Attached files
| file | filename |
|---|---|
| 8-K - FORM 8-K - NEWBRIDGE BANCORP | v410390_8k.htm |
| EX-10.1 - EXHIBIT 10.1 - NEWBRIDGE BANCORP | v410390_ex10-1.htm |
Exhibit 99.1

NASDAQ: NBBC www.newbridgebank.com 2015 ANNUAL MEETING OF SHAREHOLDERS Wednesday, May 13, 2015

FORWARD - LOOKING STATEMENTS Information in this presentation may contain forward - looking statements. Such statements involve known and unknown risks, uncertainties and other factors that may cause actual results to differ materially. Forward - looking statements are often characterized by the use of qualifying words such as “expects,” “anticipates,” “believes,” “estimates,” “plans,” “projects,” or other statements concerning opinions or judgments of the Company and its management about future events. The accuracy of such forward - looking statements could be affected by factors including, but not limited to, the financial success or changing conditions or strategies of the Company’s customers or vendors, fluctuations in interest rates, actions of government regulators, the availability of capital and personnel, or general economic conditions. Additional factors are discussed in the Company’s filings with the SEC, including without limitation, Forms 10 - K, 10 - Q and 8 - K. NewBridge Bancorp undertakes no obligations to revise these statements following the date of this presentation. 2

NEWBRIDGE BANCORP Our Guiding Principles – Always do your best – Do what is right – Treat others as you want to be treated – Financial success begins with integrity 3

MANAGEMENT TEAM DEPTH Pressley A. Ridgill President & Chief Executive Officer Spence H. Broadhurst Senior Executive Vice President Chief Banking Officer William W. Budd, Jr. Senior Executive Vice President Chief Credit Officer Robin S. Hager Senior Executive Vice President Chief Administrative Officer Ramsey K. Hamadi Senior Executive Vice President Chief Financial Officer Board of Directors Meaningful insider ownership interest of 5.20% - aligned with shareholders' interests 4 ‒ Business Banking ‒ Commercial Banking ‒ Middle Market Banking ‒ Retail Banking ‒ Private Banking ‒ Wealth Management ‒ Mortgage Banking ‒ Credit Administration ‒ Central Underwriting ‒ Special Assets ‒ Loan Review ‒ Loan Operations ‒ Corporate and Administrative Services ‒ Information Technology ‒ Deposit Operations ‒ Marketing ‒ Human Resources ‒ Vendor Management ‒ Finance/Accounting ‒ Investments ‒ Compliance/Security ‒ Corporate Secretary ‒ Investor and Shareholder Relations

QUALITY, PROFITABILITY AND GROWTH • Formed in July 2007 from a merger of equals – FNB Southeast: $1.01 billion, founded in 1910 in Reidsville, NC – LSB TheBank : $ 988 million, founded in 1949 in Lexington, NC – Created platform in Piedmont Triad from which to expand to new markets, build share, establish widely recognized identity and franchise • Good presence in attractive markets in the Carolinas • Controlled organic growth, disciplined acquisitions, and successful recruitment of experienced bankers • Recently resumed cash dividends to common shareholders • Shares trade on NASDAQ under ticker symbol NBBC 5

HIGHLIGHTS – FIRST QUARTER 2015 6 • Total assets grew $215 million to $2.70 billion, due to organic and acquisitive growth • Loans increased 8% to $1.95 billion as commercial loans exceeded $1.00 billion • Improved asset quality - Non performing assets of 0.31% • Net interest margin stable at 3.69% • Leverage capital 9.1% • (GAAP) earnings per share of $ 0.10; Reported operating earnings of $0.14 per share • Tangible book value per share increased to $5.67 as of March 31, 2015 from $5.50 as of December 31, 2014 • Common stock dividends $0.06 annualized • Premier Commercial Bank merger and systems c onversion completed
OUR STRATEGY • Position as the leading community b ank in attractive metropolitan markets in North Carolina and South Carolina • Successfully integrate past acquisitions and position for new opportunities • Strategically focus on revenue growth • Maintain strong credit quality in all business cycles • Grow diversified streams of non - interest income to decrease reliance on net interest margin (NIM) • Emphasize client relationships and continue to attract core deposits • Improve efficiency 7

EXPANDED FOOTPRINT 8 Virginia Beach MSA Richmond MSA Columbia MSA Blacksburg & Roanoke MSAs Charleston MSA Wilmington MSAs Piedmont Triad Durham – Chapel Hill MSA Asheville MSA Charlotte MSA Raleigh MSA Sampson County Brunswick County Source: SNL Financial Targeting Growth Opportunities Population Proj. (2019) Growth Market Actual Growth Rank Charlotte - Concord - Gastonia, NC - SC 2,337,694 6.3% 5 Virginia Beach, VA 1,722,167 3.9 11 Piedmont Triad, NC 1,397,316 3.7 12 Richmond, VA 1,247,586 4.4 10 Raleigh - Cary, NC 1,219,465 8.2 2 Greenville, SC 855,961 4.9 8 Columbia, SC 795,973 4.8 9 Charleston, SC 719,790 8.5 1 Durham - Chapel Hill, NC 530,627 6.1 6 Asheville, NC 442,531 5.2 7 Spartanburg, SC 319,644 3.3 13 Roanoke, VA 313,033 2.7 14 Wilmington, NC 269,287 6.5 4 Blacksburg, VA 180,244 2.5 16 Brunswick, NC 115,095 7.6 3 Sampson, NC 64,250 2.6 15

RECENT FINANCIAL HIGHLIGHTS Improving Shareholder Value Through Quality, Profitability, & Growth Merger completed PCB CPSE 1Q 2015 4Q 2014 3Q 2014 2Q 2014 1Q 2014 Core earnings per diluted share after tax₁ $0.14 $ 0.12 $0.14 $ 0.11 $ 0.11 Core ROAA₁ 0.82% 0.69 % 0.83% 0.70% 0.65% Core ROATCE 2 10.15% 8.51% 10.21% 8.42% 8.77% Operating Results Total assets $2,735,036 $2,520,232 $2,442,750 $2,429,093 $2,038,269 Net interest income $21,687 $21,304 $20,476 $20,255 $16,636 Provision for loan losses 104 50 89 600 144 Net interest income after provision $21,583 $21,254 $20,387 $19,655 $16,492 Net noninterest expense, one - time items excluded 13,485 14,360 12,474 13,025 11,053 Adjusted pre - tax net income₁ $8,098 $6,894 $7,913 $6,630 $5,439 One - time items₁ Excluded one - time gains (expenses) ($2,257) ($171) ($10) ($4,812) ($88) Improved Asset Quality Nonperforming assets to total assets 0.31% 0.41% 0.47% 0.61% 0.91% ₁ Adjusted to exclude merger costs and security gains. 2 Core Return on average tangible common equity excludes goodwill and other intangible assets PCB – Premier Commercial Bank CPSE – Capstone Bank 9

EXECUTING THE STRATEGIC PLAN 10 2012 2013 2014 2015 2012 2013 2014 November – 2012 Completed $56M Capital Raise & classified asset resolution plan August – 2012 Entered the Charlotte, NC market May – 2013 Executed partial TARP redemption of $37M $4.40 Oct/Nov – 2013 Merged Security Savings & announced acquisition of CapStone Bank April – 2014 Merged CapStone Bank total assets $2.4 billion Stock Price $4.80 $6.05 $7.50 $7.10 $7.35 July – 2014 Entered Middle - Market Corporate Banking & SC Market Feb. – 2015 Merged Premier Commercial Bank $8.35 2015

PROFITABILITY 0.0 0.5 1.0 1.5 2.0 2.5 3.0 3.5 4.0 4.5 5.0 Yield on Loans / Cost of Funds (%) Yield on Loans Cost of Funds 3.5 3.6 3.6 3.7 3.7 3.8 3.8 3.9 3.9 4.0 4.0 0.0 5.0 10.0 15.0 20.0 25.0 N I M N I I Net Interest Income ($ millions) and Net Interest Margin (%) NII NIM 11 • Net interest margin (NIM) remains stable; NIM was 3.69% in first q uarter compared with 3.75% for same quarter 2014 • Expanded loan portfolio drove net interest income higher, helping offset NIM decline • Loan yields decreased four basis points year - over - year primarily due to low interest rate conditions • Deposit and borrowing rates are actively managed; total cost of deposits for first q uarter 2015 was only 30 basis points
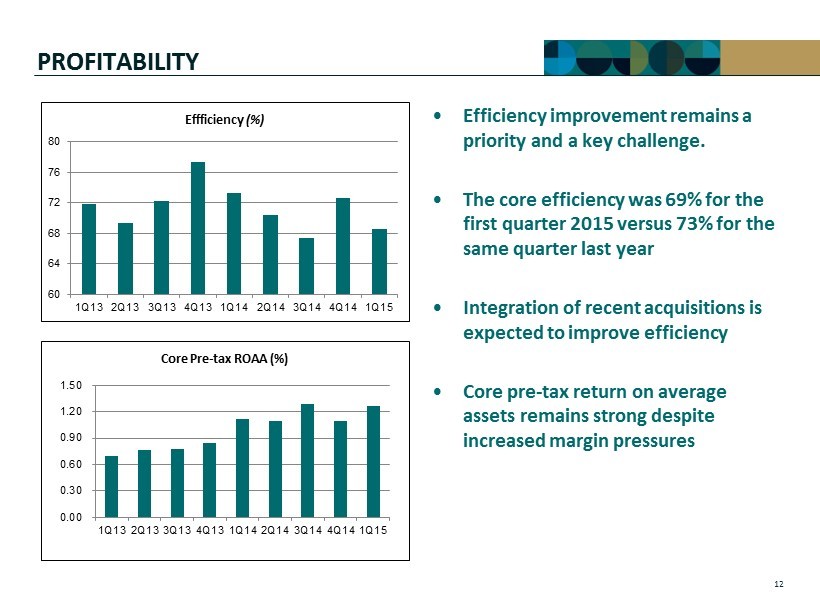
PROFITABILITY • Efficiency improvement remains a priority and a key challenge. • The core efficiency was 69% for the first quarter 2015 versus 73% for the same quarter last year • Integration of recent acquisitions is expected to improve efficiency • Core pre - tax return on average assets remains strong despite increased margin pressures 12 60 64 68 72 76 80 1Q13 2Q13 3Q13 4Q13 1Q14 2Q14 3Q14 4Q14 1Q15 Effficiency (%) 0.00 0.30 0.60 0.90 1.20 1.50 1Q13 2Q13 3Q13 4Q13 1Q14 2Q14 3Q14 4Q14 1Q15 Core Pre - tax ROAA (%)

DEPOSIT COMPOSITION $903.5 44% $543.2 27% $580.1 29% As of March 31, 2015 ($ Millions) Transaction Accounts Savings/MMA CDS 13

GROWTH 14 • Loans increased $144 million for the first quarter 2015 and $388 million for fiscal 2014 • Organic loan growth of 11% annualized for first quarter 2015 and 9% fiscal 2014 750,000 950,000 1,150,000 1,350,000 1,550,000 1,750,000 1,950,000 2,150,000 1Q13 2Q13 3Q13 4Q13 1Q14 2Q14 3Q14 4Q14 1Q15 Total Loans ($000)

GROWTH • Non - interest income totaled $4.4 million or 17% of revenue for first quarter 2015 • Non - interest income totaled $16.7 million (18% of revenue) for fiscal 2014 • Trust assets under management totaled $ 235 million at March 31, 2015 (4% increase from March 31, 2014) • Total asset growth driven by organic and acquisitions 0.0 0.5 1.0 1.5 2.0 2.5 3.0 1Q13 2Q13 3Q13 4Q13 1Q14 2Q14 3Q14 4Q14 1Q15 Total Assets ($ billion) 0 5 10 15 20 25 1Q13 2Q13 3Q13 4Q13 1Q14 2Q14 3Q14 4Q14 1Q15 Non - Interest Income / Operating Revenue (%) 15
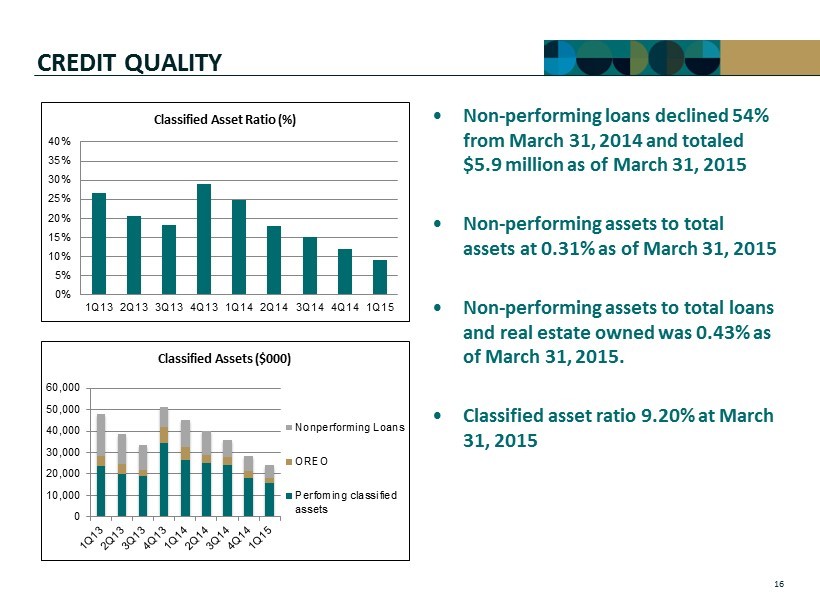
CREDIT QUALITY • Non - performing loans declined 54% from March 31, 2014 and totaled $5.9 million as of March 31, 2015 • Non - performing assets to total assets at 0.31% as of March 31, 2015 • Non - performing assets to total loans and real estate owned was 0.43% as of March 31, 2015 . • Classified asset ratio 9.20% at March 31, 2015 0 10,000 20,000 30,000 40,000 50,000 60,000 Classified Assets ($000) Nonperforming Loans OREO Perfoming classified assets 0% 5% 10% 15% 20% 25% 30% 35% 40% 1Q13 2Q13 3Q13 4Q13 1Q14 2Q14 3Q14 4Q14 1Q15 Classified Asset Ratio (%) 16
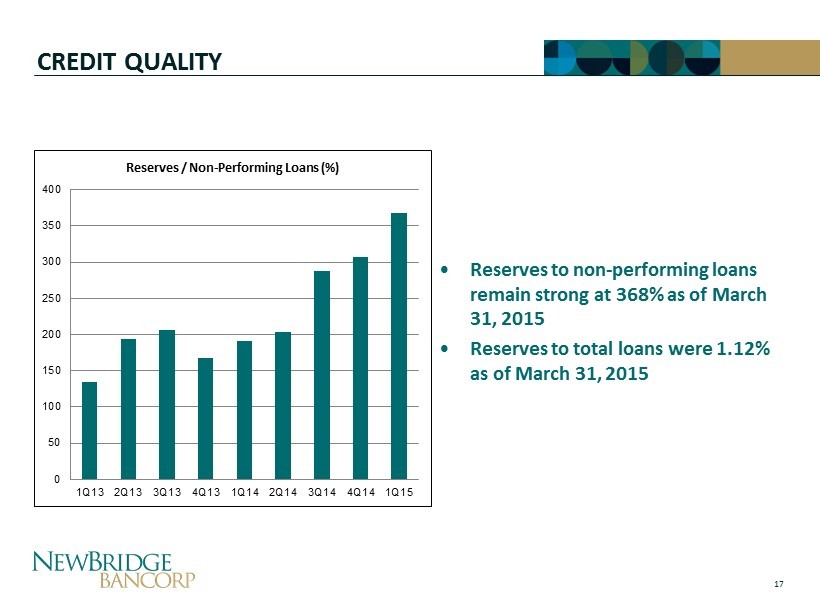
17 CREDIT QUALITY 0 50 100 150 200 250 300 350 400 1Q13 2Q13 3Q13 4Q13 1Q14 2Q14 3Q14 4Q14 1Q15 Reserves / Non - Performing Loans (%) • Reserves to non - performing loans remain strong at 368% as of March 31, 2015 • Reserves to total loans were 1.12% as of March 31, 2015

CREATING VALUE THROUGH M&A Security Savings Bank (Southport, NC) Closed : October 2013 No cash or stock outlay Loans : $ 131M Deposits : $168M Branches: 6 CapStone Bank (Raleigh, NC) Closed : April 2014 Deal Value: $62M P/TBV : 138% Earnback : Less than 2 years Loans : $293M Deposits : $274M Branches: 4 Premier Commercial Bank (Greensboro, NC) Closed: February 2015 Deal Value: $19.8 million P/TBV: 110% Earnback : Less than 1 year Loans : $96M Deposits : $ 124M Branches: 1 NewBridge : Merger Partner of Choice 18

EFFICIENT CAPITAL UTILIZATION 0.00 2.00 4.00 6.00 8.00 10.00 12.00 14.00 16.00 18.00 1Q13 2Q13 3Q13 4Q13 1Q14 2Q14 3Q14 4Q14 1Q15 Tier 1 Ratio (%) 0.00 2.00 4.00 6.00 8.00 10.00 12.00 14.00 1Q13 2Q13 3Q13 4Q13 1Q14 2Q14 3Q14 4Q14 1Q15 Leverage Ratio (%) 0.00 2.00 4.00 6.00 8.00 10.00 12.00 14.00 16.00 18.00 1Q13 2Q13 3Q13 4Q13 1Q14 2Q14 3Q14 4Q14 1Q15 Risk Based Capital (%) 19 0.00 2.00 4.00 6.00 8.00 10.00 12.00 1Q13 2Q13 3Q13 4Q13 1Q14 2Q14 3Q14 4Q14 1Q15 Tangible Common Equity / Tangible Assets (%)

ALIGNING OUR COMPANY FOR THE FUTURE • Build off of strong core bank and expand with new platform • Continue to emphasize technology (mobile banking, treasury services, and payment solutions) • Position sales & service lines for maximum effectiveness – Expand Retail Banking strategy – Execution of sales leadership in Retail, Business, Commercial, CRE, and Middle Market Banking • Focus on driving revenue, earnings growth from all served markets and business lines • Leverage size and scope to execute organic growth initiatives • Remain alert for opportunities to expand into new markets 20

WHY INVEST IN NBBC ? 21 P/TBV P/ ’16 E PS NBBC 143% 11.4x BNCN 192% 11.2x FBNC 124% 10.8x PSTB 126% 13.1x SSB 257% 14.5x COB 96% 20.3x HMPR 153% NM HTBI 89% 28.5x YDKN 167% 11.5x Scarcity Value Strong Growth Prospects - Organic (11% in 1Q15) & Acquisitive (3 deals since ‘13) Experienced Management (with a proven track record of success) Premier Franchise in Attractive M arkets – 41 branches throughout North and South Carolina Economies of Scale > $2.5 billion Good Asset Quality – NPAs/Assets < 1.0% Core Deposit F ranchise – 71% non - CD deposits Source: SNL Financial, market data as 5 / 6 /15

(60.00) (40.00) (20.00) 0.00 20.00 40.00 60.00 80.00 100.00 NBBC SNL U.S. Bank $1B-$5B STOCK PERFORMANCE Five Year Stock Price 22

CONTACTS • Pressley A. Ridgill, Chief Executive Officer pressley.ridgill@newbridgebank.com 336.369.0903 • Ramsey K. Hamadi, Chief Financial Officer ramsey.hamadi@newbridgebank.com 336.369.0975 23

NASDAQ: NBBC www.newbridgebank.com