Attached files
| file | filename |
|---|---|
| 8-K - 8-K - MIDDLEFIELD BANC CORP | d923423d8k.htm |
 Exhibit 99.1
Middlefield
Banc
Corp.
Annual Shareholder Meeting
May
13,
2015 |
 Forward Looking Statements
This presentation contains forward-looking statements within the
meaning of the Securities Exchange Act of 1934 and the Private
Securities Litigation Reform Act of 1995 concerning Middlefield
Banc Corp.’s plans, strategies, objectives, expectations, intentions,
financial condition and results of operations. These
forward-looking statements reflect management’s current
views and intentions and are subject to known and unknown risks,
uncertainties, assumptions and other factors that could cause the
actual results to differ materially from those contemplated by
the statements. The significant risks and uncertainties
related to Middlefield Banc Corp. of which management is aware are
discussed in detail in the periodic reports that Middlefield Banc Corp.
files with the Securities
and
Exchange
Commission
(the
“SEC”),
including
in
the
“Risk
Factors”
section
of its Annual Report on Form 10-K and its Quarterly Report on Form
10-Q. Investors are urged to review Middlefield Banc
Corp.’s periodic reports, which are available at no
charge
through
the
SEC’s
website
at
www.sec.gov
and
through
Middlefield
Banc
Corp.’s
website
at
www.middlefieldbank.com
on
the
“Investor
Relations”
page.
Middlefield
Banc
Corp. assumes no obligation to update any of these forward-looking
statements to reflect a change in its views or events or
circumstances that occur after the date of this presentation. 2
|
 Board of Directors
3
Thomas G. Caldwell
James R. Heslop, II
Eric W. Hummel
Kenneth E. Jones
Darryl E. Mast
Clayton W. Rose, III
James J. McCaskey
William J. Skidmore
Joseph J. Thomas
Robert W. Toth
Carolyn J. Turk |
 Experienced Management Team
Management
Position
Age
MBCN
Industry
Thomas G. Caldwell
President & CEO
57
28
38
James R. Heslop, II
EVP & COO
61
19
36
Donald L. Stacy
SVP & CFO
61
15
36
Jay P. Giles
SVP -
Senior Loan Officer
65
16
42
Teresa M. Hetrick
SVP -
Operations
51
18
27
Jeffrey N. Male
SVP -
Chief Residential Mortgage Officer
65
1
42
Kevin L. Miller
SVP -
Chief Information Officer
55
1
33
David G. Dalessandro
SVP -
Chief Credit Office
58
5
33
James L. Long
President, Central Ohio Region
64
6
42
Courtney M. Erminio
VP -
Risk Officer
33
5
12
Alfred F. Thompson, Jr.
VP -
Loan Administration
55
19
28
Thomas Caldwell serves on the Federal Delegate Board of the Independent Community Bankers of
America, having been elected in June 2010. He previously served
as Chairman of the Community
Bankers Association of Ohio.
4 |
 Meeting Overview
Welcome to the Middlefield Banc Corp. 2015 Annual Shareholder
Meeting Company Snapshot
(1)(2)
NASDAQ:
MBCN
Stock Price:
$31.71
Market Cap:
$65.1 million
Dividend (yield):
$1.04 (3.3%)
Headquarters:
Middlefield, Ohio
Established:
Bank 1901/HC 1988
Branches:
10
Total Assets:
$699.9 million
Net Loans
$469.4 million
Total Deposits:
$617.1 million
(1)
Stock price, market cap and dividend yield as of April 22, 2015
(2)
Financial figures for the period ended March 31, 2015
5
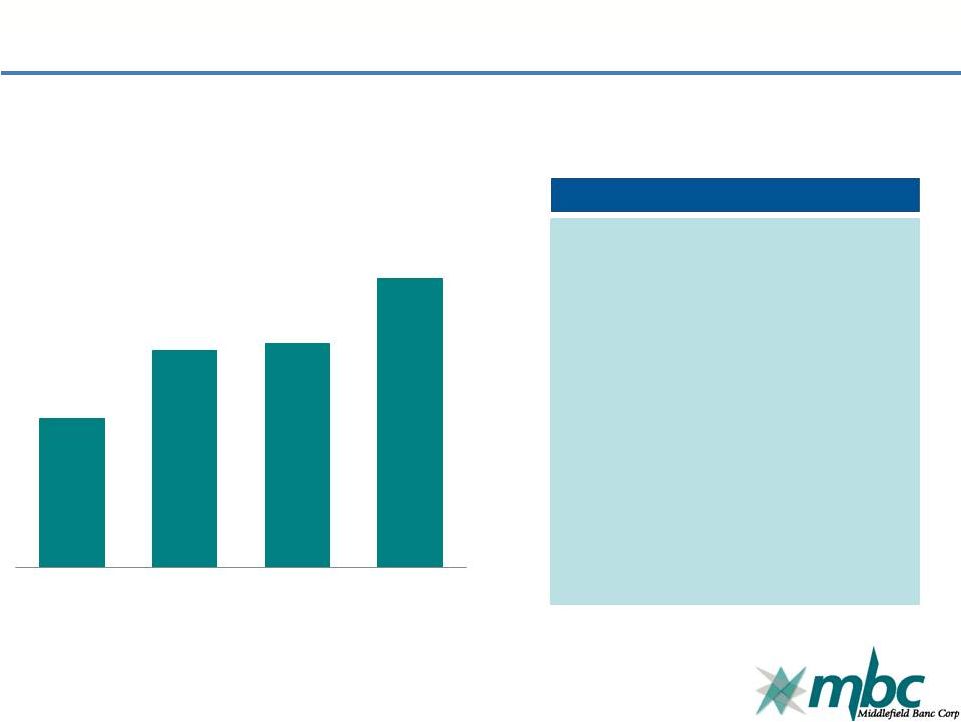
Stock Price
$17.25
$25.25
$26.00
$33.61
12/31/2011
12/31/2012
12/31/2013
12/31/2014 |
 6
Nasdaq Ceremony |
 7
CEO Report |
 Business Overview
Ended 2014 with record net loans
outstanding, net income, and
stockholders’
equity
Profitable throughout the economic
cycle and never reported a quarterly
loss
History of quarterly cash dividend
payments, and maintained dividend
amount during recession
Excellent asset quality, strong liquidity
profile, and robust core deposit base
Strong returns and efficiency ratios
Two strong Ohio banking markets
For over 100 years, Middlefield Banc
Corp. has supported its communities
by offering customers superior
financial products, exceptional
service, and modern banking
amenities
8 |
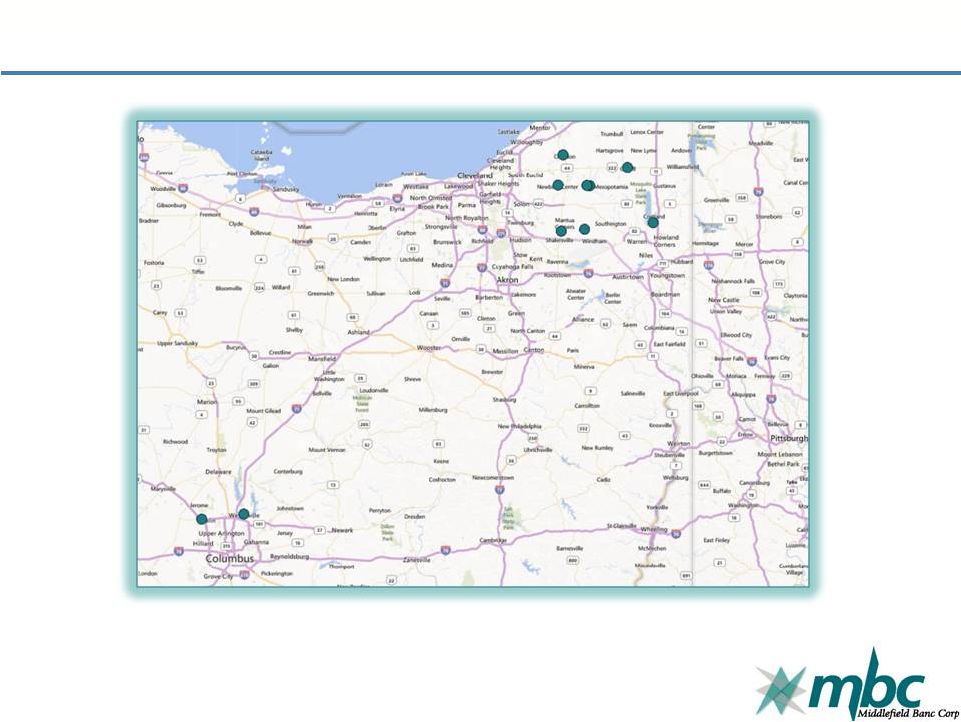 Branch Locations
9 |
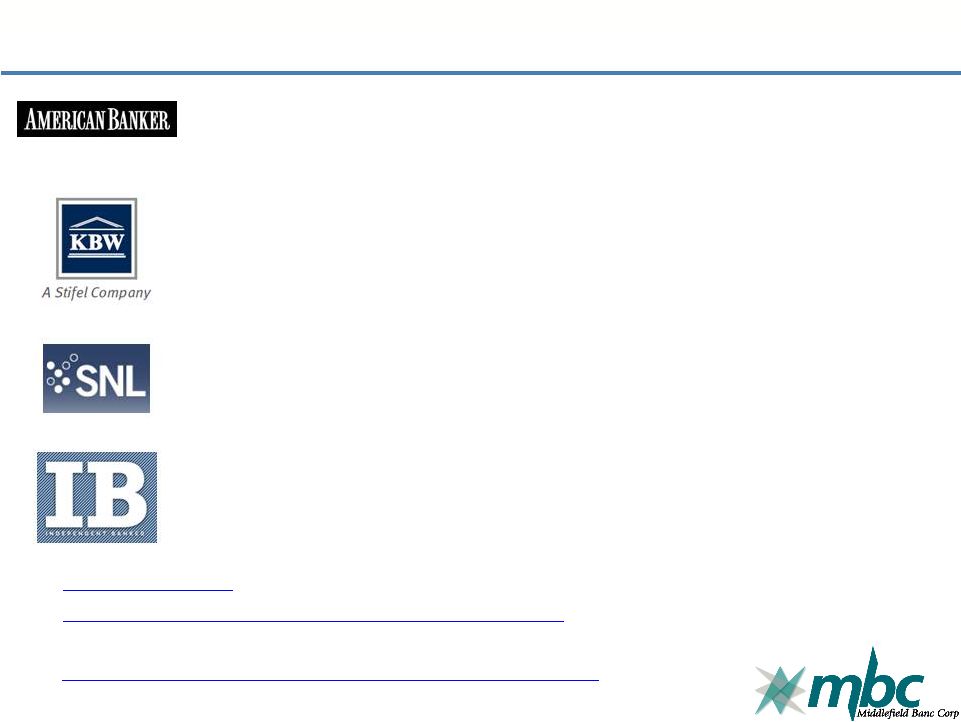 Recent Rankings and Awards
SNL Financial
(3)
According
to
a
June
16,
2014
article
from
SNL
Financial,
Middlefield
Banc
Corp.
had
the
10
th
highest
ROAE
out
of
public community banks with under $1 billion in assets.
Independent Banker
(4)
According
to
May
30,
2014
study
from
Independent
Banker,
Middlefield
Banc
Corp.
had
the
21
st
highest
ROE
of
community banks with assets of $500 million to $1 billion
KBW
(2)
On April 13, 2015, Middlefield was named one of 25 U.S. banking institutions to KBW’s
coveted “Bank Honor Roll” of superior performers. Honor Roll members
are publicly traded banking institutions with more than $500 million in total assets
that have not reported an annual loss over the past 10 years, had 2014 annual EPS equal to or
greater than peak EPS over the past 10 years, and consecutive increases in EPS since
2009. American Banker
(1)
Middlefield
Banc
Corp.
was
ranked
38
th
out
of
the
top
200
community
banks
and
thrifts
by
3-year
Avg.
ROE
according to an April 27, 2015 American Banker article.
10
(1)
American Banker April 27, 2015
(2)
KBW April 13, 2015
(3)
SNL June 16, 2014
(4)
Independent Banker
Sources:
http://www.americanbanker.com/
http://www.kbw.com/content/the-firm-PDFs/press-releases/KBW-2015-Bank-Honor-Roll-04.13.15.pdf
http://independentbanker.org/2014/05/community-banks-with-assets-of-more-than-500-million-to-1-billion/
Disproving the naysayers, some banks under $1B thrive
By Kiah Lau Haslett and Marshall Schraibman |
 Financial Summary
Dollars in thousands
2009
2010
2011
2012
2013
2014
Net interest income
14,268
18,149
21,075
22,299
22,928
23,804
Provision for loan losses
2,578
3,580
3,085
2,168
196
370
Noninterest income
2,668
2,623
2,237
3,451
3,145
3,588
Noninterest expense
12,650
14,763
15,501
15,639
16,870
17,850
Income before income taxes
1,708
2,429
4,726
7,943
9,007
9,172
Income taxes
(73)
(88)
596
1,662
1,979
1,992
Net income
1,781
2,517
4,130
6,281
7,028
7,180
Net interest margin
3.30%
3.41%
3.65%
3.74%
3.85%
3.93%
Total assets
558,658
632,197
654,551
670,288
647,090
677,531
Loans outstanding, net
348,660
366,277
395,061
400,654
428,679
463,738
Deposits
487,106
565,251
580,962
593,335
568,836
586,112
Equity capital
36,707
38,022
47,253
55,437
53,473
63,867
Earnings per share
1.15
1.60
2.45
3.29
3.48
3.52
Cash dividend (per share)
1.04
1.04
1.04
1.04
1.04
1.04
Dividend pay-out ratio
90.28%
65.04%
42.71%
31.87%
29.84%
29.54%
Return on average assets
0.36%
0.41%
0.65%
0.95%
1.06%
1.07%
Return on average equity
4.90%
6.44%
10.24%
11.98%
13.17%
12.17%
11 |
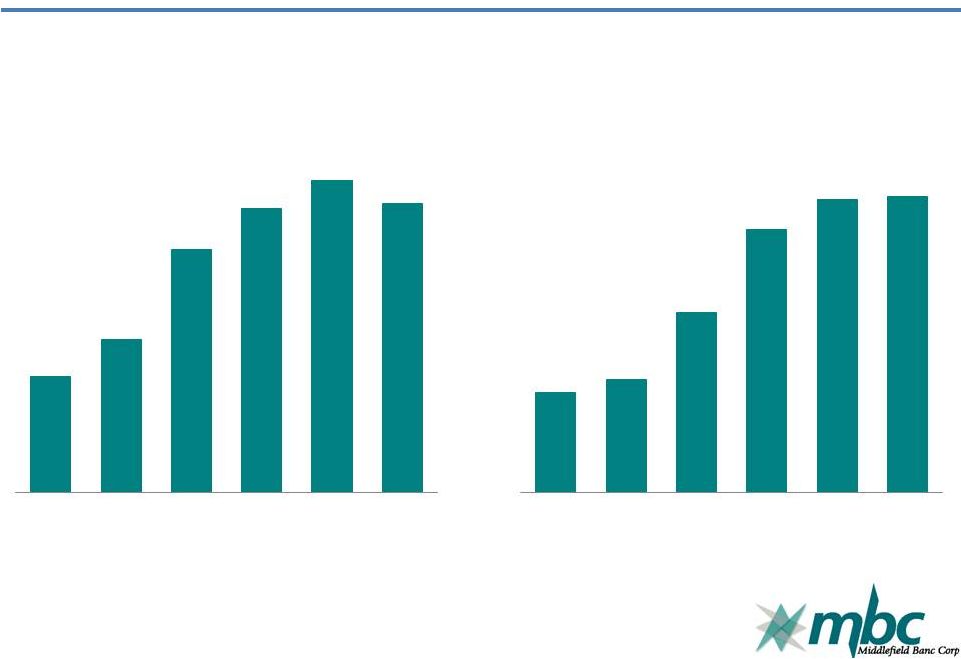
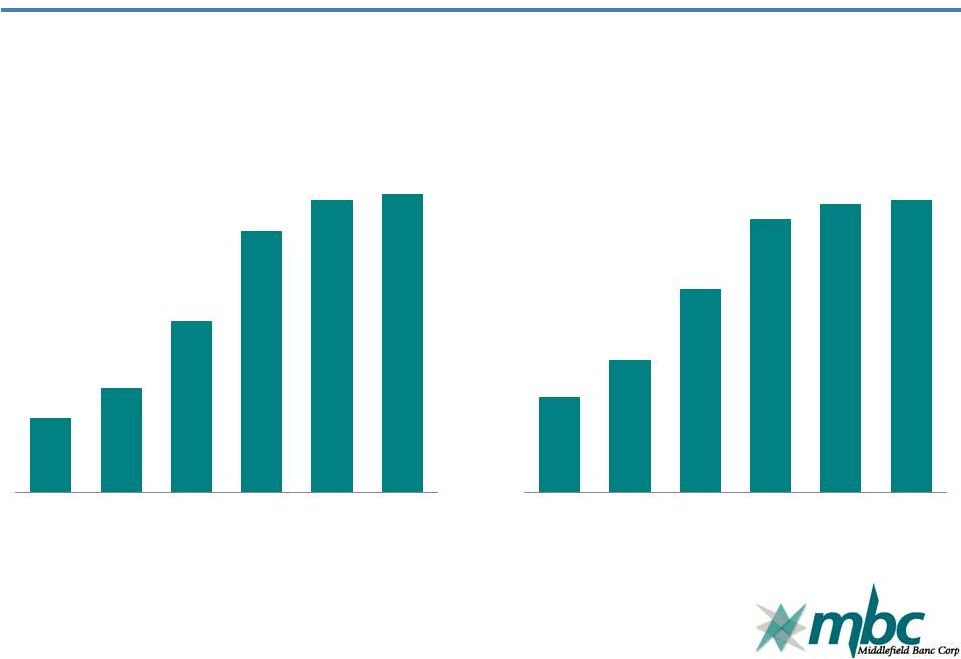 Annual Profitability
Net Income
(In millions)
Diluted EPS
MBCN has been consistently profitable through the economic cycle
and has never reported a quarterly loss.
12
$1.8
$2.5
$4.1
$6.3
$7.0
$7.2
09
10
11
12
13
14
$1.15
$1.60
$2.45
$3.29
$3.48
$3.52
09
10
11
12
13
14 |
 Annual Returns
Return on Average Equity
Return on Average Assets
13
4.90%
6.44%
10.24%
11.98%
13.17%
12.17%
09
10
11
12
13
14
0.36%
0.41%
0.65%
0.95%
1.06%
1.07%
09
10
11
12
13
14 |
 Market Demographics Stronger than State
Market
Rank
Company
Total
Median
Median Value
Unemployment
Based on
Deposits in
Population
Household
Owner-Occupied
Rate
Share of
Market
2013
Income
Housing Units
December
County
Deposits
($000)
(1)
(est.)
(2)
2013 ($)
(2)
2013 ($)
(2)
2014 (%)
(3)
Geauga
1
360,742
93,972
66,428
224,700
4.3
Geauga County
has the 3rd highest
Portage
6
92,232
163,862
52,337
150,300
4.8
median household
income in the State.
Franklin
25
61,079
1,212,263
51,460
150,800
3.8
Trumbull
10
48,954
206,442
41,798
97,400
7.5
Ashtabula
8
26,837
101,497
40,839
110,800
5.8
Aggregate: Entire State of Ohio
11,570,808
48,308
130,800
4.8
Aggregate: National
316,128,839
53,046
176,700
5.6
(1)
Obtained from the FDIC's Summary of Deposits data, as of June 30, 2014
(www.fdic.gov). (2)
Information from the U. S. Census Bureau
(www.quickfacts.census.gov). (3)
Sourced from Ohio Department of Job and Family Services and the Bureau
of Labor Statistics. Eight of the bank's 10 offices (and more
than 86% of its deposits) are located in counties that have
stronger demographics than the State averages (median household
income, median value of owner-occupied housing, and
employment rates).
14 |
 Deposit Market Share
Ashtabula, Geauga, Portage & Trumbull Counties
June 30, 2014
Rank in
Market
Institution
Number of
Branches
Total Market
Share (%)
1
The Huntington National Bank
38
1,532,821
20.60
2
JP Morgan Chase Bank, N.A.
19
894,279
12.02
3
8
528,765
7.11
4
KeyBank, National Association
15
522,389
7.02
5
PNC Bank, National Association
11
506,911
6.81
6
Talmer Bank and Trust
9
464,660
6.24
7
Cortland Savings & Banking Co.
10
385,484
5.18
8
FirstMerit Bank, N. A.
12
347,397
4.67
Total for institutions in Market
190
7,441,520
15
Total Deposits in
Market ($M)
The Middlefield Banking Company |
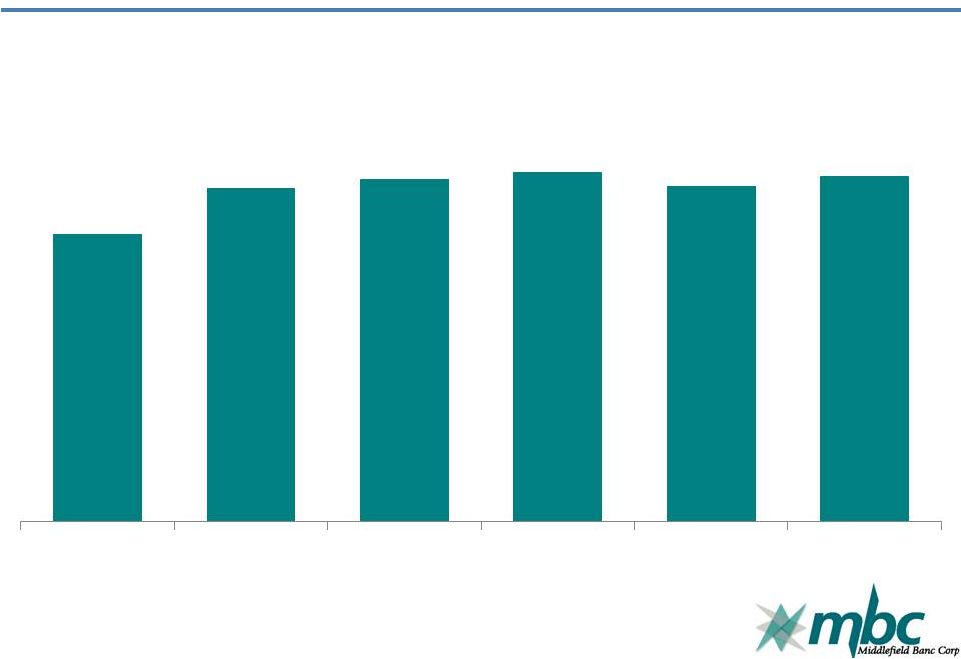
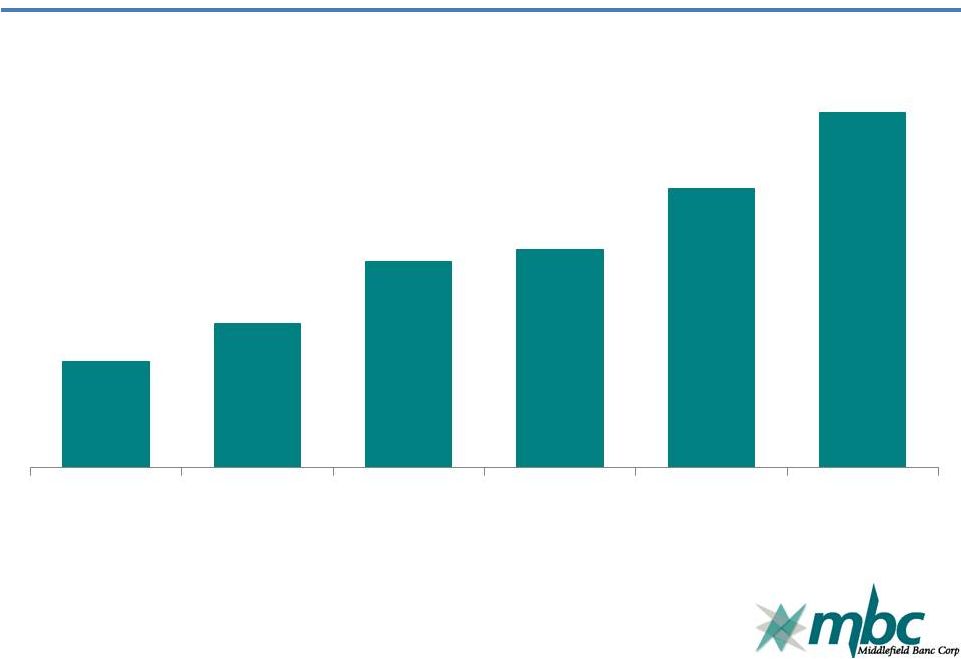 Annual
Loan
Growth
(1)
(1) Dollars in millions
16
$463.8
$428.7
$400.7
$395.1
$366.3
$348.7
14
13
12
11
10
09 |
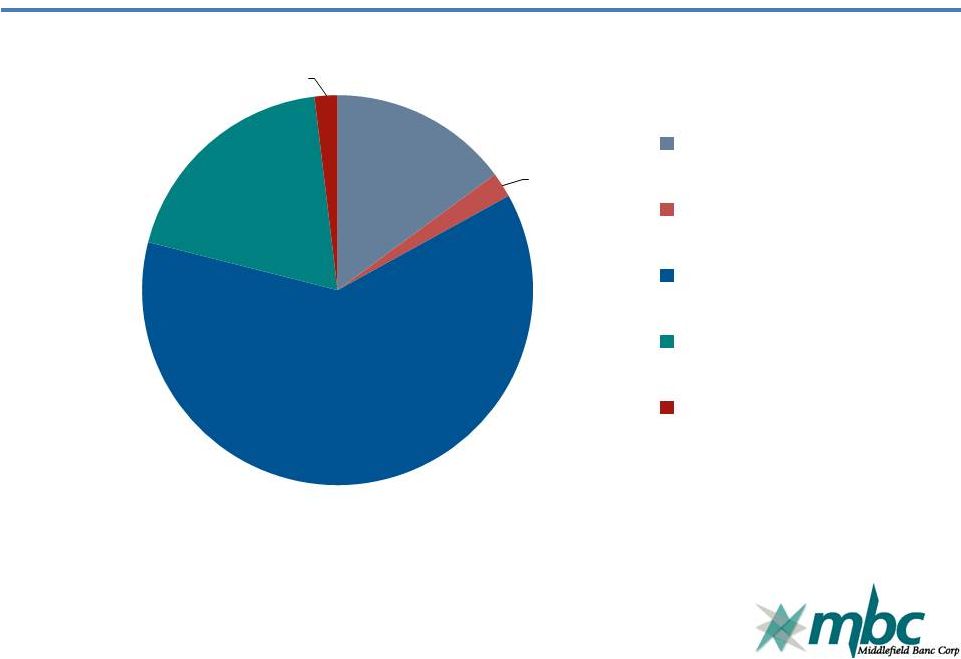
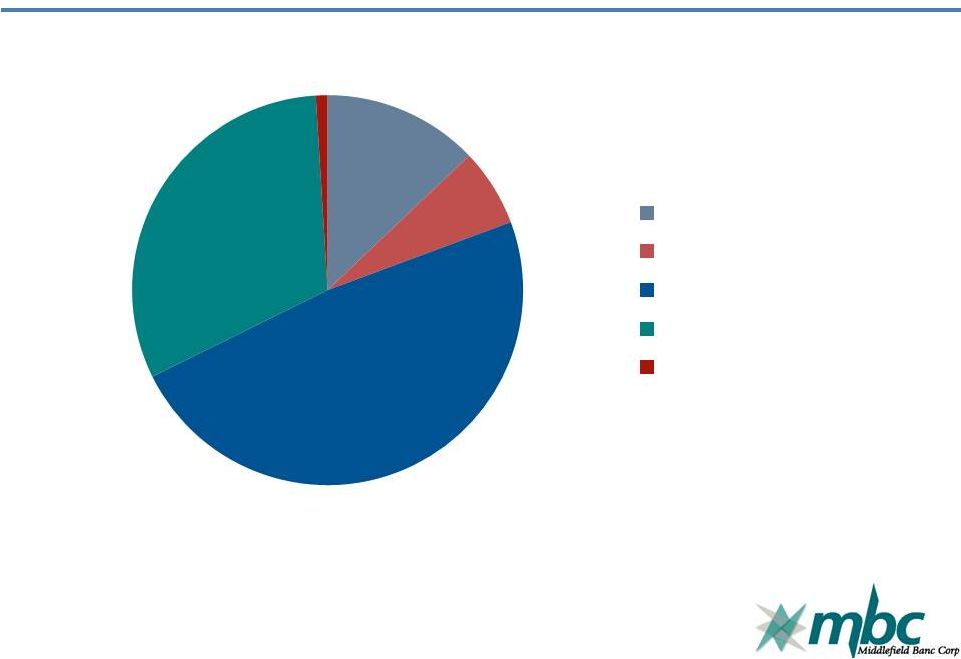 Loan Portfolio at December 31, 2014
17
13%
7%
48%
31%
1%
Commercial & Industrial
Real Estate -
Construction
Residential Mortgage
Commercial Mortgage
Consumer Installment |
 Asset Quality
2010
2011
2012
2013
2014
Nonperforming Loans
$19,986
$24,546
$14,224
$12,290
$9,048
Real Estate Owned
2,302
2,196
1,846
2,698
2,590
Nonperforming Assets
$22,288
$26,742
$16,070
$14,988
$11,638
Nonperforming Assets/
Total Assets (%)
3.52%
4.09%
2.40%
2.32%
1.72%
Allowance for Loan Losses
$6,221
$6,819
$7,779
$7,046
$6,846
Allowance/Total Loans (%)
1.67%
1.70%
1.90%
1.62%
1.45%
Net Charge-off Ratio (%)
0.63%
0.65%
0.30%
0.19%
0.38%
-
Problem
assets
peaked
in
2011,
primarily
driven
by
non-owner
occupied
1
-
4
family
in
Central
Ohio
market.
-
Net charge-offs returned to normalized levels in 2012.
-
Strong reserve coverage provides flexibility in managing potential losses
with reduced impact on net income. 18 |
 Managed
Deposit
Growth
(1)
Cost of deposits declined from 2.69% in 2009 to 0.74% in 2014
(1) Dollars in millions
19
$487.1
$565.3
$581.0
$593.3
$568.8
$586.1
09
10
11
12
13
14 |
 Strong Core Deposit Base at December 31, 2014
20
15%
2%
62%
19%
2%
Non-interest bearing
Demand
Money Market
Time
Interest-bearing Demand
Savings |
 Capital Ratios at December 31, 2014
To Be Well
Capitalized
Middlefield Banc
Corp.
The Middlefield
Banking Company
Tier 1 Risk-Based
Capital
6.00%
13.38%
12.95%
Total Risk-Based
Capital
10.00%
14.64%
14.19%
Tier 1 Leverage
Capital
5.00%
9.60%
9.25%
All capital ratios exceed regulatory requirements to qualify as well
capitalized. 21 |
 2014 Initiatives
Personnel/Talent
Strong management to drive performance growth
Sales-orientation and cultural fit
Operations/Risk Management
Expanded technology
Scaled to support growth initiatives
Diligent risk management incorporating regulatory
environment
Expand Share of Market/Share of Customer
Identify target markets and customer segments
Commercial relationship opportunities
De novo expansion and strategic acquisitions
22 |
 Today’s Banking Landscape
High level of competition for share of wallet
Increasing regulatory concerns with added costs
for smaller banks
Economic challenges with a continued low rate
environment and slow growth
Uncertain loan demand
23 |
 2015 and Forward
Grow Secondary Mortgage Offering
2015 Strategic Planning Exercise Provides Confidence in
Middlefield’s:
Market position
Product and service offerings
Growth initiatives
Continue to Expand Share of Market/Share of Customer
Identify target markets and customer segments
Commercial relationship opportunities
De novo expansion and strategic acquisitions
24 |
 Questions, Comments,
and Discussion
25 |
 Voting Results
Election of three Directors
Non-binding proposal on compensation
Ratification of appointment of S.R. Snodgrass, P.C.
26 |
 Thank you for your support!
May 13, 2015
27 |