Attached files
| file | filename |
|---|---|
| 8-K - 8-K - Emerald Oil, Inc. | v410235_8k.htm |
| EX-2.1 - EXHIBIT 2.1 - Emerald Oil, Inc. | v410235_ex2-1.htm |
| EX-99.1 - EXHIBIT 99.1 - Emerald Oil, Inc. | v410235_ex99-1.htm |
Exhibit 99.2
Corporate Presentation May 2015

1 Forward Looking Statements This presentation contains forward - looking statements within the meaning of Section 27A of the Securities Act of 1933 and Section 21E of the Securities Exchange Act of 1934. All statements, other than statements of historical fact, included in this presentation that address activities, events or develo pme nts that Emerald Oil, Inc. (the “Company”) expects, believe or anticipates will or may occur in the future are forward - looking statements. The words “believe,” “expect,” “may,” “estimates,” “will,” “anticipate,” “plan,” “intend,” “foresee,” “should,” “would,” “could,” or other similar expressions are intended to identify forward - looking statements, which generally are not hist orical in nature. However, the absence of these words does not mean that the statements are not forward - looking. Without limiting the generality of the foregoing, forward - looking stateme nts contained in this presentation specifically include the expectations of plans, strategies, objectives and anticipated financial and operating results of the Company, including as to th e Company’s drilling program, production, hedging activities, capital expenditure levels, capitalization and liquidity levels and other guidance included in this presentation. These stat eme nts are based on certain assumptions made by the Company based on management’s expectations and perception of historical trends, current conditions, anticipated future developments a nd other factors believed to be appropriate. Such statements are subject to a number of assumptions, risks and uncertainties, many of which are beyond the control of the Company, which m ay cause actual results to differ materially from those implied or expressed by the forward - looking statements. These include the factors discussed or referenced in the Company’s filings with the Securities and Exchange Commission (“SEC”), including its Forms 10 - K, 10 - Q and 8 - K, offering memorandum related to this offering, risk relating to financial performance and results, current economic conditions and resulting capital restr ain ts, prices and demand for oil and natural gas, availability of drilling equipment and personnel, availability of sufficient capit al to execute the Company’s business plan, impact of compliance with legislation and regulations, successful results from the Company’s identified drilling locations, the Company’s ability to replace reserves and efficiently develop and exploit its current reserves and other important factors that could cause actual results to differ materially from those projected. Any forward - looking statement speaks only as of the date on which such statement is made and the Company undertakes no obligatio n to correct or update any forward - looking statement, whether as a result of new information, future events or otherwise, except as required by applicable law. The SEC generally permits oil and gas companies, in filings made with the SEC, to disclose proved reserves, which are reserve es timates that geological and engineering data demonstrate with reasonable certainty to be recoverable in future years from known reservoirs under existing economic and operating condi tio ns and certain probable and possible reserves that meet the SEC’s definitions for such terms. In this presentation the term “EUR” (estimated ultimate recovery) is used to provide estimates of potential recoverably hydrocar bon s based on NSAI’s estimates of hydrocarbon quantities that may be potentially discovered through exploratory drilling or recovered with additio nal drilling or recovery techniques. These quantities do not constitute “reserves” within the meaning of the Society of Petroleum Engineer’s Petroleum Resource Management System or SEC r ule s. These estimates are by their nature speculative, and, accordingly, are subject to risk of not being actually realized by the Company. In this presentation, “drilling locations” represent the number of locat ion s that the Company currently estimates could potentially be drilled in a particular area given estimated well spacing requirements applicable to that area . Locations drilled and quantities that may be ultimately recovered from the Company’s interests will differ substantially. There is no commitment by the Company to drill all of the dri lling locations that have been attributed to these quantities. Factors affecting ultimate recovery include the scope of the Company’s ongoing drilling program, which will be directly affec ted by the availability of capital, drilling and production costs, availability of drilling services and equipment, drilling results, lease expirations, transportation constraints, regulatory app rovals and other factors; and actual drilling results, including geological and mechanical factors affecting recovery rates. The Company’s production forecasts and expectations for future periods are dependent upon many assumptions, including estimates of production decline rates from existing wells and the undertaking and outcome of future drilling activity, which may be affected by significant commodity price declines or drilling cost increases. The presentation contains the Company’s estimated 2015 production, capital expenditures, expenses and other matters. The actual levels of production, capital expenditures and expen ses may be higher or lower than these estimates due to, among other things, uncertainty in drilling schedules, changes in market dem and and unanticipated delays in production. These estimates are based on numerous assumptions, including assumptions related to number of wells drilled, average spud to releas e t imes, rig count, and production rates for wells placed on production. All or any of these assumptions may not prove to be accurate, which could result in actual results differing mate ria lly from estimates. If any of the rigs currently being utilized becomes unavailable for any reason, and the Company is not able to secure a replacement on a timely basis, we may not be able to drill, complete and place on production the expected number of wells. Similarly, average spud to release times may not be maintained in 2015. No assurance can be made that new wells will produce in line with historic performance, or that existing wells will continue to produce in line with expectations. Our ability to finance our 2015 capital budget is subject to numerous risks and uncertainties, including volatility in commodity prices and the potential for unanticipated increases in costs associated with drilling, production and transportation. In add iti on, our production estimate assumes there will not be any new federal, state or local regulation of portions of the energy industry in which we operate, or an interpretation of existing r egu lation, that will be materially adverse to our business. For additional discussion of the factors that may cause us not to achieve our 2015 production estimates, see “Risk Factors” in the Offering Circular. We do not undertake any obligation to release publicly the results of any future revisions we may make to this prospective data or to update this prospective data to refle ct events or circumstances after the date of the Prospectus. Therefore, you are cautioned not to place undue reliance on this information.
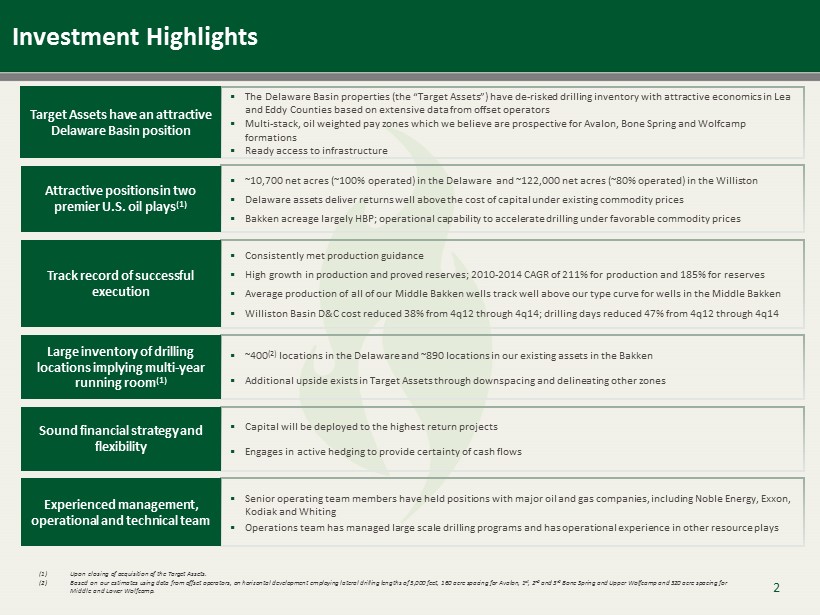
Investment Highlights ▪ ~ 10,700 net acres (~100% operated) in the Delaware and ~122,000 net acres (~80% operated) in the Williston ▪ Delaware assets deliver returns well above the cost of capital under existing commodity prices ▪ Bakken acreage largely HBP; operational capability to accelerate drilling under favorable commodity prices 2 ▪ ~ 400 (2) locations in the Delaware and ~890 locations in our existing assets in the Bakken ▪ Additional upside exists in Target Assets through downspacing and delineating other zones ▪ The Delaware Basin properties (the “Target Assets”) have de - risked drilling inventory with attractive economics in Lea and Eddy Counties based on extensive data from offset operators ▪ Multi - stack, oil weighted pay zones which we believe are prospective for Avalon, Bone Spring and Wolfcamp formations ▪ Ready access to infrastructure ▪ Capital will be deployed to the highest return projects ▪ Engages in active hedging to provide certainty of cash flows ▪ Senior operating team members have held positions with major oil and gas companies, including Noble Energy, Exxon, Kodiak and Whiting ▪ Operations team has managed large scale drilling programs and has operational experience in other resource plays Experienced management, operational and technical team Sound financial strategy and flexibility Target Assets have an attractive Delaware Basin position Large inventory of drilling locations implying multi - year running room (1) Attractive positions in two premier U.S. oil plays (1) ▪ Consistently met production guidance ▪ H igh growth in production and proved reserves; 2010 - 2014 CAGR of 211% for production and 185% for reserves ▪ Average production of all of our Middle Bakken wells track well above our type curve for wells in the Middle Bakken ▪ Williston Basin D&C cost reduced 38% from 4q12 through 4q14 ; drilling days reduced 47% from 4q12 through 4q14 Track record of successful execution (1 ) Upon closing of acquisition of the Target Assets. (2 ) Based on our estimates using data from offset operators, on horizontal development employing lateral drilling lengths of 5,000 feet , 160 acre spacing for Avalon, 1 st , 2 nd and 3 rd Bone Spring and Upper Wolfcamp and 320 acre spacing for Middle and Lower Wolfcamp.
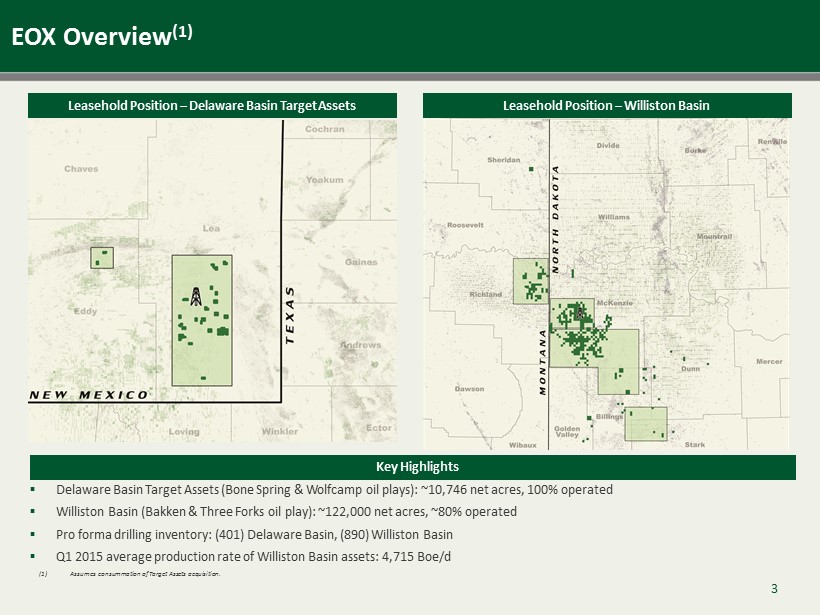
3 EOX Overview (1) Key Highlights Leasehold Position – Williston Basin Leasehold Position – Delaware Basin Target Assets ▪ Delaware Basin Target Assets (Bone Spring & Wolfcamp oil plays) : ~ 10 , 746 net acres, 100 % operated ▪ Williston Basin (Bakken & Three Forks oil play) : ~ 122 , 000 net acres, ~ 80 % operated ▪ Pro forma drilling inventory : ( 401 ) Delaware Basin, ( 890 ) Williston Basin ▪ Q 1 2015 average production rate of Williston Basin assets : 4 , 715 Boe/d (1 ) Assumes consummation of Target Assets acquisition.
Attractive Delaware Position (1) 4 (1 ) Assumes consummation of Target Assets acquisition.
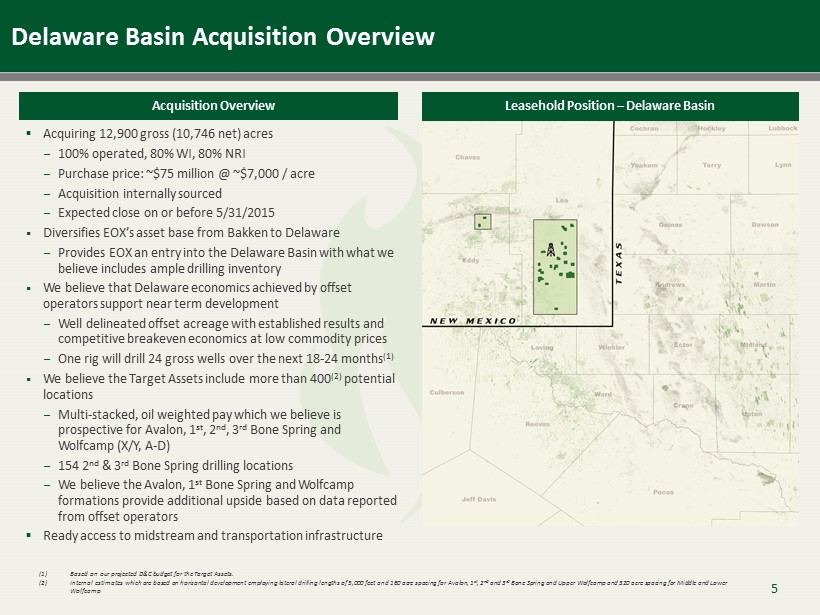
5 ▪ Acquiring 12,900 gross (10,746 net) acres − 100 % operated, 80% WI, 80% NRI − Purchase price: ~$75 million @ ~$7,000 / acre − Acquisition internally sourced − Expected close on or before 5/31/2015 ▪ Diversifies EOX’s asset base from Bakken to Delaware − Provides EOX an entry into the Delaware Basin with what we believe includes ample drilling inventory ▪ We believe that Delaware economics achieved by offset operators support near term development − Well delineated offset acreage with established results and competitive breakeven economics at low commodity prices − One rig will drill 24 gross wells over the next 18 - 24 months (1) ▪ We believe the Target Assets include more than 400 (2) potential locations − Multi - stacked, oil weighted pay which we believe is prospective for Avalon, 1 st , 2 nd , 3 rd Bone Spring and Wolfcamp (X/Y, A - D ) − 154 2 nd & 3 rd Bone Spring drilling locations − We believe the Avalon , 1 st Bone Spring and Wolfcamp formations provide additional upside based on data reported from offset operators ▪ Ready access to midstream and transportation infrastructure Delaware Basin Acquisition Overview Leasehold Position – Delaware Basin Acquisition Overview (1 ) Based on our projected D&C budget for the Target Assets . (2 ) Internal estimates which are based on horizontal development employing lateral drilling lengths of 5,000 feet and 160 acre spacing for Av alon, 1 st , 2 nd and 3 rd Bone Spring and Upper Wolfcamp and 320 acre spacing for Middle and Lower Wolfcamp

6 Acreage in the Core of the Delaware Basin MATADOR RESOURCES RANGER 33 STATE COM 1H 2 ND BONE SPRING 10/21/2013 CUM. BOE 180 = 82,703 (1) CAZA OPERATING GRAMMA 27 STATE 1H 3 rd BONE SPRING 5/24/2014 CUM. BOE 180 = 81,260 (1) MEWBOURNE OIL CABRA LOCA 11 B3OB STATE 1H 3 rd BONE SPRING 12/1/2014 CUM. BOE 90 = 81,795 (1) CONCHO OIL & GAS BEN LILLY 2 STATE COM 4H 3 rd BONE SPRING 4/25/2014 CUM. BOE 180 = 134,239 (1) EOG RESOURCES JOLLY ROGER 16 STATE 1H 2 nd BONE SPRING 7/1/2014 CUM. BOE 180 = 119,326 (1) CONCHO OIL & GAS DOS ABULESO FEE 1H 2 nd BONE SPRING 5/20/2014 CUM. BOE 180 = 107,379 (1) CONCHO OIL & GAS AIRBONITA 12 FEDERAL COM 1H 3 rd BONE SPRING 2/2/2014 CUM. BOE 180 = 70,676 (1) CONCHO RESOURCES CIMAREX ENERGY EOG RESOURCES DEVON ENERGY MATADOR RESOURCES MEWBOURNE OIL EMERALD ACQUISITION Source : IHS. Note: Dates represent date of first production. (1 ) Production results for selected wells not intended to be representative of potential production from wells we intend to drill in the tar get acreage or of any particular location in such acreage.
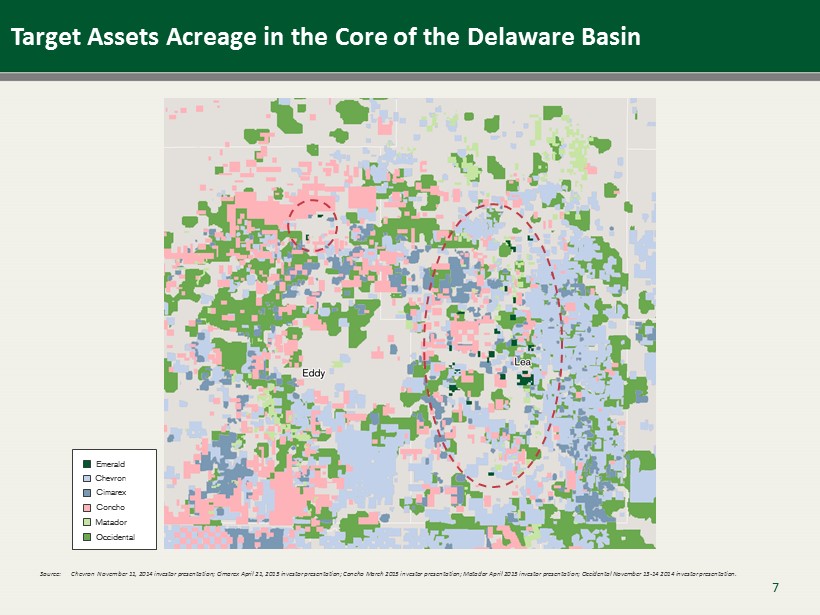
7 Target Assets Acreage in the Core of the Delaware Basin Source: Chevron November 11, 2014 investor presentation; Cimarex April 21, 2015 investor presentation ; Concho March 2015 investor presentation; Matador April 2015 investor presentation; Occidental November 13 - 14 2014 investor presentation. Emerald Chevron Cimarex Concho Matador Occidental
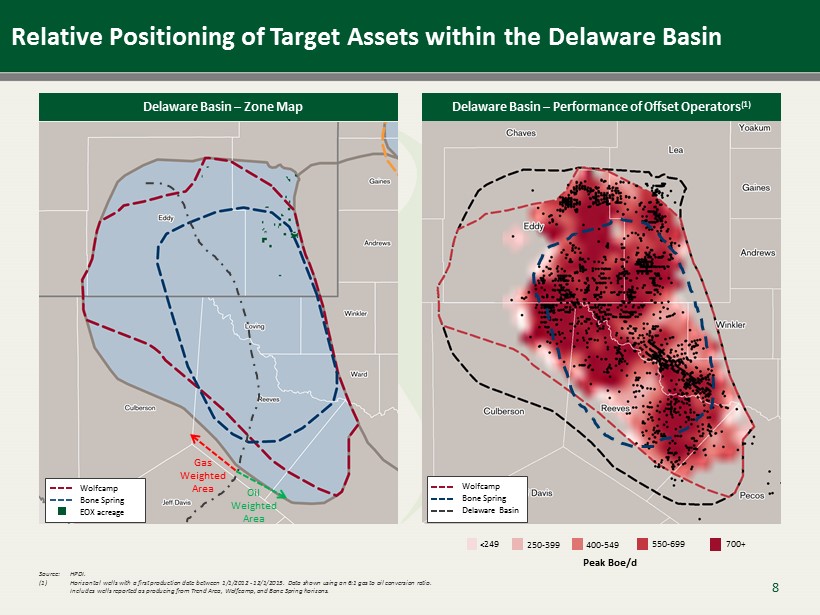
Relative Positioning of Target Assets within the Delaware Basin Delaware Basin – Zone Map Delaware Basin – Performance of Offset Operators (1) Delaware Basin Bone Spring Wolfcamp 700+ 550 - 699 400 - 549 250 - 399 <249 Peak Boe/d Gas Weighted Area Oil Weighted Area Wolfcamp Bone Spring EOX acreage Source : HPDI . (1 ) Horizontal wells with a first production date between 1/1/2012 - 12/1/2015. Data shown using an 6:1 gas to oil conversion ratio. Includes wells reported as producing from Trend Area, Wolfcamp, and Bone Spring horizons. 8
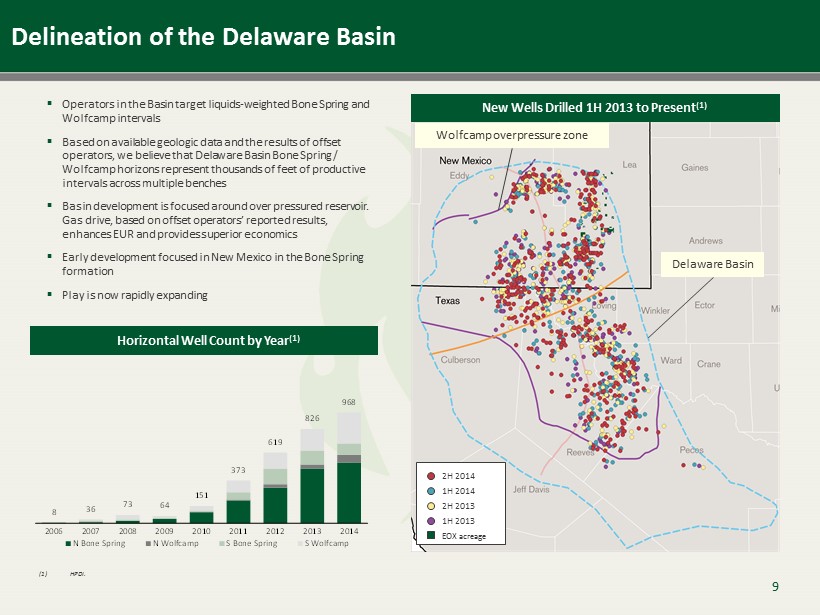
8 36 73 64 151 373 619 826 968 2006 2007 2008 2009 2010 2011 2012 2013 2014 N Bone Spring N Wolfcamp S Bone Spring S Wolfcamp Delineation of the Delaware Basin ▪ Operators in the Basin target liquids - weighted Bone Spring and Wolfcamp intervals ▪ Based on available geologic data and the results of offset operators, we believe that Delaware Basin Bone Spring / Wolfcamp horizons represent thousands of feet of productive intervals across multiple benches ▪ Basin development is focused around over pressured reservoir. Gas drive, based on offset operators’ reported results, enhances EUR and provides superior economics ▪ Early development focused in New Mexico in the Bone Spring formation ▪ Play is now rapidly expanding Horizontal Well Count by Year (1) New Wells Drilled 1H 2013 to Present (1) Delaware Basin Wolfcamp overpressure zone 2H 2014 1H 2014 2H 2013 1H 2013 EOX acreage (1) HPDI . 9

0 10 20 30 40 50 60 0 200 400 600 800 1,000 1,200 1,400 1,600 3 mos prod (Mmboe) Wells oldest to newest N Delaware N Midland Delaware Basin at an Inflection P oint ▪ Production curve shows upward EUR improvement and positive rate of change across Delaware and northern Midland Basins ▪ Based on the results of offset operators, we believe the Bone Spring / Wolfcamp horizons in northern Delaware Basin generate implied similar EUR results to the Midland Basin Wolfcamp wells while historically drilling shorter laterals ▪ The northern Delaware Basin has similar geology as the Midland Basin with the additional benefit of higher pressures at deeper depths ▪ Comparative analysis of the D&C design across Midland Basin and Delaware Basin indicate that longer laterals and greater number of frac stages are yet to be deployed in the Delaware Basin providing potential catalysts for EUR growth and incremental economics 3 Month Production Curve by Basin / H orizon 2012+ Source: HPDI . Note: Horizontal wells producing from Bone Spring, Wolfcamp and Trend Area horizons. Progression Chart 51 52 61 72 87 15 33 47 53 73 2010 2011 2012 2013 2014 Average 6 month cumulative production (Mboe) N Delaware N Midland N Delaware N Midland Point of inflection 10
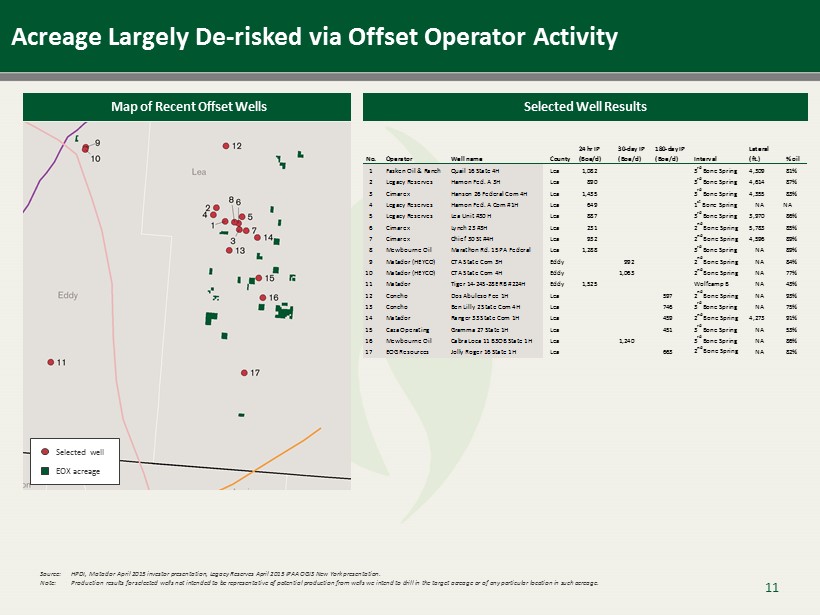
No. Operator Well name County 24 hr IP (Boe/d) 30-day IP (Boe/d) 180-day IP (Boe/d) Interval Lateral (ft.) % oil 1 Fasken Oil & Ranch Quail 16 State 4H Lea 1,082 3 rd Bone Spring 4,309 81% 2 Legacy Reserves Hamon Fed. A 3H Lea 890 3 rd Bone Spring 4,614 87% 3 Cimarex Hanson 26 Federal Com 4H Lea 1,435 3 rd Bone Spring 4,355 83% 4 Legacy Reserves Hamon Fed. A Com #1H Lea 649 1 st Bone Spring NA NA 5 Legacy Reserves Lea Unit #30 H Lea 887 3 rd Bone Spring 3,970 86% 6 Cimarex Lynch 23 #3H Lea 231 2 nd Bone Spring 5,783 85% 7 Cimarex Chief 30 St #4H Lea 932 2 nd Bone Spring 4,596 89% 8 Mewbourne Oil Marathon Rd. 15 PA Federal Lea 1,288 3 rd Bone Spring NA 89% 9 Matador (HEYCO) CTA State Com 3H Eddy 992 2 nd Bone Spring NA 84% 10 Matador (HEYCO) CTA State Com 4H Eddy 1,063 2 nd Bone Spring NA 77% 11 Matador Tiger 14-24S-28E RB #224H Eddy 1,525 Wolfcamp B NA 43% 12 Concho Dos Abuleso Fee 1H Lea 597 2 nd Bone Spring NA 93% 13 Concho Ben Lilly 2 State Com 4H Lea 746 3 rd Bone Spring NA 75% 14 Matador Ranger 33 State Com 1H Lea 459 2 nd Bone Spring 4,273 91% 15 Caza Operating Gramma 27 State 1H Lea 451 3 rd Bone Spring NA 53% 16 Mewbourne Oil Cabra Loca 11 B3OB State 1H Lea 1,240 3 rd Bone Spring NA 86% 17 EOG Resources Jolly Roger 16 State 1H Lea 663 2 nd Bone Spring NA 82% Acreage Largely De - risked via Offset Operator Activity Map of Recent Offset Wells Source: HPDI , Matador April 2015 investor presentation, Legacy Reserves April 2015 IPAA OGIS New York presentation. Note: Production results for selected wells not intended to be representative of potential production from wells we intend to drill in the tar get acreage or of any particular location in such acreage. Selected Well Results Selected well EOX acreage 11
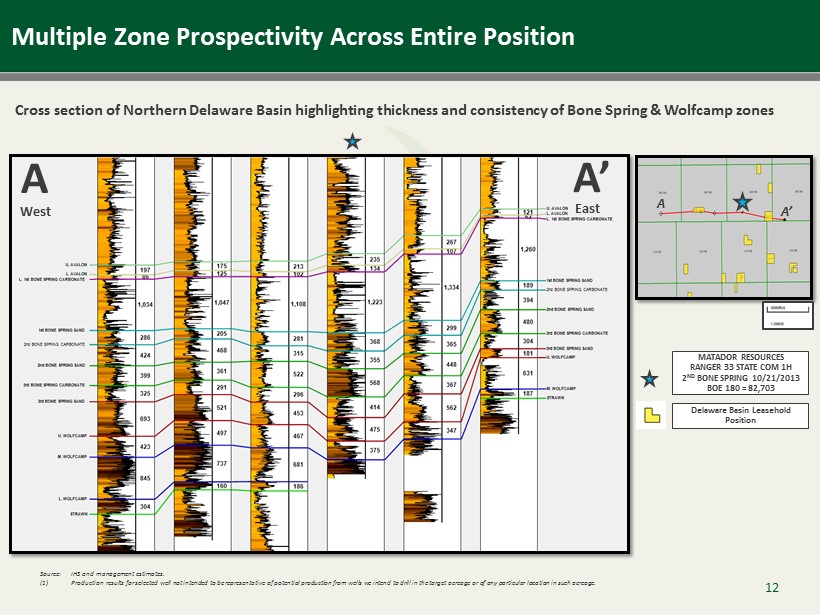
Multiple Zone Prospectivity Across Entire Position Cross section of Northern Delaware Basin highlighting thickness and consistency of Bone Spring & Wolfcamp zones Source : IHS and management estimates. (1 ) Production results for selected well not intended to be representative of potential production from wells we intend to drill in the targ et acreage or of any particular location in such acreage. 12 A A’ West East A A’ MATADOR RESOURCES RANGER 33 STATE COM 1H 2 ND BONE SPRING 10/21/2013 BOE 180 = 82,703 Delaware Basin Leasehold Position
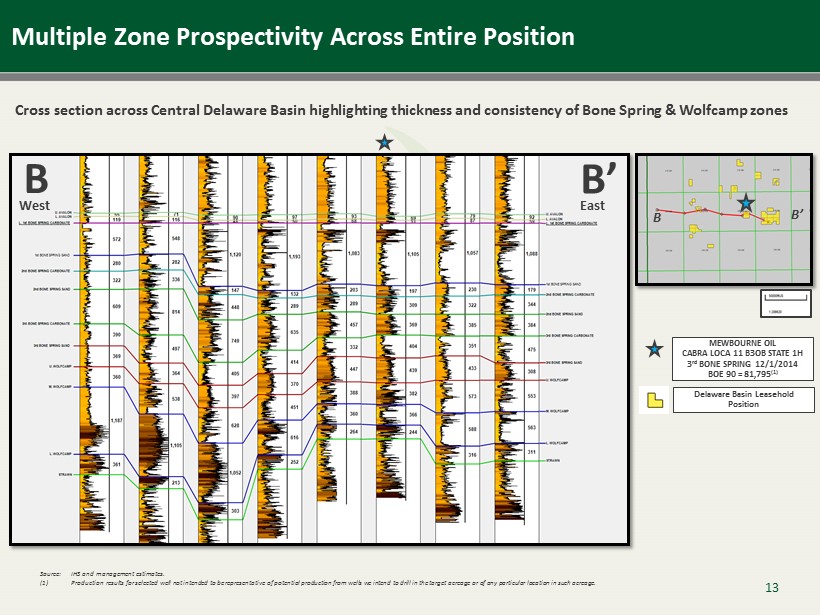
Multiple Zone Prospectivity Across Entire Position Cross section across Central Delaware Basin highlighting thickness and consistency of Bone Spring & Wolfcamp zones B B ’ West East B B’ MEWBOURNE OIL CABRA LOCA 11 B3OB STATE 1H 3 rd BONE SPRING 12/1/2014 BOE 90 = 81,795 (1) Delaware Basin Leasehold Position Source : IHS and management estimates. (1 ) Production results for selected well not intended to be representative of potential production from wells we intend to drill in the targ et acreage or of any particular location in such acreage. 13
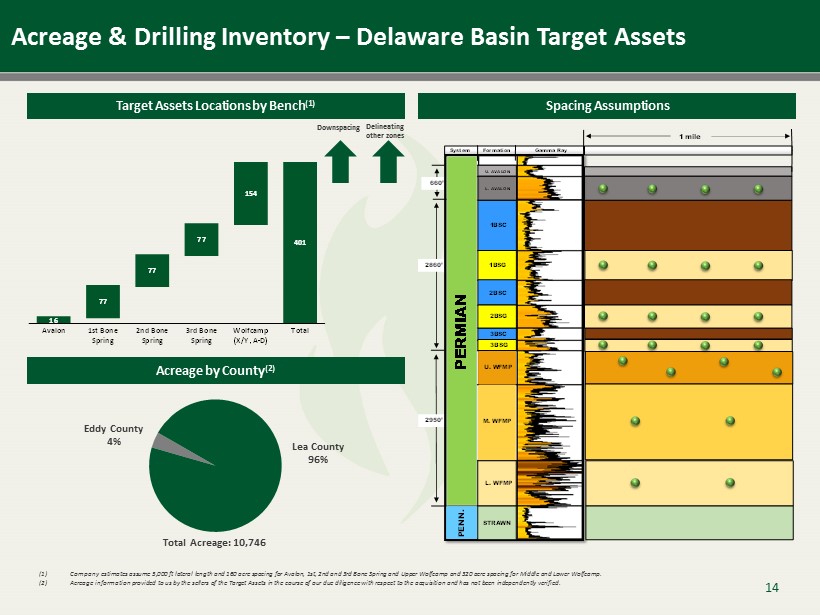
Acreage & Drilling Inventory – Delaware Basin Target Assets Spacing A ssumptions 660’ 2950’ 2860’ PERMIAN PENN. Gamma Ray System Formation 1 mile 3BSG 1BSC 2BSC 1BSG 2BSG 3BSC U. WFMP U. AVALON L. AVALON M . WFMP L . WFMP STRAWN Target Assets Locations by Bench (1) 16 401 77 77 77 154 Avalon 1st Bone Spring 2nd Bone Spring 3rd Bone Spring Wolfcamp (X/Y, A-D) Total Acreage by County (2) Total Acreage: 10,746 Lea County 96% Eddy County 4% (1 ) Company estimates assume 5,000 ft lateral length and 160 acre spacing for Avalon, 1st, 2nd and 3rd Bone Spring and Upper Wolfcamp and 320 acre spacing for Middle and Lower Wolfcamp. (2 ) Acreage information provided to us by the sellers of the Target Assets in the course of our due diligence with respect to the acquisi tio n and has not been independently verified. Downspacing Delineating other zones 14
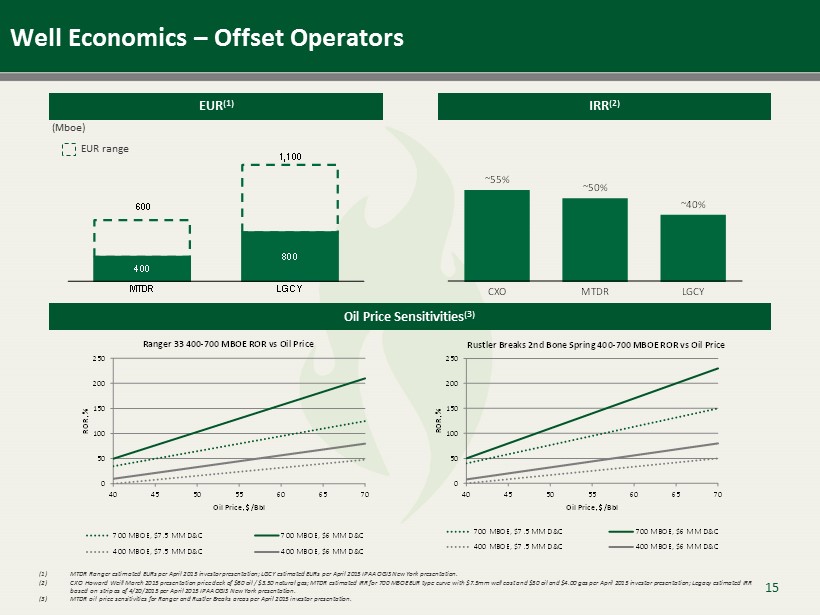
400 800 600 1,100 MTDR LGCY Well Economics – Offset Operators EUR (1) IRR (2) Oil Price Sensitivities (3) ~55% ~50% ~40% CXO MTDR LGCY 0 50 100 150 200 250 40 45 50 55 60 65 70 ROR, % Oil Price, $/Bbl Ranger 33 400 - 700 MBOE ROR vs Oil Price 700 MBOE, $7.5 MM D&C 700 MBOE, $6 MM D&C 400 MBOE, $7.5 MM D&C 400 MBOE, $6 MM D&C 0 50 100 150 200 250 40 45 50 55 60 65 70 ROR, % Oil Price, $/Bbl Rustler Breaks 2nd Bone Spring 400 - 700 MBOE ROR vs Oil Price 700 MBOE, $7.5 MM D&C 700 MBOE, $6 MM D&C 400 MBOE, $7.5 MM D&C 400 MBOE, $6 MM D&C (1 ) MTDR Ranger estimated EURs per April 2015 investor presentation; LGCY estimated EURs per April 2015 IPAA OGIS New York presentatio n. ( 2) CXO Howard Weill March 2015 presentation price deck of $60 oil / $3.50 natural gas; MTDR estimated IRR for 700 MBOE EUR type curv e w ith $7.5mm well cost and $50 oil and $4.00 gas per April 2015 investor presentation; Legacy estimated IRR based on strip as of 4/20/2015 per April 2015 IPAA OGIS New York presentation. (3 ) MTDR oil price sensitivities for Ranger and Rustler Breaks areas per April 2015 investor presentation. (Mboe) EUR range 15
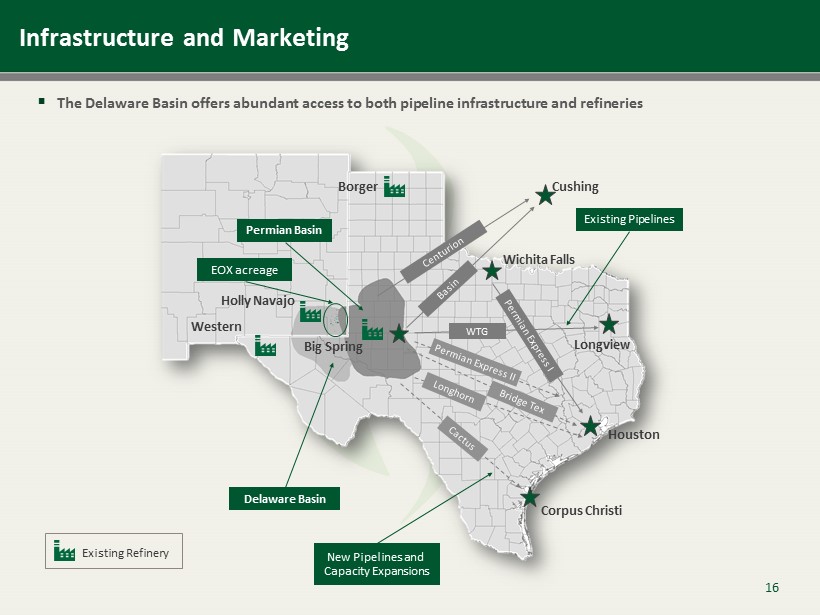
Infrastructure and Marketing Permian Basin Existing Refinery Holly Navajo Western Big Spring Borger Cushing Wichita Falls Longview Houston Corpus Christi Delaware Basin New Pipelines and Capacity Expansions Existing Pipelines WTG EOX acreage ▪ The Delaware Basin offers abundant access to both pipeline infrastructure and refineries 16

Operational Plan for Target Assets and Track Record of Success in Bakken 17

Operating Plan for Delaware Assets ▪ Operations team built to operate multi - rig drilling program ▪ Emerald is currently establishing an operations base in Hobbs, New Mexico ▪ Seasoned EOX technical and operations team positioned to ramp up drilling program and fully develop asset ▪ Retention of key contract field operations personnel & 3 rd party vendors to maintain operational continuity Operational Continuity and Asset Development Developmental M ap Experienced Operations Team ▪ Mike Dickinson – Chief Operating Officer – 20 years of industry experience ▪ Karl Osterbuhr – VP Exploration & Business Development – 20+ years of industry experience ▪ Brittany Rothe – Prospect Development Manager – 15 years of industry experience ▪ Dave Borowski – Senior Completions Engineer – 12 years of industry experience ▪ Wes Hudkins – Facility Engineering Manager – 7 years of industry experience Hz well location 18
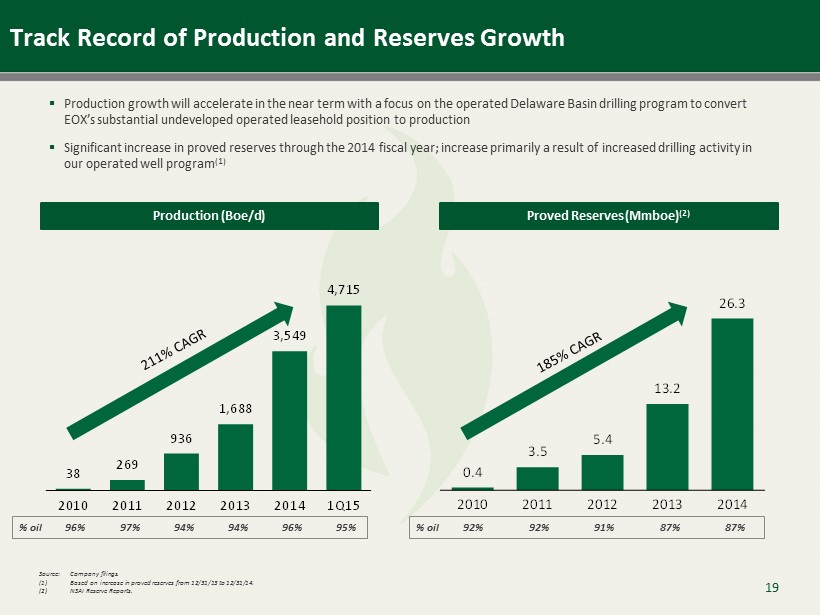
Track Record of Production and Reserves Growth Production ( Boe /d) ▪ Production growth will accelerate in the near term with a focus on the operated Delaware Basin drilling program to convert EOX’s substantial undeveloped operated leasehold position to production ▪ Significant increase in proved reserves through the 2014 fiscal year; increase primarily a result of increased drilling activity in our operated well program (1) Proved Reserves (Mmboe) (2) Source: Company filings. (1 ) Based on increase in proved reserves from 12/31/13 to 12/31/14. (2 ) NSAI Reserve Reports. 0.4 3.5 5.4 13.2 26.3 2010 2011 2012 2013 2014 38 269 936 1,688 3,549 4,715 2010 2011 2012 2013 2014 1Q15 % oil 96% 97% 94% 94% 96% 95% 92% 92% 91% 87% 87% % oil 19
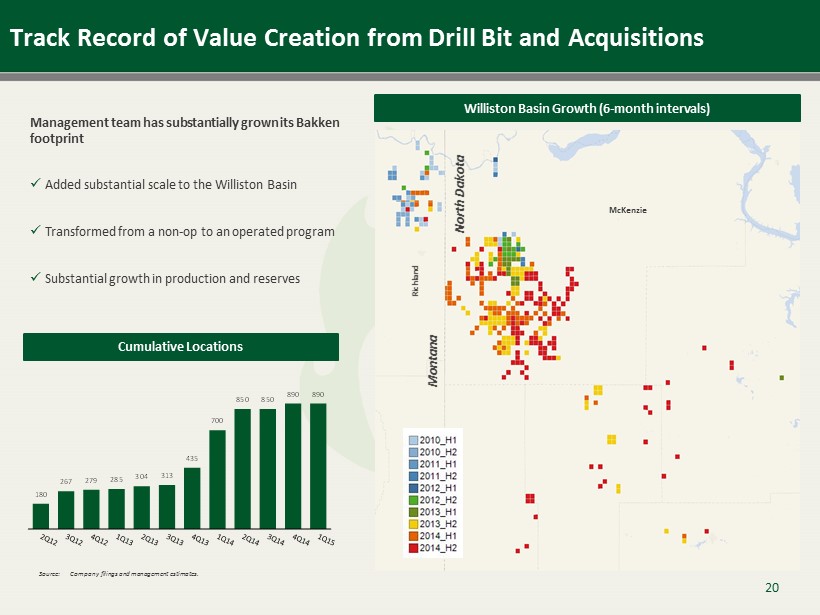
Track Record of Value Creation from Drill Bit and Acquisitions Source: Company filings and management estimates. Williston Basin Growth (6 - month intervals) Cumulative Locations 180 267 279 285 304 313 435 700 850 850 890 890 Management team has substantially grown its Bakken footprint x Added substantial scale to the Williston Basin x Transformed from a non - op to an operated program x Substantial growth in production and reserves McKenzie Richland Montana North Dakota 20
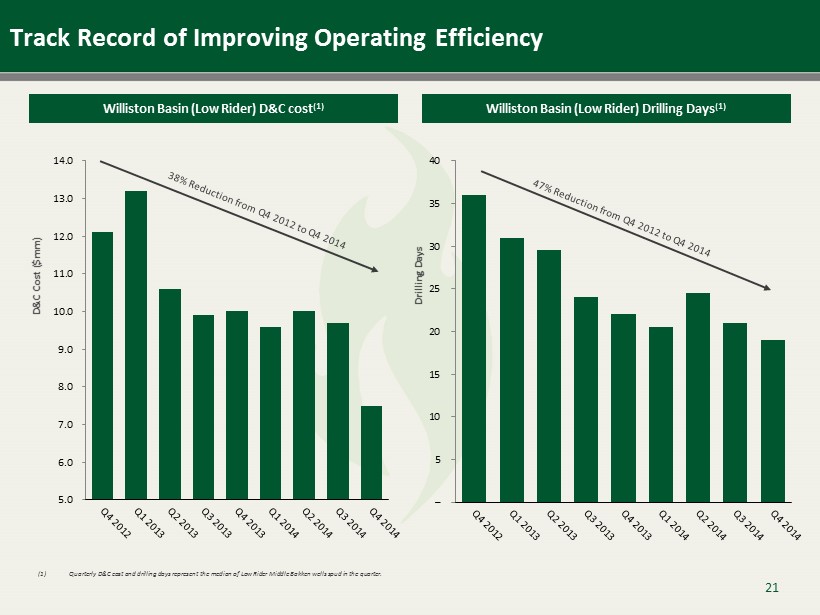
Track Record of Improving Operating Efficiency 21 Williston Basin (Low Rider) D&C cost (1) Williston Basin (Low Rider) Drilling Days (1) – 5 10 15 20 25 30 35 40 Drilling Days 5.0 6.0 7.0 8.0 9.0 10.0 11.0 12.0 13.0 14.0 D&C Cost ($mm) (1) Quarterly D&C cost and drilling days represent the median of Low Rider Middle Bakken wells spud in the quarter.
Successful Bakken Operations 22

Operated ~80% Non - Operated ~20% 72,000 36,000 8,000 6,000 McKenzie (Low Rider) McKenzie (Lewis & Clark) Richland Pronghorn Acreage & Drilling Inventory – Williston Basin Acreage Summary (Net Acres) (1 ) Management estimates based on 8 Middle Bakken wells and 4 Three Forks wells per 1,280 - acre spacing unit for Low Rider. Richland based on 5 Middle Bakken wells and 3 Three Forks wells per 1,280 - acre spacing unit. Pronghorn based on 6 Pronghorn sand wells per 1,280 - acre spacing unit. Lewis & Clark based on 5 Three Forks wells per 1,280 - acre spacing unit. Operated Acreage Total Operated Acreage: ~98,000 Project Area Net Acres Potential DSUs Wells / DSU Potential Locations (1) McKenzie (Low Rider) 72,000 56 12 672 McKenzie (Lewis & Clark) 36,000 28 5 140 Richland 8,000 6 8 48 Pronghorn 6,000 5 6 30 Total 122,000 95 890 Current Inventory Montana 7% North Dakota 93% Acreage by State Total Acreage: ~122,000 23
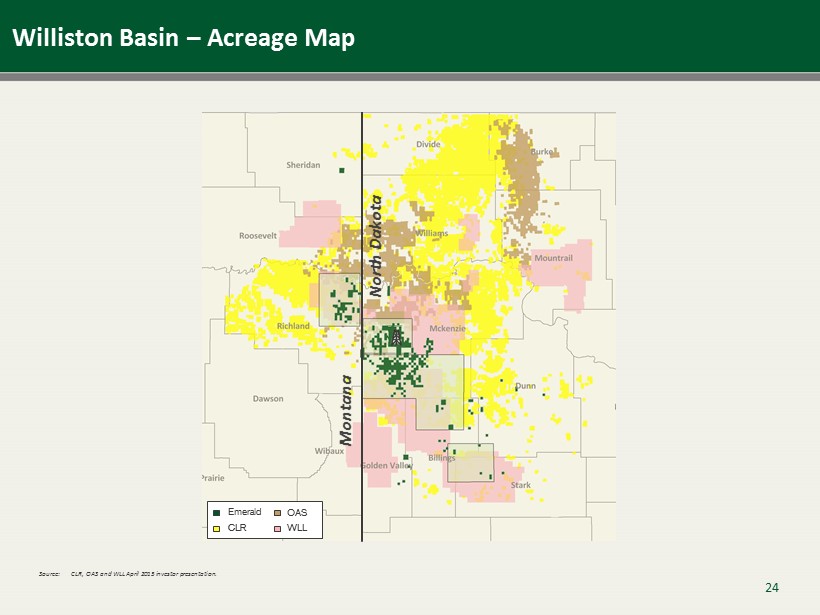
OAS Williston Basin – Acreage Map Source: CLR, OAS and WLL April 2015 investor presentation. North Dakota Montana 24 Emerald WLL CLR
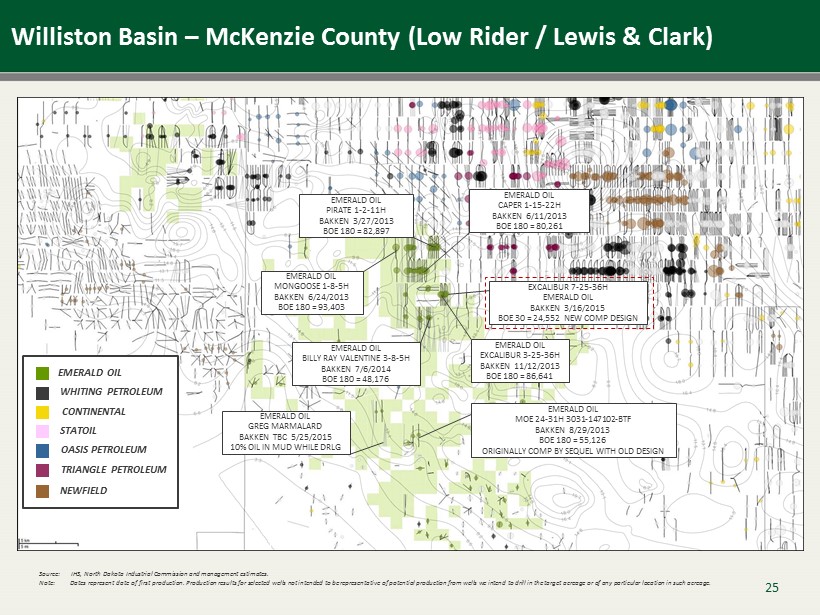
Williston Basin – McKenzie County (Low Rider / Lewis & Clark) EMERALD OIL BILLY RAY VALENTINE 3 - 8 - 5H BAKKEN 7/6/2014 BOE 180 = 48,176 EMERALD OIL CAPER 1 - 15 - 22H BAKKEN 6/11/2013 BOE 180 = 80,261 EMERALD OIL EXCALIBUR 3 - 25 - 36H BAKKEN 11/12/2013 BOE 180 = 86,641 EMERALD OIL MONGOOSE 1 - 8 - 5H BAKKEN 6/24/2013 BOE 180 = 93,403 EMERALD OIL WHITING PETROLEUM CONTINENTAL STATOIL OASIS PETROLEUM NEWFIELD TRIANGLE PETROLEUM EMERALD OIL PIRATE 1 - 2 - 11H BAKKEN 3/27/2013 BOE 180 = 82,897 EMERALD OIL MOE 24 - 31H 3031 - 147102 - BTF BAKKEN 8/29/2013 BOE 180 = 55,126 ORIGINALLY COMP BY SEQUEL WITH OLD DESIGN EMERALD OIL GREG MARMALARD BAKKEN TBC 5/25/2015 10% OIL IN MUD WHILE DRLG EXCALIBUR 7 - 25 - 36H EMERALD OIL BAKKEN 3/16/2015 BOE 30 = 24,552 NEW COMP DESIGN Source : IHS, North Dakota Industrial Commission and management estimates. Note: Dates represent date of first production. Production results for selected wells not intended to be representative of potential production from wells we intend to drill in the tar get acreage or of any particular location in such acreage. 25
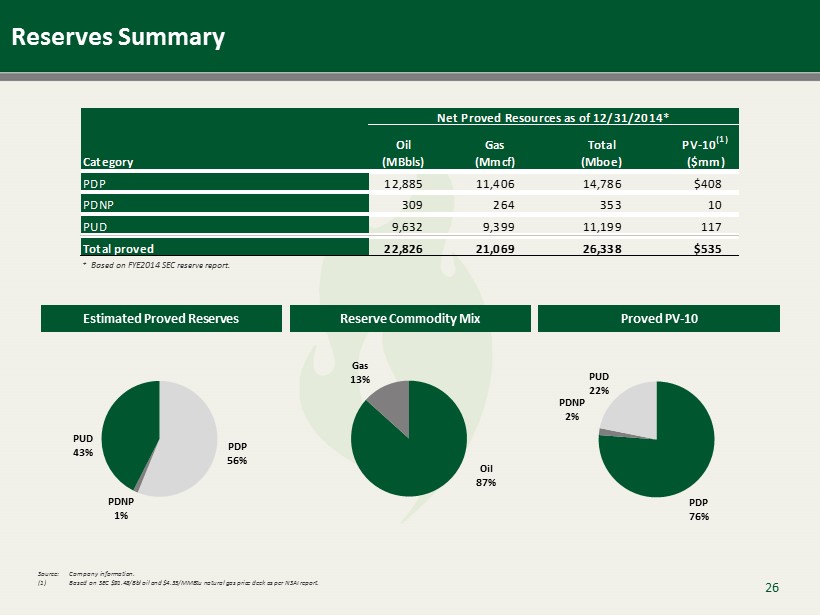
Reserves Summary PDP 56% PDNP 1% PUD 43% Oil 87% Gas 13% PDP 76% PDNP 2% PUD 22% Estimated Proved Reserves Reserve Commodity Mix Proved PV - 10 Source: Company information. (1 ) Based on SEC $91.48/Bbl oil and $4.35/MMBtu natural gas price deck as per NSAI report. Category Oil (MBbls) Gas (Mmcf) Total (Mboe) PV-10 (1) ($mm) PDP 12,885 11,406 14,786 $408 PDNP 309 264 353 10 PUD 9,632 9,399 11,199 117 Total proved 22,826 21,069 26,338 $535 Net Proved Resources as of 12/31/2014* * Based on FYE2014 SEC reserve report. 26
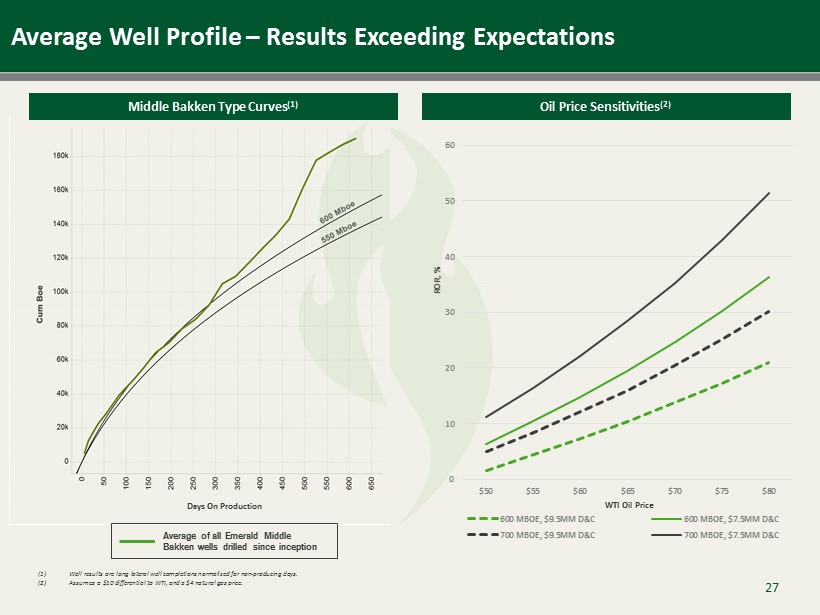
Days On Production Middle Bakken Type Curves (1) (1) Well results are long lateral well completions normalized for non - producing days. (2) Assumes a $10 differential to WTI, and a $4 natural gas price. Oil Price Sensitivities (2) Average of all Emerald Middle Bakken wells drilled since inception 0 10 20 30 40 50 60 $50 $55 $60 $65 $70 $75 $80 600 MBOE, $9.5MM D&C 600 MBOE, $7.5MM D&C 700 MBOE, $9.5MM D&C 700 MBOE, $7.5MM D&C WTI Oil Price ROR, % 27 Average Well Profile – Results Exceeding Expectations

▪ Well cost down 15% - 20% versus historical well costs – D&C services down ~20% since October 2014 – Drilling rig cost fixed due to contractual agreement through October 2015 – Service pricing anticipated to decline further upon contract rollover ▪ O perational efficiency to further drive down drilling cost – Fixed operational day rate during drilling places emphasis on minimizing days on location – Drive performance via acute operational management and incentivizing personnel to be aligned with Emerald’s corporate goals – Continue to negotiate service providers to deliver best pricing ▪ S trategic partnership on fracture stimulation reduced cost by $600K – Current fracture stimulation costs averaging approximately $2.6mm per well – Reduce mechanical isolation per well to reduce frac plug expenditure – Continue to evaluate competitive options for frac water & water transfer ▪ Drive D&C AFE Cost in Williston Basin to $7.0mm per well – Focus development opportunities to core area with existing infrastructure – Continue to partner with best in class vendors to optimize operational performance Capital Cost Reduction Update 28

Financial Summary 29

36% Delaware Basin 64% Williston Basin 97% Drill & Complete 3 % Land Budget 2015E Production Guidance (Boe/d) ( 4) 2015E (3) Capital Expenditures (4) 2015E Capital Plan (4) 2015 Capital Plan ($ in millions) (1) Includes 4 full wells and drilling 2 additional wells. (2) Includes 5 full wells and the completion of 8 previously drilled wells. (3) Represents mid - point of 2015E updated drilling budget of $85 - $109 million and 2015E land budget of $1 - $5 million . (4) These estimates are based on numerous assumptions, including assumptions related to number of wells drilled, average spud to releas e t imes, rig count, and production rates for wells placed on production. All or any of these assumptions may not prove to be accurate, which could result in actual results differing materially from estimates . No assurance can be made that new wells will produce in line with historic performance, or that existing wells will continue to produce in line with expectations. Our ability to finance our 2015 capital budget is subject to numerous risks and uncertainties. We do not undertake any obligation to release publicly the results of any future revisions we may make to this prospective da ta or to update this prospective data to reflect events or circumstances after the date of this presentation. Therefore, you are cautioned no t t o place undue reliance on this information. Williston Basin Delaware Basin Land Budget Drill & Complete 2015E Total Capital Expenditures $86 – $114 million ▪ 2015E drilling budget of $85 - $109 million for 12 - month period ending 12/31/15 ▪ 100% operated drilling activity − Delaware Basin: Expect to drill 5 net operated horizontal wells (1) in 2015 with a 1 rig program − Williston Basin: Expect to drill & complete 6.5 - 8.5 net operated horizontal wells (2) in 2015 with a variable 1 rig program ▪ Emerald maintains the flexibility to add wells to the 2015 Delaware Basin development plan with commodity price improvement 30 ▪ Updating 4Q guidance to reflect Target Assets acquisition and development 4,150 4,650 4,450 4,150 4,715 4,500 4,300 4,600 1Q15A 2Q15E 3Q15E 4Q15E Midpoint of previous guidance New Guidance Actual 4,800 4,600 4,900
▪ Disciplined deployment of capital and capital efficient production growth − 2015 capital budget represents ~68% reduction from 2014; service cost declines can further reduce the D&C portion of capital budget particularly in the Bakken − Reduced Williston Basin rig count from 3 to 0.5 in Q4 2014 following the rapid commodity price decline − 2015 production expected to grow ~27% over 2014 production ▪ Strengthened balance sheet preserves flexibility − No near-term debt maturities − Hedging floored on maximum amount allowed by bank group for 2015 and 2016 Capital Discipline in Current Commodity Environment 31
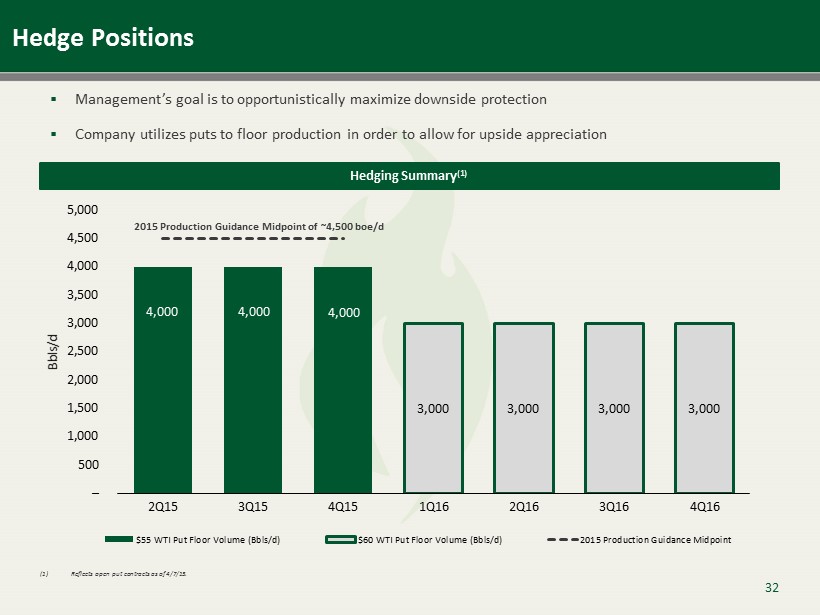
4,000 4,000 4,000 3,000 3,000 3,000 3,000 – 500 1,000 1,500 2,000 2,500 3,000 3,500 4,000 4,500 5,000 2Q15 3Q15 4Q15 1Q16 2Q16 3Q16 4Q16 Bbls/d $55 WTI Put Floor Volume (Bbls/d) $60 WTI Put Floor Volume (Bbls/d) 2015 Production Guidance Midpoint Hedge Positions Hedging Summary (1) ▪ Management’s goal is to opportunistically maximize downside protection ▪ Company utilizes puts to floor production in order to allow for upside appreciation (1 ) Reflects open put contracts as of 4/7/15. 2015 Production Guidance Midpoint of ~4,500 boe/d 32
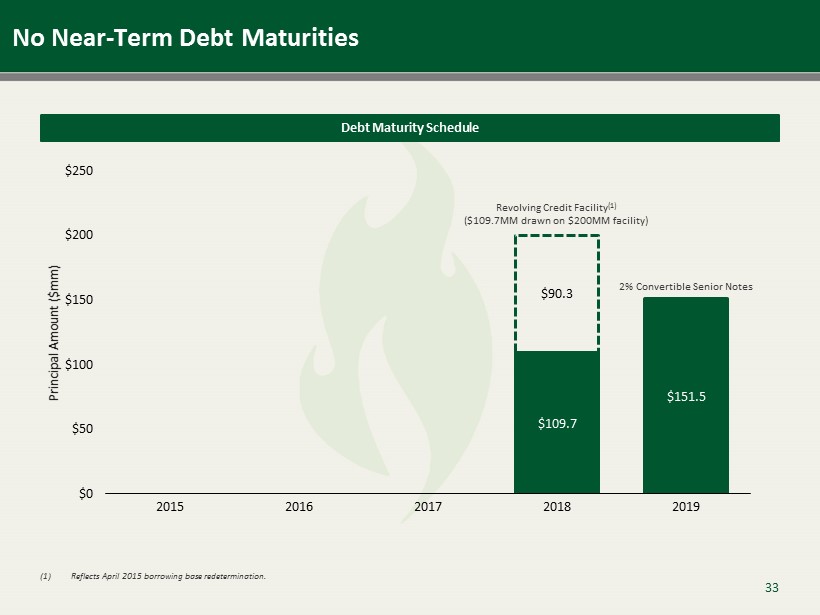
$109.7 $151.5 $90.3 $0 $50 $100 $150 $200 $250 2015 2016 2017 2018 2019 Principal Amount ($mm) No Near - Term Debt Maturities 33 Debt Maturity Schedule Revolving Credit Facility (1) ($109.7MM drawn on $200MM facility) 2% Convertible Senior Notes (1 ) Reflects April 2015 borrowing base redetermination.
Emerald Oil, Inc. 1600 Broadway Suite 1360 Denver, CO 80202 (303) 595 - 5600 Auditor BDO USA, LLP Houston, Texas Independent Petroleum Engineer Netherland, Sewell & Associates, Inc. Houston, Texas Legal Counsel Mayer Brown LLP Houston, Texas Corporate Contact Mitch Ayer VP of Finance & Investor Relations (303) 595 - 5600 info@emeraldoil.com Corporate Contact Information 34