Attached files
| file | filename |
|---|---|
| 8-K - 8-K - RCS Capital Corp | v409775_8k.htm |
| EX-99.1 - EXHIBIT 99.1 - RCS Capital Corp | v409775_ex99-1.htm |
Exhibit 99.2

American Realty Capital 1 May 2015 First Quarter 2015 Financial & Operating Results
2 2 Forward - Looking Statements Certain statements made in this presentation are forward - looking statements . Those statements include statements regarding the intent, belief or current expectations of RCS Capital Corporation (“us,” “our,” “RCAP ” or the “Company”) and members of its management team, as well as the assumptions on which such statements are based, and generally are identified by the use of words such as “may,” “will,” “seeks,” “anticipates,” “believes,” “estimates,” “expects,” “plans,” “intends,” “should” or similar expressions . Actual results may differ materially from those contemplated by such forward - looking statements . Further, forward - looking statements speak only as of the date they are made, and we undertake no obligation to update or
revise forward - looking statements to reflect changed assumptions, the occurrence of unanticipated events or changes to future operating results over time, unless required by law . The following are some of the possible risks and uncertainties, although not all risks and uncertainties, that could cause our actual results to differ materially from those presented in our forward - looking statements : the impact on our business of the events relating to American Realty Capital Properties, Inc . announcement concerning errors in its financial statements our ability to integrate our recently acquired businesses into our existing businesses ; whether and when we will be able to realize the anticipated benefits from our recent acquisitions ; significant dilution could result from future issuances of our Class A common stock ; future sales of our Class A common stock could lower the market price of our Class A common stock ; adverse developments in the direct investment program industry ; deterioration in the business environment in the specific sectors of the economy in which we focus or a decline in the market for securities of companies within these sectors ; substantial fluctuations in our financial results ; our ability to retain our senior professionals and key management personnel of our recently acquired businesses ; pricing and other competitive pressures ; changes in laws and regulations and industry practices that adversely affect our business ; incurrence of losses in the future ; competition from larger firms ; limitations on our access to capital ; malfunctioning or failure in our operations and infrastructure ; failure to achieve and maintain effective internal controls ; and the factors included in our most recent Annual Report on Form 10 - K and any subsequent Quarterly Reports on Form 10 - Q or Current Reports on Form 8 - K .
3 2 Disclaimer This presentation includes estimated projections of 2014 and 2015 operating results . These projections were not prepared in accordance with published guidelines of the SEC or the guidelines established by the American Institute of Certified Public Accountants for preparation and presentation of financial projections . This information is not fact and should not be relied upon as being necessarily indicative of future results ; the projections were prepared in good faith by management and are based on numerous assumptions that may prove to be wrong . Important factors that may affect actual results and cause the projections to not be achieved include, but are not limited to, risks and uncertainties relating to the company and other factors described under “Risk Factors” section of the Company’s Annual Report on Form 10 - K, as amended, and any subsequent Quarterly Reports on Form 10 - Q or Current Reports on Form 8 - K and “Forward - Looking Statements . ” The projections also reflect assumptions as to certain business decisions that are subject to change . As a result, actual results may differ materially from those contained in the estimates . Accordingly, there can be no assurance that the estimates will be realized . This presentation also contains estimates and information concerning our industry, including market position, market size, and growth rates of the markets in which we participate, that are based on industry publications and reports . This information involves a number of assumptions and limitations, and you are cautioned not to give undue weight to these estimates . We have not independently verified the accuracy or completeness of the data contained in these industry publications and reports . The industry in which we operate is subject to a high degree of uncertainty and risk due to variety of factors, including those described in the “Risk Factors” section of the Company’s Annual Report on Form 10 - K and any subsequent Quarterly Reports on Form 10 - Q or Current Reports on Form 8 - K and “Forward Looking Statements” . These and other factors could cause results to differ materially from those expressed in these publications and reports .
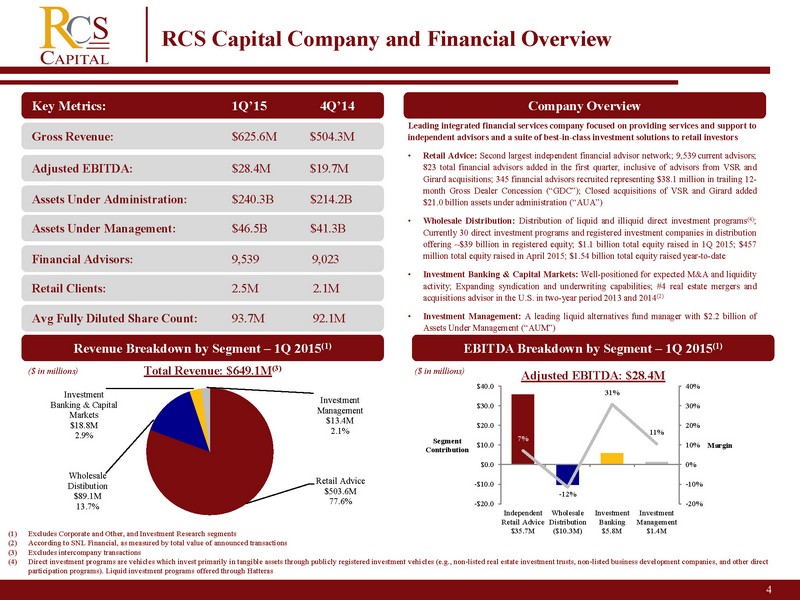
4 RCS Capital Company and Financial Overview (1) Excludes Corporate and Other, and Investment Research segments (2) According to SNL Financial, as measured by total value of announced transactions (3) Excludes intercompany transactions (4) Direct investment programs are vehicles which invest primarily in tangible assets through publicly registered investment vehi cle s (e.g., non - listed real estate investment trusts, non - listed business development companies, and other direct participation programs). Liquid investment programs offered through Hatteras Key Metrics: 1Q’15 4Q’14 Revenue Breakdown by Segment – 1Q 2015 (1 ) ($ in millions) Total Revenue: $649.1M (3) Gross Revenue: $625.6M $504.3M Adjusted EBITDA: $28.4M $19.7M Assets Under Administration: $240.3B $21
4.2B Financial Advisors: 9,539 9,023 Retail Clients: 2.5M 2.1M Company Overview Leading integrated financial services company focused on providing services and support to independent advisors and a suite of best - in - class investment solutions to retail investors • Retail Advice : Second largest independent financial advisor network ; 9 , 539 current advisors ; 823 total financial advisors added in the first quarter, inclusive of advisors from VSR and Girard acquisitions ; 345 financial advisors recruited representing $ 38 . 1 million in trailing 12 - month Gross Dealer Concession (“GDC ”) ; Closed acquisitions of VSR and Girard added $ 21 . 0 billion assets under administration (“AUA”) • Wholesale Distribution : D istribution of liquid and illiquid direct investment programs ( 4 ) ; Currently 30 direct investment programs and registered investment companies in distribution offering ~ $ 39 billion in registered equity ; $ 1 . 1 billion total equity raised in 1 Q 2015 ; $ 457 million total equity raised in April 2015 ; $ 1 . 54 billion total equity raised year - to - date • Investment Banking & Capital Markets : Well - positioned for expected M&A and liquidity activity ; Expanding syndication and underwriting capabilities ; # 4 real estate mergers and acquisitions advisor in the U . S . in two - year period 2013 and 2014 ( 2 ) • Investment Management : A leading liquid alternatives fund manager with $ 2 . 2 billion of Assets Under Management (“AUM”) Avg Fully Diluted Share Count: 93.7M 92.1M EBITDA Breakdown by Segment – 1Q 2015 (1 ) ($ in millions) Adjusted EBITDA: $28.4M Assets Under Management: $46.5B $41.3B Retail Advice $503.6M 77.6% Wholesale Distibution $89.1M 13.7% Investment Banking & Capital Markets $18.8M 2.9% Investment Management $13.4M 2.1% 7% - 12% 31% 11% -20% -10% 0% 10% 20% 30% 40% -$20.0 -$10.0 $0.0 $10.0 $20.0 $30.0 $40.0 Independent Retail Advice $35.7M Wholesale Distribution ($10.3M) Investment Banking $5.8M Investment Management $1.4M Margin Segment Contribution

5 First Quarter 2015 Financial & Operating Highlights (1) Excludes $23.4 million non - cash revenue for the first quarter 2015 recognized from fair market value accounting of embedded deri vatives in securities issued in connection with the Cetera financing (2) Retention rate based on annualized regrettable attrition in the quarter divided by trailing 12 month GDC (ex - current quarter) (3) Based on regrettable attrition Note: 1Q 2014 results are pro forma Adjusted Net Income: • Adjusted Net Income of $17.4 million, or $0.19 per fully diluted share Net Income/(Loss) (GAAP): • ($15.4) million for the first quarter, or ($0.47) per fully diluted share Adjusted EBITDA: • Adjusted EBITDA of $28.4 million; or $38.6 million excluding Wholesale division • Retail Adjusted EBITDA of $35.7 million Revenue: • Revenue of $602.2million (1) ; down 11.0% from the year - ago quarter, primarily due to lower Wholesale division revenues Assets Under Administration: • Assets Under Administration of $240.3 billion, u p 15.4% from the year - ago quarter Assets Under Management: • Assets Under Management of $46.5 billion, up 31.7% from the year - ago quarter Advisors: • 9,539 independent retail financial advisors servicing approximately 2.5 million clients Advisor Retention: • 96.9% annualized advisor retention for the first quarter based on trailing 12 - month GDC (2) • Continued focus on profitable advisor retention and recruiting Advisor Recruitment: • 823 total financial advisors added in the first quarter, inclusive of advisors from VSR and Girard acquisitions • 345 financial advisors recruited in the first quarter representing $38.1 million in GDC • $23.5 million in net recruited GDC for the first quarter compared to $20.9 million in the prior quarter (3) • GDC from advisors recruited in first quarter 160% higher than advisors who left the platform (3) Completed Acquisitions: • Closed previously announced acquisitions of VSR Group and Girard Securities, adding $21.0 billion AUA to Cetera Financial Group’s eleven member network of independent broker - dealers Balance Sheet: • Net secured debt increased by $15.8 million during the quarter as a result of net new borrowings under secured revolver • Remain compliant under debt covenants as of March 31, 2015 Cash: • $189.3 million of cash and equivalents at the end of the first quarter, inclusive of regulatory capital
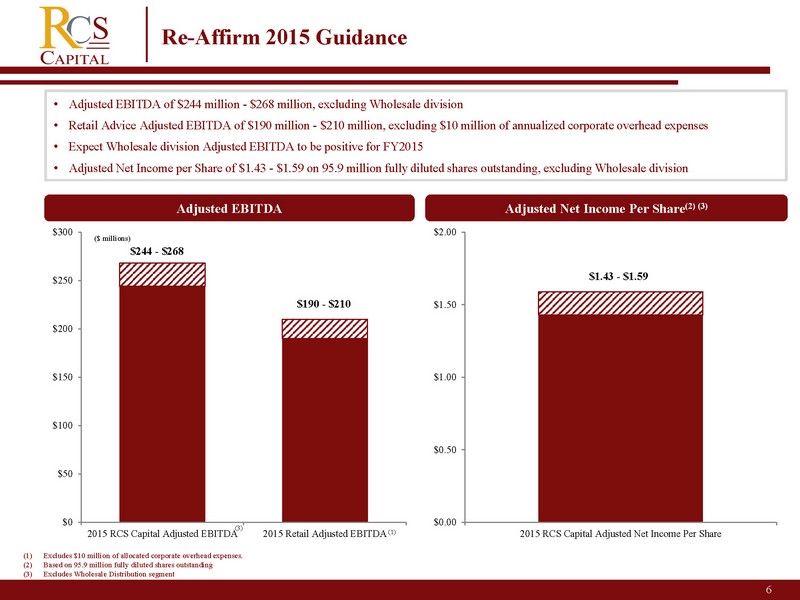
6 2 Re - Affirm 2015 Guidance Adjusted EBITDA (1) Excludes $10 million of allocated corporate overhead expenses. (2) Based on 95.9 million fully diluted shares outstanding (3) Excludes Wholesale Distribution segment (1) ($ millions) Adjusted Net Income Per Share (2 ) (3) (3) $ 244 - $268 $ 190 - $210 $0 $50 $100 $150 $200 $250 $300 2015 RCS Capital Adjusted EBITDA 2015 Retail Adjusted EBITDA $ 1.43 - $1.59 $0.00 $0.50 $1.00 $1.50 $2.00 2015 RCS Capital Adjusted Net Income Per Share • Adjusted EBITDA of $244 million - $268 million, excluding Wholesale division • Retail Advice Adjusted EBITDA of $190 million - $210 million, excluding $10 million of annualized corporate overhead expenses • Expect Wholesale division Adjusted EBITDA to be positive for FY2015 • Adjusted Net Incom
e per Share of $1.43 - $1.59 on 95.9 million fully diluted shares outstanding, excluding Wholesale division

7 1Q 2015 Actual to Full Year 2015E Retail Adjusted EBITDA Guidance Bridge ($ millions) $19 - $32 $8 - $12 $190 - $210 $11 - $14 $35.7 $35.7 $152 $152 $169 $177 $2.3 $0.0 $50.0 $100.0 $150.0 $200.0 $250.0 Q1 2015 Retail Advice Adjusted EBITDA Q1 2015 Corporate Overhead Adjustment Q1 2015 Annualized (+) Normalization of DPP & Expenses + Business Seasonality / Organic Growth (+) VSR / Girard Impact (+) Incremental 2015 Synergies & Cost Saves Comparable FY2015 Retail Advice Adjusted EBITDA Guidance (1) (1) Includes $11 million synergies realized in Q1 annualized
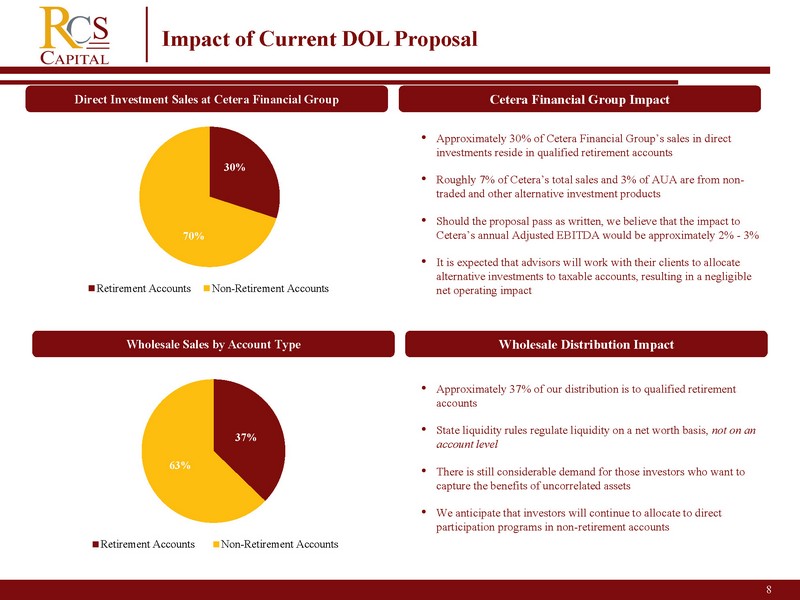
8 Impact of Current DOL Proposal • Approximately 30% of Cetera Financial Group’s sales in direct investments reside in qualified retirement accounts • Roughly 7% of Cetera’s total sales and 3% of AUA are from non - traded and other alternative investment products • Should the proposal pass as written, we believe that the impact to Cetera’s annual Adjusted EBITDA would be approximately 2% - 3% • It is expected that advisors will work with their clients to allocate alternative investments to taxable accounts, resulting in a negligible net operating impact Wholesale Sales by Account Type Wholesale Distribution Impact • Approximately 37% of our distribution is to qualified retirement accounts • State liquidity rules regulate liquidity on a net worth basis, not on an accoun
t level • There is still considerable demand for those investors who want to capture the benefits of uncorrelated assets • We anticipate that investors will continue to allocate to direct participation programs in non - retirement accounts 37% 63% Retirement Accounts Non-Retirement Accounts Direct Investment Sales at Cetera Financial Group Cetera Financial Group Impact 30% 70% Retirement Accounts Non-Retirement Accounts

9 2 (1) Producing Advisors, excludes licensed home office advisors (2) Reflects assets in internal advisory programs (3) Trailing 12 - months (4) Represents funds from new accounts and additional funds deposited into existing advisory accounts that are custodied in our fee - based advisory platforms, less account attrition and funds withdrawn from advisory accounts (5) Excludes the impact of allocated corporate overhead expenses (6) Includes previously identified 2015 synergies as well as incremental costs saves Key Retail Advice Metrics Gross Recruited GDC (3) ($M): $38.1 $30.8 23.4% Net New Advisory Assets (4) ($M): $724.0 $1,152 (37.2%) AUM (2) ($B): $46.5 $35.3 31.7% Net Recruited GDC (3) ($M): $23.5 $26.0 (9.6%) Retail Advice Adjusted EBITDA Margin Significant Margi
n Expansion Opportunities • Cash sweep revenue • Levered to rising interest rates • 100 bps Fed Funds rate increase adds approximately $65 - $130 million EBITDA • Transition to FDIC - based programs expected in 2015 • Historically low levels (< 4 % ) of client assets held in cash • Penetration of higher margin advisory assets • Incremental operating efficiencies • Natural margin expansion on organic revenue growth • Future acquisitions generating incremental EBITDA • Normalization of DPP and annuity sales Retail Expansion Opportunities: Successful Recruiting & Retention and Margin Expansion (6) 5.1% 6.5% 7.4% 6.4% 7.1% >9.5 % 0.0% 2.5% 5.0% 7.5% 10.0% Q1 2014 Q2 2014 Q3 2014 Q4 2014 Q1 2015 Post Synergies (5) Total Advisors (1) : 9,539 9,165 4.1% Retention Rate: 96.9% 98.7% ( 1.8 %) AUA ($B): $240.3 $208.3 15.4% Q1’15 Q1’14 Change Q1’15 Q1’14 Change
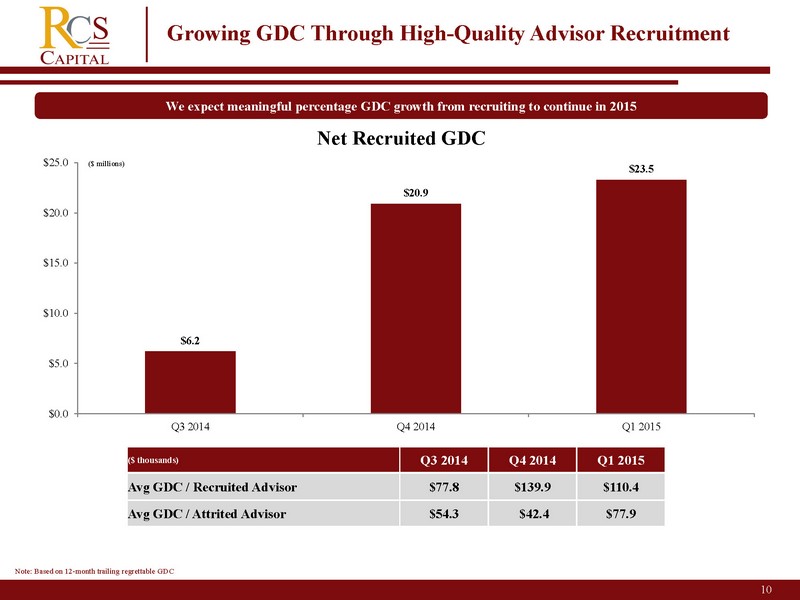
10 Growing GDC Through High - Quality Advisor Recruitment We expect meaningful percentage GDC growth from recruiting to continue in 2015 ($ millions) ($ thousands) Q3 20 14 Q4 2014 Q1 2015 Avg GDC / Recruited Advisor $ 77.8 $ 139.9 $110.4 Avg GDC / Attrited Advisor $ 54.3 $ 42.4 $77.9 Note: Based on 12 - month trailing regrettable GDC $6.2 $20.9 $ 23.5 $0.0 $5.0 $10.0 $15.0 $20.0 $25.0 Q3 2014 Q4 2014 Q1 2015 Net Recruited GDC
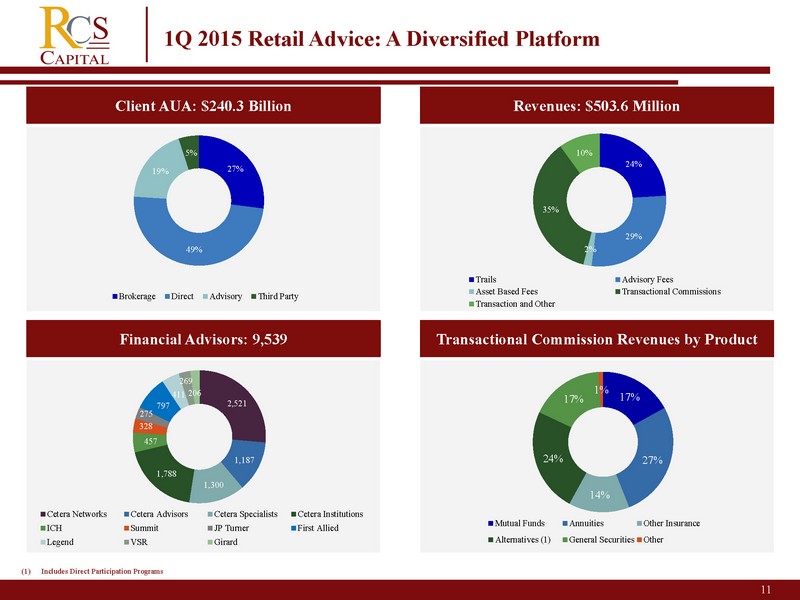
11 S 1Q 2015 Retail Advice: A Diversified Platform Financial Advisors: 9,539 Revenues : $503.6 Million Client AUA: $240.3 Billion Transactional Commission Revenues by Product 24% 29% 2% 35% 10% Trails Advisory Fees Asset Based Fees Transactional Commissions Transaction and Other 27% 49% 19% 5% Brokerage Direct Advisory Third Party 2,521 1,187 1,300 1,788 457 328 275 797 411 269 206 Cetera Networks Cetera Advisors Cetera Specialists Cetera Institutions ICH Summit JP Turner First Allied Legend VSR Girard 17% 27% 14% 24% 17% 1% Mutual Funds Annuities Other Insurance Alternatives (1) General Securities Other (1) Includes Direct Participation Programs
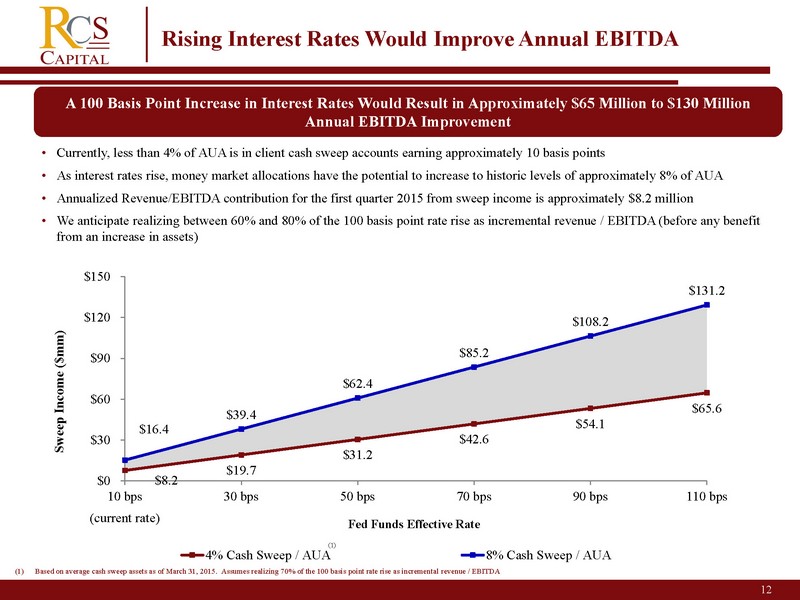
12 Rising Interest Rates Would Improve Annual EBITDA • Currently, less than 4% of AUA is in client cash sweep accounts earning approximately 10 basis points • As interest rates rise, money market allocations have the potential to increase to historic levels of approximately 8% of AUA • Annualized Revenue/EBITDA contribution for the first quarter 2015 from sweep income is approximately $8.2 million • We anticipate realizing between 60% and 80 % of the 100 basis point rate rise as incremental revenue / EBITDA (before any benefit from an increase in assets) A 100 Basis Point Increase in Interest Rates Would Result in Approximately $65 Million to $ 130 Million Annual EBITDA Improvement $8.2 $19.7 $ 31.2 $ 42.6 $54.1 $65.6 $ 16.4 $39.4 $ 62.4 $85.2 $ 108.2 $ 131.2 $0 $30
$60 $90 $120 $150 10 bps 30 bps 50 bps 70 bps 90 bps 110 bps 4% Cash Sweep / AUA 8% Cash Sweep / AUA Fed Funds Effective Rate Sweep Income ($mm) (current rate) (1) (1) Based on average cash sweep assets as of March 31, 2015. Assumes realizing 70% of the 100 basis point rate rise as increment al revenue / EBITDA
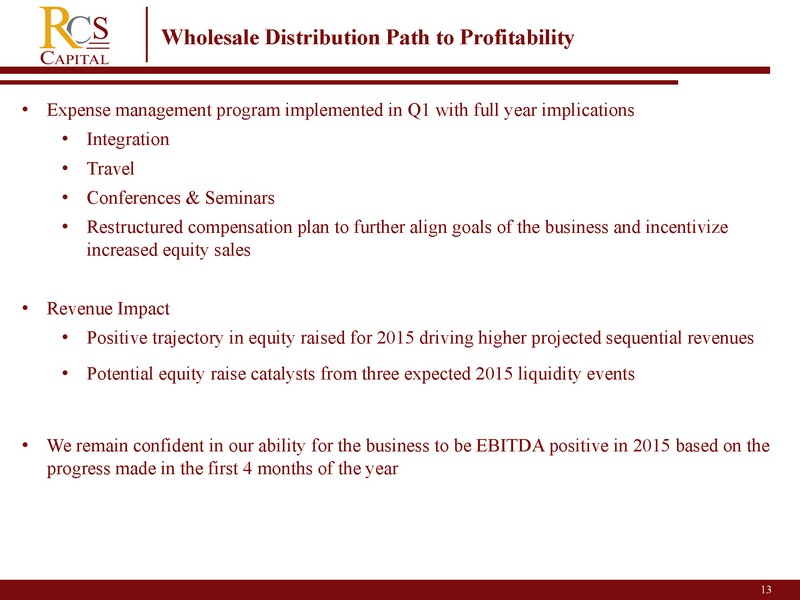
13 Wholesale Distribution Path to Profitability • Expense management program implemented in Q1 with full year implications • Integration • Travel • Conferences & Seminars • Restructured c ompensation plan to further align goals of the business and incentivize increased equity sales • Revenue Impact • Positive trajectory in equity raised for 2015 driving higher projected sequential revenues • Potential equity raise catalysts from three expected 2015 liquidity events • We remain confident in our ability for the business to be EBITDA positive in 2015 based on the progress made in the first 4 months of the year
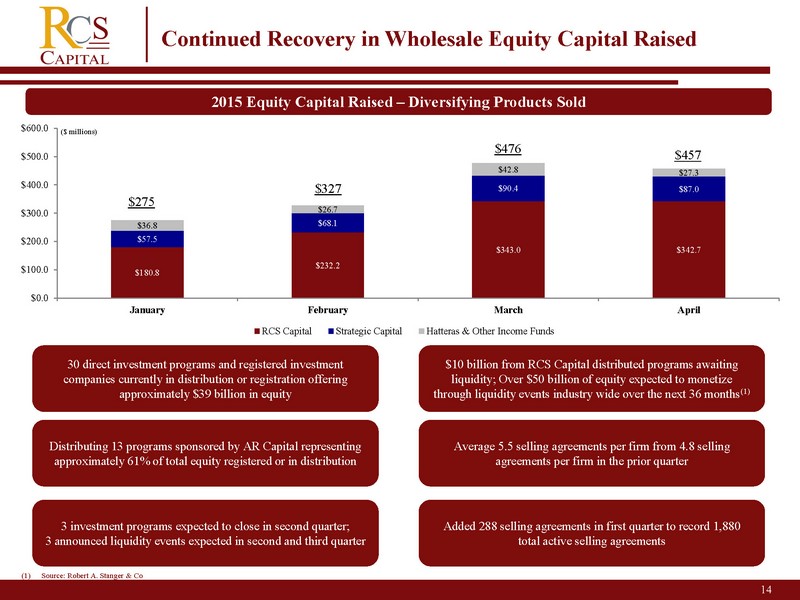
14 2 Continued Recovery in Wholesale Equity Capital Raised 2015 Equity Capital Raised – Diversifying Products Sold 30 direct investment programs and registered investment companies currently in distribution or registration offering approximately $39 billion in equity Distributing 13 programs sponsored by AR Capital representing approximately 61% of total equity registered or in distribution 3 investment programs expected to close in second quarter; 3 announced liquidity events expected in second and third quarter $10 billion from RCS Capital distributed programs awaiting liquidity; Over $50 billion of equity expected to monetize through liquidity events industry wide over the next 36 months (1) ($ millions) Average 5.5 selling agreements per firm from 4.8 selling agreem
ents per firm in the prior quarter Added 288 selling agreements in first quarter to record 1,880 total active selling agreements $180.8 $232.2 $343.0 $342.7 $57.5 $68.1 $90.4 $87.0 $36.8 $26.7 $42.8 $27.3 $0.0 $100.0 $200.0 $300.0 $400.0 $500.0 $600.0 January February March April RCS Capital Strategic Capital Hatteras & Other Income Funds $275 $327 $476 $457 (1) Source: Robert A. Stanger & Co
American Realty Capital Appendix 15 2
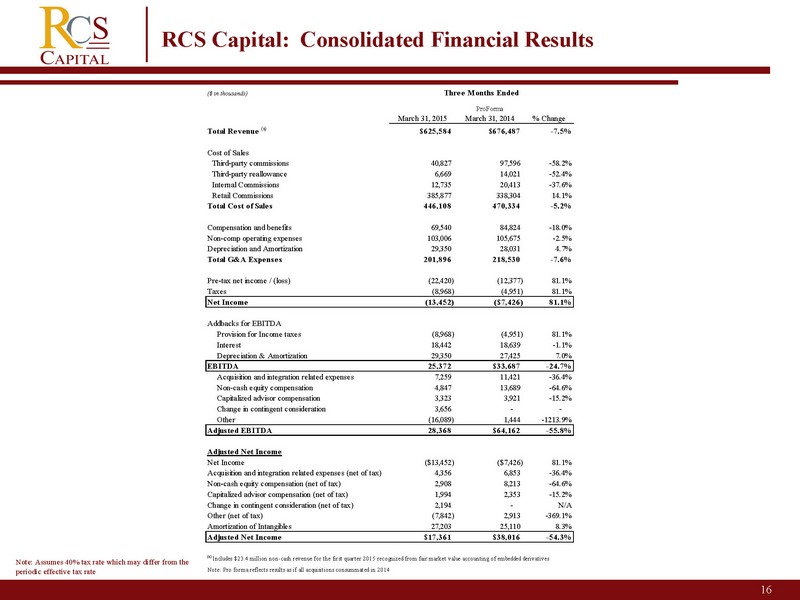
16 RCS Capital: Consolidated Financial Results Note: Assumes 40% tax rate which may differ from the periodic effective tax rate ($ in thousands) ProForma March 31, 2015 March 31, 2014 % Change Total Revenue (a) $625,584 $676,487 -7.5% Cost of Sales Third-party commissions 40,827 97,596 -58.2% Third-party reallowance 6,669 14,021 -52.4% Internal Commissions 12,735 20,413 -37.6% Retail Commissions 385,877 338,304 14.1% Total Cost of Sales 446,108 470,334 -5.2% Compensation and benefits 69,540 84,824 -18.0% Non-comp operating expenses 103,006 105,675 -2.5% Depreciation and Amortization 29,350 28,031 4.7% Total G&A Expenses 201,896 218,530 -7.6% Pre-tax net income / (loss) (22,420) (12,377) 81.1% Taxes (8,968) (4,951) 81.1% Net Income (13,452) ($7,426) 81.1% Ad
dbacks for EBITDA Provision for Income taxes (8,968) (4,951) 81.1% Interest 18,442 18,639 -1.1% Depreciation & Amortization 29,350 27,425 7.0% EBITDA 25,372 $33,687 -24.7% Acquisition and integration related expenses 7,259 11,421 -36.4% Non-cash equity compensation 4,847 13,689 -64.6% Capitalized advisor compensation 3,323 3,921 -15.2% Change in contingent consideration 3,656 - - Other (16,089) 1,444 -1213.9% Adjusted EBITDA 28,368 $64,162 -55.8% Adjusted Net Income Net Income ($13,452) ($7,426) 81.1% Acquisition and integration related expenses (net of tax) 4,356 6,853 -36.4% Non-cash equity compensation (net of tax) 2,908 8,213 -64.6% Capitalized advisor compensation (net of tax) 1,994 2,353 -15.2% Change in contingent consideration (net of tax) 2,194 - N/A Other (net of tax) (7,842) 2,913 -369.1% Amortization of Intangibles 27,203 25,110 8.3% Adjusted Net Income $17,361 $38,016 -54.3% (a) Includes $23.4 million non-cash revenue for the first quarter 2015 recognized from fair market value accounting of embedded derivatives Note: Pro forma reflects results as if all acquisitions consummated in 2014 Three Months Ended

17 Bridging EBITDA to Cash EPS – 1Q 2015 (1) Other primarily includes capitalized advisor compensation, change in contingent consideration, as well as other non - recurring pr ofessional service fees (2) EPS based on 93.7 million fully diluted shares Note: Assumes 40% tax rate which may differ from the periodic effective tax rate ($ in millions except per share data) Net Income Adjusted Net Income 1Q 2015 Adjusted EBITDA $28.4 1Q 2015 Net Income ($13.5) ( - ) Non - cash equity compensation $4.8 Plus: Share - based compensation (net of tax) $2.9 ( - ) Transaction costs $7.3 Plus: Amortization of acquired intangibles $27.2 ( - ) Fair Value Attributable to Derivative ($23.4) Plus: Acquisition & integration expense (net of tax) $4.4 ( - ) Other (1) $14.3 Plus: Fair Value Attribu
table to Derivative (net of tax) ($14.1) 1Q 2015 EBITDA $25.4 Plus: Other (net of tax) $10.5 1Q 2015 Adjusted Net Income $17.4 Less: D&A $29.4 1Q 2015 Adjusted EPS (2) (Non - GAAP) $0.19 Less: Interest $18.4 1Q 2015 EBT ($22.4) Less: Taxes $8.9 1Q 2015 Net Income ($13.5) 1Q 2015 Net Income Per Share (1) (Non - GAAP) ($0.14)
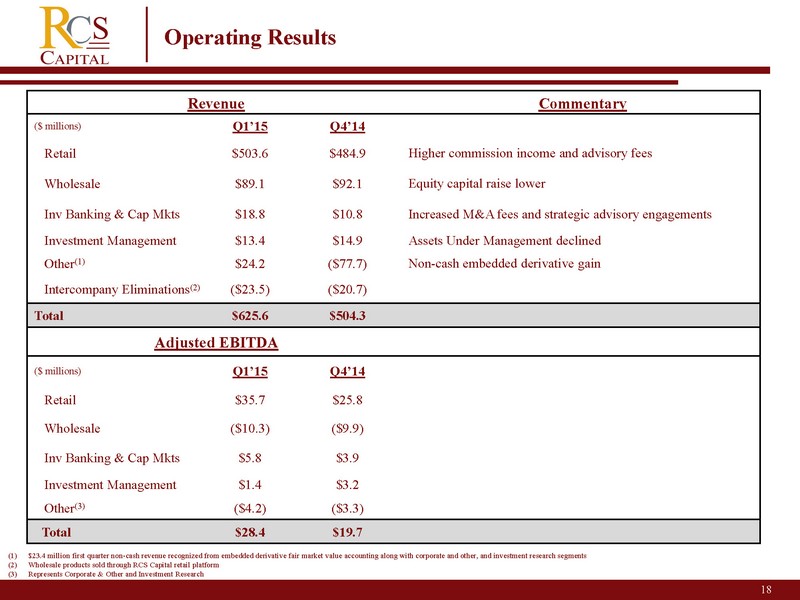
18 Revenue Commentary ($ millions) Q1’15 Q4’14 Retail $503.6 $484.9 Higher commission income and advisory fees Wholesale $89.1 $92.1 Equity capital raise lower Inv Banking & Cap Mkts $18.8 $10.8 Increased M&A fees and strategic advisory engagements Investment Management $13.4 $14.9 Assets Under Management declined Other (1) $24.2 ($77.7) Non - cash embedded derivative gain Intercompany Eliminations (2) ($23.5) ($20.7) Total $625.6 $504.3 Adjusted EBITDA ($ millions) Q1’15 Q4’14 Retail $35.7 $25.8 Wholesale ($10.3) ($9.9) Inv Banking & Cap Mkts $5.8 $3.9 Investment Management $1.4 $3.2 Other (3) ($4.2) ($3.3) Total $28.4 $19.7 Operating Results (1) $23.4 million first quarter non - cash revenue recognized from embedded derivative fair market value accounting a
long with corporate and other, and investment research segments (2) Wholesale products sold through RCS Capital retail platform (3) Represents Corporate & Other and Investment Research
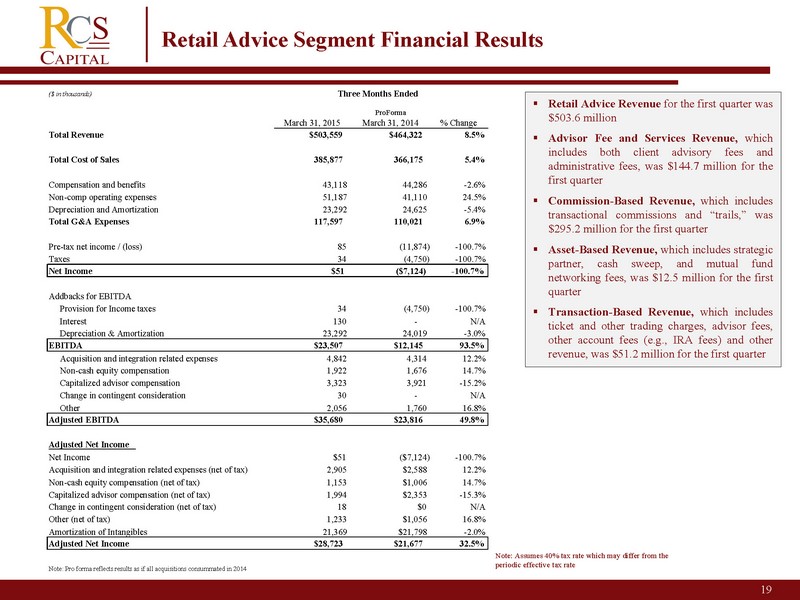
19 Retail Advice Segment Financial Results ▪ Retail Advice Revenue for the first quarter was $ 503 . 6 million ▪ Advisor Fee and Services Revenue, which includes both client advisory fees and administrative fees, was $ 144 . 7 million for the first quarter ▪ Commission - Based Revenue, which includes transactional commissions and “trails,” was $ 295 . 2 million for the first quarter ▪ Asset - Based Revenue, which includes strategic partner, cash sweep, and mutual fund networking fees, was $ 12 . 5 million for the first quarter ▪ Transaction - Based Revenue, which includes ticket and other trading charges, advisor fees, other account fees (e . g . , IRA fees) and other revenue, was $ 51 . 2 million for the first quarter Note: Assumes 40% tax rate which may differ from the pe
riodic effective tax rate ($ in thousands) ProForma March 31, 2015 March 31, 2014 % Change Total Revenue $503,559 $464,322 8.5% Total Cost of Sales 385,877 366,175 5.4% Compensation and benefits 43,118 44,286 - 2.6% Non - comp operating expenses 51,187 41,110 24.5% Depreciation and Amortization 23,292 24,625 - 5.4% Total G&A Expenses 117,597 110,021 6.9% Pre - tax net income / (loss) 85 (11,874) - 100.7% Taxes 34 (4,750) - 100.7% Net Income $51 ($7,124) - 100.7% Addbacks for EBITDA Provision for Income taxes 34 (4,750) - 100.7% Interest 130 - N/A Depreciation & Amortization 23,292 24,019 - 3.0% EBITDA $23,507 $12,145 93.5% Acquisition and integration related expenses 4,842 4,314 12.2% Non - cash equity compensation 1,922 1,676 14.7% Capitalized advisor compensation 3,323 3,921 - 15.2% Change in contingent consideration 30 - N/A Other 2,056 1,760 16.8% Adjusted EBITDA $35,680 $23,816 49.8% Adjusted Net Income Net Income $51 ($7,124) - 100.7% Acquisition and integration related expenses (net of tax) 2,905 $2,588 12.2% Non - cash equity compensation (net of tax) 1,153 $1,006 14.7% Capitalized advisor compensation (net of tax) 1,994 $2,353 - 15.3% Change in contingent consideration (net of tax) 18 $0 N/A Other (net of tax) 1,233 $1,056 16.8% Amortization of Intangibles 21,369 $21,798 - 2.0% Adjusted Net Income $28,723 $21,677 32.5% Note: Pro forma reflects results as if all acquisitions consummated in 2014 Three Months Ended
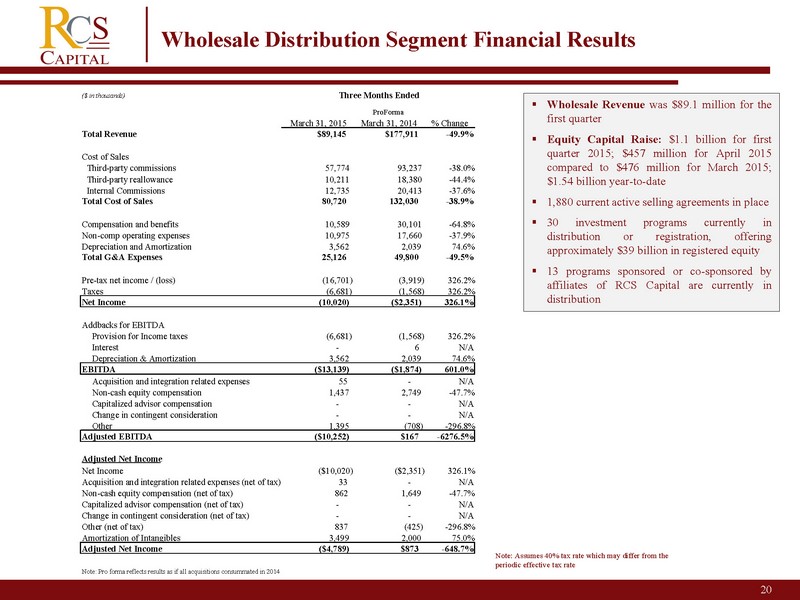
20 Wholesale Distribution Segment Financial Results ▪ Wholesale Revenue was $ 89 . 1 million for the first quarter ▪ Equity Capital Raise : $ 1 . 1 billion for first quarter 2015 ; $ 457 million for April 2015 compared to $ 476 million for March 2015 ; $ 1 . 54 billion year - to - date ▪ 1 , 880 current active selling agreements in place ▪ 30 investment programs currently in distribution or registration, offering approximately $ 39 billion in registered equity ▪ 13 programs sponsored or co - sponsored by affiliates of RCS Capital are currently in distribution Note: Assumes 40% tax rate which may differ from the periodic effective tax rate ($ in thousands) ProForma March 31, 2015 March 31, 2014 % Change Total Revenue $89,145 $177,911 - 49.9% Cost of Sales Third - party commissions 57,774 93,237 - 38.0% Third - party reallowance 10,211 18,380 - 44.4% Internal Commissions 12,735 20,413 - 37.6% Total Cost of Sales 80,720 132,030 - 38.9% Compensation and benefits 10,589 30,101 - 64.8% Non - comp operating expenses 10,975 17,660 - 37.9% Depreciation and Amortization 3,562 2,039 74.6% Total G&A Expenses 25,126 49,800 - 49.5% Pre - tax net income / (loss) (16,701) (3,919) 326.2% Taxes (6,681) (1,568) 326.2% Net Income (10,020) ($2,351) 326.1% Addbacks for EBITDA Provision for Income taxes (6,681) (1,568) 326.2% Interest - 6 N/A Depreciation & Amortization 3,562 2,039 74.6% EBITDA ($13,139) ($1,874) 601.0% Acquisition and integration related expenses 55 - N/A Non - cash equity compensation 1,437 2,749 - 47.7% Capitalized advisor compensation - - N/A Change in contingent consideration - - N/A Other 1,395 (708) - 296.8% Adjusted EBITDA ($10,252) $167 - 6276.5% Adjusted Net Income Net Income ($10,020) ($2,351) 326.1% Acquisition and integration related expenses (net of tax) 33 - N/A Non - cash equity compensation (net of tax) 862 1,649 - 47.7% Capitalized advisor compensation (net of tax) - - N/A Change in contingent consideration (net of tax) - - N/A Other (net of tax) 837 (425) - 296.8% Amortization of Intangibles 3,499 2,000 75.0% Adjusted Net Income ($4,789) $873 - 648.7% Note: Pro forma reflects results as if all acquisitions consummated in 2014 Three Months Ended
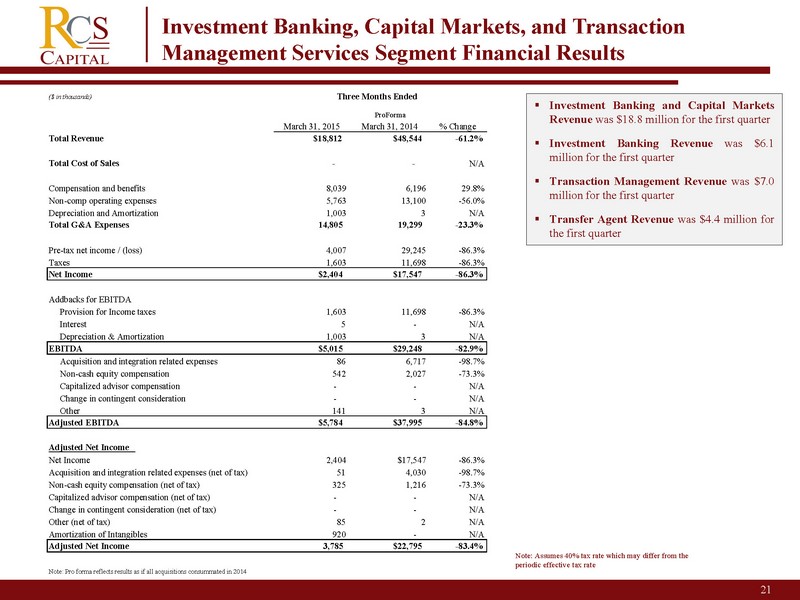
21 Investment Banking, Capital Markets, and Transaction Management Services Segment Financial Results ▪ Investment Banking and Capital Markets Revenue was $ 18 . 8 million for the first quarter ▪ Investment Banking Revenue was $ 6 . 1 million for the first quarter ▪ Transaction Management Revenue was $ 7 . 0 million for the first quarter ▪ Transfer Agent Revenue was $ 4 . 4 million for the first quarter Note: Assumes 40% tax rate which may differ from the periodic effective tax rate ($ in thousands) ProForma March 31, 2015 March 31, 2014 % Change Total Revenue $18,812 $48,544 - 61.2% Total Cost of Sales - - N/A Compensation and benefits 8,039 6,196 29.8% Non - comp operating expenses 5,763 13,100 - 56.0% Depreciation and Amortization 1,003 3 N/A Total G&A Expen
ses 14,805 19,299 - 23.3% Pre - tax net income / (loss) 4,007 29,245 - 86.3% Taxes 1,603 11,698 - 86.3% Net Income $2,404 $17,547 - 86.3% Addbacks for EBITDA Provision for Income taxes 1,603 11,698 - 86.3% Interest 5 - N/A Depreciation & Amortization 1,003 3 N/A EBITDA $5,015 $29,248 - 82.9% Acquisition and integration related expenses 86 6,717 - 98.7% Non - cash equity compensation 542 2,027 - 73.3% Capitalized advisor compensation - - N/A Change in contingent consideration - - N/A Other 141 3 N/A Adjusted EBITDA $5,784 $37,995 - 84.8% Adjusted Net Income Net Income 2,404 $17,547 - 86.3% Acquisition and integration related expenses (net of tax) 51 4,030 - 98.7% Non - cash equity compensation (net of tax) 325 1,216 - 73.3% Capitalized advisor compensation (net of tax) - - N/A Change in contingent consideration (net of tax) - - N/A Other (net of tax) 85 2 N/A Amortization of Intangibles 920 - N/A Adjusted Net Income 3,785 $22,795 - 83.4% Note: Pro forma reflects results as if all acquisitions consummated in 2014 Three Months Ended
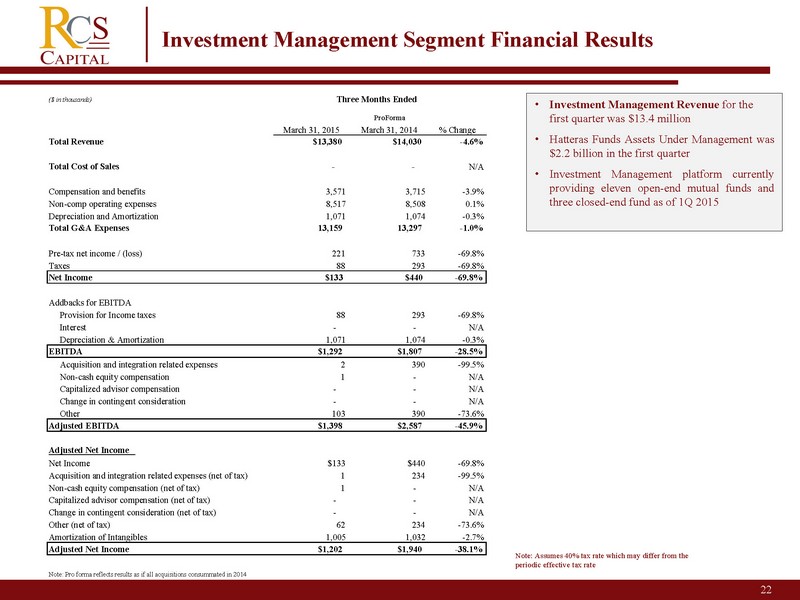
22 Investment Management Segment Financial Results • Investment Management Revenue for the first quarter was $13.4 million • Hatteras Funds Assets Under Management was $ 2 . 2 billion in the first quarter • Investment Management platform currently providing eleven open - end mutual funds and three closed - end fund as of 1 Q 2015 Note: Assumes 40% tax rate which may differ from the periodic effective tax rate ($ in thousands) ProForma March 31, 2015 March 31, 2014 % Change Total Revenue $13,380 $14,030 - 4.6% Total Cost of Sales - - N/A Compensation and benefits 3,571 3,715 - 3.9% Non - comp operating expenses 8,517 8,508 0.1% Depreciation and Amortization 1,071 1,074 - 0.3% Total G&A Expenses 13,159 13,297 - 1.0% Pre - tax net income / (loss) 221 733 - 69.
8% Taxes 88 293 - 69.8% Net Income $133 $440 - 69.8% Addbacks for EBITDA Provision for Income taxes 88 293 - 69.8% Interest - - N/A Depreciation & Amortization 1,071 1,074 - 0.3% EBITDA $1,292 $1,807 - 28.5% Acquisition and integration related expenses 2 390 - 99.5% Non - cash equity compensation 1 - N/A Capitalized advisor compensation - - N/A Change in contingent consideration - - N/A Other 103 390 - 73.6% Adjusted EBITDA $1,398 $2,587 - 45.9% Adjusted Net Income Net Income $133 $440 - 69.8% Acquisition and integration related expenses (net of tax) 1 234 - 99.5% Non - cash equity compensation (net of tax) 1 - N/A Capitalized advisor compensation (net of tax) - - N/A Change in contingent consideration (net of tax) - - N/A Other (net of tax) 62 234 - 73.6% Amortization of Intangibles 1,005 1,032 - 2.7% Adjusted Net Income $1,202 $1,940 - 38.1% Note: Pro forma reflects results as if all acquisitions consummated in 2014 Three Months Ended
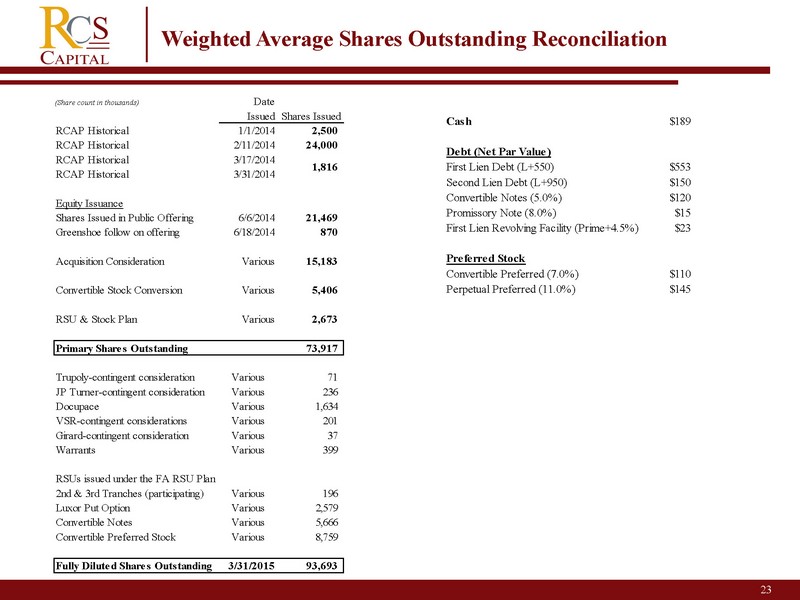
23 Weighted Average Shares Outstanding Reconciliation (Share count in thousands) Date Issued Shares Issued RCAP Historical 1/1/2014 2,500 RCAP Historical 2/11/2014 24,000 RCAP Historical 3/17/2014 RCAP Historical 3/31/2014 Equity Issuance Shares Issued in Public Offering 6/6/2014 21,469 Greenshoe follow on offering 6/18/2014 870 Acquisition Consideration Various 15,183 Convertible Stock Conversion Various 5,406 RSU & Stock Plan Various 2,673 Primary Shares Outstanding 73,917 Trupoly-contingent consideration Various 71 JP Turner-contingent consideration Various 236 Docupace Various 1,634 VSR-contingent considerations Various 201 Girard-contingent consideration Various 37 Warrants Various 399 RSUs issued under the FA RSU Plan 2nd & 3rd Tranches (participating) Various 196 Luxor Put Opti
on Various 2,579 Convertible Notes Various 5,666 Convertible Preferred Stock Various 8,759 Fully Diluted Shares Outstanding 3/31/2015 93,693 1,816 Cash $189 Debt (Net Par Value) First Lien Debt (L+550) $553 Second Lien Debt (L+950) $150 Convertible Notes (5.0%) $120 Promissory Note (8.0%) $15 First Lien Revolving Facility (Prime+4.5%) $23 Preferred Stock Convertible Preferred (7.0%) $110 Perpetual Preferred (11.0%) $145
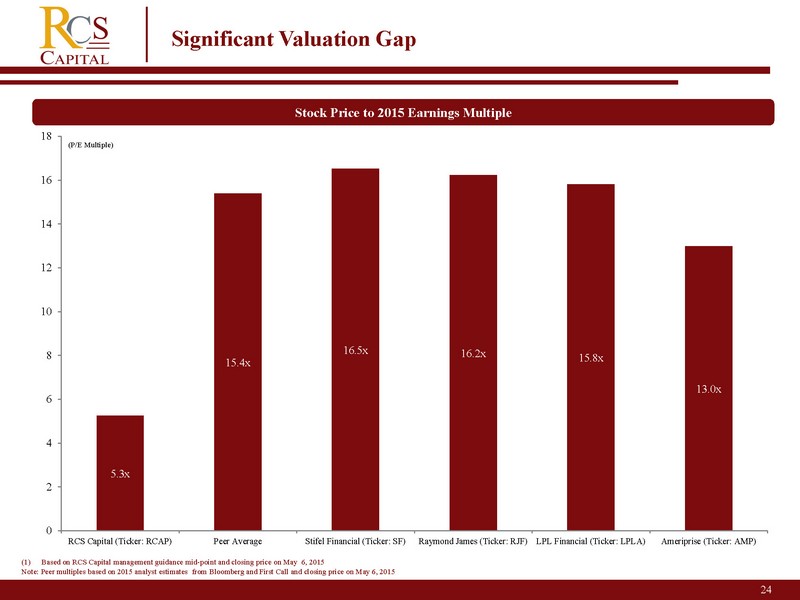
24 (1) Based on RCS Capital management guidance mid - point and closing price on May 6, 2015 Note: Peer multiples based on 2015 analyst estimates from Bloomberg and First Call and closing price on May 6, 2015 Significant Valuation Gap (P/E Multiple) Stock Price to 2015 Earnings Multiple 5.3x 15.4x 16.5x 16.2x 15.8x 13.0x 0 2 4 6 8 10 12 14 16 18 RCS Capital (Ticker: RCAP) Peer Average Stifel Financial (Ticker: SF) Raymond James (Ticker: RJF) LPL Financial (Ticker: LPLA) Ameriprise (Ticker: AMP)
25 2 Non - GAAP Measure Disclosure We use earnings before interest, taxes, depreciation and amortization, or EBITDA, adjusted EBITDA and adjusted net income, which are non - GAAP measures, as supplemental measures of our performance that are not required by, or presented in accordance with GAAP. None of the non - GAAP measures should be considered as an alternative to any other performance measure derived in accordance with GAAP. We use EBITDA, adjusted EBITDA and adjusted net income as an integral part of our report and planning processes and as one of the primary measures to, among other things: • our ability to integrate the acquired businesses into our existing businesses; • monitor and evaluate the performance of our business operations; • facilitate management’s i
nternal comparisons of the historical operating performance of our business operations; • facilitate management’s external comparisons of the results of our overall business to the historical operating performance o f o ther companies that may have different capital structures and debt levels; • analyze and evaluate financial and strategic planning decisions regarding future operating investments; • provide useful information to investors regarding financial and business trends related to our results of operations; and • plan for and prepare future annual operating budgets and determine appropriate levels of operating investments. Pro forma Adjusted EBITDA represents earnings on a pro forma basis before interest, taxes, depreciation and amortization, sha re - based compensation, acquisition and integration related costs (including integration - related employee compensation and related costs) and other non - recurring charge s. Pro forma Adjusted Net Income represents net operating income before non - controlling interest, share - based compensation, acquisition related costs, and non - recurring cos ts. We define adjusted net income as net income attributable to the Company (using a 40% tax rate to illustrate the tax impact for comparative purposes) and adjusted to excl ude acquisition related expenses and equity - based compensation and other items. We believe similarly titled measures are frequently used by securities analysts, investors and other interested parties in th e e valuation of companies in our industry, many of which present EBITDA, adjusted EBITDA, adjusted net income and other similar metrics when rep orting their financial results. Our presentation of EBITDA, adjusted EBITDA and adjusted net income should not be construed to imply that our future results will be unaffected by unusual or nonrecurring items. The non - GAAP measures have limitations as analytical tools, and you should not consider any of these measures in isolation or as a s ubstitute for analyses of our income or cash flows as reported under GAAP. Some of these limitations are: • they do not reflect our cash expenditures, or future requirements for capital expenditures, or contractual commitments; • they do not reflect changes in, or cash requirements for, our working capital needs; • they do not reflect the significant interest expense, or the cash requirements necessary to service interest or principal payments , o n our debt; and • depreciation and amortization are non - cash expense items that are reflected in our statements of cash flows. In addition, other companies in our industry may calculate these measures differently than we do, limiting their usefulness a s a comparative measure. We compensate for these limitations by relying primarily on our GAAP results and using the non - GAAP measures only for supplemental purposes. Please see our financial statements and the related notes thereto.

American Realty Capital 26