Attached files
| file | filename |
|---|---|
| 8-K - 8-K - Discover Financial Services | d920325d8k.htm |
 2015 Financial Community Briefing
May 5, 2015
©2015 DISCOVER FINANCIAL SERVICES
Exhibit 99.1 |
 The
following slides are part of a presentation by Discover Financial Services (the "Company") and are intended to be viewed as part of that
presentation. No representation is made that the information in these slides is
complete. Company
financial
data
presented
herein
is
based
on
a
calendar
year.
As
previously
reported,
the
Company
changed
its
fiscal
year
end
from
November 30 to December 31 of each year, effective beginning with the 2013 fiscal
year. For historical calendar year financial data, see the Company's Current
Report on Form 8-K dated March 5, 2013 and the Company’s Annual Report on Form 10-K for the year ended December
31, 2013.
Throughout
these
materials,
direct-to-consumer
deposits
are
referred
to
as
DTC
deposits.
DTC
deposits
include
deposit
products
that
we
offer
to customers through direct marketing, internet origination and affinity
relationships. DTC deposits include certificates of deposits, money
market accounts, online savings and checking accounts, and IRA certificates of
deposit. The
information
provided
herein
includes
certain
non-GAAP
financial
measures.
The
reconciliations
of
such
measures
to
the
comparable
GAAP
figures
are
included
at
the
end
of
this
presentation,
which
is
available
on
the
Company’s
website
at
www.discover.com
and
the
SEC’s
website.
The presentation contains forward-looking statements. You are cautioned not to
place undue reliance on forward-looking statements, which speak only as
of the date on which they are made, which reflect management’s estimates, projections, expectations or beliefs at that time, and
which are subject to risks and uncertainties that may cause actual results to
differ materially. For a discussion of certain risks and uncertainties that
may affect the future results of the Company, please see "Special Note Regarding Forward-Looking Statements," "Risk Factors," "Business
–
Competition," "Business –
Supervision and Regulation" and "Management’s Discussion and Analysis
of Financial Condition and Results of Operations" in the Company’s
Annual Report on Form 10-K for the year ended December 31, 2014 and "Management’s Discussion and
Analysis of Financial Condition and Results of Operations" in the
Company’s Quarterly Report on Form 10-Q for the quarter ended March 31,
2015
which
is
filed
with
the
SEC
and
available
at
the
SEC's
website
(www.sec.gov
). The
Company
does
not
undertake
to
update
or
revise
forward-looking statements as more information becomes available.
We own or have rights to use the trademarks, trade names and service marks that we
use in conjunction with the operation of our business, including,
but
not
limited
to:
Discover®,
PULSE®,
Cashback
Bonus®,
Discover
Cashback
Checking®,
Discover
it®,
Freeze
It
SM
,
Discover®
Network and Diners Club International®. All other trademarks, trade names and
service marks included in this presentation are the property of their
respective owners. 2
Notice |
 Agenda
3
David Nelms
CHAIRMAN & CHIEF EXECUTIVE OFFICER
Overview
Julie Loeger
CHIEF MARKETING OFFICER
U.S. Cards
Jim Panzarino
PRESIDENT –
CREDIT & CARD OPERATIONS
Credit
Roger Hochschild
PRESIDENT & CHIEF OPERATING OFFICER
Payments and Other Consumer Lending
Mark Graf
CHIEF FINANCIAL OFFICER
Funding, Capital and Financials
Break
Q&A |
 Overview
2015 Financial Community Briefing
David Nelms
Chairman & Chief Executive Officer |
 Executive Summary
Attractive business model with a solid record of success
5
•
Delivering strong card growth through new accounts, wallet share gain,
lower attrition and great credit results
•
Proprietary network driving value for Card through brand recognition,
expanding global acceptance and rewards
•
Leveraging a payments partnership strategy to position the business for
growth
•
Direct Banking growth diversifying assets and funding •
Capital position/generation supporting growth and robust capital
deployment
|
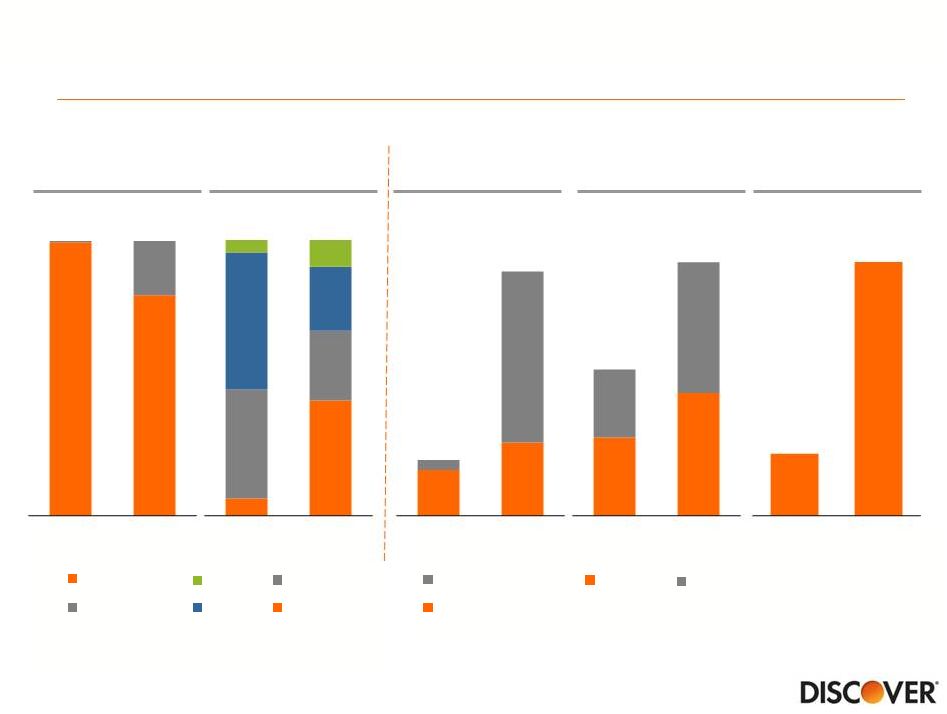 Business model has expanded and diversified
6
Loans
Funding
Acceptance
Outlets
Volume
Other
ABS
Brokered
Direct
Deposits
Note(s)
1.
Fiscal year ending November 30, 2007
2.
Includes affinity deposits
3.
Includes network-to-network acceptance agreements; merchant acceptance
based on third-party and internal estimates 4.
Includes business-to-business volume
(3)
Net Income
All data in billions, except Acceptance Outlets in millions
(1)
$53
$70
$54
$69
7
31
$186
$322
$0.6
$2.3
(4)
(2)
Card
Non-Card
2007
2014
2007
2014
2007
2014
International
Domestic
2007
2014
Credit
Debit
2007
2014 |
 Product diversification has leveraged large, loyal card base
7
Discover Card
Student Loans
Personal Loans
Deposits
Cross-sell /
Overlap (%)
(1)
~65%
~65%
~50%
Note(s)
1.
Cross-sell is defined as 12/31/14 percentage of accounts with another DFS
relationship; Student Loan cross-sell includes co-signers
•
1 in 4 U.S.
households
•
Proprietary
network |
 Business model has outperformed large banks
2009-2014 Average
Efficiency Ratio
(1)
(2)
Note(s)
1.
Non-interest expense divided by total revenue (net interest income and
noninterest income) 2.
Bank
holding
companies
participating
in
the
2015
Comprehensive
Capital
Analysis
and
Review
(CCAR);
excludes
Synchrony
Financial,
Santander
Holdings
USA,
Goldman
Sachs,
BMO Financial, HSBC USA and Deutsche Bank from some metrics due to limited
information; excludes Discover 3.
2009
adjusted
to
exclude
$1.4
billion
($0.9
billion
after
taxes)
Visa
and
MasterCard
settlement
2009-2014 Average
Return on Equity
(3)
(2)
Source
SNL, regulatory reports; Discover
2009-2014 CAGR
Total Loan Growth (%)
(2)
8
(3)
6%
3%
Discover
Large Banks
37%
Discover
Large Banks
63%
19%
6%
Discover
Large Banks |
 The
Discover Way VISION
MISSION
KEY PRIORITIES
VALUES
To be the leading
direct bank and
payments partner
To help people spend smarter, manage
debt better and save more so they can
achieve a brighter financial future
Grow Discover
card loans while
maintaining leading credit performance
Expand direct consumer banking products
Grow global network volume and acceptance
Optimize funding, cost structure and capital position
Enhance operating model including effective controls, risk
management and leadership development
Doing
the Right Thing Innovation
Simplicity
Collaboration
Openness
Volunteerism
Enthusiasm
Respect
9 |
 10
Discover’s Vision:
To be the leading direct bank and payments partner
Rewards
Discover
Proprietary
Payment
Network
Risk
Management
Loyal
Customer
Base
Customer
Service |
 Discover’s Mission & Values:
Aligned with evolving regulatory landscape
•
Expanding regulatory oversight with new laws, regulations and statutes
–
Dodd-Frank enhanced prudential standards
–
Creation of Consumer Financial Protection Bureau (CFPB)
–
Capital planning rules (CCAR)
•
Well positioned in this environment
–
Business model:
•
Simple, direct model
•
Strong value propositions
•
Leading customer service and operations
–
Company culture:
•
Clear tone at the top
•
Employees who “treat you like you’d treat you”
•
Long-term consistent values, including “do the right thing”
11 |
 Key
Priorities 12
•
Grow card loans while maintaining leading credit performance
•
Expand direct consumer banking products
•
Grow global network volume and acceptance
•
Optimize funding, cost structure and capital position
•
Enhance operating model including effective controls, risk management and
leadership development |
 Attractive business model with a solid record of success
13
•
Proprietary network driving value for Card through brand recognition,
expanding global acceptance and rewards
•
Leveraging a payments partnership strategy to position the business for
growth
•
Direct Banking growth diversifying assets and funding
•
Capital position/generation supporting growth and robust capital deployment
•
Delivering strong card growth through new accounts, wallet share
gain, lower attrition and great credit results |
 U.S. Cards
2015 Financial Community Briefing
Julie Loeger
Chief Marketing Officer |
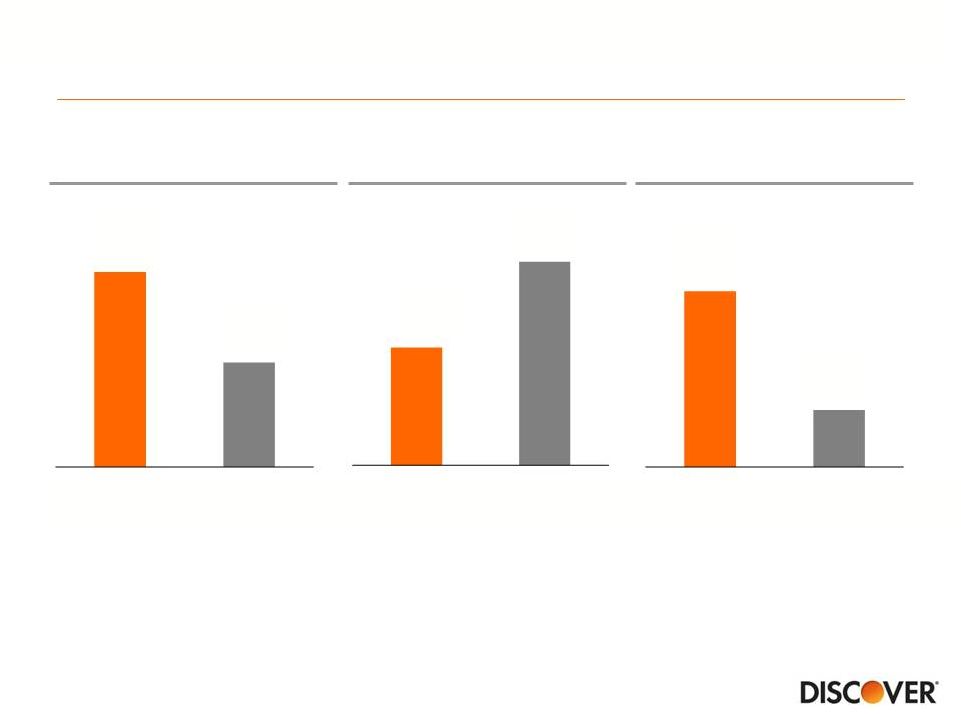
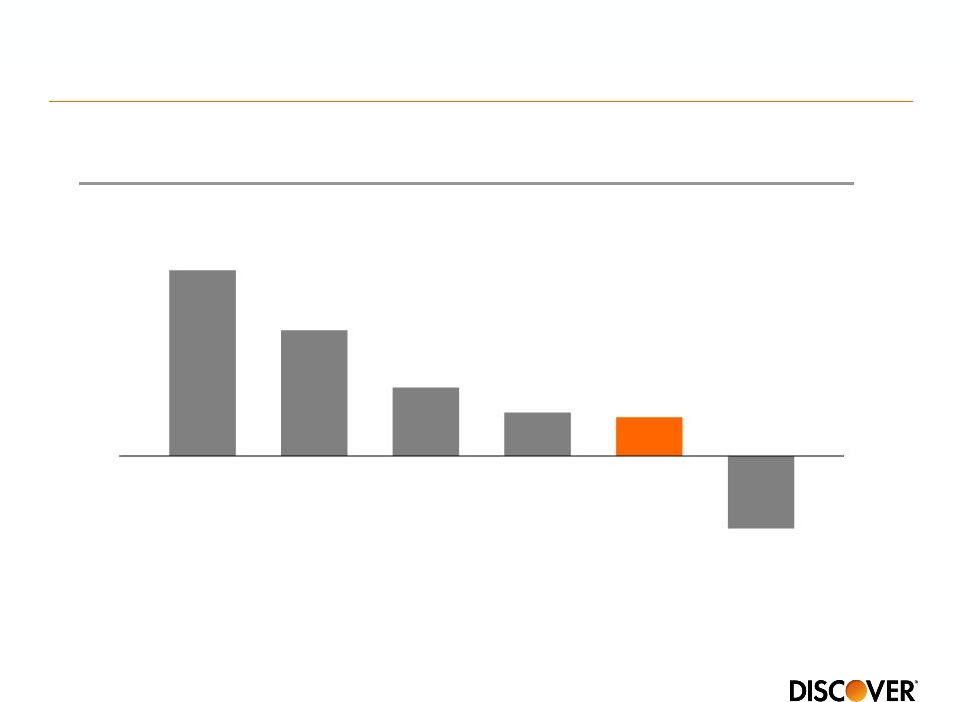
 Outperforming peers in growth and profitability
Note(s)
1.
JP Morgan (Card Services excluding Commercial Card), Citi (Citi-branded cards
N.A.), American Express (U.S. Card), Capital One (U.S. Card), and Bank of America (U.S. Card)
2.
JP Morgan (Card Services excluding Commercial Card), Citi (Citi-branded cards
N.A.), American Express, (U.S. Card) and Capital One (U.S. Card) 3.
Credit card pre-tax pre-reserve ROA is defined as pre-tax credit card
income adjusted for loan loss reserve changes. Discover pre-tax income excludes 4Q14 charges related to
the elimination of the credit card rewards estimated forfeiture reserve. This is a
non-GAAP measure: see appendix for GAAP reconciliation 2014
Loan Growth (%YOY)
2014
Net Charge-off Rate (%)
2014 Pre-tax
Pre-reserve ROA
(3)
Source
15
(1)
(1)
(2)
5.6%
2.0%
Discover
Peer Group
2.3%
2.8%
Discover
Peer Group
6.9%
5.0%
Discover
Peer Group
Public company data, calendar year |
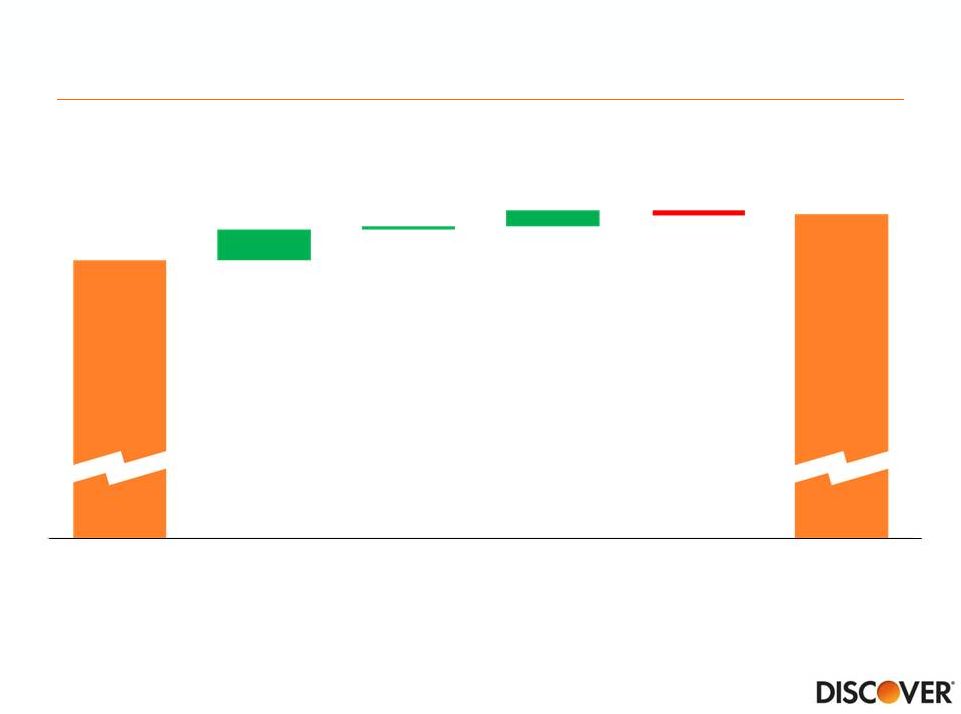 Purchase revolving behavior driving profitable loan growth
2013
Purchase
Revolvers
(1)
Purchase
Transactors
Balance Transfer/
Promotional
Cash
2014
$53Bn
$56Bn
Note(s)
1.
Balances of accounts that incurred finance charges in the period
16 |
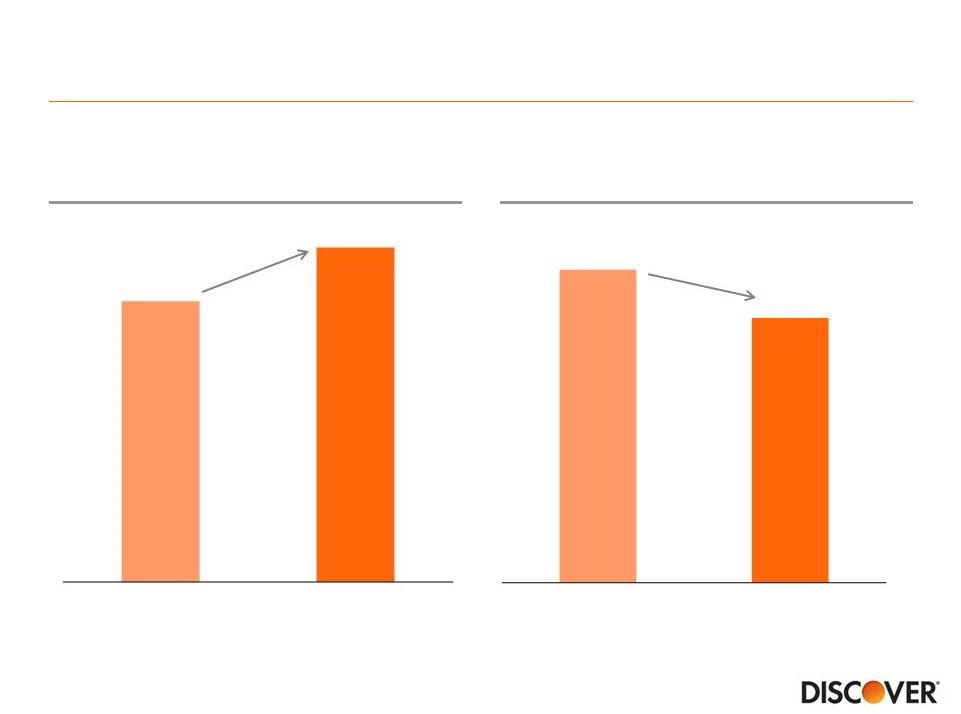
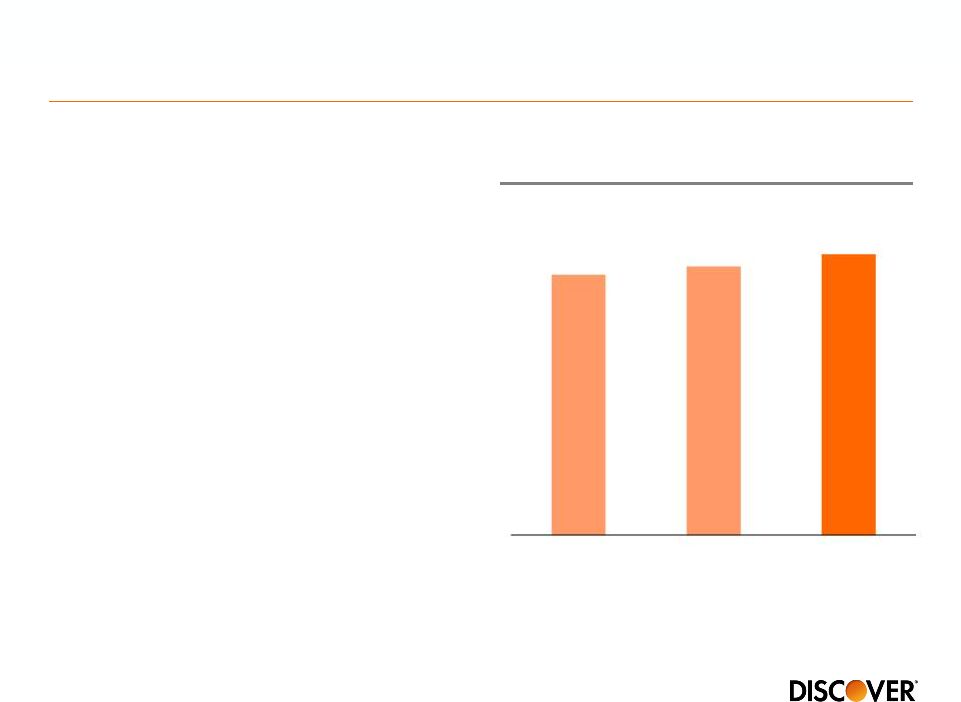
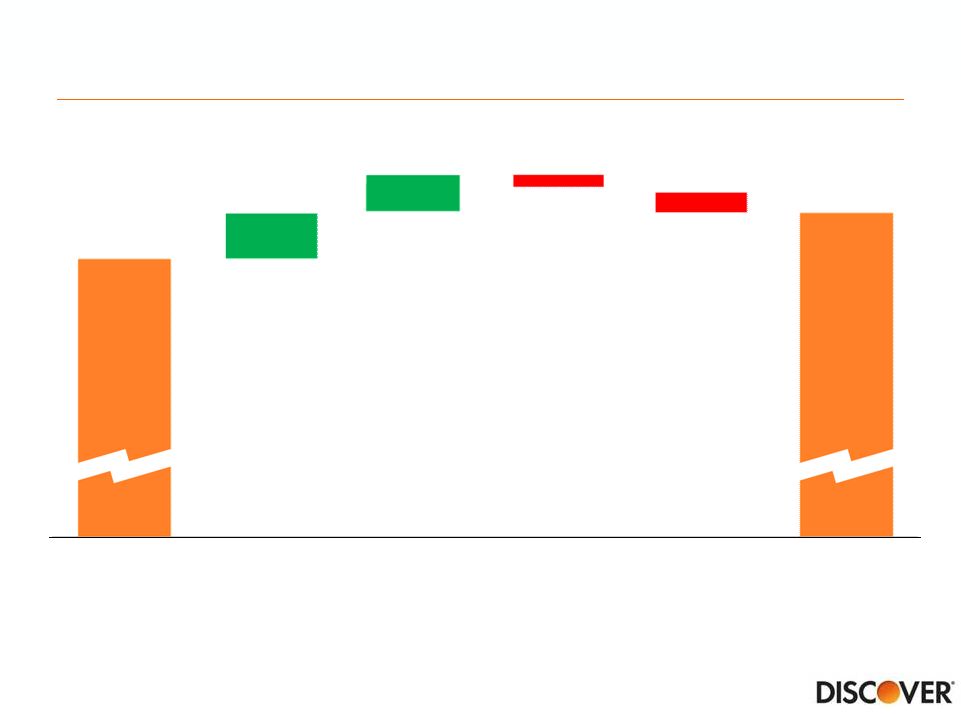 Strong performance from new and existing customers
2013
New Accounts
Wallet Share
from Existing
Customers
Attrition
Net
Charge-offs
2014
$53Bn
$56Bn
17 |
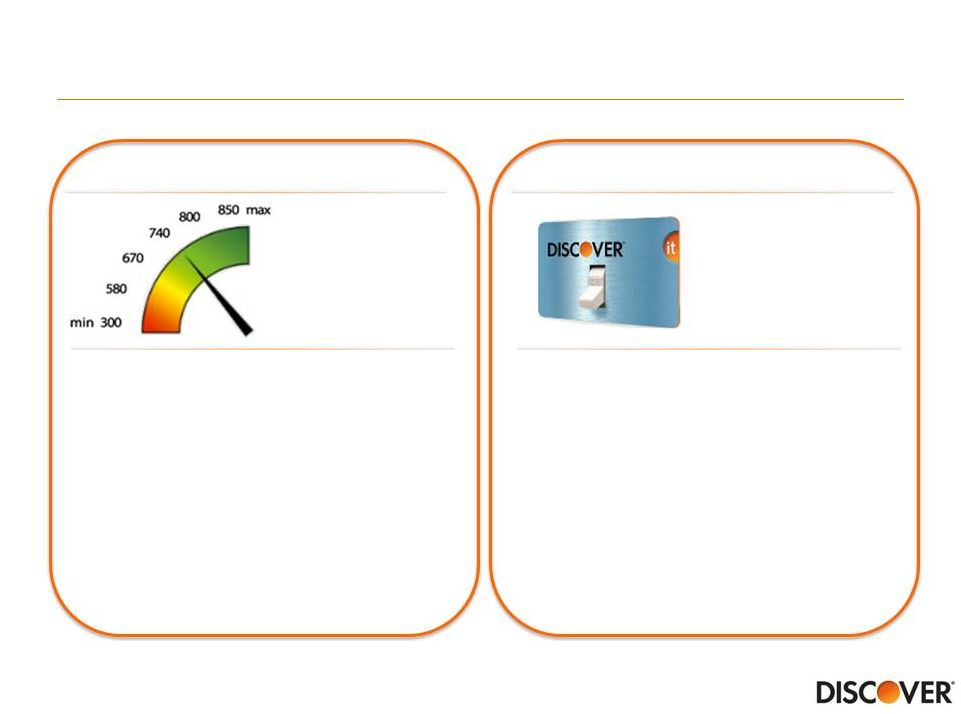
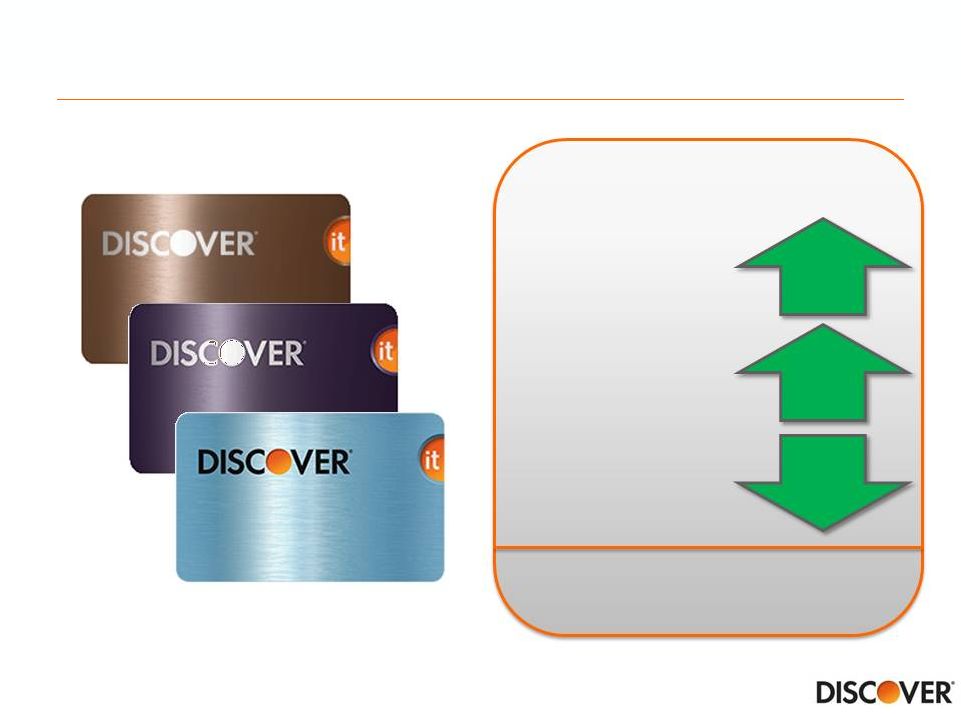 Discover it accelerating customer acquisition & performance
2014 (YOY)
New Accounts
Average FICO
(1)
~730
Note(s)
1.
Average 2014 acquired account FICO, weighted by credit line exposure
15%
22%
-1%
Purchase
Balance
Cost Per Account
18 |
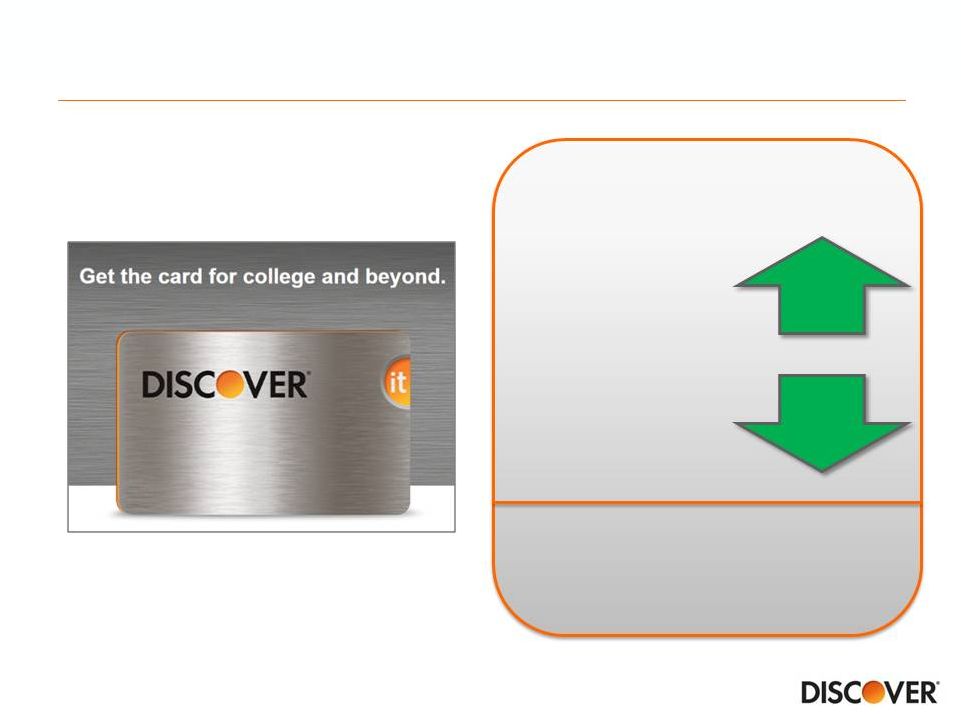 Seeding future growth through prudent focus on students
2014 (YOY)
Note(s)
1.
Average 2014 acquired student account FICO, weighted by credit line exposure
Average FICO
(1)
~700
14%
-24%
New Accounts
Cost Per Account
19 |
 Deepening relationships with existing customers
Note(s)
1.
Argus Information and Advisory Services, LLC; Discover internal analysis of 3Q14 vs
3Q13; share of loans for mature active accounts 2.
Loan balances and the accounts with a balance after attrition and
charge-offs 71
bps
3%
2014 (YOY)
Loan Balance
Per Account
(2)
Share of Customer
Loans
(1)
20 |
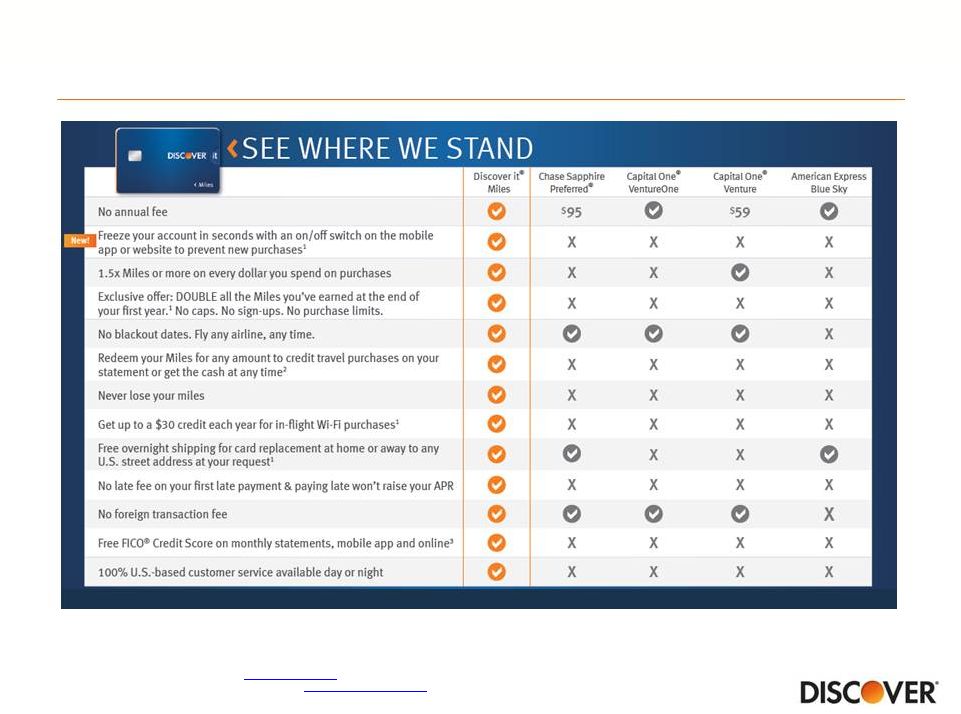 Discover it -
Miles to accelerate future growth
21
Note(s)
1.
Comparison conducted by an independent research firm and based on competitor data
compiled in April 2015 from company websites, customer service agents, and
consumer credit offers
2.
For
full
miles
redemption
terms,
visit
www.discover.com
3.
For
full
version
of
FICO
Credit
Score
Terms,
visit
www.discover.com/FICO |
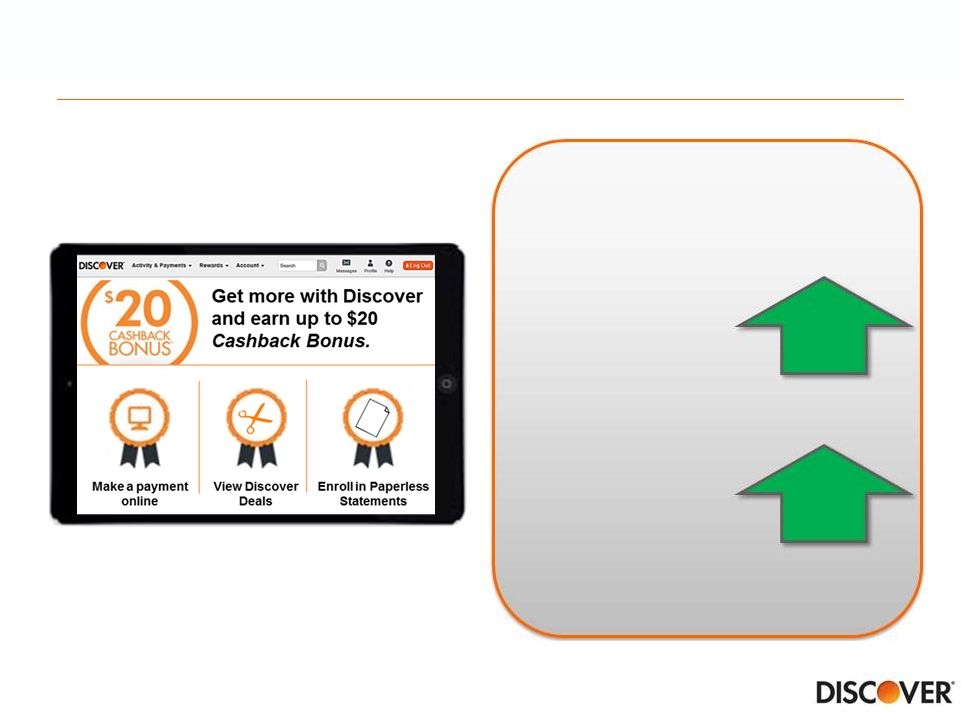
 Innovative features resonating strongly with customers
Note(s)
1.
Based on 2014 customer activity on discover.com since Free FICO feature launch
•
Top 5 most visited page
(1)
•
46% of customers actively engaged
with the feature
(1)
•
Launched April 15
th
•
Allows customers to freeze new
purchases, if card is misplaced
Free
FICO Score
®
Freeze It
New!
SM
22 |
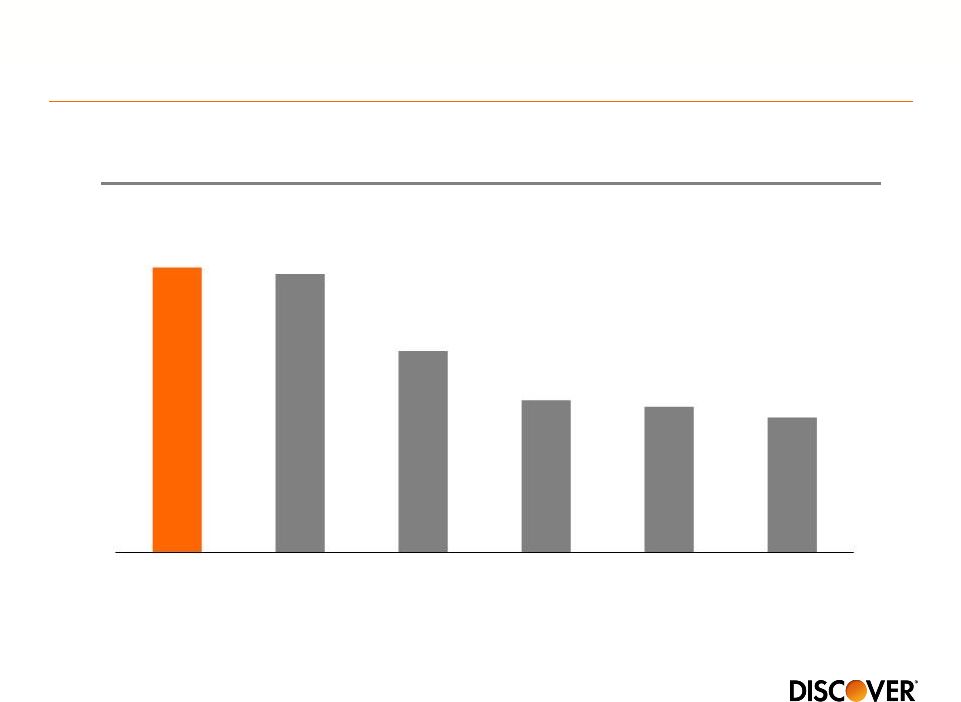
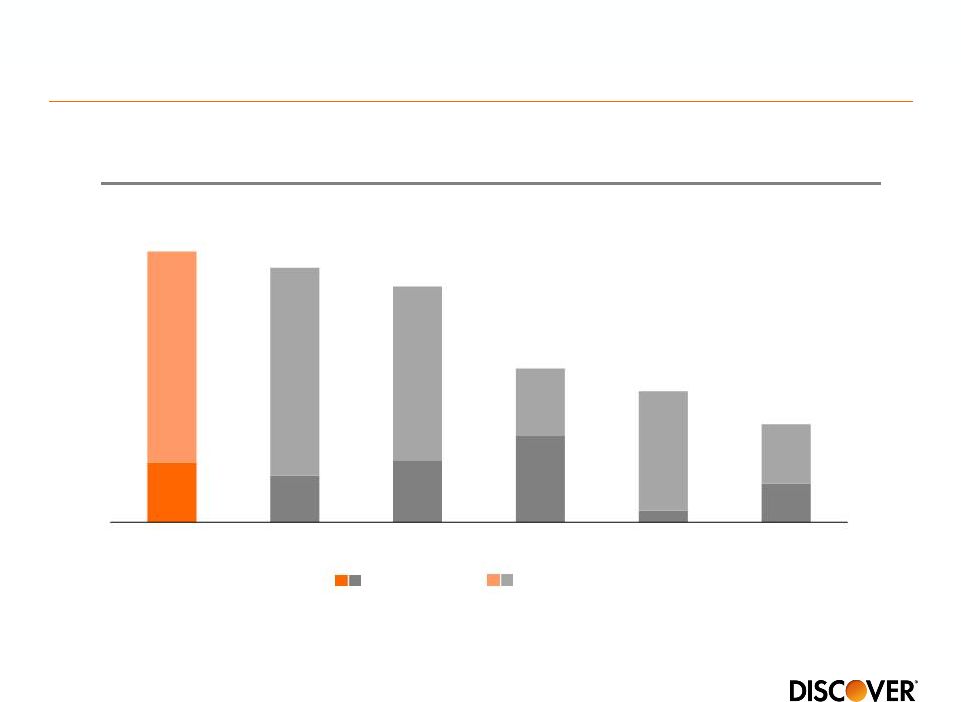
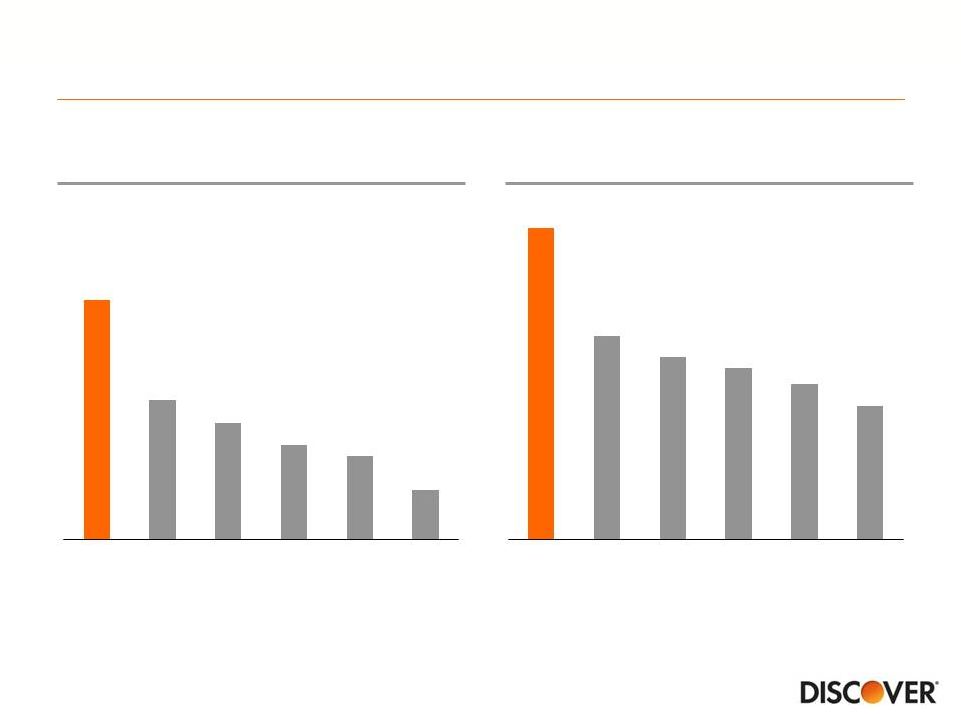 Customers recognize Discover as cashback leader
Source
Best Cash Rewards
Cash Rewards Penetration
Source
Note(s)
1.
The ratio of ownership of a Discover card to total household ownership of a
cashback rewards card based on survey results 2.
Results based on unaided survey of each brand’s primary cardmembers
23
(1)
(2)
43%
25%
21%
17%
15%
9%
DFS
JPM
AXP
BAC
COF
C
58%
38%
34%
32%
29%
25%
DFS
JPM
COF
AXP
BAC
C
2014 Consumer Payment Strategies Research Program, TNS
2014
annual
averages,
Brand
Tracking
Study,
Millward
Brown |
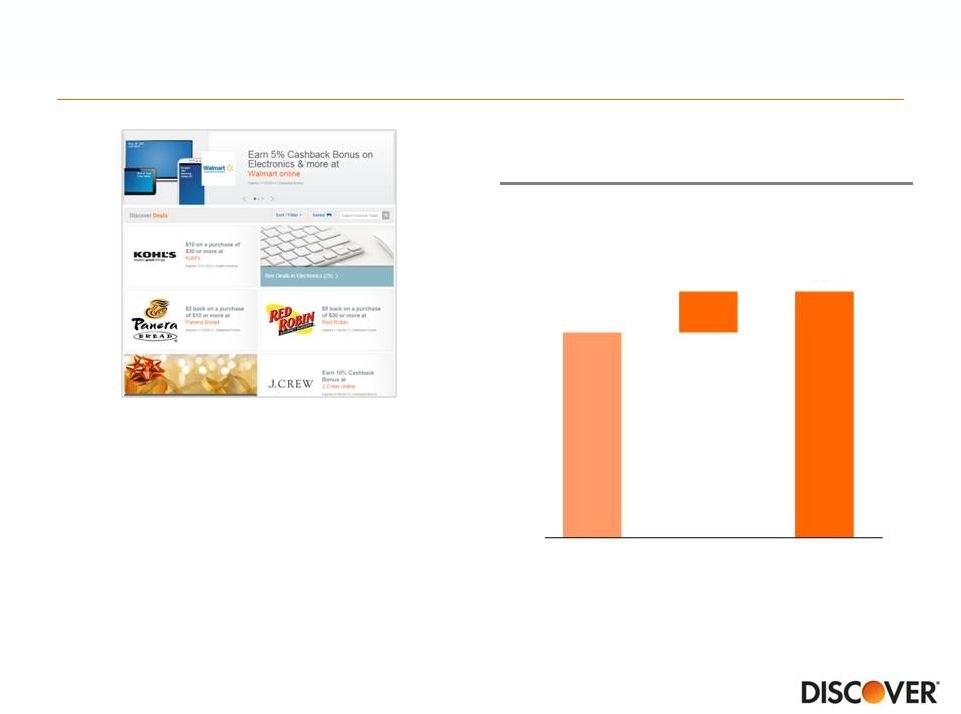
 Consumer insights driving innovation in rewards
Note(s)
1.
Defined as growth in Discover Deals site visits since rewards program enhancements
implemented in July 2014 2.
Includes partner funded incremental value of the reward or discount availed by the
cardmember 3.
2014 full calendar year
4.
2014 year-over-year increase in total dollar value of redemptions
Redeem:
Any amount.
Any time.
No expiration.
•
Over 5x growth in site visits
(1)
•
Over $130MM in value funded by
over 150 merchant partners
(2)
•
~25MM redemptions
(3)
•
25% increase in total redemptions,
35% increase at Amazon
(4)
24 |
 Digital driving customer acquisition and early engagement
Marketing Channel
(1)
Accounts Booked
(2)
51%
75%
Note(s)
1.
Percentage of 2014 new accounts solicited digitally
2.
Percentage
of
2014
new
accounts
that
applied
digitally
(website,
mobile)
25 |
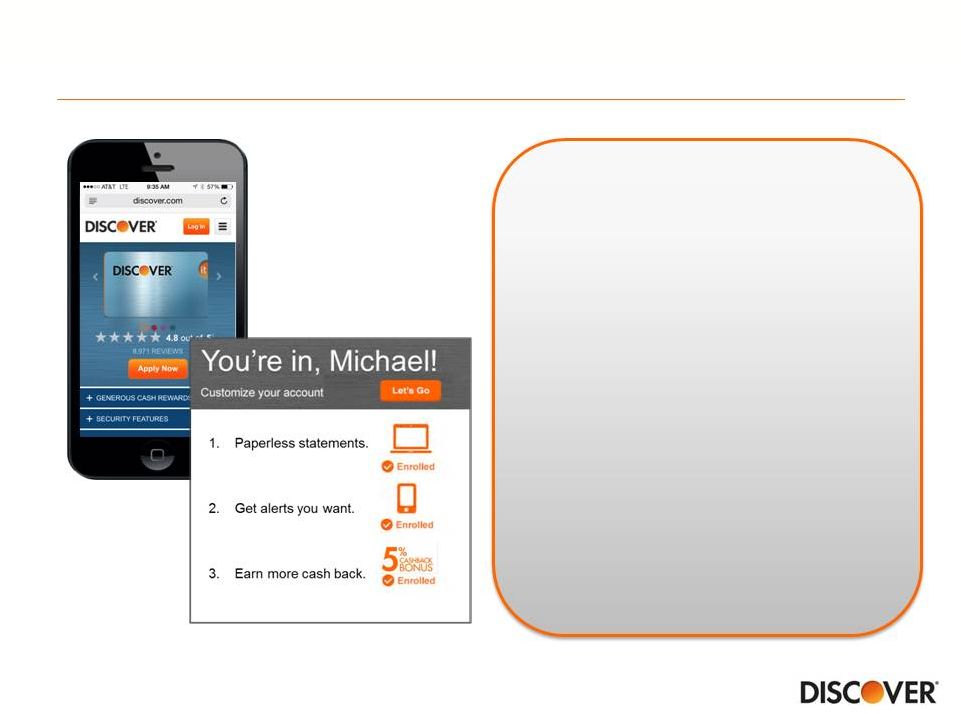
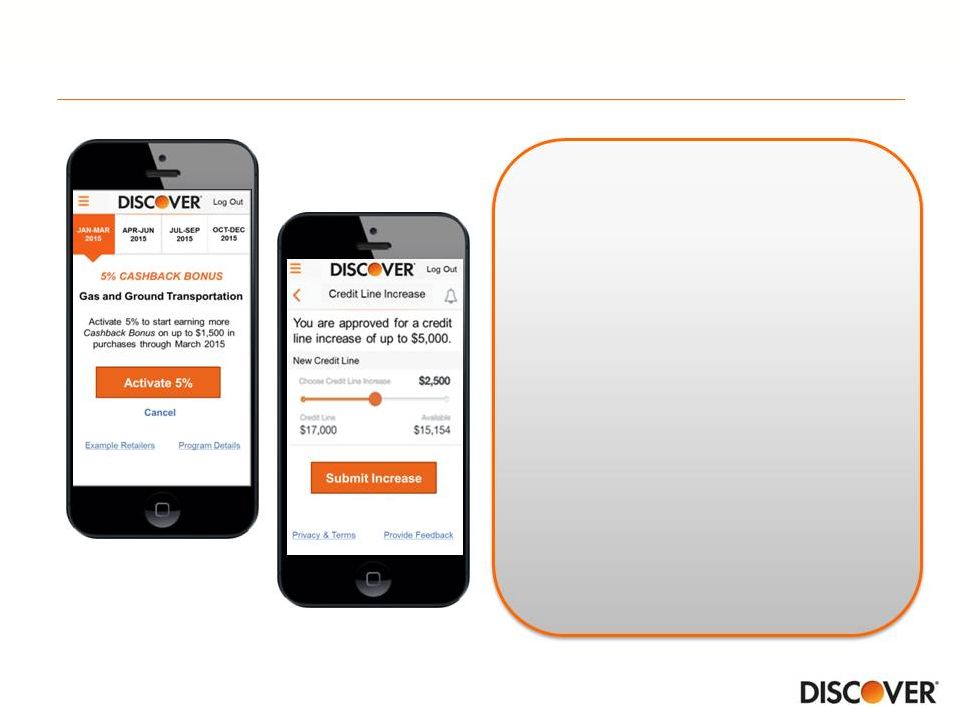 Digital driving customer experience and efficiencies
Customer Interactions
(1)
Payments
(2)
Mobile Logins
(3)
85%
58%
35%
Custom Credit Line
Rewards Signup
26
Note(s)
1.
2014 digital customer interactions (logins) as a percentage of total interactions
(logins and calls) 2.
Percentage of 2014 payments through digital channel (website, mobile)
3.
Percentage of 2014 logins through mobile channel |
 Recognized as industry leader in digital
Note(s)
1.
Ranking
represents
J.D.
Power
Website
Interaction
Factor,
which
is
a
subset
of
J.D.
Power
2014
Credit
Card
Satisfaction
Study
based
on
consumer
opinions
about
the
issuer
of
their primary credit card
2.
2014
Credit
Card
Scorecard
Keynote
digital
channel
ranking
among
American
Express,
Bank
of
America,
Barclaycard,
Capital
One,
Chase,
Citi,
PNC,
US
Bank,
and
Wells
Fargo
3.
Apple iOS and Android weighted average of app store ratings (star count) across
phone and tablet devices as end of 1Q 2015 Consumer App Reviews
DFS
4.5
4.5
JPM
4.0
4.5
COF
4.5
4.0
AXP
3.0
4.5
BAC
3.5
4.0
C
3.0
4.0
iOS
Android
27
J.D. Power:
Website Interaction
Factor
(1)
Third Party Industry Surveys
Highest
Score
Keynote:
Digital Channel
Ranking
(2)
Highest
Score
(3)
SM |
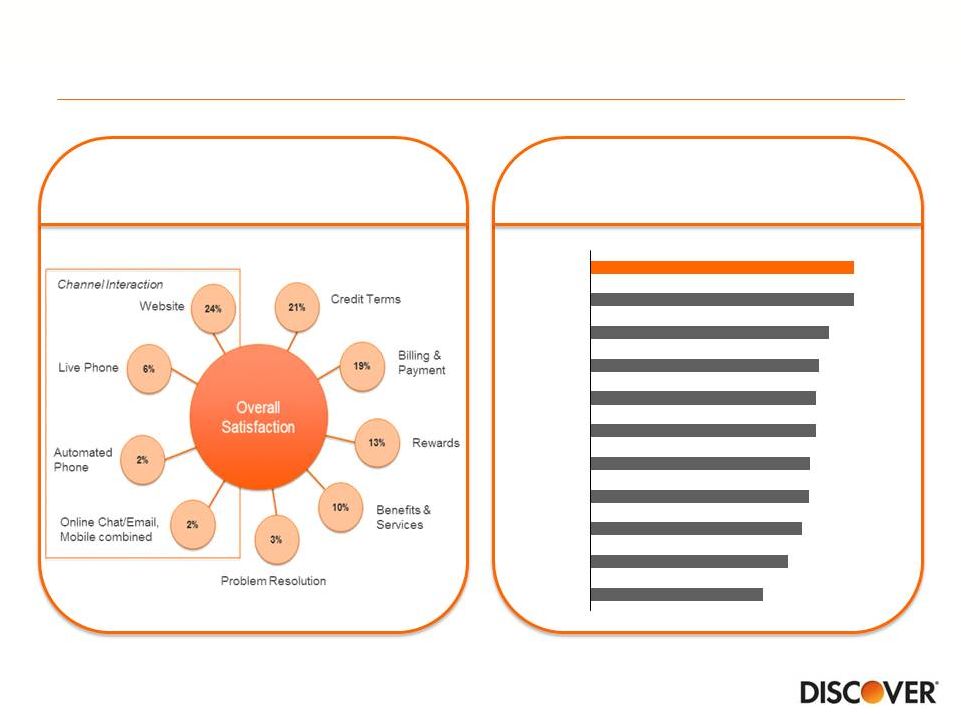 Highest score in overall satisfaction
Overall
Satisfaction
Note(s)
1.
Includes general purpose consumer credit cards only; excludes charge, corporate,
private label, small business and debit J.D. Power Evaluation
Categories 28
709
739
756
765
766
773
773
776
789
819
819
HSBC
GE
C
COF
BAC
WFC
USB
BCS
JPM
AXP
DFS
(1)
2014 J.D. Power |
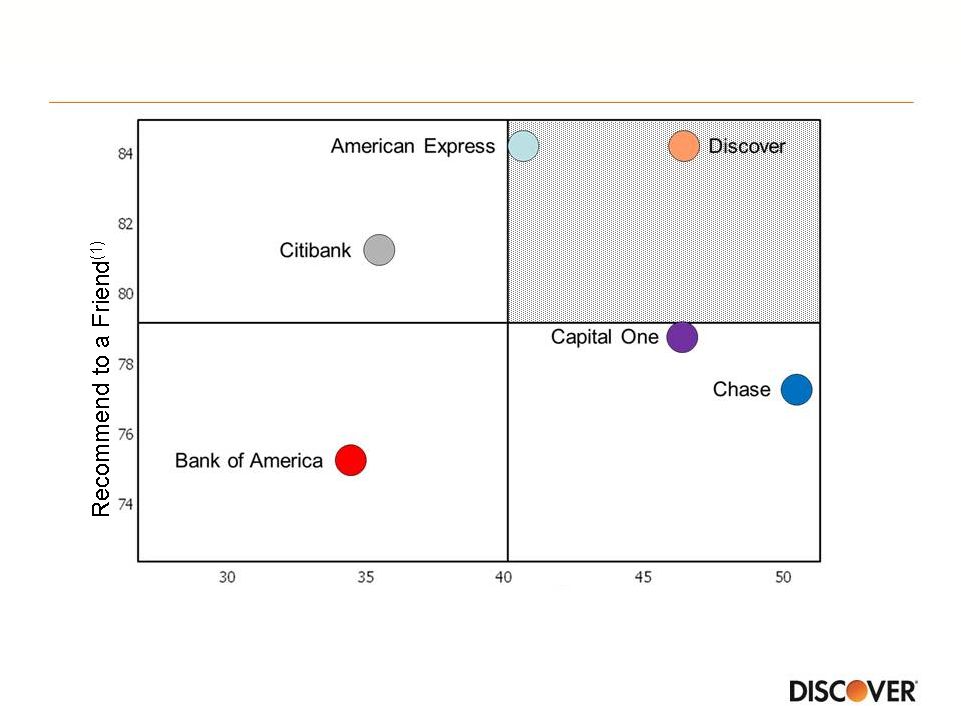 Brand strength driving growth with customers & prospects
Consideration
(2)
Source
29
1Q-4Q 2014 Brand Tracking Study, Millward Brown
Note(s)
2.
“Consideration” is the percentage of survey participants saying either “it would be my
first choice” or “I would seriously consider it”; among general population
1.
“Recommend to a Friend” is the percentage of survey participants who strongly / somewhat
agree with the statement "I would recommend to a friend"; among
cardholders who say they use that brand's card most often to make purchases |
 Card Summary
Note(s)
1.
Credit card pre-tax pre-reserve ROA is defined as pre-tax credit card
income adjusted for loan loss reserve changes and credit card rewards program changes that
eliminated
the
forfeiture
reserve
divided
by
average
credit
card
receivables.
This
is
a
non-GAAP
measure:
see
appendix
for
GAAP
reconciliation
2.
Argus Information and Advisory Services, LLC for attrition rate data
30
Focus on prime customers who use the card to spend and borrow is
driving
performance:
In 2014, 5.6% loan growth, 2.3% net charge-off, 6.9% pre-tax
pre-reserve ROA
(1)
Driven by acceleration in new accounts, continued increase in wallet share
with existing customers and industry low attrition rate
To continue gaining market share and sustain momentum, will maintain focus:
Differentiated products, features, and rewards
Leading digital capabilities
Exceptional customer experience
Superior brand equity
Delivering strong credit performance
(2) |
 Credit
2015 Financial Community Briefing
Jim Panzarino
President –
Credit & Card Operations |
 Credit Summary
•
Organizational alignment throughout customer lifecycle fosters innovation and
enables rapid execution of new processes
•
Disciplined underwriting approach to new account growth
•
Credit assessment and management of total portfolio leveraging investments
in data, analytics and operations
•
Credit environment continues to be benign
32 |
 Organizational alignment enables growth, prudent credit
management and customer focus
Prudent
profitable
growth
Industry leading
credit management
Exceptional
customer experience
33
Customer Service &
Operations
Processing Services
Workforce Management
Customer Service and Credit Management
Credit Risk
Management
Card Risk Management
Fraud
Consumer Lending
Decision Management
Credit Operations
New Accounts
Collections
Recovery
Cross functional alignment & accelerated implementation
|
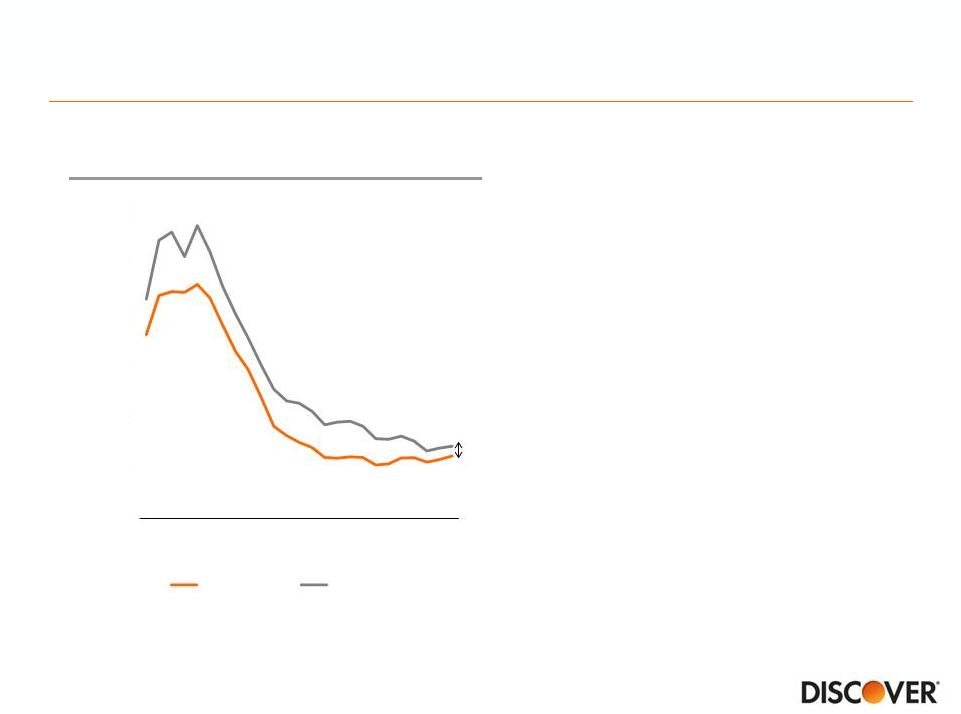 Superior credit performance
•
Disciplined new bookings
•
Profitability based line assignments
•
Proactive and targeted portfolio
management
•
Innovative use of credit and data in
decision making
•
Stronger payment preference
through in-house collection
activities
Card Net Charge-off Rates
Source
Public company data
Note(s)
1.
Weighted average rate; includes U.S. card net charge-off rates for American
Express (U.S. Card), Bank of America (U.S. Card), Capital One (U.S. Card),
Citi (Citi-branded Cards N.A.), JPMorgan Chase (Card Services) and Wells Fargo (1Q11-1Q15)
37
bps
(1)
34
0.0%
2.0%
4.0%
6.0%
8.0%
10.0%
12.0%
1Q09
1Q10
1Q11
1Q12
1Q13
1Q14
1Q15
Discover
Peer Group |
 Customer Account Resolution Experts (CARE)
•
Dedicated account manager
•
Specialized training
•
Contact by appointment
•
Custom tailored payment
solutions
•
Increased customer engagement
“I like the fact that it’s more personal
CARE Process
Collections Approach
Decline in
delinquency during
second cycle
5.1%
Example:
Customers with high
risk attributes entering
collections for the first time
35
and I don’t have to repeat my situation
each time I speak to Discover Card. ”
-CARE Customer |
 Growing new accounts while managing credit risk
Card Vintage Gross Loss Rate
(1)
New Account Bookings (MM)
Note(s)
1.
Blended vintage 6-month moving average gross principal charge-off rate
(excludes recoveries) 36
2010
2011
2012
2013
2014
0
4
8
12
16
20
24
2002-2006 Historical Benchmark
2010-2013 |
 Growing card receivables while managing credit risk
Receivables ($Bn)
30+ Delinquencies (%)
37
Note(s)
1.
Calendar year end figures
(1)
(1)
$51
$56
2012
2014
10%
1.79%
1.73%
2012
2014
6 bps |
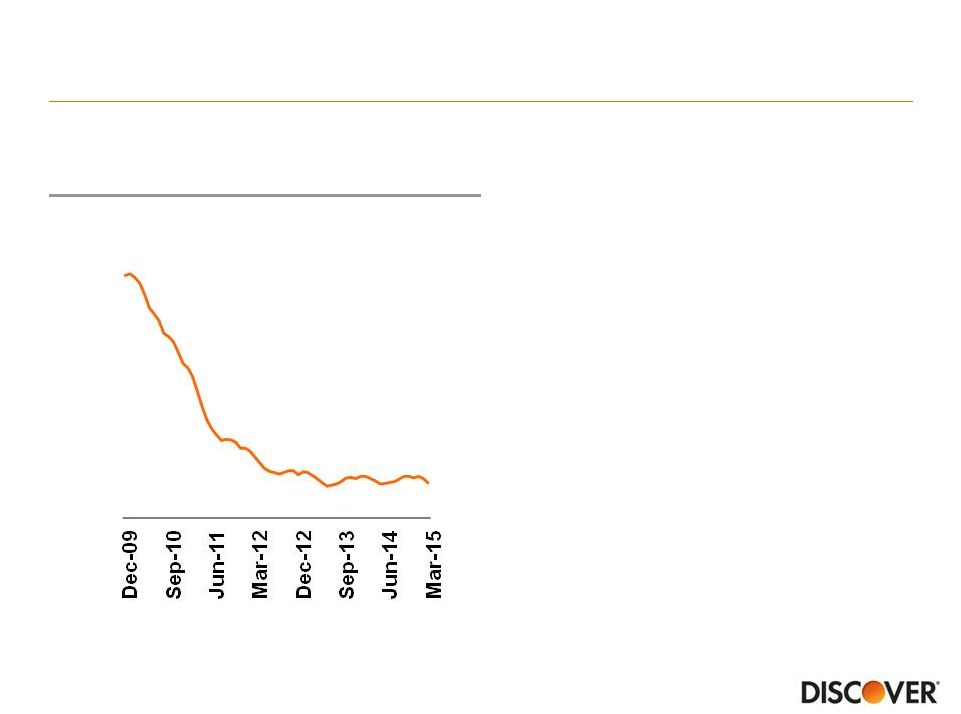 Where is credit headed?
•
Credit performance across all
products remains benign
•
Quarterly card net charge-off rates
are expected to remain below 3%
through at least the end of 2016
absent any external shock
Card 30+ Delinquency Rate
(1)
Note(s)
1.
Monthly figures through March 2015
38
1.64%
1.0%
2.0%
3.0%
4.0%
5.0%
6.0% |
 Attractive business model with a solid record of success
•
•
•
•
39
Delivering
strong
card
growth
through
new
accounts,
wallet
share
gain,
lower attrition and great credit results
Proprietary network driving value for Card through brand recognition,
expanding global acceptance and rewards
Leveraging a payments partnership strategy to position the business
for growth
Direct Banking growth diversifying assets and funding
Capital
position/generation
supporting
growth
and
robust
capital
deployment |
 Payments and Other Consumer Lending
2015 Financial Community Briefing
Roger Hochschild
President & Chief Operating Officer |
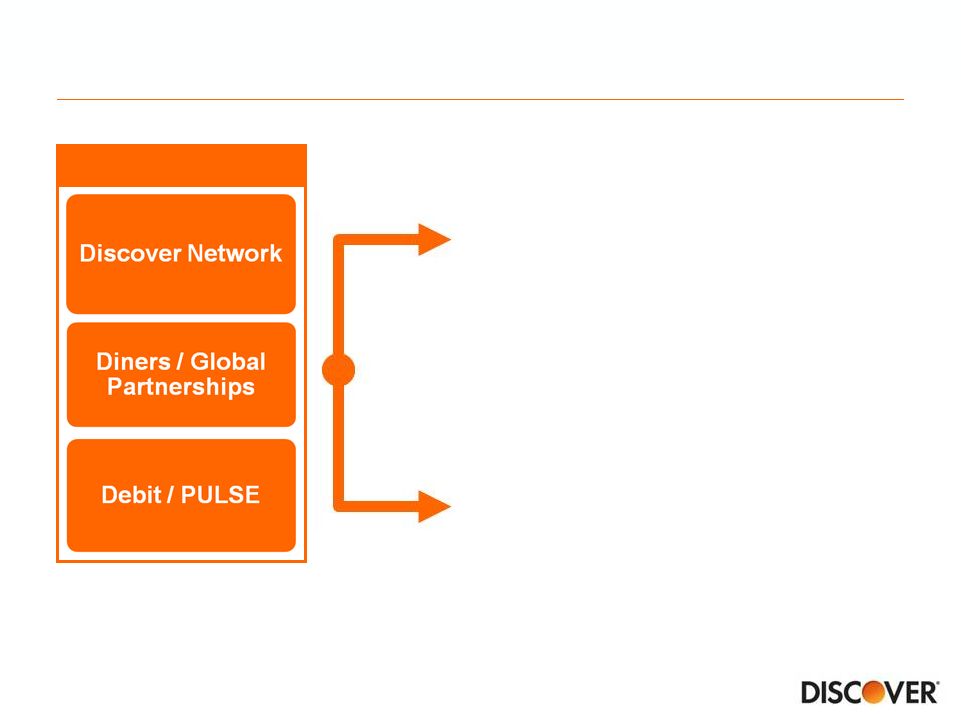 Payments sources of value
Payments Assets
Significant Value to Card
•
•
•
•
Independent Value Creation
•
•
•
41
Brand recognition
Merchant funded rewards
Emerging technologies
Flexibility and control
Traditional third-party transaction
processing
Nontraditional partnerships
Business-to-business |
 Discover
American
Express
Visa /
MasterCard
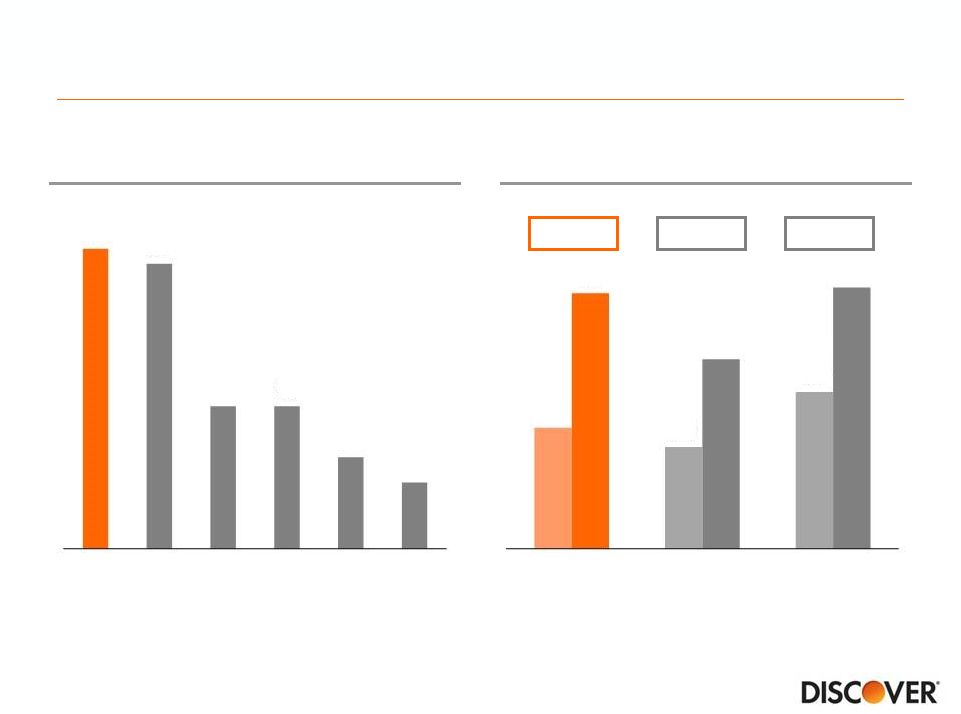
Proprietary network drives brand recognition and
increasing acceptance
Source
2014 Millward Brown Brand Tracking Study
Average Unaided Card
Brand Awareness
Domestic Acceptance Growth
Source
The Nilson Report, February 2005 and February 2015 issues
2004 2014
2004 2014
2004 2014
+111%
+86%
+67%
42
59
56
28
28
18
13
DFS
AXP
COF
JPM
C
BAC
4.4
3.7
5.7
9.3
6.9
9.5 |
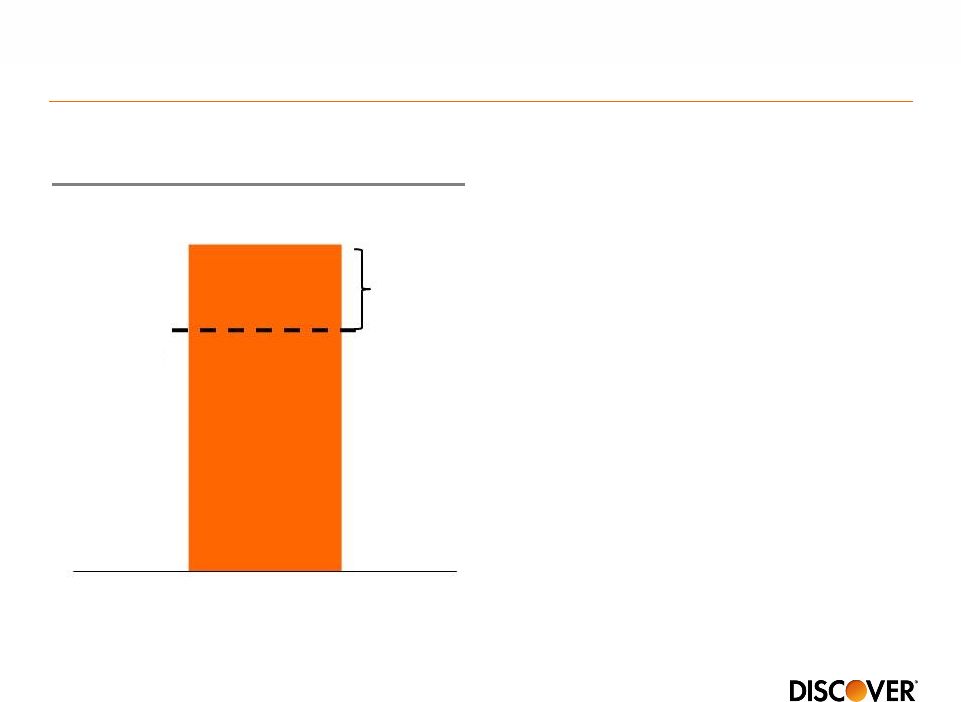
 Cash rewards program –
leveraging merchant relationships
•
Deals platform provides actionable
insight and rapid campaign
turnaround
•
Secured merchant campaigns up
significantly year-to-date due to
strong test campaign performance
Indexed
Merchant-Funded Rewards
(1)
Note(s)
1.
Indexed to 100; includes Discover Deals, estimated point-of-sale coupons,
CBB offers, statement credits and gift card redemptions 43
100
12
112
Discover
Funded
Partner
Funded
Customer
Cash Reward |
 Continued focus on payments security
•
Discover owns one of four EMV specifications in
the U.S. that are being loaded on merchant
terminals
•
Expecting to issue EMV cards to majority of active
accounts in 2015 and be ready for October 2015
liability shift
•
Increased costs in 2015 due to issuance of chip
cards, expect fraud savings to ramp up in 2016
•
Tokenization for mobile and card not present
transactions
–
Currently in testing phase
–
Launching Apple Pay in fall of 2015
•
Opportunities to offer additional digital services
44 |
 Positioning Payments business for the future
Industry
Trends
45
Consumer shift to electronic payments
Continued intense competition in debit
International growth
B2B payments electronification
Commerce and payments convergence |
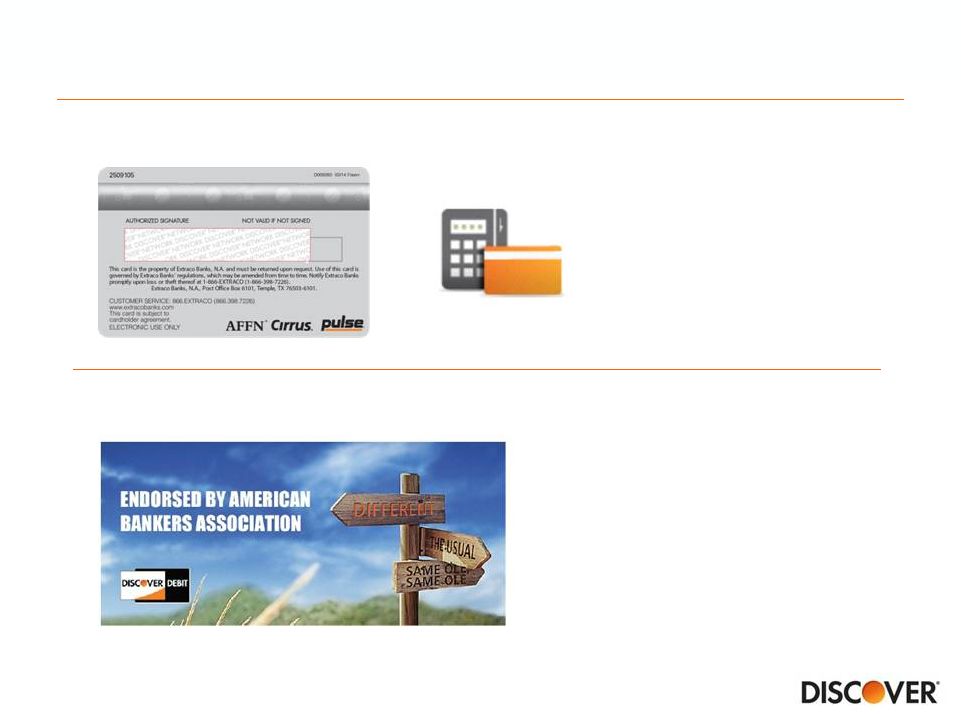 Defend PULSE PIN position and increase signature debit
PIN
Signature
•
Building pipeline
•
Long sales cycle
46
Debit
Enable PIN, PINless and
signature transactions at
the point of sale and online |
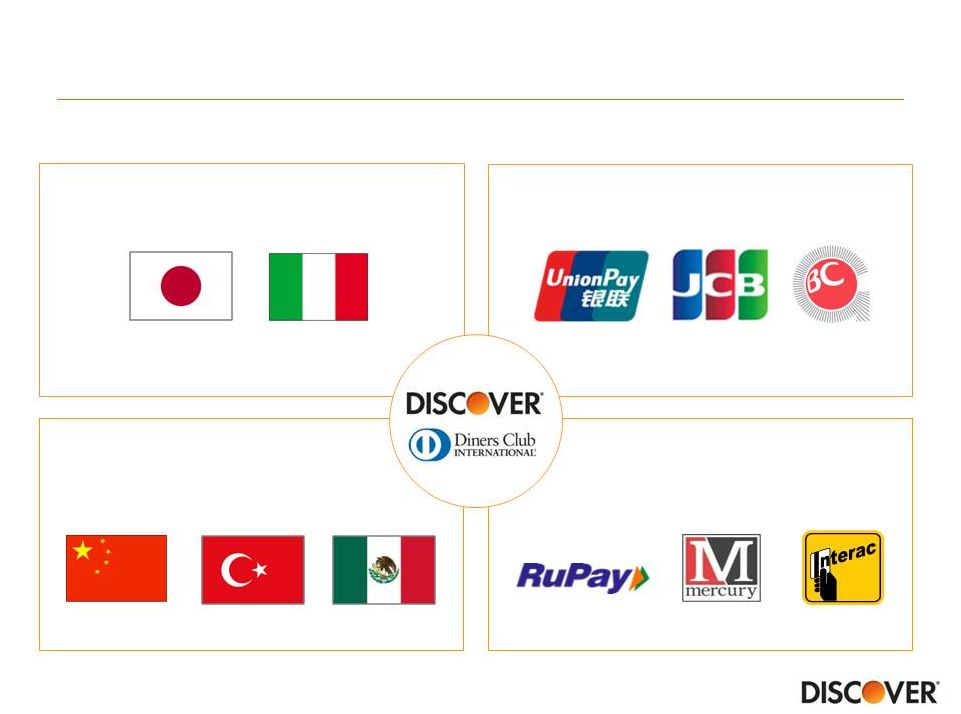 Expand in target markets
Grow and expand
Maximize growth
Stabilize and transition
Diners Club
Alliance Partners
Grow international partnerships in target markets
47
(Japan)
(Italy)
(China)
(Japan)
(S. Korea)
(China)
(Turkey)
(India)
(Middle East)
(Canada)
(Mexico) |
 •
Flexible partner in rapidly changing payments landscape
–
Alternative to Visa/MasterCard
–
White label opportunities (e.g., PayPal)
–
Full product suite (credit, debit, prepaid)
•
Proprietary network enables partnership in all areas of mobile commerce
–
Mobile Points of Sale (Merchant capabilities)
–
Mobile Payments (Customer capabilities –
mobile wallets, merchant
wallets, NFC, QR codes, bar codes)
–
Mobile Marketing (e-coupons)
Capitalize on evolving payment technology
48
1
2
•
5 buyer agreements in place
•
2,200+ suppliers boarded
•
Award winning innovation
(1)
Future Digital Services
•
Note(s)
1.
Token services leveraging
the digital platform currently
in development
2015 PYMNTS Innovator Awards for Most Disruptive Company and Best B2B
Innovation |
 Attractive business model with a solid record of success
49
Delivering
strong
card
growth
through
new
accounts,
wallet
share
gain,
lower attrition and great credit results
Proprietary network driving value for Card through brand recognition,
expanding global acceptance and rewards
Leveraging a payments partnership strategy to position the business for
growth
•
•
Direct Banking growth diversifying assets and funding
Capital position/generation supporting growth and robust capital
deployment |
 Consumer lending product offerings aligned to Discover
business model
Business model matched to
market characteristics
Other considerations
•
•
•
•
50
Market size
Competitive set
Brand fit
Cross-sell potential
Direct Model
Prime Credit Risk
Profit Potential
Consumer Lending Products
Credit
Card
Personal
Loans
Student
Loans
Home
Loans
Auto
Loans |
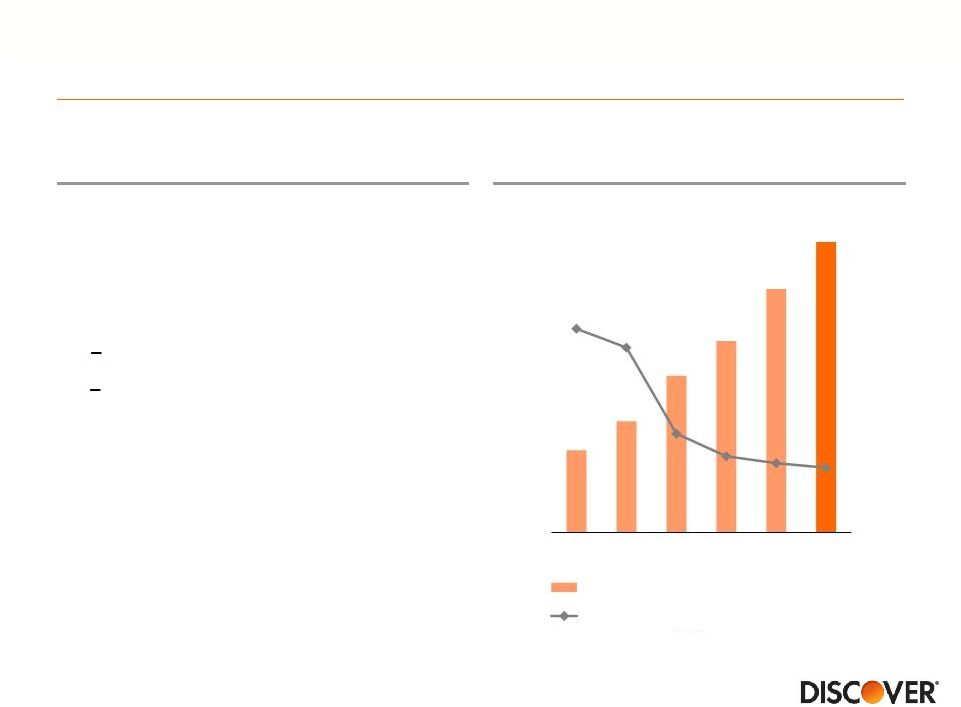 Driving profitable growth in personal loans
Overview
Personal Loans ($Bn)
•
Good alternative for consolidating
debt
•
Typical installment loan
characteristics:
51
0%
2%
4%
6%
8%
10%
$0
$1
$2
$3
$4
$5
2009
2010
2011
2012
2013
2014
Total Loans Outstanding
6 Month Lagged Charge-off Rate
•
Average FICO of ~750
•
~65% of portfolio has another
Discover relationship
•
Portfolio to date built almost
entirely “by invitation only”
3-5 year term
300-400bps rate reduction |
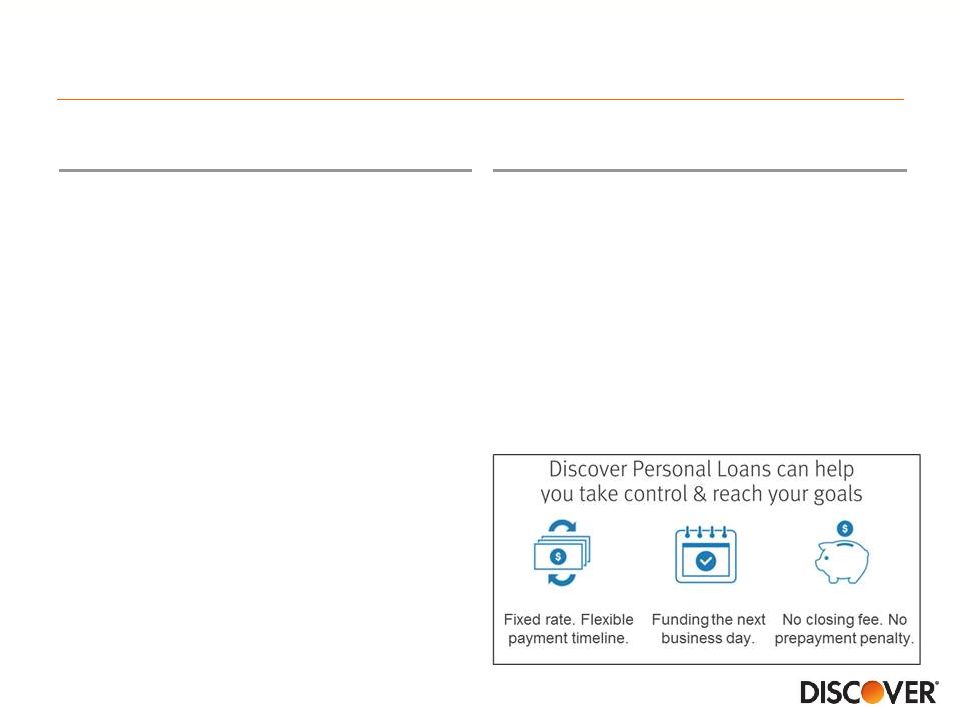 Discover’s personal lending product is well positioned in
competitive environment
•
New marketplace competition
-
Mail volumes have increased
-
Raising awareness of product
-
Focused on broader credit
segment
•
Business models often based on
originate and sell with little to no
risk retention
•
Rapid growth in low interest rate,
benign credit environment,
unproven through cycle
New Entrants
Discover’s Position
•
Leveraging brand and customer
experience
•
Prime segment focus with credit and
collections expertise developed
through cycles
•
Retaining loans on the balance sheet
with diversified funding
52 |
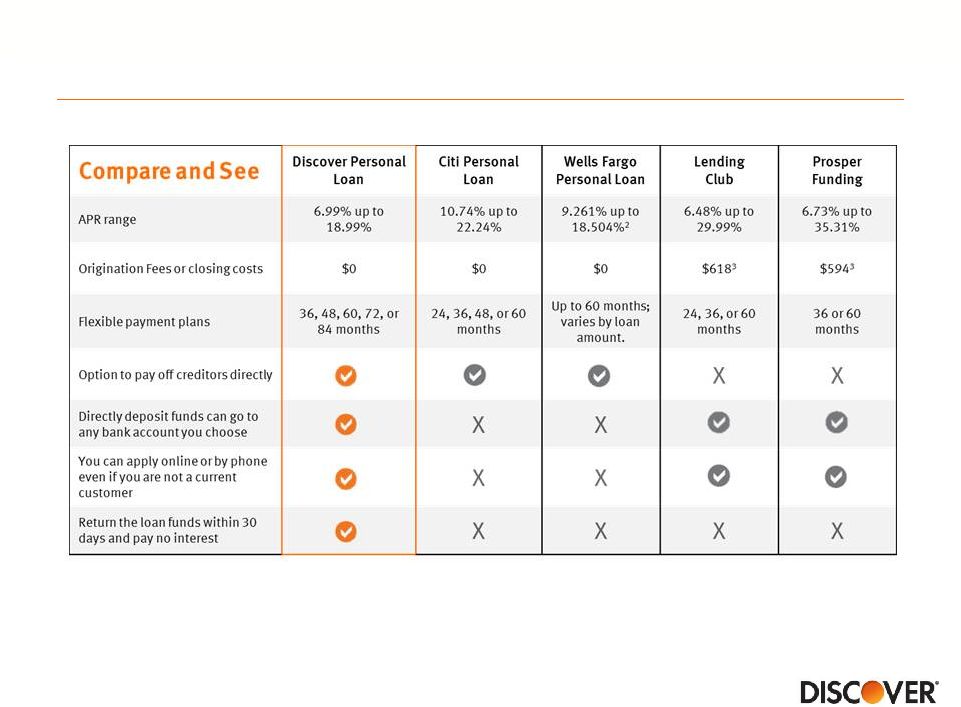 Not
all personal loans deliver the same advantages 53
Note(s)
1.
Comparison conducted by an independent research firm and based on data compiled in March 2015 from
company websites, customer service agents, and consumer credit offers 2.
Wells Fargo APR range is based on a $5,000 loan with a 36-month term 3.
Origination fee estimates are based on average loan amount and average origination fee % listed in
company filings (10-Q)
|
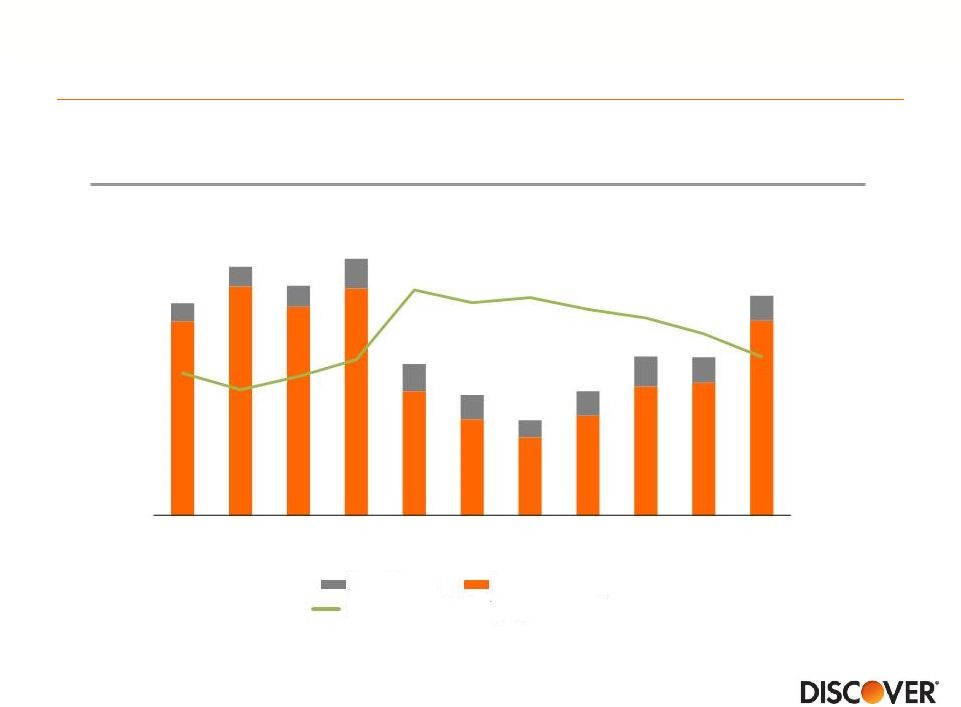 Home lending update
Mortgage Originations ($Bn)
Note(s)
1.
Freddie Mac conforming mortgage rates, quarterly averages
Purchase
Refinance
30
Yr
Fixed
Mortgage
Rates
(1)
54
2.0%
3.0%
4.0%
5.0%
$0.0
$0.2
$0.4
$0.6
$0.8
$1.0
$1.2
$1.4
3Q12
4Q12
1Q13
2Q13
3Q13
4Q13
1Q14
2Q14
3Q14
4Q14
1Q15 |
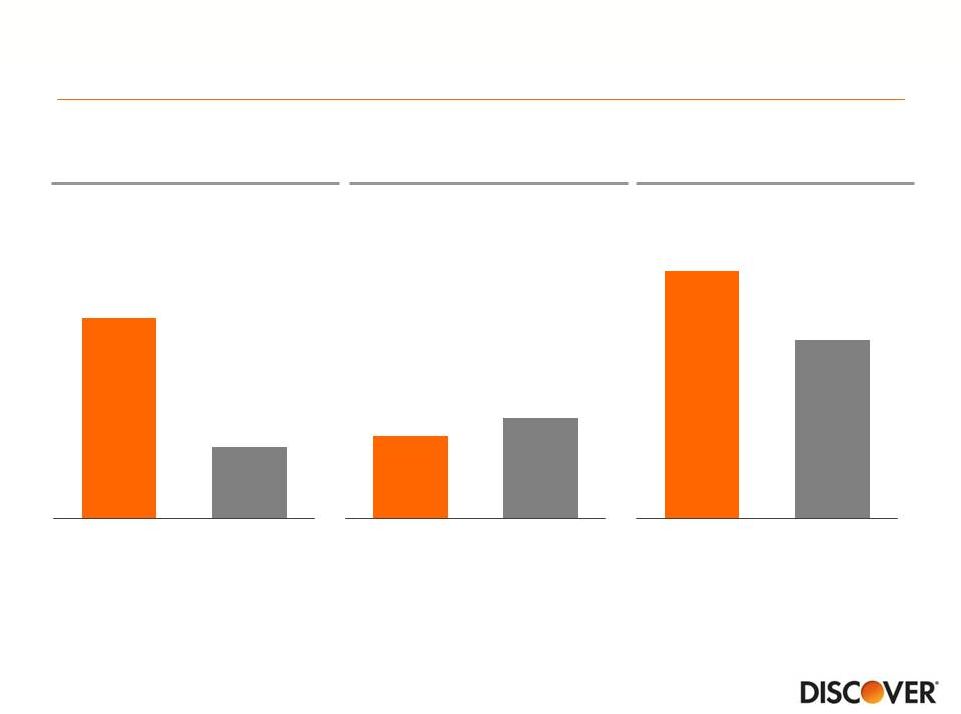
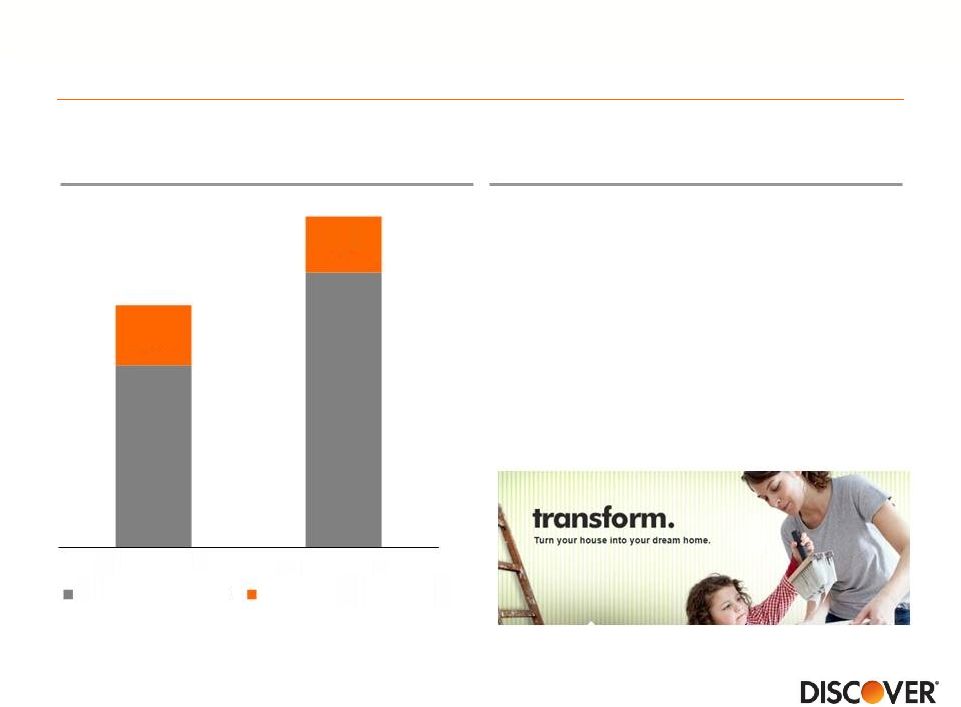 Home equity market is another opportunity for growth
Discover’s Position
•
Complements personal loans
•
Leveraging brand and customer
experience
•
Credit expertise
•
~80% of Discover cardmembers
own their own home
Home Equity
Industry Originations ($Bn)
Source
Moody’s Economics database
55
$79
$120
$26
$24
2012
2014
HE Line of Credit
HE Installment Loan |
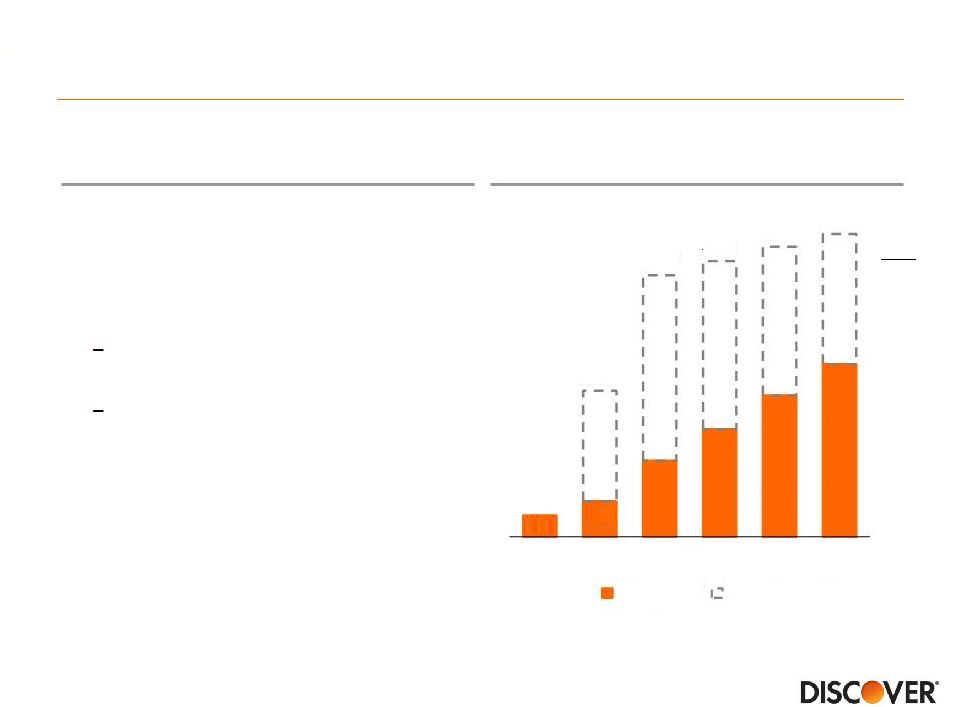 •
Target not-for-profit schools with
4-year undergraduate or graduate
degree programs, bar and
residency loans
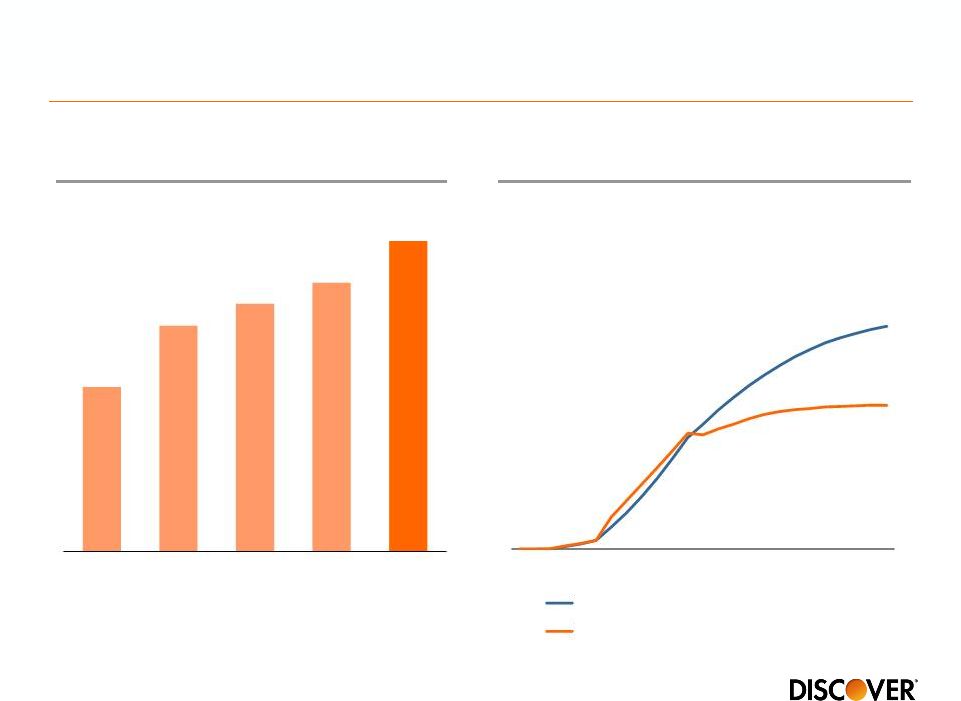
Generating organic growth in private student loans
Overview
Note(s)
1.
Placement of Discover brand at schools that use a lender list; based on 2015 U.S.
News and World Report online rankings 2.
Includes CitiAssist branded originated loans for 2011 and 2012
Student Loan Receivables ($Bn)
(2)
YOY
(12%)
22%
56
1.0
2.1
3.0
4.0
4.9
$4.1
$7.3
$7.7
$8.1
$8.5
2009
2010
2011
2012
2013
2014
0.6
Purchased
Organic
•
Fixed and variable interest rates, no
origination fees
99 of top 100 national
universities
(1)
All top 50 graduate business,
medical and law schools
(1) |
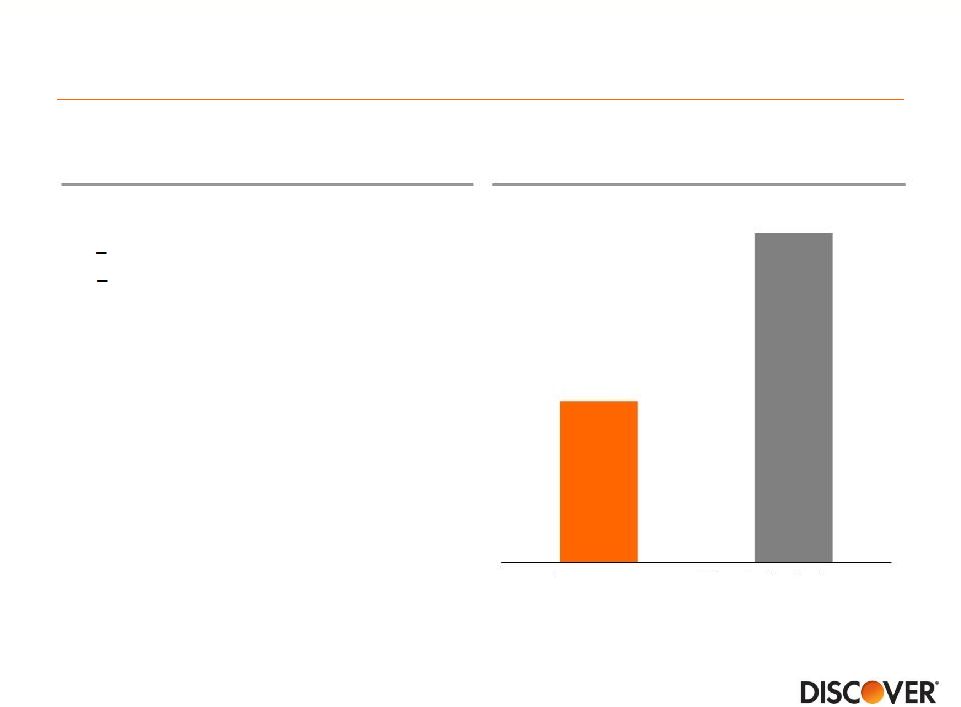 •
Strong credit characteristics
(1)
Disciplined underwriting approach drives better student loan
credit performance
Underwriting Approach
2014 Net Charge-off Rate (%)
Note(s):
1.
Reflects organic originations; FICO is the higher of either the borrower or
cosigner, weighted by loan balance 2.
Defined as 3Q14 annualized net losses to 3Q14 average managed contractual
receivables, which is a non-GAAP measure; see appendix for a reconciliation
3.
Based
on
MeasureOne
industry
net
charge-off
rates
for
3Q14
annualized;
Industry
data
includes:
The
First
Marblehead
Corporation,
PNC
Bank,
RBS
Citizens,
Sallie
Mae,
Sun
Trust Banks, Navient, and Wells Fargo Bank
(2)
(3)
57
•
School certification for all borrowers
and direct disbursement of funds to
school
Cosigner rate approximately 90%
Average FICO greater than 750 at
acquisition
0.9%
1.9%
Discover
Other Private Lenders |
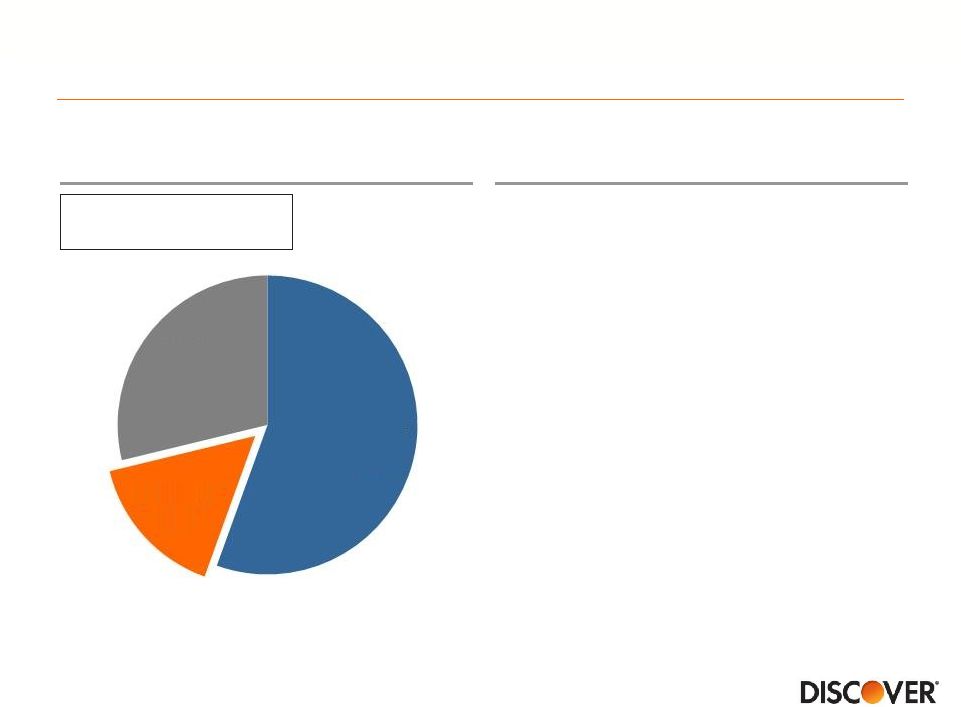 Discover product awareness expected to drive growth
Priorities for 2015 and Beyond
Note(s)
1.
December 2014 Measure One report: industry-wide private student loan
disbursements; Sallie Mae company reports •
Grow brand awareness
•
Expand integrated marketing
campaigns
•
Enhance customer experience
•
Increase borrower assistance
options
2014 Private Student Loan
Industry Originations
(1)
Total Size: $7.1Bn
2010 –
2014 CAGR: 7%
58
Sallie
Mae
55%
Discover
16%
Other
29% |
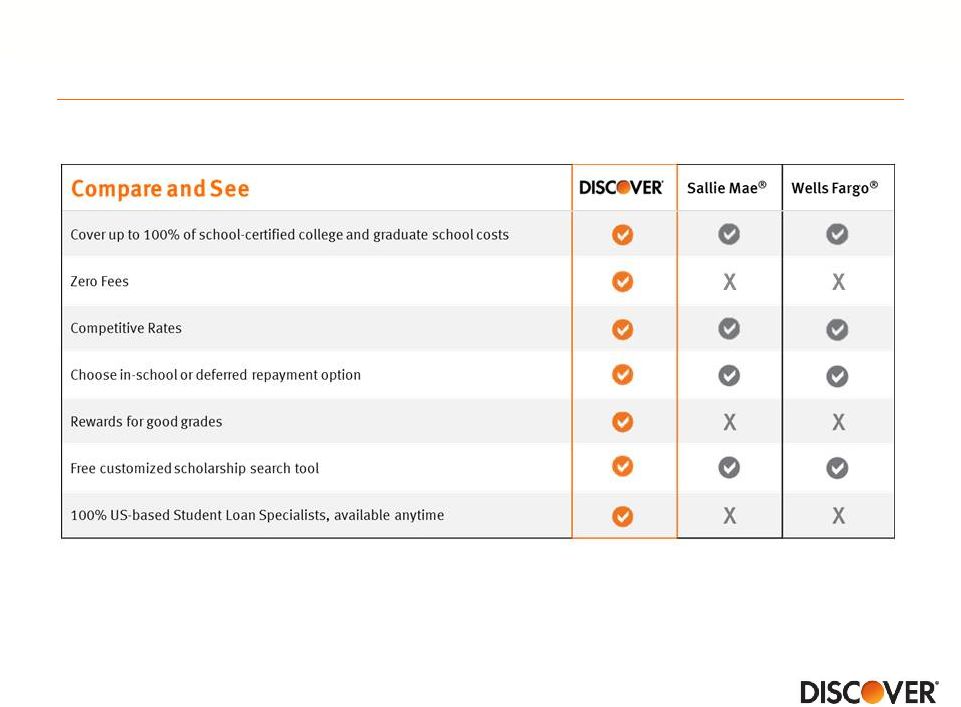 Not
all student loans are created equal 59
Note(s)
Comparisons based on information obtained on lenders’ websites or from customer service
representatives as of March 2015. At least a 3.0 GPA (or equivalent) qualifies for a
one-time cash reward of 1% of the loan amount of each new Discover student loan. Reward redemption period is limited
|
 Consumer Lending Summary
Well positioned for profitable growth in personal loans despite competitive
environment
Home lending business continues to face challenges in growing purchase
market originations
Continuing to pursue growth opportunity in home equity market
Student loan business expected to grow as tuition, enrollment and
Discover product awareness increases
Targeting 5-10% long-term receivables growth in other consumer lending
60 |
 Attractive business model with a solid record of success
61
Direct Banking growth diversifying assets and funding
Capital position/generation supporting growth and robust capital
deployment
Delivering strong card growth through new accounts, wallet share
gain,
lower attrition and great credit results
Proprietary network driving value for Card through brand recognition,
expanding global acceptance and rewards
Leveraging a payments partnership strategy to position the business for
growth |
 Funding, Capital and Financials
2015 Financial Community Briefing
Mark Graf
Chief Financial Officer |
 Financial considerations for 2015 and beyond
•
Positioning liabilities for rising rates, tailwind from lower funding costs
completed
•
Provisioning largely driven by loan growth, credit quality remains
relatively stable
•
Core expense growth is well disciplined, in 2015 expense growth
expected to be driven by some non-recurring items
•
Robust capital position supporting growth, share repurchases and
dividend actions
63 |
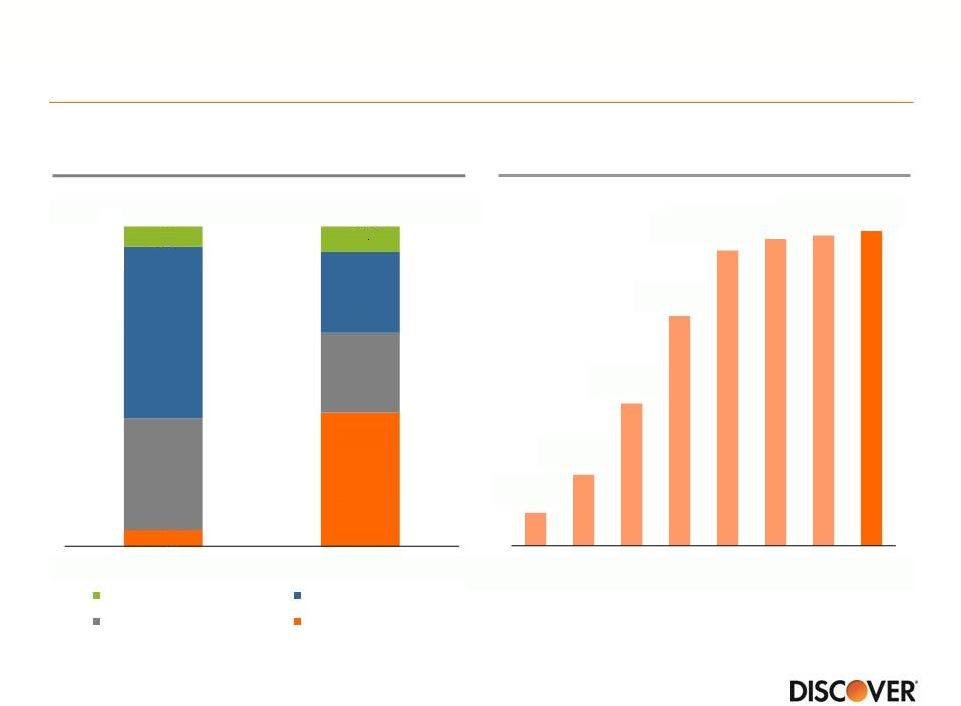 Continuing to strengthen and diversify funding sources
Funding Mix ($Bn)
$49.7
Note(s)
1.
Includes unsecured debt and other funding
2.
Includes affinity deposits
$68.7
Direct-to-Consumer
Deposits ($Bn)
(2)
Other
(1)
Brokered Deposits
ABS
Direct Deposits
(2)
64
$3
$7
$13
$21
$27
$28
$28
$29
2007
2008
2009
2010
2011
2012
2013
2014
5%
42%
35%
25%
54%
25%
6%
8%
Spin (6/30/07)
4Q14 |
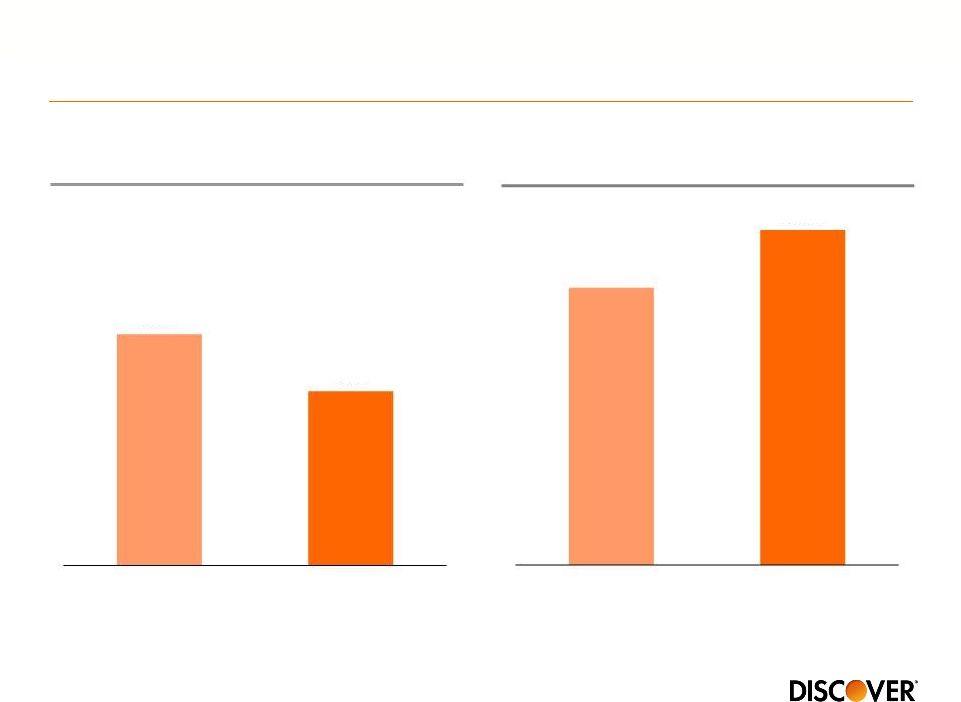 Optimizing deposit product mix to manage rate sensitivity
Indeterminate Balance Acquired at
10%+ Above Competitor Rates
(1,2)
Note(s)
1.
Indeterminate Balances defined as savings and money market balances
2.
Competitor
Rates
reflects
monthly
average
of
rates
posted
online
by
peer
banks,
which
include
banks
without
a
traditional
branch
network
Indeterminate Balances as a % of
Deposits Portfolio
(1)
65
39%
29%
2011
2014
48%
58%
2011
2014 |
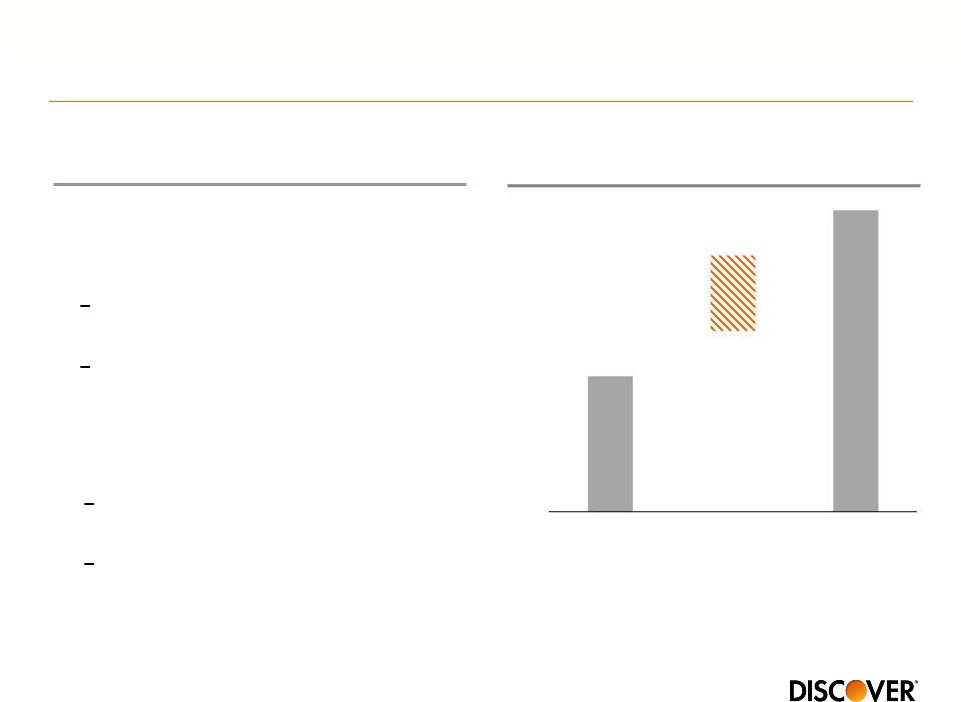
 •
Achieves cost of funds benefit in a
rising rate environment
•
Deepens customer relationships
given transactional nature of product
•
Delivers richer product features and
better value given lower direct
banking cost structure
•
Leverages Discover and PULSE
networks
Establish core banking presence and lower long term cost
of funds with checking product
Strategic Rationale
Note(s)
Checking product currently limited to existing deposit and card customers
66 |
 Discover direct deposit betas will be less than “1”
•
Similar to “traditional”
bank, strong
synergy between right and left
hand side of balance sheet
~65% of depositors have a loan
product relationship with DFS
~80% of new deposit accounts have
a loan product relationship with DFS
•
Different from “traditional”
bank…
Note(s)
1.
Defined as the ratio of expected change in deposit pricing relative to Federal
Reserve increases in short term interest rates 67
0.0
0.5
1.0
Traditional
Bank Deposit
Pricing
Discover DTC
Deposit
Pricing
Brokered CD
Pricing
DFS vs. Traditional Bank
Illustrative Betas
(1)
Checking deposits are still relatively
small (<1% of DFS funding)
Funding stack relies on ABS, direct
deposits and brokered deposits |
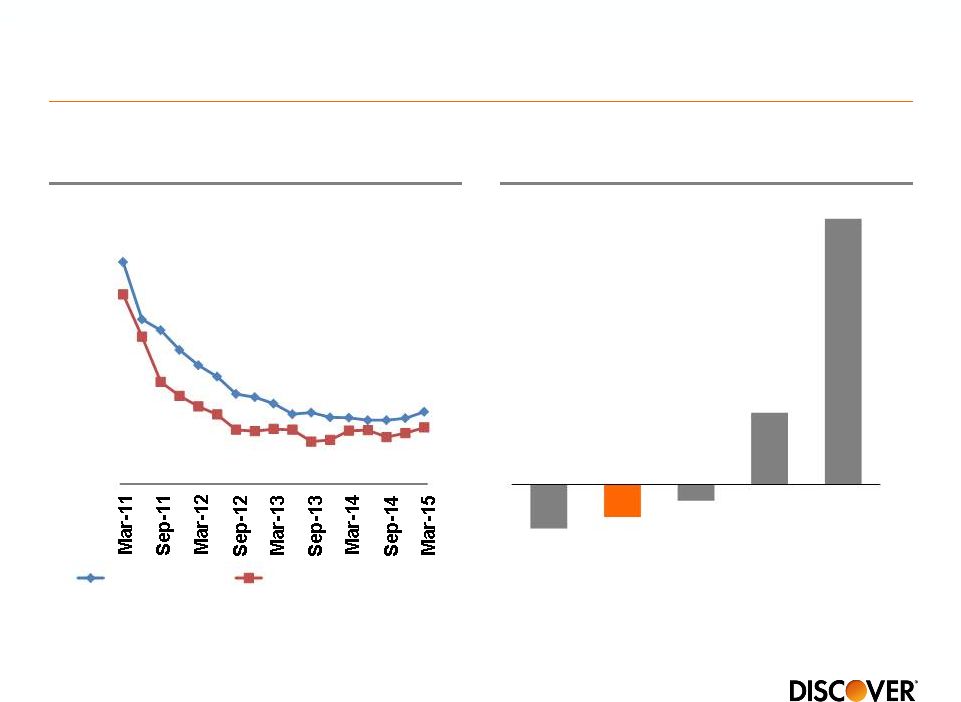
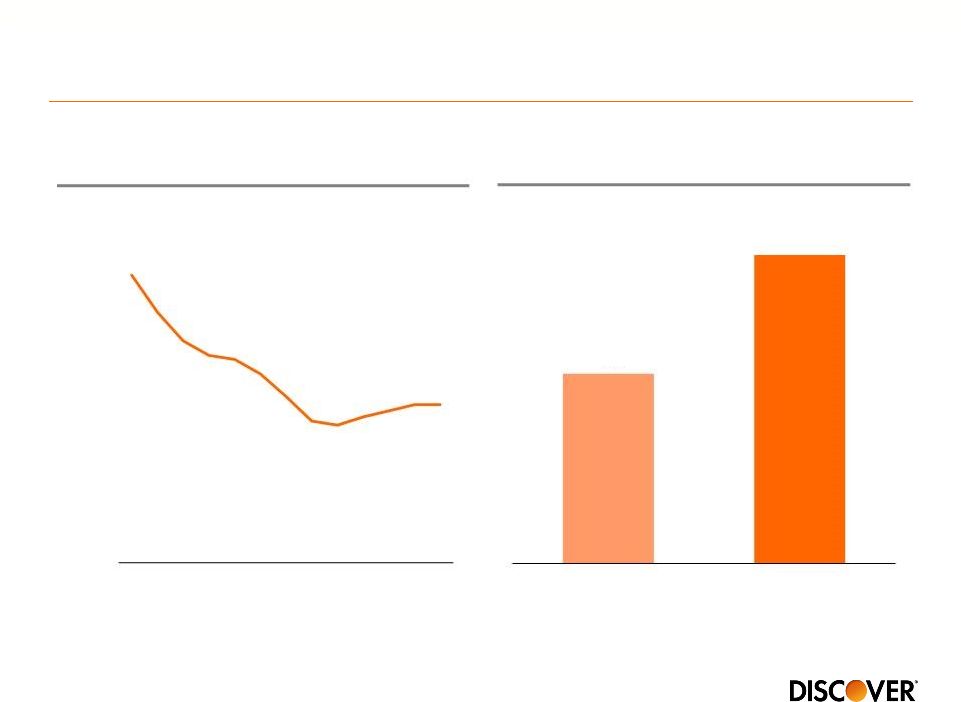 Funding costs will increase as we continue to position the
balance sheet for rising rates
Cost of Funds
(1)
Note(s)
1.
Rate on total interest-bearing liabilities
2.
Excludes all indeterminate maturity deposits (savings and money market) and
preferred stock; includes derivatives and hedging activities Avg Months to
Liability Repricing (2)
68
1.0%
1.2%
1.4%
1.6%
1.8%
2.0%
2.2%
2.4%
2.6%
1Q12
3Q12
1Q13
3Q13
1Q14
3Q14
1Q15
16
26
1Q12
1Q15 |
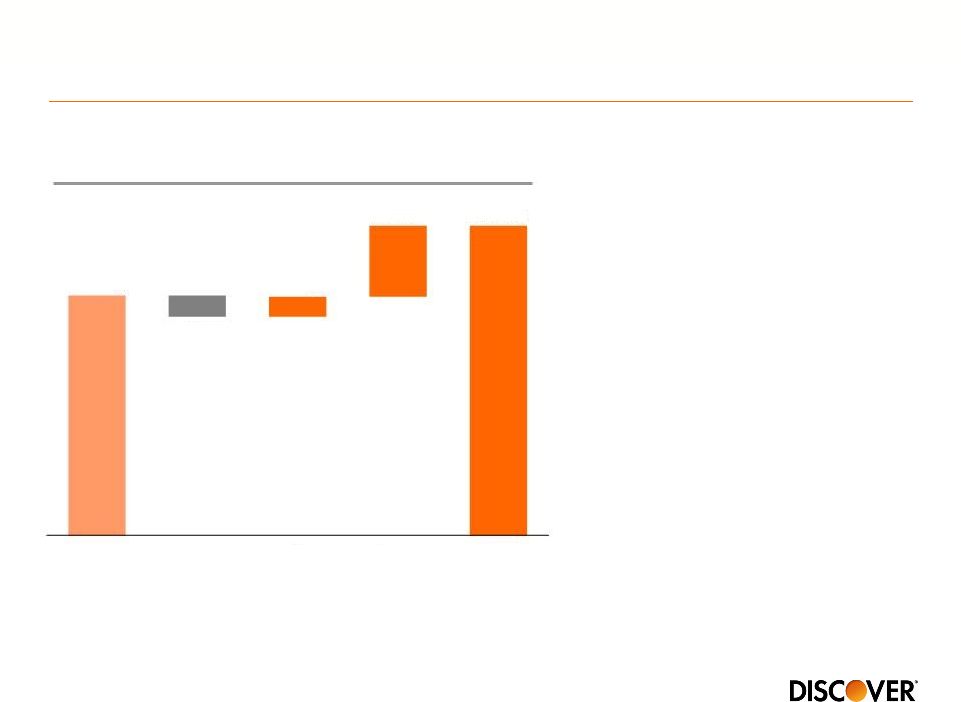 Lower funding costs drove NIM expansion in recent past
2012-2014
Net Interest Margin
Note(s)
1.
Includes interest income on all interest earnings assets
(1)
•
Expect modest 2015 NIM
compression driven by funding
costs and card yield
•
Expect to be at or above 9.5%,
on an annual basis, at least
through 2016
69
9.29%
(0.16%)
0.15%
0.53%
9.81%
2012
Gross
Yield
Interest
Charge-off
Interest
Expense
2014 |
 Discover is slightly asset sensitive
1-Year
Net
Interest
Income
Impact
from
100bps
Parallel
Shift
(1)
Note(s)
1.
Calculated based on reported net interest income impact divided by period ending
net interest income. Capital One (COF) estimated using 200 basis point parallel shift divided
by 2 to approximate 100 basis point parallel shift
Source
4Q14 Company disclosures
70
BAC
JPM
C
COF
DFS
AXP
-6%
-4%
-2%
0%
2%
4%
6%
8%
10%
12% |
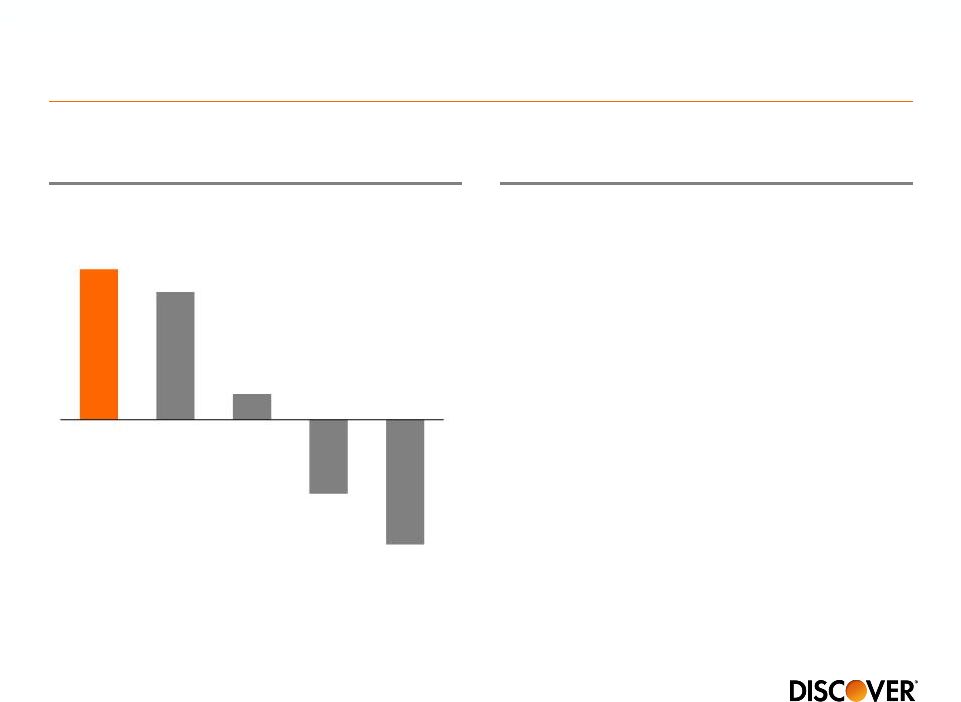 Revenue growth has outperformed peers but certain fee
revenue categories face headwinds
2014
Revenue
Growth
(YOY)
(1)
•
Protection Products Revenue –
expect continued decline
•
Other Income –
Mortgage gain on
sale volatility driven in part by refi
market
•
Payment Services Revenue –
continued negative competitive
impact, B2B volume growth strong
but lower margin
Note(s)
1.
Revenues
net
of
interest
expense;
American
Express
(U.S.
Card),
Capital
One
(U.S.
Card),
Citi
(Citi-branded
Cards
N.A.),
JPMorgan
Chase
(Card
Services)
and
Discover
(Direct
Banking segment) excludes elimination of rewards forfeiture reserve of $178 million
from 2014 Fee Revenue Categories
71
5.6%
4.8%
1.0%
-2.8%
-4.7%
DFS
AXP
C
JPM
COF |
 Total charge-off rate remains low and 2014 profits not
driven by reserve releases
Card Credit Trends
Note(s)
1.
Reserve release/build divided by pre-tax profit; American Express (U.S. Card),
Capital One (U.S. Card), Citi (Citi-branded Cards N.A.), Discover (Direct Banking segment) and
JPMorgan Chase (Card Services)
2014 Reserve Release/Build
Contribution
to
Pre-tax
Profit
(1)
72
1.00%
2.00%
3.00%
4.00%
5.00%
6.00%
7.00%
Reserve Rate
Net Charge-off Rate
-4%
-3%
-1%
6%
22%
AXP
DFS
COF
JPM
C |
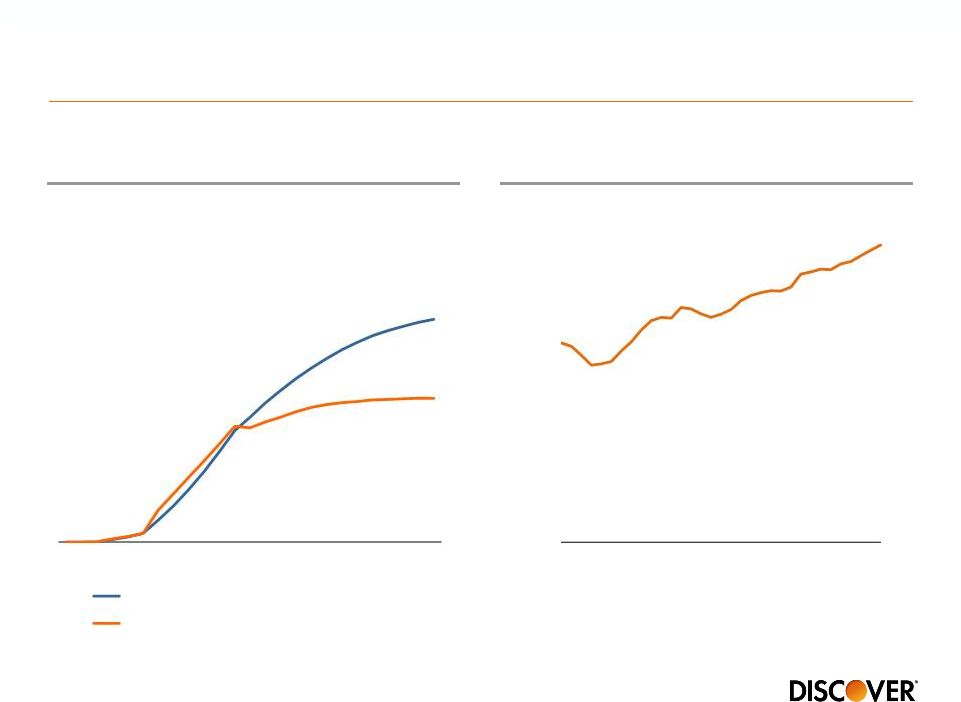 Recent vintage performance is better than historical but
seasoning of growth will drive provisioning
2010-2013
Card
Vintage
Gross
Loss
Rate
(1)
Note(s)
1.
Blended vintage 6-month moving average gross principal charge-off rate
(excludes recoveries) % of Card Portfolio on
Book for <3 Years
73
0
4
8
12
16
20
24
2002-2006 Historical Benchmark
2010-2013
10%
11%
12%
13%
14%
15%
16%
17%
18%
Jan-12
Jan-13
Jan-14 |
 Higher costs in 2015 driven by some non-recurring items
Total Expense ($Bn)
Note(s)
1.
Defined
as
reported
noninterest
expense
divided
by
total
revenue
(net
interest
income
and
noninterest
income)
2.
Adjusted efficiency ratio excludes charges associated with Diners Club from 2013
results and one-time charges associated with the rewards forfeiture change, Diners
Club and Discover Home Loans from 2014 results. See appendix for
reconciliation Efficiency
Ratio
(1)
38.8%
39.4%
--
Adj.
Efficiency
Ratio
(2)
38.4%
38.0%
•
2015 will be impacted by
–
AML/BSA program
remediation
–
EMV roll out
–
1Q15 legal reserve
–
Debit litigation
•
Continue to target long-term
efficiency ratio of 38%+/-
for the
total company
74
$3.2
$3.3
$3.5
2013
2014
2015E |
 Strongest capital ratio in stress scenario
Source
Federal Reserve Dodd-Frank Act Stress Test 2015: Supervisory Stress Test
Methodology and Results, Table 3. Projected stressed capital ratios under the severely adverse scenario,
DFAST Severely Adverse Results
Min. Common Equity Tier 1 Capital Ratio
75
13.3%
13.0%
9.4%
7.1%
6.8%
6.3%
DFS
AXP
COF
BAC
C
JPM
2014:Q4-2016:Q4; 31 participating bank holding companies
|
 Planned capital actions generate highest yield
Estimated
Dividend
and
Buyback
Yield
(1)
Note(s)
1.
CCAR announced capital actions (buybacks and dividends) pro-rated for four
quarters ending 1Q16 divided by market capitalization as of 4/30/15
Source
Public company disclosures
76
9%
8%
8%
5%
4%
3%
DFS
AXP
COF
JPM
C
BAC
Dividend
Buyback |
 Excess capital can help drive shareholder returns
Note(s)
Common Equity Tier 1
Capital Ratio
(1)
11%
Target
$2.5Bn+/-
77
14.7%
1Q15
1.
Common Equity Tier 1 Capital Ratio (Basel III fully phased-in) is calculated using Basel III fully
phased-in common equity tier 1 capital, a non-GAAP measure. The Company believes
that the common equity tier 1 capital ratio based on fully phased-in Basel III rules is an important complement to the existing capital ratios and for
comparability to other financial institutions. For the corresponding reconciliation of common
equity tier 1 capital and risk weighted assets calculated under fully phased-in Basel III
rules to common equity tier 1 capital and risk weighted assets calculated under Basel III transition rules, see appendix
dividend actions
–
Portfolio purchases
–
Disciplined acquisitions
–
Organic growth
–
Share repurchases and
•
Long-term capital priorities: |
 Key
long-term targets remain largely the same Card Loan Growth
3-5%
Non-Card Lending Growth
5-10%
Payments Volume Growth
10%+
Total Company NIM
9%+/-
Card Net Charge-Offs
3.5-4.5%
Efficiency Ratio
38%+/-
Common Equity Tier I Ratio (Basel III)
11%
ROE
15%+
78
Near-term
Long-term |
 2015 Guidance
Category
Target
Rationale
Revenue
Margin
(1)
Modest
Decline
•
Modest net interest margin
compression
•
Lower protection products revenue
•
Higher rewards rate
•
Payments volume
Provision for Loan Losses
Rate
(1)
2.5%+/-
•
Seasoning of new vintages and
modestly lower recoveries on aged
charge-offs
Operating Expenses
$3.5Bn+/-
•
Higher marketing,
regulatory/compliance and
technology costs
Note(s)
1.
As a percentage of average receivables
79 |
 Conclusion
•
Loan growth at high end of range
•
Net interest margin expected to remain above long-term target
•
Only modest increase in “core”
operating expenses near-term
•
Card delinquency trends do not indicate a change in credit environment
•
Capital position/generation supports growth, share repurchases and dividend
actions
80 |
 Q&A
2015 Financial Community Briefing |
 Reconciliation of GAAP to Non-GAAP Data
Note(s)
1.
Credit card pre-tax return on assets excluding the forfeiture reserve
elimination and loss reserve changes is a non-GAAP measure and represents pre-tax earnings of Discover's
U.S. credit card business excluding the impact of the elimination of the credit
card rewards program forfeiture reserve and changes to the allowance for loan loss reserve. Credit
card pre-tax return on assets excluding the forfeiture reserve elimination and
loss reserve changes is a meaningful measure to investors because it provides a competitive
performance benchmark
82
Twelve Months Ended
(unaudited, $ in millions)
12/31/14
GAAP Direct Banking pre-tax income
$3,605
Excluding non-credit card pre-tax income
228
Credit card pre-tax income
$3,377
Excluding elimination of credit card rewards program forfeiture reserve
178
Excluding credit card reserve changes
68
Credit card pre-tax income excluding forfeiture reserve and reserve
changes $3,623
GAAP average credit card receivables
$52,600
Credit
card
pre-tax
return
on
assets
(excluding
forfeiture
reserve
and
reserve
changes)
(1)
6.9% |
 Reconciliation of GAAP to Non-GAAP Data (cont’d)
Note(s)
83
(unaudited, $ in billions)
Three Months Ended
9/30/2014
GAAP Recorded Balance Purchased (Private) Credit Impaired Student Loans (average
loans) $3.9
Adjustment for Purchase Accounting
0.2
Contractual
Value
Purchased
(Private)
Credit
Impaired
Student
Loans
(average
loans)
(1)
$4.1
GAAP Private Student Loans (average loans)
4.5
Contractual
Value
Private
Student
Loans
(average
loans)
(1)
$8.6
(unaudited, $ in millions)
Three Months Ended
9/30/2014
GAAP Private Student Loan Net Principal Charge-offs
$12.8
Adjustment
for
Purchased
(Private)
Credit
Impaired
Student
Loans
Net
Principal
Charge-offs
6.1
Contractual
Private
Student
Loan
Net
Principal
Charge-offs
(2)
$18.9
Contractual Net Charge-off Rate
0.9%
1.
The contractual value of the purchased private student loan portfolio is a non-GAAP measure and
represents purchased private student loans excluding the purchase accounting discount. The
contractual value of the private student loan portfolio is meaningful to investors to understand total outstanding loan balances without the purchase
accounting discount
2.
Contractual private student loan net principal charge-offs is a non-GAAP measure and include
net charge-offs on purchase credit impaired loans. Under GAAP any losses on such
loans are charged against the nonaccretable difference established in purchased credit impaired accounting and are not reported as charge-offs. Contractual net
principal charge-offs is meaningful to investors to see total portfolio losses |
 Reconciliation of GAAP to Non-GAAP Data (cont’d)
Note(s)
1.
Adjusted operating efficiency is calculated using adjusted operating expense
divided by adjusted revenue net of interest expense, a non-GAAP financial measure which should be
viewed in addition to, and not as a substitute for, the company's reported results.
Management believes this information provides investors with a useful metric to evaluate the
ongoing operating performance of the company
84
Twelve Months Ended
Twelve Months Ended
(unaudited, $ in millions)
12/31/14
12/31/13
Revenue net of interest expense
$8,477
$8,224
Excluding Elimination of credit card rewards program forfeiture reserve
178
-
Adjusted revenue net of interest expense (excluding one-time charge)
$8,655
$8,224
Total operating expense
$3,340
$3,194
Excluding Discover Home Loans goodwill impairment
(27)
Excluding Diners Club Italy held-for-sale fair value adjustment
(21)
Excluding Diners Club international franchise support
-
(40)
Adjusted operating expense (excluding one-time charges)
$3,292
$3,154
Adjusted
operating
efficiency
(excluding
one-time
charges)
(1)
38.0%
38.4% |
 Reconciliation of GAAP to Non-GAAP Data (cont’d)
Note(s)
1.
Adjustments related to capital components for fully phased-in Basel III include
the phase-in of the intangible asset exclusion[ 2.
Key
differences
under
fully
phased-in
Basel
III
rules
in
the
calculation
of
risk-weighted
assets
include
higher
risk
weighting
for
past
due
loans
and
unfunded
commitments[
3.
As of January 1, 2015 regulatory capital ratios are calculated under Basel III
rules subject to transition provisions. We reported under Basel I at December 31, 2014, September
30, 2014, June 30, 2014 and March 31, 2014
4.
Common equity tier 1 capital ratio (Basel III fully phased-in) is calculated
using common equity tier 1 capital (Basel III fully phased-in), a non-GAAP measure, divided by risk
weighted assets (Basel III fully phased-in)
85
Quarter Ended
(unaudited, $ in millions)
3/31/15
Common equity Tier 1 capital (Basel III transition)
$10,497
Adjustments
related
to
capital
componentes
during
transition
(1)
(87)
Common equity Tier 1 capital (Basel III fully phased-in)
$10,410
Risk weighted assets (Basel III transition)
$70,864
Risk
weighted
assets
(Basel
III
fully
phased-in)
(2)
$70,757
Common
equity
Tier
1
capital
(Basel
III
transition)
(3)
14.8%
Common equity Tier 1 capital (Basel III fully phased-in)
(3,4)
14.7% |