Attached files
| file | filename |
|---|---|
| EXCEL - IDEA: XBRL DOCUMENT - WILLIAMS PARTNERS L.P. | Financial_Report.xls |
| EX-12 - EX-12 - WILLIAMS PARTNERS L.P. | wpz_20150331xex12.htm |
| EX-10.5 - EX-10.5 - WILLIAMS PARTNERS L.P. | wpz_2150331xex105.htm |
| EX-32 - EX-32 - WILLIAMS PARTNERS L.P. | wpz_20150331xex32.htm |
| EX-31.1 - EX-31.1 - WILLIAMS PARTNERS L.P. | wpz_20150331xex311.htm |
| EX-31.2 - EX-31.2 - WILLIAMS PARTNERS L.P. | wpz_20150331xex312.htm |
UNITED STATES SECURITIES AND EXCHANGE COMMISSION
Washington, D.C. 20549
FORM 10-Q
(Mark One)
þ | QUARTERLY REPORT PURSUANT TO SECTION 13 OR 15(d) OF THE SECURITIES EXCHANGE ACT OF 1934 |
For the quarterly period ended March 31, 2015
or
¨ | TRANSITION REPORT PURSUANT TO SECTION 13 OR 15(d) OF THE SECURITIES EXCHANGE ACT OF 1934 |
For the transition period from _____________ to _____________
Commission file number 1-34831
WILLIAMS PARTNERS L.P. |
(Exact name of registrant as specified in its charter) |
DELAWARE | 20-2485124 | |
(State or other jurisdiction of incorporation or organization) | (I.R.S. Employer Identification No.) | |
ONE WILLIAMS CENTER | ||
TULSA, OKLAHOMA | 74172-0172 | |
(Address of principal executive offices) | (Zip Code) | |
Registrant’s telephone number, including area code: (918) 573-2000
NO CHANGE
(Former name, former address and former fiscal year, if changed since last report)
Indicate by check mark whether the registrant (1) has filed all reports required to be filed by Section 13 or 15(d) of the Securities Exchange Act of 1934 during the preceding 12 months (or for such shorter period that the registrant was required to file such reports), and (2) has been subject to such filing requirements for the past 90 days. Yes þ No ¨
Indicate by check mark whether the registrant has submitted electronically and posted on its corporate Web site, if any, every Interactive Data File required to be submitted and posted pursuant to Rule 405 of Regulation S-T (§232.405 of this chapter) during the preceding 12 months (or for such shorter period that the registrant was required to submit and post such files). Yes þ No ¨
Indicate by check mark whether the registrant is a large accelerated filer, an accelerated filer, a non-accelerated filer or a smaller reporting company. See the definitions of “large accelerated filer,” “accelerated filer” and “smaller reporting company” in Rule 12b-2 of the Exchange Act. (Check one):
Large accelerated filer þ | Accelerated filer ¨ | Non-accelerated filer ¨ | Smaller reporting company ¨ | |||
(Do not check if a smaller reporting company) | ||||||
Indicate by check mark whether the registrant is a shell company (as defined in Rule 12b-2 of the Exchange Act). Yes ¨ No þ
The registrant had 586,695,126 common units and 13,948,171 Class B units outstanding as of April 27, 2015.
Williams Partners L.P.
Index
Page | ||
Item 1. Financial Statements | ||
Consolidated Balance Sheet – March 31, 2015 and December 31, 2014 | ||
Consolidated Statement of Changes in Equity – Three Months Ended March 31, 2015 | ||
Consolidated Statement of Cash Flows – Three Months Ended March 31, 2015 and 2014 | ||
Certain matters contained in this report include “forward-looking statements” within the meaning of Section 27A of the Securities Act of 1933, as amended, and Section 21E of the Securities Exchange Act of 1934, as amended. These forward-looking statements relate to anticipated financial performance, management’s plans and objectives for future operations, business prospects, outcome of regulatory proceedings, market conditions and other matters. We make these forward-looking statements in reliance on the safe harbor protections provided under the Private Securities Litigation Reform Act of 1995.
All statements, other than statements of historical facts, included in this report that address activities, events or developments that we expect, believe or anticipate will exist or may occur in the future are forward-looking statements. Forward-looking statements can be identified by various forms of words such as “anticipates,” “believes,” “seeks,” “could,” “may,” “should,” “continues,” “estimates,” “expects,” “forecasts,” “intends,” “might,” “goals,” “objectives,” “targets,” “planned,” “potential,” “projects,” “scheduled,” “will,” “assumes,” “guidance,” “outlook,” “in service date” or other similar expressions. These forward-looking statements are based on management’s beliefs and assumptions and on information currently available to management and include, among others, statements regarding:
• | The levels of cash distributions to unitholders; |
• | Our and Williams’ future credit ratings; |
• | Amounts and nature of future capital expenditures; |
• | Expansion and growth of our business and operations; |
• | Financial condition and liquidity; |
• | Business strategy; |
• | Cash flow from operations or results of operations; |
1
• | Seasonality of certain business components; |
• | Natural gas, natural gas liquids and olefins prices, supply and demand; |
• | Demand for our services. |
Forward-looking statements are based on numerous assumptions, uncertainties, and risks that could cause future events or results to be materially different from those stated or implied in this report. Limited partner units are inherently different from the capital stock of a corporation, although many of the business risks to which we are subject are similar to those that would be faced by a corporation engaged in a similar business. You should carefully consider the risk factors referenced below in addition to the other information in this report. If any of the following risks were actually to occur, our business, results of operations and financial condition could be materially adversely affected. In that case, we might not be able to pay distributions on our common units, the trading price of our common units could decline, and unitholders could lose all or part of their investment. Many of the factors that will determine these results are beyond our ability to control or predict. Specific factors that could cause actual results to differ from results contemplated by the forward-looking statements include, among others, the following:
• | Whether we have sufficient cash from operations to enable us to pay current and expected levels of cash distributions, if any, following establishment of cash reserves and payment of fees and expenses, including payments to our general partner; |
• | Availability of supplies, market demand, and volatility of prices; |
• | Inflation, interest rates, fluctuation in foreign exchange rates and general economic conditions (including future disruptions and volatility in the global credit markets and the impact of these events on our customers and suppliers); |
• | The strength and financial resources of our competitors and the effects of competition; |
• | Whether we are able to successfully identify, evaluate and execute investment opportunities; |
• | The ability to acquire new businesses and assets and successfully integrate those operations and assets into our existing businesses, as well as successfully expand our facilities; |
• | Development of alternative energy sources; |
• | The impact of operational and development hazards and unforeseen interruptions; |
• | Costs of, changes in, or the results of laws, government regulations (including safety and environmental regulations), environmental liabilities, litigation and rate proceedings; |
• | Our allocated costs for defined benefit pension plans and other postretirement benefit plans sponsored by our affiliates; |
• | Changes in maintenance and construction costs; |
• | Changes in the current geopolitical situation; |
• | Our exposure to the credit risks of our customers and counterparties; |
• | Risks related to financing, including restrictions stemming from our debt agreements, future changes in our credit ratings as determined by nationally-recognized credit rating agencies, and the availability and cost of capital; |
2
• | The amount of cash distributions from and capital requirements of our investments and joint ventures in which we participate; |
• | Risks associated with weather and natural phenomena, including climate conditions; |
• | Acts of terrorism, including cybersecurity threats and related disruptions; |
• | Additional risks described in our filings with the SEC. |
Given the uncertainties and risk factors that could cause our actual results to differ materially from those contained in any forward-looking statement, we caution investors not to unduly rely on our forward-looking statements. We disclaim any obligations to and do not intend to update the above list or to announce publicly the result of any revisions to any of the forward-looking statements to reflect future events or developments.
In addition to causing our actual results to differ, the factors listed above and referred to below may cause our intentions to change from those statements of intention set forth in this report. Such changes in our intentions may also cause our results to differ. We may change our intentions, at any time and without notice, based upon changes in such factors, our assumptions, or otherwise.
Because forward-looking statements involve risks and uncertainties, we caution that there are important factors, in addition to those listed above, that may cause actual results to differ materially from those contained in the forward-looking statements. For a detailed discussion of those factors, see Part I, Item 1A. Risk Factors in our Annual Report on Form 10-K for the year ended December 31, 2014.
3
DEFINITIONS
The following is a listing of certain abbreviations, acronyms, and other industry terminology used throughout this Form 10-Q.
Measurements:
Barrel: One barrel of petroleum products that equals 42 U.S. gallons
Bcf : One billion cubic feet of natural gas
Bcf/d: One billion cubic feet of natural gas per day
British Thermal Unit (Btu): A unit of energy needed to raise the temperature of one pound of water by one degree
Fahrenheit
Dekatherms (Dth): A unit of energy equal to one million British thermal units
Mbbls/d: One thousand barrels per day
Mdth/d: One thousand dekatherms per day
MMcf/d: One million cubic feet per day
MMdth: One million dekatherms or approximately one trillion British thermal units
MMdth/d: One million dekatherms per day
TBtu: One trillion British thermal units
Consolidated Entities:
ACMP: Access Midstream Partners, L.P. prior to its merger with Pre-merger WPZ
Cardinal: Cardinal Gas Services, L.L.C.
Constitution: Constitution Pipeline Company, LLC
Gulfstar One: Gulfstar One LLC
Jackalope: Jackalope Gas Gathering Services, L.L.C
Northwest Pipeline: Northwest Pipeline, LLC
Pre-merger WPZ: Williams Partners L.P. prior to its merger with ACMP
Transco: Transcontinental Gas Pipe Line Company, LLC
Partially Owned Entities: Entities in which we do not own a 100 percent ownership interest and which, as of March 31, 2015, we account for as an equity-method investment, including principally the following:
Aux Sable: Aux Sable Liquid Products LP
Caiman II: Caiman Energy II, LLC
Discovery: Discovery Producer Services LLC
Gulfstream: Gulfstream Natural Gas System, L.L.C.
Laurel Mountain: Laurel Mountain Midstream, LLC
OPPL: Overland Pass Pipeline Company LLC
UEOM: Utica East Ohio Midstream LLC
Government and Regulatory:
EPA: Environmental Protection Agency
FERC: Federal Energy Regulatory Commission
4
SEC: U.S. Securities and Exchange Commission
Other:
B/B Splitter: Butylene/Butane splitter
GAAP: U.S. generally accepted accounting principles
Fractionation: The process by which a mixed stream of natural gas liquids is separated into constituent products, such as ethane, propane, and butane
IDR: Incentive distribution right
NGLs: Natural gas liquids; natural gas liquids result from natural gas processing and crude oil refining and are
used as petrochemical feedstocks, heating fuels, and gasoline additives, among other applications
NGL margins: NGL revenues less Btu replacement cost, plant fuel, transportation, and fractionation
Williams: The Williams Companies, Inc. and, unless the context otherwise indicates, its subsidiaries (other than Williams Partners L.P. and its subsidiaries)
5
PART I – FINANCIAL INFORMATION
Williams Partners L.P.
Consolidated Statement of Comprehensive Income
(Unaudited)
Three months ended March 31, | |||||||
2015 | 2014 | ||||||
(Millions, except per-unit amounts) | |||||||
Revenues: | |||||||
Service revenues | $ | 1,192 | $ | 763 | |||
Product sales | 519 | 930 | |||||
Total revenues | 1,711 | 1,693 | |||||
Costs and expenses: | |||||||
Product costs | 463 | 769 | |||||
Operating and maintenance expenses | 380 | 248 | |||||
Depreciation and amortization expenses | 419 | 208 | |||||
Selling, general, and administrative expenses | 193 | 130 | |||||
Net insurance recoveries – Geismar Incident | — | (119 | ) | ||||
Other (income) expense – net | 17 | 17 | |||||
Total costs and expenses | 1,472 | 1,253 | |||||
Operating income | 239 | 440 | |||||
Equity earnings (losses) | 51 | 23 | |||||
Other investing income (loss) – net | 1 | — | |||||
Interest incurred | (209 | ) | (131 | ) | |||
Interest capitalized | 17 | 25 | |||||
Other income (expense) – net | 16 | 3 | |||||
Income before income taxes | 115 | 360 | |||||
Provision (benefit) for income taxes | 3 | 8 | |||||
Net income | 112 | 352 | |||||
Less: Net income attributable to noncontrolling interests | 23 | — | |||||
Net income attributable to controlling interests | $ | 89 | $ | 352 | |||
Allocation of net income (loss) for calculation of earnings per common unit: | |||||||
Net income attributable to controlling interests | $ | 89 | $ | 352 | |||
Allocation of net income (loss) to general partner | 195 | 180 | |||||
Allocation of net income (loss) to Class B units | (2 | ) | — | ||||
Allocation of net income (loss) to Class D units | 68 | 14 | |||||
Allocation of net income (loss) to common units | $ | (172 | ) | $ | 158 | ||
Basic and diluted net income (loss) per common unit | $ | (.34 | ) | $ | .44 | ||
Basic and diluted weighted average number of common units outstanding (thousands) | 507,001 | 361,620 | |||||
Cash distributions per common unit | $ | .8500 | $ | .9045 | |||
Other comprehensive income (loss): | |||||||
Foreign currency translation adjustments | (87 | ) | (39 | ) | |||
Other comprehensive income (loss) | (87 | ) | (39 | ) | |||
Comprehensive income | 25 | 313 | |||||
Less: Comprehensive income attributable to noncontrolling interests | 23 | — | |||||
Comprehensive income attributable to controlling interests | $ | 2 | $ | 313 | |||
See accompanying notes.
6
Williams Partners L.P.
Consolidated Balance Sheet
(Unaudited)
March 31, 2015 | December 31, 2014 | ||||||
(Dollars in millions) | |||||||
ASSETS | |||||||
Current assets: | |||||||
Cash and cash equivalents | $ | 277 | $ | 171 | |||
Trade accounts and notes receivable – net | 697 | 905 | |||||
Inventories | 200 | 231 | |||||
Other current assets | 193 | 198 | |||||
Total current assets | 1,367 | 1,505 | |||||
Investments | 8,319 | 8,399 | |||||
Property, plant, and equipment, at cost | 36,172 | 35,479 | |||||
Accumulated depreciation | (8,458 | ) | (8,157 | ) | |||
Property, plant, and equipment – net | 27,714 | 27,322 | |||||
Goodwill | 1,145 | 1,120 | |||||
Other intangible assets – net of accumulated amortization | 10,190 | 10,451 | |||||
Regulatory assets, deferred charges, and other | 549 | 525 | |||||
Total assets | $ | 49,284 | $ | 49,322 | |||
LIABILITIES AND EQUITY | |||||||
Current liabilities: | |||||||
Accounts payable: | |||||||
Trade | $ | 650 | $ | 808 | |||
Affiliate | 143 | 137 | |||||
Accrued interest | 207 | 215 | |||||
Asset retirement obligations | 23 | 40 | |||||
Other accrued liabilities | 338 | 392 | |||||
Long-term debt due within one year | 801 | 4 | |||||
Commercial paper | — | 798 | |||||
Total current liabilities | 2,162 | 2,394 | |||||
Long-term debt | 17,123 | 16,326 | |||||
Asset retirement obligations | 819 | 791 | |||||
Deferred income taxes | 126 | 133 | |||||
Regulatory liabilities, deferred income, and other | 1,027 | 993 | |||||
Contingent liabilities (Note 10) | |||||||
Equity: | |||||||
Partners’ equity: | |||||||
Common units (586,695,126 and 362,556,333 units outstanding at March 31, 2015 and December 31, 2014, respectively) | 23,035 | 10,367 | |||||
Class B units (13,948,171 units outstanding at March 31, 2015) | 819 | — | |||||
Class D units (21,574,035 units outstanding at December 31, 2014) | — | 1,011 | |||||
General partner | 2,613 | 9,214 | |||||
Accumulated other comprehensive income (loss) | (85 | ) | 2 | ||||
Total partners’ equity | 26,382 | 20,594 | |||||
Noncontrolling interests in consolidated subsidiaries | 1,645 | 8,091 | |||||
Total equity | 28,027 | 28,685 | |||||
Total liabilities and equity | $ | 49,284 | $ | 49,322 | |||
See accompanying notes.
7
Williams Partners L.P.
Consolidated Statement of Changes in Equity
(Unaudited)
Williams Partners L.P. | |||||||||||||||||||||||||||||||
Limited Partners | |||||||||||||||||||||||||||||||
Common Units | Class B Units | Class D Units | General Partner | Accumulated Other Comprehensive Income (Loss) | Total Partners’ Equity | Noncontrolling Interests | Total Equity | ||||||||||||||||||||||||
(Millions) | |||||||||||||||||||||||||||||||
Balance – December 31, 2014 | $ | 10,367 | $ | — | $ | 1,011 | $ | 9,214 | $ | 2 | $ | 20,594 | $ | 8,091 | $ | 28,685 | |||||||||||||||
Net income (loss) | (104 | ) | (4 | ) | 1 | 196 | — | 89 | 23 | 112 | |||||||||||||||||||||
Other comprehensive income (loss) | — | — | — | — | (87 | ) | (87 | ) | — | (87 | ) | ||||||||||||||||||||
Contributions from The Williams Companies, Inc. – net (Note 1) | 12,254 | 823 | — | (6,573 | ) | — | 6,504 | (6,484 | ) | 20 | |||||||||||||||||||||
Amortization of beneficial conversion feature of Class D units (Note 4) | (68 | ) | — | 68 | — | — | — | — | — | ||||||||||||||||||||||
Conversion of Class D units to common units (Note 4) | 1,080 | — | (1,080 | ) | — | — | — | — | — | ||||||||||||||||||||||
Cash distributions | (499 | ) | — | — | (226 | ) | — | (725 | ) | — | (725 | ) | |||||||||||||||||||
Contributions from general partner | — | — | — | 4 | — | 4 | — | 4 | |||||||||||||||||||||||
Contributions from noncontrolling interests | — | — | — | — | — | — | 25 | 25 | |||||||||||||||||||||||
Distributions to noncontrolling interests | — | — | — | — | — | — | (13 | ) | (13 | ) | |||||||||||||||||||||
Other | 5 | — | — | (2 | ) | — | 3 | 3 | 6 | ||||||||||||||||||||||
Net increase (decrease) in equity | 12,668 | 819 | (1,011 | ) | (6,601 | ) | (87 | ) | 5,788 | (6,446 | ) | (658 | ) | ||||||||||||||||||
Balance – March 31, 2015 | $ | 23,035 | $ | 819 | $ | — | $ | 2,613 | $ | (85 | ) | $ | 26,382 | $ | 1,645 | $ | 28,027 | ||||||||||||||
See accompanying notes.
8
Williams Partners L.P.
Consolidated Statement of Cash Flows
(Unaudited)
Three months ended March 31, | |||||||
2015 | 2014 | ||||||
(Millions) | |||||||
OPERATING ACTIVITIES: | |||||||
Net income | $ | 112 | $ | 352 | |||
Adjustments to reconcile to net cash provided by operations: | |||||||
Depreciation and amortization | 419 | 208 | |||||
Provision (benefit) for deferred income taxes | 3 | 8 | |||||
Amortization of stock-based awards | 8 | — | |||||
Cash provided (used) by changes in current assets and liabilities: | |||||||
Accounts and notes receivable | 208 | (3 | ) | ||||
Inventories | 32 | (27 | ) | ||||
Other current assets and deferred charges | 7 | 19 | |||||
Accounts payable | (74 | ) | (9 | ) | |||
Accrued liabilities | (61 | ) | 18 | ||||
Affiliate accounts receivable and payable – net | 6 | (27 | ) | ||||
Other, including changes in noncurrent assets and liabilities | 37 | 10 | |||||
Net cash provided by operating activities | 697 | 549 | |||||
FINANCING ACTIVITIES: | |||||||
Proceeds from (payments of) commercial paper – net | (799 | ) | (225 | ) | |||
Proceeds from long-term debt | 4,825 | 1,496 | |||||
Payments of long-term debt | (3,223 | ) | — | ||||
Contributions from general partner | 4 | 3 | |||||
Distributions to limited partners and general partner | (725 | ) | (556 | ) | |||
Distributions to noncontrolling interests | (13 | ) | — | ||||
Contributions from noncontrolling interests | 25 | 57 | |||||
Contributions from The Williams Companies, Inc. – net | 20 | 50 | |||||
Payments for debt issuance costs | (27 | ) | (11 | ) | |||
Other – net | (11 | ) | 12 | ||||
Net cash provided by financing activities | 76 | 826 | |||||
INVESTING ACTIVITIES: | |||||||
Property, plant, and equipment: | |||||||
Capital expenditures (1) | (735 | ) | (724 | ) | |||
Net proceeds from dispositions | — | 5 | |||||
Purchase of business from affiliate | — | (25 | ) | ||||
Purchases of and contributions to equity-method investments | (83 | ) | (215 | ) | |||
Other – net | 151 | 9 | |||||
Net cash used by investing activities | (667 | ) | (950 | ) | |||
Increase (decrease) in cash and cash equivalents | 106 | 425 | |||||
Cash and cash equivalents at beginning of year | 171 | 110 | |||||
Cash and cash equivalents at end of period | $ | 277 | $ | 535 | |||
_________ | |||||||
(1) Increases to property, plant, and equipment | $ | (645 | ) | $ | (769 | ) | |
Changes in related accounts payable and accrued liabilities | (90 | ) | 45 | ||||
Capital expenditures | $ | (735 | ) | $ | (724 | ) | |
See accompanying notes.
9
Williams Partners L.P.
Notes to Consolidated Financial Statements
(Unaudited)
Note 1 – General, Description of Business, and Basis of Presentation
General
Our accompanying interim consolidated financial statements do not include all the notes in our annual financial statements and, therefore, should be read in conjunction with the consolidated financial statements and notes thereto in Exhibit 99.1 of our Form 8-K dated February 25, 2015. The accompanying unaudited financial statements include all normal recurring adjustments and others that, in the opinion of management, are necessary to present fairly our interim financial statements.
The preparation of financial statements in conformity with accounting principles generally accepted in the United States requires management to make estimates and assumptions that affect the amounts reported in the consolidated financial statements and accompanying notes. Actual results could differ from those estimates.
Unless the context clearly indicates otherwise, references in this report to “we,” “our,” “us,” or like terms refer to Williams Partners L.P. and its subsidiaries. Unless the context clearly indicates otherwise, references to “we,” “our,” and “us” include the operations in which we own interests accounted for as equity-method investments that are not consolidated in our financial statements. When we refer to our equity investees by name, we are referring exclusively to their businesses and operations.
We are a publicly traded Delaware limited partnership. WPZ GP LLC, a Delaware limited liability company wholly owned by The Williams Companies, Inc. (Williams), serves as our general partner. As of March 31, 2015, Williams owns an approximate 58 percent limited partner interest, a 2 percent general partner interest, and incentive distribution rights (IDRs) in us.
Merger
Pursuant to an Agreement and Plan of Merger dated as of October 24, 2014, the general partners of Williams Partners L.P. and Access Midstream Partners, L.P. agreed to combine those businesses and their general partners, with Williams Partners L.P. merging with and into Access Midstream Partners, L.P. and the Access Midstream Partners, L.P. general partner being the surviving general partner (the Merger). Following the completion of the Merger on February 2, 2015, as further described below, the surviving Access Midstream Partners, L.P. changed its name to Williams Partners L.P. and the name of its general partner was changed to WPZ GP LLC. For the purpose of this report, Williams Partners L.P. (WPZ) refers to the renamed merged partnership, while Pre-merger Access Midstream Partners, L.P. (ACMP) and Pre-merger Williams Partners L.P. (Pre-merger WPZ) refer to the separate partnerships prior to the consummation of the Merger and subsequent name change.
In accordance with the terms of the Merger, each ACMP unitholder received 1.06152 ACMP units for each ACMP unit owned immediately prior to the Merger. Following this pre-merger split ACMP had 202,564,354 common units and 13,725,843 Class B units outstanding. In conjunction with the Merger, each Pre-merger WPZ common unit held by the public was exchanged for 0.86672 common units of ACMP. Each Pre-merger WPZ common unit held by Williams was exchanged for 0.80036 common units of ACMP. Prior to the closing of the Merger, the Class D limited partner units of Pre-merger WPZ, all of which were held by Williams, were converted into Pre-merger WPZ common units on a one-for-one basis pursuant to the terms of the partnership agreement of Pre-merger WPZ. All of the general partner interests of Pre-merger WPZ were converted into general partner interests of ACMP such that the general partner interest of ACMP represents 2 percent of the outstanding partnership interest.
10
Notes (Continued)
Description of Business
Our operations are located in North America and are organized into the following reportable segments: Access Midstream, Northeast G&P, Atlantic-Gulf, West, and NGL & Petchem Services.
Access Midstream provides domestic gathering, treating, and compression services to producers under long-term, fixed-fee contracts. Its primary operating areas are in the Barnett Shale region of north-central Texas, the Eagle Ford Shale region of south Texas, the Haynesville Shale region of northwest Louisiana, the Marcellus Shale region primarily in Pennsylvania and West Virginia, the Utica Shale region of eastern Ohio, and the Mid-Continent region which includes the Anadarko, Arkoma, Delaware, and Permian basins. Access Midstream also includes a 49 percent equity-method investment in Utica East Ohio Midstream, LLC (UEOM), a 50 percent equity-method investment interest in the Delaware basin gas gathering system in the Mid-Continent region, and Appalachia Midstream Services, LLC, which owns an approximate average 45 percent equity-method investment interest in 11 gas gathering systems in the Marcellus Shale (Appalachia Midstream Investments). Subsequent to March 31, 2015, WPZ announced an agreement to acquire additional equity interest in UEOM. Refer to Note 12 – Subsequent Events for further information.
Northeast G&P is comprised of our midstream gathering and processing businesses in the Marcellus and Utica shale regions, as well as a 69 percent equity-method investment in Laurel Mountain Midstream, LLC (Laurel Mountain) and a 58 percent equity-method investment in Caiman Energy II, LLC (Caiman II).
Atlantic-Gulf is comprised of our interstate natural gas pipeline, Transcontinental Gas Pipe Line Company, LLC (Transco), and significant natural gas gathering and processing and crude oil production handling and transportation in the Gulf Coast region, as well as a 50 percent equity-method investment in Gulfstream Natural Gas System, L.L.C. (Gulfstream), a 41 percent interest in Constitution Pipeline Company, LLC (Constitution) (a consolidated entity), and a 60 percent equity-method investment in Discovery Producer Services LLC (Discovery).
West is comprised of our gathering, processing and treating operations in New Mexico, Colorado, and Wyoming and our interstate natural gas pipeline, Northwest Pipeline LLC (Northwest Pipeline). Effective during the first quarter of 2015, the operations of the Niobrara Shale region that were formerly within the Access Midstream segment were transferred into the West reportable segment. The prior period amounts and disclosures included herein have been recast for this change.
NGL & Petchem Services is comprised of our 88.5 percent undivided interest in an olefins production facility in Geismar, Louisiana, along with a refinery grade propylene splitter and pipelines in the Gulf Coast region, an oil sands offgas processing plant located near Fort McMurray, Alberta, and a natural gas liquid (NGL)/olefin fractionation facility and butylene/butane splitter facility at Redwater, Alberta. This segment also includes our NGL and natural gas marketing business, storage facilities and an undivided 50 percent interest in an NGL fractionator near Conway, Kansas, and a 50 percent equity-method investment in Overland Pass Pipeline, LLC (OPPL).
Basis of Presentation
Prior to the Merger, Williams owned certain limited partnership interests in both Pre-merger WPZ and ACMP, as well as 100 percent of the general partners of both partnerships. Due to the ownership of the general partners, Williams controlled both partnerships. Williams’ control of Pre-merger WPZ began with its inception in 2005, while control of ACMP was achieved upon obtaining an additional 50 percent interest in its general partner effective July 1, 2014. Williams previously acquired 50 percent of the ACMP general partner in a separate transaction in 2012.
The Merger has been accounted for as a combination between entities under common control, with Pre-merger WPZ representing the predecessor entity. As such, the accompanying financial statements represent a continuation of Pre-merger WPZ, the accounting acquirer, except for certain adjustments to give effect to the exchange ratio applied to Pre-merger WPZ’s historically outstanding units. Because the Merger was between entities under common control, it was treated similar to a pooling of interests whereby the historical results of operations for ACMP were combined with those of Pre-merger WPZ for periods under common control (periods subsequent to July 1, 2014) and the net assets of ACMP are combined at Williams’ historical basis. (See Note 2 – Acquisition.)
11
Notes (Continued)
Prior period amounts and disclosures have been recast for the Merger. Previously presented limited partner units of Pre-merger WPZ have been adjusted to reflect the exchange ratios above, which has resulted in an increase to earnings per unit at March 31, 2014 of $.08 per common unit. Net income for the first quarter of 2014 has not been affected by the recast of the financial statements as Williams’ control of ACMP was achieved upon obtaining an additional 50 percent interest in its general partner effective July 1, 2014. In conjunction with the Merger, the partners’ equity interests in ACMP have been reclassified out of the capital account of the general partner for interests owned by Williams and noncontrolling interests for interests held by the public and into the capital accounts of common and Class B interests as a Contribution from the Williams Companies, Inc. - net within the Consolidated Statement of Changes in Equity.
Accumulated other comprehensive income (loss)
Accumulated other comprehensive income (loss) (AOCI) is substantially comprised of foreign currency translation adjustments. These adjustments did not impact Net income in any of the periods presented.
Accounting standards issued but not yet adopted
In February 2015, the Financial Accounting Standards Board (FASB) issued Accounting Standards Update (ASU) 2015-2 “Amendments to the Consolidation Analysis” (ASU 2015-2). ASU 2015-2 alters the models used to determine consolidation conclusions for certain entities, including limited partnerships, and may require additional disclosures. The ASU is effective for financial statements issued for reporting periods beginning after December 15, 2015 and interim periods within the reporting periods with either retrospective or modified retrospective presentation allowed. We will adopt the standard in the first quarter of 2016. We are currently evaluating the impact of the new standard on our consolidated financial statements.
In April 2015, the FASB issued ASU 2015-3 “Interest - Imputation of Interest: Simplifying the Presentation of Debt Issuance Costs” (ASU 2015-3). ASU 2015-3 simplifies the presentation of debt issuance costs by requiring such costs be presented as a deduction from the corresponding debt liability. The guidance is effective for financial statements issued for reporting periods beginning after December 15, 2015 and interim periods within the reporting periods and requires retrospective presentation. We will adopt the standard in the first quarter of 2016. We are evaluating the impact of the new standard.
In May 2014, the FASB issued ASU 2014-09 establishing Accounting Standards Codification Topic 606, “Revenue from Contracts with Customers” (ASC 606). ASC 606 establishes a comprehensive new revenue recognition model designed to depict the transfer of goods or services to a customer in an amount that reflects the consideration the entity expects to be entitled to receive in exchange for those goods or services and requires significantly enhanced revenue disclosures. The standard is effective for annual reporting periods beginning after December 15, 2016, and interim periods within the reporting period. The FASB has recently proposed delaying the effective date of ASC 606 to annual and interim periods beginning after December 15, 2017. Accordingly, if the FASB chooses to delay the effective date to December 15, 2017, we would plan to adopt this standard in the first quarter of 2018. ASC 606 allows either full retrospective or modified retrospective transition and early adoption is not permitted. We continue to evaluate both the impact of this new standard on our consolidated financial statements and the transition method we will utilize for adoption.
Note 2 – Acquisition
ACMP
As previously discussed in Note 1 – General, Description of Business, and Basis of Presentation, the net assets of Pre-merger WPZ and ACMP have been combined at Williams’ historical basis. Williams’ basis in ACMP reflects its business combination accounting resulting from acquiring control of ACMP on July 1, 2014 (ACMP Acquisition), which, among other things, requires identifiable assets acquired and liabilities assumed to be measured at their acquisition-date fair values.
12
Notes (Continued)
The following table presents the allocation of the acquisition-date fair value of the major classes of the assets acquired, which are presented in the Access Midstream segment, liabilities assumed, noncontrolling interest, and equity at July 1, 2014. Changes since the preliminary allocation disclosed in the Form 8-K filed on February 25, 2015, reflect an increase of $150 million in property, plant, and equipment – net and $25 million in goodwill, and a decrease of $168 million in other intangible assets and $7 million in investments. These adjustments during the measurement period were not considered significant to require retrospective revisions of our financial statements.
(Millions) | |||
Accounts receivable | $ | 168 | |
Other current assets | 63 | ||
Investments | 5,865 | ||
Property, plant, and equipment – net | 7,165 | ||
Goodwill | 499 | ||
Other intangible assets | 8,841 | ||
Current liabilities | (408 | ) | |
Debt | (4,052 | ) | |
Other noncurrent liabilities | (9 | ) | |
Noncontrolling interest in ACMP’s subsidiaries | (958 | ) | |
Noncontrolling interest representing ACMP public unitholders | (6,544 | ) | |
Equity | (10,630 | ) | |
Note 3 – Variable Interest Entities
As of March 31, 2015, we consolidate the following variable interest entities (VIEs):
Gulfstar One
We own a 51 percent interest in Gulfstar One LLC (Gulfstar One), a subsidiary that, due to certain risk-sharing provisions in its customer contracts, is a VIE. We are the primary beneficiary because we have the power to direct the activities that most significantly impact Gulfstar One’s economic performance. We, as construction agent for Gulfstar One, designed, constructed, and installed a proprietary floating-production system, Gulfstar FPS™, and associated pipelines which began providing production handling and gathering services for the Tubular Bells oil and gas discovery in the eastern deepwater Gulf of Mexico in the fourth quarter of 2014. We received certain advance payments from the producer customers. In certain circumstances, the producer customers could be responsible for Gulfstar One’s unrecovered portion of the firm price of building the facilities if the production handling agreement is terminated. Construction of an expansion project is underway that will provide production handling and gathering services for the Gunflint oil and gas discovery in the eastern deepwater Gulf of Mexico. The expansion project is expected to be in service in the first quarter of 2016. The current estimate of the total remaining construction costs for the expansion project is approximately $116 million, which we expect will be funded with revenues received from customers and capital contributions from us and the other equity partner on a proportional basis.
Constitution
We own a 41 percent interest in Constitution, a subsidiary that, due to shipper fixed-payment commitments under its long-term firm transportation contracts, is a VIE. We are the primary beneficiary because we have the power to direct the activities that most significantly impact Constitution’s economic performance. We, as construction agent for Constitution, are building a pipeline connecting our gathering system in Susquehanna County, Pennsylvania, to the Iroquois Gas Transmission and the Tennessee Gas Pipeline systems. We plan to place the project in service in the second half of 2016 and estimate the total remaining construction costs of the project to be approximately $604 million, which we expect will be funded with capital contributions from us and the other equity partners on a proportional basis.
Cardinal
We own a 66 percent interest in Cardinal Gas Services, L.L.C (Cardinal), a subsidiary that, due to certain risks shared with customers, is a VIE. We are the primary beneficiary because we have the power to direct the activities that most significantly impact Cardinal’s economic performance. We, as operator for Cardinal, designed, constructed, and
13
Notes (Continued)
installed associated pipelines which provide production handling and gathering services for the Utica region. We received certain advance payments from the equity partners during the construction process and we expect to fund future construction activity with capital contributions from us and the other equity partners on a proportional basis.
Jackalope
We own a 50 percent interest in Jackalope Gas Gathering Services, L.L.C (Jackalope), a subsidiary that, due to certain risks shared with customers, is a VIE. We are the primary beneficiary because we have the power to direct the activities that most significantly impact Jackalope’s economic performance. We, as operator for Jackalope, designed, constructed, and installed associated pipelines which provide production handling and gathering services for the Niobrara region. Although still under construction, parts of Jackalope are operating and made limited contributions to operations in 2014 and the first quarter of 2015. We have received certain advance payments from the equity partner during the construction process and we expect to fund future construction activity with capital contributions from us and the other equity partner on a proportional basis.
The following table presents amounts included in our Consolidated Balance Sheet that are for the use or obligation of our consolidated VIEs:
March 31, 2015 | December 31, 2014 | Classification | |||||||
(Millions) | |||||||||
Assets (liabilities): | |||||||||
Cash and cash equivalents | $ | 58 | $ | 113 | Cash and cash equivalents | ||||
Accounts receivable | 71 | 52 | Trade accounts and notes receivable – net | ||||||
Other current assets | 3 | 3 | Other current assets | ||||||
Property, plant, and equipment - net | 2,877 | 2,794 | Property, plant, and equipment – net | ||||||
Goodwill | 107 | 103 | Goodwill | ||||||
Other intangible assets, net | 1,474 | 1,493 | Other intangible assets - net of accumulated amortization | ||||||
Other noncurrent assets | 3 | 14 | Regulatory assets, deferred charges, and other | ||||||
Accounts payable | (40 | ) | (48 | ) | Accounts payable - trade | ||||
Accrued liabilities | (36 | ) | (36 | ) | Other accrued liabilities | ||||
Current deferred revenue | (45 | ) | (45 | ) | Other accrued liabilities | ||||
Noncurrent deferred income taxes | — | (13 | ) | Deferred income taxes | |||||
Asset retirement obligation | (94 | ) | (94 | ) | Asset retirement obligations, noncurrent | ||||
Noncurrent deferred revenue associated with customer advance payments | (389 | ) | (395 | ) | Regulatory liabilities, deferred income, and other | ||||
14
Notes (Continued)
Note 4 – Allocation of Net Income and Distributions
The allocation of net income among our general partner, limited partners, and noncontrolling interests is as follows:
Three months ended March 31, | |||||||
2015 | 2014 | ||||||
(Millions) | |||||||
Allocation of net income to general partner: | |||||||
Net income | $ | 112 | $ | 352 | |||
Net income applicable to pre-merger operations allocated to general partner | (2 | ) | — | ||||
Net income applicable to pre-partnership operations allocated to general partner | — | (15 | ) | ||||
Net income applicable to noncontrolling interests | (23 | ) | — | ||||
Costs charged directly to the general partner | 20 | — | |||||
Income subject to 2% allocation of general partner interest | 107 | 337 | |||||
General partner’s share of net income | 2 | % | 2 | % | |||
General partner’s allocated share of net income before items directly allocable to general partner interest | 2 | 7 | |||||
Priority allocations, including incentive distributions, paid to general partner | 212 | 153 | |||||
Pre-merger net income allocated to general partner interest | 2 | — | |||||
Pre-partnership net income allocated to general partner interest | — | 15 | |||||
Costs charged directly to the general partner | (20 | ) | — | ||||
Net income allocated to general partner’s equity | $ | 196 | $ | 175 | |||
Net income | $ | 112 | $ | 352 | |||
Net income allocated to general partner’s equity | 196 | 175 | |||||
Net income (loss) allocated to Class B limited partners’ equity | (4 | ) | — | ||||
Net income allocated to Class D limited partners’ equity (1) | 69 | 4 | |||||
Net income allocated to noncontrolling interests | 23 | — | |||||
Net income (loss) allocated to common limited partners’ equity | $ | (172 | ) | $ | 173 | ||
Adjustments to reconcile Net income (loss) allocated to common limited partners’ equity | |||||||
to Allocation of net income (loss) to common units: | |||||||
Incentive distributions paid | 212 | 153 | |||||
Incentive distributions declared (2) | (212 | ) | (158 | ) | |||
Impact of unit issuance timing | — | (10 | ) | ||||
Allocation of net income (loss) to common units | $ | (172 | ) | $ | 158 | ||
(1) | The net income allocated to Pre-merger WPZ Class D limited partners includes $68 million and $5 million for the three months ended March 31, 2015 and 2014, respectively, related to the amortization of the beneficial conversion feature associated with the Pre-merger WPZ Class D units. See following discussion of Class D units. |
(2) | The Board of Directors of our general partner declared a cash distribution of $0.85 per common unit on April 20, 2015, to be paid on May 14, 2015, to unitholders of record at the close of business on May 7, 2015. |
Class B Units
The Class B units originated under ACMP and are not entitled to cash distributions. Instead, prior to conversion into common units, the Class B units receive quarterly distributions of additional paid-in-kind Class B units. Effective February 10, 2015, each Class B unit became convertible at the election of either us or the holders of such Class B unit into a common unit on a one-for-one basis.
15
Notes (Continued)
Class D Units
Our Pre-merger WPZ Class D units issued in February 2014 in conjunction with our acquisition of certain Canadian operations were issued at a discount to the market price of Pre-merger WPZ’s common units, into which they were convertible. The discount represented a beneficial conversion feature and is reflected as an increase in the common unit capital account and a decrease in the Class D capital account on the Consolidated Statement of Changes in Equity. This discount was being amortized through the originally expected first quarter 2016 conversion date, resulting in an increase to the Class D capital account and a decrease to the common unit capital account. The remaining unamortized balance was recognized in the first quarter of 2015 due to the Merger. All Pre-merger WPZ Class D units were converted into common units in conjunction with the Merger.
Distributions
The Pre-merger WPZ Class D units were not entitled to cash distributions. Instead, prior to conversion into Pre-merger WPZ common units, the Pre-merger WPZ Class D units received quarterly distributions of additional paid-in-kind Pre-merger WPZ Class D units.
Earnings per unit
Basic and diluted earnings per limited partner unit are calculated using the two-class method.
Note 5 – Other Income and Expenses
Geismar Incident
On June 13, 2013, an explosion and fire occurred at our Geismar olefins plant. The incident (Geismar Incident) rendered the facility temporarily inoperable and resulted in significant human, financial, and operational effects.
At the time of the incident, we had insurance coverage for repair and replacement costs, lost production, and additional expenses related to the incident as follows:
• | Property damage and business interruption coverage with a combined per-occurrence limit of $500 million and retentions (deductibles) of $10 million per occurrence for property damage and a waiting period of 60 days per occurrence for business interruption; |
• | General liability coverage with per-occurrence and aggregate annual limits of $610 million and retentions (deductibles) of $2 million per occurrence; |
• | Workers’ compensation coverage with statutory limits and retentions (deductibles) of $1 million total per occurrence. |
During the first quarter of 2014, we received $125 million of insurance recoveries related to the Geismar Incident and incurred $6 million of related covered insurable expenses in excess of our retentions (deductibles). These amounts are reported within our NGL & Petchem Services segment and reflected as a net gain in Net insurance recoveries – Geismar Incident in our Consolidated Statement of Comprehensive Income.
Since June 2013, we have settled claims associated with $480 million of available property damage and business interruption coverage for a total of $422 million. This total includes $126 million expected to be received during the second quarter of 2015. The remaining insurance limits total approximately $20 million and we are vigorously pursuing collection.
Additional Items
Selling, general, and administrative expenses in 2015 includes $25 million of professional advisory fees associated with the Merger and $4 million of related employee transition costs reported primarily within the Access Midstream
16
Notes (Continued)
segment. Operating and maintenance expenses in 2015 also includes $4 million of related employee transition costs reported within the Access Midstream segment.
Other income (expense) – net below Operating income includes $17 million and $3 million for allowance for equity funds used during construction (AFUDC) reported within the Atlantic-Gulf segment for the three months ended March 31, 2015 and 2014, respectively. AFUDC increased during 2015 due to the increase in spending on various Transco expansion projects and Constitution.
Note 6 – Provision (Benefit) for Income Taxes
The Provision (benefit) for income taxes includes:
Three months ended March 31, | |||||||
2015 | 2014 | ||||||
(Millions) | |||||||
Deferred: | |||||||
State | $ | 1 | $ | 1 | |||
Foreign | 2 | 7 | |||||
3 | 8 | ||||||
Total provision (benefit) | $ | 3 | $ | 8 | |||
The effective income tax rates for the total provision for the three months ended March 31, 2015 and 2014, are less than the federal statutory rate due to income not subject to U.S. federal tax, partially offset by taxes on foreign operations and the effect of Texas franchise tax.
Note 7 – Inventories
March 31, 2015 | December 31, 2014 | ||||||
(Millions) | |||||||
Natural gas liquids, olefins, and natural gas in underground storage | $ | 122 | $ | 150 | |||
Materials, supplies, and other | 78 | 81 | |||||
$ | 200 | $ | 231 | ||||
Note 8 – Debt and Banking Arrangements
Long-Term Debt
Issuances and retirements
On April 15, 2015, we paid $783 million, including a redemption premium, to early retire $750 million of 5.875 percent senior notes due 2021. At March 31, 2015, we classified the $798 million carrying value of these notes in Long-term debt due within one year in the Consolidated Balance Sheet.
On March 3, 2015, we completed a public offering of $1.25 billion of 3.6 percent senior unsecured notes due 2022, $750 million of 4 percent senior unsecured notes due 2025, and $1 billion of 5.1 percent senior unsecured notes due 2045. We used the net proceeds to repay amounts outstanding under our commercial paper program and credit facility, to fund capital expenditures, and for general partnership purposes.
We retired $750 million of 3.8 percent senior unsecured notes that matured on February 15, 2015.
17
Notes (Continued)
Commercial Paper Program
As of April 29, 2015, we had $521 million of Commercial paper outstanding under our $3 billion commercial paper program.
Credit Facilities
On February 2, 2015, the credit facilities for Pre-merger WPZ and ACMP were terminated in connection with the Merger. Simultaneously, we also entered into a new $3.5 billion credit facility.
March 31, 2015 | |||||||
Stated Capacity | Outstanding | ||||||
(Millions) | |||||||
Loans | $ | 3,500 | $ | — | |||
Swingline loans sublimit | 150 | — | |||||
Letters of credit sublimit | 1,125 | 2 | |||||
Letters of credit under certain bilateral bank agreements | 3 | ||||||
On February 3, 2015, we entered into a short-term $1.5 billion credit facility. In accordance with its terms, this facility terminated on March 3, 2015, upon the completion of the previously described debt offering. We did not borrow under this credit facility.
18
Notes (Continued)
Note 9 – Fair Value Measurements and Guarantees
The following table presents, by level within the fair value hierarchy, certain of our financial assets and liabilities. The carrying values of cash and cash equivalents, accounts receivable, commercial paper, and accounts payable approximate fair value because of the short-term nature of these instruments. Therefore, these assets and liabilities are not presented in the following table.
Fair Value Measurements Using | |||||||||||||||||||
Carrying Amount | Fair Value | Quoted Prices In Active Markets for Identical Assets (Level 1) | Significant Other Observable Inputs (Level 2) | Significant Unobservable Inputs (Level 3) | |||||||||||||||
(Millions) | |||||||||||||||||||
Assets (liabilities) at March 31, 2015: | |||||||||||||||||||
Measured on a recurring basis: | |||||||||||||||||||
ARO Trust investments | $ | 60 | $ | 60 | $ | 60 | $ | — | $ | — | |||||||||
Energy derivatives assets not designated as hedging instruments | 2 | 2 | — | — | 2 | ||||||||||||||
Energy derivatives liabilities not designated as hedging instruments | (2 | ) | (2 | ) | — | — | (2 | ) | |||||||||||
Additional disclosures: | |||||||||||||||||||
Notes receivable and other | 5 | 5 | 1 | 4 | — | ||||||||||||||
Long-term debt, including current portion (1) | (17,920 | ) | (18,318 | ) | — | (18,318 | ) | — | |||||||||||
Assets (liabilities) at December 31, 2014: | |||||||||||||||||||
Measured on a recurring basis: | |||||||||||||||||||
ARO Trust investments | $ | 48 | $ | 48 | $ | 48 | $ | — | $ | — | |||||||||
Energy derivatives assets not designated as hedging instruments | 3 | 3 | 1 | — | 2 | ||||||||||||||
Energy derivatives liabilities not designated as hedging instruments | (2 | ) | (2 | ) | — | — | (2 | ) | |||||||||||
Additional disclosures: | |||||||||||||||||||
Notes receivable and other | 5 | 4 | — | 4 | — | ||||||||||||||
Long-term debt, including current portion (1) | (16,325 | ) | (16,607 | ) | — | (16,607 | ) | — | |||||||||||
(1) Excludes capital leases
Fair Value Methods
We use the following methods and assumptions in estimating the fair value of our financial instruments:
Assets and liabilities measured at fair value on a recurring basis
ARO Trust investments: Transco deposits a portion of its collected rates, pursuant to its rate case settlement, into an external trust (ARO Trust) that is specifically designated to fund future asset retirement obligations (ARO). The ARO Trust invests in a portfolio of actively traded mutual funds that are measured at fair value on a recurring basis based on quoted prices in an active market, is classified as available-for-sale, and is reported in Regulatory assets, deferred charges, and other in the Consolidated Balance Sheet. Both realized and unrealized gains and losses are ultimately recorded as regulatory assets or liabilities.
Energy derivatives: Energy derivatives include commodity based exchange-traded contracts and over-the-counter (OTC) contracts, which consist of physical forwards, futures, and swaps that are measured at fair value on a recurring basis. The fair value amounts are presented on a gross basis and do not reflect the netting of asset and liability positions permitted under the terms of our master netting arrangements. Further, the amounts do not include cash held on deposit
19
Notes (Continued)
in margin accounts that we have received or remitted to collateralize certain derivative positions. Energy derivatives assets are reported in Other current assets and Regulatory assets, deferred charges, and other in the Consolidated Balance Sheet. Energy derivatives liabilities are reported in Other accrued liabilities and Regulatory liabilities, deferred income, and other in the Consolidated Balance Sheet.
Reclassifications of fair value between Level 1, Level 2, and Level 3 of the fair value hierarchy, if applicable, are made at the end of each quarter. No transfers between Level 1 and Level 2 occurred during the three months ended March 31, 2015 or 2014.
Additional fair value disclosures
Notes receivable and other: The disclosed fair value of our notes receivable is primarily determined by an income approach which considers the underlying contract amounts and our assessment of our ability to recover these amounts. The current portion is reported in Trade accounts and notes receivable, net and the noncurrent portion is reported in Regulatory assets, deferred charges, and other in the Consolidated Balance Sheet.
Long-term debt: The disclosed fair value of our long-term debt is determined by a market approach using broker quoted indicative period-end bond prices. The quoted prices are based on observable transactions in less active markets for our debt or similar instruments.
Guarantees
We are required by our revolving credit agreements to indemnify lenders for certain taxes required to be withheld from payments due to the lenders and for certain tax payments made by the lenders. The maximum potential amount of future payments under these indemnifications is based on the related borrowings and such future payments cannot currently be determined. These indemnifications generally continue indefinitely unless limited by the underlying tax regulations and have no carrying value. We have never been called upon to perform under these indemnifications and have no current expectation of a future claim.
Note 10 – Contingent Liabilities
Environmental Matters
We are a participant in certain environmental activities in various stages including assessment studies, cleanup operations and remedial processes at certain sites, some of which we currently do not own. We are monitoring these sites in a coordinated effort with other potentially responsible parties, the U.S. Environmental Protection Agency (EPA), and other governmental authorities. We are jointly and severally liable along with unrelated third parties in some of these activities and solely responsible in others. Certain of our subsidiaries have been identified as potentially responsible parties at various Superfund and state waste disposal sites. In addition, these subsidiaries have incurred, or are alleged to have incurred, various other hazardous materials removal or remediation obligations under environmental laws. As of March 31, 2015, we have accrued liabilities totaling $18 million for these matters, as discussed below. Our accrual reflects the most likely costs of cleanup, which are generally based on completed assessment studies, preliminary results of studies or our experience with other similar cleanup operations. Certain assessment studies are still in process for which the ultimate outcome may yield significantly different estimates of most likely costs. Any incremental amount in excess of amounts currently accrued cannot be reasonably estimated at this time due to uncertainty about the actual number of contaminated sites ultimately identified, the actual amount and extent of contamination discovered and the final cleanup standards mandated by the EPA and other governmental authorities.
The EPA and various state regulatory agencies routinely promulgate and propose new rules, and issue updated guidance to existing rules. More recent rules and rulemakings include, but are not limited to, rules for reciprocating internal combustion engine maximum achievable control technology, new air quality standards for ground level ozone, one hour nitrogen dioxide emission limits, and new air quality standards impacting storage vessels, pressure valves, and compressors. We are unable to estimate the costs of asset additions or modifications necessary to comply with these new regulations due to uncertainty created by the various legal challenges to these regulations and the need for further specific regulatory guidance.
20
Notes (Continued)
Our interstate gas pipelines are involved in remediation activities related to certain facilities and locations for polychlorinated biphenyls, mercury, and other hazardous substances. These activities have involved the EPA and various state environmental authorities, resulting in our identification as a potentially responsible party at various Superfund waste sites. At March 31, 2015, we have accrued liabilities of $10 million for these costs. We expect that these costs will be recoverable through rates.
We also accrue environmental remediation costs for natural gas underground storage facilities, primarily related to soil and groundwater contamination. At March 31, 2015, we have accrued liabilities totaling $8 million for these costs.
Geismar Incident
As a result of the previously discussed Geismar Incident, there were two fatalities and numerous individuals (including employees and contractors) reported injuries, which varied from minor to serious. We are addressing the following matters in connection with the Geismar Incident.
On October 21, 2013, the EPA issued an Inspection Report pursuant to the Clean Air Act’s Risk Management Program following its inspection of the facility on June 24 through 28, 2013. The report notes the EPA’s preliminary determinations about the facility’s documentation regarding process safety, process hazard analysis, as well as operating procedures, employee training, and other matters. On June 16, 2014, we received a request for information related to the Geismar Incident from the EPA under Section 114 of the Clean Air Act to which we responded on August 13, 2014. The EPA could issue penalties pertaining to final determinations.
Multiple lawsuits, including class actions for alleged offsite impacts, property damage, customer claims, and personal injury, have been filed against us. The first trial for certain plaintiffs claiming approximately $45 million in personal injury damages is set to begin on June 15, 2015 in Iberville Parish, Louisiana. For these and all other unsettled lawsuits, in the event of an adverse ruling, we intend to appeal and we expect any ultimate losses to be covered by our general liability insurance policy, which has an aggregate annual limit of $610 million and retention (deductible) of $2 million per occurrence. For these matters, we believe it is reasonably possible that losses will be incurred. However, due to ongoing litigation concerning defenses to liability, the number of individual plaintiffs, limited information as to the nature and extent of all plaintiffs’ damages, and the ultimate outcome of all appeals, we are unable to reliably estimate a range of reasonably possible loss at this time. We believe that it is probable that any ultimate losses incurred will be covered by insurance.
Royalty Matters
Certain of our customers, including one major customer, have been named in various lawsuits alleging underpayment of royalties. In certain of these cases, we have also been named as a defendant based on allegations that we improperly participated with that major customer in causing the alleged royalty underpayments. We have also received subpoenas from the United States Department of Justice and the Pennsylvania Attorney General requesting documents relating to the agreements between us and our major customer and calculations of the major customer’s royalty payments. We believe that the claims asserted to date are subject to indemnity obligations owed to us by that major customer. Due to the preliminary status of the cases, we are unable to estimate a range of liability at this time.
Other
In addition to the foregoing, various other proceedings are pending against us which are incidental to our operations.
Summary
We have disclosed all significant matters for which we are unable to reasonably estimate a range of possible loss. We estimate that for all other matters for which we are able to reasonably estimate a range of loss, our aggregate reasonably possible losses beyond amounts accrued are immaterial to our expected future annual results of operations, liquidity and financial position. These calculations have been made without consideration of any potential recovery from third parties.
21
Notes (Continued)
Note 11 – Segment Disclosures
Our reportable segments are Access Midstream, Northeast G&P, Atlantic-Gulf, West, and NGL & Petchem Services. (See Note 1 – General, Description of Business, and Basis of Presentation.)
Performance Measurement
Prior to the first quarter of 2015, we evaluated segment operating performance based upon Segment profit (loss) from operations. Beginning in the first quarter of 2015, we evaluate segment operating performance based upon Modified EBITDA (earnings before interest, taxes, depreciation, and amortization). This measure represents the basis of our internal financial reporting and is the primary performance measure used by our chief operating decision maker in measuring performance and allocating resources among our reportable segments. Prior period segment disclosures have been recast to reflect this change.
We define Modified EBITDA as follows:
• | Net income before: |
◦ | Provision (benefit) for income taxes; |
◦ | Interest incurred, net of interest capitalized; |
◦ | Equity earnings (losses); |
◦ | Other investing income (loss) – net; |
◦ | Depreciation and amortization expenses; |
◦ | Accretion expense associated with asset retirement obligations for nonregulated operations. |
• | This measure is further adjusted to include our proportionate share (based on ownership interest) of Modified EBITDA from our equity-method investments calculated consistent with the definition described above. |
The following table reflects the reconciliation of Segment revenues to Total revenues as reported in the Consolidated Statement of Comprehensive Income.
Access Midstream | Northeast G&P | Atlantic- Gulf | West | NGL & Petchem Services | Eliminations | Total | |||||||||||||||||||||
(Millions) | |||||||||||||||||||||||||||
Three months ended March 31, 2015 | |||||||||||||||||||||||||||
Segment revenues: | |||||||||||||||||||||||||||
Service revenues | |||||||||||||||||||||||||||
External | $ | 299 | $ | 142 | $ | 457 | $ | 262 | $ | 32 | $ | — | $ | 1,192 | |||||||||||||
Internal | — | — | 1 | — | — | (1 | ) | — | |||||||||||||||||||
Total service revenues | 299 | 142 | 458 | 262 | 32 | (1 | ) | 1,192 | |||||||||||||||||||
Product sales | |||||||||||||||||||||||||||
External | — | 37 | 68 | 8 | 406 | — | 519 | ||||||||||||||||||||
Internal | — | 1 | 53 | 56 | 37 | (147 | ) | — | |||||||||||||||||||
Total product sales | — | 38 | 121 | 64 | 443 | (147 | ) | 519 | |||||||||||||||||||
Total revenues | $ | 299 | $ | 180 | $ | 579 | $ | 326 | $ | 475 | $ | (148 | ) | $ | 1,711 | ||||||||||||
Three months ended March 31, 2014 | |||||||||||||||||||||||||||
Segment revenues: | |||||||||||||||||||||||||||
Service revenues | |||||||||||||||||||||||||||
External | $ | — | $ | 99 | $ | 378 | $ | 256 | $ | 30 | $ | — | $ | 763 | |||||||||||||
Internal | — | — | 1 | — | — | (1 | ) | — | |||||||||||||||||||
Total service revenues | — | 99 | 379 | 256 | 30 | (1 | ) | 763 | |||||||||||||||||||
Product sales | |||||||||||||||||||||||||||
External | — | 60 | 152 | 19 | 699 | — | 930 | ||||||||||||||||||||
Internal | — | — | 69 | 126 | 76 | (271 | ) | — | |||||||||||||||||||
Total product sales | — | 60 | 221 | 145 | 775 | (271 | ) | 930 | |||||||||||||||||||
Total revenues | $ | — | $ | 159 | $ | 600 | $ | 401 | $ | 805 | $ | (272 | ) | $ | 1,693 | ||||||||||||
22
Notes (Continued)
The following table reflects the reconciliation of Modified EBITDA to Net income as reported in the Consolidated Statement of Comprehensive Income.
Three months ended March 31, | |||||||||||||
2015 | 2014 | ||||||||||||
(Millions) | |||||||||||||
Modified EBITDA by segment: | |||||||||||||
Access Midstream | $ | 228 | $ | — | |||||||||
Northeast G&P | 90 | 48 | |||||||||||
Atlantic-Gulf | 335 | 266 | |||||||||||
West | 161 | 212 | |||||||||||
NGL & Petchem Services | 6 | 182 | |||||||||||
Other | (3 | ) | — | ||||||||||
817 | 708 | ||||||||||||
Accretion expense associated with asset retirement obligations for nonregulated operations | (7 | ) | (3 | ) | |||||||||
Depreciation and amortization expenses | (419 | ) | (208 | ) | |||||||||
Equity earnings (losses) | 51 | 23 | |||||||||||
Other investing income (loss) – net | 1 | — | |||||||||||
Proportional Modified EBITDA of equity-method investments | (136 | ) | (54 | ) | |||||||||
Interest expense | (192 | ) | (106 | ) | |||||||||
(Provision) benefit for income taxes | (3 | ) | (8 | ) | |||||||||
Net income | $ | 112 | $ | 352 | |||||||||
The following table reflects Total assets by reportable segment.
Total Assets | |||||||
March 31, 2015 | December 31, 2014 | ||||||
(Millions) | |||||||
Access Midstream | $ | 22,550 | $ | 22,470 | |||
Northeast G&P | 7,350 | 7,314 | |||||
Atlantic-Gulf | 11,279 | 11,124 | |||||
West | 5,203 | 5,176 | |||||
NGL & Petchem Services | 3,383 | 3,510 | |||||
Other corporate assets | 367 | 563 | |||||
Eliminations (1) | (848 | ) | (835 | ) | |||
Total | $ | 49,284 | $ | 49,322 | |||
(1) | Eliminations primarily relate to the intercompany accounts receivable generated by our cash management program. |
Note 12 – Subsequent Events
On April 6, 2015, we announced our agreement to acquire an additional 21 percent equity interest in UEOM for approximately $575 million, subject to the right of the other member of UEOM to participate in the transaction. If the other member exercises this right, we would acquire an approximate 13 percent interest and the other member would acquire an approximate 8 percent interest.
On April 15, 2015, we redeemed $750 million of 5.875 percent senior notes due 2021. (See Note 8 – Debt and Banking Arrangements.)
23
Item 2
Management’s Discussion and Analysis of
Financial Condition and Results of Operations
General
We are an energy infrastructure master limited partnership focused on connecting North America’s significant hydrocarbon resource plays to growing markets for natural gas, NGLs, and olefins through our gas pipeline and midstream businesses. WPZ GP LLC, a Delaware limited liability company wholly owned by Williams, is our general partner.
Our interstate natural gas pipeline strategy is to create value by maximizing the utilization of our pipeline capacity by providing high quality, low cost transportation of natural gas to large and growing markets. Our gas pipeline businesses’ interstate transmission and storage activities are subject to regulation by the FERC and as such, our rates and charges for the transportation of natural gas in interstate commerce, and the extension, expansion or abandonment of jurisdictional facilities and accounting, among other things, are subject to regulation. The rates are established through the FERC’s ratemaking process. Changes in commodity prices and volumes transported have limited near-term impact on revenues because the majority of cost of service is recovered through firm capacity reservation charges in transportation rates.
The ongoing strategy of our midstream operations is to safely and reliably operate large-scale midstream infrastructure where our assets can be fully utilized and drive low per-unit costs. We focus on consistently attracting new business by providing highly reliable service to our customers. These services include natural gas gathering, processing and treating, NGL fractionation and transportation, crude oil production handling and transportation, olefin production, marketing services for NGL, oil and natural gas, as well as storage facilities.
Our reportable segments are Access Midstream, Northeast G&P, Atlantic-Gulf, West, and NGL & Petchem Services, which are comprised of the following businesses as of March 31, 2015:
• | Access Midstream provides domestic gathering, treating, and compression services to producers under long-term, fixed fee contracts. Its primary operating areas are in the Barnett Shale region of north-central Texas, the Eagle Ford Shale region of south Texas, the Haynesville Shale region of northwest Louisiana; the Marcellus Shale region primarily in Pennsylvania and West Virginia, the Utica Shale region of eastern Ohio, and the Mid-Continent region which includes the Anadarko, Arkoma, Delaware and Permian basins. Access Midstream also includes a 49 percent equity-method investment in UEOM, a 50 percent equity-method investment interest in the Delaware basin gas gathering system in the Mid-Continent region, and Appalachia Midstream Services, LLC, which owns an approximate average 45 percent interest in 11 gas gathering systems in the Marcellus Shale (Appalachia Midstream Investments). |
• | Northeast G&P is comprised of midstream gathering and processing businesses in the Marcellus and Utica shale regions, as well as a 69 percent equity-method investment in Laurel Mountain and a 58 percent equity-method investment in Caiman II. |
• | Atlantic-Gulf is comprised of our interstate natural gas pipeline, Transco, and significant natural gas gathering and processing and crude oil production handling and transportation in the Gulf Coast region, as well as a 50 percent equity-method investment in Gulfstream, a 60 percent equity-method investment in Discovery, and a 41 percent interest in Constitution (a consolidated entity). |
• | West is comprised of our gathering, processing and treating operations in New Mexico, Colorado, and Wyoming and our interstate natural gas pipeline, Northwest Pipeline. Effective with the first quarter of 2015, the operations of the Niobrara Shale region that were formerly within the Access Midstream segment were transferred into the West reportable segment. The prior period amounts and disclosures included herein have been recast for this change. |
24
Management’s Discussion and Analysis (Continued)
• | NGL & Petchem Services is comprised of our 88.5 percent undivided interest in an olefins production facility in Geismar, Louisiana, along with a refinery grade propylene splitter and various petrochemical and feedstock pipelines in the Gulf Coast region, an oil sands offgas processing plant near Fort McMurray, Alberta, and an NGL/olefin fractionation facility and B/B splitter facility at Redwater, Alberta. This segment also includes an NGL and natural gas marketing business, storage facilities and an undivided 50 percent interest in an NGL fractionator near Conway, Kansas, and a 50 percent equity-method investment in OPPL. |
As of March 31, 2015, Williams holds an approximate 60 percent interest in us, comprised of an approximate 58 percent limited partner interest and all of our 2 percent general partner interest and IDRs.
Unless indicated otherwise, the following discussion and analysis of results of operations and financial condition and liquidity should be read in conjunction with the consolidated financial statements and notes thereto of this Form 10‑Q and our annual consolidated financial statements and notes thereto in Exhibit 99.1 of our Form 8-K dated February 25, 2015.
Distributions
On April 20, 2015, our general partner’s Board of Directors approved a quarterly distribution to unitholders of $0.85 per common unit on May 14, 2015, on our outstanding common units to unitholders of record at the close of business on May 7, 2015.
Overview of Three Months Ended March 31, 2015
Net income attributable to controlling interests for the three months ended March 31, 2015, decreased $263 million compared to the three months ended March 31, 2014, primarily due to the absence of insurance proceeds in the first quarter of 2015 compared to $125 million received in the first quarter of 2014 as well as declines in NGL margins driven by 60 percent lower prices. These decreases were partially offset by $55 million of new fees associated with the start-up of operations at Gulfstar One in the fourth quarter of 2014 and a $22 million increase in Transco’s natural gas transportation fee revenues primarily associated with expansion projects placed in service in 2014 and 2015. See additional discussion in Results of Operations.
Abundant and low-cost natural gas reserves in the United States continue to drive strong demand for midstream and pipeline infrastructure. We believe that we have successfully positioned our energy infrastructure businesses for significant future growth.
Merger
We completed the Merger on February 2, 2015. (See Note 1 – General, Description of Business, and Basis of Presentation for additional information). As the Merger was between entities under common control, ACMP’s historical financial position, results of operations, and cash flows were combined with those of Pre-merger WPZ for periods during which ACMP was under common control of Williams (periods subsequent to July 1, 2014). Both Pre-merger WPZ and ACMP are reflected at Williams’ historical basis in both partnerships.
Geismar Incident and Plant Expansion
On June 13, 2013, an explosion and fire occurred at our Geismar olefins plant. The incident (Geismar Incident) rendered the facility temporarily inoperable and resulted in significant human, financial, and operational effects. The plant resumed consistent operations in late March 2015 and the facility is expected to produce ethylene at the base plant’s production rate through May. The process to achieve its full expanded production rate will be ongoing through June. This facility is part of our NGL & Petchem Services segment.
We expect our total property damage and business interruption loss to exceed our $500 million policy limit. Since June 2013, we have settled claims associated with $480 million of available property damage and business interruption coverage for a total of $422 million. This total includes $126 million which is expected to be received in the second quarter of 2015. The remaining insurance limits total approximately $20 million and we are vigorously pursuing collection.
25
Management’s Discussion and Analysis (Continued)
Access Midstream
UEOM
Subsequent to March 31, 2015, WPZ announced an agreement to acquire additional equity interest in UEOM. Refer to Note 12 – Subsequent Events in the Notes to Consolidated Financial Statements for further information.
West
Bucking Horse Gas Processing Facility
The Bucking Horse gas processing plant (Bucking Horse) began operating in February 2015. Bucking Horse is located in Converse County, Wyoming, and adds 120 MMcf/d of processing capacity in the Powder River basin Niobrara Shale play. Processed volumes at Bucking Horse have continued to increase through the first quarter of 2015 as existing rich gas production was re-directed from other third-party processing facilities. Bucking Horse has led to higher gathering volumes on Jackalope as previously curtailed production has increased due to the additional processing capability.
Atlantic Gulf
Mobile Bay South III
In April 2015, Transco’s Mobile Bay South III expansion south from Station 85 in west central Alabama to delivery points along the line was placed into service, which enabled us to begin providing 225 Mdth/d of additional firm transportation service on the Mobile Bay Lateral.
Volatile Commodity Prices
NGL margins were approximately 59 percent lower in the first three months of 2015 compared to the same period of 2014 driven primarily by lower non-ethane NGL prices partially offset by higher volumes.
NGL margins are defined as NGL revenues less any applicable Btu replacement cost, plant fuel, and third-party transportation and fractionation. Per-unit NGL margins are calculated based on sales of our own equity volumes at the processing plants. Our equity volumes include NGLs where we own the rights to the value from NGLs recovered at our plants under both “keep-whole” processing agreements, where we have the obligation to replace the lost heating value with natural gas, and “percent-of-liquids” agreements whereby we receive a portion of the extracted liquids with no obligation to replace the lost heating value.
26
Management’s Discussion and Analysis (Continued)
The following graph illustrates the effects of margin volatility, notably the decline in equity ethane sales driven by reduced recoveries, as well as the margin differential between ethane and non-ethane products and the relative mix of those products.
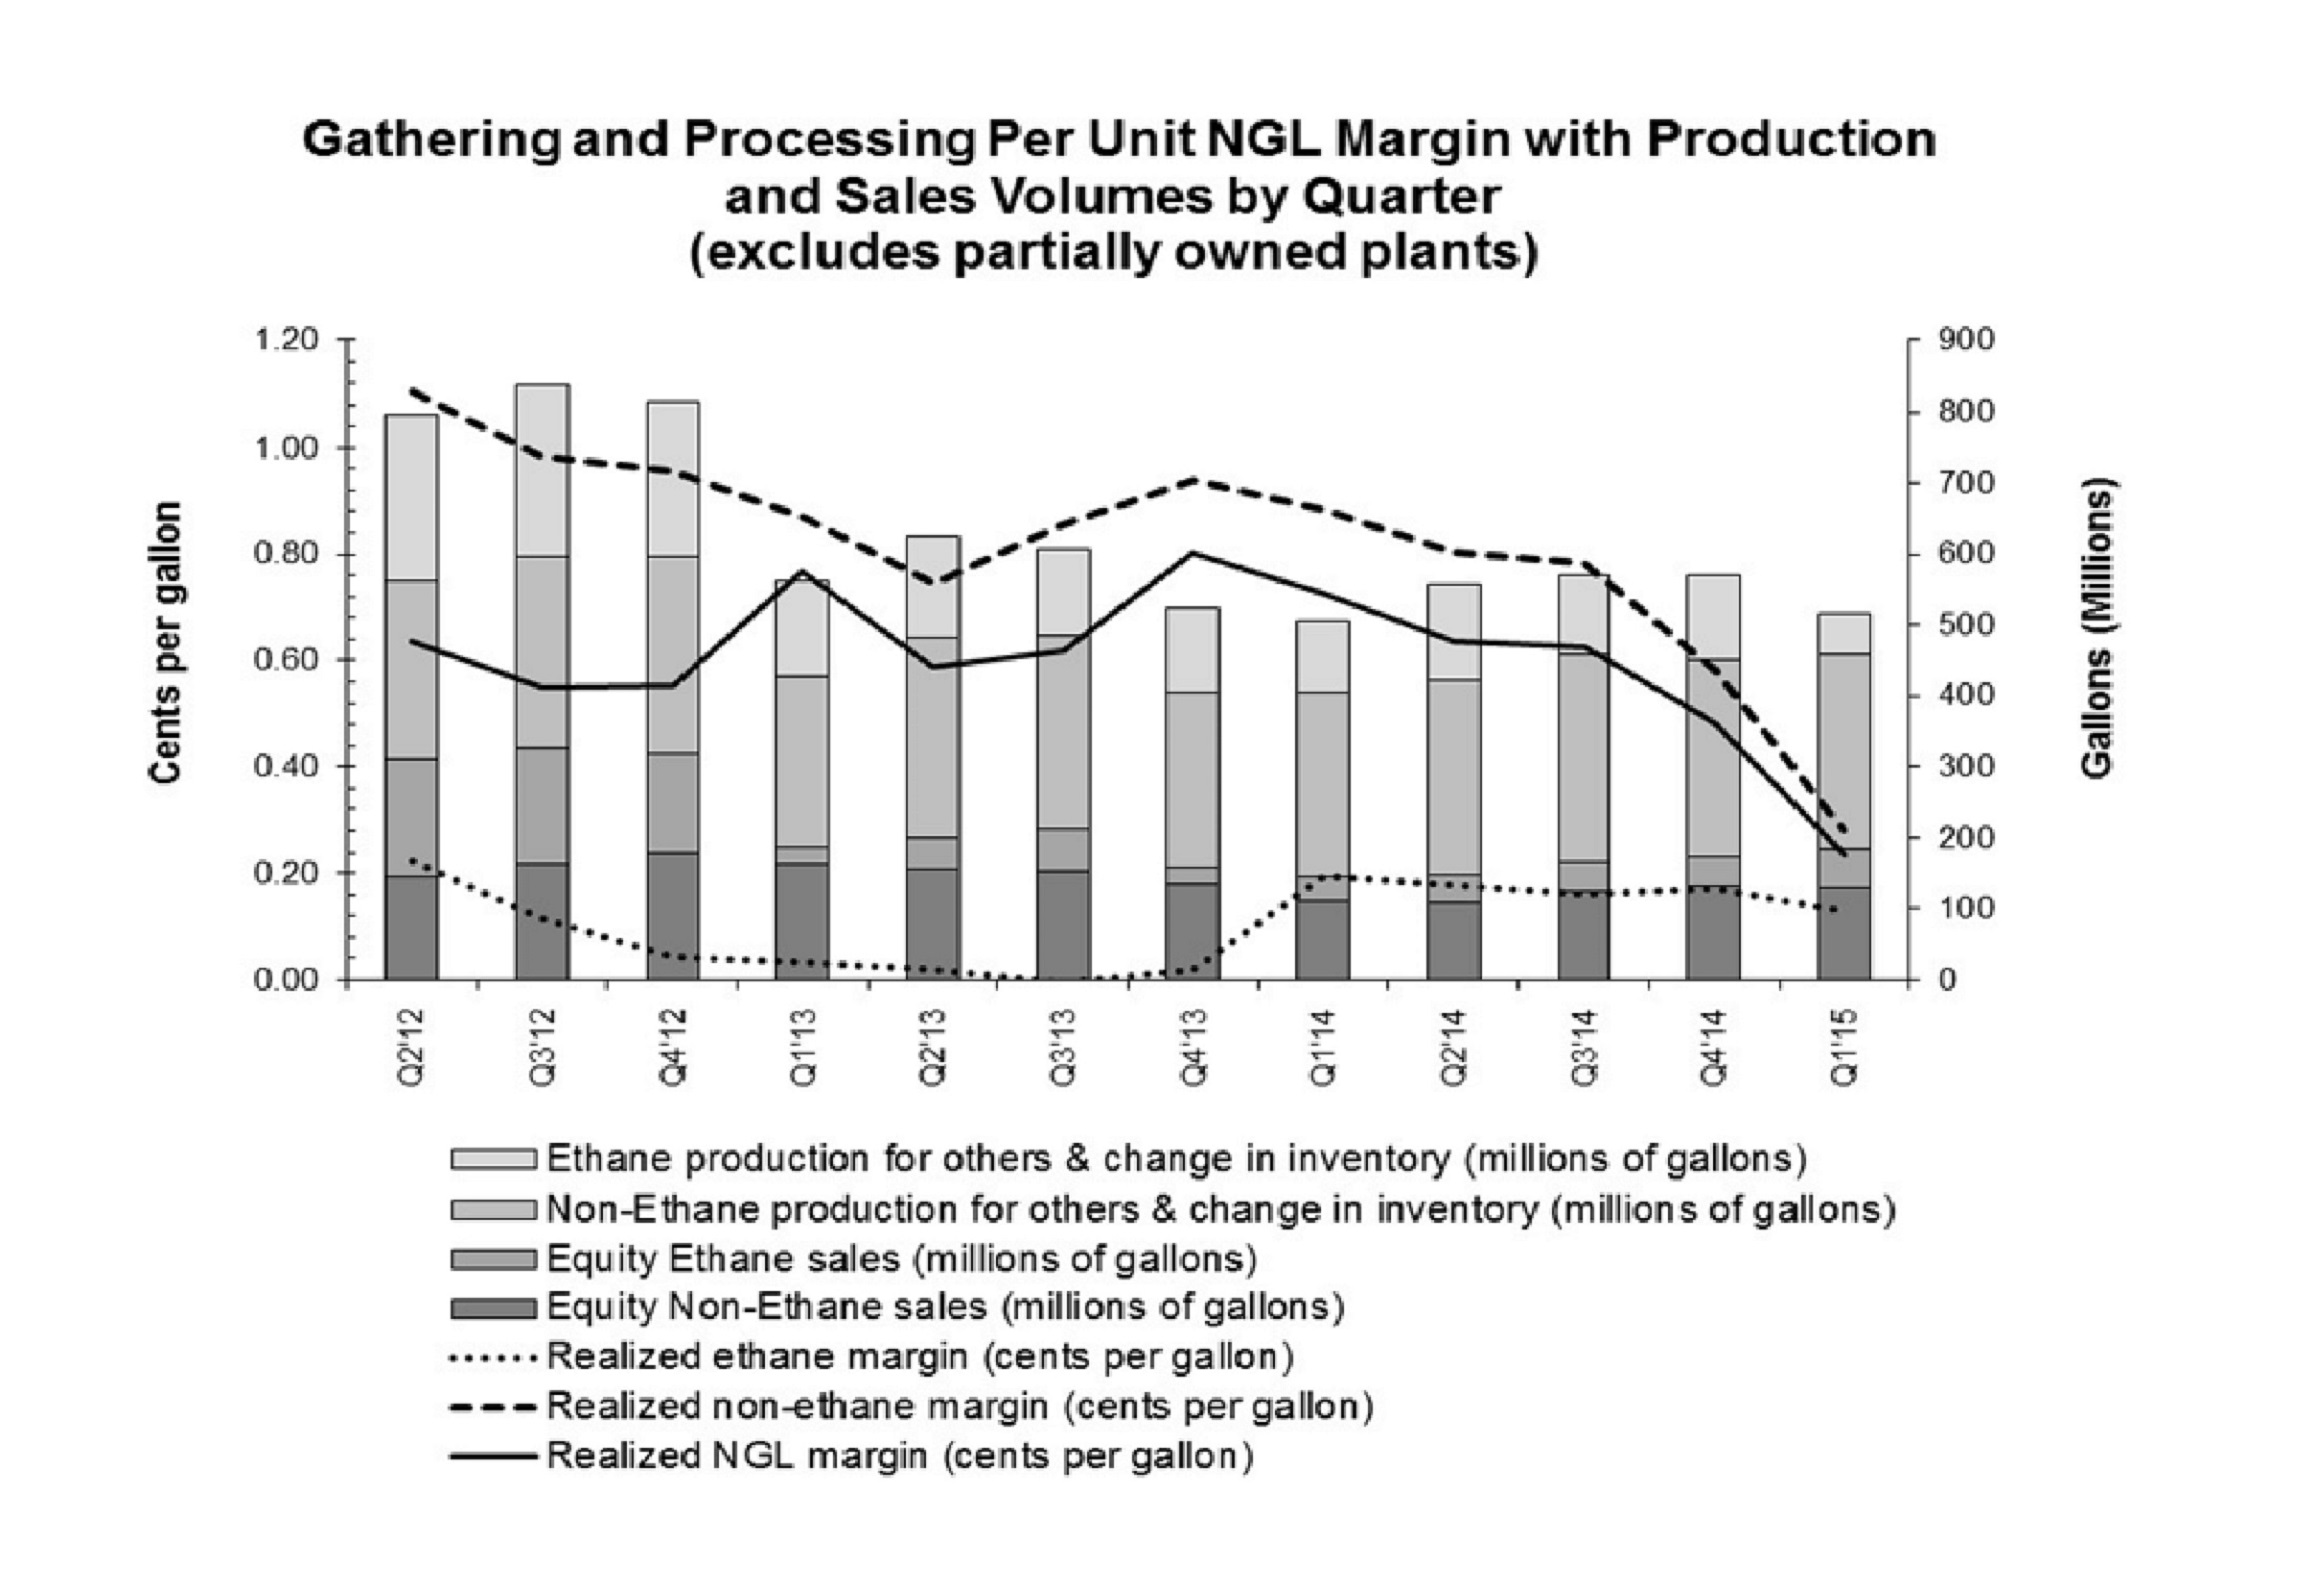 |
Company Outlook
Our strategy is to provide large-scale energy infrastructure designed to maximize the opportunities created by the vast supply of natural gas, natural gas products, and crude oil that exists in North America. We seek to accomplish this through further developing our scale positions in current key markets and basins and entering new growth markets and basins where we can become the large-scale service provider. We will maintain a strong commitment to safety, environmental stewardship, operational excellence and customer satisfaction. We believe that accomplishing these goals will position us to deliver an attractive return to our unitholders.
Following the sharp decline in energy commodity prices in fourth quarter 2014, we expect crude oil, NGLs, and olefins prices to remain at lower levels throughout 2015 as compared to 2014 average prices, which will have an adverse effect on our operating results and cash flows. Fee-based businesses are a significant component of our portfolio and have further increased as a result of the Merger. This serves to somewhat reduce the influence of commodity price fluctuations on our operating results and cash flows. However, due in part to lower natural gas prices, we anticipate that overall producer drilling economics will decrease slightly. This may reduce our gathering volumes available for both fee-based and keep-whole processing.
Our business plan for 2015 continues to reflect both significant capital investment and distributions. We continue to manage expenditures as appropriate without compromising safety and compliance. Our planned consolidated capital investments for 2015 total between $3.68 billion and $4.23 billion. We expect to maintain an attractive cost of capital and reliable access to capital markets, both of which will allow us to pursue development projects and acquisitions.
27
Management’s Discussion and Analysis (Continued)
Potential risks and obstacles that could impact the execution of our plan include:
• | General economic, financial markets, or industry downturn; |
• | Lower than anticipated energy commodity prices and margins; |
• | Decreased volumes from third parties served by our midstream business; |
• | Unexpected significant increases in capital expenditures or delays in capital project execution; |
• | Limited availability of capital due to a change in our financial condition, interest rates, market or industry conditions; |
• | Lower than expected levels of cash flow from operations; |
• | Downgrade of our investment grade credit ratings and associated increase in cost of borrowings; |
• | Counterparty credit and performance risk; |
• | Changes in the political and regulatory environments; |
• | Physical damages to facilities, including damage to offshore facilities by named windstorms; |
• | Reduced availability of insurance coverage. |
We continue to address these risks through maintaining a strong financial position and ample liquidity, as well as through managing a diversified portfolio of energy infrastructure assets.
In 2015, we anticipate an overall improvement in operating results compared to 2014 primarily due to increases in olefins volumes associated with the repair and expansion of the Geismar plant and in our fee-based businesses primarily as a result of the Merger, partially offset by lower NGL margins and higher operating expenses associated with the growth of our business.
The following factors, among others, could impact our businesses in 2015.
Commodity price changes
NGL and olefin price changes have historically correlated somewhat with changes in the price of crude oil, although NGL, olefin, crude, and natural gas prices are highly volatile, and difficult to predict. Commodity margins are highly dependent upon regional supply/demand balances of natural gas as they relate to NGL margins, while olefins are impacted by global supply and demand fundamentals. NGL products are currently the preferred feedstock for ethylene and propylene production, and are expected to remain advantaged over crude-based feedstocks into the foreseeable future. We continue to benefit from our strategic feedstock cost advantage in propylene production from Canadian oil sands offgas.
Following the sharp decline in overall energy commodity prices in the fourth quarter of 2014, we anticipate the following trends in 2015, compared to 2014:
• | Natural gas and ethane prices are expected to be at or below 2014 levels primarily due to higher inventory levels. |
• | Non-ethane prices, including propane, are expected to be lower primarily due to oversupply and the sharp decline in crude oil prices. |
• | Olefins prices, including propylene, ethylene, and the overall ethylene crack spread, are expected to be lower than 2014 levels due to the lower prices of crude oil and correlated products. |
28
Management’s Discussion and Analysis (Continued)
Gathering, transportation, processing, and NGL sales volumes
The growth of natural gas production supporting our gathering and processing volumes is impacted by producer drilling activities, which are influenced by commodity prices, including natural gas, ethane and propane prices. In addition, the natural decline in production rates in producing areas impact the amount of gas available for gathering and processing.
• | Following the Merger, we began consolidating our Access Midstream segment’s results of operations effective July 1, 2014. As such, we expect an increase in overall results for our Access Midstream segment in 2015 compared to 2014 associated with a full year of consolidated results. |
• | In our Atlantic-Gulf segment, we expect higher production handling volumes in 2015, following the completion of Gulfstar FPS™ in the fourth quarter of 2014. |
• | We anticipate higher natural gas transportation revenues at Transco compared to 2014, as a result of expansion projects placed into service in 2014 and anticipated to be placed in service in 2015. |
• | In our Northeast G&P segment, we anticipate growth in our natural gas gathering volumes compared to the prior year as our infrastructure grows to support drilling activities in the region. |
• | Volumes in the Haynesville area at our Access Midstream segment are expected to be higher in 2015 as compared to 2014 primarily due to an increase in well connections in the area. |
• | We expect an increase in volumes in 2015, as compared to 2014 at our Access Midstream segment in the Utica area primarily due to the build out of the Cardinal system, relieving compression constraints and adding new well connections. |
• | Our West segment expects an unfavorable impact in equity NGL volumes in 2015 compared to 2014, primarily due to the sharp decline in NGL prices. |
• | In 2015, our domestic businesses anticipate a continuation of periods when it will not be economical to recover ethane. |
Olefin production volumes
• | Our NGL & Petchem Services segment anticipates higher ethylene volumes in 2015 compared to 2014 substantially due to the repair and expansion of the Geismar plant, which restarted in February 2015. |
Other
• | Operating results from our equity-method investments are expected to be higher in 2015 compared to 2014 primarily due to the completion of Discovery’s Keathley Canyon Connector™ lateral in the first quarter of 2015 and an anticipated increase in volumes as well as ownership interest in UEOM. These increases are offset by an expected decrease in results from our equity-method investment in the Delaware basin gas gathering system primarily due to a redetermination of rates in association with a contract extension. |
• | Amounts recognized under minimum volume commitments at our Access Midstream segment in the Barnett area are expected to increase in 2015 compared to 2014. |
• | We expect higher operating expenses in 2015 compared to 2014, related to our growing operations in our Northeast G&P segment and expansion projects at Transco, partially offset by cost reductions and synergies associated with the Merger. |
29
Management’s Discussion and Analysis (Continued)
Expansion Projects
We expect to invest between $3.25 billion and $3.8 billion of capital among our business segments in 2015. Our ongoing major expansion projects include the following:
Access Midstream
Access Midstream Projects
We plan to expand our gathering infrastructure in the Eagle Ford, Mid-Continent, Utica, and Marcellus shale regions in order to meet our customers’ production plans. The expansion of the gathering infrastructure includes the addition of new facilities, well connections, and gathering pipeline to the existing systems.
Northeast G&P
Oak Grove Expansion
We plan to expand our processing capacity at our Oak Grove facility by adding a second 200MMcf/d cryogenic natural gas processing plant, which, based on our customers’ needs, is expected to be placed into service at the end of 2016.
Susquehanna Supply Hub
We will continue to expand the gathering system in the Susquehanna Supply Hub in northeastern Pennsylvania that is needed to meet our customers’ production plans. The expansion of the gathering infrastructure includes additional compression and gathering pipeline to the existing system.
Atlantic-Gulf
Atlantic Sunrise
In March 2015, we filed an application with the FERC to expand Transco’s existing natural gas transmission system along with greenfield facilities to provide incremental firm transportation capacity from the northeastern Marcellus producing area to markets along Transco’s mainline as far south as Station 85 in west central Alabama. We plan to place the project into service during the second half of 2017, assuming timely receipt of all necessary regulatory approvals, and it is expected to increase capacity by 1,700 Mdth/d.
Leidy Southeast
In December 2014, we received approval from the FERC to expand Transco’s existing natural gas transmission system from the Marcellus Shale production region on Transco’s Leidy Line in Pennsylvania to delivery points along its mainline as far south as Station 85 in west central Alabama. In March 2015, we began providing firm transportation service through the mainline portion of the project on an interim basis, until the in-service date of the project as a whole. We plan to place the remainder of the project into service during the fourth quarter of 2015 and expect it to increase capacity by 525 Mdth/d.
Constitution Pipeline
In December 2014, we received approval from the FERC to construct and operate the jointly owned Constitution pipeline. We also received a Notice of Complete Application from the New York Department of Environmental Conservation in December 2014. We currently own 41 percent of Constitution with three other parties holding 25 percent, 24 percent, and 10 percent, respectively. We will be the operator of Constitution. The 124-mile Constitution pipeline will connect our gathering system in Susquehanna County, Pennsylvania, to the Iroquois Gas Transmission and Tennessee Gas Pipeline systems in New York. We plan to place the project into service in the second half of 2016, with an expected capacity of 650 Mdth/d. The pipeline is fully subscribed with two shippers.
30
Management’s Discussion and Analysis (Continued)
Northeast Connector
In May 2014, we received FERC approval to expand Transco’s existing natural gas transmission system from southeastern Pennsylvania to the proposed Rockaway Delivery Lateral. In December 2014, we placed a portion of the project into service, which enabled us to begin providing 65 Mdth/d of firm transportation from Station 195 to the Rockaway Delivery Lateral junction. We plan to place the remainder of the project into service during the second quarter of 2015. In total, the project is expected to increase capacity by 100 Mdth/d.
Rockaway Delivery Lateral
In May 2014, we received FERC approval to construct a three-mile offshore lateral to a distribution system in New York. We plan to place the project into service during the second quarter of 2015, and the capacity of the lateral is expected to be 647 Mdth/d.
Virginia Southside
In November 2013, we received approval from the FERC to expand Transco’s existing natural gas transmission system from New Jersey to a proposed power station in Virginia and delivery points in North Carolina. In December 2014, we placed a portion of the project into service, which enabled us to begin providing 250 Mdth/d of additional firm transportation service through the mainline portion of the project on an interim basis, until the in-service date of the project as a whole. We plan to place the remainder of the project into service during the third quarter of 2015. In total, the project is expected to increase capacity by 270 Mdth/d.
Rock Springs
In March 2015, we received approval from the FERC to expand Transco’s existing natural gas transmission system from New Jersey to a proposed generation facility in Maryland. The project is planned to be placed into service in third quarter 2016, assuming timely receipt of all other necessary regulatory approvals, and is expected to increase capacity by 192 Mdth/d.
Hillabee
In November 2014, we filed an application with the FERC for approval of the initial phases of Transco’s Hillabee Expansion project, which involves an expansion of its existing natural gas transmission system from Station 85 in west central Alabama to a proposed new interconnection with Sabal Trail Transmission's system in Alabama. The project will be constructed in phases, and all of the project expansion capacity will be leased to Sabal Trail Transmission. We plan to place the initial phases of the project into service during the second quarter of 2017 and 2020, assuming timely receipt of all necessary regulatory approvals, and together they are expected to increase capacity by 1,025 Mdth/d.
Gulf Trace
In December 2014, we filed an application with the FERC to expand Transco’s existing natural gas transmission system together with greenfield facilities to provide incremental firm transportation capacity from Station 65 in St. Helena Parish, Louisiana westward to a new interconnection with Sabine Pass Liquefaction in Cameron Parish, Louisiana. We plan to place the project into service during the first half of 2017, assuming timely receipt of all necessary regulatory approvals, and it is expected to increase capacity by 1,200 Mdth/d.
Dalton
In March 2015, we filed an application with the FERC to expand Transco’s existing natural gas transmission system together with greenfield facilities to provide incremental firm transportation capacity from Station 210 in New Jersey to markets in northwest Georgia. We plan to place the project into service in 2017, assuming timely receipt of all necessary regulatory approvals, and it is expected to increase capacity by 448 Mdth/d.
31
Management’s Discussion and Analysis (Continued)
Garden State
In February 2015, we filed an application with the FERC to expand Transco’s existing natural gas transmission system to provide incremental firm transportation capacity from Station 210 in New Jersey to a new interconnection on our Trenton Woodbury Lateral in New Jersey. The project will be constructed in phases and is expected to increase capacity by 180 Mdth/d. We plan to place the initial phase of the project into service during the fourth quarter of 2016 and the remaining portion in the third quarter of 2017, assuming timely receipt of all necessary regulatory approvals.
Virginia Southside II
In March 2015, we filed an application with the FERC to expand Transco’s existing natural gas transmission system together with greenfield facilities to provide incremental firm transportation capacity from New Jersey and Virginia to our Brunswick Lateral in Virginia. We plan to place the project into service during the fourth quarter of 2017, assuming timely receipt of all necessary regulatory approvals, and expect it to increase capacity by 250 Mdth/d.
NGL & Petchem Services
Redwater Expansion
In association with Williams’ long-term agreement to provide gas processing services to a second bitumen upgrader in Canada’s oil sands near Fort McMurray, Alberta, we are increasing the capacity of the Redwater facilities to provide NGL transportation and fractionation services to Williams. With this capacity increase, additional NGL/olefins mixtures from Williams will be fractionated into an ethane/ethylene mix, propane, polymer grade propylene, normal butane, an alkylation feed and condensate under a long-term fee-based agreement. This capacity increase at Redwater is expected to be placed into service during the fourth quarter of 2015.
32
Management’s Discussion and Analysis (Continued)
Results of Operations
Consolidated Overview
The following table and discussion is a summary of our consolidated results of operations for the three months ended March 31, 2015, compared to the three months ended March 31, 2014. The results of operations by segment are discussed in further detail following this consolidated overview discussion.
Three months ended March 31, | |||||||||||||
2015 | 2014 | $ Change* | % Change* | ||||||||||
(Millions) | |||||||||||||
Revenues: | |||||||||||||
Service revenues | $ | 1,192 | $ | 763 | +429 | +56 | % | ||||||
Product sales | 519 | 930 | -411 | -44 | % | ||||||||
Total revenues | 1,711 | 1,693 | |||||||||||
Costs and expenses: | |||||||||||||
Product costs | 463 | 769 | +306 | +40 | % | ||||||||
Operating and maintenance expenses | 380 | 248 | -132 | -53 | % | ||||||||
Depreciation and amortization expenses | 419 | 208 | -211 | -101 | % | ||||||||
Selling, general, and administrative expenses | 193 | 130 | -63 | -48 | % | ||||||||
Net insurance recoveries – Geismar Incident | — | (119 | ) | -119 | -100 | % | |||||||
Other (income) expense – net | 17 | 17 | — | — | % | ||||||||
Total costs and expenses | 1,472 | 1,253 | |||||||||||
Operating income | 239 | 440 | |||||||||||
Equity earnings (losses) | 51 | 23 | +28 | +122 | % | ||||||||
Other investing income (loss) – net | 1 | — | +1 | NM | |||||||||
Interest expense | (192 | ) | (106 | ) | -86 | -81 | % | ||||||
Other income (expense) – net | 16 | 3 | +13 | NM | |||||||||
Income before income taxes | 115 | 360 | |||||||||||
Provision (benefit) for income taxes | 3 | 8 | +5 | +63 | % | ||||||||
Net income | 112 | 352 | |||||||||||
Less: Net income attributable to noncontrolling interests | 23 | — | -23 | NM | |||||||||
Net income attributable to controlling interests | $ | 89 | $ | 352 | |||||||||
* | + = Favorable change; - = Unfavorable change; NM = A percentage calculation is not meaningful due to a change in signs, a zero-value denominator, or a percentage change greater than 200. |
Three months ended March 31, 2015 vs. three months ended March 31, 2014
Service revenues increased primarily due to contributions from Access Midstream following the ACMP Acquisition in third quarter 2014. Additionally, production handling, gathering, processing, and transportation fee revenue all increased related to construction projects that have been placed into service, including Gulfstar One in the fourth quarter of 2014, new well connections and the completion of various compression projects in the Northeast, and expansion projects placed in service by Transco in late 2014 and in 2015.
Product sales decreased primarily due to lower NGL and crude oil marketing sales associated with sharp declines in NGL and crude oil prices and crude oil volumes, partially offset by higher NGL volumes. Equity NGL sales also decreased associated with sharp declines in NGL prices, partially offset by higher NGL volumes.
33
Management’s Discussion and Analysis (Continued)
Product costs decreased primarily due to lower NGL and crude oil marketing purchases related to sharp declines in prices and lower crude oil volumes, partially offset by higher NGL volumes. In addition, natural gas purchases associated with the production of equity NGLs decreased due to lower natural gas prices, partially offset by higher volumes.
Operating and maintenance expenses increased primarily due to new expenses associated with Access Midstream.
Depreciation and amortization expenses increased primarily due to new expenses associated with Access Midstream and due to depreciation on new projects placed in service, including Gulfstar One.
Selling, general, and administrative expenses increased primarily due to new expenses associated with Access Midstream, including $29 million of merger and transition-related costs recognized in 2015.
The unfavorable change in Net insurance recoveries – Geismar Incident is due to the receipt of $125 million of insurance recoveries in 2014.
Operating income decreased primarily due to the absence of insurance recoveries related to the Geismar Incident, higher expenses primarily related to the operations of and merger with Access Midstream and construction projects placed into service, $62 million lower NGL margins, and $19 million lower olefin product margins. These decreases are partially offset by increases in service revenue primarily related to contributions from Access Midstream and construction projects placed in service.
Equity earnings (losses) changed favorably primarily due to $33 million of contributions of equity-method investments at Access Midstream, including the Appalachia Midstream Investments. This increase was partially offset by $8 million reflecting our share of impairments recorded by Laurel Mountain.
Interest expense increased due to a $78 million increase in Interest incurred primarily due to new interest expense associated with debt from ACMP, as well as new debt issuances in 2014 and 2015. In addition, Interest capitalized decreased $8 million primarily related to construction projects that have been placed into service in the Northeast and to Gulfstar One, partially offset by new capitalized interest attributable to Access Midstream. (See Note 2 – Acquisition and Note 8 – Debt and Banking Arrangements of Notes to Consolidated Financial Statements.)
Other income (expense) – net below Operating income changed favorably primarily due to a $14 million benefit related to an increase in allowance for equity funds used during construction (AFUDC) related to an increase in spending on various Transco expansion projects and Constitution.
Provision (benefit) for income taxes changed favorably primarily due to lower foreign pretax income associated with our Canadian operations.
Net income attributable to noncontrolling interests increased $12 million associated with the start-up of Gulfstar One. In addition, $8 million of the increase is associated with the ACMP Acquisition, including the noncontrolling interests in Cardinal and Jackalope.
Period-Over-Period Operating Results – Segments
Beginning in the first quarter of 2015, we evaluate segment operating performance based upon Modified EBITDA. Note 11 – Segment Disclosures of Notes to Consolidated Financial Statements includes a reconciliation of this non-GAAP measure to Net income. Management uses Modified EBITDA because it is an accepted financial indicator used by investors to compare company performance. In addition, management believes that this measure provides investors an enhanced perspective of the operating performance of our assets. Modified EBITDA should not be considered in isolation or as a substitute for a measure of performance prepared in accordance with GAAP.
34
Management’s Discussion and Analysis (Continued)
Access Midstream
Three months ended March 31, | |||||||
2015 | 2014 | ||||||
(Millions) | |||||||
Service revenues | $ | 299 | $ | — | |||
Segment costs and expenses | (151 | ) | — | ||||
Proportional Modified EBITDA of equity-method investments | 80 | — | |||||
Access Midstream Modified EBITDA | $ | 228 | $ | — | |||
The results of operations for the Access Midstream segment are only presented for periods under common control (periods subsequent to July 1, 2014) and are reflected at Williams’ historical basis in the underlying operations (see Note 2 – Acquisition).
Three months ended March 31, 2015 vs. three months ended March 31, 2014
The increases in Service revenues, Segment costs and expenses and Proportional Modified EBITDA of equity-method investments for the first quarter of 2015 are due to the consolidation of Access Midstream.
Northeast G&P
Three months ended March 31, | |||||||
2015 | 2014 | ||||||
(Millions) | |||||||
Service revenues | $ | 142 | $ | 99 | |||
Product sales | 38 | 60 | |||||
Segment revenues | 180 | 159 | |||||
Product costs | (37 | ) | (58 | ) | |||
Other segment costs and expenses | (60 | ) | (62 | ) | |||
Proportional Modified EBITDA of equity-method investments | 7 | 9 | |||||
Northeast G&P Modified EBITDA | $ | 90 | $ | 48 | |||
Three months ended March 31, 2015 vs. three months ended March 31, 2014
Modified EBITDA increased primarily due to higher service revenues driven by new well connections and the completion of various compression projects.
Service revenues increased primarily due to $35 million higher gathering fees associated with 32 percent higher volumes driven by new well connections and the completion of various compression projects, as well as a net increase in gathering rates, primarily in the Susquehanna Supply Hub. Service revenues also increased $7 million due to contributions from our Ohio Valley Midstream business resulting from the addition of processing, fractionation, and transportation facilities placed in service in 2014.
Product sales decreased primarily due to a $25 million decline in non-ethane marketing sales in the Ohio Valley Midstream business, resulting from a 57 percent decline in non-ethane per unit marketing sales prices. The changes in marketing revenues are offset by similar changes in marketing purchases, reflected above as Product costs.
Other segment costs and expenses decreased primarily due to the absence of $6 million in costs resulting from fire damage at a compressor station in the Susquehanna Supply Hub and $4 million of charges related to a dispute, partially offset by higher expenses associated with growth in these operations.
35
Management’s Discussion and Analysis (Continued)
Proportional Modified EBITDA of equity-method investments decreased primarily due to $11 million lower earnings at Laurel Mountain resulting from $8 million of impairments and lower gathering fees due to lower gathering rates indexed to natural gas prices, partially offset by 17 percent higher volumes, all of which reflect an increase in ownership percentage compared to the prior year. Caiman II earnings increased $9 million due to the return to service of a plant that was damaged for a period in 2014, and contributions from assets placed into service in 2014 and 2015.
Atlantic-Gulf
Three months ended March 31, | |||||||
2015 | 2014 | ||||||
(Millions) | |||||||
Service revenues | $ | 458 | $ | 379 | |||
Product sales | 121 | 221 | |||||
Segment revenues | 579 | 600 | |||||
Product costs | (113 | ) | (206 | ) | |||
Other segment costs and expenses | (169 | ) | (163 | ) | |||
Proportional Modified EBITDA of equity-method investments | 38 | 35 | |||||
Atlantic-Gulf Modified EBITDA | $ | 335 | $ | 266 | |||
NGL margin | $ | 7 | $ | 14 | |||
Three months ended March 31, 2015 vs. three months ended March 31, 2014
Modified EBITDA increased primarily due to higher service revenues related to new fees from Gulfstar One and Transco expansion projects placed into service.
Service revenues increased primarily due to $55 million of new fees associated with the start-up of operations at Gulfstar One in the fourth quarter of 2014 and a $22 million increase in Transco’s natural gas transportation fee revenues primarily associated with expansion projects placed in service in 2014 and 2015.
Product sales decreased primarily due to:
• | An $84 million decrease in crude oil and NGL marketing revenues. Crude oil marketing sales decreased $49 million primarily due to 49 percent lower crude oil per barrel sales prices and 7 percent lower volumes related to natural declines in production areas served by our Mountaineer crude oil pipeline. NGL marketing sales decreased $35 million primarily due to a 56 percent decrease in non-ethane per-unit sales prices partially offset by 30 percent higher non-ethane sales volumes associated with increased production of others. These changes in marketing revenues are offset by similar changes in marketing purchases. |
• | A $9 million decrease in revenues from our equity NGLs reflecting a $14 million decrease associated with 72 percent lower realized per-unit sales prices, partially offset by a $5 million increase associated with higher volumes related to changes in inventory. |
Product costs decreased primarily due to an $84 million decrease in marketing purchases (offset in Product sales).
36
Management’s Discussion and Analysis (Continued)
Other segment costs and expenses increased slightly primarily due to higher operating and maintenance expenses, reduced benefit from regulatory credits associated with asset retirement obligations, increased project development cost reserve, and a regulatory expense recognized in 2015 to establish a regulatory liability associated with rate collections in excess of our pension funding obligation. These increases were substantially offset by a $14 million benefit related to an increase in AFUDC related to an increase in spending on various Transco expansion projects and Constitution.
West
Three months ended March 31, | |||||||
2015 | 2014 | ||||||
(Millions) | |||||||
Service revenues | $ | 262 | $ | 256 | |||
Product sales | 64 | 145 | |||||
Segment revenues | 326 | 401 | |||||
Product costs | (36 | ) | (72 | ) | |||
Other segment costs and expenses | (129 | ) | (117 | ) | |||
West Modified EBITDA | $ | 161 | $ | 212 | |||
NGL margin | $ | 25 | $ | 65 | |||
Three months ended March 31, 2015 vs. three months ended March 31, 2014
Modified EBITDA decreased primarily due to $40 million lower NGL margins reflecting $60 million in lower per-unit NGL prices partially offset by $15 million in lower per-unit natural gas costs associated with the production of equity NGLs and $5 million in increased volumes.
Service revenues increased due to the addition of gathering revenues from the Niobrara operations resulting from the ACMP Acquisition, partially offset by lower energy commodity-based fees.
Product sales decreased primarily due to:
• | A $55 million decrease in revenues from our equity NGLs primarily reflecting a $60 million decrease in price due to 55 percent lower average per-unit sales prices driven by the significant decline in energy commodity prices during the fourth quarter of 2014, partially offset by a $5 million increase in volumes primarily related to changes in inventory. |
• | A $20 million decrease in NGL marketing revenues primarily due to 60 percent average lower per-unit sales prices driven by the significant decline in energy commodity prices during the fourth quarter of 2014, as well as slightly lower volumes (offset in Product costs). |
Product costs decreased primarily due to:
• | A $20 million decrease in NGL marketing purchases (offset in Product sales). |
• | A $15 million decrease in natural gas purchases associated with the production of equity NGLs driven by lower per-unit natural gas costs as a result of the significant decline in energy commodity prices during the fourth quarter of 2014. |
Other segment costs and expenses increased primarily due to the addition of costs and expenses from the Niobrara operations resulting from the ACMP Acquisition.
37
Management’s Discussion and Analysis (Continued)
NGL & Petchem Services
Three months ended March 31, | |||||||
2015 | 2014 | ||||||
(Millions) | |||||||
Service revenues | $ | 32 | $ | 30 | |||
Product sales | 443 | 775 | |||||
Segment revenues | 475 | 805 | |||||
Product costs | (424 | ) | (704 | ) | |||
Other segment costs and expenses | (56 | ) | (48 | ) | |||
Net insurance recoveries – Geismar Incident | — | 119 | |||||
Proportional Modified EBITDA of equity-method investments | 11 | 10 | |||||
NGL & Petchem Services Modified EBITDA | $ | 6 | $ | 182 | |||
Olefins margin | $ | 9 | $ | 28 | |||
NGL margin | 10 | 26 | |||||
Marketing margin | (3 | ) | 13 | ||||
Three months ended March 31, 2015 vs. three months ended March 31, 2014
Modified EBITDA decreased in the first quarter of 2015 compared to the first quarter 2014 primarily due to the absence of $125 million of insurance proceeds related to the Geismar Incident as well as lower margins due to lower product prices. Overall margins decreased by $51 million consisting of a $16 million decrease in NGL margins, a $19 million decrease in olefin margins and a $16 million decrease in marketing margins.
Product sales decreased primarily due to:
• | A $292 million decrease in marketing revenues primarily due to lower prices across all products, partially offset by higher volumes (partially offset in Product costs). |
• | A $26 million decrease in NGL sales revenues primarily due to a $42 million decrease in prices partially offset by $16 million related to higher volumes as production available for sale in the the prior year period was impacted by the tie-in of the recently completed ethane recovery system. |
Product costs decreased primarily due to:
• | A $276 million decrease in marketing product costs primarily due to lower per-unit costs partially offset by higher volumes (more than offset by lower Product sales). |
• | A $10 million decrease in NGL product costs due to a decrease in the price of natural gas associated with the production of equity NGLs partially offset by higher volume. |
The unfavorable change in Other segment costs and expenses is primarily due to higher operating expenses including increased expenses associated with the return to operation and expansion of the Geismar plant.
The decrease in Net insurance recoveries – Geismar Incident is primarily due to the absence of insurance proceeds in the first quarter of 2015 compared to $125 million received in the first quarter of 2014. Partially offsetting the decline in insurance proceeds was an absence of covered insurable expenses in excess of our retentions (deductibles) related to the Geismar Incident in the first quarter of 2015 compared to $6 million in the first quarter of 2014.
38
Management’s Discussion and Analysis (Continued)
Management’s Discussion and Analysis of Financial Condition and Liquidity
Outlook
We seek to manage our businesses with a focus on applying conservative financial policy in order to maintain investment-grade credit metrics. Our plan for 2015 reflects our ongoing transition to an overall business mix that is increasingly fee-based. Although our cash flows are impacted by fluctuations in energy commodity prices, that impact is somewhat mitigated by certain of our cash flow streams that are not directly impacted by short-term commodity price movements, including:
• | Firm demand and capacity reservation transportation revenues under long-term contracts; |
• | Fee-based revenues from certain gathering and processing services. |
We believe we have, or have access to, the financial resources and liquidity necessary to meet our requirements for working capital, capital and investment expenditures, unitholder distributions, and debt service payments while maintaining a sufficient level of liquidity.
Liquidity
Based on our forecasted levels of cash flow from operations and other sources of liquidity, we expect to have sufficient liquidity to manage our businesses in 2015. Our internal and external sources of consolidated liquidity to fund working capital requirements, capital and investment expenditures, debt service payments, and distributions to unitholders include:
• | Cash and cash equivalents on hand; |
• | Cash generated from operations, including cash distributions from our equity-method investees; |
• | Cash proceeds from issuances of debt and/or equity securities; |
• | Use of our credit facility and/or commercial paper program. |
We anticipate our more significant uses of cash to be:
• | Maintenance and expansion capital expenditures; |
• | Contributions to our equity-method investees to fund their expansion capital expenditures; |
• | Interest on our long-term debt; |
• | Quarterly distributions to our unitholders and general partner. |
Potential risks associated with our planned levels of liquidity and the planned capital and investment expenditures include those previously discussed in Company Outlook.
39
Management’s Discussion and Analysis (Continued)
As of March 31, 2015, we had a working capital deficit (current liabilities, inclusive of long-term debt due within one year, in excess of current assets) of $795 million. However, we note the following about our available liquidity.
Available Liquidity | March 31, 2015 | ||
(Millions) | |||
Cash and cash equivalents | $ | 277 | |
Capacity available under our $3.5 billion credit facility, less amounts outstanding under our $3 billion commercial paper program (1) | 3,500 | ||
$ | 3,777 | ||
(1) | In managing our available liquidity, we do not expect a maximum outstanding amount in excess of the capacity of our credit facility inclusive of any outstanding amounts under our commercial paper program. The highest amount outstanding under our commercial paper program and credit facility during 2015 was $3.1 billion. At March 31, 2015, we were in compliance with the financial covenants associated with this credit facility and the commercial paper program. See Note 8 – Debt and Banking Arrangements of Notes to Consolidated Financial Statements for additional information on our credit facility, commercial paper program, and termination of our short-term facility. |
Debt Issuances and Retirements
On April 15, 2015, we paid $783 million, including a redemption premium, to retire $750 million of 5.875 percent senior notes due 2021.
On March 3, 2015, we completed a public offering of $1.25 billion of 3.6 percent senior unsecured notes due 2022, $750 million of 4 percent senior unsecured notes due 2025, and $1 billion of 5.1 percent senior unsecured notes due 2045. We used the net proceeds to repay amounts outstanding under our commercial paper program and credit facility, to fund capital expenditures, and for general partnership purposes.
We retired $750 million of 3.8 percent senior unsecured notes that matured on February 15, 2015.
Shelf Registration
On February 25, 2015, we filed a shelf registration statement for the offer and sale from time to time of common units representing limited partner interests in us having an aggregate offering price of up to $1 billion. These sales will be made over a period of time and from time to time in transactions at prices which are market prices prevailing at the time of sale, prices related to market price or at negotiated prices. Such sales will be made pursuant to an equity distribution agreement between us and certain banks who may act as sales agents or purchase for their own accounts as principals. As of March 31, 2015, no common units have been issued under this registration.
Distributions from Equity-Method Investees
The organizational documents of entities in which we have an equity-method interest generally require distribution of their available cash to their members on a quarterly basis. In each case, available cash is reduced, in part, by reserves appropriate for operating their respective businesses.
40
Management’s Discussion and Analysis (Continued)
Credit Ratings
Our ability to borrow money is impacted by our credit ratings. Our current ratings are as follows:
Rating Agency | Outlook | Senior Unsecured Debt Rating | Corporate Credit Rating | |||
Standard & Poor’s | Stable | BBB | BBB | |||
Moody’s Investors Service | Stable | Baa2 | N/A | |||
Fitch Ratings | Negative | BBB | N/A | |||
Credit rating agencies perform independent analyses when assigning credit ratings. No assurance can be given that the credit rating agencies will continue to assign us investment grade ratings even if we meet or exceed their current criteria for investment grade ratios. A downgrade of our credit rating might increase our future cost of borrowing and would require us to post additional collateral with third parties, negatively impacting our available liquidity. As of March 31, 2015, we estimated that a downgrade to a rating below investment grade could require us to post up to $240 million in additional collateral with third parties.
Capital and Investment Expenditures
Each of our businesses is capital-intensive, requiring investment to upgrade or enhance existing operations and comply with safety and environmental regulations. The capital requirements of these businesses consist primarily of:
• | Maintenance capital expenditures, which are generally not discretionary, including: (1) capital expenditures made to replace partially or fully depreciated assets in order to maintain the existing operating capacity of our assets and to extend their useful lives; (2) expenditures which are mandatory and/or essential to comply with laws and regulations and maintain the reliability of our operations; and (3) certain well connection expenditures. |
• | Expansion capital expenditures, which are generally more discretionary than maintenance capital expenditures, including: (1) expenditures to acquire additional assets to grow our business, to expand and upgrade plant or pipeline capacity and to construct new plants, pipelines and storage facilities; and (2) well connection expenditures which are not classified as maintenance expenditures. |
The following table provides summary information related to our actual and expected capital expenditures, purchases of businesses, and contributions to equity-method investments for 2015. Included are gross increases to our property, plant, and equipment, including changes related to accounts payable and accrued liabilities:
2015 Estimate | Three months ended March 31, 2015 | |||||||
(Millions) | ||||||||
Maintenance | $ | 430 | $ | 54 | ||||
Expansion | 3,525 | 674 | ||||||
Total | $ | 3,955 | $ | 728 | ||||
See Company Outlook - Expansion Projects for discussions describing the general nature of these expenditures.
Cash Distributions to Unitholders
We will pay cash distributions of $0.85 per unit on May 14, 2015, on our outstanding common units to unitholders of record at the close of business on May 7, 2015. (See Note 4 – Allocation of Net Income and Distributions of Notes to Consolidated Financial Statements.)
41
Management’s Discussion and Analysis (Continued)
Sources (Uses) of Cash
Three months ended March 31, | |||||||
2015 | 2014 | ||||||
(Millions) | |||||||
Net cash provided (used) by: | |||||||
Operating activities | $ | 697 | $ | 549 | |||
Financing activities | 76 | 826 | |||||
Investing activities | (667 | ) | (950 | ) | |||
Increase (decrease) in cash and cash equivalents | $ | 106 | $ | 425 | |||
Operating activities
The factors that determine operating activities are largely the same as those that affect Net income, with the exception of noncash expenses such as Depreciation and amortization. Our Net cash provided by operating activities was also impacted by net favorable changes in operating working capital and the inclusion of contributions in 2015 from consolidating operations associated with the ACMP Acquisition.
Financing activities
Significant transactions include:
• | $799 million in 2015 and $225 million in 2014 net paid on commercial paper; |
• | $2.992 billion in 2015 and $1.496 billion in 2014 net received from our debt offerings; |
• | $750 million paid in 2015 on our debt retirement; |
• | $1.832 billion received in 2015 from our credit facility borrowings; |
• | $2.472 billion paid in 2015 on our credit facility borrowings; |
• | $738 million, including $515 million to Williams, in 2015 and $556 million, including $414 million to Williams, in 2014 related to quarterly cash distributions paid to limited partner unitholders and the general partner. |
Investing activities
Significant transactions include:
• | Capital expenditures of $735 billion in 2015 and $724 million in 2014; |
• | Purchases of and contributions to our equity-method investments of $83 million in 2015 and $215 million in 2014. |
Off-Balance Sheet Arrangements and Guarantees of Debt or Other Commitments
We have various other guarantees and commitments which are disclosed in Note 3 – Variable Interest Entities, Note 9 – Fair Value Measurements and Guarantees, and Note 10 – Contingent Liabilities of Notes to Consolidated Financial Statements. We do not believe these guarantees or the possible fulfillment of them will prevent us from meeting our liquidity needs.
42
Item 3
Quantitative and Qualitative Disclosures About Market Risk
Interest Rate Risk
Our current interest rate risk exposure is related primarily to our debt portfolio and has not materially changed during the first three months of 2015.
Foreign Currency Risk
Our foreign operations, whose functional currency is the local currency, are located in Canada. Net assets of our foreign operations were approximately $910 million and $992 million at March 31, 2015 and December 31, 2014, respectively. These investments have the potential to impact our financial position due to fluctuations in the local currency arising from the process of translating the local functional currency into the U.S. dollar. As an example, a 20 percent change in the functional currency against the U.S. dollar would have changed Total partners’ equity by approximately $182 million at March 31, 2015.
43
Item 4
Controls and Procedures
Our management, including our general partner’s Chief Executive Officer and Chief Financial Officer, does not expect that our disclosure controls and procedures (as defined in Rules 13a - 15(e) and 15d - 15(e) of the Securities Exchange Act) (Disclosure Controls) or our internal control over financial reporting (Internal Controls) will prevent all errors and all fraud. A control system, no matter how well conceived and operated, can provide only reasonable, not absolute, assurance that the objectives of the control system are met. Further, the design of a control system must reflect the fact that there are resource constraints, and the benefits of controls must be considered relative to their costs. Because of the inherent limitations in all control systems, no evaluation of controls can provide absolute assurance that all control issues and instances of fraud, if any, within Williams Partners L.P. have been detected. These inherent limitations include the realities that judgments in decision-making can be faulty, and that breakdowns can occur because of simple error or mistake. Additionally, controls can be circumvented by the individual acts of some persons, by collusion of two or more people, or by management override of the control. The design of any system of controls also is based in part upon certain assumptions about the likelihood of future events, and there can be no assurance that any design will succeed in achieving its stated goals under all potential future conditions. Because of the inherent limitations in a cost-effective control system, misstatements due to error or fraud may occur and not be detected. We monitor our Disclosure Controls and Internal Controls and make modifications as necessary; our intent in this regard is that the Disclosure Controls and Internal Controls will be modified as systems change and conditions warrant.
Evaluation of Disclosure Controls and Procedures
An evaluation of the effectiveness of the design and operation of our Disclosure Controls was performed as of the end of the period covered by this report. This evaluation was performed under the supervision and with the participation of our management, including our general partner’s Chief Executive Officer and Chief Financial Officer. Based upon that evaluation, our general partner’s Chief Executive Officer and Chief Financial Officer concluded that these Disclosure Controls are effective at a reasonable assurance level.
Changes in Internal Control Over Financial Reporting
On February 2, 2015, Williams Partners L.P. and Access Midstream Partners, L.P. completed their merger. As a result of the merger, certain controls have been consolidated. We expect to continue to integrate the businesses, processes, systems and related controls in future periods. Other than the changes that resulted from the merger, there have been no changes during the first quarter of 2015 that materially affected, or are reasonably likely to materially affect, our Internal Control over Financial Reporting.
PART II. OTHER INFORMATION
Item 1. Legal Proceedings
Environmental
Certain reportable legal proceedings involving governmental authorities under federal, state and local laws regulating the discharge of materials into the environment are described below. While it is not possible for us to predict the final outcome of the proceedings which are still pending, we do not anticipate a material effect on our consolidated financial position if we receive an unfavorable outcome in any one or more of such proceedings.
In November 2013, we became aware of deficiencies with the air permit for the Ft. Beeler gas processing facility located in West Virginia. We notified the EPA and the West Virginia Department of Environmental Protection and are working to bring the Ft. Beeler facility into full compliance. At March 31, 2015, we have accrued liabilities of $300,000 for potential penalties arising out of the deficiencies.
44
On November 7, 2014, the New Mexico Environment Department’s Air Quality Bureau (Bureau) issued a Notice of Violation (NOV) to Williams Four Corners LLC (Williams) for the El Cedro Gas Treating Plant alleging a failure by Williams to limit emissions to the allowable emission rates in violation of permit requirements, and for the failure to timely file initial and excess emission reports. The NOV followed an April 2014 inspection at the plant. Williams has provided Corrective Action Verification information to the Bureau and has entered into a Tolling Agreement to allow for additional time - until May 31, 2015 - for the parties to resolve the alleged violations.
Other
The additional information called for by this item is provided in Note 10 – Contingent Liabilities of the Notes to Consolidated Financial Statements included under Part I, Item 1. Financial Statements of this report, which information is incorporated by reference into this item.
45
Item 6. Exhibits
Exhibit No. | Description | |||
Exhibit 3.1 | — | Certificate of Limited Partnership of Chesapeake Midstream Partners, L.P. (filed on February 16, 2010 as Exhibit 3.1 to Williams Partners L.P.’s registration statement on Form S-1 (File No. 333-164905) and incorporated herein by reference). | ||
Exhibit 3.2 | — | Amendment to Certificate of Limited Partnership of Chesapeake Midstream Partners, L.P. (filed on July 30, 2012 as Exhibit 3.1 to Williams Partners L.P.’s current report on Form 8‑K (File No. 001-34831) and incorporated herein by reference). | ||
Exhibit 3.3 | — | Amendment to Certificate of Limited Partnership of Access Midstream Partners, L.P. (filed on February 3, 2015 as Exhibit 3.5 to Williams Partners L.P.’s current report on Form 8‑K (File No. 001-34831) and incorporated herein by reference). | ||
Exhibit 3.4 | — | Composite Certificate of Limited Partnership of Williams Partners L.P. (filed on February 25, 2015 as Exhibit 3.4 to Williams Partners L.P.’s annual report on Form 10-K (File No. 001-34831) and incorporated herein by reference). | ||
Exhibit 3.5 | — | First Amended and Restated Agreement of Limited Partnership of Chesapeake Midstream Partners, L.P., dated August 3, 2010 (filed on August 5, 2010 as Exhibit 3.1 to Williams Partners L.P.’s current report on Form 8-K (File No. 001-34831) and incorporated herein by reference). | ||
Exhibit 3.6 | — | Amendment No. 1 to the First Amended and Restated Agreement of Limited Partnership of Chesapeake Midstream Partners, L.P. dated as of December 20, 2012 (filed on July 20, 2012 as Exhibit 3.3 to Williams Partners L.P.’s current report on Form 8-K (File No. 001-34831) and incorporated herein by reference). | ||
Exhibit 3.7 | — | Amendment No. 2 to the First Amended and Restated Agreement of Limited Partnership of Access Midstream Partners, L.P. dated as of December 20, 2012 (filed on December 20, 2012 as Exhibit 3.1 to Williams Partners L.P.’s current report on Form 8-K (File No. 001-34831) and incorporated herein by reference). | ||
Exhibit 3.8 | — | Amendment No. 3 to the First Amended and Restated Agreement of Limited Partnership of Access Midstream Partners, L.P. dated as of January 29, 2015 (filed on February 3, 2015 as Exhibit 3.1 to Williams Partners L.P.’s current report on Form 8-K (File No. 001-34831) and incorporated herein by reference). | ||
Exhibit 3.9 | — | Amendment No. 4 to the First Amended and Restated Agreement of Limited Partnership of Access Midstream Partners, L.P. dated as of January 29, 2015 (filed on February 3, 2015 as Exhibit 3.4 to Williams Partners L.P.’s current report on Form 8-K (File No. 001-34831) and incorporated herein by reference). | ||
Exhibit 3.10 | — | Composite Agreement of Limited Partnership of Williams Partners L.P. (filed on February 25, 2015 as Exhibit 3.4 to Williams Partners L.P.’s annual report on Form 10‑K (File No. 001-34831) and incorporated herein by reference). | ||
Exhibit 3.11 | — | Certificate of Formation of Chesapeake Midstream GP, L.L.C. (filed on February 16, 2010 as Exhibit 3.3 to Williams Partners L.P.’s registration statement on Form S-1 (File No. 333-164905) and incorporated herein by reference). | ||
Exhibit 3.12 | — | Certificate of Amendment to Certificate of Formation of Chesapeake Midstream GP, L.L.C. (filed on July 20, 2012 as Exhibit 3.5 to Williams Partners L.P.’s current report on Form 8‑K (File No. 001-34831) and incorporated herein by reference). | ||
46
Exhibit No. | Description | |||
Exhibit 3.13 | — | Certificate of Amendment to Certificate of Formation of Access Midstream Partners GP, L.L.C. (filed on February 2, 2015 to Williams Partners L.P.’s current report on Form 8‑K (File No. 001-34831) and incorporated herein by reference). | ||
Exhibit 3.14 | — | Composite Certificate of Formation of WPZ GP LLC (filed on February 25, 2015 as Exhibit 3.4 to Williams Partners L.P.’s annual report on Form 10-K (File No. 001-34831) and incorporated herein by reference). | ||
Exhibit 3.15 | — | Seventh Amended and Restated Limited Liability Company Agreement of WPZ GP LLC (filed on February 2, 2015 as Exhibit 3.3 to Williams Partners L.P.’s current report on Form 8‑K (File No. 001-34831) and incorporated herein by reference). | ||
Exhibit 4.1 | — | Fourth Supplemental Indenture dated February 2, 2015, by and among Williams Partners L.P., ACMP Finance Corp. and The Bank of New York Mellon Trust Company, N.A., as trustee (filed on February 3, 2015, as Exhibit 4.1 to Williams Partners L.P.’s current report on Form 8-K (File No. 001-34831) and incorporated herein by reference). | ||
Exhibit 4.2 | — | Third Supplemental Indenture among Williams Partners L.P., ACMP Finance Corp. and The Bank of New York Mellon Trust Company, N.A. (filed on February 3, 2015 as Exhibit 4.2 to Williams Partners L.P.’s current report on Form 8-K (File No. 001-34831) and incorporated herein by reference). | ||
Exhibit 4.3 | — | Fifth Supplemental Indenture among Williams Partners L.P., ACMP Finance Corp. and The Bank of New York Mellon Trust Company, N.A. (filed on February 3, 2015 as Exhibit 4.3 to Williams Partners L.P.’s current report on Form 8-K (File No. 001-34831) and incorporated herein by reference). | ||
Exhibit 4.4 | — | Seventh Supplemental Indenture, dated as of February 2, 2015, between Williams Partners L.P. and The Bank of New York Mellon Trust Company, N.A. (filed on February 3, 2015 as Exhibit 4.4 to Williams Partners L.P.’s current report on Form 8-K (File No. 001-34831) and incorporated herein by reference). | ||
Exhibit 4.5 | — | First Supplemental Indenture, dated as of February 2, 2015, among Williams Partners L.P., Williams Partners Finance Corporation and The Bank of New York Mellon Trust Company, N.A. (filed on February 3, 2015, as Exhibit 4.6 to Pre-merger WPZ’s current report on Form 8-K (File No. 001-34831) and incorporated herein by reference). | ||
Exhibit 4.6 | — | First Supplemental Indenture, dated as of February 2, 2015, between Williams Partners L.P. and The Bank of New York Mellon Trust Company, N.A. (filed on February 3, 2015 as Exhibit 4.5 to Williams Partners L.P.’s current report on Form 8-K (File No. 001-34831) and incorporated herein by reference). | ||
Exhibit 4.7 | — | Eighth Supplemental Indenture, dated as of March 3, 2015, between Williams Partners L.P. and The Bank of New York Mellon Trust Company, N.A., as trustee (filed on March 3, 2015 as Exhibit 4.1 to Williams Partners L.P.’s current report on Form 8-K (File No. 001-34831) and incorporated herein by reference). | ||
§Exhibit 10.1 | — | Second Amendment to Williams Partners L.P. Long-Term Incentive Plan, dated effective as of February 2, 2015 (filed on February 25, 2015 as Exhibit 10.6 to Williams Partners L.P.’s current report on Form 10-K (File No. 001-34831) and incorporated herein by reference). | ||
Exhibit 10.2 | — | Form of Amended and Restated Commercial Paper Dealer Agreement, dated as of February 2, 2015, between Williams Partners L.P., as Issuer, and the Dealer party thereto (filed on February 3, 2015 as Exhibit 10.3 to Williams Partners L.P.’s current report on Form 8-K (File No. 001-34831) and incorporated herein by reference). | ||
47
Exhibit No. | Description | |||
Exhibit 10.3 | — | Second Amended and Restated Credit Agreement dated as of February 2, 2015, between Williams Partners L.P. (formerly known as Access Midstream Partners, L.P.), Northwest Pipeline LLC, Transcontinental Gas Pipeline Company, LLC, as co-borrowers, the lenders named therein, and Citibank, N.A. as Administrative Agent (filed on February 3, 2015 as Exhibit 10.1 to Williams Partners L.P.’s current report on Form 8-K (File No. 001-34831) and incorporated herein by reference). | ||
Exhibit 10.4 | — | Credit Agreement dated as of February 3, 2015, between Williams Partners L.P., the lenders named therein, and Barclays Bank PLC as Administrative Agent (filed on February 3, 2015 as Exhibit 10.2 to Williams Partners L.P.’s current report on Form 8-K (File No. 001-34831) and incorporated herein by reference). | ||
*§Exhibit 10.5 | — | Contractor Agreement by and between J. Mike Stice and WPZ GP LLC dated March 1, 2015. | ||
*Exhibit 12 | — | Computation of Ratio of Earnings to Fixed Charges. | ||
*Exhibit 31.1 | — | Certification of Chief Executive Officer pursuant to Rules 13a-14(a) and 15d-14(a) promulgated under the Securities Exchange Act of 1934, as amended, and Item 601(b)(31) of Regulation S-K, as adopted pursuant to Section 302 of the Sarbanes-Oxley Act of 2002. | ||
*Exhibit 31.2 | — | Certification of Chief Financial Officer pursuant to Rules 13a-14(a) and 15d-14(a) promulgated under the Securities Exchange Act of 1934, as amended, and Item 601(b)(31) of Regulation S-K, as adopted pursuant to Section 302 of the Sarbanes-Oxley Act of 2002. | ||
**Exhibit 32 | — | Certification of Chief Executive Officer and Chief Financial Officer pursuant to 18 U.S.C. Section 1350, as adopted pursuant to Section 906 of the Sarbanes-Oxley Act of 2002. | ||
*Exhibit 101.INS | — | XBRL Instance Document. | ||
*Exhibit 101.SCH | — | XBRL Taxonomy Extension Schema. | ||
*Exhibit 101.CAL | — | XBRL Taxonomy Extension Calculation Linkbase. | ||
*Exhibit 101.DEF | — | XBRL Taxonomy Extension Definition Linkbase. | ||
*Exhibit 101.LAB | — | XBRL Taxonomy Extension Label Linkbase. | ||
*Exhibit 101.PRE | — | XBRL Taxonomy Extension Presentation Linkbase. | ||
* | Filed herewith. |
** | Furnished herewith. |
§ Management contract or compensatory plan or arrangement.
48
SIGNATURE
Pursuant to the requirements of the Securities Exchange Act of 1934, the registrant has duly caused this report to be signed on its behalf by the undersigned thereunto duly authorized.
WILLIAMS PARTNERS L.P. | |
(Registrant) | |
By: Williams Partners GP LLC, its general partner | |
/s/ Ted T. Timmermans | |
Ted T. Timmermans | |
Vice President, Controller, and Chief Accounting Officer (Duly Authorized Officer and Principal Accounting Officer) | |
April 30, 2015
EXHIBIT INDEX
Exhibit No. | Description | |||
Exhibit 3.1 | — | Certificate of Limited Partnership of Chesapeake Midstream Partners, L.P. (filed on February 16, 2010 as Exhibit 3.1 to Williams Partners L.P.’s registration statement on Form S-1 (File No. 333-164905) and incorporated herein by reference). | ||
Exhibit 3.2 | — | Amendment to Certificate of Limited Partnership of Chesapeake Midstream Partners, L.P. (filed on July 30, 2012 as Exhibit 3.1 to Williams Partners L.P.’s current report on Form 8‑K (File No. 001-34831) and incorporated herein by reference). | ||
Exhibit 3.3 | — | Amendment to Certificate of Limited Partnership of Access Midstream Partners, L.P. (filed on February 3, 2015 as Exhibit 3.5 to Williams Partners L.P.’s current report on Form 8‑K (File No. 001-34831) and incorporated herein by reference). | ||
Exhibit 3.4 | — | Composite Certificate of Limited Partnership of Williams Partners L.P. (filed on February 25, 2015 as Exhibit 3.4 to Williams Partners L.P.’s annual report on Form 10-K (File No. 001-34831) and incorporated herein by reference). | ||
Exhibit 3.5 | — | First Amended and Restated Agreement of Limited Partnership of Chesapeake Midstream Partners, L.P., dated August 3, 2010 (filed on August 5, 2010 as Exhibit 3.1 to Williams Partners L.P.’s current report on Form 8-K (File No. 001-34831) and incorporated herein by reference). | ||
Exhibit 3.6 | — | Amendment No. 1 to the First Amended and Restated Agreement of Limited Partnership of Chesapeake Midstream Partners, L.P. dated as of December 20, 2012 (filed on July 20, 2012 as Exhibit 3.3 to Williams Partners L.P.’s current report on Form 8-K (File No. 001-34831) and incorporated herein by reference). | ||
Exhibit 3.7 | — | Amendment No. 2 to the First Amended and Restated Agreement of Limited Partnership of Access Midstream Partners, L.P. dated as of December 20, 2012 (filed on December 20, 2012 as Exhibit 3.1 to Williams Partners L.P.’s current report on Form 8-K (File No. 001-34831) and incorporated herein by reference). | ||
Exhibit 3.8 | — | Amendment No. 3 to the First Amended and Restated Agreement of Limited Partnership of Access Midstream Partners, L.P. dated as of January 29, 2015 (filed on February 3, 2015 as Exhibit 3.1 to Williams Partners L.P.’s current report on Form 8-K (File No. 001-34831) and incorporated herein by reference). | ||
Exhibit 3.9 | — | Amendment No. 4 to the First Amended and Restated Agreement of Limited Partnership of Access Midstream Partners, L.P. dated as of January 29, 2015 (filed on February 3, 2015 as Exhibit 3.4 to Williams Partners L.P.’s current report on Form 8-K (File No. 001-34831) and incorporated herein by reference). | ||
Exhibit 3.10 | — | Composite Agreement of Limited Partnership of Williams Partners L.P. (filed on February 25, 2015 as Exhibit 3.4 to Williams Partners L.P.’s annual report on Form 10‑K (File No. 001-34831) and incorporated herein by reference). | ||
Exhibit 3.11 | — | Certificate of Formation of Chesapeake Midstream GP, L.L.C. (filed on February 16, 2010 as Exhibit 3.3 to Williams Partners L.P.’s registration statement on Form S-1 (File No. 333-164905) and incorporated herein by reference). | ||
Exhibit 3.12 | — | Certificate of Amendment to Certificate of Formation of Chesapeake Midstream GP, L.L.C. (filed on July 20, 2012 as Exhibit 3.5 to Williams Partners L.P.’s current report on Form 8‑K (File No. 001-34831) and incorporated herein by reference). | ||
Exhibit No. | Description | |||
Exhibit 3.13 | — | Certificate of Amendment to Certificate of Formation of Access Midstream Partners GP, L.L.C. (filed on February 2, 2015 to Williams Partners L.P.’s current report on Form 8‑K (File No. 001-34831) and incorporated herein by reference). | ||
Exhibit 3.14 | — | Composite Certificate of Formation of WPZ GP LLC (filed on February 25, 2015 as Exhibit 3.4 to Williams Partners L.P.’s annual report on Form 10-K (File No. 001-34831) and incorporated herein by reference). | ||
Exhibit 3.15 | — | Seventh Amended and Restated Limited Liability Company Agreement of WPZ GP LLC (filed on February 2, 2015 as Exhibit 3.3 to Williams Partners L.P.’s current report on Form 8‑K (File No. 001-34831) and incorporated herein by reference). | ||
Exhibit 4.1 | — | Fourth Supplemental Indenture dated February 2, 2015, by and among Williams Partners L.P., ACMP Finance Corp. and The Bank of New York Mellon Trust Company, N.A., as trustee (filed on February 3, 2015, as Exhibit 4.1 to Williams Partners L.P.’s current report on Form 8-K (File No. 001-34831) and incorporated herein by reference). | ||
Exhibit 4.2 | — | Third Supplemental Indenture among Williams Partners L.P., ACMP Finance Corp. and The Bank of New York Mellon Trust Company, N.A. (filed on February 3, 2015 as Exhibit 4.2 to Williams Partners L.P.’s current report on Form 8-K (File No. 001-34831) and incorporated herein by reference). | ||
Exhibit 4.3 | — | Fifth Supplemental Indenture among Williams Partners L.P., ACMP Finance Corp. and The Bank of New York Mellon Trust Company, N.A. (filed on February 3, 2015 as Exhibit 4.3 to Williams Partners L.P.’s current report on Form 8-K (File No. 001-34831) and incorporated herein by reference). | ||
Exhibit 4.4 | — | Seventh Supplemental Indenture, dated as of February 2, 2015, between Williams Partners L.P. and The Bank of New York Mellon Trust Company, N.A. (filed on February 3, 2015 as Exhibit 4.4 to Williams Partners L.P.’s current report on Form 8-K (File No. 001-34831) and incorporated herein by reference). | ||
Exhibit 4.5 | — | First Supplemental Indenture, dated as of February 2, 2015, among Williams Partners L.P., Williams Partners Finance Corporation and The Bank of New York Mellon Trust Company, N.A. (filed on February 3, 2015, as Exhibit 4.6 to Pre-merger WPZ’s current report on Form 8-K (File No. 001-34831) and incorporated herein by reference). | ||
Exhibit 4.6 | — | First Supplemental Indenture, dated as of February 2, 2015, between Williams Partners L.P. and The Bank of New York Mellon Trust Company, N.A. (filed on February 3, 2015 as Exhibit 4.5 to Williams Partners L.P.’s current report on Form 8-K (File No. 001-34831) and incorporated herein by reference). | ||
Exhibit 4.7 | — | Eighth Supplemental Indenture, dated as of March 3, 2015, between Williams Partners L.P. and The Bank of New York Mellon Trust Company, N.A., as trustee (filed on March 3, 2015 as Exhibit 4.1 to Williams Partners L.P.’s current report on Form 8-K (File No. 001-34831) and incorporated herein by reference). | ||
§Exhibit 10.1 | — | Second Amendment to Williams Partners L.P. Long-Term Incentive Plan, dated effective as of February 2, 2015 (filed on February 25, 2015 as Exhibit 10.6 to Williams Partners L.P.’s current report on Form 10-K (File No. 001-34831) and incorporated herein by reference). | ||
Exhibit 10.2 | — | Form of Amended and Restated Commercial Paper Dealer Agreement, dated as of February 2, 2015, between Williams Partners L.P., as Issuer, and the Dealer party thereto (filed on February 3, 2015 as Exhibit 10.3 to Williams Partners L.P.’s current report on Form 8-K (File No. 001-34831) and incorporated herein by reference). | ||
Exhibit No. | Description | |||
Exhibit 10.3 | — | Second Amended and Restated Credit Agreement dated as of February 2, 2015, between Williams Partners L.P. (formerly known as Access Midstream Partners, L.P.), Northwest Pipeline LLC, Transcontinental Gas Pipeline Company, LLC, as co-borrowers, the lenders named therein, and Citibank, N.A. as Administrative Agent (filed on February 3, 2015 as Exhibit 10.1 to Williams Partners L.P.’s current report on Form 8-K (File No. 001-34831) and incorporated herein by reference). | ||
Exhibit 10.4 | — | Credit Agreement dated as of February 3, 2015, between Williams Partners L.P., the lenders named therein, and Barclays Bank PLC as Administrative Agent (filed on February 3, 2015 as Exhibit 10.2 to Williams Partners L.P.’s current report on Form 8-K (File No. 001-34831) and incorporated herein by reference). | ||
*§Exhibit 10.5 | — | Contractor Agreement by and between J. Mike Stice and WPZ GP LLC dated March 1, 2015. | ||
*Exhibit 12 | — | Computation of Ratio of Earnings to Fixed Charges. | ||
*Exhibit 31.1 | — | Certification of Chief Executive Officer pursuant to Rules 13a-14(a) and 15d-14(a) promulgated under the Securities Exchange Act of 1934, as amended, and Item 601(b)(31) of Regulation S-K, as adopted pursuant to Section 302 of the Sarbanes-Oxley Act of 2002. | ||
*Exhibit 31.2 | — | Certification of Chief Financial Officer pursuant to Rules 13a-14(a) and 15d-14(a) promulgated under the Securities Exchange Act of 1934, as amended, and Item 601(b)(31) of Regulation S-K, as adopted pursuant to Section 302 of the Sarbanes-Oxley Act of 2002. | ||
**Exhibit 32 | — | Certification of Chief Executive Officer and Chief Financial Officer pursuant to 18 U.S.C. Section 1350, as adopted pursuant to Section 906 of the Sarbanes-Oxley Act of 2002. | ||
*Exhibit 101.INS | — | XBRL Instance Document. | ||
*Exhibit 101.SCH | — | XBRL Taxonomy Extension Schema. | ||
*Exhibit 101.CAL | — | XBRL Taxonomy Extension Calculation Linkbase. | ||
*Exhibit 101.DEF | — | XBRL Taxonomy Extension Definition Linkbase. | ||
*Exhibit 101.LAB | — | XBRL Taxonomy Extension Label Linkbase. | ||
*Exhibit 101.PRE | — | XBRL Taxonomy Extension Presentation Linkbase. | ||
* | Filed herewith. |
** | Furnished herewith. |
§ Management contract or compensatory plan or arrangement.