Attached files
| file | filename |
|---|---|
| EX-32 - EX-32 - LIFE TIME FITNESS, INC. | d916840dex32.htm |
| EX-31.2 - EX-31.2 - LIFE TIME FITNESS, INC. | d916840dex312.htm |
| EX-31.1 - EX-31.1 - LIFE TIME FITNESS, INC. | d916840dex311.htm |
Table of Contents
UNITED STATES
SECURITIES AND EXCHANGE COMMISSION
Washington, D.C. 20549
FORM 10-K/A
Amendment No. 1
| x | ANNUAL REPORT PURSUANT TO SECTION 13 OR 15(d) OF THE SECURITIES EXCHANGE ACT OF 1934 |
For the Fiscal Year Ended: December 31, 2014
| ¨ | TRANSITION REPORT PURSUANT TO SECTION 13 OR 15(d) OF THE SECURITIES EXCHANGE ACT OF 1934 |
Commission file number 001-32230
Life Time Fitness, Inc.
(Exact Name of Registrant as Specified in its Charter)
| Minnesota | 41-1689746 | |
| (State or Other Jurisdiction of Incorporation or Organization) |
(I.R.S. Employer Identification No.) |
2902 Corporate Place, Chanhassen, Minnesota 55317
(Address of Principal Executive Offices, Including Zip Code)
(952) 947-0000
(Registrant’s Telephone Number, Including Area Code)
Securities registered pursuant to Section 12(b) of the Act:
| Title of Each Class |
Name of Each Exchange on Which Registered | |
| Common Stock, $.02 par value | New York Stock Exchange | |
| Preferred Share Purchase Rights | New York Stock Exchange |
Securities registered pursuant to Section 12(g) of the Act: None
Indicate by check mark if the registrant is a well-known seasoned issuer, as defined in Rule 405 of the Securities Act. Yes x No ¨
Indicate by check mark if the registrant is not required to file reports pursuant to Section 13 or Section 15(d) of the Act. Yes ¨ No x
Table of Contents
Indicate by check mark whether the registrant (1) has filed all reports required to be filed by Section 13 or 15(d) of the Securities Exchange Act of 1934 during the preceding 12 months (or for such shorter period that the registrant was required to file such reports), and (2) has been subject to such filing requirements for the past 90 days. Yes x No ¨
Indicate by check mark whether the registrant has submitted electronically and posted on its corporate Website, if any, every Interactive Data File required to be submitted and posted pursuant to Rule 405 of Regulation S-T (§232.405 of this chapter) during the preceding 12 months (or for such shorter period that the registrant was required to submit and post such files). Yes x No ¨
Indicate by check mark if disclosure of delinquent filers pursuant to Item 405 of Regulation S-K (§229.405 of this chapter) is not contained herein, and will not be contained, to the best of registrant’s knowledge, in definitive proxy or information statements incorporated by reference in Part III of this Form 10-K or any amendment to this Form 10-K. x
Indicate by check mark whether the registrant is a large accelerated filer, an accelerated filer, a non-accelerated filer, or a smaller reporting company. See the definitions of “large accelerated filer,” “accelerated filer” and “smaller reporting company” in Rule 12b-2 of the Exchange Act.
| Large accelerated filer | x | Accelerated filer | ¨ | |||
| Non-accelerated filer | ¨ (do not check if smaller reporting company) | Smaller reporting company | ¨ | |||
Indicate by check mark whether the registrant is a shell company (as defined in Rule 12b-2 of the Act). Yes ¨ No x
The aggregate market value of the voting common stock held by non-affiliates of the registrant as of June 30, 2014 was $1,779,437,157, based on the closing sale price for the registrant’s common stock on that date.
The number of shares outstanding of the registrant’s common stock as of April 27, 2015 was 39,043,889.
DOCUMENTS INCORPORATED BY REFERENCE
None.
2
Table of Contents
| 4 | ||||||
| 5 | ||||||
| Item 10. |
5 | |||||
| Item 11. |
8 | |||||
| Item 12. |
Security Ownership of Certain Beneficial Owners and Management and Related Stockholder Matters. |
42 | ||||
| Item 13. |
Certain Relationships and Related Transactions, and Director Independence. |
44 | ||||
| Item 14. |
45 | |||||
| 47 | ||||||
| Item 15. |
47 | |||||
3
Table of Contents
This Amendment No. 1 on Form 10-K/A (the “Amendment”) amends the Annual Report on Form 10-K of Life Time Fitness, Inc. (the “Company,” “our” or “we”) for the year ended December 31, 2014, which was originally filed with the Securities and Exchange Commission (“SEC”) on March 2, 2015 (the “Original Filing”), and is being filed to solely for the purpose of providing the information required by Items 10, 11, 12, 13, and 14 of Part III.
This information was previously omitted from the Original Filing in reliance on General Instruction G(3) to Form 10-K, which permits the information in the above referenced items to be incorporated in the Form 10-K by reference from our definitive proxy statement if such statement is filed no later than 120 days after our fiscal year end. We are filing this Amendment to include Part III information in our Form 10-K because a definitive proxy statement containing this information will not be filed by us within 120 days after the end of the fiscal year covered by the Form 10-K. The reference on the cover of the Original Filing to the incorporation by reference to portions of our definitive proxy statement into Part III of the Original Filing is hereby deleted.
In accordance with Rule 12b-15 under the Securities Exchange Act of 1934, as amended, Part III, Items 10 through 14 of the Original Filing are hereby amended and restated in their entirety, and Part IV, Item 15 of the Original Filing is hereby amended and restated in its entirety, with the only changes being the addition of Exhibits 31.3, 31.4 and 32.2 filed herewith and related footnotes.
Except as specifically set forth herein, this Amendment does not amend or otherwise update any other information in the Original Filing. Accordingly, this Amendment should be read in conjunction with the Original Filing and with our filings with the SEC subsequent to the Original Filing.
4
Table of Contents
| Item 10. | DIRECTORS, EXECUTIVE OFFICERS AND CORPORATE GOVERNANCE |
Directors
All of the directors named below are the current directors of our company. The following table sets forth certain information regarding each director of our company:
| Name |
Age | Position | ||
| Bahram Akradi |
53 | Chairman of the Board of Directors, President and Chief Executive Officer | ||
| Giles H. Bateman |
70 | Director | ||
| Jack W. Eugster |
69 | Director | ||
| Guy C. Jackson |
73 | Director | ||
| John K. Lloyd |
69 | Director | ||
| Martha A. Morfitt |
57 | Director | ||
| John B. Richards |
66 | Director | ||
| Joseph S. Vassalluzzo |
67 | Director |
Set forth below are the biographies of each director, as well as a discussion of the specific experience, qualifications, attributes and skills that led to the board of directors’ conclusion that the individual should serve as a director:
Bahram Akradi founded our company in 1992 and has been a director since our inception. Mr. Akradi was elected chief executive officer and chairman of the board of directors in May 1996. In December 2009, Mr. Akradi was appointed president of our company, a position he also held from 1992 through December 2007. Mr. Akradi has over 30 years of experience in healthy way of life initiatives. From 1984 to 1989, he led U.S. Swim & Fitness Corporation as its co-founder and executive vice president. Mr. Akradi was a founder of the health and fitness Industry Leadership Council.
Through his leadership roles in our industry, Mr. Akradi has gained extensive experience in the development and operation of health and fitness companies. As our founder, he has significant knowledge of all facets of our company, including the day-to-day operations of our in-center programs and offerings and the construction and design of our centers. Mr. Akradi’s long history with our company, combined with his leadership skills and operating experience, makes him particularly well suited to be our chairman.
Giles H. Bateman was elected a director of our company in March 2006. Mr. Bateman was one of four co-founders of Price Club in 1976 and served as its chief financial officer and vice chairman until 1991. Mr. Bateman served as non-executive chairman of CompUSA Inc., a publicly traded retailer of computer hardware, software, accessories and related products, from 1993 until he retired in 2000. Mr. Bateman serves as a director and the chair of the audit committee of WD-40 Company. Within the last five years, Mr. Bateman also served on the board of directors of United PanAm Finance Corporation.
Mr. Bateman has more than 20 years of public company operating experience, including as founder, chief financial officer and vice chairman of big-box retailer, Price Club, and has served on numerous public company boards. In addition to his leadership experience with a big-box retailer, he also has background and expertise in finance through his tenure as chief financial officer at Price Club as well as his service on numerous audit committees in the past. This experience allows him to provide guidance and counsel in his role as chairman of our finance committee.
Jack W. Eugster was elected a director of our company in October 2009. Mr. Eugster served as the chairman, president and chief executive officer of Musicland Stores Corporation, a retail music and home video company, for 21 years before his retirement in 2001. Prior to Musicland, Mr. Eugster held executive leadership positions with The Gap, Inc. and Target Corporation. He currently serves on the board of directors of two other public companies, Graco Inc. and Black Hills Corporation. Within the last five years, Mr. Eugster also served on the board of directors of Donaldson Company, Inc.
Mr. Eugster has a history of demonstrated leadership with major retail organizations. His significant experience in leadership positions, including chief executive officer, of retail companies is particularly valuable for us as he can provide strategic input on center development and in-center offerings and programs. Mr. Eugster also brings extensive governance experience to our board and company as he has served as a director of numerous public companies, including big-box retailers.
5
Table of Contents
Guy C. Jackson was elected a director of our company in March 2004. In June 2003, Mr. Jackson retired from the accounting firm of Ernst & Young LLP after 35 years with the firm and one of its predecessors, Arthur Young & Company. During his career, Mr. Jackson served as the audit partner for numerous public companies. He also serves as a director, and the chair of the audit committee, of two other public companies, Cyberonics, Inc. and Digi International Inc. Within the last five years, Mr. Jackson has also served on the board of directors, and chaired the audit committees, of EpiCept Corporation and Urologix, Inc.
Mr. Jackson brings more than 35 years of finance, audit and accounting experience to our board. Along with his years of experience with the accounting firm of Ernst & Young, LLP serving many different companies and industries, Mr. Jackson is currently also a director, and chair of the audit committee, for two other public companies. Mr. Jackson’s significant experience in the finance area allows him to provide input to our finance, accounting and internal audit functions and the external audit process. This experience, and his service on other boards and audit committees, qualifies Mr. Jackson to serve as chairman of our audit committee.
John K. Lloyd was elected a director of our company in October 2009. Since 1997, Mr. Lloyd has been the president of Meridian Health, a New Jersey-based integrated health system which encompasses five hospitals and an extensive network of non-hospital healthcare services. Prior to Meridian Health, Mr. Lloyd held executive leadership positions with Jersey Shore University Medical Center, Modern Health Affiliates, Inc. and Episcopal Hospital. He currently serves as chairman of the board of directors of QualCare Preferred Providers and QualCare Alliance Networks, Inc.
As the president of Meridian Health, Mr. Lloyd has significant experience in the strategic development and operation of a network of health and wellness businesses within one corporate system. This experience allows Mr. Lloyd to provide valuable insight and guidance on organizational structure and employee programs within the health and wellness sector, as well as our technological systems and information safeguarding processes and procedures.
Martha (Marti) A. Morfitt was elected a director of our company in August 2008. Ms. Morfitt is a principal of River Rock Partners, Inc., a business and cultural transformation consulting firm, a position she has held since 2008. Ms. Morfitt is the former chief executive officer of Airborne, Inc., a privately held manufacturer and marketer of dietary supplements. Ms. Morfitt held this position from October 2009 through April 2012. Prior to her service at Airborne, Inc., Ms. Morfitt was the president and chief executive officer of CNS, Inc., a manufacturer and marketer of consumer healthcare products. She held this position from 2001 through March 2007. From 1998 to 2001, she was chief operating officer of CNS, Inc. Ms. Morfitt left her position at CNS, Inc. effective March 2007 as a result of the acquisition of CNS, Inc. by GlaxoSmithKline plc in December 2006. Prior to 1998, Ms. Morfitt held an executive position at the Pillsbury Company. Ms. Morfitt is also a director of Graco Inc. and lululemon athletica inc. Within the last five years, Ms. Morfitt has also served on the board of directors of Solta Medical, Inc.
As the president and chief executive officer of CNS, Inc., Ms. Morfitt gained significant experience leading a publicly held consumer products company. Ms. Morfitt also gained significant leadership experience in the consumer products industry as the chief executive officer of Airborne, Inc. and as a senior executive at the Pillsbury Company. In addition to her leadership experience at CNS, Inc. and Airborne, Inc., Ms. Morfitt also serves as a director of two other public companies. Ms. Morfitt is well suited as a director of our company, as her consumer marketing and business strategy expertise allows Ms. Morfitt to provide insight on strategic plans relating to our business.
John B. Richards was elected a director of our company in October 2006. Mr. Richards is currently the chief executive officer of The Joint Corp., a publicly traded franchisor of chiropractic clinics, a position he has held since July 2014. Prior to this position, Mr. Richards was a managing partner of the New England Consulting Group, a firm specializing in creative marketing and growth strategies for a wide range of branded consumer businesses, where Mr. Richards served as interim consulting executive to various retail companies from September 2007 to July 2014. In addition, Mr. Richards previously served as the president and chief executive officer of Elizabeth Arden Red Door Spa Holdings from October 2001 until May 2006. Elizabeth Arden Red Door Spa Holdings is a developer and operator of prestige day and resort spas. Mr. Richards also served as President of North American Operations of Starbucks Coffee Company, and held senior leadership and management positions with Four Seasons Hotels, Inc., Royal Viking Line, McKinsey & Company and The Procter & Gamble Company. Mr. Richards currently serves on the board of directors of The Joint Corp.
In his senior leadership roles at companies in the hospitality industry, Mr. Richards gained significant marketing and operating experience. Also, his expertise in marketing health and beauty services, gained through his role as president and chief executive officer at Elizabeth Arden Red Door Spa Holdings and his current role at The Joint Corp., is particularly valuable as we continue to provide health and wellness services in a resort-like environment.
6
Table of Contents
Joseph S. Vassalluzzo was elected a director of our company in October 2006 and our lead director in October 2008. Since August 2005, Mr. Vassalluzzo has been an independent advisor to retail organizations, with a primary emphasis on real estate. From 1989 until August 2005, Mr. Vassalluzzo held executive and senior leadership positions with Staples, Inc., an office products retailer, including vice chairman from 2000 to 2005. Previously, Mr. Vassalluzzo has held management, sales, operations and real estate positions with Mobile Corp., Amerada Hess Corp. and American Stores Company. Mr. Vassalluzzo is the non-executive chairman of the Board of Trustees of Federal Realty Investment Trust, a publicly held real estate investment trust. He is also a director, chairman of the finance and integration committee and member of the audit committee of Office Depot, Inc. Within the last five years, Mr. Vassalluzzo also served on the board of directors, and chaired the nominating committee, for iParty Corporation, a publicly held chain of party supply superstores, until its sale to Party City Holdings Inc. in May 2013.
Mr. Vassalluzzo has a history of demonstrated leadership in real estate acquisition and expansion in his roles at Staples, Inc. His real estate and expansion experience is particularly valuable as we continue to research and develop sites for new centers. His executive and senior leadership positions at numerous retailers make him well suited to be our lead director.
None of the above directors is related to each other or to any of our executive officers.
Section 16(a) Beneficial Ownership Reporting Compliance
Based upon a review of reports and written representations furnished to it, our company believes that during the fiscal year ended December 31, 2014, all filings with the SEC by its executive officers and directors complied with requirements for reporting ownership and changes in ownership of our stock pursuant to Section 16(a) of the Exchange Act.
Code of Business Conduct and Ethics
We have adopted the Life Time Fitness, Inc. Code of Business Conduct and Ethics, which applies to all of our employees, directors, agents, consultants and other representatives. The Code of Business Conduct and Ethics includes particular provisions applicable to our senior financial management, which includes our chief executive officer, chief financial officer, controller and other employees performing similar functions. A copy of our Code of Business Conduct and Ethics is available on the Corporate Governance section of the Investor Relations page on our website at lifetimefitness.com. We intend to post on our website any amendment to, or waiver from, a provision of our Code of Business Conduct and Ethics that applies to any director or officer, including our principal executive officer, principal financial officer, principal accounting officer, controller and other persons performing similar functions, promptly following the date of such amendment or waiver.
Audit Committee
Our company has a separately-designated standing audit committee established in accordance with Section 3(a)(58)(A) of the Securities Exchange Act. Our audit committee consists of Messrs. Jackson (Chair) and Eugster and Ms. Morfitt. Our board of directors has determined that all members of our audit committee are “independent,” as defined in Section 10A of the Securities Exchange Act of 1934 and pursuant to the rules of the New York Stock Exchange (“NYSE”), and that each member of our audit committee also qualifies as an “audit committee financial expert,” as defined by applicable regulations of the SEC.
7
Table of Contents
| Item 11. | EXECUTIVE COMPENSATION. |
Compensation Discussion and Analysis
This compensation, discussion and analysis (“CD&A”) provides information about our company’s compensation philosophy and 2014 executive compensation programs for the following named executive officers (“NEOs”):
| Name |
Title |
Year Employed | ||
| Bahram Akradi |
Chairman, President and Chief Executive Officer |
1992 | ||
| Jeffrey G. Zwiefel |
Executive Vice President and Chief Operating Officer |
1998 | ||
| Eric J. Buss |
Executive Vice President and Chief Financial Officer |
1999 | ||
| Tami A. Kozikowski |
Executive Vice President, Life Spa and Chief Administrative Officer |
2012 | ||
| Jess R. Elmquist |
Executive Vice President, Human Resources and Life Time University |
2005 | ||
| Michael R. Robinson(1) |
Former Executive Vice President and Chief Financial Officer |
2002 |
| (1) | Michael R. Robinson retired from his position as executive vice president and chief financial officer effective March 1, 2014. Mr. Robinson’s separation arrangement is summarized on page 24. |
While you should read the entire CD&A and the related compensation tables beginning on page 29 to fully understand our company’s executive compensation program, you may find the following helpful:
| Summary |
Page |
Description | ||||
| Executive Summary | 9 | We provide an executive summary, which includes: | ||||
| • |
Our 2014 performance; | |||||
| • | A summary of our 2013 and 2014 shareholder engagement and changes made in connection with the outreach; and | |||||
| • | 2014 compensation highlights. | |||||
| Compensation Philosophy | 13 | We describe our compensation committee’s compensation philosophy. | ||||
| Process for Establishing 2014 Compensation | 14 | We provide information on our compensation committee and independent compensation consultant as well as the roles that our executive officers play in setting NEO compensation. We describe the process in which 2014 executive compensation was established, which includes a summary of the market data considered in establishing our compensation program, our compensation committee’s evaluation of the compensation and the company’s performance and a review of the chief executive officer’s realized compensation. | ||||
| 2014 Executive Compensation Program | 18 | We summarize the elements and mix of our 2014 executive compensation and then summarize the core elements in tabular format. We then summarize our executive compensation program for 2014, which is comprised of cash (both base salary and annual incentive compensation), equity compensation in the form of annual grants of restricted stock (both time-based and performance vesting) and other items. We also provide a reconciliation of GAAP to non-GAAP financial metrics, which were used in determining the attainment of 2014 performance goals for our annual cash incentive compensation and restricted stock grants. | ||||
| Governance | 26 | We summarize our compensation-related governance policies and other considerations. | ||||
| May 2012 Grant | 27 | We provide disclosures surrounding the May 2012 grant of performance-based restricted stock, which was a grant designed to encourage transformational company performance. | ||||
8
Table of Contents
Executive Summary
2014 Performance
As shown below, we had strong financial performance in 2014 and continued to execute on our long term strategy of accelerated growth. We did miss, however, some of our previously set performance goals and, as a consequence, our incentive compensation elements paid out at below target levels. See page 25 for a reconciliation of the adjusted non-GAAP performance metrics to the corresponding GAAP financial metrics referenced throughout this CD&A.
| • | Total revenue for the year grew 7.0% to $1.291 billion from $1.206 billion in 2013. Reported net income for the year decreased 5.5% to $114.4 million from $121.0 million in 2013, and net income, adjusted to exclude non-recurring expenses associated with the exploration of converting our real estate assets into a real estate investment trust (“REIT”), the Telephone Consumer Protection Act (“TCPA”) litigation settlement , the immaterial correction of the accounting treatment of a previous financing transaction and the impact of the adjustment of a contingent liability associated with a prior acquisition, decreased to $117.8 million from $121.0 million in 2013. |
| • | Our company’s 2014 adjusted income before income taxes (also referred to as earnings before taxes, or “EBT”, throughout this CD&A) adjusted to exclude non-recurring expenses associated with the exploration of the REIT and the immaterial correction of the accounting treatment of a previous financing transaction was $192.8 million, which was less than our company’s budgeted EBT for 2014 of $211.2 million. As a result, our company’s actual payout of annual cash incentive compensation was at 91.3% of target annual cash incentive compensation. |
| • | Our company’s adjusted diluted EPS, adjusted to exclude non-recurring expenses associated with the exploration of the REIT, the TCPA litigation settlement and the immaterial correction of the accounting treatment of a previous financing transaction, for 2014 was $3.12 per share, which was greater than our company’s budgeted diluted EPS for 2014 of $3.10 per share. As a result, none of the shares subject to the NEOs’ annual restricted stock grants associated with this metric were forfeited, and the shares will vest in 25% installments over a four-year period (with the first installment having vested on March 1, 2015). |
| • | Because we did not achieve the aggressive 2014 financial objectives associated with additional restricted stock grants to our NEOs in 2014, 100% of those awards were forfeited. |
| • | With respect to the May 2012 long-term performance-based restricted stock awards, our company continues to believe that achievement of any of the cumulative diluted EPS or the return on invested capital (“ROIC”) targets are not probable. Consequently, we expect all such shares to be forfeited unless accelerated vesting was to occur in connection with a change in control transaction. To provide context for the future aggressiveness of the diluted EPS targets, the average quarterly year-over-year adjusted diluted EPS growth that would be necessary to meet 2015 and 2016 diluted EPS targets for the four quarters between January 1, 2015 and December 31, 2015 and the eight quarters between January 1, 2015 and December 31, 2016 is 97.1% and 50.6%, respectively. |
| • | In 2014, we opened six centers, of which three were in new markets. We now operate 113 centers in 32 markets in 25 states and one Canadian province. We continued to develop a pipeline for new clubs to execute on our long-term growth plans, including plans for six new center openings in existing and new markets in 2015. |
| • | Our company’s compound annual growth rate for revenue for the three-year period ended 2014 was 7.0%. |
9
Table of Contents
Summary of Shareholder Engagement and Resulting Change
Shareholder Engagement Relating to 2014 Annual Meeting
In response to a shareholder vote of 62.1% at our 2013 annual meeting approving the compensation of our NEOs as described in our 2013 proxy statement, at our compensation committee’s direction we contacted our 20 largest shareholders (representing approximately 73% of our shares), and had meaningful discussions with holders of approximately 52% of our shares. The discussions helped our compensation committee understand any concerns that may have led some of our shareholders to vote against the compensation and to receive general feedback on our executive compensation program. Conversations with two of our largest shareholders also included Mr. Vassalluzzo, the chair of our compensation committee. As a result of this feedback, we made a number of changes to our executive compensation policies and practices as described below.
Following the mailing of our proxy statement for our 2014 annual meeting, we again contacted our 20 largest shareholders to discuss the proxy statement and any concerns or comments regarding executive compensation that they may have.
In response to our outreach and the changes described in our proxy statement for our 2014 annual meeting, the shareholders vote at our 2014 annual meeting in favor of the compensation of our NEOs increased to 80.7%.
Shareholder Engagement in 2015
For 2015, again at our compensation committee’s direction we contacted shareholders representing approximately 55.98% of our shares, and had meaningful discussions with holders of approximately 29.85% of our shares. The shareholders we spoke to appreciated our continued engagement, encouraging efforts to ensure “pay for performance.”
Resulting Changes
As a result of feedback from our shareholders, over the past two years we made a number of changes to our executive compensation policies and practices as described on page 11, including the following:
| • | Our compensation committee made significant changes to our 2014 executive compensation program as described in the table below, including: |
| • | The compensation committee increased the number of shares subject to forfeiture for our annual restricted stock grant from 25% to 50%. |
| • | The compensation committee granted a new performance-based restricted stock grant that included four rigorous performance targets. If any one of those performance targets were not met, 100% of the shares would be forfeited. |
| • | Of most recent significance, the compensation committee provided that the maximum payout under our annual cash incentive program for the chief executive officer will be 200% of his base salary (and 100% of base salary with respect to the other NEOs). |
| • | We disclosed the performance metrics surrounding the May 2012 grant of performance-based restricted stock. |
| • | We adopted a number of governance-related compensation policies, including: |
| • | A stock ownership policy; |
| • | All future restricted equity grants will include double trigger vesting in the event of a change of control; |
| • | A clawback policy; |
| • | An anti-hedging policy; and |
| • | A cap on annual incentive cash compensation for the chief executive officer of 200% of his base salary (with a 100% base salary cap for the other NEOs). |
We already had an anti-pledging policy.
10
Table of Contents
The following table summarizes the primary comments from our shareholders and the actions we took in response to those comments:
| Shareholder Comments |
Compensation Committee Comments and/or Action Taken | |
| The most common comment was to ensure “pay for performance.”
• Some requested that executive compensation be aligned with total shareholder return (“TSR”).
• A few shareholders mentioned that they compared the CEO’s annual compensation against our one- and three- year TSR (as compared to our peer group’s CEO compensation against their one- and three- year TSRs).
• Many suggested use of a return metric, with ROIC as the most common metric referenced.
• A few shareholders favored TSR as a metric, while others strongly resisted its use.
• A few shareholders also requested that our compensation committee consider relative performance metrics. |
Our 2014 executive compensation program included the following changes:
• On February 25, 2014, our compensation committee made two restricted stock grants to our NEOs—the annual long-term time-based restricted stock grant, a portion of which is subject to an EPS performance condition, and a new performance- and time-based restricted stock grant, all of which is subject to aggressive performance conditions.
• With regard to the annual long-term time-based restricted stock grant, which vests in 25% installments over a four-year period, up to 50% of the shares (as opposed to 25% of the shares as provided in prior years) were subject to forfeiture if the company’s diluted EPS for 2014 fiscal year did not equal or exceed our budgeted diluted EPS for the year.
• With regard to the performance-based restricted stock grants, 100% of the shares would be forfeited if our company failed to meet any one of the following four performance targets:
• 12% TSR for fiscal 2014;
• Diluted EPS for fiscal 2014 of $3.23, representing 10% growth;
• 2014 revenue of $1.326 billion, representing 10% revenue growth; and
• Earnings before Interest, Taxes, Depreciation and Amortization (“EBITDA”) for 2014 of $374.3 million (with EBITDA calculated in the same manner as provided in our earnings releases), representing a 10% EBITDA growth.
Because these targets were not met in 2014, 100% of the performance-based restricted stock grants were forfeited.
For 2014, 57% of the cash portion of Mr. Akradi’s total target cash compensation and 36% of our other NEOs’ total target cash compensation (excluding Mr. Robinson’s) is subject to a performance metric. The financial objective for such cash compensation is EBT for the year-to-date period as compared against our 2014 budget.
Seventy percent of Mr. Akradi’s total direct compensation (which we define as total target cash compensation and incentive compensation in the form of annual equity grants) for 2014 was in the form of stock, the value of which directly ties to stock appreciation. | |
|
Many of our shareholders requested disclosure of the performance metrics underlying our May 2012 grant of performance-based restricted stock. |
Our company filed a current report on Form 8-K on December 20, 2013, which disclosed the aggressive, “stretch” long-term diluted EPS and ROIC performance goals related to the May 2012 grant and an unredacted copy of the underlying restricted stock agreement. See page 27 for more discussion of this grant. | |
|
Certain shareholders identified governance and risk mitigation policies related to executive compensation as factors they consider when evaluating our overall executive compensation program. |
Our compensation committee and/or board took the following actions related to our 2014 executive compensation:
• Adopted a stock ownership policy.
• Resolved that that all future restricted equity grants would include double trigger vesting in the event of a change of control. | |
|
• Adopted a clawback policy. | ||
|
• Adopted an anti-hedging policy. | ||
|
• Adopted a cap on annual incentive cash compensation for the chief executive officer of 200% of his base salary (with a 100% base salary cap for the other NEOs). | ||
|
We already had an anti-pledging policy.
| ||
11
Table of Contents
2014 Compensation Highlights
Establishing 2014 Compensation
In the fourth quarter of 2013, the compensation committee set executive compensation for 2014 as part of its annual review of our most recent three-year compensation program. Our compensation committee considered our then most recent financial performance as compared to both our peers and a broader selection of surveyed companies as discussed on page 15. Most important, our performance was in the top quartile for the trailing 12 month, three year and five year periods for revenue growth and EBITDA margin versus our peer group, and was either in or near the top quartile for the trailing 12 month, three year and five year periods for revenue growth and EBITDA margin versus our surveyed companies. Our market capitalization was in the 72nd percentile of our peer group and our trailing 12 month revenue was in the 59th percentile.
As a result of the positive and favorable performance of our company compared to our peer group and the survey data—generally delivering top-quartile performance versus revenue growth and EBITDA margin—as well as the factors discussed in our Compensation Philosophy section beginning on page 13, the compensation committee determined to increase our NEOs’ total direct compensation as set forth on pages 21 through 23 of this CD&A. In addition, the compensation committee noted that while our NEO’s total target direct compensation was high compared to the peer group, the increased forfeiture component of the annual stock grants and inclusion of aggressive performance metrics in much of the compensation package would serve as appropriate incentive to the NEOs.
Other highlights include:
| • | With respect to our 2014 compensation, our compensation committee engaged Mercer, its independent compensation consultant, to update its market data with respect to our peers and to provide additional, broader survey data to evaluate our executive compensation program. The compensation committee met with the consultant in executive sessions separate from management. |
| • | For our 2014 compensation we continued to engage in, or adopt, a number of best practices with respect to executive compensation: |
| • | We adopted a number of compensation-related governance policies and practices, including a stock ownership policy, double trigger vesting for future equity grants, a clawback policy and an anti-hedging policy. We had already adopted an anti-pledging policy. |
| • | A significant portion of Mr. Akradi’s total target cash compensation continued to be tied to a performance metric; fifty-seven percent. |
| • | A significant portion of Mr. Akradi’s restricted stock grants were subject to forfeiture; fifty-nine percent. |
| • | We continued to not provide tax gross-ups for perquisites or other benefits. |
| • | Our compensation committee continued to be comprised only of independent directors. |
| • | Our company’s management again conducted a comprehensive risk analysis of our executive compensation program to ensure that our program does not encourage inappropriate risk-taking and reviewed their conclusions with the compensation committee. In particular, while the performance metrics and targets are designed to incent performance, they do not incent our NEOs to engage in inappropriate risk taking. See page 27 for a full discussion of our comprehensive risk analysis of our executive compensation program. |
12
Table of Contents
| • | We engaged with our shareholders and made changes to our executive compensation program based on their feedback as described more fully above. |
| • | In late 2014, the compensation committee adopted a cap on the amount of annual incentive cash compensation payable to the chief executive officer equal to 200% of his base salary (with a 100% of base salary cap for the other NEOs). |
Compensation Philosophy
Compensation Committee’s Compensation Philosophy
Our compensation committee’s philosophy is to provide compensation to our NEOs that align their interests with the long-term interest of our shareholders. In line with this philosophy, our executive compensation goals are to:
| • | pay for performance; |
| • | attract and retain qualified talent; |
| • | motivate executives to improve the overall performance of our company; and |
| • | ensure that compensation levels are externally competitive. |
Our compensation committee considers various factors when designing a compensation program to achieve our compensation philosophy and related goals, including:
| • | how the executive’s compensation compares to market data; |
| • | the elements of compensation and the appropriate portion of compensation that should be fixed versus performance-based; |
| • | the metrics and targets used in the performance-based compensation such that it aligns our executives with our company’s goals and shareholder interests; |
| • | the actual performance of our company and our executives; |
| • | the recommendations of the chief executive officer; and |
| • | whether the compensation should be structured so as to provide for tax deductibility under Section 162(m) of the Internal Revenue Code and the potential accounting treatment for compensation. |
Compensation Philosophy as Applied to Our CEO
Our compensation committee believes that Mr. Akradi’s interests should be aligned with those of our shareholders. As such, our compensation committee has consistently provided a substantial portion of his compensation in the form of restricted stock. For 2014, approximately 70% of his total direct compensation was in the form of either performance-based or time-based restricted stock, and 57% of his total cash compensation was performance-based. Our compensation committee believes that a larger portion of Mr. Akradi’s compensation should be performance-based as compared to the other NEOs’ compensation due to his levels of responsibility and decision-making impact.
Our compensation committee also considers the following factors with respect to setting Mr. Akradi’s compensation:
| • | Mr. Akradi founded our company in 1992 and has remained one of the critical driving forces behind our mission, brand and service differentiation. Mr. Akradi has a deep understanding of the health and fitness industry through more than 30 years of work in many different capacities within the industry, including real estate and construction, finance, sales and marketing and operations. |
13
Table of Contents
| • | Mr. Akradi is heavily involved in the design, construction and day-to-day operation of our large and unique centers, as well as the comprehensive array of programs and services we deliver. |
| • | Through his leadership and continued strategic and tactical direction, Mr. Akradi has created a proven business model that continues to deliver strong results and financial performance on behalf of our shareholders by positioning our company as a market leader. |
| • | Our compensation committee recognizes that retention is key to our company’s continued success and, consequently, is an important part of its compensation program for Mr. Akradi. |
Ultimately, the compensation committee believes that Mr. Akradi’s unique role and leadership has directly contributed to our strong performance and growth and should be appropriately rewarded even when Mr. Akradi’s target opportunity is greater than the target opportunity of our peers’ CEOs.
Application of Our Philosophy – Aligning Compensation with Our Long-Term Strategy
As a company that focuses on long-term performance, our compensation committee established a three-year annual compensation program beginning in 2014 that will be reviewed annually. The program anticipates that compensation targets would be flat for three years, with any increase in compensation payout to come from exceeding budgeted goals or from an increase in stock price. The compensation committee explicitly reserved the right to revisit the program each year.
Process for Establishing 2014 Compensation
Participants Involved in Establishing Compensation
Compensation Committee
Our compensation committee, which is composed of four non-employee directors, determines all forms of compensation of our company’s executive officers. Joseph S. Vassalluzzo chairs our compensation committee. Giles H. Bateman, John K. Lloyd and Martha A. Morfitt are the other members. At all times in 2014, all of the members of our compensation committee were independent, as defined by the standards of the NYSE, and satisfied the qualification standards of Section 162(m) of the Code and Section 16 of the Securities Exchange Act of 1934.
You can read their biographies beginning on page 5.
Independent Compensation Consultant
For the review of our 2014 compensation, the compensation committee engaged its independent compensation consultant, Mercer. Mercer benchmarked the company’s executive compensation relative to the company’s peer group, survey data and, with respect to the CEO’s compensation, a new supplemental peer group of founder CEOs. Mercer also reviewed the alignment of CEO realized pay and performance of the company as compared to its peer group over a one- and three-year period.
Our compensation committee assessed Mercer’s independence pursuant to SEC and NYSE rules and concluded that no conflict of interest exists that would prevent Mercer from independently advising the compensation committee.
Management Retained Compensation Consultant
In addition, for the review of Mr. Akradi’s 2014 compensation, we engaged our own compensation consultant, Buck Consultants LLC (“Buck Consultants”), which provided information to us that included an analysis of the company’s peer group, a recommendation on a different peer group and a benchmark of the CEO’s compensation to the CEO compensation provided by the companies in the different peer group. Certain of the information Buck Consultants provided was also shared with our compensation committee.
While the compensation committee determined that Buck Consultants was not independent from management because they were retained by management, all of the information provided by Buck Consultants was also analyzed by Mercer, which provided its assessment of and recommendations regarding the information to the compensation committee, as discussed above.
14
Table of Contents
Role of Executive Officers in Compensation Decisions
In making compensation decisions for executive officers reporting to Mr. Akradi, the compensation committee solicited the views of Mr. Akradi and the compensation committee’s independent consultant. Mr. Akradi was not present during the compensation committee’s executive sessions. Our executive officers had no role in making compensation decisions.
Executive Compensation Review
Consideration of Peer Group, Founder Group (for the CEO Only) and Survey Data
As part of its review of the executive compensation, our compensation committee engaged Mercer to provide updated market compensation data. For the compensation committee’s use in setting the 2014 executive compensation program, Mercer updated the prior peer group by removing Gaylord Entertainment Co., which had converted to a REIT, and added Texas Roadhouse Inc., a consumer focused company within the targeted revenue range and with a founder CEO. The updated peer group is comprised of 12 publicly traded companies of similar size and characteristics from the consumer services global industry classification. Mercer updated the market data with respect to our peers and provided the following information relating to such peer group:
| Peer Company Name |
Trailing 12 Month Revenue ($M) |
Market Cap ($M) |
Number of Employees |
CEO Ownership (%) |
||||||||||||
| Cheesecake Factory Inc. |
1,836 | 2,220 | 33,900 | 8.3 | ||||||||||||
| Marriott Vacations Worldwide |
1,665 | 1,528 | 9,500 | <1.0 | ||||||||||||
| Texas Roadhouse Inc. |
1,298 | 1,747 | 40,000 | 9.6 | ||||||||||||
| Pinnacle Entertainment Inc. |
1,217 | 1,148 | 8,479 | 1.8 | ||||||||||||
| Ameristar Casinos Inc. |
1,178 | 869 | 7,115 | 2.0 | ||||||||||||
| Vail Resorts Inc. |
1,122 | 2,209 | 20,500 | 2.2 | ||||||||||||
| Six Flags Entertainment Corp. |
1,091 | 3,389 | 40,900 | 3.7 | ||||||||||||
| Cedar Fair |
1,082 | 2,306 | 42,700 | <1.0 | ||||||||||||
| Jos A Bank Clothiers Inc. |
1,044 | 1,156 | 6,342 | 0.5 | ||||||||||||
| Steiner Leisure Ltd. |
825 | 773 | 7,144 | <1.0 | ||||||||||||
| Ethan Allen Interiors Inc. |
732 | 832 | 5,000 | 14.0 | ||||||||||||
| Intl. Speedway Corp. |
614 | 1,452 | 840 | 4.1 | ||||||||||||
| Life Time Fitness, Inc. |
1,149 | 2,157 | 21,700 | 6.3 | % | |||||||||||
| Percentile Rank of Life Time Fitness, Inc. |
59 | % | 72 | % | 64 | % | 79 | % | ||||||||
15
Table of Contents
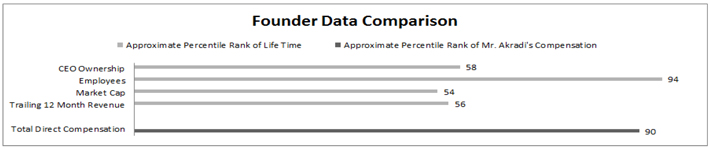
In addition, the following group of peers with founder CEOs was used as supplemental data for the CEO position:
| Founder Company Name |
Trailing 12 Month Revenue ($M) |
Market Cap ($M) |
Number of Employees |
CEO Ownership (%) |
||||||||||||
| Men’s Wearhouse Inc. |
2,518 | 1,904 | 17,500 | 3.5 | ||||||||||||
| Panera Bread Co. |
2,193 | 5,481 | 36,300 | 4.5 | ||||||||||||
| Under Armour Inc. |
1,922 | 6,274 | 5,900 | 20.0 | ||||||||||||
| Hain Celestial Group Inc. |
1,622 | 3,027 | 3,720 | 4.8 | ||||||||||||
| Papa Johns International Inc. |
1,367 | 1,427 | 18,800 | 26.9 | ||||||||||||
| Meritage Homes Corp. |
1,327 | 1,561 | 830 | 5.3 | ||||||||||||
| Gentex Corp. |
1,078 | 3,310 | 3,605 | 3.3 | ||||||||||||
| Ellis Perry Int’l Inc. |
966 | 318 | 2,600 | 11.6 | ||||||||||||
| Bridgepoint Education Inc. |
940 | 659 | 9,520 | 3.5 | ||||||||||||
| J&J Snack Foods Corp. |
861 | 1,463 | 3,200 | 20.0 | ||||||||||||
| K12 Inc. |
816 | 976 | 3,300 | 4.0 | ||||||||||||
| Tripadvisor Inc. |
809 | 8,725 | 1,575 | <1.0 | ||||||||||||
| Dreamworks Animation Inc. |
748 | 2,156 | 2,400 | 11.8 | ||||||||||||
| Morningstar Inc. |
666 | 3,607 | 3,495 | 53.0 | ||||||||||||
| Life Time Fitness, Inc. |
1,149 | 2,157 | 21,700 | 6.3 | % | |||||||||||
| Percentile Rank of Life Time Fitness, Inc. |
56 | % | 54 | % | 94 | % | 58 | % | ||||||||
The compensation committee then compared our NEOs’ 2013 base salaries, annual cash incentives and annual incentive equity award elements using the peer group for similarly positioned executives and, for the CEO only, the founder-led group.
In addition, the compensation committee reviewed survey data consisting of publicly traded companies reflecting a revenue range from $600 million to $2.4 billion from different industries. The survey data was gathered from the 2012 Mercer US Global Premium Executive Remuneration survey and provided a sample size of 181, which helped to minimize the risks associated with outliers from a smaller group. The compensation committee then compared our NEOs’ base salaries, annual cash incentives and annual long-term incentive award elements using the survey data for similarly positioned executives.
Performance as Compared to Market Data
The compensation committee does not rely on predetermined formulas or criteria when evaluating executive compensation, but considers comparable market data provided by Mercer. The following table compares the approximate percentile rank of our CEO’s compensation with the compensation of CEOs in our peer group, the surveyed companies and the founder company group:
| Total Target Cash Compensation |
Incentive Compensation (Annual Equity Grants) |
Total Direct Compensation | ||||||
| Percentile of Market Data | ||||||||
| Bahram Akradi | Peer Group Data | 75th to 90th | Above 90th | Above 90th | ||||
| Survey Data | App. 75th | App. 75th | Mod Above 75th | |||||
| Founder Group Data | App. 75th | 90th | 90th | |||||
For our other NEOs, the total direct compensation of Mr. Robinson, the company’s prior CFO, benchmarked within the 50th to 75th percentile with respect to both the peer group and survey data; Mr. Zwiefel’s total direct compensation benchmarked at approximately the 75th percentile with respect to the peer group and between the 75th and 90th percentile with respect to the survey data; Mr. Buss’s total direct compensation benchmarked at approximately the 75th percentile with respect to both the peer group and survey data; and Ms. Kozikowski’s total direct compensation benchmarked between the 25th and 50th percentile of the peer group and at approximately the 75th percentile of the survey data. Our compensation committee believed it was appropriate to pay most of our other NEOs above the 50th percentile as compared to our peer group because our company’s performance was generally in the top quartile for revenue growth and EBITDA margin as compared to our peer group. In addition, while Mr. Zwiefel’s total direct compensation benchmarked between the 75th and 90th percentile versus our peer group, Mr. Zwiefel had been compared to a combination of 3rd, 4th and 5th pay ranked executives (excluding chief financial officers) despite his position as the chief operating officer of the company. Mr. Elmquist’s compensation was not evaluated as he was not yet an executive officer.
16
Table of Contents
The following graphics show how Mr. Akradi’s total direct compensation benchmarked to the various metrics of our peer group, survey data and founder company group that our compensation committee considered.

| (1) | The trailing 12-month revenue and EBITDA margin data used the most recently reported financials. Three-year and five-year data used the mostly recently reported quarter and the period 12 quarters and 20 quarters prior, respectively. Total shareholder return is as of July 31, 2013. |
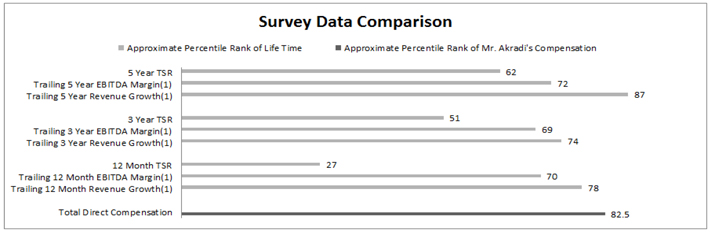
| (1) | The trailing 12-month revenue and EBITDA margin data used the most recently reported financials. Three-year and five-year data used the mostly recently reported quarter and the period 12 quarters and 20 quarters prior, respectively. Total shareholder return is as of July 31, 2013. |
Overall, our company’s performance as compared to both our peers and the broader survey companies was quite favorable. We placed in the 83rd, 82nd and 82nd percentile ranks for the trailing 12 month, three year and five year period for revenue growth, respectively, versus our peer group, and the 75th percentile ranks for each of the trailing 12 month, three year and five year EBITDA margin, respectively, versus our peer group. We placed in the 78th, 74th and 87th percentile ranks for
17
Table of Contents
the trailing 12 month, three year and five year period for revenue growth, respectively, versus our surveyed companies, and the 70th, 69th and 72nd percentile ranks for each of the trailing 12 month, three year and five year period for EBITDA margin, respectively, versus our surveyed companies. Our market capitalization was in the 72nd percentile of our peer group and our trailing 12 month revenue was in the 59th percentile. Ultimately, the compensation committee believed that longer-term metrics were more relevant in evaluating our company’s performance.
Overview of CEO Realized Pay and Performance
In connection with the compensation committee’s review of 2014 executive compensation, the compensation committee also evaluated the alignment of the chief executive officers’ realized pay to the performance of Life Time as compared to its peer companies over one- and three-year periods ended December 31, 2012. Realized compensation approximates W-2 earnings and includes the value of exercised options and vested shares. The compensation committee reviewed a metric including revenue growth, operating income growth, operating margin and net income margin and return on investment for the one-year performance measures, and total shareholder return for the three-year performance measure. The compensation committee used actual total cash compensation for each company’s most recent fiscal year for the one-year performance, and realized total direct compensation of three year average cash compensation and three year realized long-term incentive compensation.
The compensation committee observed that for both one- and three-year periods ended December 31, 2012, our chief executive officer’s realized pay and relative performance were aligned.
|
One Year Realized Pay to Relative Performance |
Three Year Realized Pay to Relative Performance | |||||||
| Combined Performance |
Total Cash Compensation |
TSR Percentile Rank |
Total Direct Compensation | |||||
| Peer Group |
92nd | 83rd | 73rd | 92nd | ||||
2014 Executive Compensation Program
Elements and Mix of 2014 Compensation
For 2014, our executive compensation included a mix of annual cash compensation, some of which varies based on company performance, long-term incentive compensation in the form of annual restricted stock grants, up to 50% of the shares of which are forfeitable if performance goals derived from our company’s annual budget are not achieved and, performance-based restricted stock grants, 100% of the shares of which are forfeited if our company failed to meet any of four aggressive performance targets: 12% TSR for fiscal 2014; 10% growth in diluted EPS for fiscal 2014; 10% growth in revenue for fiscal 2014; and 10% growth in EBITDA for fiscal 2014. The compensation committee believes that a substantial portion of compensation should either tie to performance or align the long-term interest of our executives with those of our shareholders. The compensation committee believes that compensation tied to specific performance metrics and grants of restricted stock meet those goals.
18
Table of Contents
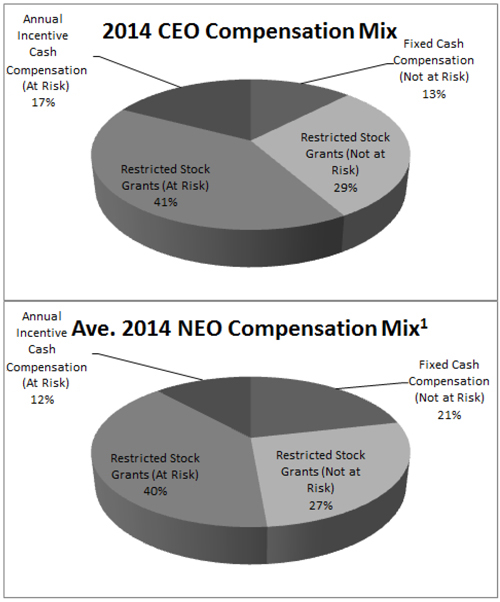
The following tables show the mix of elements of total direct compensation for Mr. Akradi and the average total direct compensation for our other NEOs (excluding Mr. Robinson, who resigned from the position of executive vice president and chief financial officer in March 2014):
| (1) | Excludes Mr. Robinson, who retired as executive vice president and chief financial officer in March 2014. |
19
Table of Contents
Core Elements of Our Company’s 2014 Executive Compensation Program
| Element |
Goal |
Basic Design |
Performance Based | |||
| Base Salary | To provide recurring compensation for the fulfillment of regular duties and responsibilities and to attract and retain talented executives | Cash payment which represents approximately 13% of the CEO’s target total direct compensation and an average of 21% of our other NEOs’ target total direct compensation | No | |||
| Annual Cash Incentive | To incent executives to deliver upon our annual financial performance goals | Cash bonuses paid on a monthly basis throughout the year based upon year-to-date EBT performance as compared to budgeted performance with a portion withheld to offset potential excess payment due to poor performance in later parts of the year | Yes | |||
| Performance goal derived from our company’s annual budgeted EBT | ||||||
| Restricted Stock (Long-Term Incentive Compensation) |
To align executives’ interests with shareholders interests and to foster an ownership culture | Three categories of restricted stock grants
59% of the CEO’s grants are subject to forfeiture and 41% are not
Subject to forfeiture, all shares of stock vest in 25% installments over a four-year period |
Yes | |||
|
To retain talented executives
|
Restricted stock grants with no forfeiture component |
No. Value increases or decreases in correlation to share price | ||||
|
To incent executives to deliver upon our financial performance goals and to retain talented executives |
Performance-based restricted stock grants with up to 100% of the shares forfeitable if our company fails to achieve an annual budgeted diluted EPS goal |
Yes | ||||
|
To incentive executives to deliver exceptional financial performance |
Performance-based restricted stock grants with 100% of the shares forfeited if our company fails to meet any one of the following four “stretch” performance goals for fiscal 2014: |
Yes | ||||
|
• 12% TSR for fiscal 2014; |
||||||
|
• 10% growth in diluted EPS; |
||||||
|
• 10% growth in revenue; and |
||||||
|
• 10% growth in EBITDA |
||||||
| Retirement Plans | To provide retirement savings in a tax-efficient manner | 401(k) plan (subject to ERISA limits) and a non-qualified deferred compensation plan, with a matching contribution, if any, determined by the compensation committee and provided to participants generally | No | |||
| Perquisites | To assist executives in carrying out their duties | Described on page 23 | No | |||
20
Table of Contents
Annual Compensation – Cash
Our compensation committee generally establishes the total cash compensation opportunity for each executive and then determines the proportion of the total cash compensation amount that will be a performance-based opportunity. The target cash compensation was increased for 2014 following the annual review of compensation.
Individually, Mr. Zwiefel continued to expand his role as chief of operations throughout 2013, in which he is responsible for all operational aspects of our Healthy Way of Life destinations along with his oversight of multiple corporate businesses and corporate services functions. He was then promoted to executive vice president and chief operating officer in October of 2013. Mr. Buss expanded his role first as interim chief financial officer in March 2014 and then as chief financial officer in July 2014. Mr. Akradi recommended, and the compensation committee approved, an increase to their total target cash compensation effective January 1, 2014.
Base Salary – NEOs
| Name |
2012 Salary($) | Change(%) | 2013 Salary($) | Change(%) | 2014 Salary($) | |||||||||||||||
| Bahram Akradi |
940,000 | — | 940,000 | 6.4 | 1,000,000 | |||||||||||||||
| Jeffrey G. Zwiefel |
300,150 | 22.2 | 366,850 | 9.0 | 400,000 | |||||||||||||||
| Eric J. Buss |
300,150 | — | 300,150 | 22.3 | 367,000 | |||||||||||||||
| Tami A. Kozikowski(1) |
— | — | 300,150 | — | 300,000 | |||||||||||||||
| Jess R. Elmquist(2) |
— | — | — | — | 240,000 | |||||||||||||||
| (1) | Ms. Kozikowski was hired in August of 2012. |
| (2) | Mr. Elmquist was promoted to Executive Vice President, Human Resources and Life Time University, and first became an NEO, for fiscal 2014. |
Annual Incentive Compensation – NEOs
With respect to performance-based cash compensation, the compensation committee determined that our company’s budgeted EBT for 2014, which was $211.2 million, was the appropriate performance metric for the performance-based portion of cash compensation to incent NEOs to improve our company’s performance. Our compensation committee believes that individual executive performances should not be highlighted in the area of cash-based incentive pay due to the executive team’s focus on collaborative decision making and on meeting our company’s financial performance goals.
Actual bonuses paid to participants equal the total cash compensation target multiplied by 2014 adjusted EBT divided by 2014 budgeted EBT, with base salary then subtracted from the resulting number. For the chief executive officer, the maximum incentive payout is capped at 200% of base salary, and for the other NEOs, the maximum incentive payout is capped at 100% of base salary. Under our cash incentive program, our company pays cash bonuses to each participant on a monthly basis throughout the year based upon its year-to-date EBT performance in relation to predetermined year-to-date budgeted EBT. Our company withholds payout on a portion of the monthly portion of the year-to-date incentive component to offset a potential excess payment in case performance falls below thresholds in later months of the year. For 2014, our adjusted EBT performance of $192.8 million was 91.3% of budgeted EBT, resulting in actual payout of our annual incentive compensation below the incentive target, which aligns with our pay-for-performance philosophy:
| Name |
2014 Incentive Cash Target($) |
2014 Incentive Cash Maximum($) |
2014 Incentive Payout($) |
|||||||||
| Bahram Akradi |
1,400,000 | 2,000,000 | 1,190,634 | |||||||||
| Jeffrey G. Zwiefel |
250,000 | 400,000 | 193,297 | |||||||||
| Eric J. Buss |
183,500 | 367,000 | 135,477 | |||||||||
| Tamara A. Kozikowski |
150,000 | 300,000 | 110,744 | |||||||||
| Jess R. Elmquist |
135,000 | 240,000 | 102,287 | |||||||||
As discussed on page 25, the compensation committee excluded the impact of the non-recurring costs associated with the exploration of the REIT and the immaterial correction of the accounting treatment of a previous financing transaction when determining whether the EBT performance target was met for 2014.
21
Table of Contents
The following table shows the payout of the annual incentive compensation as compared to the target annual incentive compensation for our NEOs over the past three years:
| Name |
2012 Incentive Comp. Payout($) |
2012 Payout vs. Target Incentive Comp(%) |
2013 Incentive Comp. Payout($) |
2013 Payout vs. Target Incentive Comp(%) |
2014 Incentive Comp. Payout($) |
2014 Payout vs. Target Incentive Comp(%) |
||||||||||||||||||
| Bahram Akradi |
1,310,225 | 100.0 | 1,237,655 | 94.5 | 1,190,634 | 85.0 | ||||||||||||||||||
| Jeffrey G. Zwiefel |
149,895 | 100.0 | 165,466 | 90.3 | 193,297 | 77.3 | ||||||||||||||||||
| Eric J. Buss |
149,895 | 100.0 | 135,381 | 90.3 | 135,477 | 73.8 | ||||||||||||||||||
| Tami A. Kozikowski(1) |
53,078 | 100.0 | 135,381 | 90.3 | 110,744 | 73.8 | ||||||||||||||||||
| Jess R. Elmquist(2) |
— | — | — | — | 102,287 | 75.8 | ||||||||||||||||||
| (1) | Ms. Kozikowski was hired in August of 2012. |
| (2) | Mr. Elmquist was promoted to Executive Vice President, Human Resources and Life Time University, and first became and NEO, for fiscal 2014. |
Long-Term Compensation – Annual Grants of Restricted Stock
For fiscal year 2014, our compensation committee determined that our NEOs should each be granted two types of restricted stock awards. The first involves shares of restricted stock that are eligible to vest 25% per year on March 1 of each of 2015, 2016, 2017 and 2018, but up to 50% of which are subject to forfeiture if the company does not reach its 2014 diluted EPS targets. The second form of award involves shares of restricted stock that are eligible to vest 25% per year on March 1 of each of 2015, 2016, 2017 and 2018, but 100% of which are forfeited if the company does not meet any one of the following targets: 12% TSR for fiscal 2014; 10% growth in diluted EPS; 10% growth in revenue; and 10% growth in EBITDA. The compensation committee believes restricted stock aligns the long-term pay our NEOs would realize upon vesting with our company’s TSR during the same period and encourages our executives to drive shareholder value.
Annual Grants of Restricted Stock – Diluted EPS Metrics
Our compensation committee determined that our NEOs should each be granted the first form of award described above involving the following number of restricted shares, subject to the forfeiture component described below:
| Name |
Number of Shares | |||
| Bahram Akradi |
100,000 | |||
| Jeffrey G. Zwiefel |
24,000 | |||
| Eric J. Buss |
20,000 | |||
| Tami A. Kozikowski |
18,000 | |||
| Jess R. Elmquist |
8,000 | |||
Our compensation committee also believes that subjecting 50% of the above annual restricted stock grant to a performance-based metric, budgeted diluted EPS for 2014 of $3.10 would incent the NEOs to meet our company’s goals while ensuring alignment with shareholder interests. Accordingly, up to 50% of the shares referenced above were subject to forfeiture in the event that our diluted EPS for 2014 was less than our budgeted diluted EPS for 2014 of $3.10 per share according to the following table:
| Diluted EPS for 2014 as a Percentage of |
Percentage of Original Restricted Shares Granted to be Forfeited | |
| 100% or Above |
0% | |
| 90% to 99% |
2% forfeited for each percent below 100% of Budgeted Diluted EPS | |
| 83% to 90% |
20% forfeited plus an additional 4% forfeited for each percent below 90% of Budgeted Diluted EPS | |
| 83% or Less |
50% |
As discussed on page 25, the compensation committee excluded the impact of the non-recurring costs associated with the exploration of the REIT, TCPA litigation settlement and the immaterial correction of the accounting treatment of a previous financing transaction when determining whether the EPS performance target was met for 2014. Because our adjusted diluted EPS of $3.12 for 2014 was higher than the budgeted diluted EPS goal for 2014, none of these shares were forfeited.
22
Table of Contents
Annual Grants of Restricted Stock – Four Targets
Our compensation committee determined that our NEOs should each be granted the second form of restricted stock award involving the following number of restricted shares that vest 25% per year on March 1 of each of 2015, 2016, 2017 and 2018, subject to the forfeiture component described below:
| Name |
Number of Shares | |||
| Bahram Akradi |
20,000 | |||
| Jeffrey G. Zwiefel |
6,000 | |||
| Eric J. Buss |
4,000 | |||
| Tami A. Kozikowski |
4,000 | |||
| Jess R. Elmquist |
2,000 | |||
Our compensation committee believed that subjecting 100% of the above annual restricted stock grant to four aggressive performance-based metrics would incent the NEOs to return exceptional performance while ensuring alignment with shareholder interests. Accordingly, all of the shares referenced above were subject to forfeiture in the event that any one of the metrics referenced in the following table was not met. The metrics were not met; consequently, all of the shares were forfeited.
| Name |
12% TSR for fiscal 2014($)(1) |
10% growth in diluted EPS ($)(2) |
10% growth in revenue($) (in thousands) |
10% growth in EBITDA($) (in thousands)(2) |
||||||||||||
| Target |
53.60 | 3.23 | 1,326,495 | 386,981 | ||||||||||||
| Performance |
53.53 | 3.12 | 1,290,620 | 383,698 | ||||||||||||
| Metric Met |
No | No | No | No | ||||||||||||
| (1) | TSR is defined as the average closing price of the company’s common stock as reported on the New York Stock Exchange on and between the dates of October 1 through December 31 of the applicable year, plus the per share amount of cash dividends paid during such year, if any. |
| (2) | As discussed on page 25, the compensation committee excluded the impact of the non-recurring costs associated with the exploration of the REIT, TCPA litigation settlement and the immaterial correction of the accounting treatment of a previous financing transaction when determining whether the EPS and EBITDA performance targets were met for 2014. |
Perquisites
We provide our executive officers with perquisites and benefits that our compensation committee believes are reasonable, competitive and consistent with our overall executive compensation program in order to attract and retain talented executives. Our executives are entitled to few benefits that are not otherwise available to all of our employees. Our compensation committee periodically reviews the levels of perquisites and other personal benefits provided to executive officers. Page 30 summarizes the perquisites.
Other Benefits
We offer the Executive Nonqualified Excess Plan of Life Time Fitness, a nonqualified deferred compensation plan, for the benefit of our highly compensated employees. Participants may voluntarily elect to defer up to 50% of their annual base salary and/or annual bonus earnings to be paid in any coming year. The investment choices available to participants are of the same type and risk categories as those offered under our 401(k) plan. We may make matching contributions and/or discretionary contributions to this plan; however, any matching contribution made by us under this plan is limited to the maximum matching contribution as a percentage of covered compensation that such participant would have received under our 401(k) plan. For 2014, our company matched 35% of the total contribution of each participant, including our NEOs, to the 401(k) and nonqualified plans.
Our NEOs are eligible for additional, company-wide benefits on the same basis as other full-time employees, including a 401(k) plan (and related matching, if any) as well as health, medical and welfare programs.
23
Table of Contents
Employment Agreements and Change in Control Provisions
Executive Employment Agreement
Messrs. Buss and Zwiefel have the same form of executive employment agreement. Messrs. Akradi and Elmquist and Ms. Kozikowski do not have an employment agreement.
We believe that our company has enjoyed considerable growth and success in the industry because of our company’s innovative, confidential and proprietary management and marketing methods and plans. We also desire to assure our executive’s continuing services including, but not limited to, under circumstances in which there is a possible threatened or actual change in control of our company. We believe it is important to diminish the inevitable distraction of the executive by virtue of the personal uncertainties and risks created by a potential severance of employment; to encourage the executive’s full attention and dedication to our company, including in the event of any threatened or impending change in control; and to provide the executive with compensation and benefits arrangements upon a severance of employment which are competitive with those of other corporations. The employment agreements address the above concerns as further described on page 36.
A summary of the payments under the executive employment agreement is included on page 36.
Change in Control Provisions
Our compensation committee requires that all equity awards granted since 2014 be subject to double trigger vesting, which means that the awards will accelerate if the employee’s employment is also terminated by our company or its successor for any reason other than cause within two years following a change in control (or if the award is not assumed by the acquiring company in the transaction). Historical grants of restricted stock made prior to 2014 (except for the May 2012 performance-based grants) provide for single trigger vesting. Further explanation of our accelerated vesting of equity award in certain situations is described on page 36.
Our agreements do not provide for any gross-up compensation with respect to any excise tax as a result of any change in control.
Transition Agreement with Mr. Robinson
On March 1, 2014, Mr. Robinson retired from his position as Executive Vice President and Chief Financial Officer. The company has retained Mr. Robinson as a part-time employee through September 1, 2015. In exchange for his continued service, the company provides the following compensation and benefits to Mr. Robinson: (i) his current annual target cash compensation for the 18 month transition period, totaling $825,000, to be paid out over the 18 month period; (ii) monthly phone and auto allowance of $1,050 to be paid out over the 18 month period; (iii) continued coverage, or reimbursement for coverage, of medical and dental benefits; and (iv) a continued Life Time Athletic membership. As a condition to such payments, Mr. Robinson agreed to a non-competition covenant for the term of his continued service. Mr. Robinson also forfeited all restricted stock that had not vested as of the end of day March 1, 2014.
24
Table of Contents
Reconciliation of 2014 Performance Metrics
In considering 2014 performance against various financial metrics for purposes of determining compensation amounts payable, the compensation committee used its discretion to exclude the impact of the non-recurring costs associated with the exploration of the REIT, TCPA litigation settlement, the immaterial correction of the accounting treatment of a previous financing transaction and the impact of the adjustment of a contingent liability associated with a prior acquisition, as explained below.
2014 Diluted EPS Reconciled to 2014 Adjusted Diluted EPS
| Fiscal Year Ended December 31, 2014 |
Explanation of Non-Recurring Adjustments | |||||
| Diluted EPS, as reported |
$ | 2.94 | ||||
| REIT exploration costs |
0.09 | Exclude the diluted per share impact of non-recurring REIT exploration costs. | ||||
| TCPA settlement accrual |
0.07 | Exclude the diluted per share impact of non-recurring TCPA settlement costs. | ||||
| Impact of financing transaction classification |
0.02 | Exclude the diluted per share impact of the correction of the accounting treatment of a previous financing transaction. | ||||
| Adjusted diluted EPS |
$ | 3.12 | ||||
2014 Income Before Income Taxes (EBT) Reconciled to 2014 Adjusted Income Before Income Taxes (Adjusted EBT)
| Fiscal Year Ended December 31, 2014 (In thousands) |
Explanation of Non-Recurring Adjustments | |||||
| Income Before Income Taxes, as reported |
$ | 188,121 | ||||
| REIT exploration costs |
3,542 | Exclude the impact of non-recurring REIT exploration costs (which are not tax deductible). | ||||
| Impact of financing transaction classification |
1,111 | Exclude the diluted per share impact of the correction of the accounting treatment of a previous financing transaction. | ||||
| Adjusted Income Before Income Taxes |
$ | 192,774 | ||||
2014 Net Income Reconciled to 2014 Adjusted Net Income
| Fiscal Year Ended December 31, 2014 (In thousands) |
Explanation of Non-Recurring Adjustments | |||||
| Net Income, as reported |
$ | 114,370 | ||||
| Impact of contingent liability reduction |
(3,634 | ) | Exclude the impact of the adjustment of a contingent liability associated with a prior acquisition | |||
| REIT exploration costs |
3,542 | Exclude the impact of non-recurring REIT exploration costs (which are not tax deductible). | ||||
| TCPA settlement accrual |
2,856 | Exclude the after-tax impact of non-recurring TCPA settlement costs. | ||||
| Impact of financing transaction classification |
677 | Exclude the diluted per share impact of the correction of the accounting treatment of a previous financing transaction. | ||||
| Adjusted Net Income |
$ | 117,811 | ||||
Comparable adjustments for these two events were also made in calculating adjusted EBITDA for purposes of assessing performance against the goals associated with certain of the 2014 grant of performance-based restricted stock.
25
Table of Contents
Compensation-Related Governance Policies and Other Considerations
The following is a summary of our material compensation-related governance policies:
| • | Stock Ownership Policy. Our stock ownership policy requires that certain executives and non-employee directors hold stock having a value equal to or greater than the corresponding amount in the following table: |
| Position |
Ownership Goal | |
| Non-employee Director |
3x annual cash stipend | |
| Chief Executive Officer or Executive Chairperson |
5x annual base salary | |
| President, Chief Operating Officer, Chief Financial Officer or Executive Vice President | 3x annual base salary | |
| Senior Vice President |
1x annual base salary |
The executives and non-employee directors have a five-year period to meet the ownership goal. All directors and NEOs currently meet the ownership goal.
| • | Clawback Policy. Our clawback policy provides that if, after an incentive award (whether cash or equity) is paid, we issue a restatement of our consolidated financial statements because of noncompliance with financial reporting requirements, each executive shall, at the request of the compensation committee, remit to our company the net proceeds of any awards (i.e., net of taxes) that the executive would not have received if the consolidated financial results had been as reported in the restatement. The policy gives the compensation committee discretion to adjust the amount subject to clawback as it deems appropriate, taking into consideration any relevant factors, including the executive’s role, if any, in the matters resulting in the restatement. |
| • | Double Trigger Vesting of Equity Awards upon a Change of Control. Beginning in 2014, the compensation committee provided that all equity awards contained accelerated vesting upon a change of control only if the employee’s employment is also terminated by our company or its successor for any reason other than cause within two years following a change of control (or if the award is not assumed by the acquiring company in the transaction), i.e., double trigger vesting. |
| • | Anti-Hedging and -Pledging Policy. As part of its insider trading policy, our company has an anti-hedging policy for all employees and directors prohibiting the purchase of any financial instruments (including prepaid variable forward contracts, equity swaps, collars, and exchange funds) that are designed to hedge or offset any decrease in the market value of our securities whether held directly or indirectly. In addition, our company has an anti-pledging policy for all executive officers and directors prohibiting them from purchasing securities on margin, borrowing against company securities held in a margin account, or pledging company securities as collateral for a loan. |
Section 162(m)
Section 162(m) of the Internal Revenue Code generally precludes a public corporation from taking a federal income tax deduction for compensation paid in excess of one million dollars per year to certain covered officers. Under this section, compensation that qualifies as performance-based for Section 162(m) purposes is not counted toward this one million dollar limit and qualifies for tax deductibility. Covered employees include our chief executive officer and the other three most highly compensated executive officers (other than our chief financial officer).
Our compensation committee considers our ability to deduct compensation in accordance with the one million dollar limitations of Section 162(m) in structuring our executive compensation programs. However, our compensation committee retains the authority to authorize the payment of compensation that may not be deductible if it believes such payments would be in the best interests of our company and our shareholders. In 2014, Section 162(m) limited the deductibility of $481,696 in compensation to Mr. Akradi as compared to $802,714 in the prior year.
26
Table of Contents
Compensation Committee Interlocks and Insider Participation
During 2014, Messrs. Bateman, Lloyd and Vassalluzzo and Ms. Morfitt served as the members of our compensation committee. No executive officer serves, or in the past has served, as a member of the board of directors or compensation committee of any entity that has any of its executive officers serving as a member of our board of directors or compensation committee.
Compensation-Related Risk
With respect to any compensation-related risk for 2014, we completed a review of our compensation policies and practices for our employees to determine the extent to which any risks arising from such policies and practices are reasonably likely to have a material adverse effect on our company. To complete this review, we first considered all compensation policies and practices for our employees, including the base salaries, annual cash incentive and long-term incentive award plans of our executive officers, as well as the compensation plans of our management level corporate employees, area directors, general managers and sales employees. The compensation arrangements and policies were then reviewed with the assistance of our internal audit, finance, human resources and legal departments, to determine any risk-taking incentives inherent in our compensation policies and practices, our internal controls that mitigate any such risks, and whether any resulting risks are reasonably likely to have a material adverse effect on our company. As part of our review, we considered whether any of our compensation policies and practices varied significantly from the overall risk and reward structure of our company and whether any of our compensation policies and practices incent individuals to take short-term risks that were inconsistent with our long-term goals. In addition, as part of its regular oversight of the compensation plan structure and administration, our compensation committee received a report on our review of compensation-related risk for 2014. Upon completion of this review, we determined there were no risks arising from our company’s compensation policies and practices that are reasonably likely to have a material adverse effect on our company.
May 2012 Grant of Performance-Based Restricted Stock
In May 2012, our compensation committee approved the grant of long-term performance-based restricted stock to management. The compensation committee’s philosophy behind the grant was to put into place special compensation awards with very aggressive, “stretch” long-term incentive targets which, if achieved, would reflect transformational company performance and likely correspond to a substantial return to our shareholders. If the goals were not achieved, no additional compensation would be paid to management and there would be no expense to our company. Such grants are subject to accelerated vesting in certain circumstances.
The following are the performance metrics underlying the plan:
| Cumulative Diluted EPS | ROIC | |||||||||||
| Measurement Period |
Diluted EPS Target | Measurement Period |
ROIC Target | |||||||||
| 2015 Performance Period 50% vest if we achieve both performance targets |
Apr. 1, 2012 through Dec. 31, 2015 |
$ | 13.68 | Jan. 1, 2015 through Dec. 31, 2015 |
8.9 | % | ||||||
| 2016 Performance Period All/remaining vest if we achieve both performance targets |
Apr. 1, 2012 through Dec. 31, 2016 |
$ | 18.96 | Jan. 1, 2016 through Dec. 31, 2016 |
9.0 | % | ||||||
In May 2012, we did not believe achievement of any of the cumulative diluted EPS or the ROIC targets to be probable. That conclusion has not changed, and no compensation expense has been recognized in our consolidated financial statements relating to the grants since their issuance.
27
Table of Contents
Our cumulative diluted EPS for the ten quarters from April 1, 2012 through December 31, 2014, the portion of the performance period that has occurred, was $7.90. In addition, our average quarterly year-over-year diluted EPS growth between April 1, 2012 and December 31, 2014 was 10.7%. To provide context for the future aggressiveness of the diluted EPS targets, the average quarterly year-over-year diluted EPS growth needed to meet 2015 and 2016 diluted EPS targets for the four quarters between January 1, 2015 and December 31, 2015 and the eight quarters between January 1, 2015 and December 31, 2016 is 97.1% and 50.6%, respectively. The highest average quarterly year-over-year diluted EPS growth over a consecutive four and eight quarter period that we have attained in the past five years was 18.4% and 16.0%, respectively.
Our ROIC for the year ended 2014 was 6.5%.
Compensation Committee Report
The compensation committee has discussed and reviewed the Compensation Discussion and Analysis with management. Based upon this review and discussion, the compensation committee recommended to the board of directors that the Compensation Discussion and Analysis be included in this Annual Report on Form 10-K.
Compensation Committee:
Joseph S. Vassalluzzo, Chair
Giles H. Bateman
John K. Lloyd
Martha A. Morfitt
28
Table of Contents
Summary Compensation Table
The following table shows information concerning compensation earned for services in all capacities during the fiscal years ended December 31, 2014, 2013 and 2012, for our chief executive officer, our chief financial officer, our three other most highly compensated executive officers who were serving at fiscal year-end and our former executive vice president and chief financial officer, together referred to as our named executive officers (“NEOs”):
| Name and Principal Position |
Year | Salary ($) |
Bonus ($) |
Stock Awards ($)(1) |
Option Awards ($) |
Non-Equity Incentive Plan Compensation ($) |
All Other Compensation ($)(2) |
Total ($) |
||||||||||||||||||||||||
| Bahram Akradi |
2014 | 1,000,000 | — | 4,725,000 | (3) | — | 1,190,634 | 176,395 | 7,092,029 | |||||||||||||||||||||||
| Chairman of the Board, President and Chief Executive Officer |
2013 | 940,000 | — | 4,180,000 | — | 1,237,655 | 84,655 | 6,442,310 | ||||||||||||||||||||||||
| 2012 | 940,000 | — | 5,099,000 | — | 1,310,225 | 73,581 | 7,422,806 | |||||||||||||||||||||||||
| Jeffrey G. Zwiefel |
2014 | 400,000 | (4) | — | 1,134,000 | (3) | — | 193,297 | 20,510 | 1,747,807 | ||||||||||||||||||||||
| Executive Vice President and Chief Operating Officer |
2013 | 366,850 | — | 836,000 | — | 165,466 | 20,405 | 1,388,721 | ||||||||||||||||||||||||
| 2012 | 300,150 | — | 1,019,800 | — | 149,895 | 22,418 | 1,492,263 | |||||||||||||||||||||||||
| Eric J. Buss (5) |
2014 | 367,000 | — | 945,000 | (3) | — | 135,477 | 21,110 | 1,468,587 | |||||||||||||||||||||||
| Executive Vice President and Chief Financial Officer |
2013 | 300,150 | — | 836,000 | — | 135,381 | 21,005 | 1,292,536 | ||||||||||||||||||||||||
| 2012 | 300,150 | — | 1,019,800 | — | 149,895 | 23,018 | 1,492,863 | |||||||||||||||||||||||||
| Tamara A. Kozikowski (6) |
2014 | 300,000 | (7) | — | 850,500 | (3) | — | 110,744 | 21,204 | 1,282,448 | ||||||||||||||||||||||
| Executive Vice President, Spa and Chief Administrative Officer |
2013 | 300,150 | — | 501,600 | — | 135,381 | 20,338 | 957,469 | ||||||||||||||||||||||||
| 2012 | 106,313 | (8) | — | 487,400 | — | 53,078 | 5,570 | 652,361 | ||||||||||||||||||||||||
| Jess R. Elmquist (9) |
2014 | 240,000 | (10) | — | 378,000 | (3) | — | 102,287 | 18,710 | 738,997 | ||||||||||||||||||||||
| Executive Vice President, Human Resources and Life Time University |
||||||||||||||||||||||||||||||||
| Michael Robinson (11) |
2014 | 519,475 | — | — | — | 21,358 | 19,610 | 560,443 | ||||||||||||||||||||||||
| Former Executive Vice President and Chief Financial Officer |
2013 | 366,850 | — | 1,045,000 | — | 165,466 | 19,505 | 1,596,821 | ||||||||||||||||||||||||
| 2012 | 366,850 | — | 1,274,750 | — | 183,205 | 23,018 | 1,847,823 | |||||||||||||||||||||||||
| (1) | Valuation of awards based on the grant date fair value of those awards computed in accordance ASC Topic 718 for the fiscal year ended December 31, 2014. The grant date fair value of the awards is calculated by multiplying the number of shares in the award, which are deemed probable of vesting, by the closing price for a share of our common stock on the NYSE on the date of grant. |
Summary Compensation Table: Supplement to Show February 2014 Performance-Based Grant Assuming Vesting
On February 26, 2014, our compensation committee approved certain performance-based restricted stock grants to our executive officers, 100% of which are subject to forfeiture if our company fails to meet any one of the following four performance targets for fiscal 2014: (i) 12% total shareholder return (“TSR”), (ii) 10% diluted EPS growth, (iii) 10% revenue growth and (iv) 10% EBITDA growth. As required by SEC rules, no value was attributed to the award in the Summary Compensation Table because, at the time of the grant, achievement of the TSR, diluted EPS, revenue growth and EBITDA growth targets was deemed not probable, and, therefore, the aggregate grant date fair value of these awards, calculated in accordance with ASC Topic 718, was zero. The grant date fair values of these awards assuming all performance targets were achieved were:
| Name |
Grant Date Fair Value of February 2014 Performance-Based Grant Assuming Full Vesting ($)(a) | ||||
| Bahram Akradi |
945,000 | ||||
| Jeffrey G. Zwiefel |
283,500 | ||||
| Eric J. Buss |
189,000 | ||||
| Tami A. Kozikowski |
189,000 | ||||
| Jess R. Elmquist |
94,500 | ||||
| Michael R. Robinson |
— | ||||
| (a) | Valuation of awards based on the grant date fair value of those awards computed in accordance with ASC Topic 718, provided, however, the table presumes that vesting of the shares is probable. The grant date fair value of the awards is calculated by multiplying the number of shares in the award by the closing price for a share of our common stock on the New York Stock Exchange on the date of grant. |
29
Table of Contents
Summary Compensation Table: Supplement to Show May 2012 Grant Assuming Vesting
On May 8, 2012, and August 17, 2012 for Ms. Kozikowski, our compensation committee approved certain restricted stock grants to our executive officers and certain other employees. As required by SEC rules, no value was attributed to the award in the Summary Compensation Table because, at the time of the grant, the achievement of the cumulative diluted EPS and ROIC targets was deemed not probable, and, therefore, the aggregate grant date fair value of these awards, calculated in accordance with ASC Topic 718, was zero. The grant date fair values of these awards assuming all performance measures will be achieved were:
| Name |
Grant Date Fair Value of May 2012 Grant Assuming Full Vesting ($)(a) | |
| Bahram Akradi |
11,061,600 | |
| Jeffrey G. Zwiefel |
2,304,500 | |
| Eric J. Buss |
2,304,500 | |
| Tami A. Kozikowski |
974,800 | |
| Jess R. Elmquist |
— | |
| Michael R. Robinson |
— |
| (a) | Valuation of awards based on the grant date fair value of those awards computed in accordance with ASC 718, provided, however, the table presumes that vesting of the shares is probable. The grant date fair value of the awards is calculated by multiplying the number of shares in the award by the closing price for a share of our common stock on the New York Stock Exchange on the date of grant. |
| (2) | The following table sets forth all other compensation amounts for 2014 by type: |
| Name |
Home Connectivity and Phone Allowance ($) |
Use of Company Car and Related Expenses ($) |
Car Allowance ($) |
Matching 401(k) and Retirement Plan Contributions ($) |
Long-term Disability Payments ($) |
Personal Use of Company Aircraft ($) |
Other ($) |
Total All Other Compensation ($) |
||||||||||||||||||||||||
| Bahram Akradi |
30,678 | (a) | 20,437 | (b) | 12,000 | 5,460 | 1,550 | 11,122 | 95,148 | (c) | 176,395 | |||||||||||||||||||||
| Jeffrey G. Zwiefel |
4,500 | — | 9,000 | 5,460 | 1,550 | — | — | 20,510 | ||||||||||||||||||||||||
| Eric J. Buss |
4,500 | — | 9,600 | 5,460 | 1,550 | — | — | 21,110 | ||||||||||||||||||||||||
| Tami A. Kozikowski |
4,500 | — | 9,600 | 5,460 | 1,550 | — | 94 | 21,204 | ||||||||||||||||||||||||
| Jess R. Elmquist |
3,300 | — | 8,400 | 5,460 | (d) | 1,550 | — | — | 18,710 | |||||||||||||||||||||||
| Michael R. Robinson |
3,600 | — | 9,000 | 5,460 | 1,550 | — | — | 19,610 | ||||||||||||||||||||||||
| (a) | Home connectivity for Mr. Akradi includes a high-speed network providing seamless integration of the computing and telephonic environments at Mr. Akradi’s home offices with those of our corporate headquarters, including the ability to use his home offices as a full-service remote location for business meetings. Phone allowance for Mr. Akradi includes his phone stipend and data plan for his tablet for the year. |
| (b) | Includes eight months of lease and auto insurance payments for a company leased car used by Mr. Akradi from January through August of 2014 and four months of the annual lease value (calculated using the Internal Revenue Service annual lease value table and guidance) of a company purchased car used by Mr. Akradi from September through December 2014. |
| (c) | Our company paid the costs, and related tax gross-up, associated with Mr. Akradi’s Hart-Scott-Rodino Act Filing required as a result of his February 2014 stock grants. |
| (d) | Includes $2,186 contributed by our company to Mr. Elmquist’s Executive Nonqualified Excess Plan. |
In addition to the amounts set forth above, our NEOs received perquisites for which there was no incremental cost to us. These perquisites include use of company tickets to certain entertainment events, minor personal travel expenses associated
30
Table of Contents
with travel and lodging for which the purpose of the trip was primarily business-related, and use of our company’s support staff for assistance with personal matters. In addition, certain personal guests accompanied Mr. Akradi, while using our plane for business-related purposes for which there were no incremental costs.
| (3) | The value for the 2014 Stock Awards represents the aggregate grant date fair value of shares of restricted stock granted to each of the NEOs on February 26, 2014, at a share price of $47.25, which was the closing price for a share of our common stock on the NYSE on February 26, 2014, for an aggregate grant date fair value computed in accordance with ASC 718 as follows: |
| Name |
Number of Shares |
Aggregate Grant Date Fair Value ($) |
||||||
| Bahram Akradi |
100,000 | 4,725,000 | ||||||
| Jeffrey G. Zwiefel |
24,000 | 1,134,000 | ||||||
| Eric J. Buss |
20,000 | 945,000 | ||||||
| Tami A. Kozikowski |
18,000 | 850,500 | ||||||
| Jess R. Elmquist |
8,000 | 378,000 | ||||||
| Michael R. Robinson |
— | — | ||||||
As discussed in footnote 1 above, no value was attributed to the February 2014 performance-based grants subject to the four performance targets in the Summary Compensation Table because, at the time of grant, they were not probable, and, therefore, the aggregate grant date fair value of these awards, calculated in accordance with ASC Topic 718, was zero.
| (4) | For the fiscal year ended December 31, 2014, $24,678 of Mr. Zwiefel’s base salary shown on the Summary Compensation Table above was deferred under the Executive Nonqualified Excess Plan. |
| (5) | Mr. Buss was appointed interim chief financial officer on March 2, 2014 and then as chief financial officer on July 21, 2014. |
| (6) | On November 1, 2014, Ms. Kozikowski transitioned from her role as Executive Vice President, Real Estate and Development to Executive Vice President, LifeSpa and Chief Administrative Officer. |
| (7) | For the fiscal year ended December 31, 2014, $42,805 of Ms. Kozikowski’s base salary shown on the Summary Compensation Table above was deferred under the Executive Nonqualified Excess Plan. |
| (8) | Ms. Kozikowski was hired in August of 2012. |
| (9) | Mr. Elmquist was promoted to Executive Vice President, Human Resources and Life Time University, and first became and NEO, for the fiscal year ended December 31, 2014. |
| (10) | For the fiscal year ended December 31, 2014, $37,953 of Mr. Elmquist’s base salary shown on the Summary Compensation Table above was deferred under the Executive Nonqualified Excess Plan. |
| (11) | On March 1, 2014, Mr. Robinson retired from his position as Executive Vice President and Chief Financial Officer. The company has retained Mr. Robinson as a part-time employee through September 1, 2015. In exchange for his continued service, the company provides the compensation and benefits to Mr. Robinson discussed on page 24 - “Transition Agreement with Mr. Robinson.” Accordingly, Mr. Robinson’s compensation for the fiscal year ended December 31, 2014 includes two months of “Salary” and “Non-Equity Incentive Plan Compensation” in the two respective columns. In addition, ten months of Mr. Robinson’s Target Pay is also included within the “Salary” column. Finally, Mr. Robinson’s “All Other Compensation” includes his continued phone and auto allowance and benefits coverage. |
31
Table of Contents
Grants of Plan-Based Awards in 2014
The following table sets forth certain information concerning plan-based awards granted to the NEOs during the 2014 fiscal year. No options were re-priced or modified during the fiscal year.
| Estimated Future Payouts Under Non- Equity Incentive Plan Awards |
Estimated Future Payouts Under Equity Incentive Plan Awards |
Grant Date Fair Value of Stock and Option Awards ($)(4) |
||||||||||||||||||||||
| Name |
Grant Date | Target ($)(1) |
Maximum Payout ($) |
Threshold (#) |
Target (#) |
|||||||||||||||||||
| Bahram Akradi |
1,400,000 | 2,000,000 | — | — | — | |||||||||||||||||||
| 2/26/2014 | — | — | 50,000 | 100,000 | (2) | 4,725,000 | ||||||||||||||||||
| 2/26/2014 | — | — | — | 20,000 | (3) | — | ||||||||||||||||||
| Jeffrey G. Zwiefel |
250,000 | 400,000 | — | — | — | |||||||||||||||||||
| 2/26/2014 | — | — | 12,000 | 24,000 | (2) | 1,134,000 | ||||||||||||||||||
| 2/26/2014 | — | — | — | 6,000 | (3) | — | ||||||||||||||||||
| Eric J. Buss |
183,500 | 367,000 | — | — | — | |||||||||||||||||||
| 2/26/2014 | — | — | 10,000 | 20,000 | (2) | 945,000 | ||||||||||||||||||
| 2/26/2014 | — | — | — | 4,000 | (3) | — | ||||||||||||||||||
| Tami A. Kozikowski |
150,000 | 300,000 | — | — | — | |||||||||||||||||||
| 2/26/2014 | — | — | 9,000 | 18,000 | (2) | 850,500 | ||||||||||||||||||
| 2/26/2014 | — | — | — | 4,000 | (3) | — | ||||||||||||||||||
| Jess R. Elmquist |
135,000 | 240,000 | — | — | — | |||||||||||||||||||
| 2/26/2014 | — | — | 4,000 | 8,000 | (2) | 378,000 | ||||||||||||||||||
| 2/26/2014 | — | — | — | 2,000 | (3) | — | ||||||||||||||||||
| Michael R. Robinson |
— | — | — | — | — | — | ||||||||||||||||||
| — | — | — | — | — | — | |||||||||||||||||||
| (1) | These amounts represent the potential target bonus amounts available to our executives for fiscal 2014 as described in the “Annual Incentive Compensation” section beginning on page 21. Actual incentive compensation paid is calculated based upon the relationship of our actual EBT performance to budgeted EBT performance, and the maximum incentive payout is capped at 200% of base salary for Mr. Akradi and 100% of base salary for all the other NEOs. The actual amounts of the incentive payouts earned by our executives during fiscal 2014 are listed in the “Non-Equity Incentive Plan Compensation” column of the Summary Compensation Table on page 29. |
| (2) | This restricted stock award granted on February 26, 2014, under our 2011 Plan, vests as to 25% of the total number of shares on March 1 of each of 2015, 2016, 2017 and 2018 (subject to accelerated vesting in certain circumstances). The Threshold amount shown for each award represents the number of shares subject only to a time-based vesting condition, and the Target amount shown includes an additional number of shares whose vesting is subject to an additional performance-based vesting condition. To the extent that performance-based vesting condition involving pre-determined diluted EPS performance hurdles are not achieved as described in the “Long-Term Compensation – Annual Grants of Restricted Stock” section on page 22, some or all of the additional restricted shares would be subject to forfeiture. |
We achieved $3.12 in adjusted diluted EPS for fiscal 2014 (after excluding the impact of the non-recurring costs associated with the exploration of the REIT, TCPA litigation settlement and the immaterial correction of the accounting treatment of a previous financing transaction, as discussed on page 25), which was higher than the budgeted diluted EPS goal of $3.10 for fiscal 2014, and, therefore, none of the additional restricted shares were forfeited.
Executives may vote and receive dividends, if any, on restricted shares that they hold; however, they are not entitled to receive dividends, if declared, until the underlying restricted shares vest. Restricted shares may not be transferred and are subject to possible forfeiture until they vest. (See “Employment Agreements and Accelerated Vesting of Equity Awards” section on page 36 for details on accelerated vesting in certain situations).
| (3) | This restricted stock award granted on February 26, 2014, under our 2011 Plan, vests as to 25% of the total number of shares on March 1 of each of 2015, 2016, 2017 and 2018 (subject to accelerated vesting in certain circumstances). 100% of the grant is subject to forfeiture if our company fails to meet all four of the performance targets as described in the “Long-Term Compensation-Annual Grants of Restricted Stock” section on page 22. The targets were not met; consequently, all of the shares were forfeited. |
| (4) | Valuation of awards based on the grant date fair value of those awards computed in accordance with ASC Topic 718 for the fiscal year ended December 31, 2014. As required by SEC rules, no value was attributed to the award discussed in footnote 3 of this table because, at the time of the grant, achievement of the four performance targets was not probable, and, therefore, the aggregate grant date fair value of these awards was zero. |
32
Table of Contents
Outstanding Equity Awards at 2014 Fiscal Year-End
The following table sets forth certain information concerning equity awards outstanding to the NEOs at December 31, 2014.
| Option Awards | Stock Awards | |||||||||||||||||||||||||||||||
| Name |
Number of Securities Underlying Unexercised Options (#) Exercisable |
Number of Securities Underlying Unexercised Options (#) Unexercisable |
Option Exercise Price ($) |
Option Expiration Date |
Number of Shares or Units of Stock That Have Not Vested (#)(1)(2) |
Market Value of Shares or Units of Stock That Have Not Vested ($)(3) |
Equity Incentive Awards: Number of Unearned Shares, Units or Other Rights That Have Not Vested (#)(4)(5) |
Equity Incentive Plan Awards: Market or Payout Value of Unearned Shares, Units or Other Rights That Have Not Vested ($)(3) |
||||||||||||||||||||||||
| Bahram Akradi |
— | — | — | — | 249,250 | 14,112,535 | 260,000 | 14,721,200 | ||||||||||||||||||||||||
| Jeffrey G. Zwiefel |
— | — | — | — | 53,850 | 3,048,987 | 56,000 | 3,170,720 | ||||||||||||||||||||||||
| Eric J. Buss |
— | — | — | — | 49,850 | 2,822,507 | 54,000 | 3,057,480 | ||||||||||||||||||||||||
| Tami. A. Kozikowski |
— | — | — | — | 31,910 | 1,806,744 | 24,000 | 1,358,880 | ||||||||||||||||||||||||
| Jess R. Elmquist |
— | — | — | — | 15,125 | 856,378 | 10,000 | 566,200 | ||||||||||||||||||||||||
| Michael R. Robinson (6) |
20,000 | (7) | — | 25.47 | 3/1/2015 | — | — | — | — | |||||||||||||||||||||||
| (1) | Includes the unvested shares of the following restricted stock awards: |
| Name |
February 23, 2011 (#)(a) |
February 21, 2012 (#)(a) |
August 17, 2012 (#)(a) |
February 26, 2013 (#)(a) |
February 26, 2014 (#)(a) |
|||||||||||||||
| Bahram Akradi |
100,000 | 100,000 | — | 100,000 | (b) | 100,000 | ||||||||||||||
| Jeffrey G. Zwiefel |
20,000 | 20,000 | — | 20,000 | (b) | 24,000 | ||||||||||||||
| Eric J. Buss |
20,000 | 20,000 | — | 20,000 | (b) | 20,000 | ||||||||||||||
| Tami A. Kozikowski |
— | — | 10,000 | 12,000 | (b) | 18,000 | ||||||||||||||
| Jess R. Elmquist |
5,000 | 5,000 | — | 6,000 | (b) | 8,000 | ||||||||||||||
| Michael R. Robinson |
— | — | — | — | — | |||||||||||||||
| (a) | The table in footnote 2 below details the vesting terms for these grants. |
| (b) | We achieved $2.93 in diluted EPS for fiscal 2013 which was 99% of the budgeted diluted EPS hurdle of $2.95 for fiscal 2013, and, therefore, one percent of the shares were forfeited for each of the NEOs, except for Mr. Elmquist who forfeited 25% of his shares because his grant was subject to a forfeiture component based on actual EBT performance for 2013 as compared to budgeted EBT for 2013. |
33
Table of Contents
| (2) | The following are the vesting terms for the restricted stock awards: |
| Date of Grant |
Vesting Terms (subject to accelerated vesting in certain circumstances) |
Performance Vesting or Forfeitures | ||
| February 23, 2011 | 25% of the total number of shares on March 1 of each of 2012, 2013, 2014 and 2015 | No Forfeiture | ||
| February 21, 2012 | 25% of the total number of shares on March 1 of each of 2013, 2014, 2015 and 2016. | No Forfeiture | ||
| August 17, 2012 | 25% of the total number of shares on August 16 of each of 2013, 2014, 2015 and 2016. | No Forfeiture | ||
| February 26, 2013 | 25% of the total number of shares on March 1 of each of 2014, 2015, 2016 and 2017. | 1% of shares granted were forfeited by each NEO. | ||
| February 26, 2014 | 25% of the total number of shares on March 1 of each of 2015, 2016, 2017 and 2018. | No Forfeiture | ||
| (3) | Value based on a share price of $56.62, which was the closing price for a share of our common stock on the NYSE on December 31, 2014. |
| (4) | Includes the unvested shares of the following restricted stock awards: |
| Name |
May 8, 2012 (#)(a) |
August 17, 2012 (#)(a) |
February 26, 2014 (#)(a) |
|||||||||
| Bahram Akradi |
240,000 | — | 20,000 | (b) | ||||||||
| Jeffrey G. Zwiefel |
50,000 | — | 6,000 | (b) | ||||||||
| Eric J. Buss |
50,000 | — | 4,000 | (b) | ||||||||
| Tami A. Kozikowski |
— | 20,000 | 4,000 | (b) | ||||||||
| Jess R. Elmquist |
8,000 | — | 2,000 | (b) | ||||||||
| Michael R. Robinson |
— | — | — | |||||||||
| (a) | The table in footnote 5 below details the vesting terms for these grants. |
| (b) | As discussed in footnote 3 of the Grants of Plan-Based Awards table on page 32, all of the performance-based shares granted on February 26, 2014 that were subject to the four performance targets were forfeited because all of the performance targets were not achieved. |
| (5) | The following are the vesting terms for the restricted stock awards: |
| Date of Grant |
Vesting Terms (subject to accelerated vesting in
certain |
Performance Vesting or Forfeitures | ||
| May 8, 2012 and August 17, 2012 | 50% of the total number of shares in the event specified cumulative diluted EPS and ROIC targets are achieved for fiscal year 2015. The remaining 50% of the total number of shares in the event the specified cumulative diluted EPS and ROIC targets are achieved for fiscal year 2016, or 100% of the total number of shares in the event the specified cumulative diluted EPS and ROIC targets are not achieved for fiscal 2015, but the cumulative diluted EPS and ROIC targets for fiscal year 2016 is achieved. | 50% of the total number of shares will be forfeited in the event the specified cumulative diluted EPS and ROIC targets are achieved for fiscal year 2015, but not achieved for fiscal year 2016. 100% of the total number of shares will be forfeited in the event the cumulative diluted EPS and ROIC targets are not achieved for fiscal years 2015 and 2016. | ||
| February 26, 2014 | 25% of the total number of shares on March 1 of each of 2015, 2016, 2017 and 2018. | 100% of the shares granted were forfeited by each NEO. | ||
| (6) | In connection with Mr. Robinson’s retirement as executive vice president and chief financial officer on March 1, 2014, Mr. Robinson forfeited all restricted stock granted by our company that had not vested as of the end of day March 1, 2014. |
| (7) | Stock option granted March 1, 2005 for 20,000 shares vested and became exercisable in 25% increments on each annual anniversary of the date of grant. |
34
Table of Contents
2014 Option Exercises and Stock Vested
The following table sets forth certain information concerning options exercised and stock vested during fiscal 2014 for the NEOs:
| Option Awards | Stock Awards | |||||||||||||||
| Name |
Number of Shares Acquired on Exercise (#) |
Value Realized on Exercise ($) |
Number of Shares Acquired on Vesting (#) |
Value Realized on Vesting ($) |
||||||||||||
| Bahram Akradi |
— | — | 95,678 | 4,516,002 | ||||||||||||
| Jeffrey G. Zwiefel |
— | — | 19,950 | 941,640 | ||||||||||||
| Eric J. Buss |
— | — | 19,950 | 941,640 | ||||||||||||
| Tami A. Kozikowski |
— | — | 5,470 | 241,209 | ||||||||||||
| Jess R. Elmquist |
— | — | 4,425 | 208,860 | ||||||||||||
| Michael R. Robinson |
67,500 | 2,004,750 | 24,937 | 1,177,026 | ||||||||||||
Nonqualified Deferred Compensation for 2014
The following table sets forth certain information concerning nonqualified deferred compensation contributed to the Executive Nonqualified Excess Plan of Life Time Fitness of amounts earned during fiscal 2014 for the NEOs:
| Name |
Executive Contributions in Last FY ($) |
Registrant Contributions in Last FY ($) |
Aggregate Earnings in Last FY ($)(1) |
Aggregate Withdrawals/ Distributions ($) |
Aggregate Balance at Last FYE ($)(2) |
|||||||||||||||
| Bahram Akradi |
— | — | — | — | — | |||||||||||||||
| Jeffrey G. Zwiefel |
24,678 | (3) | — | 18,652 | — | 215,203 | ||||||||||||||
| Eric J. Buss |
— | — | — | — | — | |||||||||||||||
| Tami A. Kozikowski |
42,805 | (3) | — | 840 | — | 43,645 | ||||||||||||||
| Jess R. Elmquist |
37,953 | (3) | 2,186 | (4) | 12,903 | 5,502 | 255,305 | |||||||||||||
| Michael R. Robinson |
— | — | — | — | — | |||||||||||||||
| (1) | The earnings listed represent, as determined by the third-party administrator of the Executive Nonqualified Excess Plan of our company, the change in the value of the investment choices selected by the participant during the fiscal year, weighted for activity, such as increases credited under the plan, transfers, and distributions, and taking into consideration any fees, reinvestments, net asset value changes, and earnings credited to the investment choices. Mr. Zwiefel’s rate of return was 10.1%; Mr. Elmquist’s rate of return was 5.5%; and Ms. Kozikowski’s rate of return was 3.8%. |
| (2) | Includes the following amounts previously reported in prior years’ Summary Compensation Tables: Mr. Zwiefel – Salary ($19,481 in 2012 and $20,414 in 2013) and All Other Compensation ($195 in 2012 and $79 in 2013). Ms. Kozikowski did not participate in the Executive Nonqualified Excess Plan prior to fiscal 2014. Mr. Elmquist first became an NEO for fiscal 2014. |
| (3) | This amount was reported in the “Salary” column of the Summary Compensation Table on page 29. |
| (4) | This amount was reported in the “All Other Compensation” column of the Summary Compensation Table on page 29. |
All highly compensated employees eligible to participate in the Executive Nonqualified Excess Plan of our company, including but not limited to our executives, may elect to defer up to 50% of their annual base salary and/or annual bonus earnings to be paid in any coming year. The investment choices available to participants under the non-qualified deferred compensation plan are of the same type and risk categories as those offered under our company’s 401(k) plan and may be modified or changed by the participant or our company at any time. Distributions can be paid out as in-service payments or at retirement. Upon retirement, a participant’s account benefits can be paid out as a lump sum or in annual installments over a term of up to 10 years. We may make matching contributions and/or discretionary contributions to this plan. However, any
35
Table of Contents
matching contribution made by our company to participants under this plan is limited to the maximum matching contribution that such participant would have received under our 401(k) plan. If we did desire to make contributions to this plan, the contributions would vest to each participant according to their years of service with our company.
Employment Agreements and Accelerated Vesting of Equity Awards
Messrs. Buss and Zwiefel have the same form of executive employment agreement. Messrs. Akradi and Elmquist and Ms. Kozikowski do not have an employment agreement. Below is a description of the payments made to Messrs. Buss and Zwiefel in certain situations pursuant to the employment agreements. Mr. Robinson retired from his position as executive vice president and chief financial officer on March 1, 2014, the terms of his transition agreement are discussed on page 24.
Executive’s Termination Other than Within One Year Following a Change of Control
Our employment agreements provide that if an executive’s employment is terminated other than within one year following a change of control (as defined in the “Definitions and Payment Details” section on page 38) for any of the following reasons then we are to provide the executive with the payments set forth below:
| • | the executive’s employment is terminated by us for any reason other than for cause (as defined in the “Definitions and Payment Details” section on page 38) or death or disability; or |
| • | the executive terminates his employment for good reason (as defined in the “Definitions and Payment Details” section on page 38). |
In the case of the executive’s termination as discussed above, then we are to provide the executive with the following:
| • | payment in an amount equal to 1 1/2 times the executive’s Target Salary (defined as the sum of the executive’s annual base salary and annual target payout under our annual cash-based incentive plan) in effect as of the termination date (or, if executive resigns for good reason due to a 25% or greater reduction in executive’s Target Salary, the Target Salary in effect immediately prior to the reduction); |
| • | up to $10,000 in aggregate reasonable outplacement costs associated with the executive’s search for new employment; and |
| • | continuation of medical plan coverage and life insurance coverage for a period of up to 18 months, not to exceed the COBRA continuation period, at the same level, in the same manner and at the same cost to the executive as in effect on the termination date of employment. |
The following table presents the estimated total amounts that would be paid out to the executive officer if his or her employment was terminated in accordance with the above as of December 31, 2014.
| Name |
Cash Severance Payments ($)(1) |
Aggregate Outplacement Costs ($) |
Continued Benefits Coverage ($)(2) |
Total Potential Payout ($) |
||||||||||||
| Bahram Akradi |
— | — | — | — | ||||||||||||
| Jeffrey G. Zwiefel |
975,000 | 10,000 | 17,681 | 1,002,681 | ||||||||||||
| Eric J. Buss |
825,750 | 10,000 | 17,681 | 853,431 | ||||||||||||
| Tami A. Kozikowski |
— | — | — | — | ||||||||||||
| Jess R. Elmquist |
— | — | — | — | ||||||||||||
| Michael R. Robinson |
— | — | — | — | ||||||||||||
| (1) | Cash Severance Payments are calculated based on the executive’s Target Salary on the date of termination. |
| (2) | Because our company’s medical plan coverage is self-funded, our company assumed that the cost of Continued Benefits Coverage would equal the difference between our company’s “net equivalency rate” as of December 31, 2014 – the amount our company charges to terminated employees who elect continued coverage under COBRA – minus the premiums for the applicable health plan. The actual amount that would be paid to the executive officer would depend upon whether the executive elected COBRA coverage pursuant to his employment agreement and would equal the amounts actually paid by our company for claims related to the covered period minus the amount the executive actually paid for medical plan coverage. Also includes 18 months of life insurance premiums paid by our company for life insurance for each executive. |
36
Table of Contents
Executive’s Termination within One Year of a Change of Control
Our employment agreements also provide that if the executive’s employment terminates within one year of a change of control for any of the following reasons then we are to provide the executive with the payments set forth below:
| • | the executive’s employment is terminated by us or a successor other than for cause or death or disability; or |
| • | the executive terminates his employment for good reason. |
In the case of the executive’s termination as discussed above, then we are to provide the executive with the following:
| • | payment in an amount equal to 1 3/4 times the executive’s Target Salary (defined as the sum of the executive’s annual base salary and annual target payout under our annual cash-based incentive plan) in effect as of the termination date (or, if executive resigns for good reason due to a 25% or greater reduction in executive’s Target Salary, the Target Salary in effect immediately prior to the reduction); |
| • | up to $10,000 in aggregate reasonable outplacement costs associated with the executive’s search for new employment; and |
| • | continuation of medical plan coverage and life insurance coverage for a period of up to 18 months, not to exceed the COBRA continuation period, at the same level, in the same manner and at the same cost to the executive as in effect on the termination date of employment. |
In addition, all stock option and restricted stock awards granted prior to December 31, 2013 (other than our May 2012 grant), provide that all stock option awards will become immediately exercisable in full and all restricted stock awards will fully vest immediately upon a change of control of our company (i.e., single trigger vesting). The May 2012 grant vests in full if the executive officer’s employment is terminated without cause any time after a change of control (or if the award is not assumed by the acquiring company in the change of control transaction)(i.e., double trigger vesting). All stock options and stock awards granted after December 31, 2013, provide for accelerated vesting upon a change of control, only if the executive’s employment is also terminated by our company or its successor for any reason other than cause within two years following a change of control (or if the award is not assumed by the acquiring company in the transaction) (i.e., double trigger vesting).
The following table presents the estimated total amounts that would be paid out to the executive officer if his employment was terminated in accordance with the above as of December 31, 2014.
| Name |
Cash Severance Payments ($)(1) |
Aggregate Outplacement Costs ($) |
Continued Benefits Coverage ($)(2) |
Value of Accelerated Equity Awards ($)(3) |
Total Potential Payout ($) |
|||||||||||||||
| Bahram Akradi |
— | — | — | 28,833,735 | 28,833,735 | |||||||||||||||
| Jeffrey G. Zwiefel |
1,137,500 | 10,000 | 17,681 | 6,219,707 | 7,384,888 | |||||||||||||||
| Eric J. Buss |
963,315 | 10,000 | 17,681 | 5,879,987 | 6,870,983 | |||||||||||||||
| Tami A. Kozikowski |
— | — | — | 3,165,624 | 3,165,624 | |||||||||||||||
| Jess R. Elmquist |
— | — | — | 1,422,578 | 1,422,578 | |||||||||||||||
| Michael R. Robinson |
— | — | — | — | — | |||||||||||||||
| (1) | Cash Severance Payments are calculated based on the executive’s Target Salary on the date of termination. |
| (2) | Because our company’s medical plan coverage is self-funded, our company assumed that the cost of Continued Benefits Coverage would equal the difference between our company’s “net equivalency rate” as of December 31, 2013 – the amount our company charges to terminated employees who elect continued coverage under Cobra – minus the premiums for the applicable health plan. The actual amount that would be paid to the executive officer would depend upon whether the executive elected Cobra coverage pursuant to his employment agreement and would equal the amounts actually paid by our company for claims related to the covered period minus the amount the executive actually paid for medical plan coverage. Also includes 18 months of life insurance premiums paid by our company for life insurance for each executive. |
37
Table of Contents
| (3) | Value based on a share price of $56.62, which was the closing price for a share of our common stock on the NYSE on December 31, 2014. Value of restricted stock awards is determined by multiplying that closing share price by the number of restricted shares. There were no unvested stock options as of December 31, 2014. The “Value of Accelerated Equity Awards” column includes the value of the February 26, 2014 performance-based restricted stock grants subject to the four performance metrics because the shares were not forfeited until February 2015 upon the completion of the financial audit for fiscal 2014. The value of performance-based shares, 100% of which were forfeited, as of December 31, 2014, was: |
| Name |
Value of February 2014 Performance-Based Grant as of December 31, 2014($) | |
| Bahram Akradi |
1,132,400 | |
| Jeffrey G. Zwiefel |
339,720 | |
| Eric J. Buss |
226,480 | |
| Tami A. Kozikowski |
226,480 | |
| Jess R. Elmquist |
113,240 | |
| Michael R. Robinson |
— |
Accelerated Vesting of Equity Awards Due to Death or Disability
Under our 2004 and 2011 Plans, and our restricted stock agreements after 2006, if an executive’s employment is terminated due to death or disability, any outstanding stock option will immediately become exercisable in full for one year (or until the option expires, if that occurs sooner), and any restricted stock award will vest in proportion to the term of the award during which the executive was employed. However, the restricted stock agreements issued in connection with the May 2012 grant do not provide for complete vesting of all restricted stock upon termination of employment due to death or disability. The following table excludes the May 2012 grants from the Value of Accelerated Equity Awards and presents the value of the restricted stock awards whose vesting would be accelerated, if the executive’s employment was terminated due to death or disability as of December 31, 2014:
| Name |
Value of Accelerated Equity Awards ($)(1) | |
| Bahram Akradi |
15,244,935 | |
| Jeffrey G. Zwiefel |
3,388,707 | |
| Eric J. Buss |
3,048,987 | |
| Tami A. Kozikowski |
2,033,224 | |
| Jess R. Elmquist |
969,618 | |
| Michael R. Robinson |
— |
| (1) | Value based on a share price of $56.62, which was the closing price for a share of our common stock on the NYSE on December 31, 2014. The value of accelerated restricted stock awards is determined by multiplying that closing share price by the number of restricted shares whose vesting is accelerated. There were no unvested stock options as of December 31, 2014. The “Value of Accelerated Equity Awards” column includes the value of the February 26, 2014 performance-based restricted stock grants subject to the four performance metrics because the shares were not forfeited until February 2015 upon the completion of the financial audit for fiscal 2014 – see footnote (3) above for the value of those grants as of December 31, 2014. |
Definitions and Payment Details
The employment agreements generally define “cause” as our determination in good faith that an executive has:
| • | engaged in willful and deliberate acts of dishonesty, fraud or unlawful behavior that adversely affects our business affairs; |
| • | been convicted of or pleaded no contest to a felony; |
38
Table of Contents
| • | been grossly negligent or engaged in willful misconduct in performing his or her duties and responsibilities and thereby materially adversely affected our business affairs; |
| • | refused to substantially perform or persistently neglected his or her duties and responsibilities, or experienced chronic unapproved absenteeism; |
| • | demonstrated an inability to perform the duties of his or her position, and is unable to satisfy within 60 days the conditions of any resulting performance improvement plan; or |
| • | breached any material terms or conditions of the employment agreement. |
Events relating to an executive’s absenteeism, neglect or refusal to perform, or inability to perform, will constitute “cause” only if we provide the executive with written notice of the event and the executive fails to remedy the event within 21 business days.
The employment agreements define “good reason” as any of the following events, provided that the executive gives written notice to our company within 90 days of the first occurrence of the event and we fail to remedy the condition within 30 days thereafter:
| • | our breach of any material terms or conditions of the employment agreement; |
| • | our executive offices are relocated outside of a 75 mile radius of its current location, if the relocation results in a material change to the location where the executive performs services for us; |
| • | our reduction of an executive’s Target Salary by 25% or more, or our material reduction of an executive’s duties and responsibilities; or |
| • | our assignment of duties and responsibilities to an executive that are materially inconsistent with the executive’s position and experience, which results in a material reduction in the executive’s duties, responsibilities or authority. |
Awards granted before April 24, 2008, under the 2004 Plan, define “change of control” as consisting of any of the following events:
| • | a change in the composition of our board of directors such that the individuals who constitute the board of directors cease for any reason to constitute at least a majority of our board of directors, provided that any director who was approved by a majority of our incumbent directors (other than in connection with a proxy contest) shall be considered an original member of our board of directors; |
| • | the consummation of a merger, tender offer or consolidation of our company with any other corporation, other than a merger or consolidation that would result in the voting securities of our company outstanding prior to the transaction continuing to represent at least 45% of the combined voting power of the voting securities of us or the surviving entity; or |
| • | the consummation of a sale of all or substantially all of the assets of our company, other than in connection with the sale-leaseback of our real estate. |
The employment agreements, as well as awards granted after April 24, 2008 under the 2004 Plan, and awards granted under the 2011 Plan, define “change of control” as consisting of any of the following events:
| • | a change in the composition of our board of directors such that the individuals who constitute the board of directors cease for any reason to constitute at least 50% of our board of directors, provided that any director who was approved by a majority of our incumbent directors (other than in connection with a proxy contest) shall be considered an original member of our board of directors; |
| • | the consummation of a merger or consolidation of our company with any other corporation or other entity, a statutory share exchange involving our capital stock, or a sale or other disposition of all or substantially all of our assets (other than in connection with a sale-leaseback of our company’s real estate) unless our shareholders own a majority of the voting power and common stock of the surviving corporation and other conditions are satisfied; |
39
Table of Contents
| • | the acquisition of beneficial ownership by a person or group which results in aggregate beneficial ownership of 30% or more of voting power or common stock, subject to certain exceptions; or |
| • | a plan to liquidate or dissolve our company. |
The payment of an executive’s Target Salary under our employment agreements will be paid in equal installments in accordance with our regular payroll schedule commencing on the first regular payroll date after the date of executive’s termination of employment, provided that the amount equal to 1/2 of executive’s Target Salary that is otherwise payable in the first six months following the termination date shall not exceed the amount that would cause the payments to be considered a deferral of compensation under Section 409A.
Payment of severance benefits under our employment agreements, whether or not termination is in connection with a change of control, is conditioned upon the executive signing and not rescinding a global release of all claims against us, and remaining in compliance with his obligations under the employment agreement to (i) protect our confidential information, (ii) refrain from competing with us for 18 months (or 24 months in connection with a change of control) after his termination of employment, (iii) refrain from hiring any of our employees for 12 months after his termination of employment, and (iv) refrain from soliciting any of our customers or inducing any customer or supplier to stop doing business with us for 12 months after his termination of employment.
COMPENSATION OF DIRECTORS
Non-employee directors are compensated for serving as directors with a grant of restricted stock, an annual stipend and annual chairperson and lead director fees, if applicable, and are also reimbursed for out-of-pocket traveling expenses incurred in attending board and committee meetings.
Director Compensation Table
The following table shows, for each of our non-employee directors, information concerning annual cash and long-term equity compensation earned for services in all capacities during the fiscal year ended December 31, 2014.
| Name |
Fees Earned or Paid in Cash ($) |
Stock Awards ($)(1) | Total ($) | |||||
| Giles H. Bateman |
78,673 | 100,009 | 178,682 | |||||
| Jack W. Eugster |
63,673 | 100,009 | 163,682 | |||||
| Guy C. Jackson |
78,673 | 100,009 | 178,682 | |||||
| John K. Lloyd |
63,673 | 100,009 | 163,682 | |||||
| Martha A. Morfitt |
63,673 | 100,009 | 163,682 | |||||
| John B. Richards |
73,673 | 100,009 | 173,682 | |||||
| Joseph S. Vassalluzzo |
168,673 | 124,999 | 293,672 | |||||
| (1) | Valuation of awards based on the grant date fair value of those awards computed in accordance with ASC 718 for the fiscal year ended December 31, 2014. The grant date fair value of the awards is calculated by multiplying the number of shares in the award by the closing price for a share of our common stock on the NYSE on the date of grant. |
All outstanding stock awards granted to non-employee directors have been in the form of restricted stock issued under our 2011 Plan. Directors may vote and receive dividends, if any, on restricted shares that they hold; however, they are not entitled to receive dividends, if declared, until the underlying restricted shares vest. Restricted shares may not be transferred and are subject to possible forfeiture until they vest, which occurs when a director ceases to be a member of our board of directors for any reason other than death, total disability or retirement unless our board of directors determines otherwise. In the event of the death, total disability or retirement of a non-employee director prior to the granting of a restricted stock award in respect of the fiscal year in which such event occurred, the restricted stock award may, in the discretion of our board of directors, be granted in respect of such fiscal year to the retired or disabled non-employee director or his or her estate. In addition, in the case of a non-employee director’s death, total disability or retirement or the occurrence of a change of control under our 2011 Plan (see “Employment Agreements and Accelerated Vesting of Equity Awards” section on page 36), all restricted shares outstanding to non-employee directors that have not previously vested or been forfeited will vest immediately.
40
Table of Contents
The following table shows, for each of our non-employee directors, the aggregate number of stock awards outstanding as of December 31, 2014:
| Name |
Aggregate Stock Awards Outstanding as of 12/31/14(#) | |
| Giles H. Bateman |
4,295 | |
| Jack W. Eugster |
4,295 | |
| Guy C. Jackson |
4,295 | |
| John K. Lloyd |
4,295 | |
| Martha A. Morfitt |
4,295 | |
| John B. Richards |
4,295 | |
| Joseph S. Vassalluzzo |
5,368 |
Stipend
An annual stipend of $60,000 was paid to each non-employee director in fiscal year 2014. The stipend is paid in cash quarterly after the end of each calendar quarter, in arrears.
Chairperson Fees
The chairpersons of our audit, compensation and finance committees each received an annual payment of $15,000, and the chairperson of our governance and nominating committee received an annual payment of $10,000 in fiscal year 2014. The annual committee chairperson fees are paid in cash quarterly after the end of each calendar quarter, in arrears.
Lead Director Fees
Our company’s non-employee lead director received an additional fee of $90,000 in fiscal year 2014. The lead director fee is paid in cash quarterly after the end of each calendar quarter, in arrears.
Restricted Stock
Each non-employee director who joins our board of directors receives an initial grant of restricted stock with a fair market value at grant date of $100,000 in connection with such a director becoming a member of our board of directors. The date of grant for such director is the date of such director’s election to our board of directors and the restrictions on the restricted stock lapse ratably on each annual anniversary of the date of grant over a three-year period. We had no new non-employee directors in fiscal year 2014.
Each non-employee director, other than our lead director, receives an annual restricted stock grant with a fair market value at grant date of $100,000 on the date of our annual shareholder meeting, or the first day of the next open trading window. The grants lapse ratably on each annual anniversary of the date of grant over a three-year period. Pursuant to this provision, Messrs. Bateman, Eugster, Jackson, Lloyd and Richards and Ms. Morfitt were each granted 2,105 shares of restricted stock on April 29, 2014.
Our lead director receives an annual restricted stock grant with a fair market value at grant date of $125,000 on the date of our annual shareholder meeting. The grants lapse ratably on each annual anniversary of the date of grant over a three-year period. Pursuant to this provision, Mr. Vassalluzzo was granted 2,631 shares of restricted stock on April 29, 2014.
Other Compensation
For the fiscal year ended December 31, 2014, all non-employee directors were provided a payment equal to the value of a one year Life Time Fitness Diamond Family Membership, which is included in the “Fees Earned or Paid in Cash” column of the Director Compensation Table on page 40.
We reimburse all non-employee directors for out-of-pocket traveling expenses incurred in attending board and committee meetings.
41
Table of Contents
| Item 12. | SECURITY OWNERSHIP OF CERTAIN BENEFICIAL OWNERS AND MANAGEMENT AND RELATED STOCKHOLDER MATTERS. |
Equity Compensation Plan Information
The following table provides information as of December 31, 2014 for compensation plans under which securities may be issued:
| Plan Category |
Number of Securities to be Issued Upon Exercise of Outstanding Options, Warrants and Rights |
Weighted-Average Exercise Price of Outstanding Options, Warrants and Rights |
Number of Securities Remaining Available for Future Issuance Under Equity Compensation Plans |
|||||||||
| Equity Compensation Plans Approved by Security Holders |
59,110 | (1) | $ | 36.24 | 2,241,210 | (2) | ||||||
| Equity Compensation Plans Not Approved by Security Holders |
— | — | — | |||||||||
|
|
|
|
|
|
|
|||||||
| Total |
59,110 | $ | 36.24 | 2,241,210 | ||||||||
|
|
|
|
|
|
|
|||||||
| (1) | This amount includes shares issuable upon the exercise of outstanding stock options granted under the 2004 Plan. This amount does not include 15,459 shares that were subject to purchase under the Life Time Fitness, Inc. Employee Stock Purchase Plan for the purchase period ended December 31, 2014. |
| (2) | This amount includes 1,012,661 shares available for issuance pursuant to equity awards that could be granted in the future under the 2011 Plan and 1,228,549 shares available for issuance under the Life Time Fitness, Inc. Employee Stock Purchase Plan. |
Securities Ownership of Certain Beneficial Owners and Management
The following table sets forth information with respect to the beneficial ownership of our common stock as of April 27, 2015 by:
| • | each person who is known by us to own beneficially more than 5% of our voting securities; |
| • | each current director; |
| • | each of the NEOs; and |
| • | all current directors and executive officers as a group. |
Beneficial ownership is determined in accordance with the Securities and Exchange Commission’s rules. In computing percentage ownership of each person, shares of common stock subject to options held by that person that are currently exercisable, or exercisable within 60 days of April 27, 2015, are deemed to be outstanding and beneficially owned by that person. These shares, however, are not deemed outstanding for the purpose of computing the percentage ownership of any other person.
42
Table of Contents
Except as indicated in the notes to this table, each shareholder named in the table has sole voting and investment power with respect to the shares set forth opposite such shareholder’s name. Percentage of ownership is based on 39,043,889 shares of our common stock outstanding on April 27, 2015. The address for each executive officer and director is 2902 Corporate Place, Chanhassen, MN 55317.
| Name and Address of Beneficial Owner |
Amount and Nature of Beneficial Ownership |
Percent of Common Stock |
||||||
| Principal Shareholders: |
||||||||
| BlackRock, Inc. (1) |
3,080,470 | 7.9 | % | |||||
| 55 East 52nd Street New York, NY 10022 |
||||||||
| Wasatch Advisors, Inc. (2) |
2,185,564 | 5.6 | % | |||||
| 150 Social Hall Avenue Salt Lake City, UT 84111 |
||||||||
| The Vanguard Group (3) |
2,186,052 | 5.6 | % | |||||
| 100 Vanguard Blvd. Malvern, PA 19355 |
||||||||
| Kornitzer Capital Management, Inc. (4) |
1,995,471 | 5.1 | % | |||||
| 5420 West 61st Place Shawnee Mission, KS 66205 |
||||||||
| Non-Employee Directors: |
||||||||
| Giles H. Bateman |
24,789 | * | ||||||
| Jack W. Eugster |
33,280 | * | ||||||
| Guy C. Jackson |
26,538 | * | ||||||
| John K. Lloyd |
20,980 | * | ||||||
| Martha A. Morfitt |
20,733 | * | ||||||
| John B. Richards |
11,020 | * | ||||||
| Joseph S. Vassalluzzo |
81,224 | * | ||||||
| Named Executive Officers: |
||||||||
| Bahram Akradi (5) |
2,499,928 | 6.4 | % | |||||
| Jeffrey G. Zwiefel |
128,956 | * | ||||||
| Eric J. Buss |
143,955 | * | ||||||
| Tami A. Kozikowski |
57,970 | * | ||||||
| Jess R. Elmquist |
26,075 | * | ||||||
| Michael R. Robinson |
0 | * | ||||||
| All current directors and executive officers as a group (13 persons)(6) |
3,090,1119 | 7.9 | % | |||||
| * | Less than 1% |
| (1) | Based on information contained in a Schedule 13G filed with the SEC on January 23, 2015, reflecting the shareholder’s beneficial ownership as of December 31, 2014. BlackRock Inc. had sole voting power for 2,995,542 shares, shared voting power for 0 shares, sole dispositive power for 3,080,470 shares and shared dispositive power for 0 shares. |
| (2) | Based on information contained in a Schedule 13G filed with the SEC on February 17, 2015, reflecting the shareholder’s beneficial ownership as of December 31, 2014. Wasatch Advisors, Inc. had sole voting power for 2,185,564 shares, shared voting power of 0 shares, sole dispositive power for 2,185,564 and shared dispositive power for 0 shares. |
| (3) | Based on information contained in a Schedule 13G filed with the SEC on February 10, 2015, reflecting the shareholder’s beneficial ownership as of December 31, 2014. The Vanguard Group had sole voting power for 54,946 shares, shared voting power for 0 shares, sole dispositive power for 2,134,006 shares and shared dispositive power for 52,046 shares. The shares reported by The Vanguard Group include: (i) 52,046 shares beneficially owned by its wholly owned subsidiary Vanguard Fiduciary Trust Company (“VFTC”) as a result of VFTC serving as investment manager of collective trust accounts; and (ii) 2,900 shares beneficially owned by its wholly owned subsidiary Vanguard Investments Australia, Ltd. (“VIA”) as a result of VIA serving as investment manager of Australia investment offerings. |
| (4) | Based on information contained in a Schedule 13G filed with the SEC on January 22, 2015, reflecting the shareholder’s beneficial ownership as of December 31, 2014. Kornitzer Capital Management, Inc. had sole voting power for 1,995,471 shares, shared voting power for 0 shares, sole dispositive power for 1,909,086 shares and shared dispositive power for 86,385 shares. |
| (5) | Includes the 60,000 shares held in a trust for the benefit of Mr. Akradi’s children. One of Mr. Akradi’s children is a co-trustee of the trust. Mr. Akradi disclaims beneficial ownership of these shares. |
| (6) | Includes 14,671 shares beneficially owned by Erik A. Lindseth, Senior Vice President and General Counsel. |
43
Table of Contents
| Item 13. | CERTAIN RELATIONSHIPS AND RELATED TRANSACTIONS, AND DIRECTOR INDEPENDENCE. |
Certain Relationships and Related Person Transactions
Related Person Transaction Approval Policy
In February 2007, our board of directors adopted a formal written related person transaction approval policy, which sets forth our company’s policies and procedures for the review, approval or ratification of any transaction required to be reported in our company’s filings with the SEC. This policy is reviewed annually. Our policy applies to any financial transaction, arrangement or relationship or any series of similar transactions, arrangements or relationships in which our company is a participant and in which a related person has a direct or indirect interest, but exempts the following:
| • | payment of compensation by our company to a related person for the related person’s service to our company in the capacity or capacities that give rise to the person’s status as a “related person”: |
| • | transactions available to all employees or all shareholders of our company on the same terms; and |
| • | transactions, which when aggregated with the amount of all other transactions between the related person and our company, involve less than $120,000 in a fiscal year, which is the threshold for disclosure of related person transactions under applicable SEC rules. |
The audit committee of our board of directors must approve any related person transaction subject to this policy before commencement of the related party transaction. The committee will analyze the following factors, in addition to any other factors the committee deems appropriate, in determining whether to approve a related party transaction:
| • | whether the terms are fair to our company; |
| • | whether the transaction is material to our company; |
| • | the role the related person has played in arranging the related person transaction; |
| • | the structure of the related person transaction; and |
| • | the interests of all related persons in the related person transaction. |
The committee may, in its sole discretion, approve or deny any related person transaction. Approval of a related person transaction may be conditioned upon our company and the related person taking such precautionary actions, as the committees deems appropriate.
Related Person Transaction Summary
Prior to the adoption of our related person transaction approval policy, our company entered into the transaction described below. We believe that the transaction set forth below was on terms no less favorable than we could have obtained from unaffiliated parties.
In October 2003, we leased a center located within a shopping center that is owned by a general partnership in which Mr. Akradi has a 100% interest. We paid $501,517 in rent in 2014 pursuant to this lease. The terms of the lease were negotiated by one of our independent directors on behalf of our company and were reviewed and approved by a majority of our independent and disinterested directors. To assist our board of directors in evaluating this transaction, a third-party expert was retained at the time of transaction to review the terms of the lease. The third-party expert determined that the terms of the lease were at market rates.
Other than the transaction set forth above, our company had no other transactions during fiscal 2014 which required review, approval or ratification under our related person transaction approval policy or where the related person transaction approval policy’s policies and procedures were not followed.
44
Table of Contents
Director Independence
Our board of directors reviews at least annually the independence of each director. During these reviews, our board of directors considers relationships between each director (considering all relevant facts and circumstances) and our company and our management to determine whether any such relationships are material. In February 2015, our board of directors conducted its annual review of director independence and determined that no material relationships existed that would disqualify any of our directors as independent under the listing standards of the New York Stock Exchange (“NYSE”) or require disclosure under SEC rules, with the exception of Mr. Akradi, who is also our chairman, president and chief executive officer. Based on a review of information provided by the directors and other information we reviewed, our board of directors concluded that none of our non-employee directors have any material relationship with our company as defined by the listing standards of the NYSE.
Our board specifically considered that for a portion of fiscal 2014, Mr. Eugster was a director and 15% equity owner of a privately held company that provides security and video surveillance related services to our company. We paid less than $500 to this company in fiscal 2014, which is significantly less than the NYSE threshold for such transactional relationships. Our board also considered that Ms. Morfitt is a director of lululemon athletica inc., a company from which we purchase certain apparel. We paid less than $833,000 to lululemon athletica inc. in fiscal 2014, which is also significantly less than the NYSE threshold for such transactional relationships. Finally, our board considered that Mr. Lloyd is the president of Meridian Health, which contracted with a third-party wellness program provider to provide certain services as part of Meridian Health’s employee wellness program. The third-party wellness program provider then subcontracted with our company to provide certain blood screening services to be included in the wellness program. We received approximately $232,500 from the third-party wellness program provider in fiscal 2014 for the Meridian Health account, which is also less than the NYSE threshold for such transactional relationships. Our board determined that the above relationships were at “arms-length” and not material to any of the entities or the directors, and that Messrs. Eugster and Lloyd and Ms. Morfitt had no personal interest in the transactions. After review of these transactions, our board of directors determined that Messrs. Bateman, Eugster, Jackson, Lloyd, Richards and Vassalluzzo and Ms. Morfitt are independent.
| Item 14. | PRINCIPAL ACCOUNTING FEES AND SERVICES. |
Fees
The following table presents the aggregate fees for professional services provided by Deloitte & Touche LLP and its affiliates (“Deloitte & Touche”) in fiscal years 2014 and 2013:
| Description of Fees |
Fiscal Year 2014 Amount |
Fiscal Year 2013 Amount |
||||||
| Audit Fees |
$ | 952,657 | $ | 790,278 | ||||
| Audit-Related Fees |
286,000 | 27,092 | ||||||
|
|
|
|
|
|||||
| Total Audit and Audit-Related Fees |
1,238,657 | 817,370 | ||||||
| Tax Fees |
740,923 | 385,045 | ||||||
|
|
|
|
|
|||||
| Total |
$ | 1,979,580 | $ | 1,202,415 | ||||
|
|
|
|
|
|||||
Audit Fees
The audit fees set forth above include fees for the integrated audit of our annual consolidated financial statements and our internal control over financial reporting. The audit fees also include fees for audit services in connection with Deloitte & Touche’s review of our interim consolidated financial statements for the first three quarters of each fiscal year.
Audit-Related Fees.
The audit-related fees set forth above for fiscal 2014 consist of fees for audit-related services performed in connection with our company’s exploration of a potential conversion of our real estate assets into a Real Estate Investment Trust (“REIT”).
Tax Fees
The tax fees set forth above consist of fees for the preparation of original and amended tax returns, tax planning and analysis and assistance with tax audits. Of the fees set forth above, Deloitte & Touche billed $278,115 and $354,095 for tax
45
Table of Contents
preparation and compliance services and $462,808 and $30,950 for other tax-related items during 2014 and 2013, respectively. The increase in other tax-related items in fiscal 2014 was due primarily to services performed in connection with our company’s exploration of a potential conversion of our real estate assets into a REIT.
Approval of Independent Registered Public Accounting Firm Services and Fees
The Audit Committee Charter requires that our audit committee approve the retention of our independent registered public accounting firm for any non-audit service and consider whether the provision of these non-audit services by our independent registered public accounting firm is compatible with maintaining our independent registered public accounting firm’s independence, prior to engagement for these services. Our audit committee also actively monitors the relationship between fees for audit and audit-related services and fees for other non-audit services. Our audit committee has delegated to the chair the authority to pre-approve additional services by our independent registered public accounting firm between committee meetings of up to $50,000, in the aggregate, without prior approval of the audit committee; however, such additional services are subsequently presented at the next meeting of the audit committee for ratification. All of the services listed under the headings Audit-Related Fees and Tax Fees were pre-approved by our audit committee, or audit committee chair, under the above described delegation.
46
Table of Contents
| Item 15. | EXHIBITS AND FINANCIAL STATEMENT SCHEDULES. |
(a) Documents filed as Part of this Annual Report on Form 10-K:
| 1. | Consolidated Financial Statements: Previously included in the Original Filing. |
| 2. | Financial Statement Schedules: The schedules are either not applicable or the required information is presented in the consolidated financial statements or notes thereto included in the Original Filing. |
(b) Exhibits:
| Exhibit |
Description |
Method of Filing | ||
| 3.1 | Amended and Restated Articles of Incorporation of the Registrant, as amended. | Incorporated by reference to Exhibit 3.1 to the Registrant’s Form 10-Q for the quarter ended September 30, 2014 (File No. 001-32230). | ||
| 3.2 | Amended and Restated Bylaws of the Registrant. | Incorporated by reference to Exhibit 3.1 to the Registrant’s Form 8-K dated March 15, 2015 (File No. 001-32230). | ||
| 4.1 | Specimen of common stock certificate. | Incorporated by reference to Exhibit 4 to Amendment No. 4 to the Registrant’s Registration Statement of Form S-1 (File No. 333-113764), filed with the Commission on June 23, 2004. | ||
| 4.2 | Rights Agreement, dated as of August 22, 2014, between Life Time Fitness, Inc. and Wells Fargo Bank, N.A. as Rights Agent. | Incorporated by reference to Exhibit 1 to the Registrant’s Registration Statement on Form 8-A filed with the Commission on August 25, 2014 (File No. 001-32230). | ||
| 10.1 | Operating Agreement of Life Time, BSC Land, DuPage Health Services Fitness Center - Bloomingdale L.L.C. dated December 1, 1999 by and between the Registrant, Bloomingdale Sports Center Land Company and Central DuPage Health. | Incorporated by reference to Exhibit 10.29 to Amendment No. 2 to the Registrant’s Form S-1 (File No. 333-113764), filed with the Commission on May 21, 2004. | ||
| 10.2# | Amended and Restated Life Time Fitness, Inc. 2004 Long-Term Incentive Plan (effective as of April 23, 2009). | Incorporated by reference to Appendix B to the Registrant’s proxy statement for its 2008 Annual Meeting of Shareholders (File No. 001-32230), filed with the Commission on March 9, 2009. | ||
| 10.3# | Form of Executive Employment Agreement. | Incorporated by reference to Exhibit 10.17 to the Registrant’s Form10-K for the year ended December 31, 2008 (File No. 001-32230). | ||
| 10.4# | Form of Incentive Stock Option for 2004 Long-Term Incentive Plan. | Incorporated by reference to Exhibit 10.19 to the Registrant’s Form10-K for the year ended December 31, 2005 (File No. 001-32230). | ||
| 10.5# | Form of Non-Incentive Stock Option Agreement for 2004 Long-Term Incentive Plan. | Incorporated by reference to Exhibit 10.20 to the Registrant’s Form10-K for the year ended December 31, 2005 (File No. 001-32230). | ||
47
Table of Contents
| Exhibit |
Description |
Method of Filing | ||
| 10.6 | Second Amended and Restated Credit Agreement, dated as of May 31, 2007, among the Company, U.S. Bank National Association, as administrative agent and lead arranger, J.P. Morgan Securities, Inc. and Royal Bank of Canada, as co-syndication agents, BMO Capital Markets, as documentation agent, and the banks party thereto from time to time. | Incorporated by reference to Exhibit 10.1 to the Registrant’s Form10-Q for the quarter ended June 30, 2007 (File No. 001-32230). | ||
| 10.7 | Security Agreement, dated as of April 15, 2005, among the Company and U.S. Bank National Association, as administrative agent. | Incorporated by reference to Exhibit 10.2 to the Registrant’s Form 8-K dated April 15, 2005 (File No. 001-32230). | ||
| 10.8# | Form of Restricted Stock Agreement (Employee) for 2004 Long-Term Incentive Plan. | Incorporated by reference to Exhibit 10.26 to the Registrant’s Form10-K for the year ended December 31, 2005 (File No. 001-32230). | ||
| 10.9 | Amendment No. 1 to Second Amended and Restated Credit Agreement, dated as of January 24, 2008, among the Company, U.S. Bank National Association, as administrative agent and lead arranger, J.P. Morgan Securities, Inc. and Royal Bank of Canada, as co-syndication agents, BMO Capital Markets, as documentation agent, and the banks party thereto from time to time. | Incorporated by reference to Exhibit 10.37 to the Registrant’s Form 10-K for the year ended December 31, 2007 (File No. 001-32230). | ||
| 10.10 | Amendment No. 2 to Second Amended and Restated Credit Agreement, dated as of June 10, 2008, among the Company, U.S. Bank National Association, as administrative agent and lead arranger, J.P. Morgan Securities, Inc. and Royal Bank of Canada, as co-syndication agents, BMO Capital Markets, as documentation agent, and the banks party thereto from time to time. | Incorporated by reference to Exhibit 10.38 to the Registrant’s Form 10-K for the year ended December 31, 2010 (File No. 001-32230). | ||
| 10.11# | Form of 2010 Restricted Stock Agreement (Forfeiture Component) for 2004 Long-Term Incentive Plan with performance-based vesting component. | Incorporated by reference to Exhibit 10.1 to the Registrant’s Form 10-Q for the quarter ended March 31, 2010 (File No. 001-32230). | ||
| 10.12# | Life Time Fitness, Inc. 2011 Long-Term Incentive Plan. | Incorporated by reference to Appendix A to the Registrant’s proxy statement for its 2011 Annual Meeting of Shareholders (File No. 001-32230) filed with the Commission on March 7, 2011. | ||
| 10.13# | Form of 2011 Restricted Stock Agreement (Forfeiture Component) for 2004 Long-Term Incentive Plan with performance vesting component. | Incorporated by reference to Exhibit 10.1 to the Registrant’s Form 10-Q for the quarter ended March 31, 2011 (File No. 001-32230). | ||
| 10.14# | Form of 2011 Restricted Stock Agreement (Non-Employee Director) for 2011 Long-Term Incentive Plan. | Incorporated by reference to Exhibit 10.3 to the Registrant’s Form 10-Q for the quarter ended June 30, 2011 (File No. 001-32230). | ||
48
Table of Contents
| Exhibit |
Description |
Method of Filing | ||
| 10.15 | Third Amended and Restated Credit Agreement dated as of June 30, 2011 between the Company; certain Subsidiaries of the Company; certain Lenders; U.S. Bank National Association, a national banking association, as one of the Lenders, as the Swingline Lender, as Agent, as Left Lead Bookrunner, and as Left Lead Arranger; J.P. Morgan Securities Inc., as Joint Bookrunner and Joint Lead Arranger; RBC Capital Markets (“RBC”), as Joint Bookrunner and Joint Lead Arranger; RBC and JPMorgan Chase Bank as Syndication Agents, and Bank of America, N.A. as Documentation Agent. | Incorporated by reference to Exhibit 10.1 to the Registrant’s Form 10-Q for the quarter ended June 30, 2011 (File No. 001-32230). | ||
| 10.16# | Form of 2012 Restricted Stock Agreement (Forfeiture Component) for 2011 Long-Term Incentive Plan with performance vesting component. | Incorporated by reference to Exhibit 10.1 to the Registrant’s Form 10-Q for the quarter ended March 31, 2012 (File No. 001-32230). | ||
| 10.17 | Amendment No. 1 to Third Amended and Restated Credit Agreement, dated as of June 8, 2012, between the Company; certain Subsidiaries of the Company; certain Lenders; U.S. Bank National Association, a national banking association, as one of the Lenders, as the Swingline Lender, as Agent, as Left Lead Bookrunner, and as Left Lead Arranger; J.P. Morgan Securities Inc., as Joint Bookrunner and Joint Lead Arranger; RBC Capital Markets (“RBC”), as Joint Bookrunner and Joint Lead Arranger; RBC and JPMorgan Chase Bank as Syndication Agents, and Bank of America, N.A. as Documentation Agent. | Incorporated by reference to Exhibit 10.2 to the Registrant’s Form 10-Q for the quarter ended June 30, 2012 (File No. 001-32230). | ||
| 10.18# | Form of 2013 Restricted Stock Agreement (Forfeiture Component) for 2011 Long-Term Incentive Plan with performance vesting component. | Incorporated by reference to Exhibit 10.1 to the Registrant’s Form 10-Q for the quarter ended March 31, 2013 (File No. 001-32230). | ||
| 10.19# | Life Time Fitness, Inc. Executive Cash Bonus Plan. | Incorporated by reference to Appendix A to the Registrant’s proxy statement for its 2013 Annual Meeting of Shareholders (File No. 001-32230), filed with the Commission on March 7, 2013. | ||
| 10.20 | Amendment No. 2 to Third Amended and Restated Credit Agreement, Amendment No. 1 to Guaranty, and Omnibus Amendment to Collateral Documents, dated as of July 24, 2013, among Life Time Fitness, Inc., certain designated subsidiaries of Life Time Fitness, Inc., U.S. Bank National Association, as administrative agent and lender, J.P. Morgan Securities LLC, RBC Capital Markets, JPMorgan Chase Bank, N.A. and Bank of America, N.A. as lenders, and certain other financial institutions. | Incorporated by reference to Exhibit 10.1 to the Registrant’s Form 8-K dated July 24, 2013 (File No. 001-32230). | ||
| 10.21# | Form of 2013 Restricted Stock Agreement (Non-Employee Director) for 2011 Long-Term Incentive Plan. | Incorporated by reference to Exhibit 10.2 to the Registrant’s Form 10-Q for the quarter ended June 30, 2013 (File No. 001-32230). | ||
49
Table of Contents
| Exhibit |
Description |
Method of Filing | ||
| 10.22# | Form of Restricted Stock Agreement for 2011 Long-Term Incentive Plan with performance-based vesting component (May 2012 grants). | Incorporated by reference to Exhibit 10.1 to the Registrant’s Form 8-K dated December 18, 2013 (File No. 001-32230). | ||
| 10.23# | Form of 2014 Restricted Stock Agreement (Diluted EPS Forfeiture Component) for 2011 Long-Term Incentive Plan with performance vesting component. | Incorporated by reference to Exhibit 10.1 to the Registrant’s Form 10-Q for the quarter ended March 31, 2014 (File No. 001-32230). | ||
| 10.24# | Form of 2014 Restricted Stock Agreement (TSR, Diluted EPS, Revenue and EBITDA Forfeiture Component) for 2011 Long-Term Incentive Plan with performance vesting component. | Incorporated by reference to Exhibit 10.2 to the Registrant’s Form 10-Q for the quarter ended March 31, 2014 (File No. 001-32230). | ||
| 10.25 | Amendment No. 3 to Third Amended and Restated Credit Agreement dated as of May 30, 2014, among Life Time Fitness, Inc., certain designated subsidiaries of Life Time Fitness, Inc., U.S. Bank National Association, as administrative agent and lender, Royal Bank of Canada, JPMorgan Chase Bank, N.A. and Bank of America, N.A. and certain other financial institutions, as lenders. | Incorporated by reference to Exhibit 10.1 to the Registrant’s Form 8-K dated May 30, 2014 (File No. 001-32230). | ||
| 10.26# | Form of 2014 Restricted Stock Agreement (Non-Employee Director) for 2011 Long-Term Incentive Plan. | Incorporated by reference to Exhibit 10.1 to the Registrant’s Form 10-Q for the quarter ended June 30, 2014 (File No. 001-32230). | ||
| 10.27# | Transition Agreement between Life Time Fitness, Inc. and Michael R. Robinson, dated July 8, 2014. | Incorporated by reference to Exhibit 10.1 to the Registrant’s Form 10-Q for the quarter ended September 30, 2014 (File No. 001-32230). | ||
| 10.28# | Amended and Restated Non-Employee Director Compensation Package, effective January 1, 2015. | Incorporated by reference to Exhibit 10.28 to the Registrant’s Form 10-K for the year ended December 31, 2014 (File No. 001-32230). | ||
| 21 | Subsidiaries of the Registrant. | Incorporated by reference to Exhibit 21 to the Registrant’s Form 10-K for the year ended December 31, 2014 (File No. 001-32230). | ||
| 23 | Consent of Independent Registered Public Accounting Firm. | Incorporated by reference to Exhibit 23 to the Registrant’s Form 10-K for the year ended December 31, 2014 (File No. 001-32230). | ||
| 24 | Powers of Attorney. | Incorporated by reference to Exhibit 24 to the Registrant’s Form 10-K for the year ended December 31, 2014 (File No. 001-32230). | ||
| 31.1 | Rule 13a-14(a)/15d-14(a) Certification by Principal Executive Officer. | Filed Electronically. | ||
| 31.2 | Rule 13a-14(a)/15d-14(a) Certification by Principal Financial Officer. | Filed Electronically. | ||
| 32 | Section 1350 Certifications. | Filed Electronically. | ||
50
Table of Contents
| Exhibit |
Description |
Method of Filing | ||
| 101 | The following materials from Life Time Fitness’s Annual Report on Form 10-K for the year ended December 31, 2014, formatted in eXtensible Business Reporting Language (XBRL): (i) consolidated balance sheets, (ii) consolidated statements of operations, (iii) consolidated statements of comprehensive income (iv) consolidated statements of shareholders’ equity, (v) consolidated statements of cash flows, and (vi) notes to the consolidated financial statements. | Incorporated by reference to Exhibit 101 to the Registrant’s Form 10-K for the year ended December 31, 2014 (File No. 001-32230). | ||
51
Table of Contents
SIGNATURES
Pursuant to the requirements of the Securities Exchange Act of 1934, Life Time Fitness, Inc. has duly caused this report to be signed on its behalf by the undersigned, thereunto duly authorized on April 30, 2015.
| LIFE TIME FITNESS, INC. | ||
| By: | /s/ Bahram Akradi | |
| Bahram Akradi | ||
| Chairman of the Board of Directors, President and Chief Executive Officer | ||
Pursuant to the requirements of the Securities Exchange Act of 1934, this report has been signed on April 30, 2015 by the following persons on behalf of the Registrant in the capacities indicated.
| LIFE TIME FITNESS, INC. | ||
| By: | /s/ Bahram Akradi | |
| Bahram Akradi | ||
| Chairman of the Board of Directors, President, Chief Executive Officer and Director | ||
| (Principal Executive Officer and Director) | ||
| By: | /s/ Eric J. Buss | |
| Eric J. Buss | ||
| Executive Vice President and Chief Financial Officer | ||
| (Principal Financial Officer) | ||
| By: | /s/ John M. Hugo | |
| John M. Hugo | ||
| Senior Vice President and Corporate Controller | ||
| (Principal Accounting Officer) | ||
| Directors | ||
| Giles H. Bateman * | ||
| Jack W. Eugster * | ||
| Guy C. Jackson * | ||
| John K. Lloyd * | ||
| Martha A. Morfitt * | ||
| John B. Richards * | ||
| Joseph S. Vassalluzzo * | ||
| * | Eric J. Buss, by signing his name hereto, does hereby sign this document on behalf of each of the above-named officers and/or directors of the Registrant pursuant to powers of attorney duly executed by such persons. |
| By: | /s/ Eric J. Buss | |
| Eric J. Buss, Attorney-in-Fact |
52