Attached files
| file | filename |
|---|---|
| EX-99.1 - EX-99.1 - Armada Hoffler Properties, Inc. | d917314dex991.htm |
| 8-K - 8-K - Armada Hoffler Properties, Inc. | d917314d8k.htm |
| Exhibit 99.2
|
Armada hoffler properties, inc.
First quarter 2015 supplemental information
Virginia beach town center
|
|
Table of contents
Forward Looking Statements 3 Corporate Profile 4 Highlights 5 2015 Outlook 6 Summary Information 7 Summary Balance Sheet 8 Summary Income Statement 9 FFO, Normalized FFO & Adjusted FFO 10 Outstanding Debt 11 Core Debt to Core EBITDA 12 Debt Information 13 Property Portfolio 14 Property Portfolio Footnotes 15 Development Pipeline 16 Acquisitions & Dispositions 17 Construction Business Summary 18 Same Store NOI by Segment 19 Top 10 Tenants by Annualized Base Rent 20 Office Lease Summary 21 Office Lease Expirations 22 Retail Lease Summary 23 Retail Lease Expirations 24 Net Asset Value Component Data 26 Appendix—Definitions & Reconciliations 27 Definitions 28 Reconciliations 32
| 2 |
|
|
|
Forward-looking statements
This Supplemental Information should be read in conjunction with our Quarterly Report on Form 10-Q for the quarter ended March 31, 2015, and the unaudited condensed consolidated financial statements appearing in our press release dated April 30, 2015, which has been furnished as Exhibit 99.1 to our Form 8-K filed on April 30, 2015. The Company makes statements in this Supplemental Information that are forward-looking statements within the meaning of the Private Securities Litigation Reform Act of 1995 (set forth in Section 27A of the Securities Act of 1933, as amended (the “Securities Act”), and Section 21E of the Securities Exchange Act of 1934, as amended (the “Exchange Act”)). In particular, statements pertaining to our capital resources, portfolio performance and results of operations contain forward-looking statements. Likewise, all of our statements regarding anticipated growth in our funds from operations, normalized funds from operations, adjusted funds from operations, funds available for distribution and net operating income are forward-looking statements. You can identify forward-looking statements by the use of forward-looking terminology such as “believes,” “expects,” “may,” “will,” “should,” “seeks,” “approximately,” “intends,” “plans,” “estimates” or “anticipates” or the negative of these words and phrases or similar words or phrases which are predictions of or indicate future events or trends and which do not relate solely to historical matters. You can also identify forward-looking statements by discussions of strategy, plans or intentions.
Forward-looking statements involve numerous risks and uncertainties and you should not rely on them as predictions of future events. Forward-looking statements depend on assumptions, data or methods which may be incorrect or imprecise and the Company may not be able to realize them. The Company does not guarantee that the transactions and events described will happen as described (or that they will happen at all). For further discussion of risk factors and other events that could impact our future results, please refer to the section entitled “Risk Factors” in our most recent Annual Report on Form 10-K filed with the Securities and Exchange Commission (the “SEC”), and the documents subsequently filed by us from time to time with the SEC.
3
|
|
Corporate profile
Armada Hoffler Properties, Inc. (NYSE: AHH) is a full service real estate company that develops, constructs and owns institutional grade office, retail and multifamily properties in the Mid-Atlantic United States. The Company also provides general contracting and development services to third-party clients throughout the Mid-Atlantic and Southeastern regions. Armada Hoffler Properties, Inc. was founded in 1979 and is headquartered in Virginia Beach, VA. The Company has elected to be taxed as a real estate investment trust (“REIT”) for U.S. federal income tax purposes.
Board of Directors Corporate Officers
Daniel A. Hoffler Executive Chairman of the Board Louis S. Haddad President and Chief Executive Officer A. Russell Kirk Vice Chairman of the Board Anthony P. Nero President of Development Louis S. Haddad Director Shelly R. Hampton President of Asset Management John W. Snow Lead Independent Director Eric E. Apperson President of Construction George F. Allen Independent Director Michael P. O’Hara Chief Financial Officer and Treasurer
James A. Carroll Independent Director Eric L. Smith Vice President of Operations and Corporate Secretary James C. Cherry Independent Director Eva S. Hardy Independent Director Joseph W. Prueher Independent Director
Analyst Coverage
Raymond James & Associates Robert W. Baird & Co. Stifel, Nicolaus & Company, Inc. Wunderlich Securities Bill Crow David Rodgers John Guinee Craig Kucera (727) 567-2594 (216) 737-7341 (443) 224-1307 (540) 277-3366 bill.crow@raymondjames.com drodgers@rwbaird.com jwguinee@stifel.com ckucera@wundernet.com
Investor Relations Contact
Julie Loftus Trudell
Vice President of Investor Relations (757) 366-6692 jtrudell@armadahoffler.com
| 4 |
|
|
|
hightlights
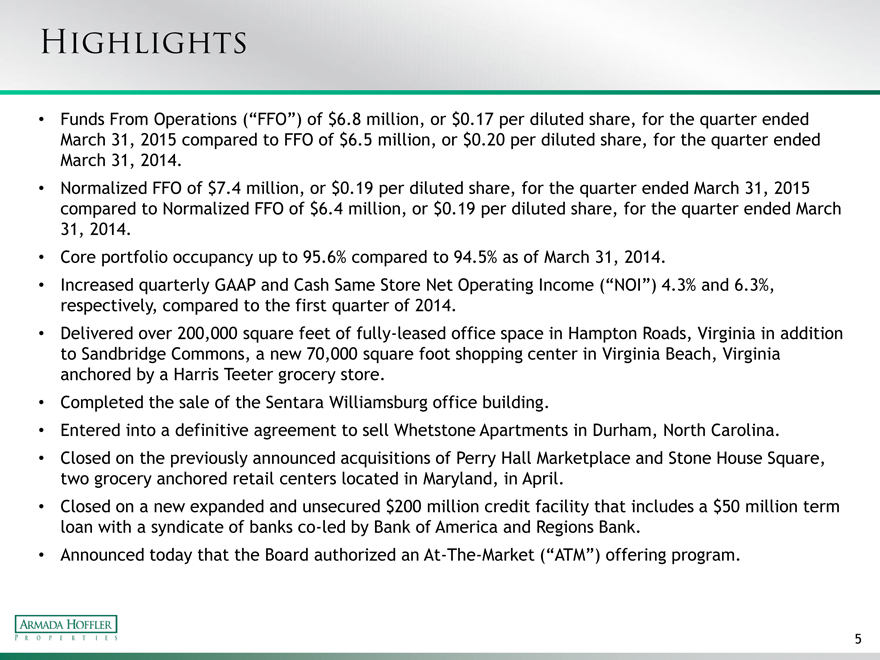
Funds From Operations (“FFO”) of $6.8 million, or $0.17 per diluted share, for the quarter ended
March 31, 2015 compared to FFO of $6.5 million, or $0.20 per diluted share, for the quarter ended March 31, 2014.
Normalized FFO of $7.4 million, or $0.19 per diluted share, for the quarter ended March 31, 2015 compared to Normalized FFO of $6.4 million, or $0.19 per diluted share, for the quarter ended March 31, 2014.
Core portfolio occupancy up to 95.6% compared to 94.5% as of March 31, 2014.
Increased quarterly GAAP and Cash Same Store Net Operating Income (“NOI”) 4.3% and 6.3%, respectively, compared to the first quarter of 2014.
Delivered over 200,000 square feet of fully-leased office space in Hampton Roads, Virginia in addition to Sandbridge Commons, a new 70,000 square foot shopping center in Virginia Beach, Virginia anchored by a Harris Teeter grocery store.
Completed the sale of the Sentara Williamsburg office building.
Entered into a definitive agreement to sell Whetstone Apartments in Durham, North Carolina.
Closed on the previously announced acquisitions of Perry Hall Marketplace and Stone House Square, two grocery anchored retail centers located in Maryland, in April.
Closed on a new expanded and unsecured $200 million credit facility that includes a $50 million term loan with a syndicate of banks co-led by Bank of America and Regions Bank.
Announced today that the Board authorized an At-The-Market (“ATM”) offering program.
| 5 |
|
|
|
2015 outlook
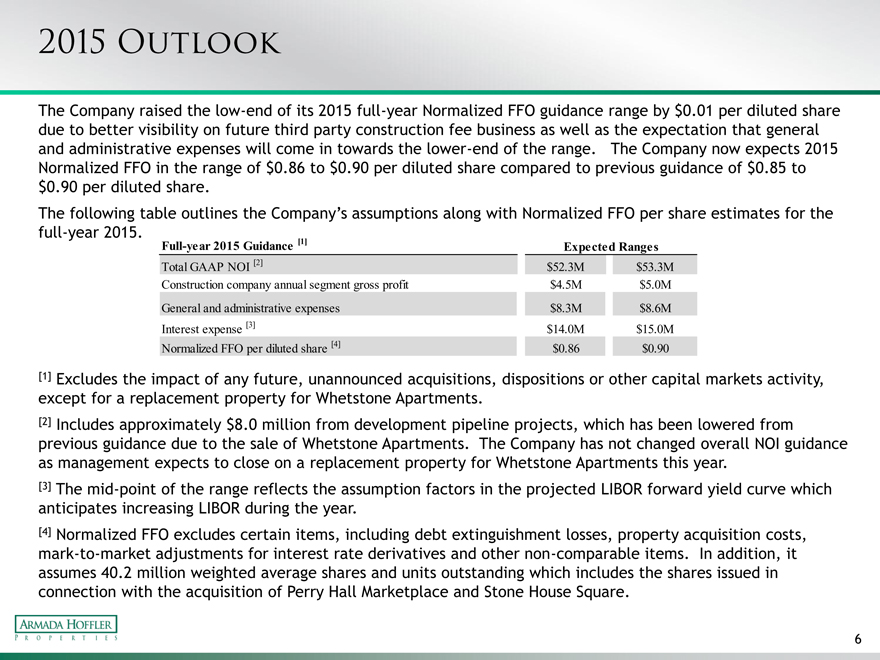
The Company raised the low-end of its 2015 full-year Normalized FFO guidance range by $0.01 per diluted share due to better visibility on future third party construction fee business as well as the expectation that general and administrative expenses will come in towards the lower-end of the range. The Company now expects 2015 Normalized FFO in the range of $0.86 to $0.90 per diluted share compared to previous guidance of $0.85 to
$0.90 per diluted share.
The following table outlines the Company’s assumptions along with Normalized FFO per share estimates for the full-year 2015.
Full-year 2015 Guidance [1] Expected Ranges
Total GAAP NOI [2] $52.3M $53.3M Construction company annual segment gross profit $4.5M $5.0M General and administrative expenses $8.3M $8.6M Interest expense [3] $14.0M $15.0M Normalized FFO per diluted share [4] $0.86 $0.90
[1] Excludes the impact of any future, unannounced acquisitions, dispositions or other capital markets activity, except for a replacement property for Whetstone Apartments.
[2] Includes approximately $8.0 million from development pipeline projects, which has been lowered from previous guidance due to the sale of Whetstone Apartments. The Company has not changed overall NOI guidance as management expects to close on a replacement property for Whetstone Apartments this year.
[3] The mid-point of the range reflects the assumption factors in the projected LIBOR forward yield curve which anticipates increasing LIBOR during the year.
[4] Normalized FFO excludes certain items, including debt extinguishment losses, property acquisition costs, mark-to-market adjustments for interest rate derivatives and other non-comparable items. In addition, it assumes 40.2 million weighted average shares and units outstanding which includes the shares issued in connection with the acquisition of Perry Hall Marketplace and Stone House Square.
| 6 |
|
|
|
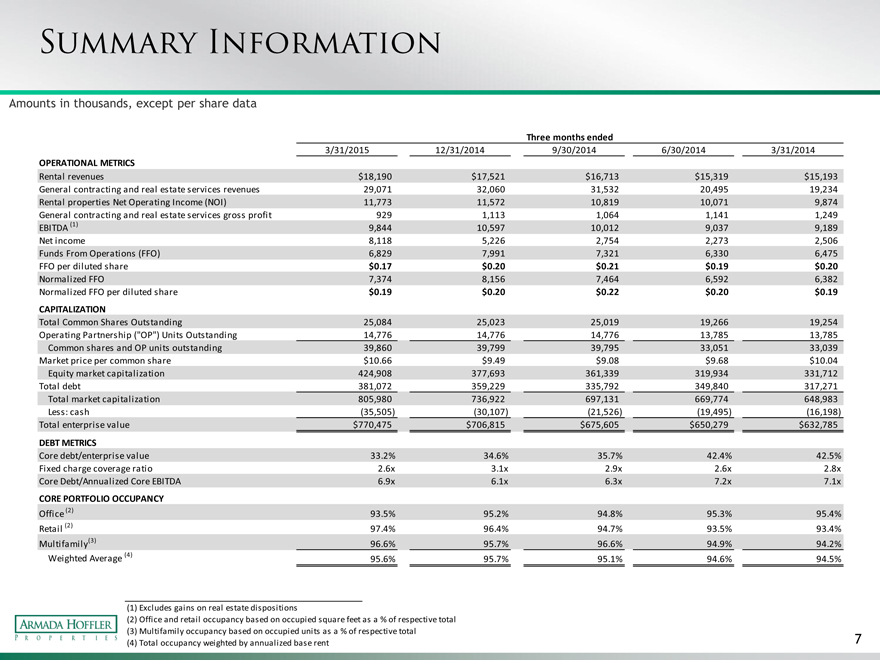
Summary information
Amounts in thousands, except per share data
Three months ended
3/31/2015 12/31/2014 9/30/2014 6/30/2014 3/31/2014
OPERATIONAL METRICS
Rental revenues $18,190 $17,521 $16,713 $15,319 $15,193 General contracting and real estate services revenues 29,071 32,060 31,532 20,495 19,234 Rental properties Net Operating Income (NOI) 11,773 11,572 10,819 10,071 9,874 General contracting and real estate services gross profit 929 1,113 1,064 1,141 1,249 EBITDA (1) 9,844 10,597 10,012 9,037 9,189 Net income 8,118 5,226 2,754 2,273 2,506 Funds From Operations (FFO) 6,829 7,991 7,321 6,330 6,475 FFO per diluted share $0.17 $0.20 $0.21 $0.19 $0.20
Normalized FFO 7,374 8,156 7,464 6,592 6,382 Normalized FFO per diluted share $0.19 $0.20 $0.22 $0.20 $0.19
CAPITALIZATION
Total Common Shares Outstanding 25,084 25,023 25,019 19,266 19,254 Operating Partnership (“OP”) Units Outstanding 14,776 14,776 14,776 13,785 13,785 Common shares and OP units outstanding 39,860 39,799 39,795 33,051 33,039 Market price per common share $10.66 $9.49 $9.08 $9.68 $10.04 Equity market capitalization 424,908 377,693 361,339 319,934 331,712 Total debt 381,072 359,229 335,792 349,840 317,271 Total market capitalization 805,980 736,922 697,131 669,774 648,983 Less: cash (35,505) (30,107) (21,526) (19,495) (16,198) Total enterprise value $770,475 $706,815 $675,605 $650,279 $632,785
DEBT METRICS
Core debt/enterprise value 33.2% 34.6% 35.7% 42.4% 42.5% Fixed charge coverage ratio 2.6x 3.1x 2.9x 2.6x 2.8x Core Debt/Annualized Core EBITDA 6.9x 6.1x 6.3x 7.2x 7.1x
CORE PORTFOLIO OCCUPANCY
Office (2) 93.5% 95.2% 94.8% 95.3% 95.4% Retail (2) 97.4% 96.4% 94.7% 93.5% 93.4% Multifamily(3) 96.6% 95.7% 96.6% 94.9% 94.2% Weighted Average (4)
95.6% 95.7% 95.1% 94.6% 94.5%
| (1) |
|
Excludes gains on real estate dispositions |
(2) Office and retail occupancy based on occupied square feet as a % of respective total (3) Multifamily occupancy based on occupied units as a % of respective total
| (4) |
|
Total occupancy weighted by annualized base rent 7 |
|
|
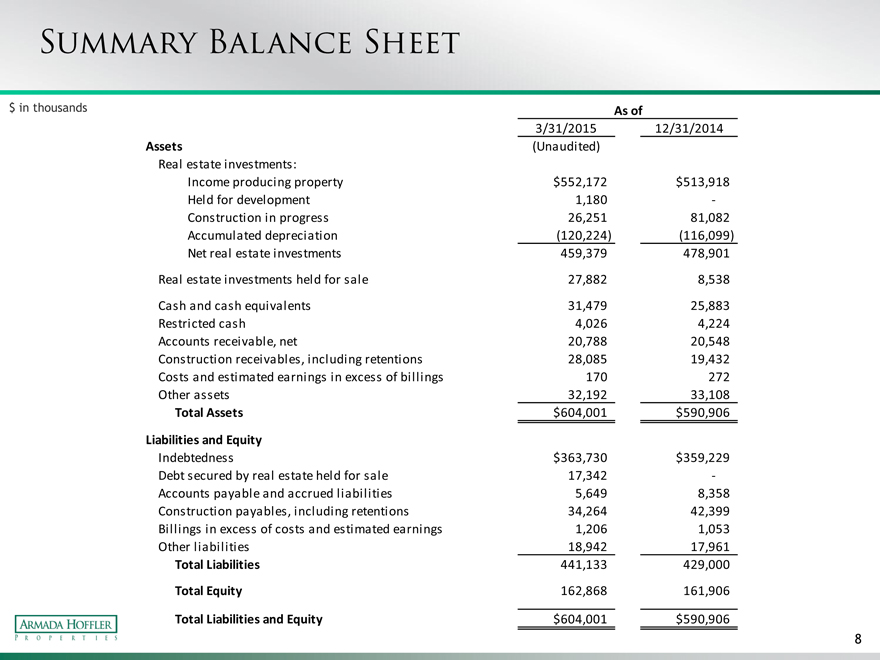
Summary balance sheet
$ in thousands As of
3/31/2015 12/31/2014 Assets (Unaudited) Real estate investments: Income producing property $552,172 $513,918 Held for development 1,180 -Construction in progress 26,251 81,082 Accumulated depreciation (120,224) (116,099) Net real estate investments 459,379 478,901
Real estate investments held for sale 27,882 8,538
Cash and cash equivalents 31,479 25,883 Restricted cash 4,026 4,224 Accounts receivable, net 20,788 20,548 Construction receivables, including retentions 28,085 19,432 Costs and estimated earnings in excess of billings 170 272 Other assets 32,192 33,108
Total Assets $604,001 $590,906
Liabilities and Equity
Indebtedness $363,730 $359,229 Debt secured by real estate held for sale 17,342 -Accounts payable and accrued liabilities 5,649 8,358 Construction payables, including retentions 34,264 42,399 Billings in excess of costs and estimated earnings 1,206 1,053 Other liabilities 18,942 17,961 Total Liabilities 441,133 429,000
Total Equity 162,868 161,906
Total Liabilities and Equity $604,001 $590,906
| 8 |
|
|
|
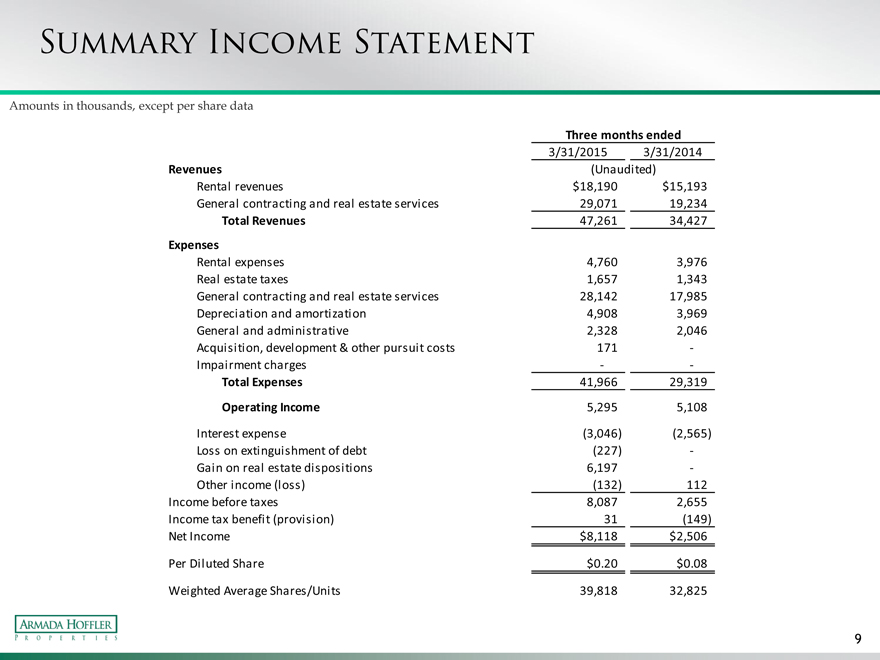
Summary income statement
Amounts in thousands, except per share data
Three months ended
3/31/2015 3/31/2014 Revenues (Unaudited) Rental revenues $18,190 $15,193 General contracting and real estate services 29,071 19,234
Total Revenues 47,261 34,427
Expenses
Rental expenses 4,760 3,976 Real estate taxes 1,657 1,343 General contracting and real estate services 28,142 17,985 Depreciation and amortization 4,908 3,969 General and administrative 2,328 2,046 Acquisition, development & other pursuit costs 171 -Impairment charges — -Total Expenses 41,966 29,319
Operating Income 5,295 5,108
Interest expense (3,046) (2,565) Loss on extinguishment of debt (227) -Gain on real estate dispositions 6,197 -Other income (loss) (132) 112 Income before taxes 8,087 2,655 Income tax benefit (provision) 31 (149) Net Income $8,118 $2,506
Per Diluted Share $0.20 $0.08
Weighted Average Shares/Units 39,818 32,825
9
|
|
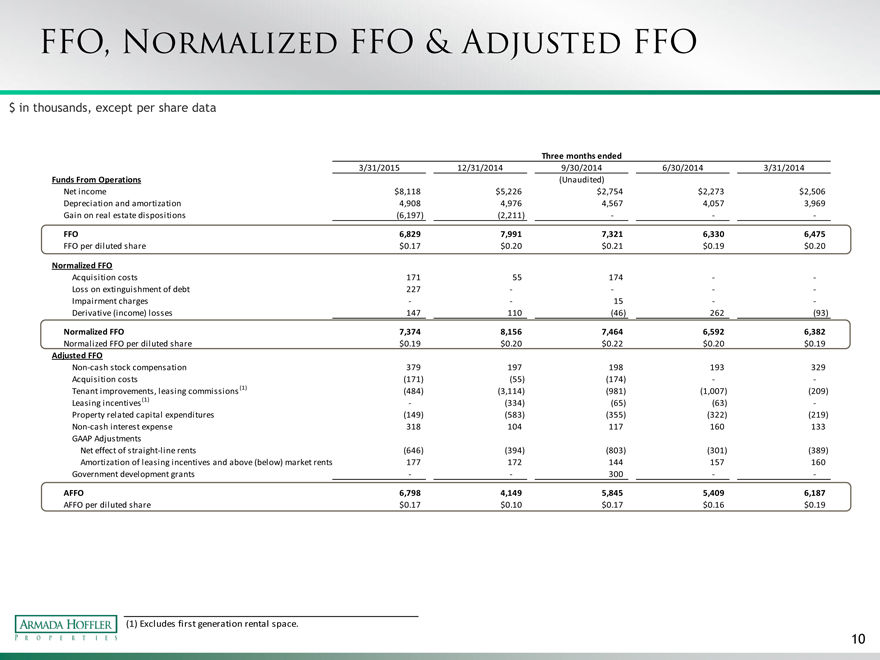
Ffo, normalized ffo & adjusted ffo
$ in thousands, except per share data
Three months ended
3/31/2015 12/31/2014 9/30/2014 6/30/2014 3/31/2014
Funds From Operations (Unaudited)
Net income $8,118 $5,226 $2,754 $2,273 $2,506 Depreciation and amortization 4,908 4,976 4,567 4,057 3,969 Gain on real estate dispositions (6,197) (2,211) — — -
FFO 6,829 7,991 7,321 6,330 6,475
FFO per diluted share $0.17 $0.20 $0.21 $0.19 $0.20
Normalized FFO
Acquisition costs 171 55 174 — -Loss on extinguishment of debt 227 — — — -Impairment charges — — 15 — -Derivative (income) losses 147 110 (46) 262 (93)
Normalized FFO 7,374 8,156 7,464 6,592 6,382
Normalized FFO per diluted share $0.19 $0.20 $0.22 $0.20 $0.19
Adjusted FFO
Non-cash stock compensation 379 197 198 193 329 Acquisition costs (171) (55) (174) — -Tenant improvements, leasing commissions(1) (484) (3,114) (981) (1,007) (209) Leasing incentives(1) — (334) (65) (63) -Property related capital expenditures (149) (583) (355) (322) (219) Non-cash interest expense 318 104 117 160 133 GAAP Adjustments Net effect of straight-line rents (646) (394) (803) (301) (389) Amortization of leasing incentives and above (below) market rents 177 172 144 157 160 Government development grants — — 300 — -
AFFO 6,798 4,149 5,845 5,409 6,187
AFFO per diluted share $0.17 $0.10 $0.17 $0.16 $0.19
| (1) |
|
Excludes first generation rental space. |
10
|
|
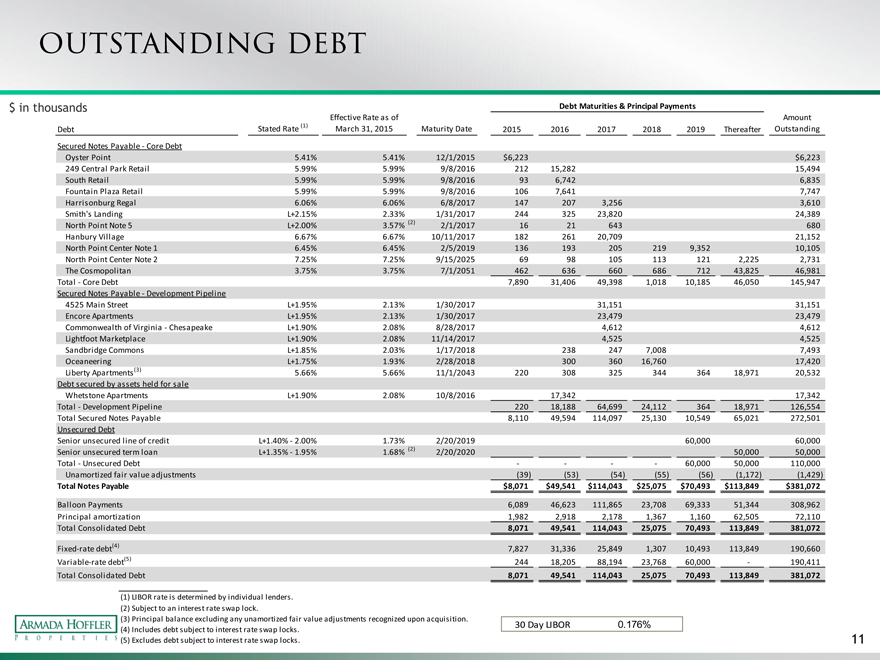
Outstanding debt
$ in thousands Debt Maturities & Principal Payments
Effective Rate as of Amount Stated Rate (1) March 31, 2015 Maturity Date Outstanding Debt 2015 2016 2017 2018 2019 Thereafter
Secured Notes Payable—Core Debt
Oyster Point 5.41% 5.41% 12/1/2015 $6,223 $6,223 249 Central Park Retail 5.99% 5.99% 9/8/2016 212 15,282 15,494 South Retail 5.99% 5.99% 9/8/2016 93 6,742 6,835 Fountain Plaza Retail 5.99% 5.99% 9/8/2016 106 7,641 7,747 Harrisonburg Regal 6.06% 6.06% 6/8/2017 147 207 3,256 3,610 Smith’s Landing L+2.15% 2.33% 1/31/2017 244 325 23,820 24,389 North Point Note 5 L+2.00% 3.57% (2) 2/1/2017 16 21 643 680 Hanbury Village 6.67% 6.67% 10/11/2017 182 261 20,709 21,152 North Point Center Note 1 6.45% 6.45% 2/5/2019 136 193 205 219 9,352 10,105 North Point Center Note 2 7.25% 7.25% 9/15/2025 69 98 105 113 121 2,225 2,731 The Cosmopolitan 3.75% 3.75% 7/1/2051 462 636 660 686 712 43,825 46,981 Total—Core Debt 7,890 31,406 49,398 1,018 10,185 46,050 145,947 Secured Notes Payable—Development Pipeline 4525 Main Street L+1.95% 2.13% 1/30/2017 31,151 31,151 Encore Apartments L+1.95% 2.13% 1/30/2017 23,479 23,479 Commonwealth of Virginia—Chesapeake L+1.90% 2.08% 8/28/2017 4,612 4,612 Lightfoot Marketplace L+1.90% 2.08% 11/14/2017 4,525 4,525 Sandbridge Commons L+1.85% 2.03% 1/17/2018 238 247 7,008 7,493 Oceaneering L+1.75% 1.93% 2/28/2018 300 360 16,760 17,420 Liberty Apartments(3) 5.66% 5.66% 11/1/2043 220 308 325 344 364 18,971 20,532 Debt secured by assets held for sale Whetstone Apartments L+1.90% 2.08% 10/8/2016 17,342 17,342 Total—Development Pipeline 220 18,188 64,699 24,112 364 18,971 126,554 Total Secured Notes Payable 8,110 49,594 114,097 25,130 10,549 65,021 272,501 Unsecured Debt Senior unsecured line of credit L+1.40%—2.00% 1.73% 2/20/2019 60,000 60,000 Senior unsecured term loan L+1.35%—1.95% 1.68% (2) 2/20/2020 50,000 50,000 Total—Unsecured Debt — — — — 60,000 50,000 110,000 Unamortized fair value adjustments (39) (53) (54) (55) (56) (1,172) (1,429)
Total Notes Payable $8,071 $49,541 $114,043 $25,075 $70,493 $113,849 $381,072
Balloon Payments 6,089 46,623 111,865 23,708 69,333 51,344 308,962 Principal amortization 1,982 2,918 2,178 1,367 1,160 62,505 72,110 Total Consolidated Debt 8,071 49,541 114,043 25,075 70,493 113,849 381,072
Fixed-rate debt(4) 7,827 31,336 25,849 1,307 10,493 113,849 190,660 Variable-rate debt(5) 244 18,205 88,194 23,768 60,000 — 190,411 Total Consolidated Debt 8,071 49,541 114,043 25,075 70,493 113,849 381,072
| (1) |
|
LIBOR rate is determined by individual lenders. (2) Subject to an interest rate swap lock. |
| (3) |
|
Principal balance excluding any unamortized fair value adjustments recognized upon acquisition. |
30 Day LIBOR 0.176%
| (4) |
|
Includes debt subject to interest rate swap locks. |
| (5) |
|
Excludes debt subject to interest rate swap locks. 11 |
|
|
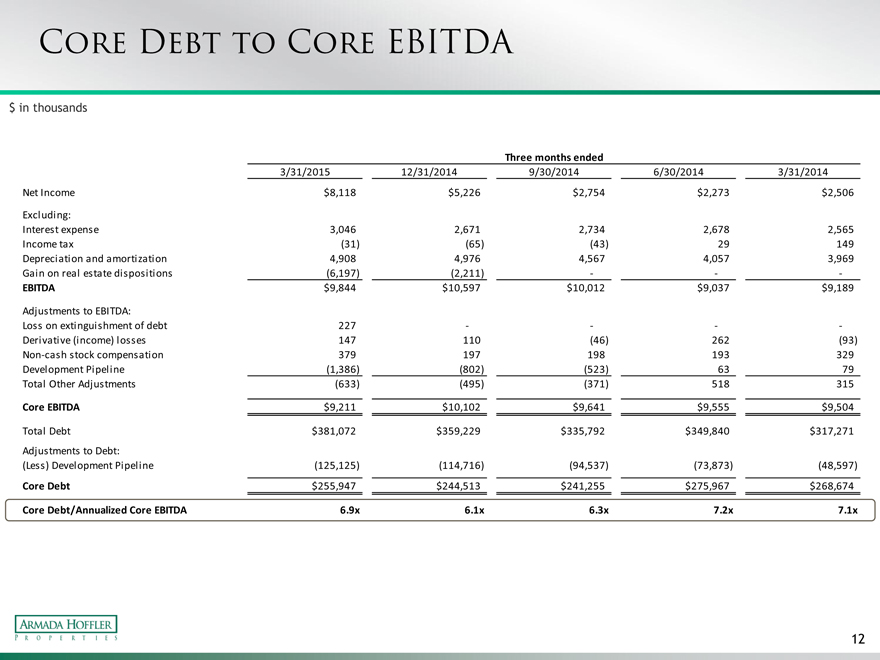
Core debt to core ebitda
$ in thousands
Three months ended
3/31/2015 12/31/2014 9/30/2014 6/30/2014 3/31/2014
Net Income $8,118 $5,226 $2,754 $2,273 $2,506
Excluding:
Interest expense 3,046 2,671 2,734 2,678 2,565 Income tax (31) (65) (43) 29 149 Depreciation and amortization 4,908 4,976 4,567 4,057 3,969 Gain on real estate dispositions (6,197) (2,211) — — -
EBITDA $9,844 $10,597 $10,012 $9,037 $9,189
Adjustments to EBITDA:
Loss on extinguishment of debt 227 — — — -Derivative (income) losses 147 110 (46) 262 (93) Non-cash stock compensation 379 197 198 193 329 Development Pipeline (1,386) (802) (523) 63 79 Total Other Adjustments (633) (495) (371) 518 315
Core EBITDA $9,211 $10,102 $9,641 $9,555 $9,504
Total Debt $381,072 $359,229 $335,792 $349,840 $317,271
Adjustments to Debt:
(Less) Development Pipeline (125,125) (114,716) (94,537) (73,873) (48,597)
Core Debt $255,947 $244,513 $241,255 $275,967 $268,674
Core Debt/Annualized Core EBITDA 6.9x 6.1x 6.3x 7.2x 7.1x
12
|
|
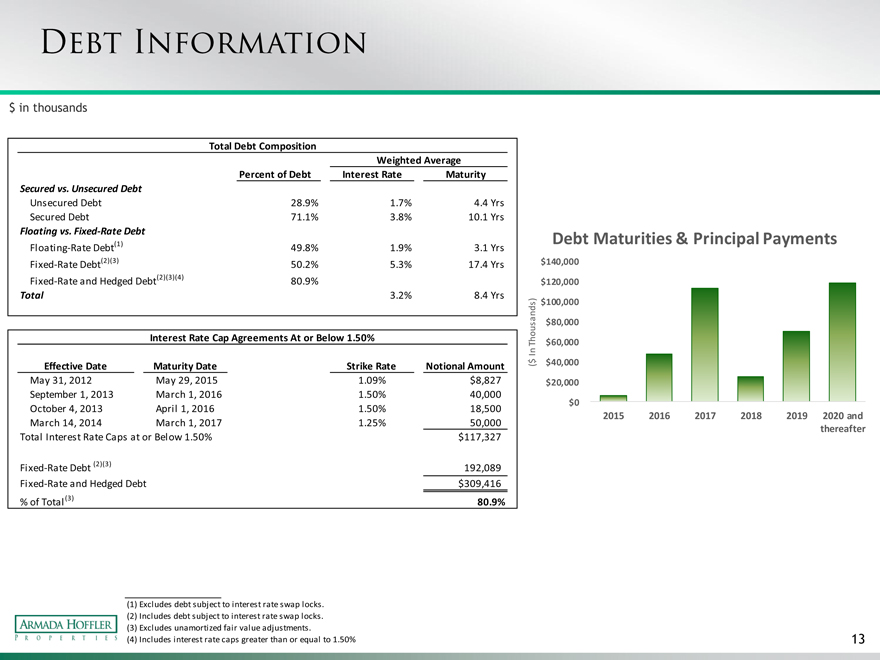
Debt information
$ in thousands
Total Debt Composition
Weighted Average Percent of Debt Interest Rate Maturity
Secured vs. Unsecured Debt
Unsecured Debt 28.9% 1.7% 4.4 Yrs Secured Debt 71.1% 3.8% 10.1 Yrs
Floating vs. Fixed-Rate Debt Debt Maturities & Principal Payments
Floating-Rate Debt(1) 49.8% 1.9% 3.1 Yrs
Fixed-Rate Debt(2)(3) 50.2% 5.3% 17.4 Yrs $140,000 Fixed-Rate and Hedged Debt(2)(3)(4) 80.9% $120,000
Total 3.2% 8.4 Yrs
) $100,000 s sand $80,000 o u
Interest Rate Cap Agreements At or Below 1.50% h
T $60,000
I n $ $40,000
Effective Date Maturity Date Strike Rate Notional Amount (
May 31, 2012 May 29, 2015 1.09% $8,827 $20,000 September 1, 2013 March 1, 2016 1.50% 40,000 $0 October 4, 2013 April 1, 2016 1.50% 18,500
2015 2016 2017 2018 2019 2020 and
March 14, 2014 March 1, 2017 1.25% 50,000
Total Interest Rate Caps at or Below 1.50% $117,327 thereafter Fixed-Rate Debt (2)(3) 192,089 Fixed-Rate and Hedged Debt $309,416 % of Total(3) 80.9%
(1) Excludes debt subject to interest rate swap locks. (2) Includes debt subject to interest rate swap locks. (3) Excludes unamortized fair value adjustments.
| (4) |
|
Includes interest rate caps greater than or equal to 1.50% 13 |
|
|
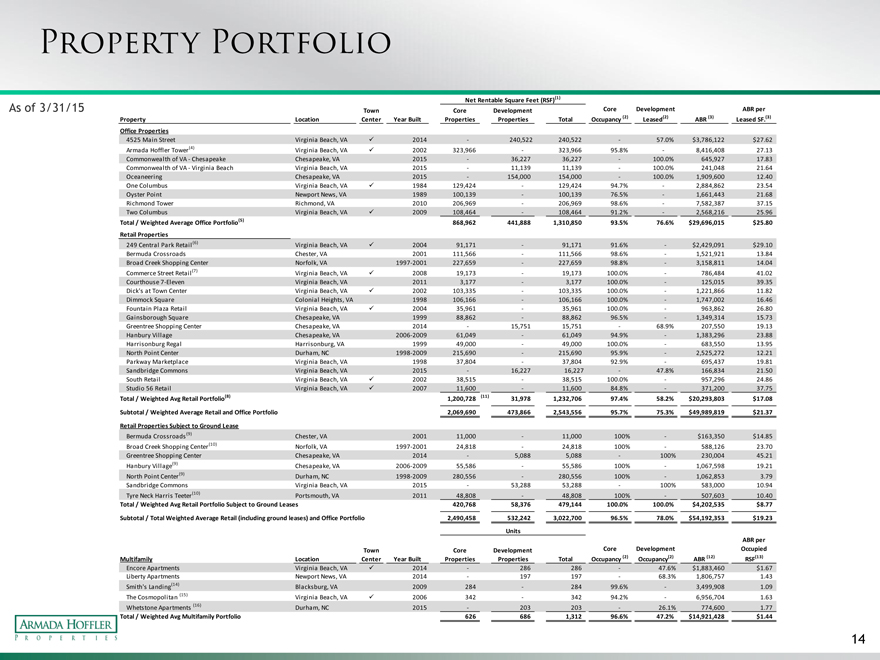
Property portfolio
Net Rentable Square Feet (RSF)(1)
As of 3/31/15 Town Core Development Core Development ABR per Property Location Center Year Built Properties Properties Total Occupancy (2) Leased(2) ABR (3) Leased SF.(3) Office Properties
4525 Main Street Virginia Beach, VA? 2014 —240,522 240,522 —57.0% $3,786,122 $27.62 Armada Hoffler Tower(4) Virginia Beach, VA? 2002 323,966 —323,966 95.8%— 8,416,408 27.13 Commonwealth of VA—Chesapeake Chesapeake, VA 2015 —36,227 36,227 —100.0% 645,927 17.83 Commonwealth of VA—Virginia Beach Virginia Beach, VA 2015 —11,139 11,139 —100.0% 241,048 21.64 Oceaneering Chesapeake, VA 2015 —154,000 154,000 —100.0% 1,909,600 12.40 One Columbus Virginia Beach, VA? 1984 129,424 —129,424 94.7%— 2,884,862 23.54 Oyster Point Newport News, VA 1989 100,139 —100,139 76.5%— 1,661,443 21.68 Richmond Tower Richmond, VA 2010 206,969 —206,969 98.6%— 7,582,387 37.15 Two Columbus Virginia Beach, VA? 2009 108,464 —108,464 91.2%— 2,568,216 25.96
Total / Weighted Average Office Portfolio(5) 868,962 441,888 1,310,850 93.5% 76.6% $29,696,015 $25.80 Retail Properties
249 Central Park Retail(6) Virginia Beach, VA? 2004 91,171 —91,171 91.6%— $2,429,091 $29.10 Bermuda Crossroads Chester, VA 2001 111,566 —111,566 98.6%— 1,521,921 13.84 Broad Creek Shopping Center Norfolk, VA 1997-2001 227,659 —227,659 98.8%— 3,158,811 14.04 Commerce Street Retail(7) Virginia Beach, VA? 2008 19,173 —19,173 100.0%— 786,484 41.02 Courthouse 7-Eleven Virginia Beach, VA 2011 3,177 —3,177 100.0%— 125,015 39.35 Dick’s at Town Center Virginia Beach, VA? 2002 103,335 —103,335 100.0%— 1,221,866 11.82 Dimmock Square Colonial Heights, VA 1998 106,166 —106,166 100.0%— 1,747,002 16.46 Fountain Plaza Retail Virginia Beach, VA? 2004 35,961 —35,961 100.0%— 963,862 26.80 Gainsborough Square Chesapeake, VA 1999 88,862 —88,862 96.5%— 1,349,314 15.73 Greentree Shopping Center Chesapeake, VA 2014 — 15,751 15,751 —68.9% 207,550 19.13 Hanbury Village Chesapeake, VA 2006-2009 61,049 —61,049 94.9%— 1,383,296 23.88 Harrisonburg Regal Harrisonburg, VA 1999 49,000 —49,000 100.0%— 683,550 13.95 North Point Center Durham, NC 1998-2009 215,690 —215,690 95.9%— 2,525,272 12.21 Parkway Marketplace Virginia Beach, VA 1998 37,804 —37,804 92.9%— 695,437 19.81 Sandbridge Commons Virginia Beach, VA 2015 — 16,227 16,227 —47.8% 166,834 21.50 South Retail Virginia Beach, VA? 2002 38,515 —38,515 100.0%— 957,296 24.86 Studio 56 Retail Virginia Beach, VA? 2007 11,600 —11,600 84.8%— 371,200 37.75
Total / Weighted Avg Retail Portfolio(8) 1,200,728 (11) 31,978 1,232,706 97.4% 58.2% $20,293,803 $17.08
Subtotal / Weighted Average Retail and Office Portfolio 2,069,690 473,866 2,543,556 95.7% 75.3% $49,989,819 $21.37
Retail Properties Subject to Ground Lease
Bermuda Crossroads(9) Chester, VA 2001 11,000 — 11,000 100%— $163,350 $14.85 Broad Creek Shopping Center(10) Norfolk, VA 1997-2001 24,818 — 24,818 100%— 588,126 23.70 Greentree Shopping Center Chesapeake, VA 2014 — 5,088 5,088 —100% 230,004 45.21 Hanbury Village(9) Chesapeake, VA 2006-2009 55,586 — 55,586 100%— 1,067,598 19.21 North Point Center(9) Durham, NC 1998-2009 280,556 — 280,556 100%— 1,062,853 3.79 Sandbridge Commons Virginia Beach, VA 2015 — 53,288 53,288 —100% 583,000 10.94 Tyre Neck Harris Teeter(10) Portsmouth, VA 2011 48,808 — 48,808 100%— 507,603 10.40
Total / Weighted Avg Retail Portfolio Subject to Ground Leases 420,768 58,376 479,144 100.0% 100.0% $4,202,535 $8.77
Subtotal / Total Weighted Average Retail (including ground leases) and Office Portfolio 2,490,458 532,242 3,022,700 96.5% 78.0% $54,192,353 $19.23
Units
ABR per Town Core Development Core Development Occupied Multifamily Location Center Year Built Properties Properties Total Occupancy (2) Occupancy(2) ABR (12) RSF(13)
Encore Apartments Virginia Beach, VA? 2014 — 286 286 —47.6% $1,883,460 $1.67 Liberty Apartments Newport News, VA 2014 — 197 197 —68.3% 1,806,757 1.43 Smith’s Landing(14) Blacksburg, VA 2009 284 —284 99.6% — 3,499,908 1.09 The Cosmopolitan (15) Virginia Beach, VA? 2006 342 —342 94.2% —6,956,704 1.63 Whetstone Apartments (16) Durham, NC 2015 — 203 203 —26.1% 774,600 1.77
Total / Weighted Avg Multifamily Portfolio 626 686 1,312 96.6% 47.2% $14,921,428 $1.44
14
|
|
Property portfolio footnotes
1)The net rentable square footage for each of our office properties is the sum of (a) the square footage of existing leases, plus (b) for available space, management’s estimate of net rentable square footage based, in part, on past leases. The net rentable square footage included in office leases is generally determined consistent with the Building Owners and Managers Association, or BOMA, 1996 measurement guidelines. The net rentable square footage for each of our retail properties is the sum of (a) the square footage of existing leases, plus (b) for available space, the field verified square footage.
2)Occupancy for each of our office and retail properties is calculated as (a) square footage under executed leases as of March 31, 2015, divided by (b) net rentable square feet, expressed as a percentage. Occupancy for our multifamily properties is calculated as (a) total units occupied as of March 31, 2015, divided by (b) total units available, expressed as a percentage.
3)For the properties in our office and retail portfolios, annualized base rent or ABR is calculated by multiplying (a) base rental payments for executed leases as of March 31, 2015 (defined as cash base rents (before abatements) excluding tenant reimbursements for expenses paid by the landlord), by (b) 12. Annualized base rent per leased square foot is calculated by dividing (a) annualized base rent, by (b) square footage under executed leases as of March 31, 2015. In the case of triple net or modified gross leases, annualized base rent does not include tenant reimbursements for real estate taxes, insurance, common area or other operating expenses.
4)As of March 31,2015, the Company occupied 18,984 square feet at this property at an annualized base rent of $529,746 or $27.90 per leased square foot, which amounts are reflected in this table. The rent paid by us is eliminated in accordance with GAAP. In addition, effective March 1, 2013, the Company subleases approximately 5,000 square feet of space from a tenant at this property.
5)Includes square footage and annualized base rent pursuant to leases for space occupied by the Company.
6)As of March 31, 2015, the Company occupied 8,995 square feet at this property at an annualized base rent of $287,300, or $31.94 per leased square foot, which amounts are reflected in this table. The rent paid by us is eliminated in accordance with GAAP.
7)Includes $32,460 of annualized base rent pursuant to a rooftop lease.
8)Reflects square footage and annualized base rent pursuant to leases for space occupied by the Company.
9)Pursuant to this ground lease, the Company owns the land and the tenant owns the improvements thereto. The Company will succeed to the ownership of the improvements to the land upon the termination of the ground lease.
10)The Company leases the land underlying this property and re-leases it to our tenant under a ground lease pursuant to which our tenant owns the improvements on the land.
11)Excludes the square footage of land subject to ground leases.
12)For the properties in our multifamily portfolio, annualized base rent or ABR is calculated by multiplying (a) base rental payments for the month ended March 31, 2015 by (b) 12.
13)Annualized base rent per occupied rentable square foot is calculated by dividing (a) annualized base rent, by (b) net rentable square footage of occupied units as of March 31, 2015.
14)The Company leases the land underlying this property pursuant to a ground lease.
15)The annualized base rent for The Cosmopolitan includes $863,000 of annualized base rent from 15 retail leases at the property. 16)Under contract to sell.
15
|
|
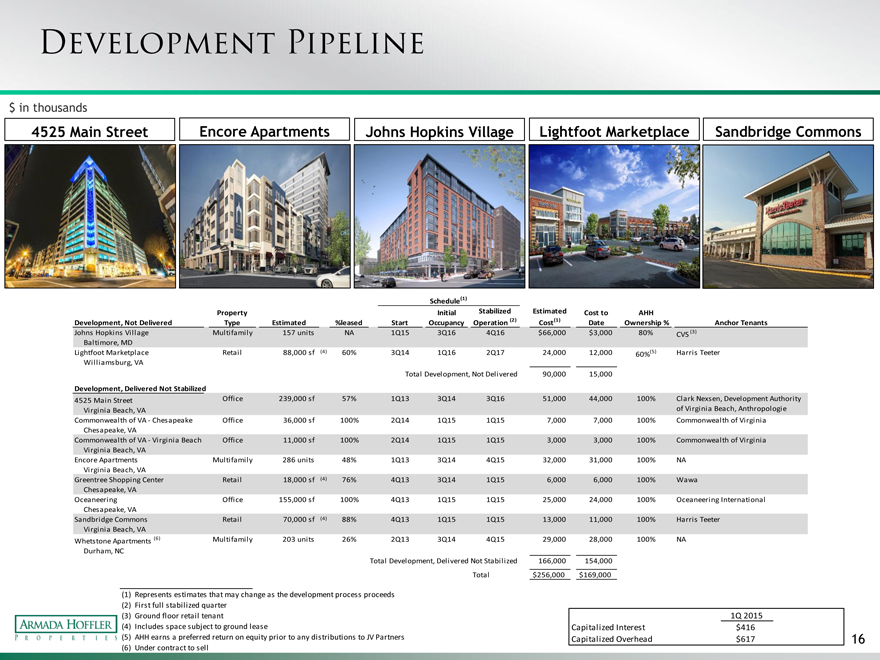
Development pipeline
$ in thousands
4525 Main Street Encore Apartments Johns Hopkins Village Lightfoot Marketplace Sandbridge Commons
Schedule(1)
Property Initial Stabilized Estimated Cost to AHH
Development, Not Delivered Type Estimated %leased Start Occupancy Operation (2) Cost(1) Date Ownership % Anchor Tenants
Johns Hopkins Village Multifamily 157 units NA 1Q15 3Q16 4Q16 $66,000 $3,000 80% CVS (3) Baltimore, MD
Lightfoot Marketplace Retail 88,000 sf (4) 60% 3Q14 1Q16 2Q17 24,000 12,000 60%(5) Harris Teeter Williamsburg, VA
Total Development, Not Delivered 90,000 15,000
Development, Delivered Not Stabilized
4525 Main Street Office 239,000 sf 57% 1Q13 3Q14 3Q16 51,000 44,000 100% Clark Nexsen, Development Authority Virginia Beach, VA of Virginia Beach, Anthropologie Commonwealth of VA—Chesapeake Office 36,000 sf 100% 2Q14 1Q15 1Q15 7,000 7,000 100% Commonwealth of Virginia Chesapeake, VA
Commonwealth of VA—Virginia Beach Office 11,000 sf 100% 2Q14 1Q15 1Q15 3,000 3,000 100% Commonwealth of Virginia Virginia Beach, VA
Encore Apartments Multifamily 286 units 48% 1Q13 3Q14 4Q15 32,000 31,000 100% NA Virginia Beach, VA
Greentree Shopping Center Retail 18,000 sf (4) 76% 4Q13 3Q14 1Q15 6,000 6,000 100% Wawa Chesapeake, VA
Oceaneering Office 155,000 sf 100% 4Q13 1Q15 1Q15 25,000 24,000 100% Oceaneering International Chesapeake, VA
Sandbridge Commons Retail 70,000 sf (4) 88% 4Q13 1Q15 1Q15 13,000 11,000 100% Harris Teeter Virginia Beach, VA
Whetstone Apartments (6) Multifamily 203 units 26% 2Q13 3Q14 4Q15 29,000 28,000 100% NA Durham, NC
Total Development, Delivered Not Stabilized 166,000 154,000
Total $256,000 $169,000
| (1) |
|
Represents estimates that may change as the development process proceeds (2) First full stabilized quarter |
| (3) |
|
Ground floor retail tenant 1Q 2015 (4) Includes space subject to ground lease Capitalized Interest $416 |
(5) AHH earns a preferred return on equity prior to any distributions to JV Partners Capitalized Overhead $617 16 (6) Under contract to sell
|
|
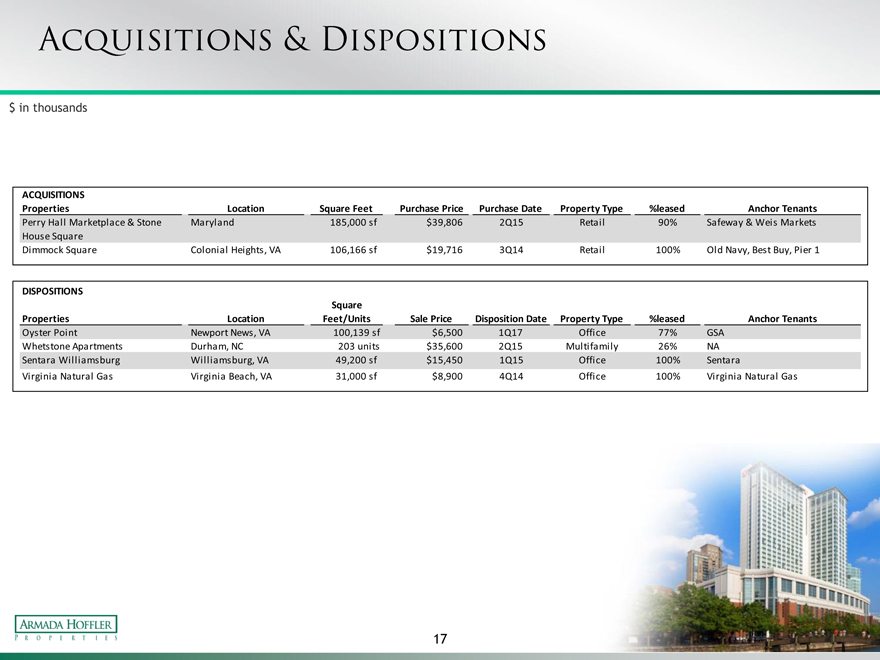
$ in thousands
ACQUISITIONS
Properties Location Square Feet Purchase Price Purchase Date Property Type %leased Anchor Tenants
Perry Hall Marketplace & Stone Maryland 185,000 sf $39,806 2Q15 Retail 90% Safeway & Weis Markets House Square Dimmock Square Colonial Heights, VA 106,166 sf $19,716 3Q14 Retail 100% Old Navy, Best Buy, Pier 1
DISPOSITIONS
Square
Properties Location Feet/Units Sale Price Disposition Date Property Type %leased Anchor Tenants
Oyster Point Newport News, VA 100,139 sf $6,500 1Q17 Office 77% GSA Whetstone Apartments Durham, NC 203 units $35,600 2Q15 Multifamily 26% NA Sentara Williamsburg Williamsburg, VA 49,200 sf $15,450 1Q15 Office 100% Sentara
Virginia Natural Gas Virginia Beach, VA 31,000 sf $8,900 4Q14 Office 100% Virginia Natural Gas
17
|
|
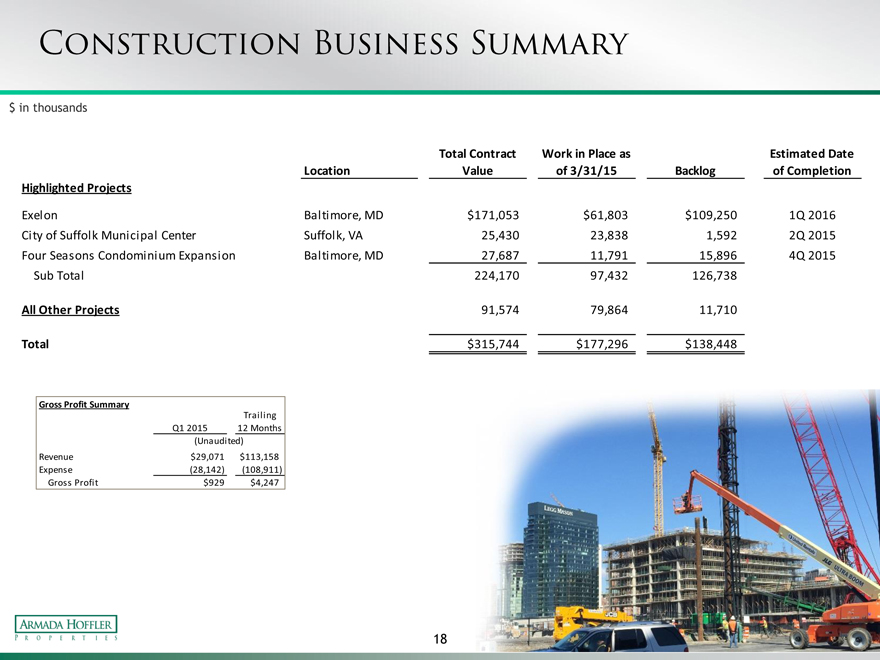
Construction business summary
$ in thousands
Total Contract Work in Place as Estimated Date Location Value of 3/31/15 Backlog of Completion Highlighted Projects
Exelon Baltimore, MD $171,053 $61,803 $109,250 1Q 2016 City of Suffolk Municipal Center Suffolk, VA 25,430 23,838 1,592 2Q 2015 Four Seasons Condominium Expansion Baltimore, MD 27,687 11,791 15,896 4Q 2015 Sub Total 224,170 97,432 126,738
All Other Projects 91,574 79,864 11,710
Total $315,744 $177,296 $138,448
Gross Profit Summary
Trailing Q1 2015 12 Months (Unaudited) Revenue $29,071 $113,158 Expense (28,142) (108,911) Gross Profit $929 $4,247
18
|
|
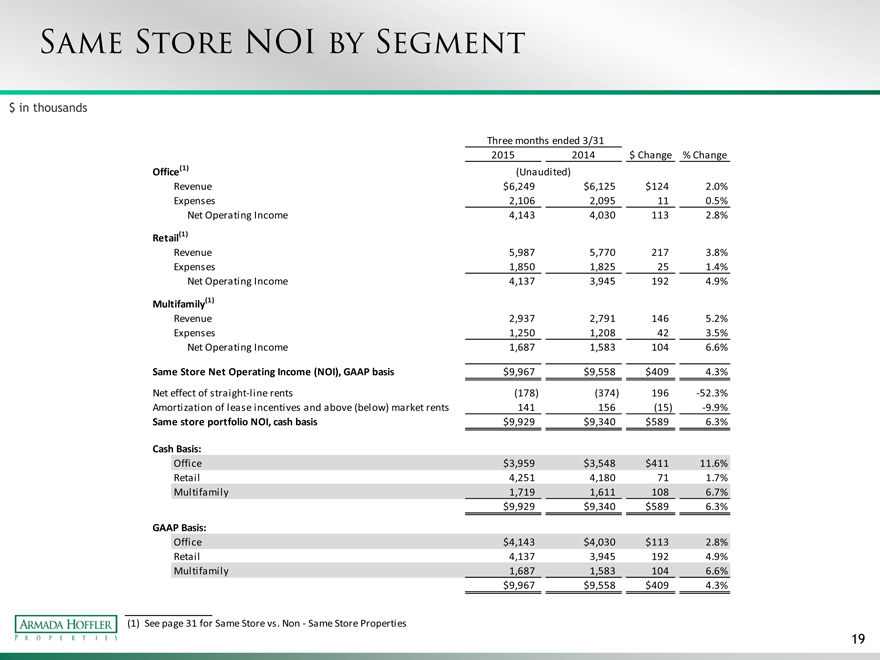
Same store noi by segment
$ in thousands
Three months ended 3/31
2015 2014 $ Change % Change Office(1) (Unaudited) Revenue $6,249 $6,125 $124 2.0% Expenses 2,106 2,095 11 0.5% Net Operating Income 4,143 4,030 113 2.8%
Retail(1)
Revenue 5,987 5,770 217 3.8% Expenses 1,850 1,825 25 1.4% Net Operating Income 4,137 3,945 192 4.9%
Multifamily(1)
Revenue 2,937 2,791 146 5.2% Expenses 1,250 1,208 42 3.5% Net Operating Income 1,687 1,583 104 6.6%
Same Store Net Operating Income (NOI), GAAP basis $9,967 $9,558 $409 4.3%
Net effect of straight-line rents (178) (374) 196 -52.3% Amortization of lease incentives and above (below) market rents 141 156 (15) -9.9%
Same store portfolio NOI, cash basis $9,929 $9,340 $589 6.3%
Cash Basis:
Office $3,959 $3,548 $411 11.6% Retail 4,251 4,180 71 1.7% Multifamily 1,719 1,611 108 6.7% $9,929 $9,340 $589 6.3%
GAAP Basis:
Office $4,143 $4,030 $113 2.8% Retail 4,137 3,945 192 4.9% Multifamily 1,687 1,583 104 6.6% $9,967 $9,558 $409 4.3%
| (1) |
|
See page 31 for Same Store vs. Non—Same Store Properties |
19
|
|
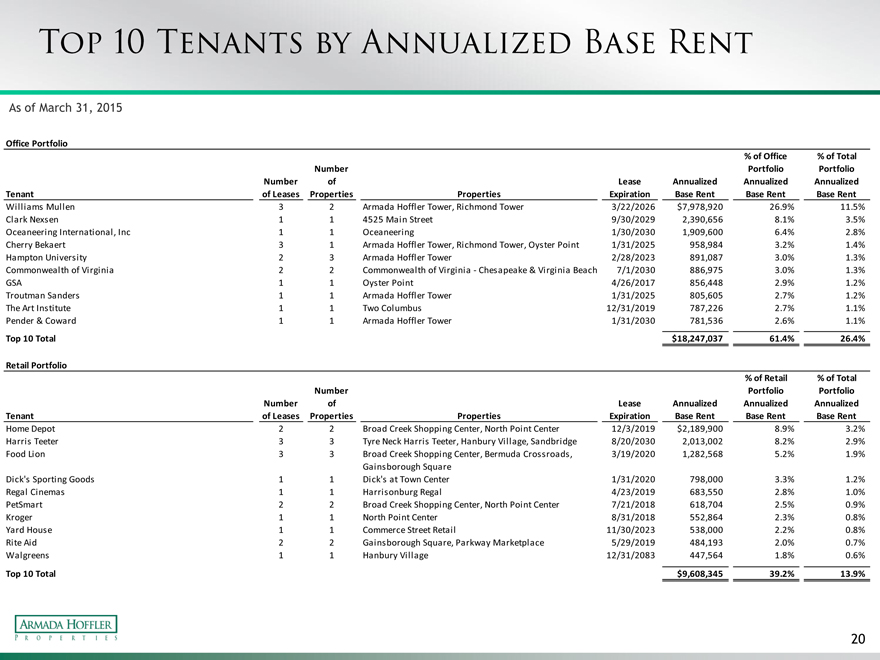
Top 10 tenants by annualized base rent
As of March 31, 2015
Office Portfolio
% of Office % of Total
Number Portfolio Portfolio
Number of Lease Annualized Annualized Annualized
Tenant of Leases Properties Properties Expiration Base Rent Base Rent Base Rent
Williams Mullen 3 2 Armada Hoffler Tower, Richmond Tower 3/22/2026 $7,978,920 26.9% 11.5%
Clark Nexsen 1 1 4525 Main Street 9/30/2029 2,390,656 8.1% 3.5%
Oceaneering International, Inc 1 1 Oceaneering 1/30/2030 1,909,600 6.4% 2.8%
Cherry Bekaert 3 1 Armada Hoffler Tower, Richmond Tower, Oyster Point 1/31/2025 958,984 3.2% 1.4%
Hampton University 2 3 Armada Hoffler Tower 2/28/2023 891,087 3.0% 1.3%
Commonwealth of Virginia 2 2 Commonwealth of Virginia—Chesapeake & Virginia Beach 7/1/2030 886,975 3.0% 1.3%
GSA 1 1 Oyster Point 4/26/2017 856,448 2.9% 1.2%
Troutman Sanders 1 1 Armada Hoffler Tower 1/31/2025 805,605 2.7% 1.2%
The Art Institute 1 1 Two Columbus 12/31/2019 787,226 2.7% 1.1%
Pender & Coward 1 1 Armada Hoffler Tower 1/31/2030 781,536 2.6% 1.1%
Top 10 Total $18,247,037 61.4% 26.4%
Retail Portfolio
% of Retail % of Total
Number Portfolio Portfolio
Number of Lease Annualized Annualized Annualized
Tenant of Leases Properties Properties Expiration Base Rent Base Rent Base Rent
Home Depot 2 2 Broad Creek Shopping Center, North Point Center 12/3/2019 $2,189,900 8.9% 3.2%
Harris Teeter 3 3 Tyre Neck Harris Teeter, Hanbury Village, Sandbridge 8/20/2030 2,013,002 8.2% 2.9%
Food Lion 3 3 Broad Creek Shopping Center, Bermuda Crossroads, 3/19/2020 1,282,568 5.2% 1.9%
Gainsborough Square
Dick’s Sporting Goods 1 1 Dick’s at Town Center 1/31/2020 798,000 3.3% 1.2%
Regal Cinemas 1 1 Harrisonburg Regal 4/23/2019 683,550 2.8% 1.0%
PetSmart 2 2 Broad Creek Shopping Center, North Point Center 7/21/2018 618,704 2.5% 0.9%
Kroger 1 1 North Point Center 8/31/2018 552,864 2.3% 0.8%
Yard House 1 1 Commerce Street Retail 11/30/2023 538,000 2.2% 0.8%
Rite Aid 2 2 Gainsborough Square, Parkway Marketplace 5/29/2019 484,193 2.0% 0.7%
Walgreens 1 1 Hanbury Village 12/31/2083 447,564 1.8% 0.6%
Top 10 Total $9,608,345 39.2% 13.9%
20
|
|
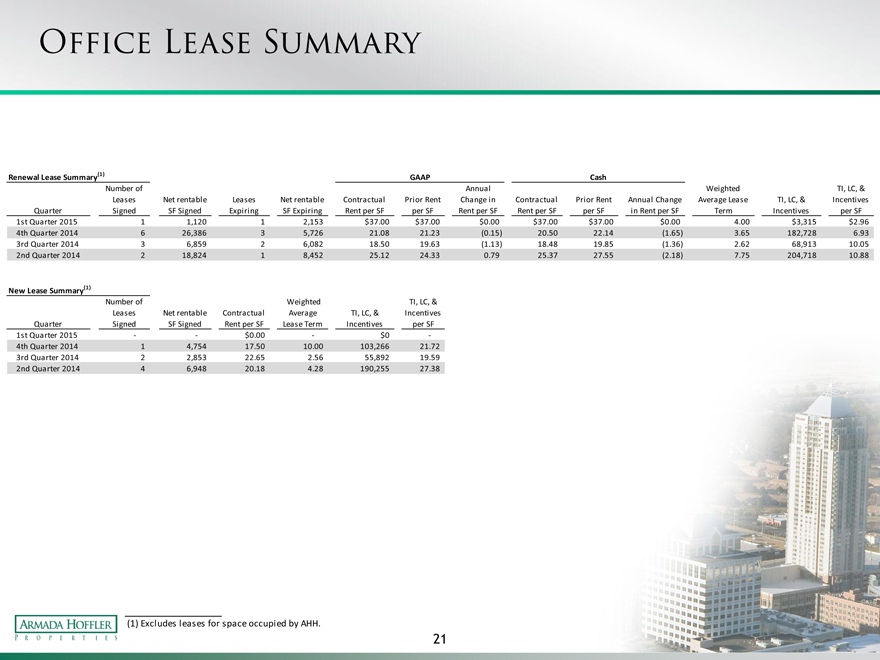
Office lease summary
Renewal Lease Summary(1) GAAP Cash
Number of Annual Weighted TI, LC, & Leases Net rentable Leases Net rentable Contractual Prior Rent Change in Contractual Prior Rent Annual Change Average Lease TI, LC, & Incentives Quarter Signed SF Signed Expiring SF Expiring Rent per SF per SF Rent per SF Rent per SF per SF in Rent per SF Term Incentives per SF
1st Quarter 2015 1 1,120 1 2,153 $37.00 $37.00 $0.00 $37.00 $37.00 $0.00 4.00 $3,315 $2.96 4th Quarter 2014 6 26,386 3 5,726 21.08 21.23 (0.15) 20.50 22.14 (1.65) 3.65 182,728 6.93 3rd Quarter 2014 3 6,859 2 6,082 18.50 19.63 (1.13) 18.48 19.85 (1.36) 2.62 68,913 10.05 2nd Quarter 2014 2 18,824 1 8,452 25.12 24.33 0.79 25.37 27.55 (2.18) 7.75 204,718 10.88
New Lease Summary(1)
Number of Weighted TI, LC, & Leases Net rentable Contractual Average TI, LC, & Incentives Quarter Signed SF Signed Rent per SF Lease Term Incentives per SF
1st Quarter 2015 — —$0.00 —$0 -4th Quarter 2014 1 4,754 17.50 10.00 103,266 21.72 3rd Quarter 2014 2 2,853 22.65 2.56 55,892 19.59 2nd Quarter 2014 4 6,948 20.18 4.28 190,255 27.38
| (1) |
|
Excludes leases for space occupied by AHH. |
21
|
|
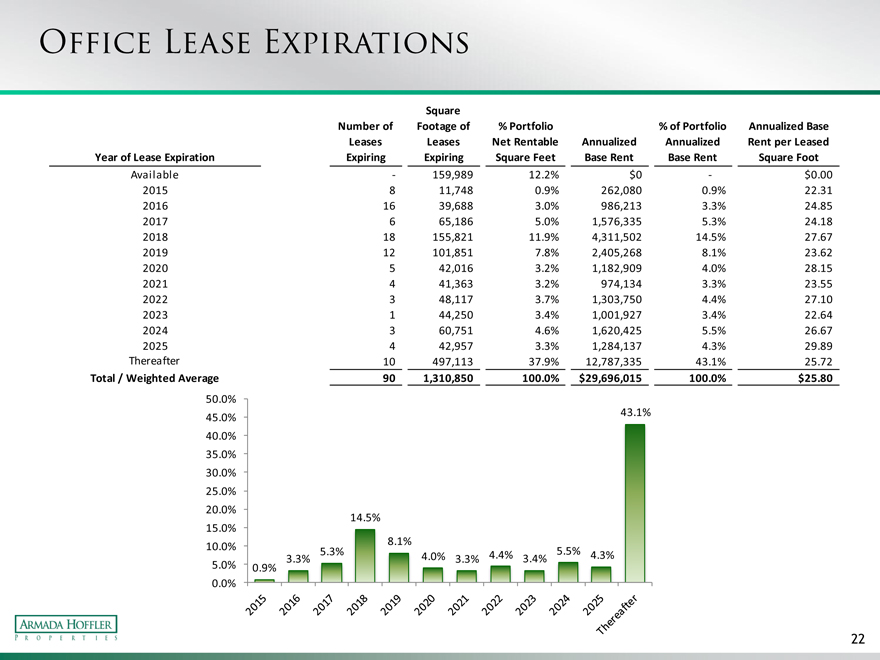
Office lease expirations
Square
Number of Footage of % Portfolio % of Portfolio Annualized Base Leases Leases Net Rentable Annualized Annualized Rent per Leased Year of Lease Expiration Expiring Expiring Square Feet Base Rent Base Rent Square Foot
Available—159,989 12.2% $0— $0.00 2015 8 11,748 0.9% 262,080 0.9% 22.31 2016 16 39,688 3.0% 986,213 3.3% 24.85 2017 6 65,186 5.0% 1,576,335 5.3% 24.18 2018 18 155,821 11.9% 4,311,502 14.5% 27.67 2019 12 101,851 7.8% 2,405,268 8.1% 23.62 2020 5 42,016 3.2% 1,182,909 4.0% 28.15 2021 4 41,363 3.2% 974,134 3.3% 23.55 2022 3 48,117 3.7% 1,303,750 4.4% 27.10 2023 1 44,250 3.4% 1,001,927 3.4% 22.64 2024 3 60,751 4.6% 1,620,425 5.5% 26.67 2025 4 42,957 3.3% 1,284,137 4.3% 29.89 Thereafter 10 497,113 37.9% 12,787,335 43.1% 25.72
Total / Weighted Average 90 1,310,850 100.0% $ 29,696,015 100.0% $25.80
50.0%
43.1%
45.0%
40.0%
35.0%
30.0%
25.0%
20.0%
14.5%
15.0%
8.1%
10.0%
5.3% 4.4% 5.5% 4.3%
5.0% 3.3% 4.0% 3.3% 3.4%
0.9%
0.0%
22
|
|
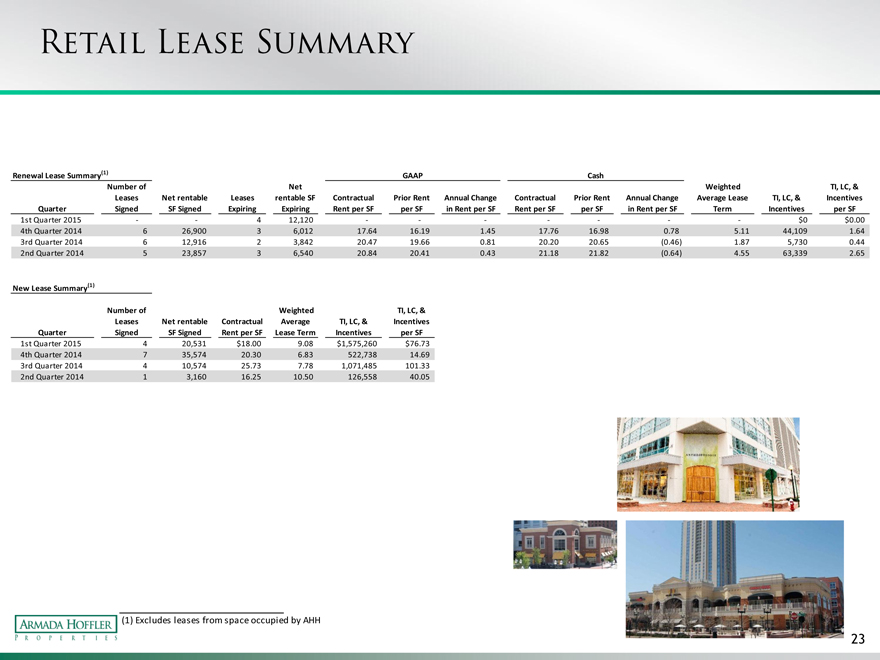
Retail lease summary
Renewal Lease Summary(1) GAAP Cash
Number of Net Weighted TI, LC, & Leases Net rentable Leases rentable SF Contractual Prior Rent Annual Change Contractual Prior Rent Annual Change Average Lease TI, LC, & Incentives Quarter Signed SF Signed Expiring Expiring Rent per SF per SF in Rent per SF Rent per SF per SF in Rent per SF Term Incentives per SF
1st Quarter 2015 — — 4 12,120 — — — — — — —$0 $0.00 4th Quarter 2014 6 26,900 3 6,012 17.64 16.19 1.45 17.76 16.98 0.78 5.11 44,109 1.64 3rd Quarter 2014 6 12,916 2 3,842 20.47 19.66 0.81 20.20 20.65 (0.46) 1.87 5,730 0.44 2nd Quarter 2014 5 23,857 3 6,540 20.84 20.41 0.43 21.18 21.82 (0.64) 4.55 63,339 2.65
New Lease Summary(1)
Number of Weighted TI, LC, & Leases Net rentable Contractual Average TI, LC, & Incentives Quarter Signed SF Signed Rent per SF Lease Term Incentives per SF
1st Quarter 2015 4 20,531 $18.00 9.08 $1,575,260 $76.73 4th Quarter 2014 7 35,574 20.30 6.83 522,738 14.69 3rd Quarter 2014 4 10,574 25.73 7.78 1,071,485 101.33 2nd Quarter 2014 1 3,160 16.25 10.50 126,558 40.05
| (1) |
|
Excludes leases from space occupied by AHH |
23
|
|
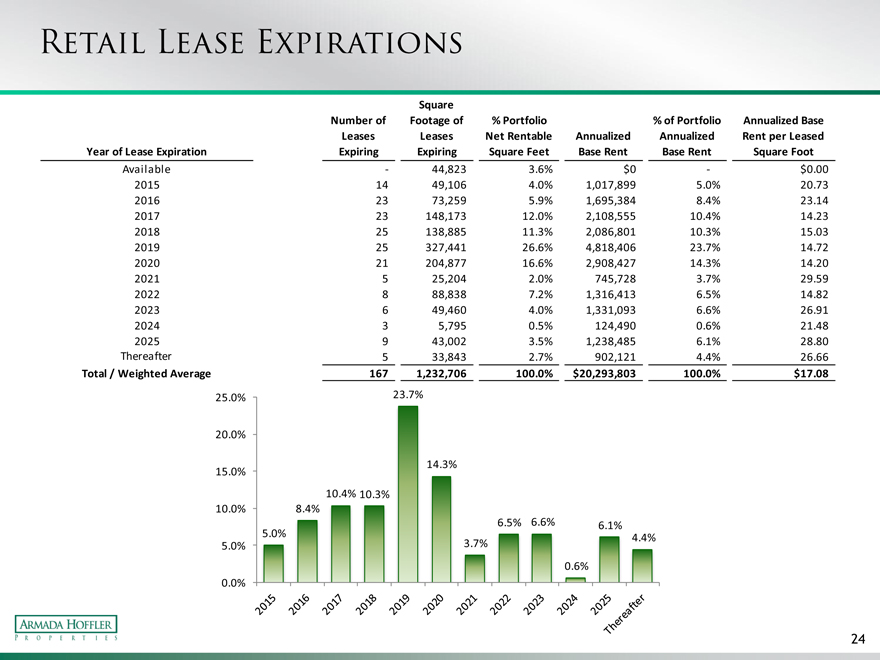
Retail lease expirations
Square
Number of Footage of % Portfolio % of Portfolio Annualized Base Leases Leases Net Rentable Annualized Annualized Rent per Leased Year of Lease Expiration Expiring Expiring Square Feet Base Rent Base Rent Square Foot
Available—44,823 3.6% $0— $0.00 2015 14 49,106 4.0% 1,017,899 5.0% 20.73 2016 23 73,259 5.9% 1,695,384 8.4% 23.14 2017 23 148,173 12.0% 2,108,555 10.4% 14.23 2018 25 138,885 11.3% 2,086,801 10.3% 15.03 2019 25 327,441 26.6% 4,818,406 23.7% 14.72 2020 21 204,877 16.6% 2,908,427 14.3% 14.20 2021 5 25,204 2.0% 745,728 3.7% 29.59 2022 8 88,838 7.2% 1,316,413 6.5% 14.82 2023 6 49,460 4.0% 1,331,093 6.6% 26.91 2024 3 5,795 0.5% 124,490 0.6% 21.48 2025 9 43,002 3.5% 1,238,485 6.1% 28.80 Thereafter 5 33,843 2.7% 902,121 4.4% 26.66
Total / Weighted Average 167 1,232,706 100.0% $20,293,803 100.0% $17.08
25.0% 23.7%
20.0%
14.3%
15.0%
10.4% 10.3%
10.0% 8.4%
6.5% 6.6% 6.1%
5.0% 4.4%
5.0% 3.7%
0.6%
0.0%
24
|
|
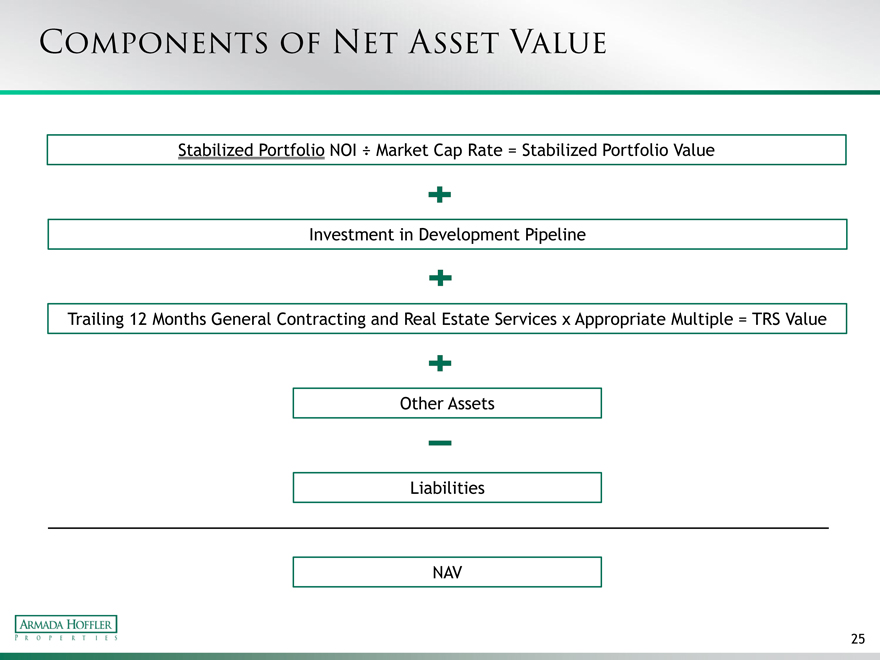
Components of net asset value
Stabilized Portfolio NOI ÷ Market Cap Rate = Stabilized Portfolio Value
Investment in Development Pipeline
Trailing 12 Months General Contracting and Real Estate Services x Appropriate Multiple = TRS Value
Other Assets
Liabilities
NAV
25
|
|
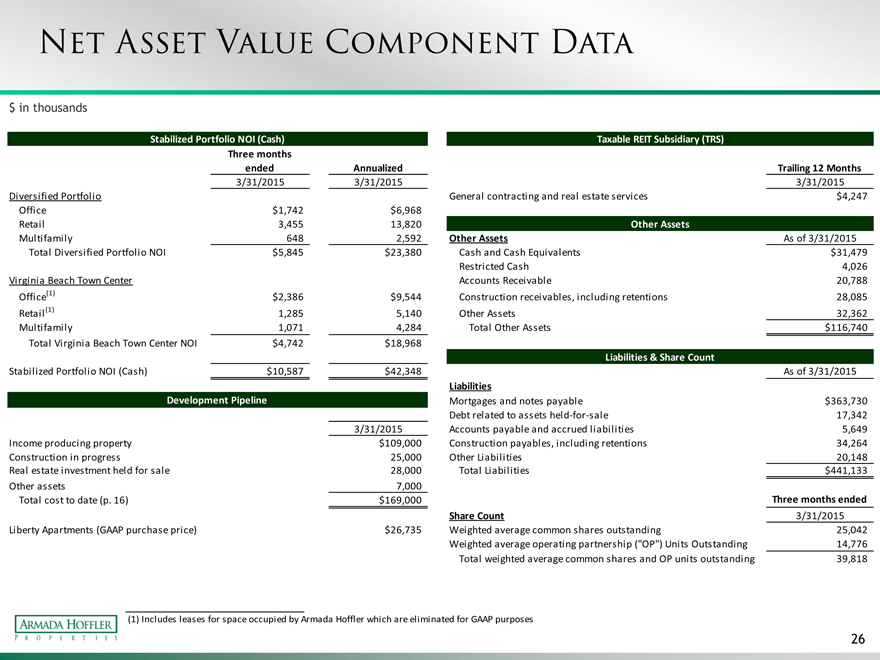
Net asset value component data
$ in thousands
Stabilized Portfolio NOI (Cash) Taxable REIT Subsidiary (TRS) Three months ended Annualized Trailing 12 Months
3/31/2015 3/31/2015 3/31/2015 Diversified Portfolio General contracting and real estate services $4,247 Office $1,742 $6,968 Retail 3,455 13,820 Other Assets Multifamily 648 2,592 Other Assets As of 3/31/2015 Total Diversified Portfolio NOI $5,845 $23,380 Cash and Cash Equivalents $31,479 Restricted Cash 4,026 Virginia Beach Town Center Accounts Receivable 20,788 Office(1) $2,386 $9,544 Construction receivables, including retentions 28,085 Retail(1) 1,285 5,140 Other Assets 32,362 Multifamily 1,071 4,284 Total Other Assets $116,740 Total Virginia Beach Town Center NOI $4,742 $18,968
Liabilities & Share Count
Stabilized Portfolio NOI (Cash) $10,587 $42,348 As of 3/31/2015
Liabilities
Development Pipeline Mortgages and notes payable $363,730 Debt related to assets held-for-sale 17,342 3/31/2015 Accounts payable and accrued liabilities 5,649 Income producing property $109,000 Construction payables, including retentions 34,264 Construction in progress 25,000 Other Liabilities 20,148 Real estate investment held for sale 28,000 Total Liabilities $441,133 Other assets 7,000 Total cost to date (p. 16) $169,000 Three months ended Share Count 3/31/2015 Liberty Apartments (GAAP purchase price) $26,735 Weighted average common shares outstanding 25,042 Weighted average operating partnership (“OP”) Units Outstanding 14,776 Total weighted average common shares and OP units outstanding 39,818
| (1) |
|
Includes leases for space occupied by Armada Hoffler which are eliminated for GAAP purposes |
26
|
|
Appendix – definitions & recogniciliations
|
|
Net Operating Income:
We calculate Net Operating Income (“NOI”) as property revenues (base rent, expense reimbursements and other revenue) less property expenses (rental expenses and real estate taxes). Other REITs may use different methodologies for calculating NOI, and accordingly, our NOI may not be comparable to such other REITs’ NOI. NOI is not a measure of operating income or cash flows from operating activities as measured by GAAP and is not indicative of cash available to fund cash needs. As a result, NOI should not be considered an alternative to cash flows as a measure of liquidity. We consider NOI to be an appropriate supplemental measure to net income because it assists both investors and management in understanding the core operations of our real estate business.
Funds From Operations:
We calculate Funds From Operations (“FFO”) in accordance with the standards established by the National Association of Real Estate Investment Trusts (“NAREIT”). NAREIT defines FFO as net income (loss) (calculated in accordance with accounting principles generally accepted in the United States (“GAAP”)), excluding gains (or losses) from sales of depreciable operating property, real estate related depreciation and amortization (excluding amortization of deferred financing costs) and after adjustments for unconsolidated partnerships and joint ventures.
FFO is a supplemental non-GAAP financial measure. Management uses FFO as a supplemental performance measure because it believes that FFO is beneficial to investors as a starting point in measuring our operational performance. Specifically, in excluding real estate related depreciation and amortization and gains and losses from property dispositions, which do not relate to or are not indicative of operating performance, FFO provides a performance measure that, when compared period-over-period, captures trends in occupancy rates, rental rates and operating costs. Other equity REITs may not calculate FFO in accordance with the NAREIT definition as we do, and, accordingly, our FFO may not be comparable to such other REITs’ FFO.
28
|
|
definitions
Normalized Funds From Operations:
We calculate Normalized Funds From Operations (“Normalized FFO”) as FFO calculated in accordance with the standards established by NAREIT, adjusted for acquisition, development and other pursuit costs, gains or losses from the early extinguishment of debt, impairment charges, mark-to-market adjustments on interest rate derivatives and other noncomparable items.
Management believes that the computation of FFO in accordance to NAREIT’s definition includes certain items that are not indicative of the results provided by the Company’s operating portfolio and affect the comparability of the Company’s period-over-period performance. Our calculation of Normalized FFO differs from NAREIT’s definition of FFO. Other equity REITs may not calculate Normalized FFO in the same manner as us, and, accordingly, our Normalized FFO may not be comparable to other REITs’ Normalized FFO.
Adjusted Funds From Operations:
We calculate Adjusted Funds From Operations (“AFFO”) as Normalized FFO adjusted for the impact of non-cash stock compensation, acquisition, development and other pursuit costs, tenant improvement, leasing commission and leasing incentive costs associated with second generation rental space, capital expenditures, non-cash interest expense, straight-line rents, the amortization of leasing incentives and above (below) market rents and proceeds from government development grants.
Management believes that AFFO provides useful supplemental information to investors regarding our operating performance as it provides a consistent comparison of our operating performance across time periods and allows investors to more easily compare our operating results with other REITs. However, other REITs may use different methodologies for calculating AFFO or similarly entitled FFO measures and, accordingly, our AFFO may not always be comparable to AFFO or other similarly entitled FFO measures of other REITs.
29
|
|
EBITDA:
We calculate EBITDA as net income (loss) (calculated in accordance with GAAP), excluding interest expense, income taxes and depreciation and amortization. We also exclude gains (or losses) from sales of depreciable operating property from our calculation of EBITDA. Management believes EBITDA is useful to investors in evaluating and facilitating comparisons of our operating performance between periods and between REITs by removing the impact of our capital structure (primarily interest expense) and asset base (primarily depreciation and amortization) from our operating
results.
Core EBITDA:
We calculate Core EBITDA as EBITDA, excluding certain items, including, but not limited to, debt extinguishment losses, mark-to-market adjustments on interest rate derivatives, non-cash stock compensation and the impact of development pipeline projects that are still in lease-up. We generally consider a property to be in lease-up until the earlier of (i) the quarter after which the property reaches 80% occupancy or (ii) the thirteenth quarter after the property receives its certificate of occupancy. Management believes that Core EBITDA provides useful supplemental information to investors regarding our ongoing operating performance as it provides a consistent comparison of our operating performance across time periods and allows investors to more easily compare our operating results with other REITs. However, other REITs may use different methodologies for calculating Core EBITDA or similarly entitled measures and, accordingly, our Core EBITDA may not always be comparable to Core EBITDA or other similarly entitled measures of other REITs.
Core Debt:
We calculate Core Debt as our total debt, excluding loans associated with our development pipeline.
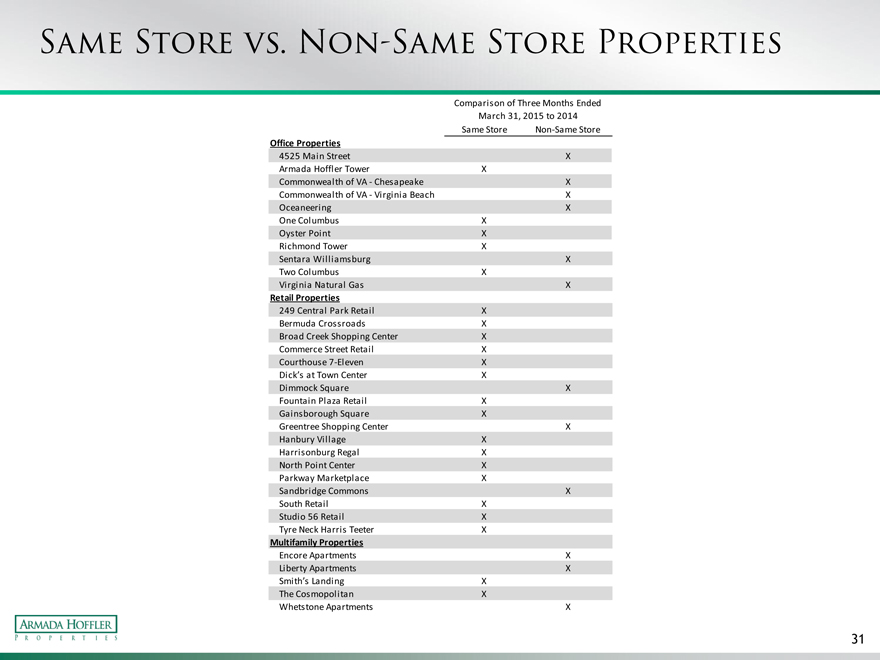
Same Store Portfolio:
We define same store properties as those that we owned and operated for the entirety of the comparative periods presented. We generally consider a property to be in lease-up until the earlier of (i) the quarter after which the property reaches 80% occupancy or (ii) the thirteenth quarter after the property receives its certificate of occupancy. The following table shows the properties included in the same store and non-same store portfolio for the comparative periods presented.
30
|
|
Same store vs. non-same store properties
Comparison of Three Months Ended March 31, 2015 to 2014 Same Store Non-Same Store
Office Properties
4525 Main Street X Armada Hoffler Tower X
Commonwealth of VA—Chesapeake X Commonwealth of VA—Virginia Beach X Oceaneering X One Columbus X
Oyster Point X Richmond Tower X
Sentara Williamsburg X Two Columbus X
Virginia Natural Gas X
Retail Properties
249 Central Park Retail X Bermuda Crossroads X Broad Creek Shopping Center X Commerce Street Retail X Courthouse 7-Eleven X
Dick’s at Town Center X
Dimmock Square X Fountain Plaza Retail X
Gainsborough Square X
Greentree Shopping Center X Hanbury Village X
Harrisonburg Regal X North Point Center X Parkway Marketplace X
Sandbridge Commons X South Retail X
Studio 56 Retail X Tyre Neck Harris Teeter X
Multifamily Properties
Encore Apartments X Liberty Apartments X
Smith’s Landing X The Cosmopolitan X
Whetstone Apartments X
31
|
|
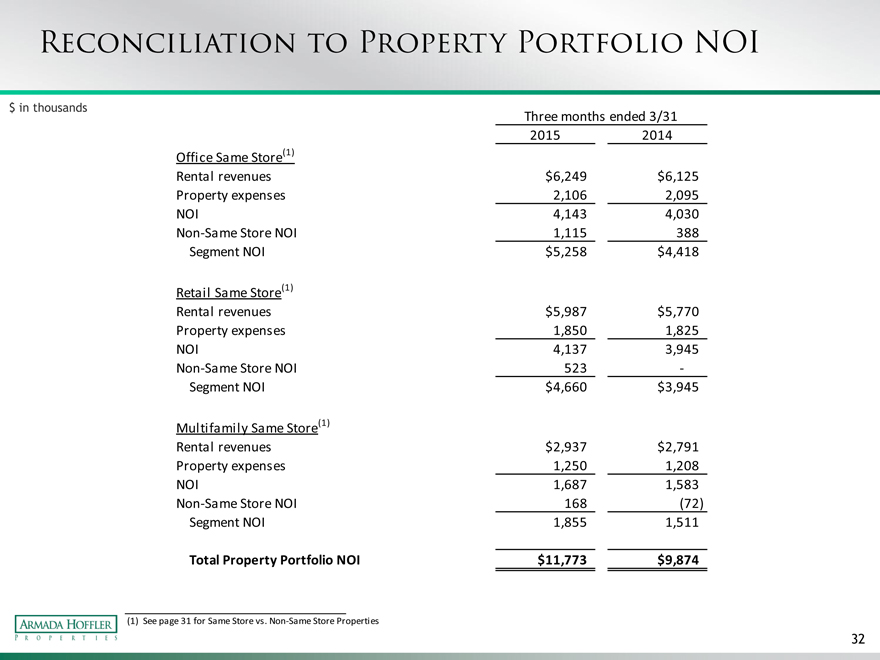
Reconciliation to property portfolio noi $ in thousands
Three months ended 3/31 2015 2014 Office Same Store(1) Rental revenues $6,249 $6,125 Property expenses 2,106 2,095 NOI 4,143 4,030 Non-Same Store NOI 1,115 388 Segment NOI $5,258 $4,418
Retail Same Store(1)
Rental revenues $5,987 $5,770 Property expenses 1,850 1,825 NOI 4,137 3,945 Non-Same Store NOI 523 -Segment NOI $4,660 $3,945
Multifamily Same Store(1)
Rental revenues $2,937 $2,791 Property expenses 1,250 1,208 NOI 1,687 1,583 Non-Same Store NOI 168 (72) Segment NOI 1,855 1,511
Total Property Portfolio NOI $11,773 $9,874
| (1) |
|
See page 31 for Same Store vs. Non-Same Store Properties |
32
|
|
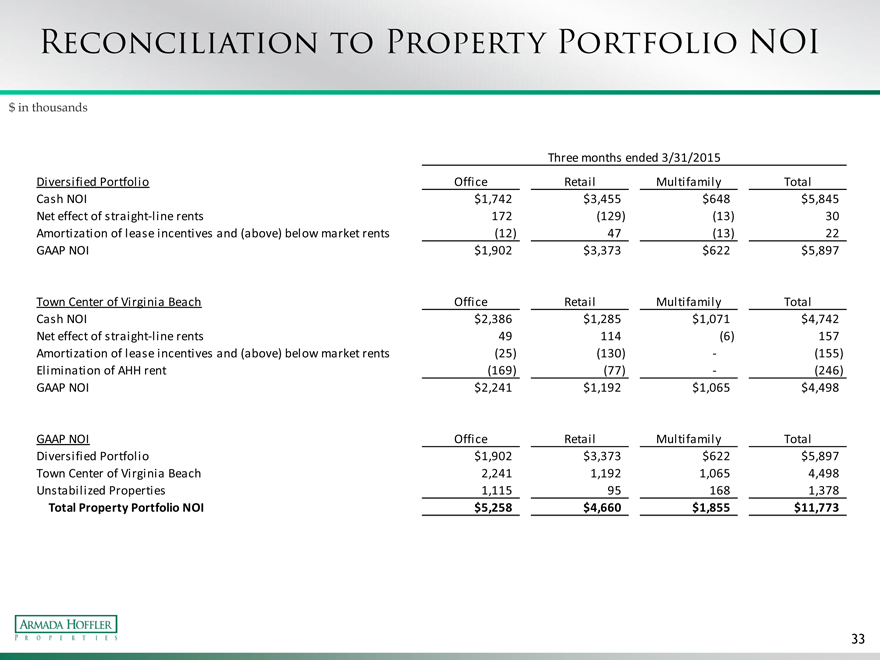
$ in thousands
Three months ended 3/31/2015
Diversified Portfolio Office Retail Multifamily Total Cash NOI $1,742 $3,455 $648 $5,845 Net effect of straight-line rents 172 (129) (13) 30 Amortization of lease incentives and (above) below market rents (12) 47 (13) 22 GAAP NOI $1,902 $3,373 $622 $5,897
Town Center of Virginia Beach Office Retail Multifamily Total Cash NOI $2,386 $1,285 $1,071 $4,742 Net effect of straight-line rents 49 114 (6) 157 Amortization of lease incentives and (above) below market rents (25) (130) — (155) Elimination of AHH rent (169) (77) — (246) GAAP NOI $2,241 $1,192 $1,065 $4,498
GAAP NOI Office Retail Multifamily Total Diversified Portfolio $1,902 $3,373 $622 $5,897 Town Center of Virginia Beach 2,241 1,192 1,065 4,498 Unstabilized Properties 1,115 95 168 1,378
Total Property Portfolio NOI $5,258 $4,660 $1,855 $11,773
33
|
|
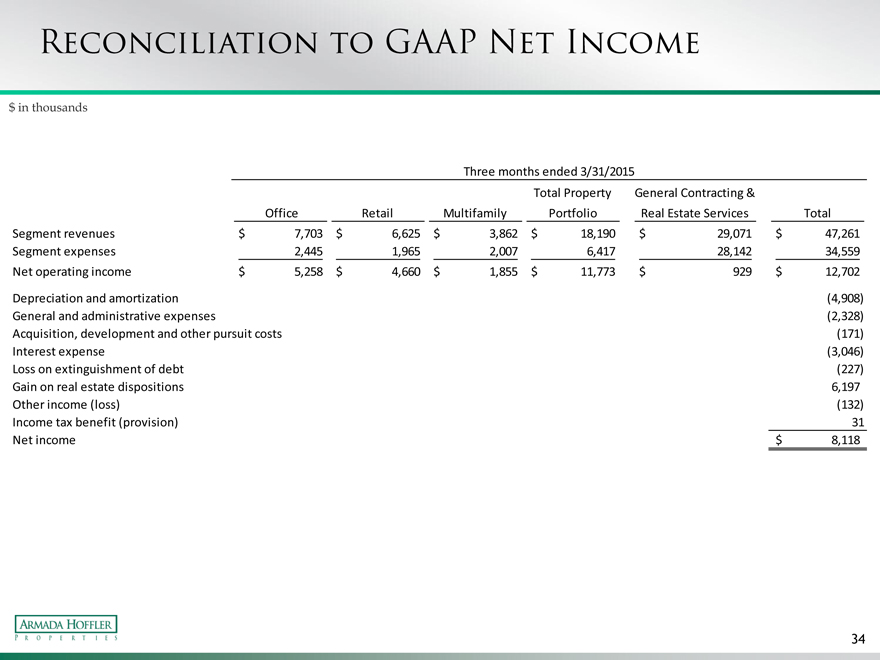
$ in thousands
Three months ended 3/31/2015
Total Property General Contracting &
Office Retail Multifamily Portfolio Real Estate Services Total Segment revenues $ 7,703 $ 6,625 $ 3,862 $ 18,190 $ 29,071 $ 47,261 Segment expenses 2,445 1,965 2,007 6,417 28,142 34,559 Net operating income $ 5,258 $ 4,660 $ 1,855 $ 11,773 $ 929 $ 12,702
Depreciation and amortization (4,908) General and administrative expenses (2,328) Acquisition, development and other pursuit costs (171) Interest expense (3,046) Loss on extinguishment of debt (227) Gain on real estate dispositions 6,197 Other income (loss) (132) Income tax benefit (provision) 31 Net income $ 8,118
34