Attached files
| file | filename |
|---|---|
| 8-K - FORM 8-K - People's United Financial, Inc. | d915900d8k.htm |
 Investor Presentation
April / May 2015
NASDAQ: PBCT
Exhibit 99.1 |
 1
Forward-Looking Statement
Certain statements contained in this presentation are forward-looking in
nature. These include all statements about People's United Financial's
plans, objectives, expectations and other statements that are not historical
facts, and usually use words such as "expect," "anticipate," "believe," "should" and similar
expressions. Such statements represent management's current beliefs, based upon
information available at the time the statements are made, with regard to
the matters addressed. All forward-looking statements are
subject
to
risks
and
uncertainties
that
could
cause
People's
United
Financial's
actual
results
or
financial
condition
to
differ
materially
from
those
expressed
in
or
implied
by
such
statements.
Factors
of
particular importance to People’s United Financial include, but are not
limited to: (1) changes in general, national or regional economic
conditions; (2) changes in interest rates; (3) changes in loan default and
charge-off rates; (4) changes in deposit levels; (5) changes in levels of
income and expense in non- interest income and expense related
activities; (6) changes in accounting and regulatory guidance applicable to
banks; (7) price levels and conditions in the public securities markets generally; (8)
competition and its effect on pricing, spending, third-party relationships and
revenues; and (9) changes in regulation resulting from or relating to
financial reform legislation. People's United Financial does not undertake
any obligation to update or revise any forward-looking statements, whether as a result of new
information, future events or otherwise. |
 2
Experienced
Experienced
leadership team
leadership team
Operate in large &
attractive Northeast
markets…
…with significant
…with significant
with significant
knowledge at the local
knowledge at the local
level
level
Commitment to
relationship-based
banking
Breadth of products
Breadth of products
& services
& services
Conservative & well-
defined underwriting
culture
Premium brand built
Premium brand built
over 170 years
over 170 years
Deep focus on
Deep focus on
expense management
expense management
PBCT Differentiators
A Uniquely Positioned Franchise |
 3
PBCT: Compelling Investment Opportunity
•
Leading market position in one of the best commercial banking markets in the
U.S. •
Significant growth runway within existing markets –
expanding in two of the largest MSAs in the U.S.
–
New York City #1 and Boston #10
•
Ability to maintain pristine credit quality
–
Median net charge-offs/average loans since 2007 have been 18bps
•
Improving profitability
–
Five consecutive years of growth in operating earnings per share
•
Low operating risk profile
–
Consistently profitable throughout the credit cycle
–
Straightforward
and
diversified
portfolio
of
products
–
no
complex
financial
exposures
•
Robust liquidity
–
Strong deposit market share in most core markets
–
Unused FHLB of Boston borrowing capacity of $5.5 billion at March 31, 2015
•
Continued capital deployment via organic growth and dividends
–
Eighteen consecutive quarters of loan growth
–
Dividend yield of ~4.5% |
 4
Premium Brand Built Over 170 Years
Corporate Overview
Corporate Overview
People’s United Financial, Inc.
NASDAQ (PBCT)
Headquarters
Bridgeport, CT
Chief Executive Officer
Jack Barnes
Chief Financial Officer
David Rosato
Market Capitalization (04.24.2015)
$4.5 billion
Assets
$36.4 billion
Loans
$26.9 billion
Deposits
$27.1 billion
Branches
405
In-store Branches
(2)
150
ATMs
600
Standalone ATMs
(3)
99
Founded
1842
1
Statistics as of March 31, 2015, unless noted otherwise
2
Exclusive relationship with Stop & Shop
3
Includes
14
ATMs
in
Stop
&
Shop
locations
where
a
branch
is
not
present |
 2010
2010
2011
2011
2012
2012
2008
2008
5
Premium Brand Built Over 170 Years
Acquired:
Chittenden Corp. which comprised:
Chittenden Bank –
Burlington, VT
Ocean Bank –
Portsmouth, NH
Maine Bank & Trust –
Portland, ME
Merrill Bank –
Bangor, ME
Flagship Bank –
Worcester, MA
Bank of West. Mass. –
Springfield, MA
Acquired:
57 branches in greater New York
metro area from RBS Citizens –
including 53 branches in Stop &
Shop supermarkets
Since 1995, PBCT has had an
exclusive relationship with Stop &
Shop to operate branches in
Connecticut stores
Acquired:
Danversbank –
Danvers, MA
Geographic Expansion in Recent Years
Acquired:
Equipment financing company
Financial Federal –
New York, NY
Acquired:
Butler Bank –
Lowell, MA
RiverBank –
North Andover, MA
Bank of Smithtown –
Smithtown, NY |
 6
Premium Brand Built Over 170 Years
In-Store Branches Versus Traditional Branches
•
Partnership allows us to leverage People’s United brand with the ~3.3 million
shoppers who visit Connecticut and New York Stop & Shop stores every
week •
In-store locations operate under the same business model as traditional
branches and sell all the Bank’s products and services
•
Connecticut and New York in-store branches accounted for a significant portion
of the new branch business booked in the market
Note: statistics represent Connecticut and New York branches only
On average, in-store locations are open 37% more hours per week (56 hours vs.
41 hours), but are 30% less expensive to operate.
Last twelve months through March 31, 2015
In-Store Branches
Traditional Branches |
 Jack Barnes
President & CEO, Director
30+
People’s United Bank (SEVP, CAO),
Chittenden, FDIC
Galan Daukas
SEVP Wealth Management
25+
People’s United Bank, Washington Trust, The
Managers Funds, Harbor Capital Mgmt
Sara Longobardi
SEVP Retail Banking
20+
People’s United Bank
Dave Norton
SEVP & Chief HR Officer
5+
People’s United Bank, New York Times,
Starwood, PepsiCo
Lee Powlus
SEVP & Chief Administrative Officer
25+
People’s United Bank, Chittenden, Alltel
David Rosato
SEVP & CFO
25+
People’s United Bank, Webster, Allfirst
Chantal Simon
SEVP & Chief Risk Officer
25+
People’s United Bank, Merrill Lynch US Bank,
Lazard Freres & Co.
Jeff Tengel
SEVP Commercial Banking
30+
People’s United Bank, PNC, National City
Bob Trautmann
SEVP & General Counsel
20+
People’s United Bank, Tyler Cooper & Alcorn
Kirk Walters
SEVP Corporate Development,
Director
25+
People’s United Bank, Santander, Sovereign,
Chittenden, Northeast Financial
Name
Name
Position
Position
Years in Banking
Years in Banking
Professional Experience
Professional Experience
Experienced Leadership Team
7 |
 8
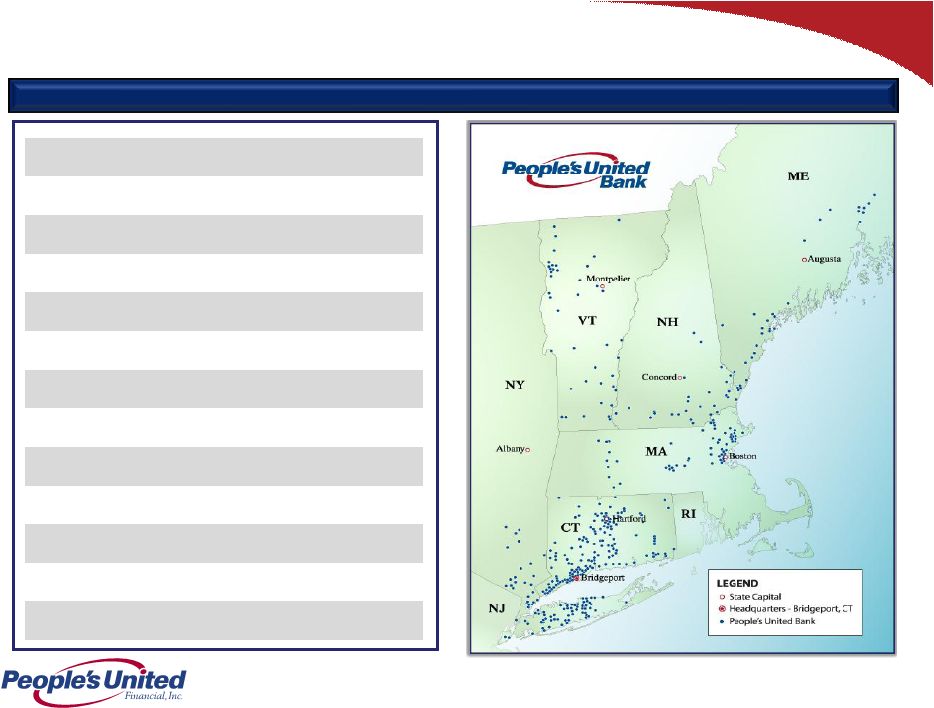
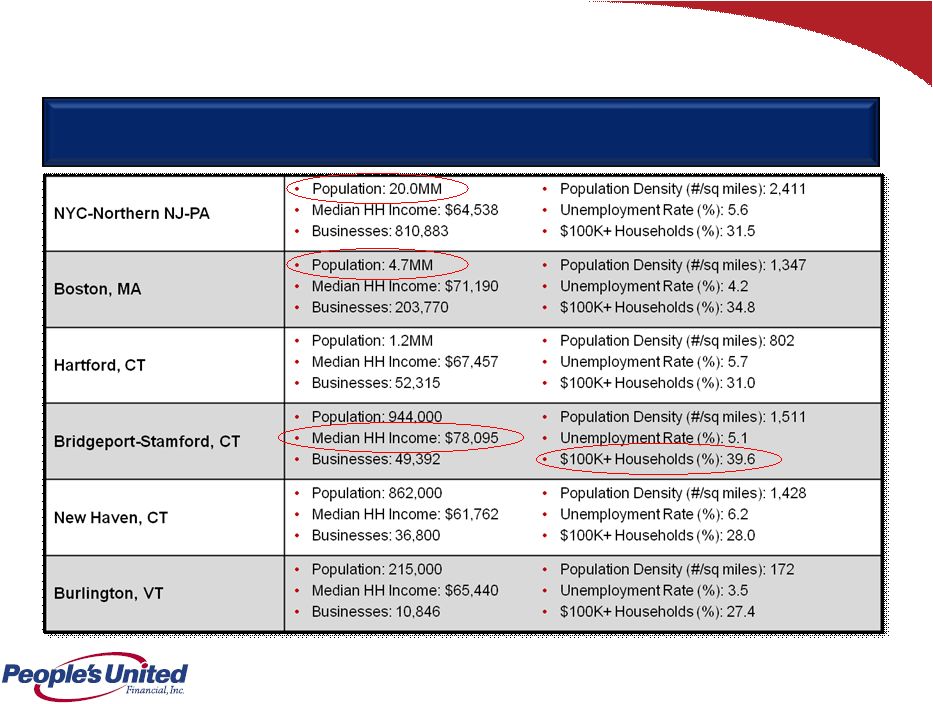
Operate in Large & Attractive Northeast Markets
Notes: The current national unemployment rate is 5.5%
The current national population density is 90 (#/sq miles)
Source: SNL Financial, US Census data
The
population
densities
of
NYC,
Boston,
Bridgeport
and
New
Haven
MSAs
are
each
over
ten
times
the
national
average |
  9
Operate in Large & Attractive Northeast Markets
People’s United’s Franchise Metrics¹
MSA Rank
MSA Rank
(Out of 917 MSAs Nationwide)
(Out of 917 MSAs Nationwide)
75% of PBCT’s deposits are in its top 5 MSAs, which are some of the
most densely populated and wealthy markets in the U.S.
Source: SNL Financial; Nielsen; FDIC data as of June 30, 2014
1.
Excludes
deposits
from
trust
institutions
and
branches
with
over
$750
million
deposits;
excludes branches and deposits located outside each MSA
2.
Rank weighted by percentage of franchise deposits
Market Size
Population
Median
% Households
People's United Top 5 MSAs
Total Deposits
Market
% Deposit
Deposits
% of
Density
Household
with $200k+
($ in millions)
Rank
Market Share
($ in millions)
Franchise
(# / sq. mile)
Income
Income
Bridgeport-Stamford-Norwalk, CT
$35,390
1
17.9%
$6,347
28.8
6
7
2
New York-Newark-Jersey City, NY-NJ-PA
613,008
20
0.5
3,041
13.8
2
34
12
Boston-Cambridge-Newton, MA-NH
131,242
8
2.1
2,784
12.6
8
18
9
Hartford-West Hartford-East Hartford, CT
26,759
4
8.7
2,324
10.6
20
26
21
New Haven-Milford, CT
18,045
4
11.7
2,104
9.6
7
49
34
Top 5 MSAs
$824,444
–
2.0%
$16,600
75.4
–
–
–
Weighted Average Rank ²
–
–
–
–
8
22
12
Rank / Nationwide MSAs (917 MSAs)
–
–
–
–
0.8%
2.4%
1.3% |
 10
Total Loan Portfolio: $26.9 Billion
Total Loan Portfolio: $26.9 Billion
At March 31, 2015
At March 31, 2015
($ in billions)
Connecticut
$7.3 / 27%
Massachusetts
$4.8 / 18%
New Hampshire
$1.3 / 5%
Other
$4.7 / 17%
New York
$5.2 / 19%
Vermont
$1.8 / 7%
New Jersey
$0.9 / 3%
Maine
$0.9 / 4%
Operate in Large & Attractive Northeast Markets
Excluding equipment finance loans, ~91% of PBCT’s loan portfolio is within the
Northeast |
 11
Source: SNL Financial; FDIC data as of June 30, 2014; excludes trust institutions;
excludes non-retail branches Notes: PBCT branch count updated as of
March 31, 2015 Operate in Large & Attractive Northeast Markets
Connecticut
Connecticut
Massachusetts
Massachusetts
Vermont
Vermont
New York
New York
New Hampshire
New Hampshire
Maine
Maine
•
5
th
in deposit market share in New England
–
# 1 in Fairfield County, CT., 65 branches, $7.7 billion in deposits, 20.9% market
share Strong deposit market positions
Strong deposit market positions
Branches
$BN
%
1
People's United
42
2.7
22.7
2
TD Bank
33
2.5
21.3
3
Merchants
32
1.3
11.2
4
RBS
20
0.8
6.7
5
KeyCorp
13
0.7
5.7
6
Northfield
13
0.5
4.5
7
Community
14
0.5
3.9
8
Union
12
0.4
3.6
9
Passumpsic
6
0.3
3.0
10
Berkshire Hills
6
0.3
2.7
Branches
$BN
%
1
RBS
73
6.9
24.1
2
TD Bank
72
5.7
19.9
3
B of A
26
4.4
15.4
4
People's United
28
1.4
4.8
5
NH Mutual
19
1.1
3.8
6
BNH
22
1.0
3.4
7
Santander
20
0.8
2.9
8
NH Thrift
21
0.8
2.9
9
Eastern Bank
6
0.8
2.7
10
Mascoma
18
0.7
2.6
Branches
$BN
%
1
TD Bank
50
3.2
13.3
2
KeyCorp
53
3.0
12.6
3
Bangor Bancorp
59
2.1
8.9
4
Camden National
44
1.9
7.9
5
B of A
18
1.6
6.8
6
First Bancorp
16
1.0
4.3
7
Machias
17
0.9
3.8
8
People's United
26
0.9
3.7
9
Bar Harbor
16
0.8
3.5
10
Norway
24
0.8
3.4
Branches
$BN
%
1
JPM Chase
799
461.2
37.9
2
Citi
271
79.8
6.6
3
HSBC
149
72.5
6.0
4
B of A
309
65.8
5.4
5
Capital One
264
42.5
3.5
6
M&T
289
39.1
3.2
7
TD Bank
255
27.0
2.2
8
Wells Fargo
87
22.1
1.8
9
Signature
27
18.5
1.5
10
KeyCorp
238
18.1
1.5
27
People's United
101
3.0
0.3
Branches
$BN
%
1
B of A
146
29.1
25.9
2
Webster
123
13.2
11.8
3
People's United
159
13.0
11.5
4
Wells Fargo
75
8.5
7.6
5
TD Bank
75
6.3
5.6
6
JPM Chase
53
4.9
4.4
7
First Niagara
76
3.9
3.5
8
Citi
17
3.2
2.9
9
Liberty
49
2.9
2.6
10
RBS
46
2.5
2.2
Branches
$BN
%
1
B of A
238
61.0
25.4
2
RBS
247
27.5
11.4
3
Santander
226
20.1
8.4
4
TD Bank
150
11.5
4.8
5
Eastern Bank
94
7.2
3.0
6
Independent Bank
86
5.7
2.4
7
First Republic
4
4.7
1.9
8
Middlesex
54
3.5
1.5
9
Boston Private
11
3.4
1.4
10
People's United
49
3.2
1.3 |
 12
Commitment to Relationship-Based Banking
Offer the superior customer service that is more characteristic of a
community oriented bank…
•
Approximately
850,000
commercial,
business
banking,
consumer
and
wealth
management
relationships
•
Long-term relationships with customers
•
Customers relationships are with local management
•
Single
point
of
contact
with
customers
–
break
down
silos
to
present
full
suite
of
products
and
services
•
Senior management frequently interacts with customers
•
Reputation and word-of-mouth referrals often drive new business
•
Broad distribution: 400+ branches across six states, 600+ ATMs, online and mobile
banking •
Call center operations locally located in Bridgeport, CT and Burlington, VT
|
 13
Breadth of Products & Services
Commercial
Commercial
Banking
Banking
Retail
Retail
Banking
Banking
Wealth
Wealth
Management
Management
…while providing the same full breadth of solutions as large banks
…while providing the same full breadth of solutions as large banks
•
Commercial
Lending:
commercial
finance,
real
estate
financing,
equipment
loans
&
leasing,
asset
based
lending, mortgage warehouse lending
•
Deposit
Products:
checking
accounts,
savings
and
money
markets
accounts
•
Treasury
Management:
cash
management
services,
Online
banking
eTreasury+,
ACH
services,
lockbox
services, remote deposit capture, merchant card processing, payroll services,
fraud protection services, liquidity and investment solutions
•
Specialty
Services:
government
banking,
healthcare
&
non-profit
banking,
interest
rate
risk
management,
international services, business aircraft finance
•
Insurance:
commercial
coverage,
employee
benefits,
bonding,
risk
management
services,
specialized
industry insurance
•
Retail
Lending:
residential
mortgages,
home
equity
loans
and
lines
of
credit,
personal
loans
•
Deposit
Products:
checking
accounts,
savings
and
money
markets
accounts
•
Services:
mobile
banking,
online
banking,
credit
cards
•
Wealth
Services
&
Solutions:
financial
planning,
trust
&
estate
solutions,
investment
management,
private
banking, self-directed investing, retirement plan services, institutional
trust services |
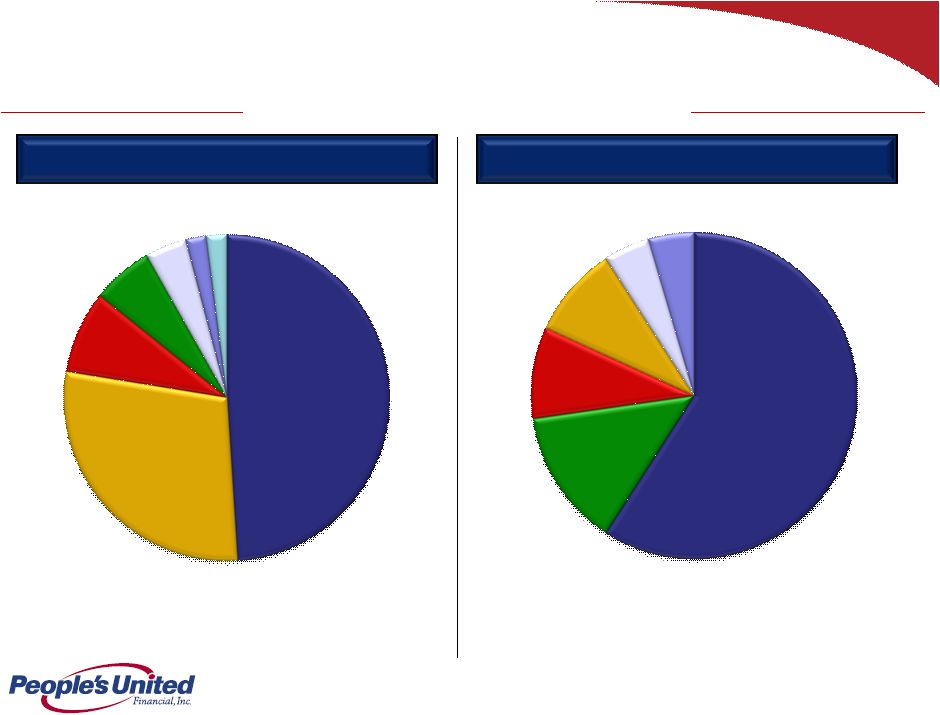
 14
Total Loan Portfolio: $26.9 Billion
Total Loan Portfolio: $26.9 Billion
At March 31, 2015
At March 31, 2015
Commercial
Commercial
$19.7 Billion / 73%
$19.7 Billion / 73%
Breadth of Products & Services
Retail
Retail
$7.2 Billion / 27%
$7.2 Billion / 27% |
 Transp. / Utility
$0.2 / 3%
Arts/Ent./Rec.
$0.1 / 2%
Construction
$0.2 / 3%
Other Prop.
$0.1 / 1%
15
Commercial Real Estate
Commercial Real Estate
$9.5 Billion / 35% of Total Portfolio
$9.5 Billion / 35% of Total Portfolio
(At March 31, 2015)
Residential
(Multi-Family)
$3.4 / 36%
Commercial & Industrial
Commercial & Industrial
$7.4 Billion / 28% of Total Portfolio
$7.4 Billion / 28% of Total Portfolio
Equipment Financing
Equipment Financing
$2.8 Billion / 10% of Total Portfolio
$2.8 Billion / 10% of Total Portfolio
Commercial
Loans:
$19.7
Billion
/
73%
of
Total
Portfolio
($ in billions)
($ in billions)
($ in billions)
Retail
Retail
$2.3 / 25%
$2.3 / 25%
Office Buildings
Office Buildings
$2.2 / 23%
$2.2 / 23%
Land
$0.1 / 1%
Self Storage
$0.1 / 1%
Mixed / Special Use
$0.2 / 2%
Hosp. & Entertain.
$0.5 / 5%
Industrial /
Manufacturing
$0.6 / 6%
Finance &
Finance &
Insurance
Insurance
$1.3 / 18%
$1.3 / 18%
Service
Service
$1.4 / 18%
$1.4 / 18%
Manufacturing
Manufacturing
$1.0 / 13%
$1.0 / 13%
Wholesale Dist.
Wholesale Dist.
$0.8/ 11%
$0.8/ 11%
Health
Health
$0.8 / 10%
$0.8 / 10%
Retail
Retail
Sales
Sales
$0.6 / 9%
$0.6 / 9%
Information
$0.1 / 1%
Public Admin.
$0.1 / 1%
Packaging
$0.1 / 5%
Transportation
& Utilities
$1.0 / 36%
Construction
Construction
$0.4 / 13%
$0.4 / 13%
Finance,
Finance,
Ins. & RE
Ins. & RE
$0.3 / 11%
$0.3 / 11%
Waste
Waste
$0.2 / 7%
$0.2 / 7%
Printing
Printing
$0.2 / 7%
$0.2 / 7%
Manufacturing
Manufacturing
$0.2 / 6%
$0.2 / 6%
Wholesale
Wholesale
Dist.
Dist.
$0.1 / 5%
$0.1 / 5%
Mining, Oil & Gas
$0.1 / 3%
Service
$0.1 / 2%
Other
$0.2 / 5%
Breadth of Products & Services
Broadly diversified commercial loan portfolio
Broadly diversified commercial loan portfolio
Real Estate
Real Estate
$0.8 / 11%
$0.8 / 11% |
 16
Residential Mortgage
$5.0 Billion / 19% of Total Portfolio
$5.0 Billion / 19% of Total Portfolio
(At March 31, 2015)
Retail
Loans:
$7.2
Billion
/
27%
of
Total
Portfolio
($ in billions)
($ in billions)
Consumer
$2.2 Billion / 8% of Total Portfolio
$2.2 Billion / 8% of Total Portfolio
March 2015 YTD originated weighted average LTV of 67%
March 2015 YTD originated weighted average FICO score of 769
Hybrid ARMs represent ~90% of the portfolio
March 2015 YTD originated weighted average CLTV of 58%
March 2105 YTD originated weighted average FICO score of 769
~60% of originations during last 3 years are in a first lien position
New York
New York
$0.5 / 9%
$0.5 / 9%
Vermont
Vermont
$0.3 / 6%
$0.3 / 6%
Massachusetts
Massachusetts
$1.4 / 28%
$1.4 / 28%
Connecticut
Connecticut
$2.4 / 48%
$2.4 / 48%
Connecticut
Connecticut
$1.3 / 60%
$1.3 / 60%
Vermont
Vermont
$0.3 / 10%
$0.3 / 10%
New York
New York
$0.2 / 10%
$0.2 / 10%
Massachusetts
Massachusetts
$0.2 / 8%
$0.2 / 8%
New Hampshire
$0.2 / 4%
Maine
$0.1 / 3%
Other
$0.1 / 2%
New Hampshire
$0.1 / 6%
Maine
$0.1 / 6%
Breadth of Products & Services |
 17
Conservative & Well-Defined Underwriting Culture
•
Credit culture and underwriting standards
–
Cash flow –
deal specific and global
–
Collateral / limited unsecured exposure with equity investment requirements and
guarantees –
No speculative real estate projects
•
Credit structure includes meaningful covenants, appropriate LTVs
and monitored advance rates
•
Industry knowledge and expertise (i.e. basic industries and property types)
•
Seasoned relationship managers with considerable local market knowledge
•
Experienced senior credit officers (SCO) average 25+ years of commercial banking
experience •
Approval authority
–
Local, regional and corporate credit committee structure
–
>$25 million also requires Executive Risk Oversight Committee approval
•
Due diligence begins prior to the issuance of a proposal (market
manager & SCO) and independent credit
associates in Risk Management are utilized
•
Credit analyst / relationship manager complete detailed loan submission
•
Stress test cash flow for interest rate sensitivities, vacancy and rental rates
•
Independent field exams and appraisal review
Commercial Credit Culture & Approval Process
Commercial Credit Culture & Approval Process |
 18
Conservative & Well-Defined Underwriting Culture
Conservative underwriting is a hallmark of People’s United
Conservative underwriting is a hallmark of People’s United
Average Annual Net Charge-Offs / Average Loans
Peer Group Comparison 2010-2014 |
 19
Deep Focus on Expense Management
•
EMOC has been fully operational since November 2011
–
Committee comprised of the CEO, CFO, Chief Administrative Officer and Chief HR
Officer •
EMOC oversees:
–
Non-interest expense management and implements strategies to attain targeted
goals –
Revenue initiatives that require expenditures and conducts periodic progress
reviews •
Provides a horizontal view of the organization
•
Expense Management Units (EMUs) established to facilitate EMOC functions
–
Defined EMUs include:
•
Technology
•
Operations
•
Real Estate Services
•
Spending requests above $25,000 are submitted by EMU owners for approval
•
Staffing models, staffing replacements and additions for mid-level positions and
above require approval by the Committee
Expense Management Oversight Committee (EMOC)
Expense Management Oversight Committee (EMOC)
Proactive expense management approach
Proactive expense management approach |
 20
Deep Focus on Expense Management
•
People’s United has managed expenses while also making significant investments
in: People
and
systems
amidst
a
regulatory
environment
of
heightened
expectations
Revenue and deposit gathering initiatives
Improving
customer
experiences
via
enhanced
delivery
of
products
and
services
Operating Non-Interest Expenses
Operating expenses have remained flat despite continued strategic
investments and increasing regulatory compliance costs
|
 21
•
Bolstering commercial banking presence in Massachusetts and New York
•
Building large-corporate and government banking productivity
•
Filling in New York metro Commercial Real Estate presence
•
Continuing to leverage investment in asset-based lending
•
Focusing on deposit gathering capabilities
•
Growing wealth management fee income
•
Increasing momentum in other fee income businesses
–
Transitioning Insurance to a more specialized model
–
Delivering interest rate swaps and foreign exchange products to corporate
customers –
Expanding international trade finance
–
Growing commercial banking lending fees
–
Investing in competitive cash management products
These significant opportunities expected to provide earnings growth for years to
come Significant Opportunities
Growing in larger markets (New York metro & greater Boston), while deepening
presence in heritage markets such as Connecticut and Vermont
|
 22
Building the Franchise for the Long-Term
Committed to delivering value to both customers and shareholders
Committed to delivering value to both customers and shareholders
•
Increase focus on relationship profitability
–
Continue to build deep, multi-product relationships with an emphasis on
cross-sell –
Deposit gathering remains a key focus and is reflected in incentive
structure •
Maintain pristine asset quality
•
Tightly control expenses while investing in key infrastructure
•
Maintain asset sensitivity to position People’s United for rising interest
rates |
 First Quarter 2015 Results |
 24
First Quarter 2015 Overview
•
Operating
earnings
of
$63.2
million,
an
increase
of
12%
from
the
prior
year
quarter
•
Net interest income¹
of $228 million, consistent with recent quarters
•
Net interest margin of 2.91%, a decrease of 9 basis points
•
Loan growth of $337 million, 5.1% annualized growth rate
•
Organic deposit growth of $1.0 billion, 17.3% annualized growth rate
•
Non-interest income of $89 million, increased 3% from the fourth quarter and
11% from the prior year quarter •
Operating expenses of $212 million, a modest increase due to traditionally higher
first quarter costs, but flat compared to the prior year quarter
•
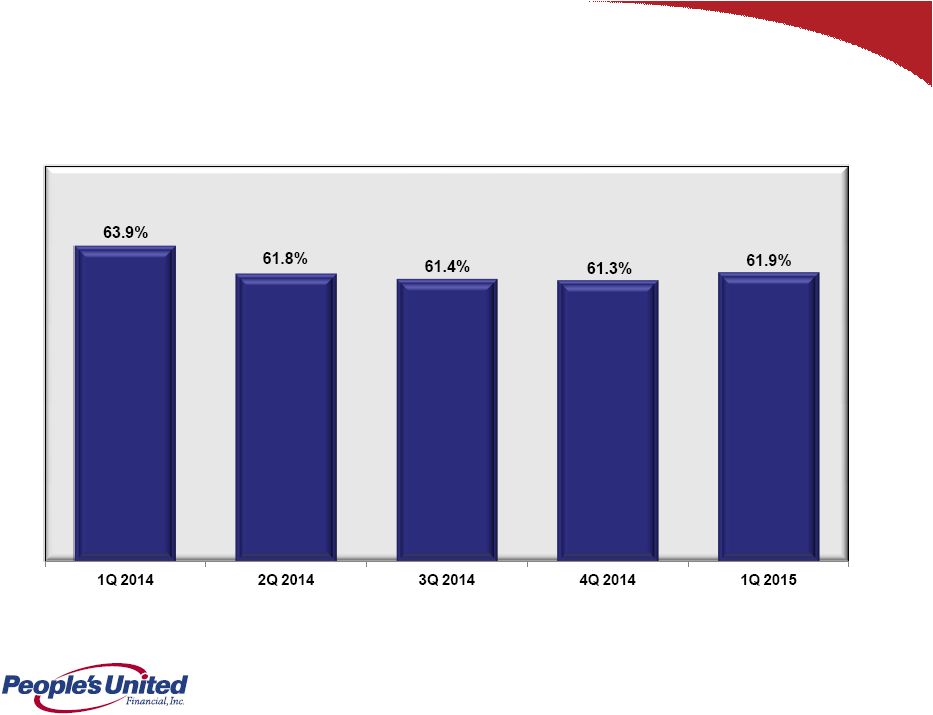
Efficiency ratio was 61.9%, a slight increase from 61.3%, but improved from 63.9%
in the prior year quarter •
Net loan charge-offs were 0.11%, an improvement from 0.13%
(Comparisons versus fourth quarter 2014, unless noted differently)
1
Net interest income on a fully taxable equivalent basis for 4Q 2014 and 1Q 2015
was $233.2 million and $233.9 million, respectively. |
 25
Net Interest Income
1
($ in millions)
Linked Quarter Change
Linked Quarter Change
1
Net interest income on a fully taxable equivalent basis for 4Q 2014 and 1Q 2015
was $233.2 million and $233.9 million, respectively. |
 26
Net Interest Margin
Linked Quarter Change
Linked Quarter Change |
 27
Loans
($ in millions)
Linked Quarter Change
Linked Quarter Change
Annualized linked quarter change: +5.1%
|
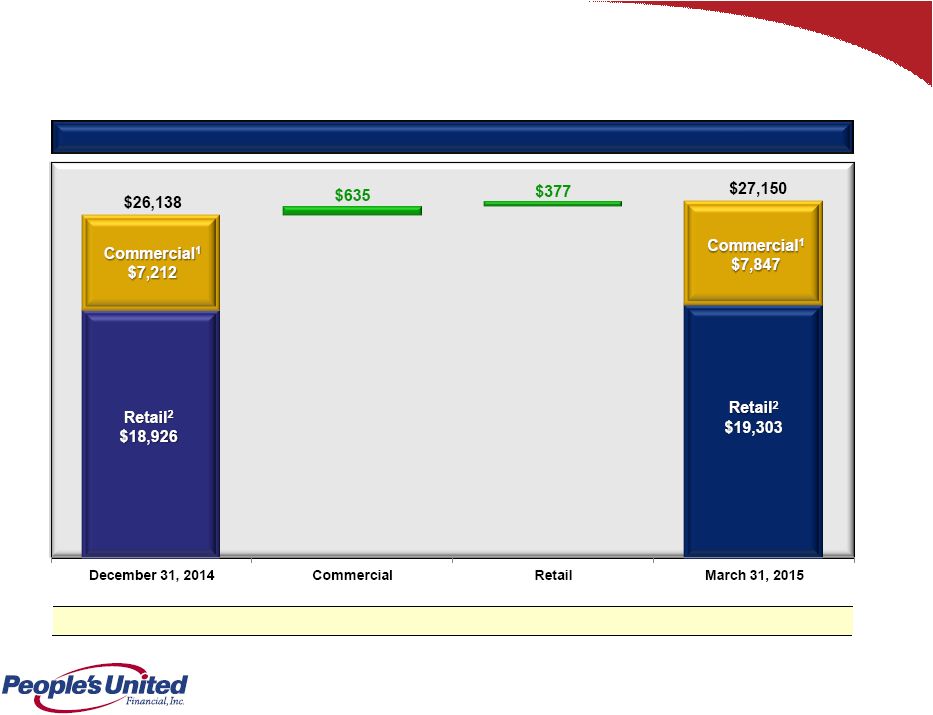 28
Deposits
Linked Quarter Change
Linked Quarter Change
($ in millions)
Annualized linked quarter change: +15.5%
1
Commercial includes Municipal deposits of $1,458 at 12/31/2014 and $1,608 at
3/31/2015 2
Retail includes brokered deposits of $2,633 at 12/31/2014 and $2,629 at
3/31/2015 |
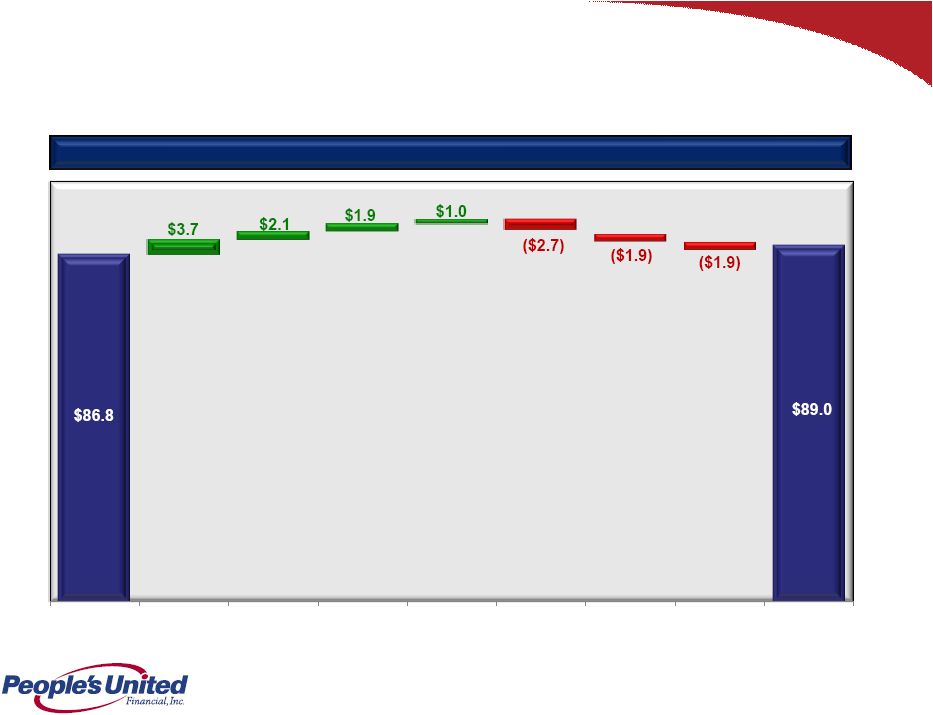 29
Non-Interest Income
($ in millions)
Linked Quarter Change
Linked Quarter Change
4Q 2014
Commercial
Banking Lending
Fees
Customer Interest
Rate Swap Income
Net Gain on
Sale of Loans
Insurance
Net Security
Gains
Bank Service Charges
Other
1Q 2015 |
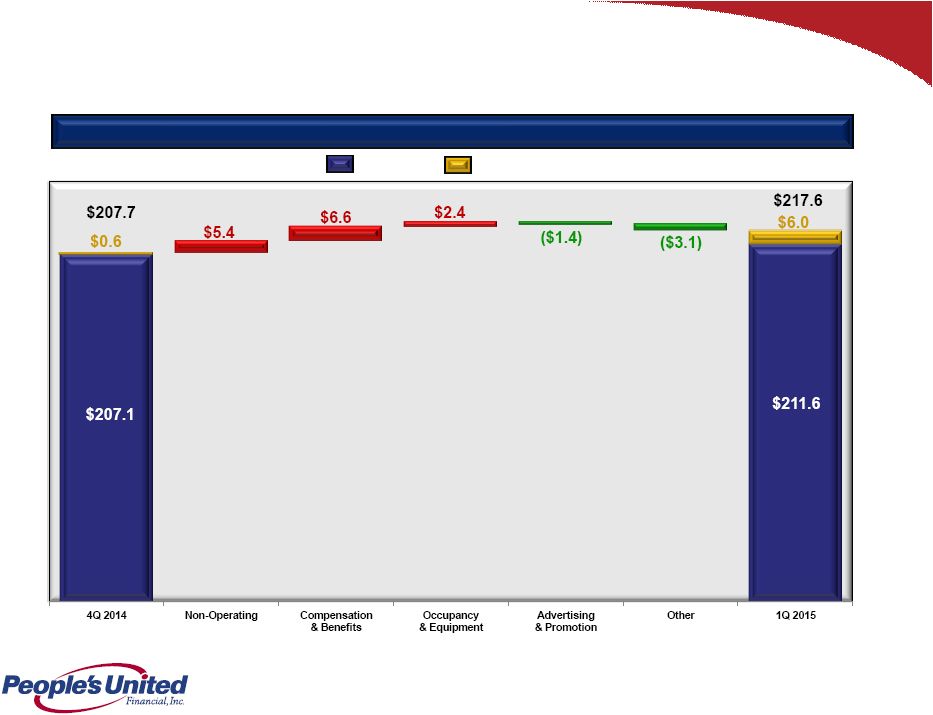 30
Non-Interest Expense
($ in millions)
Linked Quarter Change
Linked Quarter Change
Operating
Non-Operating |
 31
Efficiency Ratio |
 32
Asset Quality
NPAs / Loans & REO (%)
1
1
Non-performing
assets
(excluding
acquired
non-performing
loans)
as
a
percentage
of
originated
loans
plus
all
REO
and
repossessed
assets;
acquired
non-performing
loans
excluded
as
risk
of
loss
has
been
considered
by
virtue
of
(i)
our
estimate
of
acquisition-date
fair
value, (ii) the existence of an FDIC loss sharing agreement, and/or (iii)
allowance for loan losses established subsequent to acquisition Source: SNL
Financial and Company filings Notes: Top 50 Banks represents the largest 50
banks by total assets in each respective quarter PBCT
Peer Group (Median)
Top 50 Banks (Median) |
 33
Asset Quality
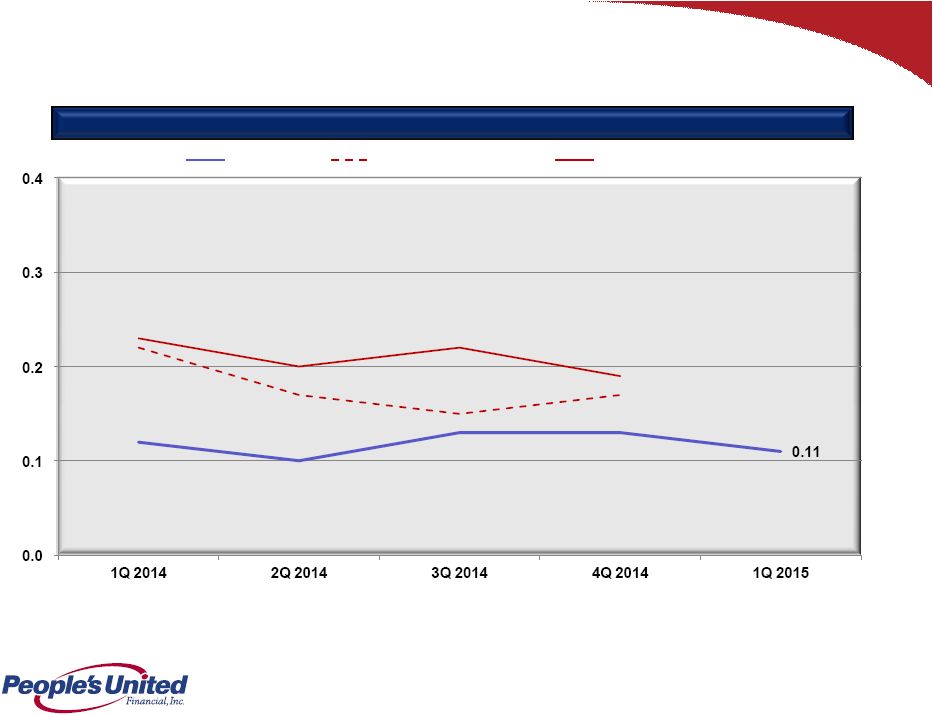
Net Charge-Offs / Average Loans (%)
1
1
Excluding
acquired
loan
charge-offs,
PBCT’s
charge-off
ratio
was
0.11%,
0.13%,
0.12%,
0.09%,
and
0.09%,
in
1Q
2015,
4Q
2014,
3Q
2014,
2Q
2014,
and 1Q 2014, respectively
Source: SNL Financial and Company filings
Notes: Top 50 Banks represents the largest 50 banks by total assets in each
respective quarter PBCT
Peer Group (Median)
Top 50 Banks (Median) |
 34
Growing Future Earnings Per Share
Loans
Loans
Deposits
Deposits
Deposits per Share
Loans per Share
Loans ($ in billions)
Deposits ($ in billions)
|
 35
Operating Return on Average Assets |
 36
Operating Return on Average Tangible Equity |
 37
Capital Ratios
(Effective January 1, 2015, all ratios calculated in accordance with Basel
III) Basel III Notes:
1.
Tier
1
Leverage
ratio
represents
Tier
1
Capital
divided
by
Average
Total
Assets
(less
goodwill,
other
acquisition-related
intangibles
and
other
deductions
from
Common
Equity
Tier
1
Capital)
2.
Common
Equity
Tier
1
Capital
ratio
represents
total
stockholder’s
equity,
excluding:
(i)
after-tax
net
unrealized
gains
(losses)
on
certain
securities
classified
as
available
for
sale;
(ii)
goodwill
and
other
acquisition-
related intangibles; and (iii)
the amount recorded in accumulated other comprehensive income (loss) relating to
pension and other postretirement benefits divided by Total Risk-Weighted Assets
3.
Tier
1
Risk-Based
Capital
ratio
represents
Common
Equity
Tier
1
Capital
plus
additional
Tier
1
Capital
(together,
"Tier
1
Capital")
divided
by
Total
Risk-Weighted
Assets
4.
Total Risk-Based Capital ratio represents Tier 1 Capital plus subordinated notes
and debentures, up to certain limits, and the allowance for loan losses, up to 1.25% of Total Risk-Weighted Assets, divided by Total
Risk-Weighted Assets
5.
Well capitalized limits under Basel III capital rules are: Tier 1 Leverage Ratio,
5%; Common Equity Tier 1 Capital Ratio, 6.5%; Tier 1 Risk-Based Capital Ratio, 8%; and Total Risk-Based Capital Ratio, 10%
1Q 2014
2Q 2014
3Q 2014
4Q 2014
1Q 2015
People’s United Financial
Tang. Com. Equity/Tang. Assets
8.0%
7.9%
7.8%
7.5%
7.5%
Tier 1 Leverage
1, 5
8.4%
8.3%
8.1%
7.9%
8.3%
Common Equity Tier 1 Capital
2, 5
10.1%
10.0%
9.9%
9.8%
10.0%
Tier 1 Risk-Based Capital
3, 5
10.1%
10.0%
9.9%
9.8%
10.0%
Total Risk-Based Capital
4, 5
11.2%
12.5%
12.3%
12.2%
12.0%
People’s United Bank
Tier 1 Leverage
1, 5
9.1%
9.0%
8.8%
8.5%
8.8%
Common Equity Tier 1 Capital
2, 5
11.0%
10.8%
10.7%
10.5%
10.6%
Tier 1 Risk-Based Capital
3, 5
11.0%
10.8%
10.7%
10.5%
10.6%
Total Risk-Based Capital
4, 5
12.2%
13.5%
13.3%
13.0%
13.1% |
 38
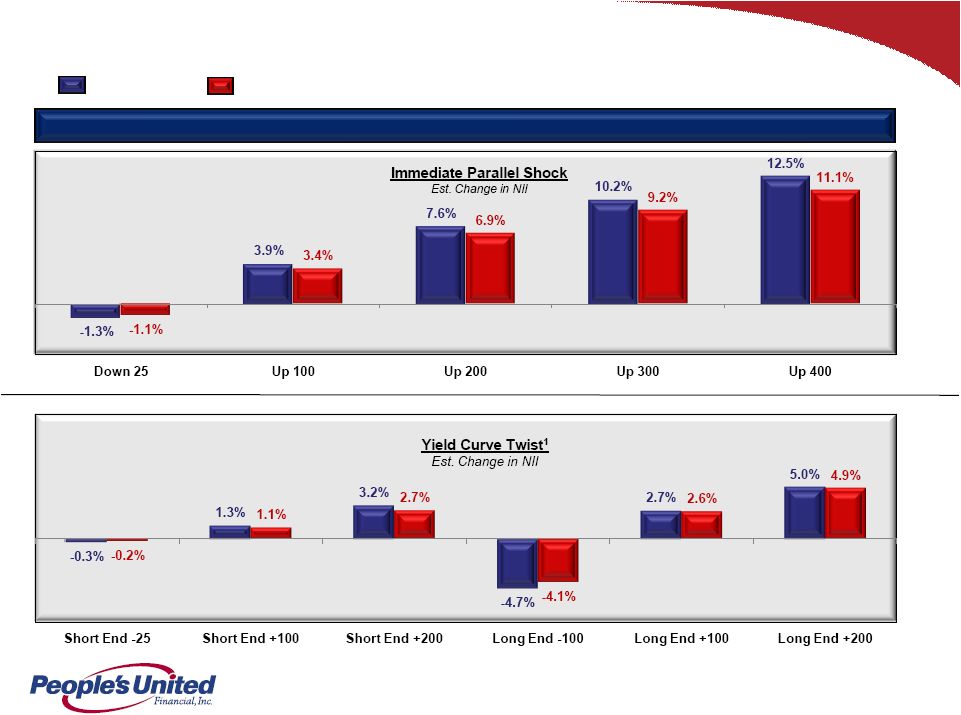
Interest Rate Risk Profile
Net Interest Income (NII) Sensitivity
Net Interest Income (NII) Sensitivity
1
Yield
curve
twist
pivot
point
is
18
month
point
on
yield
curve.
Short
End
defined
as
overnight
to
18
months.
Long End defined as terms greater than 18 months.
Mar. 31, 2015
Dec. 31, 2014 |
 39
Experienced
Experienced
leadership team
leadership team
Operate in large &
attractive Northeast
markets…
…with significant
…with significant
with significant
knowledge at the local
knowledge at the local
level
level
Commitment to
relationship-based
banking
Breadth of products
Breadth of products
& services
& services
Conservative & well-
defined underwriting
culture
Premium brand built
Premium brand built
over 170 years
over 170 years
Deep focus on
Deep focus on
expense management
expense management
Summary
A Uniquely Positioned Franchise |
 Appendix |
 41
Asset Quality
Originated Portfolio Coverage Detail as of March 31, 2015
ALLLs / Loans
ALLLs / Loans
NPLs / Loans
NPLs / Loans
ALLLs / NPLs
ALLLs / NPLs
Note –
ALLLs: Commercial: $173 million, Retail: $18 million, Total: $191 million
|
 Bonds, Notes & Debentures
$0.3 / 5%
42
Securities Portfolio Detail
Note:
Duration of the securities portfolio is ~4 years
Securities portfolio does not contain CLOs, CDOs, trust preferred, or
private-label mortgage-backed securities Held to maturity (HTM)
securities reported on an amortized cost basis (book value). Available for sale (AFS)
securities reported at fair value
Numbers may not sum due to rounding
Agency CMO’s
$1.8 / 33%
Agency MBS & Agency CMOs comprised of 10-yr & 15-yr collateral
constitute ~78% of the portfolio. Municipal bond portfolio has an underlying
weighted average credit rating above AA .
.
Securities Portfolio: $5.6 Billion
Securities Portfolio: $5.6 Billion
At March 31, 2015
At March 31, 2015
($ in billions)
Agency MBS
Agency MBS
$2.2 / 40%
$2.2 / 40%
Municipal -
HTM
$0.9 / 16%
FHLB & Federal
Reserve Bank Stock
$0.3 / 5% |
 43
Balance Sheet Funding
81% funded by organic deposits, customer repurchase agreements and common
equity .
.
Balance Sheeting Funding: $36.4 Billion
Balance Sheeting Funding: $36.4 Billion
At March 31, 2015
At March 31, 2015
($ in billions)
Retail Deposits
Retail Deposits
$16.7 / 46%
$16.7 / 46%
Brokered Deposits
$2.6 / 7%
Commercial Deposits
Commercial Deposits
$7.8 / 21%
$7.8 / 21%
Shareholders’
Equity
$4.7 / 13%
Fed Funds & FHLB
Fed Funds & FHLB
Advances
Advances
$2.7 / 8%
$2.7 / 8%
Subordinated Borrowings
& Senior Notes
$1.0 / 3%
Customer Repurchase
Agreements
$0.5 / 1%
Other Liabilities
$0.4 / 1% |
 44
Peer Group
Firm
Ticker
City
State
1
Associated
ASB
Green Bay
WI
2
BancorpSouth
BXS
Tupelo
MS
3
City National
CYN
Los Angeles
CA
4
Comerica
CMA
Dallas
TX
5
Commerce
CBSH
Kansas City
MO
6
Cullen/Frost
CFR
San Antonio
TX
7
East West
EWBC
Pasadena
CA
8
First Niagara
FNFG
Buffalo
NY
9
FirstMerit
FMER
Akron
OH
10
Fulton
FULT
Lancaster
PA
11
Huntington
HBAN
Columbus
OH
12
M&T
MTB
Buffalo
NY
13
New York Community
NYCB
Westbury
NY
14
Signature
SBNY
New York
NY
15
Susquehanna
SUSQ
Lititz
PA
16
Synovus
SNV
Columbus
GA
17
Valley National
VLY
Wayne
NJ
18
Webster
WBS
Waterbury
CT
19
Wintrust
WTFC
Lake Forest
IL
20
Zions
ZION
Salt Lake City
UT |
 45
Non-GAAP Financial Measures and Reconciliation to GAAP
In addition to evaluating People’s United Financial’s results of
operations in accordance with U.S. generally accepted accounting principles
(“GAAP”), management routinely supplements this evaluation with an analysis of certain non-
GAAP financial measures, such as the efficiency and tangible equity ratios,
tangible book value per share and operating earnings metrics. Management
believes these non-GAAP financial measures provide information useful to
investors in understanding People’s United Financial’s underlying
operating performance and trends, and facilitates comparisons with the
performance of other financial institutions. Further, the efficiency ratio and operating earnings
metrics are used by management in its assessment of financial performance,
including non-interest expense control, while the tangible equity ratio
and tangible book value per share are used to analyze the relative strength of People’s
United Financial’s capital position.
The
efficiency
ratio,
which
represents
an
approximate
measure
of
the
cost
required
by
People’s
United
Financial
to
generate
a
dollar
of
revenue,
is
the
ratio
of
(i)
total
non-interest
expense
(excluding
goodwill
impairment
charges,
amortization of other acquisition-related intangible assets, losses on real
estate assets and non-recurring expenses) (the numerator) to (ii)
net interest income on a fully taxable equivalent ("FTE") basis plus total
non-interest income (including the FTE adjustment on bank-owned life
insurance ("BOLI") income, and excluding gains and losses on sales
of assets other than residential mortgage loans and acquired loans, and non-recurring income) (the
denominator). In addition, operating lease expense is excluded from total
non-interest expense and netted against operating lease income within
non-interest income to conform with the reporting approach applied to fee-based
businesses already presented on a net basis. People’s United Financial
generally considers an item of income or expense to be non-recurring if
it is not similar to an item of income or expense of a type incurred within the last two
years and is not similar to an item of income or expense of a type reasonably
expected to be incurred within the following two years.
|
 46
Non-GAAP Financial Measures and Reconciliation to GAAP
Operating earnings exclude from net income those items that management considers to
be of such a non-recurring or infrequent nature that, by excluding such
items (net of income taxes), People’s United Financial’s results can be
measured and assessed on a more consistent basis from period to period. Items
excluded from operating earnings, which include, but are not limited to,
non-recurring gains/losses, merger-related expenses (including acquisition
integration and other costs), charges related to executive-level management
separation costs, severance-related costs
and
writedowns
of
banking
house
assets,
are
generally
also
excluded
when
calculating
the
efficiency
ratio.
Operating earnings per share is derived by determining the per share impact of the
respective adjustments to arrive at operating earnings and adding
(subtracting) such amounts to (from) GAAP earnings per share. Operating return on
average assets is calculated by dividing operating earnings (annualized) by average
assets. Operating return on average tangible stockholders' equity is
calculated by dividing operating earnings (annualized) by average tangible
stockholders' equity. The operating dividend payout ratio is calculated by dividing
dividends paid by operating earnings for the respective period.
The
tangible
equity
ratio
is
the
ratio
of
(i)
tangible
stockholders’
equity
(total
stockholders’
equity
less
goodwill
and
other
acquisition-related
intangible
assets)
(the
numerator)
to
(ii)
tangible
assets
(total
assets
less
goodwill
and
other
acquisition-related intangible assets) (the denominator). Tangible book value
per share is calculated by dividing tangible stockholders’
equity by common shares (total common shares issued, less common shares classified
as treasury shares and unallocated Employee Stock Ownership Plan
("ESOP") common shares). In light of diversity in presentation among
financial institutions, the methodologies used by People’s United Financial
for determining the non-GAAP financial measures discussed above may differ from
those used by other financial institutions. Please refer to People’s
United Financial’s latest Form 10-Q regulatory filing for detailed reconciliations to
GAAP figures. |
 For more information, investors may contact:
Andrew S. Hersom
(203) 338-4581
andrew.hersom@ peoples.com
NASDAQ: PBCT |