Attached files
| file | filename |
|---|---|
| 8-K - FORM 8-K - PG&E Corp | form8k1q2015.htm |
| EX-99.1 - EARNINGS RELEASE - PG&E Corp | ex9901.htm |

FIRST QUARTER EARNINGS CALL April 29, 2015 Exhibit 99.2
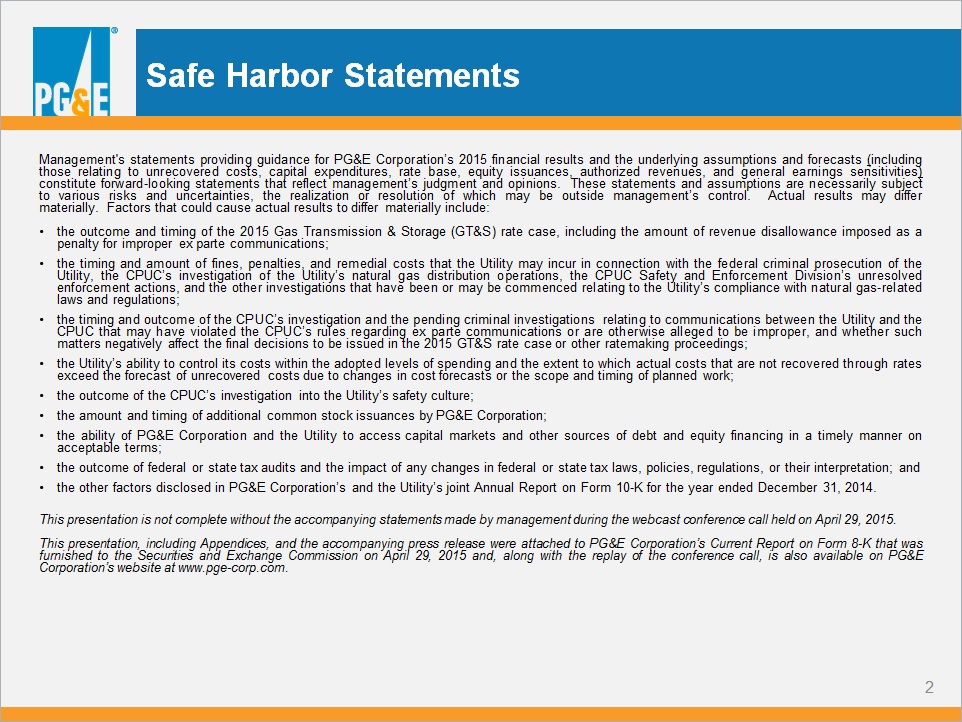
* Safe Harbor Statements Management's statements providing guidance for PG&E Corporation’s 2015 financial results and the underlying assumptions and forecasts (including those relating to unrecovered costs, capital expenditures, rate base, equity issuances, authorized revenues, and general earnings sensitivities) constitute forward-looking statements that reflect management’s judgment and opinions. These statements and assumptions are necessarily subject to various risks and uncertainties, the realization or resolution of which may be outside management’s control. Actual results may differ materially. Factors that could cause actual results to differ materially include: the outcome and timing of the 2015 Gas Transmission & Storage (GT&S) rate case, including the amount of revenue disallowance imposed as a penalty for improper ex parte communications; the timing and amount of fines, penalties, and remedial costs that the Utility may incur in connection with the federal criminal prosecution of the Utility, the CPUC’s investigation of the Utility’s natural gas distribution operations, the CPUC Safety and Enforcement Division’s unresolved enforcement actions, and the other investigations that have been or may be commenced relating to the Utility’s compliance with natural gas-related laws and regulations; the timing and outcome of the CPUC’s investigation and the pending criminal investigations relating to communications between the Utility and the CPUC that may have violated the CPUC’s rules regarding ex parte communications or are otherwise alleged to be improper, and whether such matters negatively affect the final decisions to be issued in the 2015 GT&S rate case or other ratemaking proceedings; the Utility’s ability to control its costs within the adopted levels of spending and the extent to which actual costs that are not recovered through rates exceed the forecast of unrecovered costs due to changes in cost forecasts or the scope and timing of planned work; the outcome of the CPUC’s investigation into the Utility’s safety culture; the amount and timing of additional common stock issuances by PG&E Corporation; the ability of PG&E Corporation and the Utility to access capital markets and other sources of debt and equity financing in a timely manner on acceptable terms; the outcome of federal or state tax audits and the impact of any changes in federal or state tax laws, policies, regulations, or their interpretation; and the other factors disclosed in PG&E Corporation’s and the Utility’s joint Annual Report on Form 10-K for the year ended December 31, 2014. This presentation is not complete without the accompanying statements made by management during the webcast conference call held on April 29, 2015. This presentation, including Appendices, and the accompanying press release were attached to PG&E Corporation’s Current Report on Form 8-K that was furnished to the Securities and Exchange Commission on April 29, 2015 and, along with the replay of the conference call, is also available on PG&E Corporation’s website at www.pge-corp.com.
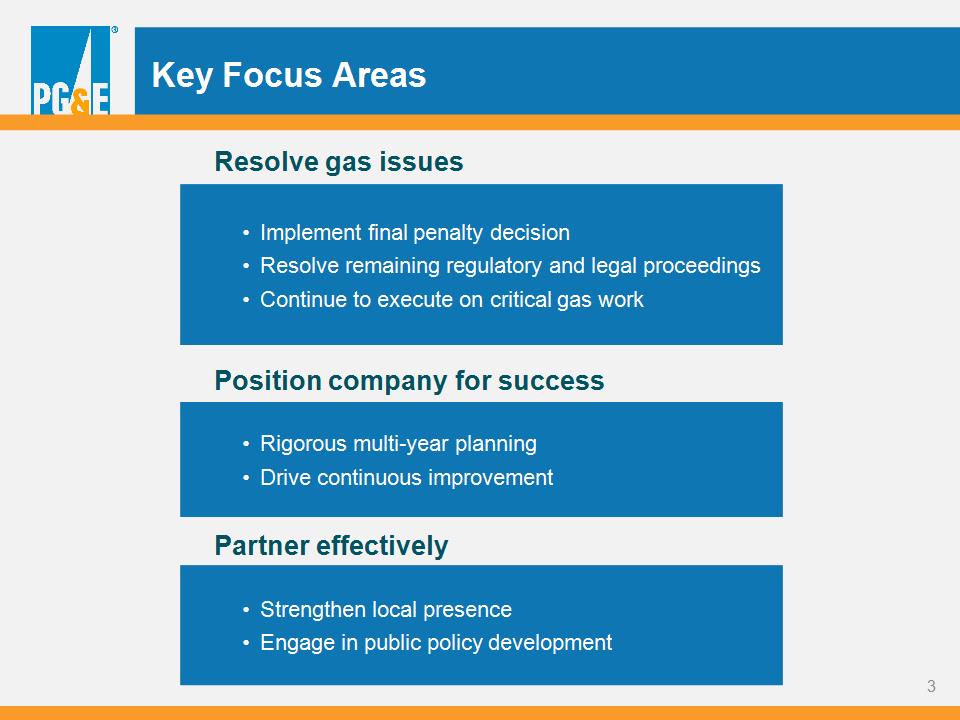
* Key Focus Areas Implement final penalty decision Resolve remaining regulatory and legal proceedings Continue to execute on critical gas work Rigorous multi-year planning Drive continuous improvement Strengthen local presence Engage in public policy development Resolve gas issues Position company for success Partner effectively
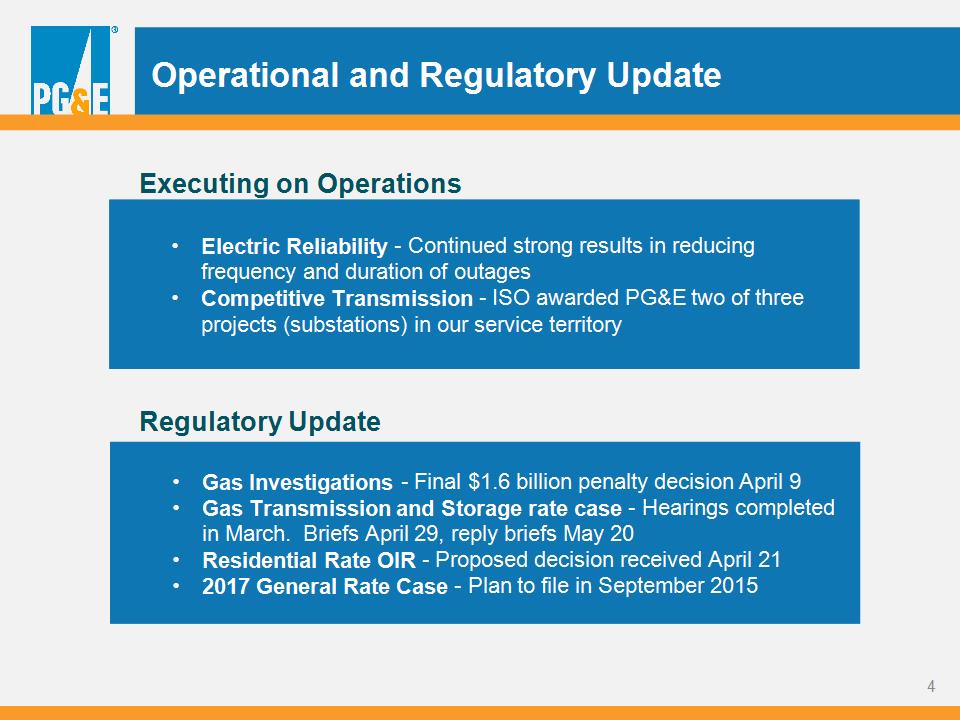
* Gas Investigations – Final $1.6 billion penalty decision April 9 Gas Transmission and Storage rate case – Hearings completed in March. Briefs April 29, reply briefs May 20 Residential Rate OIR – Proposed decision received April 21 2017 General Rate Case – Plan to file in September 2015 Regulatory Update Operational and Regulatory Update Executing on Operations Electric Reliability – Continued strong results in reducing frequency and duration of outages Competitive Transmission – ISO awarded PG&E two of three projects (substations) in our service territory

* Q1 2015 Earnings Results Earnings from Operations is not calculated in accordance with GAAP and excludes items impacting comparability. See Exhibit A in Appendix 2 for a reconciliation of Earnings per Share (“EPS”) from Operations to EPS on a GAAP basis.

* Q1 2015: Quarter over Quarter Comparison EPS from Operations Earnings per Share from Operations is not calculated in accordance with GAAP and excludes items impacting comparability. See Exhibit A in Appendix 2 for a reconciliation of EPS from Operations to EPS on a GAAP basis.

* Assumptions for 2015 Return on Equity: 10.4% Equity Ratio: 52% Authorized Cost of Capital* Authorized Rate Base (weighted average) ($ billions) Other Factors Affecting Earnings from Operations - Gas Transmission & Storage rate case Outcome and timing of rate case Amounts not requested + Tax benefits + Incentive revenues + Monetizing shares in SolarCity CWIP earnings: offset by below-the-line costs Capital Expenditures ($ millions) (1) Includes ~$350 million of estimated capital disallowed in April 9 final penalty decision (2) Amounts previously reserved for limits on PSEP authorized spend *CPUC authorized See the Safe Harbor Statements for factors that could cause actual results to differ materially from the guidance presented and underlying assumptions. (3) Reflects ~$200 million reduction to weighted average rate base for estimated 2015 capital disallowed in April 9 final penalty decision Changes from prior quarter are noted in blue.

* 2015 Earnings Per Share Guidance See the Safe Harbor Statements for factors that could cause actual results to differ materially from the guidance presented and underlying assumptions. See Exhibit E in Appendix 2 for detailed 2015 earnings guidance. Guidance ranges exclude potential future fines or penalties and any future insurance recoveries (1) Guidance is consistent with the April 9 final penalty decision, and the estimated safety-related costs that will be trued up with a final GT&S rate case decision.

* 2015 Items Impacting Comparability Guidance ranges exclude potential future fines or penalties and any future insurance recoveries (1) Guidance is consistent with the April 9 final penalty decision, and the estimated safety-related costs that will be trued up with a final GT&S rate case decision. (2) Guidance assumes roughly half of the disallowed capital is written off in 2015 and the remaining half in 2016. See the Safe Harbor Statements for factors that could cause actual results to differ materially from the guidance presented and underlying assumptions. See Exhibit E in Appendix 2 for detailed 2015 earnings guidance.
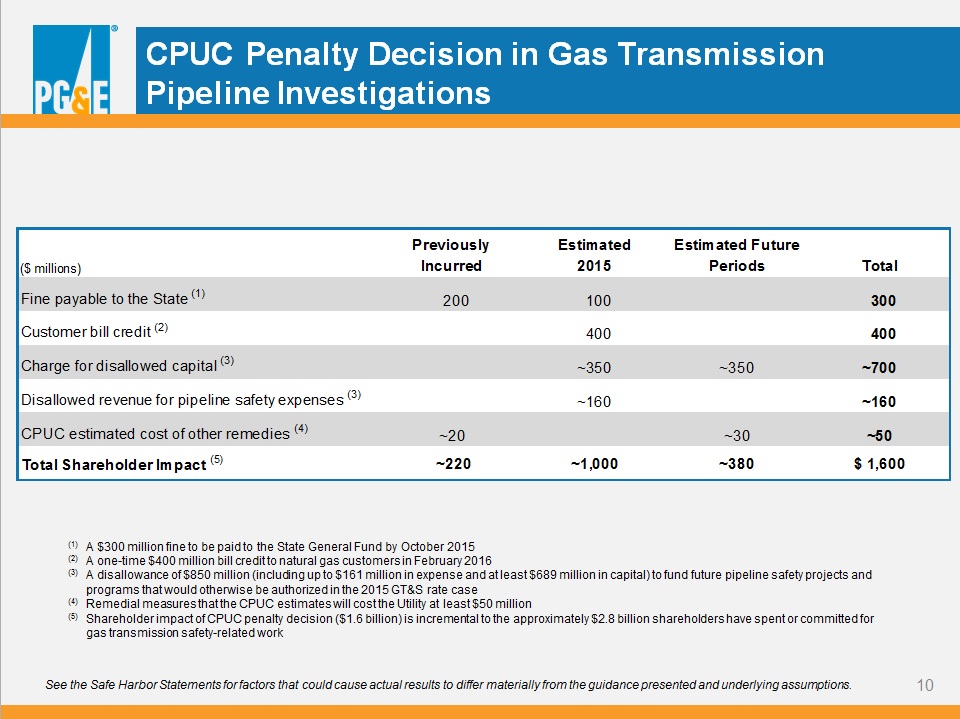
* CPUC Penalty Decision in Gas Transmission Pipeline Investigations (1) A $300 million fine to be paid to the State General Fund by October 2015 (2) A one-time $400 million bill credit to natural gas customers in February 2016 (3) A disallowance of $850 million (including up to $161 million in expense and at least $689 million in capital) to fund future pipeline safety projects and programs that would otherwise be authorized in the 2015 GT&S rate case (4) Remedial measures that the CPUC estimates will cost the Utility at least $50 million (5) Shareholder impact of CPUC penalty decision ($1.6 billion) is incremental to the approximately $2.8 billion shareholders have spent or committed for gas transmission safety-related work See the Safe Harbor Statements for factors that could cause actual results to differ materially from the guidance presented and underlying assumptions.

* 2015 Equity Issuance Previous 2015 $400M - 600M $700M - 800M 2014 EOY shares outstanding: 476M + Fines and penalties Cash flows: balancing accounts, timing of expenditures, and other Current2015 See the Safe Harbor Statements for factors that could cause actual results to differ materially from the guidance presented and underlying assumptions. Changes from prior quarter are noted in blue. March 31, 2015 shares outstanding: 479M

* Capital Expenditures 2014-2016 $4.9B ~$5.5B* $5.3B - 5.8B* 2014 Recorded (1) (1) 2014 recorded capex includes ~$400 million that has already been reserved for PSEP capital that exceeds authorized amounts. * Range reflects recent regulatory decisions, current or planned regulatory filings, and historic spending patterns and includes ~$350 million per year ($689 million total) for estimated capital disallowed in April 9 final penalty decision. See the Safe Harbor Statements for factors that could cause actual results to differ materially from the guidance presented and underlying assumptions. 2016 2015 Changes from prior quarter are noted in blue.

* Rate Base Growth 2014-2016 $32.9 - 33.3B* ~$28.2B 2014 2016 2015 ~$31B* 2014-2016 Weighted Average Authorized Rate Base CAGR: ~8% * Range reflects recent regulatory decisions, current or planned regulatory filings, and historic spending patterns. See the Safe Harbor Statements for factors that could cause actual results to differ materially from the guidance presented and underlying assumptions. Changes from prior quarter are noted in blue.
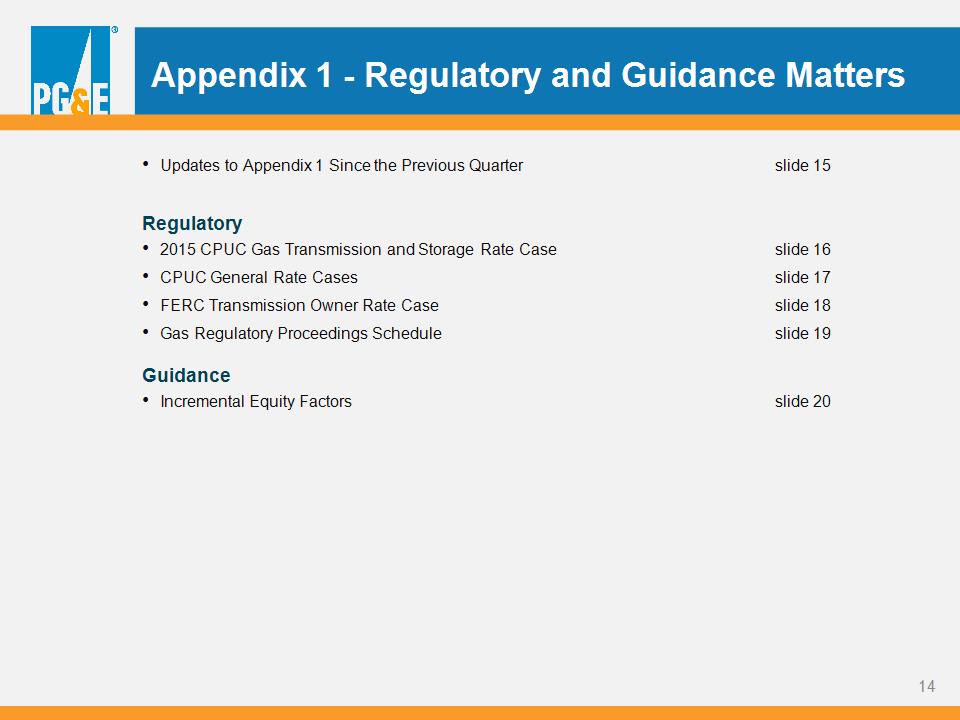
* Appendix 1 – Regulatory and Guidance Matters Updates to Appendix 1 Since the Previous Quarter slide 15 Regulatory 2015 CPUC Gas Transmission and Storage Rate Case slide 16 CPUC General Rate Cases slide 17 FERC Transmission Owner Rate Case slide 18 Gas Regulatory Proceedings Schedule slide 19 Guidance Incremental Equity Factors slide 20
* Updates to Appendix 1 Since the Previous Quarter Slide 16 2015 CPUC Gas Transmission and Storage Rate Case Slide 18 FERC Transmission Owner Rate Case Slide 19 Gas Regulatory Proceedings Schedule Slide 20 Incremental Equity Factors

* 2015 CPUC Gas Transmission and Storage Rate Case Application filed with the CPUC on December 19, 2013 Request for authorized revenue requirement for 2015-2017 Includes operating costs and capital for CPUC jurisdictional gas transmission and storage 2015 requested revenue requirement of $1.3 billion includes increase of $555 million Request reflects significant expense and capital to comply with new gas regulations Requested attrition increases of $61 million and $168 million in 2016 and 2017, respectively ALJ approved revenue requirement retroactivity to January 1, 2015 Decision on Order to Show Cause, November 20, 2014, includes potential disallowance of up to five months of the increase in the authorized revenue requirement. April 9, 2015 final penalty decision in gas transmission pipeline investigations included an $850 million disallowance of costs for future pipeline safety projects and programs that would otherwise be authorized. Qualifying safety work to be determined in GT&S rate case decision. Assigned Commissioner: Peterman (Commissioner Florio recused from proceeding) Administrative Law Judge: Yip-Kikugawa (case reassigned from Wong) Q2 Q4 Q3 Q1 Q3 2014 Briefs Reply briefs SED risk report Intervenor testimony Public participation hearings Self-reported ex parte communication Schedule suspended OSC hearing OSC proposed decision and alternate PD OSC final decision Prehearing conference Evidentiary hearings 2015 Decision

* CPUC General Rate Cases General Rate Case set base revenue requirement for 2014-2016 Includes operating costs and capital for generation and electric and gas distribution Excludes cost of capital determination, electric transmission, gas transmission, and cost of fuel and purchased power Final decision adopted an increase of $460 million compared to the requested increase of $1.16 billion Decision in August 2014; revenues retroactive to January 1, 2014 Decision adopted attrition increases for 2015 and 2016 of $324 million and $371 million, compared to the requested increases of $436 million and $486 million, respectively The CPUC approved balancing account treatment for recovery of costs associated with gas leak survey and repair (up to a cap), major emergencies, and certain new regulatory requirements related to nuclear operations and hydroelectric relicensing Request to be filed September 1, 2015 2017 GRC 2014 GRC Excerpt from Q4 2014 Earnings Presentation

* FERC Transmission Owner Rate Case July 30, 2014 – TO16 filed with FERC Requested revenue requirement of $1.366 billion and ROE of 11.26% September 30, 2014 – TO16 was accepted and rate changes suspended until March 1, 2015 May 7, 2015 – Next settlement conference TO16

* Gas Regulatory Proceedings Schedule Recordkeeping OII I. 11-02-016 Class Location OII I. 11-11-009 Gas Pipeline OII I. 12-01-007 May March April June Gas Pipeline Safety OIR R. 11-02-019 2015 Order to Show Cause - Ex Parte A. 13-12-012 Gas Distribution OII and Order to Show Cause I. 14-11-008 3/13: Modified Presiding Officers’ Decisions and President Picker Decision Different 3/9: Prehearing conference 5/7: CPUC may vote on GO 112 (pipeline safety) rule revisions 4/9: PG&E draft stipulation of facts 4/20: Parties’ reply comments on draft stipulation of facts 5/8: PG&E final stipulation of facts 4/1: Parties’ reply comments on Modified Decisions and Decision Different 4/9: Final decision 6/8: PG&E advice letter establishing shareholder-funded gas transmission safety account 5/26: PG&E advice letter on implementing penalty bill credit

* Incremental Equity Factors Equity Impacting Event Multiplier Fine payable to State (1) 100% Customer bill credit (2) (4) 60% Charge for disallowed capital (3) (4) 30% Disallowed revenue for pipeline safety expenses (2) (4) 60% CPUC estimated costs of other remedies (4) 60% Applies to newly issued fines. Fines already accrued: 50% multiplier at the time of payment Half of multiplier applies at the time of the non-cash impact; remaining half applies at the time the incremental cash is needed Applies to charges in the year in which they are incurred Assumes costs tax deductible Incremental Equity Factors for CPUC Final Penalty Decision

* Appendix 2 – Supplemental Earnings Materials Exhibit A: Reconciliation of PG&E Corporation Earnings from Operations to Consolidated slide 22 Income Available for Common Shareholders in Accordance with GAAP Exhibit B: Key Drivers of PG&E Corporation Earnings per Common Share from Operations slide 23 Exhibit C: Operational Performance Metrics slide 24-25 Exhibit D: Sales and Sources Summary slide 26 Exhibit E: PG&E Corporation Earnings Per Share Guidance slide 27 Exhibit F: General Earnings Sensitivities slide 28 Exhibit G: Summary of Selected Regulatory Cases slide 29-34

* Exhibit A: Reconciliation of PG&E Corporation Earnings from Operations to Consolidated Income Available for Common Shareholders in Accordance with Generally Accepted Accounting Principles (“GAAP”) First Quarter, 2015 vs. 2014 (in millions, except per share amounts) In 2014, natural gas matters included pipeline-related costs to perform work under the PSEP and other activities associated with safety improvements to the Utility’s natural gas system, as well as legal and other costs related to natural gas matters. Natural gas matters also included charges recorded related to fines, third party liability claims, and insurance recoveries in 2014. “Earnings from operations” is not calculated in accordance with GAAP and excludes items impacting comparability as described in Note (2) below. Items impacting comparability reconcile earnings from operations with Consolidated Income Available for Common Shareholders as reported in accordance with GAAP. For the three months ended March 31, 2015 the Utility incurred costs of $17 million, pre-tax, for pipeline related expenses, including costs related to the multi-year effort to identify and remove encroachments from transmission pipeline rights of way and costs to perform remaining work under the Utility’s pipeline safety enhancement plan (“PSEP”). For the three months ended March 31, 2015 the Utility incurred costs of $14 million, pre-tax, for legal and regulatory related expenses, including legal and other costs incurred in connection with various enforcement, regulatory, and litigation activities regarding natural gas matters and regulatory communications. For the three months ended March 31, 2015 the Utility incurred costs of $553 million, pre-tax, associated with fines and penalties imposed by the CPUC on April 9, 2015 in the gas transmission pipeline investigations. As shown in the table below, these costs include an increase to the accrual for fines payable to the State General Fund, a charge for a bill credit for natural gas customers, and a charge for capital costs incurred during the three months ended March 31, 2015 that the Utility believes are probable of disallowance in the Gas Transmission and Storage rate case. Future fines or penalties may be imposed in connection with other enforcement, regulatory and litigation activities regarding natural gas matters and regulatory communications.

* Exhibit B: Key Drivers of PG&E Corporation Earnings per Common Share (“EPS”) from Operations First Quarter, 2015 vs. 2014 ($/Share, Diluted) See Exhibit A for a reconciliation of EPS from Operations to EPS on a GAAP basis. Represents the increase in base revenues authorized by the CPUC in the 2014 GRC decision for the three months ended March 31, 2015, including the impact of flow-through ratemaking treatment for federal tax deductions for repairs. In 2013, the Utility incurred approximately $200 million of expense and $1 billion of capital costs above authorized levels. The 2014 GRC decision authorized revenues that support this higher level of spending during 2014 and throughout the GRC period. The increase in revenue related to 2014 was not recognized until the quarter ended September 30, 2014, when the 2014 GRC decision was issued. Represents the timing of taxes reportable in quarterly statements. Represents expenses during the three months ended March 31, 2015 requested in the GT&S rate case with no corresponding increase in revenue. The Utility’s 2015 GT&S request to increase revenues is pending a CPUC decision. After a final decision is issued, the Utility will be authorized to collect any increase in revenue requirements from January 1, 2015.

* Exhibit C: Operational Performance Metrics The 2015 target for earnings from operations is not publicly reported but is consistent with the guidance range provided for 2015 EPS from operations of $3.50 to $3.70. See following page for definitions of the operational performance metrics. The operational performance goals set under the PG&E Corporation 2015 Short Term Incentive Plan (“STIP”) are based on the same operational metrics and targets.
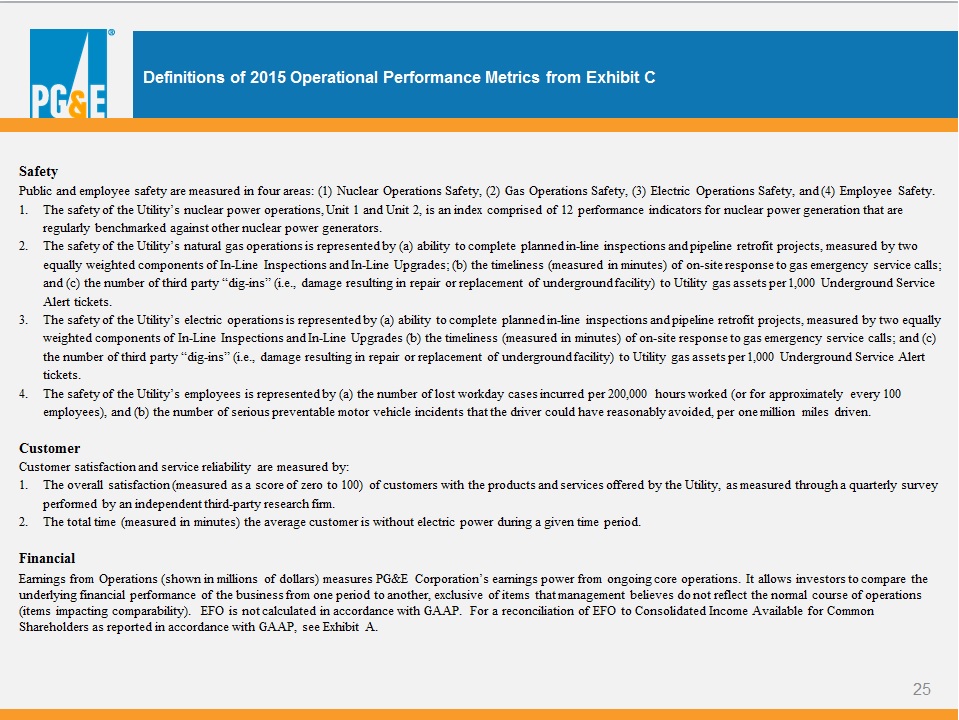
* Definitions of 2015 Operational Performance Metrics from Exhibit C Safety Public and employee safety are measured in four areas: (1) Nuclear Operations Safety, (2) Gas Operations Safety, (3) Electric Operations Safety, and (4) Employee Safety. The safety of the Utility’s nuclear power operations, Unit 1 and Unit 2, is an index comprised of 12 performance indicators for nuclear power generation that are regularly benchmarked against other nuclear power generators. The safety of the Utility’s natural gas operations is represented by (a) ability to complete planned in-line inspections and pipeline retrofit projects, measured by two equally weighted components of In-Line Inspections and In-Line Upgrades; (b) the timeliness (measured in minutes) of on-site response to gas emergency service calls; and (c) the number of third party “dig-ins” (i.e., damage resulting in repair or replacement of underground facility) to Utility gas assets per 1,000 Underground Service Alert tickets. The safety of the Utility’s electric operations is represented by (a) ability to complete planned in-line inspections and pipeline retrofit projects, measured by two equally weighted components of In-Line Inspections and In-Line Upgrades (b) the timeliness (measured in minutes) of on-site response to gas emergency service calls; and (c) the number of third party “dig-ins” (i.e., damage resulting in repair or replacement of underground facility) to Utility gas assets per 1,000 Underground Service Alert tickets. The safety of the Utility’s employees is represented by (a) the number of lost workday cases incurred per 200,000 hours worked (or for approximately every 100 employees), and (b) the number of serious preventable motor vehicle incidents that the driver could have reasonably avoided, per one million miles driven. Customer Customer satisfaction and service reliability are measured by: The overall satisfaction (measured as a score of zero to 100) of customers with the products and services offered by the Utility, as measured through a quarterly survey performed by an independent third-party research firm. The total time (measured in minutes) the average customer is without electric power during a given time period. Financial Earnings from Operations (shown in millions of dollars) measures PG&E Corporation’s earnings power from ongoing core operations. It allows investors to compare the underlying financial performance of the business from one period to another, exclusive of items that management believes do not reflect the normal course of operations (items impacting comparability). EFO is not calculated in accordance with GAAP. For a reconciliation of EFO to Consolidated Income Available for Common Shareholders as reported in accordance with GAAP, see Exhibit A.
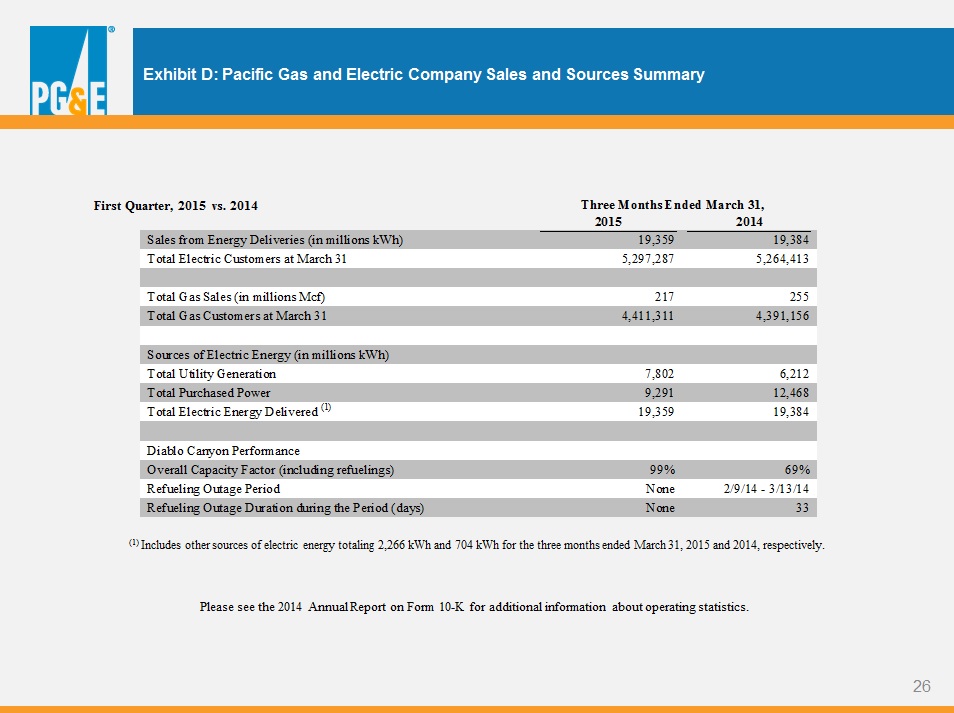
* (1) Includes other sources of electric energy totaling 2,266 kWh and 704 kWh for the three months ended March 31, 2015 and 2014, respectively. Exhibit D: Pacific Gas and Electric Company Sales and Sources Summary First Quarter, 2015 vs. 2014 Please see the 2014 Annual Report on Form 10-K for additional information about operating statistics.
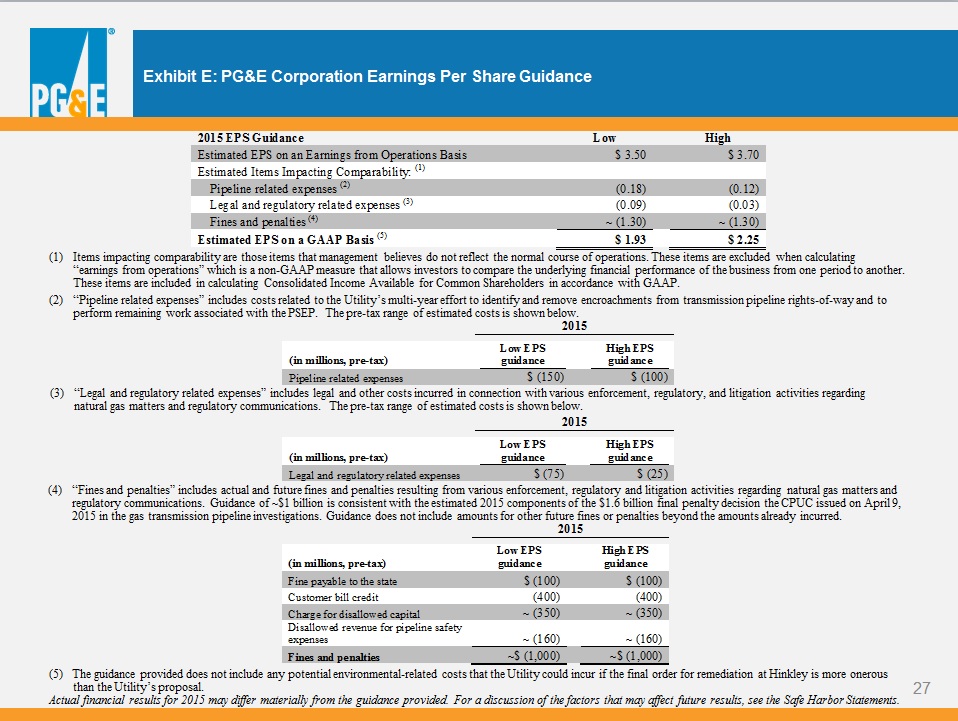
* Exhibit E: PG&E Corporation Earnings Per Share Guidance Items impacting comparability are those items that management believes do not reflect the normal course of operations. These items are excluded when calculating “earnings from operations” which is a non-GAAP measure that allows investors to compare the underlying financial performance of the business from one period to another. These items are included in calculating Consolidated Income Available for Common Shareholders in accordance with GAAP. “Pipeline related expenses” includes costs related to the Utility’s multi-year effort to identify and remove encroachments from transmission pipeline rights-of-way and to perform remaining work associated with the PSEP. The pre-tax range of estimated costs is shown below. (3) “Legal and regulatory related expenses” includes legal and other costs incurred in connection with various enforcement, regulatory, and litigation activities regarding natural gas matters and regulatory communications. The pre-tax range of estimated costs is shown below. Actual financial results for 2015 may differ materially from the guidance provided. For a discussion of the factors that may affect future results, see the Safe Harbor Statements. (5) The guidance provided does not include any potential environmental-related costs that the Utility could incur if the final order for remediation at Hinkley is more onerous than the Utility’s proposal. (4) “Fines and penalties” includes actual and future fines and penalties resulting from various enforcement, regulatory and litigation activities regarding natural gas matters and regulatory communications. Guidance of ~$1 billion is consistent with the estimated 2015 components of the $1.6 billion final penalty decision the CPUC issued on April 9, 2015 in the gas transmission pipeline investigations. Guidance does not include amounts for other future fines or penalties beyond the amounts already incurred.
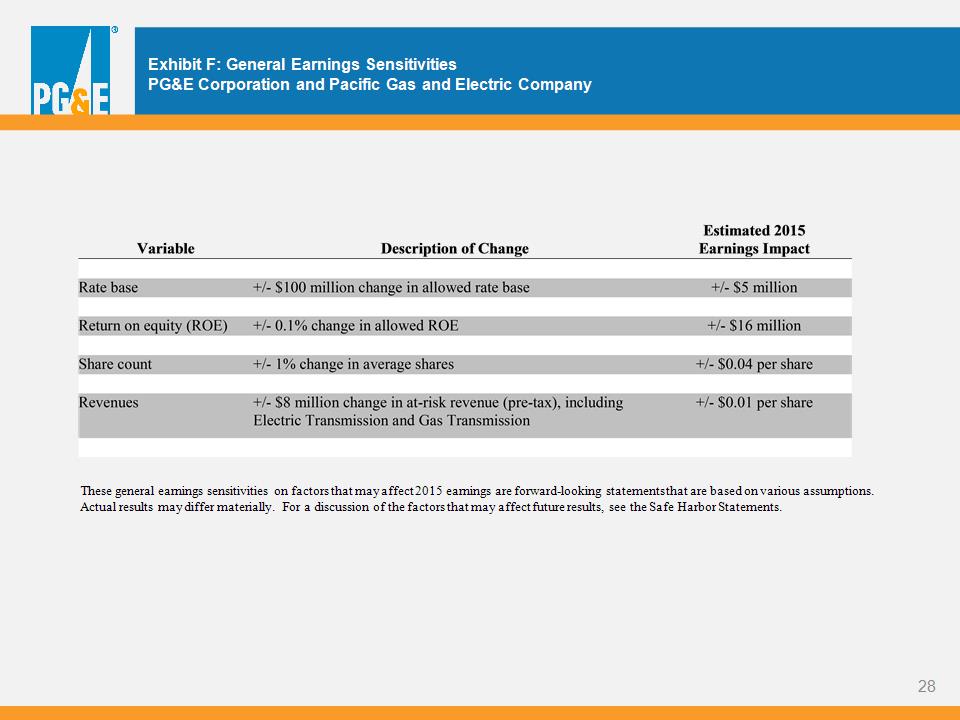
* Exhibit F: General Earnings Sensitivities PG&E Corporation and Pacific Gas and Electric Company These general earnings sensitivities on factors that may affect 2015 earnings are forward-looking statements that are based on various assumptions. Actual results may differ materially. For a discussion of the factors that may affect future results, see the Safe Harbor Statements.

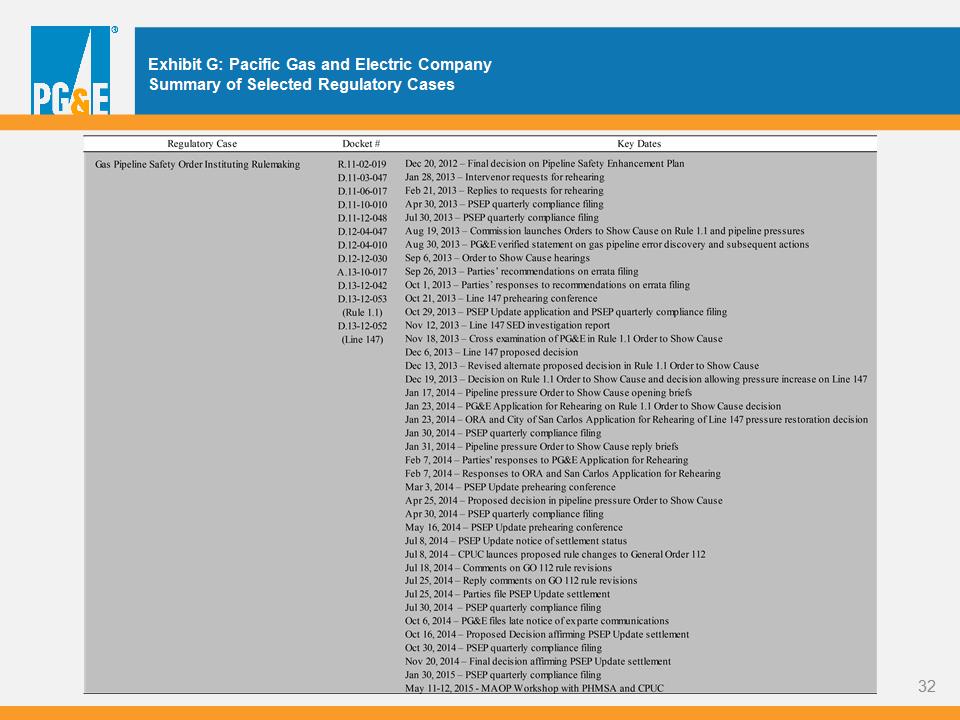
* Exhibit G: Pacific Gas and Electric Company Summary of Selected Regulatory Cases

* Exhibit G: Pacific Gas and Electric Company Summary of Selected Regulatory Cases

* Exhibit G: Pacific Gas and Electric Company Summary of Selected Regulatory Cases
* Exhibit G: Pacific Gas and Electric Company Summary of Selected Regulatory Cases

* Exhibit G: Pacific Gas and Electric Company Summary of Selected Regulatory Cases

* Exhibit G: Pacific Gas and Electric Company Summary of Selected Regulatory Cases