Attached files
| file | filename |
|---|---|
| 8-K - 8-K - GLU MOBILE INC | a15-10264_18k.htm |
| EX-4.01 - EX-4.01 - GLU MOBILE INC | a15-10264_1ex4d01.htm |
| EX-99.01 - EX-99.01 - GLU MOBILE INC | a15-10264_1ex99d01.htm |
| EX-99.04 - EX-99.04 - GLU MOBILE INC | a15-10264_1ex99d04.htm |
| EX-99.03 - EX-99.03 - GLU MOBILE INC | a15-10264_1ex99d03.htm |
| EX-99.05 - EX-99.05 - GLU MOBILE INC | a15-10264_1ex99d05.htm |
Exhibit 99.02
|
|
Page 1 Glu Mobile Q115 Earnings Call April 29, 2015 |
|
|
Safe Harbor Statement This presentation contains "forward-looking" statements including: Glu has an expanding global presence, particularly in APAC; we expect to announce additional celebrity partnerships throughout 2015; we expect to have a total reach of approximately 500 million social followers by the end of 2016; the expected next title releases for each of our core franchises and Hollywood partnerships; that we are minimally exposed to increases in advertising rates; Glu is benefitting from strong mobile secular trends in the installed base for smartphones and tablets and the popularity of games among all apps; Glu has multiple growth opportunities through wearables, the quad screen future, mobile ad spending and international expansion; the expected timing for the completion of the second tranche of our Tencent investment; Tencent’s expected ownership and Glu’s expected cash balance once the transaction is completed; the expected use of proceeds from the Tencent investment; that we expect in due course an operating partnership between Glu and Tencent and the expected benefits of such operating partnership; that we have a growing and engaged installed base; Glu’s expected 2015 title roadmap and the expected half of 2015 in which we expect these titles to launch; and our Q2-2015 and full year 2015 guidance. These forward-looking statements are subject to material risks and uncertainties that could cause actual results to differ materially from those in the forward-looking statements. Investors should consider important risk factors, which include: the risk that Glu and Tencent do not receive antitrust clearance for the second tranche of the investment or that any such clearance is substantially delayed; the risk that Glu does not realize the anticipated strategic benefits from its strategic relationship with Tencent; consumer demand for smartphones, tablets and next-generation platforms does not grow as significantly as we anticipate or that we will be unable to capitalize on any such growth; the risk that we do not realize a sufficient return on our investment with respect to our efforts to develop free-to-play games for smartphones and tablets, the risk that we do not maintain our good relationships with Apple and Google; the risk that our development expenses are greater than we anticipate; the risk that complying with Apple’s requirement that our games support 64-bit development will negatively impact revenues and increase expenses; the risk that our recently and newly launched games are less popular than anticipated; the risk that our newly released games will be of a quality less than desired by reviewers and consumers; the risk that the mobile games market, particularly with respect to social, free-to-play gaming, is smaller than anticipated; risks related to the restatement of certain of our historical financial statements and other risks detailed under the caption "Risk Factors" in our Form 10-K filed with the Securities and Exchange Commission on March 13, 2015 and our other SEC filings. You can locate these reports through our website at http://www.glu.com/investors. These "forward-looking" statements are based on estimates and information available to us on April 29, 2015 and we are under no obligation, and expressly disclaim any obligation, to update or alter our forward-looking statements whether as a result of new information, future events or otherwise. Page 2 |
|
|
Use of Non-GAAP Financial Measures Page 3 Glu uses in this presentation certain non-GAAP measures of financial performance. The presentation of these non-GAAP financial measures is not intended to be considered in isolation from, as a substitute for, or superior to, the financial information prepared and presented in accordance with GAAP, and may be different from non-GAAP financial measures used by other companies. In addition, these non-GAAP measures have limitations in that they do not reflect all of the amounts associated with Glu's results of operations as determined in accordance with GAAP. The non-GAAP financial measures used by Glu include non-GAAP revenues, non-GAAP smartphone revenues, non-GAAP cost of revenues, non-GAAP gross profit, non-GAAP gross margin, non-GAAP operating expenses, non-GAAP operating margin, non-GAAP net income/(loss), non-GAAP net income/(loss) per share, Adjusted EBITDA and Adjusted EBITDA margin. These non-GAAP financial measures exclude the following items from Glu's unaudited consolidated statements of operations: Change in deferred revenues and deferred cost of revenues; Amortization of intangible assets; Non-cash warrant expense; Stock-based compensation expense; Restructuring charges; Change in fair value of Blammo earnout; Transitional costs; Release of tax liabilities and valuation allowance; and Foreign currency exchange gains and losses primarily related to the revaluation of assets and liabilities. In addition, Glu has included in this presentation “Adjusted EBITDA” figures which are used to evaluate Glu’s operating performance and is defined as non-GAAP operating income/(loss) excluding depreciation. Adjusted EBITDA margin is defined as Adjusted EBITDA divided by non-GAAP revenue. Glu believes that these non-GAAP financial measures, when taken together with the corresponding GAAP financial measures, provide meaningful supplemental information regarding Glu's performance by excluding certain items that may not be indicative of Glu's core business, operating results or future outlook. Glu's management uses, and believes that investors benefit from referring to, these non-GAAP financial measures in assessing Glu's operating results, as well as when planning, forecasting and analyzing future periods. These non-GAAP financial measures also facilitate comparisons of Glu's performance to prior periods. For a reconciliation of these non-GAAP financial measures to their most directly comparable GAAP financial measures, please refer to the tables at the end of this presentation. |
|
|
Executive Summary Page 4 |

|
|
Page 5 © Glu Mobile Inc. – Proprietary |

|
|
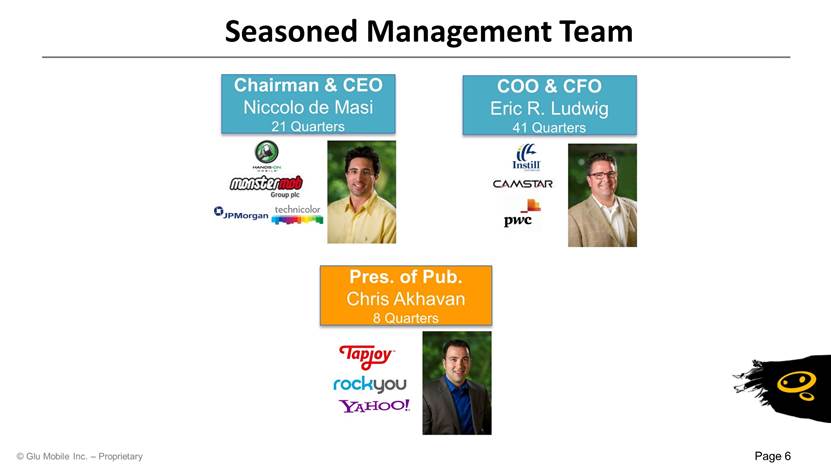
Seasoned Management Team Page 6 Pres. of Pub. Chris Akhavan 8 Quarters COO & CFO Eric R. Ludwig 41 Quarters Chairman & CEO Niccolo de Masi 21 Quarters |
|
|
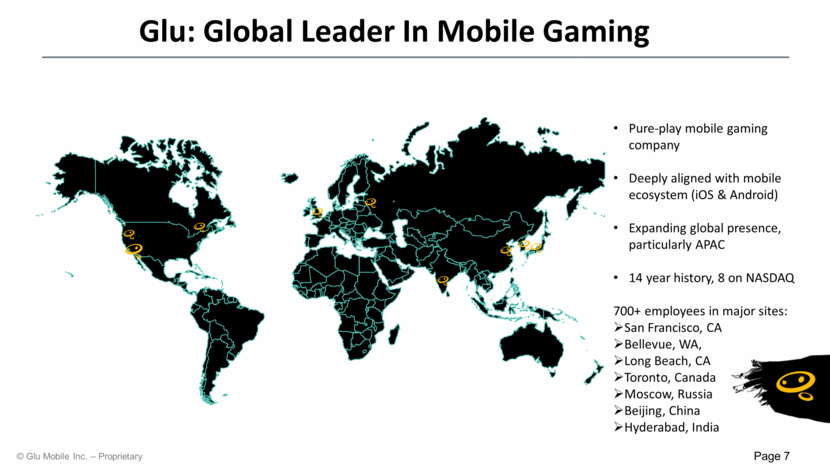
Glu: Global Leader In Mobile Gaming Page 7 Pure-play mobile gaming company Deeply aligned with mobile ecosystem (iOS & Android) Expanding global presence, particularly APAC 14 year history, 8 on NASDAQ 700+ employees in major sites: San Francisco, CA Bellevue, WA, Long Beach, CA Toronto, Canada Moscow, Russia Beijing, China Hyderabad, India |
|
|
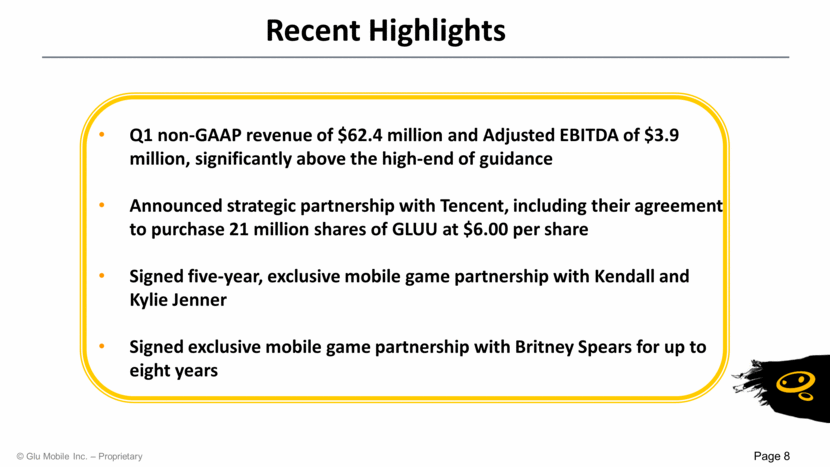
Q1 non-GAAP revenue of $62.4 million and Adjusted EBITDA of $3.9 million, significantly above the high-end of guidance Announced strategic partnership with Tencent, including their agreement to purchase 21 million shares of GLUU at $6.00 per share Signed five-year, exclusive mobile game partnership with Kendall and Kylie Jenner Signed exclusive mobile game partnership with Britney Spears for up to eight years Recent Highlights Page 8 |
|
|
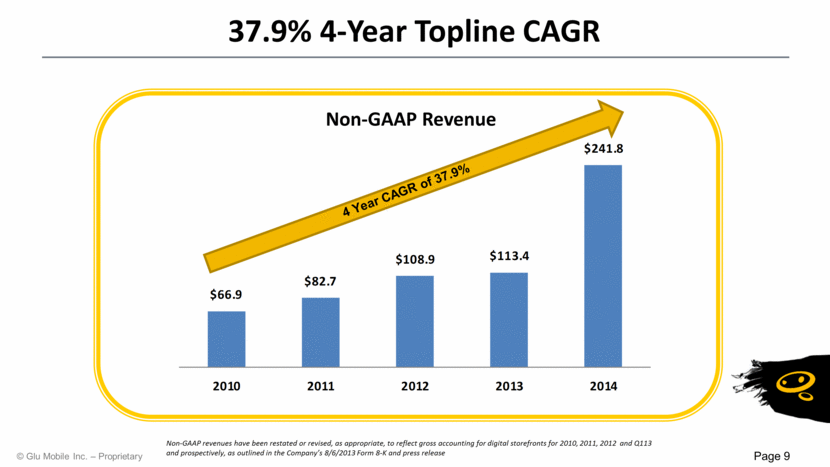
37.9% 4-Year Topline CAGR Page 9 4 Year CAGR of 37.9% Non-GAAP revenues have been restated or revised, as appropriate, to reflect gross accounting for digital storefronts for 2010, 2011, 2012 and Q113 and prospectively, as outlined in the Company’s 8/6/2013 Form 8-K and press release Non-GAAP Revenue $66.9 $82.7 $108.9 $113.4 $241.8 2010 2011 2012 2013 2014 |
|
|
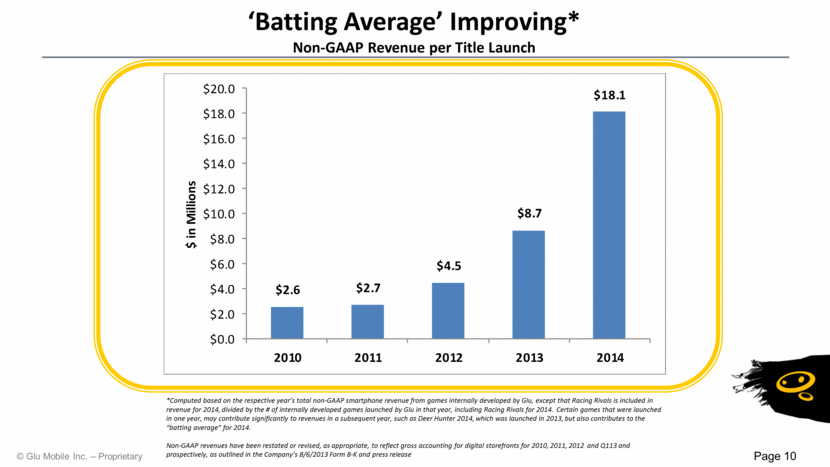
‘Batting Average’ Improving* Non-GAAP Revenue per Title Launch Page 10 *Computed based on the respective year’s total non-GAAP smartphone revenue from games internally developed by Glu, except that Racing Rivals is included in revenue for 2014, divided by the # of internally developed games launched by Glu in that year, including Racing Rivals for 2014. Certain games that were launched in one year, may contribute significantly to revenues in a subsequent year, such as Deer Hunter 2014, which was launched in 2013, but also contributes to the “batting average” for 2014. Non-GAAP revenues have been restated or revised, as appropriate, to reflect gross accounting for digital storefronts for 2010, 2011, 2012 and Q113 and prospectively, as outlined in the Company’s 8/6/2013 Form 8-K and press release $2.6 $2.7 $4.5 $8.7 $18.1 $0.0 $2.0 $4.0 $6.0 $8.0 $10.0 $12.0 $14.0 $16.0 $18.0 $20.0 2010 2011 2012 2013 2014 $ in Millions |
|
|
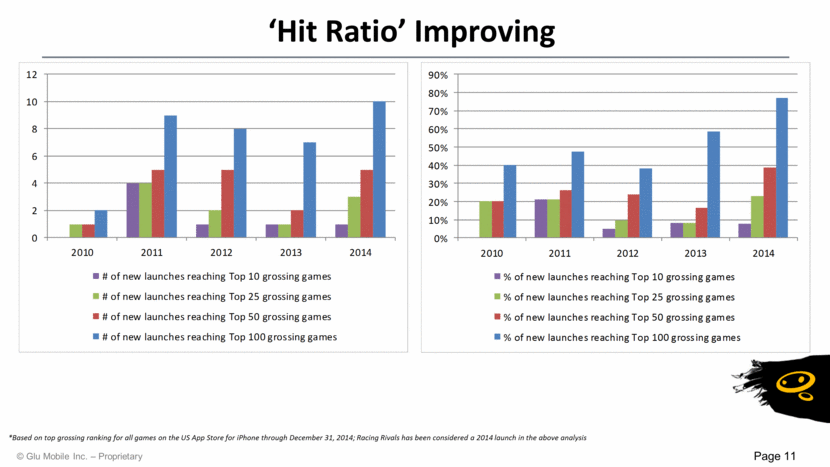
‘Hit Ratio’ Improving *Based on top grossing ranking for all games on the US App Store for iPhone through December 31, 2014; Racing Rivals has been considered a 2014 launch in the above analysis Page 11 0% 10% 20% 30% 40% 50% 60% 70% 80% 90% 2010 2011 2012 2013 2014 % of new launches reaching Top 10 grossing games % of new launches reaching Top 25 grossing games % of new launches reaching Top 50 grossing games % of new launches reaching Top 100 grossing games 0 2 4 6 8 10 12 2010 2011 2012 2013 2014 # of new launches reaching Top 10 grossing games # of new launches reaching Top 25 grossing games # of new launches reaching Top 50 grossing games # of new launches reaching Top 100 grossing games |
|
|
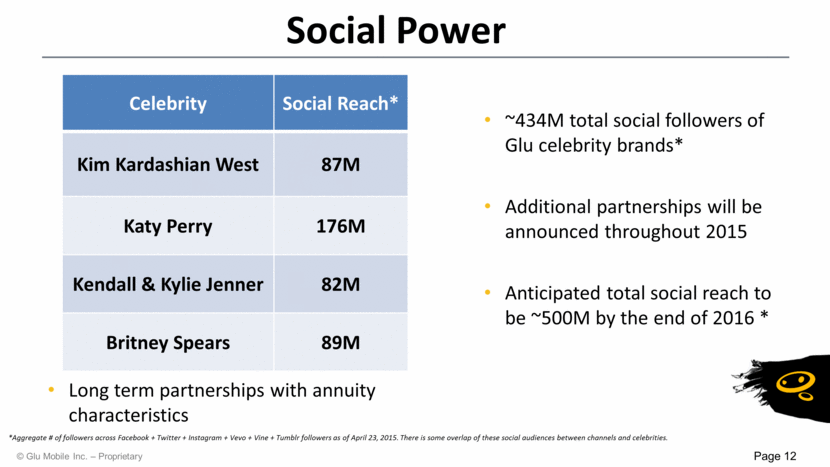
~434M total social followers of Glu celebrity brands* Additional partnerships will be announced throughout 2015 Anticipated total social reach to be ~500M by the end of 2016 * Social Power Page 12 Long term partnerships with annuity characteristics *Aggregate # of followers across Facebook + Twitter + Instagram + Vevo + Vine + Tumblr followers as of April 23, 2015. There is some overlap of these social audiences between channels and celebrities. Celebrity Social Reach* Kim Kardashian West 87M Katy Perry 176M Kendall & Kylie Jenner 82M Britney Spears 89M |
|
|
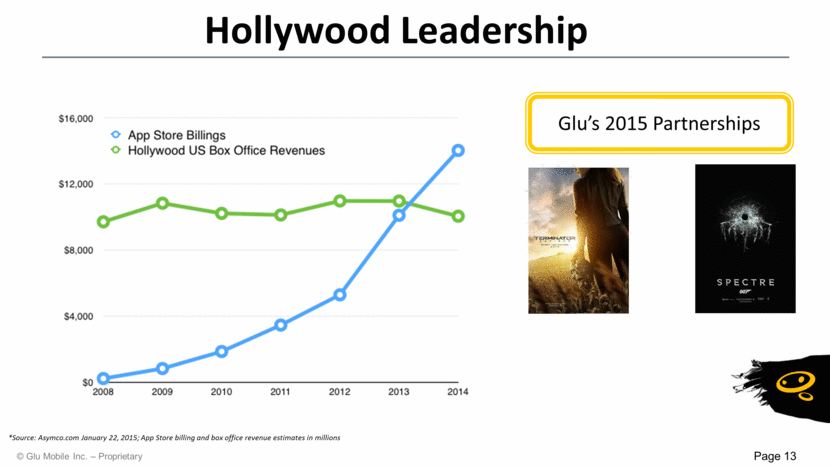
Hollywood Leadership Page 13 Glu’s 2015 Partnerships *Source: Asymco.com January 22, 2015; App Store billing and box office revenue estimates in millions |
|
|
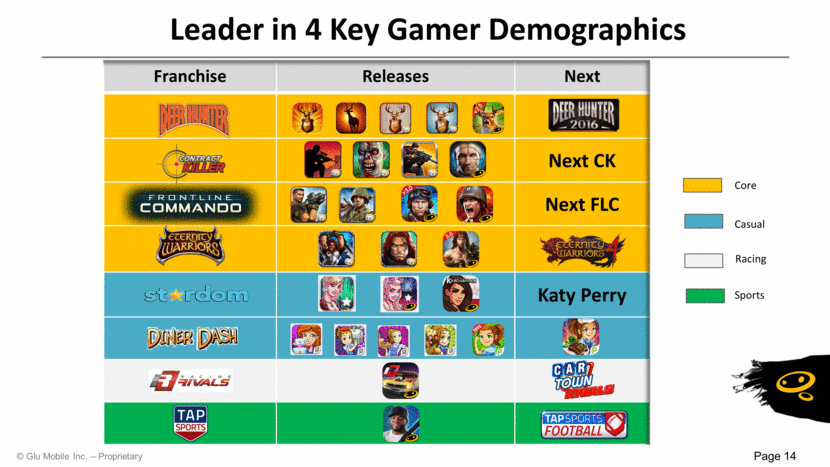
Leader in 4 Key Gamer Demographics Franchise Releases Next Next CK Next FLC Katy Perry Page 14 Core Casual Racing Sports |
|
|
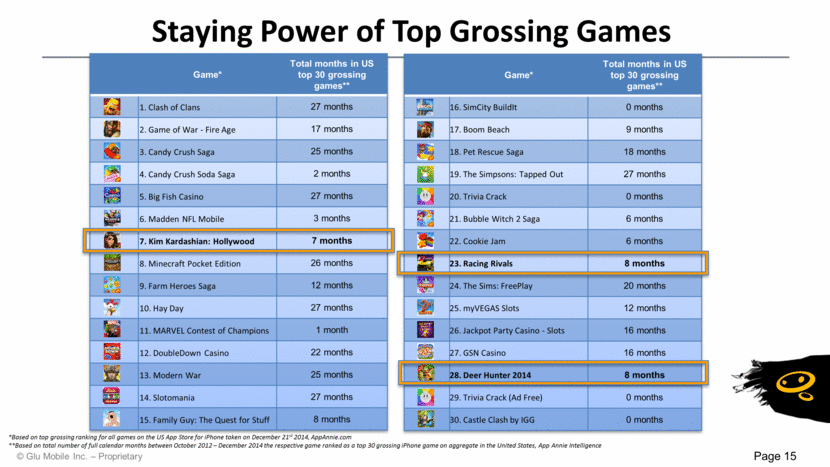
Staying Power of Top Grossing Games *Based on top grossing ranking for all games on the US App Store for iPhone taken on December 21st 2014, AppAnnie.com **Based on total number of full calendar months between October 2012 – December 2014 the respective game ranked as a top 30 grossing iPhone game on aggregate in the United States, App Annie Intelligence Page 15 Game* Total months in US top 30 grossing games** 1. Clash of Clans 27 months 2. Game of War - Fire Age 17 months 3. Candy Crush Saga 25 months 4. Candy Crush Soda Saga 2 months 5. Big Fish Casino 27 months 6. Madden NFL Mobile 3 months 7. Kim Kardashian: Hollywood 7 months 8. Minecraft Pocket Edition 26 months 9. Farm Heroes Saga 12 months 10. Hay Day 27 months 11. MARVEL Contest of Champions 1 month 12. DoubleDown Casino 22 months 13. Modern War 25 months 14. Slotomania 27 months 15. Family Guy: The Quest for Stuff 8 months Game* Total months in US top 30 grossing games** 16. SimCity BuildIt 0 months 17. Boom Beach 9 months 18. Pet Rescue Saga 18 months 19. The Simpsons: Tapped Out 27 months 20. Trivia Crack 0 months 21. Bubble Witch 2 Saga 6 months 22. Cookie Jam 6 months 23. Racing Rivals 8 months 24. The Sims: FreePlay 20 months 25. myVEGAS Slots 12 months 26. Jackpot Party Casino - Slots 16 months 27. GSN Casino 16 months 28. Deer Hunter 2014 8 months 29. Trivia Crack (Ad Free) 0 months 30. Castle Clash by IGG 0 months |
|
|
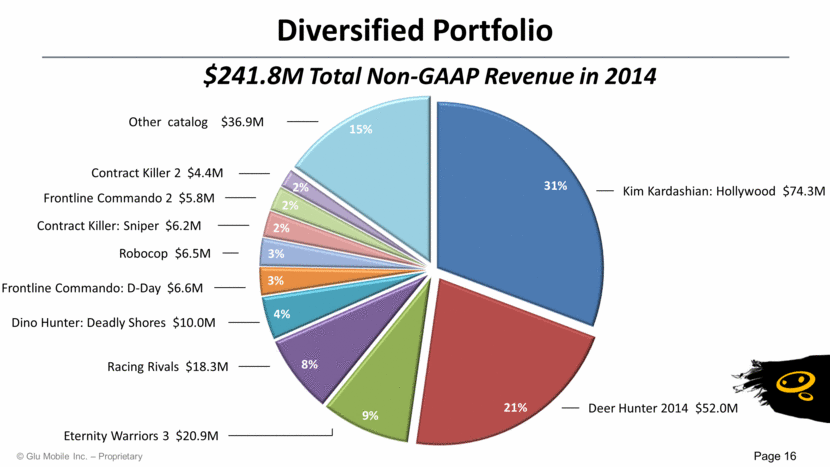
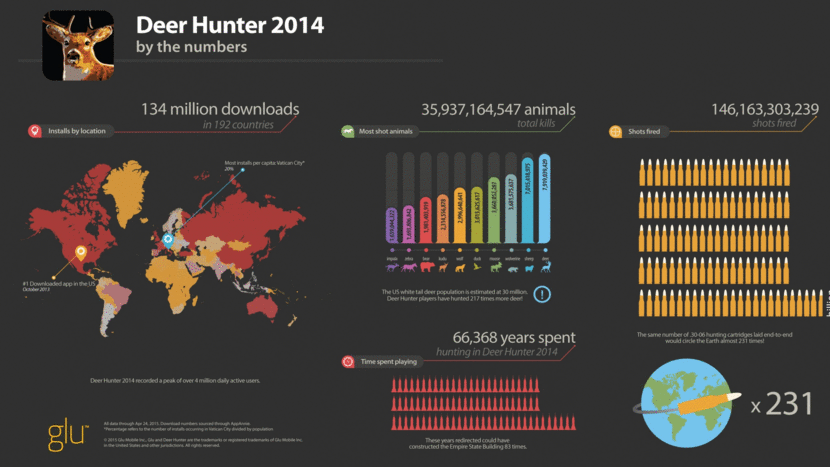
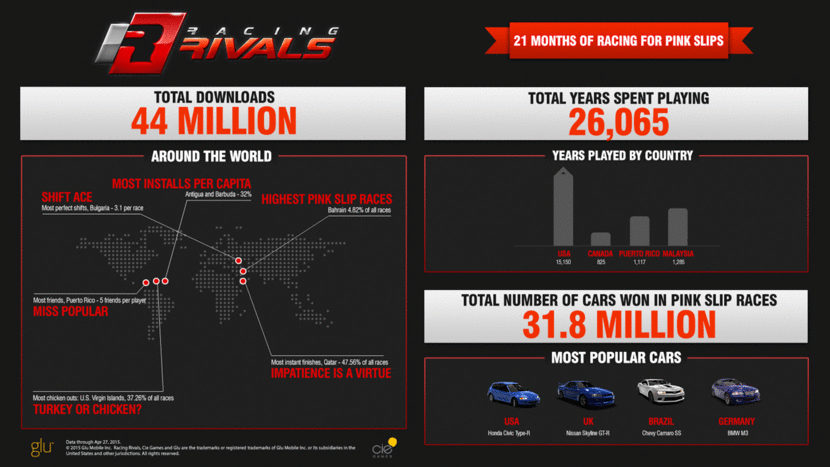
Robocop $6.5M Page 16 Diversified Portfolio Kim Kardashian: Hollywood $74.3M Deer Hunter 2014 $52.0M Eternity Warriors 3 $20.9M Racing Rivals $18.3M Dino Hunter: Deadly Shores $10.0M Frontline Commando: D-Day $6.6M Contract Killer: Sniper $6.2M Frontline Commando 2 $5.8M Other catalog $36.9M Contract Killer 2 $4.4M $241.8M Total Non-GAAP Revenue in 2014 31% 21% 9% 8% 4% 3% 3% 2% 2% 2% 15% |
|
|
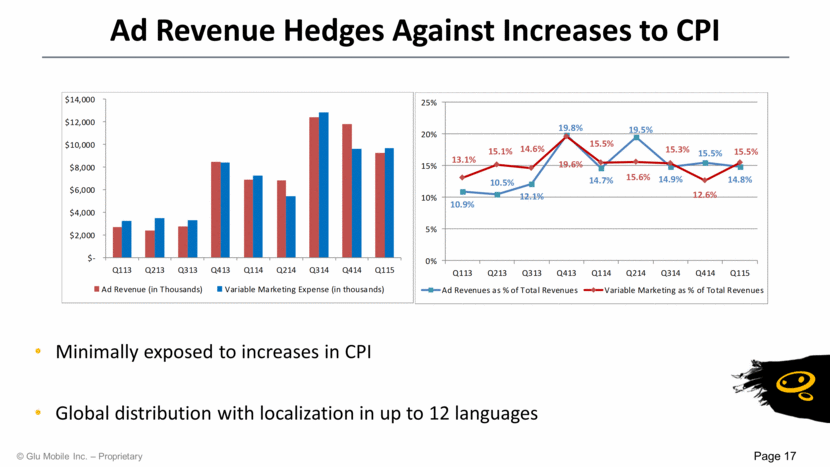
Ad Revenue Hedges Against Increases to CPI Page 17 Minimally exposed to increases in CPI Global distribution with localization in up to 12 languages |
|
|
Page 18 |
|
|
Page 19 |
|
|
Page 20 |
|
|
Growth Landscape Page 21 |

|
|
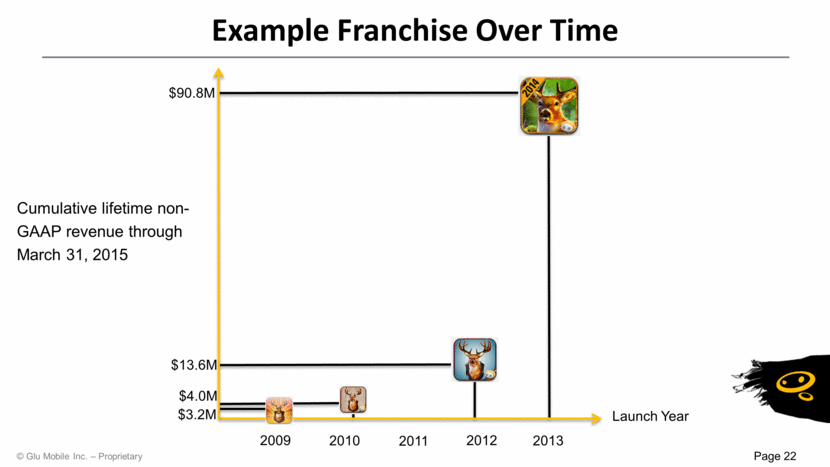
Page 22 Example Franchise Over Time Launch Year Cumulative lifetime non-GAAP revenue through March 31, 2015 2011 2012 2013 $4.0M $13.6M $90.8M 2010 2009 $3.2M |
|
|
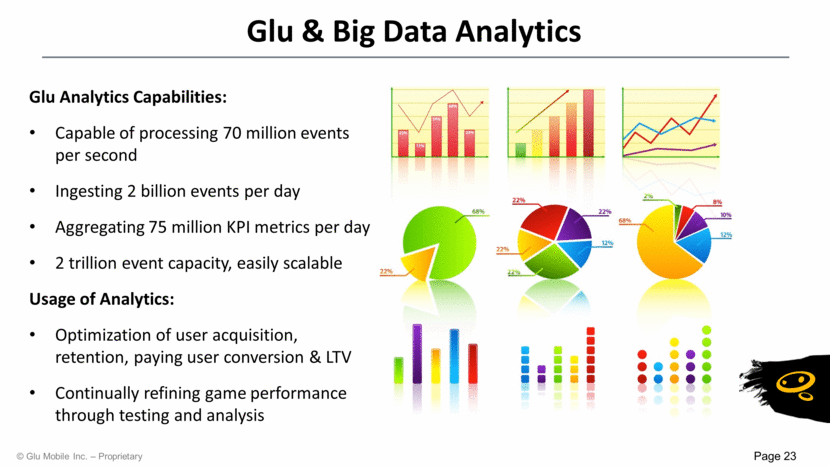
Glu & Big Data Analytics Page 23 Glu Analytics Capabilities: Capable of processing 70 million events per second Ingesting 2 billion events per day Aggregating 75 million KPI metrics per day 2 trillion event capacity, easily scalable Usage of Analytics: Optimization of user acquisition, retention, paying user conversion & LTV Continually refining game performance through testing and analysis |
|
|
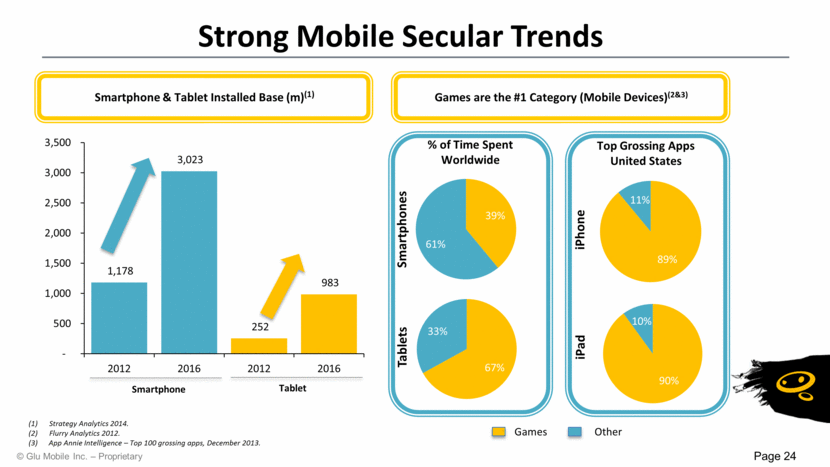
Page 24 Strategy Analytics 2014. Flurry Analytics 2012. (3) App Annie Intelligence – Top 100 grossing apps, December 2013. Strong Mobile Secular Trends Smartphone & Tablet Installed Base (m)(1) Games are the #1 Category (Mobile Devices)(2&3) Smartphone Tablet % of Time Spent Worldwide Top Grossing Apps United States Smartphones Tablets iPhone iPad Games Other 1,178 3,023 252 983 - 500 1,000 1,500 2,000 2,500 3,000 3,500 2012 2016 2012 2016 39% 61% 67% 33% 89% 11% 90% 10% (1) (2) |
|
|
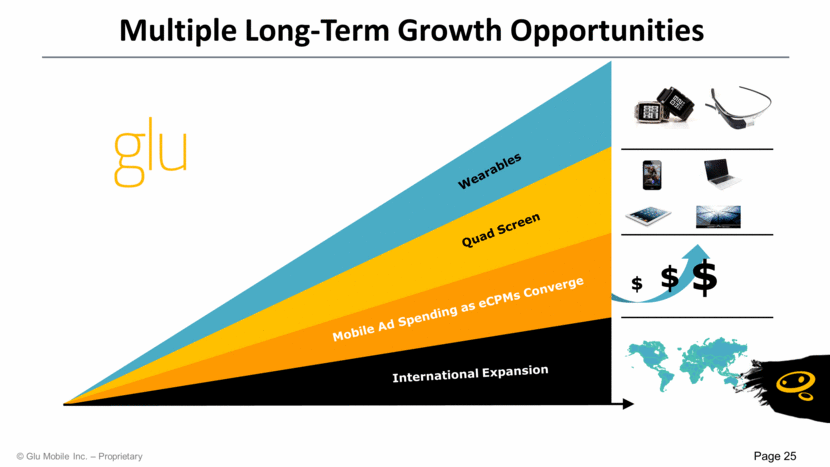
Multiple Long-Term Growth Opportunities Page 25 International Expansion Mobile Ad Spending as eCPMs Converge Quad Screen Wearables Opportunity / Revenue / Value Time $ $ $ |
|
|
Page 26 Tencent Strategic Relationship |

|
|
Page 27 |
|
|
Tencent has agreed to purchase 21 million shares of GLUU at $6.00 per share, or an approximate 22% premium to Glu’s average closing price for the one month prior to the transaction 12.5 million of the shares were purchased today and the remaining 8.5 million shares will be purchased once the waiting period under the HSR Act expires or terminates – we expect this to occur later in Q2 Will represent approximately 14.6% of Glu’s fully diluted common stock, calculated by including all outstanding shares, options, restricted stock unit awards and warrants as of March 31, 2015 Glu will have a pro-forma cash balance of approximately $190M, based on Glu’s cash balance as of March 31, 2015 High Level Deal Structure Page 28 |

|
|
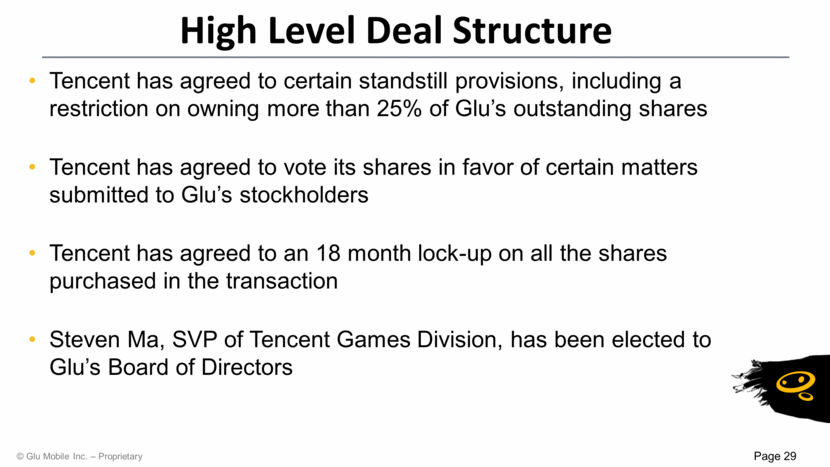
Tencent has agreed to certain standstill provisions, including a restriction on owning more than 25% of Glu’s outstanding shares Tencent has agreed to vote its shares in favor of certain matters submitted to Glu’s stockholders Tencent has agreed to an 18 month lock-up on all the shares purchased in the transaction Steven Ma, SVP of Tencent Games Division, has been elected to Glu’s Board of Directors High Level Deal Structure Page 29 |
|
|
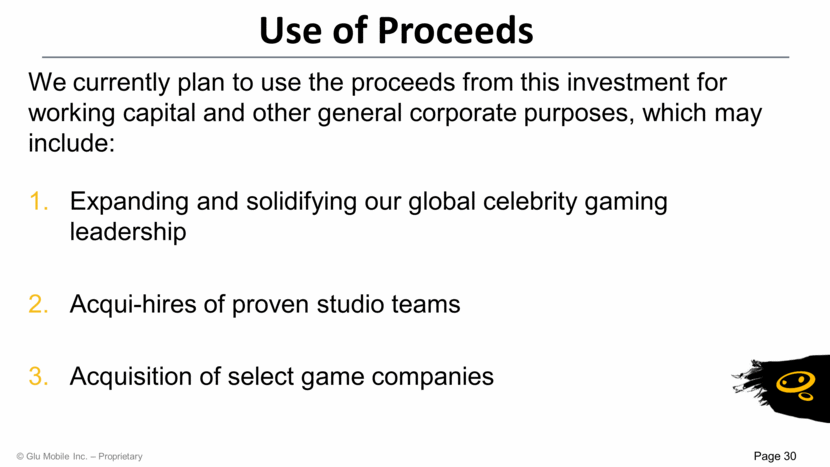
We currently plan to use the proceeds from this investment for working capital and other general corporate purposes, which may include: Expanding and solidifying our global celebrity gaming leadership Acqui-hires of proven studio teams Acquisition of select game companies Use of Proceeds Page 30 1. 2. 3. |
|
|
Financial Overview Page 31 |

|
|
Strong top line growth Diversified portfolio of franchises Cost-effective customer acquisition Long tail games provide significant visibility Growing & engaged installed base Financial Investment Highlights Page 32 |

|
|
Q115 Financial Summary Page 33 Presented in millions of USD, with the exception of per share data and share count. Q115 Non-GAAP Guidance Actuals Low High Revenue $ 62.4 $ 50.0 $ 52.0 Gross Profit Margin 39.0 30.2 31.4 Gross Profit Margin % 62.5% 60.4% 60.4% Operating Expenses 35.9 33.1 32.3 Depreciation 0.7 0.9 0.9 Adjusted EBITDA $ 3.9 $ (2.0) $ - Adjusted EBITDA Margin 6% -4% 0% Basic: Earnings/(Loss) per Share $ 0.02 $ (0.03) $ (0.01) Basic Shares 103,869 103,800 103,800 Diluted: Earnings per Share $ 0.02 $ (0.03) $ (0.01) Diluted Shares 107,851 108,000 108,000 |

|
|
Q115 Non-GAAP Results Page 34 ($ in millions) Q115 Q414 Q/Q Q114 Y/Y Total Revenue $ 62.4 $ 76.2 (18%) $ 47.0 33% Gross Profit 39.0 46.6 (16%) 32.5 20% Gross Margin 62.5% 61.1% 143 bp 69.3% (677) bp Operating Expense 35.9 33.1 8% 26.7 34% Operating Income 3.2 13.5 (77%) 5.8 (46%) Adjusted EBITDA $ 3.9 $ 14.1 (73%) $ 6.5 (40%) |

|
|
Non-GAAP Revenue and Adjusted EBITDA Page 35 Non-GAAP revenues have been restated to reflect gross accounting for digital storefronts Q113 and prospectively, as outlined in the Company’s 8/6/2013 Form 8-K and press release. |

|
|
% of Non-GAAP Revenue Page 36 Non-GAAP revenues have been restated to reflect gross accounting for digital storefronts Q113 and prospectively, as outlined in the Company’s 8/6/2013 Form 8-K and press release. |

|
|
Non-GAAP Revenue by Geography Page 37 Q1 2015 (In millions) 17.2 14.7 13.0 11.6 10.5 9.6 19.6 24.5 5.6 5.5 7.1 7.0 7.8 6.6 7.3 10.4 6.4 5.9 6.3 6.0 6.1 5.6 8.0 9.7 - 5.0 10.0 15.0 20.0 25.0 30.0 35.0 40.0 45.0 50.0 Q212 Q312 Q412 Q113 Q213 Q313 Q413 Q114 NA APAC ROW |

|
|
Non-GAAP Revenue Mix Page 38 Non-GAAP revenues have been restated to reflect gross accounting for digital storefronts for Q113 and prospectively, as outlined in the Company’s 8/6/2013 Form 8-K and press release. The presentation of platform and category mix contribution in prior presentations was reported as a percentage of non-GAAP smartphone revenues. All prior percentages in the above graphs have been updated to reflect each category’s respective percentage of total non-GAAP revenues. The ‘Premium/All Other’ revenues include featurephone revenues. |

|
|
Non-GAAP Revenue by Vintage Racing Rivals $11.9M Dino Hunter: Deadly Shores $1.7M Tap Sports: Baseball 2014 $1.0M $62.4M Total Non-GAAP Revenue in Q115 Eternity Warriors 3 $1.3M Page 39 Frontline Commando 2 $0.4M Robocop $0.3M Contract Killer: Sniper $6.8M Diner Dash $1.7M Kim Kardashian: Hollywood $21.3M Deer Hunter 2014 $8.9M Blood and Glory Immortals $0.8M |

|
|
Strong Balance Sheet Page 40 ($ in millions) Q115 Q414 Q114 Cash and cash equivalents $ 65.7 $ 70.9 $ 37.0 Accounts receivable, net 24.5 32.2 19.7 Prepaid expenses, royalties and other current assets 27.3 18.3 8.9 Other assets 19.3 14.8 7.0 Intangible assets & goodwill 112.9 115.5 24.4 Total Assets $249.7 $251.7 $97.0 Accounts payable and accrued liabilities 15.1 15.5 10.8 Accrued expenses, royalties and other liabilities 28.0 27.2 9.8 Deferred revenue 30.7 37.3 20.7 Common stock/Paid in capital 419.2 415.8 307.4 Accumulated deficit & other comprehensive income (243.3) (244.1) (251.7) Total Liabilities and Stockholders' Equity $249.7 $251.7 $97.0 |

|
|
Strong Consumer Interest Page 41 |

|
|
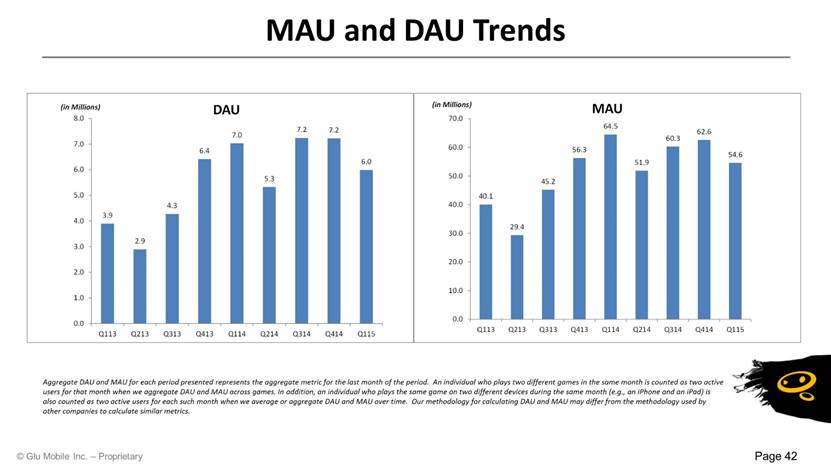
MAU and DAU Trends Page 42 Aggregate DAU and MAU for each period presented represents the aggregate metric for the last month of the period. An individual who plays two different games in the same month is counted as two active users for that month when we aggregate DAU and MAU across games. In addition, an individual who plays the same game on two different devices during the same month (e.g., an iPhone and an iPad) is also counted as two active users for each such month when we average or aggregate DAU and MAU over time. Our methodology for calculating DAU and MAU may differ from the methodology used by other companies to calculate similar metrics. |
|
|
Guidance Page 43 |

|
|
Page 44 2015 Roadmap * Title launches within each respective half year are listed in no particular order 1H 2015 2H 2015 Katy Perry Kendall & Kylie Jenner + 2 additional titles + 2 additional titles |

|
|
2015 Full Year Guidance Page 45 Guidance ($ in millions) Q115 Q215 Q315 Q415 2015 Total Revenue (Low) $62.4 $50.0 $262.0 Total Revenue (High) $62.4 $52.0 $287.0 Adjusted EBITDA (Low) $3.9 ($5.0) $30.0 Adjusted EBITDA (High) $3.9 ($3.0) $35.0 |

|
|
Q215 Guidance Page 46 ($ in millions, except EPS) Q115 Act Q215 Guidance Q215 Guidance Low High Total Revenue $62.4 $50.0 $52.0 Gross Margin 62.5% 61.5% 61.5% Operating Expense 35.9 36.4 35.7 Operating Income/(Loss) 3.2 (5.7) (3.7) Depreciation Addback 0.7 0.7 0.7 Adjusted EBITDA $3.9 ($5.0) ($3.0) Net Income/(Loss) 2.1 (5.9) (4.0) Basic Shares (millions) 103.9 116.5 116.5 Diluted Shares (millions) 107.9 122.1 122.1 Net Income/(Loss) Per Basic Share $0.02 ($0.05) ($0.03) Net Income/(Loss) Per Diluted Share $0.02 ($0.05) ($0.03) |

|
|
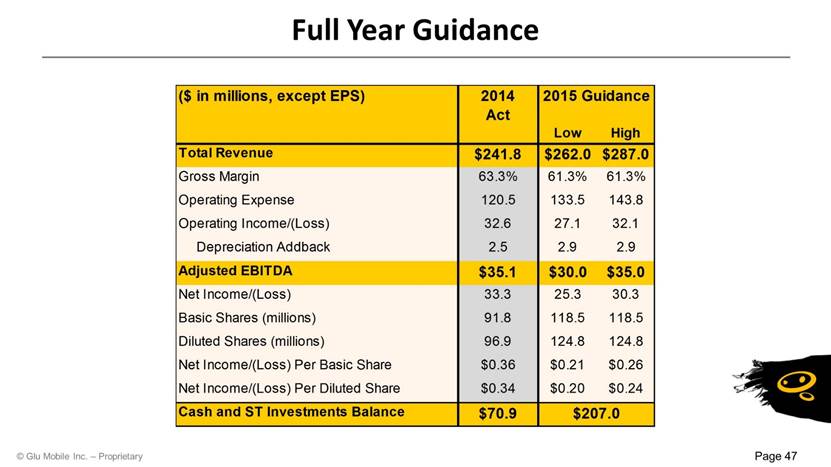
Full Year Guidance Page 47 ($ in millions, except EPS) 2014 Act Low High 2015 Guidance Total Revenue $241.8 $262.0 $287.0 Gross Margin 63.3% 61.3% 61.3% Operating Expense 120.5 133.5 143.8 Operating Income/(Loss) 32.6 27.1 32.1 Depreciation Addback 2.5 2.9 2.9 Adjusted EBITDA $35.1 $30.0 $35.0 Net Income/(Loss) 33.3 25.3 30.3 Basic Shares (millions) 91.8 118.5 118.5 Diluted Shares (millions) 96.9 124.8 124.8 Net Income/(Loss) Per Basic Share $0.36 $0.21 $0.26 Net Income/(Loss) Per Diluted Share $0.34 $0.20 $0.24 Cash and ST Investments Balance $70.9 $207.0 |
|
|
Page 48 Key Statistics Shares outstanding are as of April 24, 2015 and before the Tencent investment Cash balance is as of March 31st, 2015 and before the Tencent investment Average Daily Volume is calculated using the last 90 calendar days Market Statistics (as of April 24, 2015) (in millions except per share and volume data) Stock Price $5.45 52 Week High $7.60 52 Week Low $3.27 Shares Outstanding 107.8 Avg. Daily Volume (last 90 days) 2,570,626 Market Capitalization $587.5 Debt $0 Cash $65.7 Enterprise Value $521.8 |

|
|
Page 49 Investment Highlights Benefitting from strong secular global mobile growth Tencent investment provides strengthened balance sheet Diversified portfolio of franchises Strong 2015 title roadmap Financials benefitting from significant investments |

|
|
Non-GAAP Reconciliations Page 50 |

|
|
Page 51 Q115 GAAP to Non-GAAP Reconciliation Condensed Consolidated Statements of Operations GAAP to Non-GAAP Reconciliation (in thousands, except per share data) (unaudited) GAAP Results Change in deferred revenues Change in deferred platform commissions and royalty expense Amortization of intangible assets Stock-based compensation Transitional Costs Non-cash warrant expense Foreign currency exchange loss Non-GAAP Results Revenues 69,470 $ (7,023) $ - $ - $ - $ - $ - $ - $ 62,447 $ Cost of revenues: Platform commissions, royalties and other 26,310 - (2,819) - - - (93) - 23,398 Amortization of intangible assets 2,434 - - (2,434) - - - - - Total cost of revenues 28,744 - (2,819) (2,434) - - (93) - 23,398 Gross profit 40,726 (7,023) 2,819 2,434 - - 93 - 39,049 Operating expenses: Research and development 18,243 - - - (760) - - - 17,483 Sales and marketing 12,438 - - - (218) - - - 12,220 General and administrative 7,406 - - - (1,151) (72) - - 6,183 Amortization of intangible assets 127 - - (127) - - - - - Total operating expenses 38,214 - - (127) (2,129) (72) - - 35,886 Income from operations 2,512 (7,023) 2,819 2,561 2,129 72 93 - 3,163 Interest and other income/(expense), net: (284) - - - - - - 290 6 Income before income taxes 2,228 (7,023) 2,819 2,561 2,129 72 93 290 3,169 Income tax provision (1,104) - - - - - - - (1,104) Net income 1,124 $ (7,023) $ 2,819 $ 2,561 $ 2,129 $ 72 $ 93 $ 290 $ 2,065 $ Net income per share: Basic 0.01 $ 0.02 $ Diluted 0.01 $ 0.02 $ Number of shares used in computation Basic 103,869 103,869 Diluted 107,851 107,851 Three Months Ended March 31, 2015 |

|
|
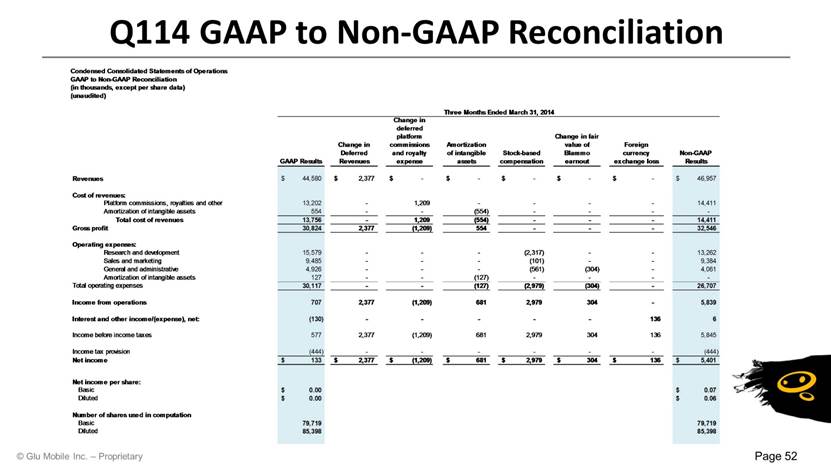
Q114 GAAP to Non-GAAP Reconciliation Page 52 Condensed Consolidated Statements of Operations GAAP to Non-GAAP Reconciliation (in thousands, except per share data) (unaudited) GAAP Results Change in Deferred Revenues Change in deferred platform commissions and royalty expense Amortization of intangible assets Stock-based compensation Change in fair value of Blammo earnout Foreign currency exchange loss Non-GAAP Results Revenues 44,580 $ 2,377 $ - $ - $ - $ - $ - $ 46,957 $ Cost of revenues: Platform commissions, royalties and other 13,202 - 1,209 - - - - 14,411 Amortization of intangible assets 554 - - (554) - - - - Total cost of revenues 13,756 - 1,209 (554) - - - 14,411 Gross profit 30,824 2,377 (1,209) 554 - - - 32,546 Operating expenses: Research and development 15,579 - - - (2,317) - - 13,262 Sales and marketing 9,485 - - - (101) - - 9,384 General and administrative 4,926 - - - (561) (304) - 4,061 Amortization of intangible assets 127 - - (127) - - - - Total operating expenses 30,117 - - (127) (2,979) (304) - 26,707 Income from operations 707 2,377 (1,209) 681 2,979 304 - 5,839 Interest and other income/(expense), net: (130) - - - - - 136 6 Income before income taxes 577 2,377 (1,209) 681 2,979 304 136 5,845 Income tax provision (444) - - - - - - (444) Net income 133 $ 2,377 $ (1,209) $ 681 $ 2,979 $ 304 $ 136 $ 5,401 $ Net income per share: Basic 0.00 $ 0.07 $ Diluted 0.00 $ 0.06 $ Number of shares used in computation Basic 79,719 79,719 Diluted 85,398 85,398 Three Months Ended March 31, 2014 |
|
|
GAAP to Non-GAAP Reconciliation Page 53 Glu Mobile Inc. Non-GAAP Adjusted EBITDA (in thousands) (unaudited) March 31, June 30, September 30, December 31, March 31, 2014 2014 2014 2014 2015 GAAP net income/(loss) 133 $ (3,768) $ 10,404 $ 1,379 $ 1,124 $ Change in deferred revenues 2,377 (5,874) 18,762 3,363 (7,023) Change in deferred platform commissions and royalty expense (1,209) 1,527 (9,122) (108) 2,819 Non-cash warrant expense - - 1,126 66 93 Amortization of intangible assets 681 568 1,465 2,561 2,561 Depreciation 620 607 617 669 706 Stock-based compensation 2,979 4,566 1,954 2,134 2,129 Change in fair value of Blammo earnout 304 531 - - - Transitional costs - 682 493 255 72 Restructuring charge - 159 209 67 - Foreign currency exchange loss 136 31 347 981 290 Interest and other expense (6) (7) (7) (3) (6) Income tax provision/(benefit) 444 78 (10,850) 2,773 1,104 Total Non-GAAP Adjusted EBITDA 6,459 $ (900) $ 15,398 $ 14,137 $ 3,869 $ For the Three Months Ended |

|
|
Key Operating Metrics Page 54 *DAU & MAU reflects the DAU & MAU figures for the last month of the quarter **FTE only, excludes contractors, temporary employees and consultants ***Q314 in-app purchase billable transactions and average revenues per billable transaction has been restated to include the impact of Cie Games activity after its acquisition on August 20, 2014 Actual Actual Actual Actual Actual (All Revenue Figures are Non-GAAP) Q114 Q214 Q314 Q414 Q115 Total Revenues (in thousands) $46,957 $35,036 $83,553 $76,228 $62,446 Total Revenues Growth Q/Q 10% (25%) 138% (9%) (18%) Total Revenues Growth Y/Y 90% 51% 270% 78% 33% Original IP % of Total Revenues 91% 93% 37% 41% 43% Platform Commissions (in thousands) $11,886 $8,155 $21,382 $19,391 $16,043 Royalties (in thousands) 1,121 1,348 10,711 8,441 6,127 Hosting and other COGS (in thousands) 1,406 1,403 1,637 1,835 1,227 Total Cost of Revenues (in thousands) $14,413 $10,906 $33,730 $29,667 $23,397 Non-GAAP Operating Expenses (in thousands) $ 26,707 $ 25,638 $ 35,043 $ 33,093 $ 35,886 Variable Marketing Expense (in thousands) 7,271 5,456 12,800 9,641 9,693 Variable Marketing as % of Total Revenues 15% 16% 15% 13% 16% Adjusted EBITDA (in thousands) 6,459 (900) 15,398 14,137 3,870 Headcount** (at quarter-end) 547 562 630 653 695 Daily Active Users (DAU)* (in millions) 7.0 5.3 7.2 7.2 6.0 Monthly Active Users (MAU)* (in millions) 64.5 51.9 60.3 62.6 54.6 Installs (in millions) 105.6 60.2 107.7 89.4 72.6 Cumulative Installs (in millions) 711.9 772.1 879.8 969.2 1,041.8 In-App Purchase Billable Transactions (in thousands)*** 3,286 2,257 7,778 7,477 5,896 Average Revenue per Billable Transaction*** $11.79 $11.84 $9.14 $8.62 $9.02 |
