Attached files
| file | filename |
|---|---|
| 8-K - FORM 8-K - UMB FINANCIAL CORP | d915975d8k.htm |
| EX-99.1 - EX-99.1 - UMB FINANCIAL CORP | d915975dex991.htm |
| EX-99.3 - EX-99.3 - UMB FINANCIAL CORP | d915975dex993.htm |
 Strength in Balance.
Annual Meeting of Shareholders
April 28, 2015
UMB Financial
Exhibit 99.2 |
 2
Cautionary Notice about Forward-Looking Statements
This presentation contains, and our other communications may contain,
forward-looking statements within the meaning of the Private Securities
Litigation Reform Act of 1995. These statements can be identified by the fact that they do not relate strictly to historical or
current
facts.
Forward-looking
statements
often
use
words
such
as
“believe,”
“expect,”
“anticipate,”
“intend,”
“estimate,”
“project,”
“outlook,”
“forecast,”
“target,”
“trend,”
“plan,”
“goal,”
or other words of comparable meaning or future-tense or conditional verbs such
as “may,”
“will,”
“should,”
“would,”
or “could.”
Forward-looking statements convey our expectations, intentions, or forecasts
about future events, circumstances, results, or aspirations.
All forward-looking statements are subject to assumptions, risks, and
uncertainties, which may change over time and many of which are beyond
our
control.
You
should
not
rely
on
any
forward-looking
statement
as
a
prediction
or
guarantee
about
the
future.
Our
actual
future
objectives, strategies, plans, prospects, performance, condition, or results may
differ materially from those set forth in any forward- looking statement.
Some of the factors that may cause actual results or other future events, circumstances, or aspirations to differ from
those in forward-looking statements are described in our Annual Report on Form
10-K for the year ended December 31, 2014, our subsequent Quarterly
Reports on Form 10-Q or Current Reports on Form 8-K, or other applicable documents that are filed or furnished
with the Securities and Exchange Commission (SEC).
Any forward-looking statement made by us or on our behalf speaks only as of the
date that it was made. We do not undertake to update any forward-looking
statement to reflect the impact of events, circumstances, or results that arise after the date that the statement was
made. You, however, should consult further disclosures (including disclosures of a
forward-looking nature) that we may make in any subsequent Annual Report
on Form 10-K, Quarterly Report on Form 10-Q, Current Report on Form 8-K, or other applicable document
that is filed or furnished with the SEC. |
 Agenda
Authenticity
2014 Performance & Highlights
1
st
Quarter 2015 Financials
Questions & Answers |
 Genuine
Not easily replicated
Trustworthy
Original
Experienced
Strong
Consistent |
 5
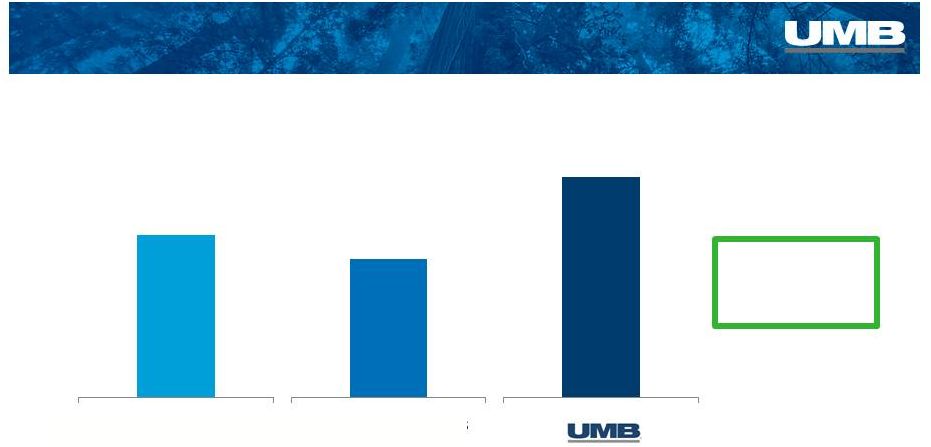
Continuity –
We’re in it for the long run
•
CEO tenure
4 generations
of consistent
leadership
All company and large bank CEO tenure statistics source: The Motley Fool,
Sept. 5, 2013. All Companies
8.1 years
Largest US Banks
6.9 years
11 years |
 6
Continuity –
We’re in it for the long run
•
Company-wide
•
Our Loan Committee—12 senior executives who guide our
lending—average 23 years at UMB
•
In Kansas City—our commercial lenders average 13 years
•
Footprint-wide—the average commercial lender has been
with UMB for 9 years
•
Lending team tenure
long-tenured
lenders
build
relationships.
—
—associates
average
nearly
9
years
with UMB |
 #1
7
Consistency –
Steady business practices
Consistently independent—no government assistance, no
FDIC assisted deals
Consistent actions to diversify and innovate our business
Named as one of the best by Forbes for 6
th
year**
* Source FDIC reports
** Source: Forbes “Best Banks in America”
list, 2010 -
2015
o
1933 –
UMB turned down Emergency Banking Act assistance during the
Great Depression
o
2008 –
UMB did not participate in the Troubled Asset Relief Program
deposit market share in Kansas City for past 4 years*
|
 8
Consistency –
Independence
“If we were to liquidate this bank today, we could
pay our depositors one hundred cents on the
dollar and collect our entire Surplus and Capital
Account of $700,000 and a large part of the
Undivided Profits Account.”
No need for government assistance –
then or now.
-R.
Crosby
Kemper,
Sr.
in a 1933 letter to the Missouri
Banking Commissioner |
 9
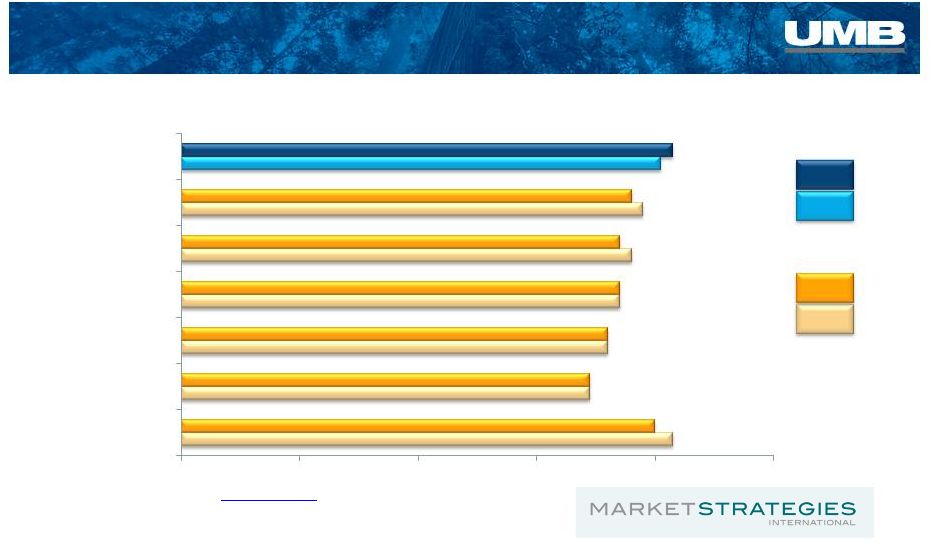
Consistency –
Stability Breeds Confidence
American Customer Satisfaction Index (ACSI)
“Score”
on 100-Point Scale
2013
2014
For ACSI:
2013
2014
For UMB:
Source
for
non-UMB
ACSI
scores:
www.theacsi.org
Source for UMB scores: Average of 3 questions, converted to 100-point
scale Q1: How satisfied would you say you are with UMB? Q2: To what extent
has UMB exceeded or fallen short of your expectations? Q3: Now, I want you to imagine an
ideal bank. How well do you think UMB compares with that ideal bank?
83
69
72
74
76
78
81
80
69
72
74
74
76
83
0
20
40
60
80
100
All other banks
Bank of America
Wells Fargo
Citibank
J. P. Morgan Chase
Banking Industry Total
UMB |
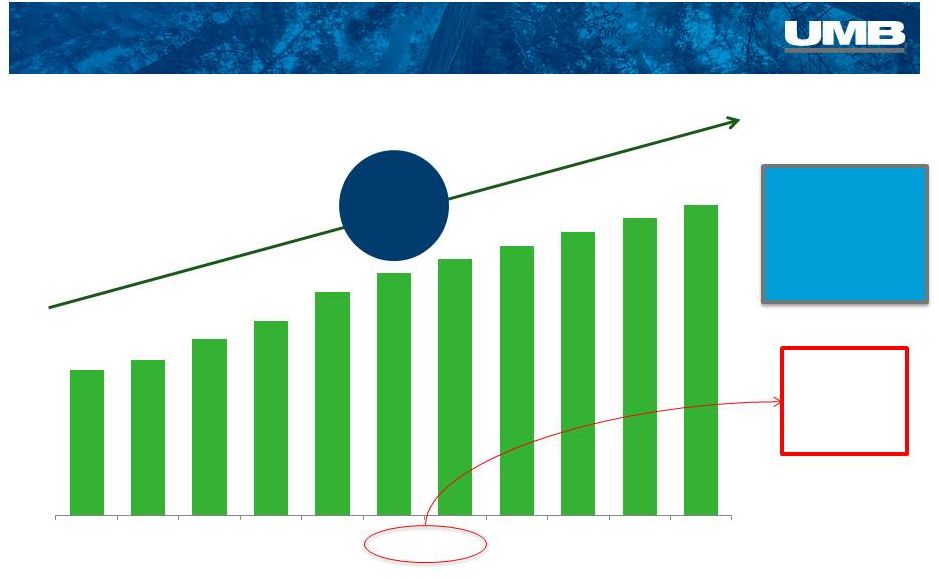 10
Consistency –
Returning Value to Shareholders
Annual Dividends Per Share Declared
Dividend
increase
= 114.1%
Industry
Median
+17.1%
increase
Industry is defined as all publicly traded banks with dividends reported in 2004
and 2014. Source: SNL Financial More than
half of banks
decreased
dividends in
2009 or 2010
$0.425
$0.910
2004
2005
2006
2007
2008
2009
2010
2011
2012
2013
2014 |
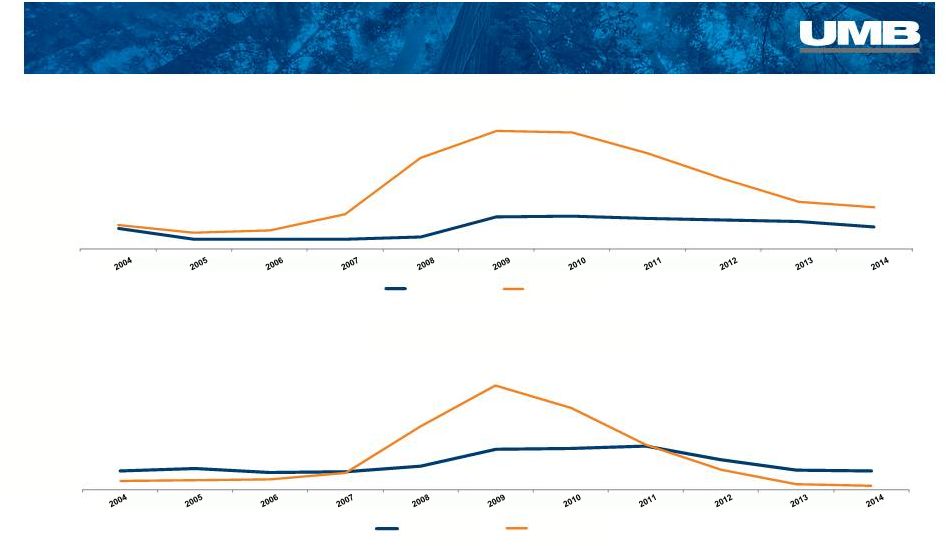 11
Peer group consists of Bank of Oklahoma, Boston Private, Commerce, Cullen/Frost,
CoBiz, City Natl., First Midwest, Hancock, Old Natl., Prosperity, Signature,
Silicon Valley, Trustmark, and Webster. Source for peer data: SNL Financial.
Consistency –
Unwavering Credit Standards
0.00%
0.50%
1.00%
1.50%
2.00%
Non-Performing Loans/Loans
UMBF
Peer Median
0.00%
0.50%
1.00%
1.50%
Net Chargeoffs/Avg. Loans
UMBF
Peer Median |
 Net
Charge-Offs
(000’s)
2014
2013
2012
2011
2010
2009
2008
2007
2006
2005
2004
Commercial
Loans*
6,459
3,881
7,310
11,880
6,007
4,113
2,943
1,569
2,367
1,818
893
Credit Card
8,301
8,811
9,382
11,127
14,279
12,291
6,839
4,577
3,449
4,917
4,412
Other**
851
1,483
1,399
1,128
1,411
3,854
1,973
2,127
1,176
938
836
Total Net
Charge-Offs
15,611
14,175
18,091
24,135
21,697
20,258
11,755
8,273
6,992
7,673
6,141
Average
Total Loans
(billions)
NCOs as %
of average
loans
0.22%
0.23%
0.35%
0.51%
0.48%
0.47%
0.28%
0.21%
0.20%
0.25%
0.22%
12
Consistency –
Quality Underwriting
* Commercial Loans includes Commercial Loans and Commercial Real
Estate. ** Other includes Consumer, Consumer Real Estate, Home Equity, and
DDA Charge-offs. 6.98
$
6.22
$
5.25
$
4.76
$
4.49
$
4.38
$
4.19
$
3.90
$
3.58
$
3.13
$
2.78
$ |
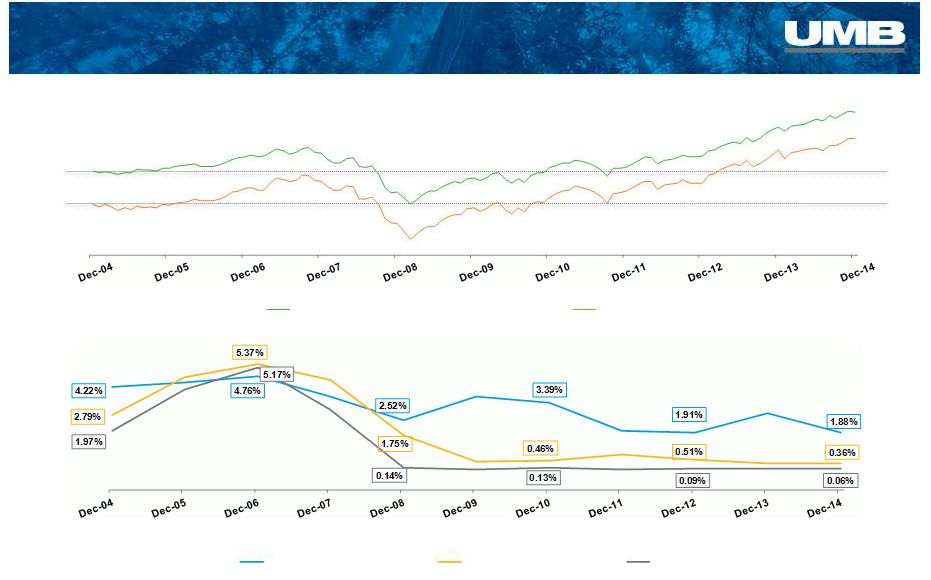 13
Consistency –
Change is Constant
Key Interest Rates
Index Prices
December
31,
2004
–
December
31,
2014
10-yr Treasury
6-mo LIBOR
Fed Funds Rate
$0
$70
$0
$65
S&P 500: +69.9%
DJIA: +65.3% |
 $18.93
$36.10
Book Value
Evolution –
Then and Now
$1.23 Billion
$2.59 Billion
Market Capitalization
Average Deposits –
Full Year
$5.0 billion
$12.7 billion
14
Share Price -
UMBF
$28.33
$56.89
Total Assets
$7.8 billion
$17.5 billion
Average Loans –
Full Year
$2.8 billion
$7.0 billion
2004
2014
At December 31, except for averages |
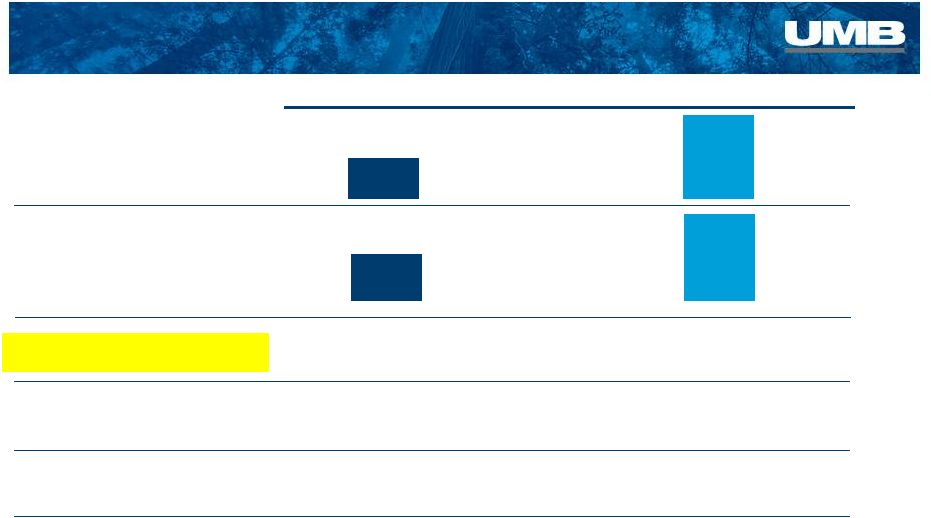
 Building Strength & Balance |
 Evolution –
Optimizing our Balance Sheet
2014
16
Geographic
Expansion &
Penetration
Changing
Balance
Sheet
Asset
Management:
Growth &
Diversification
Asset
Servicing:
Adapting to
Changes
Healthcare
Services:
Evolving with
the Industry
2004 |
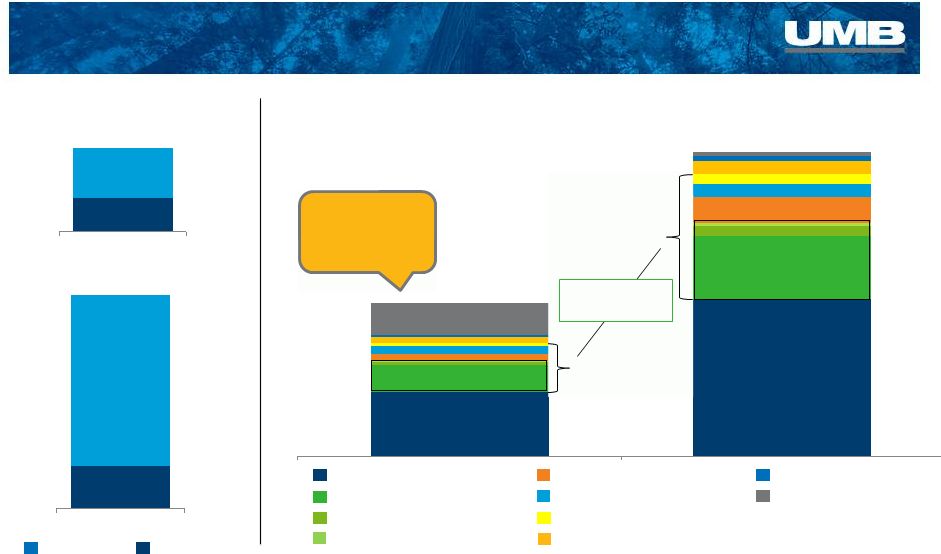   41.8%
51.6%
17.9%
20.8%
8.6%
4.3%
4.2%
21.0%
Evolution –
Loan Composition
2006
12/31/06 Loans -
$3.8 billion
2014
12/31/14 Loans -
$7.5 billion
4.0%
4.6%
5.1%
*Note: unlabeled categories comprise <4% each of total loans
CRE
C&I
CRE
C&I
Commercial Real Estate
C&I –
including leases
Farm RE (CRE category)
Residential RE (1-4 Family)
HELOC
RE Construction & Land Dev.
Multifamily RE (CRE category)
Consumer Credit Card
Consumer -
other
Commercial Credit Card
Consumer Loans
17
2004
2014
18.4%
39.9%
81.6%
60.1%
Commercial/Consumer Mix
annual averages
Commercial
Consumer
Real Estate –
related loans
32.0%
41.3%
Indirect Loans
Runoff from
$700M, June ‘07 -
Dec ‘11 |
 33.9%
33.5%
54.8%
24.9%
7.5%
9.8%
6.8%
6.2%
6.8%
4.5%
Evolution –
Deposit Sources
Consumer Banking
Commercial & Small Business
Inst. Banking & Investor Services
Asset Servicing
Healthcare Services
Private Wealth Management
Institutional Asset Management
Small Business Banking
4.0% combined
•Private Wealth
•Healthcare
•Inst. Asset Mgmt
•Small Business
3.2%
4.1%
18
% Noninterest-
Bearing
12/31/06
33.5%
12/31/14
42.1%
Average Cost
of Deposits
12/31/06
1.77%
12/31/14
0.10%
2006
Average
Deposits
-
$5.5
billion
2014
Average
Deposits
-
$12.7
billion |
 Evolution –
Pushing our Boundaries
2014
Healthcare
Services:
Evolving with
the Industry
19
Geographic
Expansion &
Penetration
Changing
Balance
Sheet
2004
Asset
Management:
Growth &
Diversification
Asset
Servicing:
Adapting to
Changes |
 20
Fund Services
Prairie Capital
Healthcare Services –
National Sales
Scout Investments –
National Sales
Corporate Trust/Inst. Asset Mgmt.
UMB Bank presence
Loan Production Office
2004
Private Wealth/Personal Trust |
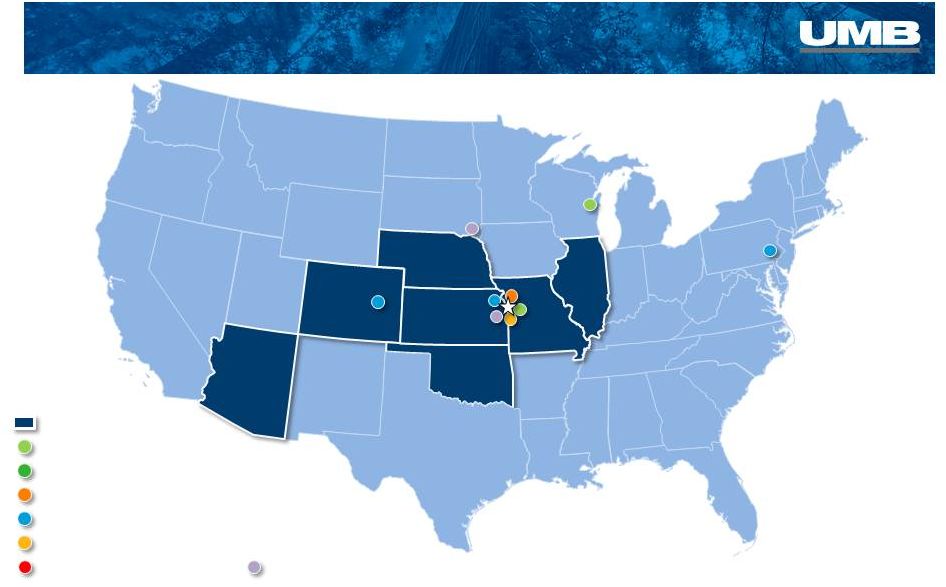
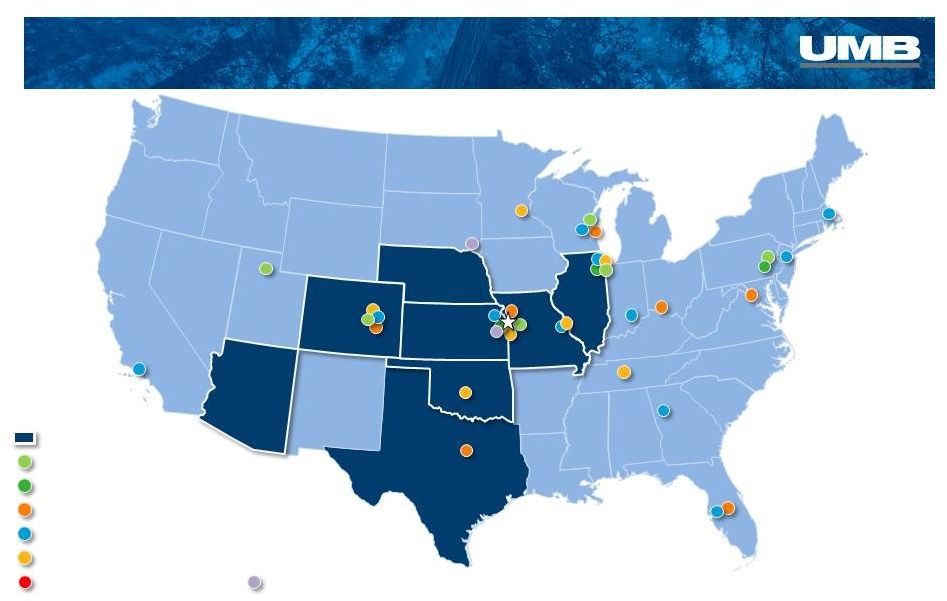 21
2014
Fund Services
Prairie Capital
Healthcare
Services
–
National
Sales
Scout
Investments
–
National
Sales
Corporate Trust/Inst. Asset Mgmt.
UMB Bank presence
Loan Production Office
Private Wealth/Personal Trust |
 Evolution –
Scale in Asset Management
Asset
Management:
Growth &
Diversification
Asset
Servicing:
Adapting to
Changes
Healthcare
Services:
Evolving with
the Industry
22
Changing
Balance
Sheet
Geographic
Expansion &
Penetration
2004
2014 |
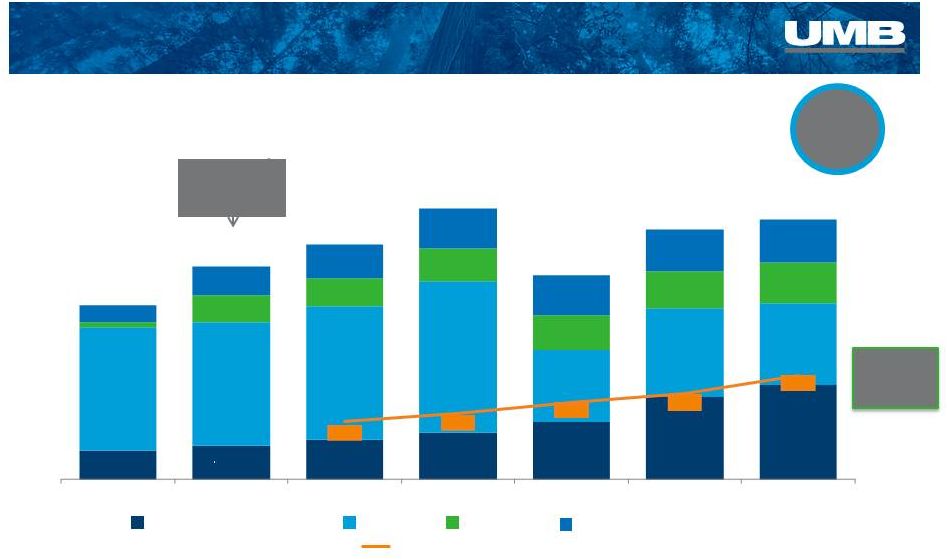
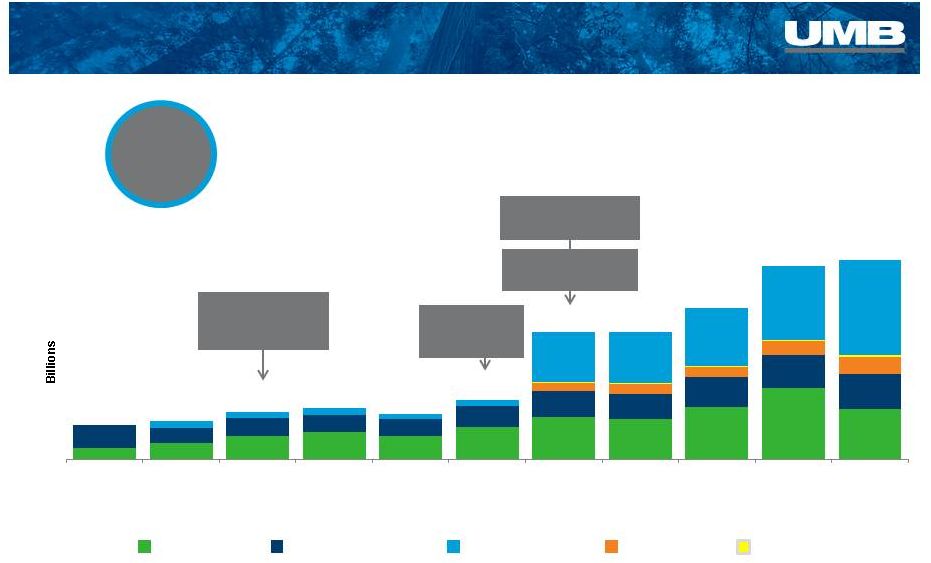 $8.2B
$10.1B
$9.7B
$11.0B
$12.8B
$27.3B
$27.3B
$32.4B
$41.4B
$42.8B
Rolled out
MidCap strategy
–
Oct 2006
Assets Under Management
Evolution
–
Designed to Grow
10-year
CAGR
19.2%
Private Wealth/Trust
Scout Institutional
Scout Funds
Prairie Capital
Brokerage
23
Scout became
a sub of
UMBFC –
2009
Acquired PCM,
$2.2B –
July 2010
Acquired Reams,
$9.8B–
Dec 2010
At Dec. 31,
$2.4
$3.5
$5.0
$5.8
$4.9
$6.9
$8.8
$8.7
$11.3
$15.4
$10.7
$5.0
$3.2
$3.7
$3.7
$3.6
$4.5
$5.5
$5.4
$6.4
$7.0
$7.6
$1.7
$2.0
$2.2
$2.9
$3.6
$1.5
$1.4
$1.5
$1.2
$1.4
$10.9
$11.0
$12.3
$15.8
$20.5
2004
2005
2006
2007
2008
2009
2010
2011
2012
2013
2014
$7.4B |
 24
Evolution –
Asset
Diversification
Scout AUM Diversification
$31.2 billion
* Asset mix by strategy not available prior to 2009 due to system constraints
Intl Equity
Money Mkt
Small Cap Equity
Core Bond
Balanced Equity
Core Plus Bond
Low Duration Bond
Unconstrained Bond
Mid Cap Equity
Long Duration Bond
Other
21.8%
20.7%
18.4%
12.2%
12.2%
6.7%
8.0%
62.7%
12.2%
2009*
2014
$8.2 billion
5.3%
5.7%
7.0%
7.1%
At December 31, |
 25
Evolution –
Building
Wealth for our Customers
Private Wealth Management
Assets Under Management
$5.0B
$11.6B
2004
2014
At December 31,
PCM added 13 funds
since acquisition for a
total of 23 funds
2014
Offerings
expanded to
151 products
2010
Acquired Prairie
Capital -$2.2B in AUM
2004
We offered ~40
products to our
clients
10-year
CAGR
8.9%
2009
Rolled out wrap
accounts, began
building brokerage
assets
Private Wealth/Trust
Prairie Capital
Brokerage
$7.6
$3.6
$0.4
$5.0 |
 Evolution –
Adapting Asset Servicing Capabilities
Asset
Management:
Growth &
Diversification
Asset
Servicing:
Adapting to
Changes
Healthcare
Services:
Evolving with
the Industry
26
Changing
Balance
Sheet
2004
2014
Geographic
Expansion &
Penetration |
 27
Evolution –
UMB Fund Services
10-year
CAGR
30.5%
Assets Under Administration
($billions)
$132.6
$179.3
$162.4
$206.4
$191.0
$156.0
$198.3
Fund Accounting & Admin.
Alternative
Custody
Other (transfer agent/distribution)
* Current segment reporting was initiated in 2010. Comparative revenue data
not available before that time. 42.7%
Revenue
growth
42.7%
Revenue
growth
Revenue (millions)
At December 31,
16.6%
15.8%
17.0%
17.4%
28.2%
33.0%
36.4%
71.3%
57.9%
56.5%
56.0%
35.2%
35.6%
31.5%
2.5%
12.6%
11.9%
11.9%
16.8%
14.6%
15.9%
9.6%
13.7%
14.5%
14.7%
19.7%
16.8%
16.3%
2008
2009
2010
2011
2012
2013
2014
$77.5
$66.0
$71.1
$83.0
$94.2
Acquired JD
Clark $18B
AUA–2009 |
 Evolution
–
A Changing Healthcare Industry
2004
2014
Asset
Management:
Growth &
Diversification
Asset
Servicing:
Adapting to
Changes
Healthcare
Services:
Evolving with
the Industry
28
Geographic
Expansion &
Penetration
Changing
Balance
Sheet |
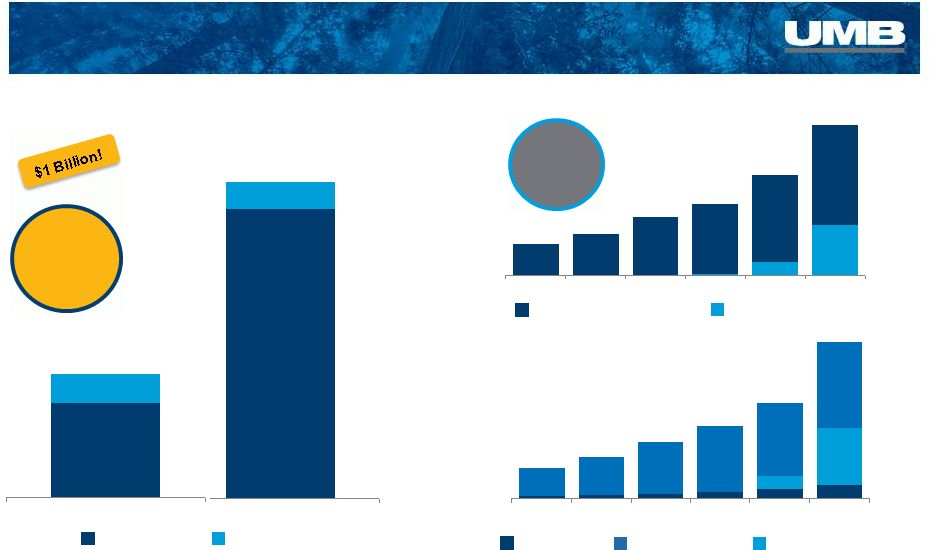  Healthcare Deposits and Assets
$millions
2014
2005
HSA Assets
HSA Deposits
$36.6
$917.5
$841.8
$75.8
$28.3
$8.3
29
Evolution
–
Healthcare Services
Jan ‘15
Deposits
& assets
+ $1B
13.3%
33.2%
$0.9
$1.2
$1.7
$2.1
$3.0
$4.4
2009
2010
2011
2012
2013
2014
315
438
588
567
2,451
1,212
1,630
2,245
2,824
3,161
3,765
2009
2010
2011
2012
2013
2014
Healthcare Card Purchase Volume
$millions
Healthcare Accounts
thousands
Virtual Card Volume
HSA & FSA Card Volume
FSA Benefit Cards
HSA Accounts
V-Cards Issued*
*Virtual Cards are single-use; one-time transaction, not an open account.
At December 31
At Dec. 31
5yr
CAGR
36.7% |
 Evolution
–
A Journey, Not a Destination
2004
2014
Healthcare
Services:
Evolving with
the Industry
30
Geographic
Expansion &
Penetration
Changing
Balance
Sheet
Asset
Management:
Growth &
Diversification
Asset
Servicing:
Adapting to
Changes |
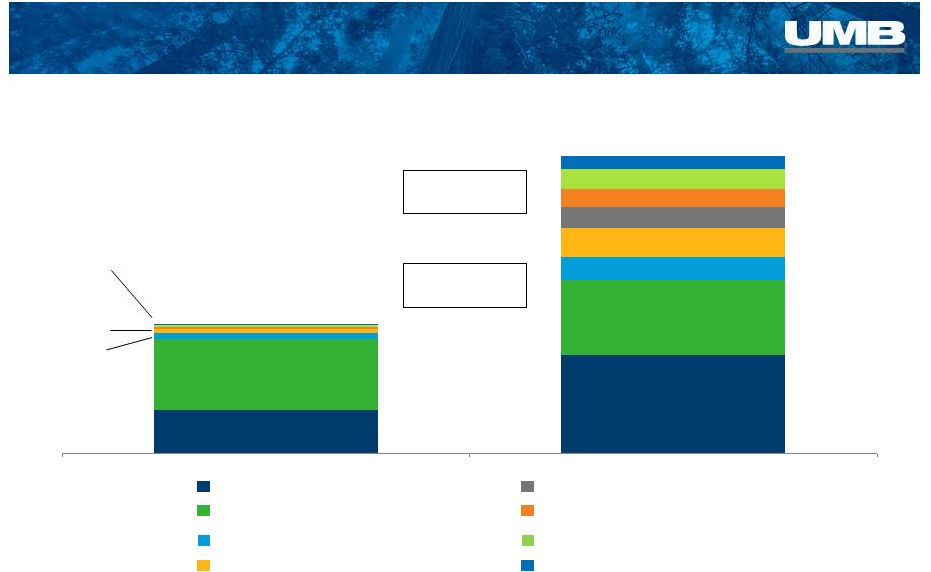
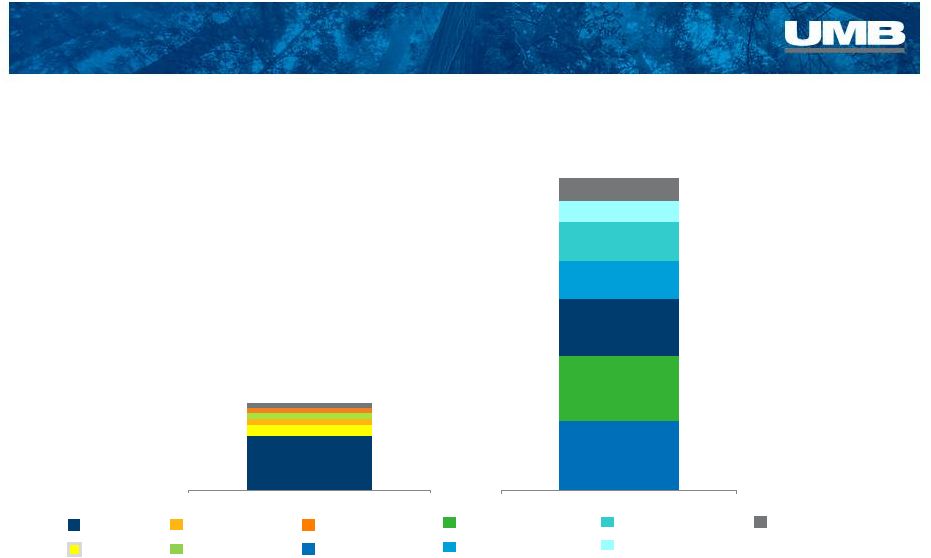
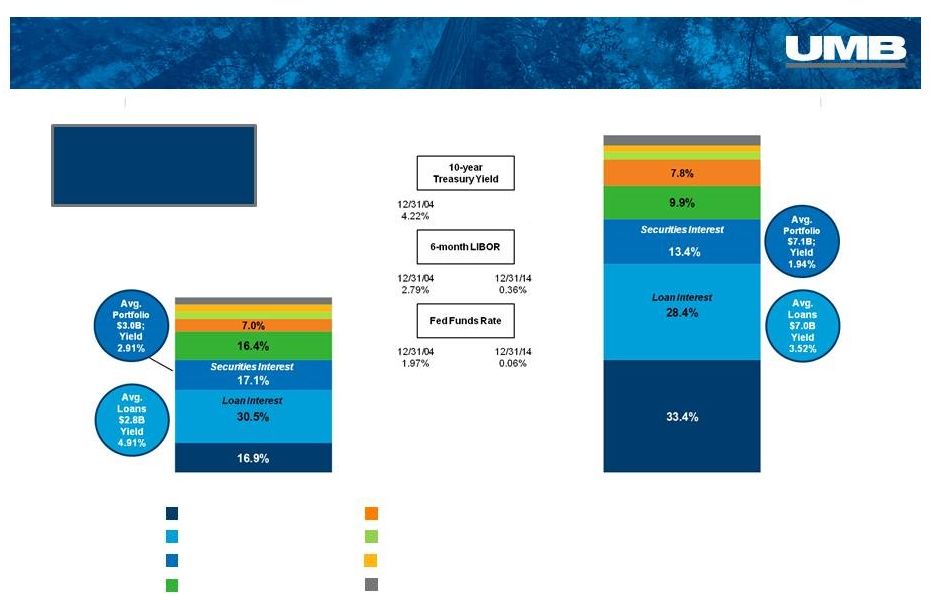 31
Evolution –
Diverse Revenue = Fewer Dependencies
Total Revenue
$862.6 million
Total Revenue
$447.6 million
2004
2014
Interest on Loans
Trust & Securities Processing
Interest on Securities
Deposit Service Charges
Trading & Investment Banking
Bankcard Fees
Other
“Other”
includes:
•
Brokerage fees
•
Gains on Securities Sales
•
Equity Earnings on Alt Investments
•
Insurance Fees & Commissions
•
Interest income from repo, due from, etc.
Other Noninterest Income
12/31/14
2.17%
Revenue nearly
doubled during the
past decade.
4.0%
4.1%
4.0%
2.9%
2.0%
2.2% |
 Growth |
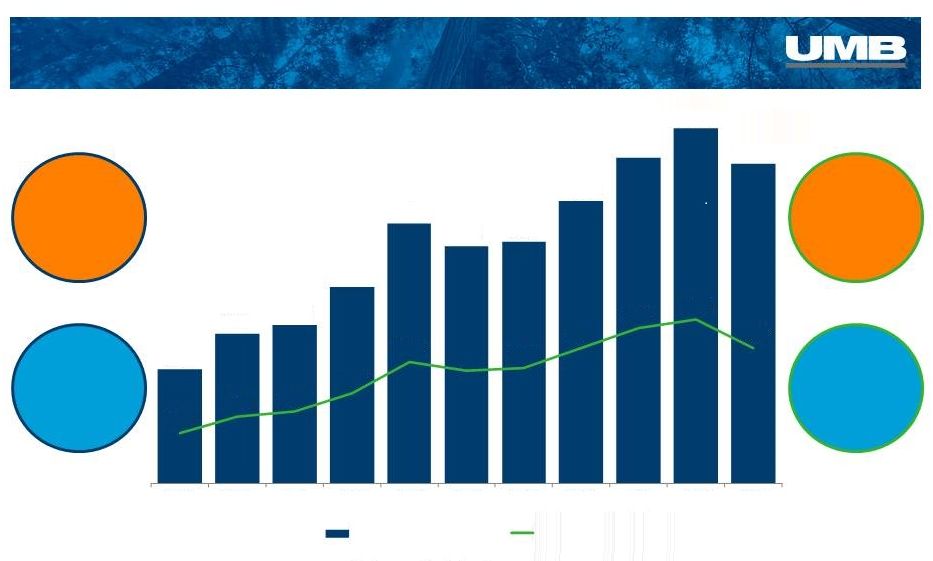 33
Growth
–
Net Income & EPS
UMB
Net
Income
‘04-’14
+181.6%
Industry
Median
Net Income
‘04-’14
+33.3%
UMB
EPS*
‘04-’14
+167.7%
Industry
Median
EPS*
‘04-’14
+17.0%
Industry
is
defined
as
all
publicly
traded
banks
with
net
income
reported
in
2004
and
2014.
Source:
SNL
Financial.
*EPS
is
diluted.
$42.8
$56.3
$59.8
$74.2
$98.1
$89.5
$91.0
$106.5
$122.7
$134.0
$120.7
$0.99
$1.30
$1.40
$1.77
$2.38
$2.20
$2.26
$2.64
$3.04
$3.20
$2.65
2004
2005
2006
2007
2008
2009
2010
2011
2012
2013
2014
Net Income ($ millions)
Diluted EPS |
 34
Growth
–
A 10-year Picture
95.4%
Net Interest Income
Diluted Earnings Per Share
UMBF
(2004 –
2014)
108.6%
Total Revenue
58.5%
17.0%
Industry Median
(2004 –
2014)
62.3%
118.6%
Noninterest Income
58.7%
167.7%
Average Loans
Average Total Deposits
150.8%
155.0%
69.2%
79.4%
Industry is defined as all publicly traded banks with data reported in 2004 and
2014. Source: SNL Financial |
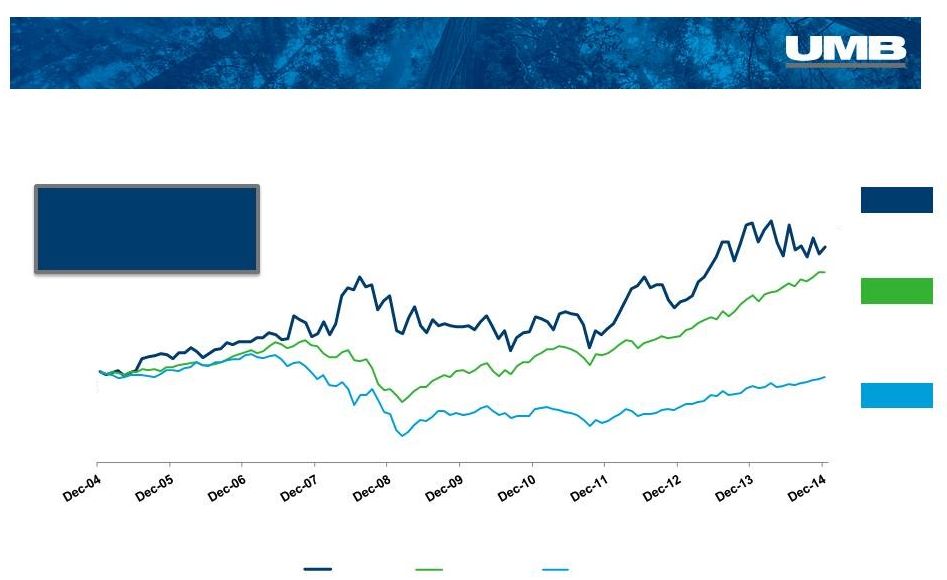 35
December 31, 2004 –
December 31, 2014
Reinvesting all cash dividends
+137.6%
+109.5%
-6.5%
UMBF
Compound Annual
Growth Rate 9.0%
Growth
–
Total Shareholder Return
$100
$238
$209
$94
UMBF
S&P 500
SNL U.S. Bank |
 Agenda
Authenticity
2014 Performance & Highlights
1
st
Quarter 2015 Financials
Questions & Answers |
 37
Overview of 2014 Results
All comparisons are full-year 2014 vs. full-year 2013 unless
otherwise noted •
Net Income: $120.7 million, a decrease of $13.3 million compared
to 2013
•
EPS: $2.65 per diluted share
•
Average loans increased 12.1% to $7.0 billion
•
Net interest income, driven by loan volume and mix, increased 5.0% to $350.0
million •
Nonperforming loans decreased to 0.37% of loans from 0.47% in 2013
•
Total assets under management stood at $42.8 billion at 12/31/14, an increase of
3.4% •
Announced agreement to acquire Marquette Financial Companies, pending regulatory
approval |
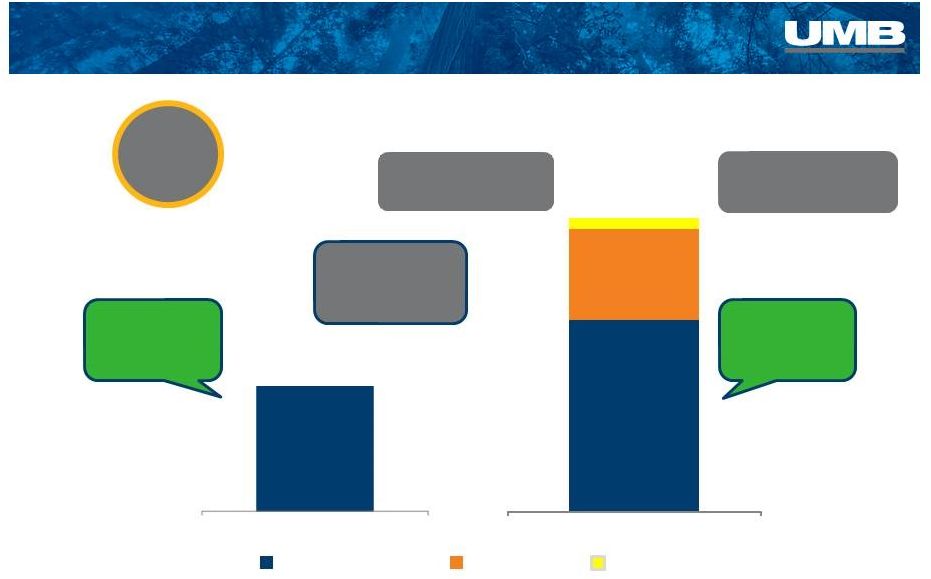
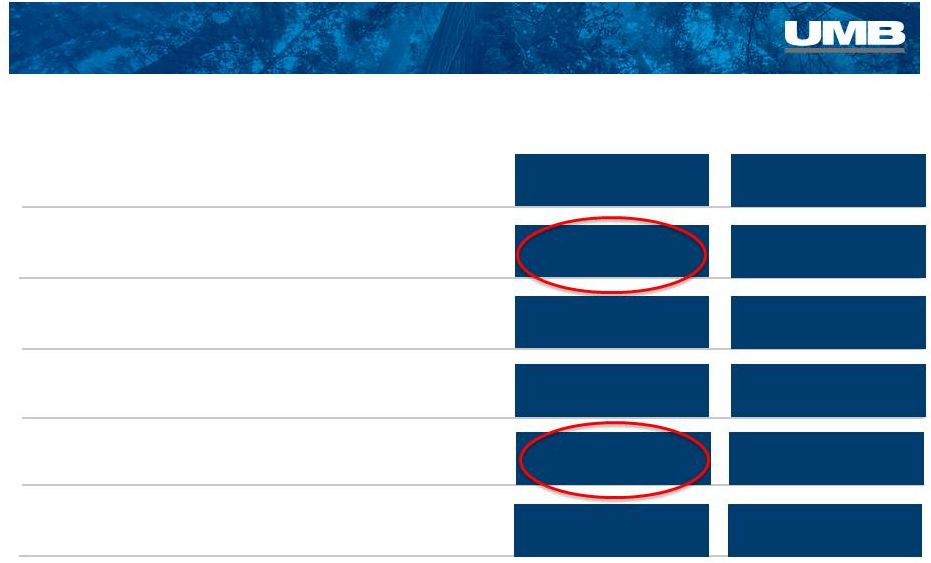
 38
Strategically Compelling Combination
Compatible cultures
Complementary balance sheet
o
Combining MFC’s higher-yielding loans with UMB’s low-cost
funding Enhances UMB’s market share in Dallas and Phoenix markets
Adds national specialty-lending businesses and an asset-management
business +
Pending Acquisition of Marquette Financial Companies |
 39
About Marquette
$1.4 billion in assets, $970 million in net loans & leases, $959
million in deposits
Original bank formed 36 years ago in Phoenix
Privately-owned by the Pohlad family
Community Banking Franchise
Dallas
5 branches
$323 million in net loans
$376 million in deposits
Phoenix
8 branches
$341 million in net loans
$583 million in deposits
High Quality National Specialty Lending
Middle-Market Asset-Based Lending
$207 million in net loans
Factoring business
$96 million in net loans
Note: Financial data as of 03/31/2015 Source: MFC financial reports and regulatory
filings. |
 Agenda
2014 Performance & Highlights
1st
Quarter 2015 Financials
Questions & Answers
Authenticity |
 41
First Quarter 2015
All comparisons are first quarter 2015 vs. first quarter 2014 unless otherwise
noted •
Net Income: $33.8 million, an increase of $10.4 million
•
EPS: $0.74 per diluted share
•
Average loans increased 11.9% to $7.5 billion
•
Noninterest income increased 1.8% to $125.2 million
•
Nonperforming loans decreased to 0.39% of loans from 0.45%
•
Total company assets under management stood at $42.3 billion at March 31,
2015 •
Return on average assets increased to 0.81% from 0.58%
•
Return on average equity increased to 8.18% from 6.13%
•
Tier 1 capital ratio at 03/31/15 remains strong at 12.91% under the new Basel III
requirements |
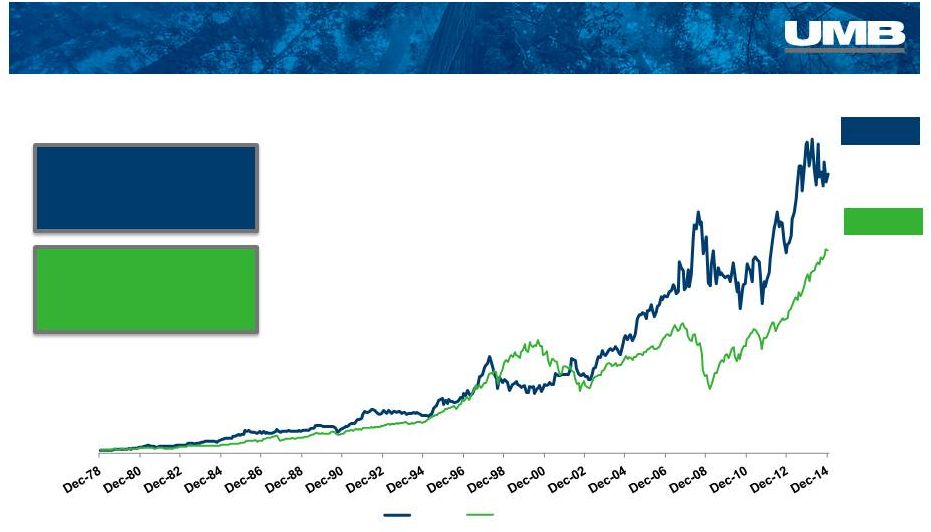 Built for the Decades
42
UMBF
Compound Annual
Growth Rate 13.0%
UMBF
Compound Annual
Growth Rate 13.0%
S&P 500
Compound Annual
Growth Rate 12.0%
S&P 500
Compound Annual
Growth Rate 12.0%
+5,837%
+8,069%
Total Shareholder Return
December 31, 1978 –
December 31, 2014
$100
$8,169
$5,937
UMBF
S&P 500 |
 Agenda
2014 Performance & Highlights
1
st
Quarter 2015 Financials
Questions & Answers
Authenticity |
 Strength in balance –
today and tomorrow.
Annual Meeting of Shareholders
–
April 2015
UMB Financial |