Attached files
| file | filename |
|---|---|
| 8-K - 8-K - O-I Glass, Inc. /DE/ | a15-10152_18k.htm |
| EX-99.1 - EX-99.1 - O-I Glass, Inc. /DE/ | a15-10152_1ex99d1.htm |
Exhibit 99.2
|
|
O-I First Quarter 2015 Earnings Presentation April 29, 2015 |
|
|
Safe Harbor Comments Regulation G The information presented here regarding adjusted net earnings and adjusted EPS relates to net earnings from continuing operations attributable to the Company exclusive of items management considers not representative of ongoing operations and does not conform to U.S. generally accepted accounting principles (GAAP). It should not be construed as an alternative to the reported results determined in accordance with GAAP. Management has included this non-GAAP information to assist in understanding the comparability of results of ongoing operations. Further, the information presented here regarding free cash flow does not conform to GAAP. Management defines free cash flow as cash provided by continuing operating activities less capital spending (both as determined in accordance with GAAP) and has included this non-GAAP information to assist in understanding the comparability of cash flows. Management uses non-GAAP information principally for internal reporting, forecasting, budgeting and calculating compensation payments. Management believes that the non-GAAP presentation allows the board of directors, management, investors and analysts to better understand the Company’s financial performance in relationship to core operating results and the business outlook. Forward-Looking Statements This document contains "forward-looking" statements within the meaning of Section 21E of the Securities Exchange Act of 1934 and Section 27A of the Securities Act of 1933. Forward-looking statements reflect the Company's current expectations and projections about future events at the time, and thus involve uncertainty and risk. The words “believe,” “expect,” “anticipate,” “will,” “could,” “would,” “should,” “may,” “plan,” “estimate,” “intend,” “predict,” “potential,” “continue,” and the negatives of these words and other similar expressions generally identify forward-looking statements. It is possible the Company's future financial performance may differ from expectations due to a variety of factors including, but not limited to the following: (1) foreign currency fluctuations relative to the U.S. dollar, specifically the Euro, Brazilian real, Colombian peso and Australian dollar, (2) changes in capital availability or cost, including interest rate fluctuations and the ability of the Company to refinance debt at favorable terms, (3) the general political, economic and competitive conditions in markets and countries where the Company has operations, including uncertainties related to economic and social conditions, disruptions in capital markets, disruptions in the supply chain, competitive pricing pressures, inflation or deflation, and changes in tax rates and laws, (4) consumer preferences for alternative forms of packaging, (5) cost and availability of raw materials, labor, energy and transportation, (6) the Company’s ability to manage its cost structure, including its success in implementing restructuring plans and achieving cost savings, (7) consolidation among competitors and customers, (8) the ability of the Company to acquire businesses and expand plants, integrate operations of acquired businesses and achieve expected synergies, (9) unanticipated expenditures with respect to environmental, safety and health laws, (10) the Company’s ability to further develop its sales, marketing and product development capabilities, and (11) the timing and occurrence of events which are beyond the control of the Company, including any expropriation of the Company’s operations, floods and other natural disasters, events related to asbestos-related claims, and the other risk factors discussed in the Company’s Annual Report on Form 10-K for the year ended December 31, 2014 and any subsequently filed Annual Report on Form 10-K or Quarterly Report on Form 10-Q. It is not possible to foresee or identify all such factors. Any forward-looking statements in this document are based on certain assumptions and analyses made by the Company in light of its experience and perception of historical trends, current conditions, expected future developments, and other factors it believes are appropriate in the circumstances. Forward-looking statements are not a guarantee of future performance and actual results or developments may differ materially from expectations. While the Company continually reviews trends and uncertainties affecting the Company's results of operations and financial condition, the Company does not assume any obligation to update or supplement any particular forward-looking statements contained in this document. Presentation Note Unless otherwise noted, the information presented in this presentation reflects continuing operations only. 1 |
|
|
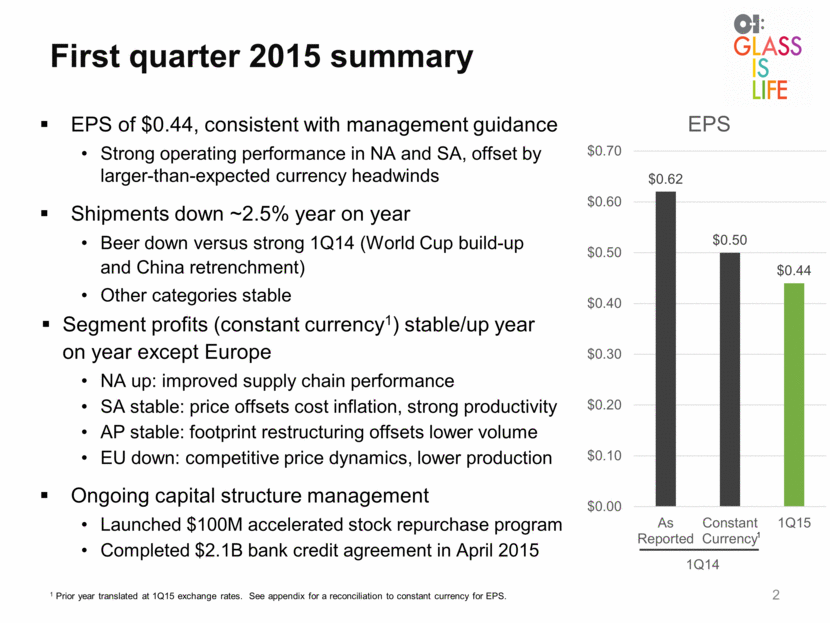
EPS of $0.44, consistent with management guidance Strong operating performance in NA and SA, offset by larger-than-expected currency headwinds Shipments down ~2.5% year on year Beer down versus strong 1Q14 (World Cup build-up and China retrenchment) Other categories stable Segment profits (constant currency1) stable/up year on year except Europe NA up: improved supply chain performance SA stable: price offsets cost inflation, strong productivity AP stable: footprint restructuring offsets lower volume EU down: competitive price dynamics, lower production Ongoing capital structure management Launched $100M accelerated stock repurchase program Completed $2.1B bank credit agreement in April 2015 First quarter 2015 summary 1Q14 1 Prior year translated at 1Q15 exchange rates. See appendix for a reconciliation to constant currency for EPS. 1 $0.62 $0.50 $0.44 $0.00 $0.10 $0.20 $0.30 $0.40 $0.50 $0.60 $0.70 As Reported Constant Currency 1Q15 EPS |
|
|
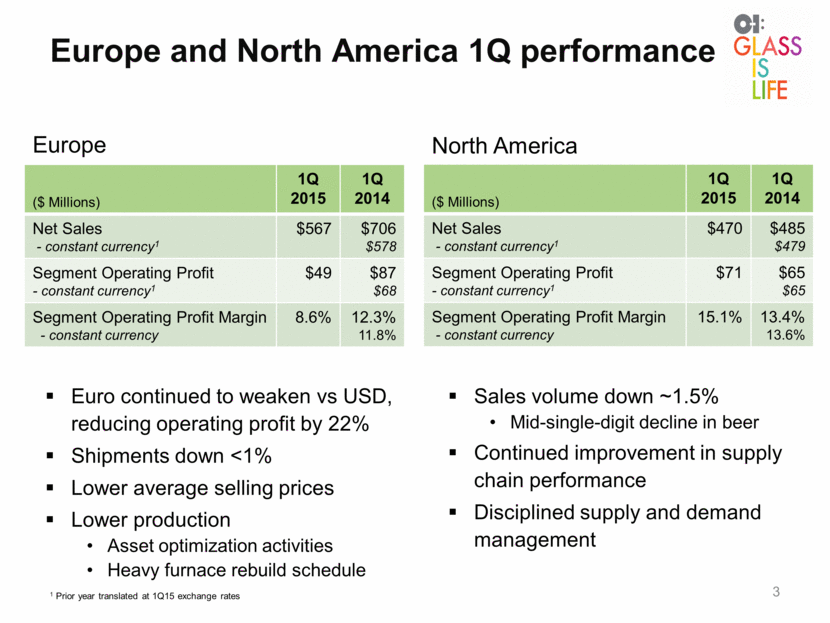
3 Euro continued to weaken vs USD, reducing operating profit by 22% Shipments down <1% Lower average selling prices Lower production Asset optimization activities Heavy furnace rebuild schedule North America Europe Sales volume down ~1.5% Mid-single-digit decline in beer Continued improvement in supply chain performance Disciplined supply and demand management 1 Prior year translated at 1Q15 exchange rates ($ Millions) 1Q 2015 1Q 2014 Net Sales - constant currency1 $567 $706 $578 Segment Operating Profit - constant currency1 $49 $87 $68 Segment Operating Profit Margin - constant currency 8.6% 12.3% 11.8% ($ Millions) 1Q 2015 1Q 2014 Net Sales - constant currency1 $470 $485 $479 Segment Operating Profit - constant currency1 $71 $65 $65 Segment Operating Profit Margin - constant currency 15.1% 13.4% 13.6% Europe and North America 1Q performance |
|
|
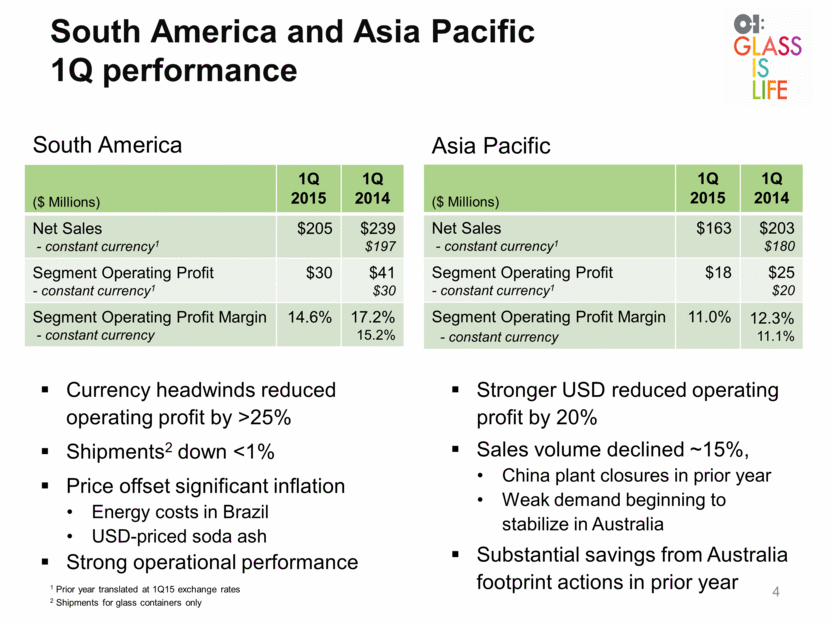
South America and Asia Pacific 1Q performance 4 Currency headwinds reduced operating profit by >25% Shipments2 down <1% Price offset significant inflation Energy costs in Brazil USD-priced soda ash Strong operational performance Asia Pacific South America Stronger USD reduced operating profit by 20% Sales volume declined ~15%, China plant closures in prior year Weak demand beginning to stabilize in Australia Substantial savings from Australia footprint actions in prior year 1 Prior year translated at 1Q15 exchange rates 2 Shipments for glass containers only ($ Millions) 1Q 2015 1Q 2014 Net Sales - constant currency1 $205 $239 $197 Segment Operating Profit - constant currency1 $30 $41 $30 Segment Operating Profit Margin - constant currency 14.6% 17.2% 15.2% ($ Millions) 1Q 2015 1Q 2014 Net Sales - constant currency1 $163 $203 $180 Segment Operating Profit - constant currency1 $18 $25 $20 Segment Operating Profit Margin - constant currency 11.0% 12.3% 11.1% |
|
|
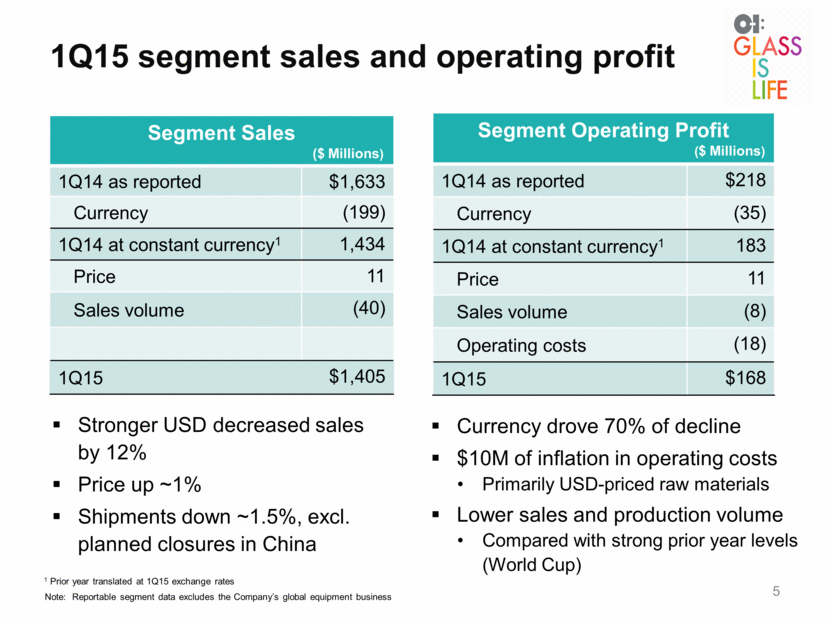
1Q15 segment sales and operating profit 5 Note: Reportable segment data excludes the Company’s global equipment business Stronger USD decreased sales by 12% Price up ~1% Shipments down ~1.5%, excl. planned closures in China Segment Sales ($ Millions) 1Q14 as reported $1,633 Currency (199) 1Q14 at constant currency1 1,434 Price 11 Sales volume (40) 1Q15 $1,405 Segment Operating Profit ($ Millions) 1Q14 as reported $218 Currency (35) 1Q14 at constant currency1 183 Price 11 Sales volume (8) Operating costs (18) 1Q15 $168 Currency drove 70% of decline $10M of inflation in operating costs Primarily USD-priced raw materials Lower sales and production volume Compared with strong prior year levels (World Cup) 1 Prior year translated at 1Q15 exchange rates |
|
|
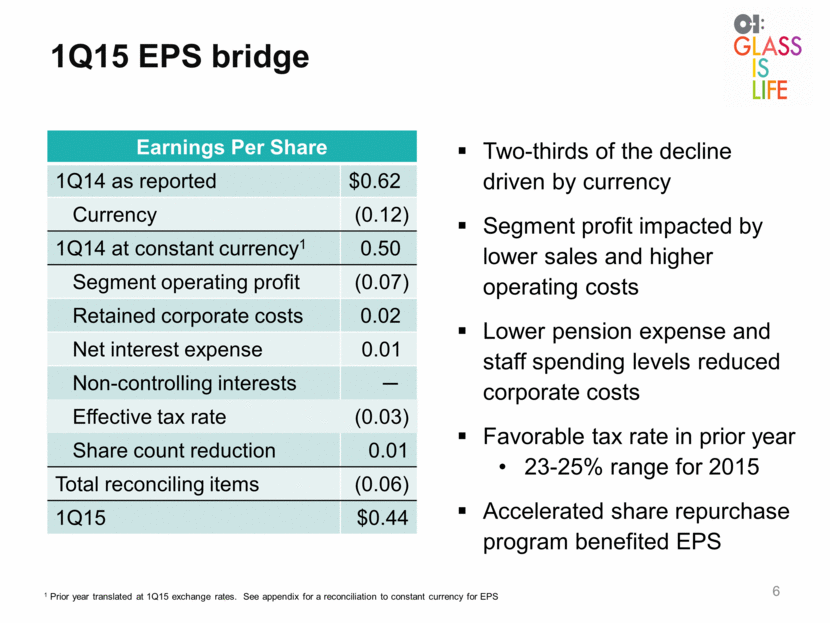
1Q15 EPS bridge 6 Earnings Per Share 1Q14 as reported $0.62 Currency (0.12) 1Q14 at constant currency1 0.50 Segment operating profit (0.07) Retained corporate costs 0.02 Net interest expense 0.01 Non-controlling interests - Effective tax rate (0.03) Share count reduction 0.01 Total reconciling items (0.06) 1Q15 $0.44 1 Prior year translated at 1Q15 exchange rates. See appendix for a reconciliation to constant currency for EPS Two-thirds of the decline driven by currency Segment profit impacted by lower sales and higher operating costs Lower pension expense and staff spending levels reduced corporate costs Favorable tax rate in prior year 23-25% range for 2015 Accelerated share repurchase program benefited EPS |
|
|
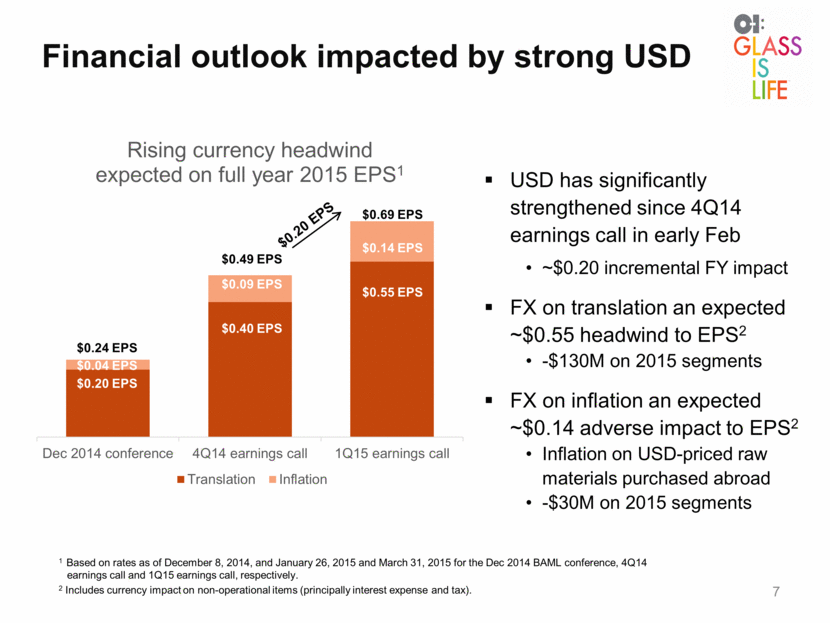
Financial outlook impacted by strong USD 7 1 Based on rates as of December 8, 2014, and January 26, 2015 and March 31, 2015 for the Dec 2014 BAML conference, 4Q14 earnings call and 1Q15 earnings call, respectively. 2 Includes currency impact on non-operational items (principally interest expense and tax). USD has significantly strengthened since 4Q14 earnings call in early Feb ~$0.20 incremental FY impact FX on translation an expected ~$0.55 headwind to EPS2 -$130M on 2015 segments FX on inflation an expected ~$0.14 adverse impact to EPS2 Inflation on USD-priced raw materials purchased abroad -$30M on 2015 segments $0.55 EPS $0.14 EPS $0.40 EPS $0.09 EPS $0.69 EPS $0.49 EPS $0.20 EPS $0.20 EPS $0.04 EPS $0.24 EPS Dec 2014 conference 4Q14 earnings call 1Q15 earnings call Rising currency headwind expected on full year 2015 EPS 1 Translation Inflation |
|
|
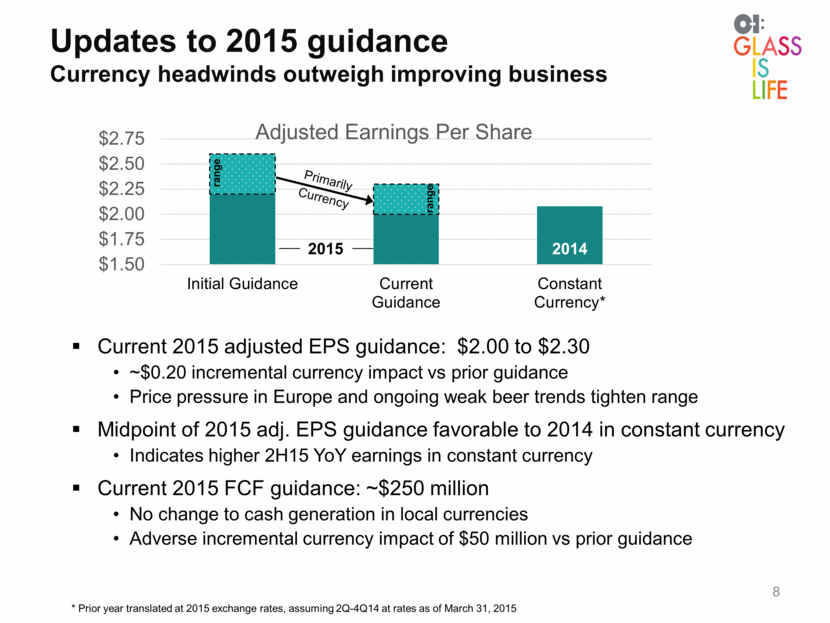
Current 2015 adjusted EPS guidance: $2.00 to $2.30 ~$0.20 incremental currency impact vs prior guidance Price pressure in Europe and ongoing weak beer trends tighten range Midpoint of 2015 adj. EPS guidance favorable to 2014 in constant currency Indicates higher 2H15 YoY earnings in constant currency Current 2015 FCF guidance: ~$250 million No change to cash generation in local currencies Adverse incremental currency impact of $50 million vs prior guidance Updates to 2015 guidance Currency headwinds outweigh improving business 8 2014 * Prior year translated at 2015 exchange rates, assuming 2Q-4Q14 at rates as of March 31, 2015 Primarily Currency range range 2015 $1.50 $1.75 $2.00 $2.25 $2.50 $2.75 Initial Guidance Current Guidance Constant Currency* Adjusted Earnings Per Share |
|
|
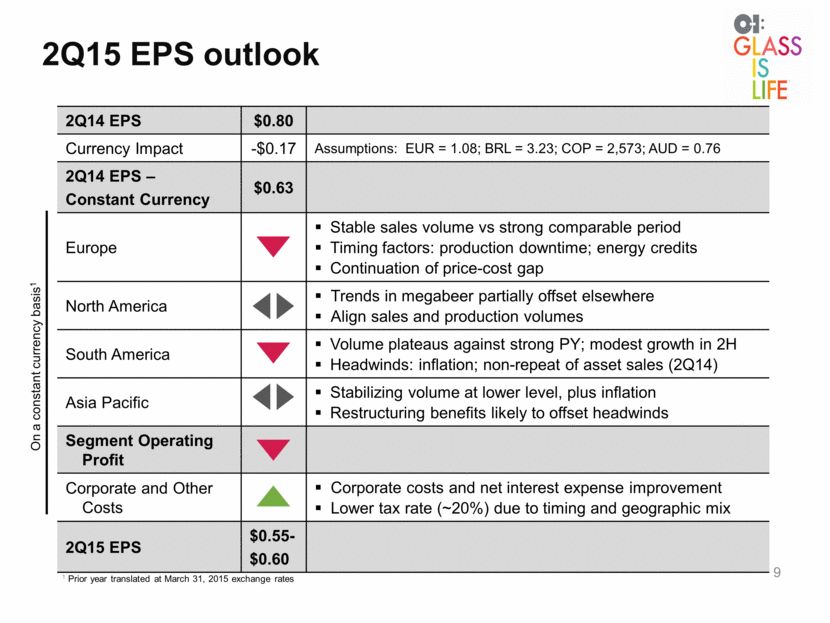
2Q15 EPS outlook 9 2Q14 EPS $0.80 Currency Impact -$0.17 Assumptions: EUR = 1.08; BRL = 3.23; COP = 2,573; AUD = 0.76 2Q14 EPS – Constant Currency $0.63 Europe Stable sales volume vs strong comparable period Timing factors: production downtime; energy credits Continuation of price-cost gap North America Trends in megabeer partially offset elsewhere Align sales and production volumes South America Volume plateaus against strong PY; modest growth in 2H Headwinds: inflation; non-repeat of asset sales (2Q14) Asia Pacific Stabilizing volume at lower level, plus inflation Restructuring benefits likely to offset headwinds Segment Operating Profit Corporate and Other Costs Corporate costs and net interest expense improvement Lower tax rate (~20%) due to timing and geographic mix 2Q15 EPS $0.55- $0.60 1 Prior year translated at March 31, 2015 exchange rates On a constant currency basis1 |
|
|
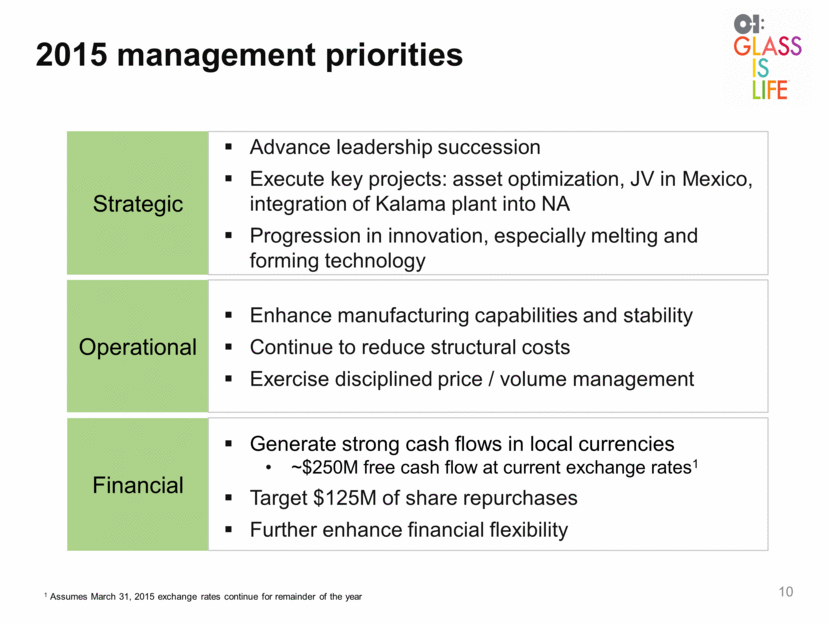
2015 management priorities Advance leadership succession Execute key projects: asset optimization, JV in Mexico, integration of Kalama plant into NA Progression in innovation, especially melting and forming technology Strategic Generate strong cash flows in local currencies ~$250M free cash flow at current exchange rates1 Target $125M of share repurchases Further enhance financial flexibility Financial Enhance manufacturing capabilities and stability Continue to reduce structural costs Exercise disciplined price / volume management Operational 10 1 Assumes March 31, 2015 exchange rates continue for remainder of the year |
|
|
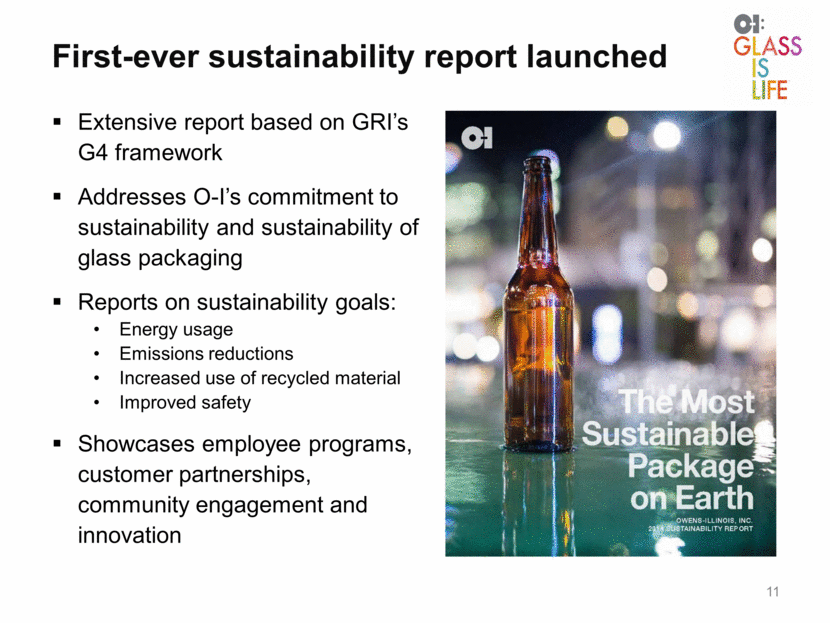
First-ever sustainability report launched OWENS-ILLINOIS, INC. 2014 Sustainability Report The Most 11 Extensive report based on GRI’s G4 framework Addresses O-I’s commitment to sustainability and sustainability of glass packaging Reports on sustainability goals: Energy usage Emissions reductions Increased use of recycled material Improved safety Showcases employee programs, customer partnerships, community engagement and innovation |
|
|
Appendix 12 |
|
|
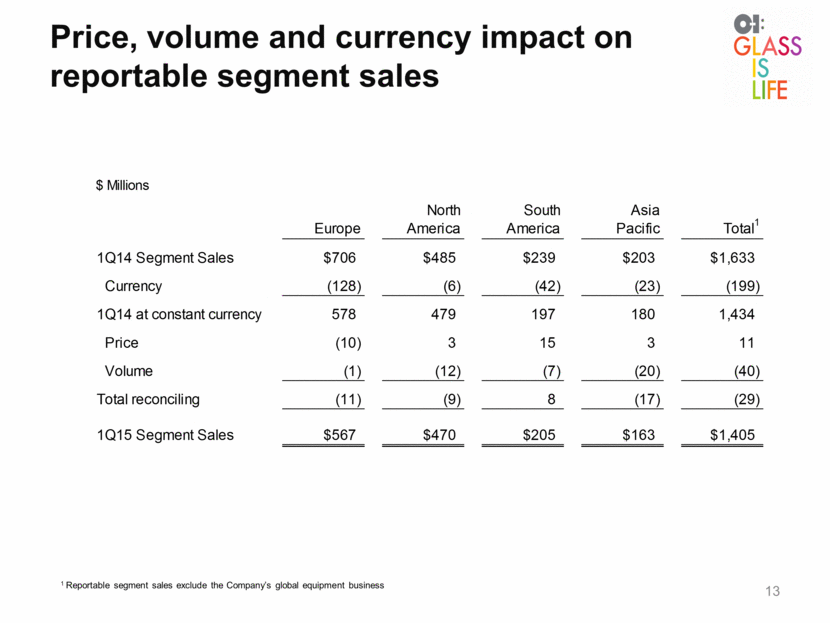
Price, volume and currency impact on reportable segment sales 13 1 Reportable segment sales exclude the Company’s global equipment business (128) (6) (42) (23) |
|
|
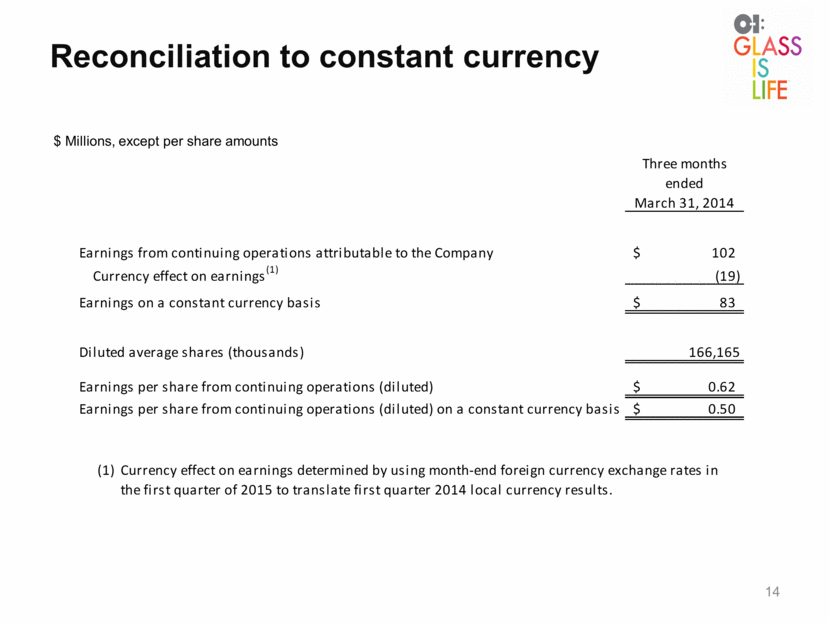
Reconciliation to constant currency 14 $ Millions, except per share amounts Three months ended March 31, 2014 102 $ (19) Earnings on a constant currency basis 83 $ 166,165 Earnings per share from continuing operations (diluted) 0.62 $ Earnings per share from continuing operations (diluted) on a constant currency basis 0.50 $ (1) Currency effect on earnings determined by using month-end foreign currency exchange rates in the first quarter of 2015 to translate first quarter 2014 local currency results. Diluted average shares (thousands) Currency effect on earnings (1) Earnings from continuing operations attributable to the Company |
|
|
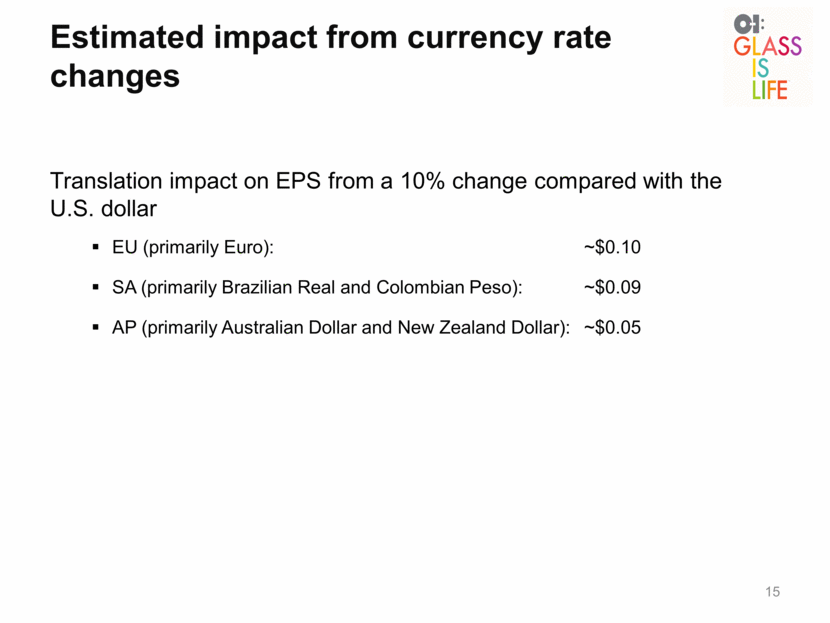
Estimated impact from currency rate changes 15 Translation impact on EPS from a 10% change compared with the U.S. dollar EU (primarily Euro): ~$0.10 SA (primarily Brazilian Real and Colombian Peso): ~$0.09 AP (primarily Australian Dollar and New Zealand Dollar): ~$0.05 |

