Attached files
| file | filename |
|---|---|
| 8-K - 8-K - COMERICA INC /NEW/ | a2015annualmeetingpresenta.htm |
| EX-99.2 - EXHIBIT 99.2 - COMERICA INC /NEW/ | ex99204282015.htm |

Comerica Incorporated Annual Meeting of Shareholders April 28, 2015Comerica Bank TowerDallas, TX Call to Order 2

Quorum 3 Proposal IElection of Directors 4

Proposal IIRatification of the Appointmentof Independent Auditors 5 Proposal IIIApproval of the 2015 Comerica Incorporated Incentive Plan for Non-Employee Directors 6

Proposal IVApproval of a Non-Binding, Advisory Proposal Approval Executive Compensation 7 A Motion to Vote 8

Polls Open for Voting 9 Polls Closed 10

Voting Results 11 Adjournment 12

Chairman and Chief Executive Officer’s Presentation 13 Safe Harbor Statement Any statements in this presentation that are not historical facts are forward-looking statements as defined in the Private Securities LitigationReform Act of 1995. Words such as “anticipates,” “believes,” “contemplates,” “feels,” “expects,” “estimates,” “seeks,” “strives,” “plans,” “intends,”“outlook,” “forecast,” “position,” “target,” “mission,” “assume,” “achievable,” “potential,” “strategy,” “goal,” “aspiration,” “opportunity,” “initiative,”“outcome,” “continue,” “remain,” “maintain,” “on course,” “trend,” “objective,” “looks forward,” “projects,” “models” and variations of such words andsimilar expressions, or future or conditional verbs such as “will,” “would,” “should,” “could,” “might,” “can,” “may” or similar expressions, as theyrelate to Comerica or its management, are intended to identify forward-looking statements. These forward-looking statements are predicated onthe beliefs and assumptions of Comerica's management based on information known to Comerica's management as of the date of thispresentation and do not purport to speak as of any other date. Forward-looking statements may include descriptions of plans and objectives ofComerica's management for future or past operations, products or services, and forecasts of Comerica's revenue, earnings or other measures ofeconomic performance, including statements of profitability, business segments and subsidiaries, estimates of credit trends and global stability.Such statements reflect the view of Comerica's management as of this date with respect to future events and are subject to risks anduncertainties. Should one or more of these risks materialize or should underlying beliefs or assumptions prove incorrect, Comerica's actual resultscould differ materially from those discussed. Factors that could cause or contribute to such differences are changes in general economic, politicalor industry conditions; changes in monetary and fiscal policies, including changes in interest rates; changes in regulation or oversight; Comerica'sability to maintain adequate sources of funding and liquidity; the effects of more stringent capital or liquidity requirements; declines or otherchanges in the businesses or industries of Comerica's customers, including the energy industry; operational difficulties, failure of technologyinfrastructure or information security incidents; reliance on other companies to provide certain key components of business infrastructure; factorsimpacting noninterest expenses which are beyond Comerica's control; changes in the financial markets, including fluctuations in interest rates andtheir impact on deposit pricing; changes in Comerica's credit rating; unfavorable developments concerning credit quality; the interdependence offinancial service companies; the implementation of Comerica's strategies and business initiatives; Comerica's ability to utilize technology toefficiently and effectively develop, market and deliver new products and services; competitive product and pricing pressures among financialinstitutions within Comerica's markets; changes in customer behavior; any future strategic acquisitions or divestitures; management's ability tomaintain and expand customer relationships; management's ability to retain key officers and employees; the impact of legal and regulatoryproceedings or determinations; the effectiveness of methods of reducing risk exposures; the effects of terrorist activities and other hostilities; theeffects of catastrophic events including, but not limited to, hurricanes, tornadoes, earthquakes, fires, droughts and floods; changes in accountingstandards and the critical nature of Comerica's accounting policies. Comerica cautions that the foregoing list of factors is not exclusive. Fordiscussion of factors that may cause actual results to differ from expectations, please refer to our filings with the Securities and ExchangeCommission. In particular, please refer to “Item 1A. Risk Factors” beginning on page 12 of Comerica's Annual Report on Form 10-K for the yearended December 31, 2014. Forward-looking statements speak only as of the date they are made. Comerica does not undertake to updateforward-looking statements to reflect facts, circumstances, assumptions or events that occur after the date the forward-looking statements aremade. For any forward-looking statements made in this presentation or in any documents, Comerica claims the protection of the safe harbor forforward-looking statements contained in the Private Securities Litigation Reform Act of 1995. 14

15 At the Heart of the Comerica Promise are our Core Values 16 ► Customer-centricity► Collaboration► Integrity► Excellence► Agility► Diversity► Involvement

2014 Financial Accomplishments At 12/31/14 ● 1Reflecting decreases of $48MM in litigation-related expenses and $47MM in pension expense. ● 2Through dividends and share repurchase program. Grew the Bottom Line Shareholder Return Controlling What We Can Control Focus on Relationships • 11% increase in EPS to $3.16• 10% increase in net income to $593MM • 5%, or $2.2B, increase in average loans to $46.6B• 6%, or $3.1B, increase in average deposits to $54.8B• $5MM increase in customer-driven fee income • 6%, or $96MM, decrease in noninterest expenses1• 5 bps of NCOs - Credit quality continued to be strong • 66% of net income, or $392MM, returned to shareholders2• 6% increase in tangible book value per share to $37.72 • Capital position continued to be solid 17 2014 Business Line Accomplishments 18 • Trusted Advisor program rollout to business bankers• New integrated solutions in Treasury Management• Agreement with Vantiv, Inc. for merchant services • Enhancements to Mobile Banking services• Rollout of the ‘banking center of the future’ concept• Introduction of Small Business Resource Center • Business Owner Advisory Services Group success• Professional Trust Alliance as source of fiduciary income Business Bank Wealth ManagementRetail Bank

TexasLargest U.S. Commercial Bank Headquartered in Texas At 3/31/15 Established presence: 1988 Acquired 21 banks in Texas from 1988 to 1995 and completed the acquisition of Sterling in July 2011 Moved headquarters to Dallas: 2007 Today, 135 banking centers in major metropolitan areas 7.7 9.6 10.0 11.0 2011 2012 2013 2014 7.8 10.0 10.2 10.8 2011 2012 2013 2014 Average Loans($ in billions) Average Deposits($ in billions) +42% +38 19 +10% +5% CaliforniaConsiderable Opportunities in Growth Industries At 3/31/15 11.8 12.7 14.0 15.4 2011 2012 2013 2014 12.7 14.6 14.7 16.1 2011 2012 2013 2014 Average Loans($ in billions) Average Deposits($ in billions) Established presence: 1991 Acquired 10 banks from 1991 to 2001 Today, 104 banking centers in major metropolitan areas +30% +27% 20 +10% +10%

MichiganMaintaining Leadership Position At 3/31/15 ● 1Source: FDIC June 2014 Established presence: 1849 #2 deposit market share in Michigan1 214 banking centers in major metropolitan areas 13.9 13.6 13.5 13.3 2011 2012 2013 2014 18.5 19.6 20.3 21.0 2011 2012 2013 2014 Average Loans($ in billions) Average Deposits($ in billions) -4% +13% 21 -1% +3% 19% 21% 23% 24% 28% 58% 53% 42%47% 79% 76% 66% 2011 2012 2013 2014 Dividends Share Repurchases Active Capital Management 1Outlook as of 4/17/15 ● 2See Supplemental Financial Data slides for a reconciliation of non-GAAP financial measures ●3Shares repurchased under equity repurchase program Shareholder Payout3($ in millions)2014 Capital Plan Completed: $236MM or 5MM shares repurchased 2Q14 through 1Q15 • $59MM or 1.4MM shares repurchased in 1Q Increased quarterly dividend to $0.20 per share in 2Q14 2015 Capital Plan Target1: Up to $393MM share repurchases over five quarters (2Q15 through 2Q16) Board to consider dividend increase to $0.21 at April 28th meeting Dividends Per Share Growth 0.40 0.55 0.68 0.79 2011 2012 2013 2014 +98% 3 $31.40 $33.36 $35.64 $37.72 2011 2012 2013 2014 Tangible Book Value Per Share2 22

Strong Commitment to Community 23 $8.5 Millioncontributed to not-for-profitorganizations in 2014 73,000+ Hoursvolunteered by employeesin 2014 Leader in Sustainability 24 516,825 Poundsof sensitive paper documents were securely destroyedand recycled at Texas Shred Day events in 2014

DiversityContinue to receivenational recognition 25

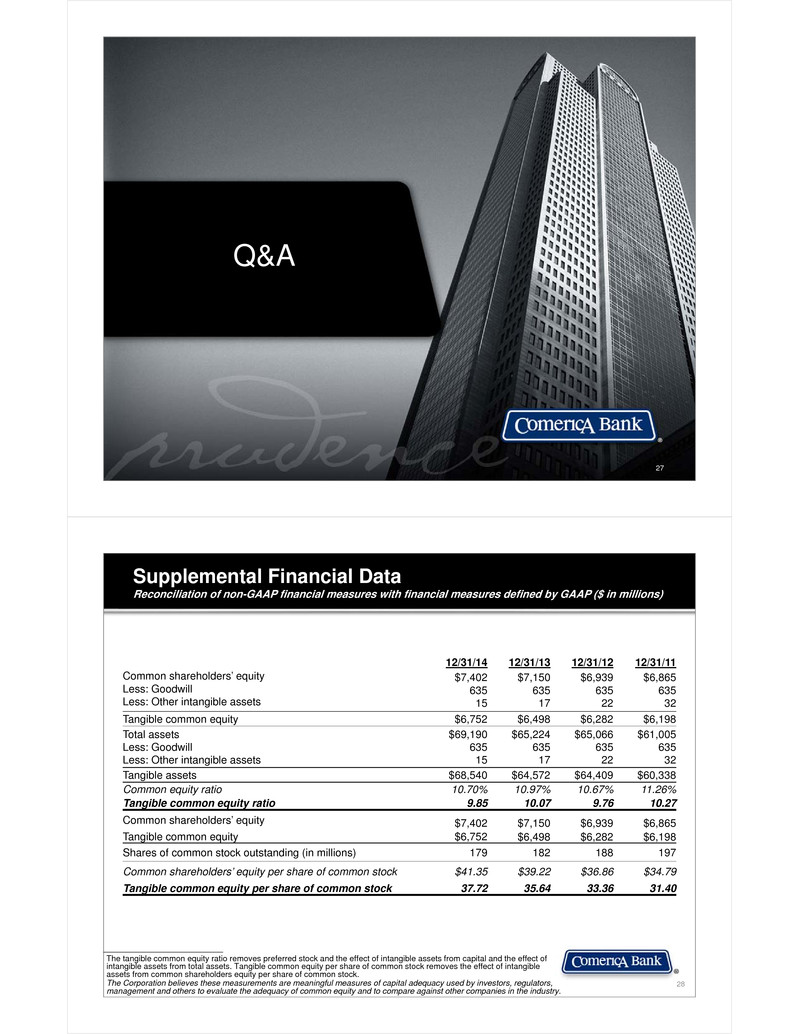
Q&A 27 Supplemental Financial DataReconciliation of non-GAAP financial measures with financial measures defined by GAAP ($ in millions) The tangible common equity ratio removes preferred stock and the effect of intangible assets from capital and the effect of intangible assets from total assets. Tangible common equity per share of common stock removes the effect of intangible assets from common shareholders equity per share of common stock.The Corporation believes these measurements are meaningful measures of capital adequacy used by investors, regulators, management and others to evaluate the adequacy of common equity and to compare against other companies in the industry. 28 12/31/14 12/31/13 12/31/12 12/31/11Common shareholders’ equityLess: GoodwillLess: Other intangible assets $7,40263515 $7,15063517 $6,93963522 $6,86563532Tangible common equity $6,752 $6,498 $6,282 $6,198Total assetsLess: GoodwillLess: Other intangible assets $69,19063515 $65,22463517 $65,06663522 $61,00563532Tangible assets $68,540 $64,572 $64,409 $60,338Common equity ratio 10.70% 10.97% 10.67% 11.26%Tangible common equity ratio 9.85 10.07 9.76 10.27 Common shareholders’ equity $7,402 $7,150 $6,939 $6,865Tangible common equity $6,752 $6,498 $6,282 $6,198Shares of common stock outstanding (in millions) 179 182 188 197 Common shareholders’ equity per share of common stock $41.35 $39.22 $36.86 $34.79Tangible common equity per share of common stock 37.72 35.64 33.36 31.40
