Attached files
| file | filename |
|---|---|
| 8-K - 8-K - Ally Financial Inc. | v408435_8k.htm |
| EX-99.1 - PRESS RELEASE - Ally Financial Inc. | v408435_ex99-1.htm |
| EX-99.3 - SUPPLEMENTAL FINANCIAL DATA - Ally Financial Inc. | v408435_ex99-3.htm |
Exhibit 99.2

Ally Financial Inc. 1 Q 2015 Earnings Review Contact Ally Investor Relations at (866) 710 - 4623 or investor.relations@ally.com April 28, 2015

2 1Q 2015 Preliminary Results Forward - Looking Statements and Additional Information The following should be read in conjunction with the financial statements, notes and other information contained in the Compa ny’ s Annual Reports on Form 10 - K, Quarterly Reports on Form 10 - Q, and Current Reports on Form 8 - K . This information is preliminary and based on company data available at the time of the presentation In the presentation that follows and related comments by Ally Financial Inc. (“Ally”) management, the use of the words “expec t,” “anticipate,” “estimate,” “forecast,” “initiative,” “objective,” “plan,” “goal,” “project,” “outlook,” “priorities,” “target,” “explore,” “ pos itions,” “intend,” “evaluate,” “pursue,” “seek,” “may,” “would, ” “could, ” “should, ” “believe, ” “potential, ” “continue,” or the negative of these words, or similar expressions is intended to identify forward - looking statements. All statements herein and in related management comments, other than statements of historical fact, including without limitation, statements about future events and financial performance, are forward - looking statements tha t involve certain risks and uncertainties. While these statements represent our current judgment on what the future may hold, and we believe th ese judgments are reasonable, these statements are not guarantees of any events or financial results, and Ally’s actual results may differ mate ria lly due to numerous important factors that are described in the most recent reports on SEC Forms 10 - K and 10 - Q for Ally, each of which may be revise d or supplemented in subsequent reports filed with the SEC. Such factors include, among others, the following: maintaining the mut ual ly beneficial relationship between Ally and General Motors, and Ally and Chrysler and our ability to further diversify our business; our ability to maintain relationships with automotive dealers; the significant regulation and restrictions that we are subject to as a bank holding company and financial holding company; the potential for deterioration in the residual value of off - lease vehicles; disruptions in the market in which we fund our operations, with resulting negative impact on our liquidity; changes in our accounting assumptions that may require or that r esu lt from changes in the accounting rules or their application, which could result in an impact on earnings; changes in our credit ratings; changes in economic conditions, currency exchange rates or political stability in the markets in which we operate; and changes in the existing or th e adoption of new laws, regulations, policies or other activities of governments, agencies and similar organizations (including as a result of the Dodd - Frank Act and Basel III). Investors are cautioned not to place undue reliance on forward - looking statements. Ally undertakes no obligation to update publi cly or otherwise revise any forward - looking statements, whether as a result of new information, future events or other such factors that affect t he subject of these statements, except where expressly required by law. Reconciliation of non - GAAP financial measures included within this presentat ion are provided in this presentation. Use of the term “loans” describes products associated with direct and indirect lending activities of Ally’s operations. The s pec ific products include retail installment sales contracts, lines of credit, leases or other financing products. The term “originate” refers to Ally’ s p urchase, acquisition or direct origination of various “loan” products.

3 1Q 2015 Preliminary Results Key Messages Building a better financial services company Diversifying our leading auto finance business Expanding franchise to drive long - term growth Improving shareholder returns
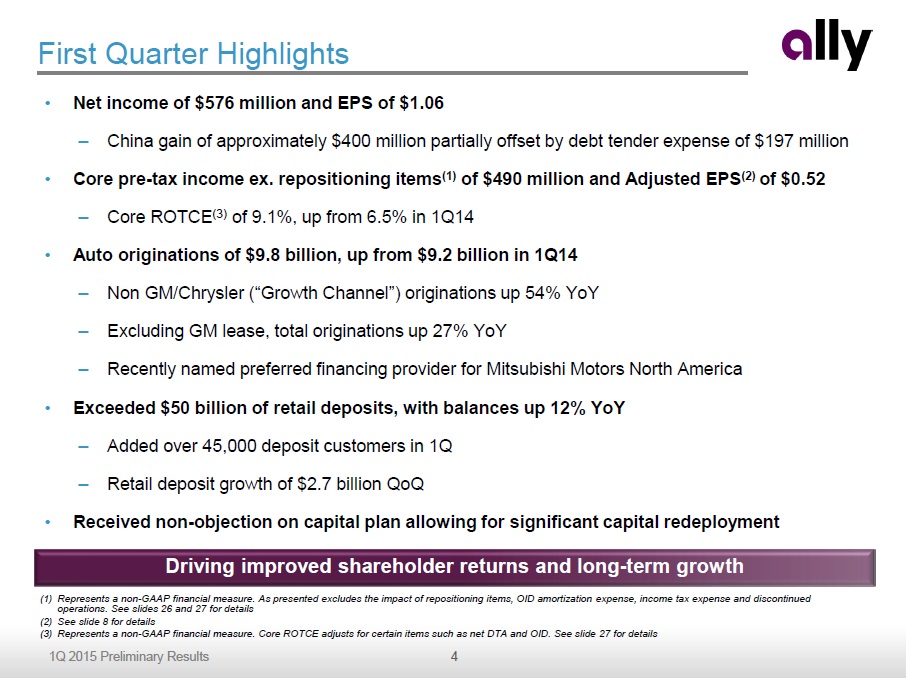
4 1Q 2015 Preliminary Results First Quarter Highlights • Net income of $576 million and EPS of $1.06 – China gain of approximately $400 million partially offset by debt tender expense of $ 197 million • Core pre - tax income ex. repositioning items (1) of $490 million and Adjusted EPS (2) of $0.52 – Core ROTCE (3) of 9.1%, up from 6.5% in 1Q14 • Auto originations of $9.8 billion, up from $9.2 billion in 1Q14 – Non GM/Chrysler (“Growth Channel”) originations up 54% YoY – Excluding GM lease, total originations up 27% YoY – Recently named preferred financing provider for Mitsubishi Motors North America • Exceeded $50 billion of retail deposits, with balances up 12% YoY – Added over 45,000 deposit customers in 1Q – Retail deposit growth of $2.7 billion QoQ • Received non - objection on capital plan allowing for significant capital redeployment (1) Represents a non - GAAP financial measure. As presented excludes the impact of repositioning items, OID amortization expense, income tax expense and discontinued operations. See slides 26 and 27 for details (2) See slide 8 for details (3) Represents a non - GAAP financial measure. Core ROTCE adjusts for certain items such as net DTA and OID. See slide 27 for details Driving improved shareholder returns and long - term growth
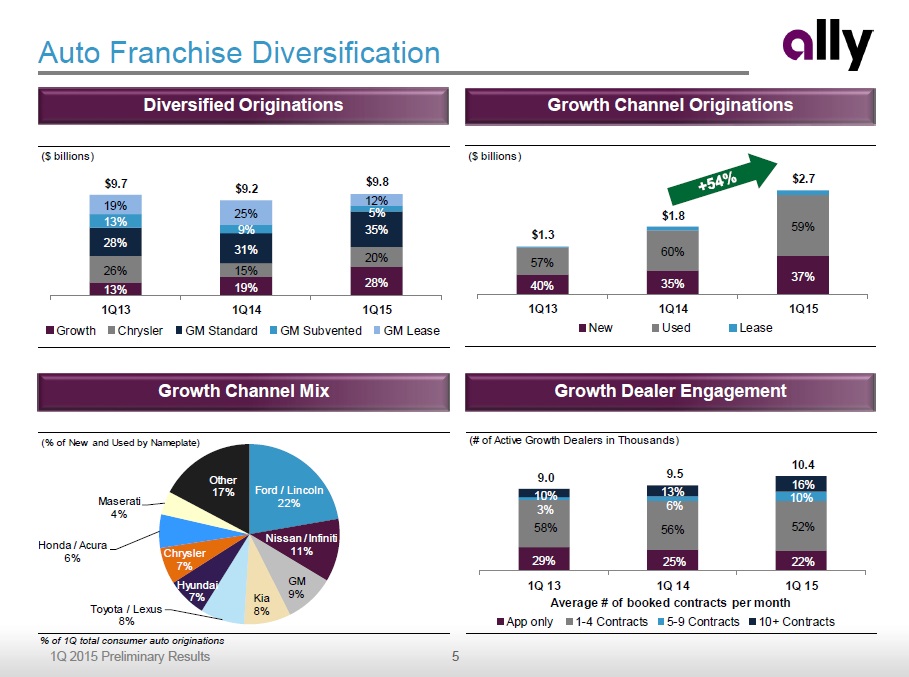
5 1Q 2015 Preliminary Results ($ billions) 57% 60% 59% $1.3 $1.8 $2.7 40% 35% 37% 1Q13 1Q14 1Q15 New Used Lease Auto Franchise Diversification Diversified Originations Growth Channel Originations Growth Dealer Engagement Growth Channel Mix (# of Active Growth Dealers in Thousands) 29% 25% 22% 58% 56% 52% 3% 6% 10% 10% 13% 16% 9.0 9.5 10.4 1Q 13 1Q 14 1Q 15 Average # of booked contracts per month App only 1-4 Contracts 5-9 Contracts 10+ Contracts ($ billions) 13% 19% 28% 26% 15% 20% 28% 31% 35% 13% 9% 5% 19% 25% 12% $9.7 $9.2 $9.8 1Q13 1Q14 1Q15 Growth Chrysler GM Standard GM Subvented GM Lease (% of New and Used by Nameplate) Ford / Lincoln 22% Nissan / Infiniti 11% GM 9% Kia 8% Toyota / Lexus 8% Hyundai 7% Chrysler 7% Honda / Acura 6% Maserati 4% Other 17% % of 1Q total consumer auto originations

6 1Q 2015 Preliminary Results Growing Customer Base Dealer Relationships Decisioned Applications Retail Deposit Customers Retail Auto Customers (thousands) 691 825 954 1Q13 1Q14 1Q15 (millions) 4.2 4.3 4.4 1Q13 1Q14 1Q15 (millions) 1.9 2.1 2.5 1Q13 1Q14 1Q15 (thousands) 9.0 9.5 10.4 6.8 6.7 6.7 15.8 16.2 17.1 1Q13 1Q14 1Q15 Growth Dealers GM / Chrysler

7 1Q 2015 Preliminary Results Vision for Franchise Expansion (1) Named “Best Online Bank” four years in a row by Money® magazine Leading Brand – “Best Online Bank” (1) P Scalable Nationwide Platform and Technology P Growing and Attractive Customer Base P Nimble and Flexible – No Branch Overhead P Culture of Innovation and Superior Customer Experience P Build on Strong Foundation Develop Smart Products and Services Well Positioned for Future of Banking

8 1Q 2015 Preliminary Results ($ millions except per share data) 1Q 15 4Q 14 1Q 14 4Q 14 1Q 14 Net financing revenue (1) 860$ 835$ 865$ 26$ (4)$ Total other revenue (1)(2) 440 370 321 71 119 Provision for loan losses 116 155 137 (39) (21) Controllable expenses (2) 469 478 487 (8) (18) Other noninterest expenses (2) 226 176 223 50 3 Core pre-tax income, ex. repositioning (3) 490$ 396$ 339$ 93$ 151$ Net income 576$ 177$ 227$ 399$ 349$ GAAP EPS (diluted) 1.06$ 0.23$ 0.33$ 0.83$ 0.72$ Discontinued operations, net of tax (0.82) (0.05) (0.06) (0.77) (0.76) OID expense, net of tax 0.02 0.06 0.06 (0.03) (0.04) One time items / repositioning (4) 0.26 0.17 0.00 0.09 0.26 Adjusted EPS 0.52$ 0.40$ 0.34$ 0.12$ 0.18$ ROTCE (5) 14.2% 3.1% 4.9% Core ROTCE (5) 9.1% 7.1% 6.5% Adjusted Efficiency Ratio (5) 48% 50% 55% Tier 1 Common Ratio (6) 10.5% 9.6% 9.1% Increase/(Decrease) vs. First Quarter Financial Results (1) Excludes OID. Total other revenue excludes accelerated OID expense of $7 million in 1Q15 and $6 million in 4Q14 associated w ith debt redemption (2) Excludes repositioning expenses. See slides 26 and 27 for details (3) As presented excludes the impact of repositioning items, OID amortization expense, income tax expense and discontinued operation s. See slides 26 and 27 for details (4) Repositioning items are primarily related to the extinguishment of high - cost legacy debt in 1Q15 and 4Q14. Also includes a one - time discrete tax item in 4Q14. See slide 27 for additional details (5) Represents a non - GAAP financial measure. See slide 27 for details (6) Tier 1 Common is a non - GAAP financial measure. See page 16 of the Financial Supplement for details
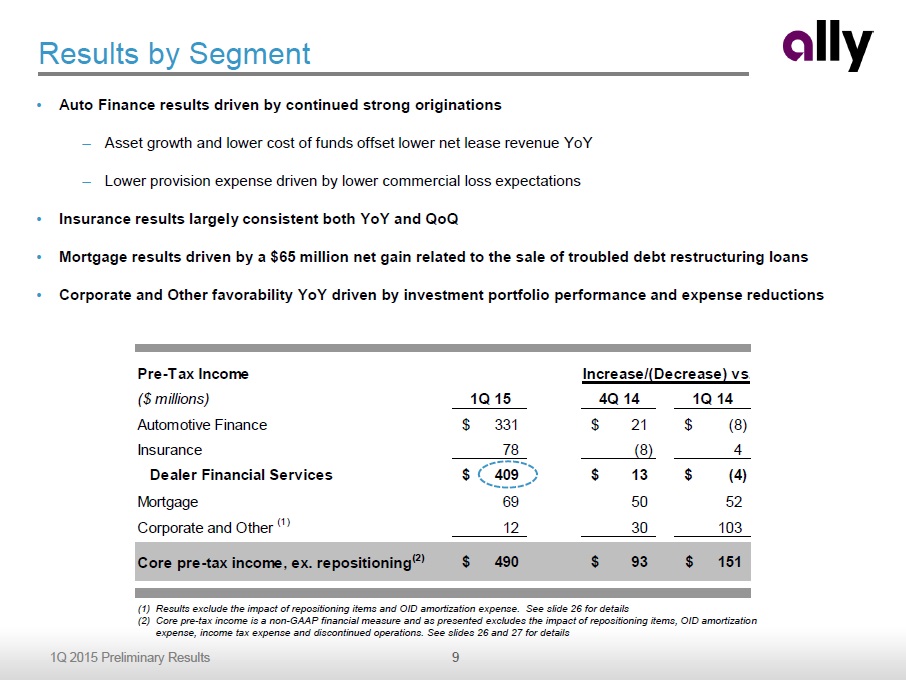
9 1Q 2015 Preliminary Results Pre-Tax Income ($ millions) 1Q 15 4Q 14 1Q 14 Automotive Finance 331$ 21$ (8)$ Insurance 78 (8) 4 Dealer Financial Services 409$ 13$ (4)$ Mortgage 69 50 52 Corporate and Other (1) 12 30 103 Core pre-tax income, ex. repositioning (2) 490$ 93$ 151$ Increase/(Decrease) vs. Results by Segment (1) Results exclude the impact of repositioning items and OID amortization expense. See slide 26 for details (2) Core pre - tax income is a non - GAAP financial measure and as presented excludes the impact of repositioning items, OID amortizatio n expense, income tax expense and discontinued operations. See slides 26 and 27 for details • Auto Finance results driven by continued strong originations – Asset growth and lower cost of funds offset lower net lease revenue YoY – Lower provision expense driven by lower commercial loss expectations • Insurance results largely consistent both YoY and QoQ • Mortgage results driven by a $65 million net gain related to the sale of troubled debt restructuring loans • Corporate and Other favorability YoY driven by investment portfolio performance and expense reductions

10 1Q 2015 Preliminary Results Net Interest Margin • Net Interest Margin (1) up 12 bps QoQ driven by lower cost of funds and higher asset yields – Cost of funds (1) down 21 bps YoY and 5 bps QoQ driven by continued reduction of legacy high - cost debt and deposit growth – YoY NIM decline of 6 bps driven primarily by lower lease yields Note: Continuing operations only (1) Excludes OID Ally Financial - Net Interest Margin $138 $141 $141 4.49% 4.15% 4.21% 2.53% 2.35% 2.47% 2.06% 1.90% 1.85% 1Q 14 2Q 14 3Q 14 4Q 14 1Q 15 Average Earning Assets ($B) Earning Asset Yield NIM (ex. OID) Cost of Funds (ex. OID)
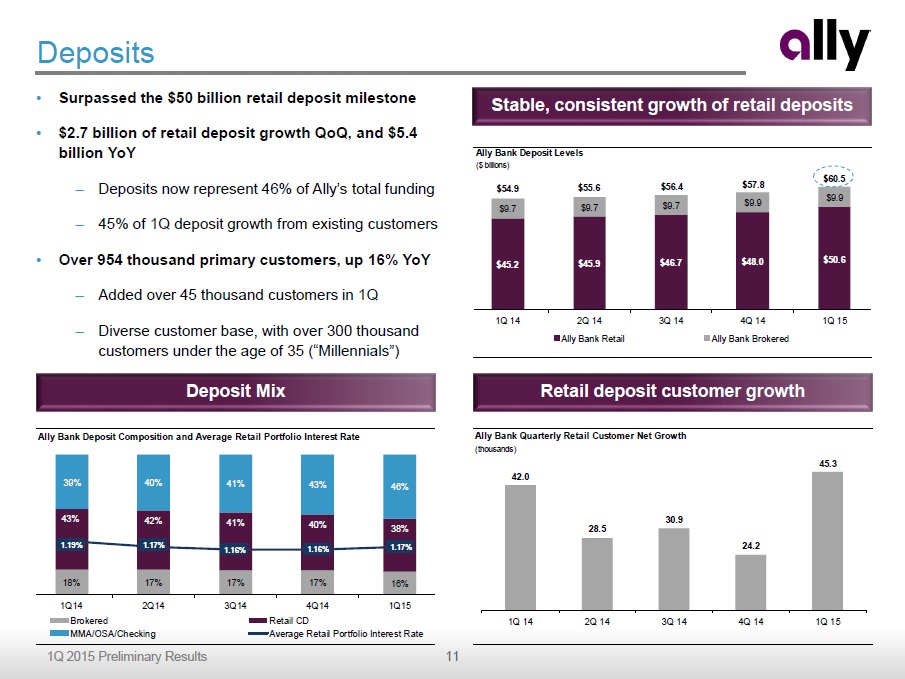
11 1Q 2015 Preliminary Results Ally Bank Deposit Levels ($ billions) $45.2 $45.9 $46.7 $48.0 $50.6 $9.7 $9.7 $9.7 $9.9 $9.9 $54.9 $55.6 $56.4 $57.8 $60.5 1Q 14 2Q 14 3Q 14 4Q 14 1Q 15 Ally Bank Retail Ally Bank Brokered Deposits • S urpassed the $50 billion retail deposit milestone • $2.7 billion of retail deposit growth QoQ , and $5.4 billion YoY – Deposits now represent 46% of Ally’s total funding – 45% of 1Q deposit growth from existing customers • Over 954 thousand primary customers, up 16% YoY – Added over 45 thousand customers in 1Q – Diverse customer base, with over 300 thousand customers under the age of 35 (“Millennials”) Stable, consistent growth of retail deposits Deposit Mix Retail deposit customer growth Ally Bank Deposit Composition and Average Retail Portfolio Interest Rate 18% 17% 17% 17% 16% 43% 42% 41% 40% 38% 39% 40% 41% 43% 46% 1.19% 1.17% 1.16% 1.16% 1.17% 1Q14 2Q14 3Q14 4Q14 1Q15 Brokered Retail CD MMA/OSA/Checking Average Retail Portfolio Interest Rate Ally Bank Quarterly Retail Customer Net Growth (thousands) 42.0 28.5 30.9 24.2 45.3 1Q 14 2Q 14 3Q 14 4Q 14 1Q 15

12 1Q 2015 Preliminary Results Capital • Tier 1 Common capital improved both YoY and QoQ , driven primarily by the closing of the China transaction, continued growth in net income available to common and Deferred Tax Asset (DTA) utilization – Preliminary fully phased - in Basel III Common Equity Tier 1 (CET1) ratio of 10.4% • Received a non - objection on capital plan from the Federal Reserve – $1.3 billion of Series G redeemed in April Ally's preliminary Basel III Common Equity Tier 1 ratio, reflective of transition provisions, is 10.9% (primarily driven by phase - in of DTA treatment ). Tier 1 Common and Common Equity Tier 1 are non - GAAP financial measures. See page 16 of the Financial Supplement for details Pro forma for $1.3 billion Series G redemption Ally Financial Capital $128 $129 $128 $131 $129 $131 13.0% 13.2% 13.5% 13.2% 14.3% 14.0% 12.1% 12.3% 12.7% 12.5% 13.5% 13.0% 9.1% 9.4% 9.7% 9.6% 10.5% 10.4% 9.6% 9.5% 1Q 14 2Q 14 3Q 14 4Q 14 1Q 15 Basel I 1Q 15 Basel III (Fully Phased-In) Risk-Weighted Assets ($B) Total Capital Ratio Tier 1 Ratio Tier 1 Common / CET1 Ratio

13 1Q 2015 Preliminary Results Capital Management • C apital structure normalization is underway through the reduction of high - cost preferred securities • Once complete, Ally expects to redeploy excess capital to further drive shareholder value: – Growth initiatives – focused on prudent and efficient allocation of capital – Dividends and share buybacks • Capital expected to be generated through retained earnings as well as through reduction in disallowed DTA • Ally’s 2015 capital plan resulted in a minimum stressed Tier 1 Common capital ratio of 7.1% in the Federal Reserve’s severely adverse scenario – Provides for reduction of $2.8 billion of high - cost capital securities (1) Recently announced tender offer for up to $325 million of Series A (2) Approved capital plan includes an additional $0.2 billion of common capital reduction from the repurchase of high - cost unsecured debt and/or preferred securities ($ billions) Outstanding as of 3/31/15 Approved Action Impact to Tier 1 Common Timing Series G $2.6 ($1.3) ($1.2) April 2015 Series A $1.0 ($1.0) - By 2Q16 (1) Trust Preferred Securities $2.7 ($0.5) - 1Q16 Additional Capital Utilization (2) - - ($0.2) By 2Q16 Capital Redeployment Actions

14 1Q 2015 Preliminary Results $B Per Share $B Per Share GAAP Shareholder's Equity 15.9$ 33.1$ 14.5$ 30.1$ Preferred Equity and Goodwill (1.3) (2.7) (1.3) (2.7) Tangible Common Equity 14.7$ 30.4$ 13.2$ 27.5$ Tax-Effected Bond OID (1) (0.9) (1.8) (1.0) (2.0) Series G Discount (2.3) (4.9) (2.3) (4.9) Adjusted Tangible Book Value 11.4$ 23.7$ 9.9$ 20.5$ Adjusted Tangible Book Value 1Q15 1Q14 Tangible Book Value • Analysts and investors have made various adjustments to Ally’s tangible book value • Tangible book value increased by $3 per share YoY (1) Assumes 34% tax rate

15 1Q 2015 Preliminary Results $2 $0 $1 $0 ($0) ($1) 0.03% 0.00% 0.01% 0.00% 0.00% - 0.01% 4Q 13 1Q 14 2Q 14 3Q 14 4Q 14 1Q 15 Net Charge-Offs ($M) Annualized NCO Rate $114 $121 $83 $137 $160 $132 0.80% 0.85% 0.58% 0.93% 1.10% 0.93% 4Q 13 1Q 14 2Q 14 3Q 14 4Q 14 1Q 15 Net Charge-Offs ($M) Annualized NCO Rate 234% 224% 344% 187% 144% 155% 0.53% 0.53% 0.34% 0.60% 0.68% 0.61% 4Q 13 1Q 14 2Q 14 3Q 14 4Q 14 1Q 15 ALLL as % of Annualized NCOs Annualized NCO Rate $977 $1,113 $1,171 $1,192 $1,208 $ 933 ALLL Balance ($M) (30+ DPD) $1,325 $904 $1,174 $1,338 $1,543 $1,076 2.35% 1.59% 2.02% 2.28% 2.73% 1.87% 4Q 13 1Q 14 2Q 14 3Q 14 4Q 14 1Q 15 Delinquent Contracts ($M) Delinquency Rate Consolidated Net Charge - Offs U.S. Commercial Auto Net Charge - Offs Asset Quality U.S. Retail Auto Net Charge - Offs U.S. Retail Auto Delinquencies Note: Above loans are classified as held - for - investment and recorded at historical cost. See slide 27 for details Note: Includes accruing contracts only Note: 4Q13 charge - offs include a non - recurring recognition of additional recoveries

16 1Q 2015 Preliminary Results Key Financials ($ millions) 1Q 15 4Q 14 1Q 14 Net financing revenue 809$ 42$ (11)$ Total other revenue 52 (17) (12) Total net revenue 861 25 (23) Provision for loan losses 127 (48) (32) Noninterest expense 403 52 17 Pre-tax income from continuing ops 331$ 21$ (8)$ U.S. auto earning assets 110,654$ (927)$ 2,721$ Net lease revenue Operating lease revenue 896$ (9)$ 26$ Depreciation expense 691 8 40 Remarketing gains 69 19 (40) Total depreciation expense 622 (11) 80 Net lease revenue 274$ 2$ (54)$ Lease assets 19,021$ (489)$ 834$ 1Q 15 4Q 14 1Q 14 Net lease yield 5.7% 5.5% 7.4% Increase/(Decrease) vs. • Auto Finance reported pre - tax income of $331 million in 1Q, down $ 8 million YoY and up $21 million from the prior quarter – Net financing revenue lower YoY driven primarily by lower net lease revenue ▪ Higher QoQ driven by lower funding costs – Provision lower both YoY and QoQ driven by lower commercial loss expectations and seasonally lower retail charge - offs QoQ • Earning assets up 3% YoY despite $3.6 billion of retail loan asset sales since 3Q14 • $9.8 billion of originations in 1Q, up $0.7 billion YoY and $0.8 billion QoQ – Nonprime (<620 FICO) 12% of originations in 1Q15 vs. 9% in 1Q14 – On track to achieve high $ 30s billion of originations in 2015 Auto Finance – Results 1Q 15 1Q 14 YoY Change GM 5.1$ 6.0$ -15% Chrysler 2.0 1.4 44% Growth 2.7 1.8 54% Total 9.8$ 9.2$ 7% Decisioned Applications (mm) 2.5 2.1 19% Consumer Auto Originations by Channel ($B)

17 1Q 2015 Preliminary Results (EOP $ billions) $77.7 $77.8 $79.2 $81.3 $81.3 $82.1 4Q 13 1Q 14 2Q 14 3Q 14 4Q 14 1Q 15 On Balance Sheet Sold ($ billions) $31.6 $32.6 $32.9 $31.4 $33.2 $32.4 4Q 13 1Q 14 2Q 14 3Q 14 4Q 14 1Q 15 ($ billions; % of $ originations) 66% 66% 63% 63% 60% 52% 16% 15% 17% 16% 18% 20% 18% 19% 20% 20% 22% 28% $8.2 $9.2 $10.9 $11.8 $9.0 $9.8 4Q 13 1Q 14 2Q 14 3Q 14 4Q 14 1Q 15 GM Chrysler Growth Auto Finance – Key Metrics See slide 27 for definitions Consumer Serviced Assets Commercial Assets Consumer Originations Origination Mix Note: Asset balances reflect the average daily balance for the quarter (% of $ originations) 9% 5% 5% 24% 30% 31% 7% 8% 10% 29% 27% 17% 30% 30% 36% 4Q 13 1Q 14 2Q 14 3Q 14 4Q 14 1Q 15 New Subvented New Standard New Growth Lease Used

18 1Q 2015 Preliminary Results Key Financials ($ millions) 1Q 15 4Q 14 1Q 14 Premiums, service revenue earned and other 237$ (8)$ (7)$ Losses and loss adjustment expenses 56 (1) (12) Acquisition and underwriting expenses 146 - 1 Total underwriting income 35 (7) 4 Investment income and other 43 (1) - Pre-tax income from continuing ops 78$ (8)$ 4$ Total assets 7,242$ 52$ 58$ Key Statistics 1Q 15 4Q 14 1Q 14 Insurance ratios Loss ratio 24% 23% 28% Underwriting expense ratio 62% 60% 60% Combined ratio 86% 83% 88% Increase/(Decrease) vs. Dealer Products & Services Written Premiums ($ millions) $233 $276 $267 $225 $244 $267 $265 $248 $239 1Q 13 2Q 13 3Q 13 4Q 13 1Q 14 2Q 14 3Q 14 4Q 14 1Q 15 Insurance • Pre - tax income of $78 million, up $4 million YoY and down $8 million from the prior quarter – YoY increase driven primarily by lower vehicle service contract losses – QoQ decline driven by lower floorplan inventory levels • Written premiums of $239 million lower both YoY and QoQ driven primarily by lower floorplan balances – Proactive weather loss risk management Note: Excludes Canadian Personal Lines business, which is in runoff Note: Excludes the benefit of weather - related loss reinsurance and Canadian Personal Lines losses Insurance Losses ($ millions) $52 $49 $51 $47 $42 $40 $3 $7 $124 $36 $5 $4 $67 $69 $190 $97 $60 $56 4Q 13 1Q 14 2Q 14 3Q 14 4Q 14 1Q 15 VSC Losses Weather Losses Other Losses

19 1Q 2015 Preliminary Results Key Financials ($ millions) 1Q 15 4Q 14 1Q 14 Net financing revenue (ex. OID) 24$ (26)$ 9$ Total other revenue (ex. OID) 52 34 71 Provision for loan losses (6) - (7) Noninterest expense 71 (23) (16) Core pre-tax income (1) 12$ 30$ 103$ OID amortization expense (2) 17 (25) (27) Pre-tax loss from continuing ops (1) (5)$ 56$ 129$ Total assets 27,439$ 3,873$ 3,415$ Increase/(Decrease) vs. Key Financials ($ millions) 1Q 15 4Q 14 1Q 14 Net financing revenue 15$ 7$ 1$ Total other revenue 68 66 64 Total net revenue 83 73 65 Provision for loan losses (5) 9 18 Noninterest expense 19 14 (5) Pre-tax income from continuing ops (1) 69$ 50$ 52$ Total assets 7,694$ (190)$ (243)$ Ally Bank HFI Portfolio 1Q 15 4Q 14 1Q 14 Net Carry Value ($ billions) 7.5$ 7.3$ 7.8$ Ongoing (post 1/1/2009) 51% 47% 39% Legacy (pre 1/1/2009) 49% 53% 61% % Interest Only 11.1% 12.5% 13.5% % 30+ Delinquent 2.8% 3.0% 2.5% Net Charge-off Rate 1.0% 0.6% 0.6% Wtd. Avg. LTV/CLTV (2) 68.6% 71.5% 77.8% Refreshed FICO 748 734 727 Increase/(Decrease) vs. Mortgage and Corporate and Other (1) Excludes repositioning items in 4Q14. See slide 26 for details (2) Updated home values derived using a combination of appraisals, BPOs, AVMs and MSA level house price indices Mortgage Results (1) Excludes repositioning items in prior periods. See slide 26 for details (2) Primarily bond exchange OID amortization expense used for calculating core pre - tax income Corporate and Other Results
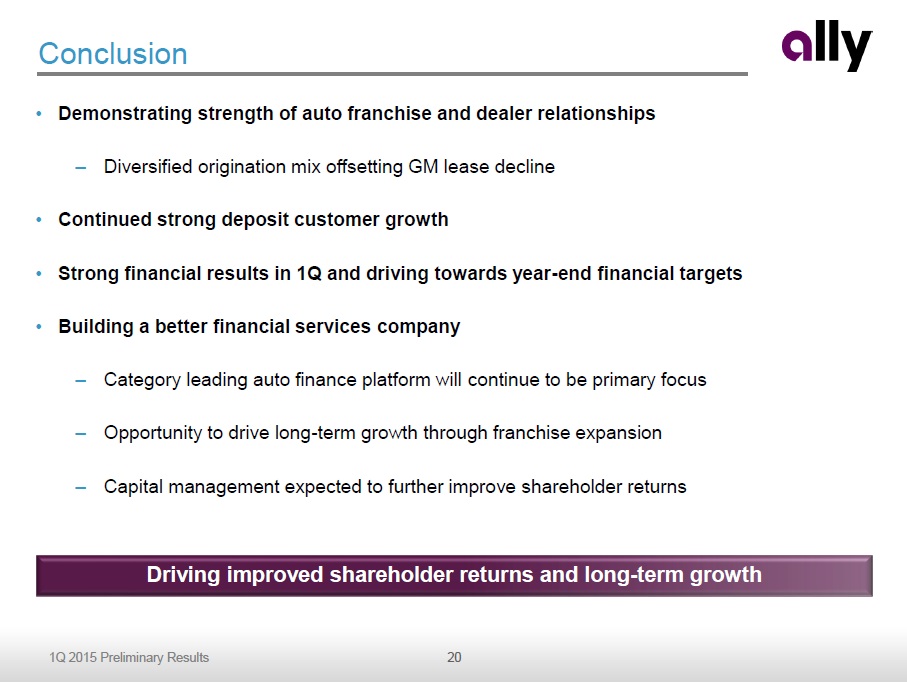
20 1Q 2015 Preliminary Results Conclusion • Demonstrating strength of auto franchise and dealer relationships – Diversified origination mix offsetting GM lease decline • Continued strong deposit customer growth • Strong financial results in 1Q and driving towards year - end financial targets • Building a better financial services company – Category leading auto finance platform will continue to be primary focus – Opportunity to drive long - term growth through franchise expansion – Capital management expected to further improve shareholder returns Driving improved shareholder returns and long - term growth

Supplemental Charts
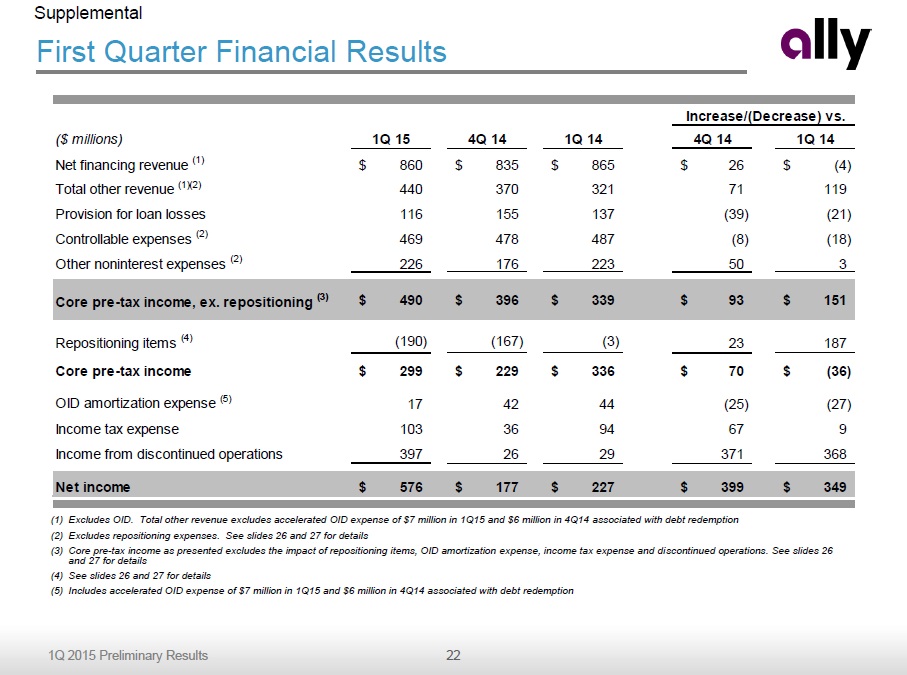
22 1Q 2015 Preliminary Results ($ millions) 1Q 15 4Q 14 1Q 14 4Q 14 1Q 14 Net financing revenue (1) 860$ 835$ 865$ 26$ (4)$ Total other revenue (1)(2) 440 370 321 71 119 Provision for loan losses 116 155 137 (39) (21) Controllable expenses (2) 469 478 487 (8) (18) Other noninterest expenses (2) 226 176 223 50 3 Core pre-tax income, ex. repositioning (3) 490$ 396$ 339$ 93$ 151$ Repositioning items (4) (190) (167) (3) 23 187 Core pre-tax income 299$ 229$ 336$ 70$ (36)$ OID amortization expense (5) 17 42 44 (25) (27) Income tax expense 103 36 94 67 9 Income from discontinued operations 397 26 29 371 368 Net income 576$ 177$ 227$ 399$ 349$ Increase/(Decrease) vs. First Quarter Financial Results (1) Excludes OID. Total other revenue excludes accelerated OID expense of $7 million in 1Q15 and $6 million in 4Q14 associated with debt redemption (2) Excludes repositioning expenses. See slides 26 and 27 for details (3) Core pre - tax income as presented excludes the impact of repositioning items, OID amortization expense, income tax expense and di scontinued operations. See slides 26 and 27 for details (4) See slides 26 and 27 for details (5) Includes accelerated OID expense of $7 million in 1Q15 and $6 million in 4Q14 associated with debt redemption Supplemental

23 1Q 2015 Preliminary Results 1Q 2015 ($ millions) Average Outstanding Balance (1) Quarterly Interest Expense Annualized Cost of Funds LT Unsecured Debt 22,969$ 295$ 5.21% Secured Debt 40,608 119 1.19% Other Borrowings (2) 9,216 16 0.70% Deposits 59,464 172 1.17% Total / Weighted Average 132,257$ 602$ 1.85% ($ billions) 66% 68% 68% 69% 68% $148.5 $149.9 $149.2 $151.8 $153.5 1Q 14 2Q 14 3Q 14 4Q 14 1Q 15 Ally Bank Assets Non-Bank Assets ($ billions) $2.0 $2.7 $0.0 $0.0 $1.9 $4.4 $1.9 $1.6 1Q 15 2Q 15 3Q 15 4Q 15 2016 2017 2018 2019 Matured Remaining • Diversified funding strategy with opportunities to lower cost of funds – 68% of total assets reside at Ally Bank – Deposits now represent 46% of Ally’s funding • Efficient capital markets funding in 1Q – $2.7 billion of term securitizations – $1 billion whole loan sale – $2.5 billion of unsecured issuance – Renewed $12.5 billion of secured credit facilities Funding As of 3 /31/15. Total maturities for 2020 and beyond equal $10.2 billion and do not exceed $3.1 billion in any given year. Current period does not include early debt redemptions. Total Asset Breakdown Unsecured Long - Term Debt Maturities Supplemental Liability and Cost of Funds Detail (1) Excludes OID (2) Includes Demand Notes, FHLB, and Repurchase Agreements

24 1Q 2015 Preliminary Results Impact of Discontinued Operations ($ millions) 1Q 15 4Q 14 1Q 14 Auto Finance 454$ 431$ 425$ Insurance - (0) 0 Corporate and Other 6 0 7 Consolidated pre-tax income 460$ 431$ 432$ Tax expense 63 61 64 Consolidated net income 397$ 371$ 368$ Increase/(Decrease) vs. Discontinued Operations Supplemental • Closed China joint - venture sale in January 2015, generating a gain of approximately $400 million

25 1Q 2015 Preliminary Results Deferred Tax Asset 4Q 14 ($ millions) Gross DTA/(DTL) Balance Valuation Allowance Net DTA/(DTL) Balance Net DTA/(DTL) Balance Net Operating Loss (Federal) 913$ -$ 913$ 1,001$ Capital Loss (Federal) 6 - 6 22 Tax Credit Carryforwards 1,920 (478) 1,442 1,433 State/Local Tax Carryforwards 208 (110) 98 143 Other Deferred Tax Assets/(Liabilities) (2) (825) (1) (825) (792) Net Deferred Tax Assets 2,222$ (589)$ 1,634$ 1,807$ 1Q 15 (1) Deferred Tax Asset Supplemental (1) U.S. GAAP does not prescribe a method for calculating individual elements of deferred taxes for interim periods; therefore , these balances are estimated (2) Primarily book / tax timing differences

26 1Q 2015 Preliminary Results Notes on non - GAAP and other financial measures Supplemental (1) Represents core pre - tax income excluding repositioning items. See slide 27 for definitions $ millions GAAP OID & Repositioning Items Non-GAAP (1) GAAP OID & Repositioning Items Non-GAAP (1) GAAP OID & Repositioning Items Non-GAAP (1) Consolidated Ally Net financing revenue 850$ 10$ 860$ 799$ 36$ 835$ 821$ 44$ 865$ Total other revenue 243 197 440 215 155 370 321 - 321 Provision for loan losses 116 - 116 155 - 155 137 - 137 Controllable expenses 469 - 469 479 (1) 478 490 (3) 487 Other noninterest expenses 226 - 226 193 (18) 176 223 - 223 Pre-tax income from continuing ops 282$ 208$ 490$ 187$ 209$ 396$ 292$ 47$ 339$ Mortgage Operations Net financing revenue 15$ -$ 15$ 8$ -$ 8$ 14$ -$ 14$ Gain (loss) on sale of mortgage loans, net 66 - 66 - - - - - - Other revenue (loss) (excluding gain on sale) 2 - 2 4 (2) 2 4 - 4 Total net revenue 83 - 83 12 (2) 10 18 - 18 Provision for loan losses (5) - (5) (14) - (14) (23) - (23) Noninterest expense 19 - 19 5 - 5 24 - 24 Pre-tax income (loss) from continuing ops 69$ -$ 69$ 21$ (2)$ 19$ 17$ -$ 17$ Corporate and Other Net financing revenue (loss) 14$ 10$ 24$ 15$ 36$ 51$ (28)$ 44$ 16$ Total other revenue (loss) (145) 197 52 (138) 157 19 (19) - (19) Provision for loan losses (6) - (6) (6) - (6) 1 - 1 Noninterest expense 71 - 71 113 (19) 94 90 (3) 87 Pre-tax income (loss) from continuing ops (196)$ 208$ 12$ (230)$ 211$ (19)$ (138)$ 47$ (91)$ 1Q 15 4Q 14 1Q 14

27 1Q 2015 Preliminary Results Notes on non - GAAP and other financial measures Supplemental 1) Core pre - tax income (loss) is a non - GAAP financial measure. It is defined as income (loss) from continuing operations before income tax expense and primarily bond exchange original issue discount ("OID") amortization expense . 2) Repositioning items for 1Q15 and 4Q14 are primarily related to the extinguishment of high - cost legacy debt. 3) ROTCE is equal to GAAP Net I ncome A vailable to Common S hareholders divided by a two period average of Tangible C ommon Equity. See pages 4 and 16 in the Financial Supplement for more detail. 4) Core ROTCE is equal to Operating Net Income Available to Common divided by Normalized Common Equity. See page 22 in the Financial Supplement for full calculation . A. Operating Net Income Available to Common is calculated as (a) Pre - Tax Income from Continuing Operations minus (b) Income Tax Expense using a normalized 34% rate plus (c) expense associated with original issue bond discount amortization minus (d) preferred dividends associated with our Series A and Series G preferred stock plus (e) impact of any disclosed repositioning items . B. Normalized Common Equity is calculated as the two period average of (a) shareholder equity minus (b) the book value of preferred stock outstanding minus (c) goodwill and other intangibles minus (d) remaining original issue bond discount minus (e) remaining net deferred tax asset. 5) Adjusted Efficiency ratio is equal to (A) total noninterest expense less ( i ) Insurance operating segment related expenses, (ii) mortgage repurchase expense and (iii) expense related to repositioning items divided by ( B) total net revenue less ( i ) Insurance operating segment related revenue, (ii) OID amortization expense and (iii) any revenue related to repositioning items . See page 22 in the Financial Supplement for full calculation. 6) Corporate and Other primarily consists of Ally’s centralized treasury activities, the residual impacts of the company’s corporate funds transfer pri cing and asset liability management activities, and the amortization of the discount associated with debt issuances and bond exchanges . C orporate and Other also includes the Ally Corporate Finance business, certain equity investments and reclassifications, eliminations between the repo rta ble operating segments, and overhead previously allocated to operations that have since been sold or discontinued. 7) Controllable expenses include employee related costs, consulting and legal fees, marketing, information technology, facility, portfolio servicing a nd restructuring expenses. 8) U.S. consumer auto originations ▪ New Subvented – subvented rate new vehicle loans from GM and Chrysler dealers ▪ New Standard – standard rate new vehicle loans from GM and Chrysler dealers ▪ Lease – new vehicle lease originations from all dealers ▪ Used – used vehicle loans from all dealers ▪ Growth – total originations from non - GM/Chrysler dealers (New Growth refers to new vehicle loan originations only) 9) Net charge - off ratios are calculated as annualized net charge - offs divided by average outstanding finance receivables and loans excluding loans measur ed at fair value and loans held - for - sale .