Attached files
| file | filename |
|---|---|
| 8-K - 8-K - JPMORGAN CHINA REGION FUND, INC. | form8k-13848_jfc.htm |
JPMorgan China Region Fund, Inc. |
|
|
|

| Benchmark A | |
80 % MSCI Golden Dragon Index (Net) 20 % CSI 300 Index (Net) | |
| |
| Investment objective | |
Long term capital appreciation through investments primarily in equity securities of companies with substantial assets in, or revenues derived from, the People's Republic of China, Hong Kong, Taiwan and Macau. | |
| Fund statistics | |
| Fund Manager | Emerson Yip |
| Listed | New York Stock Exchange |
| Net Assets (as at 31/03/15) | USD 134.31m |
| Launch date | 16th July 1992 |
| Dividends (Ex-dividend date) |
USD 0.1270 (10 December 2014) |
| Actual LeverageB | -10.1% |
| Market capitalization breakdown | (as at 31/03/15) |
(Large
Cap > USD 2bn, Mid Cap USD 500m - USD 2bn,
| |
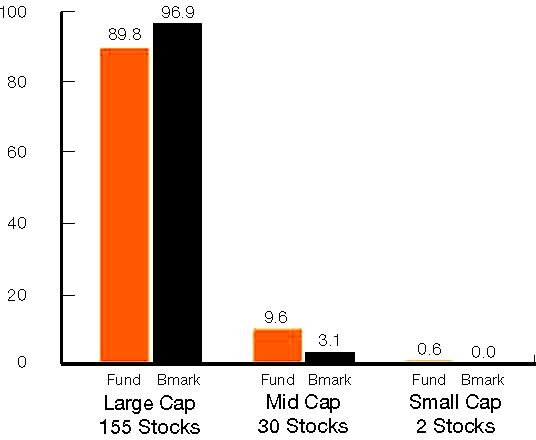 | |
Total number of stocks in the Fund’s portfolio: 187 | |
| A | On 01/03/01 the benchmark of the Fund was changed from 25% TWII, 20% BNPPCI, 50% MSCI HK, 5% HSBC to MSCI Golden Dragon Index (Total). On 13/04/12 the benchmark was changed to 80% MSCI Golden Dragon Index, 20% CSI 300 Index. On 01/10/13 the Fund’s benchmark was changed to a net, rather than gross, basis. Formerly JF China Region Fund, Inc., the Fund name was changed on 06/12/13. | |
| B | Actual leverage represents the excess amount above shareholders’ funds of total assets less cash/cash equivalents, expressed as a percentage of shareholders’ funds. If the amount calculated is negative, this represents a net cash position. |
| Performance data | (as at 31/03/15) |
| |
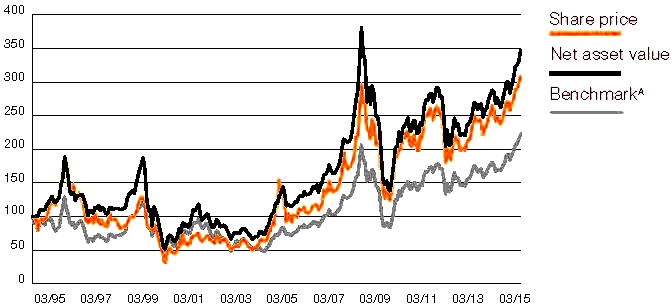
| Cumulative performance | (as at 31/03/15) | |||||||||||||||||||||||||||
| % | 1 mth | 3 mths | 2015 YTD | 1 year | 3 year | 5 year | 10 years | |||||||||||||||||||||
| Share price | 3.2 | 6.8 | 6.8 | 27.8 | 45.3 | 39.4 | 191.1 | |||||||||||||||||||||
| Net asset value | 4.6 | 7.4 | 7.4 | 29.5 | 48.3 | 43.0 | 162.7 | |||||||||||||||||||||
| BenchmarkA | 3.9 | 8.2 | 8.2 | 31.9 | 42.1 | 48.9 | 167.5 | |||||||||||||||||||||
| Rolling 12 month performance | ||||||||||||||||||||
| % | 2015/2014 | 2014/2013 | 2013/2012 | 2012/2011 | 2011/2010 | |||||||||||||||
| Share price | 27.8 | -0.3 | 14.0 | -16.6 | 15.1 | |||||||||||||||
| Net asset value | 29.5 | 3.4 | 10.7 | -16.3 | 15.3 | |||||||||||||||
| BenchmarkA | 31.9 | 1.6 | 6.0 | -8.8 | 14.9 | |||||||||||||||
Past performance is no guarantee of future results. Investment returns and principal value will fluctuate and shares, when sold, may be worth more or less than original cost. Current performance may be lower or higher than the performance data quoted. All return data includes investment management fees, administrative and custodial charges, bank loan expenses and assumes the reinvestment of all distributions. Returns for periods less than one year are not annualized.
| Top 10 Holdings | (as at 31/03/15) | |||
| Holding | Fund % | BenchmarkA weight | ||
| Taiwan Semiconductor Manufacturing | 5.4 | 5.1 | ||
| Tencent Holdings | 5.2 | 4.3 | ||
| Ping An Insurance* | 4.0 | 2.2 | ||
| China Construction Bank | 3.3 | 2.8 | ||
| AIA Group | 3.3 | 3.3 | ||
| Agricultural Bank of China* | 2.5 | 0.7 | ||
| China Pacific Insurance* | 2.2 | 0.8 | ||
| CK Hutchison Holdings | 1.9 | 1.3 | ||
| China Minsheng Banking* | 1.8 | 0.9 | ||
| Fubon Financial | 1.7 | 0.5 | ||
| Sub-Total | 31.3 | 21.9 | ||
| * Denotes China A-share holding | ||||
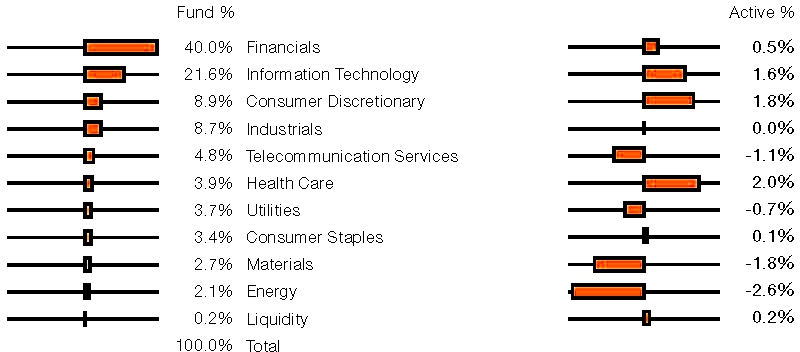
| Sector | (as at 31/03/15) |
| |
|
|
| Fund information | |
| Share price | USD 18.06 |
| NAV per share | USD 20.83 |
| Discount (-) / Premium | |
| Current | -13.3% |
| Shares in issue | 6,447,637 |
| Fund code | |
| Bloomberg | JFC US |
| ISIN | US46614T1079 |
| Sedol | 2471392 |
| Portfolio | (as of 31/03/15) |
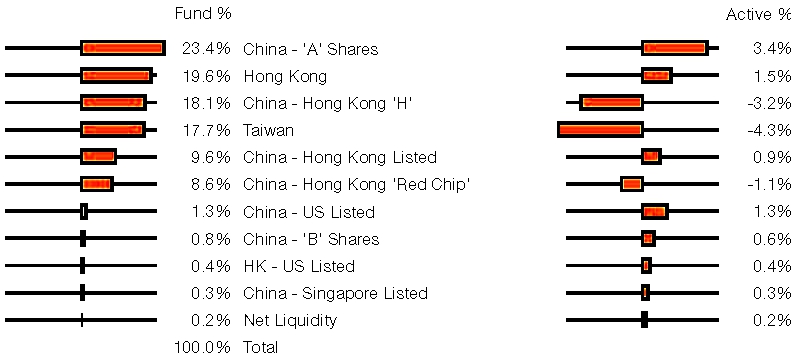 | |
| Portfolio review | (as of 31/03/15) |
Greater China markets rose in a volatile trading month. The MSCI China Index continued to rise despite a generally lackluster earnings season, as the market focused on potential fund flows into Hong Kong from mainland-based mutual funds and continued relaxation of monetary and property market policies. Mainland stock markets posted double digit gains as fund flows surged. The MSCI Hong Kong Index rose in sympathy, partially propelled by strong earnings from several index bellwethers. The MSCI Taiwan Index lagged, as fears of a lull in demand led to a global correction in technology stocks. Half of the market’s capitalization is accounted for by technology companies.
| Market outlook | (as of 31/03/15) |
We continue to remain constructive on Greater China markets given China’s policy easing, reasonable equity valuations and ample global liquidity. The surging mainland domestic markets, a product of these conditions along with a multi-year bear market and excessive household savings, will play a helpful part in equitizing balance sheets in a heavily-leveraged economy. We continue to find opportunities in Greater China’s environmental, healthcare and technology spaces, as well as in nascent consumer sectors and Chinese financials benefiting from policy easing.
| Further information | |
| Investment Adviser: | JF International Management Inc. |
| Website: | www.jpmchinaregionfund.com |
| Administration: | Lucy Dina +44 (0)20 7742 3735 |
| US Representative: | Khimmara Greer +1 (617) 624 6329 |
Source: J.P. Morgan, Reuters, Bloomberg
Benchmark Source: MSCI. The MSCI data is comprised of a custom index calculated by MSCI for, and as requested by, JPMAM (UK). The MSCI data is for internal use only and may not be redistributed or used in connection with creating or offering any securities, financial products or indices. Neither MSCI nor any other third party involved in or related to compiling, computing or creating the MSCI data (the “MSCI Parties”) makes any express or implied warranties or representations with respect to such data (or the results to be obtained by the use thereof), and the MSCI Parties hereby expressly disclaim all warranties of originality, accuracy, completeness, merchantability or fitness for a particular purpose with respect to such data. Without limiting any of the foregoing, in no event shall any of the MSCI Parties have any liability for any direct, indirect, special, punitive, consequential or any other damages (including lost profits) even if notified of the possibility of such damages.
All equity indices stated as ‘Net’ are calculated net of tax as per the standard published approach by the index vendor unless stated otherwise.
This material should not be relied on as including sufficient information to support an investment decision. US recipients of this information that wish to receive further information or effect transactions in the Fund’s shares should contact JPM New York and not other brokers who may be listed in this report.
This document contains information concerning the performance of JF Investment Companies. It does not constitute or contain, and may not be used for the purposes of or in connection with, any offer or invitation or solicitation by or on behalf of any of the investment companies described herein to subscribe for or to purchase securities by anyone in any jurisdiction in which such offer, invitation or solicitation is not authorised, or to any person to whom it is unlawful to make such offer, invitation or solicitation. There is no assurance that the Fund will achieve its investment objective. You should remember that past performance is not a guide to the future. The price of investments and the income from them may fall as well as rise and you may not get back the full amount invested. All performance assumes reinvestment of all dividends and capital gain distributions. Total return based on share price reflects changes in market value. Total return based on net asset value reflects changes in the Fund’s net asset value during each period. Shares of the Fund may trade above or below its net asset value. Current performance may be lower or higher than the performance data quoted. When a subscription involves a foreign exchange transaction, it may be subject to the fluctuations of currency values. Exchange rates may also cause the value of underlying overseas investments to go up or down. Investments in emerging markets may involve a higher element of risk due political and economic instability and underdeveloped markets and systems. Investments in smaller companies may involve a higher degree of risk as markets are usually more sensitive to price movements. Concentrating investments in the greater China region subjects the Fund to more volatility and greater risk of loss than geographically diverse funds. The views expressed herein are not to be taken as advice
or a recommendation to buy or sell any investment.