Attached files
| file | filename |
|---|---|
| EX-31.1 - CEO CERTIFICATION - FLOTEK INDUSTRIES INC/CN/ | exhibit311-10q03312015.htm |
| EX-32.1 - CEO 906 CERTIFICATION - FLOTEK INDUSTRIES INC/CN/ | exhibit321-10q03312015.htm |
| EX-31.2 - CFO CERTIFICATION - FLOTEK INDUSTRIES INC/CN/ | exhibit312-10q03312015.htm |
| EXCEL - IDEA: XBRL DOCUMENT - FLOTEK INDUSTRIES INC/CN/ | Financial_Report.xls |
| EX-32.2 - CFO 906 CERTIFICATION - FLOTEK INDUSTRIES INC/CN/ | exhibit322-10q03312015.htm |
UNITED STATES
SECURITIES AND EXCHANGE COMMISSION
Washington, D.C. 20549
FORM 10-Q |
x | QUARTERLY REPORT PURSUANT TO SECTION 13 OR 15(d) OF THE SECURITIES EXCHANGE ACT OF 1934 |
For the quarterly period ended March 31, 2015
or
¨ | TRANSITION REPORT PURSUANT TO SECTION 13 OR 15(d) OF THE SECURITIES EXCHANGE ACT OF 1934 |
For the transition period from to
Commission File Number 1-13270
FLOTEK INDUSTRIES, INC. (Exact name of registrant as specified in its charter) |
Delaware | 90-0023731 | |
(State or other jurisdiction of incorporation or organization) | (I.R.S. Employer Identification No.) | |
10603 W. Sam Houston Parkway N., Suite 300 Houston, TX | 77064 | |
(Address of principal executive offices) | (Zip Code) | |
(713) 849-9911
(Registrant’s telephone number, including area code)
Indicate by check mark whether the registrant (1) has filed all reports required to be filed by Section 13 or 15(d) of the Securities Exchange Act of 1934 during the preceding 12 months (or for such shorter period that the registrant was required to file such reports), and (2) has been subject to such filing requirements for the past 90 days. Yes x No ¨
Indicate by check mark whether the registrant has submitted electronically and posted on its corporate Website, if any, every Interactive Data File required to be submitted and posted pursuant to Rule 405 of Regulation S-T (§232.405 of this chapter) during the preceding 12 months (or for such shorter period that the registrant was required to submit and post such files). Yes x No ¨
Indicate by check mark whether the registrant is a large accelerated filer, an accelerated filer, a non-accelerated filer, or a smaller reporting company. See the definitions of “large accelerated filer,” “accelerated filer” and “smaller reporting company” in Rule 12b-2 of the Exchange Act.
Large accelerated filer | x | Accelerated filer | ¨ | |||
Non-accelerated filer | ¨ (Do not check if a smaller reporting company) | Smaller reporting company | ¨ | |||
Indicate by check mark whether the registrant is a shell company (as defined in Rule 12b-2 of the Exchange Act). Yes ¨ No x
As of April 16, 2015, there were 53,486,963 outstanding shares of Flotek Industries, Inc. common stock, $0.0001 par value.
TABLE OF CONTENTS
2
PART I — FINANCIAL INFORMATION
Item 1. Financial Statements
FLOTEK INDUSTRIES, INC.
UNAUDITED CONSOLIDATED BALANCE SHEETS
(in thousands, except share data)
March 31, 2015 | December 31, 2014 | ||||||
ASSETS | |||||||
Current assets: | |||||||
Cash and cash equivalents | $ | 2,499 | $ | 1,266 | |||
Accounts receivable, net of allowance for doubtful accounts of $851 and $847 at March 31, 2015 and December 31, 2014, respectively | 56,011 | 78,624 | |||||
Inventories | 98,162 | 85,958 | |||||
Deferred tax assets, net | 1,799 | 2,696 | |||||
Other current assets | 9,275 | 11,055 | |||||
Total current assets | 167,746 | 179,599 | |||||
Property and equipment, net | 88,239 | 86,111 | |||||
Goodwill | 72,820 | 71,131 | |||||
Deferred tax assets, net | 13,486 | 12,907 | |||||
Other intangible assets, net | 72,716 | 73,528 | |||||
TOTAL ASSETS | $ | 415,007 | $ | 423,276 | |||
LIABILITIES AND EQUITY | |||||||
Current liabilities: | |||||||
Accounts payable | $ | 28,427 | $ | 33,185 | |||
Accrued liabilities | 7,651 | 12,314 | |||||
Income taxes payable | 1,755 | 1,307 | |||||
Interest payable | 106 | 93 | |||||
Current portion of long-term debt | 24,417 | 18,643 | |||||
Total current liabilities | 62,356 | 65,542 | |||||
Long-term debt, less current portion | 23,613 | 25,398 | |||||
Deferred tax liabilities, net | 23,297 | 25,982 | |||||
Total liabilities | 109,266 | 116,922 | |||||
Commitments and contingencies | |||||||
Equity: | |||||||
Cumulative convertible preferred stock, $0.0001 par value, 100,000 shares authorized; no shares issued and outstanding | — | — | |||||
Common stock, $0.0001 par value, 80,000,000 shares authorized; 55,154,224 shares issued and 53,429,599 shares outstanding at March 31, 2015; 54,633,726 shares issued and 53,357,811 shares outstanding at December 31, 2014 | 6 | 5 | |||||
Additional paid-in capital | 259,139 | 254,233 | |||||
Accumulated other comprehensive income (loss) | (742 | ) | (502 | ) | |||
Retained earnings | 51,247 | 52,762 | |||||
Treasury stock, at cost; 704,350 and 449,397 shares at March 31, 2015 and December 31, 2014, respectively | (4,267 | ) | (495 | ) | |||
Flotek Industries, Inc. stockholders’ equity | 305,383 | 306,003 | |||||
Noncontrolling interests | 358 | 351 | |||||
Total equity | 305,741 | 306,354 | |||||
TOTAL LIABILITIES AND EQUITY | $ | 415,007 | $ | 423,276 | |||
See accompanying Notes to Unaudited Consolidated Financial Statements.
3
FLOTEK INDUSTRIES, INC.
UNAUDITED CONSOLIDATED STATEMENTS OF OPERATIONS
(in thousands, except per share data)
Three months ended March 31, | |||||||
2015 | 2014 | ||||||
Revenue | $ | 82,373 | $ | 102,575 | |||
Cost of revenue | 55,846 | 58,894 | |||||
Gross margin | 26,527 | 43,681 | |||||
Expenses: | |||||||
Selling, general and administrative | 23,888 | 21,572 | |||||
Depreciation and amortization | 2,676 | 2,285 | |||||
Research and development | 1,252 | 1,026 | |||||
Total expenses | 27,816 | 24,883 | |||||
Income (loss) from operations | (1,289 | ) | 18,798 | ||||
Other income (expense): | |||||||
Interest expense | (407 | ) | (454 | ) | |||
Other income (expense), net | (225 | ) | 54 | ||||
Total other income (expense) | (632 | ) | (400 | ) | |||
Income (loss) before income taxes | (1,921 | ) | 18,398 | ||||
Income tax benefit (expense) | 406 | (6,380 | ) | ||||
Net income (loss) | $ | (1,515 | ) | $ | 12,018 | ||
Earnings (loss) per common share: | |||||||
Basic earnings (loss) per common share | $ | (0.03 | ) | $ | 0.22 | ||
Diluted earnings (loss) per common share | $ | (0.03 | ) | $ | 0.22 | ||
Weighted average common shares: | |||||||
Weighted average common shares used in computing basic earnings (loss) per common share | 54,448 | 53,948 | |||||
Weighted average common shares used in computing diluted earnings (loss) per common share | 54,448 | 55,398 | |||||
See accompanying Notes to Unaudited Consolidated Financial Statements.
4
FLOTEK INDUSTRIES, INC.
UNAUDITED CONSOLIDATED STATEMENTS OF COMPREHENSIVE INCOME
(in thousands)
Three months ended March 31, | ||||||||
2015 | 2014 | |||||||
Net income (loss) | $ | (1,515 | ) | $ | 12,018 | |||
Other comprehensive income (loss): | ||||||||
Foreign currency translation adjustment | (240 | ) | (149 | ) | ||||
Comprehensive income (loss) | $ | (1,755 | ) | $ | 11,869 | |||
See accompanying Notes to Unaudited Consolidated Financial Statements.
5
FLOTEK INDUSTRIES, INC.
UNAUDITED CONSOLIDATED STATEMENTS OF CASH FLOWS
(in thousands)
Three months ended March 31, | |||||||
2015 | 2014 | ||||||
Cash flows from operating activities: | |||||||
Net income (loss) | $ | (1,515 | ) | $ | 12,018 | ||
Adjustments to reconcile net income (loss) to net cash provided by operating activities: | |||||||
Depreciation and amortization | 4,570 | 4,219 | |||||
Amortization of deferred financing costs | 86 | 106 | |||||
Gain on sale of assets | (1,223 | ) | (558 | ) | |||
Stock compensation expense | 3,462 | 2,334 | |||||
Deferred income tax benefit | (2,367 | ) | (290 | ) | |||
Excess tax benefit related to share-based awards | (87 | ) | (1,300 | ) | |||
Changes in current assets and liabilities, net of acquisitions: | |||||||
Accounts receivable, net | 22,613 | (525 | ) | ||||
Inventories | (11,990 | ) | (9,863 | ) | |||
Other current assets | 1,782 | 885 | |||||
Accounts payable | (4,758 | ) | 6,700 | ||||
Accrued liabilities | (4,663 | ) | (2,531 | ) | |||
Income taxes payable | 535 | 4,322 | |||||
Interest payable | 13 | (12 | ) | ||||
Net cash provided by operating activities | 6,458 | 15,505 | |||||
Cash flows from investing activities: | |||||||
Capital expenditures | (5,590 | ) | (4,115 | ) | |||
Proceeds from sale of assets | 1,315 | 832 | |||||
Payments for acquisitions, net of cash acquired | (1,250 | ) | (5,286 | ) | |||
Purchase of patents and other intangible assets | (115 | ) | (135 | ) | |||
Net cash used in investing activities | (5,640 | ) | (8,704 | ) | |||
Cash flows from financing activities: | |||||||
Repayments of indebtedness | (4,786 | ) | (4,786 | ) | |||
Borrowings on revolving credit facility | 112,151 | 96,750 | |||||
Repayments on revolving credit facility | (103,376 | ) | (99,097 | ) | |||
Debt issuance costs | — | (59 | ) | ||||
Excess tax benefit related to share-based awards | 87 | 1,300 | |||||
Purchase of treasury stock related to share-based awards | (1,055 | ) | (4,045 | ) | |||
Proceeds from sale of common stock | 256 | 231 | |||||
Repurchase of common stock | (2,651 | ) | — | ||||
Proceeds from exercise of stock options | 22 | 443 | |||||
Proceeds from exercise of stock warrants | — | 1,545 | |||||
Proceeds from noncontrolling interest | 7 | — | |||||
Net cash provided by (used in) financing activities | 655 | (7,718 | ) | ||||
Effect of changes in exchange rates on cash and cash equivalents | (240 | ) | (149 | ) | |||
Net increase (decrease) in cash and cash equivalents | 1,233 | (1,066 | ) | ||||
Cash and cash equivalents at the beginning of period | 1,266 | 2,730 | |||||
Cash and cash equivalents at the end of period | $ | 2,499 | $ | 1,664 | |||
See accompanying Notes to Unaudited Consolidated Financial Statements.
6
FLOTEK INDUSTRIES, INC.
UNAUDITED CONSOLIDATED STATEMENT OF EQUITY
(in thousands)
Common Stock | Treasury Stock | Additional Paid-in Capital | Accumulated Other Comprehensive Income (Loss) | Retained Earnings | Non-controlling Interests | Total Equity | |||||||||||||||||||||||||||
Shares Issued | Par Value | Shares | Cost | ||||||||||||||||||||||||||||||
Balance, December 31, 2014 | 54,634 | $ | 5 | 449 | $ | (495 | ) | $ | 254,233 | $ | (502 | ) | $ | 52,762 | $ | 351 | $ | 306,354 | |||||||||||||||
Net income (loss) | — | — | — | — | — | — | (1,515 | ) | — | (1,515 | ) | ||||||||||||||||||||||
Foreign currency translation adjustment | — | — | — | — | — | (240 | ) | — | — | (240 | ) | ||||||||||||||||||||||
Stock issued under employee stock purchase plan | — | — | (18 | ) | — | 256 | — | — | — | 256 | |||||||||||||||||||||||
Stock options exercised | 35 | — | — | — | 88 | — | — | — | 88 | ||||||||||||||||||||||||
Stock surrendered for exercise of stock options | — | — | 4 | (66 | ) | — | — | — | — | (66 | ) | ||||||||||||||||||||||
Restricted stock granted | 425 | 1 | — | — | (1 | ) | — | — | — | — | |||||||||||||||||||||||
Restricted stock forfeited | — | — | 7 | — | — | — | — | — | — | ||||||||||||||||||||||||
Treasury stock purchased | — | — | 82 | (1,055 | ) | — | — | — | — | (1,055 | ) | ||||||||||||||||||||||
Stock compensation expense | — | — | — | — | 3,462 | — | — | — | 3,462 | ||||||||||||||||||||||||
Excess tax benefit related to share-based awards | — | — | — | — | 87 | — | — | — | 87 | ||||||||||||||||||||||||
Investment in Flotek Gulf, LLC and Flotek Gulf Research, LLC | — | — | — | — | — | — | — | 7 | 7 | ||||||||||||||||||||||||
Stock issued in IAL acquisition | 60 | — | — | — | 1,014 | — | — | — | 1,014 | ||||||||||||||||||||||||
Repurchase of common stock | — | — | 180 | (2,651 | ) | — | — | — | — | (2,651 | ) | ||||||||||||||||||||||
Balance, March 31, 2015 | 55,154 | $ | 6 | 704 | $ | (4,267 | ) | $ | 259,139 | $ | (742 | ) | $ | 51,247 | $ | 358 | $ | 305,741 | |||||||||||||||
See accompanying Notes to Unaudited Consolidated Financial Statements.
7
FLOTEK INDUSTRIES, INC.
NOTES TO UNAUDITED CONSOLIDATED FINANCIAL STATEMENTS
Note 1 — Organization and Significant Accounting Policies
Organization and Nature of Operations
Flotek Industries, Inc. (“Flotek” or the “Company”) is a global, diversified, technology-driven supplier of energy chemistries and consumer and industrial chemistries and is a global developer and supplier of drilling, completion and production technologies and related services.
Flotek’s strategic focus, and that of its diversified subsidiaries (collectively referred to as the “Company”), includes energy related chemistry technologies, drilling and production technologies, and consumer and industrial chemistry technologies. Within energy technologies, the Company provides oilfield specialty chemistries and logistics, downhole drilling tools and production related tools used in the energy and mining industries. Flotek’s products and services enable customers to drill wells more efficiently, to realize increased production from both new and existing wells and to decrease future well operating costs. Major customers include leading oilfield service providers, pressure-pumping service companies, onshore and offshore drilling contractors, and major and independent oil and gas exploration and production companies. Within consumer and industrial chemistry technologies, the Company provides products for the flavor and fragrance industry and the industrial chemical industry. Major customers include food and beverage companies, fragrance companies, and companies providing household and industrial cleaning products.
The Company is headquartered in Houston, Texas, with operating locations in Colorado, Florida, Louisiana, New Mexico, North Dakota, Oklahoma, Pennsylvania, Texas, Utah, Wyoming, Canada, the Netherlands and the Middle East. Flotek’s products are marketed both domestically and internationally, with international presence and/or initiatives in over 20 countries.
Flotek was initially incorporated under the laws of the Province of British Columbia on May 17, 1985. On October 23, 2001, Flotek changed its corporate domicile to the state of Delaware.
Basis of Presentation
The accompanying Unaudited Consolidated Financial Statements and accompanying footnotes (collectively the “Financial Statements”) reflect all adjustments, in the opinion of management, necessary for fair presentation of the financial condition and results of operations for the periods presented. All such adjustments are normal and recurring in nature. The Financial Statements, including selected notes, have been prepared in accordance with applicable rules and regulations of the Securities and Exchange Commission (the “SEC”) regarding interim financial reporting and do not include all information and disclosures required by accounting principles generally accepted in the United States of America (“GAAP”) for comprehensive financial statement reporting. These interim Financial Statements should be read in conjunction with the audited consolidated financial statements and notes included in the Company’s Annual Report on Form 10-K for the fiscal year ended December 31, 2014 (the “Annual Report”). A copy of the Annual Report is available on the SEC’s website, www.sec.gov, under the Company’s ticker symbol (“FTK”) or on Flotek’s website, www.flotekind.com. The results of operations for the three months ended March 31, 2015 are not necessarily indicative of the results to be expected for the year ending December 31, 2015.
Use of Estimates
The preparation of financial statements in conformity with GAAP requires management to make estimates and assumptions that affect reported amounts of assets and liabilities, disclosure of contingent assets and liabilities and reported amounts of revenue and expenses. Actual results could differ from these estimates.
Reclassifications
Certain prior period amounts have been reclassified to conform to the current period presentation. The reclassifications did not impact net income.
8
FLOTEK INDUSTRIES, INC.
NOTES TO UNAUDITED CONSOLIDATED FINANCIAL STATEMENTS
Note 2 — Recent Accounting Pronouncements
(a) Application of New Accounting Standards
Effective January 1, 2015, the Company adopted the accounting guidance in Accounting Standards Update (“ASU”) No. 2014-08, “Presentation of Financial Statements and Property, Plant, and Equipment - Reporting Discontinued Operations and Disclosures of Disposals of Components of an Entity,” which amends the definition of a discontinued operation by raising the threshold for a disposal to qualify as discontinued operations. The ASU will also require entities to provide additional disclosures about discontinued operations as well as disposal transactions that do not meet the discontinued operations criteria. Implementation of this standard did not have a material effect on the consolidated financial statements.
Effective January 1, 2015, the Company adopted the accounting guidance in ASU No. 2014-12, “Accounting for Share-Based Payments When the Terms of an Award Provide That a Performance Target Could Be Achieved after the Requisite Service Period.” The ASU requires that a performance target that affects vesting and that could be achieved after the requisite service period be treated as a performance condition. As such, the performance target should not be reflected in estimating the grant-date fair value of the award. Implementation of this standard did not have a material effect on the consolidated financial statements or the Company's current awards under its existing stock-based compensation plans.
(b) New Accounting Requirements and Disclosures
In May 2014, the Financial Accounting Standards Board (“FASB”) issued ASU No. 2014-09, “Revenue from Contracts with Customers.” The ASU will supersede most of the existing revenue recognition requirements in U.S. GAAP and will require entities to recognize revenue at an amount that reflects the consideration to which the Company expects to be entitled in exchange for transferring goods or services to a customer. The new standard also requires significantly expanded disclosures regarding the qualitative and quantitative information of an entity’s nature, amount, timing, and uncertainty of revenue and cash flows arising from contracts with customers. The pronouncement is effective for annual reporting periods beginning after December 15, 2016, including interim periods within that reporting period and is to be applied retrospectively, with early application not permitted. The Company is currently evaluating the impact the pronouncement will have on the consolidated financial statements and related disclosures.
In January 2015, the FASB issued ASU No. 2015-01, “Simplifying Income Statement Presentation by Eliminating the Concept of Extraordinary Items.” This ASU eliminates from generally accepted accounting principles (“GAAP”) the concept of extraordinary items and the need for an entity to separately classify, present, and disclose extraordinary events and transactions, while retaining certain presentation and disclosure guidance for items that are unusual in nature or occur infrequently. The pronouncement is effective for annual reporting periods beginning after December 15, 2015, including interim periods within that reporting period and may be applied retrospectively, with early application permitted. The Company is currently evaluating the impact the pronouncement will have on the consolidated financial statements and related disclosures.
In February 2015, the FASB issued ASU No. 2015-02, “Amendments to the Consolidation Analysis.” The amendment eliminates the deferral of certain consolidation standards for entities considered to be investment companies and modifies the consolidation analysis performed on certain types of legal entities. The pronouncement is effective for annual reporting periods beginning after December 15, 2015, including interim periods within that reporting period and may be applied retrospectively, with early application permitted. The Company is currently evaluating the impact the pronouncement will have on the consolidated financial statements and related disclosures.
In April 2015, the FASB issued ASU No. 2015-03, “Simplifying the Presentation of Debt Issuance Costs.” The accounting guidance requires that debt issuance costs related to a recognized debt liability be reported on the Consolidated Statements of Financial Condition as a direct deduction from the carrying amount of that debt liability. The pronouncement is effective for annual reporting periods beginning after December 15, 2015, including interim periods within that reporting period with early application permitted for financial statements that have not been previously issued. The Company is currently evaluating the impact the pronouncement will have on the consolidated financial statements and related disclosures.
9
FLOTEK INDUSTRIES, INC.
NOTES TO UNAUDITED CONSOLIDATED FINANCIAL STATEMENTS
Note 3 — Acquisitions
On January 27, 2015, the Company acquired 100% of the assets of International Artificial Lift, LLC (“IAL”) for $1.3 million in cash consideration and 60,024 shares of the Company’s common stock. IAL is a development-stage company that specializes in the design, manufacturing and service of next-generation hydraulic pumping units that serve to increase and maximize production for oil and natural gas wells.
On April 1, 2014, the Company acquired 100% of the membership interests in SiteLark, LLC (“SiteLark”) for $0.4 million in cash and 5,327 shares of the Company’s common stock. SiteLark provides reservoir engineering and modeling services for a variety of hydrocarbon applications. Its services include proprietary software which assists engineers with reservoir simulation, reservoir engineering and waterflood optimization.
On January 1, 2014, the Company acquired 100% of the membership interests in Eclipse IOR Services, LLC (“EOGA”), a leading Enhanced Oil Recovery (“EOR”) design and injection firm, for $5.3 million in cash consideration, net of cash received, and 94,354 shares of the Company’s Common Stock. EOGA’s enhanced oil recovery processes and its use of polymers to improve the performance of EOR projects has been combined with the Company’s existing EOR products and services.
Note 4 — Supplemental Cash Flow Information
Supplemental cash flow information is as follows (in thousands):
Three months ended March 31, | |||||||
2015 | 2014 | ||||||
Supplemental non-cash investing and financing activities: | |||||||
Value of common stock issued in acquisitions | $ | 1,014 | $ | 1,750 | |||
Value of common stock issued in payment of accrued liability | — | 600 | |||||
Exercise of stock options by common stock surrender | 66 | 1,005 | |||||
Supplemental cash payment information: | |||||||
Interest paid | $ | 309 | $ | 360 | |||
Income taxes paid | 1,911 | 2,039 | |||||
Note 5 — Revenue
The Company differentiates revenue and cost of revenue based on whether the source of revenue is attributable to products, rentals or services. Revenue and cost of revenue by source are as follows (in thousands):
Three months ended March 31, | ||||||||
2015 | 2014 | |||||||
Revenue: | ||||||||
Products | $ | 66,160 | $ | 82,406 | ||||
Rentals | 11,824 | 13,923 | ||||||
Services | 4,389 | 6,246 | ||||||
$ | 82,373 | $ | 102,575 | |||||
Cost of revenue: | ||||||||
Products | $ | 45,624 | $ | 47,732 | ||||
Rentals | 6,285 | 6,513 | ||||||
Services | 2,042 | 2,715 | ||||||
Depreciation | 1,895 | 1,934 | ||||||
$ | 55,846 | $ | 58,894 | |||||
10
FLOTEK INDUSTRIES, INC.
NOTES TO UNAUDITED CONSOLIDATED FINANCIAL STATEMENTS
Note 6 — Inventories
Inventories are as follows (in thousands):
March 31, 2015 | December 31, 2014 | ||||||
Raw materials | $ | 55,492 | $ | 31,581 | |||
Work-in-process | 3,211 | 3,129 | |||||
Finished goods | 39,459 | 51,248 | |||||
Inventories | $ | 98,162 | $ | 85,958 | |||
Note 7 — Property and Equipment
Property and equipment are as follows (in thousands):
March 31, 2015 | December 31, 2014 | |||||||
Land | $ | 7,122 | $ | 6,780 | ||||
Buildings and leasehold improvements | 33,933 | 33,765 | ||||||
Machinery, equipment and rental tools | 85,108 | 80,731 | ||||||
Equipment in progress | 4,429 | 7,299 | ||||||
Furniture and fixtures | 2,619 | 2,528 | ||||||
Transportation equipment | 6,959 | 6,566 | ||||||
Computer equipment and software | 10,322 | 7,605 | ||||||
Property and equipment | 150,492 | 145,274 | ||||||
Less accumulated depreciation | (62,253 | ) | (59,163 | ) | ||||
Property and equipment, net | $ | 88,239 | $ | 86,111 | ||||
Depreciation expense, including expense recorded in cost of revenue, totaled $3.4 million and $3.0 million for the three months ended March 31, 2015 and 2014, respectively.
Note 8 — Goodwill and Other Intangible Assets
During the three months ended March 31, 2015, the Company recognized $1.7 million of goodwill within the Production Technologies reporting unit in connection with the acquisition of IAL. There were no impairments of goodwill recognized during the three months ended March 31, 2015.
Changes in the carrying value of goodwill for each reporting unit are as follows (in thousands):
Energy Chemistry Technologies | Consumer and Industrial Chemistry Technologies | Teledrift® | Production Technologies | Total | |||||||||||||||
Balance at December 31, 2014 | $ | 36,318 | $ | 19,480 | $ | 15,333 | $ | — | $ | 71,131 | |||||||||
Addition upon acquisition of IAL | — | — | — | 1,689 | 1,689 | ||||||||||||||
Balance at March 31, 2015 | $ | 36,318 | $ | 19,480 | $ | 15,333 | $ | 1,689 | $ | 72,820 | |||||||||
Finite lived intangible assets acquired are amortized on a straight-line basis over two to 20 years. Amortization of finite lived intangible assets acquired totaled $1.2 million and $1.2 million for the three months ended March 31, 2015 and 2014, respectively.
Amortization of deferred financing costs was $0.1 million and $0.1 million for the three months ended March 31, 2015 and 2014, respectively.
11
FLOTEK INDUSTRIES, INC.
NOTES TO UNAUDITED CONSOLIDATED FINANCIAL STATEMENTS
Note 9 — Long-Term Debt and Credit Facility
Long-term debt is as follows (in thousands):
March 31, 2015 | December 31, 2014 | ||||||
Long-term debt: | |||||||
Borrowings under revolving credit facility | $ | 17,274 | $ | 8,500 | |||
Term loan | 30,756 | 35,541 | |||||
Total long-term debt | 48,030 | 44,041 | |||||
Less current portion of long-term debt | (24,417 | ) | (18,643 | ) | |||
Long-term debt, less current portion | $ | 23,613 | $ | 25,398 | |||
Credit Facility
On May 10, 2013, the Company and certain of its subsidiaries (the “Borrowers”) entered into an Amended and Restated Revolving Credit, Term Loan and Security Agreement (the “Credit Facility”) with PNC Bank, National Association (“PNC Bank”). The Company may borrow under the Credit Facility for working capital, permitted acquisitions, capital expenditures and other corporate purposes. Under terms of the Credit Facility, as amended, the Company (a) may borrow up to $75 million under a revolving credit facility and (b) has borrowed $50 million under a term loan.
The Credit Facility is secured by substantially all of the Company’s domestic real and personal property, including accounts receivable, inventory, land, buildings, equipment and other intangible assets. The Credit Facility contains customary representations, warranties, and both affirmative and negative covenants, including a financial covenant to maintain a consolidated earnings before interest, taxes, depreciation and amortization (“EBITDA”) to debt ratio of 1.10 to 1.00, a financial covenant to maintain a ratio of funded debt to adjusted EBITDA of not greater than 4.0 to 1.0, and an annual limit on capital expenditures of approximately $34 million. The Credit Facility restricts the payment of cash dividends on common stock. In the event of default, PNC Bank may accelerate the maturity date of any outstanding amounts borrowed under the Credit Facility.
The Credit Facility includes a provision that 25% of EBITDA minus cash paid for taxes, dividends, debt payments and unfunded capital expenditures, not to exceed $3.0 million for any year, be paid within 60 days of the fiscal year end. For the year ended December 31, 2014, the excess cash flow exceeded $3.0 million. Consequently, the Company paid $3.0 million on its term loan balance to PNC Bank on March 2, 2015. This amount is classified as current debt at December 31, 2014.
Each of the Company’s domestic subsidiaries is fully obligated for Credit Facility indebtedness as a borrower or as a guarantor.
(a) Revolving Credit Facility
Under the revolving credit facility, the Company may borrow up to $75 million through May 10, 2018. This includes a sublimit of $10 million that may be used for letters of credit. The revolving credit facility is secured by substantially all of the Company’s domestic accounts receivable and inventory.
At March 31, 2015, eligible accounts receivable and inventory securing the revolving credit facility provided availability of $74.8 million under the revolving credit facility. Available borrowing capacity, net of outstanding borrowings, was $57.5 million at March 31, 2015.
The interest rate on advances under the revolving credit facility varies based on the level of borrowing under the Credit Facility. Rates range (a) between PNC Bank’s base lending rate plus 0.5% to 1.0% or (b) between the London Interbank Offered Rate (LIBOR) plus 1.5% to 2.0%. PNC Bank’s base lending rate was 3.25% at March 31, 2015. The Company is required to pay a monthly facility fee of 0.25% per annum, on any unused amount under the commitment based on daily averages. At March 31, 2015, $17.3 million was outstanding under the revolving credit facility, with $6.3 million borrowed as base rate loans at an interest rate of 3.75% and $11.0 million borrowed as LIBOR loans at an interest rate of 1.68%.
Borrowing under the revolving credit facility is classified as current debt as a result of the required lockbox arrangement and the subjective acceleration clause.
(b) Term Loan
The Company increased borrowing to $50 million under the term loan on May 10, 2013. Monthly principal payments of $0.6 million are required. The unpaid balance of the term loan is due May 10, 2018. Prepayments are permitted, and may be required
12
FLOTEK INDUSTRIES, INC.
NOTES TO UNAUDITED CONSOLIDATED FINANCIAL STATEMENTS
in certain circumstances. Amounts repaid under the term loan may not be reborrowed. The term loan is secured by substantially all of the Company’s domestic land, buildings, equipment and other intangible assets.
The interest rate on the term loan varies based on the level of borrowing under the Credit Facility. Rates range (a) between PNC Bank’s base lending rate plus 1.25% to 1.75% or (b) between LIBOR plus 2.25% to 2.75%. At March 31, 2015, $30.8 million was outstanding under the term loan, with $0.8 million borrowed as base rate loans at an interest rate of 4.50% and $30.0 million borrowed as LIBOR loans at an interest rate of 2.43%.
Note 10 — Earnings (Loss) Per Share
Basic earnings (loss) per common share is calculated by dividing net income (loss) by the weighted average number of common shares outstanding for the period. Diluted earnings (loss) per common share is calculated by dividing net income (loss) by the weighted average number of common shares outstanding combined with dilutive common share equivalents outstanding, if the effect is dilutive.
Potentially dilutive securities were excluded from the calculation of diluted earning (loss) per share for the three months ended March 31, 2015, since including them would have an anti-dilutive effect on earnings (loss) per share due to the net loss incurred during the period. Securities convertible into shares of common stock that were not considered in the diluted earnings (loss) per share calculation were 1.5 million stock options and 0.4 million restricted stock units.
Basic and diluted earnings per common share are as follows (in thousands, except per share data):
Three months ended March 31, | ||||||||
2015 | 2014 | |||||||
Net income (loss) - Basic and Diluted | $ | (1,515 | ) | $ | 12,018 | |||
Weighted average common shares outstanding - Basic | 54,448 | 53,948 | ||||||
Assumed conversions: | ||||||||
Incremental common shares from stock warrants | — | 486 | ||||||
Incremental common shares from stock options | — | 949 | ||||||
Incremental common shares from restricted stock units | — | 15 | ||||||
Weighted average common shares outstanding - Diluted | 54,448 | 55,398 | ||||||
Basic earnings (loss) per common share | $ | (0.03 | ) | $ | 0.22 | |||
Diluted earnings (loss) per common share | $ | (0.03 | ) | $ | 0.22 | |||
Note 11 — Fair Value Measurements
Fair value is defined as the amount that would be received for selling an asset or paid to transfer a liability in an orderly transaction between market participants at the measurement date. The Company categorizes financial assets and liabilities into the three levels of the fair value hierarchy. The hierarchy prioritizes the inputs to valuation techniques used to measure fair value and bases categorization within the hierarchy on the lowest level of input that is available and significant to the fair value measurement.
• | Level 1 — Quoted prices in active markets for identical assets or liabilities; |
• | Level 2 — Observable inputs other than Level 1, such as quoted prices for similar assets or liabilities, quoted prices in markets that are not active, or other inputs that are observable or can be corroborated by observable market data for substantially the full term of the assets or liabilities; and |
• | Level 3 — Significant unobservable inputs that are supported by little or no market activity or that are based on the reporting entity’s assumptions about the inputs. |
Fair Value of Other Financial Instruments
The carrying amounts of certain financial instruments, including cash and cash equivalents, accounts receivable, accounts payable and accrued expenses, approximate fair value due to the short-term nature of these accounts. The Company had no cash equivalents at March 31, 2015 or December 31, 2014.
13
FLOTEK INDUSTRIES, INC.
NOTES TO UNAUDITED CONSOLIDATED FINANCIAL STATEMENTS
The carrying value and estimated fair value of the Company’s long-term debt are as follows (in thousands):
March 31, 2015 | December 31, 2014 | ||||||||||||||
Carrying Value | Fair Value | Carrying Value | Fair Value | ||||||||||||
Term loan | $ | 30,756 | $ | 30,756 | $ | 35,541 | $ | 35,541 | |||||||
Borrowings under revolving credit facility | 17,274 | 17,274 | 8,500 | 8,500 | |||||||||||
The carrying value of the term loan and borrowings under the revolving credit facility approximate their fair value because the interest rates are variable.
Assets Measured at Fair Value on a Nonrecurring Basis
The Company’s non-financial assets, including property and equipment, goodwill and other intangible assets are measured at fair value on a non-recurring basis and are subject to fair value adjustment in certain circumstances. No impairment of any of these assets was recognized during the three months ended March 31, 2015 and 2014.
Note 12 — Income Taxes
The Company’s corporate organizational structure requires the filing of two separate consolidated U.S. Federal income tax returns. Taxable income of one group cannot be offset by tax attributes, including net operating losses, of the other group.
A reconciliation of the effective tax rate to the U.S. federal statutory tax rate is as follows:
Three months ended March 31, | ||||||
2015 | 2014 | |||||
Federal statutory tax rate | 35.0 | % | 35.0 | % | ||
State income taxes, net of federal benefit | 5.4 | 2.3 | ||||
Non-US income taxed at different rates | (23.6 | ) | — | |||
Non-deductible expenses | 5.4 | 0.1 | ||||
Domestic production activities deduction | (1.1 | ) | (2.7 | ) | ||
Effective income tax rate | 21.1 | % | 34.7 | % | ||
The decline in the effective tax rate for the three months ended March 31, 2015, compared to the three months ended March 31, 2014, was primarily due to the mix of pre-tax profit and loss between domestic and international taxing jurisdictions. The Company plans to permanently reinvest profits from international operations into opportunities to expand the Company’s international presence.
Deferred taxes are presented in the balance sheets as follows (in thousands):
March 31, 2015 | December 31, 2014 | |||||||
Current deferred tax assets | $ | 1,799 | $ | 2,696 | ||||
Non-current deferred tax assets | 13,486 | 12,907 | ||||||
Non-current deferred tax liabilities | (23,297 | ) | (25,982 | ) | ||||
Net deferred tax assets (liabilities) | $ | (8,012 | ) | $ | (10,379 | ) | ||
Note 13 — Convertible Preferred Stock and Stock Warrants
In August 2009, the Company sold convertible preferred stock with detachable warrants to purchase shares of the Company’s common stock. In February 2011, the Company exercised its contractual right to mandatorily convert all outstanding shares of convertible preferred stock into shares of common stock. Currently, the Company has no issued or outstanding shares of preferred stock.
On February 7, 2014, warrants were exercised to purchase 1,277,250 shares of the Company's common stock at $1.21 per share. The Company received cash proceeds of $1.5 million in connection with the warrants exercised. Following the exercise, the Company no longer has any outstanding warrants.
14
FLOTEK INDUSTRIES, INC.
NOTES TO UNAUDITED CONSOLIDATED FINANCIAL STATEMENTS
Note 14 — Stock Repurchase Program
In November 2012, the Company's Board of Directors authorized the repurchase of up to $25 million of the Company's common stock. Repurchases may be made in the open market or through privately negotiated transactions. During the three months ended March 31, 2015, the Company repurchased 180,190 shares of its outstanding common stock on the open market at a cost of $2.7 million, inclusive of transaction costs, or an average price of $14.71 per share.
As of March 31, 2015, the Company has $12.0 million remaining under its share repurchase program.
Note 15 — Business Segment, Geographic and Major Customer Information
Segment Information
Operating segments are defined as components of an enterprise for which separate financial information is available that is regularly evaluated by chief operating decision-makers in deciding how to allocate resources and assess performance. The operations of the Company are categorized into four reportable segments: Energy Chemistry Technologies (previously referred to as Energy Chemical Technologies), Consumer and Industrial Chemistry Technologies (previously referred to as Consumer and Industrial Chemical Technologies), Drilling Technologies and Production Technologies.
• | Energy Chemistry Technologies designs, develops, manufactures, packages and markets specialty chemistries used in oil and natural gas well drilling, cementing, completion, stimulation and production. In addition, the Company's chemistries are used in specialized enhanced and improved oil recovery markets. Activities in this segment also include construction and management of automated material handling facilities and management of loading facilities and blending operations for oilfield services companies. |
• | Consumer and Industrial Chemistry Technologies designs, develops and manufactures products that are sold to companies in the flavor and fragrance industries and the specialty chemical industry. These technologies are used by beverage and food companies, fragrance companies, and companies providing household and industrial cleaning products. |
• | Drilling Technologies rents, sells, inspects, manufactures and markets downhole drilling equipment used in energy, mining, water well and industrial drilling activities. |
• | Production Technologies assembles and markets production-related equipment, including the PetrovalveTM product line of rod pump components, electric submersible pumps, gas separators, valves and services that support natural gas and oil production activities. |
The Company evaluates performance based upon a variety of criteria. The primary financial measure is segment operating income. Various functions, including certain sales and marketing activities and general and administrative activities, are provided centrally by the corporate office. Costs associated with corporate office functions, other corporate income and expense items, and income taxes, are not allocated to reportable segments.
15
FLOTEK INDUSTRIES, INC.
NOTES TO UNAUDITED CONSOLIDATED FINANCIAL STATEMENTS
Summarized financial information of the reportable segments is as follows (in thousands):
As of and for the three months ended March 31, | Energy Chemistry Technologies | Consumer and Industrial Chemistry Technologies | Drilling Technologies | Production Technologies | Corporate and Other | Total | |||||||||||||||||
2015 | |||||||||||||||||||||||
Net revenue from external customers | $ | 46,643 | $ | 13,463 | $ | 18,694 | $ | 3,573 | $ | — | $ | 82,373 | |||||||||||
Gross margin | 16,100 | 3,706 | 5,991 | 730 | — | 26,527 | |||||||||||||||||
Income (loss) from operations | 6,821 | 2,381 | (637 | ) | (539 | ) | (9,315 | ) | (1,289 | ) | |||||||||||||
Depreciation and amortization | 1,204 | 552 | 2,319 | 125 | 370 | 4,570 | |||||||||||||||||
Total assets | 152,423 | 92,438 | 141,229 | 25,176 | 3,741 | 415,007 | |||||||||||||||||
Capital expenditures | 2,361 | 22 | 2,124 | 638 | 445 | 5,590 | |||||||||||||||||
2014 | |||||||||||||||||||||||
Net revenue from external customers | $ | 62,377 | $ | 13,030 | $ | 24,901 | $ | 2,267 | $ | — | $ | 102,575 | |||||||||||
Gross margin | 29,220 | 4,033 | 9,788 | 640 | — | 43,681 | |||||||||||||||||
Income (loss) from operations | 21,623 | 2,335 | 3,317 | (79 | ) | (8,398 | ) | 18,798 | |||||||||||||||
Depreciation and amortization | 1,067 | 433 | 2,437 | 70 | 212 | 4,219 | |||||||||||||||||
Total assets | 137,638 | 93,217 | 136,141 | 14,864 | 8,656 | 390,516 | |||||||||||||||||
Capital expenditures | 1,386 | 14 | 3,296 | 61 | 233 | 4,990 | |||||||||||||||||
Geographic Information
Revenue by country is based on the location where services are provided and products are used. No individual country other than the United States (“U.S.”) accounted for more than 10% of revenue. Revenue by geographic location is as follows (in thousands):
Three months ended March 31, | ||||||||
2015 | 2014 | |||||||
U.S. | $ | 64,195 | $ | 87,331 | ||||
Other countries | 18,178 | 15,244 | ||||||
Total | $ | 82,373 | $ | 102,575 | ||||
Long-lived assets held in countries other than the U.S. are not considered material to the consolidated financial statements.
Major Customers
Revenue from major customers, as a percentage of consolidated revenue, is as follows:
Three months ended March 31, | ||||||
2015 | 2014 | |||||
Customer A | 12.0 | % | * | |||
Customer B | 10.3 | % | 15.4 | % | ||
* This customer did not account for more than 10% of revenue during the period.
Over 93% of the revenue from these customers was for sales in the Energy Chemistry Technologies segment.
16
FLOTEK INDUSTRIES, INC.
NOTES TO UNAUDITED CONSOLIDATED FINANCIAL STATEMENTS
Note 16 — Commitments and Contingencies
Litigation
The Company is subject to routine litigation and other claims that arise in the normal course of business. Management is not aware of any pending or threatened lawsuits or proceedings that are expected to have a material effect on the Company’s financial position, results of operations or liquidity.
EPA Environmental Proceeding
On January 9, 2015, FC Pro, LLC (“FC Pro”), a wholly-owned subsidiary of the Company, received a letter and proposed consent agreement and final order from the United States Environmental Protection Agency (“EPA”) concerning alleged violations of the federal hazardous waste regulations at FC Pro’s specialty chemical blending facility in Waller, Texas. Specifically, EPA alleged that FC Pro failed to comply with certain notification, operating, and reporting requirements applicable to generators or large quantity generators of hazardous waste. FC Pro has resolved the alleged violations pursuant to a consent agreement and final order under which it did not admit or deny the allegations and agreed to pay an administrative penalty of $410,868, obtain an EPA identification number, and develop certain specified operating procedures. The consent agreement and final order has been signed by EPA and will become final upon being ratified by the regional judicial officer. Since this enforcement case was initiated, FC Pro has made changes to its operating practices at its Waller facility that it believes has resulted in it no longer generating hazardous waste at that facility.
The amount of the civil penalty has been recorded as selling, general and administrative expense during the three months ended March 31, 2015.
Concentrations and Credit Risk
The majority of the Company’s revenue is derived from the oil and gas industry. Customers include major oilfield services companies, major integrated oil and natural gas companies, independent oil and natural gas companies, pressure pumping service companies and state-owned national oil companies. This concentration of customers in one industry increases credit and business risks.
The Company is subject to significant concentrations of credit risk within trade accounts receivable as the Company does not generally require collateral as support for trade receivables. In addition, the majority of the Company’s cash is maintained at a major financial institution and balances often exceed insurable amounts.
17
Item 2. Management’s Discussion and Analysis of Financial Condition and Results of Operations
Forward-Looking Statements
This Quarterly Report on Form 10-Q (the “Quarterly Report”), and in particular, Part I, Item 2 - “Management’s Discussion and Analysis of Financial Condition and Results of Operations,” contains “forward-looking statements” within the meaning of the safe harbor provisions, 15 U.S.C. § 78u-5, of the Private Securities Litigation Reform Act of 1995 (the “Reform Act”). Forward-looking statements are not historical facts, but instead represent the Company’s current assumptions and beliefs regarding future events, many of which, by their nature, are inherently uncertain and outside the Company’s control. Such statements include estimates, projections, and statements related to Flotek Industries, Inc.’s (“Flotek” or the “Company”) business plan, objectives, expected operating results and assumptions upon which those statements are based. The forward-looking statements contained in this Quarterly Report are based on information available as of the date of this Quarterly Report.
The forward-looking statements relate to future industry trends and economic conditions, forecast performance or results of current and future initiatives and the outcome of contingencies and other uncertainties that may have a significant impact on the Company’s business, future operating results and liquidity. These forward-looking statements generally are identified by words including, but not limited to, “anticipate,” “believe,” “estimate,” “continue,” “intend,” “expect,” “plan,” “forecast,” “project” and similar expressions, or future-tense or conditional constructions such as “will,” “may,” “should,” “could” and “would,” or the negative thereof or other variations thereon or comparable terminology. The Company cautions that these statements are merely predictions, and are not to be considered guarantees of future performance. Forward-looking statements are based upon current expectations and assumptions that are subject to risks and uncertainties that can cause actual results to differ materially from those projected, anticipated or implied.
A detailed discussion of potential risks and uncertainties that could cause actual results and events to differ materially from forward-looking statements is included in Part I, Item 1A - “Risk Factors” of the Annual Report on Form 10-K for the year ended December 31, 2014, (the “Annual Report”) and periodically in subsequent reports filed with the Securities and Exchange Commission (the “SEC”). The Company has no obligation to publicly update or revise any forward-looking statements, whether as a result of new information or future events, except as required by law.
Management’s Discussion and Analysis of Financial Condition and Results of Operations (“MD&A”) should be read in conjunction with the unaudited consolidated financial statements and the related notes thereto, as well as the Annual Report. Phrases such as “Company,” “we,” “our” and “us” refer to Flotek Industries, Inc. and its subsidiaries.
Executive Summary
Flotek is a global, diversified, technology-driven company that develops and supplies oilfield products, services and equipment to the oil, gas and mining industries, and high value compounds to companies that make cleaning products, cosmetics, food and beverages, and other products that are sold in the consumer and industrial markets.
The Company’s oilfield businesses include specialty chemistries and logistics, downhole drilling tools and production-related tools. Flotek’s technologies enable customers to drill wells more efficiently, increase well production and decrease well operating costs. The Company also provides automated bulk material handling, loading facilities and blending capabilities. The Company sources citrus oil domestically and internationally and is one of the largest processors of citrus oil in the world. Products produced from processed citrus oil include (1) high value compounds used as additives by companies in the flavors and fragrances markets and (2) environmentally friendly chemistries for use in numerous industries around the world, specifically the oil and gas (“O&G”) industry.
Flotek operates in over 20 domestic and international markets, including the Gulf Coast, Southwest, West Coast, Rocky Mountains, Northeastern and Mid-Continental regions of the United States (the “U.S.”), Canada, Mexico, Central America, South America, Europe, Africa, Middle East, Australia and Asia-Pacific. Customers include major integrated O&G companies, oilfield services companies, independent O&G companies, pressure-pumping service companies, national and state-owned oil companies, and international supply chain management companies. The Company also serves customers who purchase non-energy-related citrus oil and related products, including household and commercial cleaning product companies, fragrance and cosmetic companies, and food manufacturing companies.
18
The operations of the Company are categorized into four reportable segments: Energy Chemistry Technologies (previously referred to as Energy Chemical Technologies), Consumer and Industrial Chemistry Technologies (previously referred to as Consumer and Industrial Chemical Technologies), Drilling Technologies and Production Technologies.
• | Energy Chemistry Technologies designs, develops, manufactures, packages and markets specialty chemistries used in O&G well drilling, cementing, completion, stimulation and production. In addition, the Company's chemistries are used in specialized enhanced and improved oil recovery markets ("EOR" or "IOR"). Activities in this segment also include construction and management of automated material handling facilities and management of loading facilities and blending operations for oilfield services companies. |
• | Consumer and Industrial Chemistry Technologies designs, develops and manufactures products that are sold to companies in the flavor and fragrance industries and the specialty chemistry industry. These technologies are used by beverage and food companies, fragrance companies, and companies providing household and industrial cleaning products. |
• | Drilling Technologies rents, sells, inspects, manufactures and markets downhole drilling equipment used in energy, mining, water well and industrial drilling activities. |
• | Production Technologies assembles and markets production-related equipment, including the PetrovalveTM product line of rod pump components, electric submersible pumps, gas separators, valves and services that support natural gas and oil production activities. |
Market Conditions
The Company’s success is sensitive to a number of factors, which include, but are not limited to, drilling activity, customer demand for its advanced technology products, market prices for raw materials and governmental actions.
Drilling activity levels are influenced by a number of factors, including the number of rigs in operation, the geographical areas of rig activity, and drill rig efficiency (rig days required per well). Additional factors that influence the level of drilling activity include:
• | Historical, current, and anticipated future O&G prices, |
• | Federal, State and local governmental actions that may encourage or discourage drilling activity, |
• | Customers’ strategies relative to capital funds allocations, |
• | Weather conditions, and |
• | Technological changes to drilling methods and economics. |
Historical North American drilling activity is reflected in “TABLE A” on the following page.
Customers’ demand for advanced technology products and services provided by the Company are dependent on their recognition of the value of:
• | Chemistries that improve the economics of their O&G operations, |
• | Drilling products that improve drilling operations and efficiencies, |
• | Chemistries that are economically viable, socially responsible and ecologically sound, and |
• | Production technologies that improve production and production efficiencies in maturing wells. |
Market prices for citrus oils can be influenced by:
• | Historical, current, and anticipated future production levels of the global citrus (primarily orange) crop, |
• | Weather related risks, |
• | Health and condition of citrus trees (e.g., disease and pests), and |
• | International competition and pricing pressures resulting from natural and artificial pricing influences. |
Governmental actions may restrict the future use of hazardous chemicals, including but not limited to, the following industrial applications:
• | O&G drilling and completion operations, |
• | O&G production operations, and |
• | Non-O&G industrial solvents. |
19
TABLE A | |||||||||
Three months ended March 31, | |||||||||
2015 | 2014 | % Change | |||||||
North American Average Active Drilling Rigs | |||||||||
U.S. | 1,403 | 1,779 | (21.1 | )% | |||||
Canada | 313 | 525 | (40.4 | )% | |||||
Total Average North American Drilling Rigs | 1,716 | 2,304 | (25.5 | )% | |||||
U.S. Average Active Drilling Rigs by Type | |||||||||
Vertical | 217 | 387 | (43.9 | )% | |||||
Horizontal | 1,055 | 1,182 | (10.7 | )% | |||||
Directional | 131 | 210 | (37.6 | )% | |||||
Total Average U.S. Drilling Rigs by Type | 1,403 | 1,779 | (21.1 | )% | |||||
Oil vs. Natural Gas Average North American Drilling Rigs | |||||||||
Oil | 1,257 | 1,766 | (28.8 | )% | |||||
Natural Gas | 459 | 538 | (14.7 | )% | |||||
Total North America | 1,716 | 2,304 | (25.5 | )% | |||||
Source: Rig count is per Baker Hughes, Inc. (www.bakerhughes.com). Rig counts are the averages of the weekly rig count activity.
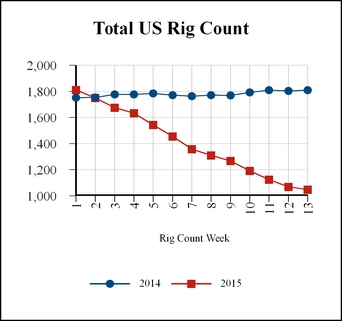
As crude oil prices peaked at approximately $106/barrel in June 2014 and began the descent to the current levels hovering around $50/barrel, total US rig count decreased from 1,929 rigs on November 21, 2014, to 1,048 rigs as of March 27, 2015, representing a 45.6% drop. Additionally, as the total US rig count dropped, the horizontal rig count declined 40.8%, the directional rig count decreased by 55.1%, and the vertical rig count fell by 59.1%. Horizontal rigs now represent 77.5% of the total working US rig count, versus 71.1% at the peak US drilling activity level in November 2014.
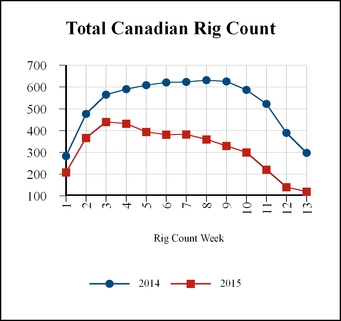
The Canadian rig count has had a similar response. Canadian rigs failed to reach the 600 - 700 rig range normally achieved from mid-January through early March before the spring thaw resulted in significantly reduced drilling activity. The Canadian rig count peaked on January 16, 2015, at 440 rigs and has fallen continuously through March 27, 2015, to 120 rigs.
During the three months ended March 31, 2015, the total North American active drilling rig count decreased 25.5% when compared to the same period of 2014. The average North American oil drilling rig count decreased by 28.8% for the three months ended March 31, 2015, when compared to the same period of 2014. The average North American natural gas drilling rig count decreased 14.7% for the three months ended March 31, 2015, compared to the same period of 2014.
20
Company Outlook
Beginning in the second half of 2014 and continuing through the first quarter of 2015, the price of crude oil declined dramatically. As a result, most North American exploration and production companies - many of which are Flotek clients - are significantly reducing their exploration and drilling activity in 2015. The reduction in activity creates a more challenging environment in which to market the Company's broad range of energy technologies, from chemistry to drilling and production technologies. Although the Company expects demand for its oil and gas related products and services in North America to be impacted by these industry conditions, the Company plans to continue aggressive marketing of its oil and gas based products and services including its Complex nano-Fluid® chemistries, Teledrift® product line, recently introduced Stemulator® product line and the growing line of production technologies. While international markets may react differently than North American markets to the decline in crude prices, the Company expects similar market challenges around the globe. However, the Company believes there will continue to be new market opportunities available in the current price environment.
In response to the current market environment, the Company has been proactive in reducing costs to reflect current market conditions while, at the same time, remaining focused on preserving appropriate functions and capacity, which allows the Company to be opportunistic when market conditions improve. Cost reductions to date include the consolidation of certain operating bases, reducing lease and personnel expense; other headcount reductions and hiring restrictions that have not impacted customer service or production output; vendor price reductions that have partially mitigated gross margin erosion; and other cost controls that have reduced overall operating costs of our business. Capital spending has largely been limited to completion of existing projects with a focus on revenue-generating expenditures. The Company regularly evaluates its cost structure based on market conditions with a focus on continuous efficiency improvements.
Capital expenditures, exclusive of acquisitions, totaled $5.6 million and $5.0 million for the three months ended March 31, 2015 and 2014, respectively. Of the $5.6 million spent to date in 2015, 89% has been for the completion of projects started in 2014. The Company expects capital spending to be approximately $21 million in 2015, inclusive of approximately $8 million for construction of major facilities, including the Company’s previously announced Global Research & Innovation Headquarters in Houston. The Company believes construction of this facility should generate substantial value in 2016 and beyond. The Company will remain nimble in its core capital expenditure plans, adjusting as market conditions warrant.
The Company’s planned Global Research & Innovation Headquarters in Houston will allow for the development of new energy chemistries as well as expand collaboration between clients, leaders from academia and Company scientists. The Company believes these collaborative opportunities will become an important and distinguishing capability within the industry. The Company also plans to continue to expand the capabilities and use of its patent pending FracMaxTM software which should continue to enhance the Company’s sales and marketing efforts by validating the production and economic benefits of the Company’s core Complex nano-Fluid® chemistries.
The FracMax™ analytical platform is an innovative software technology that allows the Company to quantitatively demonstrate the benefits associated with the use of the Company’s patented and proprietary Complex nano-Fluid® chemistries. The FracMax™ application has been integrated into the Company’s sales and marketing process leading to new sales opportunities. In October 2014, the Company announced the formation of FracMax Analytics, LLC, a wholly owned subsidiary that will use the FracMax™ analytical platform to provide customized data analysis to oil and gas operators, investors and other companies.
The Company continues to pursue selected strategic relationships, both domestically and internationally, to expand its business:
In March 2015, the Company entered into agreements with Solazyme, Inc (“Solazyme”) to globally commercialize Flocapso™, an innovative, advanced drilling fluid additive that combines Flotek’s patented Complex nano-Fluid® chemistries with Solazyme’s proprietary EncapsoTM technology. FlocapsoTM will allow the use of water-based fluids in wells that previously required more expensive and invasive oil-based products, providing an environmentally superior, more efficient solution to drilling challenges. In addition, Flotek will market Solazyme’s Encapso™ lubricant - the first commercially available, biodegradable encapsulated lubricant for drilling fluids - in certain Middle Eastern markets.
In January 2015, the Company acquired 100% of the assets from International Artificial Lift, LLC (“IAL”), a development-stage company that specializes in the design, manufacturing and service of next-generation hydraulic pumping units that serve to increase and maximize production for oil and natural gas wells.
In April 2014, the Company acquired 100% of the membership interests in SiteLark, LLC (“SiteLark”). SiteLark provides reservoir engineering and modeling services for a variety of hydrocarbon applications. Its service assists engineers with reservoir simulation, reservoir engineering and waterflood optimization.
21
In January 2014, the Company acquired Eclipse IOR Services, LLC (“EOGA”), a leading enhanced oil recovery design and injection firm. EOGA’s expertise in enhanced oil recovery processes and the use of polymers to improve the performance of EOR projects have been combined with the Company’s previously existing EOR products and services.
The outlook for the Company’s consumer and industrial chemistries will be driven by availability and demand for citrus oils and other bio-based raw materials. Current inventory and crop expectations are sufficient to meet the Company’s needs to supply its flavor and fragrance business as well as the industrial markets. However, market price volatility may result in revenue and margin fluctuations from quarter-to-quarter.
Changes to geopolitical, global economic and industry trends could have an impact, either positive or negative, on the Company’s business. In the event of significant adverse changes to the demand for oil and gas production and/or the market price for oil and gas, the market conditions affecting the Company could change rapidly and materially. Should such adverse changes to market conditions occur, management believes the Company has adequate liquidity to withstand the impact of such changes while continuing to make strategic capital investments and acquisitions if and when opportunities arise. In addition, management believes the Company is well-positioned to take advantage of significant increases in demand for its products should market conditions improve dramatically in the near term.
The Company expects that competition for contracts and margins will remain intense but that product innovation, service improvements and data from its FracMax™ analytical platform will enable the Company to realize relative market share gains during the remainder of 2015 and into 2016.
22
Consolidated Results of Operations (in thousands):
Three months ended March 31, | |||||||
2015 | 2014 | ||||||
Revenue | $ | 82,373 | $ | 102,575 | |||
Cost of revenue | 55,846 | 58,894 | |||||
Gross margin | 26,527 | 43,681 | |||||
Gross margin % | 32.2 | % | 42.6 | % | |||
Selling, general and administrative costs | 23,888 | 21,572 | |||||
Selling, general and administrative costs % | 29.0 | % | 21.0 | % | |||
Depreciation and amortization | 2,676 | 2,285 | |||||
Research and innovation costs | 1,252 | 1,026 | |||||
Income (loss) from operations | (1,289 | ) | 18,798 | ||||
Income (loss) from operations % | (1.6 | )% | 18.3 | % | |||
Interest and other expense, net | (632 | ) | (400 | ) | |||
Income (loss) before income taxes | (1,921 | ) | 18,398 | ||||
Income tax benefit (expense) | 406 | (6,380 | ) | ||||
Net income (loss) | $ | (1,515 | ) | $ | 12,018 | ||
Net income (loss) % | (1.8 | )% | 11.7 | % | |||
Consolidated Results of Operations: Three Months Ended March 31, 2015, Compared to the Three Months Ended March 31, 2014
Consolidated revenue for the three months ended March 31, 2015, decreased $20.2 million, or 19.7%, relative to the comparable period of 2014. The decrease in revenue was driven by the decline in drilling activity as indicated by the 25.5% decline in North American rig count which affected the Energy Chemistry Technologies and Drilling Technologies segments.
Consolidated gross margin for the three months ended March 31, 2015, decreased $17.2 million, or 39.3%, relative to the comparable period of 2014. Gross margin as a percentage of revenue decreased to 32.2% for the three months ended March 31, 2015, from 42.6% in the same period of 2014, primarily due to new incentive pricing structures for strategic relationships, product mix and price concessions.
Selling, general and administrative (“SG&A”) expenses are not directly attributable to products sold or services provided. SG&A expenses for the three months ended March 31, 2015, increased $2.3 million, or 10.7%, relative to the comparable period of 2014. The increase was primarily due to higher stock compensation expense, increased head count in the Energy Chemistry sales and R&I staff during 2014, and a civil penalty related to an environmental matter assessed in 2015, partially offset by cost reduction actions taken throughout the organization during the first quarter of 2015. The company regularly evaluates its SG&A cost structure as market conditions warrant.
Depreciation and amortization expense for the three months ended March 31, 2015, increased by $0.4 million, or 17.1%, relative to the comparable periods of 2014. The increase was primarily attributable to the depreciation and amortization of improvements to facilities and equipment that were added during the later portion of 2014.
Research and Innovation (“R&I”) expense increased $0.2 million, or 22.0%, for the three months ended March 31, 2015, as compared to the same period in 2014. The increase in R&I is primarily attributable to new product development and Flotek’s commitment to remaining responsive to customer needs, increased demand and continued growth of our existing product lines.
Interest and other expense increased $0.2 million for the three months ended March 31, 2015, compared to the same period of 2014.
The Company recorded income tax benefit of $0.4 million, yielding an effective tax rate of 21.1% for the three months ended March 31, 2015, compared to the income tax provision of $6.4 million reflecting an effective tax rate of 34.7% for the comparable period in 2014. The reduction in the effective tax rate is primarily attributable to the mix of pre-tax profit and loss between domestic and international taxing jurisdictions.
23
Results by Segment
Energy Chemistry Technologies (previously referred to as Energy Chemical Technologies) (dollars in thousands) | |||||||||
Three months ended March 31, | |||||||||
2015 | 2014 | ||||||||
Revenue | $ | 46,643 | $ | 62,377 | |||||
Gross margin | 16,100 | 29,220 | |||||||
Gross margin % | 34.5 | % | 46.8 | % | |||||
Income from operations | 6,821 | 21,623 | |||||||
Income from operations % | 14.6 | % | 34.7 | % | |||||
Energy Chemistry Technologies Results of Operations: Three Months Ended March 31, 2015, Compared to the Three Months Ended March 31, 2014
Energy Chemistry Technologies revenue for the three months ended March 31, 2015, decreased $15.7 million, or 25.2%, relative to the comparable period of 2014. This reduction in revenue virtually mirrored the decrease in the North American active drilling rig count of 25.5% over the comparable periods. While eroding market conditions are the primary driver of the revenue decrease, Flotek has aggressively pursued strategic relationships with existing customers and has continued to promote the benefits of CnF® in completions and restimulation efforts by leveraging the quantitative evidence validated through the FracMax™ analytical platform. These strategic sales and marketing efforts are ensuring that Flotek remains a leader in the energy chemistry industry and is poised to take advantage of any market recovery.
Energy Chemistry Technologies gross margin decreased $13.1 million, or 44.9%, for the three months ended March 31, 2015, compared to the same period of 2014. Gross margin as a percentage of revenue decreased to 34.5% for the three months ended March 31, 2015, from 46.8% in the same period of 2014, primarily due to new incentive pricing structures associated with new strategic relationships and product mix.
Income from operations for the Energy Chemistry Technologies segment decreased $14.8 million, or 68.5%, for the three months ended March 31, 2015, relative to the comparable periods of 2014. The decrease in income from operations is primarily attributable to the decrease in gross margin, increased headcount during 2014 in the sales organization, in pursuit of growth opportunities, and in R&I, related to new product development and increased demand for existing product support, and a civil penalty related to an environmental matter. During the three months ended March 31, 2015, the Energy Chemistry Technologies segment implemented cost control measures including a 10% decrease in compensation and benefits associated with headcount reductions to more closely align the segment staffing with current market conditions.
Consumer and Industrial Chemistry Technologies (previously referred to as Consumer and Industrial Chemical Technologies) (dollars in thousands) | |||||||||
Three months ended March 31, | |||||||||
2015 | 2014 | ||||||||
Revenue | $ | 13,463 | $ | 13,030 | |||||
Gross margin | 3,706 | 4,033 | |||||||
Gross margin % | 27.5 | % | 31.0 | % | |||||
Income from operations | 2,381 | 2,335 | |||||||
Income from operations % | 17.7 | % | 17.9 | % | |||||
Consumer and Industrial Chemistry Technologies (CICT) Results of Operations: Three Months Ended March 31, 2015, Compared to the Three Months Ended March 31, 2014
CICT revenue for the three months ended March 31, 2015, increased $0.4 million, or 3.3%, compared to the same period in 2014, primarily due to increased terpene prices between the two periods.
24
CICT gross margin for the three months ended March 31, 2015, decreased $0.3 million, or 8.1%, from the comparable period of 2014, primarily due to the higher terpene costs partially offset by increased prices. Gross margin as a percentage of revenue decreased to 27.5% for the three months ended March 31, 2015, from 31.0% in the same period of 2014, primarily due to increased terpene costs.
Income from operations for the CICT segment remained relatively flat for the three months ended March 31, 2015 compared to the same period of 2014, as reductions in compensation and benefits associated with headcount reductions offset the gross margin factors described above.
Drilling Technologies (dollars in thousands) | |||||||||
Three months ended March 31, | |||||||||
2015 | 2014 | ||||||||
Revenue | $ | 18,694 | $ | 24,901 | |||||
Gross margin | 5,991 | 9,788 | |||||||
Gross margin % | 32.0 | % | 39.3 | % | |||||
Income (loss) from operations | (637 | ) | 3,317 | ||||||
Income (loss) from operations % | (3.4 | )% | 13.3 | % | |||||
Drilling Technologies Results of Operations: Three Months Ended March 31, 2015, Compared to the Three Months Ended March 31, 2014
Drilling Technologies revenue for the three months ended March 31, 2015, decreased $6.2 million, or 24.9%, relative to the same period in 2014, primarily due to a decrease in actuated tool rentals, Teledrift® tool rentals, and decreases in float and motor equipment product sales.
• | Rental revenue for the three months ended March 31, 2015, decreased by $2.0 million, or 14.6%, compared to the same period of 2014. The decrease can be attributed to a decline in actuated tool rental orders and a reduction in Teledrift® tool rental jobs which was due to the drop in the U.S. rig count in the first quarter. Pricing pressure in the market also caused decreased average revenues per job. |
• | Product sales revenue for the three months ended March 31, 2015, compared to the same period of 2014, decreased by $2.7 million, or 35.7%, due to decreased float equipment, centralizers and motor part sales. |
• | Service revenue for the three months ended March 31, 2015, decreased $1.5 million, or 42.8%, compared to the same period of 2014. The decrease in service revenue was primarily related to decreased Teledrift® service charges and fees. |
Drilling Technologies gross margin for the three months ended March 31, 2015, decreased $3.8 million, or 38.8%, from the comparable period of 2014. This is primarily due to the volume decrease in the quarter, motor rental fixed costs, and reductions in pricing for actuated tools and Teledrift® tools.
Drilling Technologies income from operations for the three months ended March 31, 2015, declined by $4.0 million, compared to the same period of 2014. Income from operations as a percentage of revenue decreased 16.7% for the three months ended March 31, 2015, compared to the same period of 2014. Reduced revenue from lower volumes and pricing, plus fixed depreciation and amortization costs negatively impacted operating income which was partially offset by cost control measures put in place during the first quarter including a 16% reduction in headcount, consolidation of select locations and other direct expense controls.
Production Technologies (dollars in thousands) | |||||||||
Three months ended March 31, | |||||||||
2015 | 2014 | ||||||||
Revenue | $ | 3,573 | $ | 2,267 | |||||
Gross margin | 730 | 640 | |||||||
Gross margin % | 20.4 | % | 28.2 | % | |||||
Income (loss) from operations | (539 | ) | (79 | ) | |||||
Income (loss) from operations % | (15.1 | )% | (3.5 | )% | |||||
25
Production Technologies Results of Operations: Three Months Ended March 31, 2015, Compared to the Three Months Ended March 31, 2014
Revenue for the Production Technologies segment for the three months ended March 31, 2015, increased by $1.3 million, or 57.6%, from the same period in 2014 due to increased sales of rod pump equipment from a new location opened in the third quarter of 2014.
Production Technologies gross margin increased by $0.1 million, or 14.1%, for the three months ended March 31, 2015, compared to the same period in 2014, while gross margin as a percentage of revenue declined from 28.2% to 20.4%. The decline was due to product mix and increased direct costs, including salaries and supplies, related to the expansion of locations and product lines.
Production Technologies income from operations decreased by $0.5 million, for the three months ended March 31, 2015, compared to the same period in 2014. The decline was due to expense associated with selling and R & I activities as the segment continues to position itself for growth opportunities in the market. These activities include preparing new product and service offerings to be introduced in 2015, including those associated with the IAL acquisition in January 2015 which are in the process of being introduced commercially.
Off-Balance Sheet Arrangements
There have been no transactions that generate relationships with unconsolidated entities or financial partnerships, such as entities often referred to as “structured finance” or “special purpose entities” (“SPEs”), established for the purpose of facilitating off-balance sheet arrangements or other contractually narrow or limited purposes. As of March 31, 2015, the Company was not involved in any unconsolidated SPEs.
The Company has not made any guarantees to customers or vendors nor does the Company have any off-balance sheet arrangements or commitments that have, or are reasonably likely to have, a current or future effect on the Company’s financial condition, change in financial condition, revenue, expenses, results of operations, liquidity, capital expenditures or capital resources that would be material to investors.
Critical Accounting Policies and Estimates
The Company’s Financial Statements have been prepared in accordance with accounting principles generally accepted in the United States of America (“GAAP”). Preparation of these statements requires management to make judgments, estimates and assumptions that affect the amounts reported in the financial statements and accompanying footnotes. Part II, Item 8, Financial Statements and Supplementary Data, Note 2 of "Notes to Unaudited Consolidated Financial Statements" and Part II, Item 7, Management’s Discussion and Analysis of Financial Conditions and Results of Operations, “Critical Accounting Policies and Estimates” of the Company’s Annual Report, and the “Notes to Unaudited Consolidated Financial Statements” of this Quarterly Report describe the significant accounting policies and critical accounting estimates used to prepare the consolidated financial statements. Critical accounting policies and estimates are defined as those that are both most important to the portrayal of the Company’s financial condition and results of operations and require management’s most subjective judgments. The Company regularly reviews and challenges judgments, assumptions and estimates related to critical accounting policies. The Company’s estimates and assumptions are based on historical experience and expected changes in the business environment; however, actual results may materially differ from the estimates.
As part of any acquisition process, the Company reaffirms policies and estimates surrounding business combinations in accordance with GAAP, specifically utilizing the guidance of Accounting Standards Codification (“ASC”) Topic 805, “Business Combinations.” ASC Topic 805 requires an acquiring entity in a transaction to recognize all of the identifiable assets acquired and liabilities assumed at their estimated fair values on the acquisition date, to recognize and measure pre-acquisition contingencies, including contingent consideration, at fair value (if possible), to remeasure liabilities related to contingent consideration at fair value in each subsequent reporting period and to expense all acquisition relates costs. Though the Company has followed business combination accounting guidance, there have been no significant changes in the Company’s critical accounting estimates during the three months ended March 31, 2015.
26
Application of New Accounting Standards
Effective January 1, 2015, the Company adopted the accounting guidance in Accounting Standards Update (“ASU”) No. 2014-08, “Presentation of Financial Statements and Property, Plant, and Equipment - Reporting Discontinued Operations and Disclosures of Disposals of Components of an Entity,” which amends the definition of a discontinued operation by raising the threshold for a disposal to qualify as discontinued operations. The ASU will also require entities to provide additional disclosures about discontinued operations as well as disposal transactions that do not meet the discontinued operations criteria. Implementation of this standard did not have a material effect on the consolidated financial statements.
Effective January 1, 2015, the Company adopted the accounting guidance in ASU No. 2014-12, “Accounting for Share-Based Payments When the Terms of an Award Provide That a Performance Target Could Be Achieved after the Requisite Service Period.” The ASU requires that a performance target that affects vesting and that could be achieved after the requisite service period be treated as a performance condition. As such, the performance target should not be reflected in estimating the grant-date fair value of the award. Implementation of this standard did not have a material effect on the consolidated financial statements or the Company's current awards under its existing stock-based compensation plans.
New Accounting Requirements and Disclosures
In May 2014, the Financial Accounting Standards Board (“FASB”) issued ASU No. 2014-09, “Revenue from Contracts with Customers.” The ASU will supersede most of the existing revenue recognition requirements in U.S. GAAP and will require entities to recognize revenue at an amount that reflects the consideration to which the Company expects to be entitled in exchange for transferring goods or services to a customer. The new standard also requires significantly expanded disclosures regarding the qualitative and quantitative information of an entity's nature, amount, timing, and uncertainty of revenue and cash flows arising from contracts with customers. The pronouncement is effective for annual reporting periods beginning after December 15, 2016, including interim periods within that reporting period and is to be applied retrospectively, with early application not permitted. The Company is currently evaluating the impact the pronouncement will have on the consolidated financial statements and related disclosures.
In January 2015, the FASB issued ASU No. 2015-01, “Simplifying Income Statement Presentation by Eliminating the Concept of Extraordinary Items.” This ASU eliminates from generally accepted accounting principles (“GAAP”) the concept of extraordinary items and the need for an entity to separately classify, present, and disclose extraordinary events and transactions, while retaining certain presentation and disclosure guidance for items that are unusual in nature or occur infrequently. The pronouncement is effective for annual reporting periods beginning after December 15, 2015, including interim periods within that reporting period and may be applied retrospectively, with early application permitted. The Company is currently evaluating the impact the pronouncement will have on the consolidated financial statements and related disclosures.
In February 2015, the FASB issued ASU No. 2015-02, “Amendments to the Consolidation Analysis.” The amendment eliminates the deferral of certain consolidation standards for entities considered to be investment companies and modifies the consolidation analysis performed on certain types of legal entities. The pronouncement is effective for annual reporting periods beginning after December 15, 2015, including interim periods within that reporting period and may be applied retrospectively, with early application permitted. The Company is currently evaluating the impact the pronouncement will have on the consolidated financial statements and related disclosures.
In April 2015, the FASB issued ASU No. 2015-03, “Simplifying the Presentation of Debt Issuance Costs.” The accounting guidance requires that debt issuance costs related to a recognized debt liability be reported on the Consolidated Statements of Financial Condition as a direct deduction from the carrying amount of that debt liability. The pronouncement is effective for annual reporting periods beginning after December 15, 2015, including interim periods within that reporting period with early application permitted for financial statements that have not been previously issued. The Company is currently evaluating the impact the pronouncement will have on the consolidated financial statements and related disclosures.
27
Capital Resources and Liquidity
Overview
Ongoing capital requirements arise from the Company’s need to service debt, acquire and maintain equipment, fund working capital requirements, and when the opportunities arise, to make strategic acquisitions. During the first three months of 2015, the Company funded its operating, capital and acquisition requirements through operating cash flows and debt financing.
The Company’s primary source of debt financing is its Credit Facility with PNC Bank. This Credit Facility contains provisions for a revolving credit facility of up to $75 million and a term loan secured by substantially all of the Company’s domestic real and personal property, including accounts receivable, inventory, land, buildings, equipment and other intangible assets. As of March 31, 2015, the Company had $17.3 million in outstanding borrowings under the revolving debt portion of the credit facility and $30.8 million outstanding under the term loan. At March 31, 2015, the Company was in compliance with all debt covenants. Significant terms of the Company’s credit facility are discussed in Part I, Item 1 — “Financial Statements” in Note 9 of “Notes to Unaudited Consolidated Financial Statements” in this Quarterly Report.
The Company expects to generate sufficient cash from operations to fund its capital expenditures and make required payments on the term loan. If necessary, the Company will utilize its available capacity under the revolving credit facility to fulfill its liquidity needs. As of March 31, 2015, the Company had available borrowing capacity under its revolving line of credit of $57.5 million and available cash of $2.5 million resulting in total liquidity of $60.0 million. For the remainder of 2015, the Company plans to spend approximately $15 million for committed and planned capital expenditures, inclusive of approximately $8 million for a new R&I facility.
Any excess cash generated may be used to pay down the level of debt, repurchase company stock or be retained for future use. The Company may pursue acquisitions when strategic opportunities arise and may access external financing to fund those acquisitions, if needed.
Net Debt
Net debt represents total debt less cash and cash equivalents and combines the Company’s indebtedness and the cash and cash equivalents the could be used to repay that debt. Components of net debt are as follows (in thousands):
March 31, 2015 | March 31, 2014 | ||||||
Cash and cash equivalents | $ | 2,499 | $ | 1,664 | |||
Current Portion of long-term debt | (24,417 | ) | (24,068 | ) | |||
Long-term debt, less current portion | (23,613 | ) | (30,905 | ) | |||
Net Debt | $ | (45,531 | ) | $ | (53,309 | ) | |
Cash Flows
Consolidated cash flows by type of activity are noted below (in thousands):
Three months ended March 31, | |||||||
2015 | 2014 | ||||||
Net cash provided by operating activities | $ | 6,458 | $ | 15,505 | |||
Net cash used in investing activities | (5,640 | ) | (8,704 | ) | |||
Net cash provided by (used in) financing activities | 655 | (7,718 | ) | ||||
Effect of changes in exchange rates on cash and cash equivalents | (240 | ) | (149 | ) | |||
Net increase (decrease) in cash and cash equivalents | $ | 1,233 | $ | (1,066 | ) | ||
28
Operating Activities
Net cash provided by operating activities was $6.5 million and $15.5 million during the three months ended March 31, 2015 and 2014, respectively. Consolidated net loss for the three months ended March 31, 2015, totaled $1.5 million, compared to consolidated net income of $12.0 million for the three months ended March 31, 2014.
During the three months ended March 31, 2015, net non-cash contributions to net income totaled $4.4 million. Contributory non-cash items consisted of $4.6 million for depreciation and amortization and $3.5 million for stock-based compensation expense. Non-cash reductions to net income included $2.4 million for deferred income taxes, $1.2 million for net gains on asset disposals, $0.1 million for recognized incremental tax benefits related to the Company’s share based awards.
During the three months ended March 31, 2014, net non-cash contributions to net income totaled $4.5 million, primarily consisting of $2.3 million for stock compensation expense and $4.2 million for depreciation and amortization, partially offset by $0.6 million for net gain on sale of assets, $0.3 million for deferred income taxes, and $1.3 million recognized incremental tax benefits related to the Company’s share based awards.
During the three months ended March 31, 2015, net working capital increased by $3.5 million. Working capital grew by decreasing accounts receivable by $22.6 million, decreasing other current assets by $1.8 million, and increasing income taxes payable by $0.5 million. The additions to working capital were partially offset by increased inventory of $12.0 million, decreased accounts payable of $4.8 million, and decreased accrued liabilities of $4.7 million.
During the three months ended March 31, 2014, net working capital decreased by $1.0 million. Working capital was primarily used to decrease accrued liabilities by $2.5 million, increase inventory by $9.9 million and increase accounts receivable by $0.5 million. Offsetting the reductions to working capital were increased income taxes payable of $4.3 million, increased accounts payable of $6.7 million and decreased current assets of $0.9 million.
Investing Activities
Net cash used in investing activities was $5.6 million for the three months ended March 31, 2015. Cash used by investing activities in 2015 were for capital expenditures of $5.6 million, and net cash payments for the acquisitions of IAL and various patents of $1.4 million, partially offset by $1.3 million of proceeds received from the sale of fixed assets.
Net cash used in investing activities was $8.7 million for the three months ended March 31, 2014. Cash used by investing activities in 2014 were for the acquisition of EOGA, net of cash received, for $5.3 million and capital expenditures of $4.1 million, partially offset by $0.8 million of proceeds received from the sale of fixed assets.
Financing Activities
Net cash generated by financing activities was $0.7 million for the three months ended March 31, 2015, and was primarily due to net proceeds from borrowings, net of repayments of debt, of $4.0 million, proceeds from the sale of common stock of $0.3 million and proceeds from the excess tax benefit related to stock-based compensation of $0.1 million. Cash provided by financing activities was partially offset by $2.7 million for the repurchase of common stock and $1.1 million for purchases of treasury stock for tax withholding purposes related to vesting of restricted stock awards.
During the three months ended March 31, 2014, financing activities used net cash of $7.7 million. Cash used by financing activities included repayment of debt, net of borrowings, of $7.1 million and the purchase of treasury stock for tax withholding purposes related to vesting of restricted stocks awards of $4.0 million. Cash used by financing activities was partially offset by proceeds from the exercise of stock warrants of $1.5 million, proceeds from the excess tax benefit related to stock-based compensation of $1.3 million and proceeds from the exercise of stock options of $0.4 million.
Although the Company has no immediate intention to access the capital markets, the Company intends to file a “universal” shelf registration with the Securities and Exchange Commission in the future. This shelf registration statement will register the issuance and sale from time to time of various securities by the Company, including but not limited to senior notes, subordinated notes, preferred stock, common stock, and warrants. Once this shelf registration statement is filed with the Securities and Exchange Commission and becomes effective, the Company will have the financial flexibility to access the capital markets quickly and efficiently from time to time as the need may arise.
29
Contractual Obligations
Cash flows from operations are dependent on a variety of factors, including fluctuations in operating results, accounts receivable collections, inventory management, and the timing of payments for goods and services. Correspondingly, the impact of contractual obligations on the Company’s liquidity and capital resources in future periods is analyzed in conjunction with such factors.
Material contractual obligations consist of repayment of amounts borrowed on the Company’s Credit Facility with PNC Bank and payment of operating lease obligations. Contractual obligations at March 31, 2015, are as follows (in thousands):
Payments Due by Period | ||||||||||||||||||||
Total | Less than 1 year | 1 - 3 years | 3 - 5 years | More than 5 years | ||||||||||||||||
Term loan | $ | 30,756 | $ | 7,143 | $ | 14,286 | $ | 9,327 | $ | — | ||||||||||
Interest expense on term loan (1) | 2,869 | 1,258 | 1,532 | 79 | — | |||||||||||||||
Borrowings under revolving credit facility (2) | 17,274 | 17,274 | — | — | — | |||||||||||||||
Operating lease obligations | 24,787 | 2,621 | 4,828 | 3,841 | 13,497 | |||||||||||||||
Total | $ | 75,686 | $ | 28,296 | $ | 20,646 | $ | 13,247 | $ | 13,497 | ||||||||||
(1) Interest expense amounts assume interest rates on this variable rate obligation remain unchanged from March 31, 2015 rates. The weighted-average interest rate is 2.46% at March 31, 2015.
(2) The borrowing is classified as current debt. The weighted-average interest rate is 2.43% at March 31, 2015.
Item 3. Quantitative and Qualitative Disclosures About Market Risk
The Company is exposed to market risk from changes in interest rates and, to a limited extent, commodity prices and foreign currency exchange rates. There have been no material changes to the quantitative or qualitative disclosures about market risk set forth in Part II, Item 7A of the Company’s Annual Report.
Item 4. Controls and Procedures
Evaluation of Disclosure Controls and Procedures
The Company’s disclosure controls and procedures are designed to ensure that information required to be disclosed by the Company in reports filed or submitted under the Securities Exchange Act of 1934, as amended (the “Exchange Act”), is recorded, processed, summarized and reported within the time periods specified in the SEC’s rules and forms. The Company’s disclosure controls and procedures are also designed to ensure such information is accumulated and communicated to management, including the principal executive and principal financial officers, as appropriate to allow timely decisions regarding required disclosures. There are inherent limitations to the effectiveness of any system of disclosure controls and procedures, including the possibility of human error and the circumvention or overriding of controls and procedures. Accordingly, even effective disclosure controls and procedures can only provide reasonable assurance that control objectives are attained. The Company’s disclosure controls and procedures are designed to provide such reasonable assurance.
The Company’s management, with the participation of the principal executive and principal financial officers, evaluated the effectiveness of the design and operation of the Company’s disclosure controls and procedures as of March 31, 2015, as required by Rule 13a-15(e) of the Exchange Act. Based upon that evaluation, the principal executive and principal financial officers have concluded that the Company’s disclosure controls and procedures were effective as of March 31, 2015.
Changes in Internal Control Over Financial Reporting
There have been no changes in the Company’s system of internal control over financial reporting during the three months ended March 31, 2015 that have materially affected, or are reasonably likely to materially affect, the Company’s internal control over financial reporting.
30
PART II - OTHER INFORMATION
Item 1. Legal Proceedings
Litigation
The Company is subject to routine litigation and other claims that arise in the normal course of business. Management is not aware of any pending or threatened lawsuits or proceedings that are expected to have a material effect on the Company’s financial position, results of operations or liquidity.
EPA Environmental Proceeding
On January 9, 2015, FC Pro LLC (“FC Pro”), a wholly-owned subsidiary of the Company, received a letter and proposed consent agreement and final order from the United States Environmental Protection Agency (“EPA”) concerning alleged violations of the federal hazardous waste regulations at FC Pro’s specialty chemical blending facility in Waller, Texas. Specifically, EPA alleged that FC Pro failed to comply with certain notification, operating, and reporting requirements applicable to generators or large quantity generators of hazardous waste. FC Pro has resolved the alleged violations pursuant to a consent agreement and final order under which it did not admit or deny the allegations and agreed to pay an administrative penalty of $410,868, obtain an EPA identification number, and develop certain specified operating procedures. The consent agreement and final order has been signed by EPA and will become final upon being ratified by the regional judicial officer. Since this enforcement case was initiated, FC Pro has made changes to its operating practices at its Waller facility that it believes has resulted in it no longer generating hazardous waste at that facility.
Item 1A. Risk Factors
There have been no material changes to the risk factors set forth in Part I, Item 1A of the Company’s Annual Report.
Item 2. Unregistered Sales of Equity Securities and Use of Proceeds
Issuance of Shares of Common Stock
On January 27, 2015, the Company issued shares of its common stock pursuant to the Asset Purchase Agreement dated as of January 27, 2015, by and among the Company and International Artificial Lift, LLC as follows:
Number of Shares | ||
Larry Best | 18,457 | |
Ronnie Brown | 18,457 | |
Clayton Brown | 6,002 | |
Rudolph J. Renda | 9,004 | |
Tiburon Oil & Gas, Inc. | 1,501 | |
Scott Briggs | 3,602 | |
Jim Shaw | 3,001 | |
Total | 60,024 | |
The issuance of shares was exempt from registration pursuant to Regulation D or Section 4(2) under the Securities Act of 1933, as amended, as such issuances were made in transactions not involving a public offering. The shares of common stock were issued at an effective price of $16.89 per share.
31
Issuer Purchases of Equity Securities
Repurchases of the Company’s equity securities during the three months ended March 31, 2015 are as follows:
Period | Total Number of Shares Purchased (1) | Average Price Paid per Share | Total Number of Shares Purchased as Part of Publicly Announced Plans or Programs | Maximum Dollar Value of Shares that May Yet be Purchased Under the Plans or Programs (2) | ||||||||||
January 1, 2015 to January 31, 2015 | 20,188 | $ | 16.55 | — | $ | 14,604,569 | ||||||||
February 1, 2015 to February 28, 2015 | 36,852 | $ | 17.30 | — | $ | 14,604,569 | ||||||||
March 1, 2015 to March 31, 2015 | 209,075 | $ | 14.79 | 180,190 | $ | 11,953,728 | ||||||||
Total | 266,115 | $ | 15.27 | 180,190 | ||||||||||
(1) The Company purchased shares of its common stock (a) to satisfy tax withholding requirements and payment remittance obligations related to period vesting of restricted shares and exercise of non-qualified stock options, (b) to satisfy payments required for common stock upon the exercise of stock options, and (c) as part of a publicly announce repurchase program.
(2) In November 2012, the Company’s Board of Directors authorized the repurchase of up to $25 million of the Company’s common stock. Repurchases may be made in open market or privately negotiated transactions. Through March 31, 2015, the Company has repurchased $13.0 million of its common stock under this repurchase program and $12.0 million may yet be used to purchase shares.
Item 3. Defaults Upon Senior Securities
None.
Item 4. Mine Safety Disclosures
Not applicable.
Item 5. Other Information
None.
32
Item 6. Exhibits
Exhibit Number | Description of Exhibit | ||
3.1 | Amended and Restated Certificate of Incorporation (incorporated by reference to Exhibit 3.1 to the Company’s Form 10-Q for the quarter ended September 30, 2007). | ||
3.2 | Certificate of Designations for Series A Cumulative Convertible Preferred Stock dated August 11, 2009 (incorporated by reference to Exhibit 3.1 to the Company’s Form 8-K filed on August 17, 2009). | ||
3.3 | Certificate of Amendment to the Amended and Restated Certificate of Incorporation (incorporated by reference to Exhibit 3.1 to the Company’s Form 10-Q for the quarter ended September 30, 2009). | ||
3.4 | Amended and Restated Bylaws, dated December 9, 2014 (incorporated by reference to Exhibit 3.1 to the Company’s Form 8-K filed on December 10, 2014). | ||
4.1 | Form of Certificate of Common Stock (incorporated by reference to Appendix E to the Company’s Definitive Proxy Statement filed on September 27, 2001). | ||
4.2 | Form of Certificate of Series A Cumulative Convertible Preferred Stock (incorporated by reference to Exhibit A to the Certificate of Designations for Series A Cumulative Convertible Preferred Stock filed as Exhibit 3.1 to the Company’s Form 8-K filed on August 17, 2009). | ||
4.3 | Form of Warrant to Purchase Common Stock of the Company, dated August 31, 2000 (incorporated by reference to Exhibit 4.3 to the Company’s Registration Statement on Form SB-2 (File No. 333-129308) filed on October 28, 2005). | ||
4.4 | Form of Exercisable Warrant, dated August 11, 2009 (incorporated by reference to Exhibit 4.1 to the Company’s Form 8-K filed on August 17, 2009). | ||
4.5 | Form of Contingent Warrant, dated August 11, 2009 (incorporated by reference to Exhibit 4.2 to the Company’s Form 8-K filed on August 17, 2009). | ||
4.6 | Amendment to Warrant to Purchase Common Stock, dated June 14, 2012, by and among the Company and each of the holders party thereto (incorporated by reference to Exhibit 10.1 to the Company’s Form 8-K filed on June 18, 2012). | ||
4.7 | Amendment to Amended and Restated Warrant to Purchase Common Stock, dated as of February 5, 2014 (incorporated by reference to Exhibit 10.1 to the Company’s Form 8-K filed on February 11, 2014). | ||
10.1 | Employment Agreement, dated effective December 31, 2014 between the Company and Steve Reeves (incorporated by reference to Exhibit 10.1 to the Company’s Form 8-K filed on January 7, 2015). | ||
31.1 | * | Rule 13a-14(a) Certification of Principal Executive Officer. | |
31.2 | * | Rule 13a-14(a) Certification of Principal Financial Officer. | |
32.1 | * | Section 1350 Certification of Principal Executive Officer. | |
32.2 | * | Section 1350 Certification of Principal Financial Officer. | |
101.INS | ** | XBRL Instance Document. | |
101.SCH | ** | XBRL Schema Document. | |
101.CAL | ** | XBRL Calculation Linkbase Document. | |
101.LAB | ** | XBRL Label Linkbase Document. | |
101.PRE | ** | XBRL Presentation Linkbase Document. | |
101.DEF | ** | XBRL Definition Linkbase Document. | |
* | Filed herewith. | ||
** | Furnished with this Form 10-Q, not filed. | ||
33
SIGNATURES
Pursuant to the requirements of the Securities Exchange Act of 1934, the registrant has duly caused this report to be signed on its behalf by the undersigned, thereunto duly authorized.
FLOTEK INDUSTRIES, INC. | ||
By: | /s/ JOHN W. CHISHOLM | |
John W. Chisholm | ||
President, Chief Executive Officer and Chairman of the Board | ||
Date: April 22, 2015
FLOTEK INDUSTRIES, INC. | ||
By: | /s/ H. RICHARD WALTON | |
H. Richard Walton | ||
Executive Vice President and Chief Financial Officer | ||
Date: April 22, 2015
34