Attached files
| file | filename |
|---|---|
| 8-K - CLEARWATER PAPER CORPORATION 8-K - Clearwater Paper Corp | a51085201.htm |
| EX-99.1 - EXHIBIT 99.1 - Clearwater Paper Corp | a51085201ex99_1.htm |
Exhibit 99.2
CLEARWATER PAPER CORPORATION FIRST QUARTER 2015 SUPPLEMENTAL INFORMATION LINDA MASSMAN PRESIDENT, CHIEF EXECUTIVE OFFICER AND DIRECTOR JOHN HERTZ SENIOR VICE PRESIDENT FINANCE AND CHIEF FINANCIAL OFFICER
FORWARD-LOOKING STATEMENTS This supplemental information contains, in addition to historical information, certain forward-looking statements within the meaning of the Private Securities Litigation Reform Act of 1995, including statements regarding, segment, corporate and consolidated outlook for Q2 2015 and fiscal year 2015; production; product volumes shipped; product pricing and sales mix; pulp and wood fiber costs and supply; chemical costs; operational and packaging supply costs; transportation costs; energy costs; cost and timing of major maintenance and repairs; cost of wages and benefits; selling, general, and administrative expenses; corporate expenses; consolidated sales and operating margins; EBITDA sensitivities; and estimated Q2 2015 adjusted EBITDA. These forward-looking statements are based on management’s current expectations, estimates, assumptions and projections that are subject to change. Our actual results of operations may differ materially from those expressed or implied by the forward-looking statements contained in this presentation. Important factors that could cause or contribute to such differences include the risks and uncertainties described from time to time in the company's public filings with the Securities and Exchange Commission, as well as the following: • competitive pricing pressures for our products, including as a result of increased capacity as additional manufacturing facilities are operated by our competitors; • the loss of or changes in prices in regards to a significant customer; • changes in transportation costs and disruptions in transportation services; • manufacturing or operating disruptions, including equipment malfunction and damage to our manufacturing facilities caused by fire or weather-related events and IT system failures; • changes in the cost and availability of wood fiber and wood pulp; • labor disruptions; • changes in costs for and availability of packaging supplies, chemicals, energy and maintenance and repairs; • environmental liabilities or expenditures; • changes in the U.S. and international economies and in general economic conditions in the regions and industries in which we operate; changes in customer product preferences and competitors' product offerings; • changes in expenses and required contributions associated with our pension plans; • reliance on a limited number of third-party suppliers for raw materials; • cyclical industry conditions; • inability to successfully implement our operational efficiencies and expansion strategies; • inability to fund our debt obligations; • restrictions on our business from debt covenants and terms; and • changes in laws, regulations or industry standards affecting our business. Forward-looking statements contained in this presentation present management’s views only as of the date of this presentation. We undertake no obligation to publicly update forward-looking statements, whether as a result of new information, future events or otherwise. 1 FIRST QUARTER SUMMARY $434 MILLION NET SALES $38 MILLION ADJUSTED EBITDA1 FIRST FULL QUARTER WITHOUT SPECIALTY MILLS RETURNED $37 MILLION TO SHAREHOLDERS AS PART OF NEW $100 MILLION SHARE BUYBACK PROGRAM AT AVERAGE COST OF $62 PER SHARE COMPLETED MAJOR MAINTENANCE AT OUR IDAHO PAPERBOARD FACILITY, $15 MILLION COST
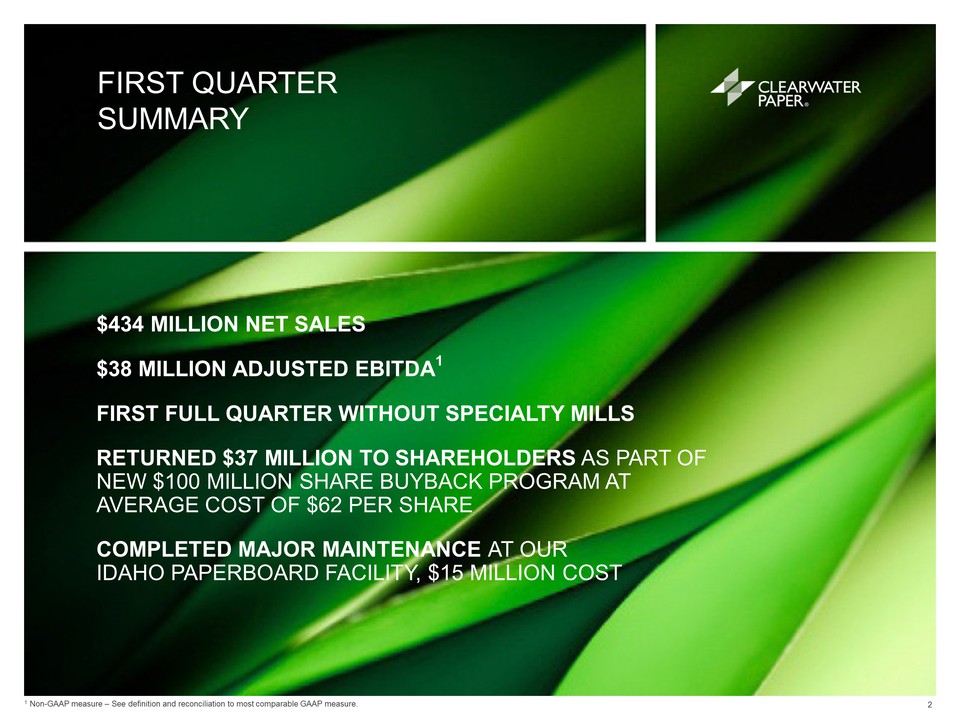
FIRST QUARTER SUMMARY $434 MILLION NET SALES $38 MILLION ADJUSTED EBITDA1 FIRST FULL QUARTER WITHOUT SPECIALTY MILLS RETURNED $37 MILLION TO SHAREHOLDERS AS PART OF NEW $100 MILLION SHARE BUYBACK PROGRAM AT AVERAGE COST OF $62 PER SHARE COMPLETED MAJOR MAINTENANCE AT OUR IDAHO PAPERBOARD FACILITY, $15 MILLION COST 1 Non-GAAP measure – See definition and reconciliation to most comparable GAAP measure. FINANCIAL SUMMARY (UNAUDITED)
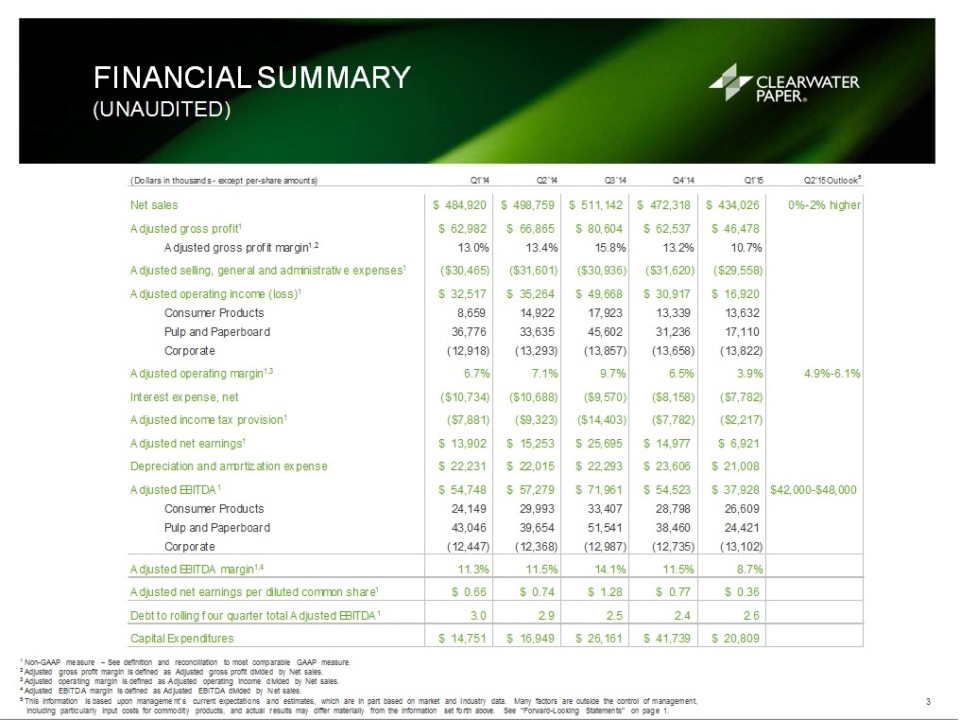
1 Non-GAAP measure – See definition and reconciliation to most comparable GAAP measure. 2 Adjusted gross profit margin is defined as Adjusted gross profit divided by Net sales. 3 Adjusted operating margin is defined as Adjusted operating income divided by Net sales. 4 Adjusted EBITDA margin is defined as Adjusted EBITDA divided by Net sales. 5 This information is based upon management’s current expectations and estimates, which are in part based on market and industry data. Many factors are outside the control of management, including particularly input costs for commodity products, and actual results may differ materially from the information set forth above. See “Forward-Looking Statements” on page 1. Q1'14Q2'14Q3'14Q4'14Q1'15Q2'15 Outlook5$ 484,920$ 498,759$ 511,142$ 472,318$ 434,0260%-2% higher$ 62,982$ 66,865$ 80,604$ 62,537$ 46,478Adjusted gross profit margin1,213.0%13.4%15.8%13.2%10.7%($30,465)($31,601)($30,936)($31,620)($29,558)$ 32,517$ 35,264$ 49,668$ 30,917$ 16,920Consumer Products8,65914,92217,92313,33913,632Pulp and Paperboard36,77633,63545,60231,23617,110Corporate (12,918)(13,293)(13,857)(13,658)(13,822)6.7%7.1%9.7%6.5%3.9%4.9%-6.1%($10,734)($10,688)($9,570)($8,158)($7,782)($7,881)($9,323)($14,403)($7,782)($2,217)$ 13,902$ 15,253$ 25,695$ 14,977$ 6,921$ 22,231$ 22,015$ 22,293$ 23,606$ 21,008$ 54,748$ 57,279$ 71,961$ 54,523$ 37,928$42,000-$48,000Consumer Products24,14929,99333,40728,79826,609Pulp and Paperboard43,04639,65451,54138,46024,421Corporate(12,447)(12,368)(12,987)(12,735)(13,102)11.3%11.5%14.1%11.5%8.7%$ 0.66$ 0.74$ 1.28$ 0.77$ 0.363.0 2.9 2.5 2.4 2.6 $ 14,751$ 16,949$ 26,161$ 41,739$ 20,809Depreciation and amortization expenseAdjusted EBITDA1Adjusted EBITDA margin1,4Adjusted net earnings per diluted common share1Debt to rolling four quarter total Adjusted EBITDA1Capital ExpendituresAdjusted operating income (loss)1Adjusted operating margin1,3Interest expense, netAdjusted income tax provision1Adjusted net earnings1(Dollars in thousands - except per-share amounts)Net salesAdjusted gross profit1Adjusted selling, general and administrative expenses1 Q1’15 VS. Q4’14 CONSOLIDATED ADJUSTED EBITDA1 BRIDGE
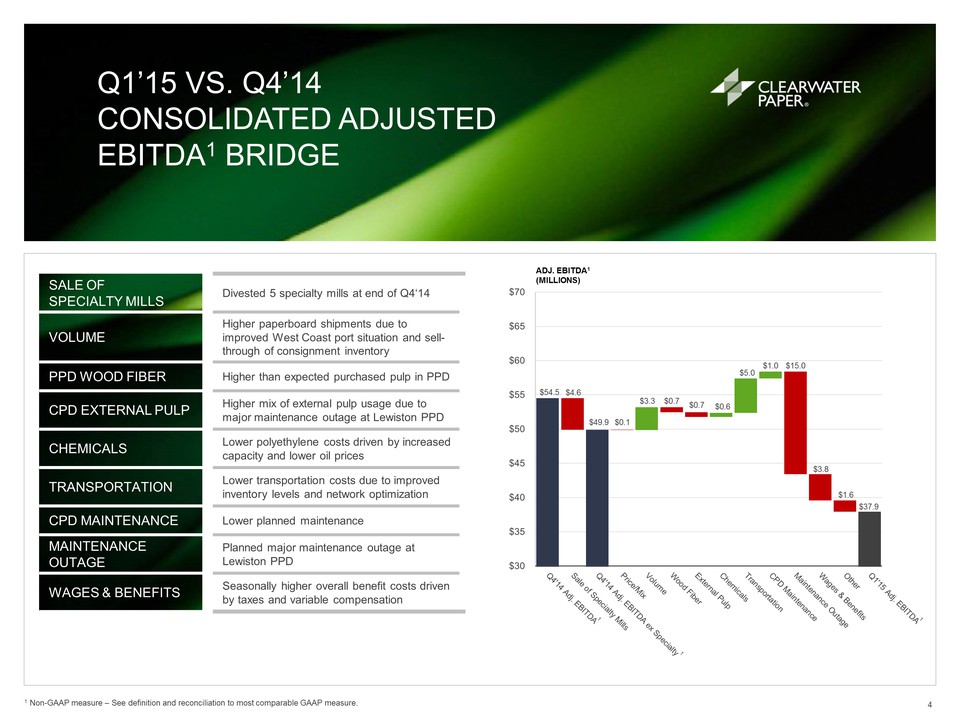
1 Non-GAAP measure – See definition and reconciliation to most comparable GAAP measure. $54.5 $4.6 $49.9 $0.1 $3.3 $0.7 $0.7 $0.6 $5.0 $1.0 $15.0 $3.8 $1.6 $37.9 $30 $35 $40 $45 $50 $55 $60 $65 $70 ADJ. EBITDA1 (MILLIONS) SALE OF SPECIALTY MILLS Divested 5 specialty mills at end of Q4‘14 VOLUME Higher paperboard shipments due to improved West Coast port situation and sell-through of consignment inventory PPD WOOD FIBER Higher than expected purchased pulp in PPD CPD EXTERNAL PULP Higher mix of external pulp usage due to major maintenance outage at Lewiston PPD CHEMICALS Lower polyethylene costs driven by increased capacity and lower oil prices TRANSPORTATION Lower transportation costs due to improved inventory levels and network optimization CPD MAINTENANCE Lower planned maintenance MAINTENANCE OUTAGE Planned major maintenance outage at Lewiston PPD WAGES & BENEFITS Seasonally higher overall benefit costs driven by taxes and variable compensation Q1’15 VS. Q1’14 CONSOLIDATED ADJUSTED EBITDA1 BRIDGE
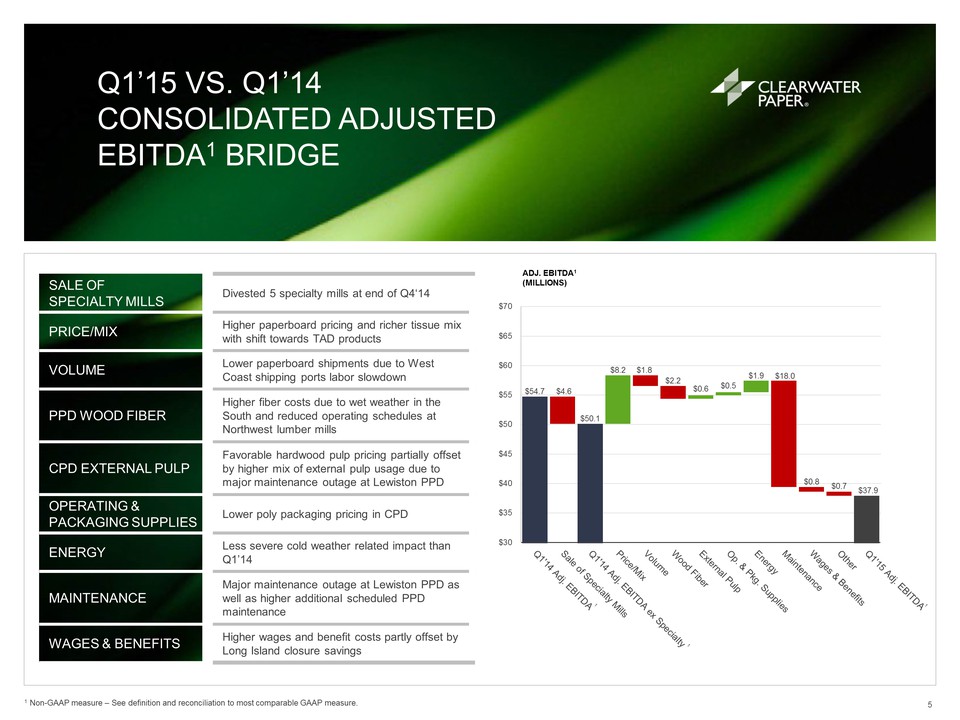
1 Non-GAAP measure – See definition and reconciliation to most comparable GAAP measure. SALE OF SPECIALTY MILLS Divested 5 specialty mills at end of Q4‘14 PRICE/MIX Higher paperboard pricing and richer tissue mix with shift towards TAD products VOLUME Lower paperboard shipments due to West Coast shipping ports labor slowdown PPD WOOD FIBER Higher fiber costs due to wet weather in the South and reduced operating schedules at Northwest lumber mills CPD EXTERNAL PULP Favorable hardwood pulp pricing partially offset by higher mix of external pulp usage due to major maintenance outage at Lewiston PPD OPERATING & PACKAGING SUPPLIES Lower poly packaging pricing in CPD ENERGY Less severe cold weather related impact than Q1’14 MAINTENANCE Major maintenance outage at Lewiston PPD as well as higher additional scheduled PPD maintenance WAGES & BENEFITS Higher wages and benefit costs partly offset by Long Island closure savings $54.7 $4.6 $50.1 $8.2 $1.8 $2.2 $0.6 $0.5 $1.9 $18.0 $0.8 $0.7 $37.9 $30 $35 $40 $45 $50 $55 $60 $65 $70 ADJ. EBITDA1 (MILLIONS) KEY SEGMENT RESULTS – CONSUMER PRODUCTS (UNAUDITED)
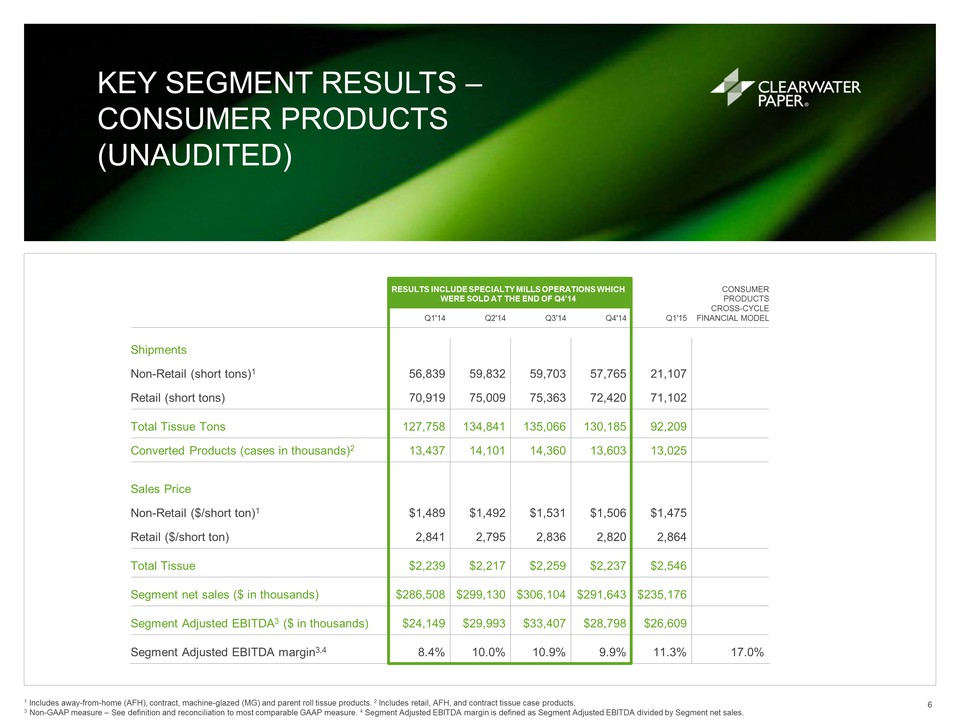
1 Includes away-from-home (AFH), contract, machine-glazed (MG) and parent roll tissue products. 2 Includes retail, AFH, and contract tissue case products. 3 Non-GAAP measure – See definition and reconciliation to most comparable GAAP measure. 4 Segment Adjusted EBITDA margin is defined as Segment Adjusted EBITDA divided by Segment net sales. CONSUMER PRODUCTS CROSS-CYCLE FINANCIAL MODEL RESULTS INCLUDE SPECIALTY MILLS OPERATIONS WHICH WERE SOLD AT THE END OF Q4’14 Q1'14 Q2'14 Q3'14 Q4'14 Q1'15 Shipments Non-Retail (short tons)1 56,839 59,832 59,703 57,765 21,107 Retail (short tons) 70,919 75,009 75,363 72,420 71,102 Total Tissue Tons 127,758 134,841 135,066 130,185 92,209 Converted Products (cases in thousands)2 13,437 14,101 14,360 13,603 13,025 Sales Price Non-Retail ($/short ton)1 $1,489 $1,492 $1,531 $1,506 $1,475 Retail ($/short ton) 2,841 2,795 2,836 2,820 2,864 Total Tissue $2,239 $2,217 $2,259 $2,237 $2,546 Segment net sales ($ in thousands) $286,508 $299,130 $306,104 $291,643 $235,176 Segment Adjusted EBITDA3 ($ in thousands) $24,149 $29,993 $33,407 $28,798 $26,609 Segment Adjusted EBITDA margin3,4 8.4% 10.0% 10.9% 9.9% 11.3% 17.0% Retail 77% AFH 7% Parent Rolls 14% Other 2% CLW Q1’15 by Market Segment (% of Tons) CLEARWATER PAPER TISSUE SHIPMENTS AND U.S. RETAIL TISSUE MARKET
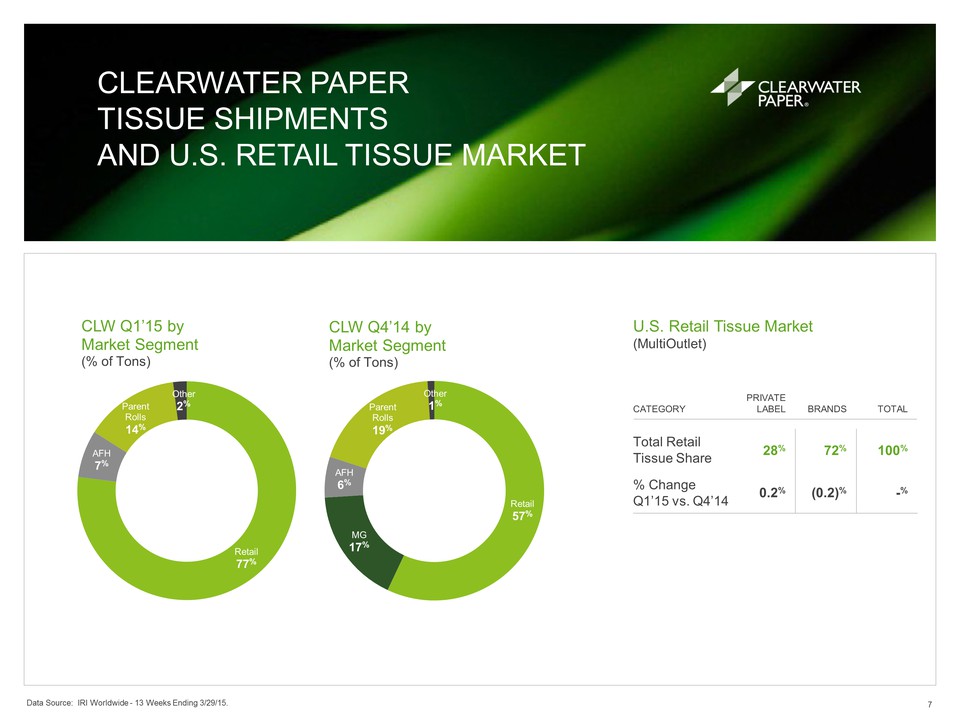
Retail 57% MG 17% AFH 6% Parent Rolls 19% Other 1% CLW Q4’14 by Market Segment (% of Tons) U.S. Retail Tissue Market (MultiOutlet) CATEGORY PRIVATE LABEL BRANDS TOTAL Total Retail Tissue Share 28% 72% 100% % Change Q1’15 vs. Q4’14 0.2% (0.2)% -% Data Source: IRI Worldwide - 13 Weeks Ending 3/29/15. PRICE/MIX SHIPMENT VOLUMES EXTERNAL PULP CHEMICAL COSTS OP. & PKG. SUPPLIES TRANSPORTATION COSTS ENERGY COSTS MAINTENANCE SG&A FEBRUARY ‘15 Q1’15 OUTLOOK VERSUS Q4’14 0-1% higher 0-1% higher Cost / shipped ton: stable Cost / shipped ton: stable Cost / shipped ton: lower Cost / shipped ton: lower Cost / shipped ton: stable Stable Stable Q1’15 ACTUAL VERSUS Q4’14 Stable Stable Cost / shipped ton: higher Cost / shipped ton: stable Cost / shipped ton: lower Cost / shipped ton: lower Cost / shipped ton: stable Lower Stable SALE OF SPECIALTY MILLS Divested 5 specialty mills at end of Q4‘14 EXTERNAL PULP Higher mix of external pulp usage due to major maintenance outage at Lewiston PPD TRANSPORTATION Lower transportation costs due to improved inventory levels and network optimization MAINTENANCE Lower planned maintenance WAGES & BENEFITS Seasonally higher overall benefit costs driven by taxes and variable compensation Q1’15 VS. Q4’14 CONSUMER PRODUCTS ADJUSTED EBITDA1 BRIDGE
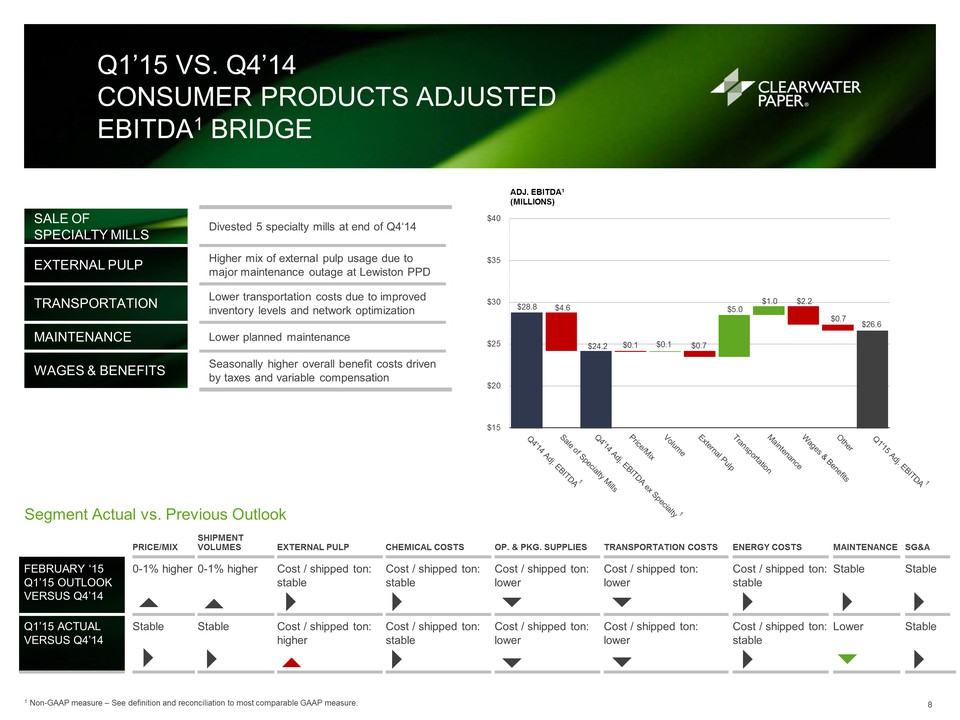
1 Non-GAAP measure – See definition and reconciliation to most comparable GAAP measure. Segment Actual vs. Previous Outlook $28.8 $4.6 $24.2 $0.1 $0.1 $0.7 $5.0 $1.0 $2.2 $0.7 $26.6 $15 $20 $25 $30 $35 $40 ADJ. EBITDA1 (MILLIONS) KEY SEGMENT RESULTS – PULP AND PAPERBOARD (UNAUDITED)
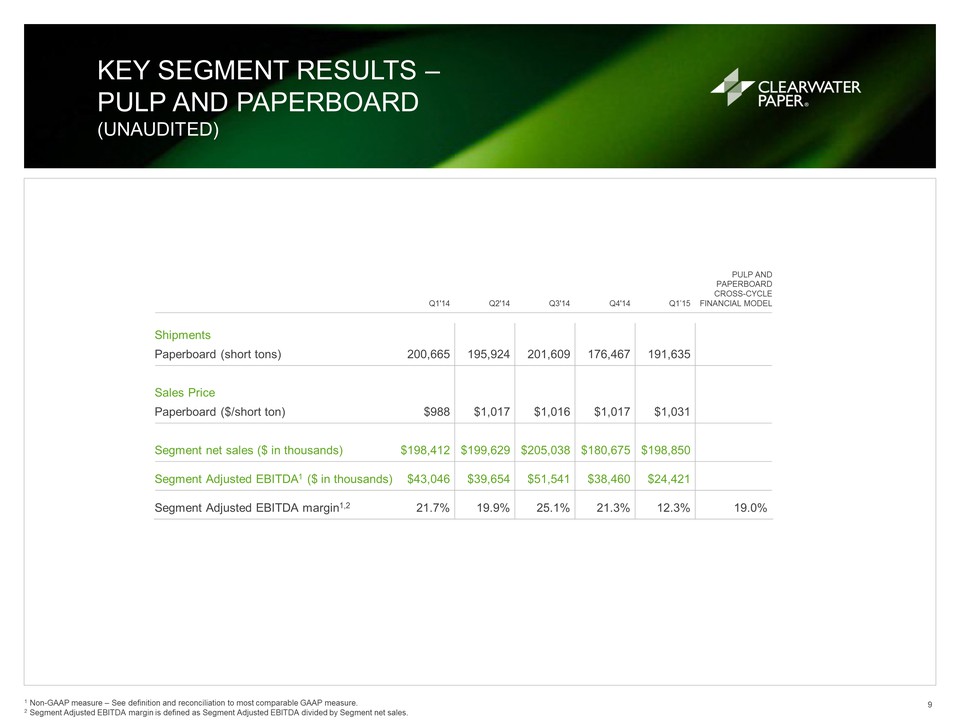
1 Non-GAAP measure – See definition and reconciliation to most comparable GAAP measure. 2 Segment Adjusted EBITDA margin is defined as Segment Adjusted EBITDA divided by Segment net sales. PULP AND PAPERBOARD CROSS-CYCLE FINANCIAL MODEL Q1'14 Q2'14 Q3'14 Q4'14 Q1’15 Shipments Paperboard (short tons) 200,665 195,924 201,609 176,467 191,635 Sales Price Paperboard ($/short ton) $988 $1,017 $1,016 $1,017 $1,031 Segment net sales ($ in thousands) $198,412 $199,629 $205,038 $180,675 $198,850 Segment Adjusted EBITDA1 ($ in thousands) $43,046 $39,654 $51,541 $38,460 $24,421 Segment Adjusted EBITDA margin1,2 21.7% 19.9% 25.1% 21.3% 12.3% 19.0% CLEARWATER PAPER PAPERBOARD SHIPMENTS AND U.S. PAPERBOARD MARKET
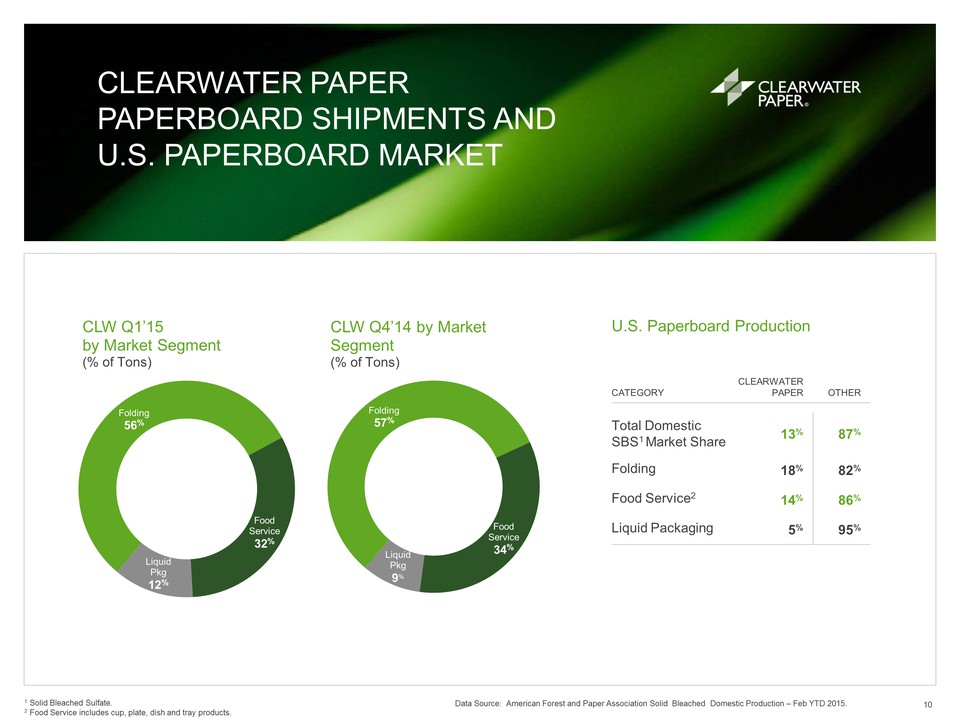
U.S. Paperboard Production CATEGORY CLEARWATER PAPER OTHER Total Domestic SBS1 Market Share 13% 87% Folding 18% 82% Food Service2 14% 86% Liquid Packaging 5% 95% Data Source: American Forest and Paper Association Solid Bleached Domestic Production – Feb YTD 2015. Folding 56% Food Service 32% Liquid Pkg 12% CLW Q1’15 by Market Segment (% of Tons) Folding 57% Food Service 34% Liquid Pkg 9% CLW Q4’14 by Market Segment (% of Tons) 1 Solid Bleached Sulfate. 2 Food Service includes cup, plate, dish and tray products. PRICE/MIX SHIPMENT VOLUMES WOOD FIBER CHEMICAL COSTS OP. & PKG. SUPPLIES TRANSPORTATION COSTS ENERGY COSTS MAINTENANCE SG&A FEBRUARY ‘15 Q1’15 OUTLOOK VERSUS Q4’14 0-1% higher 1-5% higher Cost / shipped ton: stable Cost / shipped ton: lower Cost / shipped ton: stable Cost / shipped ton: stable Cost / shipped ton: stable $13-$15M higher Stable Q1’15 ACTUAL VERSUS Q4’14 1% higher 9% higher Cost / shipped ton: higher Cost / shipped ton: lower Cost / shipped ton: stable Cost / shipped ton: stable Cost / shipped ton: stable $15M higher Stable VOLUME Higher paperboard shipments due to improved West Coast port situation and sell-through of consignment inventory WOOD FIBER Higher than expected purchased pulp usage CHEMICALS Lower polyethylene costs driven by higher capacity and lower oil prices MAINTENANCE Planned major maintenance outage at Lewiston WAGES & BENEFITS Seasonally higher overall benefit costs driven by taxes and variable compensation Q1’15 VS. Q4’14 PULP AND PAPERBOARD ADJUSTED EBITDA1 BRIDGE
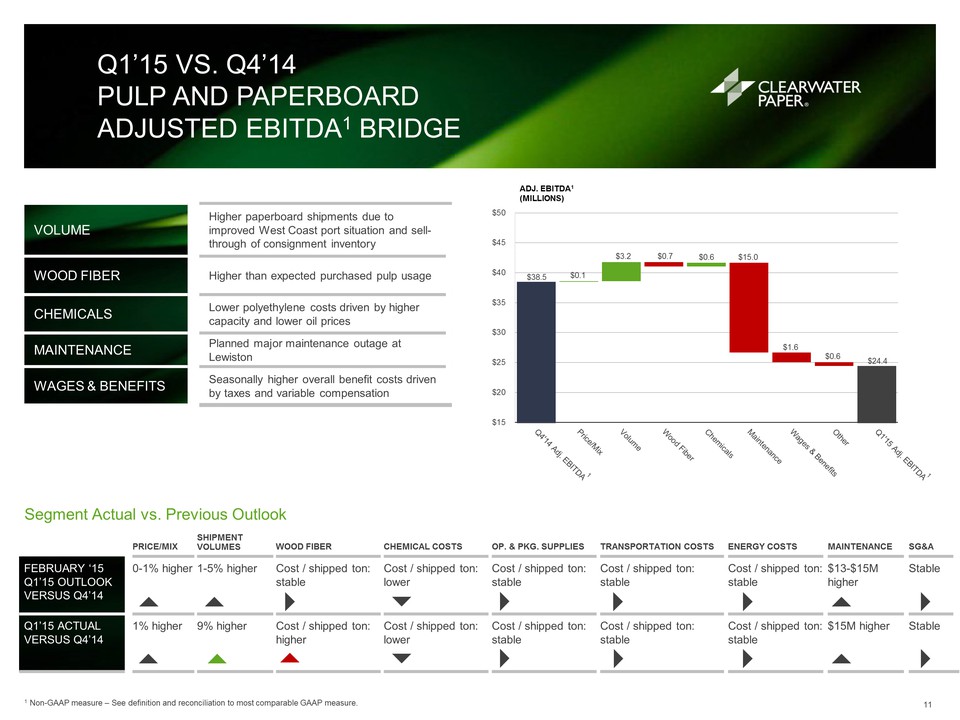
1 Non-GAAP measure – See definition and reconciliation to most comparable GAAP measure. Segment Actual vs. Previous Outlook $38.5 $0.1 $3.2 $0.7 $0.6 $15.0 $1.6 $0.6 $24.4 $15 $20 $25 $30 $35 $40 $45 $50 ADJ. EBITDA1 (MILLIONS) CLEARWATER PAPER CROSS-CYCLE FINANCIAL MODEL
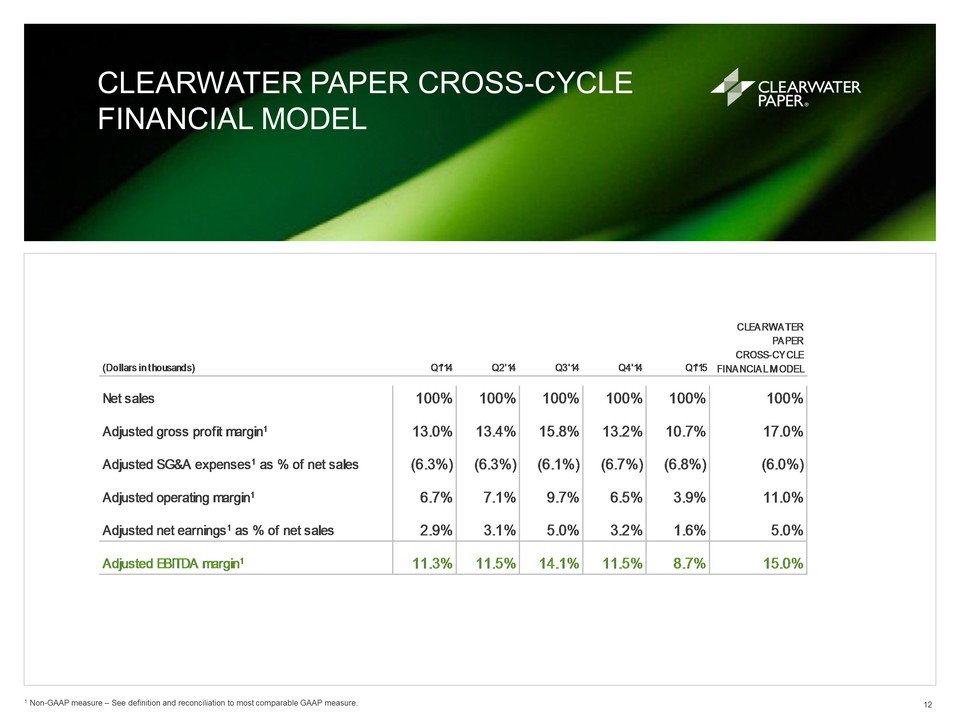
1 Non-GAAP measure – See definition and reconciliation to most comparable GAAP measure. (Dollars in thousands)Q1'14Q2'14Q3'14Q4'14Q1'15Net sales100%100%100%100%100%100%Adjusted gross profit margin113.0%13.4%15.8%13.2%10.7%17.0% Adjusted SG&A expenses1 as % of net sales(6.3%)(6.3%)(6.1%)(6.7%)(6.8%)(6.0%)Adjusted operating margin16.7%7.1%9.7%6.5%3.9%11.0% Adjusted net earnings1 as % of net sales2.9%3.1%5.0%3.2%1.6%5.0% Adjusted EBITDA margin111.3%11.5%14.1%11.5%8.7%15.0%CLEARWATER PAPER CROSS-CYCLE FINANCIAL MODEL 12.4% 12.7% 16.7% 4.7% 4.3% 11.1% 12.7% 12.1% 8.3% 7.7% 6.5% 4.5% 3.6% 0% 5% 10% 15% 20% 2011 2012 2013 2014 LTM Ending 3/31/15 ROIC Adjusted ROIC WACC 2 3,4,5 1 5 4 3 RETURN ON INVESTED CAPITAL1,6 (UNAUDITED)
\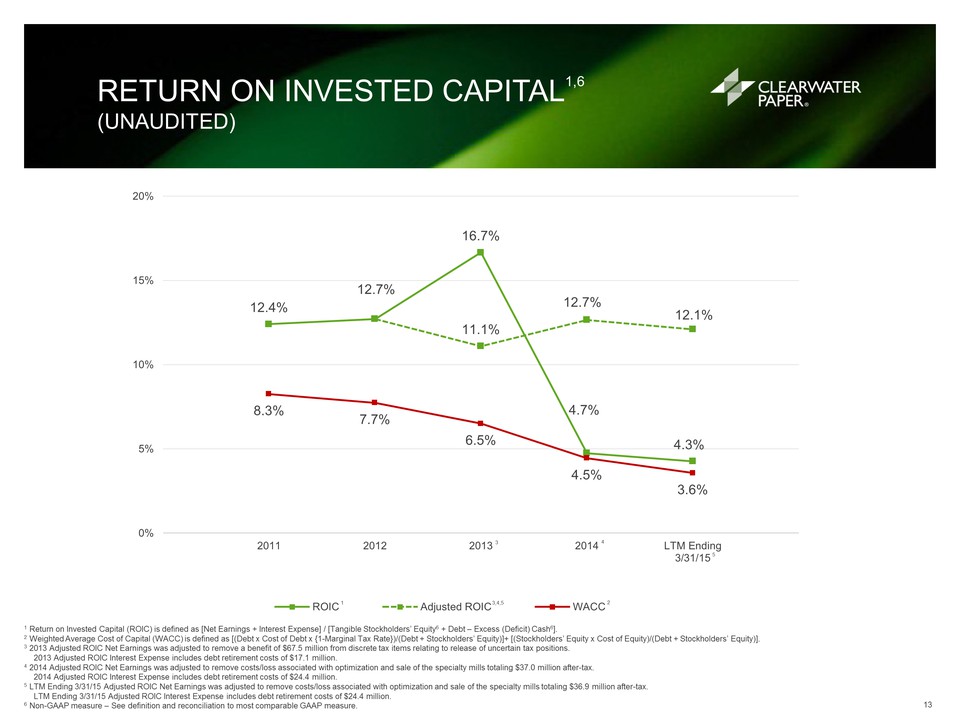
1 Return on Invested Capital (ROIC) is defined as [Net Earnings + Interest Expense] / [Tangible Stockholders’ Equity6 + Debt – Excess (Deficit) Cash6]. 2 Weighted Average Cost of Capital (WACC) is defined as [(Debt x Cost of Debt x {1-Marginal Tax Rate})/(Debt + Stockholders’ Equity)]+ [(Stockholders’ Equity x Cost of Equity)/(Debt + Stockholders’ Equity)]. 3 2013 Adjusted ROIC Net Earnings was adjusted to remove a benefit of $67.5 million from discrete tax items relating to release of uncertain tax positions. 2013 Adjusted ROIC Interest Expense includes debt retirement costs of $17.1 million. 4 2014 Adjusted ROIC Net Earnings was adjusted to remove costs/loss associated with optimization and sale of the specialty mills totaling $37.0 million after-tax. 2014 Adjusted ROIC Interest Expense includes debt retirement costs of $24.4 million. 5 LTM Ending 3/31/15 Adjusted ROIC Net Earnings was adjusted to remove costs/loss associated with optimization and sale of the specialty mills totaling $36.9 million after-tax. LTM Ending 3/31/15 Adjusted ROIC Interest Expense includes debt retirement costs of $24.4 million. 6 Non-GAAP measure – See definition and reconciliation to most comparable GAAP measure. SECOND QUARTER 2015 OUTLOOK (COMPARED TO Q1’15)
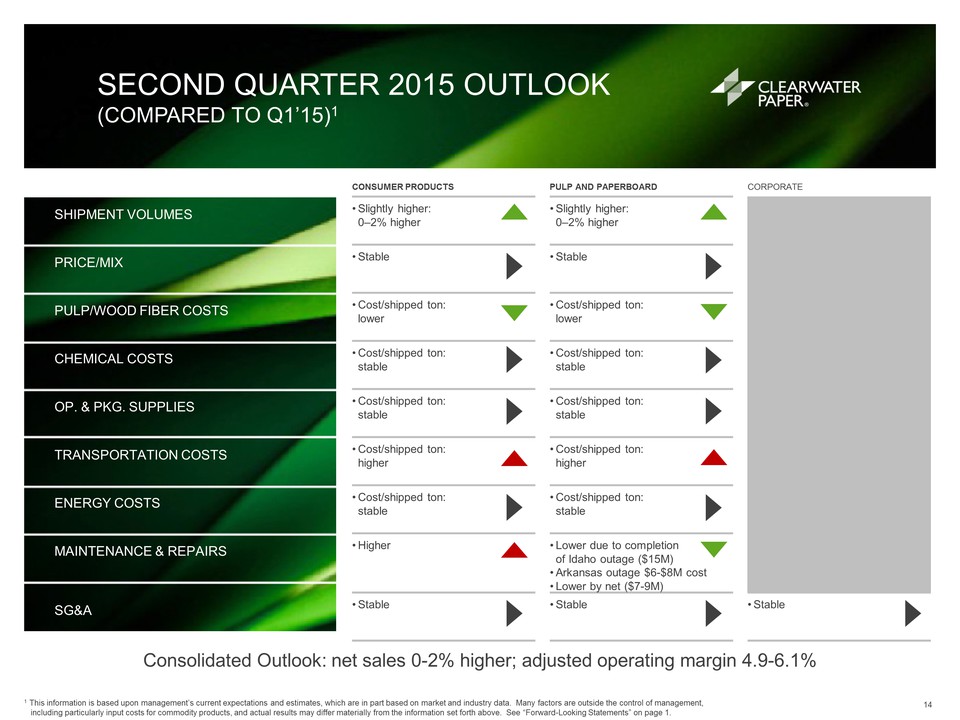
1 CONSUMER PRODUCTS PULP AND PAPERBOARD CORPORATE SHIPMENT VOLUMES • Slightly higher: 0–2% higher • Slightly higher: 0–2% higher PRICE/MIX • Stable • Stable PULP/WOOD FIBER COSTS • Cost/shipped ton: lower • Cost/shipped ton: lower CHEMICAL COSTS • Cost/shipped ton: stable • Cost/shipped ton: stable OP. & PKG. SUPPLIES • Cost/shipped ton: stable • Cost/shipped ton: stable TRANSPORTATION COSTS • Cost/shipped ton: higher • Cost/shipped ton: higher ENERGY COSTS • Cost/shipped ton: stable • Cost/shipped ton: stable MAINTENANCE & REPAIRS • Higher • Lower due to completion of Idaho outage ($15M) • Arkansas outage $6-$8M cost • Lower by net ($7-9M) SG&A • Stable • Stable • Stable Consolidated Outlook: net sales 0-2% higher; adjusted operating margin 4.9-6.1% 1 This information is based upon management’s current expectations and estimates, which are in part based on market and industry data. Many factors are outside the control of management, including particularly input costs for commodity products, and actual results may differ materially from the information set forth above. See “Forward-Looking Statements” on page 1. BRIDGE TO Q2’15 ADJUSTED EBITDA OUTLOOK1,2
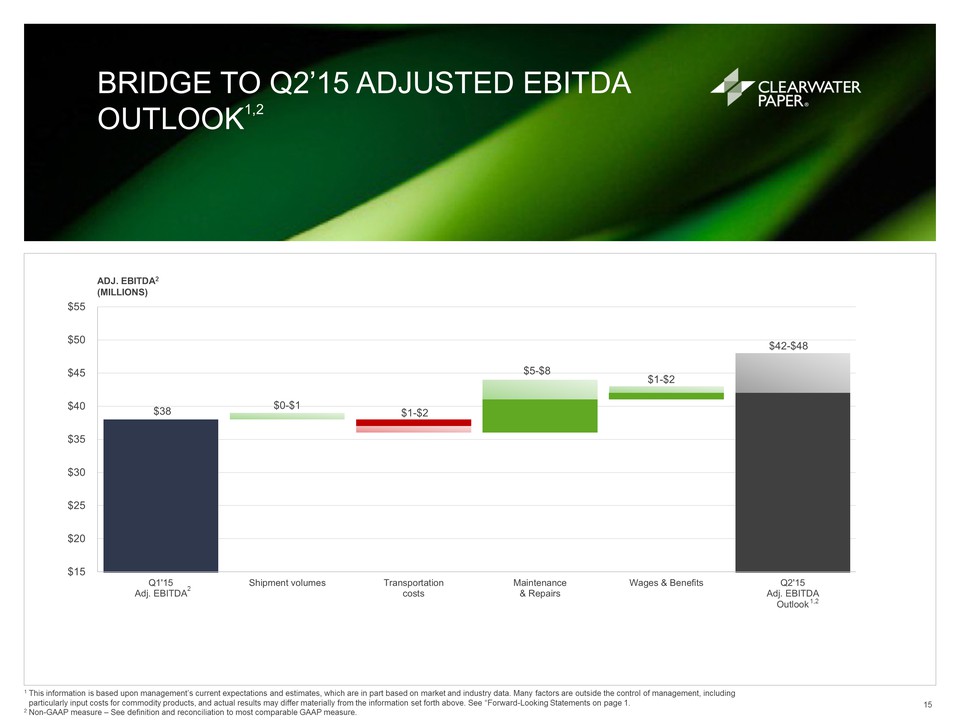
1 This information is based upon management’s current expectations and estimates, which are in part based on market and industry data. Many factors are outside the control of management, including particularly input costs for commodity products, and actual results may differ materially from the information set forth above. See “Forward-Looking Statements on page 1. 2 Non-GAAP measure – See definition and reconciliation to most comparable GAAP measure. $38 $0-$1 $1-$2 $1-$2 $5-$8 $42-$48 $15 $20 $25 $30 $35 $40 $45 $50 $55 Q1'15 Adj. EBITDA Shipment volumes Transportation costs Maintenance & Repairs Wages & Benefits Q2'15 Adj. EBITDA Outlook ADJ. EBITDA2 (MILLIONS) 1,2 2 EBITDA SENSITIVITIES
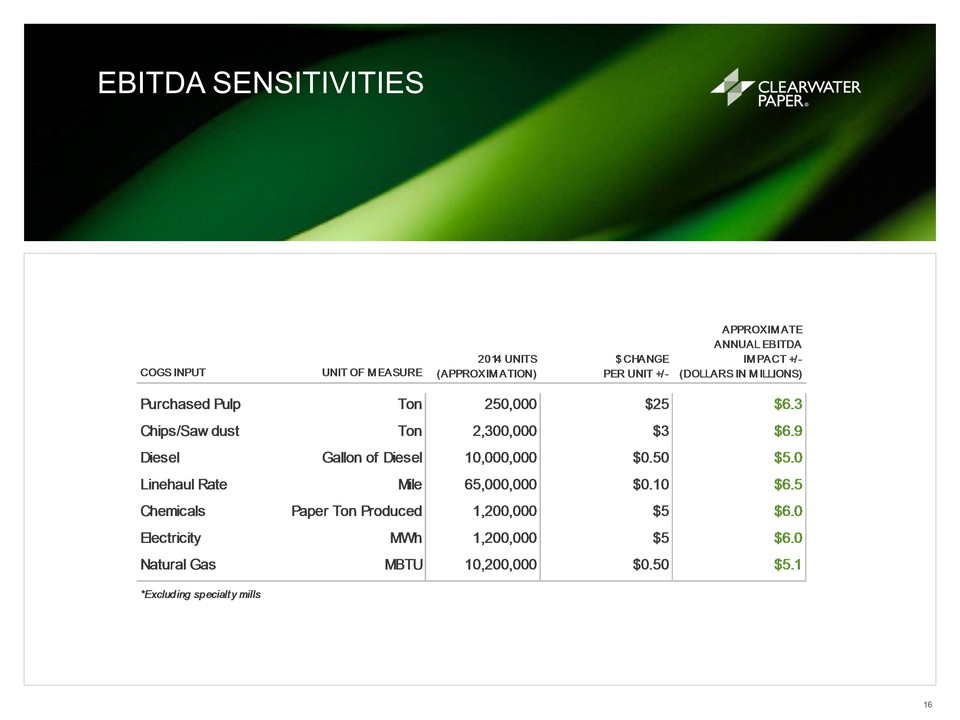
COGS INPUTUNIT OF MEASUREPurchased PulpTon250,000$25$6.3Chips/SawdustTon2,300,000$3$6.9DieselGallon of Diesel10,000,000$0.50$5.0Linehaul RateMile65,000,000$0.10$6.5ChemicalsPaper Ton Produced1,200,000$5$6.0ElectricityMWh1,200,000$5$6.0Natural GasMBTU10,200,000$0.50$5.1*Excluding specialty mills2014 UNITS(APPROXIMATION)$ CHANGEPER UNIT +/-APPROXIMATE ANNUAL EBITDA IMPACT +/-(DOLLARS IN MILLIONS) ADJUSTED GROSS PROFIT & ADJUSTED SG&A RECONCILIATION OF NON-GAAP FINANCIAL MEASURES (UNAUDITED)
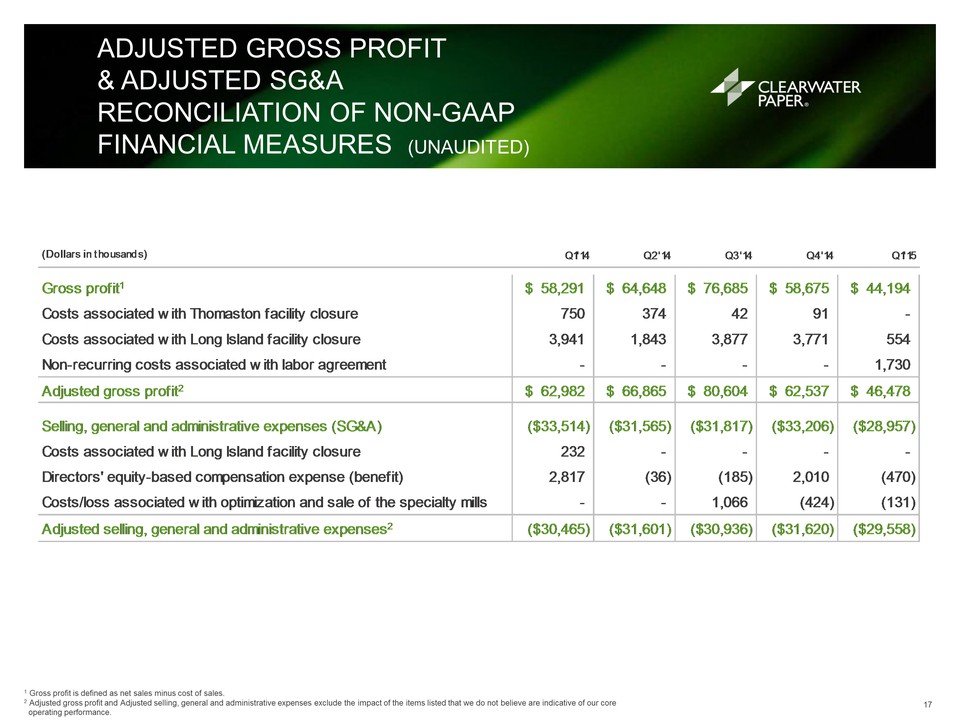
1 Gross profit is defined as net sales minus cost of sales. 2 Adjusted gross profit and Adjusted selling, general and administrative expenses exclude the impact of the items listed that we do not believe are indicative of our core operating performance. (Dollars in thousands)Q1'14Q2'14Q3'14Q4'14Q1'15Gross profit1$ 58,291$ 64,648$ 76,685$ 58,675$ 44,194Costs associated with Thomaston facility closure750 374 42 91 - Costs associated with Long Island facility closure3,941 1,843 3,877 3,771 554 Non-recurring costs associated with labor agreement- - - - 1,730 Adjusted gross profit2$ 62,982$ 66,865$ 80,604$ 62,537$ 46,478Selling, general and administrative expenses (SG&A)($33,514)($31,565)($31,817)($33,206)($28,957)Costs associated with Long Island facility closure232 - - - - Directors' equity-based compensation expense (benefit)2,817 (36) (185) 2,010 (470) Costs/loss associated with optimization and sale of the specialty mills- - 1,066 (424) (131) Adjusted selling, general and administrative expenses2($30,465)($31,601)($30,936)($31,620)($29,558) SEGMENT ADJUSTED OPERATING INCOME (LOSS) RECONCILIATION OF NON-GAAP FINANCIAL MEASURES (UNAUDITED)
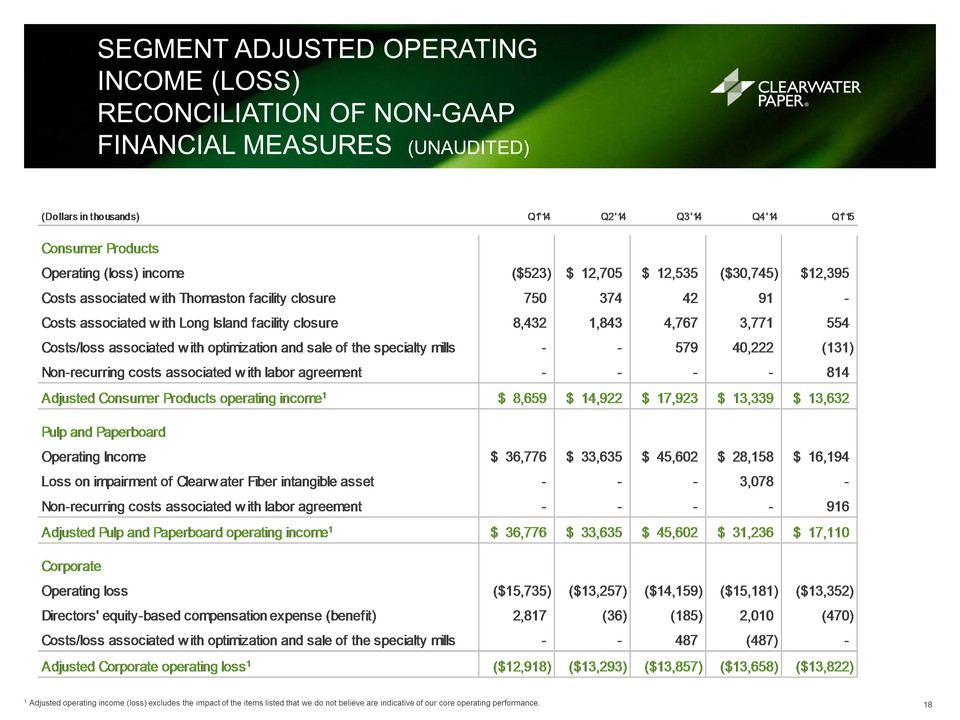
(Dollars in thousands)Q1'14Q2'14Q3'14Q4'14Q1'15Consumer ProductsOperating (loss) income($523)$ 12,705$ 12,535($30,745)$12,395Costs associated with Thomaston facility closure750 374 42 91 - Costs associated with Long Island facility closure8,432 1,843 4,767 3,771 554 Costs/loss associated with optimization and sale of the specialty mills- - 579 40,222 (131) Non-recurring costs associated with labor agreement- - - - 814 Adjusted Consumer Products operating income1$ 8,659$ 14,922$ 17,923$ 13,339$ 13,632Pulp and PaperboardOperating Income$ 36,776$ 33,635$ 45,602$ 28,158$ 16,194Loss on impairment of Clearwater Fiber intangible asset- - - 3,078 - Non-recurring costs associated with labor agreement- - - - 916 Adjusted Pulp and Paperboard operating income1$ 36,776$ 33,635$ 45,602$ 31,236$ 17,110CorporateOperating loss($15,735)($13,257)($14,159)($15,181)($13,352)Directors' equity-based compensation expense (benefit)2,817 (36) (185) 2,010 (470) Costs/loss associated with optimization and sale of the specialty mills- - 487 (487) - Adjusted Corporate operating loss1($12,918)($13,293)($13,857)($13,658)($13,822) 1 Adjusted operating income (loss) excludes the impact of the items listed that we do not believe are indicative of our core operating performance. ADJUSTED NET EARNINGS & ADJUSTED NET EARNINGS PER DILUTED COMMON SHARE RECONCILIATION OF NON-GAAP FINANCIAL MEASURES (UNAUDITED)
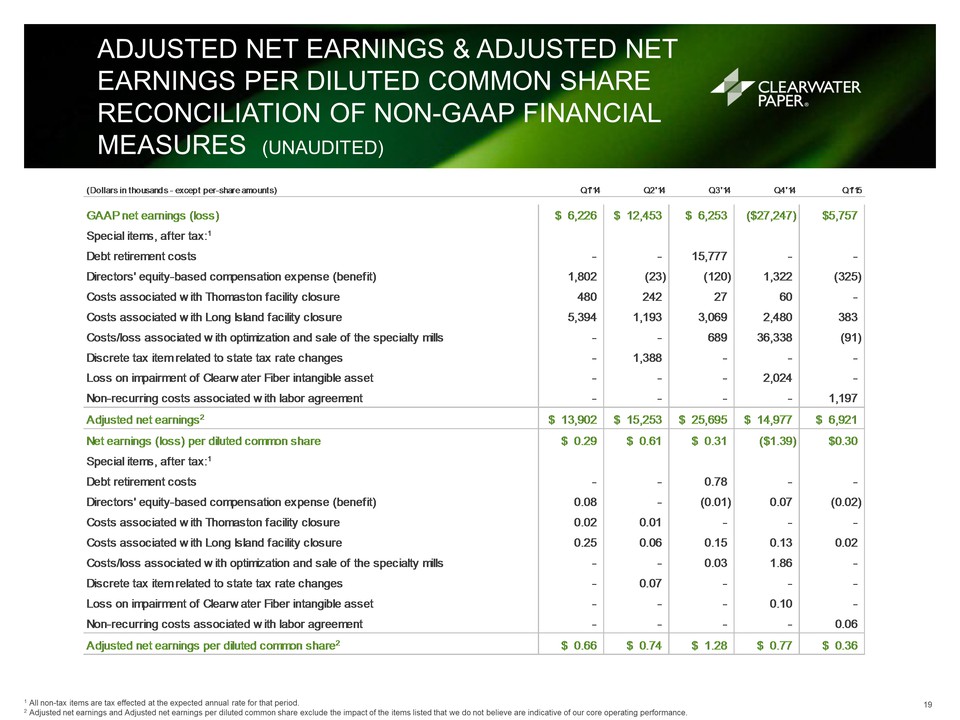
1 All non-tax items are tax effected at the expected annual rate for that period. 2 Adjusted net earnings and Adjusted net earnings per diluted common share exclude the impact of the items listed that we do not believe are indicative of our core operating performance. (Dollars in thousands - except per-share amounts)Q1'14Q2'14Q3'14Q4'14Q1'15GAAP net earnings (loss)$ 6,226$ 12,453$ 6,253($27,247)$5,757Special items, after tax:1Debt retirement costs- - 15,777 - - Directors' equity-based compensation expense (benefit)1,802 (23) (120) 1,322 (325) Costs associated with Thomaston facility closure480 242 27 60 - Costs associated with Long Island facility closure5,394 1,193 3,069 2,480 383 Costs/loss associated with optimization and sale of the specialty mills- - 689 36,338 (91) Discrete tax item related to state tax rate changes- 1,388 - - - Loss on impairment of Clearwater Fiber intangible asset- - - 2,024 - Non-recurring costs associated with labor agreement- - - - 1,197 Adjusted net earnings2$ 13,902$ 15,253$ 25,695$ 14,977$ 6,921Net earnings (loss) per diluted common share$ 0.29$ 0.61$ 0.31($1.39)$0.30Special items, after tax:1Debt retirement costs- - 0.78 - - Directors' equity-based compensation expense (benefit)0.08 - (0.01) 0.07 (0.02) Costs associated with Thomaston facility closure0.02 0.01 - - - Costs associated with Long Island facility closure0.25 0.06 0.15 0.13 0.02 Costs/loss associated with optimization and sale of the specialty mills- - 0.03 1.86 - Discrete tax item related to state tax rate changes- 0.07 - - - Loss on impairment of Clearwater Fiber intangible asset- - - 0.10 - Non-recurring costs associated with labor agreement- - - - 0.06 Adjusted net earnings per diluted common share2$ 0.66$ 0.74$ 1.28$ 0.77$ 0.36 ADJUSTED INCOME TAX PROVISION RECONCILIATION OF NON-GAAP FINANCIAL MEASURE (UNAUDITED)
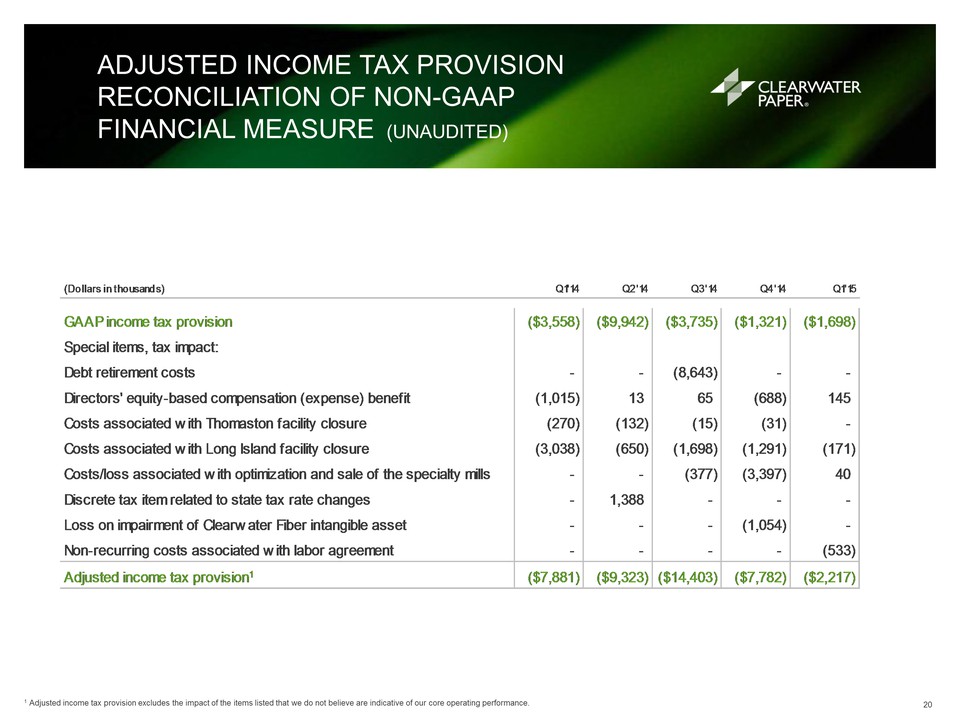
1 Adjusted income tax provision excludes the impact of the items listed that we do not believe are indicative of our core operating performance. (Dollars in thousands)Q1'14Q2'14Q3'14Q4'14Q1'15GAAP income tax provision($3,558)($9,942)($3,735)($1,321)($1,698)Special items, tax impact: Debt retirement costs- - (8,643) - - Directors' equity-based compensation (expense) benefit (1,015) 13 65 (688) 145 Costs associated with Thomaston facility closure(270) (132) (15) (31) - Costs associated with Long Island facility closure(3,038) (650) (1,698) (1,291) (171) Costs/loss associated with optimization and sale of the specialty mills- - (377) (3,397) 40 Discrete tax item related to state tax rate changes- 1,388 - - - Loss on impairment of Clearwater Fiber intangible asset- - - (1,054) - Non-recurring costs associated with labor agreement- - - - (533) Adjusted income tax provision1($7,881)($9,323)($14,403)($7,782)($2,217) EBITDA & ADJUSTED EBITDA RECONCILIATION OF NON-GAAP FINANCIAL MEASURES (UNAUDITED)
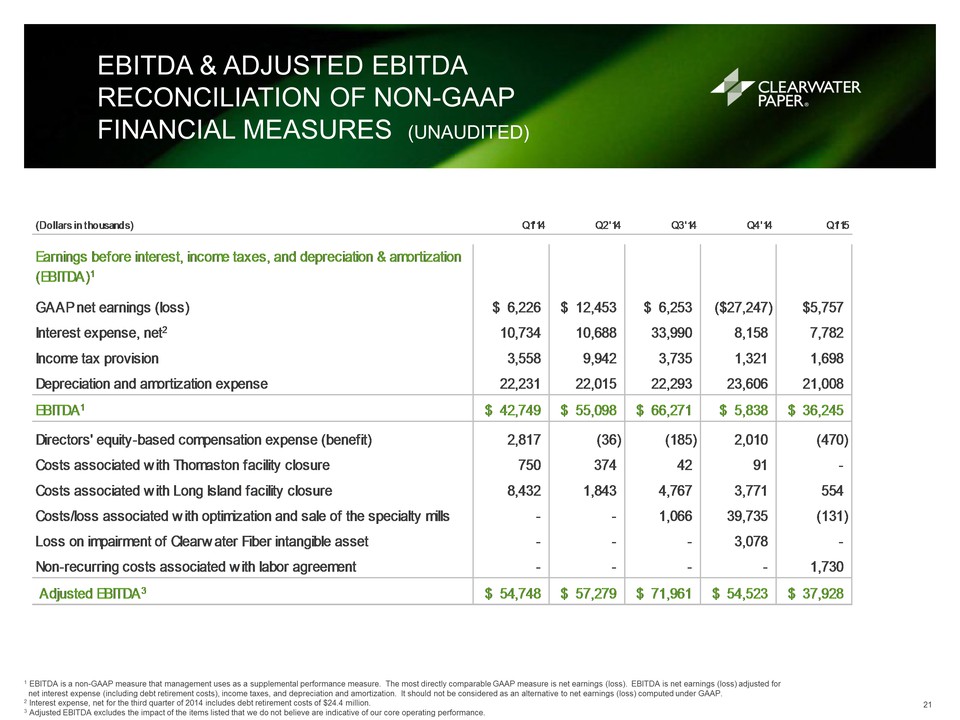
1 EBITDA is a non-GAAP measure that management uses as a supplemental performance measure. The most directly comparable GAAP measure is net earnings (loss). EBITDA is net earnings (loss) adjusted for net interest expense (including debt retirement costs), income taxes, and depreciation and amortization. It should not be considered as an alternative to net earnings (loss) computed under GAAP. 2 Interest expense, net for the third quarter of 2014 includes debt retirement costs of $24.4 million. 3 Adjusted EBITDA excludes the impact of the items listed that we do not believe are indicative of our core operating performance. (Dollars in thousands)Q1'14Q2'14Q3'14Q4'14Q1'15Earnings before interest, income taxes, and depreciation & amortization (EBITDA)1 GAAP net earnings (loss)$ 6,226$ 12,453$ 6,253($27,247)$5,757Interest expense, net210,73410,68833,9908,1587,782Income tax provision3,5589,9423,7351,3211,698Depreciation and amortization expense22,23122,01522,29323,60621,008EBITDA1$ 42,749$ 55,098$ 66,271$ 5,838$ 36,245Directors' equity-based compensation expense (benefit)2,817 (36) (185) 2,010 (470) Costs associated with Thomaston facility closure750 374 42 91 - Costs associated with Long Island facility closure8,432 1,843 4,767 3,771 554 Costs/loss associated with optimization and sale of the specialty mills- - 1,066 39,735 (131) Loss on impairment of Clearwater Fiber intangible asset- - - 3,078 - Non-recurring costs associated with labor agreement- - - - 1,730 Adjusted EBITDA3$ 54,748$ 57,279$ 71,961$ 54,523$ 37,928 SEGMENT EBITDA & ADJUSTED EBITDA RECONCILIATION OF NON-GAAP FINANCIAL MEASURES (UNAUDITED)
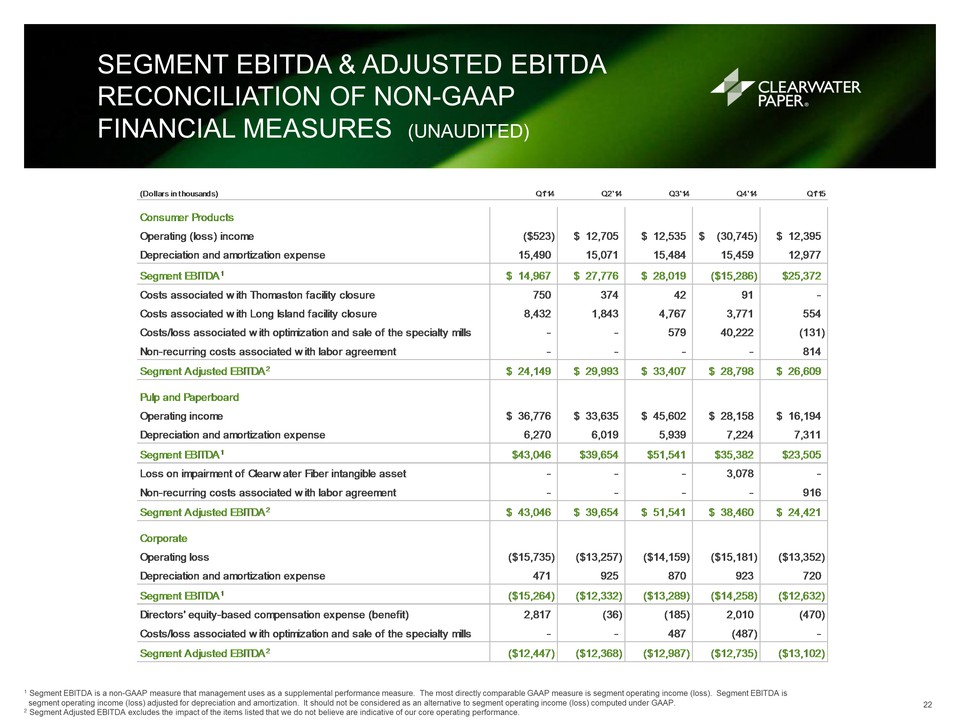
(Dollars in thousands)Q1'14Q2'14Q3'14Q4'14Q1'15Consumer ProductsOperating (loss) income($523)$ 12,705$ 12,535(30,745)$ $ 12,395Depreciation and amortization expense15,490 15,071 15,484 15,459 12,977 Segment EBITDA1$ 14,967$ 27,776$ 28,019($15,286)$25,372Costs associated with Thomaston facility closure750 374 42 91 - Costs associated with Long Island facility closure8,432 1,843 4,767 3,771 554 Costs/loss associated with optimization and sale of the specialty mills- - 579 40,222 (131) Non-recurring costs associated with labor agreement- - - - 814 Segment Adjusted EBITDA2$ 24,149$ 29,993$ 33,407$ 28,798$ 26,609Pulp and PaperboardOperating income$ 36,776$ 33,635$ 45,602$ 28,158$ 16,194Depreciation and amortization expense6,270 6,019 5,939 7,224 7,311 Segment EBITDA1$43,046$39,654$51,541$35,382$23,505Loss on impairment of Clearwater Fiber intangible asset- - - 3,078 - Non-recurring costs associated with labor agreement- - - - 916 Segment Adjusted EBITDA2$ 43,046$ 39,654$ 51,541$ 38,460$ 24,421CorporateOperating loss($15,735)($13,257)($14,159)($15,181)($13,352)Depreciation and amortization expense471 925 870 923 720 Segment EBITDA1($15,264)($12,332)($13,289)($14,258)($12,632)Directors' equity-based compensation expense (benefit)2,817 (36) (185) 2,010 (470) Costs/loss associated with optimization and sale of the specialty mills- - 487 (487) - Segment Adjusted EBITDA2($12,447)($12,368)($12,987)($12,735)($13,102) 1 Segment EBITDA is a non-GAAP measure that management uses as a supplemental performance measure. The most directly comparable GAAP measure is segment operating income (loss). Segment EBITDA is segment operating income (loss) adjusted for depreciation and amortization. It should not be considered as an alternative to segment operating income (loss) computed under GAAP. 2 Segment Adjusted EBITDA excludes the impact of the items listed that we do not believe are indicative of our core operating performance. RETURN ON INVESTED CAPITAL, TANGIBLE STOCKHOLDERS’ EQUITY & EXCESS CASH RECONCILIATION OF NON-GAAP FINANCIAL MEASURES (UNAUDITED)
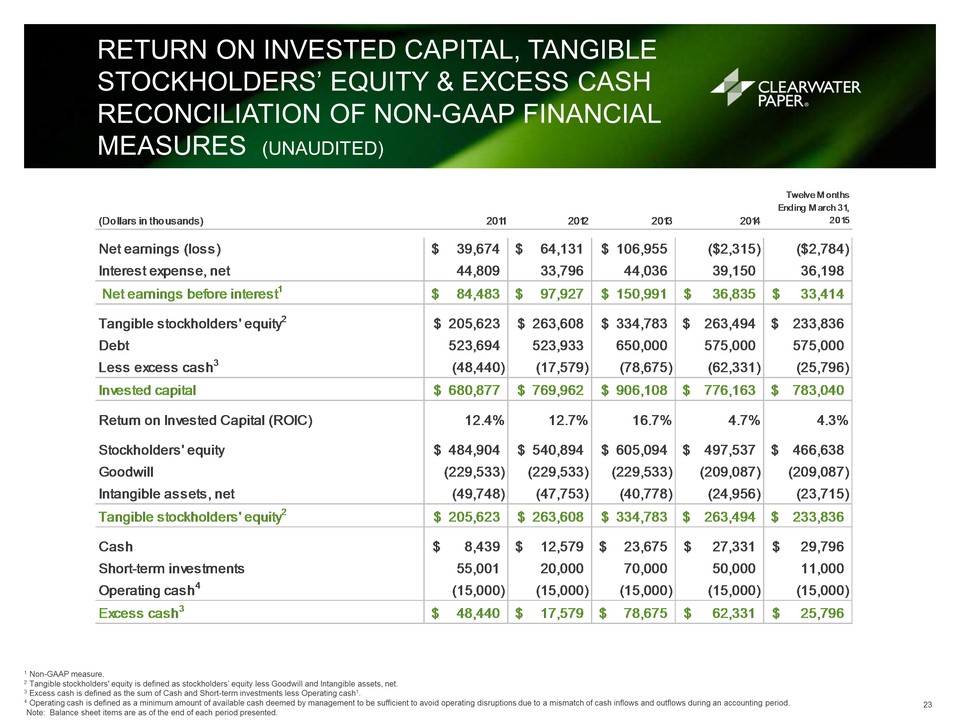
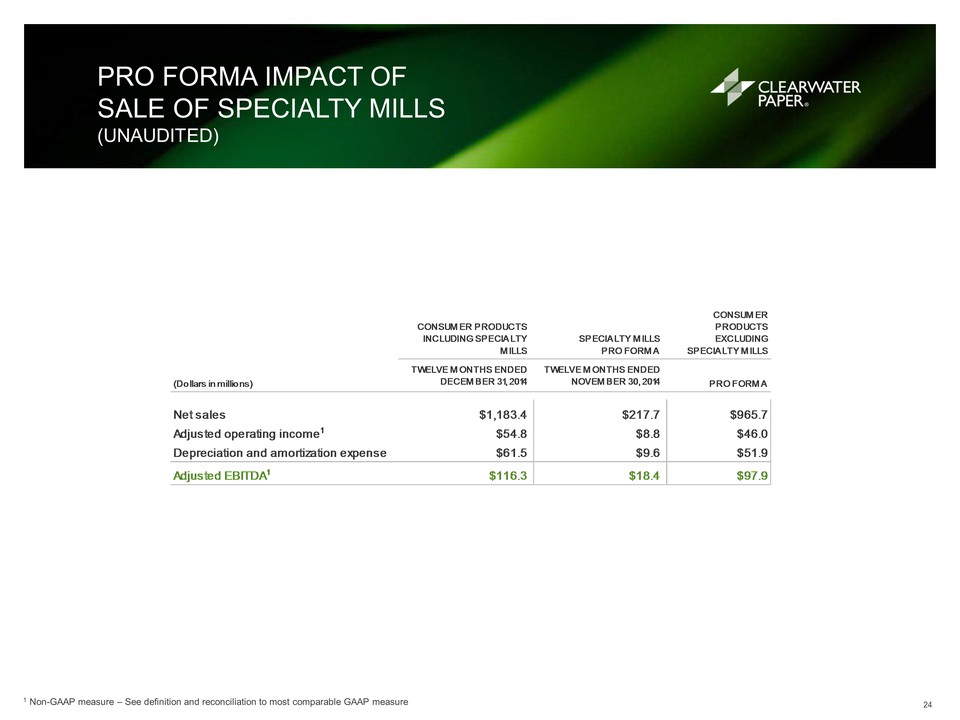
1 Non-GAAP measure. 2 Tangible stockholders' equity is defined as stockholders’ equity less Goodwill and Intangible assets, net. 3 Excess cash is defined as the sum of Cash and Short-term investments less Operating cash1. 4 Operating cash is defined as a minimum amount of available cash deemed by management to be sufficient to avoid operating disruptions due to a mismatch of cash inflows and outflows during an accounting period. Note: Balance sheet items are as of the end of each period presented. (Dollars in thousands)2011201220132014Twelve Months Ending March 31, 2015Net earnings (loss)39,674$ 64,131$ 106,955$ ($2,315)($2,784)Interest expense, net44,809 33,796 44,036 39,150 36,198 Net earnings before interest184,483$ 97,927$ 150,991$ 36,835$ 33,414$ Tangible stockholders' equity2205,623$ 263,608$ 334,783$ 263,494$ 233,836$ Debt523,694 523,933 650,000 575,000 575,000 Less excess cash3(48,440) (17,579) (78,675) (62,331) (25,796) Invested capital680,877$ 769,962$ 906,108$ 776,163$ 783,040$ Return on Invested Capital (ROIC)12.4%12.7%16.7%4.7%4.3%Stockholders' equity484,904$ 540,894$ 605,094$ 497,537$ 466,638$ Goodwill(229,533) (229,533) (229,533) (209,087) (209,087) Intangible assets, net(49,748) (47,753) (40,778) (24,956) (23,715) Tangible stockholders' equity2205,623$ 263,608$ 334,783$ 263,494$ 233,836$ Cash8,439$ 12,579$ 23,675$ 27,331$ 29,796$ Short-term investments55,001 20,000 70,000 50,000 11,000 Operating cash4(15,000) (15,000) (15,000) (15,000) (15,000) Excess cash348,440$ 17,579$ 78,675$ 62,331$ 25,796$ CONSUMER PRODUCTS INCLUDING SPECIALTY MILLSSPECIALTY MILLSPRO FORMACONSUMER PRODUCTS EXCLUDING SPECIALTY MILLS(Dollars in millions)TWELVE MONTHS ENDEDDECEMBER 31, 2014TWELVE MONTHS ENDEDNOVEMBER 30, 2014PRO FORMANet sales$1,183.4$217.7$965.7Adjusted operating income1$54.8$8.8$46.0Depreciation and amortization expense$61.5 $9.6 $51.9 Adjusted EBITDA1$116.3 $18.4 $97.9 PRO FORMA IMPACT OF SALE OF SPECIALTY MILLS (UNAUDITED)
1 Non-GAAP measure – See definition and reconciliation to most comparable GAAP measure Q2’15 OUTLOOK1 RECONCILIATION OF NON-GAAP FINANCIAL MEASURES (UNAUDITED)
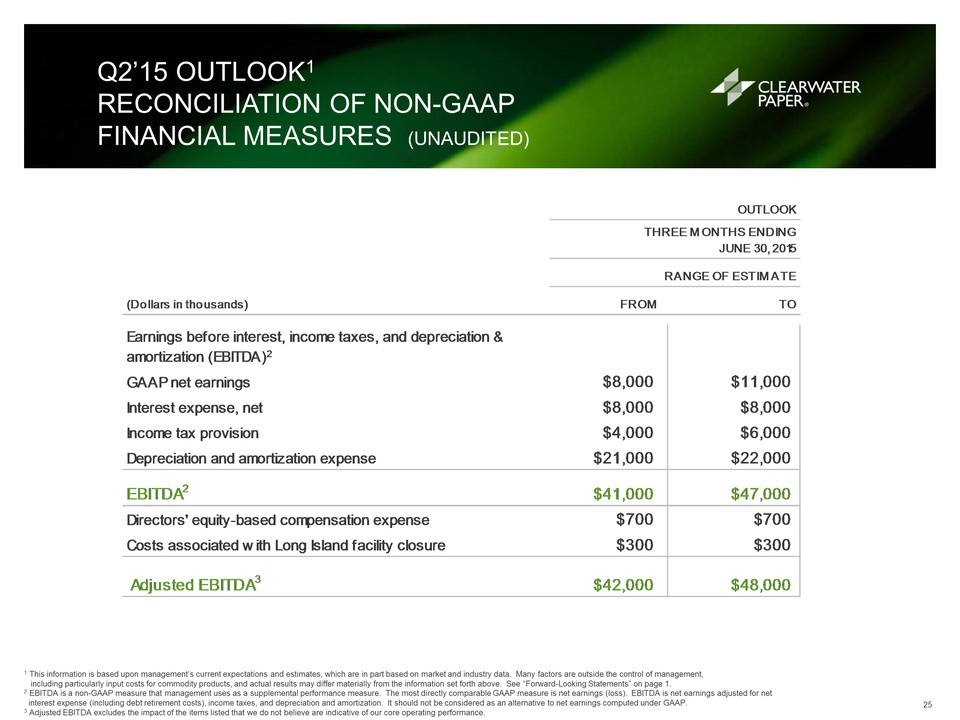
1 This information is based upon management’s current expectations and estimates, which are in part based on market and industry data. Many factors are outside the control of management, including particularly input costs for commodity products, and actual results may differ materially from the information set forth above. See “Forward-Looking Statements” on page 1. 2 EBITDA is a non-GAAP measure that management uses as a supplemental performance measure. The most directly comparable GAAP measure is net earnings (loss). EBITDA is net earnings adjusted for net interest expense (including debt retirement costs), income taxes, and depreciation and amortization. It should not be considered as an alternative to net earnings computed under GAAP. 3 Adjusted EBITDA excludes the impact of the items listed that we do not believe are indicative of our core operating performance. (Dollars in thousands)FROMTOEarnings before interest, income taxes, and depreciation & amortization (EBITDA)2GAAP net earnings$8,000$11,000Interest expense, net$8,000$8,000Income tax provision$4,000$6,000Depreciation and amortization expense$21,000$22,000EBITDA2$41,000$47,000Directors' equity-based compensation expense$700$700Costs associated with Long Island facility closure$300$300 Adjusted EBITDA3$42,000$48,000THREE MONTHS ENDINGJUNE 30, 2015RANGE OF ESTIMATEOUTLOOK FOR MORE INFORMATION: WWW.CLEARWATERPAPER.COM