Attached files
| file | filename |
|---|---|
| 8-K - 8-K - ASPEN INSURANCE HOLDINGS LTD | form8-kq12015.htm |
| EX-99.1 - EXHIBIT 99.1 - ASPEN INSURANCE HOLDINGS LTD | a991-ahlq115.htm |
| EX-99.3 - EXHIBIT 99.3 - ASPEN INSURANCE HOLDINGS LTD | ahlq12015investorpresent.htm |
Exhibit 99.2
 | ||||||||||||
FINANCIAL SUPPLEMENT | ||||||||||||
As of March 31, 2015 | ||||||||||||
Aspen Insurance Holdings Limited | ||||||||||||
This financial supplement is for information purposes only. It should be read in conjunction with other documents filed or to be filed by Aspen Insurance Holdings Limited with the United States Securities and Exchange Commission. | ||||||||||||
www.aspen.co | ||||||||||||
Investor Contact: | ||||||||||||
Aspen Insurance Holdings Limited | ||||||||||||
Kerry Calaiaro, Senior Vice President, Investor Relations | ||||||||||||
T: +1 646-502-1076 | ||||||||||||
email: kerry.calaiaro@aspen.co | ||||||||||||
 | ||||||||||||
 | ASPEN INSURANCE HOLDINGS LIMITED | |||
Table Of Contents | ||||
Page | ||||
Condensed Consolidated Statements of Cash Flows | ||||
Prior Year Reserve Releases | ||||
| ASPEN INSURANCE HOLDINGS LIMITED | |||
Basis of Presentation | ||||
Definitions and presentations: All financial information contained herein is unaudited except for information for the fiscal year ended December 31, 2014 and December 31, 2013. Unless otherwise noted, all data is in U.S. dollar millions, except for per share amounts, percentages and ratio information. | ||||
In presenting Aspen's results, management has included and discussed certain "non-GAAP financial measures", as such term is defined in Regulation G. Management believes that these non-GAAP measures, which may be defined differently by other companies, better explain Aspen's results of operations in a manner that allows for a more complete understanding of the underlying trends in Aspen's business. However, these measures should not be viewed as a substitute for those determined in accordance with GAAP. The reconciliation of such non-GAAP financial measures to their respective most directly comparable GAAP financial measures in accordance with Regulation G is included in this financial supplement. | ||||
Operating income (a non-U.S. GAAP financial measure): Operating income is an internal performance measure used by Aspen in the management of its operations and represents after-tax operational results excluding, as applicable, after-tax net realized and unrealized capital gains or losses, including net realized and unrealized gains and losses on interest rate swaps, after-tax net foreign exchange gains or losses, including net realized and unrealized gains and losses from foreign exchange contracts and certain non-recurring items. In 2014, non-recurring items included costs associated with defending the unsolicited approach from Endurance Specialty Holdings Ltd. in the amount of $3.0 million for the three months ended March 31, 2014. | ||||
Aspen excludes these items above from its calculation of operating income because they are either not expected to recur and therefore are not reflective of underlying performance or the amount of these gains or losses is heavily influenced by, and fluctuates in part, according to the availability of market opportunities. Aspen believes these amounts are largely independent of its business and underwriting process and including them would distort the analysis of trends in its operations. In addition to presenting net income determined in accordance with GAAP, Aspen believes that showing operating income enables investors, analysts, rating agencies and other users of its financial information to more easily analyze Aspen's results of operations in a manner similar to how management analyzes Aspen's underlying business performance. Operating income should not be viewed as a substitute for GAAP net income. Please see page 22 for a reconciliation of operating income to net income. | ||||
Annualized operating return on average equity (“Operating ROE”) (a non-GAAP financial measure): Operating ROE is calculated using operating income, as defined above, and average equity is calculated as the arithmetic average on a monthly basis for the stated periods of shareholders' equity excluding the aggregate value of the liquidation preferences of our preference shares net of issuance costs and the total amount of non-controlling interest. | ||||
Aspen presents Operating ROE as a measure that is commonly recognized as a standard of performance by investors, analysts, rating agencies and other users of its financial information. See page 22 for a reconciliation of operating income to net income and page 7 for a reconciliation of average ordinary shareholders' equity to average shareholders' equity. | ||||
Diluted operating earnings per share and basic operating earnings per share (non-GAAP financial measures): Aspen believes that the presentation of diluted operating earnings per share and basic operating earnings per share supports meaningful comparison from period to period and the analysis of normal business operations. Diluted operating earnings per share and basic operating earnings per share are calculated by dividing operating income by the diluted or basic weighted average number of shares outstanding for the period. See page 22 for a reconciliation of diluted and basic operating earnings per share to basic earnings per share. | ||||
Diluted book value per ordinary share (not a non-GAAP financial measure): Aspen has included diluted book value per ordinary share as it illustrates the effect on basic book value per share of dilutive securities thereby providing a better benchmark for comparison with other companies. Diluted book value per share is calculated using the treasury stock method as defined on page 21. | ||||
Underwriting ratios (GAAP financial measures): Aspen, along with others in the industry, uses underwriting ratios as measures of performance. The loss ratio is the ratio of net claims and claims adjustment expenses to net premiums earned. The acquisition expense ratio is the ratio of underwriting expenses (commissions, premium taxes, licenses and fees, as well as other underwriting expenses) to net premiums earned. The general and administrative expense ratio is the ratio of general and administrative expenses to net premiums earned. The combined ratio is the sum of the loss ratio, the acquisition expense ratio and the general and administrative expense ratio. These ratios are relative measurements that describe for every $100 of net premiums earned, the cost of losses and expenses, respectively. The combined ratio presents the total cost per $100 of earned premium. A combined ratio below 100% demonstrates underwriting profit; a combined ratio above 100% demonstrates underwriting loss. | ||||
GAAP combined ratios differ from U.S. statutory combined ratios primarily due to the deferral of certain third-party acquisition expenses for GAAP reporting purposes and the use of net premiums earned rather than net premiums written in the denominator when calculating the acquisition expense and the general and administrative expense ratios. | ||||
1
| ASPEN INSURANCE HOLDINGS LIMITED | |||||||||||||
Financial Highlights | ||||||||||||||
Three Months Ended March 31, | ||||||||||||||
(in US$ millions except for percentages, share and per share amounts) | 2015 | 2014 | Change | |||||||||||
Gross written premium | $ | 919.2 | $ | 855.5 | 7.4 | % | ||||||||
Net written premium | $ | 763.2 | $ | 697.5 | 9.4 | % | ||||||||
Net earned premium | $ | 593.6 | $ | 566.5 | 4.8 | % | ||||||||
Net income after tax | $ | 128.0 | $ | 120.4 | 6.3 | % | ||||||||
Operating income after tax | $ | 98.0 | $ | 112.7 | (13.0 | )% | ||||||||
Net investment income | $ | 47.4 | $ | 49.5 | (4.2 | )% | ||||||||
Underwriting income | $ | 66.0 | $ | 73.8 | (10.6 | )% | ||||||||
Earnings Per Share and Book Value Per Share | ||||||||||||||
Basic earnings per ordinary share | ||||||||||||||
Net income adjusted for preference share dividend | $ | 1.91 | $ | 1.70 | 12.4 | % | ||||||||
Operating income adjusted for preference share dividend | $ | 1.43 | $ | 1.59 | (10.1 | )% | ||||||||
Diluted earnings per ordinary share | ||||||||||||||
Net income adjusted for preference share dividend | $ | 1.87 | $ | 1.66 | 12.7 | % | ||||||||
Operating income adjusted for preference share dividend | $ | 1.39 | $ | 1.55 | (10.3 | )% | ||||||||
Weighted average number of ordinary shares outstanding (in millions of shares) | 62.159 | 65.289 | (4.8 | )% | ||||||||||
Diluted weighted average number of ordinary shares outstanding (in millions of shares) | 63.533 | 66.566 | (4.6 | )% | ||||||||||
Book value per ordinary share | $ | 47.14 | $ | 43.28 | 8.9 | % | ||||||||
Diluted book value per ordinary share | $ | 46.02 | $ | 42.72 | 7.7 | % | ||||||||
Ordinary shares outstanding at March 31, 2015 and March 31, 2014 (in millions of shares) | 61.723 | 65.419 | (5.6 | )% | ||||||||||
Diluted ordinary shares outstanding at March 31, 2015 and March 31, 2014 (in millions of shares) | 63.227 | 66.281 | (4.6 | )% | ||||||||||
Underwriting Ratios | ||||||||||||||
Loss ratio | 51.6 | % | 50.9 | % | ||||||||||
Policy acquisition expense ratio | 20.1 | % | 19.8 | % | ||||||||||
General, administrative and corporate expense ratio | 17.2 | % | 16.9 | % | ||||||||||
General, administrative and corporate expense ratio (excluding non-recurring corporate expenses) | 17.2 | % | 16.3 | % | ||||||||||
Expense ratio | 37.3 | % | 36.7 | % | ||||||||||
Expense ratio (excluding non-recurring corporate expenses) | 37.3 | % | 36.1 | % | ||||||||||
Combined ratio | 88.9 | % | 87.6 | % | ||||||||||
Combined ratio (excluding non-recurring corporate expenses) | 88.9 | % | 87.0 | % | ||||||||||
Return On Equity | ||||||||||||||
Average equity (1) | $ | 2,886.3 | $ | 2,787.7 | ||||||||||
Return on average equity | ||||||||||||||
Net income adjusted for preference share dividend | 4.1 | % | 4.0 | % | ||||||||||
Operating income adjusted for preference share dividend | 3.1 | % | 3.7 | % | ||||||||||
Annualized return on average equity | ||||||||||||||
Net income | 16.4 | % | 16.0 | % | ||||||||||
Operating income | 12.4 | % | 14.8 | % | ||||||||||
See pages 7 and 22 for a reconciliation of non-GAAP financial measures to their most directly comparable GAAP financial measures. | ||||||||||||||
(1) Average equity excludes preference shares. | ||||||||||||||
2
| ASPEN INSURANCE HOLDINGS LIMITED | |||||||||||||||||||||
Consolidated Statements of Operations - Quarterly Results | ||||||||||||||||||||||
(in US$ millions except for percentages and per share amounts) | Q1 2015 | Q4 2014 | Q3 2014 | Q2 2014 | Q1 2014 | |||||||||||||||||
UNDERWRITING REVENUES | ||||||||||||||||||||||
Gross written premiums | $ | 919.2 | $ | 615.4 | $ | 652.5 | $ | 779.3 | $ | 855.5 | ||||||||||||
Premiums ceded | (156.0 | ) | (61.4 | ) | (75.2 | ) | (92.9 | ) | (158.0 | ) | ||||||||||||
Net written premiums | 763.2 | 554.0 | 577.3 | 686.4 | 697.5 | |||||||||||||||||
Change in unearned premiums | (169.6 | ) | 58.2 | 33.1 | (70.2 | ) | (131.0 | ) | ||||||||||||||
Net earned premiums | 593.6 | 612.2 | 610.4 | 616.2 | 566.5 | |||||||||||||||||
UNDERWRITING EXPENSES | ||||||||||||||||||||||
Losses and loss adjustment expenses | 306.1 | 339.6 | 342.7 | 337.1 | 288.1 | |||||||||||||||||
Amortization of deferred policy acquisition costs | 119.3 | 114.8 | 115.5 | 108.9 | 112.0 | |||||||||||||||||
General, administrative and corporate expenses (excluding non-recurring corporate expenses) | 102.2 | 121.5 | 99.6 | 103.5 | 92.6 | |||||||||||||||||
Total underwriting expenses | 527.6 | 575.9 | 557.8 | 549.5 | 492.7 | |||||||||||||||||
Underwriting income including corporate expenses | 66.0 | 36.3 | 52.6 | 66.7 | 73.8 | |||||||||||||||||
OTHER OPERATING REVENUE AND EXPENSES | ||||||||||||||||||||||
Net investment income | 47.4 | 46.7 | 48.0 | 46.1 | 49.5 | |||||||||||||||||
Interest expense | (7.4 | ) | (7.4 | ) | (7.4 | ) | (7.3 | ) | (7.4 | ) | ||||||||||||
Other (expense)/income | (1.6 | ) | (3.9 | ) | (7.8 | ) | 2.0 | (0.1 | ) | |||||||||||||
Total other operating revenue | 38.4 | 35.4 | 32.8 | 40.8 | 42.0 | |||||||||||||||||
OPERATING INCOME BEFORE TAX | 104.4 | 71.7 | 85.4 | 107.5 | 115.8 | |||||||||||||||||
Non-recurring corporate expenses | — | — | (20.2 | ) | (5.3 | ) | (3.0 | ) | ||||||||||||||
Net realized and unrealized exchange (losses)/gains (1) (3) | (11.0 | ) | (2.8 | ) | (9.9 | ) | 7.7 | 2.6 | ||||||||||||||
Net realized and unrealized investment gains/(losses) (2) (3) | 39.7 | (0.9 | ) | (16.6 | ) | 27.1 | 8.8 | |||||||||||||||
INCOME BEFORE TAX | 133.1 | 68.0 | 38.7 | 137.0 | 124.2 | |||||||||||||||||
Income tax expense | (5.1 | ) | (0.8 | ) | (1.3 | ) | (6.2 | ) | (3.8 | ) | ||||||||||||
NET INCOME AFTER TAX | 128.0 | 67.2 | 37.4 | 130.8 | 120.4 | |||||||||||||||||
Dividends paid on ordinary shares | (12.4 | ) | (12.4 | ) | (13.1 | ) | (13.1 | ) | (11.7 | ) | ||||||||||||
Dividends paid on preference shares | (9.5 | ) | (9.4 | ) | (9.5 | ) | (9.4 | ) | (9.5 | ) | ||||||||||||
Dividends paid to non-controlling interest | — | (0.1 | ) | — | — | — | ||||||||||||||||
Proportion due to non-controlling interest | — | (0.8 | ) | 0.1 | — | (0.1 | ) | |||||||||||||||
Retained income | $ | 106.1 | $ | 44.5 | $ | 14.9 | $ | 108.3 | $ | 99.1 | ||||||||||||
Components of net income after tax | ||||||||||||||||||||||
Operating income | 98.0 | 71.3 | 81.7 | 102.8 | 112.7 | |||||||||||||||||
Non-recurring corporate expenses | — | — | (20.2 | ) | (5.3 | ) | (3.0 | ) | ||||||||||||||
Net realized and unrealized exchange (losses)/gains after tax (1) (3) | (9.8 | ) | (3.1 | ) | (7.5 | ) | 6.3 | 2.1 | ||||||||||||||
Net realized and unrealized investment gains/(losses) after tax (2) (3) | 39.8 | (1.0 | ) | (16.6 | ) | 27.0 | 8.6 | |||||||||||||||
NET INCOME AFTER TAX | $ | 128.0 | $ | 67.2 | $ | 37.4 | $ | 130.8 | $ | 120.4 | ||||||||||||
Loss ratio | 51.6 | % | 55.5 | % | 56.1 | % | 54.7 | % | 50.9 | % | ||||||||||||
Policy acquisition expense ratio | 20.1 | % | 18.8 | % | 18.9 | % | 17.7 | % | 19.8 | % | ||||||||||||
General, administrative and corporate expense ratio | 17.2 | % | 19.8 | % | 19.6 | % | 17.7 | % | 16.9 | % | ||||||||||||
General, administrative and corporate expense ratio (excluding non-recurring corporate expenses) | 17.2 | % | 19.8 | % | 16.3 | % | 16.8 | % | 16.3 | % | ||||||||||||
Expense ratio | 37.3 | % | 38.6 | % | 38.5 | % | 35.4 | % | 36.7 | % | ||||||||||||
Expense ratio (excluding non-recurring corporate expenses) | 37.3 | % | 38.6 | % | 35.2 | % | 34.5 | % | 36.1 | % | ||||||||||||
Combined ratio | 88.9 | % | 94.1 | % | 94.6 | % | 90.1 | % | 87.6 | % | ||||||||||||
Combined ratio (excluding non-recurring corporate expenses) | 88.9 | % | 94.1 | % | 91.3 | % | 89.2 | % | 87.0 | % | ||||||||||||
Basic earnings per share (4) | $ | 1.91 | $ | 0.92 | $ | 0.43 | $ | 1.85 | $ | 1.70 | ||||||||||||
Diluted earnings per share (4) | $ | 1.87 | $ | 0.90 | $ | 0.42 | $ | 1.82 | $ | 1.66 | ||||||||||||
Annualized return on average equity | ||||||||||||||||||||||
Net income | 16.4 | % | 8.0 | % | 4.0 | % | 16.8 | % | 16.0 | % | ||||||||||||
Operating income | 12.4 | % | 8.8 | % | 10.0 | % | 12.8 | % | 14.8 | % | ||||||||||||
See pages 7 and 22 for a reconciliation of non-GAAP financial measures to their most directly comparable GAAP financial measures. | ||||||||||||||||||||||
(1) Includes the net realized and unrealized gains/(losses) from foreign exchange contracts. | ||||||||||||||||||||||
(2) Includes the net realized and unrealized gains/(losses) from interest rate swaps. | ||||||||||||||||||||||
(3) Adjusted for a representation of foreign exchange in relation to investment securities from realized and unrealized exchange gains/(losses) to realized and unrealized investment gains/(losses). | ||||||||||||||||||||||
(4) Adjusted for preference share dividends and non-controlling interest. | ||||||||||||||||||||||
3
| ASPEN INSURANCE HOLDINGS LIMITED | |||||||||||||
Consolidated Statements of Operations - Year To Date Results | ||||||||||||||
Three Months Ended March 31, | ||||||||||||||
2015 | 2014 | 2013 | ||||||||||||
UNDERWRITING REVENUES | ||||||||||||||
Gross written premiums | $ | 919.2 | $ | 855.5 | $ | 773.4 | ||||||||
Premiums ceded | (156.0 | ) | (158.0 | ) | (176.4 | ) | ||||||||
Net written premiums | 763.2 | 697.5 | 597.0 | |||||||||||
Change in unearned premiums | (169.6 | ) | (131.0 | ) | (86.1 | ) | ||||||||
Net earned premiums | 593.6 | 566.5 | 510.9 | |||||||||||
UNDERWRITING EXPENSES | ||||||||||||||
Losses and loss adjustment expenses | 306.1 | 288.1 | 268.7 | |||||||||||
Amortization of deferred policy acquisition costs | 119.3 | 112.0 | 104.6 | |||||||||||
General, administrative and corporate expenses (excluding non-recurring corporate expenses) | 102.2 | 92.6 | 86.6 | |||||||||||
Total underwriting expenses | 527.6 | 492.7 | 459.9 | |||||||||||
Underwriting income including corporate expenses | 66.0 | 73.8 | 51.0 | |||||||||||
OTHER OPERATING REVENUE AND EXPENSES | ||||||||||||||
Net investment income | 47.4 | 49.5 | 48.3 | |||||||||||
Interest expense | (7.4 | ) | (7.4 | ) | (7.7 | ) | ||||||||
Other (expense)/income | (1.6 | ) | (0.1 | ) | 0.5 | |||||||||
Total other operating revenue | 38.4 | 42.0 | 41.1 | |||||||||||
OPERATING INCOME BEFORE TAX | 104.4 | 115.8 | 92.1 | |||||||||||
Non-recurring corporate expenses | — | (3.0 | ) | — | ||||||||||
Net realized and unrealized exchange (losses)/gains (1) | (11.0 | ) | 2.6 | (10.2 | ) | |||||||||
Net realized and unrealized investment gains(2) | 39.7 | 8.8 | 15.8 | |||||||||||
INCOME BEFORE TAX | 133.1 | 124.2 | 97.7 | |||||||||||
Income tax expense | (5.1 | ) | (3.8 | ) | (5.9 | ) | ||||||||
NET INCOME AFTER TAX | 128.0 | 120.4 | 91.8 | |||||||||||
Dividends paid on ordinary shares | (12.4 | ) | (11.7 | ) | (11.9 | ) | ||||||||
Dividends paid on preference shares | (9.5 | ) | (9.5 | ) | (8.6 | ) | ||||||||
Proportion due to non-controlling interest | — | (0.1 | ) | — | ||||||||||
Retained income | $ | 106.1 | $ | 99.1 | $ | 71.3 | ||||||||
Components of net income after tax | ||||||||||||||
Operating income | 98.0 | 112.7 | 85.7 | |||||||||||
Non-recurring corporate expenses | — | (3.0 | ) | — | ||||||||||
Net realized and unrealized exchange (losses)/gains after tax (1) | (9.8 | ) | 2.1 | (9.5 | ) | |||||||||
Net realized and unrealized investment gains after tax (2) | 39.8 | 8.6 | 15.6 | |||||||||||
NET INCOME AFTER TAX | $ | 128.0 | $ | 120.4 | $ | 91.8 | ||||||||
Loss ratio | 51.6 | % | 50.9 | % | 52.6 | % | ||||||||
Policy acquisition expense ratio | 20.1 | % | 19.8 | % | 20.5 | % | ||||||||
General, administrative and corporate expense ratio | 17.2 | % | 16.9 | % | 17.0 | % | ||||||||
General, administrative and corporate expense ratio (excluding non-recurring corporate expenses) | 17.2 | % | 16.3 | % | 17.0 | % | ||||||||
Expense ratio | 37.3 | % | 36.7 | % | 37.5 | % | ||||||||
Expense ratio (excluding non-recurring corporate expenses) | 37.3 | % | 36.1 | % | 37.5 | % | ||||||||
Combined ratio | 88.9 | % | 87.6 | % | 90.1 | % | ||||||||
Combined ratio (excluding non-recurring corporate expenses) | 88.9 | % | 87.0 | % | 90.1 | % | ||||||||
See pages 7 and 22 for a reconciliation of non-GAAP financial measures to their most directly comparable GAAP financial measures. | ||||||||||||||
(1 Includes the net realized and unrealized gains/(losses) from foreign exchange contracts. | ||||||||||||||
(2) Includes the net realized and unrealized gains/(losses) from interest rate swaps. | ||||||||||||||
4
| ASPEN INSURANCE HOLDINGS LIMITED | ||||||||||||||||||||||||||
Consolidated Balance Sheets | |||||||||||||||||||||||||||
(in US$ millions except for per share amounts) | March 31, 2015 | December 31, 2014 | September 30, 2014 | June 30, 2014 | March 31, 2014 | December 31, 2013 | |||||||||||||||||||||
Investments | |||||||||||||||||||||||||||
Fixed income securities | $ | 6,339.2 | $ | 6,401.0 | $ | 6,271.9 | $ | 6,297.7 | $ | 6,256.1 | $ | 6,285.3 | |||||||||||||||
Equity securities | 719.0 | 725.9 | 647.0 | 574.2 | 507.8 | 460.4 | |||||||||||||||||||||
Other investments | 9.5 | 8.7 | 8.7 | 8.7 | 8.7 | 48.0 | |||||||||||||||||||||
Catastrophe bonds | 32.8 | 34.8 | 32.2 | 30.0 | 18.0 | 5.8 | |||||||||||||||||||||
Short-term investments | 180.9 | 258.5 | 314.2 | 349.7 | 215.5 | 160.3 | |||||||||||||||||||||
Total investments | 7,281.4 | 7,428.9 | 7,274.0 | 7,260.3 | 7,006.1 | 6,959.8 | |||||||||||||||||||||
Cash and cash equivalents | 1,225.9 | 1,178.5 | 1,289.1 | 1,345.2 | 1,443.7 | 1,293.6 | |||||||||||||||||||||
Reinsurance recoverables | |||||||||||||||||||||||||||
Unpaid losses | 360.1 | 350.0 | 384.7 | 360.0 | 352.1 | 332.7 | |||||||||||||||||||||
Ceded unearned premiums | 276.4 | 206.8 | 229.8 | 217.9 | 221.3 | 151.9 | |||||||||||||||||||||
Receivables | |||||||||||||||||||||||||||
Underwriting premiums | 1,264.8 | 1,011.7 | 1,105.3 | 1,192.7 | 1,189.5 | 999.0 | |||||||||||||||||||||
Other | 92.1 | 90.2 | 92.0 | 106.4 | 107.8 | 90.3 | |||||||||||||||||||||
Funds withheld | 46.1 | 46.9 | 47.5 | 47.8 | 49.4 | 46.5 | |||||||||||||||||||||
Deferred policy acquisition costs | 333.8 | 299.0 | 301.6 | 306.4 | 289.6 | 262.2 | |||||||||||||||||||||
Derivatives at fair value | 2.1 | 8.0 | 7.0 | 1.6 | 6.8 | 7.0 | |||||||||||||||||||||
Receivable for securities sold | 0.3 | 2.3 | 1.6 | 9.1 | 14.8 | 5.2 | |||||||||||||||||||||
Office properties and equipment | 61.9 | 62.2 | 64.4 | 65.1 | 61.8 | 60.1 | |||||||||||||||||||||
Taxation | — | — | 4.0 | 2.8 | 0.5 | 1.6 | |||||||||||||||||||||
Other assets | 18.2 | 13.6 | 10.4 | 1.5 | 1.5 | 2.2 | |||||||||||||||||||||
Intangible assets | 18.2 | 18.2 | 18.2 | 18.2 | 18.3 | 18.4 | |||||||||||||||||||||
Total assets | $ | 10,981.3 | $ | 10,716.3 | $ | 10,829.6 | $ | 10,935.0 | $ | 10,763.2 | $ | 10,230.5 | |||||||||||||||
LIABILITIES | |||||||||||||||||||||||||||
Insurance reserves | |||||||||||||||||||||||||||
Losses and loss adjustment expenses | $ | 4,698.9 | $ | 4,750.8 | $ | 4,787.3 | $ | 4,795.8 | $ | 4,760.7 | $ | 4,678.9 | |||||||||||||||
Unearned premiums | 1,665.1 | 1,441.8 | 1,508.7 | 1,568.5 | 1,479.7 | 1,280.6 | |||||||||||||||||||||
Total insurance reserves | 6,364.0 | 6,192.6 | 6,296.0 | 6,364.3 | 6,240.4 | 5,959.5 | |||||||||||||||||||||
Payables | |||||||||||||||||||||||||||
Reinsurance premiums | 171.5 | 92.0 | 146.8 | 93.5 | 155.1 | 88.2 | |||||||||||||||||||||
Taxation | 34.8 | 21.4 | 25.7 | 28.0 | 16.5 | 15.7 | |||||||||||||||||||||
Accrued expenses and other payables | 308.6 | 356.9 | 290.3 | 284.5 | 361.6 | 265.6 | |||||||||||||||||||||
Liabilities under derivative contracts | 11.5 | 14.3 | 12.7 | 5.4 | 0.4 | 2.9 | |||||||||||||||||||||
Total payables | 526.4 | 484.6 | 475.5 | 411.4 | 533.6 | 372.4 | |||||||||||||||||||||
Loan notes issued by variable interest entities, at fair value | 76.0 | 70.7 | 64.5 | 56.0 | 53.4 | 50.0 | |||||||||||||||||||||
Long-term debt | 549.1 | 549.1 | 549.1 | 549.1 | 549.0 | 549.0 | |||||||||||||||||||||
Total liabilities | 7,515.5 | 7,297.0 | 7,385.1 | 7,380.8 | 7,376.4 | 6,930.9 | |||||||||||||||||||||
SHAREHOLDERS’ EQUITY | |||||||||||||||||||||||||||
Ordinary shares | 0.1 | 0.1 | 0.1 | 0.1 | 0.1 | 0.1 | |||||||||||||||||||||
Non-controlling interest | 0.5 | 0.5 | (0.3 | ) | (0.2 | ) | (0.2 | ) | (0.3 | ) | |||||||||||||||||
Preference shares | — | — | — | — | — | — | |||||||||||||||||||||
Additional paid-in capital | 1,106.0 | 1,134.3 | 1,186.4 | 1,276.7 | 1,269.9 | 1,297.4 | |||||||||||||||||||||
Retained earnings | 2,156.2 | 2,050.1 | 2,005.6 | 1,990.7 | 1,882.4 | 1,783.3 | |||||||||||||||||||||
Accumulated other comprehensive income, net of taxes | 203.0 | 234.3 | 252.7 | 286.9 | 234.6 | 219.1 | |||||||||||||||||||||
Total shareholders’ equity | 3,465.8 | 3,419.3 | 3,444.5 | 3,554.2 | 3,386.8 | 3,299.6 | |||||||||||||||||||||
Total liabilities and shareholders’ equity | $ | 10,981.3 | $ | 10,716.3 | $ | 10,829.6 | $ | 10,935.0 | $ | 10,763.2 | $ | 10,230.5 | |||||||||||||||
Book value per ordinary share | $ | 47.14 | $ | 46.16 | $ | 45.60 | $ | 45.81 | $ | 43.28 | $ | 41.87 | |||||||||||||||
Book value per diluted ordinary share | $ | 46.02 | $ | 45.13 | $ | 44.60 | $ | 44.84 | $ | 42.72 | $ | 40.90 | |||||||||||||||
See pages 7 and 22 for a reconciliation of non-GAAP financial measures to their most directly comparable GAAP financial measures. | |||||||||||||||||||||||||||
5
| ASPEN INSURANCE HOLDINGS LIMITED | |||||||||
Earnings Per Share and Book Value Per Share | ||||||||||
Three Months Ended | ||||||||||
(in US$ except for number of shares) | March 31, 2015 | March 31, 2014 | ||||||||
Basic earnings per ordinary share | ||||||||||
Net income adjusted for preference share dividend | $ | 1.91 | $ | 1.70 | ||||||
Operating income adjusted for preference share dividend | $ | 1.43 | $ | 1.59 | ||||||
Diluted earnings per ordinary share | ||||||||||
Net income adjusted for preference share dividend | $ | 1.87 | $ | 1.66 | ||||||
Operating income adjusted for preference share dividend | $ | 1.39 | $ | 1.55 | ||||||
Weighted average number of ordinary shares outstanding (in millions) | 62.159 | 65.289 | ||||||||
Weighted average number of ordinary shares outstanding and dilutive potential ordinary shares (in millions) | 63.533 | 66.566 | ||||||||
Book value per ordinary share | $ | 47.14 | $ | 43.28 | ||||||
Diluted book value per ordinary share | $ | 46.02 | $ | 42.72 | ||||||
Ordinary shares outstanding at end of the period (in millions) | 61.723 | 65.419 | ||||||||
Ordinary shares outstanding and dilutive potential ordinary shares at end of the period (in millions) | 63.227 | 66.281 | ||||||||
See pages 7 and 22 for a reconciliation of non-GAAP financial measures to their most directly comparable GAAP financial measures. | ||||||||||
6
| ASPEN INSURANCE HOLDINGS LIMITED | |||||||||
Return On Average Equity | ||||||||||
Three Months Ended | ||||||||||
(in US$ millions except for percentages) | March 31, 2015 | March 31, 2014 | ||||||||
Average shareholders' equity | $ | 3,442.6 | $ | 3,343.2 | ||||||
Average non-controlling interest | (0.5 | ) | 0.3 | |||||||
Average preference shares | (555.8 | ) | (555.8 | ) | ||||||
Average ordinary shareholders' equity | $ | 2,886.3 | $ | 2,787.7 | ||||||
Return on average equity: | ||||||||||
Net income adjusted for preference share dividend and non-controlling interest | 4.1 | % | 4.0 | % | ||||||
Operating income adjusted for preference share dividend and non-controlling interest | 3.1 | % | 3.7 | % | ||||||
Annualized return on average equity: | ||||||||||
Net income | 16.4 | % | 16.0 | % | ||||||
Operating income | 12.4 | % | 14.8 | % | ||||||
Components of return on average equity: | ||||||||||
Return on average equity from underwriting activity (1) | 2.3 | % | 2.6 | % | ||||||
Return on average equity from investment and other activity (2) | 1.0 | % | 1.2 | % | ||||||
Pre-tax operating income return on average equity | 3.3 | % | 3.8 | % | ||||||
Post-tax operating income return on average equity (3) | 3.1 | % | 3.7 | % | ||||||
See page 22 for a reconciliation of non-GAAP financial measures to their most directly comparable GAAP financial measures. | ||||||||||
(1) Calculated by using underwriting income. | ||||||||||
(2) Calculated by using total other operating revenue and other income/(expense) adjusted for preference share dividends. | ||||||||||
(3) Calculated by using operating income after-tax adjusted for preference share dividends. | ||||||||||
7
| ASPEN INSURANCE HOLDINGS LIMITED | ||||||||||||||||||||||||
Consolidated Underwriting Results by Operating Segment | |||||||||||||||||||||||||
Three Months Ended March 31, 2015 | Three Months Ended March 31, 2014 | ||||||||||||||||||||||||
(in US$ millions except for percentages) | Reinsurance | Insurance | Total | Reinsurance | Insurance | Total | |||||||||||||||||||
Gross written premiums | $ | 484.8 | $ | 434.4 | $ | 919.2 | $ | 472.2 | $ | 383.3 | $ | 855.5 | |||||||||||||
Net written premiums | 442.1 | 321.1 | 763.2 | 442.6 | 254.9 | 697.5 | |||||||||||||||||||
Gross earned premiums | 265.8 | 415.1 | 680.9 | 278.5 | 373.6 | 652.1 | |||||||||||||||||||
Net earned premiums | 249.4 | 344.2 | 593.6 | 266.7 | 299.8 | 566.5 | |||||||||||||||||||
Losses and loss adjustment expenses | 105.5 | 200.6 | 306.1 | 110.4 | 177.7 | 288.1 | |||||||||||||||||||
Amortization of deferred policy acquisition costs | 53.4 | 65.9 | 119.3 | 50.4 | 61.6 | 112.0 | |||||||||||||||||||
General and administrative expenses | 32.4 | 55.3 | 87.7 | 32.8 | 45.9 | 78.7 | |||||||||||||||||||
Underwriting income | $ | 58.1 | $ | 22.4 | $ | 80.5 | $ | 73.1 | $ | 14.6 | $ | 87.7 | |||||||||||||
Net investment income | 47.4 | 49.5 | |||||||||||||||||||||||
Net realized and unrealized investment gains (1) | 39.7 | 8.3 | |||||||||||||||||||||||
Corporate expenses | (14.5 | ) | (13.9 | ) | |||||||||||||||||||||
Non-recurring corporate expenses | — | (3.0 | ) | ||||||||||||||||||||||
Other expense | (1.6 | ) | (0.1 | ) | |||||||||||||||||||||
Interest expense | (7.4 | ) | (7.4 | ) | |||||||||||||||||||||
Net realized and unrealized foreign exchange (losses)/gains (2) | (11.0 | ) | 3.1 | ||||||||||||||||||||||
Income before tax | $ | 133.1 | $ | 124.2 | |||||||||||||||||||||
Income tax expense | (5.1 | ) | (3.8 | ) | |||||||||||||||||||||
Net income | $ | 128.0 | $ | 120.4 | |||||||||||||||||||||
Ratios | |||||||||||||||||||||||||
Loss ratio | 42.3 | % | 58.3 | % | 51.6 | % | 41.4 | % | 59.3 | % | 50.9 | % | |||||||||||||
Policy acquisition expense ratio | 21.4 | % | 19.1 | % | 20.1 | % | 18.9 | % | 20.5 | % | 19.8 | % | |||||||||||||
General and administrative expense ratio (3) | 13.0 | % | 16.1 | % | 17.2 | % | 12.3 | % | 15.3 | % | 16.9 | % | |||||||||||||
General and administrative expense ratio (excluding non-recurring corporate expenses)(3) | 13.0 | % | 16.1 | % | 17.2 | % | 12.3 | % | 15.3 | % | 16.3 | % | |||||||||||||
Expense ratio | 34.4 | % | 35.2 | % | 37.3 | % | 31.2 | % | 35.8 | % | 36.7 | % | |||||||||||||
Expense ratio (excluding non-recurring corporate expenses) | 34.4 | % | 35.2 | % | 37.3 | % | 31.2 | % | 35.8 | % | 36.1 | % | |||||||||||||
Combined ratio | 76.7 | % | 93.5 | % | 88.9 | % | 72.6 | % | 95.1 | % | 87.6 | % | |||||||||||||
Combined ratio (excluding non-recurring corporate expenses) | 76.7 | % | 93.5 | % | 88.9 | % | 72.6 | % | 95.1 | % | 87.0 | % | |||||||||||||
(1) Includes the net realized and unrealized gains/(losses) from interest rate swaps. | |||||||||||||||||||||||||
(2) Includes the net realized and unrealized gains/(losses) from foreign exchange contracts. | |||||||||||||||||||||||||
(3) The total group general and administrative expense ratio includes the impact from corporate expenses. | |||||||||||||||||||||||||
8
| ASPEN INSURANCE HOLDINGS LIMITED | |||||||||||||||||||||
Reinsurance Segment - Quarterly Results | ||||||||||||||||||||||
(in US$ millions except for percentages) | Q1 2015 | Q4 2014 | Q3 2014 | Q2 2014 | Q1 2014 | |||||||||||||||||
Gross written premiums | $ | 484.8 | $ | 145.3 | $ | 256.9 | $ | 298.4 | $ | 472.2 | ||||||||||||
Net written premiums | 442.1 | 143.6 | 250.9 | 286.9 | 442.6 | |||||||||||||||||
Gross earned premiums | 265.8 | 278.4 | 291.0 | 289.7 | 278.5 | |||||||||||||||||
Net earned premiums | 249.4 | 263.1 | 279.6 | 278.8 | 266.7 | |||||||||||||||||
Net losses and loss adjustment expenses | 105.5 | 130.4 | 132.0 | 125.0 | 110.4 | |||||||||||||||||
Amortization of deferred policy acquisition costs | 53.4 | 47.7 | 52.1 | 49.8 | 50.4 | |||||||||||||||||
General and administrative expenses | 32.4 | 39.4 | 38.4 | 35.8 | 32.8 | |||||||||||||||||
Underwriting income | $ | 58.1 | $ | 45.6 | $ | 57.1 | $ | 68.2 | $ | 73.1 | ||||||||||||
Ratios | ||||||||||||||||||||||
Loss ratio | 42.3 | % | 49.6 | % | 47.2 | % | 44.8 | % | 41.4 | % | ||||||||||||
Policy acquisition expense ratio | 21.4 | % | 18.1 | % | 18.6 | % | 17.9 | % | 18.9 | % | ||||||||||||
General and administrative expense ratio | 13.0 | % | 15.0 | % | 13.7 | % | 12.8 | % | 12.3 | % | ||||||||||||
Expense ratio | 34.4 | % | 33.1 | % | 32.3 | % | 30.7 | % | 31.2 | % | ||||||||||||
Combined ratio | 76.7 | % | 82.7 | % | 79.5 | % | 75.5 | % | 72.6 | % | ||||||||||||
9
| ASPEN INSURANCE HOLDINGS LIMITED | ||||||||||||||||||||||
Insurance Segment - Quarterly Results | |||||||||||||||||||||||
(in US$ millions except for percentages) | Q1 2015 | Q4 2014 | Q3 2014 | Q2 2014 | Q1 2014 | ||||||||||||||||||
Gross written premiums | $ | 434.4 | $ | 470.1 | $ | 395.6 | $ | 480.9 | $ | 383.3 | |||||||||||||
Net written premiums | 321.1 | 410.4 | 326.4 | 399.5 | 254.9 | ||||||||||||||||||
Gross earned premiums | 415.1 | 417.0 | 403.9 | 404.5 | 373.6 | ||||||||||||||||||
Net earned premiums | 344.2 | 349.1 | 330.8 | 337.4 | 299.8 | ||||||||||||||||||
Net losses and loss adjustment expenses | 200.6 | 209.2 | 210.7 | 212.1 | 177.7 | ||||||||||||||||||
Amortization of deferred policy acquisition costs | 65.9 | 67.1 | 63.4 | 59.1 | 61.6 | ||||||||||||||||||
General and administrative expenses | 55.3 | 62.9 | 45.6 | 51.1 | 45.9 | ||||||||||||||||||
Underwriting income | $ | 22.4 | $ | 9.9 | $ | 11.1 | $ | 15.1 | $ | 14.6 | |||||||||||||
Ratios | |||||||||||||||||||||||
Loss ratio | 58.3 | % | 59.9 | % | 63.7 | % | 62.9 | % | 59.3 | % | |||||||||||||
Policy acquisition expense ratio | 19.1 | % | 19.2 | % | 19.2 | % | 17.5 | % | 20.5 | % | |||||||||||||
General and administrative expense ratio | 16.1 | % | 18.0 | % | 13.8 | % | 15.1 | % | 15.3 | % | |||||||||||||
Expense ratio | 35.2 | % | 37.2 | % | 33.0 | % | 32.6 | % | 35.8 | % | |||||||||||||
Combined ratio | 93.5 | % | 97.1 | % | 96.7 | % | 95.5 | % | 95.1 | % | |||||||||||||
10
| ASPEN INSURANCE HOLDINGS LIMITED | |||||||||||||||||||||
Written and Earned Premiums by Segment and Lines of Business | ||||||||||||||||||||||
(in US$ millions) | ||||||||||||||||||||||
Gross Written Premiums | Q1 2015 | Q4 2014 | Q3 2014 | Q2 2014 | Q1 2014 | |||||||||||||||||
Reinsurance | ||||||||||||||||||||||
Property Catastrophe Reinsurance | $ | 153.8 | $ | 1.1 | $ | 40.0 | $ | 91.6 | $ | 168.8 | ||||||||||||
Other Property Reinsurance | 109.9 | 55.4 | 95.4 | 89.8 | 102.4 | |||||||||||||||||
Casualty Reinsurance | 114.7 | 37.3 | 70.7 | 60.6 | 113.3 | |||||||||||||||||
Specialty Reinsurance | 106.4 | 51.5 | 50.8 | 56.4 | 87.7 | |||||||||||||||||
Total Reinsurance | $ | 484.8 | $ | 145.3 | $ | 256.9 | $ | 298.4 | $ | 472.2 | ||||||||||||
Insurance | ||||||||||||||||||||||
Property and Casualty Insurance | $ | 213.4 | $ | 202.5 | $ | 200.9 | $ | 221.3 | $ | 176.3 | ||||||||||||
Marine, Aviation and Energy Insurance | 131.7 | 145.8 | 88.2 | 153.6 | 131.7 | |||||||||||||||||
Financial and Professional Lines Insurance | 89.3 | 121.8 | 106.5 | 106.0 | 75.3 | |||||||||||||||||
Total Insurance | $ | 434.4 | $ | 470.1 | $ | 395.6 | $ | 480.9 | $ | 383.3 | ||||||||||||
Total Gross Written Premiums | $ | 919.2 | $ | 615.4 | $ | 652.5 | $ | 779.3 | $ | 855.5 | ||||||||||||
Net Written Premiums | ||||||||||||||||||||||
Reinsurance | ||||||||||||||||||||||
Property Catastrophe Reinsurance | $ | 126.1 | $ | (0.1 | ) | $ | 37.4 | $ | 80.9 | $ | 147.9 | |||||||||||
Other Property Reinsurance | 98.8 | 54.9 | 92.0 | 88.3 | 96.6 | |||||||||||||||||
Casualty Reinsurance | 113.8 | 37.4 | 70.7 | 61.5 | 111.4 | |||||||||||||||||
Specialty Reinsurance | 103.4 | 51.4 | 50.8 | 56.2 | 86.7 | |||||||||||||||||
Total Reinsurance | $ | 442.1 | $ | 143.6 | $ | 250.9 | $ | 286.9 | $ | 442.6 | ||||||||||||
Insurance | ||||||||||||||||||||||
Property and Casualty Insurance | $ | 156.7 | $ | 159.3 | $ | 166.4 | $ | 171.0 | $ | 101.5 | ||||||||||||
Marine, Aviation and Energy Insurance | 120.5 | 137.6 | 64.2 | 131.1 | 119.5 | |||||||||||||||||
Financial and Professional Lines Insurance | 43.9 | 113.5 | 95.8 | 97.4 | 33.9 | |||||||||||||||||
Total Insurance | $ | 321.1 | $ | 410.4 | $ | 326.4 | $ | 399.5 | $ | 254.9 | ||||||||||||
Total Net Written Premiums | $ | 763.2 | $ | 554.0 | $ | 577.3 | $ | 686.4 | $ | 697.5 | ||||||||||||
Net Earned Premiums | ||||||||||||||||||||||
Reinsurance | ||||||||||||||||||||||
Property Catastrophe Reinsurance | $ | 57.1 | $ | 60.0 | $ | 62.5 | $ | 62.7 | $ | 62.4 | ||||||||||||
Other Property Reinsurance | 77.5 | 68.0 | 84.1 | 81.5 | 79.2 | |||||||||||||||||
Casualty Reinsurance | 57.8 | 75.4 | 75.0 | 78.8 | 72.2 | |||||||||||||||||
Specialty Reinsurance | 57.0 | 59.7 | 58.0 | 55.8 | 52.9 | |||||||||||||||||
Total Reinsurance | $ | 249.4 | $ | 263.1 | $ | 279.6 | $ | 278.8 | $ | 266.7 | ||||||||||||
Insurance | ||||||||||||||||||||||
Property and Casualty Insurance | $ | 159.8 | $ | 141.9 | $ | 148.0 | $ | 146.9 | $ | 119.5 | ||||||||||||
Marine, Aviation and Energy Insurance | 99.4 | 111.4 | 107.2 | 119.9 | 115.1 | |||||||||||||||||
Financial and Professional Lines Insurance | 85.0 | 95.8 | 75.6 | 70.6 | 65.2 | |||||||||||||||||
Total Insurance | $ | 344.2 | $ | 349.1 | $ | 330.8 | $ | 337.4 | $ | 299.8 | ||||||||||||
Total Net Earned Premiums | $ | 593.6 | $ | 612.2 | $ | 610.4 | $ | 616.2 | $ | 566.5 | ||||||||||||
11
| ASPEN INSURANCE HOLDINGS LIMITED | |||||||||
Consolidated Statements of Changes in Shareholders' Equity | ||||||||||
Three Months Ended March 31, | ||||||||||
(in US$ millions) | 2015 | 2014 | ||||||||
Ordinary shares | ||||||||||
Beginning and end of period | $ | 0.1 | $ | 0.1 | ||||||
Preference shares | ||||||||||
Beginning and end of period | — | — | ||||||||
Non-controlling interest | ||||||||||
Beginning of period | 0.5 | (0.3 | ) | |||||||
Net change for the period | — | 0.1 | ||||||||
End of period | 0.5 | (0.2 | ) | |||||||
Additional paid-in capital | ||||||||||
Beginning of period | 1,134.3 | 1,297.4 | ||||||||
New shares issued | 3.5 | 0.8 | ||||||||
Ordinary shares repurchased | (36.5 | ) | (30.9 | ) | ||||||
Share-based compensation | 4.7 | 2.6 | ||||||||
End of period | 1,106.0 | 1,269.9 | ||||||||
Retained earnings | ||||||||||
Beginning of period | 2,050.1 | 1,783.3 | ||||||||
Net income for the period | 128.0 | 120.4 | ||||||||
Dividends paid on ordinary and preference shares | (21.9 | ) | (21.2 | ) | ||||||
Proportion due to non-controlling interest | — | (0.1 | ) | |||||||
End of period | 2,156.2 | 1,882.4 | ||||||||
Accumulated other comprehensive income: | ||||||||||
Cumulative foreign currency translation adjustments, net of taxes: | ||||||||||
Beginning of period | 72.7 | 88.6 | ||||||||
Change for the period | (26.1 | ) | (4.8 | ) | ||||||
End of period | 46.6 | 83.8 | ||||||||
Loss on derivatives: | ||||||||||
Beginning of period | (3.8 | ) | — | |||||||
Net change from current period hedged transactions | (2.4 | ) | — | |||||||
End of period | (6.2 | ) | — | |||||||
Unrealized appreciation/(depreciation) on investments, net of taxes: | ||||||||||
Beginning of period | 165.4 | 130.5 | ||||||||
Change for the period | (2.8 | ) | 20.3 | |||||||
End of period | 162.6 | 150.8 | ||||||||
Total accumulated other comprehensive income | 203.0 | 234.6 | ||||||||
Total shareholders' equity | $ | 3,465.8 | $ | 3,386.8 | ||||||
12
| ASPEN INSURANCE HOLDINGS LIMITED | |||||||||
Consolidated Statements of Comprehensive Income | ||||||||||
Three Months Ended March 31, | ||||||||||
(in US$ millions) | 2015 | 2014 | ||||||||
Net income adjusted for non-controlling interest | $ | 128.0 | $ | 120.3 | ||||||
Other comprehensive income, net of taxes: | ||||||||||
Available for sale investments: | ||||||||||
Reclassification adjustment for net realized (gains) included in net income | (32.3 | ) | (0.2 | ) | ||||||
Change in net unrealized gains on available for sale securities held | 29.5 | 20.5 | ||||||||
Net change from current period hedged transactions | (2.4 | ) | — | |||||||
Change in foreign currency translation adjustment | (26.1 | ) | (4.8 | ) | ||||||
Other comprehensive (loss)/income | (31.3 | ) | 15.5 | |||||||
Comprehensive income | $ | 96.7 | $ | 135.8 | ||||||
13
| ASPEN INSURANCE HOLDINGS LIMITED | |||||||||
Condensed Consolidated Statements of Cash Flows | ||||||||||
Three Months Ended March 31, | ||||||||||
(in US$ millions) | 2015 | 2014 | ||||||||
Net cash from operating activities | $ | 66.2 | $ | 211.9 | ||||||
Net cash from/(used in) investing activities | 120.9 | (12.1 | ) | |||||||
Net cash (used in) financing activities | (119.8 | ) | (51.3 | ) | ||||||
Effect of exchange rate movements on cash and cash equivalents | (19.9 | ) | 1.6 | |||||||
Increase in cash and cash equivalents | 47.4 | 150.1 | ||||||||
Cash at beginning of period | 1,178.5 | 1,293.6 | ||||||||
Cash at end of period | $ | 1,225.9 | $ | 1,443.7 | ||||||
14
| ASPEN INSURANCE HOLDINGS LIMITED | ||||||||
Reserves for Losses and Loss Adjustment Expenses | |||||||||
(in US$ millions) | For the Three Months Ended March 31, 2015 | For the Twelve Months Ended December 31, 2014 | |||||||
Provision for losses and loss adjustment expenses at the start of the period | $ | 4,750.8 | $ | 4,678.9 | |||||
Reinsurance recoverables | (350.0 | ) | (332.7 | ) | |||||
Net loss and loss adjustment expenses at the start of the period | 4,400.8 | 4,346.2 | |||||||
Net loss and loss adjustment expenses disposed | — | (24.2 | ) | ||||||
Provision for losses and loss adjustment expenses for claims incurred | |||||||||
Current period | 333.6 | 1,411.6 | |||||||
Prior period release | (27.5 | ) | (104.1 | ) | |||||
Total incurred | 306.1 | 1,307.5 | |||||||
Losses and loss adjustment expenses payments for claims incurred | (271.7 | ) | (1,107.7 | ) | |||||
Foreign exchange (gains) | (96.4 | ) | (121.0 | ) | |||||
Net loss and loss adjustment expenses reserves at the end of the period | 4,338.8 | 4,400.8 | |||||||
Reinsurance recoverables on unpaid losses at the end of the period | 360.1 | 350.0 | |||||||
Gross loss and loss adjustment expenses reserves at the end of the period | $ | 4,698.9 | $ | 4,750.8 | |||||
15
| ASPEN INSURANCE HOLDINGS LIMITED | ||||||||||||||||||||||||
Reserves by Operating Segment | |||||||||||||||||||||||||
As at March 31, 2015 | As at December 31, 2014 | ||||||||||||||||||||||||
(in US$ millions) | Gross | Reinsurance Recoverables | Net | Gross | Reinsurance Recoverables | Net | |||||||||||||||||||
Reinsurance | $ | 2,447.3 | $ | (36.4 | ) | $ | 2,410.9 | $ | 2,531.1 | $ | (37.8 | ) | $ | 2,493.3 | |||||||||||
Insurance | 2,251.6 | (323.7 | ) | 1,927.9 | 2,219.7 | (312.2 | ) | 1,907.5 | |||||||||||||||||
Total losses and loss adjustment expense reserves | $ | 4,698.9 | $ | (360.1 | ) | $ | 4,338.8 | $ | 4,750.8 | $ | (350.0 | ) | $ | 4,400.8 | |||||||||||
16
| ASPEN INSURANCE HOLDINGS LIMITED | ||||||||||||||||||||||||
Prior Year Reserve Releases | |||||||||||||||||||||||||
(in US$ millions) | Three Months Ended March 31, 2015 | Three Months Ended March 31, 2014 | |||||||||||||||||||||||
Gross | Reinsurance Recoverables | Net | Gross | Reinsurance Recoverables | Net | ||||||||||||||||||||
Reinsurance | $ | 14.5 | $ | (1.3 | ) | $ | 13.2 | $ | 22.1 | $ | (0.9 | ) | $ | 21.2 | |||||||||||
Insurance | 21.2 | (6.9 | ) | 14.3 | 0.6 | 6.4 | 7.0 | ||||||||||||||||||
Release in reserves for prior years during the period | $ | 35.7 | $ | (8.2 | ) | $ | 27.5 | $ | 22.7 | $ | 5.5 | $ | 28.2 | ||||||||||||
17
| ASPEN INSURANCE HOLDINGS LIMITED | ||||||
Worldwide Natural Catastrophe Exposures: Major Peril Zones as at April 1, 2015 | |||||||
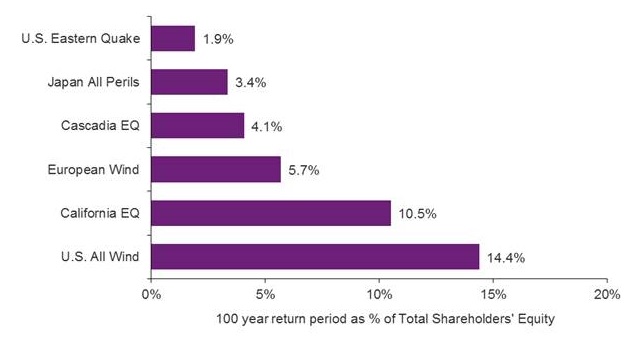 | 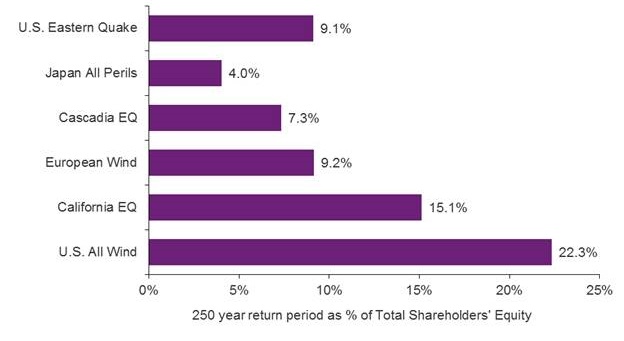 | ||||||
1 in 100 year tolerance: 17.5% of total shareholders' equity | 1 in 250 year tolerance: 25.0% of total shareholders' equity | ||||||
Based on Shareholders' equity of $3,465.3 million (excluding non-controlling interest) at March 31, 2015. The estimates reflect Aspen's own view of the modelled maximum losses (“PMLs”) at the return periods shown which include input from various third party vendor models, our own proprietary adjustments to these models, and planned reinsurance purchases. Catastrophe loss experience may materially differ from the modelled PMLs due to limitations in one or more of the models or uncertainties in the application of policy terms and limits. | |||||||
18
| ASPEN INSURANCE HOLDINGS LIMITED | |||||||||||||||||||||
Consolidated Investment Portfolio | ||||||||||||||||||||||
(in US$ millions) | Fair Market Value | |||||||||||||||||||||
March 31, 2015 | December 31, 2014 | September 30, 2014 | June 30, 2014 | March 31, 2014 | ||||||||||||||||||
Marketable Securities - Available For Sale | ||||||||||||||||||||||
U.S. government securities | $ | 1,041.8 | $ | 1,094.4 | $ | 973.9 | $ | 994.0 | $ | 1,014.7 | ||||||||||||
U.S. agency securities | 182.9 | 197.4 | 201.9 | 205.0 | 245.2 | |||||||||||||||||
Municipal securities | 30.7 | 31.5 | 31.7 | 26.9 | 33.6 | |||||||||||||||||
Corporate securities | 2,333.6 | 2,319.4 | 2,278.4 | 2,244.9 | 2,154.1 | |||||||||||||||||
Foreign government securities | 637.7 | 665.7 | 752.6 | 766.5 | 735.0 | |||||||||||||||||
Asset-backed securities | 140.9 | 143.5 | 143.9 | 140.3 | 130.0 | |||||||||||||||||
Bonds backed by foreign government | 68.2 | 78.0 | 75.5 | 83.9 | 91.5 | |||||||||||||||||
Mortgage-backed securities | 1,104.0 | 1,100.1 | 1,039.9 | 1,065.3 | 1,117.6 | |||||||||||||||||
Total fixed income securities | 5,539.8 | 5,630.0 | 5,497.8 | 5,526.8 | 5,521.7 | |||||||||||||||||
Short-term investments | 180.2 | 258.3 | 307.2 | 335.7 | 215.5 | |||||||||||||||||
Equity securities | — | 109.9 | 125.9 | 142.1 | 147.4 | |||||||||||||||||
Total Available For Sale | $ | 5,720.0 | $ | 5,998.2 | $ | 5,930.9 | $ | 6,004.6 | $ | 5,884.6 | ||||||||||||
Marketable Securities - Trading | ||||||||||||||||||||||
U.S. government securities | $ | 9.0 | $ | — | $ | 16.5 | $ | 12.9 | $ | 16.8 | ||||||||||||
U.S. agency securities | 0.2 | 0.2 | 0.2 | 0.2 | 0.2 | |||||||||||||||||
Municipal securities | 0.5 | 1.1 | 1.1 | 1.2 | 1.2 | |||||||||||||||||
Corporate securities | 554.1 | 529.8 | 521.1 | 524.5 | 494.8 | |||||||||||||||||
Foreign government securities | 133.7 | 140.1 | 139.2 | 139.3 | 136.4 | |||||||||||||||||
Asset-backed securities | 16.0 | 14.7 | 15.2 | 11.4 | 12.3 | |||||||||||||||||
Bank loans | 85.9 | 85.1 | 80.8 | 81.4 | 72.7 | |||||||||||||||||
Total fixed income securities | 799.4 | 771.0 | 774.1 | 770.9 | 734.4 | |||||||||||||||||
Short-term investments | 0.7 | 0.2 | 7.0 | 14.0 | — | |||||||||||||||||
Equity securities | 719.0 | 616.0 | 521.1 | 432.1 | 360.4 | |||||||||||||||||
Catastrophe bonds | 32.8 | 34.8 | 32.2 | 30.0 | 18.0 | |||||||||||||||||
Total Trading | $ | 1,551.9 | $ | 1,422.0 | $ | 1,334.4 | $ | 1,247.0 | $ | 1,112.8 | ||||||||||||
Other Investments | $ | 9.5 | $ | 8.7 | $ | 8.7 | $ | 8.7 | $ | 8.7 | ||||||||||||
Cash | 1,225.9 | 1,178.5 | 1,289.1 | 1,345.2 | 1,443.7 | |||||||||||||||||
Accrued interest | 43.9 | 47.2 | 45.7 | 49.7 | 46.5 | |||||||||||||||||
Total Cash and Accrued Interest | $ | 1,269.8 | $ | 1,225.7 | $ | 1,334.8 | $ | 1,394.9 | $ | 1,490.2 | ||||||||||||
Total Cash and Investments | $ | 8,551.2 | $ | 8,654.6 | $ | 8,608.8 | $ | 8,655.2 | $ | 8,496.3 | ||||||||||||
19
| ASPEN INSURANCE HOLDINGS LIMITED | |||||||||||||||||||
Investment Analysis | ||||||||||||||||||||
(in US$ millions except for percentages) | Q1 2015 | Q4 2014 | Q3 2014 | Q2 2014 | Q1 2014 | |||||||||||||||
Net investment income from fixed income investments and cash | $ | 41.2 | $ | 43.6 | $ | 43.5 | $ | 42.0 | $ | 44.1 | ||||||||||
Net investment income from equity securities | 6.2 | 3.1 | 4.5 | 4.1 | 5.4 | |||||||||||||||
Net investment income | 47.4 | 46.7 | 48.0 | 46.1 | 49.5 | |||||||||||||||
Net realized and unrealized investment gains/(losses) excluding the interest rate swaps (1) | 42.9 | 3.5 | (17.5 | ) | 31.3 | 10.7 | ||||||||||||||
Net realized investment (losses)/gains from the interest rate swaps | (3.2 | ) | (2.7 | ) | 0.9 | (3.5 | ) | (1.9 | ) | |||||||||||
Other-than-temporary impairment charges | — | (1.7 | ) | — | (0.7 | ) | — | |||||||||||||
Net realized and unrealized investment gains/(losses) (1) | 39.7 | (0.9 | ) | (16.6 | ) | 27.1 | 8.8 | |||||||||||||
Change in unrealized gains/(losses) on available for sale investments (gross of tax) (1) | — | 21.2 | (39.6 | ) | 33.8 | 22.6 | ||||||||||||||
Total return/(loss) on investments (1) | $ | 87.1 | $ | 67.0 | $ | (8.2 | ) | $ | 107.0 | $ | 80.9 | |||||||||
Portfolio Characteristics | ||||||||||||||||||||
Fixed income portfolio book yield (excluding the impact of the interest rate swaps) | 2.56 | % | 2.65 | % | 2.65 | % | 2.61 | % | 2.68 | % | ||||||||||
Fixed income portfolio duration (excluding the impact of the interest rate swaps) | 3.5 years | 3.5 years | 3.5 years | 3.4 years | 3.5 years | |||||||||||||||
(1) Adjusted for a representation of foreign exchange in relation to investment securities from realized and unrealized exchange gains/(losses) to realized and unrealized investment gains/(losses). | ||||||||||||||||||||
20
| ASPEN INSURANCE HOLDINGS LIMITED | |||||||||||||||||||||
Book Value Per Ordinary Share | ||||||||||||||||||||||
(in US$ millions except for number of shares and per share amounts) | March 31, 2015 | December 31, 2014 | September 30, 2014 | June 30, 2014 | March 31, 2014 | |||||||||||||||||
Net assets | $ | 3,465.8 | $ | 3,419.3 | $ | 3,444.5 | $ | 3,554.2 | $ | 3,386.8 | ||||||||||||
Less: Preference shares | (555.8 | ) | (555.8 | ) | (555.8 | ) | (555.8 | ) | (555.8 | ) | ||||||||||||
Less: Non-controlling interest | (0.5 | ) | (0.5 | ) | 0.3 | 0.2 | 0.2 | |||||||||||||||
Total | $ | 2,909.5 | $ | 2,863.0 | $ | 2,889.0 | $ | 2,998.6 | $ | 2,831.2 | ||||||||||||
Ordinary shares outstanding (in millions) | 61.723 | 62.017 | 63.350 | 65.463 | 65.419 | |||||||||||||||||
Ordinary shares and dilutive potential ordinary shares (in millions) | 63.227 | 63.445 | 64.783 | 66.871 | 66.281 | |||||||||||||||||
Book value per ordinary share | $ | 47.14 | $ | 46.16 | $ | 45.60 | $ | 45.81 | $ | 43.28 | ||||||||||||
Diluted book value per ordinary share | $ | 46.02 | $ | 45.13 | $ | 44.60 | $ | 44.84 | $ | 42.72 | ||||||||||||
The dilutive effect of options has been calculated using the treasury stock method. The treasury stock method assumes that the proceeds received from the exercise of options will be used to purchase the Company's ordinary shares at the average market price during the period of calculation. | ||||||||||||||||||||||
21
| ASPEN INSURANCE HOLDINGS LIMITED | ||||||||||
Operating Income Reconciliation | |||||||||||
Net income is adjusted to exclude after-tax change in net foreign exchange gains and losses, realized gains and losses in investments and non-recurring items. | |||||||||||
Three Months Ended | |||||||||||
(in US$ millions except where stated) | March 31, 2015 | March 31, 2014 | |||||||||
Net income as reported | $ | 128.0 | $ | 120.4 | |||||||
Net change attributable to non-controlling interest | — | (0.1 | ) | ||||||||
Preference share dividends | (9.5 | ) | (9.5 | ) | |||||||
Net income available to ordinary shareholders | 118.5 | 110.8 | |||||||||
Add (deduct) after tax income: | |||||||||||
Net foreign exchange losses | 9.8 | (2.6 | ) | ||||||||
Net realized (gains) on investments | (39.8 | ) | (8.1 | ) | |||||||
Non-recurring corporate expenses | — | 3.0 | |||||||||
Operating income after tax available to ordinary shareholders | 88.5 | 103.1 | |||||||||
Tax expense on operating income | 6.4 | 3.1 | |||||||||
Operating income before tax available to ordinary shareholders | $ | 94.9 | $ | 106.2 | |||||||
Basic earnings per ordinary share | |||||||||||
Net income adjusted for preference share dividends and non-controlling interest | $ | 1.91 | $ | 1.70 | |||||||
Add (deduct) after tax income: | |||||||||||
Net foreign exchange losses | 0.16 | (0.04 | ) | ||||||||
Net realized (gains) on investments | (0.64 | ) | (0.12 | ) | |||||||
Non-recurring corporate expenses | — | 0.05 | |||||||||
Operating income adjusted for preference shares dividends and non-controlling interest | $ | 1.43 | $ | 1.59 | |||||||
Diluted earnings per ordinary share | |||||||||||
Net income adjusted for preference share dividends and non-controlling interest | $ | 1.87 | $ | 1.66 | |||||||
Add (deduct) after tax income: | |||||||||||
Net foreign exchange losses | 0.15 | (0.04 | ) | ||||||||
Net realized (gains) on investments | (0.63 | ) | (0.12 | ) | |||||||
Non-recurring corporate expenses | — | 0.05 | |||||||||
Operating income adjusted for preference shares dividends and non-controlling interest | $ | 1.39 | $ | 1.55 | |||||||
22