Attached files
| file | filename |
|---|---|
| 8-K - FORM 8-K - InfuSystem Holdings, Inc | d912485d8k.htm |
Exhibit 99.1
InfuSystem Holdings, Inc. Shareholder Presentation As of April 15, 2015 Eric Steen – CEO Jonathan Foster – CFO
Safe Harbor Statement Certain statements contained in this presentation are forward?looking statements and are based on future expectations, plans and prospects for the business and operations of InfuSystem Holdings, Inc. (“InfuSystem” or “the Company”) that involve a number of risks and uncertainties. In connection with the “safe harbor” provisions of the Private Securities Litigation Reform Act of 1995, the Company is identifying certain factors that could cause actual results to materially differ from those indicated by these forward?looking statements. Those factors, risks and uncertainties include, but are not limited to: potential changes in overall healthcare reimbursement, including CMS competitive bidding; sequestration; concentration of customers; increased focus on early detection of cancer; competitive treatments; dependency on Medicare Supplier Number; availability of chemotherapy drugs; global financial conditions; changes and enforcement of state and federal laws; dependency on suppliers; risks associated with acquisitions and joint ventures, including integration risks; US Healthcare Reform; relationships with healthcare professionals and organizations; technological changes related to infusion therapy; dependency on websites and intellectual property; dependency on key personnel; dependency on banking relationships; risks associated with our common stock, as well as any litigation to which the Company may be subject from time to time; and other risk factors as discussed in the Company’s annual report on Form 10?K for the year ended December 31, 2014 and in subsequent filings made by the Company from time to time with the Securities and Exchange Commission (the “SEC”), which can be obtained via the SEC’s Edgar website or by contacting the Company or the SEC. Forward?looking statements in this presentation are made as of April 15, 2015, and, unless required by law, the Company disclaims any duty to supplement, update or revise such statements, whether as a result of subsequent developments, changed expectations or otherwise. The Company regularly posts important information to the investors section of its website.
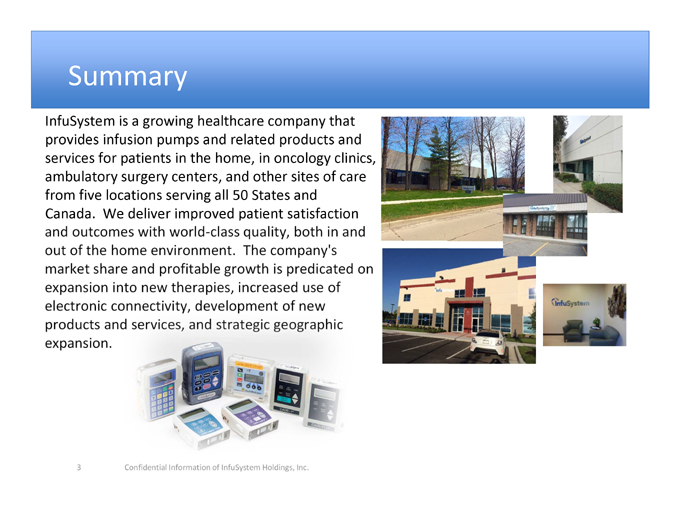
Summary InfuSystem is a growing healthcare company that provides infusion pumps and related products and services for patients in the home, in oncology clinics, ambulatory surgery centers, and other sites of care from five locations serving all 50 States and Canada. We deliver improved patient satisfaction And outcomes with world-class quality, both in and out of the home environment. The company’s market share and profitable growth is predicated on expansion into new therapies, increased use of electronic connectivity, development of new products and services, and strategic geographic expansion. 3 confidential information of infosystem Holding, inc.
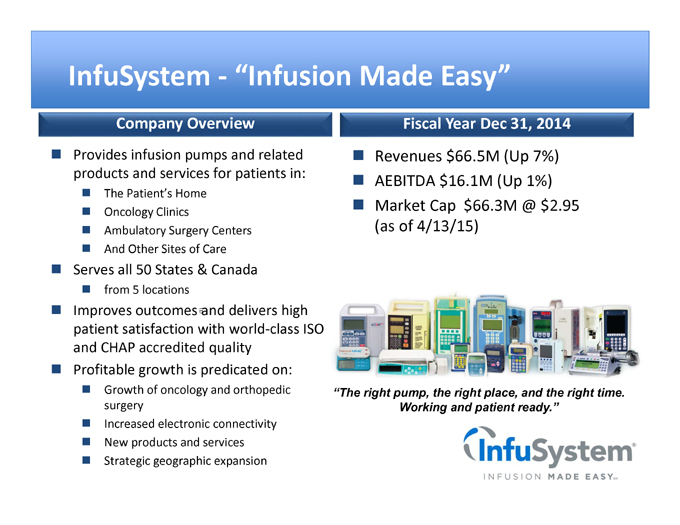
InfuSystem ?“Infusion Made Easy” Company Overview Fiscal Year Dec 31, 2014 Provides infusion pumps and related Revenues $66.5M (Up 7%) products and services for patients in: AEBITDA $16.1M (Up 1%) The Patient’s Home Market Cap $66.3M @ $2.95 Oncology Clinics Ambulatory Surgery Centers (as of 4/13/15) And Other Sites of Care Serves all 50 States & Canada from 5 locations Improves outcomes (1) and delivers high patient satisfaction with world?class ISO and CHAP accredited quality Profitable growth is predicated on: Growth of oncology and orthopedic “The right pump, the right place, and the right time. surgery Working and patient ready.” Increased electronic connectivity New products and services Strategic geographic expansion
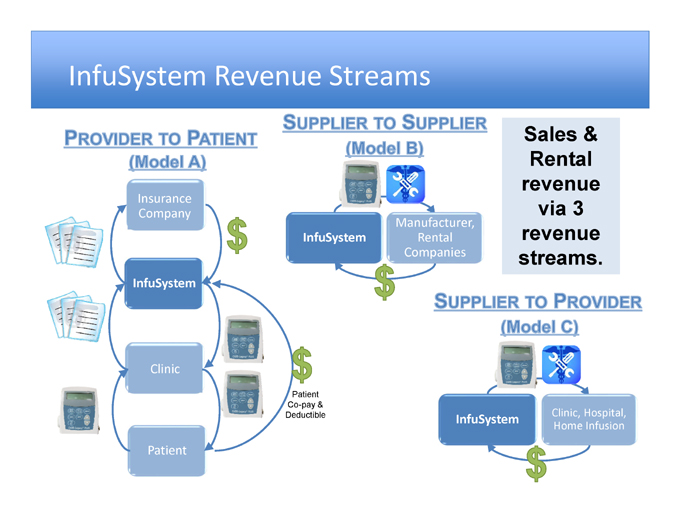
InfuSystem Revenue Streams Sales & Rental revenue Insurance via 3 Company acturer, revenue InfuSystem Rental Companies streams. InfuSystem Clinic Patient Co-pay & Clinic, Hospital, Deductible InfuSystem Home Infusion Patient
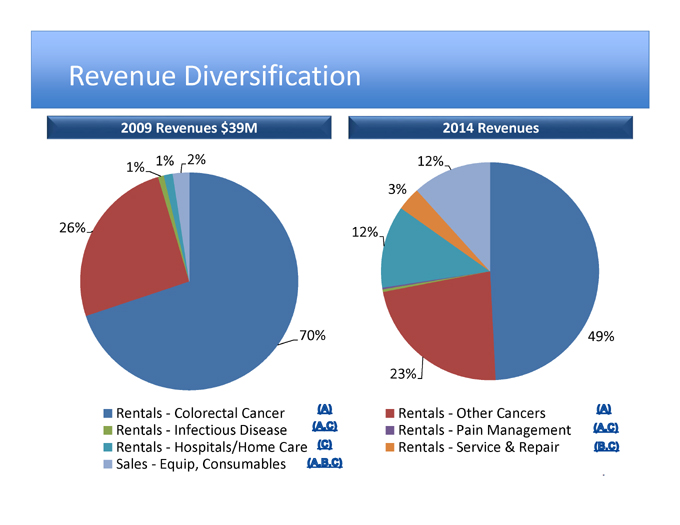
Revenue Diversification 2009 Revenues $39M 2014 Revenues 1% 2% 12% 1% 3% 26% 12% 70% 49% 23% Rentals ? Colorectal Cancer Rentals ? Other Cancers Rentals ? Infectious Disease Rentals ? Pain Management Rentals ? Hospitals/Home Care Rentals ? Service & Repair Sales ? Equip, Consumables
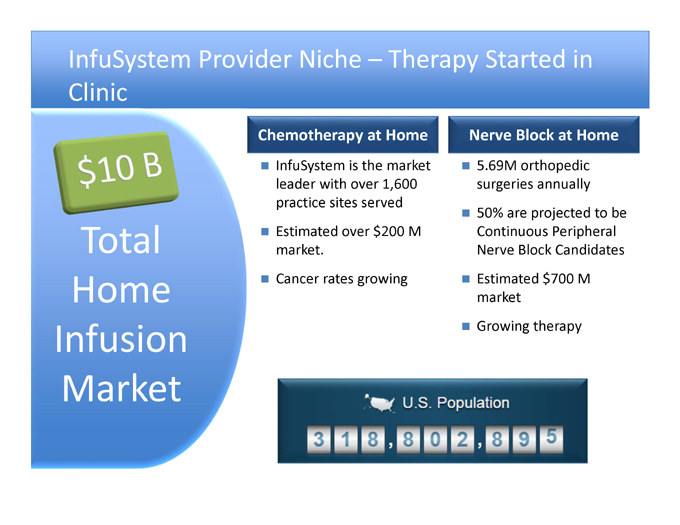
InfuSystem Provider Niche – Therapy Started in Clinic Chemotherapy at Home Nerve Block at Home InfuSystem is the market 5.69M orthopedic leader with over 1,600 surgeries annually practice sites served 50% are projected to be Total Estimated over $200 M Continuous Peripheral market. Nerve Block Candidates Cancer rates growing Estimated $700 M Home market Infusion Growing therapy Market
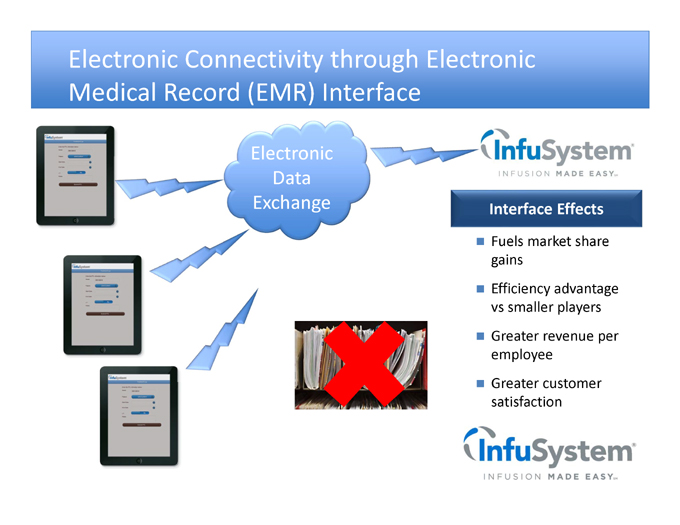
Electronic Connectivity through Electronic Medical Record (EMR) Interface Electronic Data Exchange Interface Effects Fuels market share gains Efficiency advantage vs smaller players Greater revenue per employee Greater customer satisfaction
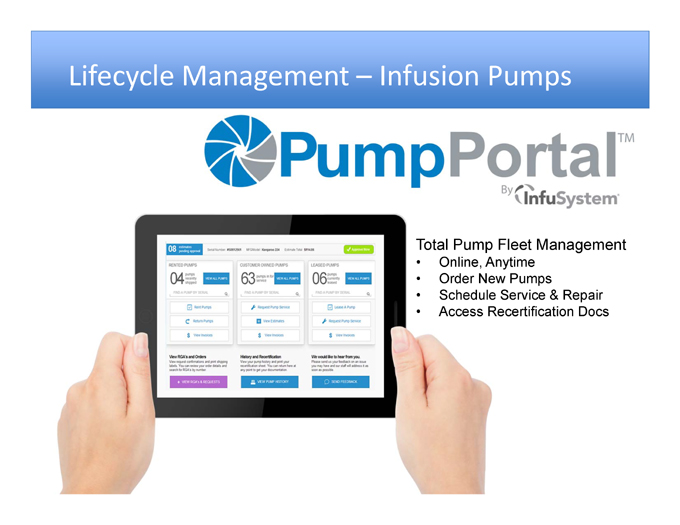
Lifecycle Management – Infusion Pumps Total Pump Fleet Management • Online, Anytime • Order New Pumps • Schedule Service & Repair • Access Recertification Docs
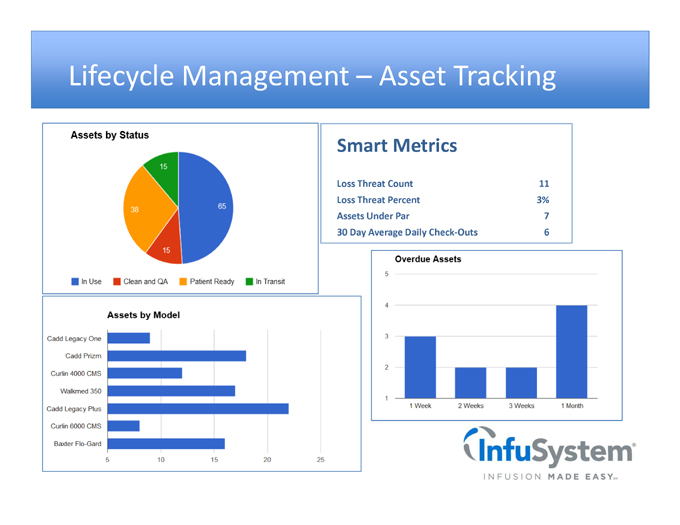
Lifecycle Management – Asset Tracking Smart Metrics Loss Threat Count 11 Loss Threat Percent 3% Assets Under Par 7 30 Day Average Daily Check?Outs 6

High Patient Satisfaction Scores
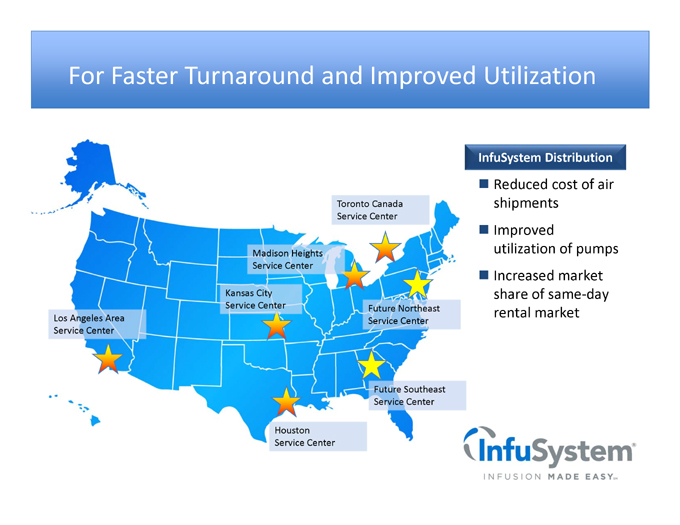
For Faster Turnaround and Improved Utilization InfuSystem Distribution Reduced cost of air Toronto Canada shipments Service Center Improved Madison Heights utilization of pumps Service Center Increased market Kansas City share of same?day Service Center Future Northeast rental market Los Angeles Area Service Center Service Center Future Southeast Service Center Houston Service Center
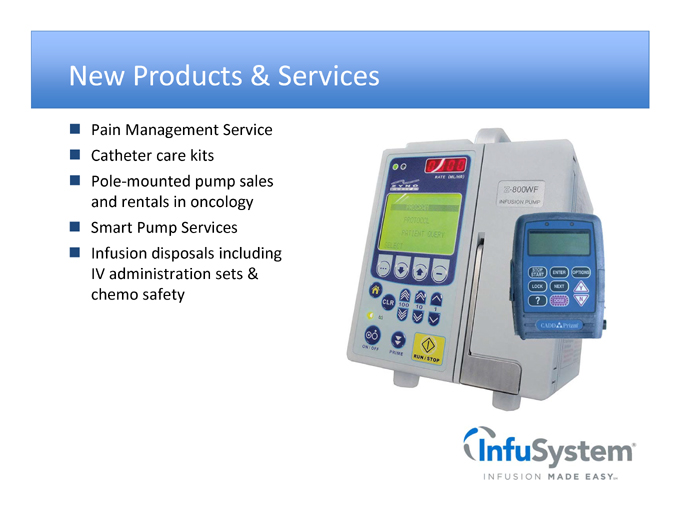
New Products & Services Pain Management Service Catheter care kits Pole?mounted pump sales and rentals in oncology Smart Pump Services Infusion disposals including IV administration sets & chemo safety
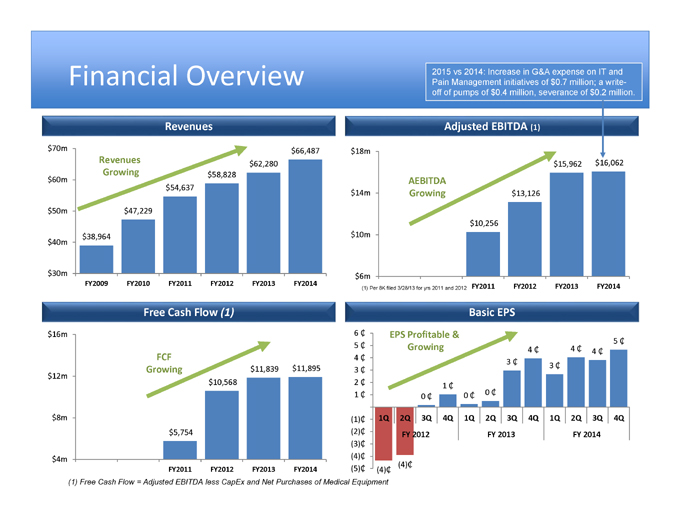
2015 vs 2014: Increase in G&A expense on IT and Financial Overview Pain Management initiatives of $0.7 million; a write-off of pumps of $0.4 million, severance of $0.2 million. Revenues Adjusted EBITDA (1) $70m $66,487 $18m Revenues $16,062 $62,280 $15,962 Growing $58,828 $60m AEBITDA $54,637 $14m Growing $13,126 $50m $47,229 $10,256 $38,964 $10m $40m $30m $6m FY2009 FY2010 FY2011 FY2012 FY2013 FY2014 FY2011 FY2012 FY2013 FY2014 (1) Per 8K filed 3/28/13 for yrs 2011 and 2012 Free Cash Flow (1) Basic EPS $16m 6 ? EPS Profitable & 5 ? 5 ? Growing 4 ? 4 ? 4 ? FCF 4 ? 3 ? $11,895 3 ? Growing $11,839 3 ? $12m $10,568 2 ? 1 ? 0 ? 1 ? 0 ? 0 ? $8m (1)? 1Q 2Q 3Q 4Q 1Q 2Q 3Q 4Q 1Q 2Q 3Q 4Q $5,754 (2)? FY 2012 FY 2013 FY 2014 (3)? (4)? $4m (4)? FY2011 FY2012 FY2013 FY2014 (5)? (4)? (1) Free Cash Flow = Adjusted EBITDA less CapEx and Net Purchases of Medical Equipment
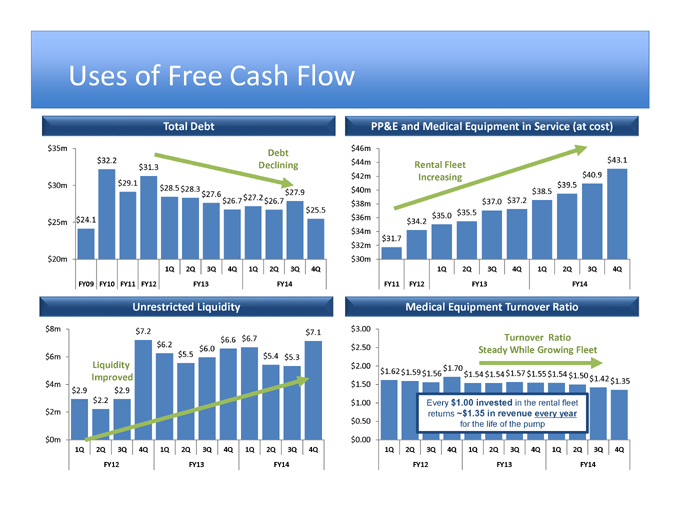
Uses of Free Cash Flow Total Debt PP&E and Medical Equipment in Service (at cost) $35m $46m Debt $43.1 $32.2 $44m $31.3 Declining Rental Fleet $42m Increasing $40.9 $30m $29.1 $39.5 $28.5 $28.3 $40m $27.6 $27.2 $27.9 $38.5 $26.7 $26.7 $37.0 $37.2 $25.5 $38m $35.0 $35.5 $24.1 $36m $25m $34.2 $34m $32m $31.7 $20m $30m 1Q 2Q 3Q 4Q 1Q 2Q 3Q 4Q 1Q 2Q 3Q 4Q 1Q 2Q 3Q 4Q FY09 FY10 FY11 FY12 FY13 FY14 FY11 FY12 FY13 FY14 Unrestricted Liquidity Medical Equipment Turnover Ratio $8m $7.2 $3.00 $7.1 $6.2 $6.6 $6.7 Turnover Ratio $6.0 $2.50 Steady While Growing Fleet $6m $5.5 $5.4 $5.3 Liquidity $2.00 $1.62 $1.70 $1.59 $1.56 $1.54 $1.54 $1.57 $1.55 $1.54 Improved $1.50 $1.42 $4m $1.50 $1.35 $2.9 $2.9 $2.2 $1.00 Every $1.00 invested in the rental fleet $2m returns ~$1.35 in revenue every year $0.50 for the life of the pump $0m $0.00 1Q 2Q 3Q 4Q 1Q 2Q 3Q 4Q 1Q 2Q 3Q 4Q 1Q 2Q 3Q 4Q 1Q 2Q 3Q 4Q 1Q 2Q 3Q 4Q FY12 FY13 FY14 FY12 FY13 FY14
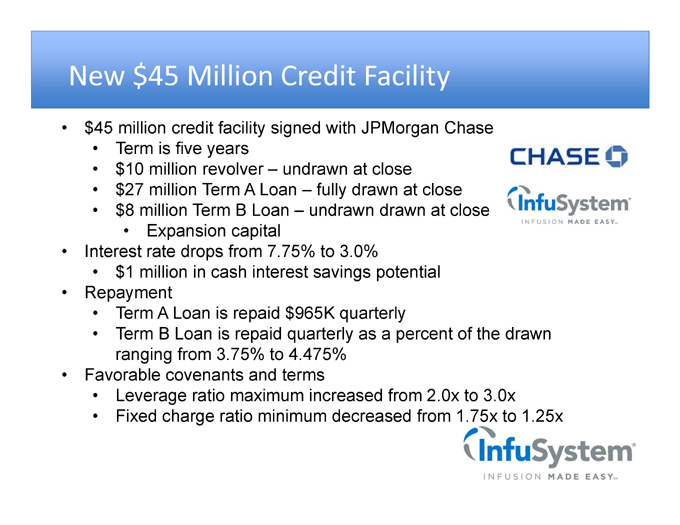
New $45 Million Credit Facility • $45 million credit facility signed with JPMorgan Chase • Term is five years • $10 million revolver – undrawn at close • $27 million Term A Loan – fully drawn at close • $8 million Term B Loan – undrawn drawn at close • Expansion capital • Interest rate drops from 7.75% to 3.0% • $1 million in cash interest savings potential • Repayment • Term A Loan is repaid $965K quarterly • Term B Loan is repaid quarterly as a percent of the drawn ranging from 3.75% to 4.475% • Favorable covenants and terms • Leverage ratio maximum increased from 2.0x to 3.0x • Fixed charge ratio minimum decreased from 1.75x to 1.25x
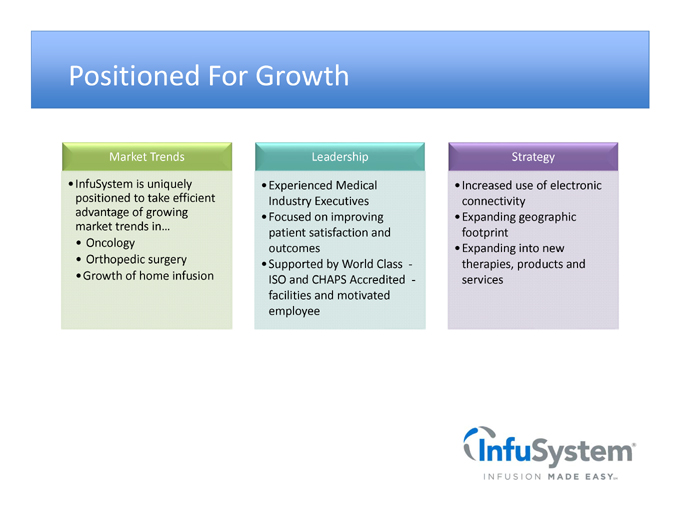
Positioned For Growth Market Trends Leadership Strategy •InfuSystem is uniquely •Experienced Medical •Increased use of electronic positioned to take efficient Industry Executives connectivity advantage of growing •Focused on improving •Expanding geographic market trends in… patient satisfaction and footprint • Oncology outcomes •Expanding into new • Orthopedic surgery •Supported by World Class ? therapies, products and •Growth of home infusion ISO and CHAPS Accredited ? services facilities and motivated employee
Where Does This Take INFU? Aging Population and Cancer Growth More Patients Home IV , Commercial Pay Recognizing Value, CMS Competitive Bidding Peripheral Nerve Block and Smart Pump Growth Revenue Growth in High Single Digits Through 2015
Thank You for Your Interest! IR Contact Info: Joe Dorame Managing Partner Lytham Partners, LLC 602?889?9700 dorame@lythampartners.com