Attached files
| file | filename |
|---|---|
| 8-K - SIMULATIONS PLUS, INC. - Simulations Plus, Inc. | simulations_8k-041415.htm |
| EX-99.2 - PRESS RELEASE - Simulations Plus, Inc. | simulations_8k-ex9902.htm |
Exhibit 99.1

Copyright (c) 2015 Simulations Plus, Inc. 1 Simulations Plus, Inc . and its wholly owned subsidiary Cognigen Corporation ( NASDAQ:SLP ) Investor Call April 14, 2015

Copyright (c) 2015 Simulations Plus, Inc. 2 With the exception of historical information, the matters discussed in this presentation are forward - looking statements that involve a number of risks and uncertainties . The actual results of the Company could differ significantly from those statements . Factors that could cause or contribute to such differences include, but are not limited to : continuing demand for the Company’s products, competitive factors, the Company’s ability to finance future growth, the Company’s ability to produce and market new products in a timely fashion, the Company’s ability to continue to attract and retain skilled personnel, and the Company’s ability to sustain or improve current levels of productivity . Further information on the Company’s risk factors is contained in the Company’s quarterly and annual reports and filed with the Securities and Exchange Commission . Safe Harbor Statement

Copyright (c) 2015 Simulations Plus, Inc. 3 • Major provider of software and consulting services for pharmaceutical research and development • Expertise and software tools span from earliest drug discovery through clinical trials and beyond patent life to supporting generic companies • New applications being explored in aerospace and general healthcare • Acquisition of Cognigen Corp. in September 2014 more than doubled workforce, expected to add $4.8 to $5 million to revenues in FY15. Consolidated results are presented herein. • In 2QFY15, revenues increased by 48.4%, or $1.5 million, to $4.6 million from $3.1 million • In 2QFY15, gross profit increased by 33.2%, or $860,000, to $3.5 million from $2.6 million • Distributing a dividend of $0.05/quarter, subject to board approval each quarter Simulations Plus, Inc. Overview

Copyright (c) 2015 Simulations Plus, Inc. 4 • Revenues increased by 48.4%, or $1.5 million, to $ 4.6 million from $3.1 million ‒ Cognigen revenues were $ 1.27 million, up by $140,000 over prior quarter ‒ Simulations Plus revenue increased 7.2%, or $221,000, in 2QFY15 versus 2QFY14; analytical study revenues increased $171,000 in 2QFY15 compared to 2QFY14 . Simulations Plus revenue was affected by a $250,000 renewal order that slipped to 3QFY15. • Gross profit increased 33.2%, or $860,000, to $3.5 million in 2QFY15 from $2.6 million in 2QFY14 ‒ $737,000 of increase is from Cognigen, which showed a 58% gross margin ‒ Simulations Plus margin for the quarter was 82.1%, down 2.5% from 84% in 2QFY14 ‒ Consolidated gross margin decreased to 75.4% from 84 %, the result of the blending of margins on consulting revenues of Cognigen with higher software margins of Simulations Plus 2QFY15 Highlights Compared to 2QFY14 Fiscal Quarter Ended 2/28/15

Copyright (c) 2015 Simulations Plus, Inc. 5 • SG&A increased 46.1%, or $ 509,000, to $1.6 million from $1.1 million the prior year ‒ $539,000 of increase is from Cognigen operating expenses ‒ Simulations Plus SG&A decreased $30,000 ‒ Total SG &A decreased to 32.5% of revenues in 2QFY15 from 35.8% in 2QFY14 • R&D spend and expense remained fairly constant • Other income ( expense) decreased by $ 42,000 in 2QFY15 versus 2QFY14 as a result of foreign currency fluctuations ‒ We recently made a ~5% increase to prices in our main Asian market. We do not anticipate this increase will have a significant impact on sales . ‒ This Asian market represented 15% of software sales for the quarter. 2QFY15 Highlights Compared to 2QFY14 Fiscal Quarter Ended 2/28/15, cont’d.

Copyright (c) 2015 Simulations Plus, Inc. 6 • Net income increased by 19.8%, or $ 160,000, to $970,000 in 2QFY15 from $810,000 in 2QFY14 ‒ $124,000 of this increase were earnings from Cognigen subsidiary ‒ Simulations Plus profit increase was affected by a $250,000 renewal order that pushed into the next quarter • EBITDA increased 45% to $1.97 million in 2QFY15 versus $1.36 million in 2QFY14 • Diluted earnings per share was $ 0.056 in 2QFY15 , an increase of $0.007 from $ 0.049 in 2QFY14 • If the $250,000 order had not slipped to the following week, earnings per share would have been $0.07 per share • Cash dividends totaling $0.05/share were distributed during this fiscal quarter 2QFY15 Highlights Compared to 2QFY14 Fiscal Quarter Ended 2/28/15, cont’d.

Copyright (c) 2015 Simulations Plus, Inc. 7 Income Statement 2QFY15 Compared to 2QFY14 (in millions) 2QFY15 2QFY14 Net sales $ 4.574 $ 3.081 Gross profit 3.448 2.589 Gross profit margin 75.4% 84.0% SG&A 1.612 1.104 R&D 0.361 0.354 Total operating expenses 1.973 1.458 Income from operations 1.475 1.131 Other income (expense) (.030) 0.012 Income from operations before income taxes 1.445 1.144 Net income 0.970 0.810 Diluted earnings per share (in dollars) 0.057 0.049 EBITDA 1.967 1.350

Copyright (c) 2015 Simulations Plus, Inc. 8 Income Statement 2QFY15, by Division (in millions) SLP Cognigen Eliminations FQY15.2 Net sales $ 3.302 $ 1.271 0.00 $ 4.574 Gross profit 2.711 0.737 0.00 3.448 Gross profit margin 82.1% 58.0% 0.00 75.4% SG&A 1.073 0.539 0.00 1.612 R&D 0.350 0.011 0.00 0.361 Total operating expenses 1.423 0.550 0.00 1.973 Income from operations 1.288 0.187 0.00 1.475 Other income (expense) (.030) .000 0.00 (.030) Income from operations before income taxes 1.258 0.187 0.00 1.445 Net income 0.846 0.124 0.00 0.970 EBITDA 1.689 0.278 0.00 1.967

Copyright (c) 2015 Simulations Plus, Inc. 9 • Revenues increased by 51.3%, or $2.9 million, to $8.7 million from $5.7 million in 6moFY14 ‒ Cognigen revenues were $2.4 million ‒ Simulations Plus revenue increased 9.3%, or $531,000, to $6.3 million in 6moFY15 versus 6moFY14; analytical study revenues increased 65%, or $156,000, to $396,000 in 6moFY15 compared to 6moFY14 ‒ If the $250,000 order had not slipped to Q3FY15 , Simulations Plus revenue for 6moFY15 would have increased $ 781,000, or 13.7% to $6.504 million • Gross profit increased 36.7%, or $ 1.76 million, to $6.54 million in 6moFY15 from $4.78 million in 6moFY14 ‒ $1.34 million of increase is from Cognigen, which showed a 56% gross margin ‒ Simulations Plus margin for the quarter was 83.1%, down 0.5% from 83.6% the prior year • Consolidated gross margin decreased to 75.4% from 83.6 %, the result of the blending of margins on consulting revenues of Cognigen with higher software margins of Simulations Plus 6moFY15 Highlights Compared to 6moFY14 Period Ended 2/28/15

Copyright (c) 2015 Simulations Plus, Inc. 10 • SG&A increased 69.2%, or $1.5 million, to $3.7 million from $2.2 million the prior year ‒ $1.1 million of the increase is from Cognigen operating expenses ‒ Simulations Plus SG&A increased $440 ,000 for 6moFY15 compared to 6moFY14 ‒ During this 6 - month period, we paid ~$400,000 in consulting fees associated with the Cognigen acquisition which increased consulting fees for the period by $351,000 compared to 6moFY14 ‒ Commission expenses to our Japanese and Chinese dealers were up by $49,000 from increased sales in those markets ‒ As a percent of revenues, SG&A increased 4.5% to 4 2.5% of revenues in 6moFY15 from 38% in 6moFY14 ‒ One - time consulting fees were majority of that increase • R&D spend of $1.25 million remained fairly constant, however, expensed portion of R&D increased by $ 117,000 to $633,000 6moFY15 Highlights Compared to 6moFY14 Period Ended 2/28/15, cont’d.
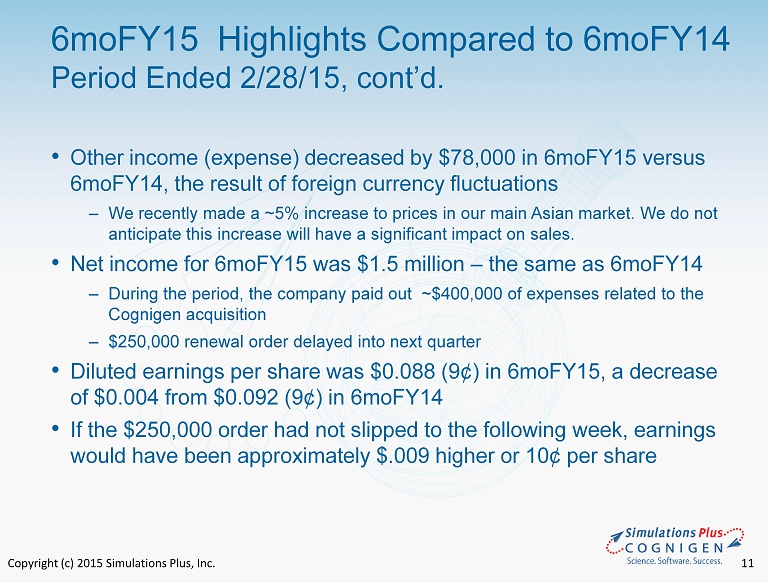
Copyright (c) 2015 Simulations Plus, Inc. 11 • Other income ( expense) decreased by $78,000 in 6moFY15 versus 6moFY14, the result of foreign currency fluctuations ‒ We recently made a ~5% increase to prices in our main Asian market. We do not anticipate this increase will have a significant impact on sales. • Net income for 6moFY15 was $1.5 million – the same as 6moFY14 ‒ During the period, the company paid out ~$400,000 of expenses related to the Cognigen acquisition ‒ $250,000 renewal order delayed into next quarter • Diluted earnings per share was $0.088 (9¢) in 6moFY15, a decrease of $ 0.004 from $0.092 (9¢) in 6moFY14 • If the $250,000 order had not slipped to the following week, earnings would have been approximately $.009 higher or 10 ¢ per share 6moFY15 Highlights Compared to 6moFY14 Period Ended 2/28/15, cont’d.

Copyright (c) 2015 Simulations Plus, Inc. 12 6moFY15 6moFY14 Net sales $ 8.660 $ 5.722 Gross profit 6.537 4.782 Gross profit margin 75.5% 83.6% SG&A 3.679 2.175 R&D 0.633 0.516 Total operating expenses 4.312 2.691 Income from continuing operations 2.225 2.091 Other income (0.034) 0.45 Income from operations before income taxes 2.191 2.136 Net income 1.499 1.495 Diluted earnings per share (in dollars) 0.09 0.09 EBITDA 3.171 3.101 Income Statement 6moFY15 Versus 6moFY14 (in millions)
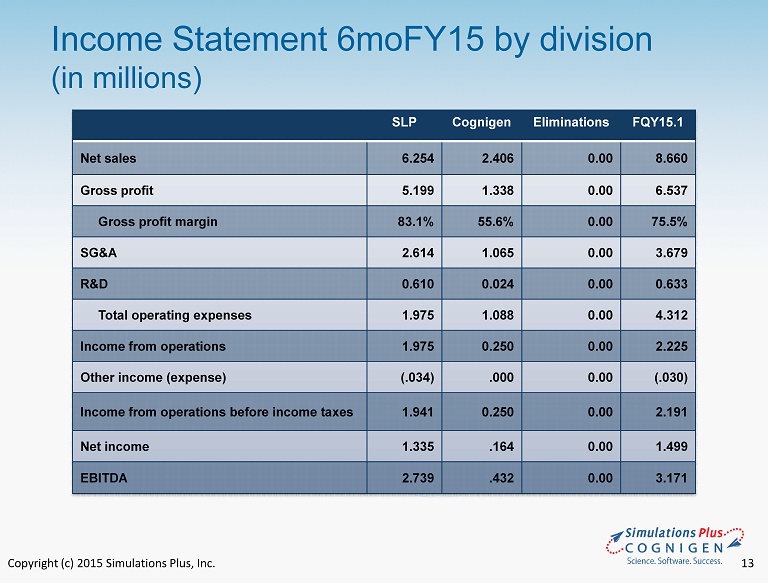
Copyright (c) 2015 Simulations Plus, Inc. 13 Income Statement 6moFY15 by division (in millions) SLP Cognigen Eliminations FQY15.1 Net sales 6.254 2.406 0.00 8.660 Gross profit 5.199 1.338 0.00 6.537 Gross profit margin 83.1% 55.6% 0.00 75.5% SG&A 2.614 1.065 0.00 3.679 R&D 0.610 0.024 0.00 0.633 Total operating expenses 1.975 1.088 0.00 4.312 Income from operations 1.975 0.250 0.00 2.225 Other income (expense) (.034) .000 0.00 (.030) Income from operations before income taxes 1.941 0.250 0.00 2.191 Net income 1.335 .164 0.00 1.499 EBITDA 2.739 .432 0.00 3.171

Copyright (c) 2015 Simulations Plus, Inc. 14 Selected Balance Sheet Items (in millions) February 28, 2015 August 31, 2014 Cash and cash equivalents $6.103* $8.614 Cash per share 0.36 0.52 Total current assets 10.732 11.533 Total assets 27.062 20.981 Total current liabilities 1.468 1.391 Total liabilities 8.380 5.545 Current ratio 7.31 8.29 Shareholders’ equity 18.682 15.435 Total liabilities and shareholders’ equity 27.062 20.981 Shareholders’ equity per diluted share 1.093 0.94 * Cash as of April 10, 2015 was $7.3 million

Copyright (c) 2015 Simulations Plus, Inc. 15 2QFY15 Consolidated Sales By Region Europe 27% North America 5 9% Asia 13% South America <1% Japan = 78% China = 15% Korea = 7 %

Copyright (c) 2015 Simulations Plus, Inc. 16 New Software Customers, by Fiscal Quarter 0 5 10 15 20 25 Q1 Q2 Q3 Q4 23 20 2010 2011 2012 2013 2014 2015

Copyright (c) 2015 Simulations Plus, Inc. 17 Consolidated Revenues, by Fiscal Quarter (pro forma prior to 2012; in millions) Column1 2009 2010 2011 2012 2013 2014 2015 Q1 1.4 1.7 2.1 2.24 2.29 2.64 4.01 Q2 1.8 2.2 2.6 2.79 3.12 3.08 4.57 Q3 2 2.3 2.64 2.77 3.09 3.74 Q4 1.1 1.3 1.43 1.64 1.58 2.00 0 0.5 1 1.5 2 2.5 3 3.5 4 4.5 5 Q1 Q2 Q3 Q4 Chart Title 2009 2010 2011 2012 2013 2014 2015 $0 $1 $2 $3 $4 $5 Q1 Q2 Q3 Q4 4.01 4.57 2009 2010 2011 2012 2013 2014 2015
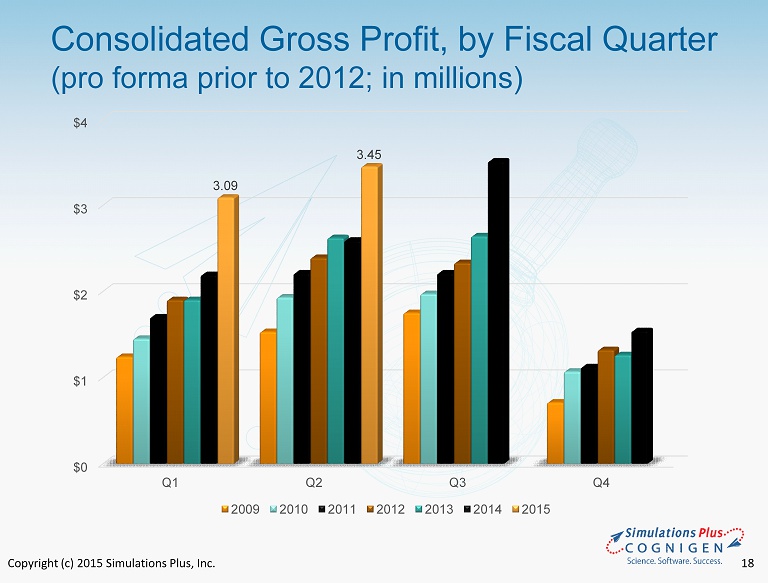
Copyright (c) 2015 Simulations Plus, Inc. 18 Consolidated Gross Profit, by Fiscal Quarter (pro forma prior to 2012; in millions) $0 $1 $2 $3 $4 Q1 Q2 Q3 Q4 3.09 3.45 2009 2010 2011 2012 2013 2014 2015

Copyright (c) 2015 Simulations Plus, Inc. 19 Consolidated EBITDA, by Fiscal Quarter (in millions) $0 $1 $2 $3 Q1 Q2 Q3 Q4 1.45 1.97 2009 2010 2011 2012 2013 2014 2015

Copyright (c) 2015 Simulations Plus, Inc. 20 Consolidated Net Income, by Fiscal Quarter (pro forma prior to 2012; in millions) $ - $0.20 $0.40 $0.60 $0.80 $1.00 $1.20 $1.40 Q1 Q2 Q3 Q4 $0.53 $0.97 2009 2010 2011 2012 2013 2014 2015

Copyright (c) 2015 Simulations Plus, Inc. 21 Returning Cash to Shareholders (in millions) 1.6 0.8 0.8 2.2 0 0.5 0.5 0.6 0.81 0.81 0.81 0.84 0.84 13.2 12.9 12.7 11.4 9.3 9.8 10 10.1 10.6 11 7.8 8.6 5.8 6.1 7.3 $0 $1 $1 $2 $2 $3 $0 $2 $4 $6 $8 $10 $12 $14 Dividend Paid Cash on Hand Cash paid $2.5M TSRL Cash paid $2.1M for Cognigen

Copyright (c) 2015 Simulations Plus, Inc. 22 Simulations Plus, Inc. Cognigen Growth Opportunities • Continued penetration of clinical pharmacology departments to provide more detailed mechanistic modeling for clinical data analysis in line with regulatory expectations • Social media and Email blasts emphasizing − KIWI™ functionality − Modeling & simulation services − Data Assembly services • Piggyback onto Simulations Plus’ presence at national and international scientific meetings

Copyright (c) 2015 Simulations Plus, Inc. 23 • 2QFY15 ‒ Active projects at end of quarter: ~40 ‒ New clients: 2 ‒ New projects and expansions in scope: 18 ‒ Client assistance in regulatory interactions: 25% of projects • Beyond 2QFY15 – current ‒ New clients and new clients in pipeline: 8 ‒ New projects and expansions in scope: 4 • KIWI ™ licenses 2QFY15: 3 ‒ KIWI ™ prospects: 6 ‒ KIWI ™ presentation accepted for PAGE meeting in June 2015 ‒ Targeting release of KIWI ™ Version 1.3 in June 2015 Simulations Plus, Inc. Cognigen Sales Update

Copyright (c) 2015 Simulations Plus, Inc. 24 • Of 2,500 companies registered with FDA, we have ~10% penetration with Simulations Plus products ‒ http://www.fda.gov/Drugs/NewsEvents/ucm339912.htm • AEROModeler™ ‒ Application of our artificial neural network ensemble (ANNE) technology to predict aerodynamic force coefficients for missiles at arbitrary Mach number and angle of attack ‒ Also for recognition of missiles from radar tracking data ‒ Presenting at 3 aerospace conferences in 2015 • MRIModeler™ ‒ Application of our ANNE technology to analysis of magnetic resonance imaging (MRI) data to classify patients as healthy or likely to experience various disease states ‒ Submitted SBIR grant application to NIH in April Simulations Plus, Inc. Additional Growth Opportunities
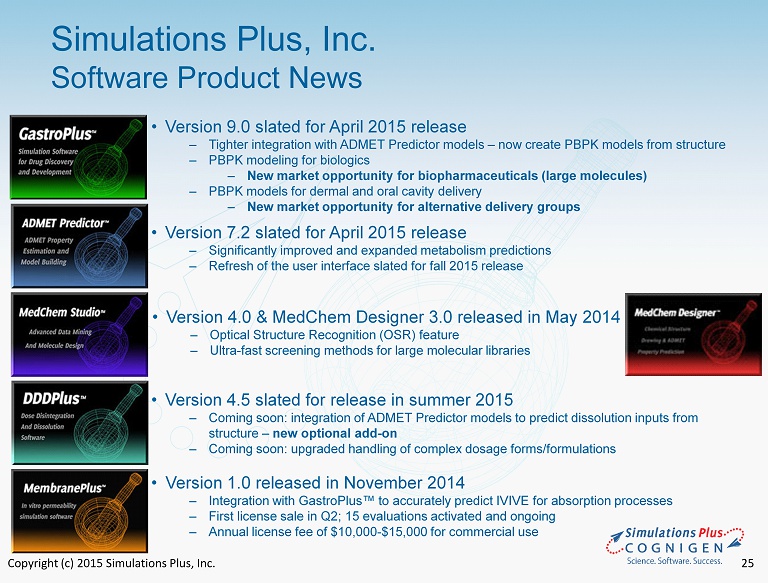
Copyright (c) 2015 Simulations Plus, Inc. 25 • Version 9.0 slated for April 2015 release ‒ Tighter integration with ADMET Predictor models – now create PBPK models from structure ‒ PBPK modeling for biologics ‒ N ew market opportunity for biopharmaceuticals (large molecules) ‒ PBPK models for dermal and oral cavity delivery ‒ N ew market opportunity for alternative delivery groups • Version 7.2 slated for April 2015 release ‒ Significantly improved and expanded metabolism predictions ‒ Refresh of the user interface slated for fall 2015 release • Version 4.0 & MedChem Designer 3.0 released in May 2014 ‒ Optical Structure Recognition (OSR) feature ‒ U ltra - fast screening methods for large molecular libraries • Version 4.5 slated for release in summer 2015 ‒ Coming soon: integration of ADMET Predictor models to predict dissolution inputs from structure – new optional add - on ‒ Coming soon: upgraded handling of complex dosage forms/formulations • Version 1.0 released in November 2014 ‒ Integration with GastroPlus™ to accurately predict IVIVE for absorption processes ‒ First license sale in Q2; 15 evaluations activated and ongoing ‒ Annual license fee of $10,000 - $15,000 for commercial use Simulations Plus, Inc. Software Product News

Copyright (c) 2015 Simulations Plus, Inc. 26 • Added 20 new software customers during 2QFY15: − New companies in US, Europe, Japan , and China − New divisions at the US FDA, US EPA, Japan PMDA, and Chinese FDA • Software renewal rate (accounts ) was 89%; 93% in terms of revenue Simulations Plus, Inc. Consolidated Sales Breakdown – 2QFY15 51% 33% 14% 2% Renewal Consulting New Training

Copyright (c) 2015 Simulations Plus, Inc. 27 • Conferences/scientific meetings continue to be primary source of leads ‒ 9 scientific meetings attended; co - authors on 7 presentations • Trainings and workshops ‒ Conducted training workshops in San Diego – full attendance ‒ 2015 workshops scheduled for US, Europe, and Asia • Strategic digital marketing initiatives ‒ Hosted 3 webinars on our software updates and applications ‒ 650 registrations ‒ Active updates: LinkedIn, Facebook, Google+, and Twitter accounts ‒ 1800+ followers of the company pages on LinkedIn; 35% increase since September 2014 ‒ GastroPlus ™ User Group now has over 616 members on LinkedIn; 32% increase since September 2014 Simulations Plus, Inc. Marketing Program – 2QFY15

Copyright (c) 2015 Simulations Plus, Inc. 28 • Center for Food Safety and Nutrition ( CFSAN) ‒ Completed third year of 5 - year renewable Research Collaboration Agreement (RCA) with CFSAN to provide model - building capabilities to predict toxicities for large number of substances that can be in foods as additives or contaminants ‒ First peer - reviewed articles from FDA scientists published in 2QFY15 • Office of Testing and Research (OTR) ‒ Completed first year of 5 - year RCA signed with OTR to validate mechanistic absorption modeling in developing predictive in vitro - in vivo correlations (IVIVCs) ‒ FDA scientists to host webinars in 3QFY15 and present at October conference • Office of Generic Drugs (OGD) ‒ Completed first ½ - year of 3 - year funded collaboration ($200,000/year) with OGD to develop improved PBPK models for ocular (eye) drug delivery ‒ Need to reach milestones to receive full funding – on target • National Toxicology Program (NTP) ‒ Completed second year of 3 - year collaboration with NTP to utilize PBPK and QSAR modeling to prioritize testing of compounds for the Tox21 program Simulations Plus, Inc. Government Collaborations

Copyright (c) 2015 Simulations Plus, Inc. 29 • For 2QFY15 and 6moFY15 - Revenues and earnings continued seven - year - plus profitable trend - Cognigen acquisition increases revenues and profit, expands offerings into clinical pharmacology; second quarter Cognigen earnings were $ 124,000 up from $ 40,000 in the first quarter of the current fiscal year • Continuing to grow revenues and customer base - Consolidated 51% revenue growth in first 6 months since Cognigen acquisition - Added 20 new customers in second quarter and total of 43 for the six months ended February 28, 2015 • Earnings per share - For the quarter, are up $.01/share - Unchanged for six months compared to prior year even with additional costs of Cognigen acquisition and large delayed order • Strong cash position; returning cash to shareholders - Company continues to pay dividends of $0.05 per quarter - Cash dividends totaling approximately $10 million have been distributed, yet cash remains at $7.3 million as of today Summary
Copyright (c) 2015 Simulations Plus, Inc. 30 Q&A