Attached files
| file | filename |
|---|---|
| EX-31.1 - EX-31.1 - SPORTSMAN'S WAREHOUSE HOLDINGS, INC. | spwh-ex311_201501319.htm |
| EX-32.1 - EX-32.1 - SPORTSMAN'S WAREHOUSE HOLDINGS, INC. | spwh-ex321_2015013111.htm |
| EX-31.2 - EX-31.2 - SPORTSMAN'S WAREHOUSE HOLDINGS, INC. | spwh-ex312_2015013110.htm |
| EX-23.2 - EX-23.2 - SPORTSMAN'S WAREHOUSE HOLDINGS, INC. | spwh-ex232_20150131251.htm |
| EX-21.1 - EX-21.1 - SPORTSMAN'S WAREHOUSE HOLDINGS, INC. | spwh-ex211_20150131249.htm |
| EX-23.1 - EX-23.1 - SPORTSMAN'S WAREHOUSE HOLDINGS, INC. | spwh-ex231_20150131250.htm |
| EXCEL - IDEA: XBRL DOCUMENT - SPORTSMAN'S WAREHOUSE HOLDINGS, INC. | Financial_Report.xls |
UNITED STATES
SECURITIES AND EXCHANGE COMMISSION
Washington, D.C. 20549
FORM 10-K
(Mark One)
|
x |
ANNUAL REPORT PURSUANT TO SECTION 13 OR 15(d) OF THE SECURITIES EXCHANGE ACT OF 1934 |
For the fiscal year ended January 31, 2015
OR
|
¨ |
TRANSITION REPORT PURSUANT TO SECTION 13 OR 15(d) OF THE SECURITIES EXCHANGE ACT OF 1934 |
FOR THE TRANSITION PERIOD FROM TO
Commission File Number 001-36401
SPORTSMAN’S WAREHOUSE HOLDINGS, INC.
(Exact name of Registrant as specified in its Charter)
|
Delaware |
|
39-1975614 |
|
( State or other jurisdiction of incorporation or organization) |
|
(I.R.S. Employer |
|
|
|
|
|
7035 South High Tech Drive Midvale, Utah |
|
84047 |
|
(Address of principal executive offices) |
|
(Zip Code) |
Registrant’s telephone number, including area code: (801) 566-6681
Securities registered pursuant to Section 12(b) of the Act: Common Stock, Par Value $0.01 Per Share; Common stock traded on the NASDAQ stock market
Securities registered pursuant to Section 12(g) of the Act: None
Indicate by check mark if the Registrant is a well-known seasoned issuer, as defined in Rule 405 of the Securities Act. YES ¨ NO x
Indicate by check mark if the Registrant is not required to file reports pursuant to Section 13 or 15(d) of the Act. YES ¨ NO x
Indicate by check mark whether the Registrant: (1) has filed all reports required to be filed by Section 13 or 15(d) of the Securities Exchange Act of 1934 during the preceding 12 months (or for such shorter period that the Registrant was required to file such reports), and (2) has been subject to such filing requirements for the past 90 days. YES x NO ¨
Indicate by check mark whether the Registrant has submitted electronically and posted on its corporate Web site, if any, every Interactive Data File required to be submitted and posted pursuant to Rule 405 of Regulation S-T (§232.405 of this chapter) during the preceding 12 months (or for such shorter period that the Registrant was required to submit and post such files). YES x NO ¨
Indicate by check mark if disclosure of delinquent filers pursuant to Item 405 of Regulation S-K (§229.405) is not contained herein, and will not be contained, to the best of Registrant’s knowledge, in definitive proxy or information statements incorporated by reference in Part III of this Form 10-K or any amendment to this Form 10-K. x
Indicate by check mark whether the Registrant is a large accelerated filer, an accelerated filer, a non-accelerated filer, or a smaller reporting company. See the definition of “large accelerated filer”, “accelerated filer”, and “smaller reporting company” in Rule 12b-2 of the Exchange Act. (Check one):
|
Large accelerated filer |
|
¨ |
|
Accelerated filer |
|
¨ |
|
|
|
|
|
|
|
|
|
Non-accelerated filer |
|
x (Do not check if a smaller reporting company) |
|
Smaller reporting company |
|
¨ |
Indicate by check mark whether the Registrant is a shell company (as defined in Rule 12b-2 of the Exchange Act). YES ¨ NO x
As of August 1, 2014, the last business day of the registrant’s most recently completed second quarter, the aggregate market value of the voting and non-voting common equity held by non-affiliates of the Registrant, based on the closing price of the shares of common stock on The NASDAQ Stock Market on August 1, 2014, was $98,875,367. Shares held by each executive officer, director and by each person who owns 10% or more of the outstanding common stock have been excluded in that such persons may be deemed to be affiliates. The determination of affiliate status is not necessarily a conclusive determination for other purposes.
The number of shares of Registrant’s Common Stock outstanding as of April 2, 2015 was 41,818,235.
Portions of the Registrant’s Definitive Proxy Statement relating to the Annual Meeting of Shareholders, scheduled to be held on June 24, 2015, are incorporated by reference into Part III of this Report.
Table of Contents
|
|
|
Page |
|
PART I |
|
|
|
Item 1. |
4 |
|
|
Item 1A. |
18 |
|
|
Item 1B. |
31 |
|
|
Item 2. |
31 |
|
|
Item 3. |
32 |
|
|
Item 4. |
33 |
|
|
|
|
|
|
PART II |
|
|
|
Item 5. |
34 |
|
|
Item 6. |
35 |
|
|
Item 7. |
Management’s Discussion and Analysis of Financial Condition and Results of Operations |
37 |
|
Item 7A. |
50 |
|
|
Item 8. |
51 |
|
|
Item 9. |
Changes in and Disagreements With Accountants on Accounting and Financial Disclosure |
70 |
|
Item 9A. |
70 |
|
|
Item 9B. |
70 |
|
|
|
|
|
|
PART III |
|
|
|
Item 10. |
71 |
|
|
Item 11. |
71 |
|
|
Item 12. |
Security Ownership of Certain Beneficial Owners and Management and Related Stockholder Matters |
71 |
|
Item 13. |
Certain Relationships and Related Transactions, and Director Independence |
71 |
|
Item 14. |
71 |
|
|
|
|
|
|
PART IV |
|
|
|
Item 15. |
72 |
ii
References throughout this document to “Sportsman’s Warehouse,” “we,” “us,” and “our” refer to Sportsman’s Warehouse Holdings, Inc. and its subsidiaries, and references to “Holdings” refer to Sportsman’s Warehouse Holdings, Inc. excluding its subsidiaries.
STATEMENT REGARDING FORWARD-LOOKING STATEMENTS
This Annual Report on Form 10-K (this “10-K) contains statements that constitute forward-looking statements as that term is defined by the Private Securities Litigation Reform Act of 1995. These statements concern our business, operations and financial performance and condition as well as our plans, objectives and expectations for our business operations and financial performance and condition, which are subject to risks and uncertainties. All statements other than statements of historical fact included in this 10-K are forward-looking statements. These statements may include words such as “aim,” “anticipate,” “assume,” “believe,” “can have,” “could,” “due,” “estimate,” “expect,” “goal,” “intend,” “likely,” “may,” “objective,” “plan,” “potential,” “positioned,” “predict,” “should,” “target,” “will,” “would” and other words and terms of similar meaning in connection with any discussion of the timing or nature of future operating or financial performance or other events or trends. For example, all statements we make relating to our plans and objectives for future operations, growth or initiatives and strategies are forward-looking statements.
These forward-looking statements are based on current expectations, estimates, forecasts and projections about our business and the industry in which we operate and our management’s beliefs and assumptions. We derive many of our forward-looking statements from our own operating budgets and forecasts, which are based upon many detailed assumptions. While we believe that our assumptions are reasonable, we caution predicting the impact of known factors is very difficult, and we cannot anticipate all factors that could affect our actual results.
All of our forward-looking statements are subject to risks and uncertainties that may cause our actual results to differ materially from our expectations. Important factors that could cause actual results to differ materially from our expectations include, but are not limited to:
|
· |
our retail-based business model is impacted by general economic conditions and economic and financial uncertainties may cause a decline in consumer spending; |
|
· |
our concentration of stores in the Western United States makes us susceptible to adverse conditions in this region, which could affect our sales and cause our operating results to suffer; |
|
· |
we operate in a highly fragmented and competitive industry and may face increased competition; |
|
· |
we may not be able to anticipate, identify and respond to changes in consumer demands, including regional preferences, in a timely manner; |
|
· |
we may not be successful in operating our stores in any existing or new markets into which we expand; and |
|
· |
current and future government regulations, in particular regulations relating to the sale of firearms and ammunition, may impact the demand for our products and our ability to conduct our business. |
The above is not a complete list of factors or events that could cause actual results to differ from our expectations, and we cannot predict all of them. All written and oral forward-looking statements attributable to us, or persons acting on our behalf, are expressly qualified in their entirety by the cautionary statements disclosed under “Risk Factors,” “Management’s Discussion and Analysis of Financial Condition and Results of Operations” and elsewhere in this 10-K, as such disclosures may be amended, supplemented or superseded from time to time by other reports we file with the Securities and Exchange Commission (the “SEC”), including subsequent Annual Reports on Form 10-K and Quarterly Reports on Form 10-Q, and public communications. You should evaluate all forward-looking statements made in this 10-K and otherwise in the context of these risks and uncertainties.
Potential investors and other readers are urged to consider these factors carefully in evaluating the forward-looking statements and are cautioned not to place undue reliance on any forward-looking statements we make. These forward-looking statements speak only as of the date of this 10-K and are not guarantees of future performance or developments and involve known and unknown risks, uncertainties and other factors that are in many cases beyond our control. Except as required by law, we undertake no obligation to update or revise any forward-looking statements publicly, whether as a result of new information, future developments or otherwise.
iii
Overview
Sportsman’s Warehouse is a high-growth outdoor sporting goods retailer focused on meeting the everyday needs of the seasoned outdoor veteran, the first-time participant and every enthusiast in between. Our mission is to provide a one-stop shopping experience that equips our customers with the right hunting, shooting, fishing and camping gear to maximize their enjoyment of the outdoors. We strive to accomplish this goal by tailoring our broad and deep merchandise assortment to meet local conditions and demand, offering everyday low prices, providing friendly support from our knowledgeable, highly trained staff and offering extensive in-store events and educational programming. These core strategies help position Sportsman’s Warehouse as the “local outdoor experts” and the preferred place to both shop and share outdoor-based experiences in the communities we serve. As a result, we are expanding our loyal customer base in existing markets and increasing our store footprint in new markets, which we believe will further drive our growth and profitability.
Sportsman’s Warehouse was founded in 1986 as a single retail store in Midvale, Utah and has grown to 56 stores across 18 states. Today, we have the largest outdoor specialty store base in the Western United States and Alaska. Our stores range from 30,000 to 65,000 gross square feet, with an average size of approximately 46,000 gross square feet. Our store layout is adaptable to both standalone locations and strip centers. Based on publicly available information, we believe it is less capital-intensive for us to open new stores compared to our principal competitors because our “no frills” store layout requires less initial cash investment to build out and our stores generally require less square footage than the stores of our competitors. Together, these features enable us to effectively serve markets of multiple sizes, from Metropolitan Statistical Areas, or MSAs, with populations of less than 75,000 to major metropolitan areas with populations in excess of 1,000,000, while generating consistent four-wall Adjusted EBITDA margins and returns on invested capital across a range of store sales volumes. We may post information that is important to investors on our website from time to time. The information provided on our website is not part of this report and is, therefore, not incorporated herein by reference.
Our Competitive Strengths
We believe the following competitive strengths allow us to capitalize on the growth opportunity within the outdoor activities and sporting goods market:
Differentiated Shopping Experience for the Seasoned Outdoor Veteran, the First-Time Participant and Every Enthusiast in Between. We place great emphasis on creating an inviting and engaging store experience for customers of all experience levels. For the seasoned outdoor veteran, we offer a one-stop, convenient store layout that promotes “easy-in, easy-out” access to replenish supplies, learn about local conditions and test products. We also serve first-time participants and casual users who are interested in enjoying the outdoors but enter our store without a clear sense for what equipment they need for their chosen activity. Our highly trained employees, who often are outdoor enthusiasts themselves and users of the products we sell, engage and interact with our customers in order to educate them and equip them with the right gear. Our sales associates draw upon both formal vendor sales training as well as first-hand experiences from using our products in local conditions. This selling approach allows us to offer a broad range of products and to deliver a shopping experience centered on the customer’s needs, which we believe results in increased customer loyalty, repeat visits and frequent referrals to other potential customers.
A customer’s shopping experience in our stores is further enhanced by a variety of helpful in-store offerings and features, including the issuance of hunting and fishing licenses, local fishing reports, availability of Sportsman’s News (our proprietary in-store newspaper), access to the Braggin’ Board (where customers can post photos of their outdoor adventures), indoor test ranges for archery equipment and displays of customer-owned taxidermy. In addition, we host a variety of in-store programs (such as “ladies night”), contests (such as Bucks & Bulls, a free-to-enter, big-game trophy contest) and a wide range of instructional seminars, from turkey frying to firearm operation and safety. These programs are all designed to help our customers connect with the outdoors and build the skill sets necessary to maximize enjoyment of their chosen activities. As a result, we believe our stores often serve as gathering spots where local enthusiasts can share stories, product knowledge and advice on outdoor recreation activities, which both drives traffic and fosters customer loyalty.
4
Locally Relevant Merchandise Serving the Comprehensive Needs of Outdoor Enthusiasts at a Compelling Value. We offer our customers an extensive and carefully selected assortment of branded, high-quality outdoor products at competitive prices. We accomplish this in three principal ways:
|
· |
Locally Relevant Merchandise: We carry over 70,000 SKUs on average in each store, out of a pool of approximately 125,000 total SKUs. Each store’s merchandise is tailored to meet local conditions and consumer demand, taking into account seasonal requirements, regional game and fishing species, geographic diversity, weather patterns and key demographic factors, so that our customers have the right product, at the right time, for the right location. |
|
· |
Breadth and Mix of Product Assortment: Our merchandise strategy is designed to serve a variety of purchasing occasions, from big-ticket items to replenishment activity, as well as to meet the wide-ranging needs of customers from first-time participants to seasoned outdoor veterans. We pride ourselves on carrying an extensive selection of branded, “good, better and best” hard goods at everyday low prices, including a broad array of in-stock consumable items. Approximately 35.0% of our unit sales and 20.0% of our dollar sales during fiscal year 2014 were consumable goods, such as ammunition, bait, cleaning supplies, food, lures, propane and reloading supplies. We believe this pairing of product breadth and consumable goods appeals to a broad range of customers and drives both repeat traffic and increased average ticket value. |
|
· |
Strong Vendor Relationships: We believe our vendors find our “brand-centric,” high-service store concept to be unique among national specialty outdoor retailers. Our attractive store locations, consistent presentation of merchandise and thorough product training present a compelling opportunity for our vendors to offer their brands to local markets that historically have been served primarily by “mom & pop” retailers. As a result, we believe we are able to negotiate terms with our vendors that are similar to those offered to our principal competitors that are larger in size. We share the benefits of these strategic vendor relationships with our customers through better pricing and enhanced access to certain products that are limited in production. |
Flexible and Adaptable Real Estate Strategy. We believe that our store model, combined with our rigorous site selection process, is uniquely customizable to address the needs of the different markets we serve. Our stores can vary in size from approximately 30,000 to 65,000 gross square feet. We have had success with leasing existing sites as well as constructing new build-to-suit sites. Our flexible store model permits us to serve both large metropolitan areas, like Phoenix, Arizona, and smaller MSAs, like Soldotna, Alaska, while generating consistent four-wall Adjusted EBITDA margins and returns on invested capital across a range of store sales volumes. In small- to medium-sized markets, we are often able to establish ourselves as a standalone destination for our customers; in larger markets, we have successfully leveraged existing infrastructure to open stores in shopping plazas near complementary retailers, drawing upon existing foot traffic. We believe our low-cost, flexible model allows us to access both large and small markets more economically than many of our peers.
We maintain a disciplined approach to new store development and perform comprehensive market research before selecting a new site, including partnering with specialized, third-party local real estate firms. We select sites based on criteria such as local demographics, traffic patterns, density of hunting and fishing license holders in the area, abundance of hunting and fishing game and outdoor recreation activities, store visibility and accessibility, purchase data from our existing customer database and availability of attractive lease terms. We have established productive relationships with well-regarded commercial real estate firms and believe that we are a sought-after tenant, given the strength of the Sportsman’s Warehouse brand, the high volume of customers that visit our stores and our flexible approach to site locations. As a result, we continue to have access to desirable retail sites on attractive terms.
Low Cost Operating Structure with Attractive and Replicable Store Economics. We strive to maintain a lower operating cost structure than our principal competitors, which allows us to serve small- to medium-sized markets as well as larger MSAs. We achieve this by exercising tight control over store-level expenses, real estate costs and corporate overhead. In addition, our growing store base, efficient, localized marketing spend and “no frills” warehouse store layout help us maintain comparatively low operating costs and provide us with the opportunity to achieve four-wall Adjusted EBITDA margins of 10% or more for stores in most new markets. Our typical new store requires an average net investment of approximately $2.0 million, which includes store build-out (net of contributions from landlords) and pre-opening cash expenditures. In addition, we stock each new store with initial inventory at an average cost of approximately $2.4 million. We target a pre-tax return on invested capital within one year after opening of over 50% excluding initial inventory cost (or over 20% including initial inventory cost), although our historical returns have often exceeded these thresholds. For fiscal year 2014, all of our stores that had been open for more than twelve months were profitable and our stores had an average Adjusted EBITDA margin of 14.3%. We believe this low-cost, capital-efficient approach also allows us to successfully serve markets that are not well-suited for the more capital-intensive store models of our principal competitors. Approximately 55% of our markets currently lack another nationally recognized outdoor specialty retailer, which we believe is a result of these dynamics.
5
Significant New Store Growth Opportunity within Existing and New Markets. We operate 56 stores across 18 states, primarily in the Western United States and Alaska, with a presence in these markets that is nearly three times that of the next largest outdoor retailer. We believe our leadership position in the Western United States, combined with our existing scalable infrastructure, provides a strong foundation for continued expansion within our core markets. Over the longer term, we believe our distinct retail concept has the potential to expand to more than 300 locations throughout the United States based on research conducted for us by Buxton Company, an independent consumer research and analytics firm.
Passionate and Experienced Management Team with Proven Track Record. We are focused on delivering an unsurpassed shopping experience to anyone who enjoys the excitement of the outdoors. This passion and commitment is shared by team members throughout our entire organization, from senior management to the employees in our stores. Our senior management team has an average 19 years of retail experience, with extensive capabilities across a broad range of disciplines, including merchandising, real estate, finance, compliance, store operations, supply chain management and information technology. We also pride ourselves on the long tenure of our more than 200 store managers and corporate employees, who have been with us for an average of approximately 10 years.
Our Growth Strategy
We are pursuing a number of strategies designed to continue our growth and strong financial performance, including:
Expanding Our Store Base. We believe that our compelling new store economics and our track record of opening successful new stores provide a strong foundation for continued growth through new store openings in existing, adjacent and new markets. Over the last three fiscal years, we have opened an average of five stores per year. We have opened one new store to date in fiscal year 2015 and currently plan to open an additional eight new stores in the remainder of fiscal year 2015. For the next several years thereafter, we intend to grow our store base at a rate of greater than 10 percent annually and expect that most of our near-term growth will occur within the Western United States. Our longer-term plans include expanding our store base to serve the outdoor needs of enthusiasts in markets across the United States. We believe our existing infrastructure, including distribution, information technology, loss prevention and employee training, is capable of sustaining 100 or more stores without significant additional capital investment.
Increasing Same Store Sales Growth. We are committed to increasing same store sales through a number of ongoing and new initiatives, including: expansion of our clothing offerings and private label program (such as our new proprietary Rustic RidgeTM clothing line), our loyalty program, the implementation of kiosks and mobile point-of-sale in our stores and expansion of our “store-within-a-store” programs with major brands such as Carhartt, Columbia Sportswear and Under Armour. Each of these initiatives is designed to foster additional shopping convenience, add deeper merchandise selection and provide more product information to the customer. We believe these initiatives will drive additional traffic, improve conversion and increase average ticket value.
Continuing to Enhance Our Operating Margins. We believe that our planned expansion of our store base and growth in same store sales will result in improved Adjusted EBITDA margins as we take advantage of economies of scale in product sourcing and leverage our existing infrastructure, supply chain, corporate overhead and other fixed costs. Furthermore, we expect to increase our gross profit margin by expanding product offerings in our private label program, including our new proprietary Rustic RidgeTM clothing line, and continuing marketing initiatives in our higher-margin clothing and footwear departments.
Growing the Sportsman’s Warehouse Brand. We are committed to supporting our stores, product offerings and brand through a variety of marketing programs, private label offerings and corporate partnerships. Our marketing and promotional strategy includes coordinated print, digital and social media platforms. In-store, we offer a wide range of outdoor-themed activities and seminars, from turkey frying to firearm operation and safety. In addition, we sponsor community outreach and charity programs to more broadly connect with our local communities with the aim of promoting our brand and educating consumers. Finally, we are committed to local chapters of national, regional and local wildlife federations and other outdoor-focused organizations, such as Ducks Unlimited and the Rocky Mountain Elk Foundation. Many of our store managers and employees serve in senior positions in these organizations, which further strengthens our place as leaders in the local outdoor community. We believe all of these programs promote our mission of engaging with our customers and serving outdoor enthusiasts.
Our Stores
We operate 56 stores across 18 states. Most of our stores are located in power, neighborhood and lifestyle centers. Power centers are large, unenclosed shopping centers that are usually anchored by three or more national supercenters, such as Target, Wal-Mart and Costco. Neighborhood centers are shopping centers anchored by a supermarket or drugstore that provide convenience goods and services to a neighborhood. Lifestyle centers are shopping centers that combine the traditional functions of a shopping mall with leisure amenities such as pedestrian friendly areas, open air seating and inviting meeting spaces. We also operate several single-unit, stand-alone locations. Our stores average approximately 46,000 gross square feet.
6
The following table lists the location by state of our 56 stores open as of March 31, 2015:
|
|
|
Number of Stores |
|
|
|
Number of Stores |
|
||
|
Washington |
|
|
8 |
|
Nevada |
|
|
3 |
|
|
Idaho |
|
|
6 |
|
New Mexico |
|
|
2 |
|
|
Utah |
|
|
6 |
|
Wyoming |
|
|
2 |
|
|
Oregon |
|
|
5 |
|
Iowa |
|
|
1 |
|
|
Alaska |
|
|
4 |
|
Kentucky |
|
|
1 |
|
|
California |
|
|
4 |
|
Mississippi |
|
|
1 |
|
|
Colorado |
|
|
4 |
|
South Carolina |
|
|
1 |
|
|
Arizona |
|
|
3 |
|
Tennessee |
|
|
1 |
|
|
Montana |
|
|
3 |
|
Virginia |
|
|
1 |
|
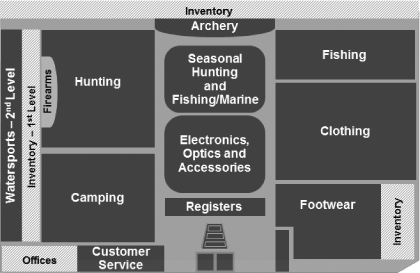
Store Design and Layout
We present our broad and deep array of products in a convenient and engaging atmosphere to meet the everyday needs of all outdoor enthusiasts, from the seasoned veteran to the first-time participant. We maintain a consistent floor layout across our store base that we believe promotes an “easy-in, easy-out” shopping experience. All of our stores feature wide aisles, high ceilings, visible signage and central checkouts with multiple registers. Sportsman’s Warehouse stores, true to their name, are designed in a “no frills” warehouse format that welcomes customers directly from or on the way to an outdoor activity. Some of our stores also feature “store-within-a-store” concepts for certain popular brand partners, such as Carhartt, Columbia Sportswear and Under Armour, through which we dedicate a portion of our floor space to these brands to help increase visibility and drive additional sales.
We have increased our selling square footage within 31 of our existing stores, utilizing the additional square footage primarily for clothing display. This expansion permits us to diversify our presentation of clothing by combining table-top folded merchandise, four-way racks and “store-within-a-store” displays. The diagram below demonstrates this newer format. We intend to improve the presentation of our clothing department in the remainder of our stores with a new fixturing strategy that utilizes the space constraints more effectively.
Our stores include locally relevant features such as a large fishing board at the entrance that displays current fishing conditions in local lakes and rivers with coordinating gear in end-cap displays in the fishing aisles. We actively engage our customers through in-store features such as the Braggin’ Board, various contests (such as Bucks & Bulls and Fish Alaska), and customer-owned taxidermy displays on the walls. We also host in-store programs such as “ladies night” and a wide range of instructional seminars, from dutch oven cooking to choosing the right binocular. Annually, we organize approximately 3,000 programs across our stores for the benefit of our customers. We believe these programs help us connect with the communities in which we operate and encourage first time participants to build the skills necessary to become outdoor enthusiasts and loyal customers.
7
Expansion Opportunities and Site Selection
We have developed a rigorous and flexible process for site selection. We select sites for new store openings based on criteria such as local demographics, traffic patterns, density of hunting and fishing license holders in the area, abundance of hunting and fishing game and outdoor recreation activities, store visibility and accessibility, purchase data from our existing customer database and availability of attractive lease terms. Our store model is adaptable to markets of multiple sizes, from MSAs with populations of less than 75,000 to major metropolitan areas with populations in excess of 1,000,000. We have been successful in taking over existing leases and in constructing new build-to-suit locations.
Our store model is designed to be profitable in a variety of real estate venues, including power, neighborhood and lifestyle centers as well as single-unit, stand-alone locations. In small- to medium-sized markets, we generally seek anchor locations within high-traffic, easily accessible shopping centers. In larger metropolitan areas, we generally seek locations in retail areas with major discount retailers (such as Wal-Mart), wholesale retailers (such as Costco), other specialty hardline retailers (such as The Home Depot) or supermarkets. As we continue to expand our store base, we believe that small- to medium-sized markets offer a significant opportunity. In these markets, we believe our store size, which is smaller than many of our national competitors but larger than many independent retailers, enables us to find convenient, easily accessible store locations while still offering the broad and deep selection of merchandise that our customers desire. In addition, our store format and size allow us to open multiple stores in local areas within major MSAs, which gives our customers convenient, easy access to our products without having to travel long distances.
Members of our real estate team spend considerable time evaluating prospective sites before bringing a proposal to our real estate committee. Our real estate committee, which is comprised of senior management including our Chief Executive Officer, Chief Financial Officer and Senior Vice President of Stores, approves all prospective locations before a lease is signed.
We believe there is a significant opportunity to expand our store base in the United States. Based on research conducted for us by Buxton Company, we believe that we can grow our store base from 56 locations to more than 300 locations in the United States.
We opened eight new stores in fiscal year 2014. We have opened one new store to date in fiscal year 2015 and currently plan to open an additional eight new stores in the remainder of fiscal year 2015. For the next several years thereafter, we intend to grow our store base at a rate of greater than 10 percent annually. Our new store openings are planned in existing, adjacent and new markets.
Our new store growth plan is supported by our target new unit economics, which we believe to be compelling. A typical store location ranges in size from 30,000 to 50,000 gross square feet. Our net investment to open a new store is approximately $2.0 million, consisting of pre-opening expenses and capital investments, net of tenant allowances. In addition, we stock each new store with initial inventory at an average cost of approximately $2.4 million. For the first twelve month period after opening a new store, we target net sales of $8.0 million to $11.0 million, a four-wall Adjusted EBITDA margin of more than 10% and a pre-tax return on invested capital of over 50% excluding initial inventory cost (or over 20% including initial inventory cost). Our new stores typically reach a mature sales growth rate within three to four years after opening, with net sales increasing approximately 25% in the aggregate during this time period. For the 12 stores opened since 2010 that have been open for a full twelve months, we achieved an average four-wall Adjusted EBITDA margin of 14.3% and an average ROIC of 121.6% excluding initial inventory cost (and 38.7% including initial inventory cost) during the first twelve months of operations. In addition, we achieved an average pre-tax payback period of less than one year (excluding initial inventory cost) and expect to achieve an average pre-tax payback period of approximately 2.5 years (including initial inventory cost).
E-Commerce Platform and Digital Strategy
We believe our website is an extension of our brand and our retail stores. Our website, www.sportsmanswarehouse.com, serves as both a sales channel and a platform for marketing and product education, and allows us to engage more fully with the local outdoor community. Our website features a similar merchandise assortment as offered in our stores as well as certain products found exclusively online. Regulatory restrictions create certain structural barriers to the online sale of approximately 30% of our revenue, such as ammunition, certain cutlery, firearms, propane and reloading powder. As a result, this portion of our business is currently more protected from online-only retailers, such as Amazon.
We also provide our online customers with convenient multi-channel services. To ensure that our customers have access to our entire assortment of products available on the e-commerce website, our retail stores feature kiosks that allow customers to place orders for items that are available only on our website or that are out of stock or not regularly stocked. We view our kiosk offering as an important complement to our larger format stores, as well as a key differentiator and extension of our smaller format stores. Our in-store pickup offering allows customers to order products through our e-commerce website and pick up the products in our retail stores without incurring shipping costs. We believe our ship-to-store functionality is a valuable service offering to customers, as well as a means to generate additional foot traffic to our retail stores.
8
Our website also features an online version of our Braggin’ Board, which complements our retail store Braggin’ Board forum. In addition, our website features local area content, including fishing reports and event schedules, as well as online educational resources, including tips, advice and links to video demonstrations on our dedicated YouTube channel. In fiscal year 2014, we launched enhanced department and product pages, detailed buyer’s guides, and additional instructional product videos. We recently began to roll out our social media strategy through our Facebook page and Instagram feed. These platforms allow us to reach our customers more directly with targeted postings of advertisements and in-store events. We believe our online educational resources and community outreach drive traffic to our website and retail stores, while improving user engagement as shoppers move from single-purchase users to loyal customers.
Up until mid-2014, we provided online customer service support through a third-party service provider, but began providing this service in-house beginning in mid-2014. We fulfill all orders in-house through our distribution center. During fiscal year 2014, our e-commerce platform generated total sales of $7.5 million, or 1.1% of our total sales. Over the same period, our website received approximately 13 million visits, which we believe demonstrates our position as a leading resource for outdoor products and product education.
Our Products and Services
Merchandise Strategy
We offer a broad range of products at a variety of price points and carry a deep selection of branded merchandise from well-known manufacturers, such as Browning, Carhartt, Coleman, Columbia Sportswear, Federal Premium Ammunition, Honda, Johnson Outdoors, Remington, Shakespeare, Shimano, Smith & Wesson and Under Armour. To reinforce our convenient shopping experience, we offer our products at competitive, everyday low prices. We believe our competitive pricing strategy supports our strong value proposition, instills price confidence in both our customers and our sales associates and is a critical element of our competitive position.
We believe we offer a wider selection of hard goods than many of our principal competitors. We employ a “good, better, and best” merchandise strategy, with an emphasis on “better” products that meet the needs of customers of all experience levels. We strive to keep our merchandise mix fresh and exciting by continuously searching for new, innovative products and introducing them to our customers. Our hunting and shooting department, which is strategically located at the back of the store, is a key driver of store traffic and one of the reasons for our high frequency of customer visits. We carry a large array of consumable goods, which includes ammunition, bait, cleaning supplies, food, lures, propane and reloading supplies. During fiscal year 2014, sales of consumable goods accounted for approximately 35.0% of our unit sales and 20.0% of our dollar sales. We believe the sale of consumables and replenishment items drives repeat traffic, with approximately 66% of our customers visiting our stores seven or more times per year (according to our internal surveys). During such visits, our customers frequently browse and purchase other items, including additional gear and accessories.
We also carry a variety of private label offerings under the Rustic RidgeTM, Killik, Vital Impact, Yukon Gold, Lost River and Sportsman’s Warehouse brands. These products are designed and priced to complement our branded assortment, by offering our customers a quality alternative at all price points. We believe the clothing, footwear and camping categories present a compelling near-term opportunity to expand our private label offering. In order to address these segments, we recently introduced our proprietary Rustic RidgeTM and Killik clothing lines. During fiscal year 2014, private label offerings accounted for less than 3.0% of our total sales, compared to more than 20% for many of our sporting goods retail peers. We believe our private label products are an important opportunity to drive sales and increase margins alongside our branded merchandise.
In addition to outfitting our customers with the correct gear, we provide our customers with various in-store, value-added, technical support services. All of our stores offer full-service archery technician services, fishing-reel line winding, gun bore sighting and scope mounting, among other services. We also help first-time participants enjoy the outdoors responsibly by issuing hunting and fishing licenses. We believe the support services provided by our highly trained staff technicians differentiate us from our competitors and drive customer loyalty and repeat traffic to our stores.
9
Products
Our stores are organized into six departments. The table below summarizes the key product lines and brands by department:
|
Department |
|
Product Offerings |
|
Camping |
|
Backpacks, camp essentials, canoes and kayaks, coolers, outdoor cooking equipment, sleeping bags, tents and tools |
|
Clothing |
|
Camouflage, jackets, hats, outerwear, sportswear, technical gear and work wear |
|
Fishing |
|
Bait, electronics, fishing rods, flotation items, fly fishing, lines, lures, reels, tackle and small boats |
|
Footwear |
|
Hiking boots, socks, sport sandals, technical footwear, trail shoes, casual shoes, waders and work boots |
|
Hunting and Shooting |
|
Ammunition, archery items, ATV accessories, blinds and tree stands, decoys, firearms, reloading equipment and shooting gear |
|
Optics, Electronics and Accessories |
|
Gift items, GPS devices, knives, lighting, optics (e.g., binoculars) and two-way radios |
Each department has buying and planning teams that are responsible for monitoring product availability from vendors and sales volume within the department and across all stores. We actively monitor the profitability of each product category within each department and adjust our assortment and selling space accordingly. This flexibility enables us to provide customers with more preferred product choices and to enhance the profit potential of each store.
Hunting and shooting has historically been the largest contributor to our sales. Hunting and shooting department products are generally sold at significantly higher price points than other merchandise but often have lower margins. Camping is our second largest department, and family-oriented camping equipment in particular continues to be a high growth product category. Our clothing sales have grown as we have introduced new brands and styles, including our selections for women and children. We view clothing sales as an important opportunity, given this department’s high gross margins and appeal to a broad, growing demographic.
The following table shows our sales during the past three fiscal years presented by department:
|
|
|
Fiscal Year Ended |
|
|||||||||
|
|
|
January 31, |
|
|
February 1, |
|
|
February 2, |
|
|||
|
Department |
|
2015 |
|
|
2014 |
|
|
2013 |
|
|||
|
Camping |
|
|
13.5 |
% |
|
|
12.1 |
% |
|
|
12.0 |
% |
|
Clothing |
|
|
9.5 |
|
|
|
8.8 |
|
|
|
7.6 |
|
|
Fishing |
|
|
9.5 |
|
|
|
8.8 |
|
|
|
8.2 |
|
|
Footwear |
|
|
7.4 |
|
|
|
6.6 |
|
|
|
5.8 |
|
|
Hunting and Shooting |
|
|
47.9 |
|
|
|
52.1 |
|
|
|
55.7 |
|
|
Optics, Electronics and Accessories |
|
|
9.5 |
|
|
|
9.1 |
|
|
|
8.5 |
|
|
Other |
|
|
2.7 |
|
|
|
2.5 |
|
|
|
2.2 |
|
|
Total |
|
|
100.0 |
% |
|
|
100.0 |
% |
|
|
100.0 |
% |
Camping. Camping represented approximately 13.5%% of our net sales during fiscal year 2014. Our camping assortment addresses both the technical requirements of the heavy-use camper, including for long-duration or deep-woods excursions, as well as the needs of the casual camper. We offer a broad selection of tents and shelters for both multi-day “base camp” use and weekend outings, sleeping bags for the most extreme conditions as well as the summer overnight trip, backpacks and backpacking gear, including camouflaged styles for hunting, generators for home and camp use, a full assortment of easy-to-carry tools, cooking and food preparation equipment, including stoves and extended-use coolers, as well as dehydrated foods. Our camping department also includes canoes, kayaks and a selection of recreational family camping equipment, including basic automotive accessories, camp chairs and canopies. Our camping department includes brands such as Camp Chef, Coleman, Honda, Johnson Outdoors and Teton Sports.
Clothing. Clothing represented approximately 9.5% of our net sales during fiscal year 2014 and includes camouflage, outerwear, sportswear, technical gear, workwear, jackets and hats. We primarily offer well-known brands in our clothing department, such as Carhartt, Columbia Sportswear and Under Armour. We also intend to grow our proprietary clothing line, Rustic RidgeTM and Killik. Our clothing selection offers technical performance capabilities for a variety of hunting activities, including upland game, waterfowl, archery, big game hunting, turkey hunting and shooting sports. Performance attributes include waterproofing, temperature control, scent control features and visual capabilities, such as blaze orange and camouflage in a wide range of patterns. Outerwear, particularly performance rainwear, is an important product category for customers who are fishing, hiking, hunting or marine enthusiasts. We furthermore complement our technical clothing with an assortment of casual clothing that fits our customers’
10
lifestyles, including a variety of branded graphic t-shirts, private label motto t-shirts and. Our clothing department includes brands such as Browning, Carhartt, Columbia, King’s Camo, Sitka and Under Amour.
Fishing . Fishing represented approximately 9.5% of our net sales during fiscal year 2014 and includes products for fresh-water fishing, salt-water fishing, fly-fishing, ice-fishing and boating. Our broad assortment appeals to the beginning and weekend angler, as well as avid and tournament anglers. In addition to lures, rods and reels, our fishing assortment features a wide selection of products in the tackle supplies, electronics, fly-fishing, ice-fishing and marine accessories sub-categories. We also provide fishing-reel line winding services in all of our stores and live bait in most of our stores. We offer products for boat care and maintenance, as well as safety equipment and aquatic products such as float tubes and pontoons. All of our stores also sell fishing licenses. Our fishing department includes brands such as Plano Molding, Pure Fishing, Rapala, Rivers Wild Flies, Sages and Shimano.
Footwear . Footwear represented approximately 7.4% of our net sales during fiscal year 2014 and includes work boots, technical footwear, hiking boots, trail shoes, socks, sport sandals and waders. As with clothing, our footwear selection offers a variety of technical performance capabilities, such as different levels of support and types of tread, waterproofing, temperature control and visual attributes. Our footwear department includes brands such as Danner, Keen, Red Wing, Simms, SmartWool and Wolverine World Wide.
Hunting and Shooting. Hunting and shooting is our largest merchandise department, representing approximately 47.9% of our net sales during fiscal year 2014. Products such as ammunition, cleaning supplies, firearms and reloading selections are typically key drivers of traffic in our stores. Our hunting and shooting merchandise assortment provides equipment, accessories and consumable supplies for virtually every type of hunting and sport shooting. A backroom shop staffed with technicians allows us to support our hunting assortments for the benefit of the hunter.
Our merchandise selection includes a wide variety of firearms designed for hunting, shooting sports and home and personal defense, including air guns, black powder muzzle loaders, handguns, rifles and shotguns. We carry a wide selection of ammunition, archery equipment, dog training products, hunting equipment, reloading equipment and shooting accessories. Our hunting and shooting department includes brands such as Ammunition Accessories, Browning, Federal Premium Ammunition, Remington, Smith & Wesson and Winchester.
Optics, Electronics and Accessories. Our optics, electronics and accessories department represented approximately 9.5% of our net sales during fiscal year 2014. This department supplements our other equipment departments with complementary products, such as optics (including binoculars, spotting scopes and rangefinders), GPS devices and other navigation gear, GoPro video cameras, two-way radios, specialized and basic cutlery and tools, including hunting and other knives, lighting, bear spray and other accessories. Our optics, electronics and accessories department includes brands such as Garmin, Leupold & Stevens, Nikon, Swarovski Optik and Vortex Optics.
Other. Our other department represented approximately 2.7% of our net sales during fiscal year 2014 and includes hunting and fishing licenses, background checks and miscellaneous services.
Loyalty Programs
We launched a loyalty program in the fall of 2013, through which our consumers are able to earn “points” towards Sportsman’s Warehouse gift cards on most of their purchases. The program is free to join and accepted through all channels for both purchases and the use of redemption cards. As of January 31, 2015, we had approximately 475,000 participants in our loyalty program.
Customers may obtain a loyalty program card when making a purchase in-store or online. After obtaining a card, the customer must register on our website in order to redeem loyalty rewards. Customers earn one point for each dollar spent, with the exception of certain items, such as gift cards and fish and game licenses. For every 100 points accumulated, the customer is entitled to a $1.00 gift credit, which may be redeemed by logging into our website to request a redemption card for any whole dollar amount (subject to the customer’s available point balance). The redemption card is then mailed to the customer and operates as a gift card to be used for both in-store and online purchasing.
In addition, we began issuing the multi-use Sportsman’s Warehouse Rewards VISA Platinum credit card in 2006 through US Bank. US Bank extends credit directly to cardholders and provides all servicing for the credit card accounts, funds the rewards and bears all credit and fraud losses. This card allows customers to earn points whenever and wherever they use their card. Customers may redeem earned points for products and services just as they would redeem loyalty card points. The rewards points never expire as long as the account is in good standing.
11
Sourcing and Distribution
Sourcing
We maintain central purchasing, replenishment and distribution functions to manage inventory planning, allocate merchandise to stores and oversee the replenishment of basic merchandise to the distribution center. We have no long-term purchase commitments. During fiscal year 2014, we purchased merchandise from approximately 1,500 vendors with no vendor accounting for more than approximately 8% of total merchandise purchased. We have established long-standing, continuous relationships with our largest vendors.
Our sourcing organization is currently managed by our merchant team in our corporate headquarters. We also have field merchants that coordinate certain merchandising functions at the store level to provide a more localized merchandising model. To ensure that our product offerings are tailored to local market conditions and demand, our merchant teams regularly meet one-on-one with our vendors, and attend trade shows, review trade periodicals and evaluate merchandise offered by other retail and online merchants. We also frequently gather feedback and new product reviews from our store management and employees, as well as from reviews submitted by our customers. We believe this feedback is valuable to our vendor-partners and improves our access to new models and technologies.
Distribution and Fulfillment
We distribute all of our merchandise from our efficient 507,000 square foot distribution center in Salt Lake City, Utah. We opened this facility in July 2013, more than doubling the available space from our prior facility, in order to accommodate our growing store base and e-commerce platform. The distribution center supports replenishment for all 56 stores and manages the fulfillment of direct-to-consumer e-commerce orders. We use common carriers for replenishment of our retail stores. We ship merchandise to our e-commerce customers via courier service. An experienced distribution management team leads a staff of 260 distribution center employees at peak inventory levels heading into the fourth quarter.
The distribution center has scalable systems and processes that we believe can accommodate continued new store growth to exceed 100 stores. We use the HighJump warehouse management system to manage all activities. The system is highly adaptable and can be easily changed to accommodate new business requirements. For example, in 2010, we implemented a new picking process that allows e-commerce orders to be released without impacting the existing replenishment operations of the distribution center. Additionally, we have developed customized order packing and shipping processes to handle the specific requirements of the e-commerce business. We have the capability to both case pick and item pick, which is designed to ensure that our stores have sufficient quantities of product while also allowing us to maintain in inventory slow moving but necessary items. This balance allows us to stock the right products at the necessary locations, all at the right time and in the correct quantity.
Marketing and Advertising
We believe, based on internal surveys, that the majority of our customers are male, between the ages of 35 and 65, and have an annual household income between $40,000 and $100,000. We also actively market to women and children and have expanded our product offerings of women’s and children’s outerwear, clothing and footwear to address rising participation rates in hunting and shooting sports, as well as overall outdoor activity.
Our primary marketing efforts are focused on driving additional consumers to the stores and increasing the frequency and profitability of visits by customers of all types. We employ a two-pronged marketing approach:
|
· |
regional advertising programs; and |
|
· |
local grass roots efforts to build brand awareness and customer loyalty. |
Our regional advertising programs emphasize seasonal requirements for hunting, fishing and camping in our various store geographies. Our advertising medium is typically newspaper inserts (primarily multi-page color inserts during key shopping periods such as the Christmas season and Father’s Day), supplemented with modest amounts of direct mail, seasonal use of local and national television ads and a variety of out-of-home media buys. We proactively modify the timing and content of our message to match local and regional preferences, changing seasons, weather patterns and topography of a given region. In addition, the use of co-op funding with select vendors to supplement our out-of-pocket media expenses allows us to improve brand exposure through various advertising vehicles, while partnering with national brands in relevant media channels. This program also reinforces the general consumer’s impression of Sportsman’s Warehouse as a preferred retailer for those brands. Finally, we sponsor regional and national television programming, including sponsoring the Alaska Outdoor, Angler’s Channel, Fishful Thinking, Hooked on Utah and RAM Outdoors. Our total media expenses for fiscal year 2014 were approximately $7.4 million, excluding co-op reimbursement of $1.8 million.
12
The second prong of our marketing effort is the time and resources devoted to fostering grass roots relationships in the local community. Each Sportsman’s Warehouse store employs a variety of outreach tools to build local awareness. One key component to a successful store is hosting events throughout the year, targeting a variety of end user customer profiles (such as hunters, campers, anglers, women and children). In total, our store base hosts or facilitates approximately 3,000 in-store and offsite seminars and events per year, such as “ladies night,” Eastman’s Deer Tour, Waterfowl Weekend, Elk Calling contest and Bucks & Bulls. We are also active in supporting a variety of conservation groups, such as Ducks Unlimited, Rocky Mountain Elk Foundation, Mule Deer Foundation and the National Wild Turkey Federation, both at the corporate level and through store employee local memberships and participation. Company representatives attend more than 500 events annually in the aggregate, both to provide support for these organizations and to solidify ties between their members and the Sportsman’s brand. Furthermore, we believe that the Sportsman’s News newspaper, offered in-store only, provides a unique point of contact with our customers by offering outdoor stories, product reviews, how-to articles and new product introductions to keep all of our customers up to date on the latest trends and technology. Finally, such grass roots campaigns enable us to reduce our initial marketing spend in connection with new store openings. We believe that these initiatives are highly cost-effective tools to create brand awareness and engender a loyal community of local customers, as well as a key differentiator versus other national retailers.
Hiring, Training and Motivating our Employees
We believe that the recruitment, training and knowledge of our employees and the consistency and quality of the service they deliver are central to our success. We emphasize deep product knowledge for store managers and sales associates at both the hiring and training stages. We hire most of our sales associates for a specific department or product category. As part of the interview process, we test each prospective employee for knowledge specific to the department or category in which he or she is applying to work. All of our managers and sales associates undergo focused sales training, consisting of both sales techniques and specialized product instruction, both immediately upon hiring (approximately 20 hours) and continuing throughout their career (approximately 16 hours annually). In addition, our sales associates receive loss prevention instruction and departmental training upon hiring. For example, in our hunting department, all employees receive an additional nine hours of training on ATF and company policies initially upon hire, with continuing education throughout the year. Our store managers complete two to six months of on-the-job training at another store with an existing district manager, as part of which they receive approximately 80 hours of dedicated managerial training and instruction. Our department heads receive extensive online training as well as on-site instruction, totaling approximately 40 hours. As a result of these programs, our employees are highly trained to provide friendly and non-intimidating education, guidance and support to address our customers’ needs.
Our employees are often outdoor enthusiasts themselves, participating in outdoor activities alongside our customers in the local community. Our employees spend approximately 14% of their gross wages in-store, underscoring their passion for both our company and the outdoor lifestyle. We believe this high level of participation and employee store patronage is unique among our competitors in this industry and enhances our differentiated shopping experience.
One of our unique assets is a specially designed training room (our “blue room”) located at our headquarters. Our blue room is used frequently for firm-wide training programs and by vendors to stage training demonstrations for new products. Blue room sessions are broadcast real-time in high definition to each store location and are recorded for future viewing. Vendor training is especially interactive, permitting vendor representatives to present a uniform message simultaneously to all employees, while allowing managers and sales staff in individual stores to ask questions of the vendors and provide real-time feedback on products. This system decreases the vendor’s promotion and education costs and provides more meaningful training to our employees. Blue room training sessions are particularly important for technical products, especially those with numerous features and a high unit price, because they enable our sales associates to better educate customers and provide additional assurance that a given product fits the customer’s needs. Given its utility as a cost-effective sales tool, our blue room is reserved well in advance by vendors. Our training program has been a critical factor in increasing conversion, which has led to average ticket growth of approximately 5% since the end of fiscal year 2010.
Information Technology
Business critical information technology, or IT, systems include our supply chain systems, merchandise system, point-of-sale (POS) system, warehouse management system, e-commerce system, loss prevention system and financial and payroll systems. Our IT infrastructure is robustly designed to be able to access real-time data from any store or channel. The network infrastructure allows us to quickly and cost effectively add new stores to the wide area network, or WAN. The private WAN is built on a CenturyLink (formerly Qwest) backbone with all of its resources and support. Additionally, we have implemented a redundant wireless WAN on Verizon’s infrastructure. Each Sportsman’s location is equipped with a backup power generator. All key systems will continue to run in the event of a power or network outage. All data is backed up daily from one storage array to another storage array.
13
We have implemented what we believe to be best-of-class software for all of our major business critical systems. Key operating systems include Oracle Applications for ERP, Oracle ATG for our e-commerce channel, Tomax’s Retail.net and JPOS for in-store functionality and HighJump for WMS. Our physical infrastructure is also built on products from best-in-class vendors Cisco, Dell, Oracle Sun and VMWare. Originally designed with the goal of being able to run a significantly larger retail business, our IT systems are scalable to support our growth.
Each retail store and the distribution center has a security room and loss prevention employees who monitor an average of 64 cameras (160 at the distribution center) that are connected to digital video recorders (DVR) that record at least 30 days of video. Cameras are monitored locally during store hours. In addition, all cameras are monitored centrally at our headquarters in our dedicated surveillance room, which has capacity to monitor over 120 stores. This room is staffed continuously and provides off-hours monitoring and backup for all stores. Digital recorded video can be searched by pixel movement, which can quickly identify any loss prevention issue. Our sophisticated systems are a key factor in our shrink rates of less than 1% and an important component of our comprehensive compliance program.
We furthermore have incorporated enhanced reporting tools that have allowed for more comprehensive monitoring of business performance, which has been critical to management’s ability to drive strong store level performance. Management has access to a reporting dashboard that shows key performance indicators, or KPIs, on a company, store, department and category level. KPIs include sales, margin, budget, conversions, payroll, shrinkage and average order value all on a daily, weekly, monthly and yearly basis. All KPIs are compared to comparable prior year periods. District, store and department managers have access to the data relevant to their area of responsibility. Real-time, up to the second, sales data is available on demand. The system allows for custom-created reports as required.
Intellectual Property
Sportsman’s Warehouse® and Sportsman’s Warehouse America’s Premier Outfitter® are among our service marks or trademarks registered with the United States Patent and Trademark Office. We also have several pending applications for trademarks, including Rustic RidgeTM, Killik, and Vital Impact. In addition, we own several other registered and unregistered trademarks and service marks involving advertising slogans and other names and phrases used in our business. We also own numerous domain names, including www.sportsmanswarehouse.com, among others. The information on, or that can be accessed through, our websites is not a part of this filing.
We believe that our trademarks are valid and valuable and intend to maintain our trademarks and any related registrations. We do not know of any material pending claims of infringement or other challenges to our right to use our marks in the United States or elsewhere. We have no franchises or other concessions that are material to our operations.
Our Market and Competition
Our Market
We compete in the large, growing and fragmented outdoor activities and sporting goods market, which we believe is currently underserved by full-line multi-activity retailers. We believe, based on reports by the NSGA and other industry sources, that U.S. outdoor activities and sporting goods retail sales totaled over $50 billion in 2013. The U.S. outdoor activities and sporting goods sector is comprised of three primary categories—equipment, clothing and footwear—with each category containing distinct product sets to support a variety of activities, including hunting, fishing, camping and shooting, as well as other sporting goods activities.
We believe growth in the U.S. outdoor activities and sporting goods market is driven by several key trends, including: an expanding demographic focused on healthy and active lifestyles; successful new product introductions centered around enhancing performance and enjoyment while participating in sporting and outdoor activities; and the resilience of consumer demand for purchases in these categories versus other discretionary categories. We believe these factors will continue to foster growth in the outdoor activities and sporting goods market in the future.
Within the retail sporting goods sector, we operate primarily in the outdoor equipment, clothing and footwear segment, which includes hunting and shooting, fishing, camping and boating. This segment is growing at a faster rate than the sporting goods industry at large. The 2011 U.S. Fish and Wildlife national survey, published once every five years, found that hunting and shooting and fishing participation increased 9% and 11%, respectively, for Americans aged 16 and older from 2006 to 2011. This survey also found that fishing participation among women increased by 17% over the same time period. Furthermore, we believe that specialty retailers have generated additional sales volume by expanding their presence, especially in smaller communities, which has increased customers’ access to products that formerly were less available. The nature of the outdoor activities to which we cater requires recurring purchases throughout the year, resulting in high rates of conversion among customers. For example, active anglers typically purchase various fishing tackle throughout the year based on seasons and changing conditions. Hunting with firearms typically is
14
accompanied by recurring purchases of ammunition and cleaning supplies throughout the year and multiple firearm styles for different hunted game.
Competition
We believe that the principal competitive factors in our industry are breadth and depth of product selection, including locally relevant offerings, value pricing, convenient locations, technical services and customer service. A few of our competitors have a larger number of stores, and some of them have a greater market presence, name recognition and financial, distribution, marketing and other resources than we have. We believe that we compete effectively with our competitors with our distinctive branded selection and superior customer service, as well as our commitment to understanding and providing merchandise that is relevant to our targeted customer base. We cater to the outdoor enthusiast and believe that we have both an in-depth knowledge of the technical outdoor customer and a “grab and go” store environment that is uniquely conducive to their need for value and convenience. We believe that our flexible box size, combined with our low-cost, high-service model, also allows us to enter into and serve smaller markets that our larger competitors cannot penetrate as effectively. Finally, certain barriers, including legal restrictions, exist on the sale of our product offerings that comprise approximately 30% of our revenue, such as ammunition, certain cutlery, firearms, propane and reloading powder, create a structural barrier to competition from many online retailers, such as Amazon.
Our principal competitors include the following:
|
· |
independent, local specialty stores, often referred to as “mom & pops”; |
|
· |
other specialty retailers that compete with us across a significant portion of our merchandising categories through retail store, catalog or e-commerce businesses, such as Bass Pro Shops, Cabela’s and Gander Mountain; |
|
· |
large-format sporting goods stores and chains, such as Academy Sports + Outdoors and Dick’s Sporting Goods; and |
|
· |
mass merchandisers, warehouse clubs, discount stores, department stores and online retailers, such as Amazon, Target and Wal-Mart. |
Independent, Local Specialty Stores. These stores generally range in size from approximately 2,000 to 10,000 square feet, and typically focus on one or two specific product categories, such as hunting, fishing or camping, and usually lack a broad selection of product.
Other Specialty Retailers. Some of the other specialty retailers that compete with us across a significant portion of our merchandising categories are large-format retailers that generally range in size from 40,000 to 250,000 square feet. These retailers seek to offer a broad selection of merchandise focused on hunting, fishing, camping and other outdoor product categories. Some of these stores combine the characteristics of an outdoor retailer with outdoor entertainment and theme attractions. We believe that the number of these stores that can be supported in any single market area is limited because of their large size and significant per-store cost.
Other specialty retailers are smaller chains that typically focus on offering a broad selection of merchandise in one or more of the following product categories—hunting, fishing, camping or other outdoor product categories. We believe that these other outdoor-focused chains generally do not offer a similar depth and breadth of merchandise or specialized services in all of our product categories.
Large-Format Sporting Goods Stores And Chains. These stores generally range from 20,000 to 80,000 square feet and offer a broad selection of sporting goods merchandise covering a variety of sporting goods categories, including baseball, basketball, football and home gyms, as well as hunting, fishing and camping. However, we believe that the amount of space at these stores devoted to our outdoor product categories limits the extent of their offerings in these areas.
Mass Merchandisers, Warehouse Clubs, Discount Stores, Department Stores and Online Retailers. With respect to retailers in this category with physical stores, these stores generally range in size from approximately 50,000 to over 200,000 square feet and are primarily located in shopping centers, free-standing sites or regional malls. Hunting, fishing and camping merchandise and clothing represent a small portion of the stores’ assortment, and of their total sales. We believe that less than 10% of our product offering, and less than 5% of our hunting and shooting product offering, overlap with these stores.
Over the past decade, specialty retailers, such as us, have gained market share of equipment sales at the expense of mass merchants, discount stores and independent retailers, or “mom & pop” shops, which we believe comprise approximately 65% of the market. In addition, while there are over 55,000 federal firearms licenses, or FFLs, in the United States today, only 4,000 are currently held by national or regional specialty stores. Since FFLs are issued at the store level, these statistics imply that the remaining 93% of the market is fragmented among mom & pop stores. We believe this fragmentation within the total addressable market presents an
15
attractive opportunity for us to continue to expand our market share, as customers increasingly prefer a broad and appealing selection of merchandise, competitive prices, high levels of service and one-stop shopping convenience.
Seasonality
We experience moderate seasonal fluctuations in our net sales and operating results as a result of holiday spending and the opening of hunting seasons. While our sales are more level throughout the year than many retailers, our sales are still traditionally somewhat higher in the third and fourth quarters than in the other quarterly periods. On average over the last three fiscal years, we have generated 26.6% and 30.1% of our net sales in the third and fourth fiscal quarters, respectively, which includes the holiday selling season as well as the opening of the fall hunting season. However, Spring hunting, Father’s Day and the availability of hunting and fishing throughout the year in many of our markets counterbalance this seasonality to a certain degree.
Regulation and Compliance
Regulation and Legislation
We operate in highly regulated industries. There are a number of federal, state and local laws and regulations that affect our business. In every state in which we operate, we must obtain various licenses or permits in order to operate our business.
Because we sell firearms at all of our retail stores, we are subject to regulation by the Bureau of Alcohol, Tobacco, Firearms and Explosives, or the “ATF”. Each store has a federal firearms license permitting the sale of firearms, and our distribution center has obtained a federal firearms license to store and distribute firearms. Certain states require a state license to sell firearms, and we have obtained these licenses for the states in which we operate that have such a requirement.
We must comply with federal, state and local laws and regulations, including the National Firearms Act of 1934, or NFA, the Gun Control Act of 1968, or GCA, the Arms Export Control Act of 1976 and Internal Revenue Code provisions applicable to the Firearms and Ammunition Excise Tax, all of which have been amended from time to time. The NFA and the GCA require our business to, among other things, maintain federal firearms licenses for our locations and perform a pre-transfer background check in connection with all firearms purchases. We perform this background check using either the FBI-managed National Instant Criminal Background Check System, or NICS, or a comparable state government-managed system that relies on NICS and any additional information collected by the state, a state point of contact, or POC. These background check systems either confirm that a transfer can be made, deny the transfer or require that the transfer be delayed for further review, and provide us with a transaction number for the proposed transfer. We are required to record the transaction number on an ATF Form 4473 and retain this form in our records for auditing purposes for 20 years for each approved transfer and five years for each denied or delayed transaction.
The federal categories of prohibited purchasers are the prevailing minimum for all states. States (and, in some cases, local governments) on occasion enact laws that further restrict permissible purchasers of firearms. We are also subject to numerous other federal, state and local laws and regulations regarding firearm sale procedures, record keeping, inspection and reporting, including adhering to minimum age restrictions regarding the purchase or possession of firearms or ammunition, residency requirements, applicable waiting periods, importation regulations and regulations pertaining to the shipment and transportation of firearms.
Over the past several years, bills have been introduced in the United States Congress that would restrict or prohibit the manufacture, transfer, importation or sale of certain calibers of handgun ammunition, impose a tax and import controls on bullets designed to penetrate bullet-proof vests, impose a special occupational tax and registration requirements on manufacturers of handgun ammunition and increase the tax on handgun ammunition in certain calibers. Recently, Congress has debated certain gun control measures that are supported by the current administration.
In September 2004, Congress declined to renew the Assault Weapons Ban of 1994, or AWB, which prohibited the manufacture of certain firearms defined as “assault weapons”; restricted the sale or possession of “assault weapons,” except those that were manufactured prior to the law’s enactment; and placed restrictions on the sale of new high capacity ammunition feeding devices. Various states and local jurisdictions, including Colorado and California (states in which we operate stores), have adopted their own versions of the AWB or high capacity ammunition feeding device restrictions, some of which restrictions apply to the products we sell in other states. If a statute similar to the AWB were to be enacted or re-enacted at the federal level, it would impact our ability to sell certain products. Additionally, state and local governments have proposed laws and regulations that, if enacted, would place additional restrictions on the manufacture, transfer, sale, purchase, possession and use of firearms, ammunition and shooting-related products. For example, several states, such as Colorado, Connecticut, Maryland, New Jersey, New York, and Washington have enacted laws and regulations that are more restrictive than federal laws and regulations that limit access to and sale of certain firearms. For example, Connecticut and New York impose mandatory screening of ammunition purchases; California and the District of Columbia have requirements for microstamping (that is, engraving the handgun’s serial number on each cartridge) of new handguns; and some
16
states prohibit the sale of guns without internal or external locking mechanisms. Other state or local governmental entities may also explore similar legislative or regulatory initiatives that may further restrict the manufacture, sale, purchase, possession or use of firearms, ammunition and shooting-related products.
The Protection of Lawful Commerce in Arms Act, or PLCAA, which became effective in October 2005, prohibits civil liability actions from being brought or continued in any federal or state court against federally licensed manufacturers, distributors, dealers or importers of firearms or ammunition for damages, punitive damages, injunctive or declaratory relief, abatement, restitution, fines, penalties or other relief resulting from the criminal or unlawful misuse of a qualified product by third parties. The legislation does not preclude traditional product liability actions.
We are also subject to a variety of federal, state and local laws and regulations relating to, among other things, protection of the environment, human health and safety, advertising, pricing, weights and measures, product safety, and other matters. Some of these laws affect or restrict the manner in which we can sell certain items, such as handguns, smokeless powder, black powder substitutes, ammunition, bows, knives and other products. State and local laws and regulations governing hunting, fishing, boating, ATVs and other outdoor activities and equipment can also affect our business. We believe that we are in substantial compliance with the terms of such laws and that we have no liabilities under such laws that we expect could have a material adverse effect on our business, results of operations or financial condition.
In addition, many of our imported products are subject to existing or potential duties, tariffs or quotas that may limit the quantity of products that we may import into the United States and other countries or impact the cost of such products. To date, quotas in the operation of our business have not restricted us, and customs duties have not comprised a material portion of the total cost of our products.
Our e-commerce business is subject to the Mail or Telephone Order Merchandise Rule and related regulations promulgated by the FTC which affect our catalog mail order operations. FTC regulations, in general, govern the solicitation of orders, the information provided to prospective customers, and the timeliness of shipments and refunds. In addition, the FTC has established guidelines for advertising and labeling many of the products we sell.
Compliance
We are routinely inspected by the ATF and various state agencies to ensure compliance with federal and local regulations. While we view such inspections as a starting point, we employ more thorough internal compliance inspections to help ensure we are in compliance with all applicable laws. Our compliance department conducts at least one on-site inspection of each store location annually. With the IT infrastructure systems we have in place, recall inspections can be done remotely.
We dedicate significant resources to ensure compliance with applicable federal, state and local regulations. Since we began operations in 1986, none of our federal firearm licenses have been revoked, and none of our ATF compliance inspections have resulted in a major violation.
We are also subject to a variety of state laws and regulations relating to, among other things, advertising and product restrictions. Some of these laws prohibit or limit the sale, in certain states and locations, of certain items, such as black powder firearms, ammunition, bows, knives, and similar products. Our compliance department administers various restriction codes and other software tools to prevent the sale of such jurisdictionally restricted items.
We have particular expertise in the California market and have passed two California Department of Justice, or CA DOJ, firearm audits with zero violations. The CA DOJ communicates with us for policy discussion, recognizing the strength of our compliance infrastructure.
Employees
As of March 31, 2015 we had approximately 3,800 total employees. Of our total employees, approximately 200 were based at our corporate headquarters in Midvale, Utah, approximately 300 were located at our distribution center, and approximately 3,300 were store employees. We had approximately 2,100 full-time employees and approximately 1,700 part-time employees, who are primarily store employees. None of our employees are represented by a labor union or are party to a collective bargaining agreement, and we have had no labor-related work stoppages. Our relationship with our employees is one of the keys to our success, and we believe that relationship is good.
17
Available Information
Our Annual Report on Form 10-K, Quarterly Reports on Form 10-Q, Current Reports on Form 8-K and amendments to reports filed or furnished pursuant to Sections 13(a) and 15(d) of the Securities Exchange Act of 1934, as amended, or the Exchange Act are available on our web site at www.sportsmanswarehouse.com, free of charge, as soon as reasonably practicable after the electronic filing of these reports with, or furnishing of these reports to, the SEC. Any materials we file with the SEC are available at the SEC’s Public Reference Room at 100 F Street, NE, Washington, DC 20549. Additional information about the operation of the Public Reference Room can also be obtained by calling the SEC at 1-800-SEC-0330. In addition, the SEC maintains a web site at www.sec.gov that contains reports, proxy and information statements, and other information regarding issuers that file electronically with the SEC, including us.
Our business faces significant risks and uncertainties. Certain important factors may have a material adverse effect on our business prospects, financial condition and results of operations, and you should carefully consider them. Accordingly, in evaluating our business, we encourage you to consider the following discussion of risk factors, in its entirety, in addition to other information contained in or incorporated by reference into this 10-K and our other public filings with the SEC. Other events that we do not currently anticipate or that we currently deem immaterial may also affect our business, prospects, financial condition and results of operations.
Risks Related to Our Business
Our retail-based business model is impacted by general economic conditions in our markets, and ongoing economic and financial uncertainties may cause a decline in consumer spending that may adversely affect our business, operations, liquidity, financial results and stock price.
As a retail business that depends on consumer discretionary spending, we may be adversely affected if our customers reduce, delay or forego their purchases of our products as a result of continued job losses, bankruptcies, higher consumer debt and interest rates, higher energy and fuel costs, reduced access to credit, falling home prices, lower consumer confidence, uncertainty or changes in tax policies and tax rates and uncertainty due to potential national or international security concerns. Decreases in same store sales, customer traffic or average ticket sales negatively affect our financial performance, and a prolonged period of depressed consumer spending could have a material adverse effect on our business. Promotional activities and decreased demand for consumer products could affect profitability and margins. In addition, adverse economic conditions may result in an increase in our operating expenses due to, among other things, higher costs of labor, energy, equipment and facilities. Due to recent fluctuations in the U.S. economy, our sales, operating and financial results for a particular period are difficult to predict, making it difficult to forecast results to be expected in future periods. Any of the foregoing factors could have a material adverse effect on our business, results of operations and financial condition and could adversely affect our stock price.
Our concentration of stores in the Western United States makes us susceptible to adverse conditions in this region.
The majority of our stores are located in the Western United States, comprising Alaska, Arizona, California, Colorado, Idaho, Montana, Nevada, New Mexico, Oregon, Utah, Washington and Wyoming. As a result, our operations are more susceptible to regional factors than the operations of more geographically diversified competitors. These factors include regional economic and weather conditions, natural disasters, demographic and population changes and governmental regulations in the states in which we operate. Environmental changes and disease epidemics affecting fish or game populations in any concentrated region may also affect our sales. If a region with a concentration of our stores were to suffer an economic downturn or other adverse event, our operating results could suffer.
Competition in the outdoor activities and sporting goods market could reduce our net sales and profitability.
The outdoor activities and sporting goods market is highly fragmented and competitive. We compete directly or indirectly with the following types of companies:
|
· |
independent, local specialty stores, often referred to as “mom & pops”; |
|
· |
other specialty retailers that compete with us across a significant portion of our merchandising categories through retail store, catalog or e-commerce businesses, such as Bass Pro Shops, Cabela’s and Gander Mountain; |
18
|
· |
large-format sporting goods stores and chains, such as Academy Sports + Outdoors and Dick’s Sporting Goods; and |
|
· |
mass merchandisers, warehouse clubs, discount stores, department stores and online retailers, such as Amazon, Target and Wal-Mart. |
A few of our competitors have a larger number of stores, and some of them have a greater market presence, name recognition and financial, distribution, marketing and other resources than we have. In addition, if our competitors reduce their prices, we may have to reduce our prices in order to compete, which could harm our margins. Furthermore, some of our competitors may build new stores in or near our existing locations. As a result of this competition, we may need to spend more on advertising and promotion. Some of our mass merchandising competitors, such as Wal-Mart, do not currently compete in many of the product lines we offer. However, if these competitors were to begin offering a broader array of competing products, or if any of the other factors listed above occurred, our net sales could be reduced or our costs could be increased, resulting in reduced profitability.
If we fail to anticipate changes in consumer demands, including regional preferences, in a timely manner, our operating results could suffer.
Our products appeal to consumers who regularly hunt, camp, fish and participate in various shooting sports. The preferences of these consumers cannot be predicted with certainty and are subject to change. In addition, due to different game and fishing species and varied weather conditions found in different markets, it is critical that our stores stock products appropriate for their markets. Our success depends on our ability to identify product trends in a variety of markets as well as to anticipate, gauge and quickly react to changing consumer demands in these markets. We usually must order merchandise well in advance of the applicable selling season. The extended lead times for many of our purchases may make it difficult for us to respond rapidly to new or changing product trends or changes in prices. If we misjudge either the market for our products or our customers’ purchasing habits, our net sales may decline significantly and we may not have sufficient quantities of merchandise to satisfy customer demand or we may be required to mark down excess inventory, either of which would result in lower profit margins and harm our operating results.
Our expansion into new, unfamiliar markets presents increased risks that may prevent us from being profitable in these new markets.
We intend to expand by opening stores in new markets, which may include small- to medium-sized markets and which may not have existing national outdoor sports retailers. As a result, we may have less familiarity with local customer preferences and encounter difficulties in attracting customers due to a reduced level of customer familiarity with our brand. Other factors that may impact our ability to open stores in new markets and operate them profitably, many of which are beyond our control, include:
|
· |
our ability to identify suitable locations, including our ability to gather and assess demographic and marketing data to determine consumer demand for our products in the locations we select; |
|
· |
our ability to negotiate favorable lease agreements; |
|
· |
our ability to properly assess the profitability of potential new retail store locations; |
|
· |
our ability to secure required governmental permits and approvals; |
|
· |
our ability to hire and train skilled store operating personnel, especially management personnel; |
|
· |
the availability of construction materials and labor and the absence of significant construction delays or cost overruns; |
|
· |
our ability to provide a satisfactory mix of merchandise that is responsive to the needs of our customers living in the areas where new retail stores are built; |
|
· |
our ability to supply new retail stores with inventory in a timely manner; |
|
· |
our competitors building or leasing stores near our retail stores or in locations we have identified as targets for a new retail store; |
|
· |
consumer demand for our products, particularly firearms and ammunition, which drives traffic to our retail stores; |
|
· |
regional economic and other factors in the geographies in which we expand; and |
|
· |
general economic and business conditions affecting consumer confidence and spending and the overall strength of our business. |
19
Once we decide on a new market and find a suitable location, any delays in opening new stores could impact our financial results. It is possible that events, such as delays in the entitlements process or construction delays caused by permitting or licensing issues, material shortages, labor issues, weather delays or other acts of god, discovery of contaminants, accidents, deaths or injunctions, could delay planned new store openings beyond their expected dates or force us to abandon planned openings altogether. In addition, new retail stores typically generate lower operating margins because pre-opening expenses are expensed as they are incurred and because fixed costs, as a percentage of net sales, are higher. Furthermore, the substantial management time and resources which our retail store expansion strategy requires may result in disruption to our existing business operations, which may decrease our profitability.
As a result of the above factors, we cannot assure you that we will be successful in operating our stores in new markets on a profitable basis.
Our planned growth may strain our business infrastructure, which could adversely affect our operations and financial condition.
Over time, we expect to expand the size of our retail store network in new and existing markets. As we grow, we will face the risk that our existing resources and systems, including management resources, accounting and finance personnel and operating systems, may be inadequate to support our growth. We cannot assure you that we will be able to retain the personnel or make the changes in our systems that may be required to support our growth. Failure to secure these resources and implement these systems on a timely basis could have a material adverse effect on our operating results. In addition, hiring additional personnel and implementing changes and enhancements to our systems will require capital expenditures and other increased costs that could also have a material adverse impact on our operating results.
Our expansion in new markets may also create new distribution and merchandising challenges, including strain on our distribution facility, an increase in information to be processed by our management information systems and diversion of management attention from existing operations towards the opening of new stores and markets. To the extent that we are not able to meet these additional challenges, our sales could decrease and our operating expenses could increase.
Our ability to operate and expand our business and to respond to changing business and economic conditions will depend on the availability of adequate capital.
The operation of our business, the rate of our expansion and our ability to respond to changing business and economic conditions depend on the availability of adequate capital, which in turn depends on cash flow generated by our business and, if necessary, the availability of equity or debt capital. We will also need sufficient cash flow to meet our obligations under our existing debt agreements. We paid total cash interest on our credit facilities of $16.4 million, $19.0 million and $4.0 million in fiscal years 2014, 2013 and 2012, respectively, and our term loans require us to make quarterly principal payments of $0.4 million.
The amount that we are able to borrow and have outstanding under our revolving credit facility at any given time is subject to a borrowing base calculation, which is a contractual calculation equal to roughly (1) the lesser of (a) 90% of the net orderly liquidation value of our eligible inventory, and (b) 75% of the lower of cost or market value of our eligible inventory, plus (2) 90% of the eligible accounts receivable, less certain reserves against outstanding gift cards, layaway deposits and amounts outstanding under commercial letters of credit, each term as defined in the credit agreement for the revolving credit facility. As a result, our ability to borrow is subject to certain risks and uncertainties, such as a deterioration in the quality of our inventory (which is the largest asset in our borrowing base), a decline in sales activity and the collection of our receivables, which could reduce the funds available to us under our revolving credit facility.
We cannot assure you that our cash flow from operations or cash available under our revolving credit facility will be sufficient to meet our needs. If we are unable to generate sufficient cash flows from operations in the future, and if availability under our revolving credit facility is not sufficient, we may have to obtain additional financing. If we obtain additional capital by issuing equity, the interests of our existing stockholders will be diluted. If we incur additional indebtedness, that indebtedness may contain significant financial and other covenants that may significantly restrict our operations. We cannot assure you that we could obtain refinancing or additional financing on favorable terms or at all.
20
Our revolving credit facility and term loans contain restrictive covenants that may impair our ability to access sufficient capital and operate our business.
Our revolving credit facility and term loans contain various provisions that limit our ability to, among other things:
|
· |
incur, create or assume certain indebtedness; |
|
· |
create, incur or assume certain liens; |
|
· |
make certain investments; |
|
· |
make sales, transfers and dispositions of certain property; |
|
· |
undergo certain fundamental changes, including certain mergers, liquidations and consolidations; |
|
· |
purchase, hold or acquire certain investments; and |
|
· |
declare or make certain dividends and distributions. |
These covenants may affect our ability to operate and finance our business as we deem appropriate. If we are unable to meet our obligations as they become due or to comply with various financial covenants contained in the instruments governing our current or future indebtedness, this could constitute an event of default under the instruments governing our indebtedness.
If there were an event of default under the instruments governing our indebtedness, the holders of the affected indebtedness could declare all of that indebtedness immediately due and payable, which, in turn, could cause the acceleration of the maturity of all of our other indebtedness. We may not have sufficient funds available, or we may not have access to sufficient capital from other sources, to repay any accelerated debt. Even if we could obtain additional financing, the terms of the financing may not be favorable to us. In addition, substantially all of our assets are subject to liens securing our revolving credit facility and term loans. If amounts outstanding under the revolving credit facility or term loans were accelerated, our lenders could foreclose on these liens and we could lose substantially all of our assets. Any event of default under the instruments governing our indebtedness could have a material adverse effect on our business, financial condition and results of operations.
Our same store sales may fluctuate and may not be a meaningful indicator of future performance.
Our same store sales may vary from quarter to quarter, and an unanticipated decline in net sales or same store sales may cause the price of our common stock to fluctuate significantly. A number of factors have historically affected, and will continue to affect, our same store sales results, including:
|
· |
changes or anticipated changes to regulations related to some of the products we sell; |
|
· |
consumer preferences, buying trends and overall economic trends; |
|
· |
our ability to identify and respond effectively to local and regional trends and customer preferences; |
|
· |
our ability to provide quality customer service that will increase our conversion of shoppers into paying customers; |
|
· |
competition in the regional market of a store; |
|
· |
atypical weather; |
|
· |
changes in our product mix; and |
|
· |
changes in pricing and average ticket sales. |
Our operating results are subject to seasonal fluctuations.
We experience moderate seasonal fluctuations in our net sales and operating results. On average over the last three fiscal years, we have generated 26.6% and 30.1% of our annual net sales in the third and fourth fiscal quarters, respectively, which includes the holiday selling season as well as the opening of the fall hunting season. We incur additional expenses in the third and fourth fiscal quarters due to higher purchase volumes and increased staffing in our stores. If, for any reason, we miscalculate the demand for our products or our product mix during the third or fourth fiscal quarters, our sales in these quarters could decline, resulting in higher labor costs as a percentage of sales, lower margins and excess inventory, which could cause our annual operating results to suffer and our stock price to decline. Due to our seasonality, the possible adverse impact from other risks associated with our business, including atypical weather, consumer spending levels and general business conditions, is potentially greater if any such risks occur during our peak sales seasons.
21
We rely on a single distribution center for our business, and if there is a natural disaster or other serious disruption at such facility, we may be unable to deliver merchandise effectively to our stores or customers.
We rely on a single distribution center in Salt Lake City, Utah for our business. Any natural disaster or other serious disruption at such facility due to fire, tornado, earthquake, flood or any other cause could damage our on-site inventory or impair our ability to use such distribution center. While we maintain business interruption insurance, as well as general property insurance, the amount of insurance coverage may not be sufficient to cover our losses in such an event. Any of these occurrences could impair our ability to adequately stock our stores or fulfill customer orders and harm our operating results.
Any disruption of the supply of products from our vendors could have an adverse impact on our net sales and profitability.
We cannot predict when, or the extent to which, we will experience any disruption in the supply of products from our vendors. Any such disruption could negatively impact our ability to market and sell our products and serve our customers, which could adversely impact our net sales and profitability.
We depend on merchandise purchased from our vendors to obtain products for our stores. We have no contractual arrangements providing for continued supply from our key vendors, and our vendors may discontinue selling to us at any time. Changes in commercial practices of our key vendors or manufacturers, such as changes in vendor support and incentives or changes in credit or payment terms, could also negatively impact our results. If we lose one or more key vendors or are unable to promptly replace a vendor that is unwilling or unable to satisfy our requirements with a vendor providing equally appealing products at comparable prices, we may not be able to offer products that are important to our merchandise assortment.
We also are subject to risks, such as the price and availability of raw materials and fabrics, labor disputes, union organizing activity, strikes, inclement weather, natural disasters, war and terrorism and adverse general economic and political conditions, that might limit our vendors’ ability to provide us with quality merchandise on a timely and cost-efficient basis. We may not be able to develop relationships with new vendors, and products from alternative sources, if any, may be of a lesser quality and more expensive than those we currently purchase. Any delay or failure in offering products to our customers could have a material adverse impact on our net sales and profitability.
In addition, the SEC has adopted rules regarding disclosure of the use of conflict minerals (commonly referred to as tantalum, tin, tungsten and gold), which are mined from the Democratic Republic of the Congo and surrounding countries. We expect to incur costs to design and implement a process to discover the origin of the tantalum, tin, tungsten and gold used in the products we sell, and may incur costs to audit our conflict minerals disclosures. Our reputation may also suffer if the products we sell contain conflict minerals originating in the Democratic Republic of the Congo or surrounding countries.
Political and economic uncertainty and unrest in foreign countries where our merchandise vendors are located and trade restrictions upon imports from these foreign countries could adversely affect our ability to source merchandise and operating results.
In fiscal year 2014, approximately 2.2% of our merchandise was imported directly from vendors located in foreign countries, with a substantial portion of the imported merchandise being obtained directly from vendors in China and El Salvador. In addition, we believe that a significant portion of our domestic vendors obtain their products from foreign countries that may also be subject to political and economic uncertainty. We are subject to risks and uncertainties associated with changing economic, political and other conditions in foreign countries where our vendors are located, such as:
|
· |
increased import duties, tariffs, trade restrictions and quotas; |
|
· |
work stoppages; |
|
· |
economic uncertainties; |
|
· |
adverse foreign government regulations; |
|
· |
wars, fears of war and terrorist attacks and organizing activities; |
|
· |
adverse fluctuations of foreign currencies; |
|
· |
natural disasters; and |
|
· |
political unrest. |
22
We cannot predict when, or the extent to which, the countries in which our products are manufactured will experience any of the above events. Any event causing a disruption or delay of imports from foreign locations would likely increase the cost or reduce the supply of merchandise available to us and would adversely affect our operating results.
In addition, trade restrictions, including increased tariffs or quotas, embargoes, safeguards and customs restrictions against clothing items, as well as U.S. or foreign labor strikes, work stoppages or boycotts could increase the cost or reduce the supply of merchandise available to us or may require us to modify our current business practices, any of which could hurt our profitability.
Finally, potential changes in federal restrictions on the importation of firearms and ammunition products could affect our ability to acquire certain popular brands of firearms and ammunition products from importers and wholesalers, which could negatively impact our net sales until replacements in the United States can be obtained, if at all.
A failure in our e-commerce operations, security breaches and cyber security risks could disrupt our business and lead to reduced sales and growth prospects and reputational damage.
Our e-commerce business is an important element of our brand and relationship with our customers, and we expect it to continue to grow. In addition to changing consumer preferences and shifting traffic patterns and buying trends in e-commerce, we are vulnerable to additional risks and uncertainties associated with e-commerce sales, including rapid changes in technology, website downtime and other technical failures, security breaches, cyber attacks, consumer privacy concerns, changes in state tax regimes and government regulation of internet activities. Our failure to successfully respond to these risks and uncertainties could reduce our e-commerce sales, increase our costs, diminish our growth prospects and damage our brand, which could negatively impact our results of operations and stock price.
In addition, there is no guarantee that we will be able to expand our e-commerce business. Many of our competitors already have e-commerce businesses that are substantially larger and more developed than ours, which places us at a competitive disadvantage. In addition, there are regulatory restrictions on the sale of approximately 30% of our product offerings, such as ammunition, certain cutlery, firearms, propane and reloading powder. If we are unable to expand our e-commerce business, our growth plans will suffer and the price of our common stock could decline.
We do not collect sales taxes in some jurisdictions, which could result in substantial tax liabilities and cause our future e-commerce sales to decrease.
An increasing number of states have considered or adopted laws that attempt to impose tax collection obligations on out-of-state retailers. We believe that these initiatives are inconsistent with the United States Supreme Court’s holding that states, absent congressional legislation, may not impose tax collection obligations on out-of-state e-commerce businesses unless the out-of-state e-commerce business has nexus with the state. A successful assertion by one or more states requiring us to collect taxes where we do not do so could result in substantial tax liabilities, including for past sales, as well as penalties and interest. The imposition by state governments of sales tax collection obligations on out-of-state e-commerce businesses who participate in e-commerce could also create additional administrative burdens for us, put us at a competitive disadvantage if they do not impose similar obligations on our competitors and decrease our future e-commerce sales, which could have a material adverse impact on our business and results of operations.
Current and future government regulations, in particular regulations relating to the sale of firearms and ammunition, may negatively impact the demand for our products and our ability to conduct our business.
We operate in a complex regulatory and legal environment that could negatively impact the demand for our products and expose us to compliance and litigation risks, which could materially affect our operations and financial results. These laws may change, sometimes significantly, as a result of political, economic or social events. Some of the federal, state or local laws and regulations that affect our business and demand for our products include:
|
· |
federal, state or local laws and regulations or executive orders that prohibit or limit the sale of certain items we offer, such as firearms, black powder firearms, ammunition, bows, knives and similar products; |
|
· |
the ATF, regulations, audit and regulatory policies that impact the process by which we sell firearms and ammunition and similar policies of state agencies that have concurrent jurisdiction, such as the California Department of Justice; |
|
· |
laws and regulations governing hunting and fishing; |
|
· |
laws and regulations relating to the collecting and sharing of non-public customer information; |
|
· |
laws and regulations relating to consumer products, product liability or consumer protection, including regulation by the Consumer Product Safety Commission and similar state regulatory agencies; |
23
|
· |
laws and regulations relating to the manner in which we advertise, market or sell our products; |
|
· |
labor and employment laws, including wage and hour laws; |
|
· |
U.S. customs laws and regulations pertaining to proper item classification, quotas and the payment of duties and tariffs; and |
|
· |
Federal Trade Commission, or FTC, regulations governing the manner in which orders may be solicited and prescribing other obligations in fulfilling orders and consummating sales. |
Over the past several years, bills have been introduced in the United States Congress that would restrict or prohibit the manufacture, transfer, importation or sale of certain calibers of handgun ammunition, impose a tax and import controls on bullets designed to penetrate bullet-proof vests, impose a special occupational tax and registration requirements on manufacturers of handgun ammunition and increase the tax on handgun ammunition in certain calibers. Because we carry these products, such legislation could, depending on its scope, materially harm our sales.
Additionally, state and local governments have proposed laws and regulations that, if enacted, would place additional restrictions on the manufacture, transfer, sale, purchase, possession and use of firearms, ammunition and shooting-related products. For example, in response to the Sandy Hook Elementary shooting in Newtown, Connecticut and other incidents in the United States, several states, such as Colorado, Connecticut, Maryland, New Jersey, and New York, have enacted laws and regulations that limit access to and sale of certain firearms in ways more restrictive than federal laws. Other state or local governmental entities may continue to explore similar legislative or regulatory restrictions that could prohibit the manufacture, sale, purchase, possession or use of firearms and ammunition. In New York and Connecticut, mandatory screening of ammunition purchases is now required. In addition, California and the District of Columbia have adopted requirements for micro-stamping (that is, engraving the handgun’s serial number on the firing pin of new handguns), and at least seven other states and the United States Congress have introduced microstamping legislation for certain firearms. Lastly, some states prohibit the sale of firearms without internal or external locking mechanisms, and several states are considering mandating certain design features on safety grounds, most of which would be applicable only to handguns. Other state or local governmental entities may also explore similar legislative or regulatory initiatives that may further restrict the manufacture, sale, purchase, possession or use of firearms, ammunition and shooting-related products.
The regulation of firearms, ammunition and shooting-related products may become more restrictive in the future. Changes in these laws and regulations or additional regulation, particularly new laws or increased regulations regarding sales and ownership of firearms and ammunition, could cause the demand for and sales of our products to decrease and could materially adversely impact our net sales and profitability. Sales of firearms represent a significant percentage of our net sales and are critical in drawing customers to our stores. A substantial reduction in our sales or margins on sales of firearms and firearm related products due to the establishment of new regulations could harm our operating results. Moreover, complying with increased or changed regulations could cause our operating expenses to increase.
We may incur costs from litigation relating to products that we sell, particularly firearms and ammunition, which could adversely affect our net sales and profitability.
We may incur damages due to lawsuits relating to products we sell, including lawsuits relating to firearms, ammunition, tree stands and archery equipment. We may incur losses due to lawsuits, including potential class actions, relating to our performance of background checks on firearms purchases and compliance with other sales laws as mandated by state and federal law. We may also incur losses from lawsuits relating to the improper use of firearms or ammunition sold by us, including lawsuits by municipalities or other organizations attempting to recover costs from manufacturers and retailers of firearms and ammunition. Our insurance coverage and the insurance provided by our vendors for certain products they sell to us may be inadequate to cover claims and liabilities related to products that we sell. In addition, claims or lawsuits related to products that we sell, or the unavailability of insurance for product liability claims, could result in the elimination of these products from our product line, thereby reducing net sales. If one or more successful claims against us are not covered by or exceed our insurance coverage, or if insurance coverage is no longer available, our available working capital may be impaired and our operating results could be materially adversely affected. Even unsuccessful claims could result in the expenditure of funds and management time and could have a negative impact on our profitability and on future premiums we would be required to pay on our insurance policies.
24
We recently lost a jury trial in which monetary damages of $11.9 million were awarded against the defendants in the claim, which included us. If we are not successful in having the verdict set aside or, if necessary, winning an appeal to the decision, we may be required to pay the full amount of damages.
On March 12, 2014, we were added as a defendant to a pending consolidated action filed against United Farmers of Alberta Co-Operative Limited, the seller of Wholesale Sports, Wholesale Sports, Alamo Group and Donald F. Gaube and spouse. The amended complaint was filed by the landlords of two stores we did not assume in our purchase of assets from Wholesale Sports. Such stores were formerly operated by Wholesale Sports in Skagit and Thurston Counties in Washington. The amended complaint alleged breach of lease, breach of collateral assignment, misrepresentation, intentional interference with contract, piercing the corporate veil and violation of Washington’s Fraudulent Transfer Act. The Company was named as a co-defendant with respect to the intentional interference with contract and fraudulent conveyance claims. The amended complaint sought against us and all defendants unspecified money damages, declaratory relief and attorneys’ fees and costs. On March 9, 2015, a jury awarded $11.9 million against the defendants to the action, including us. We are reviewing the decision and have recorded a $4.0 million accrual in our results for the fiscal year and fourth quarter ended January 31, 2015. We expect to file post-trial motions seeking to have the verdict set aside, and, if necessary, will appeal the decision. Interest on the award will accrue at the weekly average one-year constant maturity (nominal) Treasury yield, as published by the Federal Reserve System (currently at 0.22%) while any appeal is pending. If we are not successful in having the verdict set aside or, if necessary, winning an appeal to the decision, we may be required to pay the full amount of damages.
If we fail to maintain the strength and value of our brand, our net sales are likely to decline.
Our success depends on the value and strength of the Sportsman’s Warehouse brand. The Sportsman’s Warehouse name is integral to our business as well as to the implementation of our strategies for expanding our business. Maintaining, promoting and positioning our brand will depend largely on the success of our marketing and merchandising efforts and our ability to provide high quality merchandise and a consistent, high quality customer experience. Our brand could be adversely affected if we fail to achieve these objectives or if our public image or reputation were to be tarnished by negative publicity. Any of these events could result in decreases in net sales.
Our inability or failure to protect our intellectual property could have a negative impact on our operating results.
Our trademarks, service marks, copyrights, patents, trade secrets, domain names and other intellectual property are valuable assets that are critical to our success. The unauthorized reproduction or other misappropriation of our intellectual property could diminish the value of our brands or goodwill and cause a decline in our net sales. Any infringement or other intellectual property claim made against us, whether or not it has merit, could be time-consuming, result in costly litigation, cause product delays or require us to enter into royalty or licensing agreements. As a result, any such claim could have a material adverse effect on our operating results.
Unauthorized disclosure of sensitive or confidential customer information could harm our business and standing with our customers.
The protection of our customer, employee and company data is critical to us. We rely on commercially available systems, software, tools and monitoring to provide security for processing, transmission and storage of confidential customer information, such as payment card and personally identifiable information. Despite the security measures we have in place, our facilities and systems, and those of our third-party service providers, may be vulnerable to security breaches, acts of vandalism, computer viruses, misplaced or lost data, programming or human errors or other similar events. Any security breach involving the misappropriation, loss or other unauthorized disclosure of confidential information, whether by us or our vendors, could damage our reputation, expose us to risk of litigation and liability, disrupt our operations and harm our business.
Our computer hardware and software systems are vulnerable to damage that could harm our business.
Our success, in particular our ability to successfully manage inventory levels, largely depends upon the efficient operation of our computer hardware and software systems. We use management information systems to track inventory information at the store level, communicate customer information and aggregate daily sales, margin and promotional information. These systems are vulnerable to damage or interruption from:
|
· |
fire, flood, tornado and other natural disasters; |
|
· |
power loss, computer system failures, internet and telecommunications or data network failures, operator negligence, improper operation by or supervision of employees, physical and electronic loss of data or security breaches, misappropriation and similar events; |
|
· |
hacking by third parties and computer viruses; and |
25
|
· |
upgrades, installations of major software releases and integration with new systems. |
Any failure that causes an interruption in our systems processing could disrupt our operations and result in reduced sales. We have centralized the majority of our computer systems in our corporate office. It is possible that an event or disaster at our corporate office could materially and adversely affect the performance of our company and the ability of each of our stores to operate efficiently.
Our private brand offerings expose us to various risks.
We expect to continue to grow our exclusive private brand offerings through a combination of brands that we own and brands that we license from third parties. We have invested in our development and procurement resources and marketing efforts relating to these private brand offerings. Although we believe that our private brand products offer value to our customers at each price point and provide us with higher gross margins than comparable third-party branded products we sell, the expansion of our private brand offerings also subjects us to certain specific risks in addition to those discussed elsewhere in this section, such as:
|
· |
potential mandatory or voluntary product recalls; |
|
· |
our ability to successfully protect our proprietary rights (including defending against counterfeit, knock offs, grey-market, infringing or otherwise unauthorized goods); |
|
· |
our ability to successfully navigate and avoid claims related to the proprietary rights of third parties; |
|
· |
our ability to successfully administer and comply with obligations under license agreements that we have with the licensors of brands, including, in some instances, certain minimum sales requirements that, if not met, could cause us to lose the licensing rights or pay damages; and |
|
· |
other risks generally encountered by entities that source, sell and market exclusive branded offerings for retail. |
An increase in sales of our private brands may also adversely affect sales of our vendors’ products, which may, in turn, adversely affect our relationship with our vendors. Our failure to adequately address some or all of these risks could have a material adverse effect on our business, results of operations and financial condition.
If we lose key management or are unable to attract and retain the talent required for our business, our operating results and financial condition could suffer.
Our performance depends largely on the leadership efforts and abilities of our executive officers and other key employees. We have entered into employment agreements with John V. Schaefer, our President and Chief Executive Officer, and Kevan P. Talbot, our Chief Financial Officer and Secretary. None of our other employees have an employment agreement with us. If we lose the services of one or more of our key employees, we may not be able to successfully manage our business or achieve our growth objectives. As our business grows, we will need to attract and retain additional qualified personnel in a timely manner.
Our business depends on our ability to meet our labor needs.
Our success depends in part upon our ability to attract, motivate and retain a sufficient number of qualified employees, including district managers, store managers, department managers and sales associates, who understand and appreciate our outdoor culture and are able to adequately represent this culture to our customers. Qualified individuals of the requisite caliber and number needed to fill these positions may be in short supply in some areas, and the turnover rate in the retail industry is high. If we are unable to hire and retain sales associates capable of consistently providing a high level of customer service, as demonstrated by their enthusiasm for our culture and knowledge of our merchandise, our business could be materially adversely affected. Although none of our employees is currently covered by collective bargaining agreements, our employees may elect to be represented by labor unions in the future, which could increase our labor costs. Additionally, competition for qualified employees could require us to pay higher wages to attract a sufficient number of employees. An inability to recruit and retain a sufficient number of qualified individuals in the future may delay the planned openings of new stores. Any such delays, any material increases in employee turnover rates at existing stores or any increases in labor costs could have a material adverse effect on our business, financial condition or operating results.
Increases in the minimum wage could adversely affect our financial results.
From time to time, legislative proposals are made to increase the federal minimum wage in the United States, as well as the minimum wage in a number of individual states. Base wage rates for some of our employees are at or slightly above the minimum wage. As federal or state minimum wage rates increase, we may need to increase not only the wage rates of our minimum wage employees, but also the wages paid to our other hourly employees as well. Any increase in the cost of our labor could have an adverse effect on our operating costs, financial condition and results of operations.
26
We may pursue strategic acquisitions or investments, and the failure of an acquisition or investment to produce the anticipated results or the inability to fully integrate the acquired companies could have an adverse impact on our business.
We may from time to time acquire or invest in complementary companies, businesses or assets. The success of such acquisitions or investments will be based on our ability to make accurate assumptions regarding the valuation, operations, growth potential, integration and other factors relating to the respective business or assets. Our acquisitions or investments may not produce the results that we expect at the time we enter into or complete the transaction. For example, we may not be able to capitalize on previously anticipated synergies. Furthermore, acquisitions may result in dilutive issuances of our equity securities, the incurrence of debt, contingent liabilities, amortization expenses or write-offs of goodwill or other intangibles, any of which could harm our financial condition or results of operations. We also may not be able to successfully integrate operations that we acquire, including their personnel, financial systems, supply chain and other operations, which could adversely affect our business. Acquisitions may also result in the diversion of our capital and our management’s attention from other business issues and opportunities.
A proposed new standard for lease accounting may significantly impact the timing and amount in which we report our lease expense.
In August 2010, the Financial Accounting Standards Board, or FASB, and the International Accounting Standards Board, or IASB, issued an exposure draft that proposes substantial changes to existing lease accounting that would affect all lease arrangements. Subsequent meetings of the joint committee of the FASB and the IASB have made further changes to the proposed lease accounting.
Under the current proposed accounting model, lessees would be required to record an asset representing the right-to-use the leased item for the lease term, or right-of-use asset, and a corresponding liability to make lease payments. The right-of-use asset and liability incorporate the rights arising under the lease and are based on the lessee’s assessment of expected payments to be made over the lease term. The proposed model requires measuring these amounts at the present value of the future expected payments. For the majority of our leases, we expect that the lease expense would include the amortization of the right-of-use asset and the recognition of interest expense based upon the lessee’s incremental borrowing rate (or the rate implicit in the lease, if known) on the repayment of the lease obligation.
The FASB issued a revised lease accounting exposure draft in May 2013. A proposed effective date has not yet been announced. The FASB and IASB are considering comment letters on the revised exposure draft and are expected to issue a final standard in 2015. Currently, management is unable to assess the impact the adoption of the new final lease standard will have on our financial statements. Although we believe the presentation of our financial statements will likely change, including the pattern of lease expense recognition, we do not believe the accounting pronouncement will change the fundamental economic reasons for which we lease our stores.
We may not achieve projected goals and objectives in the time periods that we anticipate or announce publicly, which could harm our business and cause the price of our common stock to decline.
We set targets and timing to accomplish certain objectives regarding our business. We have included some of these targets in this filing and may make similar future public statements. For example, we state in this filing that:
|
· |
we currently plan to open eight additional new stores in fiscal year 2015 and, for the next several years thereafter, intend to grow our store base at a rate greater than 10 percent annually; and |
|
· |
we target a minimum 10% four-wall Adjusted EBITDA margin and a minimum return on invested capital of 50% excluding initial inventory cost (or 20% including initial inventory cost) in the first twelve months of operation for a new store. |
This filing also includes other forecasts and targets. These forecasts and targets are based on our current expectations. We may not achieve these forecasts and targets, and the actual achievement and timing of these events can vary due to a number of factors, including currently unforeseen matters and matters beyond our control. You should not unduly rely on these forecasts or targets in deciding whether to invest in our common stock.
27
Risks Related to Our Common Stock
Affiliates of Seidler Equity Partners III, L.P. (collectively, “Seidler”) beneficially own approximately 52.7% of our common stock, and their interests may conflict with or differ from the interests of our other stockholders.
Seidler beneficially owns approximately 52.7% of our common stock. As a result, Seidler has significant influence over the election of all of our directors and the approval of significant corporate transactions that require the approval of our board of directors or stockholders, such as mergers and the sale of substantially all of our assets. So long as Seidler continues to own a significant amount of the outstanding shares of our common stock, it will have the ability to exert significant influence over our corporate decisions. Seidler may act in a manner that advances its best interests and not necessarily those of other stockholders by, among other things:
|
· |
delaying, deferring or preventing a change in control transaction; |
|
· |
entrenching our management and/or our board of directors; |
|
· |
impeding a merger, consolidation, takeover or other business combination involving us; |
|
· |
discouraging a potential acquirer from making a tender offer or otherwise attempting to obtain control of us; or |
|
· |
causing us to enter into transactions or agreements that are not in the best interests of all stockholders. |
Additionally, Seidler is in the business of making investments in companies and may in the future acquire interests in businesses that directly or indirectly compete with certain portions of our business or our suppliers or customers. Seidler may also pursue acquisitions that may be complementary to our business, and, as a result, those acquisition opportunities may not be available to us.
Seidler and the members of our board of directors who are affiliated with Seidler, by the terms of our certificate of incorporation, are not required to offer us any transaction opportunity of which they become aware and could take any such opportunity for themselves or offer it to other companies in which they have an investment, unless such opportunity is expressly offered to them solely in their capacity as our directors. We, by the terms of our certificate of incorporation, expressly renounce any interest in any such corporate opportunity to the extent permitted under applicable law, even if the opportunity is one that we would reasonably be deemed to have pursued if given the opportunity to do so, unless such opportunity is expressly offered to any director or officer in his or her capacity as our director or officer. Our certificate of incorporation cannot be amended to eliminate our renunciation of any such corporate opportunity arising prior to the date of any such amendment. Seidler or its affiliates may also acquire competing businesses that may not be attractive to us, and have no obligation to refrain from acquiring competing businesses. Any competition could intensify if an affiliate or subsidiary of Seidler were to enter into or acquire a business similar to our specialty retail operations. Seidler or its affiliates may enter into or acquire a competing business in the future.
We are a “controlled company” within the meaning of The NASDAQ Stock Market corporate governance standards and, as a result, qualify for, and rely on, exemptions from some of the corporate governance requirements that provide protection to stockholders of other companies.
Affiliates of Seidler control a majority of our outstanding common stock. As a result, we are a “controlled company” within the meaning of The NASDAQ Stock Market corporate governance standards. As a controlled company, we are exempt from some of The NASDAQ Stock Market corporate governance requirements, including the requirements that:
|
· |
a majority of the board of directors consist of “independent directors” as defined under The NASDAQ Stock Market corporate governance standards; |
|
· |
our director nominees be selected, or recommended for our board of directors’ selection, either (1) by a majority of independent directors in a vote by independent directors, pursuant to a nominations process adopted by a board resolution, or (2) by a nominating and governance committee comprised solely of independent directors with a written charter addressing the nominations process; and |
|
· |
the compensation of our executive officers be determined, or recommended to the board for determination, by a majority of independent directors in a vote by independent directors, or by a compensation committee comprised solely of independent directors. |
A majority of our board of directors currently consist of independent directors, and we have an audit committee and a compensation committee comprised solely of independent directors. However, our nominating and governance committee are not comprised solely of independent directors. As long as we are a “controlled company,” we could avail ourselves of any of the exemptions described above even if we are not currently relying upon them. Accordingly, for so long as we are a “controlled
28
company,” our stockholders may not have the same protections afforded to stockholders of companies that are subject to all of The NASDAQ Stock Market corporate governance standards.
Our bylaws, our certificate of incorporation and Delaware law contain provisions that could discourage another company from acquiring us and may prevent attempts by our stockholders to replace or remove our current management.
Provisions of our bylaws, our certificate of incorporation and Delaware law may discourage, delay or prevent a merger or acquisition that stockholders may consider favorable, including transactions in which our stockholders might otherwise receive a premium for their shares. In addition, these provisions may frustrate or prevent any attempts by our stockholders to replace or remove our current management by making it more difficult for stockholders to replace or remove our board of directors. These provisions include:
|
· |
establishing a classified board of directors; |
|
· |
providing that directors may be removed only for cause once Seidler owns shares of our common stock representing less than a majority of the outstanding shares of our capital stock; |
|
· |
not providing for cumulative voting in the election of directors; |
|
· |
requiring at least a supermajority vote of our stockholders to amend our bylaws or certain provisions of our certificate of incorporation; |
|
· |
eliminating the ability of stockholders to call special meetings of stockholders; |
|
· |
establishing advance notice requirements for nominations for election to the board of directors or for proposing matters that can be acted on by stockholders at stockholder meetings; |
|
· |
prohibiting stockholder action by written consent once Seidler owns less than a majority of the outstanding shares of our common stock; and |
|
· |
authorizing the issuance of “blank check” preferred stock without any need for action by stockholders. |
In addition, we will be subject to Section 203 of the Delaware General Corporation Law once Seidler ceases to beneficially own at least 15% of the total voting power of our then-outstanding shares of common stock. In general, subject to some exceptions, Section 203 prohibits a Delaware corporation from engaging in any “business combination” with any “interested stockholder” (which is generally defined as an entity or person who, together with the person’s affiliates and associates, beneficially owns, or within three years prior to the time of determination of interested stockholder status did own, 15% or more of the outstanding voting stock of the corporation), for a three-year period following the date that the stockholder became an interested stockholder. Section 203 could have the effect of delaying, deferring or preventing a change in control that our stockholders might consider to be in their best interests.
Further, our certificate of incorporation provides that, subject to limited exceptions, the Court of Chancery of the State of Delaware will be, to the fullest extent permitted by law, the exclusive forum for any derivative action or proceeding brought on our behalf; any action asserting a breach of fiduciary duty; any action asserting a claim against us arising pursuant to the Delaware General Corporation Law; or any action asserting a claim against us that is governed by the internal affairs doctrine. This exclusive forum provision may limit a stockholder’s ability to bring a claim in a judicial forum that it finds favorable for disputes with us or our directors, officers or other employees and agents, which may discourage such lawsuits against us and our directors, officers, employees and agents.
Together, these charter and statutory provisions could make the removal of management more difficult and may discourage transactions that otherwise could involve payment of a premium over prevailing market prices for our common stock. The existence of the foregoing provisions and anti-takeover measures, as well as the significant common stock beneficially owned by Seidler, could limit the price that investors might be willing to pay in the future for shares of our common stock. They could also deter potential acquirers of our company, thereby potentially reducing the likelihood that our stockholders could receive a premium for their common stock in an acquisition.
We expect that the price of our common stock will fluctuate.
Volatility in the market price of our common stock may prevent our stockholders from being able to sell their common stock at or above the prices they paid for their common stock. The market price for our common stock could fluctuate significantly for various reasons, including:
|
· |
our operating and financial performance and prospects, including seasonal fluctuations in our financial performance; |
|
· |
conditions that impact demand for our products; |
29
|
· |
the public’s reaction to our press releases, other public announcements and filings with the SEC; |
|
· |
changes in earnings estimates or recommendations by securities analysts who track our common stock; |
|
· |
market and industry perception of our success, or lack thereof, in pursuing our growth strategy; |
|
· |
strategic actions by us or our competitors, such as acquisitions or restructurings; |
|
· |
changes in federal and state government regulation; |
|
· |
changes in accounting standards, policies, guidance, interpretations or principles; |
|
· |
arrival or departure of key personnel; |
|
· |
sales of common stock by us or members of our management team; and |
|
· |
changes in general market, economic and political conditions in the United States and global economies or financial markets, including those resulting from natural disasters, terrorist attacks, acts of war and responses to such events. |
In addition, if the market for stocks in our industry, or the stock market in general, experiences a loss of investor confidence, the trading price of our common stock could decline for reasons unrelated to our business, financial condition or results of operations. If any of the foregoing occurs, it could cause our stock price to fall and may expose us to lawsuits that, even if unsuccessful, could be costly to defend and distract our management.
We are an emerging growth company (“EGC”) within the meaning of The Jumpstart our Business Startups Act (“JOBS Act”), and the reduced reporting requirements applicable to EGCs may make our common stock less attractive to investors.
Because we qualify as an EGC under the JOBS Act, we have elected to comply with some of the reduced disclosure and other reporting requirements available to us as an EGC for a period of up to five years following our initial public offering if we remain an EGC. For example, for as long as we remain an EGC, we are not subject to certain governance requirements, such as holding a “say-on-pay” and “say-on-golden-parachute” advisory votes, we are not required to include a “Compensation Discussion and Analysis” section in our proxy statements and reports filed under the Exchange Act, and we do not need to obtain an annual attestation report on our internal control over financial reporting from a registered public accounting firm pursuant to Section 404(b) of the Sarbanes-Oxley Act of 2002 (the “Sarbanes-Oxley Act”). We could be an EGC for a period up to the end of the fifth fiscal year after our initial public offering, although we will cease to be an EGC earlier than this five-year period if our total annual gross revenues equal or exceed $1 billion in a fiscal year, if we issue more than $1 billion in non-convertible debt over a three-year period or if we become a “large accelerated filer” (which requires, among other things, the market value of our common stock held by non-affiliates to be at least $700 million as of the last business day of our second fiscal quarter of any fiscal year).
Accordingly, for up to five fiscal years after our initial public offering, our stockholders may not receive the same level of disclosure that is afforded to stockholders of a non-EGC. It is possible that investors will find our common stock to be less attractive because we have elected to comply with the reduced disclosure and other reporting requirements available to us as an EGC, which could adversely affect the trading market for our common stock and the prices at which stockholders may be able to sell their common stock.
The requirements of being a public company may strain our resources and divert management’s attention.
As a public company, we are subject to the reporting requirements of the Exchange Act, the Sarbanes-Oxley Act, the Dodd-Frank Wall Street Reform and Consumer Protection Act of 2010 and other applicable securities rules and regulations. Compliance with these rules and regulations have increased our legal and financial compliance costs, make some activities more difficult, time-consuming or costly and increase demand on our systems and resources. The Exchange Act requires, among other things, that we file annual, quarterly and current reports with respect to our business and results of operations and proxy or information statements in connection with matters upon which our stockholders may vote. As a result of our public disclosure of information in filings required of a public company, our business and financial condition have become more visible, which could result in threatened or actual litigation, or other adverse actions taken by competitors and other third parties. In addition, our management team has limited experience managing a public company or complying with the increasingly complex laws pertaining to public companies, and a number of our directors have limited experience serving on the boards of public companies. The time and resources necessary to comply with the requirements of being a public company and contend with any action that might be brought against us as a result of publicly available information could divert our resources and the attention of our management and adversely affect our business, financial condition and results of operations.
30
If we are unable to implement and maintain effective internal control over financial reporting, investors may lose confidence in the accuracy and completeness of our financial reports, and the market price of our common stock may be adversely affected.
As a public company, we are required to implement and maintain effective internal control over financial reporting and to disclose any material weaknesses identified in our internal controls. Our management will be required to furnish an annual report regarding the effectiveness of our internal control over financial reporting pursuant to Section 404 of the Sarbanes-Oxley Act (“Section 404”), beginning with our annual report on Form 10-K for fiscal year 2015 (to be filed in 2016). Currently, we are in the process of refining, implementing and testing the internal controls required to comply with Section 404. If we identify material weaknesses in our internal control over financial reporting, if we fail to comply with the requirements of Section 404 in a timely manner or if we are unable to assert that our internal control over financial reporting is effective, investors may lose confidence in the accuracy and completeness of our financial reports and the market price of our common stock could be adversely affected. We could also become subject to investigations by The NASDAQ Stock Market, the SEC or other regulatory authorities, which could require additional financial and management resources.
We do not expect to pay any cash dividends for the foreseeable future.
We currently expect to retain all available funds and future earnings, if any, for use in the operation and growth of our business and do not anticipate paying any cash dividends in the foreseeable future. Any future determination to pay dividends will be at the discretion of our board of directors, subject to compliance with applicable law and any contractual provisions, including under the credit agreements governing our term loans and revolving credit facility and agreements governing any additional indebtedness we may incur in the future, that restrict or limit our ability to pay dividends, and will depend upon, among other factors, our results of operations, financial condition, earnings, capital requirements and other factors that our board of directors deems relevant. Further, because we are a holding company, our ability to pay dividends depends on our receipt of cash dividends from our operating subsidiaries, which may further restrict our ability to pay dividends as a result of the laws of their jurisdiction of organization, agreements of our subsidiaries or covenants under our existing or future indebtedness. All of our business operations are conducted through our wholly owned subsidiaries, Sportsman’s Warehouse, Inc. and Minnesota Merchandising Corporation and their subsidiaries. The ability of Sportsman’s Warehouse, Inc. and Minnesota Merchandising Corporation to pay dividends to us, and our ability to pay dividends on our capital stock, is limited by our term loans. Our revolving credit facility also limits our ability to pay dividends on our capital stock. Our ability to pay dividends may also be restricted by the terms of any future credit agreement or any future debt or preferred equity securities of ours or of our subsidiaries.
If securities or industry analysts publish inaccurate or unfavorable research about us, our stock price and trading volume could decline.
The trading market for our common stock will depend in part on the research reports that securities or industry analysts publish about us, our business and our industry. Assuming we obtain securities or industry analyst coverage, if one or more of the analysts who cover us downgrade our stock or publish inaccurate or unfavorable research about us, our business or our industry, our stock price would likely decline. If one or more of these analysts cease coverage of our company or fail to publish reports on us regularly, demand for our stock could decrease, which might cause our stock price and trading volume to decline.
ITEM 1B. UNRESOLVED STAFF COMMENTS
None.
We do not plan to own any material real property, but rather intend to lease all of our store locations. From time to time we will self-develop one of our properties with the intention to enter into a sale-leaseback transaction with a third party. Depending upon where we are in the process of completing the sale-leaseback transaction, we may legally own real property at any particular balance sheet date. Our corporate headquarters is located in an approximately 60,000 square foot building in Midvale, Utah. The building is leased under an agreement expiring on December 31, 2018.
Our distribution center is located in a 507,000 square foot facility in Salt Lake City, Utah. The building is leased under an agreement expiring on December 31, 2023, with three options that each allow us to extend for an additional five years. We believe that our distribution center is of sufficient scale to support a network of up to 100 stores.
31
We operate 56 retail stores in 18 states. In total we have approximately 3.2 million gross square feet across all of our stores. All of our stores are leased from third parties with lease terms typically ranging from five to fifteen years, and many of our lease agreements have additional five-year renewal options. All of our leases provide for additional payments associated with common area maintenance, real estate, taxes and insurance. In addition, many of our lease agreements have defined escalating rent provisions over the initial term and extensions.
On March 11, 2013, we acquired certain assets and assumed certain liabilities of Wholesale Sports Outdoor Outfitters, or Wholesale Sports, relating to their retail business of hunting, fishing and camping goods and supplies. Concurrently with our asset purchase, Alamo Group, LLC, an unrelated third party, purchased all of the stock of Wholesale Sports. On March 22, 2013, the landlord of a store in Spokane, Washington that was formerly operated by Wholesale Sports, and which was one of the five stores whose leases we did not assume in our purchase of assets from Wholesale Sports, filed a complaint against the seller of Wholesale Sports, Wholesale Sports and Alamo Group in the Superior Court for the State of Washington in the County of Spokane captioned as North Town Mall v. United Farmers of Alberta Co-Operative Limited, et al., Case No. 13-2-01201-9. The complaint, as amended, alleged claims for breach of lease, violation of Washington’s Fraudulent Transfer Act, tortious interference with contractual relations, piercing the corporate veil, assumption of the Spokane store lease and fraud and/or negligent representation. We were named as a co-defendant in the amended complaint with respect to the fraudulent conveyance, tortious interference, and assumption of the lease claims. The complaint requested that the court order “avoidance” of an alleged transfer of assets from Wholesale Sports to us and/or Alamo Group, damages based on future rent to be paid under the lease in the approximate amount of $4.5 million, attachment of assets, attorneys’ fees and costs as provided for in contract, and such other relief that the court deems just and proper. In addition, the amended complaint alleged that we and Alamo Group were liable for expenses that the landlord would incur as a result of default under the lease, including expenses related to returning the store premises to the condition called for in the lease and the cost to locate a new tenant.
On March 12, 2014, we were added as a defendant to a pending consolidated action filed in the United States District Court, Western District of Washington, captioned as Lacey Market Place Associates II, LLC, et al. v. United Farmers of Alberta Co-Operative Limited, et al., Case No. 2:13-cv-00383-JLR against United Farmers of Alberta Co-Operative Limited, the seller of Wholesale Sports, Wholesale Sports, Alamo Group and Donald F. Gaube and spouse. The amended complaint was filed by the landlords of two stores we did not assume in our purchase of assets from Wholesale Sports. Such stores were formerly operated by Wholesale Sports in Skagit and Thurston Counties in Washington. The amended complaint alleged breach of lease, breach of collateral assignment, misrepresentation, intentional interference with contract, piercing the corporate veil and violation of Washington’s Fraudulent Transfer Act. We were named as a co-defendant with respect to the intentional interference with contract and fraudulent conveyance claims. The amended complaint sought against us and all defendants unspecified money damages, declaratory relief and attorneys’ fees and costs. On January 28, 2015, the court in the Lacey Marketplace action granted in part and denied in part our motion for summary judgment and dismissed the intentional interference claim against us, but declined to dismiss the fraudulent transfer claim.
Trial in the Lacey Marketplace action began March 2, 2015 and concluded March 6, 2015. On March 9, 2015, the jury in the trial awarded $11.9 million against the defendants to the action, including us. We are reviewing the decision and have recorded a $4.0 million accrual in our results for the fiscal year and fourth quarter ended January 31, 2015. We strongly disagree with the jury’s verdict, expect to file post-trial motions seeking to have the verdict set aside, and, if necessary, will appeal the decision. Interest on the award will accrue at the weekly average one-year constant maturity (nominal) Treasury yield, as published by the Federal Reserve System (currently at 0.22%) while any appeal is pending.
When we become aware of a claim or potential claim, we assess the likelihood of any loss or exposure. If a loss contingency is probable and the amount of the loss can be reasonably estimated, we record an accrual for the loss. In such cases, there may be an exposure to potential loss in excess of the amount accrued. Where a loss is not probable but is reasonably possible or where a loss in excess of the amount accrued is reasonably possible, we disclose an estimate of the amount of the loss or range of possible losses for the claim if a reasonable estimate can be made, unless the amount of such reasonably possible losses is not material to our financial position, results of operations or cash flows. The ability to predict the ultimate outcome of such matter involves judgments and inherent uncertainties. The actual outcome could differ.
We are subject to various legal proceedings and claims, including employment claims, wage and hour claims, intellectual property claims, contractual and commercial disputes and other matters that arise in the ordinary course of our business. While the outcome of these and other claims cannot be predicted with certainty, we do not believe that the outcome of these matters individually or in the aggregate will have a material adverse effect on our business, results of operations or financial condition.
32
ITEM 4. MINE SAFETY DISCLOSURES
Not Applicable.
33
PART II
ITEM 5. MARKET FOR REGISTRANT’S COMMON EQUITY, RELATED STOCKHODLER MATTERS AND ISSUER PURCHASES OF EQUITY SECURITIES
Market for Registrant’s Common Equity
The common stock of Sportsman’s Warehouse Holdings Incorporated is listed for trading on the NASDAQ under the symbol “SPWH." As of March 31, 2015, there were 96 holders of record of our common stock. This number does not include persons who hold our common stock in nominee or “street name” accounts through brokers or banks.
The following table sets forth, for the fiscal quarters indicated, the high and low sales prices per share of our common stock as reported on the NASDAQ:
|
|
2014 |
|
|||||
|
|
High |
|
|
Low |
|
||
|
First Quarter |
|
10.90 |
|
|
|
9.47 |
|
|
Second Quarter |
|
10.10 |
|
|
|
5.79 |
|
|
Third Quarter |
|
7.67 |
|
|
|
5.46 |
|
|
Fourth Quarter |
|
8.10 |
|
|
|
6.29 |
|
Dividend Policy
We declared and paid dividends on our common stock and restricted nonvoting common stock of $8.57 per share (on a pre-split basis) in November 2012, totaling approximately $99.2 million, and $8.73 per share (on a pre-split basis) in August 2013, totaling approximately $101.1 million. We did not pay any dividends in fiscal year 2014.
We currently expect to retain all available funds and future earnings, if any, for use in the operation and growth of our business and do not anticipate paying any cash dividends in the foreseeable future. Any future determination to pay dividends will be at the discretion of our board of directors, subject to compliance with applicable law and any contractual provisions, including under the credit agreements governing our term loans and revolving credit facility and agreements governing any additional indebtedness we may incur in the future, that restrict or limit our ability to pay dividends, and will depend upon, among other factors, our results of operations, financial condition, earnings, capital requirements and other factors that our board of directors deems relevant. Because we are a holding company, our ability to pay dividends depends on our receipt of cash dividends from our operating subsidiaries, which may further restrict our ability to pay dividends as a result of the laws of their jurisdiction of organization, agreements of our subsidiaries or covenants under our existing or future indebtedness. All of our business operations are conducted through our wholly owned subsidiaries, Sportsman’s Warehouse, Inc. and Minnesota Merchandising Corporation and their subsidiaries. The ability of Sportsman’s Warehouse, Inc. and Minnesota Merchandising Corporation to pay dividends to us, and our ability to pay dividends on our capital stock, is limited by our term loans. Our revolving credit facility also limits our ability to pay dividends on our capital stock. Our ability to pay dividends may also be restricted by the terms of any future credit agreement or any future debt or preferred equity securities of ours or of our subsidiaries.
Equity Compensation Plan Information
Equity compensation plan information required by this Item 5 will be included in our definitive proxy statement for our annual meeting of stockholders, which will be filed with the SEC no later than 120 days after the end of our fiscal year ended January 31, 2015 (the "Proxy Statement"), and is incorporated herein by reference.
Stock Performance Graph
The stock price performance graph below shall not be deemed soliciting material or to be filed with the SEC or subject to Regulation 14A or 14C under the Exchange Act or to the liabilities of Section 18 of the Exchange Act, nor shall it be incorporated by reference into any past or future filing under the Securities Act of 1933, as amended, or the Securities Act or the Exchange Act, except to the extent we specifically request that it be treated as soliciting material or specifically incorporate it by reference into a filing under the Securities Act or the Exchange Act.
The following graph shows the cumulative total stockholder return of an investment of $100 in cash at market close on April 17, 2014 (the first day of trading of our Common Stock), through January 30, 2015 for (i) our Common Stock (“SPWH”), (ii) the S&P 500 Retailing Industry Group Index (“S&P Retail”) and (iii) the Russell 2000 Index (“Russell 2000”). Pursuant to applicable SEC
34
rules, all values assume reinvestment of the full amount of all dividends. The stockholder return shown on the graph below is not necessarily indicative of future performance, and we do not make or endorse any predictions as to future stockholder returns.
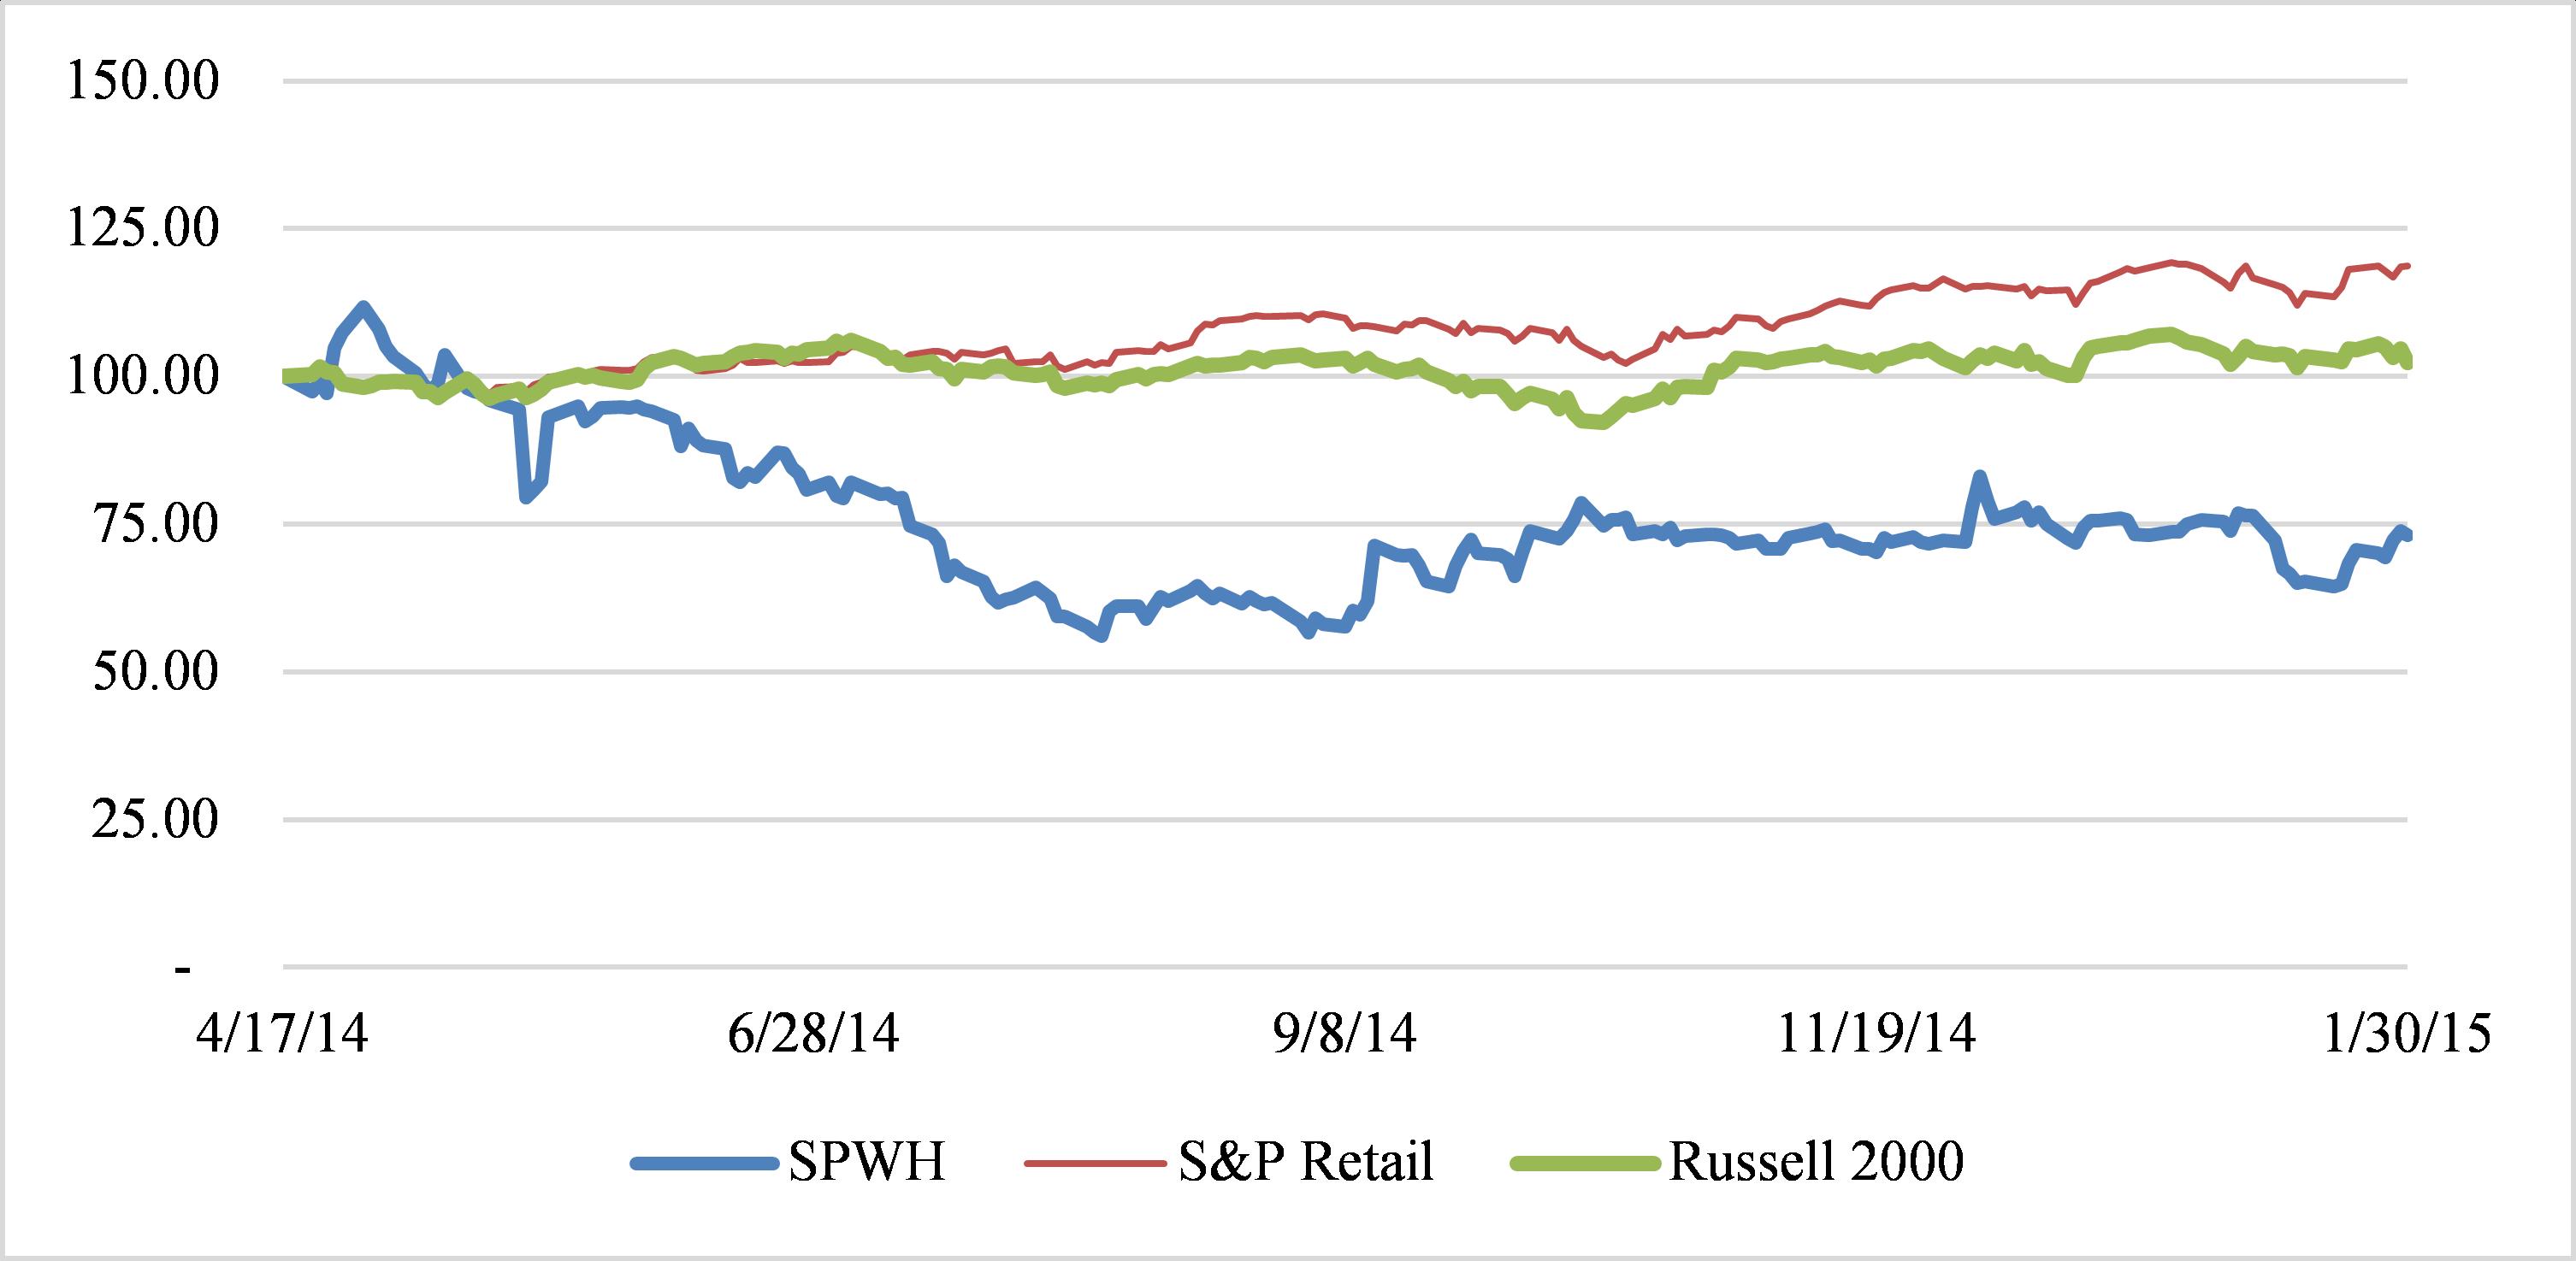
|
|
4/17/2014 |
|
|
5/2/2014 |
|
|
8/1/2014 |
|
|
10/31/2014 |
|
|
1/30/2015 |
|
|||||
|
|
|
|
|
|
|
|
|
|
|
|
|
|
|
|
|
|
|
|
|
|
SPWH |
$ |
100 |
|
|
$ |
103 |
|
|
$ |
59 |
|
|
$ |
72 |
|
|
$ |
73 |
|
|
S&P Retail |
|
100 |
|
|
|
100 |
|
|
|
101 |
|
|
|
110 |
|
|
|
119 |
|
|
Russell 2000 |
|
100 |
|
|
|
99 |
|
|
|
98 |
|
|
|
103 |
|
|
|
102 |
|
ITEM 6. SELECTED FINANCIAL DATA.
|
|
Fiscal Year Ended |
|
|||||||||
|
|
January 31, |
|
|
February 1, |
|
|
February 2, |
|
|||
|
|
2015 |
|
|
2014 |
|
|
2013 |
|
|||
|
|
(in thousands, except per share amounts) |
|
|||||||||
|
Consolidated Statements of Income Data: |
|
|
|
|
|
|
|
|
|
|
|
|
Net sales |
$ |
660,003 |
|
|
$ |
643,163 |
|
|
$ |
526,942 |
|
|
Cost of goods sold |
|
444,796 |
|
|
|
435,933 |
|
|
|
364,326 |
|
|
Gross profit |
|
215,207 |
|
|
|
207,230 |
|
|
|
162,616 |
|
|
Selling, general and administrative expenses |
|
170,315 |
|
|
|
147,140 |
|
|
|
109,408 |
|
|
Bankruptcy-related expenses (benefit) (1) |
|
- |
|
|
|
55 |
|
|
|
(263 |
) |
|
Income from operations |
|
44,892 |
|
|
|
60,035 |
|
|
|
53,471 |
|
|
Interest expense |
|
(22,480 |
) |
|
|
(25,447 |
) |
|
|
(6,321 |
) |
|
Income before income taxes |
|
22,412 |
|
|
|
34,588 |
|
|
|
47,150 |
|
|
Income tax expense |
|
8,628 |
|
|
|
12,838 |
|
|
|
19,076 |
|
|
Net income |
$ |
13,784 |
|
|
$ |
21,750 |
|
|
$ |
28,074 |
|
|
|
|
|
|
|
|
|
|
|
|
|
|
|
Earnings per share: |
|
|
|
|
|
|
|
|
|
|
|
|
Basic |
$ |
0.34 |
|
|
$ |
0.66 |
|
|
$ |
0.84 |
|
|
Diluted |
$ |
0.34 |
|
|
$ |
0.66 |
|
|
$ |
0.84 |
|
|
|
|
|
|
|
|
|
|
|
|
|
|
|
Weighted average shares outstanding: |
|
|
|
|
|
|
|
|
|
|
|
|
Basic shares |
|
39,961 |
|
|
|
33,170 |
|
|
|
33,229 |
|
|
Diluted shares |
|
40,141 |
|
|
|
33,185 |
|
|
|
33,229 |
|
35
|
|
Fiscal Year Ended |
|
|||||||||
|
|
January 31, |
|
|
February 1, |
|
|
February 2, |
|
|||
|
|
2015 |
|
|
2014 |
|
|
2013 |
|
|||
|
|
(in thousands, except number of stores and square feet) |
|
|||||||||
|
Consolidated Balance Sheet Data: |
|
|
|
|
|
|
|
|
|
|
|
|
Total current assets |
$ |
203,671 |
|
|
$ |
176,316 |
|
|
$ |
143,511 |
|
|
Total assets |
|
270,723 |
|
|
|
224,229 |
|
|
|
166,563 |
|
|
Long-term debt (including current portion), net of discount |
|
158,046 |
|
|
|
231,132 |
|
|
|
124,808 |
|
|
Total liabilities |
|
302,055 |
|
|
|
345,325 |
|
|
|
208,407 |
|
|
Total stockholders’ deficit |
|
(31,332 |
) |
|
|
(121,096 |
) |
|
|
(41,844 |
) |
|
Total liabilities and stockholders’ deficit |
|
270,723 |
|
|
|
224,229 |
|
|
|
166,563 |
|
|
|
|
|
|
|
|
|
|
|
|
|
|
|
Other Data: |
|
|
|
|
|
|
|
|
|
|
|
|
Adjusted EBITDA (3) |
$ |
66,252 |
|
|
$ |
70,716 |
|
|
$ |
59,039 |
|
|
Adjusted EBITDA margin (3) |
|
10.0 |
% |
|
|
10.9 |
% |
|
|
11.2 |
% |
|
Number of stores open at end of period |
55 |
|
|
47 |
|
|
33 |
|
|||
|
Total selling square feet at end of period |
|
2,565,321 |
|
|
|
1,668,227 |
|
|
|
1,207,920 |
|
|
Same store sales growth for period (2) |
(8.4)% |
|
|
(3.7)% |
|
|
|
25.4 |
% |
||
|
(1) |
On March 21, 2009, Sportsman’s Warehouse Holdings, Inc. and its subsidiaries filed voluntary petitions for relief under Chapter 11 of the United States Bankruptcy Code, seeking to reorganize the business under the provisions of the Bankruptcy Code. The plan of reorganization under the Bankruptcy Code was confirmed by the United States Bankruptcy Court for the District of Delaware on July 30, 2009 and became effective when all material conditions of the plan of reorganization were satisfied on August 14, 2009. We incurred certain costs related to our restructuring and emergence from Chapter 11 bankruptcy and included a liability as part of the reorganization value at August 14, 2009, the date of emergence from bankruptcy. Bankruptcy-related expenses are those amounts that are greater than the initial estimated restructuring costs, whereas bankruptcy-related benefits are those amounts that are less than the initial estimated costs. They are expensed as incurred. |
|
(2) |
Net sales from a store are included in same store sales on the first day of the 13th full month following the store’s opening or acquisition by us. We exclude net sales from e-commerce from our calculation of same store sales, and for fiscal years consisting of 53 weeks, we exclude net sales during the 53rd week from our calculation of same store sales. The figures shown represent growth over the corresponding period in the prior fiscal year. |
|
(3) |
Adjusted EBITDA has been presented in this filing as a supplemental measure of financial performance that is not required by, or presented in accordance with, generally accepted accounting principles, or GAAP. We define Adjusted EBITDA as net income plus interest expense, income tax expense, depreciation and amortization, stock-based compensation expense, pre-opening expenses, expenses related to bonuses paid as a result of the successful completion of our initial public offering, litigation accrual, bankruptcy-related expenses and expenses related to the acquisition of 10 stores in fiscal year 2013. Adjusted EBITDA margin means, for any period, the Adjusted EBITDA for that period divided by the net sales for that period. |
Adjusted EBITDA and Adjusted EBITDA margin are included in this filing because they are key metrics used by management and our board of directors to assess our financial performance. Adjusted EBITDA and Adjusted EBITDA margin are frequently used by analysts, investors and other interested parties in the evaluation of companies in our industry. In addition to assessing our financial performance, we use Adjusted EBITDA and Adjusted EBITDA margin as additional measurement tools for purposes of business decision-making, including evaluating store performance, developing budgets and managing expenditures.
Adjusted EBITDA is not a U.S. generally accepted accounting principles (GAAP) measure of our financial performance or liquidity and should not be considered as an alternative to net income as a measure of financial performance or cash flows from operations as a measure of liquidity, or any other performance measure derived in accordance with GAAP, and it should not be construed as an inference that our future results will be unaffected by unusual or non-recurring items. Additionally, Adjusted EBITDA is not intended to be a measure of free cash flow for management’s discretionary use, as it does not reflect certain cash requirements such as tax payments, debt service requirements, capital expenditures, store openings and certain other cash costs that may recur in the future. Adjusted EBITDA contains certain other limitations, including the failure to reflect our cash expenditures or future requirements for capital expenditures or contractual commitments. In evaluating Adjusted EBITDA, you should be aware that, in the future, we will incur expenses that are the same as or similar to some of the adjustments reflected in this presentation, such as income tax expense (benefit), interest expense, depreciation and amortization and pre-opening expenses. Our presentation of Adjusted EBITDA should not be construed to imply that our future results will be unaffected by any such adjustments. Management compensates for these limitations by relying on our GAAP results in addition to using
36
Adjusted EBITDA supplementally. Our measures of Adjusted EBITDA are not necessarily comparable to other similarly titled captions of other companies due to different methods of calculation.
A reconciliation of net income to Adjusted EBITDA is set forth below:
|
|
Fiscal Year Ended |
|
|||||||||
|
|
January 31, |
|
|
February 1, |
|
|
February 2, |
|
|||
|
|
2015 |
|
|
2014 |
|
|
2013 |
|
|||
|
|
(in thousands) |
|
|||||||||
|
Net income |
$ |
13,784 |
|
|
$ |
21,750 |
|
|
$ |
28,074 |
|
|
Plus: |
|
|
|
|
|
|
|
|
|
|
|
|
Interest expense |
|
22,480 |
|
|
|
25,447 |
|
|
|
6,321 |
|
|
Income tax expense |
|
8,628 |
|
|
|
12,838 |
|
|
|
19,076 |
|
|
Depreciation and amortization |
|
9,150 |
|
|
|
6,277 |
|
|
|
3,431 |
|
|
Stock-based compensation expense (a) |
|
3,293 |
|
|
|
365 |
|
|
|
— |
|
|
Pre-opening expenses (b) |
|
2,717 |
|
|
|
1,653 |
|
|
|
1,441 |
|
|
IPO bonus (c) |
|
2,200 |
|
|
|
— |
|
|
|
— |
|
|
Litigation accrual (d) |
|
4,000 |
|
|
|
— |
|
|
|
— |
|
|
Bankruptcy-related expenses (benefit) (e) |
|
— |
|
|
|
55 |
|
|
|
(263 |
) |
|
Acquisition expenses (f) |
|
— |
|
|
|
2,331 |
|
|
|
959 |
|
|
Adjusted EBITDA |
$ |
66,252 |
|
|
$ |
70,716 |
|
|
$ |
59,039 |
|
|
(a) |
Stock-based compensation expense represents non-cash expenses related to equity instruments granted to employees under our 2013 Performance Incentive Plan. |
|
(b) |
Pre-opening expenses include expenses incurred in the preparation and opening of a new store location, such as payroll, travel and supplies, but do not include the cost of the initial inventory or capital expenditures required to open a location. For the periods presented, these pre-opening costs were not concentrated in any quarter. |
|
(c) |
As a result of the completion of our initial public offering and pursuant to the terms of the employment agreements with our executive officers, we paid $2.2 million in bonuses to our executive officers. |
|
(d) |
On March 9, 2015, a jury awarded $11.9 million against the defendants as outlined in “Item 3. Legal Proceedings”. In conjunction with the award, we recorded a $4.0 million accrual related to this case. |
|
(e) |
We incurred certain costs related to our restructuring and emergence from Chapter 11 bankruptcy and included a liability as part of the reorganization value at August 14, 2009, the date of emergence from bankruptcy. Bankruptcy-related expenses are those amounts that are greater than the initial estimated restructuring costs, whereas bankruptcy-related benefits are those amounts that are less than the initial estimated costs. They are expensed as incurred. |
|
(f) |
Acquisition expenses for fiscal year 2013 relate to the costs associated with the acquisition of our 10 previously operated stores in Montana, Oregon and Washington. Acquisition expenses for fiscal year 2012 relate to legal and consulting expenses related to potential merger and acquisition activity. |
ITEM 7. MANAGEMENTS DISCUSSION AND ANALYSIS OF FINANCIAL CONDITION AND RESULS OF OPERATIONS
The discussion below contains forward-looking statements that involve risks and uncertainties. Our actual results could differ materially from those anticipated in these forward-looking statements as a result of various factors, including those which are discussed in the “Risk Factors” section in Part I, Item 1A of this 10-K. Also see “Statement Regarding Forward-Looking Statements” preceding Part I.
The following discussion and analysis should be read in conjunction with the consolidated financial statements and the notes thereto included in this 10-K.
Overview
We are a high-growth outdoor sporting goods retailer focused on meeting the everyday needs of the seasoned outdoor veteran, the first-time participant and every enthusiast in between. Our mission is to provide a one-stop shopping experience that equips our
37
customers with the right quality, brand name hunting, shooting, fishing and camping gear to maximize their enjoyment of the outdoors.
Our business was founded in 1986 as a single retail store in Midvale, Utah. Today, we operate 56 stores in 18 states, totaling approximately 2.6 million gross square feet. During fiscal year 2014, we increased our gross square footage by 14.0% through the opening of eight stores in the following locations:
|
· |
Hillsboro, Oregon on March 15, 2014 |
|
· |
Carson City, Nevada on April 5, 2014 |
|
· |
East Wenatchee, Washington on April 26, 2014 |
|
· |
Chico, California on May 10, 2014 |
|
· |
Vernal, Utah on June 7, 2014 |
|
· |
Rancho Cordova, California on July 12, 2014 |
|
· |
Kelso, Washington on August 2, 2014 |
|
· |
Pocatello, Idaho on August 16, 2014 |
Individual stores are aggregated into one operating and reportable segment.
How We Assess the Performance of Our Business
In assessing the performance of our business, we consider a variety of performance and financial measures. The key measures for determining how our business is performing are net sales, same store sales, gross margin, selling, general and administrative expenses, income from operations and Adjusted EBITDA.
Fiscal Year
We operate using a 52/53 week fiscal year ending on the Saturday closest to January 31. Fiscal years 2014, 2013 and 2012 ended on January 31, 2015, February 1, 2014 and February 2, 2013, respectively. Fiscal year 2012 contains 53 weeks of operations and fiscal years 2013 and 2014 contain 52 weeks of operations.
Net Sales and Same Store Sales
Our net sales are primarily received from revenue generated in our stores and also include sales generated through our e-commerce platform. When measuring revenue generated from our stores, we review our same store sales as well as the performance of our stores that have not operated for a sufficient amount of time to be included in same store sales. We include net sales from a store in same store sales on the first day of the 13th full fiscal month following the store’s opening or acquisition by us. We exclude net sales from e-commerce from our calculation of same store sales and for fiscal years consisting of 53 weeks, such as fiscal year 2012, we exclude net sales during the 53rd week from our calculation of same store sales.
Measuring the change in year-over-year same store sales allows us to evaluate how our retail store base is performing. Various factors affect same store sales, including:
|
· |
changes or anticipated changes to regulations related to some of the products we sell; |
|
· |
consumer preferences, buying trends and overall economic trends; |
|
· |
our ability to identify and respond effectively to local and regional trends and customer preferences; |
|
· |
our ability to provide quality customer service that will increase our conversion of shoppers into paying customers; |
|
· |
competition in the regional market of a store; |
|
· |
atypical weather; |
|
· |
changes in our product mix; and |
|
· |
changes in pricing and average ticket sales. |
38
Opening new stores is also an important part of our growth strategy. Since the beginning of fiscal year 2010, we have opened 21 stores, including the eight new stores we have opened in fiscal year 2014 and the one new store we have opened in fiscal year 2015. For the next several years, we intend to grow our store base at a rate of greater than 10 percent annually. As part of our growth strategy, we also re-acquired 10 stores in fiscal year 2013 that were previously operated under our Sportsman’s Warehouse banner.
For our new locations, we measure our investment by reviewing the new store’s four-wall Adjusted EBITDA margin and pre-tax return on invested capital (“ROIC”). We target a minimum 10% four-wall Adjusted EBITDA margin and a minimum ROIC of 50% excluding initial inventory costs (or 20% including initial inventory cost) for the first full twelve months of operation for a new store. The 12 new stores that we have opened since 2010 and that have been open for a full twelve months (excluding the 10 acquired stores) have achieved an average four-wall Adjusted EBITDA margin of 14.3% and an average ROIC of 121.6% excluding initial inventory cost (and 38.7% including initial inventory cost) during their first full twelve months of operations. Four-wall Adjusted EBITDA means, for any period, a particular store’s Adjusted EBITDA, excluding any allocations of corporate selling, general and administrative expenses allocated to that store. Four-wall Adjusted EBITDA margin means, for any period, a store’s four-wall Adjusted EBITDA divided by that store’s net sales. For a definition of Adjusted EBITDA and Adjusted EBITDA margin and a reconciliation of net income to Adjusted EBITDA, see “—Non-GAAP Measures.” ROIC means a store’s four-wall Adjusted EBITDA for a given period divided by our initial cash investment in the store. We calculate ROIC both including and excluding the initial inventory cost.
We also have been scaling our e-commerce platform and increasing sales through our website, www.sportsmanswarehouse.com.
We believe the key drivers to increasing our total net sales will be:
|
· |
increasing our total gross square footage by opening new stores and increasing the selling square footage of our existing stores; |
|
· |
continuing to increase and improve same store sales in our existing markets; |
|
· |
increasing customer visits to our stores and improving our conversion rate through focused marketing efforts and continually high standards of customer service; |
|
· |
increasing the average ticket sale per customer; and |
|
· |
expanding our e-commerce platform. |
Gross Profit
Gross profit is our net sales less cost of goods sold. Gross margin measures our gross profit as a percentage of net sales. Our cost of goods sold primarily consists of merchandise acquisition costs, including freight-in costs, shipping costs, payment term discounts received from the vendor and vendor allowances and rebates associated directly with merchandise and shipping costs related to e-commerce sales.
We believe the key drivers to improving our gross margin are increasing the product mix to higher margin products, particularly clothing and footwear, improving buying opportunities with our vendor partners and coordinating pricing strategies among our stores and buying group. Our ability to properly manage our inventory can also impact our gross profit. Successful inventory management ensures we have sufficient high margin products in stock at all times to meet customer demand, while overstocking of items could lead to markdowns in order to help a product sell. We believe that the overall growth of our business will allow us to generally maintain or increase our gross margins, because increased merchandise volumes will enable us to maintain our strong relationships with our vendors.
Selling, General and Administrative Expenses
We closely manage our selling, general and administrative expenses. Our selling, general and administrative expenses are comprised of payroll, rent and occupancy, depreciation and amortization, acquisition expenses, pre-opening expenses and other operating expenses, including share-based compensation expense and litigation accrual. Pre-opening expenses include expenses incurred in the preparation and opening of a new store location, such as payroll, travel and supplies, but do not include the cost of the initial inventory or capital expenditures required to open a location.
Our selling, general and administrative expenses are primarily influenced by the volume of net sales of our locations, except for our corporate payroll, rent and occupancy and depreciation and amortization, which are generally fixed in nature. We control our selling, general and administrative expenses through a budgeting and reporting process that allows our personnel to adjust our expenses as trends in net sales activity are identified.
39
We expect that our selling, general and administrative expenses will increase in future periods due to our continuing growth and in part to additional legal, accounting, insurance and other expenses we expect to incur as a result of being a public company.
Income from Operations
Income from operations is gross profit less selling, general and administrative expenses. We use income from operations as an indicator of the productivity of our business and our ability to manage selling, general and administrative expenses.
Adjusted EBITDA
We define Adjusted EBITDA as net income plus interest expense, income tax expense, depreciation and amortization, stock-based compensation expense, pre-opening expenses, expenses related to bonuses paid as a result of the successful completion of our initial public offering, litigation accrual, bankruptcy-related expenses and expenses related to the acquisition of 10 stores in fiscal year 2013. In evaluating our business, we use Adjusted EBITDA and Adjusted EBITDA margin as an additional measurement tool for purposes of business decision-making, including evaluating store performance, developing budgets and managing expenditures. See “—Non-GAAP Measures.”
Results of Operations
The following table summarizes key components of our results of operations as a percentage of net sales for the periods indicated:
|
|
Fiscal Year Ended |
|
|||||||||
|
|
January 31, 2015 |
|
|
February 1, 2014 |
|
|
February 2, 2013 |
|
|||
|
Percentage of net sales: |
|
|
|
|
|
|
|
|
|
|
|
|
Net sales |
|
100.0 |
% |
|
|
100.0 |
% |
|
|
100.0 |
% |
|
Cost of goods sold |
|
67.4 |
|
|
|
67.8 |
|
|
|
69.1 |
|
|
Gross profit |
|
32.6 |
|
|
|
32.2 |
|
|
|
30.9 |
|
|
Selling, general and administrative expenses |
|
25.8 |
|
|
|
22.9 |
|
|
|
20.8 |
|
|
Bankruptcy-related expenses |
|
0.0 |
|
|
|
0.0 |
|
|
|
0.0 |
|
|
Income from operations |
|
6.8 |
|
|
|
9.3 |
|
|
|
10.1 |
|
|
Interest expense |
|
3.4 |
|
|
|
3.9 |
|
|
|
1.2 |
|
|
Income before income taxes |
|
3.4 |
|
|
|
5.4 |
|
|
|
8.9 |
|
|
Income tax expense |
|
1.3 |
|
|
|
2.0 |
|
|
|
3.6 |
|
|
Net income |
|
2.1 |
% |
|
|
3.4 |
% |
|
|
5.3 |
% |
|
Adjusted EBITDA |
|
10.0 |
% |
|
|
10.9 |
% |
|
|
11.2 |
% |
40
The following table shows our sales during the periods presented by department:
|
|
|
|
|
Fiscal Year Ended |
|
|||||||||
|
Department |
|
Product Offerings |
|
January 31, 2015 |
|
|
February 1, 2014 |
|
|
February 2, 2013 |
|
|||
|
Camping |
|
Backpacks, camp essentials, canoes and kayaks, coolers, outdoor cooking equipment, sleeping bags, tents and tools |
|
|
13.5 |
% |
|
|
12.1 |
% |
|
|
12.0 |
% |
|
Clothing |
|
Camouflage, jackets, hats, outerwear, sportswear, technical gear and work wear |
|
|
9.5 |
|
|
|
8.8 |
|
|
|
7.6 |
|
|
Fishing |
|
Bait, electronics, fishing rods, flotation items, fly fishing, lines, lures, reels, tackle and small boats |
|
|
9.5 |
|
|
|
8.8 |
|
|
|
8.2 |
|
|
Footwear |
|
Hiking boots, socks, sport sandals, technical footwear, trail shoes, casual shoes, waders and work boots |
|
|
7.4 |
|
|
|
6.6 |
|
|
|
5.8 |
|
|
Hunting and Shooting |
|
Ammunition, archery items, ATV accessories, blinds and tree stands, decoys, firearms, reloading equipment and shooting gear |
|
|
47.9 |
|
|
|
52.1 |
|
|
|
55.7 |
|
|
Optics, Electronics and Accessories |
|
Gift items, GPS devices, knives, lighting, optics (e.g. binoculars) and two-way radios |
|
|
9.5 |
|
|
|
9.1 |
|
|
|
8.5 |
|
|
Other |
|
|
|
|
2.7 |
|
|
|
2.5 |
|
|
|
2.2 |
|
|
Total |
|
|
|
|
100.0 |
% |
|
|
100.0 |
% |
|
|
100.0 |
% |
Fiscal Year 2014 Compared to Fiscal Year 2013
Net Sales. Net sales increased by $16.8 million, or 2.6%, to $660.0 million in the fiscal year 2014 compared to $643.2 million in fiscal year 2013. Net sales increased due to net sales generated from our eight new stores openings during fiscal year 2014 and a full year of the 14 stores, either opened or acquired, during fiscal year 2013 for the period of time prior to inclusion in our same store sales. These new stores generated $69.5 million in additional net sales in the fiscal year 2014 compared to fiscal year 2013. This increase from our new store openings was partially offset by a decline in our same stores sales for the period of 8.4% (or a decrease of 2.5% excluding firearms and ammunition).
Each of our departments recognized an increase in net sales in fiscal year 2014 from fiscal year 2013 except for our hunting and shooting department. Our camping, clothing, fishing, footwear and optics, electronics and accessories departments had a combined increase of $32.4 million in net sales over the prior year period as a result of the expansion of our product offerings in the clothing and footwear departments that was a result of the roll out of a “store-within-a-store” concept with certain of our key vendors and increased demand in our camping department. This increase was partially offset by an $18.3 million decrease in the hunting and shooting department as a result of decreased demand for firearms, ammunition and related products as compared to the corresponding period of fiscal year 2013. During the fourth fiscal quarter of fiscal year 2012, we experienced increased demand for firearms that continued into fiscal year 2013, due in part to the public perception during that period that federal or state legislation might be enacted that would potentially make it more difficult to purchase certain firearms, ammunition and reloading supplies. Our sales of firearms returned closer to historical sales levels during the latter part of fiscal year 2013, which when combined with sales of ammunition and related products, resulted in the decrease in same store sales for fiscal year 2014 compared to the same period in fiscal year 2013.
With respect to same store sales, four of our six departments (clothing, hunting and shooting, fishing, and optics, electronics and accessories) realized a decline in same store sales because of the decrease in demand for firearms and ammunition, as discussed above, and the associated decrease in customer traffic associated with this decreased demand. Our hunting and shooting department experienced a same store sales decline of 16.1% during fiscal year 2014 when compared to fiscal year 2013. Warm weather in our markets also adversely impacted the sales of our clothing products causing clothing department sales to decline approximately 2.0% when compared with clothing department sales from fiscal year 2013. These declines were partially offset by the camping and footwear departments, which had same store sales increases of 2.9% and 3.3%, respectively, during the same period. As of January 31, 2015, we had 47 stores included in our same store sales calculation.
During fiscal year 2014, we opened eight new stores. These eight new locations generated net sales of $51.1 million during this period. Existing stores that were not included in same store sales generated $18.4 million in additional net sales in fiscal year 2014 over fiscal year 2013.
Net sales from our e-commerce business remained flat at $7.5 million in fiscal year 2014 when compared to fiscal year 2013.
41
Gross Profit. Gross profit increased by $8.0 million, or 3.8%, to $215.2 million for fiscal year 2014 from $207.2 million for fiscal year 2013. As a percentage of net sales, gross profit increased by 0.4% to 32.6% for fiscal year 2014 from 32.2% in fiscal year 2013. The increase in gross profit from the corresponding period of the prior fiscal year was due to an increase in vendor incentives received during the year combined with a shift in the sales mix from lower margin products to higher margin products.
Selling, General and Administrative Expenses. Selling, general and administrative expenses increased by $23.2 million, or 15.8%, to $170.3 million for fiscal year 2014 from $147.1 million for fiscal year 2013. The increase in these expenses resulted from an increase in the number of stores in operation over the corresponding period of the prior year. Our payroll, rent and depreciation and amortization expenses increased $10.7 million, $4.7 million and $2.9 million, respectively, for fiscal year 2014 from fiscal year 2013. Also, as described in “Item 3. Legal Proceedings”, there was an additional $4.0 million increase in other operating expenses due to an accrual with respect to a litigation matter. These increases were partially offset by a decrease in the costs associated with our acquisition of the 10 stores in March 2013 of $2.3 million during fiscal year 2013. Our total payroll expense for the first half of fiscal year 2014 included $2.2 million in bonuses paid as a result of the successful completion of our initial public offering and pursuant to the terms of the employment agreements with our executive officers and $3.3 million in non-cash stock-based compensation, $1.2 million of which was due to accelerated vesting triggered by our initial public offering. Selling, general and administrative expenses were 25.8% of net sales in fiscal year 2014 compared to 22.9% of net sales in fiscal year 2013. Selling, general and administrative expenses increased as a percentage of net sales primarily due to the increase in bonuses and stock-based compensation expense related to our initial public offering, increased payroll, rent and pre-opening expenses from the new store locations and the litigation accrual described above.
Interest Expense. Interest expense decreased by $3.0 million, or 11.7%, to $22.5 million in fiscal year 2014 from $25.4 million for fiscal year 2013. Interest expense decreased primarily as a result of our lower debt balance during fiscal year 2014 compared to fiscal year 2013. Specifically, as described below under “—Liquidity and Capital Resources,” we used the net proceeds from our initial public offering and partial exercise of the underwriter’s overallotment to repay $73.3 million outstanding under our term loan facility in April and May of 2014. Additionally, we refinanced our term loan in the fourth quarter of 2014, which resulted in additional interest expense of $5.7 million in fiscal year 2014 related to this refinance and increased our outstanding amount from $158.8 million to $160.0 million. In August 2013, we refinanced our term loan facility and increased the outstanding amount under this facility by $110.0 million, from $125.0 million to $235.0 million, and, as a result of this refinance, we recorded $8.1 million of interest expense in fiscal year 2013.
Income Taxes. We recorded an income tax expense of $8.6 million for fiscal year 2014 compared to income tax expense of $12.8 million for fiscal year 2013. Our effective tax rate for fiscal year 2014 of 38.5% increased from the effective tax rate for fiscal year 2013 of 37.1%. The increase was primarily due to legislative changes which impacted the apportionment methods in certain states where we operate.
Fiscal Year 2013 Compared to Fiscal Year 2012
Net Sales. Net sales increased by $116.2 million, or 22.1%, to $643.2 million in fiscal year 2013 compared to $526.9 million in fiscal year 2012. This increase was due primarily to the additional $132.0 million of net sales generated from 14 new stores, consisting of our four new store openings during fiscal year 2013 and our acquisition of 10 stores in March 2013. This increase was offset by a 3.7% decrease in our same store sales in fiscal year 2013 (or an increase of 0.6% excluding net sales of firearms). Each of our departments recognized an increase in net sales from fiscal year 2012, with the largest increase generated by our hunting and shooting department, which had an increase in net sales of $41.7 million. The increase in net sales in each of our departments was also the result of net sales generated by our 14 new stores in fiscal year 2013. Our net sales were also supplemented by an increase in customer visits. Our customer visits increased by 5.9 million, or 38.2%, to approximately 21.2 million customer visits during fiscal year 2013 compared to 15.4 million customer visits during fiscal year 2012. We calculate customer visits as the total number of visits to our stores, including repeat visits, regardless of whether a purchase is made.
The 53rd week in fiscal year 2012 caused a one-week shift in our fiscal year 2013 calendar, resulting in the first quarter of fiscal year 2013 being later by one week relative to the quarter-ending date last fiscal year, which we refer to as a retail calendar shift. If there are seasonal influences near quarter-end dates, year-over-year comparisons may be impacted by the retail calendar shift. Our reported same store sales results for fiscal year 2012 have been adjusted for the retail calendar shift. Accordingly, our same store sales results for fiscal year 2013, which is the 52-week period ended February 1, 2014, are compared with our same store sales results for the 52-week period ended February 2, 2013 (instead of the 53-week period ended February 2, 2013, which was the period for fiscal year 2012). We had a decrease in same store sales of $19.0 million, or 3.7%, to $492.3 million for the fiscal year ended February 1, 2014 from $511.3 million for the fiscal year ended February 2, 2013. We had an increase in same store sales of 7.2% for the 39 weeks ended November 2, 2013 over the 39 weeks ended November 3, 2012. However, we had a decrease in same store sales of 24.9% for the fourth fiscal quarter of fiscal year 2013 compared to the fourth fiscal quarter of fiscal year 2012, which resulted primarily from a decrease in same store sales of our hunting and fishing department in the fourth fiscal quarter of fiscal year 2013. During the fourth fiscal quarter of fiscal year 2012, we experienced an increased demand for firearms that continued into the earlier part of fiscal year
42
2013, due in part to the public perception during that period that federal or state legislation might be enacted that would potentially make it more difficult to purchase certain firearms. Our sales of firearms returned closer to historical sales levels during fiscal year 2013, which resulted in the decrease in same store sales for the fourth fiscal quarter of fiscal year 2013 compared to the same period in fiscal year 2012. All of our other departments recognized an increase in same store sales in fiscal year 2013 except for our camping department, which decreased 0.2%. Our same store sales excluding net sales of firearms increased 0.6% from fiscal year 2012 to fiscal year 2013, compared to an increase of 19.8% from fiscal year 2011 to fiscal year 2012. The growth from 2012 to 2013 decreased compared to the growth from 2011 to 2012 primarily because we experienced a decrease in same store sales of ammunition and other hunting equipment that coincided with our decrease in same store sales of firearms, as discussed above. We had 33 stores included in our same store sales calculation as of February 1, 2014. The stores included in same store sales generated $7.0 million in net sales during the 53rd week of fiscal year 2012.
During fiscal year 2013, we opened four new stores in the following locations: Farmington, New Mexico; Lewiston, Idaho; Cheyenne, Wyoming; and Logan, Utah. These four new locations generated net sales of $28.1 million in fiscal year 2013. In March 2013, we also re-acquired 10 stores previously operated under our Sportsman’s Warehouse banner that are located in Montana, Oregon and Washington. In fiscal year 2013, these 10 stores generated $103.9 million in net sales. Existing stores that were not included in same store sales generated $8.3 million in additional net sales in fiscal year 2013 over the same period in fiscal 2012.
Net sales from our e-commerce business increased by $2.0 million, or 36.4%, from $5.5 million in fiscal year 2012 to $7.5 million in fiscal year 2013.
Gross Profit. Gross profit increased by $44.6 million, or 27.4%, to $207.2 million for fiscal year 2013 from $162.6 million for fiscal year 2012. Gross profit increased as a result of the increased net sales we experienced during fiscal year 2013. As a percentage of net sales, gross profit increased by 1.3% to 32.2% for fiscal year 2013 from 30.9% in fiscal year 2012. We believe the increase in our gross margin for fiscal year 2013 represents the shift we had been seeing to higher margin products, such as clothing and footwear, prior to the latter part of fiscal year 2012. Our gross margin slightly decreased in fiscal year 2012 compared to fiscal year 2011 because of the shift in sales to firearms and ammunitions in the latter part of fiscal year 2012, which offset the increase in gross margin we had otherwise been experiencing. We believe the increase in gross margin in fiscal year 2013 is more reflective of our recent trends in product sales mix.
Selling, General and Administrative Expenses. Selling, general and administrative expenses increased by $37.7 million, or 34.5%, to $147.1 million in fiscal year 2013 from $109.4 million in fiscal year 2012. The increase in these expenses resulted primarily from the increased net sales we experienced in fiscal year 2013. Our payroll and rent increased $16.6 million and $9.9 million, respectively, from fiscal year 2012, in part as a result of the opening of four new stores and the acquisition of 10 stores during fiscal year 2013. In addition, we incurred $2.3 million in acquisition expenses associated with the purchase of the 10 stores in March 2013. Selling, general and administrative expenses were 22.9% of net sales in fiscal year 2013 and 20.8% of net sales in fiscal year 2012. Selling, general and administrative expenses increased as a percentage of net sales due to the acquisition expenses incurred to acquire the 10 stores and an increase in our rent and payroll as a percentage of net sales.
Interest Expense. Interest expense increased by $19.1 million to $25.4 million in fiscal year 2013 from $6.3 million in fiscal year 2012. Interest expense increased as a result of our higher debt balance throughout fiscal year 2013, a prepayment penalty of $2.5 million on the repayment of our term loan and the write-off of debt issuance costs and other non-cash charges of $2.6 million. We entered into a $125.0 million term loan in November 2012 and subsequently refinanced it in August 2013 with a new $235.0 million term loan facility.
Income Taxes. We had income tax expense of $12.8 million for fiscal year 2013 compared to income tax expense of $19.1 million in fiscal year 2012. Our effective tax rate for fiscal year 2013 of 37.1% decreased from the effective tax rate for fiscal year 2012 of 40.5% as a result of a reduction in non-deductible interest associated with debt that was repaid at the beginning of fiscal year 2013 as well as a reduction of our effective state income tax rate as we opened stores in states with no applicable state income tax and changes to the income apportionment methods in certain states where we operate.
Seasonality
Due to holiday buying patterns and the openings of hunting season across the country, net sales are typically higher in the third and fourth fiscal quarters than in the first and second fiscal quarters. We also incur additional expenses in the third and fourth fiscal quarters due to higher volume and increased staffing in our stores. We anticipate our net sales will continue to reflect this seasonal pattern.
The timing of our new retail store openings also may have an impact on our quarterly results. First, we incur certain one-time expenses related to opening each new retail store, all of which are expensed as they are incurred. Second, most store expenses
43
generally vary proportionately with net sales, but there is also a fixed cost component, which includes occupancy costs. These fixed costs typically result in lower store profitability during the initial period after a new retail store opens. Due to both of these factors, new retail store openings may result in a temporary decline in operating profit, in dollars and/or as a percentage of net sales.
Weather conditions affect outdoor activities and the demand for related clothing and equipment. Customers’ demand for our products, and, therefore, our net sales, can be significantly impacted by weather patterns on a local, regional and national basis.
Quarterly Results of Operations
The following table sets forth unaudited financial and operating data for each fiscal quarter of fiscal years 2014 and 2013 and gives effect to the 2.87-for-1 stock split of our common stock and the 2.87-for-1 stock split of our restricted nonvoting common stock effected on April 3, 2014. This quarterly information has been prepared on a basis consistent with our audited financial statements and includes all normal recurring adjustments that we consider necessary for a fair presentation of the information shown. This information should be read in conjunction with “Part II, Item 6. Selected Financial Data” and “Part II, Item 8. Financial Statements and Supplementary Data” of this 10-K. Our quarterly operating results may fluctuate significantly as a result of the factors described above and a variety of other factors, and operating results for any fiscal quarter are not necessarily indicative of results for a full fiscal year.
|
|
|
|
|
|
|
|
|
|
|
|
|
|
|
|
|
|
|
|
|
|
|
|
|
|
|
|
|
|
|
|
|
|
|
|
|
Fiscal Year 2014 |
|
|
Fiscal Year 2013 |
|
||||||||||||||||||||||||||
|
|
|
Fourth Quarter |
|
|
Third Quarter |
|
|
Second Quarter |
|
|
First Quarter |
|
|
Fourth Quarter |
|
|
Third Quarter |
|
|
Second Quarter |
|
|
First Quarter |
|
||||||||
|
|
|
(unaudited) |
|
|||||||||||||||||||||||||||||
|
|
|
(in thousands, except per share data, percentages and number of stores) |
|
|||||||||||||||||||||||||||||
|
Net sales |
|
$ |
185,578 |
|
|
$ |
182,532 |
|
|
$ |
159,468 |
|
|
$ |
132,425 |
|
|
$ |
175,728 |
|
|
$ |
175,059 |
|
|
$ |
155,856 |
|
|
$ |
136,520 |
|
|
Gross profit |
|
|
61,601 |
|
|
|
60,651 |
|
|
|
52,827 |
|
|
|
40,128 |
|
|
|
56,884 |
|
|
|
55,223 |
|
|
|
52,192 |
|
|
|
42,931 |
|
|
Income (loss) from operations (1)(2) |
|
|
14,145 |
|
|
|
18,625 |
|
|
|
12,343 |
|
|
(221) |
|
|
|
16,386 |
|
|
|
16,983 |
|
|
|
16,050 |
|
|
|
10,616 |
|
|
|
Net income (loss) (2)(3) |
|
|
3,173 |
|
|
|
8,916 |
|
|
|
5,063 |
|
|
(3,368) |
|
|
|
7,412 |
|
|
|
2,222 |
|
|
|
7,657 |
|
|
|
4,459 |
|
|
|
Earnings (loss) per share |
|
|
0.08 |
|
|
|
0.21 |
|
|
|
0.12 |
|
|
(0.1) |
|
|
|
0.22 |
|
|
|
0.07 |
|
|
|
0.23 |
|
|
|
0.14 |
|
|
|
As a percentage of full year results: |
|
|
|
|
|
|
|
|
|
|
|
|
|
|
|
|
|
|
|
|
|
|
|
|
|
|
|
|
|
|
|
|
|
Net sales |
|
|
28.1 |
% |
|
|
27.7 |
% |
|
|
24.2 |
% |
|
|
20.0 |
% |
|
|
27.3 |
% |
|
|
27.2 |
% |
|
|
24.2 |
% |
|
|
21.2 |
% |
|
Gross profit |
|
|
28.6 |
|
|
|
28.2 |
|
|
|
24.6 |
|
|
|
18.6 |
|
|
|
27.4 |
|
|
|
26.6 |
|
|
|
25.2 |
|
|
|
20.7 |
|
|
Income (loss) from operations |
|
|
31.4 |
|
|
|
41.3 |
|
|
|
27.5 |
|
|
(0.5) |
|
|
|
27.3 |
|
|
|
28.3 |
|
|
|
26.7 |
|
|
|
17.7 |
|
|
|
Net income (loss) |
|
|
18.5 |
|
|
|
52.0 |
|
|
|
29.5 |
|
|
(20.7) |
|
|
|
34.1 |
|
|
|
10.2 |
|
|
|
35.2 |
|
|
|
20.5 |
|
|
|
Operating data: |
|
|
|
|
|
|
|
|
|
|
|
|
|
|
|
|
|
|
|
|
|
|
|
|
|
|
|
|
|
|
|
|
|
Number of stores open at end of period |
|
|
55 |
|
|
|
55 |
|
|
|
54 |
|
|
|
51 |
|
|
|
47 |
|
|
|
47 |
|
|
|
46 |
|
|
|
45 |
|
|
(1) |
Includes acquisition costs of $7,154 and $2,170 (in thousands) for the third, second and first quarters of fiscal year 2013, respectively. |
|
(2) |
Includes, for the fourth quarter of fiscal year 2014, an accrual of $4.0 million with respect to the litigation matter discussed in “Item 3. Legal Proceedings”. |
|
(3) |
Includes, for the fourth quarter of fiscal year 2014 and the third quarter of fiscal year 2013, term loan refinance-related fees of $5.7 million and $5.3 million, respectively. |
Liquidity and Capital Resources
Our primary capital requirements are for seasonal working capital needs and capital expenditures related to opening new stores. Our sources of liquidity to meet these needs have primarily been borrowings under our revolving credit facility, operating cash flows and short and long-term debt financings from banks and financial institutions. We believe that our cash on hand, cash generated by operating activities and funds available under our revolving credit facility will be sufficient to finance our operating activities for at least the next twelve months.
For fiscal year 2014, we incurred approximately $30.2 million in capital expenditures. We expect capital expenditures between $30.0 million and $35.0 million for the next twelve months. We intend to fund these initiatives with our operating cash flows and funds available under our revolving credit facility. Other investment opportunities, such as potential strategic acquisitions or store expansion rates in excess of those presently planned, may require additional funding.
44
Cash flows from operating, investing and financing activities are shown in the following table:
|
|
Fiscal Year Ended |
|
|||||
|
|
January 31, |
|
|
February 1, |
|
||
|
|
2015 |
|
|
2014 |
|
||
|
|
(in thousands) |
|
|||||
|
Cash flows provided by operating activities |
$ |
20,473 |
|
|
$ |
34 |
|
|
Cash flows used in investing activities |
|
(30,167 |
) |
|
|
(68,059 |
) |
|
Cash flows provided by financing activities |
|
10,091 |
|
|
|
32,864 |
|
|
Cash and cash equivalents at end of period |
|
1,751 |
|
|
|
1,354 |
|
Net cash provided by operating activities was $20.5 million for fiscal year 2014, compared to $34,000 for fiscal year 2013. Our net cash provided from operating activities increased primarily due to favorable changes in income taxes, accrued expenses, deferred rent, inventory, stock-based compensation and depreciation of $10.4 million, $6.1 million, $5.0 million, $3.7 million, $2.9 million and $2.6 million, respectively. These changes were partially offset by an unfavorable change in deferred income taxes and accounts receivable of $2.2 million and $1.1 million, respectively, and lower net income of $8.0 million.
Net cash used in investing activities was $30.2 million for fiscal year 2014 compared to net cash used in investing activities of $68.1 million for fiscal year 2013. During fiscal year 2013, we acquired 10 stores for $47.8 million of cash. Capital expenditures increased $9.8 million to $30.2 million for fiscal year 2014 compared to $20.4 million for fiscal year 2013. This increase was primarily a result of opening eight new stores in fiscal year 2014 compared to four new stores opened in fiscal year 2013, as well as additional racking and equipment we acquired for our distribution center.
Net cash provided by financing activities was $10.1 million for fiscal year 2014, compared to $32.9 million for fiscal year 2013. Total principal payments on long-term debt during fiscal year 2014 were $234.2 million compared to $125.9 million in fiscal year 2013. During the first quarter of fiscal year 2014, we completed our initial public offering and, in the second quarter of fiscal year 2014, the underwriters partially exercised the over-allotment option granted at the time of the initial public offering to purchase additional shares of our common stock. Through these transactions, we received total net proceeds, after deducting underwriting discounts and commissions and our offering expenses of $3.3 million, of $73.3 million. These proceeds were used to repay amounts outstanding under our term loans. During the fourth quarter of fiscal year 2014, we refinanced our term loan. Principal payments made to pay off the old term loan totaled $158.8 million and the term loan was re-issued for $160.0 million. During the third quarter of fiscal year 2013, we refinanced our term loan. Principal payments made to pay off the old term loan totaled $124.1 million and the term loan was re-issued for $235.0 million. Also, during the fourth quarter of fiscal year 2013, we paid dividends to our shareholders totaling $101.1 million. In addition to these changes, we had net borrowings of approximately $12.8 million during fiscal year 2014 on our revolving credit facility compared to $29.1 million during fiscal year 2013.
Our outstanding debt consists of our senior secured revolving line of credit and our senior secured term loans.
Senior Secured Revolving Credit Facility. We have a senior secured revolving credit facility with Wells Fargo Bank, National Association that provides for borrowings in the aggregate amount of up to $135.0 million, subject to a borrowing base calculation. In connection with the refinancing of our senior secured term loans in December 2014 discussed below, the lenders under our senior secured revolving credit facility agreed to increase our maximum borrowing availability from $105.0 million to $135.0 million. All borrowings under the revolving credit facility are limited to a borrowing base equal to roughly (1) the lesser of (a) 90% of the net orderly liquidation value of our eligible inventory and (b) 75% of the lower of cost or market value of our eligible inventory, plus (2) 90% of the eligible accounts receivable, less certain reserves against outstanding gift cards, layaway deposits and amounts outstanding under commercial letters of credit, each term as defined in the credit agreement. As of January 31, 2015, $73.2 million was available for borrowing and $41.9 million was outstanding under the revolving credit facility. The revolving credit facility matures on December 3, 2019.
Each of the subsidiaries of Sportsman’s Warehouse Holdings, Inc., or Holdings, is a borrower under the revolving credit facility, and all obligations under the revolving credit facility are guaranteed by Holdings. All of our obligations under the revolving credit facility are secured by a lien on substantially all of Holdings’ tangible and intangible assets and the tangible and intangible assets of all of our subsidiaries, including a pledge of all capital stock of each of our subsidiaries. The lien securing the obligations under the revolving credit facility is a first priority lien as to certain liquid assets, including cash, accounts receivable, deposit accounts and inventory. In addition, the credit agreement contains provisions that enable Wells Fargo to require us to maintain a lock-box for the collection of all receipts.
45
Borrowings under the revolving credit facility bear interest based on either, at our option, the base rate or LIBOR, in each case plus an applicable margin. The base rate is the higher of (1) Wells Fargo’s prime rate, (2) the federal funds rate (as defined in the credit agreement) plus 0.50% and (3) the one-month LIBOR (as defined in the credit agreement) plus 1.00%. The applicable margin for loans under the revolving credit facility, which varies based on the average daily availability, ranges from 0.75% to 1.25% per year for base rate loans and from 1.75% to 2.25% per year for LIBOR loans. The weighted average interest rate on the amount outstanding under the revolving credit facility as of January 31, 2015 was 2.21%.
Interest on base rate loans is payable monthly in arrears and interest on LIBOR loans is payable based on the LIBOR interest period selected by us, which can be 30, 60 or 90 days. All amounts that are not paid when due under our revolving credit facility will accrue interest at the rate otherwise applicable plus 2.00% until such amounts are paid in full.
We may be required to make mandatory prepayments under the revolving credit facility in the event of a disposition of certain property or assets, in the event of receipt of certain insurance or condemnation proceeds, upon the issuance of certain debt or equity securities, upon the incurrence of certain indebtedness for borrowed money or upon the receipt of certain payments not received in the ordinary course of business.
The revolving credit facility contains customary affirmative and negative covenants, including covenants that limit our ability to incur, create or assume certain indebtedness, to create, incur or assume certain liens, to make certain investments, to make sales, transfers and dispositions of certain property and to undergo certain fundamental changes, including certain mergers, liquidations and consolidations. The revolving credit facility also requires us to maintain a minimum availability at all times of not less than 10% of the gross borrowing base, and in any event, not less than $5.0 million. The revolving credit facility also contains customary events of default. As of January 31, 2015, we were in compliance with all covenants under the revolving credit facility.
Senior Secured Term Loans. On December 3, 2014, our wholly owned subsidiary, Sportsman’s Warehouse, Inc., refinanced its existing $235.0 million term loan facility, of which $158.8 million was outstanding as of December 3, 2014, and entered into a new $160.0 million senior secured term loan facility with a financial institution. The term loan was issued at a price of 99% of the aggregate principal amount and has a maturity date of December 3, 2020.
All of Sportsman’s Warehouse, Inc.’s obligations under the term loan are guaranteed by Holdings, Minnesota Merchandising Corporation, a wholly owned subsidiary of Holdings, and each of Sportsman’s Warehouse, Inc.’s subsidiaries.
The term loan is secured by a lien on substantially all of the tangible and intangible assets of Sportsman’s Warehouse, Inc. The lien securing the obligations under the term loan is a first priority lien as to certain non-liquid assets, including equipment, intellectual property, proceeds of assets sales and other personal property.
The term loan requires quarterly principal payments of $0.4 million payable on the last business day of each fiscal quarter continuing up to and including October 30, 2020. A final installment payment consisting of the remaining unpaid balance is due on December 3, 2020.
As a result of this refinance, we recorded $5.7 million in expense related to the write-off of term loan fees, which included deferred financing fees, the discount, and a prepayment penalty on the prior term loan.
Sportsman’s Warehouse, Inc. may be required to make mandatory prepayments on the term loan in the event of, among other things, certain asset sales, the receipt of payment in respect of certain insurance claims or upon the issuance or incurrence of certain indebtedness. Sportsman’s Warehouse, Inc. may also be required to make mandatory prepayments based on any excess cash flows as defined in the term loan agreement.
The term loan bears interest at a rate per annum equal to the one-, two-, three-, or six-month LIBOR (or, the nine- or 12-month LIBOR), as defined in the term loan agreement, at our election, which cannot be less than 1.25%, plus an applicable margin of 6.00%. As of January 31, 2015, there was $159.6 million outstanding under the term loan.
The term loan contains customary affirmative and negative covenants, including covenants that limit our ability to incur, create or assume certain indebtedness, to incur or assume certain liens, to purchase, hold or acquire certain investments, to declare or make certain dividends and distributions and to engage in certain mergers, consolidations and asset sales. The term loan also requires us to comply with specified financial covenants, including a minimum interest coverage ratio and a maximum total net leverage ratio. The term loan also contains customary events of default. As of January 31, 2015, we were in compliance with all covenants under the term loan.
46
Sportsman’s Warehouse, Inc.’s prior term loan that was repaid with our refinancing on December 3, 2014 was a $235.0 million senior secured term loan facility, consisting of a $185.0 million tranche and a $50.0 million tranche, with Credit Suisse AG as administrative agent and collateral agent. The prior term loans had a maturity date of August 20, 2019.
Under the prior term loans, Sportsman’s Warehouse, Inc. was required to make quarterly principal payments of $0.6 million on the last business day of each fiscal quarter through maturity. We used all of the $73.3 million of net proceeds from our initial public offering and the underwriters’ over-allotment exercise to repay amounts outstanding under our prior term loans on a pro rata basis between the two tranches in April and May 2014.
Critical Accounting Policies
Our financial statements are prepared in accordance with generally accepted accounting principles in the United States, or GAAP. In connection with the preparation of the financial statements, we are required to make assumptions, make estimates and apply judgment that affect the reported amounts of assets, liabilities, revenue, expenses and the related disclosures. We base our assumptions, estimates and judgments on historical experience, current trends and other factors that we believe to be relevant at the time the condensed consolidated financial statements are prepared. On a regular basis, we review the accounting policies, assumptions, estimates and judgments to ensure that our financial statements are presented fairly and in accordance with GAAP. However, because future events and their effects cannot be determined with certainty, actual results could differ from our assumptions and estimates, and such differences could be material.
Our significant accounting policies are discussed in Note 2 of the Notes to our condensed consolidated financial statements. We believe that the following accounting policies are the most critical to aid in fully understanding and evaluating our reported financial results.
Revenue Recognition
We recognize revenue on our retail sales at the time of the sale in the store. We record a reserve for estimated product returns in each reporting period based on our historical experience. Had our estimate of product returns been lower or higher by 10% as of January 31, 2015, our operating income would have been correspondingly higher or lower by approximately $0.1 million. Our policy regarding gift cards sold is to record revenue as the gift cards are redeemed for merchandise. Prior to their redemption, the gift cards are recorded as a liability. Gift card breakage income is recognized based upon historical redemption patterns and represents the balance of gift cards for which we believe the likelihood of redemption by the customer is remote. During the fiscal year ended January 31, 2015, we recognized $0.8 million in gift card breakage income. During the fiscal year ended February 1, 2014, we did not recognize any material gift card breakage income. We include gift card breakage income as a reduction in selling, general and administrative expenses, if applicable. Had our estimate of breakage on our recorded liability for gift cards been lower or higher by 10% of the recorded liability as of January 31, 2015, our selling, general and administrative expenses would have been correspondingly higher or lower by approximately $0.9 million.
Inventory Valuation
We value our inventory at the lower of cost or market. Cost is determined using the weighted average cost method. We estimate a provision for inventory shrinkage based on our historical inventory accuracy rates as determined by periodic cycle counts. The allowance for damaged goods from returns is based upon our historical experience. We also adjust inventory for obsolete or slow moving inventory based on inventory productivity reports and by specific identification of obsolete or slow moving inventory. Had our estimated inventory reserves been lower or higher by 10% as of January 31, 2015, our cost of sales would have been correspondingly lower or higher by approximately $0.4 million.
Valuation of Long-Lived Assets
We review our long-lived assets with definite lives for impairment whenever events or changes in circumstances may indicate that the carrying value of an asset may not be recoverable. We use an estimate of the future undiscounted net cash flows of the related asset or group of assets over their remaining useful lives in measuring whether the assets are recoverable. If the carrying amount of an asset exceeds its estimated future cash flows, an impairment charge is recognized for the amount by which the carrying amount exceeds the estimated fair value of the asset. Impairment of long-lived assets is assessed at the lowest levels for which there are identifiable cash flows that are independent of other groups of assets. Assets to be disposed of are reported at the lower of the carrying amount or fair value, less the estimated costs to sell. No impairment charge to long-lived assets was recorded during the fiscal year ended January 31, 2015 or February 1, 2014.
47
Off Balance Sheet Arrangements
We are not party to any off balance sheet arrangements.
Contractual Obligations
The following table summarizes our contractual obligations as of January 31, 2015 and the effect such obligations are expected to have on our liquidity and cash flows in future periods.
|
|
|
|
|
|
|
|
|
|
|
|
|
|
|
|
|
|
|
|
|
|
|
|
|
|
|
Payments Due by Period |
|
|||||||||||||
|
|
Total |
|
|
Less than 1 year |
|
|
1-3 years |
|
|
3-5 years |
|
|
More than 5 years |
|
|||||
|
|
(in thousands) |
|
|||||||||||||||||
|
Long-term debt obligations (1) |
$ |
226,171 |
|
|
$ |
13,256 |
|
|
$ |
26,159 |
|
|
$ |
25,904 |
|
|
$ |
160,852 |
|
|
Operating lease obligations (2) |
|
286,295 |
|
|
|
33,283 |
|
|
|
67,633 |
|
|
|
63,878 |
|
|
|
121,501 |
|
|
Standby letters of credit |
|
400 |
|
|
|
400 |
|
|
|
— |
|
|
|
— |
|
|
|
— |
|
|
Purchase obligations (3) |
|
4,119 |
|
|
|
3,524 |
|
|
|
595 |
|
|
|
— |
|
|
|
— |
|
|
(1) |
Long-term debt obligations do not reflect the amounts outstanding under our revolving credit facility, because those amounts are considered current liabilities, and do not reflect any mandatory prepayments of our term loans that may be required upon the occurrence of certain events, which are described above under “—Liquidity and Capital Resources.” Long-term obligations include interest to be paid until maturity. For loans that have variable rate interest, we have calculated future interest obligations based on the interest rate for that loan as of January 31, 2015. |
|
(2) |
Operating lease obligations in the table above do not include additional payments associated with common area maintenance, real estate, taxes and insurance. Such payments were $6.3 million, 5.0 million and $3.6 million in fiscal years 2014, 2013 and 2012, respectively. |
|
(3) |
In the ordinary course of business, we enter into arrangements with vendors to purchase merchandise in advance of expected delivery. Because these purchase orders do not contain any termination payments or other penalties if cancelled, they are not included in this table of contractual obligations. In accordance with U.S. generally accepted accounting principles, these obligations are not recorded in our financial statements. |
Non-GAAP Measures
In evaluating our business, we use Adjusted EBITDA and Adjusted EBITDA margin as supplemental measures of our operating performance. We define Adjusted EBITDA as net income plus interest expense, income tax expense, depreciation and amortization, stock-based compensation expense, pre-opening expenses, expenses related to bonuses paid as a result of the successful completion of our initial public offering, litigation accrual, bankruptcy-related expenses and expenses related to the acquisition of 10 stores in fiscal year 2013. Adjusted EBITDA margin means, for any period, the Adjusted EBITDA for that period divided by the net sales for that period. We consider Adjusted EBITDA and Adjusted EBITDA margin important supplemental measures of our operating performance and believe they are frequently used by analysts, investors and other interested parties in the evaluation of companies in our industry. Other companies in our industry, however, may calculate Adjusted EBITDA and Adjusted EBITDA margin differently than we do. Management also uses Adjusted EBITDA and Adjusted EBITDA margin as additional measurement tools for purposes of business decision-making, including evaluating store performance, developing budgets and managing expenditures.
Adjusted EBITDA is not defined under GAAP and is not a measure of operating income, operating performance or liquidity presented in accordance with GAAP. Adjusted EBITDA has limitations as an analytical tool, and when assessing our operating performance, you should not consider Adjusted EBITDA in isolation or as a substitute for net income or other condensed consolidated income statement data prepared in accordance with GAAP. Some of these limitations include, but are not limited to:
|
· |
Adjusted EBITDA does not reflect our cash expenditures or future requirements for capital expenditures or contractual commitments; |
|
· |
Adjusted EBITDA does not reflect changes in, or cash requirements for, our working capital needs; |
|
· |
Adjusted EBITDA may be defined differently by other companies, and, therefore, it may not be directly comparable to the results of other companies in our industry; |
48
|
· |
Adjusted EBITDA does not reflect the interest expense, or the cash requirements necessary to service interest or principal payments, on our debt; and |
|
· |
Adjusted EBITDA does not reflect income taxes or the cash requirements for any tax payments. |
The following table presents a reconciliation of net income, the most directly comparable financial measure presented in accordance with GAAP, to Adjusted EBITDA for the fiscal years ended January 31, 2015, February 1, 2014, and February 2, 2013.
|
|
Fiscal Year Ended |
|
|||||||||
|
|
January 31, |
|
|
February 1, |
|
|
February 2, |
|
|||
|
|
2015 |
|
|
2014 |
|
|
2013 |
|
|||
|
|
|
|
|||||||||
|
Net income |
$ |
13,784 |
|
|
$ |
21,750 |
|
|
$ |
28,074 |
|
|
Plus: |
|
|
|
|
|
|
|
|
|
|
|
|
Interest expense |
|
22,480 |
|
|
|
25,447 |
|
|
|
6,321 |
|
|
Income tax expense |
|
8,628 |
|
|
|
12,838 |
|
|
|
19,076 |
|
|
Depreciation and amortization |
|
9,150 |
|
|
|
6,277 |
|
|
|
3,431 |
|
|
Stock-based compensation expense (1) |
|
3,293 |
|
|
|
365 |
|
|
|
— |
|
|
Pre-opening expenses (2) |
|
2,717 |
|
|
|
1,653 |
|
|
|
1,441 |
|
|
IPO bonus (3) |
|
2,200 |
|
|
|
— |
|
|
|
— |
|
|
Litigation accrual (4) |
|
4,000 |
|
|
|
— |
|
|
|
— |
|
|
Bankruptcy-related expenses (benefits) (5) |
|
— |
|
|
|
55 |
|
|
|
(263 |
) |
|
Acquisition expenses (6) |
|
— |
|
|
|
2,331 |
|
|
|
959 |
|
|
Adjusted EBITDA |
$ |
66,252 |
|
|
$ |
70,716 |
|
|
$ |
59,039 |
|
|
|
|
|
|
|
|
|
|
|
|
|
|
|
Adjusted EBITDA margin |
|
10.0 |
% |
|
|
10.9 |
% |
|
|
11.2 |
% |
|
(1) |
Stock-based compensation expense represents non-cash expenses related to equity instruments granted to employees under our 2013 Performance Incentive Plan. |
|
(2) |
Pre-opening expenses include expenses incurred in the preparation and opening of a new store location, such as payroll, travel and supplies, but do not include the cost of the initial inventory or capital expenditures required to open a location. |
|
(3) |
As a result of the completion of our initial public offering and pursuant to the terms of the employment agreements with our executive officers, we paid $2.2 million in bonuses to our executive officers. |
|
(4) |
On March 9, 2015, a jury awarded $11.9 million against the defendants as outlined in “Item 3. Legal Proceedings”. In conjunction with the award, we recorded a $4.0 million accrual related to this case. |
|
(5) |
We incurred certain costs related to our restructuring and emergence from Chapter 11 bankruptcy and included a liability as part of the reorganization value at August 14, 2009, the date of emergence from bankruptcy. Bankruptcy-related expenses are those amounts that are greater than the initial estimated restructuring costs, whereas bankruptcy-related benefits are those amounts that are less than the initial estimated costs. They are expensed as incurred. |
|
(6) |
Acquisition expenses for fiscal year 2013 relate to the costs associated with the acquisition of our 10 previously operated stores in Montana, Oregon and Washington. Acquisition expenses for fiscal year 2012 relate to legal and consulting expenses related to potential merger and acquisition activity. |
Recent Accounting Pronouncements
For a description of recent accounting pronouncements, see the notes to our condensed consolidated financial statements. Under the Jumpstart Our Business Startup Act, “emerging growth companies” (“EGCs”) can delay adopting new or revised accounting standards until such time as those standards apply to private companies. We have irrevocably elected not to avail ourselves of this exemption from new or revised accounting standards, and, therefore, we will be subject to the same new or revised accounting standards as other public companies that are not EGCs.
We will continue to be an EGC for a period up to the end of the fifth fiscal year after our initial public offering. We could cease to be an EGC earlier than this five-year period if our total annual gross revenues equal or exceed $1 billion in a fiscal year, if we issue more than $1 billion in non-convertible debt over a three-year period or if we become a “large accelerated filer” (which requires,
49
among other things, the market value of our common stock held by non-affiliates to be at least $700 million as of the last business day of our second fiscal quarter of any fiscal year). For further information, see Part I, Item 1A. “Risk Factors—We are an EGC within the meaning of the JOBS Act and we cannot be certain if the reduced reporting requirements applicable to EGCs will make our common stock less attractive to investors.”
ITEM 7A. QUANTITATIVE AND QUALITATIVE DISCLOSURES ABOUT MARKET RISK
Our principal exposure to market risk relates to changes in interest rates. Our revolving credit facility and term loans carry floating interest rates that are tied to LIBOR, the federal funds rate and the prime rate, and, therefore, our income and cash flows will be exposed to changes in interest rates to the extent that we do not have effective hedging arrangements in place. We historically have not used interest rate swap agreements to hedge the variable cash flows associated with the interest on our credit facilities. At January 31, 2015, the weighted average interest rate on our borrowings under our revolving credit facility was 2.21%. Based on a sensitivity analysis at January 31, 2015, assuming the amount outstanding under our revolving credit facility would be outstanding for a full year, a 100 basis point increase in interest rates would increase our annual interest expense by approximately $0.4 million. As long as LIBOR is less than 1.25%, the interest rate on our $160.0 million term loan will be fixed at 7.25%. Since we entered into the term loan facility on December 3, 2014, LIBOR has not exceeded 1.25%. We do not use derivative financial instruments for speculative or trading purposes. However, this does not preclude our adoption of specific hedging strategies in the future.
50
ITEM 8. FINANCIAL STATEMENTS AND SUPPLEMENTARY DATA
TABLE OF CONTENTS
|
|
|
Page |
|
|
52 |
|
|
|
CONSOLIDATED FINANCIAL STATEMENTS: |
|
|
|
53 |
|
|
|
54 |
|
|
|
55 |
|
|
|
56 |
|
|
|
57 |
51
Report of Independent Registered Public Accounting Firm
The Board of Directors and Stockholders
Sportsman’s Warehouse Holdings, Inc.:
We have audited the accompanying consolidated balance sheets of Sportsman’s Warehouse Holdings, Inc. and subsidiaries as of January 31, 2015 and February 1, 2014, and the related consolidated statements of income, stockholders’ equity (deficit), and cash flows for each of the fiscal years in the three-year period ended January 31, 2015. In connection with our audits of the consolidated financial statements, we also have audited the financial statement schedule. These consolidated financial statements and financial statement schedule are the responsibility of the Company’s management. Our responsibility is to express an opinion on these consolidated financial statements and financial statement schedule based on our audits.
We conducted our audits in accordance with the standards of the Public Company Accounting Oversight Board (United States). Those standards require that we plan and perform the audit to obtain reasonable assurance about whether the financial statements are free of material misstatement. An audit includes examining, on a test basis, evidence supporting the amounts and disclosures in the financial statements. An audit also includes assessing the accounting principles used and significant estimates made by management, as well as evaluating the overall financial statement presentation. We believe that our audits provide a reasonable basis for our opinion.
In our opinion, the consolidated financial statements referred to above present fairly, in all material respects, the financial position of Sportsman’s Warehouse Holdings, Inc. and subsidiaries as of January 31, 2015 and February 1, 2014, and the results of their operations and their cash flows for each of the fiscal years in the three-year period ended January 31, 2015, in conformity with U.S. generally accepted accounting principles. Also in our opinion, the related financial statement schedule, when considered in relation to the basic consolidated financial statements taken as a whole, presents fairly, in all material respects, the information set forth therein.
/s/ KPMG LLP
Salt Lake City, Utah
April 2, 2015
52
SPORTSMAN’S WAREHOUSE HOLDINGS, INC. AND SUBSIDIARIES
Amounts in Thousands, Except Per Share Data
|
|
January 31, |
|
|
February 1, |
|
||
|
|
2015 |
|
|
2014 |
|
||
|
Assets |
|
|
|
|
|
|
|
|
Current assets: |
|
|
|
|
|
|
|
|
Cash and cash equivalents |
$ |
1,751 |
|
|
$ |
1,354 |
|
|
Accounts receivable, net |
|
425 |
|
|
|
413 |
|
|
Merchandise inventories |
|
185,909 |
|
|
|
161,334 |
|
|
Prepaid expenses and other |
|
7,468 |
|
|
|
7,753 |
|
|
Deferred income taxes, current |
|
2,928 |
|
|
|
2,229 |
|
|
Income taxes receivable |
|
5,190 |
|
|
|
3,233 |
|
|
Total current assets |
|
203,671 |
|
|
|
176,316 |
|
|
Property and equipment, net |
|
54,317 |
|
|
|
31,494 |
|
|
Deferred income taxes, noncurrent |
|
5,398 |
|
|
|
6,051 |
|
|
Definite lived intangibles, net |
|
5,729 |
|
|
|
7,535 |
|
|
Other long-term assets, net |
|
1,608 |
|
|
|
2,833 |
|
|
Total assets |
$ |
270,723 |
|
|
$ |
224,229 |
|
|
|
|
|
|
|
|
|
|
|
Liabilities and Stockholders' Deficit |
|
|
|
|
|
|
|
|
Current liabilities: |
|
|
|
|
|
|
|
|
Accounts payable |
$ |
28,500 |
|
|
$ |
27,664 |
|
|
Accrued expenses |
|
42,620 |
|
|
|
31,884 |
|
|
Revolving line of credit |
|
41,899 |
|
|
|
29,052 |
|
|
Current portion of long-term debt, net of discount |
|
1,333 |
|
|
|
1,860 |
|
|
Current portion of deferred rent |
|
2,873 |
|
|
|
2,640 |
|
|
Total current liabilities |
|
117,225 |
|
|
|
93,100 |
|
|
Long-term liabilities: |
|
|
|
|
|
|
|
|
Long-term debt, net of discount and current portion |
|
156,713 |
|
|
|
229,272 |
|
|
Deferred rent, net of current portion |
|
28,117 |
|
|
|
22,953 |
|
|
Total long-term liabilities |
|
184,830 |
|
|
|
252,225 |
|
|
Total liabilities |
|
302,055 |
|
|
|
345,325 |
|
|
|
|
|
|
|
|
|
|
|
Commitments and contingencies (Notes 9, 10, & 15) |
|
|
|
|
|
|
|
|
Stockholders' deficit: |
|
|
|
|
|
|
|
|
Preferred stock, $.01 par value; 20,000 and 0 shares authorized, respectively; 0 shares issued and outstanding |
|
— |
|
|
|
— |
|
|
Common stock, $.01 par value; 100,000 and 27,552 shares authorized, respectively; 41,818 and 27,265 shares issued and outstanding, respectively |
|
418 |
|
|
|
273 |
|
|
Restricted nonvoting common stock, $.01 par value; 0 and 6,888 shares authorized, respectively; 0 and 5,677 shares issued and outstanding, respectively |
|
— |
|
|
|
57 |
|
|
Additional paid-in capital |
|
76,257 |
|
|
|
365 |
|
|
Accumulated deficit |
|
(108,007 |
) |
|
|
(121,791 |
) |
|
Total stockholders' deficit |
|
(31,332 |
) |
|
|
(121,096 |
) |
|
Total liabilities and stockholders' deficit |
$ |
270,723 |
|
|
$ |
224,229 |
|
See accompanying notes to the consolidated financial statements
53
SPORTSMAN’S WAREHOUSE HOLDINGS, INC. AND SUBSIDIARIES
CONSOLIDATED STATEMENTS OF INCOME
Amounts in Thousands, Except Per Share Data
|
|
Fiscal Year Ended |
|
|||||||||
|
|
January 31, |
|
|
February 1, |
|
|
February 2, |
|
|||
|
|
2015 |
|
|
2014 |
|
|
2013 |
|
|||
|
Net sales |
$ |
660,003 |
|
|
$ |
643,163 |
|
|
$ |
526,942 |
|
|
Cost of goods sold |
|
444,796 |
|
|
|
435,933 |
|
|
|
364,326 |
|
|
Gross profit |
|
215,207 |
|
|
|
207,230 |
|
|
|
162,616 |
|
|
|
|
|
|
|
|
|
|
|
|
|
|
|
Selling, general, and administrative expenses |
|
170,315 |
|
|
|
147,140 |
|
|
|
109,408 |
|
|
Bankruptcy related expenses (benefits) |
|
— |
|
|
|
55 |
|
|
|
(263 |
) |
|
Income from operations |
|
44,892 |
|
|
|
60,035 |
|
|
|
53,471 |
|
|
Interest expense |
|
(22,480 |
) |
|
|
(25,447 |
) |
|
|
(6,321 |
) |
|
Income before income taxes |
|
22,412 |
|
|
|
34,588 |
|
|
|
47,150 |
|
|
Income tax expense |
|
8,628 |
|
|
|
12,838 |
|
|
|
19,076 |
|
|
Net income |
$ |
13,784 |
|
|
$ |
21,750 |
|
|
$ |
28,074 |
|
|
Earnings per share: |
|
|
|
|
|
|
|
|
|
|
|
|
Basic |
$ |
0.34 |
|
|
$ |
0.66 |
|
|
$ |
0.84 |
|
|
Diluted |
$ |
0.34 |
|
|
$ |
0.66 |
|
|
$ |
0.84 |
|
|
Weighted average shares outstanding: |
|
|
|
|
|
|
|
|
|
|
|
|
Basic |
|
39,961 |
|
|
|
33,170 |
|
|
|
33,229 |
|
|
Diluted |
|
40,141 |
|
|
|
33,185 |
|
|
|
33,229 |
|
See accompanying notes to the consolidated financial statements
54
SPORTSMAN’S WAREHOUSE HOLDINGS, INC. AND SUBSIDIARIES
CONSOLIDATED STATEMENTS OF STOCKHOLDERS’ EQUITY (DEFICIT)
Amounts in Thousands
|
|
|
|
|
|
|
|
|
|
|
|
|
|
|
|
|
|
|
|
|
|
|
|
|
|
|
|
|
|
|
Common Stock |
|
|
Restricted nonvoting common stock |
|
|
Additional paid-in-capital |
|
|
Retained earnings (accumulated deficit) |
|
|
Total stockholders' equity (deficit) |
|
|||||||||||||
|
|
Shares |
|
|
Amount |
|
|
Shares |
|
|
Amount |
|
|
Amount |
|
|
Amount |
|
|
Amount |
|
|||||||
|
Balance at January 28, 2012 |
|
27,265 |
|
|
$ |
273 |
|
|
|
5,964 |
|
|
$ |
60 |
|
|
$ |
8,903 |
|
|
$ |
41,096 |
|
|
$ |
50,332 |
|
|
Dividends |
|
— |
|
|
|
— |
|
|
|
— |
|
|
|
— |
|
|
|
(8,903 |
) |
|
|
(111,347 |
) |
|
|
(120,250 |
) |
|
Net income |
|
— |
|
|
|
— |
|
|
|
— |
|
|
|
— |
|
|
|
— |
|
|
|
28,074 |
|
|
|
28,074 |
|
|
Balance at February 2, 2013 |
|
27,265 |
|
|
$ |
273 |
|
|
|
5,964 |
|
|
$ |
60 |
|
|
$ |
— |
|
|
$ |
(42,177 |
) |
|
$ |
(41,844 |
) |
|
Dividends |
|
— |
|
|
|
— |
|
|
|
— |
|
|
|
— |
|
|
|
— |
|
|
|
(101,065 |
) |
|
|
(101,065 |
) |
|
Repurchase and retirement of restricted nonvoting common stock |
|
— |
|
|
|
— |
|
|
|
(287 |
) |
|
|
(3 |
) |
|
|
— |
|
|
|
(299 |
) |
|
|
(302 |
) |
|
Stock based compensation |
|
— |
|
|
|
— |
|
|
|
— |
|
|
|
— |
|
|
|
365 |
|
|
|
— |
|
|
|
365 |
|
|
Net income |
|
— |
|
|
|
— |
|
|
|
— |
|
|
|
— |
|
|
|
— |
|
|
|
21,750 |
|
|
|
21,750 |
|
|
Balance at February 1, 2014 |
|
27,265 |
|
|
$ |
273 |
|
|
|
5,677 |
|
|
$ |
57 |
|
|
$ |
365 |
|
|
$ |
(121,791 |
) |
|
$ |
(121,096 |
) |
|
Issuance of common shares |
|
8,683 |
|
|
|
86 |
|
|
|
— |
|
|
|
— |
|
|
|
73,305 |
|
|
|
— |
|
|
|
73,391 |
|
|
Conversion of nonvoting common stock to common stock |
|
5,677 |
|
|
|
57 |
|
|
|
(5,677 |
) |
|
|
(57 |
) |
|
|
— |
|
|
|
— |
|
|
|
— |
|
|
Vesting of restricted stock units |
|
193 |
|
|
|
2 |
|
|
|
— |
|
|
|
— |
|
|
|
— |
|
|
|
— |
|
|
|
2 |
|
|
Payment of withholdings on restricted stock units |
|
— |
|
|
|
— |
|
|
|
— |
|
|
|
— |
|
|
|
(993 |
) |
|
|
— |
|
|
|
(993 |
) |
|
Tax benefit from restricted stock units |
|
— |
|
|
|
— |
|
|
|
— |
|
|
|
— |
|
|
|
287 |
|
|
|
— |
|
|
|
287 |
|
|
Stock based compensation |
|
— |
|
|
|
— |
|
|
|
— |
|
|
|
— |
|
|
|
3,293 |
|
|
|
— |
|
|
|
3,293 |
|
|
Net income |
|
— |
|
|
|
— |
|
|
|
— |
|
|
|
— |
|
|
|
— |
|
|
|
13,784 |
|
|
|
13,784 |
|
|
Balance at January 31, 2015 |
|
41,818 |
|
|
$ |
418 |
|
|
|
— |
|
|
$ |
— |
|
|
$ |
76,257 |
|
|
$ |
(108,007 |
) |
|
$ |
(31,332 |
) |
See accompanying notes to the consolidated financial statements
55
SPORTSMAN’S WAREHOUSE HOLDINGS, INC. AND SUBSIDIARIES
CONSOLIDATED STATEMENTS OF CASH FLOWS
Amounts in Thousands
|
|
Fiscal Years Ended |
|
|||||||||
|
|
January 31, |
|
|
February 1, |
|
|
February 2, |
|
|||
|
|
2015 |
|
|
2014 |
|
|
2013 |
|
|||
|
Cash flows from operating activities: |
|
|
|
|
|
|
|
|
|
|
|
|
Net income |
$ |
13,784 |
|
|
$ |
21,750 |
|
|
$ |
28,074 |
|
|
Adjustments to reconcile net income to net cash provided by operating activities: |
|
|
|
|
|
|
|
|
|
|
|
|
Depreciation of property and equipment |
|
7,344 |
|
|
|
4,749 |
|
|
|
3,431 |
|
|
Amortization of discount on debt and deferred financing fees |
|
6,497 |
|
|
|
6,952 |
|
|
|
1,810 |
|
|
Amortization of definite lived intangible |
|
1,806 |
|
|
|
1,528 |
|
|
|
— |
|
|
Net increase in deferred rent credit |
|
5,397 |
|
|
|
432 |
|
|
|
2,170 |
|
|
Gain on asset dispositions |
|
— |
|
|
|
(112 |
) |
|
|
— |
|
|
Deferred income taxes |
|
(46 |
) |
|
|
2,169 |
|
|
|
1,292 |
|
|
Stock-based compensation |
|
3,293 |
|
|
|
365 |
|
|
|
— |
|
|
Change in operating assets and liabilities, net of acquisition: |
|
|
|
|
|
|
|
|
|
|
|
|
Accounts receivable, net |
|
(12 |
) |
|
|
1,052 |
|
|
|
53 |
|
|
Merchandise inventories |
|
(24,575 |
) |
|
|
(28,344 |
) |
|
|
6,948 |
|
|
Prepaid expenses and other |
|
86 |
|
|
|
(1,522 |
) |
|
|
(1,976 |
) |
|
Other long-term assets |
|
(107 |
) |
|
|
49 |
|
|
|
— |
|
|
Accounts payable |
|
836 |
|
|
|
1,333 |
|
|
|
7,346 |
|
|
Accrued expenses |
|
8,127 |
|
|
|
2,049 |
|
|
|
3,841 |
|
|
Income taxes receivable |
|
(1,957 |
) |
|
|
(12,416 |
) |
|
|
8,910 |
|
|
Net cash provided by operating activities |
|
20,473 |
|
|
|
34 |
|
|
|
61,899 |
|
|
Cash flows from investing activities: |
|
|
|
|
|
|
|
|
|
|
|
|
Purchase of property and equipment |
|
(30,167 |
) |
|
|
(20,416 |
) |
|
|
(6,856 |
) |
|
Purchase of business |
|
— |
|
|
|
(47,767 |
) |
|
|
— |
|
|
Proceeds from sale of fixed assets |
|
— |
|
|
|
124 |
|
|
|
45,199 |
|
|
Net cash (used in) provided by investing activities |
|
(30,167 |
) |
|
|
(68,059 |
) |
|
|
38,343 |
|
|
Cash flows from financing activities: |
|
|
|
|
|
|
|
|
|
|
|
|
Net borrowings on line of credit |
|
12,847 |
|
|
|
29,052 |
|
|
|
(26,426 |
) |
|
Borrowings on term loan |
|
160,000 |
|
|
|
235,000 |
|
|
|
122,250 |
|
|
Issuance of common stock, net |
|
73,393 |
|
|
|
(302 |
) |
|
|
— |
|
|
Dividends paid |
|
— |
|
|
|
(101,065 |
) |
|
|
(120,250 |
) |
|
Increase in book overdraft |
|
2,609 |
|
|
|
5,696 |
|
|
|
(3,940 |
) |
|
Excess tax benefits from stock-based compensation arrangements |
|
287 |
|
|
|
— |
|
|
|
— |
|
|
Payment of withholdings on restricted stock units |
|
(993 |
) |
|
|
— |
|
|
|
— |
|
|
Payment of deferred financing costs |
|
(2,227 |
) |
|
|
(3,960 |
) |
|
|
(3,766 |
) |
|
Principal payments on unsecured note payable |
|
— |
|
|
|
(2,756 |
) |
|
|
— |
|
|
Principal payments on long-term debt |
|
(234,225 |
) |
|
|
(125,863 |
) |
|
|
(31,838 |
) |
|
Discount on term loan |
|
(1,600 |
) |
|
|
(2,938 |
) |
|
|
— |
|
|
Net cash provided by (used in) financing activities |
|
10,091 |
|
|
|
32,864 |
|
|
|
(63,970 |
) |
|
Net change in cash and cash equivalents |
|
397 |
|
|
|
(35,161 |
) |
|
|
36,272 |
|
|
Cash and cash equivalents at beginning of year |
|
1,354 |
|
|
|
36,515 |
|
|
|
243 |
|
|
Cash and cash equivalents at end of year |
$ |
1,751 |
|
|
$ |
1,354 |
|
|
$ |
36,515 |
|
|
|
|
|
|
|
|
|
|
|
|
|
|
|
Net cash paid during the year for: |
|
|
|
|
|
|
|
|
|
|
|
|
Interest |
$ |
16,408 |
|
|
$ |
18,979 |
|
|
$ |
3,993 |
|
|
Income taxes |
|
10,328 |
|
|
|
23,089 |
|
|
|
8,878 |
|
See accompanying notes to the consolidated financial statements
56
SPORTSMAN’S WAREHOUSE HOLDINGS, INC. AND SUBSIDIARIES
Notes to Consolidated Financial Statements
Amounts in Thousands
(1) Nature of Business
Description of Business
Sportsman’s Warehouse Holdings, Inc. (“Holdings”) and subsidiaries (collectively, the “Company”) operate retail sporting goods stores. As of January 31, 2015, the Company operated 55 stores in 18 states.
On December 4, 2013, Holdings, previously a Utah corporation, reincorporated in Delaware by consummating a merger with its wholly owned subsidiary SWH Merger Sub, Inc., a Delaware corporation, with the Delaware corporation being the surviving entity and being renamed Sportsman’s Warehouse Holdings, Inc.
Voluntary Reorganization under Chapter 11
On March 21, 2009, the Company and all of its subsidiaries filed a voluntary bankruptcy petition for reorganization under Chapter 11 of the United States Bankruptcy Code in the United States Bankruptcy Court for the District of Delaware (the “Bankruptcy Court”). On July 30, 2009, the Bankruptcy Court entered an order approving and confirming the Plan of Reorganization (the “Reorganization Plan”). On May 22, 2013, the Company’s bankruptcy case was closed after a final decree was entered by the bankruptcy court.
Bankruptcy-Related Expenses
The adoption of fresh start reporting upon emergence from bankruptcy required the Company to allocate the reorganization value to its assets and liabilities in a manner similar to that which is required under Financial Accounting Standards Board Accounting Standards Codification (“FASB ASC”) Topic 805, Business Combinations, including estimated costs required to restructure and emerge from Chapter 11 bankruptcy. The Company incurred certain costs related to restructuring and emergence from Chapter 11 bankruptcy and included a liability as part of the reorganization value at August 14, 2009, the date of emergence from bankruptcy. Amounts greater than the estimated restructuring costs are expensed as incurred and included as a separate component of the consolidated statements of income to arrive at income from operations.
(2) Summary of Significant Accounting Policies
Principles of Consolidation
The consolidated financial statements of the Company have been prepared in accordance with U.S. generally accepted accounting principles (“GAAP”) and include the accounts of its four wholly owned subsidiaries, Sportsman’s Warehouse, Inc. (“Sportsman’s Warehouse”), Pacific Flyway Wholesale, LLC (“Pacific Flyway”), Sportsman’s Warehouse Southwest, Inc., and Minnesota Merchandising Corporation. All intercompany transactions and accounts have been eliminated in consolidation.
Fiscal Year
The Company operates using a 52/53 week fiscal year ending on the Saturday closest to January 31. Fiscal years 2014, 2013 and 2012 ended on January 31, 2015, February 1, 2014 and February 2, 2013, respectively. Fiscal year 2012 contains 53 weeks of operations and fiscal years 2013 and 2014 contain 52 weeks of operations.
Seasonality
The Company’s business is generally seasonal, with a significant portion of total sales occurring during the third and fourth quarters of the calendar year.
Use of Estimates in the Preparation of Consolidated Financial Statements
The preparation of consolidated financial statements in conformity with GAAP requires management to make estimates and assumptions that affect the reported amounts of assets and liabilities and disclosure of contingent assets and liabilities at the date of the consolidated financial statements and the reported amounts of revenues and expenses during the reporting period. Actual results could differ from those estimates.
57
Segment Reporting
The Company operates solely as a sporting goods retailer whose Chief Operating Decision Maker (“CODM”) is the Chief Executive Officer. The CODM reviews financial information presented on a consolidated and individual store and cost center basis, for purposes of allocating resources and evaluating financial performance. The Company’s stores typically have similar square footage and offer essentially the same general product mix. The Company’s core customer demographic remains similar chainwide, as does the Company’s process for the procurement and marketing of its product mix. Furthermore, the Company distributes its product mix chainwide from a single distribution center. Given that the stores have the same economic characteristics, the individual stores are aggregated into one single operating and reportable segment.
Cash and Cash Equivalents
The Company considers cash on hand in stores and highly liquid investments with an initial maturity of three months or less as cash and cash equivalents. Checks issued pending bank clearance that result in overdraft balances for accounting purposes are classified as accrued expenses in the accompanying consolidated balance sheets.
In accordance with the terms of a financing agreement (Note 9), the Company maintains depository accounts with two banks in a lock-box arrangement. Deposits into these accounts are used to reduce the outstanding balance on the line of credit as soon as the respective bank allows the funds to be transferred to the financing company. At January 31, 2015, the combined balance in these accounts was $5,987. Accordingly, this amount has been classified as a reduction in the line of credit as if the transfers had occurred on January 31, 2015.
Accounts Receivable
The Company offers credit terms on the sale of products to certain government and corporate retail customers and requires no collateral from these customers. The Company performs ongoing credit evaluations of its customers’ financial condition and maintains an allowance for doubtful accounts receivable based upon historical experience and a specific review of accounts receivable at the end of each period. Actual bad debts may differ from these estimates and the difference could be significant. At January 31, 2015 and February 1, 2014, the allowance for doubtful accounts receivable totaled $113 and $103, respectively. The activity in the allowance for doubtful accounts was not significant for the fiscal years ended January 31, 2015, February 1, 2014 and February 2, 2013.
Merchandise Inventories
Merchandise inventories are stated at the lower of cost or market. Cost is determined using the weighted average cost method. The Company estimates a provision for inventory shrinkage based on its historical inventory accuracy rates as determined by periodic cycle counts. The allowance for damaged goods from returns is based upon historical experience. The Company also adjusts inventory for obsolete or slow moving inventory based on inventory productivity reports and by specific identification of slow moving or obsolete inventory. The inventory reserves for shrinkage, damaged, or obsolescence totaled $4,889 and $4,020 at January 31, 2015 and February 1, 2014, respectively.
Property and Equipment
Property and equipment are recorded at cost. Leasehold improvements primarily include the cost of improvements funded by landlord incentives or allowances. Maintenance, repairs, minor renewals, and betterments are expensed as incurred. Major renewals and betterments are capitalized. Upon retirement or disposal of assets, the cost and accumulated depreciation and amortization are eliminated from the respective accounts and the related gains or losses are credited or charged to earnings.
Depreciation and amortization of property and equipment is computed using the straight-line method over the estimated useful lives of the related assets. Leasehold improvements are amortized over the shorter of the useful lives of the improvements or the term of the lease. Furniture, fixtures, and equipment, are depreciated over useful lives ranging from 3 to 10 years.
Impairment of Long-Lived Assets
The Company reviews its long-lived assets with definite lives for impairment whenever events or changes in circumstances may indicate that the carrying value of an asset may not be recoverable. The Company uses an estimate of the future undiscounted net cash flows of the related asset or group of assets over their remaining useful lives in measuring whether the assets are recoverable. If the carrying amount of an asset exceeds its estimated future cash flows, an impairment charge is recognized for the amount by which the carrying amount exceeds the estimated fair value of the asset. Impairment of long-lived assets is assessed at the lowest levels for which there are identifiable cash flows that are independent of other groups of assets. Assets to be disposed of are reported at the
58
lower of the carrying amount or fair value, less the estimated costs to sell. No impairment charge to long-lived assets was recorded during the fiscal years ended January 31, 2015, February 1, 2014 or February 2, 2013.
Prepaid Expenses and Other
Prepaid expenses and other primarily consists of prepaid expenses, vendor rebates receivable, vendor advertising receivables and miscellaneous deposits.
Revenue Recognition
Revenue is recognized for retail sales at the time of the sale in the store. The Company records a reserve for estimated product returns in each reporting period, based on its historical experience. Revenue for gift cards sold is deferred and recognized as the gift cards are redeemed for merchandise. Gift card breakage income is recognized based upon historical redemption patterns and represents the balance of gift cards for which the Company believes the likelihood of redemption by the customer is remote. During the fiscal years ended January 31, 2015, February 1, 2014 and February 2, 2013, the Company recognized $833, $0 and $17 of gift card breakage income, respectively. This income is included in the accompanying consolidated statements of income as a reduction in selling, general, and administrative expenses (“SG&A”).
In November of 2013, the Company launched a customer loyalty program. Under this program, the Company issues credits in the form of points to loyalty program members. The value of points earned by loyalty program members is included in accrued liabilities and recorded as a reduction of net sales at the time the points are earned.
Customer deposits on items placed in layaway are recorded as a liability. Revenue is recognized on layaway transactions at the point where the customer takes possession of the merchandise. These liabilities are recorded as unearned revenue in accrued expenses in the consolidated balance sheets.
Sales taxes collected from customers and remitted to governmental authorities are accounted for on a net basis and, therefore, are excluded from net sales in the consolidated statements of income.
Cost of Goods Sold
Cost of goods sold primarily consists of merchandise acquisition costs, including freight-in costs, shipping costs, terms discounts received from the vendor and vendor allowances and rebates associated directly with merchandise. Vendor allowances include allowances and rebates received from vendors. The Company records an estimate of earned allowances based on purchase volumes. These funds are determined for each fiscal year, and the majority is based on various quantitative contract terms. Amounts expected to be received from vendors relating to purchase of merchandise inventories are recognized as a reduction of cost of goods sold as the merchandise is sold. Historical program results and current purchase volumes are reviewed when establishing the estimate for earned allowances.
Shipping and Handling Fees and Costs
All shipping and handling fees billed to customers are recorded as a component of net sales. All costs incurred related to the shipping and handling of products are recorded in cost of sales.
Vendor Allowances
Vendor allowances include price allowances, volume rebates, store opening costs reimbursements, marketing participation and advertising reimbursements received from vendors under the terms of specific arrangements with certain vendors. Vendor allowances related to merchandise are recognized as a reduction of the costs of merchandise as sold. Vendor reimbursements of costs are recorded as a reduction to expense in the period the related cost is incurred based on actual costs incurred. Any cost reimbursements exceeding expenses incurred are recognized as a reduction of the cost of merchandise sold. Volume allowances may be estimated based on historical purchases and estimates of projected purchases.
Tenant Allowances
The Company may receive reimbursement from a landlord for some of the costs related to occupancy or tenant improvements per lease provisions. These reimbursements may be referred to as tenant allowances or landlord reimbursements ("tenant allowances"). Reimbursement from a landlord for occupancy or tenant improvements is included within deferred rent on the accompanying
59
consolidated balance sheets. The deferred rent credit is amortized as rent expense on a straight-line basis over the term of the lease. Landlord reimbursements from these transactions are included in cash flows from operating activities as a change in deferred rent.
Health Insurance
The Company maintains for its employees a partially self-funded health insurance plan. The Company maintains stop-loss insurance through an insurance company with a $100 per person deductible and aggregate claims limit above a predetermined threshold. The Company is under contract with this insurance company through December 2014. The Company intends to maintain this plan indefinitely. However, the plan may be terminated, modified, suspended, or discontinued at any time for any reason specified by the Company.
The Company has established reserve amounts based upon claims history and estimates of claims that have been incurred but not reported (“IBNR”). As of January 31, 2015 and February 1, 2014, the Company estimated the IBNR to be $811 and $752, respectively. Actual claims may differ from the estimate and such difference could be significant. These reserves are included in accrued expenses in the accompanying consolidated balance sheets.
Workers Compensation Insurance
Effective November 1, 2014, the Company maintains for its employees a high-deductible workers compensation plan. The Company maintains stop-loss insurance through an insurance company with a $150 per claim deductible and aggregate claims limit above a predetermined threshold. The Company intends to maintain this plan indefinitely. However, the plan may be terminated, modified, suspended, or discontinued at any time for any reason specified by the Company. Prior to November 1, 2014, we operated under a guaranteed cost program.
As of January 31, 2015, the Company has established a reserve of $107 related to the workers compensation plan. This reserve has been included in accrued expenses in the accompanying consolidated balance sheets.
Operating Leases and Deferred Rent
The Company has various operating lease commitments on its store locations. Certain leases contain rent escalation clauses that require higher rental payments in later years. Leases may also contain rent holidays, or free rents, during the lease term. Rent expense is recognized on a straight-line basis over the lease term. Rent expense in excess of rental payments is recorded as deferred rent on the accompanying consolidated balance sheets.
Advertising
Costs for newspaper, television, radio, and other advertising are expensed in the period in which the advertising occurs. The Company participates in various advertising and marketing cooperative programs with its vendors, who, under these programs, reimburse the Company for certain costs incurred. Payments received under these cooperative programs are recorded as a decrease to expense in the period that the advertising occurred. For the fiscal years ended January 31, 2015, February 1, 2014 and February 2, 2013, net advertising expenses totaled $5,629, $4,685 and $3,773, respectively. These amounts are included in selling, general and administrative expenses in the accompanying consolidated statements of income.
Stock-Based Compensation
Compensation expense is estimated based on grant date fair value on a straight-line basis over the requisite service period. Costs associated with awards are included in compensation expense as a component of selling, general, and administrative expenses.
Income Taxes
The Company recognizes a deferred income tax liability or deferred income tax asset for the future tax consequences attributable to differences between the financial statement basis of existing assets and liabilities and their respective tax basis. Deferred income tax assets and liabilities are measured using enacted tax rates expected to apply to taxable income in the years in which those temporary differences are expected to be recovered or settled. A valuation allowance is provided against deferred income tax assets when it is more likely than not that all or some portion of the deferred income tax assets will not be realized.
The Company recognizes the tax benefit from an uncertain tax position only if it is more likely than not that the tax position will be sustained on examination by the relevant tax authorities, based on the technical merits of the position. Interest and potential penalties are accrued related to unrecognized tax benefits in the provision for income taxes.
60
Fair Value of Financial Instruments
The carrying amounts of financial instruments except for long-term debt approximate fair value because of the general short-term nature of these instruments. The carrying amounts of long-term variable rate debt approximate fair value as the terms are consistent with market terms for similar debt instruments. The carrying amount of the Company’s financial instruments approximates fair value as of January 31, 2015 and February 1, 2014.
Earnings Per Share
Basic earnings per share is calculated by dividing net income by the weighted-average shares of common stock outstanding, reduced by shares repurchased and held in treasury, during the period. Diluted earnings per share represents basic earnings per share adjusted to include the potentially dilutive effect of outstanding share option awards, nonvested share awards and nonvested share unit awards.
Comprehensive Income
The Company has no components of income that would require classification as other comprehensive income for the fiscal years ended January 31, 2015, February 1, 2014 or February 2, 2013.
Recent Accounting Pronouncements
In May 2014, the Financial Accounting Standards Board issued Accounting Standards Update ("ASU") 2014-09 "Revenue from Contracts with Customers" (Topic 606) ("ASU 2014-09"). ASU 2014-09 is a comprehensive new revenue recognition model requiring a company to recognize revenue to depict the transfer of goods or services to a customer at an amount reflecting the consideration it expects to receive in exchange for those goods or services. In adopting ASU 2014-09, companies may use either a full retrospective or a modified retrospective approach. ASU 2014-09 is effective for the first interim period within annual reporting periods beginning after December 15, 2016, and early adoption is not permitted. Management is evaluating the provisions of ASU 2014-09 and has not determined what impact the adoption of ASU 2014-09 will have on the Company's financial position or results of operations.
(3) Initial Public Offering
On April 23, 2014, the Company completed its initial public offering, pursuant to which it issued and sold 8,333 shares of common stock at a price to the public of $9.50 per share; included in this offering was the sale of 4,167 shares by affiliates of Seidler Equity Partners III, L.P. The total net proceeds raised by the Company were $70,299 after deducting underwriting discounts and commissions of $5,542 and other offering expenses of $3,326. Total net proceeds were used to make an unscheduled early payment on the term loan (Note 10). In connection with the initial public offering, all of the then-outstanding shares of restricted nonvoting common stock automatically converted into shares of common stock.
On May 16, 2014, the underwriters of the Company’s initial public offering of common stock partially exercised the over-allotment option granted at the time of the initial public offering to purchase an additional 1,400 shares of common stock at the public offering price of $9.50 per share, less underwriting discounts and commissions, which consists of 350 shares sold by the Company and 1,050 shares sold by affiliates of Seidler Equity Partners III, L.P. The Company received, after deducting underwriting discounts and commissions and estimated offering expenses, approximately $3,100 of net proceeds. Substantially all of the net proceeds were used for the repayment of an additional amount outstanding under the Company’s term loans.
(4) Stock Split
On April 2, 2014, the Company’s board of directors approved an amendment to the Company’s amended and restated certificate of incorporation to effect a 2.87-for-1 stock split of the Company’s common stock and restricted nonvoting common stock and to increase the number of authorized shares of capital stock that the Company is authorized to issue to 110,000 shares of capital stock in aggregate, consisting of 100,000 shares of common stock and 10,000 shares of restricted nonvoting common stock. The certificate of amendment giving effect to the stock split was filed on April 3, 2014. On April 16, 2014, the Company adopted a new charter, under which the Company is authorized to issue up to 120,000 shares of capital stock in aggregate, consisting of 100,000 shares of common stock and 20,000 shares of preferred stock. All information in the accompanying condensed consolidated financial statements and the related notes thereto related to common stock, restricted nonvoting common stock, restricted stock unit awards and earnings per share have been adjusted to reflect the 2.87-for-1 stock split.
(5) Acquisition
On March 11, 2013, the Company acquired certain assets and assumed certain liabilities of Wholesale Sports Outdoor Outfitters.
61
Pro Forma Results
The following pro forma results are based on the individual historical results of the acquired stores with adjustments to give effect to the combined operations as if the acquisition has been consummated at the beginning of fiscal year 2013. The pro forma results are intended for information purposes only and do not purport to represent what the combined results of operations would actually have been had the acquisition in fact occurred at the beginning of the earliest period presented.
|
|
Fiscal Year Ended |
|
|
|
|
February 1, 2014 |
|
|
|
|
(In thousands, except per share amounts) |
|
|
|
Net sales |
$ |
643,829 |
|
|
Net income |
$ |
21,633 |
|
|
Basic earnings per share |
$ |
0.65 |
|
|
Diluted earnings per share |
$ |
0.65 |
|
(6) Property and Equipment
Property and equipment as of January 31, 2015 and February 1, 2014 are as follows:
|
|
January 31, |
|
|
February 1, |
|
||
|
|
2015 |
|
|
2014 |
|
||
|
Furniture, fixtures, and equipment |
$ |
32,678 |
|
|
$ |
23,953 |
|
|
Leasehold improvements |
|
34,398 |
|
|
|
15,943 |
|
|
Construction in progress |
|
7,651 |
|
|
|
4,664 |
|
|
|
|
74,727 |
|
|
|
44,560 |
|
|
Less accumulated depreciation and amortization |
|
(20,410 |
) |
|
|
(13,066 |
) |
|
|
$ |
54,317 |
|
|
$ |
31,494 |
|
Depreciation expense was $7,344, $4,749 and $3,431 for the fiscal years ended January 31, 2015, February 1, 2014 and February 2, 2013, respectively.
(7) Definite Lived Intangible Asset
Intangible assets increased as a result of the non-compete agreement associated with the Wholesale Sports acquisition. The following table summarizes the definite lived intangible assets:
|
|
|
January 31, 2015 |
|
|||||||||||
|
|
|
Amortization period |
|
Gross carrying amount |
|
|
Accumulated amortization |
|
|
Net carrying amount |
|
|||
|
Amortizing intangible assets: |
|
|
|
|
|
|
|
|
|
|
|
|
|
|
|
Non-compete agreement |
|
5 years |
|
$ |
9,063 |
|
|
|
(3,334 |
) |
|
|
5,729 |
|
|
Total |
|
|
|
$ |
9,063 |
|
|
|
(3,334 |
) |
|
|
5,729 |
|
|
|
|
|
|
|
|
|
|
|
|
|
|
|
|
|
|
|
|
February 1, 2014 |
|
|||||||||||
|
|
|
Amortization period |
|
Gross carrying amount |
|
|
Accumulated amortization |
|
|
Net carrying amount |
|
|||
|
Amortizing intangible assets: |
|
|
|
|
|
|
|
|
|
|
|
|
|
|
|
Non-compete agreement |
|
5 years |
|
$ |
9,063 |
|
|
|
(1,528 |
) |
|
|
7,535 |
|
|
Total |
|
|
|
$ |
9,063 |
|
|
|
(1,528 |
) |
|
|
7,535 |
|
Amortization expense for definite lived intangible asset was $1,806 for the fiscal year ended January 31, 2015. Amortization expense for the next four years is $1,806 in fiscal years 2015 and 2016, $1,840 in fiscal year 2017 and $277 in fiscal year 2018.
62
(8) Accrued Expenses and Other Liabilities
Accrued expenses and other liabilities consist of the following at January 31, 2015 and February 1, 2014:
|
|
January 31, |
|
|
February 1, |
|
||
|
|
2015 |
|
|
2014 |
|
||
|
Book overdraft |
$ |
8,305 |
|
|
$ |
5,696 |
|
|
Unearned revenue |
|
9,629 |
|
|
|
8,579 |
|
|
Accrued payroll and related expenses |
|
7,104 |
|
|
|
6,919 |
|
|
Sales and use tax payable |
|
3,708 |
|
|
|
2,277 |
|
|
Other |
|
13,874 |
|
|
|
8,413 |
|
|
|
$ |
42,620 |
|
|
$ |
31,884 |
|
(9) Revolving Line of Credit
The Company has a senior secured revolving credit facility with Wells Fargo Bank, National Association that provides for borrowings in the aggregate amount of up to $135.0 million, subject to a borrowing base calculation. In connection with the refinancing of the Company’s senior secured term loans in December 2014, the lenders under the Company’s senior secured revolving credit facility agreed to increase the Company’s maximum borrowing availability from $105.0 million to $135.0 million. All borrowings under the revolving credit facility are limited to a borrowing base equal to roughly (1) the lesser of (a) 90% of the net orderly liquidation value of the Company’s eligible inventory and (b) 75% of the lower of cost or market value of the Company’s eligible inventory, plus (2) 90% of the eligible accounts receivable, less certain reserves against outstanding gift cards, layaway deposits and amounts outstanding under commercial letters of credit, each term as defined in the credit agreement. As of January 31, 2015, $73.2 million was available for borrowing and $41.9 million was outstanding under the revolving credit facility.
Each of the subsidiaries of the Company is a borrower under the revolving credit facility, and all obligations under the revolving credit facility are guaranteed by the Company. All of the Company’s obligations under the revolving credit facility are secured by a lien on substantially all of the Company’s tangible and intangible assets and the tangible and intangible assets of all of the Company’s subsidiaries, including a pledge of all capital stock of each of the Company’s subsidiaries. The lien securing the obligations under the revolving credit facility is a first priority lien as to certain liquid assets, including cash, accounts receivable, deposit accounts and inventory. In addition, the credit agreement contains provisions that enable Wells Fargo to require us to maintain a lock-box for the collection of all receipts.
As of January 31, 2015 and February 1, 2014, the Company had $47,886 and $34,029, respectively, in outstanding revolving loans under a financing agreement (the “Revolving Line of Credit”). Amounts outstanding are offset on the condensed consolidated balance sheets by amounts in depository accounts under lock-box arrangements, which were $5,987 and $4,977 as of January 31, 2015 and February 1, 2014, respectively. As of January 31, 2015, the Company had $73,214 of net borrowing availability under the terms of the Revolving Line of Credit and stand-by commercial letters of credit of $400.
Borrowings under the revolving credit facility bear interest based on either, at the Company’s option, the base rate or LIBOR, in each case plus an applicable margin. The base rate is the higher of (1) Wells Fargo’s prime rate, (2) the federal funds rate (as defined in the credit agreement) plus 0.50% and (3) the one-month LIBOR (as defined in the credit agreement) plus 1.00%. The applicable margin for loans under the revolving credit facility, which varies based on the average daily availability, ranges from 0.75% to 1.25% per year for base rate loans and from 1.75% to 2.25% per year for LIBOR loans. The weighted average interest rate on the amount outstanding under the revolving credit facility as of January 31, 2015 was 2.21%.
Interest on base rate loans is payable monthly in arrears and interest on LIBOR loans is payable based on the LIBOR interest period selected by us, which can be 30, 60 or 90 days. All amounts that are not paid when due under the Company’s revolving credit facility will accrue interest at the rate otherwise applicable plus 2.00% until such amounts are paid in full.
The Company may be required to make mandatory prepayments under the revolving credit facility in the event of a disposition of certain property or assets, in the event of receipt of certain insurance or condemnation proceeds, upon the issuance of certain debt or equity securities, upon the incurrence of certain indebtedness for borrowed money or upon the receipt of certain payments not received in the ordinary course of business.
63
The revolving credit facility contains customary affirmative and negative covenants, including covenants that limit the Company’s ability to incur, create or assume certain indebtedness, to create, incur or assume certain liens, to make certain investments, to make sales, transfers and dispositions of certain property and to undergo certain fundamental changes, including certain mergers, liquidations and consolidations. The revolving credit facility also requires us to maintain a minimum availability at all times of not less than 10% of the gross borrowing base, and in any event, not less than $5.0 million. The revolving credit facility also contains customary events of default. The Revolving Line of Credit matures on December 3, 2019. The Revolving Line of Credit was modified on December 3, 2014 (see Note 10).
(10) Long-Term Debt
Long-term debt consisted of the following as of January 31, 2015 and February 1, 2014:
|
|
January 31, |
|
|
February 1, |
|
||
|
|
2015 |
|
|
2014 |
|
||
|
Term loan |
$ |
159,600 |
|
|
$ |
233,825 |
|
|
Less discount |
|
(1,554 |
) |
|
|
(2,693 |
) |
|
|
|
158,046 |
|
|
|
231,132 |
|
|
Less current portion, net of discount |
|
(1,333 |
) |
|
|
(1,860 |
) |
|
Long-term portion |
$ |
156,713 |
|
|
$ |
229,272 |
|
Term Loan
On December 3, 2014 (“Closing Date”), the Company’s wholly owned subsidiary, Sportsman’s Warehouse, Inc., refinanced its existing $235,000 Term Loan facility, of which $158,800 was outstanding as of December 3, 2014, and entered into a new $160,000 senior secured term loan facility (“Term Loan”) with a financial institution. The Term Loan was issued at a price of 99% of the aggregate principal amount and has a maturity date of December 3, 2020.
All of Sportsman’s Warehouse, Inc.’s obligations under the Term Loan are guaranteed by Holdings, Minnesota Merchandising Corporation, a wholly owned subsidiary of Holdings, and each of Sportsman’s Warehouse, Inc.’s subsidiaries.
The Term Loan is secured by a lien on substantially all of the Company’s tangible and intangible assets. The lien securing the obligations under the Term Loan is a first priority lien as to certain non-liquid assets, including equipment, intellectual property, proceeds of assets sales and other personal property.
The Term Loan requires quarterly principal payments of $400 payable on the last business day of each fiscal quarter commencing on May 1, 2015, and continuing up to and including October 30, 2020. A final installment payment consisting of the remaining unpaid balance is due on December 3, 2020.
As a result of this refinance, we recorded $5,668 in expense related to the write-off of term loan fees, which included deferred financing fees, the discount, and a prepayment penalty.
Sportsman’s Warehouse, Inc. may be required to make mandatory prepayments on the Term Loan in the event of, among other things, certain asset sales, the receipt of payment in respect of certain insurance claims or the issuance or incurrence of certain indebtedness. Sportsman’s Warehouse, Inc. may also be required to make mandatory prepayments based on any excess cash flows as defined in the agreement for the Term Loan.
The Term Loan bears interest at a rate per annum equal to the one-, two-, three-, or six-month LIBOR (or, the nine- or 12-month LIBOR), as defined in the term loan agreement, at the Company’s election, which cannot be less than 1.25%, plus an applicable margin of 6.00%.
The Term Loan contain customary affirmative and negative covenants, including covenants that limit the Company’s ability to incur, create or assume certain indebtedness, to incur or assume certain liens, to purchase, hold or acquire certain investments, to declare or make certain dividends and distributions and to engage in certain mergers, consolidations and asset sales. The Term Loan also requires the Company to comply with specified financial covenants, including a minimum interest coverage ratio and a maximum total net leverage ratio. The Term Loan also contains customary events of default.
In conjunction with the refinance of the Term Loan, the borrowing capacity of the Revolving Line of Credit facility was increased to $135,000 from $105,000, and the maturity date was extended to December 3, 2019.
64
As of January 31, 2015, the Term Loan had $158,046 outstanding, net of unamortized discount of $1,554. During fiscal years 2014 and 2013, the Company recognized $2,739 and $2,880, respectively of non-cash interest expense with respect to the amortization of this discount.
As part of the term loan agreement, there are a number of financial and non-financial debt covenants. The financial covenants include a net leverage ratio and an interest coverage ratio to be measured on a trailing twelve month basis.
Restricted Net Assets
The provisions of the Term Loan and the Revolving Line of Credit restrict all of the net assets of the Company’s consolidated subsidiaries, which constitute all of the net assets on the Company’s condensed consolidated balance sheet as of January 31, 2015, from being used to pay any dividends without prior written consent from the financial institutions party to the Company’s Term Loan and Revolving Line of Credit.
(11) Stockholders’ Equity (Deficit)
Common Stock
Holders of common stock are entitled to one vote per share, and to receive dividends and, upon liquidation or dissolution, are entitled to receive all assets available for distribution to stockholders on a proportional basis with the restricted nonvoting common stockholders. The holders have no preemptive or other subscription rights, and there are no redemption or sinking fund provisions with respect to such shares.
Retained Earnings
During the fiscal years 2013 and 2012, the Company declared and paid dividends to all stockholders of $101,065 and $120,250, respectively. The dividends reduced retained earnings and additional paid-in-capital, resulting in a net deficit in stockholders’ equity.
(12) Earnings Per Share
Basic earnings per share is calculated by dividing net income by the weighted-average number of shares of common stock outstanding, reduced by the number of shares repurchased and held in treasury, during the period. Diluted earnings per share represents basic earnings per share adjusted to include the potentially dilutive effect of outstanding share option awards, nonvested share awards and nonvested share unit awards.
The following table sets forth the computation of basic and diluted earnings per common share:
|
|
Fiscal Year Ended |
|
|||||||||
|
|
January 31, |
|
|
February 1, |
|
|
February 2, |
|
|||
|
|
2015 |
|
|
2014 |
|
|
2013 |
|
|||
|
Net income |
$ |
13,784 |
|
|
$ |
21,750 |
|
|
$ |
28,074 |
|
|
Weighted-average shares of common stock outstanding: |
|
|
|
|
|
|
|
|
|
|
|
|
Basic |
|
39,961 |
|
|
|
33,170 |
|
|
|
33,229 |
|
|
Dilutive effect of common stock equivalents |
|
180 |
|
|
|
15 |
|
|
|
— |
|
|
Diluted |
|
40,141 |
|
|
|
33,185 |
|
|
|
33,229 |
|
|
Basic earnings per share |
$ |
0.34 |
|
|
$ |
0.66 |
|
|
$ |
0.84 |
|
|
Diluted earnings per share |
$ |
0.34 |
|
|
$ |
0.66 |
|
|
$ |
0.84 |
|
For the fiscal year ended February 2, 2013, basic net income per share was the same as diluted net income per share because there were no outstanding potentially dilutive securities.
(13) Stock-Based Compensation
Under the terms of the restricted stock unit agreements, twenty-five percent of the outstanding restricted stock units vested on the effective date of the registration statement relating to the initial public offering because such date occurred within the first vesting period of the outstanding restricted stock units. The Company recognized $1,208 of stock-based compensation expense as a result of the change in the vesting date. The remaining non-vested restricted stock units will vest one third annually on each of the first three anniversaries of the effective date of the registration statement relating to the initial public offering.
65
The following table sets forth the rollforward of outstanding restricted stock units:
|
|
Fiscal Year Ended |
|
|
|
|
January 31, 2015 |
|
|
|
Unvested restricted stock units at February 1, 2014 |
|
1,193,747 |
|
|
Grants |
|
5,000 |
|
|
Forfeitures |
|
13,493 |
|
|
Vesting in connection with initial public offering |
|
297,401 |
|
|
Unvested restricted stock units at January 31, 2015 |
|
887,853 |
|
Total compensation expense related to the restricted stock unit awards recognized during the fiscal years ended January 31, 2015 and February 1, 2014 was $3,293 and $365, respectively.
(14) Income Taxes
For the fiscal years ended January 31, 2015, February 1, 2014 and February 2, 2013, the income tax provision consisted of the following:
|
|
|
January 31, |
|
|
February 1, |
|
|
February 2, |
|
|||
|
|
|
2015 |
|
|
2014 |
|
|
2013 |
|
|||
|
Current: |
|
|
|
|
|
|
|
|
|
|
|
|
|
Federal |
|
$ |
7,482 |
|
|
$ |
9,421 |
|
|
$ |
14,337 |
|
|
State |
|
|
1,192 |
|
|
|
1,248 |
|
|
|
3,447 |
|
|
Total current |
|
|
8,674 |
|
|
|
10,669 |
|
|
|
17,784 |
|
|
Deferred: |
|
|
|
|
|
|
|
|
|
|
|
|
|
Federal |
|
|
(103 |
) |
|
|
1,830 |
|
|
|
1,549 |
|
|
State |
|
|
57 |
|
|
|
339 |
|
|
|
(257 |
) |
|
Change in valuation allowance |
|
|
— |
|
|
|
— |
|
|
|
— |
|
|
Total deferred |
|
|
(46 |
) |
|
|
2,169 |
|
|
|
1,292 |
|
|
Total income tax provision |
|
$ |
8,628 |
|
|
$ |
12,838 |
|
|
$ |
19,076 |
|
The provision for income taxes differs from the amounts computed by applying the federal statutory rate as follows for the following periods:
|
|
|
January 31, |
|
|
February 1, |
|
|
February 2, |
|
|||
|
|
|
2015 |
|
|
2014 |
|
|
2013 |
|
|||
|
Federal statutory rate |
|
|
35.0 |
% |
|
|
35.0 |
% |
|
|
35.0 |
% |
|
State tax, net of federal benefit |
|
|
3.5 |
|
|
|
3.6 |
|
|
|
4.2 |
|
|
Permanent items |
|
|
0.2 |
|
|
|
0.3 |
|
|
|
2.3 |
|
|
Valuation allowance |
|
|
0.0 |
|
|
|
0.0 |
|
|
|
0.0 |
|
|
Other items |
|
(0.2) |
|
|
(1.8) |
|
|
(1.0) |
|
|||
|
Effective income tax rate |
|
|
38.5 |
% |
|
|
37.1 |
% |
|
|
40.5 |
% |
66
The tax effects of temporary differences that give rise to significant portions of the deferred tax assets and deferred tax liabilities at January 31, 2015 and February 1, 2014, respectively, are presented below:
|
|
|
January 31, |
|
|
February 1, |
|
||
|
|
|
2015 |
|
|
2014 |
|
||
|
Deferred tax assets: |
|
|
|
|
|
|
|
|
|
Accrued liabilities |
|
$ |
444 |
|
|
$ |
389 |
|
|
Allowance for doubtful accounts |
|
|
44 |
|
|
|
40 |
|
|
Deferred rent |
|
|
11,932 |
|
|
|
9,884 |
|
|
Inventories |
|
|
2,189 |
|
|
|
2,228 |
|
|
Litigation accrual |
|
|
1,540 |
|
|
|
— |
|
|
Net operating loss |
|
|
51 |
|
|
|
93 |
|
|
Sales return reserve |
|
|
276 |
|
|
|
248 |
|
|
Stock-based compensation |
|
|
600 |
|
|
|
— |
|
|
Total gross deferred tax assets |
|
$ |
17,076 |
|
|
$ |
12,882 |
|
|
Deferred tax liabilities: |
|
|
|
|
|
|
|
|
|
Depreciation |
|
$ |
(8,125 |
) |
|
$ |
(3,926 |
) |
|
Prepaid expenses |
|
|
(625 |
) |
|
|
(676 |
) |
|
Total gross deferred tax liabilities |
|
$ |
(8,750 |
) |
|
$ |
(4,602 |
) |
|
Net deferred tax asset |
|
$ |
8,326 |
|
|
$ |
8,280 |
|
As of January 31, 2015 and February 1, 2014, the components of the current and long-term deferred income taxes are as follows:
|
|
|
January 31, |
|
|
February 1, |
|
||
|
|
|
2015 |
|
|
2014 |
|
||
|
Current deferred tax assets, net: |
|
|
|
|
|
|
|
|
|
Accrued liabilities |
|
$ |
444 |
|
|
$ |
389 |
|
|
Allowance for doubtful accounts |
|
|
44 |
|
|
|
40 |
|
|
Inventories |
|
|
2,189 |
|
|
|
2,228 |
|
|
Prepaid expenses |
|
|
(625 |
) |
|
|
(676 |
) |
|
Sales return reserve |
|
|
276 |
|
|
|
248 |
|
|
Stock-based compensation |
|
|
600 |
|
|
|
— |
|
|
Current deferred tax assets, net |
|
$ |
2,928 |
|
|
$ |
2,229 |
|
|
Non-current deferred tax assets, net: |
|
|
|
|
|
|
|
|
|
Deferred rent |
|
$ |
11,932 |
|
|
$ |
9,884 |
|
|
Depreciation |
|
|
(8,125 |
) |
|
|
(3,926 |
) |
|
Litigation accrual |
|
|
1,540 |
|
|
|
— |
|
|
Net operating loss |
|
|
51 |
|
|
|
93 |
|
|
Non-current deferred tax assets, net |
|
$ |
5,398 |
|
|
$ |
6,051 |
|
Deferred tax assets have resulted primarily from the Company’s future deductible temporary differences. In assessing the realizability of deferred tax assets, management considers whether it is more likely than not that some portion or all of the deferred tax asset will not be realized. The Company’s ability to realize its deferred tax assets depends upon the generation of sufficient future taxable income to allow for the utilization of its net operating loss carryforwards and deductible temporary differences.
Management evaluates the realizability of the deferred tax assets and the need for additional valuation allowances annually. At January 31, 2015, based on current facts and circumstances, management believes that it is more likely than not that the Company will realize benefit for its gross deferred tax assets.
As of January 31, 2015, the Company had no unrecognized tax benefits. The Company does not anticipate that unrecognized tax benefits will significantly increase or decrease within 12 months of the reporting date. There are no tax returns that are currently under examination. Federal and state tax years that remain subject to examination are periods ended January 29, 2011 through January 31, 2015.
67
At February 1, 2014, the Company had state net operating loss carry-forwards of approximately $3,047, of which $1,661 was used to offset taxable income in fiscal year 2014. At January 31, 2015, the Company had state net operating loss carry-forwards of approximately $1,387 remaining.
The Company’s policy is to accrue interest expense, and penalties as appropriate, on estimated unrecognized tax benefits as a charge to interest expense in the consolidated statements of income. During 2014, the Company accrued interest and penalties of $14. No interest or penalties were accrued for 2013 or 2012.
On September 13, 2013, the U. S. Treasury and Internal Revenue Service issued final Tangible Property Regulations (“TPR”) under Internal Revenue Code (“IRC”) Section 162 and IRC Section 263(a). The regulations became effective for tax years beginning on or after January 1, 2014, and certain portions may require a tax method change on a retroactive basis, thus requiring an IRC Section 481(a) adjustment related to fixed and real asset deferred taxes. The accounting guidance under Accounting Standards Codification 740 - Income Taxes, treats the release of these regulations as a change in tax law as of the date of issuance and requires the Company to determine whether there will be an impact on its consolidated financial statements for fiscal year 2014. Any such impact of the final tangible property regulations would affect temporary deferred taxes only and result in a consolidated balance sheet reclassification between current and deferred taxes. The Company has analyzed the expected impact of the TPR on the Company as of January 31, 2015, and concluded that the expected impact is minimal. The Company will continue to prospectively monitor the impact of any future changes to the TPR on the Company.
(15) Commitments and Contingencies
Operating Leases
The Company leases its retail store, office space, and warehouse locations under non-cancelable operating leases. Certain of these leases include tenant allowances that are amortized over the life of the lease. In 2014, 2013 and 2012, the Company received tenant allowances of $5,129, $200 and $200, respectively. The Company expects to receive $11,047 in tenant allowances under leases during 2015. Certain leases require the Company to pay contingent rental amounts based on a percentage of sales, in addition to real estate taxes, insurance, maintenance and other operating expenses associated with the leased premises. These agreements expire at various dates through March 2028 and generally contain three, five-year renewal options. Rent expense under these leases totaled $30,520, $27,118 and $18,639 for the fiscal years ended January 31, 2015, February 1, 2014 and February 2, 2013, respectively.
Future minimum lease payments for non-cancelable operating leases by fiscal year, as of January 31, 2015 are as follows:
|
Fiscal Year: |
|
|
|
|
|
|
|
|
|
|
|
2015 |
|
|
33,283 |
|
|
2016 |
|
|
34,068 |
|
|
2017 |
|
|
33,565 |
|
|
2018 |
|
|
33,104 |
|
|
2019 |
|
|
30,774 |
|
|
Thereafter |
|
|
121,501 |
|
|
|
|
|
286,295 |
|
Legal Matters
The Company is involved in various legal matters generally incidental to its business. The Company believes, after discussion with legal counsel, that, other than as described below, the disposition of these matters will not have a material impact on its consolidated financial condition, liquidity, or results of operations.
68
On March 12, 2014, the Company was added as a defendant to a pending consolidated action filed in the United States District Court, Western District of Washington, captioned as Lacey Market Place Associates II, LLC, et al. v. United Farmers of Alberta Co-Operative Limited, et al., Case No. 2:13-cv-00383-JLR against United Farmers of Alberta Co-Operative Limited, the seller of Wholesale Sports, Wholesale Sports, Alamo Group and Donald F. Gaube and spouse. The amended complaint was filed by the landlords of two stores that the Company did not assume in the Company’s purchase of assets from Wholesale Sports. Such stores were formerly operated by Wholesale Sports in Skagit and Thurston Counties in Washington. The amended complaint alleged breach of lease, breach of collateral assignment, misrepresentation, intentional interference with contract, piercing the corporate veil and violation of Washington’s Fraudulent Transfer Act. The Company was named as a co-defendant with respect to the intentional interference with contract and fraudulent conveyance claims. The amended complaint sought against the Company and all defendants unspecified money damages, declaratory relief and attorneys’ fees and costs. On January 28, 2015, the court in the Lacey Marketplace action granted in part and denied in part the Company’s motion for summary judgment and dismissed the intentional interference claim against the Company, but declined to dismiss the fraudulent transfer claim.
Trial in the Lacey Marketplace action began March 2, 2015 and concluded March 6, 2015. On March 9, 2015, the jury in the trial awarded $11,887 against the defendants to the action, including us. The Company is reviewing the decision and has accrued $4,000 in its results for the fiscal year and fourth quarter ended January 31, 2015 related to this matter. The Company strongly disagrees with the jury’s verdict, expects to file post-trial motions seeking to have the verdict set aside, and, if necessary, will appeal the decision. Interest on the award will accrue at the weekly average one-year constant maturity (nominal) Treasury yield, as published by the Federal Reserve System (currently at 0.22%) while any appeal is pending.
(16) Related-Party Transactions
On August 14, 2009, the Company entered into a reimbursement agreement with the majority stockholder of the Company. Under the terms of this agreement, the Company agreed to reimburse the majority stockholder for various out-of-pocket costs and expenses related to the Company up to a maximum of $150 annually. During the fiscal years ended January 31, 2015, February 1, 2014 and February 2, 2013, the Company made payments of $35, $18 and $21, respectively, under this agreement. At January 31, 2015 and February 1, 2014, there were no amounts payable under the terms of this agreement.
(17) Retirement Plan
The Company sponsors a profit sharing plan (the “Plan”) for which Company contributions are based upon wages paid. As approved by the Board of Directors, the Company makes discretionary contributions to the Plan at rates determined by management. The Company made contributions of $276, $234 and $174 for the fiscal years ended January 31, 2015, February 1, 2014 and February 2, 2013, respectively.
69
Schedule II
Valuation and Qualifying Accounts
(Amounts in thousands)
|
|
|
Beginning of Year Balance |
|
|
Charged to Costs and Expenses |
|
|
Deductions |
|
|
End of Year Balance |
|
||||
|
Year Ended January 31, 2015 |
|
|
|
|
|
|
|
|
|
|
|
|
|
|
|
|
|
Inventory Reserve |
|
$ |
4,020 |
|
|
$ |
2,666 |
|
|
$ |
(1,797 |
) |
|
$ |
4,889 |
|
|
Reserve for Sales Returns (a) |
|
|
643 |
|
|
|
10,517 |
|
|
|
(10,444 |
) |
|
|
716 |
|
|
Year Ended February 1, 2014 |
|
|
|
|
|
|
|
|
|
|
|
|
|
|
|
|
|
Inventory Reserve |
|
$ |
2,565 |
|
|
$ |
2,553 |
|
|
$ |
(1,098 |
) |
|
$ |
4,020 |
|
|
Reserve for Sales Returns (a) |
|
|
500 |
|
|
|
9,588 |
|
|
|
(9,445 |
) |
|
|
643 |
|
|
Year Ended February 2, 2013 |
|
|
|
|
|
|
|
|
|
|
|
|
|
|
|
|
|
Inventory Reserve |
|
$ |
2,545 |
|
|
$ |
1,228 |
|
|
$ |
(1,208 |
) |
|
$ |
2,565 |
|
|
Reserve for Sales Returns (a) |
|
|
459 |
|
|
|
6,977 |
|
|
|
(6,936 |
) |
|
|
500 |
|
|
(a) |
These amounts represent the gross margin effect of sales returns during the respective years. |
ITEM 9. CHANGES IN AND DISAGREEMENTS WITH ACCOUNTANTS ON ACCOUNTING AND FINANCIAL DISCLOSURE
None.
ITEM 9A. CONTROLS AND PROCEDURES
Disclosure Controls and Procedures
As of the end of the period covered by this report, management, including our chief executive officer and chief financial officer, evaluated the effectiveness of the design and operation of our disclosure controls and procedures. Based upon and as of the date of the evaluation, our chief executive officer and chief financial officer concluded that our disclosure controls and procedures were effective as of January 31, 2015 to ensure that information required to be disclosed in the reports we file or submit under the Securities Exchange Act of 1934, as amended (the “Exchange Act”), is recorded, processed, summarized and reported within the time periods specified in the SEC’s rules and forms. Disclosure controls and procedures include, without limitation, controls and procedures designed to ensure that information required to be disclosed by us in the reports we file or submit under the Exchange Act is accumulated and communicated to our management, including our chief executive officer and our chief financial officer, as appropriate to allow timely decisions regarding required disclosure.
Changes in Internal Control Over Financial Reporting
There were no changes in our internal control over financial reporting during the 13 weeks ended January 31, 2015 that have materially affected, or are reasonably likely to materially affect, our internal control over financial reporting.
Exemption from Management’s Report on Internal Control Over Financial
This 10-K does not include a report of management’s assessment regarding internal control over financial reporting or an attestation report of our independent registered public accounting firm due to a transition period established by rules of the SEC for newly public companies.
None.
70
ITEM 10. DIRECTORS, EXECUTIVE OFFICERS AND CORPORATE GOVERNANCE
The Company has adopted a Code of Conduct and Ethics applicable to our employees, directors, and officers. This Code of Conduct and Ethics is applicable to our principal executive officer, principal financial officer, principal accounting officer and controller, or persons performing similar functions. The code is available on the Company’s website at investors.sportsmanswarehouse.com. To the extent required by rules adopted by the SEC and NASDAQ, we intend to promptly disclose future amendments to certain provisions of the code, or waivers of such provisions granted to executive officers and directors on our website at investors.sportsmanswarehouse.com.
The remaining information required by this Item 10 will be included in our Proxy Statement and is incorporated herein by reference.
ITEM 11. EXECUTIVE COMPENSATION
The information required by this Item 11 will be included in our Proxy Statement and is incorporated herein by reference.
ITEM 12. SECURITY OWNERSHIP OF CERTAIN BENEFICIAL OWNERS AND MANAGEMENT RELATED STOCKHOLDER MATTERS
The information required by this Item 12 will be included in our Proxy Statement and is incorporated herein by reference.
ITEM 13. CERTAIN RELATIONSHIPS AND RELATED TRANSACTIONS, AND DIRECTOR INDEPENDENCE
The information required by this Item 13 will be included in our Proxy Statement and is incorporated herein by reference.
ITEM 14. PUBLIC ACCOUNTING FEES AND SERVICES
The information required by this Item 14 will be included in our Proxy Statement and is incorporated herein by reference.
71
PART IV
ITEM 15. EXHIBITS, FINANCIAL STATEMENT SCHEDULES
|
(a) |
List The following documents are filed as part of this report: |
|
1. |
Financial Statements: |
|
· |
Report of Independent Registered Public Accounting Firm |
|
· |
Consolidated Balance Sheets – January 31, 2015 and February 1, 2014 |
|
· |
Consolidated Statements of Income – Years ended January 31, 2015, February 1, 2014 and February 2, 2013 |
|
· |
Consolidated Statements of Stockholders’ Equity (Deficit) – Years ended January 31, 2015, February 1, 2014 and February 2, 2013 |
|
· |
Consolidated Statements of Cash Flows – Years ended January 31, 2015, February 1, 2014 and February 2, 2013 |
|
· |
Notes to Consolidated Financial Statements |
|
2. |
Financial Statement Schedules: |
|
· |
Schedule II – Valuation and Qualifying Accounts |
All other schedules for which provision is made in the applicable accounting regulations of the SEC are not required under the related instructions or are inapplicable and, therefore, have been omitted.
|
3. |
Exhibits: See Item 15(b) below. |
|
(b) |
Exhibits |
|
Exhibit |
|
Description |
|
|
|
|
|
3.1 |
|
Amended and Restated Certificate of Incorporation of Sportsman’s Warehouse Holdings, Inc. (incorporated by reference to Exhibit 3.1 to the Company’s Quarterly Report on Form 10-Q filed on June 11, 2014). |
|
|
|
|
|
3.2 |
|
Amended and Restated Bylaws of Sportsman’s Warehouse Holdings, Inc. (incorporated by reference to Exhibit 3.2 to the Company’s Quarterly Report on Form 10-Q filed on June 11, 2014). |
|
|
|
|
|
4.1 |
|
Form of Specimen Common Stock of Sportsman’s Warehouse Holdings, Inc. (incorporated by reference to Exhibit 4.1 to Amendment No. 1 to the Company’s Registration Statement on Form S-1 (Registration No. 333.1944421) filed on March 24, 2014). |
|
|
|
|
|
4.2 |
|
Registration Rights Agreement, dated April 15, 2014, among Sportsman’s Warehouse Holdings, Inc., SEP SWH Holdings, L.P. and New SEP SWH Holdings, L.P. (incorporated by reference to Exhibit 4.2 to the Company's Registration Statement on Form S-1 (Registration No. 333-1944421) filed on March 7, 2014). |
|
|
|
|
|
10.2† |
|
Guarantee and Collateral Agreement, dated as of August 20, 2013, among Sportsman’s Warehouse, Inc., as Borrower, Sportsman’s Warehouse Holdings, Inc., the Subsidiaries of the Borrower from time to time party thereto and Credit Suisse AG, as Collateral Agent (incorporated by reference to Exhibit 10.2 to the Company’s Registration Statement on Form S-1 (Registration No. 333-1944421) filed on March 7, 2014). |
|
|
|
|
|
10.3† |
|
Credit Agreement, dated as of May 28, 2010, among Sportsman’s Warehouse, Inc., as Lead Borrower, the other Borrowers party thereto, Sportsman’s Warehouse Holdings, Inc., as a Guarantor, the Lenders party thereto, and Wells Fargo Bank, National Association, as Administrative Agent, Collateral Agent, and Swing Line Lender (incorporated by reference to Exhibit 10.3 to the Company’s Registration Statement on Form S-1 (Registration No. 333-1944421) filed on March 7, 2014). |
|
|
|
|
|
10.3.1† |
|
First Amendment to Credit Agreement, dated as of October 27, 2011, among Sportsman’s Warehouse, Inc., as Lead Borrower, the other Borrowers party thereto, Sportsman’s Warehouse Holdings, Inc., as a Guarantor, the Lenders party thereto, and Wells Fargo Bank, National Association, as Administrative Agent, Collateral Agent, and Swing Line Lender (incorporated by reference to Exhibit 10.3.1 to the Company’s Registration Statement on Form S-1 (Registration No. 333-1944421) filed on March 7, 2014). |
|
|
|
|
72
|
Exhibit |
|
Description |
|
|
|
|
|
10.3.2† |
|
Second Amendment to Credit Agreement, dated as of November 13, 2012, among Sportsman’s Warehouse, Inc., as Lead Borrower, the other Borrowers party thereto, Sportsman’s Warehouse Holdings, Inc., as a Guarantor, the Lenders party thereto, and Wells Fargo Bank, National Association, as Administrative Agent, Collateral Agent, and Swing Line Lender (incorporated by reference to Exhibit 10.3.2 to the Company’s Registration Statement on Form S-1 (Registration No. 333-1944421) filed on March 7, 2014). |
|
|
|
|
|
10.3.3 |
|
Side Letter, dated as of July 8, 2013, from Wells Fargo Bank, National Association to Sportsman’s Warehouse, Inc. (incorporated by reference to Exhibit 10.3.3 to the Company’s Registration Statement on Form S-1 (Registration No. 333-1944421) filed on March 7, 2014). |
|
|
|
|
|
10.3.4† |
|
Third Amendment to Credit Agreement, dated as of August 20, 2013, among Sportsman’s Warehouse, Inc., as Lead Borrower, the other Borrowers party thereto, Sportsman’s Warehouse Holdings, Inc., as a Guarantor, the Lenders party thereto, and Wells Fargo Bank, National Association, as Administrative Agent, Collateral Agent, and Swing Line Lender (incorporated by reference to Exhibit 10.3.4 to the Company’s Registration Statement on Form S-1 (Registration No. 333-1944421) filed on March 7, 2014). |
|
|
|
|
|
10.3.5 |
|
Side Letter, dated as of October 21, 2013, from Wells Fargo Bank, National Association to Sportsman’s Warehouse, Inc. (incorporated by reference to Exhibit 10.3.5 to the Company’s Registration Statement on Form S-1 (Registration No. 333-1944421) filed on March 7, 2014). |
|
|
|
|
|
10.3.6 |
|
Fourth Amendment to Credit Agreement (amended and restated Credit Agreement to reflect first three amendments), dated as of March 20, 2014, among Sportsman’s Warehouse, Inc., as Lead Borrower, the other Borrowers party thereto, Sportsman’s Warehouse Holdings, Inc., as a Guarantor, the Lenders party thereto, and Wells Fargo Bank, National Association, as Administrative Agent, Collateral Agent, and Swing Line Lender (incorporated by reference to Exhibit 10.3.6 to Amendment No. 1 to the Company’s Registration Statement on Form S-1 (Registration No. 333-1944421) filed on March 24, 2014). |
|
|
|
|
|
10.3.7† |
|
Fifth Amendment to Credit Agreement and Third Amendment to Security Agreement, effective as of December 3, 2014, by and among Wells Fargo Retail Finance, LLC, a global investment company, as Lender, and Sportsman’s Warehouse, Inc., as Borrower (incorporated by reference to Exhibit 10.3 to the Company’s Quarterly Report on Form 10-Q filed on December 5, 2014). |
|
|
|
|
|
10.4 |
|
Guaranty, dated as of May 28, 2010, by Sportsman’s Warehouse Holdings, Inc., as Guarantor, in favor of Wells Fargo Retail Finance, LLC, as Administrative Agent and Collateral Agent, and the Credit Parties (incorporated by reference to Exhibit 10.4 to the Company’s Registration Statement on Form S-1 (Registration No. 333-1944421) filed on March 7, 2014). |
|
|
|
|
|
10.5 |
|
Security Agreement, dated as of May 28, 2010, by Sportsman’s Warehouse, Inc., Minnesota Merchandising Corp., Sportsman’s Warehouse Southwest, Inc. and Pacific Flyway, LLC, as Borrowers, and Sportsman’s Warehouse Holdings, Inc., as Guarantor, in favor of Wells Fargo Retail Finance, LLC, as Collateral Agent (incorporated by reference to Exhibit 10.5 to the Company’s Registration Statement on Form S-1 (Registration No. 333-1944421) filed on March 7, 2014). |
|
|
|
|
|
10.6 |
|
Form of Agreement between holders of restricted nonvoting common stock and Sportsman’s Warehouse Holdings, Inc. (incorporated by reference to Exhibit 10.6 to the Company’s Registration Statement on Form S-1 (Registration No. 333-1944421) filed on March 7, 2014). |
|
|
|
|
|
10.7* |
|
Sportsman’s Warehouse Holdings, Inc. 2013 Performance Incentive Plan. (incorporated by reference to Exhibit 10.7 to the Company’s Registration Statement on Form S-1 (Registration No. 333-1944421) filed on March 7, 2014). |
|
|
|
|
|
10.8* |
|
Form of Restricted Stock Unit Award Agreement (incorporated by reference to Exhibit 10.8 to the Company’s Registration Statement on Form S-1 (Registration No. 333-1944421) filed on March 7, 2014). |
|
|
|
|
|
10.9* |
|
Form of Indemnification Agreement for Directors and Executive Officers (incorporated by reference to Exhibit 10.9 to the Company’s Registration Statement on Form S-1 (Registration No. 333-1944421) filed on March 7, 2014). |
|
|
|
|
73
|
Exhibit |
|
Description |
|
|
|
|
|
10.10* |
|
Employment Agreement, dated December 10, 2013, between Sportsman’s Warehouse Holdings, Inc. and John V. Schaefer (incorporated by reference to Exhibit 10.10 to the Company’s Registration Statement on Form S-1 (Registration No. 333-1944421) filed on March 7, 2014). |
|
|
|
|
|
10.11* |
|
Employment Agreement, dated January 21, 2014, between Sportsman’s Warehouse Holdings, Inc. and Kevan P. Talbot (incorporated by reference to Exhibit 10.11 to the Company’s Registration Statement on Form S-1 (Registration No. 333-1944421) filed on March 7, 2014). |
|
|
|
|
|
10.12† |
|
Term Loan Agreement, effective as of December 3, 2014, by and among Cortland Capital Market Services LLC, a global investment company, as Lender, and Sportsman’s Warehouse, Inc., as Borrower (incorporated by reference to Exhibit 10.1 to the Company’s Quarterly Report on Form 10-Q filed on December 5, 2014). |
|
|
|
|
|
10.13† |
|
Guarantee and Collateral Agreement, effective as of December 3, 2014, by and among Cortland Capital Market Services LLC, a global investment company, as Lender, and Sportsman’s Warehouse, Inc., as Borrower (incorporated by reference to Exhibit 10.2 to the Company’s Quarterly Report on Form 10-Q filed on December 5, 2014). |
|
|
|
|
|
21.1** |
|
Subsidiaries of Sportsman’s Warehouse Holdings, Inc. |
|
|
|
|
|
23.1** |
|
Consent of KPMG LLP. |
|
|
|
|
|
23.2** |
|
Consent of Buxton Company. |
|
|
|
|
|
31.1** |
|
Certification of Chief Executive Officer pursuant to Section 302 of the Sarbanes-Oxley Act of 2002. |
|
|
|
|
|
31.2** |
|
Certification of Chief Financial Officer pursuant to Section 302 of the Sarbanes-Oxley Act of 2002. |
|
|
|
|
|
32.1*** |
|
Certification of Chief Executive Officer and Chief Financial Officer pursuant to 18 U.S.C. 1350, as created by Section 906 of the Sarbanes-Oxley Act of 2002. |
|
|
|
|
|
101.INS** |
|
XBRL Instance Document. |
|
|
|
|
|
101.SCH** |
|
XBRL Taxonomy Extension Schema Document. |
|
|
|
|
|
101.CAL** |
|
XBRL Taxonomy Extension Calculation Linkbase Document. |
|
|
|
|
|
101.DEF** |
|
XBRL Taxonomy Extension Definition Linkbase Document. |
|
|
|
|
|
101.LAB** |
|
XBRL Taxonomy Extension Label Linkbase Document. |
|
|
|
|
|
101.PRE** |
|
XBRL Taxonomy Extension Presentation Linkbase Document. |
|
* |
|
Management contract or compensatory plan or arrangement |
|
** |
|
Filed herewith |
|
*** |
|
Furnished herewith |
|
† |
|
Indicates that certain information contained herein has been omitted and confidentially submitted separately with the Securities and Exchange Commission. Confidential treatment has been requested with respect to the omitted portions. |
74
SIGNATURES
Pursuant to the requirements of Section 13 or 15(d) of the Securities Exchange Act of 1934, as amended, the Registrant has duly caused this Report to be signed on its behalf by the undersigned, thereunto duly authorized.
|
|
SPORTSMAN’S WAREHOUSE HOLDINGS, INC. |
||
|
Date: April 2, 2015 |
By: |
|
/s/ John V. Schaefer |
|
|
|
|
John V. Schaefer |
|
|
|
|
President and Chief Executive Officer |
|
|
|
|
(Principal Executive Officer) |
|
Date: April 2, 2015 |
By: |
|
/s/ Kevan P. Talbot |
|
|
|
|
Kevan P. Talbot |
|
|
|
|
Chief Financial Officer and Secretary |
|
|
|
|
(Principal Financial and Accounting Officer) |
75
Pursuant to the requirements of the Securities Exchange Act of 1934, this report has been signed below by the following persons on behalf of the registrant and in the capacities and on the dates indicated:
|
Signature |
|
Title |
|
Date |
|
|
|
|
|
|
|
|
|
|
|
|
|
/s/ John V. Schaefer |
|
President, Chief Executive |
|
April 2, 2015 |
|
John V. Schaefer |
|
Officer and Director |
|
|
|
|
|
(Principal Executive Officer) |
|
|
|
|
|
|
|
|
|
/s/ Kevan P. Talbot |
|
Chief Financial Officer and Secretary |
|
April 2, 2015 |
|
Kevan P. Talbot |
|
(Principal Financial and |
|
|
|
|
|
Accounting Officer) |
|
|
|
|
|
|
|
|
|
/s/ Christopher Eastland |
|
Director |
|
April 2, 2015 |
|
Christopher Eastland |
|
|
|
|
|
|
|
|
|
|
|
|
|
|
|
|
|
/s/ Leonard Lee |
|
Director |
|
April 2, 2015 |
|
Leonard Lee |
|
|
|
|
|
|
|
|
|
|
|
|
|
|
|
|
|
/s/ Kent V. Graham |
|
Director |
|
April 2, 2015 |
|
Kent V. Graham |
|
|
|
|
|
|
|
|
|
|
|
|
|
|
|
|
|
/s/ Gregory P. Hickey |
|
Director |
|
April 2, 2015 |
|
Gregory P. Hickey |
|
|
|
|
|
|
|
|
|
|
|
|
|
|
|
|
|
/s/ Joseph P. Schneider |
|
Director |
|
April 2, 2015 |
|
Joseph P. Schneider |
|
|
|
|
|
|
|
|
|
|
|
|
|
|
|
|
|
/s/ Kay L. Toolson |
|
Director |
|
April 2, 2015 |
|
Kay L. Toolson |
|
|
|
|
76