Attached files
Washington, D.C. 20549
______________
Form
10-K
| (Mark one) | |||
| ☑ | ANNUAL REPORT PURSUANT TO SECTION 13 OR 15(d) | ||
| OF THE SECURITIES EXCHANGE ACT OF 1934 | |||
| For the fiscal year ended February 1, 2015 | |||
| OR | |||
| ☐ | TRANSITION REPORT PURSUANT TO SECTION 13 OR 15(d) | ||
| OF THE SECURITIES EXCHANGE ACT OF 1934 | |||
| For the transition period from | to | ||
Commission file number
001-16485
KRISPY KREME DOUGHNUTS, INC.
(Exact name of registrant
as specified in its charter)
| North Carolina | 56-2169715 |
| (State or other jurisdiction of | (I.R.S. Employer Identification No.) |
| incorporation or organization) | |
| 370 Knollwood Street, | 27103 |
| Winston-Salem, North Carolina | (Zip Code) |
| (Address of principal executive offices) | |
Registrant’s telephone
number, including area code:
(336) 725-2981
Securities registered pursuant to Section 12(b) of the Act:
| Name of | |
| Each Exchange | |
| on Which | |
| Title of Each Class | Registered |
| Common Stock, No Par Value | New York Stock Exchange |
None
Indicate by check mark if the registrant is a well-known seasoned issuer, as defined in Rule 405 of the Securities Act. Yes ☐ No ☑
Indicate by check mark if the registrant is not required to file reports pursuant to Section 13 or Section 15(d) of the Act. Yes ☐ No ☑
Indicate by check mark whether the registrant (1) has filed all reports required to be filed by Section 13 or 15(d) of the Securities Exchange Act of 1934 during the preceding 12 months (or for such shorter period that the registrant was required to file such reports), and (2) has been subject to such filing requirements for the past 90 days. Yes ☑ No ☐
Indicate by check mark whether the registrant has submitted electronically and posted on its corporate Web site, if any, every Interactive Data File required to be submitted and posted pursuant to Rule 405 of Regulation S-T during the preceding 12 months (or for such shorter period that the registrant was required to submit and post such files). Yes ☑ No ☐
1
Indicate by check mark if disclosure of delinquent filers pursuant to Item 405 of Regulation S-K (§ 229.405 of this chapter) is not contained herein, and will not be contained, to the best of registrant’s knowledge, in definitive proxy or information statements incorporated by reference in Part III of this Form 10-K or any amendment to this Form 10-K. ☐
Indicate by check mark whether the registrant is a large accelerated filer, an accelerated filer, a non-accelerated filer, or a smaller reporting company. See the definitions of “large accelerated filer,” “accelerated filer” and “smaller reporting company” in Rule 12b-2 of the Exchange Act.
| Large accelerated filer ☑ | Accelerated filer ☐ | Non-accelerated filer ☐ | Smaller Reporting Company ☐ |
Indicate by check mark whether the registrant is a shell company (as defined in Rule 12b-2 of the Act). Yes ☐ No ☑
The aggregate market value of voting and non-voting common equity of the registrant held by nonaffiliates of the registrant as of August 3, 2014 was $955,000,000.
Number of shares of Common Stock, no par value, outstanding as of March 20, 2015: 64,927,711.
DOCUMENTS INCORPORATED BY REFERENCE:
Portions of the definitive proxy statement for the registrant’s 2015 Annual Meeting of Shareholders to be held on June 17, 2015 are incorporated by reference into Part III hereof.
2
3
As used herein, unless the context otherwise requires, “Krispy Kreme,” the “Company,” “we,” “us” and “our” refer to Krispy Kreme Doughnuts, Inc. and its subsidiaries. References to fiscal 2016, fiscal 2015, fiscal 2014 and fiscal 2013 mean the fiscal years ended January 31, 2016, February 1, 2015, February 2, 2014 and February 3, 2013, respectively. Please note that fiscal 2013 contained 53 weeks.
This Annual Report on Form 10-K contains forward-looking statements within the meaning of Section 27A of the Securities Act of 1933, as amended, and Section 21E of the Securities Exchange Act of 1934, as amended (the “Exchange Act”), that relate to our plans, objectives, estimates and goals. Statements expressing expectations regarding our future and projections relating to products, sales, revenues, expenditures, costs and earnings are typical of such statements, and are made under the Private Securities Litigation Reform Act of 1995. Forward-looking statements are based on management’s beliefs, assumptions and expectations of our future economic performance, considering the information currently available to management. These statements are not statements of historical fact. Forward-looking statements involve risks and uncertainties that may cause our actual results, performance or financial condition to differ materially from the expectations of future results, performance or financial condition we express or imply in any forward-looking statements. The words “believe,” “may,” “could,” “will,” “should,” “would,” “anticipate,” “estimate,” “expect,” “intend,” “objective,” “seek,” “strive” or similar words, or the negative of these words, identify forward-looking statements. Factors that could contribute to these differences include, but are not limited to:
| ● | the quality of Company and franchise store operations and changes in sales volume; |
| ● | risks associated with the use and implementation of information technology; |
| ● | our ability, and our dependence on the ability of our franchisees, to execute on our and their business plans; |
| ● | our relationships with our franchisees; |
| ● | actions by franchisees that could harm our business; |
| ● | our ability to implement our domestic and international growth strategies; |
| ● | our ability to implement and operate our domestic shop model; |
| ● | political, economic, currency and other risks associated with our international operations; |
| ● | the price and availability of raw materials needed to produce doughnut mixes and other ingredients, and the price of motor fuel; |
| ● | our relationships with wholesale customers; |
| ● | reliance on third parties in many aspects of our business; |
| ● | our ability to protect our trademarks and trade secrets; |
| ● | changes in customer preferences and perceptions; |
| ● | risks associated with competition; |
| ● | risks related to the food service industry, including food safety and protection of personal information; |
| ● | compliance with government regulations relating to food products and franchising; |
| ● | increased costs or other effects of new government regulations; and |
| ● | other factors discussed below in Item 1A, “Risk Factors” and in Krispy Kreme’s periodic reports and other information filed with the United States Securities and Exchange Commission (the “SEC”). |
All such factors are difficult to predict, contain uncertainties that may materially affect actual results and may be beyond our control. New factors emerge from time to time, and it is not possible for management to predict all such factors or to assess the impact of each such factor on the Company. Any forward-looking statement speaks only as of the date on which such statement is made, and we do not undertake any obligation to update any forward-looking statement to reflect events or circumstances after the date on which such statement is made.
We caution you that any forward-looking statements are not guarantees of future performance and involve known and unknown risks, uncertainties and other factors which may cause our actual results, performance or achievements to differ materially from the facts, results, performance or achievements we have anticipated in such forward-looking statements except as required by the federal securities laws.
4
Company Overview
Krispy Kreme is a leading branded retailer and wholesaler of high-quality doughnuts, complementary beverages and treats and packaged sweets. The Company’s principal business, which began in 1937, is owning and franchising Krispy Kreme stores, at which a wide variety of high-quality doughnuts, including the Company’s Original Glazed® doughnut, are sold and distributed together with complementary products, and where a broad array of coffees and other beverages are offered.
The Company generates revenues from four business segments: Company Stores, Domestic Franchise, International Franchise and KK Supply Chain. The revenues and operating income of each of these segments for each of the three most recent fiscal years is set forth in Note 2 to the Company’s consolidated financial statements appearing elsewhere herein.
Company Stores. The Company Stores segment is comprised of the doughnut shops operated by the Company. These shops sell doughnuts and complementary products through the on-premises and wholesale channels and come in two formats: factory stores and satellite shops. Factory stores have a doughnut-making production line, and many of them sell products to on-premises consumers and at wholesale to approved retailers of Krispy Kreme products to more fully utilize production capacity. Factory stores also include commissaries which serve only wholesale customers. Satellite shops, which serve only on-premises customers, are smaller than most factory stores, and include the hot shop and fresh shop formats. As of February 1, 2015, there were 111 Company shops in 19 states and the District of Columbia, including 92 factory and 19 satellite shops.
Domestic Franchise. The Domestic Franchise segment consists of the Company’s domestic store franchise operations and the licensing of Krispy Kreme products domestically. Domestic franchise stores sell doughnuts and complementary products through the on-premises and wholesale channels in the same way and using the same store formats as do Company stores. As of February 1, 2015, there were 167 domestic franchise stores in 32 states, consisting of 116 factory and 51 satellite stores.
The Company began licensing complementary products in the beverage category when it signed an agreement for the test of Krispy Kreme branded bagged coffee at approximately 100 wholesale club locations in the southeastern United States. In calendar 2014, the Company signed agreements for the introduction of Krispy Kreme branded ready-to-drink coffee beverages in bottles for distribution at approximately 900 mass merchant locations throughout the United States, and an agreement with Keurig Green Mountain to bring Krispy Kreme branded coffee to the Keurig® brewing system. Krispy Kreme coffee is available in K-Cup® packs at grocery, convenience store and big box outlets throughout the U.S., as well as at Krispy Kreme shops and online. Manufacturing and distribution of all three products is done by the licensees. In March 2015, the Company announced a multi-year licensing agreement with a major beverage firm to roast and distribute twelve-ounce bags of Krispy Kreme® ground coffee in Rich, Smooth and Decaf blends through grocers, mass merchants, club stores and online. The Company intends to expand licensing of its brand to additional beverages and other product categories.
International Franchise. The International Franchise segment consists of the Company’s international store franchise operations. International franchise stores sell doughnuts and complementary products almost exclusively through the on-premises sales channel using shop formats similar to those used in the United States, and also using a kiosk format. A portion of sales by the franchisees in Canada, the United Kingdom and Australia are made at wholesale to approved retailers of Krispy Kreme products. As of February 1, 2015, there were 709 international franchise shops in 23 countries, consisting of 133 factory stores and 576 satellite shops.
KK Supply Chain. The KK Supply Chain segment produces doughnut mixes and manufactures doughnut-making equipment, which all factory stores, both Company and franchise, are required to purchase. In addition, KK Supply Chain sells other ingredients, packaging and supplies, principally to Company-owned and domestic franchise stores.
5
As of February 1, 2015, there were 278 Krispy Kreme stores operated domestically in 39 states and in the District of Columbia, and there were 709 shops in 23 other countries around the world. Of the 987 total stores, 341 were factory stores and 646 were satellites. The ownership and location of those stores is as follows:
| Domestic | International | Total | ||||
| Company stores | 111 | - | 111 | |||
| Franchise stores | 167 | 709 | 876 | |||
| Total | 278 | 709 | 987 |
The Company and its franchisees sell products through two channels:
| ● | On-premises: Sales to customers visiting Company and franchise factory and satellite stores, including sales made through drive-thru windows, along with discounted sales to community organizations that in turn sell doughnuts for fundraising purposes. A substantial majority of the doughnuts sold in our shops are consumed elsewhere. |
| ● | Wholesale: Sales of fresh doughnuts and packaged sweets primarily on a branded basis to a variety of retail customers, including convenience stores, grocery stores/mass merchants and other food service and institutional accounts. These customers display and resell the doughnuts and other products from self-service display cases, and in packages merchandised on stand-alone display units or on the retailer’s shelf. Products are delivered to customer locations by our fleet of delivery trucks operated by a commissioned employee sales force or, occasionally, by independent third-party distributors. Distribution through wholesale sales channels generally is limited to stores in the United States. Only a small minority of sales by international franchisees are made to wholesale customers. |
Company History
In 1933, Vernon Carver Rudolph, the founder of Krispy Kreme, went to work for his uncle, who had acquired a doughnut shop in Paducah, Kentucky from a French chef originally from New Orleans, which included, among other items, the rights to a secret yeast-raised doughnut recipe. In the mid 1930s, they decided to look for a larger market, and moved their operations to Nashville, Tennessee. Shortly thereafter, Mr. Rudolph acquired the business, together with his father and brother, and they soon opened shops in Charleston, West Virginia and Atlanta, Georgia. At this time, the business focused on selling doughnuts to local grocery stores.
During the early summer of 1937, Mr. Rudolph decided to leave Nashville to open his own doughnut shop. Along with two friends, he set off in a 1936 Pontiac and arrived in Winston-Salem, North Carolina with $25 in cash, a few pieces of doughnut-making equipment, the secret recipe, and the name Krispy Kreme Doughnuts. They used their last $25 to rent a building across from Salem Academy and College in what is now called historic Old Salem.
On July 13, 1937, the first Krispy Kreme doughnuts were made at the new Winston-Salem shop, with the first batch of ingredients purchased on credit. Mr. Rudolph was 21 years of age. Soon afterward, people began stopping by to ask if they could buy hot doughnuts right there on the spot. The demand was so great that Mr. Rudolph opened the shop for retail business by cutting a hole in the wall and selling doughnuts directly to customers, marking the beginning of Krispy Kreme’s restaurant business.
In 1939, Mr. Rudolph registered the trademark “Krispy Kreme” with the United States Patent and Trademark Office. The business grew rapidly and the number of shops grew, opened first by family members and later by licensees.
In the 1950s and 1960s, steps were taken to mechanize the doughnut-making process. Proofing, cooking, glazing, screen loading and cutting became entirely automatic. Most of these doughnut-making processes are still used by Krispy Kreme stores today, although they have been further modernized.
Following Mr. Rudolph’s death, in May 1976 Krispy Kreme became a wholly-owned subsidiary of Beatrice Foods Company of Chicago, Illinois. In February 1982, a group of Krispy Kreme franchisees purchased Krispy Kreme from Beatrice Foods.
With new leadership, a renewed focus on the hot doughnut experience became a priority for the Company and led to the birth of the Doughnut Theater®, in which the doughnut-making production line is visible to consumers, creating a multi-sensory experience unique to Krispy Kreme that is an important distinguishing feature of our brand. The Company began to expand outside of the Southeast and opened a store in New York City in 1996. Soon afterward, in 1999, the Company opened its first store in California and began its national expansion. In April 2000, Krispy Kreme held an initial public offering of common stock, and in December 2001, the Company opened its first international store, in Canada, and began its international expansion.
When the Company turned 60 years old in 1997, Krispy Kreme’s place as a 20th century American icon was recognized by the induction of Company artifacts into the Smithsonian Institution’s National Museum of American History.
6
Today, our Hot Krispy Kreme Original Glazed Now® sign is an integral contributor to the brand’s mystique. In addition, the Doughnut Theater in factory stores provides a multi-sensory introduction to the brand and reinforces the unique Krispy Kreme experience in 24 countries around the world.
Industry Overview
Krispy Kreme operates within the quick service restaurant, or QSR, segment of the restaurant industry, although our consumer research indicated domestic customers think of our shops more like bakeries than restaurants. In our Company shops, approximately 55% of retail transactions include one or more dozens of doughnuts and the vast majority of products we sell in our shops are consumed elsewhere. In the United States, the QSR segment is the largest segment of the restaurant industry and has demonstrated steady growth over a long period of time.
We believe that the QSR segment is generally less vulnerable to economic downturns than the casual dining segment, due to the value that QSRs deliver to consumers, as well as some “trading to value” by consumers from other restaurant industry segments during adverse economic conditions, as they seek to preserve the “away from home” dining experience on tighter budgets. However, high unemployment, low consumer confidence, tightened credit and other factors have taken their toll on consumers and their ability to increase spending, resulting in fewer visits to restaurants and related dollar growth. As a result, QSR sales may continue to be adversely impacted by the weak economic environment or by sharp increases in commodity or energy prices. We believe increased prices of agricultural products and energy are more likely to significantly affect our business than are economic conditions generally, because we believe our products are affordable indulgences that appeal to consumers in all economic environments.
In both domestic and international markets, we compete against a broad array of national, regional and local retailers of doughnuts and treats, some of which have substantially greater financial resources than we do and are expanding to other geographic regions, including areas where we have a significant store presence. We also compete against other retailers who sell sweet treats such as cookie, cupcake and ice cream stores. We compete on elements such as food quality, convenience, location, customer service and value.
In addition to retail doughnut outlets, the domestic doughnut market is comprised of several other sales channels, including grocery store packaged products, in-store bakeries within grocery stores, convenience stores, and foodservice and institutional accounts. Our wholesale competitors include makers of doughnuts and snacks sold through all of these wholesale channels. Customer service, including frequency of deliveries and maintenance of fully stocked shelves, is an important factor in successfully competing for convenience store and grocery/mass merchant business. There is an industry trend moving towards expanded fresh product offerings at convenience stores during morning and evening drive times, and products are either sourced from a central commissary or brought in by local bakeries. In the packaged doughnut market, we compete for sales with many sweet treats, including those made by well-known producers, such as Dolly Madison, Entenmann’s, Little Debbie, Hostess and Sara Lee, as well as regional brands.
The Company uses industry data purchased from third-party vendors to track doughnut category sales by distribution channel. Industry data indicate that during fiscal 2015, doughnut industry sales rose approximately 4.8% year-over-year in grocery stores and rose approximately 14.3% in convenience stores. During that same time Krispy Kreme’s market share declined 0.7% and 1.3% in those channels, respectively.
Krispy Kreme Brand Elements
| Krispy Kreme has several important brand elements we believe have created a bond between our brand and our team members, guests, consumers and their communities. The key elements include: | |
| One-of-a-kind taste. The taste experience of our doughnuts is the foundation of our concept and the common thread that binds generations of our loyal customers. Our doughnuts are made based on a secret recipe that has been in our Company since 1937. We use premium ingredients, which are blended by our proprietary processing equipment in accordance with our standard operating procedures, to create this unique and very special product. Our research indicates this one-of-a-kind taste drives guests’ cravings for our products. | |
| Doughnut Theater. Our factory stores typically showcase our Doughnut Theater, which is designed to produce a multi-sensory customer experience and establish a brand identity. Our goal is to provide our customers with an entertainment experience and to reinforce our commitment to quality and freshness by allowing them to see the doughnuts being made. | |
|
Hot Krispy Kreme Original Glazed Now sign. The Hot Krispy Kreme Original Glazed Now sign, when illuminated, is a signal that our hot Original Glazed doughnuts are being served. The Hot Krispy Kreme Original Glazed Now sign is an impulse purchase generator and an integral contributor to our brand. In fiscal 2012, we introduced the Krispy Kreme Hot Light® app for smartphones and desktops that automatically notifies guests when the Hot Krispy Kreme Original Glazed Now sign is illuminated at either their favorite or the nearest Krispy Kreme shop. The app also allows users to get directions to Krispy Kreme locations and find out important information regarding current promotions. |
7
| Our Original Glazed doughnuts are made for several hours every morning and evening, and at other times during the day at our factory stores. We also operate hot shops, which are satellite locations supplied with unglazed doughnuts from a nearby factory store or commissary. Hot shops use tunnel ovens to heat unglazed doughnuts throughout the day, which are then finished using the same glaze waterfall process used at factory shops. | |
| Sharing and Connection. Krispy Kreme doughnuts are a popular choice for sharing with friends, family, co-workers and fellow students. Consumer research shows the majority of purchases at our domestic shops are for sharing occasions and in Company shops, approximately 55% of retail transactions are for sales of one or more dozen doughnuts. The strength of our brand in shared-use occasions transcends international borders. Sales of dozens comprise a significant portion of shop sales transactions around the world, and the sharing concept is an integral part of our global marketing approach. | |
| Community relationships. Krispy Kreme was built upon generations of word-of-mouth marketing. We are committed to building relationships with our team members, guests and in our communities. Our shop operators support their local communities through fundraising programs and sponsorship of charitable events. Many of our loyal customers have memories of selling Krispy Kreme doughnuts to raise money for their schools, clubs and community organizations. We refer to these activities as “local relationship marketing;” it is the core building block of Krispy Kreme marketing and directly connects our marketing efforts to our brand’s mission of “touching and enhancing lives through the joy that is Krispy Kreme.” | |
|
Heritage. For over 77 years, Krispy Kreme has been known for producing one-of-a-kind doughnuts. Our consumer research indicates this heritage and consistency are important parts of the brand’s imagery with our guests. Icons of Krispy Kreme’s heritage include paper hats, historical road signs and our “bowtie” logo. |
Strategic Initiatives
We have developed a number of strategic initiatives designed to foster our growth and improve our profitability. Our business strategy has four principal components:
| ● | accelerating global growth |
| ● | leveraging technology |
| ● | enhancing our core menu and |
| ● | maximizing brand awareness. |
Accelerating global growth
Geographic Expansion
We believe that there is a significant opportunity to expand our business globally. Our approach to expansion is threefold:
First, we plan to infill in markets in which we are already represented by expanding with existing franchise partners and growing out existing Company-owned markets. We believe this approach will permit us to leverage supply chain efficiencies and capitalize on our strong brand awareness.
Second, we intend to pursue expansion opportunities with new franchisees to grow our shop footprint in both underpenetrated and new markets.
Third, we plan to evaluate new markets, regions and areas where Krispy Kreme has limited or no existing market presence. We expect to announce new development agreements in the future as we seek to increase the number of new shops franchisees have contractually committed to open.
In the past two fiscal years, we have announced new shop development agreements with domestic franchisees in Dallas, Houston, Maryland, northern Virginia, Arkansas and southern California, and internationally in South Korea, Colombia, Taiwan, Bangladesh and Russia. In addition, the Company opened new shops in a number of existing Company markets, including Atlanta, Georgia and Jacksonville, Florida.
8
We have a suite of shop formats to fit individual market needs, which we believe will facilitate Company and franchisee shop expansion. See “Company Stores Business Segment — Shop Formats” below.
Our goal is to achieve annual double-digit percentage growth in our systemwide unit count over the next several years.
Growth in Same Store Sales
In addition to growth from an expected increase in the number of Krispy Kreme shops, we believe we have opportunities to increase same store sales and shop average unit volumes.
We expect continued same store sales growth in our U.S. business. To achieve this goal, we are focused on increasing traffic by offering additional doughnut and beverage varieties, using strategic promotions, and encouraging special and “everyday” reasons for consumers to visit Krispy Kreme. We plan to further develop and leverage a new mobile guest engagement platform described below to delight guests, build visit frequency and promote social media sharing of the Krispy Kreme consumer experience.
Leveraging Technology
We are devoting significant resources to improving and enhancing our information technology platforms.
We are leveraging our successful Hot Light smartphone app, by introducing our new mobile guest engagement platform, including the My Krispy Kreme Treats™ loyalty and rewards program. Offered for both the iPhone™ and Android™ platforms, this new mobile program currently is operational in four Company markets, and we plan to introduce the program across the U.S. later in fiscal 2016.
Our guest engagement platform offers the Hot Light feature, enabling consumers to locate the nearest Krispy Kreme shop and be notified when the Hot Krispy Kreme Original Glazed Now light is illuminated at each consumer’s favorite Krispy Kreme shop.
With the introduction of My Krispy Kreme Treats, we can reward guests for their purchases with a simple framework that has an easy-to-read dashboard and current product and marketing news. The app shows current points accumulated, earned rewards and points needed for the next reward. The app also offers securely-loadable stored value for the convenience of guests. Future versions of the app are expected to include e-gifting, which would allow consumers to transfer digitally either stored value or reward points to family and friends.
We are also working to enhance our business intelligence capabilities to gather more precise and timely data and to gather information about consumer needs and desires.
In addition, in March 2015, we implemented the first phase of a new state-of-the-art enterprise resource planning (“ERP”) system. This initial phase includes core accounting system functionality, including general ledger, accounts receivable and payable, fixed assets, purchasing, warehouse management, equipment and doughnut mix manufacturing cost accounting, and database management. The first phase implementation also provides the platform for anticipated deployment of additional ERP functionality including business analytics, demand and production planning, shop cost accounting and more robust promotional analysis.
Enhancing the Core Menu
We believe our unique Krispy Kreme Original Glazed and other doughnut offerings are a core strength of our brand and a major factor differentiating us from other sweet-goods manufacturers and retailers. While we expect that doughnuts will remain at the center of our menu offerings, we expect to continue to focus on increasing doughnut variety to keep offerings both exciting and inviting. In addition, we believe that increasing the percentage of retail consumers who purchase a beverage when visiting Krispy Kreme has great potential for growing both revenues and profitability.
Maximizing Brand Awareness
We believe that wholesale distribution of doughnuts, snacks and beverages offers an opportunity to maximize the value of the Krispy Kreme brand.
Wholesale distribution of doughnuts and snacks represents about half of the revenues of our Company Stores segment. We have been adding new, longer shelf-life snacks to our product offering, and believe the wholesale channel has continued opportunity for sales and profit growth.
In fiscal 2014, we announced our licensing program, with an emphasis on coffee. The primary focus of the licensing program is to create top of mind consumer awareness of the Krispy Kreme brand in the beverage category and to encourage trial usage of Krispy Kreme coffee. In addition to improving the in-store beverage attachment rate, we believe licensing can increase brand equity and offer long-term revenue opportunities.
9
We believe our fundraising program has potential for future revenue growth. For over sixty years, Krispy Kreme’s fundraising program has assisted local charities; in fiscal 2015 alone, the program helped organizations raise more than $35 million. We believe we can enhance our fundraising program with the use of technology and by increasing awareness of the program. We believe fundraising is a unique strength of Krispy Kreme, and demonstrates our commitment to our mission “to touch and enhance lives through the joy that is Krispy Kreme.”
Company Stores Business Segment
Our Company Stores segment is comprised of the operations of our Company-owned stores. Of our 111 Company shops in operation as of February 1, 2015, 71 sell doughnuts and complementary products exclusively through the on-premises distribution channel. An additional 32 shops sell products through both on-premises and wholesale channels, and eight commissaries serve wholesale customers exclusively.
We expect substantially all our new shop development to focus on retail-only shops because they are less costly to build and simpler to operate than are shops which serve both on-premises and wholesale customers, and their retail-only nature enables our team members to focus more effectively on providing outstanding consumer experiences.
Expenses for this business segment include cost of goods sold; store level operating expenses; store start-up and preopening costs; segment general, administrative and management expenses; certain marketing costs; and an allocation of shared corporate costs estimated to be directly attributable to the segment’s operations, including accounting, internal audit, human resources, risk management, information technology, and training expenses.
Products
Doughnuts and Related Products. We currently make and sell a wide variety of high-quality doughnuts, including our signature Original Glazed doughnut. Our shops typically offer 16 or more doughnut varieties, including eight varieties that are offered at all our Krispy Kreme shops and up to four limited time doughnut offerings, with the balance of the assortment selected by the shop manager from our more than 12 other standard doughnut varieties. Most of our doughnuts, including our Original Glazed doughnut, are yeast-raised doughnuts, although we also offer several varieties of cake doughnuts and crullers. We have become known for seasonal doughnuts that come in a variety of non-traditional shapes, including hearts, pumpkins, footballs, eggs and snowmen, and which often feature complementary icings and fillings. We also offer other doughnut varieties on a limited time basis to provide a changing variety of new and innovative doughnut menu offerings to consumers, and to promote continuous excitement about our products among our team members. Sales of doughnuts comprise approximately 89% of total retail sales, with the balance comprised principally of beverage sales.
Many of the doughnut varieties we offer in our doughnut shops are also distributed through wholesale channels. In addition, we offer a number of products exclusively through wholesale channels, including Danishes, honeybuns, fruit pies, mini-crullers and chocolate products, generally packaged as individually wrapped snacks or packaged in snack bags. We also have introduced products in non-traditional packaging for distribution through grocery stores, mass merchants and convenience stores. Sales of yeast-raised doughnuts comprise approximately 75% of total wholesale sales, with cake doughnuts and all other product offerings comprising approximately 25% of total wholesale sales.
The cost of doughnut mixes, shortening, sugar and packaging are the four most significant component costs of our doughnut products, comprising approximately 11%, 5%, 5% and 7%, respectively, of Company Stores’ sales, respectively, in fiscal 2015.
Complementary products. We continue to develop and leverage complementary products to meet consumer needs for convenience, regional taste preference and variety. Beverages play a large role in providing convenience and satisfaction for our guests, including coffee, which has been part of the brand for many decades. We have a complete beverage program which includes drip coffees, iced coffees, both coffee-based and non-coffee-based frozen drinks, juices, milks, water, frozen/blended beverages and packaged and fountain beverages. We are continuing to refine our beverage offerings, including specialty espresso, cappuccino and hot chocolate drinks, and rolled out three new drip coffee blends in fiscal 2012. Many markets and shops introduced new espresso beverages in fiscal 2013, and promotional activities include beverage and doughnut combos when appropriate.
Shop Formats
As of February 1, 2015, 103 of our 111 shops serve on-premises consumers; another eight stores are commissaries that produce doughnuts solely for wholesale distribution. Of the 103 shops that serve on-premises consumers, 84 are factory shops that have full doughnut-making production lines, while 19 shops are satellites that serve fresh doughnuts supplied twice-daily by a nearby factory shop. All but one of the satellites offer the Krispy Kreme hot doughnut experience to consumers.
10
The following description of company shop formats is also generally applicable to our domestic and international franchise shop formats, although international markets generally do not use the large traditional factory shop format because most international markets serve only the on-premises distribution channel and therefore do not require the additional space required to support wholesale distribution. All our international shops are operated by franchisees, very few of which are engaged in wholesale distribution.
When the production lines at our factory shops are producing our Original Glazed doughnut, we illuminate our Hot Krispy Kreme Original Glazed Now sign, which is a signal to consumers that our hot Original Glazed doughnuts are being served.
Consumer demand for our products at our retail shops is relatively even throughout the day. The breakdown of our retail sales transactions by daypart is approximately as follows (hours between 11:00 p.m. and 6:00 a.m. have been omitted because very few of our shops are open to the public during these hours):
| Hours | Percentage of Retail Transactions | |
| 6 a.m. – 10 a.m. | 23% | |
| 10 a.m. – 2 p.m. | 21% | |
| 2 p.m. – 6 p.m. | 23% | |
| 6 p.m. – 11 p.m. | 29% |
The ability to accommodate a drive-thru window is an important characteristic in most domestic shop locations, because our shops most often are situated in suburban locations that are accessed by consumers using vehicles. Of our 103 shops which serve on-premises customers, 99 have drive-thrus, and drive-thru sales comprise approximately 49% of these shops’ retail sales. At some of the shops which produce doughnuts 24 hours per day, we also have continuous drive-thru operations.
Over time, as the Company begins to develop shops in more urban, pedestrian-rich environments in the United States, smaller satellite locations may become more common because the lower size requirements may be attractive in urban markets in which the per square foot cost of real estate is greater than suburban locations. Our international franchisees tend to operate in those urban environments and, accordingly, international franchise shops tend to be smaller than their domestic counterparts, and satellite locations are more common than factory shops.
Our domestic consumer demographics are very much in line with the general population in which we do business. Our consumer research also indicates that consumers give us permission to leverage our brand into a variety of complementary products, so long as the quality of those products is consistent with the very high quality consumers attribute to our Original Glazed doughnut.
- Factory Shops
Traditional Factory Stores. Historically, the Krispy Kreme business was centered around large facilities which operated both as quick service restaurants and as consumer packaged goods distributors, with doughnut-making production lines and related doughnut finishing and storage space to support production for both distribution channels. The operation of these traditional factory stores tends to be complex, and their relatively high initial investment and relatively high fixed costs resulted in higher breakeven points compared to shops that serve only on-premises customers.
Traditional factory stores generally are located in freestanding suburban locations generally ranging in size from approximately 2,800 to 5,500 square feet, and typically have the equipment which can produce from 150 to 600 dozen doughnuts per hour. The relatively larger factory stores often sell doughnuts and complementary products to both on-premises and wholesale customers, with the allocation between such channels dependent on the stores’ capacities and the characteristics of the markets in which the stores operate; some of these shops have equipment that can produce 600 dozen doughnuts per hour or have more than one production line. Relatively smaller traditional factory stores, which typically have less production capacity, serve only on-premises customers.
The factory store category also includes eight commissaries, six of which have multiple production lines. These production lines often have equipment capable of producing 600 or 1,000 dozen doughnuts per hour. The commissaries typically serve wholesale customers exclusively, although some commissaries produce certain products (typically longer shelf-life products such as honeybuns) that are shipped to other factory stores where they are distributed to wholesale customers together with products manufactured at the receiving shop.
Historically, the relatively large size and high cost of traditional factory stores limited the density of our stores in many markets, causing many of our consumers to utilize them as “destination” locations, which limited their frequency of use. In addition, each factory store has significant fixed or semi-fixed costs, and margins and profitability are significantly affected by doughnut production and sales volume. Some of our traditional factory stores and commissaries have more capacity to produce doughnuts than is currently is being utilized.
11
Our consumer research indicates that the typical Krispy Kreme on-premises customer visits Krispy Kreme an average of once a month, and a significant obstacle to more frequent customer visits is our relative lack of convenience.
Small Factory Stores. We have been developing smaller factory shops to serve on-premises customers exclusively, with the goal of permitting us to operate a larger number of stores that are more convenient to our customers, reducing the initial shop investment, reducing our per store fixed costs, lowering breakeven points and, most importantly, enabling us to focus exclusively on the consumer experience for our retail customers. Our initial development of small factory shops focused on end-cap locations rather than free-standing shops because end-cap locations typically are less costly than free-standing shops.
During the last three fiscal years, we have opened a total of 26 of these small factory shops, including three shops that were replacements or relocations of existing shops. These shops typically range from approximately 2,700 to 3,000 square feet in size. Most of these new factory shops have been located in freestanding buildings.
Each of these small factories contains a full doughnut production line, but on a smaller scale than the production equipment in a traditional factory store. We view the small factory format as a more cost-effective means to offer the Krispy Kreme experience to consumers than our traditional large factory stores. Due to their lower cost, we believe these small format factory shops will enable us to deliver the Krispy Kreme Doughnut Theater experience to consumers in relatively smaller geographic markets than we currently serve because the small shops typically have lower breakeven points than our large traditional shops.
Our small factory stores generally have the capacity to produce 110 dozen doughnuts per hour, although some shops have greater capacity in order to meet consumer demand in their markets.
The following table summarizes our current inventory of small factory shops, all of which have drive-thrus:
| Number of Company Stores | ||||||
| Free standing | End cap | Average | ||||
| Fiscal Year Opened | Buildings | locations | Square Footage | |||
| Fiscal 2005 | - | 1 | 2,000 | |||
| Fiscal 2010 | - | 1 | 2,500 | |||
| Fiscal 2013 | 2 | 2 | 2,600 | |||
| Fiscal 2014 | 8 | - | 2,500 | |||
| Fiscal 2015 | 14 | - | 2,600 | |||
| Small factory shops in operation at February 1, 2015 | 24 | 4 | ||||
We expect to open 10 to 15 new Company small factory shops in fiscal 2016, all of which we expect to be free-standing.
Outside the United States, small factory stores are more numerous than larger traditional factory stores. Because many international factory stores are located in urban areas where lease rates are relatively high, these shops tend to be smaller than domestic factory stores. In addition, because international factory shops generally serve only on-premises customers, the space required to support wholesale distribution is not required.
- Satellite Shops
In addition to small factory shops, we have developed three varieties of satellite stores that serve fresh doughnuts delivered twice daily from a nearby factory store or, principally in international markets, from a central commissary production facility. Like small factory shops, satellite shops serve only on-premises customers and are smaller than traditional factory stores, but do not contain a doughnut-making production line.
Domestic satellite stores consist of the hot shop and fresh shop formats and, internationally include the kiosk format. Hot shops and fresh shops typically range in size from approximately 1,800 to 2,400 square feet (exclusive of larger factory stores that have been converted to satellites). In each of these formats, the Company sells doughnuts, beverages and complementary products, with the doughnuts supplied by a nearby traditional factory store or a commissary.
Hot shops utilize tunnel oven doughnut heating and finishing equipment to offer customers our hot Original Glazed doughnuts throughout the day. This equipment heats unglazed doughnuts and finishes them using a warm glaze waterfall that is the same as that used in a traditional factory store. Hot shops signal customers that our signature product is available using the Hot Krispy Kreme Original Glazed Now illuminated sign. Products other than our Original Glazed doughnut generally are delivered at least twice daily to the hot shop already finished, although in some locations we perform some finishing functions at the hot shop, including application of icings and fillings, to provide consumers with elements of our Doughnut Theater experience in hot shop locations.
12
Fresh shops are similar to hot shops, but do not contain doughnut heating and finishing equipment. Doughnuts sold at fresh shops often are delivered fully finished from the factory hub, but in some locations fresh shops decorate and finish doughnuts in the shop in order to provide an element of consumer interest and to emphasize the freshness of our products. The fresh shop format is the predominant satellite format used by our international franchisees, comprising approximately 66% of all international satellite shops.
Hot shops and fresh shops typically are located in shopping centers, malls and other retail-oriented locations. Domestically, end cap spaces that can accommodate drive-thru windows are particularly desirable. Kiosks typically are located in high pedestrian traffic venues, such as airports and train stations and transportation malls. We view the satellite formats as ways to achieve market penetration and greater consumer convenience in a variety of market sizes and settings.
Our international franchisees pioneered the development of the satellite small shop formats and the hub and spoke distribution system that supplies them. Most of our international franchisees use a hub and spoke distribution model; 81% of Krispy Kreme shops outside the United States are satellite shops, with the fresh shop being the predominant format.
The following table sets forth the type and locations of Company stores as of February 1, 2015.
| Number of Company Stores | ||||||||
| Factory | ||||||||
| State | Stores | Hot Shops | Fresh Shops | Total | ||||
| Alabama | 4 | 3 | - | 7 | ||||
| District of Columbia | - | 1 | - | 1 | ||||
| Florida | 8 | - | - | 8 | ||||
| Georgia | 15 | 2 | - | 17 | ||||
| Illinois | 1 | - | - | 1 | ||||
| Indiana | 3 | 1 | - | 4 | ||||
| Kansas | 2 | - | - | 2 | ||||
| Kentucky | 4 | 1 | - | 5 | ||||
| Louisiana | 1 | - | - | 1 | ||||
| Maryland | 1 | - | - | 1 | ||||
| Michigan | 3 | - | - | 3 | ||||
| Mississippi | 1 | - | - | 1 | ||||
| Missouri | 1 | - | - | 1 | ||||
| New York | - | - | 1 | 1 | ||||
| North Carolina | 14 | 4 | - | 18 | ||||
| Ohio | 6 | - | - | 6 | ||||
| South Carolina | 6 | 2 | - | 8 | ||||
| Tennessee | 14 | 2 | - | 16 | ||||
| Virginia | 7 | 2 | - | 9 | ||||
| West Virginia | 1 | - | - | 1 | ||||
| Total | 92 | 18 | 1 | 111 | ||||
13
Changes in the number of Company stores during the past three fiscal years are summarized in the following table.
| Number of Company Stores | |||||||||||
| Factory | |||||||||||
| Stores | Hot Shops | Fresh Shops | Total | ||||||||
| January 29, 2012 | 72 | 19 | 1 | 92 | |||||||
| Opened | 4 | - | - | 4 | |||||||
| Closed | (1 | ) | - | - | (1 | ) | |||||
| Transferred from Domestic Franchise | 1 | 1 | - | 2 | |||||||
| February 3, 2013 | 76 | 20 | 1 | 97 | |||||||
| Opened | 6 | - | - | 6 | |||||||
| Closed | (1 | ) | (1 | ) | - | (2 | ) | ||||
| Change in store type | 1 | (1 | ) | - | - | ||||||
| Transferred to Domestic Franchise | (6 | ) | - | - | (6 | ) | |||||
| February 2, 2014 | 76 | 18 | 1 | 95 | |||||||
| Opened | 13 | - | - | 13 | |||||||
| Closed | - | (1 | ) | - | (1 | ) | |||||
| Change in store type | 2 | (2 | ) | - | - | ||||||
| Transferred to Domestic Franchise | (1 | ) | - | - | (1 | ) | |||||
| Transferred from Domestic Franchise | 2 | 3 | - | 5 | |||||||
| February 1, 2015 | 92 | 18 | 1 | 111 | |||||||
Wholesale Distribution
Sales to wholesale customers accounted for 48.6% of fiscal 2015 revenues in the Company Stores segment. Of the 111 stores operated by the Company as of February 1, 2015, 40 serve the wholesale distribution channel, including eight commissaries. We sell our traditional yeast-raised and cake doughnuts in a variety of packages, generally containing from six to 15 doughnuts. In addition, we offer in the wholesale distribution channel a number of doughnuts and complementary products that we do not offer in our shops, including honeybuns, mini-crullers, fruit pies, Danishes and a variety of snack doughnuts. These products typically have longer shelf lives than our traditional doughnuts and are packaged in snack bags or as individually wrapped snacks. Packaged products generally are marketed from Krispy Kreme branded displays. In addition to packaged products, we sell individual loose doughnuts through our in-store bakery (“ISB”) program, using branded self-service display cases that also contain branded packaging for loose doughnut sales. The Company intends to introduce additional new products to expand the breadth of product offerings to consumers who purchase Krispy Kreme products from grocers, mass merchants and convenience stores.
The wholesale distribution channel is composed of two principal customer groups: grocers/mass merchants and convenience stores. Substantially all sales to grocers and mass merchants consist of packaged products, while a significant majority of sales to convenience stores consists of loose doughnuts sold through the ISB program.
We deliver doughnuts to wholesale customers using a fleet of delivery trucks operated by a commissioned employee sales force. We deliver products to packaged doughnut customers three or more times per week, generally on either a Monday/Wednesday/Friday or Tuesday/Thursday/Saturday schedule. ISB customers generally are serviced daily, six times per week. In addition to delivering product, our salespeople are responsible for merchandising our products in the displays and picking up unsold products for return to the Company shop. Our principal products are yeast-raised doughnuts having a short shelf-life, which results in unsold product costs in the wholesale distribution channel, most of which are absorbed by the Company.
In recent years, the Company has reemphasized marketing of new and existing longer shelf-life products, including products made by third parties, and has developed order management systems to more closely match display quantities and assortments with consumer demand and reduce the amount of unsold product. The goals of these efforts are to increase the average weekly sales derived from each wholesale distribution point and minimize spoilage. Whenever possible, the Company seeks to eliminate relatively lower sales volume distribution points and consolidate routes in order to reduce delivery costs and increase the average revenue per distribution point and the average revenue per mile driven.
Shop Operations
General store operations. We outline standard specifications and designs for each Krispy Kreme shop format and require compliance with our standards regarding the operation of each store, including, but not limited to, varieties of products, product specifications, sales channels, packaging, sanitation and cleaning, signage, furniture and fixtures, image and use of logos and trademarks, training, marketing and advertising.
Our shops generally operate seven days a week, excluding some major holidays.
14
Quality standards and customer service. We encourage our team members to be courteous, helpful, knowledgeable and attentive. We emphasize the importance of performance by linking a portion of both a Company shop manager’s and assistant manager’s incentive compensation to profitability and customer service. We also encourage high levels of customer service and the maintenance of our quality standards by frequently monitoring our stores through a variety of methods, including periodic quality audits, regular mystery shop visits and a toll-free consumer telephone number. In addition, our customer experience department handles customer comments and conducts routine satisfaction surveys of our on-premises customers.
Management and staffing. Our Vice President of Company Stores Operations focuses on operations at retail-only shops and on both the doughnut production and QSR elements of our stores that serve both on-premises and wholesale customers. This Vice President is supported by two regional directors, as well as market managers in each geographic region to whom shop general managers report. Our Wholesale Operations team is responsible for wholesale distribution at all retail locations that also serve wholesale customers, and for operation of our eight commissaries. The Wholesale Operations management structure consists principally of a vice president of commissary operations who supervises the operations of our commissaries through managers at these locations, and a sales organization led by a vice president and consisting of national and regional wholesale sales managers who deal with larger customers and in-store sales personnel responsible for managing sales and deliveries to individual customer locations. Store Operations and Wholesale Operations closely coordinate their activities because a substantial portion of wholesale production takes place in shops which also have significant retail and fundraising distribution. We communicate frequently with all store managers and wholesale sales managers and their staffs using shop audits, weekly communications by telephone or e-mail and both scheduled and surprise shop visits.
We offer a comprehensive manager training program covering the critical skills required to operate a Krispy Kreme store and a training program for all positions in the shop. The manager training program includes classroom instruction, computer-based training modules and in-shop training.
Our staffing varies depending on a store’s size, volume of business and number of sales channels. Stores, depending on the sales channels they serve, have employees handling on-premises sales, processing, production, bookkeeping, sanitation and delivery. Hourly employees, along with route sales personnel, are trained by local store management through hands-on experience and training manuals.
Shop Acquisitions and Refranchisings
During the past three fiscal years, we have acquired franchisee shops in Alabama, Georgia and Illinois. We expect to consider additional franchise acquisitions from time to time when a potential acquisition involves territory that is a good geographic fit with our existing shops operations or acquisition of the shops otherwise satisfies important strategic goals.
In February 2013, the Company refranchised three locations in Kansas and Missouri. In July 2013, the Company refranchised its three stores in Dallas, Texas and entered into a development agreement with the new franchisee for 15 additional stores in the Dallas market. In September 2014, the Company refranchised a shop in Rockville, Maryland and entered into a development agreement with the new franchisee for 20 additional stores in southern Maryland, northern Virginia and the District of Columbia.
We currently operate Company stores in 19 states and the District of Columbia. Over time, we may consider refranchising other stores, most likely shops in markets outside our traditional base in the southeastern United States.
Domestic Franchise Business Segment
The Domestic Franchise segment consists of the Company’s domestic store franchise operations. This segment derives revenue principally from initial development and franchise fees related to new stores and from royalties on sales by franchise stores. Domestic Franchise direct operating expenses include costs incurred to recruit new domestic franchisees, to assist with domestic store openings, to assist in the development of domestic marketing and promotional programs, and to monitor and aid in the performance of domestic franchise stores, as well as direct general and administrative expenses and certain allocated corporate costs.
The store formats used by domestic franchisees are very similar to those used by the Company. All domestic franchisees sell products to on-premises customers, and some also sell products to wholesale accounts. Sales to wholesale customers generally constitute a smaller percentage of a domestic franchisee’s total sales than do the Company’s sales to wholesale customers. The Company’s relatively higher percentage of wholesale sales reflects, among other things, the fact that the Company’s KK Supply Chain segment earns a profit on sales of doughnut mixes, other ingredients and supplies that are used by the Company Stores segment to produce products for wholesale customers, which gives the Company a cost advantage not enjoyed by franchisees in serving this relatively lower profit margin distribution channel. Sales to wholesale customers comprised approximately 20% of domestic franchisees’ total sales in fiscal 2015.
15
Domestic franchise stores include stores that we historically have referred to as associate stores and area developer stores, as well as franchisee stores that have opened since the beginning of calendar 2008. The rights of our franchisees to build new stores and to use the Krispy Kreme trademarks and related marks vary by franchisee type and are discussed below.
| ● |
Associates. Associate franchisees are located principally in the Southeast, and their stores have attributes that are similar to Company stores located in the Southeast. Associates typically have many years of experience operating Krispy Kreme stores and selling Krispy Kreme branded products in both the retail and wholesale distribution channels in defined territories. This group of franchisees generally concentrates on growing sales within the current base of stores rather than developing new stores. Under their associate license agreements, associates generally have the exclusive right to open new stores in their geographic territories, but they are not obligated to develop additional stores. We cannot grant new franchises within an associate’s territory during the term of the license agreement. Further, we generally cannot sell within an associate’s territory any Krispy Kreme branded products, without the associate franchisee’s permission because we have granted those exclusive rights to the franchisee for the term of the license agreement. All of the Company’s associate franchisees have consented to the sale of Krispy Kreme branded coffee beverages by third party licensees within their territories. Associates generally pay royalties of 3.0% of on-premises sales and 1.0% of all other sales. Some associates also contribute 1.0% of all sales to the Company-administered public relations and advertising fund, which we refer to as the Brand Fund and to an Advertising Fund being introduced in fiscal 2016 with a contribution rate of 0.50% of sales. Our associate license agreements generally permit the franchisee to open Krispy Kreme shops within their geographic territories without the payment of any development fee or initial franchise fee. Of the approximately $337 million of sales by domestic franchisees in fiscal 2015, approximately $85 million, or 25%, was made by franchisees subject to the foregoing royalty structure. The aggregate royalty revenue recognized by the Company on such sales was approximately $1.9 million. Most of the associates
had license agreements that were scheduled to expire between 2018 and
2023. During fiscal 2015, the Company negotiated replacement agreements
with almost all of the associates, putting them on modern franchise
agreements substantially similar to those with recent franchisees (see
“Recent Franchisees,” below). Franchisees representing over 85% of the
aggregate $85 million of sales reported in fiscal 2015 by franchisees
subject to the associate franchisee royalty structure are now under the
new agreements. The principal features of these agreements include
retention of the franchisees’ existing royalty rates through the scheduled
expiration of the original agreements, an approximately 15-year franchise
term, and the Company regaining all of the intellectual property rights to
the Krispy Kreme brand except, of course, as they relate to the
on-premises sale of doughnuts from Krispy Kreme shops. Further, these
agreements provide that, beginning in 2018, the Company has the right,
exercisable on 24-months’ notice, to distribute Krispy Kreme products to
wholesale customers in the former associate territories. Importantly, the
replacement agreements return to the Company certain territory held by
certain of the associates with respect to which the franchisees had no
development obligations. The Company plans to develop the newly available
territory with new and existing franchisees, and possibly with Company
shops. |
| ● |
Area Developers. In the mid-1990s, we franchised territories in the United States, usually defined by metropolitan statistical areas, pursuant to area development agreements. These development agreements established the number of stores to be developed in an area, and the related franchise agreements governed the operation of each store. Most of these area development agreements have expired, been terminated or renewed with territorial and store-count (build out) modifications. We have entered into new franchise agreements with the area developers as described below under “Recent Franchisees.” These new agreements generally are smaller in geographic scope than in the 1990s area developer agreements. Under their franchise agreements, area developers generally have the exclusive right to sell Krispy Kreme branded products within a one-mile radius of their stores and in wholesale accounts that they have serviced in the last 12 months. The franchise agreements for area developers have a 15-year term that may be renewed by the Company. These franchise agreements generally provide for royalties of 4.5% of both on-premises and wholesale sales, and contributions to the Brand Fund of 1.0% of sales. In addition, many of the franchise agreements require franchisees to contribute to an Advertising Fund the Company is implementing in fiscal 2016, with contribution rate of 0.50% of sales. In recent years, the Company elected to reduce the royalty rate on wholesale sales; the Company currently charges area developers a royalty rate of 1.5% on wholesale sales. Of the approximately $337 million of sales by domestic franchisees in fiscal 2015, approximately $252 million, or 75%, was made by franchisees subject to the area developer royalty structure. The aggregate royalty revenue recognized by the Company on such sales was approximately $9.9 million. Recent domestic development agreements generally provide for the payment of one-time initial development and franchise fees ranging from $25,000 to $50,000 per store. As of February 1, 2015, we had an equity interest in two of the domestic area developers. See Note 7 to the consolidated financial statements appearing elsewhere herein for additional information on our franchisee investments. We do not currently expect to own equity interests in any future franchisees. |
16
| ● |
Recent Franchisees. Since fiscal 2009, the Company has signed several new franchise agreements. All of these new franchise agreements are of the kind described under “Area Developers,” above. These agreements included renewal agreements resulting from contract expirations, agreements for new stores with existing franchisees and agreements with new franchisees who acquired existing Krispy Kreme franchise and Company shops. In addition, several agreements arose from the conveyance of Company markets to franchisees. Some of the recent franchisees have signed development agreements, which require the franchisee to build a specified number of stores in an exclusive geography within a specified time period, usually five years or less. The franchise agreements with this group of franchisees have a 15-year term, are renewable provided the franchisee meets specified criteria, and generally do not contemplate engaging in wholesale distribution. Additionally, these franchise agreements generally allow the Company to sell Krispy Kreme branded products in close geographic proximity to the franchisees’ stores. These franchise agreements and development agreements are used for all new franchisees and, in general, for the renewal of older franchise agreements and associate license agreements. We are charging recent franchisees the same royalty and Brand Fund rates as those charged to area developer franchisees. |
As of February 1, 2015, the Company’s approximately 40 domestic franchisees operated a total of 167 stores. Approximately 80% of these franchisees operate five or fewer shops, approximately 10% operate between six and ten shops, and approximately 10% operate more than ten shops.
17
The types and locations of domestic franchise stores as of February 1, 2015 are summarized in the following table.
| Number of Domestic Franchise Stores | ||||||||
| Factory | ||||||||
| State | Stores | Hot Shops | Fresh Shops | Total | ||||
| Alabama | 4 | - | - | 4 | ||||
| Arizona | 2 | 5 | - | 7 | ||||
| Arkansas | 3 | - | - | 3 | ||||
| California | 15 | 11 | 2 | 28 | ||||
| Colorado | 2 | - | - | 2 | ||||
| Connecticut | 1 | - | 3 | 4 | ||||
| Delaware | 1 | - | - | 1 | ||||
| Florida | 12 | 8 | 1 | 21 | ||||
| Georgia | 5 | 3 | - | 8 | ||||
| Hawaii | 1 | - | - | 1 | ||||
| Idaho | 1 | - | - | 1 | ||||
| Illinois | 2 | - | - | 2 | ||||
| Iowa | 1 | - | 1 | 2 | ||||
| Kansas | 1 | - | - | 1 | ||||
| Louisiana | 2 | - | - | 2 | ||||
| Maryland | 1 | - | - | 1 | ||||
| Mississippi | 3 | 1 | - | 4 | ||||
| Missouri | 4 | 1 | - | 5 | ||||
| Nebraska | 1 | - | 1 | 2 | ||||
| Nevada | 3 | - | 2 | 5 | ||||
| New Jersey | - | 1 | - | 1 | ||||
| New Mexico | 1 | 1 | 1 | 3 | ||||
| North Carolina | 8 | 1 | - | 9 | ||||
| Oklahoma | 2 | - | - | 2 | ||||
| Oregon | 2 | - | - | 2 | ||||
| Pennsylvania | 4 | 3 | 1 | 8 | ||||
| South Carolina | 7 | 2 | - | 9 | ||||
| Tennessee | 1 | - | - | 1 | ||||
| Texas | 17 | 2 | - | 19 | ||||
| Utah | 2 | - | - | 2 | ||||
| Washington | 6 | - | - | 6 | ||||
| Wisconsin | 1 | - | - | 1 | ||||
| 116 | 39 | 12 | 167 | |||||
The Company has equity interests in two domestic franchisees operating stores in Washington, Oregon, Hawaii and South Florida, as more fully described in Note 7 to the consolidated financial statements appearing elsewhere herein. The Company currently does not expect to own equity interests in franchisees in the future.
18
The Company has development agreements with certain of its domestic franchisees pursuant to which the franchisees are contractually obligated to open additional Krispy Kreme stores. The following table sets forth those commitments, by state, as of February 1, 2015:
| Development | ||||
| Future | Agreement | |||
| Store | Expiration | |||
| State | Commitments | (Fiscal Year) | ||
| Alaska | 4 | 2017 | ||
| Arizona | 2 | 2017 | ||
| Arkansas | 4 | 2018 | ||
| California | 28 | 2021 | ||
| Colorado | 13 | 2018 | ||
| Florida | 7 | 2020 | ||
| Maryland | 20 | 2022 | ||
| Metro Philadelphia | 10 | 2020 | ||
| Missouri | 1 | 2016 | ||
| Texas | 37 | 2022 | ||
| Washington | 3 | 2017 | ||
| 129 |
Changes in the number of domestic franchise stores during the past three fiscal years are summarized in the following table.
| Number of Domestic Franchise Stores | |||||||||||
| Factory | |||||||||||
| Stores | Hot Shops | Fresh Shops | Total | ||||||||
| January 29, 2012 | 102 | 25 | 15 | 142 | |||||||
| Opened | 3 | 6 | - | 9 | |||||||
| Closed | (5 | ) | (1 | ) | (1 | ) | (7 | ) | |||
| Transferred to Company Stores | (1 | ) | (1 | ) | - | (2 | ) | ||||
| February 3, 2013 | 99 | 29 | 14 | 142 | |||||||
| Opened | 2 | 8 | 1 | 11 | |||||||
| Closed | - | - | - | - | |||||||
| Transferred from Company Stores | 6 | - | - | 6 | |||||||
| February 2, 2014 | 107 | 37 | 15 | 159 | |||||||
| Opened | 10 | 5 | - | 15 | |||||||
| Closed | - | - | (3 | ) | (3 | ) | |||||
| Transferred from Company Stores | 1 | - | - | 1 | |||||||
| Transferred to Company Stores | (2 | ) | (3 | ) | - | (5 | ) | ||||
| February 1, 2015 | 116 | 39 | 12 | 167 | |||||||
We generally assist our franchisees with issues such as operating procedures, advertising and marketing programs, public relations, store design, training and technical matters. We also provide an opening team to provide on-site training and assistance both for the week prior to and during the first week of operation for each initial store opened by a new franchisee. The number of opening team members providing this assistance is reduced with each subsequent store opening for an existing franchisee.
International Franchise Business Segment
The International Franchise segment consists of the Company’s international store franchise operations. The franchise agreements with international area developers typically provide for the payment of royalties of 6.0% of all sales, contributions to the Brand Fund of 0.25% of sales and one-time development and franchise fees generally ranging from $20,000 to $50,000 per store. Direct operating expenses for this business segment include costs incurred to recruit new international franchisees, to assist with international store openings, to assist in the development of marketing and promotional programs, to assist in the development of operational tools and store designs, and to monitor and aid in the performance of international franchise stores, as well as direct general and administrative expenses and allocated corporate costs.
The operations of international franchise stores are similar to those of domestic stores, except that substantially all of the sales of international franchise stores are made to on-premises customers. International franchisees pioneered the hub and spoke business model, in which centralized factory stores or commissaries provide fresh doughnuts to satellite locations. Internationally, the fresh shop satellite format predominates, and shops typically are located in pedestrian-rich environments, including transportation hubs and shopping malls. Some of our international franchisees have developed small kiosk formats, which also are typically located in transportation hubs and shopping malls. The satellite shops operated by international franchisees tend to be smaller than domestic satellite shops, and the international satellite shops have lower average unit volumes than do domestic satellite shops.
19
Our International Franchisees have renewable development agreements regarding the build-out of Krispy Kreme stores in their territories. Territories are typically country or region-wide, but for large countries, the development territory may encompass only a portion of a country. The international franchise agreements have a renewable 10 to 15-year term. These agreements generally do not contemplate distribution through wholesale channels, although our franchisees in Canada, Australia and the United Kingdom make such sales.
Product offerings at shops outside the United States include our signature Original Glazed doughnut, a core set of doughnut varieties offered in our domestic shops and a complementary set of localized doughnut varieties tailored to meet the unique taste preferences and dietary norms in the market. Often, our glazes, icings and filling flavors are tailored to meet local taste preferences. We work closely with our franchisees outside the United States to conduct marketing research to understand local tastes and usage occasions, which drives development of new products and marketing approaches.
Internationally, we believe that complementary products such as baked goods and other treat products could play an increasingly important role for our franchisees as they penetrate their markets and further establish the Krispy Kreme brand. These items offer franchisees the opportunity to fill and/or strengthen day part offerings to meet a broader set of customer needs. Krispy Kreme Baked Creations®, a baked platform for international markets designed to meet needs across a broad set of markets, was launched in fiscal 2010 in the Philippines. Today, our Krispy Kreme Baked Creations products are available in the Philippines, Korea, Indonesia, Saudi Arabia and Turkey.
Beverage offerings at shops outside the United States include a complete program consisting of hot and iced espresso based beverages, frozen drinks, teas, juices, sodas, water and bottled or canned beverages. Drip coffee is also offered in many international markets, but represents a much smaller component of the beverage program relative to the United States due to international consumer preferences. In-store consumption occasions often play a key role in total beverage consumption internationally due to store locations and consumer habits, and we work closely with international franchisees to adapt the store environment and product offerings to take advantage of this dynamic. We continue to look for ways to improve our beverage program and bring cross-market efficiencies to international franchisees.
Markets outside the United States have been a significant source of growth, and we plan to continue that growth exclusively by franchising. In the past three years, we have focused our international development efforts primarily on opportunities in markets in Asia, the Middle East and Central and South America. In fiscal 2013, we signed new international franchise agreements with franchisees in Moscow, India and Singapore, in fiscal 2014, we signed a new development agreement for shops in Colombia and Taiwan and in fiscal 2015, we signed a new development agreement for shops in Bangladesh and St. Petersburg.
With the exception of India and Australia, there is a single franchisee in each of the countries outside the United States where Krispy Kreme is represented. All of the Krispy Kreme shops in the Middle East are operated by a single franchisee.
20
The types and locations of international franchise stores as of February 1, 2015 are summarized in the following table.
| Number of International Franchise Stores | ||||||||||||
| Fiscal | ||||||||||||
| Year First | Factory | |||||||||||
| Country | Store Opened | Stores | Hot Shops | Fresh Shops | Kiosks | Total | ||||||
| Australia | 2004 | 8 | 1 | 7 | 6 | 22 | ||||||
| Bahrain | 2009 | 1 | - | 1 | - | 2 | ||||||
| Canada | 2002 | 4 | - | 2 | - | 6 | ||||||
| Colombia | 2015 | 2 | - | - | - | 2 | ||||||
| Dominican Republic | 2011 | 1 | - | 3 | - | 4 | ||||||
| India | 2013 | 5 | - | 12 | 6 | 23 | ||||||
| Indonesia | 2007 | 1 | - | 7 | 7 | 15 | ||||||
| Japan | 2007 | 16 | - | 41 | 7 | 64 | ||||||
| Kuwait | 2007 | 1 | - | 7 | 6 | 14 | ||||||
| Malaysia | 2010 | 2 | - | 2 | 6 | 10 | ||||||
| Mexico | 2004 | 9 | 1 | 44 | 82 | 136 | ||||||
| Philippines | 2007 | 8 | 3 | 40 | 11 | 62 | ||||||
| Puerto Rico | 2009 | 7 | - | - | - | 7 | ||||||
| Qatar | 2008 | 1 | - | - | - | 1 | ||||||
| Russia | 2014 | 2 | - | 6 | 4 | 12 | ||||||
| Saudi Arabia | 2008 | 10 | - | 73 | 22 | 105 | ||||||
| Singapore | 2014 | 2 | - | 3 | - | 5 | ||||||
| South Korea | 2005 | 32 | - | 71 | - | 103 | ||||||
| Taiwan | 2014 | 2 | - | 1 | 1 | 4 | ||||||
| Thailand | 2011 | 3 | 2 | 10 | 4 | 19 | ||||||
| Turkey | 2010 | 1 | - | 11 | 9 | 21 | ||||||
| United Arab Emirates | 2008 | 2 | - | 10 | 7 | 19 | ||||||
| United Kingdom | 2004 | 13 | 2 | 30 | 8 | 53 | ||||||
| 133 | 9 | 381 | 186 | 709 | ||||||||
The Company has an equity interest in the franchisee operating a store in Western Canada. The Company currently does not expect to own equity interests in franchisees in the future.
The Company has development agreements with certain of its international franchisees pursuant to which the franchisees are contractually obligated to open additional Krispy Kreme stores. The following table sets forth those commitments as of February 1, 2015:
| Development | ||||
| Future | Agreement | |||
| Store | Expiration | |||
| Country | Commitments | (Fiscal Year) | ||
| Australia | 11 | 2019 | ||
| Bangladesh | 20 | 2021 | ||
| Colombia | 23 | 2019 | ||
| India | 93 | 2018 | ||
| Japan | 46 | 2017 | ||
| Russia | 39 | 2019 | ||
| Singapore | 11 | 2018 | ||
| South Korea | 27 | 2018 | ||
| Taiwan | 6 | 2019 | ||
| Thailand | 3 | 2016 | ||
| Turkey | 12 | 2017 | ||
| United Kingdom | 13 | 2018 | ||
| 304 |
21
Changes in the number of international franchise stores during the past three fiscal years are summarized in the following table.
| Number of International Franchise Stores | |||||||||||||||
| Factory | |||||||||||||||
| Stores | Hot Shops | Fresh Shops | Kiosks | Total | |||||||||||
| January 29, 2012 | 118 | 11 | 226 | 105 | 460 | ||||||||||
| Opened | 10 | - | 63 | 25 | 98 | ||||||||||
| Closed | (7 | ) | (1 | ) | (26 | ) | (15 | ) | (49 | ) | |||||
| Change in store type | (1 | ) | (1 | ) | (6 | ) | 8 | - | |||||||
| February 3, 2013 | 120 | 9 | 257 | 123 | 509 | ||||||||||
| Opened | 15 | - | 53 | 28 | 96 | ||||||||||
| Closed | (8 | ) | - | (17 | ) | (6 | ) | (31 | ) | ||||||
| Change in store type | (2 | ) | - | 3 | (1 | ) | - | ||||||||
| February 2, 2014 | 125 | 9 | 296 | 144 | 574 | ||||||||||
| Opened | 15 | 1 | 89 | 46 | 151 | ||||||||||
| Closed | (4 | ) | - | (7 | ) | (5 | ) | (16 | ) | ||||||
| Change in store type | (3 | ) | (1 | ) | 3 | 1 | - | ||||||||
| February 1, 2015 | 133 | 9 | 381 | 186 | 709 | ||||||||||
KK Supply Chain Business Segment
The Company operates an integrated supply chain to help maintain the consistency and quality of products throughout the Krispy Kreme system. The KK Supply Chain segment buys and processes ingredients it uses to produce doughnut mixes and manufactures doughnut-making equipment that all factory stores are required to purchase.
The Company manufactures doughnut mixes at its facility in Winston-Salem, North Carolina. The Company also manufactures doughnut mix concentrates, which are blended with flour and other ingredients by contract mix manufacturers to produce finished doughnut mix. The Company has an agreement with an independent food company to manufacture certain doughnut mixes using concentrate for domestic regions outside the southeastern United States and to provide backup production capability in the event of a business disruption at the Winston-Salem facility. The Company is working to secure additional backup production facilities.
The Company utilizes contract mix manufacturers in multiple countries to produce doughnut mixes from one or more concentrate varieties manufactured by the Company, but sourcing other mix ingredients locally. The concentrate production models are used to reduce the substantial international transportation costs associated with shipping finished mixes, to minimize foreign import taxes, and to help protect the Company’s intellectual property.
The KK Supply Chain segment also purchases and sells key supplies, including icings and fillings, other food ingredients, juices, signage, display cases, uniforms and other items to both Company and franchisee-owned stores. In addition, through KK Supply Chain, the Company utilizes volume-buying power, which the Company believes helps lower the cost of supplies to stores and enhances profitability. In fiscal 2012, the Company entered into an agreement with an independent distributor to distribute products to Company and franchise stores in the eastern portion of the United States, as well as to handle the export of products to the 23 foreign countries in which the Company’s international franchisees operate. The Company has subcontracted with another independent distributor since 2008 to distribute products to domestic stores in the western portion of the United States. Implementation of the eastern U.S. outsourcing resulted in all of KK Supply Chain’s distribution operations being handled by contract distributors. The Company believes that moving to a substantially outsourced model has enabled the Company and its franchisees to benefit from the operating scale of the independent distributors and, in the case of outsourcing of all export functions, to minimize the compliance and other risks associated with exporting to a large number of countries with diverse import regulations and procedures.
Substantially all domestic stores purchase all of their ingredients and supplies from KK Supply Chain, while KK Supply Chain sales to international franchise stores are comprised principally of sales of doughnut mix. The Company is continuously studying its distribution system to reduce the delivered cost of products to both Company and franchise stores. The Company expects to employ increased regional and local sourcing for international franchisees in order to reduce costs, while maintaining control of the doughnut mix manufacturing process.
Flour, shortening, sugar and packaging represent the four most significant cost components of products sold by KK Supply Chain. While the flours used in the production of doughnut mixes are generic, the food properties of flour are different by type of flour and change from crop year to crop year. Accordingly, the Company periodically must reformulate its doughnut mixes to account for changes in the characteristics of the flour used in their production in order to maintain uniform, high quality doughnut products. Similarly, while the shortening in which the Company’s doughnuts are fried is made from generic food oils, the Company’s shortenings are manufactured by third-party food companies to the Company’s specifications. Such specifications are subject to change from time to time. For example, changes in the formulation of the Company’s shortening were necessary to enable the Company to begin offering zero grams trans fats per serving of its doughnuts in fiscal 2008.
22
The Supply Chain business unit is volume-driven, and its economics are enhanced by the opening of new stores and the growth of sales by existing stores.
Revenues by Geographic Region
Set forth below is a table presenting our revenues by geographic region for fiscal 2015, 2014 and 2013. Revenues by geographic region are presented by attributing revenues from customers on the basis of the location to which the Company’s products are delivered or, in the case of franchise segment revenues, the location of the franchise store from which the franchise revenue is derived. Please note that fiscal 2013 contained 53 weeks.
| Year Ended | |||||||||
| February 1, | February 2, | February 3, | |||||||
| 2015 | 2014 | 2013 | |||||||
| (In thousands) | |||||||||
| Revenues by geographic region: | |||||||||
| United States | $ | 438,801 | $ | 412,743 | $ | 391,835 | |||
| Other North America | 9,204 | 10,000 | 9,184 | ||||||
| Asia/Pacific | 28,575 | 25,460 | 22,384 | ||||||
| Middle East | 6,372 | 5,257 | 6,687 | ||||||
| Europe | 6,613 | 6,871 | 5,753 | ||||||
| South America | 769 | - | - | ||||||
| Total revenues | $ | 490,334 | $ | 460,331 | $ | 435,843 | |||
Marketing
Krispy Kreme’s approach to marketing is a natural extension of our brand equity, brand attributes, relationship with our customers and our values. Our marketing team has extensive food and beverage experience, and we manage our marketing efforts on a global basis.
Domestic
To build our brand and drive our sales in a manner aligned with our brand values, we will focus our domestic marketing activities in the following areas:
Shop Experience. Our factory stores are where most guests first experience a hot Original Glazed doughnut. Customers know that when our Hot Krispy Kreme Original Glazed Now sign in the shop window is illuminated, they can enjoy a hot Original Glazed doughnut. We believe this experience begins our relationship with our guests and forms the foundation of the Krispy Kreme experience.
Relationship Marketing. The foundation of our marketing efforts starts with building a “relationship” between our brand and our team members, guests, consumers and their communities. Toward that end, many of our brand-building activities are grassroots-based and focused on building relevancy with these groups. These activities include:
| ● | Good neighbor product deliveries to create trial uses; |
| ● | Sponsorship of local events and nonprofit organizations; |
| ● | Friends of Krispy Kreme eMessages sent to guests registered to receive monthly updates about new products, promotions and shop openings; |
| ● | Fundraising programs designed to assist local charitable organizations in raising money for their non-profit causes, which the Company estimates helped organizations raise over $35 million during fiscal 2015; and |
| ● | Digital, social, viral and interactive efforts including the use of social media such as Facebook and Twitter to communicate product and promotional activity, new shop openings and local relationship marketing programs. We currently have over 4.7 million fans on Facebook. |
23
Public Relations. We utilize public relations and media relations, product placement, event marketing and community involvement as vehicles to generate brand awareness, brand relevancy and trial usage for our products. Our public relations activities create opportunities for media and consumers to interact with the Krispy Kreme brand. Our key messages are as follows:
| ● | Krispy Kreme doughnuts are the preferred doughnut of choice for guests nationwide; |
| ● | Krispy Kreme is a trusted food retailer with a long history of providing superior, innovative products and delivering quality customer service; and |
| ● | Krispy Kreme cares about our brand, our team members, our guests, our consumers and the communities we serve. |
Marketing, Advertising and Sales Promotion. Local relationship marketing has been central to building our brand, awareness and relevancy. In addition to these grassroots efforts, we will use other media as appropriate to communicate the brand, promotions and other promotional activities. These media may include traditional tactics (e.g., free-standing newspaper inserts, direct mail, shared mail, radio, television, out-of-home and other communications vehicles) and alternative media such as social, viral, and digital (e.g., Facebook, Twitter, blogs, krispykreme.com, Friends of Krispy Kreme email club, etc.).
These activities may include limited time offerings and shaped doughnut varieties, such as Valentine’s Day hearts, footballs, Halloween pumpkins and holiday snowmen. We also engage in activities and call attention to and leverage the Krispy Kreme experience and engage the public in non-traditional ways.
International
Krispy Kreme's approach to international marketing utilizes many of the same elements as the domestic marketing approach to build integrated marketing initiatives through store experience, relationship marketing, public relations and marketing/advertising/sales promotion. One of the key foundations to developing integrated marketing programs that leverage each of these marketing elements is our efforts and focus on driving category-leading new product innovation. New product innovation is a critical focus internationally as it allows us to engage consumers more often through our marketing efforts and, at the same time, evolve our product range to more effectively meet local taste demands. This focus on new product innovation has resulted in innovations such as our Krispy Kreme Baked Creations line of baked goods and innovation within our core doughnut range. Those core product range innovations include chocolate glaze and chocolate dough, whole wheat dough, minis, doughnut holes, doughnut pops and new doughnut varieties leveraging co-promotional relationships with international chocolate brands, movies and branded toys.
Our international marketing team works closely with the domestic marketing team to develop global programs that leverage key global occasions and celebrations, including programs for Valentine’s Day, Halloween and the holiday season. In addition, we develop international specific programs that address the broad needs of our international markets, regional programs that address trends and occasions unique to Asia/Pacific, Latin America and the Middle East/Europe, and assist in the development of local country programs that leverage unique aspects of our broad set of markets.
To build our brand and drive sales across our international markets, our international team provides strategic leadership, marketing expertise and consulting on local market issues through dedicated regional resources. In partnership with our franchisees, we assist in local marketing planning, product offering innovation, promotional and store activation, and consumer messaging. In addition, we develop global and regional product, promotional and store event programs to supplement and enhance local country marketing initiatives, bring marketing efficiencies to international franchisees, and build local marketing capabilities.
Brand Fund
We administer domestic and international public relations and advertising funds, which we refer to as the Brand Funds. Franchise agreements with domestic area developers and international area developers require these franchisees to contribute 1.0% and 0.25% of their sales, respectively, to the Brand Funds. The brand fund contribution for international franchisees will increase to 0.50% in fiscal 2016. Company stores contribute to the Brand Fund on the same basis as domestic area developers, as do some associate franchisees. Proceeds from the Brand Funds are utilized to develop programs to increase sales and brand awareness and build brand affinity. Brand Fund proceeds are also utilized to measure consumer feedback and the performance of our products and stores.
In fiscal 2016, the Company is instituting a domestic Advertising Fund to which many domestic franchisees, and all Company shops, are expected to contributed at a rate of 0.50% of sales.
In fiscal 2015, we and our domestic and international franchisees contributed approximately $7.3 million to the Brand Funds.
Competition
Our domestic and international competitors include a wide range of retailers of doughnuts and other treats, coffee shops, other café and bakery concepts. We also compete with snacks sold through convenience stores, supermarkets, restaurants and retail stores domestically, but to a much lesser extent internationally. Some of our competitors have substantially greater financial resources than we do and are expanding to other geographic regions, including areas where we have a significant store presence. We also compete against other retailers who sell sweet treats such as cookie, cupcake and ice cream shops. We compete on elements such as food quality, convenience, location, customer service and value. Customer service, including frequency of deliveries and maintenance of fully stocked shelves, is an important factor in successfully competing for convenience store and grocery/mass merchant business. There is an industry trend moving towards expanded fresh product offerings at convenience stores during morning and evening drive times, and products are either sourced from a central commissary or brought in by local bakeries.
24
In the packaged doughnut market, an array of doughnuts is typically merchandised on a free-standing branded display. We compete for sales with many sweet treats, including those made by well-known producers, such as Dolly Madison, Entenmann’s, Little Debbie, Sara Lee, Hostess, and regional brands.
We view the uniqueness of our Original Glazed doughnut as an important factor that distinguishes our brand from competitors, both in the doughnut category and in sweet goods generally.
Trademarks and Trade Names
Our doughnut shops are operated under the Krispy Kreme® trademark, and we use many federally and internationally registered trademarks and service marks, including Original Glazed® and Hot Krispy Kreme Original Glazed Now® and the logos associated with these marks. We have also registered some of our trademarks in approximately 60 other countries. We generally license the use of these trademarks to our franchisees for the operation of their doughnut shops.
Although we are not aware of anyone else using “Krispy Kreme” or “Hot Krispy Kreme Original Glazed Now” as a trademark or service mark in the United States, we are aware that some businesses are using “Krispy” or a phonetic equivalent, such as “Crispie Creme,” as part of a trademark or service mark associated with retail doughnut shops. There may be similar uses of which we are unaware that could arise from prior users. When necessary, we aggressively pursue persons who use our trademarks without our consent.
Government Regulation
Environmental regulation. The Company is subject to a variety of federal, state and local environmental laws and regulations. Except for the legal and settlement costs totaling approximately $2.5 million in fiscal 2010 associated with the settlement of litigation relating to alleged damage to a sewer system in Fairfax County, Virginia, such laws and regulations have not had a significant impact on the Company’s capital expenditures, earnings or competitive position.
Local regulation. Our shops, both those in the United States and those in international markets, are subject to licensing and regulation by a number of government authorities, which may include health, sanitation, safety, fire, building and other agencies in the countries, states or municipalities in which the shops are located. Developing new doughnut shops in particular areas could be delayed by problems in obtaining the required licenses and approvals or by more stringent requirements of local government bodies with respect to zoning, land use and environmental factors. Our agreements with our franchisees require them to comply with all applicable federal, state and local laws and regulations, and indemnify us for costs we may incur attributable to their failure to comply.
Food product regulation. Our doughnut mixes are primarily produced at our manufacturing facility in Winston-Salem, North Carolina. Production at and shipments from our Winston-Salem facility are subject to the applicable federal and state governmental rules and regulations. Similar state regulations may apply to products shipped from our doughnut shops to convenience stores or grocers/mass merchants.
As is the case for other food producers, numerous other government regulations apply to our products. For example, the ingredient list, product weight and other aspects of our product labels are subject to state, federal and international regulation for accuracy and content. Most states periodically check products for compliance. The use of various product ingredients and packaging materials is regulated by the United States Department of Agriculture and the Federal Food and Drug Administration. Conceivably, one or more ingredients in our products could be banned, and substitute ingredients would then need to be identified.
International trade. The Company conducts business outside the United States in compliance with all foreign and domestic laws and regulations governing international business and trade. In connection with our international operations, we typically export our products, principally our doughnut mixes (or products which are combined with other ingredients sourced locally to manufacture mixes) to our franchisees in markets outside the United States. Numerous government regulations apply to both the export of food products from the United States as well as the import of food products into other countries. If one or more of the ingredients in our products are banned, alternative ingredients would need to be identified. Although we intend to be proactive in addressing any product ingredient issues, such requirements may delay our ability to open shops in other countries in accordance with our desired schedule.
25
Franchise regulation. We must comply with regulations adopted by the Federal Trade Commission (the “FTC”) and with several state and foreign laws that regulate the offer and sale of franchises. The FTC’s Trade Regulation Rule on Franchising (“FTC Rule”) and certain state and foreign laws require that we furnish prospective franchisees with a franchise disclosure document containing information prescribed by the FTC Rule and applicable state and foreign laws and regulations. We register in domestic and foreign jurisdictions that require registration for the sale of franchises. Our domestic franchise disclosure document complies with FTC disclosure requirements, and our international disclosure documents comply with applicable requirements.
We also must comply with a number of state and foreign laws that regulate some substantive aspects of the franchisor-franchisee relationship. These laws may limit a franchisor’s ability to: terminate or not renew a franchise without good cause; interfere with the right of free association among franchisees; disapprove the transfer of a franchise; discriminate among franchisees with regard to charges, royalties and other fees; and place new shops near existing franchises.
Bills intended to regulate certain aspects of franchise relationships have been introduced into the United States Congress on several occasions during the last decade, but none have been enacted.
Employment regulations. We are subject to state and federal labor laws that govern our relationship with team members, such as minimum wage requirements, overtime and working conditions and citizenship requirements. Many of our shop team members are paid at rates which are influenced by changes in the federal minimum wage. Accordingly, increases in the minimum wage could increase our labor costs. The work conditions at our facilities are regulated by the Occupational Safety and Health Administration and are subject to periodic inspections by this agency. In addition, the enactment of recent legislation and resulting new government regulation relating to healthcare benefits have resulted in increased costs, and may result in additional cost increases and other effects in the future. See “Management’s Discussion and Analysis of Financial Condition and Results of Operations – Fiscal 2015 Compared to Fiscal 2014 – Company Stores – Costs and expenses.”
Other regulations. We are subject to a variety of consumer protection and similar laws and regulations at the federal, state and local level. Failure to comply with these laws and regulations could subject us to financial and other penalties. We have several contracts to serve United States military bases, which require compliance with certain applicable regulations. The stores which serve these military bases are subject to health and cleanliness inspections by military authorities.
Seasonality
Our sales peak throughout the year due to certain promotional events and holiday celebrations. Additionally, our hot beverage sales generally increase during the fall and winter months while our iced beverage sales generally increase during the spring and summer months. Quarterly results also may be affected by the timing of the opening of new stores and the closing of existing stores. For these reasons, results for any quarter are not necessarily indicative of the results that may be achieved for the full fiscal year.
Research and Development
New product innovation is important to the success of our business. We believe that the development of new Krispy Kreme doughnuts, beverages and other products attracts new customers to our brand, increases same store sales, and allows our shops to strengthen day part offerings. One of our properties in Winston-Salem, North Carolina includes research and development facilities including test kitchens and doughnut producing equipment used in developing new products and processes.
Team Members
We employ approximately 5,000 people. Of these, approximately 200 are employed in our headquarters and administrative offices and approximately 100 are employed in our manufacturing and distribution center. We employ approximately 600 employees in our commissaries which serve wholesale customers almost exclusively, most of whom are employed full-time. In our other Krispy Kreme stores, we employ approximately 4,100 team members, of which approximately 1,900 are full-time (including approximately 600 managers, assistant managers and supervisors) with the balance employed part-time.
We are not a party to any collective bargaining agreement, although we have experienced occasional unionization initiatives. We believe our relationships with our team members generally are good.
Available Information
We maintain a website at www.krispykreme.com. The information on our website is available for information purposes only and is not incorporated by reference in this Annual Report on Form 10-K.
26
We make available on or through our website certain reports and amendments to those reports, if applicable, that we file with or furnish to the SEC in accordance with the Exchange Act. These include our annual reports on Form 10-K, our quarterly reports on Form 10-Q, our current reports on Form 8-K and amendments to those reports. We make this information available on our website free of charge as soon as reasonably practicable after we electronically file the information with, or furnish it to, the SEC. In addition, you may read and copy any materials that we file with the SEC at the SEC’s Public Reference Room at 100 F Street, NE., Washington, DC 20549. You may obtain information about the operation of the SEC’s Public Reference Room by calling the SEC at 1 (800) SEC-0339. The SEC also maintains an Internet site (http://www.sec.gov) that contains reports, proxy and information statements, and other information regarding the Company that we file electronically with the SEC.
In addition, many of our corporate governance documents are available on our website. Our Nominating and Corporate Governance Committee Charter, Compensation Committee Charter, Audit Committee Charter, Corporate Governance Guidelines, Code of Business Conduct and Ethics and Code of Ethics for Chief Executive and Senior Financial Officers are all available through the “Corporate Governance” tab of the Investor Relations section of our website, http://investor.krispykreme.com. Each of these documents is available in print to any shareholder who requests it by sending a written request to Krispy Kreme Doughnuts, Inc., 370 Knollwood Street, Winston-Salem, NC 27103, Attention: Secretary.
Our business, operations and financial condition are subject to various risks. Some of these risks are described below, and you should take such risks into account in evaluating us or any investment decision involving our Company. This section does not describe all risks that may be applicable to us, our industry or our business, and it is intended only as a summary of certain material risk factors. More detailed information concerning the risk factors described below is contained in other sections of this Annual Report on Form 10-K.
RISKS RELATING TO OUR BUSINESS
Shop profitability is sensitive to changes in sales volume.
Each shop has significant fixed or semi-fixed costs, and margins and profitability are significantly affected by doughnut sales volume. Because significant fixed and semi-fixed costs prevent us from reducing our operating expenses in proportion with declining sales, our earnings are negatively impacted if sales decline.
A number of factors have historically affected, and will continue to affect, our sales results, including, among other factors:
| ● | Consumer trends, preferences and disposable income; |
| ● | Our ability to execute our business strategy effectively; |
| ● | Competition; |
| ● | General regional and national economic conditions; and |
| ● | Seasonality and weather conditions. |
Changes in our sales results could cause the price of our common stock to fluctuate substantially.
We rely on information technology in our operations and are making improvements to important business systems. Any material failure, inadequacy or interruption of that technology could adversely affect our ability to effectively operate our business and result in financial or other loss.
We are making investments to improve our information technology systems infrastructure designed to improve our operational capabilities and effectiveness and to provide modern technology platforms to support future growth of our business. We recently implemented a new enterprise resource planning system and are implementing various other technology enhancements to improve our business capabilities. Implementing these systems is a lengthy and expensive process that may result in a diversion of resources from other initiatives and activities. Continued execution of the project plans, or a divergence from them, may result in cost overruns, project delays or business interruptions. Business interruptions also could result from the failure of other important information technology platforms we use to operate our business. Any disruptions, delays or deficiencies in the design and/or implementation of any of these systems, or our inability to accurately predict the costs of such initiatives or our failure to generate revenue and corresponding profits from such activities and investments, could impact our ability to perform necessary business operations, which could adversely affect our reputation, competitive position, business, results of operations and financial condition.
Our business is affected by security risks for individually identifiable data of our guests, web-site users, and team members.
We receive and, in certain cases, maintain certain personal information about our guests, web-site users, and team members. The use of this information by us is regulated by applicable law, as well as by certain third party contracts. If our security and information systems are compromised or our business associates fail to comply with these laws and regulations and this information is obtained by unauthorized persons or used inappropriately, it could adversely affect our reputation, as well as our operations, their results and our financial condition. Additionally, we could be subject to litigation or the imposition of penalties. As privacy and information security laws and regulations change, we may incur additional costs to ensure we remain in compliance with these laws and regulations.
27
We rely in part on our franchisees. Disputes with our franchisees, or failures by our franchisees to operate successfully, to develop or finance new stores or build them on suitable sites or open them on schedule, could adversely affect our growth and our operating results.
Franchisees, which are all independent operators and not Krispy Kreme employees, contributed (including through purchases from KK Supply Chain) approximately 34% of our total revenues in fiscal 2015. We rely in part on these franchisees and the manner in which they operate their locations to develop and promote our business. We occasionally have disputes with franchisees, which could materially adversely affect our business, financial condition and results of operations. We provide training and support to franchisees, but the quality of franchise store operations may be diminished by any number of factors beyond our control. The failure of our franchisees to operate franchises successfully could have a material adverse effect on us, our reputation and our brands, and could materially adversely affect our business, financial condition and results of operations. In addition, although we do not control our franchisees and they operate as independent contractors, actions taken by any of our franchisees may be seen by the public as actions taken by us, which, in turn, could adversely affect our reputation or brands.
Lack of access to financing by our franchisees on reasonable terms could adversely affect our future operations by limiting franchisees’ ability to open new stores or leading to additional franchisee store closures, which would in turn reduce our franchise revenues and KK Supply Chain revenues. Most development agreements specify a schedule for opening stores in the territory covered by the agreement. These schedules form the basis for our expectations regarding the number and timing of new Krispy Kreme store openings. In the past, Krispy Kreme has agreed to extend or modify development schedules for certain franchisees and may do so in the future.
Franchisees opened a net 147 shops in fiscal 2015. Royalty revenues and most KK Supply Chain revenues are directly related to sales by franchise stores and, accordingly, the success of franchisees’ operations has a direct effect on our revenues, results of operations and cash flows.
Our franchisees could take actions that could harm our business.
Franchisees are independently owned and operated, and they are not our employees. Although we provide certain training and support to franchisees, our franchisees operate their restaurants as independent businesses. Consequently, the quality of franchised restaurant operations may be diminished by any number of factors beyond our control. Moreover, franchisees may not operate restaurants in a manner consistent with applicable laws and regulations or in accordance with our standards and requirements. Also, franchisees may not successfully hire and train qualified managers and other restaurant personnel. Our image and reputation, and the image and reputation of other franchisees, may suffer materially if our franchisees do not operate successfully, which could result in a significant decline in systemwide sales, our revenues and our profitability.
A portion of our growth strategy depends on opening new Krispy Kreme stores both domestically and internationally. Our ability to expand our store base is influenced by factors beyond our and our franchisees’ control, which may slow store development and impair our strategy.
Our ability to expand our store base both domestically and internationally is influenced by factors beyond our and our franchisees’ control, which may slow store development and impair our growth strategy. The success of these new stores will be dependent in part on a number of factors, which neither we nor our franchisees can control.
We rely on third parties in many aspects of our business, which creates additional risk.
Due to the scale and scope of our business, we must rely on relationships with third parties for certain functions, such as our suppliers, distributors, contractors and external business partners. These relationships inherently involve a lesser degree of control over business operations, governance and compliance, thereby potentially increasing our financial, legal, reputational and/or operational risk.
Our profitability is sensitive to changes in the cost of fuel and raw materials.
Although we utilize forward purchase contracts and futures contracts and/or options on such contracts to mitigate the risks related to commodity price fluctuations, such contracts do not fully mitigate commodity price risk, particularly over the longer term. In addition, the portion of our anticipated future commodity requirements that is subject to such contracts varies from time to time.
28
Flour, shortening and sugar are our three most significant ingredients. We also purchase a substantial amount of gasoline to fuel our fleet of wholesale delivery vehicles. The prices of wheat and soybean oil, which are the principal components of flour and shortening respectively, and of sugar and gasoline, have been volatile in recent years. Adverse changes in commodity prices could adversely affect the Company’s profitability.
We are the exclusive supplier of doughnut mixes or mix concentrates to all Krispy Kreme stores worldwide. We also supply other key ingredients and flavors to all domestic Krispy Kreme Company stores. If we have any problems supplying these ingredients, our and our franchisees’ ability to make doughnuts could be negatively affected.
We are the exclusive supplier of doughnut mixes for many domestic and international Krispy Kreme stores. As to other stores, we are the exclusive supplier of doughnut mix concentrates that are blended with other ingredients to produce doughnut mixes. We also are the exclusive supplier of other key ingredients and flavors to all domestic Company stores, most domestic franchise stores and some international franchise stores. We manufacture the doughnut mixes and concentrates at our mix manufacturing facility located in Winston-Salem, North Carolina. We distribute doughnut mixes and other key ingredients and flavors using independent contract distributors for Krispy Kreme shops domestically and internationally. We have a backup source to manufacture our doughnut mixes in the event of a loss of our Winston-Salem facility; this backup source currently produces mix for us for distribution in most Krispy Kreme stores west of the Mississippi River. Nevertheless, an interruption of production capacity at our manufacturing facility could impede our ability or that of our franchisees to make doughnuts. In addition, in the event that any of our supplier relationships terminate unexpectedly, even where we have multiple suppliers for the same ingredient, we may not be able to obtain adequate quantities of the same high-quality ingredient at competitive prices.
We are the only manufacturer of substantially all of our doughnut-making equipment. If we have any problems producing this equipment, our stores’ ability to make doughnuts could be negatively affected.
We manufacture our custom doughnut-making equipment in one facility in Winston-Salem, North Carolina. Although we have limited backup sources for the production of our equipment, obtaining new equipment quickly in the event of a loss of our Winston-Salem facility would be difficult and would jeopardize our ability to supply equipment to new stores or new parts for the maintenance of existing equipment in established stores on a timely basis.
We have only one supplier of glaze flavoring, and any interruption in supply could impair our ability to make our signature hot Original Glazed® doughnut.
We utilize a sole supplier for our glaze flavoring. However, the supplier has multiple plants, and has a backup manufacturing agreement with another manufacturing company. Any interruption in the delivery of glaze flavoring could adversely affect our ability to produce our signature hot Original Glazed® doughnut
Political, economic, currency and other risks associated with our international operations could adversely affect our and our international franchisees’ operating results.
As of February 1, 2015, there were 709 Krispy Kreme stores operated outside of the United States, representing 72% of our total store count, all of which were operated by franchisees. Our revenues from international franchisees are exposed to the potentially adverse effects of our franchisees’ operations, political instability, currency exchange rates, local economic conditions and other risks associated with doing business in foreign countries. Royalties are based on a percentage of net sales generated by our foreign franchisees’ operations. Royalties payable to us by our international franchisees are based on a conversion of local currencies to U.S. dollars using the prevailing exchange rate, and changes in exchange rates could adversely affect our revenues. To the extent that the portion of our revenues generated from international operations increases in the future, our exposure to changes in foreign political and economic conditions and currency fluctuations will increase.
We typically export our products, principally our doughnut mixes and doughnut mix concentrates, to our franchisees in markets outside the United States. Numerous government regulations apply to both the export of food products from the United States as well as the import of food products into other countries. If one or more of the ingredients in our products are banned, alternative ingredients would need to be identified. Although we intend to be proactive in addressing any product ingredient issues, such requirements may delay our ability to open stores in other countries in accordance with our desired schedule.
We are subject to franchise laws and regulations that govern our status as a franchisor and regulate some aspects of our franchise relationships. Our ability to develop new franchised stores and to enforce contractual rights against franchisees may be adversely affected by these laws and regulations, which could cause our franchise revenues to decline.
As a franchisor, we are subject to regulation by the FTC and by domestic and foreign laws regulating the offer and sale of franchises. Our failure to obtain or maintain approvals to offer franchises would cause us to lose future franchise revenues and KK Supply Chain revenues. In addition, domestic or foreign laws that regulate substantive aspects of our relationships with franchisees may limit our ability to terminate or otherwise resolve conflicts with our franchisees. Because we plan to grow primarily through franchising, any impairment of our ability to develop new franchise stores will negatively affect us and our growth strategy.
29
Sales to wholesale customers represent a significant portion of our sales. The infrastructure necessary to support wholesale distribution results in significant fixed and semi-fixed costs. Also, the loss of one of our large wholesale customers could adversely affect our financial condition and results of operations.
We have several large wholesale customers. Our top two such customers accounted for approximately 16% of total Company Stores segment revenues during fiscal 2015. The loss of one of our large national wholesale customers could adversely affect our results of operations across all domestic business segments. These customers do not enter into long-term contracts; instead, they make purchase decisions based on a combination of price, product quality, consumer demand and service quality. They may in the future use more of their shelf space, including space currently used for our products, for other products, including private label products. If our sales to one or more of these customers are reduced, this reduction may adversely affect our business.
The Company operates a fleet network to support wholesale sales. Declines in wholesale sales without a commensurate reduction in operating expenses, as well as rising fuel costs, may adversely affect our business.
RISKS RELATING TO THE FOOD SERVICE INDUSTRY
The food service industry is affected by litigation, regulation and publicity concerning food quality, health and other issues, which can cause customers to avoid our products and result in liabilities.
Food service businesses can be adversely affected by litigation, by regulation and by complaints from customers or government authorities resulting from food quality, illness, injury or other health concerns or operating issues stemming from one store or a limited number of stores, including stores operated by our franchisees. In addition, class action lawsuits have been filed and may continue to be filed against various food service businesses (including quick service restaurants) alleging, among other things, that food service businesses have failed to disclose the health risks associated with high-fat foods and that certain food service business marketing practices have encouraged obesity. Adverse publicity about these allegations may negatively affect us and our franchisees, regardless of whether the allegations are true, by discouraging customers from buying our products. Because one of our competitive strengths is the taste and quality of our doughnuts, adverse publicity or regulations relating to food quality or other similar concerns affect us more than it would food service businesses that compete primarily on other factors. We could also incur significant liabilities if such a lawsuit or claim results in a decision against us or as a result of litigation costs regardless of the result.
The food service industry is affected by food safety issues, including food tampering or contamination.
Food safety, including the possibility of food tampering or contamination is a concern for any food service business. Any report or publicity linking the Company or one of its franchisees to food safety issues, including food tampering or contamination, could adversely affect our reputation as well as our revenues and profits. Food safety issues could also adversely affect the price and availability of affected ingredients, which could result in disruptions in our supply chain or lower margins for us and our franchisees. Additionally, food safety issues could expose the Company to litigation or governmental investigation.
Recent healthcare legislation and other potential employment legislation could adversely affect our business.
Federal legislation regarding government-mandated health benefits is expected to increase our and our domestic franchisees’ costs. It is difficult to predict the overall impact of the healthcare legislation on our business and the businesses of our domestic franchisees over the coming years. Likely adverse effects of the legislation include increased costs, exposure to expanded liability and requirements for us to revise the ways in which we conduct business. Our results of operations, financial position and cash flows could be adversely affected. Many of our domestic franchisees face the potential of similar adverse effects. Other potential employment legislation, such as minimum wage increases, could have similar adverse effects.
Our success depends on our ability to compete with many food service businesses.
We compete with many well-established food service companies. At the retail level, we compete with other doughnut retailers and bakeries, specialty coffee retailers, bagel shops, fast-food restaurants, delicatessens, take-out food service companies, convenience stores and supermarkets. At the wholesale level, we compete primarily with grocery store bakeries, packaged snack foods and vending machine dispensers of snack foods. Aggressive pricing by our competitors or the entrance of new competitors into our markets could reduce our sales and profit margins. Moreover, many of our competitors offer consumers a wider range of products. Many of our competitors or potential competitors have substantially greater financial and other resources than we do which may allow them to react to changes in pricing, marketing and the quick service restaurant industry better than we can. As competitors expand their operations, we expect competition to intensify. In addition, the start-up costs associated with retail doughnut and similar food service establishments are not a significant impediment to entry into the retail doughnut business. We also compete with other employers in our markets for hourly workers and may be subject to higher labor costs.
30
RISKS RELATING TO INTELLECTUAL PROPERTY
Our failure or inability to enforce our trademarks could adversely affect the value of our brands.
We own certain common-law trademark rights in the United States, as well as numerous trademark and service mark registrations in the United States and in other jurisdictions. We believe that our trademarks and other intellectual property rights are important to our success and our competitive position. We therefore devote appropriate resources to the protection of our trademarks and aggressively pursue persons who unlawfully and without our consent use or register our trademarks. We have a system in place that is designed to detect potential infringement on our trademarks, and we take appropriate action with regard to such infringement as circumstances warrant. The protective actions that we take, however, may not be sufficient, in some jurisdictions, to secure our trademark rights for some of the goods and services that we offer or to prevent imitation by others, which could adversely affect the value of our trademarks and service marks.
In certain jurisdictions outside the United States, specifically Costa Rica, Guatemala, India, Indonesia, Nigeria, Peru, the Philippines and Venezuela, we are aware that some businesses have registered, used and/or may be using “Krispy Kreme” (or its phonetic equivalent) in connection with doughnut-related goods and services. There may be similar such uses or registrations of which we are unaware and which could perhaps arise from prior users. These uses and/or registrations could limit our operations and possibly cause us to incur litigation costs, or pay damages or licensing fees to a prior user or registrant of similar intellectual property.
Loss of our trade secret recipes could adversely affect our sales.
We derive significant competitive benefit from the fact that our doughnut recipes are trade secrets. Although we take reasonable steps to safeguard our trade secrets, should they become known to competitors, our competitive position could suffer substantially.
RISKS RELATING TO OWNERSHIP OF OUR COMMON STOCK
The market price of our common stock has been volatile and may continue to be volatile, and the value of any investment may decline.
The market price of our common stock has been volatile and may continue to be volatile. This volatility may cause wide fluctuations in the price of our common stock, which is listed on the New York Stock Exchange. The market price may fluctuate in response to many factors including:
| ● | Changes in general conditions in the economy or the financial markets; |
| ● | Variations in our quarterly operating results or our operating results failing to meet the expectations of securities analysts or investors in a particular period; |
| ● | Changes in financial estimates by securities analysts; |
| ● | Other developments affecting Krispy Kreme, our industry, customers or competitors; |
| ● | The operating and stock price performance of companies that investors deem comparable to Krispy Kreme; and |
| ● | The impact of our share repurchase program. |
Our charter and bylaws contain provisions that may make it more difficult or expensive to acquire us in the future or may negatively affect our stock price.
Our articles of incorporation and bylaws contain several provisions that may make it more difficult for a third party to acquire control of us without the approval of our board of directors. These provisions may make it more difficult or expensive for a third party to acquire a majority of our outstanding voting common stock. They may also delay, prevent or deter a merger, acquisition, tender offer, proxy contest or other transaction that might otherwise result in our shareholders’ receiving a premium over the market price for their common stock.
Item 1B. UNRESOLVED STAFF COMMENTS.
None.
31
Stores. As of February 1, 2015, there were 987 Krispy Kreme stores systemwide, of which 111 were Company stores and 876 were operated by franchisees.
| ● | As of February 1, 2015, all of our Company stores, except our eight commissaries, had on-premises sales, and 40 of our Company factory stores also engaged in wholesale sales. |
| ● | Of the 111 Company stores in operation as of February 1, 2015, we owned the land and building for 39 stores, we owned the building and leased the land for 32 stores, leased both the land and building for 18 stores and leased space for 22 in-line and end cap locations. |
KK Supply Chain facilities. We own a 150,000 square foot facility in Winston-Salem, North Carolina, which houses our doughnut mix plant and distribution center. This facility also houses a commissary serving wholesale customers that was opened late in fiscal 2012. We own another 105,000 square foot facility in Winston-Salem which we use primarily as our equipment manufacturing facility, but which also contains our research and development and training facilities.
Other properties. Our corporate headquarters is located in Winston-Salem, North Carolina. We lease the entire 86,000 square feet of this facility under a lease that expires on November 30, 2026, with two five-year renewal options.
Pending Matters
Except as disclosed below, the Company currently is not a party to any material legal proceedings.
K² Asia Litigation
On April 7, 2009, a Cayman Islands corporation, K2 Asia Ventures, and its owners filed a lawsuit in Forsyth County, North Carolina Superior Court against the Company, its franchisee in the Philippines, and other persons associated with the franchisee. The suit alleges that the Company and the other defendants conspired to deprive the plaintiffs of claimed “exclusive rights” to negotiate franchise and development agreements with prospective franchisees in the Philippines, and seeks unspecified damages. The Company therefore does not know the amount or range of possible loss related to this matter. The Company believes that these allegations are false and intends to vigorously defend against the lawsuit. On July 26, 2013, the Superior Court dismissed the Philippines-based defendants for lack of personal jurisdiction, and the plaintiffs appealed that decision. On January 22, 2015, the North Carolina Supreme Court denied the plaintiffs’ request to review the case.
The Company does not believe it is probable that a loss has been incurred with respect to this matter, and accordingly no liability related to it has been reflected in the accompanying financial statements.
Other Legal Matters
The Company also is engaged in various legal proceedings arising in the normal course of business. The Company maintains customary insurance policies against certain kinds of such claims and suits, including insurance policies for workers’ compensation and personal injury, some of which provide for relatively large deductible amounts. While the ultimate outcome of these matters could differ from management’s expectations, management currently does not believe their resolution will have a material adverse effect on the Company’s consolidated financial statements.
Item 4. MINE SAFETY DISCLOSURES.
Not applicable.
32
|
MARKET FOR REGISTRANT’S COMMON EQUITY, RELATED STOCKHOLDER MATTERS AND ISSUER PURCHASES OF EQUITY SECURITIES. |
Market Information
Our common stock is listed on the NYSE under the symbol “KKD.” The following table sets forth the high and low sales prices for our common stock in composite trading as reported by the NYSE for the fiscal periods shown.
| High | Low | |||||
| Year Ended February 2, 2014: | ||||||
| First Quarter | $ | 15.33 | $ | 12.32 | ||
| Second Quarter | 21.69 | 12.55 | ||||
| Third Quarter | 24.69 | 18.25 | ||||
| Fourth Quarter | 26.63 | 16.77 | ||||
| Year Ended February 1, 2015: | ||||||
| First Quarter | $ | 21.30 | $ | 15.70 | ||
| Second Quarter | 19.30 | 14.82 | ||||
| Third Quarter | 19.02 | 14.90 | ||||
| Fourth Quarter | 21.08 | 18.18 | ||||
Holders
As of March 20, 2015, there were approximately 14,300 shareholders of record of our common stock.
Dividends
We did not pay any cash dividends in fiscal 2015 or fiscal 2014. Because we intend to invest significant amounts of cash in assets and activities we believe will grow our business and generate significant earnings over the long term, we do not anticipate paying regular cash dividends in the foreseeable future.
Recent Sales of Unregistered Securities
None.
Purchases of Equity Securities
On July 11, 2013, our Board of Directors authorized the repurchase of up to $50 million of the Company's common stock, and subsequently increased such repurchase authorization such that it now totals $105 million. This authorization does not have an expiration date. Pursuant to this authorization, during the year ended February 1, 2015, we repurchased approximately 2,237,000 shares at an average price of $17.54 per share, for a total cost of approximately $39.2 million (none of which were purchased in the fourth quarter), and during the year end February 2, 2014, we repurchased approximately 1,185,000 shares at an average price of $18.85 per share, for an aggregate purchase price of approximately $22.3 million. At February 1, 2015, there remains approximately $43.4 million available for future repurchases under the authorization, which has no expiration date. Due to the Company’s incorporation in North Carolina, which does not recognize treasury shares, the shares repurchased are canceled at the time of repurchase.
We expect to make additional share repurchases in the future.
33
Stock Performance Graph
The performance graph shown below compares the percentage change in the cumulative total shareholder return on our common stock against the cumulative total return of the NYSE Composite Index and Standard & Poor’s Restaurants Index for the period from January 31, 2010 through February 1, 2015. The graph assumes an initial investment of $100 and the reinvestment of dividends.
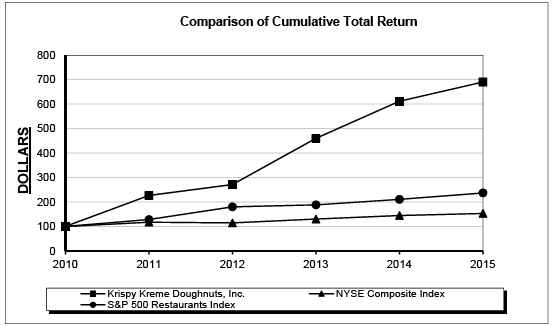
| January 31, | January 30, | January 29, | February 3, | February 2, | February 1, | |||||||
| 2010 | 2011 | 2012 | 2013 | 2014 | 2015 | |||||||
| Krispy Kreme Doughnuts, Inc. | $ | 100.00 | $ | 226.60 | $ | 271.28 | $ | 460.28 | $ | 611.70 | $ | 690.43 |
| NYSE Composite Index | 100.00 | 117.13 | 114.42 | 130.24 | 144.80 | 153.07 | ||||||
| S&P 500 Restaurants Index | 100.00 | 128.23 | 180.14 | 188.26 | 210.76 | 236.86 |
34
Item 6. SELECTED FINANCIAL DATA.
The following selected financial data should be read in conjunction with Item 7, “Management’s Discussion and Analysis of Financial Condition and Results of Operations,” and the Company’s consolidated financial statements appearing elsewhere herein. The Company’s fiscal year ends on the Sunday closest to January 31, which periodically results in a 53-week year. Fiscal 2013 contained 53 weeks.
| Year Ended | ||||||||||||||||||||
| February 1, | February 2, | February 3, | January 29, | January 30, | ||||||||||||||||
| 2015 | 2014 | 2013 | 2012 | 2011 | ||||||||||||||||
| (In thousands, except per share and number of stores data) | ||||||||||||||||||||
| STATEMENT OF INCOME DATA: | ||||||||||||||||||||
| Revenues | $ | 490,334 | $ | 460,331 | $ | 435,843 | $ | 403,217 | $ | 361,955 | ||||||||||
| Operating expenses: | ||||||||||||||||||||
| Direct operating expenses (exclusive of depreciation | ||||||||||||||||||||
| and amortization expense shown below) | 399,744 | 376,132 | 362,828 | 346,434 | 313,475 | |||||||||||||||
| General and administrative expenses | 28,558 | 25,149 | 25,089 | 22,188 | 21,870 | |||||||||||||||
| Depreciation and amortization expense | 12,840 | 11,106 | 9,891 | 8,235 | 7,389 | |||||||||||||||
| Impairment charges and lease termination costs | 955 | 1,374 | 306 | 793 | 4,066 | |||||||||||||||
| Operating income | 48,237 | 46,570 | 37,729 | 25,567 | 15,155 | |||||||||||||||
| Interest income | 406 | 616 | 114 | 166 | 207 | |||||||||||||||
| Interest expense | (856 | ) | (1,057 | ) | (1,642 | ) | (1,666 | ) | (6,359 | ) | ||||||||||
| Loss on retirement of debt | - | (967 | ) | - | - | (1,022 | ) | |||||||||||||
| Equity in income (losses) of equity method franchisees | (118 | ) | (221 | ) | (202 | ) | (122 | ) | 547 | |||||||||||
| Gain on sale of interest in equity method franchisee | - | - | - | 6,198 | - | |||||||||||||||
| Other non-operating income and (expense), net | 547 | 119 | 317 | 215 | 329 | |||||||||||||||
| Income before income taxes | 48,216 | 45,060 | 36,316 | 30,358 | 8,857 | |||||||||||||||
| Provision for income taxes | 18,156 | 10,804 | 15,537 | (135,911 | ) | 1,258 | ||||||||||||||
| Net income | $ | 30,060 | $ | 34,256 | $ | 20,779 | $ | 166,269 | $ | 7,599 | ||||||||||
| Earnings per common share: | ||||||||||||||||||||
| Basic | $ | 0.45 | $ | 0.51 | $ | 0.31 | $ | 2.40 | $ | 0.11 | ||||||||||
| Diluted | $ | 0.44 | $ | 0.48 | $ | 0.30 | $ | 2.33 | $ | 0.11 | ||||||||||
| BALANCE SHEET DATA (AT END OF YEAR): | ||||||||||||||||||||
| Working capital | $ | 77,889 | $ | 81,079 | $ | 88,108 | $ | 55,722 | $ | 22,576 | ||||||||||
| Total assets | 352,713 | 338,546 | 341,938 | 334,948 | 169,926 | |||||||||||||||
| Loan and lease obligations, less current portion | 9,354 | 1,659 | 23,595 | 25,369 | 32,874 | |||||||||||||||
| Total shareholders' equity | 267,786 | 265,093 | 246,432 | 249,126 | 76,428 | |||||||||||||||
| Number of stores at end of year: | ||||||||||||||||||||
| Company | 111 | 95 | 97 | 92 | 85 | |||||||||||||||
| Franchise | 876 | 733 | 651 | 602 | 561 | |||||||||||||||
| Systemwide | 987 | 828 | 748 | 694 | 646 | |||||||||||||||
35
|
MANAGEMENT’S DISCUSSION AND ANALYSIS OF FINANCIAL CONDITION AND RESULTS OF OPERATIONS. |
The following discussion of the Company’s financial condition and results of operations should be read in conjunction with the consolidated financial statements and notes thereto appearing elsewhere herein. Such financial statements have been prepared in conformity with accounting principles generally accepted in the United States (“GAAP”).
The following tables set forth operating metrics with respect to the Krispy Kreme stores operated by the Company (all of which are located in the United States) and the stores operated by the Company’s domestic and international franchisees.
The Company’s fiscal year ends on the Sunday closest to January 31, which periodically results in a 53-week year. Fiscal 2013 included 53 weeks. Operating metrics in the table below for fiscal 2013 are presented for the 52 weeks ended January 27, 2013 in order to enhance comparability of the fiscal 2013 metrics with those for fiscal 2015 and 2014, each of which contained 52 weeks.
36
| 52 Weeks Ended | ||||||||||||
| February 1, | February 2, | January 27, | ||||||||||
| 2015 | 2014 | 2013 | ||||||||||
| Change in Same Store Sales (on-premises sales only): | ||||||||||||
| Company stores | 1.2 | % | 7.4 | % | 5.9 | % | ||||||
| Domestic Franchise stores | 4.2 | 10.4 | 7.9 | |||||||||
| International Franchise stores | (4.6 | ) | (8.0 | ) | (5.7 | ) | ||||||
| International Franchise stores, in constant dollars(1) | (2.6 | ) | (3.3 | ) | (4.8 | ) | ||||||
| Change in Same Store Customer Count - Company stores (retail sales only) | 0.1 | % | 5.3 | % | 7.6 | % | ||||||
| Average Guest Check - Company stores (retail sales only) | $ | 7.56 | $ | 7.47 | $ | 7.29 | ||||||
| Wholesale Metrics (Company stores only): | ||||||||||||
| Average weekly number of doors served: | ||||||||||||
| Grocers/mass merchants | 5,312 | 5,236 | 5,582 | |||||||||
| Convenience stores | 4,614 | 4,503 | 4,517 | |||||||||
| Average weekly sales per door: | ||||||||||||
| Grocers/mass merchants | $ | 349 | $ | 350 | $ | 319 | ||||||
| Convenience stores | 251 | 256 | 248 | |||||||||
| Systemwide Sales (in thousands):(2) | ||||||||||||
| Company stores | $ | 322,521 | $ | 303,973 | $ | 288,079 | ||||||
| Domestic Franchise stores | 337,072 | 317,864 | 281,334 | |||||||||
| International Franchise stores | 476,364 | 438,027 | 423,418 | |||||||||
| International Franchise stores, in constant dollars(3) | 476,364 | 428,950 | 395,548 | |||||||||
| Average Weekly Sales Per Store (in thousands):(4) (5) (6) | ||||||||||||
| Company stores: | ||||||||||||
| Factory stores: | ||||||||||||
| Commissaries — wholesale | $ | 190.5 | $ | 202.9 | $ | 181.6 | ||||||
| Dual-channel stores: | ||||||||||||
| On-premises | 38.9 | 37.4 | 34.0 | |||||||||
| Wholesale | 48.4 | 49.0 | 45.7 | |||||||||
| Total | 87.3 | 86.4 | 79.7 | |||||||||
| On-premises only stores | 35.7 | 37.3 | 35.0 | |||||||||
| All factory stores | 70.8 | 74.4 | 71.0 | |||||||||
| Satellite stores | 22.1 | 21.4 | 20.1 | |||||||||
| All stores | 62.1 | 63.4 | 59.8 | |||||||||
| Domestic Franchise stores: | ||||||||||||
| Factory stores | $ | 50.2 | $ | 51.4 | $ | 48.2 | ||||||
| Satellite stores | 18.0 | 18.0 | 16.7 | |||||||||
| International Franchise stores: | ||||||||||||
| Factory stores | $ | 40.9 | $ | 40.1 | $ | 41.0 | ||||||
| Satellite stores | 9.5 | 10.2 | 11.3 | |||||||||
| (1) | Represents the change in International Franchise same store sales computed by reconverting franchise store sales in each foreign currency to U.S. dollars at a constant rate of exchange for each period. | |
| (2) | Excludes sales among Company and franchise stores. Systemwide sales is a non-GAAP measure. | |
| (3) | Represents International Franchise store sales computed by reconverting International Franchise store sales for the 52-weeks ended January 27, 2013 and February 2, 2014 to U.S. dollars based upon the weighted average of the exchange rates prevailing in the year ended February 1, 2015. | |
| (4) | Includes sales between Company and franchise stores. | |
| (5) | Metrics are computed based only on stores open at the respective period end. | |
| (6) | Metrics are computed based on each store’s classification at the end of the respective period. |
37
In the first quarter of fiscal 2015, the Company revised its methodology for computing its same store sales metric. Under the revised methodology, shops are included in the same store sales computation after 18 months of operation, compared to 13 months under the former methodology. The Company believes that deferring stores’ entry into the same store sales metric until week 79 results in a more meaningful measurement of comparable sales because, in most cases, substantially all of the elevated sales levels typically experienced in the initial weeks following the opening of a new Krispy Kreme shop will no longer be reflected in the metric.
All same store sales change metrics set forth herein reflect the new methodology for all periods. The Company filed a Current Report on Form 8-K on May 8, 2014 providing quarterly tables showing the change in same store sales for Company, domestic franchise and international franchise shops for fiscal 2012 through fiscal 2014 calculated using the revised computational methodology and using the former methodology.
The change in “same store sales” is computed by dividing the aggregate on-premises sales (including fundraising sales) during the current year period for all stores which had been open for more than 78 consecutive weeks during the current year (but only to the extent such sales occurred in the 79th or later week of each store’s operation) by the aggregate on-premises sales of such stores for the comparable weeks in the preceding year. Once a store has been open for at least 79 consecutive weeks, its sales are included in the computation of same store sales for all subsequent periods. In the event a store is closed temporarily (for example, for remodeling) and has no sales during one or more weeks, such store’s sales for the comparable weeks during the earlier or subsequent period are excluded from the same store sales computation. The change in same store customer count is similarly computed, but is based upon the number of retail transactions reported in the Company’s point-of-sale system.
For wholesale sales, “average weekly number of doors” represents the average number of customer locations to which product deliveries were made during a week, and “average weekly sales per door” represents the average weekly sales to each such location.
Systemwide sales, a non-GAAP financial measure, include sales by both Company and franchise Krispy Kreme stores. The Company believes systemwide sales data are useful in assessing consumer demand for the Company’s products, the overall success of the Krispy Kreme brand and, ultimately, the performance of the Company. All of the Company’s royalty revenues are computed as percentages of sales made by the Company’s domestic and international franchisees, and substantially all of KK Supply Chain’s external sales of doughnut mixes and other ingredients ultimately are determined by demand for the Company’s products at franchise stores. Accordingly, sales by the Company’s franchisees have a direct effect on the Company’s royalty and KK Supply Chain revenues, and therefore on the Company’s profitability. The Company’s consolidated financial statements appearing elsewhere herein include sales by Company stores, sales to franchisees by the KK Supply Chain business segment, and royalties and fees received from franchise stores based on their sales, but exclude sales by franchise stores to their customers.
38
The following table sets forth data about the number of systemwide stores as of February 1, 2015, February 2, 2014 and February 3, 2013.
| February 1, | February 2, | February 3, | ||||
| 2015 | 2014 | 2013 | ||||
| Number of Stores Open At Year End: | ||||||
| Company stores: | ||||||
| Factory: | ||||||
| Commissaries | 8 | 7 | 7 | |||
| Dual-channel stores | 32 | 31 | 36 | |||
| On-premises only stores | 52 | 38 | 33 | |||
| Satellite stores | 19 | 19 | 21 | |||
| Total Company stores | 111 | 95 | 97 | |||
| Domestic Franchise stores: | ||||||
| Factory stores | 116 | 107 | 99 | |||
| Satellite stores | 51 | 52 | 43 | |||
| Total Domestic Franchise stores | 167 | 159 | 142 | |||
| International Franchise stores: | ||||||
| Factory stores | 133 | 125 | 120 | |||
| Satellite stores | 576 | 449 | 389 | |||
| Total international franchise stores | 709 | 574 | 509 | |||
| Total systemwide stores | 987 | 828 | 748 | |||
The following table sets forth data about the number of store operating weeks for the 52 weeks ended February 1, 2015, February 2, 2014 and January 27, 2013.
| 52 Weeks Ended | ||||||
| February 1, | February 2, | January 27, | ||||
| 2015 | 2014 | 2013 | ||||
| Store Operating Weeks:(1) | ||||||
| Company stores: | ||||||
| Factory stores: | ||||||
| Commissaries | 416 | 364 | 364 | |||
| Dual-channel stores | 1,623 | 1,684 | 1,842 | |||
| On-premises only stores | 2,263 | 1,805 | 1,623 | |||
| Satellite stores | 982 | 1,011 | 1,062 | |||
| Domestic Franchise stores:(2) | ||||||
| Factory stores | 5,738 | 5,365 | 4,910 | |||
| Satellite stores | 2,651 | 2,406 | 2,078 | |||
| International Franchise stores:(2) | ||||||
| Factory stores | 5,559 | 5,296 | 5,224 | |||
| Satellite stores | 25,696 | 21,180 | 17,724 | |||
| (1) | Metrics are computed based on each store’s classification at the end of the respective period. | |
| (2) | Metrics are computed based only on stores open at the respective period end. |
39
FISCAL 2015 COMPARED TO FISCAL 2014
Matters Affecting Comparability
The Company recorded a pretax charge of $2.5 million in the fourth quarter of fiscal 2015 for the settlement of amounts due under an employment agreement with the Company’s former chief executive officer. That officer, who was most recently the Company’s Executive Chairman, transitioned from that role to the non-employee role of non-executive chairman of the board of directors in January 2015. In the second quarter of fiscal 2014, the Company recorded a charge of $967,000 related to the retirement of its secured credit facilities, consisting principally of the write off of deferred financing costs related to the Company’s term loan, which was retired in full, and the termination of an interest rate hedge related to the term loan. Charges of this nature are not expected to recur on a regular basis. Accordingly, financial results for fiscal 2015 are not directly comparable to those for fiscal 2014.
Non-GAAP Measures
The Company has substantial net operating loss carryforwards and, accordingly, the Company’s cash payments for income taxes are not significant and are expected to remain insignificant for the next three to five years. See “Provision for Income Taxes” below, and Note 16 to the consolidated financial statements appearing elsewhere herein.
Management evaluates the Company’s results of operations using, among other measures, adjusted net income and adjusted earnings per share, which reflect the provision for income taxes only to the extent such taxes are currently payable in cash. In addition, management excludes from adjusted net income charges and credits that are unusual and infrequently occurring. Management believes adjusted net income and adjusted earnings per share are useful performance measures because they more closely measure the cash flows generated by the Company’s operations and the trends in those cash flows than do GAAP net income and earnings per share, and because they exclude the effects of transactions that are not indicative of the Company’s ongoing results of operations.
Adjusted net income and adjusted earnings per share are non-GAAP measures.
The following presentation of adjusted net income, the related reconciliation of adjusted net income to GAAP net income, and the presentation of adjusted earnings per share are intended to facilitate comparisons of fiscal 2015 results with the Company’s results for fiscal 2014 in light of the effects of the matters discussed under “Matters Affecting Comparability” above, and to illustrate the material difference between the Company’s income tax expense and income taxes currently payable. These non-GAAP performance measures are consistent with other measurements made by management in the operation of the business which do not consider income taxes except to the extent to which those taxes currently are payable, for example, capital allocation decisions and incentive compensation measurements that are made on a pretax basis.
| Year Ended | ||||||
| February 1, | February 2, | |||||
| 2015 | 2014 | |||||
| (In thousands, except per share | ||||||
| amounts) | ||||||
| Net income, as reported | $ | 30,060 | $ | 34,256 | ||
| Charge for settlement of employment contract | 2,464 | - | ||||
| Loss on retirement of debt | - | 967 | ||||
| Provision for deferred income taxes | 15,729 | 8,014 | ||||
| Adjusted net income | $ | 48,253 | $ | 43,237 | ||
| Adjusted earnings per common share: | ||||||
| Basic | $ | 0.73 | $ | 0.64 | ||
| Diluted | $ | 0.70 | $ | 0.61 | ||
|
Weighted average shares outstanding: |
||||||
| Basic | 66,360 | 67,261 | ||||
| Diluted | 68,929 | 71,054 | ||||
Overview
Total revenues rose to $490.3 million in fiscal 2015 from $460.3 million in fiscal 2014.
40
Consolidated operating income increased to $48.2 million in fiscal 2015 from $46.6 million in fiscal 2014. Consolidated net income was $30.1 million in fiscal 2015 compared to $34.3 million in fiscal 2014. Consolidated net income in fiscal 2014 reflects an $8.8 million credit in the provision for income taxes resulting from an increase in management’s estimate of annual pretax income to be earned in future years, as described in Note 16 to the consolidated financial statements appearing elsewhere herein. See also “Matters Affecting Comparability” above.
Revenues by business segment (expressed in dollars and as a percentage of total revenues) and operating income by business segment are set forth in the following table (percentage amounts may not add to totals due to rounding).
| Year Ended | ||||||||
| February 1, | February 2, | |||||||
| 2015 | 2014 | |||||||
| (Dollars in thousands) | ||||||||
| Revenues by business segment: | ||||||||
| Company Stores | $ | 325,306 | $ | 306,825 | ||||
| Domestic Franchise | 13,450 | 11,839 | ||||||
| International Franchise | 28,598 | 25,607 | ||||||
| KK Supply Chain: | ||||||||
| Total revenues | 244,688 | 231,229 | ||||||
| Less - intersegment sales elimination | (121,708 | ) | (115,169 | ) | ||||
| External KK Supply Chain revenues | 122,980 | 116,060 | ||||||
| Total revenues | $ | 490,334 | $ | 460,331 | ||||
| Segment revenues as a percentage of total revenues: | ||||||||
| Company Stores | 66.3 | % | 66.7 | % | ||||
| Domestic Franchise | 2.7 | 2.6 | ||||||
| International Franchise | 5.8 | 5.6 | ||||||
| KK Supply Chain (external sales) | 25.1 | 25.2 | ||||||
| 100.0 | % | 100.0 | % | |||||
| Operating income: | ||||||||
| Company Stores | $ | 9,287 | $ | 11,334 | ||||
| Domestic Franchise | 8,103 | 8,083 | ||||||
| International Franchise | 20,026 | 17,977 | ||||||
| KK Supply Chain | 41,823 | 36,953 | ||||||
| Total segment operating income | 79,239 | 74,347 | ||||||
| General and administrative expenses | (28,558 | ) | (25,149 | ) | ||||
| Corporate depreciation and amortization expense | (1,489 | ) | (1,254 | ) | ||||
| Impairment charges and lease termination costs | (955 | ) | (1,374 | ) | ||||
| Consolidated operating income | 48,237 | 46,570 | ||||||
| Interest income | 406 | 616 | ||||||
| Interest expense | (856 | ) | (1,057 | ) | ||||
| Loss on retirement of debt | - | (967 | ) | |||||
| Equity in losses of equity method franchisee | (118 | ) | (221 | ) | ||||
| Other non-operating income and (expense), net | 547 | 119 | ||||||
| Income before income taxes | 48,216 | 45,060 | ||||||
| Provision for income taxes | 18,156 | 10,804 | ||||||
| Consolidated net income | $ | 30,060 | $ | 34,256 | ||||
A discussion of the revenues and operating results of each of the Company’s four business segments follows, together with a discussion of income statement line items not associated with specific segments.
41
Company Stores
The components of Company Stores revenues and expenses (expressed in dollars and as a percentage of total revenues) are set forth in the table below (percentage amounts may not add to totals due to rounding).
| Percentage of Total Revenues | ||||||||||||||
| Year Ended | Year Ended | |||||||||||||
| February 1, | February 2, | February 1, | February 2, | |||||||||||
| 2015 | 2014 | 2015 | 2014 | |||||||||||
| (In thousands) | ||||||||||||||
| Revenues: | ||||||||||||||
| On-premises sales: | ||||||||||||||
| Retail sales | $ | 151,956 | $ | 136,921 | 46.7 | % | 44.6 | % | ||||||
| Fundraising sales | 15,406 | 14,591 | 4.7 | 4.8 | ||||||||||
| Total on-premises sales | 167,362 | 151,512 | 51.4 | 49.4 | ||||||||||
| Wholesale sales: | ||||||||||||||
| Grocers/mass merchants | 95,272 | 94,352 | 29.3 | 30.8 | ||||||||||
| Convenience stores | 57,434 | 57,390 | 17.7 | 18.7 | ||||||||||
| Other wholesale | 5,238 | 3,571 | 1.6 | 1.2 | ||||||||||
| Total wholesale sales | 157,944 | 155,313 | 48.6 | 50.6 | ||||||||||
| Total revenues | 325,306 | 306,825 | 100.0 | 100.0 | ||||||||||
| Operating expenses: | ||||||||||||||
| Cost of sales: | ||||||||||||||
| Food, beverage and packaging | 121,669 | 115,623 | 37.4 | 37.7 | ||||||||||
| Shop labor | 58,943 | 54,270 | 18.1 | 17.7 | ||||||||||
| Delivery labor | 24,586 | 24,280 | 7.6 | 7.9 | ||||||||||
| Employee benefits | 20,825 | 21,259 | 6.4 | 6.9 | ||||||||||
| Total cost of sales | 226,023 | 215,432 | 69.5 | 70.2 | ||||||||||
| Vehicle costs(1) | 16,559 | 17,135 | 5.1 | 5.6 | ||||||||||
| Loss on gasoline derivatives | 1,221 | - | 0.4 | - | ||||||||||
| Occupancy(2) | 10,731 | 9,752 | 3.3 | 3.2 | ||||||||||
| Utilities expense | 6,419 | 5,876 | 2.0 | 1.9 | ||||||||||
| Depreciation expense | 10,534 | 9,039 | 3.2 | 2.9 | ||||||||||
| Pre-opening costs | 2,530 | 563 | 0.8 | 0.2 | ||||||||||
| Business acquisition charges | 431 | - | 0.1 | - | ||||||||||
| Gain on refranchising | (1,247 | ) | (876 | ) | (0.4 | ) | (0.3 | ) | ||||||
| Other operating expenses | 25,106 | 20,486 | 7.7 | 6.7 | ||||||||||
| Total store level costs | 298,307 | 277,407 | 91.7 | 90.4 | ||||||||||
| Store operating income | 26,999 | 29,418 | 8.3 | 9.6 | ||||||||||
| Other segment operating costs(3) | 13,412 | 13,784 | 4.1 | 4.5 | ||||||||||
| Allocated corporate overhead | 4,300 | 4,300 | 1.3 | 1.4 | ||||||||||
| Segment operating income | $ | 9,287 | $ | 11,334 | 2.9 | % | 3.7 | % | ||||||
| (1) |
Includes fuel, maintenance and repairs, rent, taxes and other costs of operating the delivery fleet, exclusive of depreciation. | |
| (2) |
Includes rent, property taxes, common area maintenance charges, insurance, building maintenance and other occupancy costs, exclusive of utilities and depreciation. | |
| (3) |
Includes marketing costs not charged to stores, segment management costs, wholesale selling expenses and support functions. |
42
A reconciliation of Company Stores segment sales from fiscal 2014 to fiscal 2015 follows:
| On-Premises | Wholesale | Total | ||||||||||
| (In thousands) | ||||||||||||
| Sales for the year ended February 2, 2014 | $ | 151,512 | $ | 155,313 | $ | 306,825 | ||||||
| Fiscal 2014 sales at closed stores | (2,363 | ) | (892 | ) | (3,255 | ) | ||||||
| Fiscal 2014 sales at stores refranchised in fiscal 2014 | (2,075 | ) | (1,715 | ) | (3,790 | ) | ||||||
| Fiscal 2014 sales at stores refranchised in fiscal 2015 | (2,358 | ) | - | (2,358 | ) | |||||||
| Fiscal 2015 sales at closed stores | 936 | - | 936 | |||||||||
| Fiscal 2015 sales at stores refranchised in fiscal 2015 | 1,407 | - | 1,407 | |||||||||
| Increase in sales at established stores (open stores only) | 1,309 | 2,234 | 3,543 | |||||||||
| Increase in sales at stores opened in fiscal 2014 | 4,317 | - | 4,317 | |||||||||
| Sales at stores acquired in fiscal 2015 | 5,153 | 3,004 | 8,157 | |||||||||
| Sales at stores opened in fiscal 2015 | 9,524 | - | 9,524 | |||||||||
| Sales for the year ended February 1, 2015 | $ | 167,362 | $ | 157,944 | $ | 325,306 | ||||||
On-premises sales
The following table presents on-premises sales metrics for Company stores:
| Year Ended | ||||||||
| February 1, | February 2, | |||||||
| 2015 | 2014 | |||||||
| On-premises: | ||||||||
| Change in same store sales | 1.2 | % | 7.4 | % | ||||
| Change in same store customer count (retail sales only) | 0.1 | % | 5.3 | % | ||||
| Average guest check (retail sales only) | $ | 7.56 | $ | 7.47 | ||||
The components of the change in same store sales at Company stores are as follows:
| Year Ended | |||||
| February 1, | February 2, | ||||
| 2015 | 2014 | ||||
| Change in same store sales attributable to: | |||||
| Retail menu pricing | 1.9 | % | 3.4 | % | |
| Guest check average (exclusive of the effects of menu pricing) | (0.9 | ) | (0.9 | ) | |
| Customer count | 0.1 | 4.7 | |||
| Fundraising pricing | 0.6 | 0.0 | |||
| Other | (0.5 | ) | 0.2 | ||
| Total | 1.2 | % | 7.4 | % | |
Retail and fundraising price increases implemented in the first quarter of fiscal 2015 drove increases in same store sales of 1.9 and 0.6 percentage points, respectively, exclusive of any effects of higher pricing on unit volumes; such effects are difficult to measure reliably. On February 3, 2014, the Company implemented retail price increases affecting items comprising approximately 70% of retail sales; the average price increase on these items was approximately 3%. On March 3, 2014, the Company implemented a fundraising price increase of approximately 9%.
An increase in consumer incentives compared to last year offset the effects of higher menu pricing in fiscal 2015 and contributed to a decline in the average guest check (exclusive of menu pricing), which reduced same store sales by 0.9 percentage points. A slight increase in same store customer traffic drove a 0.1% increase in same store sales dollars in fiscal 2015. The Company continuously evaluates and adjusts its marketing, promotional and operational activities and techniques with the goal of increasing customer traffic in its shops, which management believes will continue to be an important factor in the profitability of the Company Stores business segment.
In addition, the Company believes that normal cannibalization effects from new stores in some markets in which the Company is opening additional stores negatively affected traffic at existing shops in those markets, which adversely affected same store customer traffic during the fiscal 2015. The Company’s goal is to increase total sales of its products and the Company’s profitability in each market it serves by adding additional Krispy Kreme shops in markets the Company believes it has not fully penetrated.
43
Wholesale sales
The following table presents wholesale sales metrics for Company stores:
| Year Ended | |||||
| February 1, | February 2, | ||||
| 2015 | 2014 | ||||
| Wholesale: | |||||
| Grocers/mass merchants: | |||||
| Change in average weekly number of doors | 1.5 | % | (6.2 | )% | |
| Change in average weekly sales per door | (0.3 | )% | 9.7 | % | |
| Convenience stores: | |||||
| Change in average weekly number of doors | 2.5 | % | (0.3 | )% | |
| Change in average weekly sales per door | (2.0 | )% | 3.2 | % | |
Sales to grocers and mass merchants increased to $95.3 million in fiscal 2015 from $94.4 million in fiscal 2014, reflecting a 1.5% increase in the average number of doors served partially offset by a 0.3% decrease in average weekly sales per door. The increase in the average number of doors served in the grocery/mass merchant channel reflects growth in new doors at existing customers and an increase in doors resulting from the acquisition of stores in the Birmingham, Alabama market in the second quarter of fiscal 2015, partially offset by the refranchising of stores in the Kansas/Missouri and Dallas markets in fiscal 2014. Sales of packaged products comprise substantially all of the Company’s sales to grocers and mass merchants.
Convenience store sales increased slightly in fiscal 2015 compared to fiscal 2014, reflecting a 2.5% increase in the average number of doors served partially offset by a 2.0% decrease in average weekly sales per door. The majority of the door growth in fiscal 2015 reflects new doors at existing customers and the increase in doors resulting from the acquisition of stores in the Birmingham, Alabama market in the second quarter of fiscal 2015, partially offset by the refranchising of stores in the Kansas/Missouri and Dallas markets in fiscal 2014. Sales of loose unpackaged products comprise approximately 80% of sales to convenience store customers, with the balance comprised of sales of packaged products.
Costs and expenses
Total cost of sales as a percentage of revenues decreased by 0.7 percentage points from fiscal 2014 to 69.5% in fiscal 2015. The cost of food, beverage and packaging as percentage of sales fell 0.3 percentage points. An increase in on-premises sales, which typically have lower food costs compared to wholesale sales, as a percentage of total revenues, was largely offset by an increase in consumer promotional incentives that adversely affected margins.
Based upon current market forecasts and purchase and other contracts entered into by KK Supply Chain, the Company estimates its aggregate ingredient and packaging costs will be modestly lower in fiscal 2016 compared to fiscal 2015.
Vehicle costs as a percentage of revenues decreased from 5.6% of revenues in fiscal 2014 to 5.1% of revenues in fiscal 2015, principally reflecting lower fuel costs and a reduction in wholesale sales as a percentage of total Company Stores sales.
The Company entered into gasoline derivative positions during the fourth quarter of fiscal 2015 and had net losses of $1.2 million related to these derivative positions, of which approximately $937,000 relates to positions taken to fix, at least in part, the cost of gasoline in fiscal 2016 and 2017. The Company has not designated any of its derivative positions as cash flow hedges and accordingly, changes in the market value of those positions are reflected in earnings as they occur.
The Company is self-insured for workers’ compensation, vehicle and general liability claims, but maintains stop-loss coverage for individual claims exceeding certain amounts. The Company provides for claims under these self-insured programs using actuarial methods as described in Note 1 to the consolidated financial statements appearing elsewhere herein, and periodically updates actuarial valuations of its self-insurance reserves at least annually. Such periodic actuarial valuations result in changes over time in the estimated amounts which ultimately will be paid for claims under these programs to reflect the Company’s actual claims experience for each policy year as well as trends in claims experience over multiple years. Such claims, particularly workers’ compensation claims, often are paid over a number of years following the year in which the insured events occur, and the estimated ultimate cost of each year’s claims accordingly is adjusted over time as additional information becomes available. As a result of the periodic update of its actuarial valuation, the Company recorded favorable adjustments for changes in estimates to its self-insurance claims liabilities related to prior policy years of approximately $1.7 million in fiscal 2015, of which $940,000 was recorded in the fourth quarter, and $1.1 million in 2014, of which $520,000 was recorded in the fourth quarter. The $1.7 million in favorable adjustments recorded in fiscal 2015 includes a favorable adjustment relating to workers’ compensation liability claims of approximately $1.3 million included in employee benefits in the table above, a favorable adjustment relating to vehicle liability claims of approximately $250,000 included in vehicle costs, and a favorable adjustment relating to general liability claims of approximately $160,000 included in other operating costs. An additional $20,000 of favorable adjustments was recorded in other segments of the business. The $1.1 million in favorable adjustments recorded in fiscal 2014 includes a favorable adjustment relating to workers’ compensation liability claims of approximately $650,000, a favorable adjustment relating to vehicle liability claims of approximately $200,000, and a favorable adjustment relating to general liability claims of approximately $210,000. An additional $20,000 of favorable adjustments was recorded in other segments of the business.
44
Depreciation expense increased in fiscal 2015 compared to fiscal 2014 due to construction of new stores and store refurbishments at existing stores.
Pre-opening costs related to new stores (a portion of which relates to stores which had not yet opened at the end of fiscal 2015) increased approximately $2.0 million in fiscal 2015 compared to fiscal 2014 as a result of an increase in the number of stores opened during fiscal 2015 and expected to be opened in early fiscal 2016.
During fiscal 2015, the Company recorded charges of $431,000 related to the acquisition of the business and operating assets of its franchisee in Birmingham, Alabama as more fully described in Note 21 to the consolidated financial statements included elsewhere herein. The charges include $343,000 for the settlement as part of the acquisition of the pre-existing franchise contract between the Company and the franchisee, certain terms of which were unfavorable, from the Company’s point of view, to current market terms, and transaction costs related to the acquisition of $88,000.
During fiscal 2015, the Company refranchised its retail Krispy Kreme shop in Rockville, Maryland to a new franchisee as more fully described in Note 21 to the consolidated financial statements appearing elsewhere herein. The Company realized a gain of $1.2 million on this refranchising transaction.
During fiscal 2014, the Company refranchised three stores in the Dallas market to a new franchisee as more fully described in Note 21, and realized a gain of approximately $876,000 on this refranchising transaction.
Other store operating expenses increased to $25.1 million (7.7% of revenues) in fiscal 2015 from $20.5 million (6.7% of revenues) in fiscal 2014. The increase reflects, among other things, approximately $700,000 related to redesigned apparel distributed to both on-premises and wholesale personnel at all Company shops during the third quarter of fiscal 2015 and higher marketing and promotional costs. Additionally, during fiscal 2014, the Company realized net gains of approximately $190,000 on the disposal of property and equipment, principally reflecting the disposal of a closed store, which is included in other store operating expense, compared to net losses of $220,000 on the disposal of property and equipment in fiscal 2015.
Other segment operating expense decreased in fiscal 2015 to 4.1% of revenues from 4.5% of revenues in fiscal 2014. In fiscal 2014, other segment operating expenses included approximately $790,000 in legal costs related to the litigation associated with the Company’s former landlord in Lorton, Virginia which was settled in the fourth quarter of fiscal 2014.
Many segment operating costs are fixed or semi-fixed in nature and, accordingly, segment profit margins are sensitive to changes in sales volumes.
The Patient Protection and Affordable Care Act (the “Act”) requires large employers to offer health care benefits to all full-time employees, or face financial penalties, generally beginning in January 2015. To avoid these penalties, the health benefits must provide a specified “minimum value” and be “affordable,” each as defined in the Act. Management estimates that its incremental cost in fiscal 2016 compared to fiscal 2015 of complying with provisions of the Act will be approximately $2 million.
45
Domestic Franchise
| Year Ended | |||||||
| February 1, | February 2, | ||||||
| 2015 | 2014 | ||||||
| (In thousands) | |||||||
| Revenues: | |||||||
| Royalties | $ | 11,937 | $ | 10,934 | |||
| Development and franchise fees | 525 | 313 | |||||
| Other | 988 | 592 | |||||
| Total revenues | 13,450 | 11,839 | |||||
| Operating expenses: | |||||||
| Segment operating expenses | 4,850 | 4,904 | |||||
| Gain on sale of assets to franchisees | (38 | ) | (1,667 | ) | |||
| Depreciation expense | 135 | 119 | |||||
| Allocated corporate overhead | 400 | 400 | |||||
| Total operating expenses | 5,347 | 3,756 | |||||
| Segment operating income | $ | 8,103 | $ | 8,083 | |||
| Segment operating margin | 60.2 | % | 68.3 | % | |||
Domestic Franchise revenues rose 13.6% to $13.5 million in fiscal 2015 from $11.8 million in fiscal 2014. The increase reflects higher domestic royalties resulting from a 6.0% increase in sales by domestic franchise stores from $318 million in fiscal 2014 to $337 million in fiscal 2015. Domestic Franchise same store sales rose 4.2% in fiscal 2015. The increase also reflects higher development and franchise fees resulting from an increase in store openings. Certain franchisees’ license agreements provide that the franchisees may develop, with the Company’s consent, additional Krispy Kreme shops within the franchise territory without payment of initial franchise or development fees. Accordingly, some shop openings by domestic franchisees do not result in the recognition of such fees.
The increase in other Domestic Franchise revenues reflects revenue from the licensing of certain Krispy Kreme trademarks to third parties for use in marketing Krispy Kreme branded beverages. The Company first entered into such licensing agreements in fiscal 2014 and intends to expand licensing of its brand to additional products. The increase in other revenues also reflects rents charged to two franchisees for stores leased or subleased to the franchisees in connection with the Kansas/Missouri and Dallas refranchising transactions in the first and second quarters of fiscal 2014, respectively, and rents charged to another franchisee in connection with the Company’s acquisition of the land, building and doughnut-making equipment at a facility in Illinois in December 2013 as more fully described in Note 21 to the consolidated financial statements appearing elsewhere herein. The Company assumed operation of the Illinois facility for its own account in July 2014. The Company’s Dallas franchisee exercised its option to purchase the two stores leased to it by the Company during the third quarter of fiscal 2015 as described below.
Domestic Franchise segment operating expenses include costs to recruit new domestic franchisees, to assist in domestic store openings, and to monitor and aid in the performance of domestic franchise stores, as well as allocated corporate costs. Domestic Franchise operating expenses in fiscal 2015 reflect increased costs associated with the execution of the Company’s domestic franchise expansion program offset by a decrease in provisions for incentive compensation in fiscal 2015 compared to fiscal 2014.
Domestic Franchise operating expenses include gains of $38,000 in fiscal 2015 and $1.7 million in fiscal 2014 related to the sale of assets to franchisees. In the third quarter of fiscal 2015, a franchisee exercised its option to acquire the two stores it leased from the Company in connection with the Dallas refranchising transaction in fiscal 2014 for an aggregate purchase price of $2.1 million cash; the Company realized a gain of $38,000 on the closing of the transaction. The $1.7 million gain in fiscal 2014 relates to the sale of leasehold interests to a franchisee that occurred in September 2012. Recognition of such gain previously was deferred because the franchisee’s initial and continuing investment was less than the 20% of the purchase price required by GAAP to permit recognition of a gain on the transaction. In the third quarter of fiscal 2014, the franchisee’s initial and continuing investment first exceeded 20% of the purchase price and, accordingly, the Company recognized the previously deferred gain as described in Note 21 to the consolidated financial statements appearing elsewhere herein.
Domestic franchisees opened 15 stores and closed 3 stores in fiscal 2015. As of February 1, 2015, development agreements for territories in the United States provide for the development of 129 additional stores through fiscal 2022. Royalty revenues are directly related to sales by franchise stores and, accordingly, the success of franchisees’ operations has a direct effect on the Company’s revenues, results of operations and cash flows.
46
| International Franchise | |||||||
| Year Ended | |||||||
| February 1, | February 2, | ||||||
| 2015 | 2014 | ||||||
| (In thousands) | |||||||
| Revenues: | |||||||
| Royalties | $ | 26,550 | $ | 24,139 | |||
| Development and franchise fees | 2,048 | 1,468 | |||||
| Total revenues | 28,598 | 25,607 | |||||
| Operating expenses: | |||||||
| Segment operating expenses | 7,367 | 6,423 | |||||
| Depreciation expense | 5 | 7 | |||||
| Allocated corporate overhead | 1,200 | 1,200 | |||||
| Total operating expenses | 8,572 | 7,630 | |||||
| Segment operating income | $ | 20,026 | $ | 17,977 | |||
| Segment operating margin | 70.0 | % | 70.2 | % | |||
International Franchise royalties rose 10.0% to $26.6 million in fiscal 2015, driven by an 8.8% increase in sales by international franchisees from $438 million in fiscal 2014 to $476 million in fiscal 2015. Changes in the rates of exchange between the U.S. dollar and the foreign currencies in which the Company’s international franchisees do business decreased sales by international franchisees measured in U.S. dollars by approximately $10.1 million in fiscal 2015 compared to fiscal 2014, which adversely affected international royalty revenues by approximately $600,000. Excluding the effects of exchange rates, sales by international franchisees rose 11.1%. The Company recognized royalty revenue of approximately $900,000 and $380,000 collected during fiscal 2015 and 2014, respectively, related to franchisee sales in prior periods which had not previously been recorded as revenue due to the uncertainty surrounding the collection of these royalties. Substantially all of the amounts relate to a single franchisee and were received in the second quarter of each year. There is no prescribed repayment schedule for the remaining $1.9 million owed to the Company by the franchisee and the Company therefore cannot predict the amount or timing of future payments, if any, on this obligation. Accordingly, the Company has not recognized such amount in the financial statements.
International Franchise same store sales, measured on a constant currency basis to eliminate the effects of changing exchange rates between foreign currencies and the U.S. dollar (“constant dollar same store sales”), fell 2.6%. The decline in International Franchise same store sales reflects, among other things, the normal cannibalization effects on initial stores in new markets of additional store openings in those markets.
Constant dollar same store sales in established markets fell 0.5% in fiscal 2015 and fell 4.7% in new markets. “Established markets” means countries in which the first Krispy Kreme store opened before fiscal 2007. Sales at stores in established markets comprised approximately 53% of aggregate constant dollar same store sales for fiscal 2015. While the Company considers countries in which Krispy Kreme first opened stores before fiscal 2007 to be established markets, franchisees in those markets continue to develop their business. Of the 671 international shops currently in operation that opened since the beginning of fiscal 2007, 282 shops are in these established markets.
International Franchise operating expenses include costs to recruit new international franchisees, to assist in international store openings, and to monitor and aid in the performance of international franchise stores, as well as allocated corporate costs. International Franchise operating expenses increased to $7.4 million in fiscal 2015 from $6.4 million fiscal 2014, principally reflecting higher personnel and personnel-related costs and other costs to support continuing and anticipated international growth. In addition operating expenses in fiscal 2015 include a provision for potential uncollectible accounts of approximately $220,000 principally related to two franchisees, compared to a net credit in bad debt expense of approximately $180,000 in fiscal 2014 resulting principally from recoveries of accounts previously written-off. These increases were partially offset by a decrease of approximately $420,000 in provisions for incentive compensation in fiscal 2015 compared to fiscal 2014.
International franchisees opened 151 stores and closed 16 stores in fiscal 2015. As of February 1, 2015, development and franchise agreements for territories outside the United States provide for the development of 304 additional stores through fiscal 2021. Royalty revenues are directly related to sales by franchise stores and, accordingly, the success of franchisees’ operations has a direct effect on the Company’s revenues, results of operations and cash flows.
47
KK Supply Chain
The components of KK Supply Chain revenues and expenses (expressed in dollars and as a percentage of total revenues before intersegment sales elimination) are set forth in the following table (percentage amounts may not add to totals due to rounding).
| Percentage of Total Revenues | ||||||||||||
| Before Intersegment | ||||||||||||
| Sales Elimination | ||||||||||||
| Year Ended | Year Ended | |||||||||||
| February 1, | February 2, | February 1, | February 2, | |||||||||
| 2015 | 2014 | 2015 | 2014 | |||||||||
| (In thousands) | ||||||||||||
| Revenues: | ||||||||||||
| Doughnut mixes | $ | 83,554 | $ | 80,773 | 34.1 | % | 34.9 | % | ||||
| Other ingredients, packaging and supplies | 144,290 | 135,674 | 59.0 | 58.7 | ||||||||
| Equipment | 14,180 | 11,928 | 5.8 | 5.2 | ||||||||
| Fuel surcharge | 2,664 | 2,854 | 1.1 | 1.2 | ||||||||
| Total revenues before intersegment sales elimination | 244,688 | 231,229 | 100.0 | 100.0 | ||||||||
| Operating expenses: | ||||||||||||
| Cost of sales: | ||||||||||||
| Cost of goods produced and purchased | 166,440 | 157,897 | 68.0 | 68.3 | ||||||||
| (Gain) loss on agricultural derivatives | 903 | 1,459 | 0.4 | 0.6 | ||||||||
| Inbound freight | 7,054 | 6,570 | 2.9 | 2.8 | ||||||||
| Total cost of sales | 174,397 | 165,926 | 71.3 | 71.8 | ||||||||
| Distribution costs | 14,893 | 14,326 | 6.1 | 6.2 | ||||||||
| Other segment operating costs | 11,698 | 12,137 | 4.8 | 5.2 | ||||||||
| Depreciation expense | 677 | 687 | 0.3 | 0.3 | ||||||||
| Allocated corporate overhead | 1,200 | 1,200 | 0.5 | 0.5 | ||||||||
| Total operating costs | 202,865 | 194,276 | 82.9 | 84.0 | ||||||||
| Segment operating income | $ | 41,823 | $ | 36,953 | 17.1 | % | 16.0 | % | ||||
KK Supply Chain revenues before intersegment sales eliminations rose 5.8% to $244.7 million in fiscal 2015 from $231.2 million in fiscal 2014.
Sales of doughnut mixes rose 3.4% in fiscal 2015 due to higher unit volumes partially offset by slightly lower selling prices.
Sales of other ingredients, packaging and supplies, made principally to Company and Domestic Franchise stores, rose 6.4% in fiscal 2015 due to higher unit volumes partially offset by slightly lower selling prices.
Equipment sales rose to $14.2 million in fiscal 2015 from $11.9 million principally due to increased store openings.
KK Supply Chain utilizes a fuel surcharge program. Charges under the program are based upon the excess, if any, of the price of diesel fuel over a pre-established base level, with the base level generally adjusted annually.
KK Supply Chain revenues were derived from the following customers:
| Year Ended | |||||
| February 1, | February 2, | ||||
| 2015 | 2014 | ||||
| (In thousands) | |||||
| Revenues: | |||||
| Company Stores | $ | 121,708 | $ | 115,169 | |
| Domestic Franchise shops | 99,026 | 93,179 | |||
| International Franchise shops | 22,935 | 21,981 | |||
| Other | 1,019 | 900 | |||
| Total revenues before intersegment sales elimination | $ | 244,688 | $ | 231,229 | |
48
KK Supply Chain cost of sales decreased 0.5 percentage points to 71.3% of revenues in fiscal 2015 compared to 71.8% in fiscal 2014. KK Supply Chain had net losses on agricultural derivative positions of $903,000 in fiscal 2015 compared to net losses of $1.5 million in fiscal 2014. The Company has not designated any of its derivative positions as cash flow hedges and accordingly, changes in the market value of those positions are reflected in earnings as they occur.
Other segment operating costs include segment management, purchasing, customer service and support, laboratory and quality control costs, and research and development expenses. These costs as a percentage of revenues declined by 0.4 percentage points to 4.8% in the in fiscal 2015, principally reflecting lower provisions for incentive compensation of approximately $570,000 in fiscal 2015 compared to the prior year.
Franchisees opened 166 stores and closed 19 stores in fiscal 2015. A substantial portion of KK Supply Chain’s revenues are directly related to sales by franchise stores and, accordingly, the success of franchisees’ operations has a direct effect on the Company’s revenues, results of operations and cash flows.
A significant portion of franchise store sales is attributable to sales by franchisees outside the United States. The Company sells doughnut mixes, either manufactured by the Company in the United States or blended by contract mix manufacturers using concentrates supplied by the Company, to all its international franchisees. Most of these franchisees purchase substantially all other ingredients, packaging and supplies through sourcing arrangements approved by the Company. Accordingly, KK Supply Chain revenues are less correlated with sales by international franchisees than with sales by domestic franchisees, which purchase substantially all of their ingredients from KK Supply Chain. Like all international businesses, the Company and its international franchisees must address the risks of international trade, including taxes, tariffs, duties and transportation costs, which can affect the franchisees’ product costs and therefore indirectly affect the pace of development. The Company, in cooperation with its international franchisees, continually seeks to mitigate the impact of these factors. For example, the Company has developed premix and concentrate doughnut mix production models, and has been continuously pursuing alternative sourcing arrangements in various markets.
General and Administrative Expenses
General and administrative expenses consist of costs incurred in various functional areas whose activities are not associated exclusively with an individual business segment. Such costs include expenses associated with finance and accounting; internal and external financial reporting, including financial planning and analysis; internal audit; human resources; risk management; information technology; training; corporate office occupancy; public company costs; and executive management. Certain personnel and other costs in some of these functional areas (for example, some of the costs of information technology and human resources) are associated primarily with the operation of individual business segments, and are allocated to those segments as allocated corporate costs. General and administrative expenses in the consolidated statement of income are presented net of such allocated costs, which are reflected in the results of operations of the four operating segments. Such allocated costs totaled $7.1 million in fiscal 2015 and 2014, respectively.
General and administrative expenses increased to $28.6 million in fiscal 2015 from $25.1 million in fiscal 2014, and as a percentage of sales increased to 5.8% from 5.5%.
General and administrative expenses in fiscal 2015 reflect a $2.5 million charge for the settlement of amounts due under an employment agreement with the Company’s former chief executive officer and an increase in executive compensation costs related to the transition to a new chief executive officer. General and administrative expenses also include costs of approximately $2.8 million and $820,000 in fiscal 2015 and 2014, respectively, related to the implementation of a new enterprise resource planning system. These higher general and administrative expenses were partially offset by a decrease in provisions for incentive compensation of approximately $680,000 in fiscal 2015 compared to fiscal 2014, and a decrease in share-based compensation costs of approximately $1.6 million resulting, in part, from a change in the timing of granting equity awards.
Impairment Charges and Lease Termination Costs
Impairment charges and lease termination costs were $955,000 in fiscal 2015 compared to $1.4 million in fiscal 2014. The components of these charges are set forth in the following table:
| Year Ended | |||||
| February 1, | February 2, | ||||
| 2015 | 2014 | ||||
| (In thousands) | |||||
| Impairment of long-lived assets | $ | 901 | $ | - | |
| Lease termination costs | 54 | 1,374 | |||
| $ | 955 | $ | 1,374 | ||
49
The Company tests long-lived assets for impairment when events or changes in circumstances indicate that their carrying value may not be recoverable. These events and changes in circumstances include store closing and refranchising decisions, the effects of changing costs on current results of operations, observed trends in operating results, and evidence of changed circumstances observed as a part of periodic reforecasts of future operating results and as part of the Company’s annual budgeting process. Impairment charges generally relate to Company stores expected to be closed or refranchised, as well as to stores management believes will not generate sufficient future cash flows to enable the Company to recover the carrying value of the stores’ assets, but which management has not yet decided to close. When the Company concludes that the carrying value of long-lived assets is not recoverable (based on future projected undiscounted cash flows), the Company records impairment charges to reduce the carrying value of those assets to their estimated fair values. The fair values of these assets are estimated based on the present value of estimated future cash flows, on independent appraisals and, in the case of assets the Company currently is negotiating to sell, based on the Company’s negotiations with unrelated third-party buyers.
Impairment charges related to Company Stores long-lived assets were $901,000 in fiscal 2015. Such charges relate to an underperforming store which management believed would not generate sufficient future cash flows to enable the Company to recover the carrying value of the stores’ assets, but which management had not yet decided to close. The store’s impaired assets consist of a building constructed on leased land and certain other equipment.
Lease termination costs represent the estimated fair value of liabilities related to unexpired leases, after reduction by the amount of accrued rent expense, if any, related to the leases, and are recorded when the lease contracts are terminated or, if earlier, the date on which the Company ceases use of the leased property. The fair value of these liabilities were estimated as the excess, if any, of the contractual payments required under the unexpired leases over the current market lease rates for the properties, discounted at a credit-adjusted risk-free rate over the remaining term of the leases. The provision for lease termination costs also includes adjustments to liabilities recorded in prior periods arising from changes in estimated sublease rentals and from settlements with landlords.
In November 2013, the Fairfax County court entered a judgment against the Company in its dispute with a former landlord in Lorton, Virginia. The Company subsequently agreed to settle the matter, and the Company recorded an additional lease termination charge of approximately $1.4 million in fiscal 2014 related to the resolution of the matter.
The Company may refranchise certain geographic markets, potentially including, but not necessarily limited to, markets outside the Company’s traditional base in the southeastern United States. The franchise rights and other assets in many of these markets were acquired by the Company in business combinations in prior years.
From fiscal 2009 through fiscal 2015, the Company refranchised a total of 18 stores and received consideration totaling $6.1 million in connection with those transactions. During this period, the Company recorded impairment charges totaling approximately $490,000 related to certain completed and anticipated refranchisings, but also realized gains of approximately $2.1 million related to other refranchising transactions, of which $1.2 million was recorded in fiscal 2015 and is reflected as a reduction in the Company Stores segment’s operating expenses.
The Company cannot predict the likelihood of refranchising any additional stores or markets or the amount of proceeds, if any, which might be received therefrom, including the amounts which might be realized from the sale of store assets and the execution of any related franchise agreements. Asset dispositions associated with future refranchisings could result in the recognition of impairment losses on the related assets.
Interest Income
Interest income decreased to $406,000 in fiscal 2015 from $616,000 in fiscal 2014. Interest income in fiscal 2014 included $250,000 of previously unrecognized interest income on a note received from a franchisee as part of the consideration for its purchase of leasehold interests from the Company, of which $70,000 accrued in fiscal 2013 and was previously recorded as a reduction in the carrying value of the note as described in Note 21 to the consolidated financial statements appearing elsewhere herein. In addition, interest income includes $112,500 and $87,500 received in fiscal 2015 and 2014, respectively, from notes receivable from equity method franchisees Kremeworks and Kremeworks Canada, which are fully reserved or which were written off in earlier years as described in Note 7.
50
Interest Expense
The components of interest expense are as follows:
| Year Ended | ||||||
| February 1, | February 2, | |||||
| 2015 | 2014 | |||||
| (In thousands) | ||||||
| Interest accruing on outstanding term loan indebtedness | $ | - | $ | 259 | ||
| Letter of credit and unused revolver fees | 159 | 217 | ||||
| Amortization of cost of interest rate derivative | - | 39 | ||||
| Amortization of deferred financing costs | 108 | 285 | ||||
| Other (including interest on lease obligations) | 589 | 257 | ||||
| $ | 856 | $ | 1,057 | |||
On July 12, 2013, the Company retired its secured credit facilities and repaid the $21.7 million remaining balance of its term loan as described in Note 11 to the consolidated financial statements appearing elsewhere herein.
Loss on Retirement of Debt
The Company recorded a charge of $967,000 in fiscal 2014 on the retirement of its secured credit facilities, consisting of a $451,000 write-off of unamortized deferred financing costs related principally to the Company’s term loan, which was retired in full, and a $516,000 write-off related to the termination of an interest rate hedge related to the term loan. The $516,000 charge related to the interest rate hedge was reclassified from accumulated other comprehensive income to “Loss on retirement of debt” in the consolidated statement of income because the hedged forecasted transaction (interest on the term loan) would not occur.
Equity in Income (Losses) of Equity Method Franchisees
The Company recorded equity in the losses of equity method franchisees of $118,000 in fiscal 2015 compared to losses of $221,000 in fiscal 2014. This caption represents the Company’s share of operating results of equity method franchisees which develop and operate Krispy Kreme stores.
Other Non-Operating Income and (Expense), Net
Other non-operating income and (expense), net includes payments of approximately $550,000 and $95,000 in fiscal 2015 and 2014, respectively, received from an equity method franchisee in reimbursement for amounts paid by the Company in fiscal 2014 pursuant to the Company’s guarantee of the investee’s indebtedness. As more fully described in Note 7 to the consolidated financial statements appearing elsewhere herein, in November 2013, following the lender’s demand for payment of the loan, which had matured in by its terms in October 2009, the Company made a loan of approximately $1.6 million to the franchisee, the proceeds of which the franchisee used to retire the debt. Such amount was charged against the guarantee accrual, and the remaining balance of the accrual of approximately $30,000 was credited to other non-operating income and (expense), net. Repayments on the loan are being reflected in income as received due to the uncertainty of their continued collection.
Provision for Income Taxes
The provision for income taxes was $18.2 million in fiscal 2015 and $10.8 million in fiscal 2014. The Company’s effective income tax rate was 37.7% compared to 24.0%.
The Company establishes valuation allowances for deferred tax assets in accordance with GAAP, which provides that such valuation allowances shall be established unless realization of the deferred tax assets is more likely than not. Realization of net deferred tax assets generally is dependent on generation of taxable income in future periods.
In the fourth quarter of fiscal 2014, after considering all relevant factors and objectively verifiable evidence having an impact on the likelihood of future realization of the Company’s deferred tax assets, management concluded that it was more likely than not that deferred tax assets would be realized in future years in excess of amounts previously estimated. Accordingly, the Company reversed $4.3 million of the valuation allowance on deferred tax assets, with an offsetting credit to the provision for income taxes. The deferred tax assets with respect to which management concluded that a valuation allowance was no longer required related principally to state income tax net operating loss carryovers.
51
Also in the fourth quarter of fiscal 2014, the Company concluded that certain foreign tax credit carryovers which management previously forecasted would be deducted from future taxable income rather than being taken as a credit against future income taxes payable, would ultimately be taken as a credit rather than as a deduction. This increase in management’s estimate of the amount of tax benefits to be realized from the credit carryovers was reflected as a credit to income tax expense in the fourth quarter of fiscal 2014. The change in estimate with respect to foreign tax credit carryovers generated in prior years was $4.5 million. The change in estimate with respect to the $2.3 million of foreign taxes paid in fiscal 2014 was approximately $1.5 million.
The aggregate credit to income tax expense in the fourth quarter of fiscal 2014 from the reduction in management’s estimate of the necessary valuation allowance, and the increase in the aggregate amount of tax benefits expected to be realized from the foreign tax credit carryovers, was $10.3 million. Of this amount, $8.8 million represents the effect of fourth quarter changes in estimates related to tax assets arising in prior years, which reduced the effective income tax rate for fiscal 2014 by approximately 20 percentage points. All of both adjustments resulted from an increase in the fourth quarter of fiscal 2014 in management’s estimate of the amount of annual pretax income to be earned in future periods.
In the second quarter of fiscal 2014, the North Carolina state legislature enacted a prospective reduction in the corporate income tax rate, which caused the Company to revalue its deferred income tax assets to reflect the lower income tax rate. Such revaluation reduced the Company’s deferred tax assets by approximately $1.0 million. Because a portion of the deferred tax assets were already subject to a valuation allowance, the revaluation of the assets resulted in a reduction in the necessary valuation allowance of approximately $314,000. The effect of the legislation was therefore to reduce the Company’s net deferred tax assets by $686,000.
In addition to adjustments to the valuation allowance on deferred tax assets, the provision for income taxes includes amounts estimated to be payable or refundable currently. The portion of the income tax provision representing taxes estimated to be payable currently was approximately $2.4 million and $2.8 million in fiscal 2015 and fiscal 2014, respectively, the majority of which represents foreign withholding taxes related to royalties and franchise fees paid by international franchisees.
Net Income
The Company reported net income of $30.1 million for fiscal 2015 compared to $34.3 million for fiscal 2014.
52
FISCAL 2014 COMPARED TO FISCAL 2013
Matters Affecting Comparability
The Company’s fiscal year ends on the Sunday closest to January 31, which periodically results in a 53-week year. The year ended February 2, 2014 included 52 weeks, compared to 53 weeks for the year ended February 3, 2013. Accordingly, financial results for fiscal 2014 are not directly comparable to those for fiscal 2013.
In the second quarter of fiscal 2014, the Company recorded a charge of $967,000 related to the retirement of its secured credit facilities, consisting principally of the write off of deferred financing costs related to the Company’s term loan, which was retired in full, and the termination of an interest rate hedge related to the term loan. Charges of this nature are not expected to recur on a regular basis. Accordingly, financial results for fiscal 2014 are not directly comparable to those for fiscal 2013.
Non-GAAP Measures
The Company has substantial net operating loss carryforwards and, accordingly, the Company’s cash payments for income taxes are not significant and are expected to remain insignificant for the next three to five years. See “Provision for Income Taxes” below, and Note 16 to the consolidated financial statements appearing elsewhere herein.
Management evaluates the Company’s results of operations using, among other measures, adjusted net income and adjusted earnings per share, which include the provision for income taxes only to the extent such taxes are currently payable in cash. In addition, management excludes from adjusted net income charges and credits that are unusual and infrequently occurring. Management believes adjusted net income and adjusted earnings per share are useful performance measures because they more closely measure the cash flows generated by the Company’s operations and the trends in those cash flows than do GAAP net income and earnings per share, and because they exclude the effects of transactions that are not indicative of the Company’s ongoing results of operations.
Adjusted net income and adjusted earnings per share are non-GAAP measures.
The following presentation of adjusted net income, the related reconciliation of adjusted net income to GAAP net income, and the presentation of adjusted earnings per share are intended to facilitate comparisons of fiscal 2014 results with the Company’s results for fiscal 2013 in light of the effects of the matters discussed under “Matters Affecting Comparability” above, and to illustrate the material difference between the Company’s income tax expense and income taxes currently payable. These non-GAAP performance measures are consistent with other measurements made by management in the operation of the business which do not consider income taxes except to the extent to which those taxes currently are payable, for example, capital allocation decisions and incentive compensation measurements that are made on a pretax basis.
| Year Ended | |||||||
| February 2, | February 3, | ||||||
| 2014 | 2013 | ||||||
| (In thousands, except per share | |||||||
| amounts) | |||||||
| Net income, as reported | $ | 34,256 | $ | 20,779 | |||
| Loss on retirement of debt | 967 | - | |||||
| Provision for deferred income taxes | 8,014 | 13,413 | |||||
| Adjusted net income | 43,237 | 34,192 | |||||
| Earnings for the 53rd week | - | (1,273 | ) | ||||
| Adjusted net income - 52 week basis | $ | 43,237 | $ | 32,919 | |||
| Adjusted earnings per common share: | |||||||
| Basic | $ | 0.64 | $ | 0.51 | |||
| Diluted | $ | 0.61 | $ | 0.49 | |||
| Adjusted earnings per common share - 52 week basis: | |||||||
| Basic | $ | 0.64 | $ | 0.49 | |||
| Diluted | $ | 0.61 | $ | 0.47 | |||
| Weighted average shares outstanding: | |||||||
| Basic | 67,261 | 67,624 | |||||
| Diluted | 71,054 | 69,896 | |||||
53
Overview
Total revenues rose to $460.3 million in fiscal 2014 compared to $435.8 million in fiscal 2013. Excluding the 53rd week in fiscal 2013, total revenues rose 7.9% from $426.8 million.
Consolidated operating income increased to $46.6 million in fiscal 2014 from $37.7 million in fiscal 2013 (of which approximately $1.3 million relates to the 53rd week). Consolidated net income was $34.3 million compared to $20.8 million. Consolidated net income in fiscal 2014 reflects an $8.8 million credit in the provision for income taxes resulting from an increase in management’s estimate of annual pretax income to be earned in future years, as described in Note 16 to the consolidated financial statements appearing elsewhere herein. See also “Matters Affecting Comparability” above.
54
Revenues by business segment (expressed in dollars and as a percentage of total revenues) and operating income by business segment are set forth in the following table (percentage amounts may not add to totals due to rounding).
| Year Ended | ||||||||
| February 2, | February 3, | |||||||
| 2014 | 2013 | |||||||
| (Dollars in thousands) | ||||||||
| Revenues by business segment: | ||||||||
| Company Stores | $ | 306,825 | $ | 296,494 | ||||
| Domestic Franchise | 11,839 | 10,325 | ||||||
| International Franchise | 25,607 | 24,941 | ||||||
| KK Supply Chain: | ||||||||
| Total revenues | 231,229 | 215,412 | ||||||
| Less - intersegment sales elimination | (115,169 | ) | (111,329 | ) | ||||
| External KK Supply Chain revenues | 116,060 | 104,083 | ||||||
| Total revenues | $ | 460,331 | $ | 435,843 | ||||
| Segment revenues as a percentage of total revenues: | ||||||||
| Company Stores | 66.7 | % | 68.0 | % | ||||
| Domestic Franchise | 2.6 | 2.4 | ||||||
| International Franchise | 5.6 | 5.7 | ||||||
| KK Supply Chain (external sales) | 25.2 | 23.9 | ||||||
| 100.0 | % | 100.0 | % | |||||
| Operating income (loss): | ||||||||
| Company Stores | $ | 11,334 | $ | 8,534 | ||||
| Domestic Franchise | 8,083 | 5,590 | ||||||
| International Franchise | 17,977 | 17,387 | ||||||
| KK Supply Chain | 36,953 | 32,450 | ||||||
| Total segment operating income | 74,347 | 63,961 | ||||||
| General and administrative expenses | (25,149 | ) | (25,089 | ) | ||||
| Corporate depreciation and amortization expense | (1,254 | ) | (837 | ) | ||||
| Impairment charges and lease termination costs | (1,374 | ) | (306 | ) | ||||
| Consolidated operating income | 46,570 | 37,729 | ||||||
| Interest income | 616 | 114 | ||||||
| Interest expense | (1,057 | ) | (1,642 | ) | ||||
| Loss on retirement of debt | (967 | ) | - | |||||
| Equity in losses of equity method franchisees | (221 | ) | (202 | ) | ||||
| Other non-operating income and (expense), net | 119 | 317 | ||||||
| Income before income taxes | 45,060 | 36,316 | ||||||
| Provision for income taxes | 10,804 | 15,537 | ||||||
| Net income | $ | 34,256 | $ | 20,779 | ||||
A discussion of the revenues and operating results of each of the Company’s four business segments follows, together with a discussion of income statement line items not associated with specific segments.
55
Company Stores
The components of Company Stores revenues and expenses (expressed in dollars and as a percentage of total revenues) are set forth in the following table (percentage amounts may not add to totals due to rounding).
| Percentage of Total Revenues | |||||||||||||
| Year Ended | Year Ended | ||||||||||||
| February 2, | February 3, | February 2, | February 3, | ||||||||||
| 2014 | 2013 | 2014 | 2013 | ||||||||||
| (In thousands) | |||||||||||||
| Revenues: | |||||||||||||
| On-premises sales: | |||||||||||||
| Retail sales | $ | 136,921 | $ | 127,989 | 44.6 | % | 43.2 | % | |||||
| Fundraising sales | 14,591 | 14,929 | 4.8 | 5.0 | |||||||||
| Total on-premises sales | 151,512 | 142,918 | 49.4 | 48.2 | |||||||||
| Wholesale sales: | |||||||||||||
| Grocers/mass merchants | 94,352 | 93,384 | 30.8 | 31.5 | |||||||||
| Convenience stores | 57,390 | 56,972 | 18.7 | 19.2 | |||||||||
| Other wholesale | 3,571 | 3,220 | 1.2 | 1.1 | |||||||||
| Total wholesale sales | 155,313 | 153,576 | 50.6 | 51.8 | |||||||||
| Total revenues | 306,825 | 296,494 | 100.0 | 100.0 | |||||||||
| Operating expenses: | |||||||||||||
| Cost of sales: | |||||||||||||
| Food, beverage and packaging | 115,623 | 111,205 | 37.7 | 37.5 | |||||||||
| Shop labor | 54,270 | 53,210 | 17.7 | 17.9 | |||||||||
| Delivery labor | 24,280 | 24,222 | 7.9 | 8.2 | |||||||||
| Employee benefits | 21,259 | 20,889 | 6.9 | 7.0 | |||||||||
| Total cost of sales | 215,432 | 209,526 | 70.2 | 70.7 | |||||||||
| Vehicle costs(1) | 17,135 | 17,336 | 5.6 | 5.8 | |||||||||
| Occupancy(2) | 9,752 | 9,805 | 3.2 | 3.3 | |||||||||
| Utilities expense | 5,876 | 5,993 | 1.9 | 2.0 | |||||||||
| Pre-opening costs | 563 | 400 | 0.2 | 0.1 | |||||||||
| Depreciation expense | 9,039 | 8,142 | 2.9 | 2.7 | |||||||||
| Gain on refranchising | (876 | ) | - | (0.3 | ) | - | |||||||
| Other operating expenses | 20,486 | 20,125 | 6.7 | 6.8 | |||||||||
| Total store level costs | 277,407 | 271,327 | 90.4 | 91.5 | |||||||||
| Store operating income | 29,418 | 25,167 | 9.6 | 8.5 | |||||||||
| Other segment operating costs(3) | 13,784 | 12,333 | 4.5 | 4.2 | |||||||||
| Allocated corporate overhead | 4,300 | 4,300 | 1.4 | 1.5 | |||||||||
| Segment operating income | $ | 11,334 | $ | 8,534 | 3.7 | % | 2.9 | % | |||||
(1) Includes fuel,
maintenance and repairs, rent, taxes and other costs of operating the delivery
fleet, exclusive of depreciation.
(2) Includes rent, property taxes, common area maintenance charges,
insurance, building maintenance and other occupancy costs, exclusive of
utilities and depreciation.
(3)
Includes marketing costs not charged to stores, segment management costs,
wholesale selling expenses and support functions.
A reconciliation of Company Stores segment sales from fiscal 2013 to fiscal 2014 follows:
| On-Premises | Wholesale | Total | ||||||||||
| (In thousands) | ||||||||||||
| Sales for the year ended February 3, 2013 | $ | 142,918 | $ | 153,576 | $ | 296,494 | ||||||
| Fiscal 2013 sales at closed stores | (3,580 | ) | (2,630 | ) | (6,210 | ) | ||||||
| Fiscal 2013 sales at stores refranchised in fiscal 2014 | (7,554 | ) | (7,811 | ) | (15,365 | ) | ||||||
| Fiscal 2014 sales at closed stores | 1,408 | 892 | 2,300 | |||||||||
| Fiscal 2014 sales at stores refranchised in fiscal 2014 | 2,075 | 1,715 | 3,790 | |||||||||
| Increase in sales at established stores (open stores only) | 4,844 | 8,405 | 13,249 | |||||||||
| Increase in sales at stores opened in fiscal 2013 | 4,038 | - | 4,038 | |||||||||
| Increase in sales at stores acquired in fiscal 2013 | 1,549 | 1,166 | 2,715 | |||||||||
| Sales at stores opened in fiscal 2014 | 5,814 | - | 5,814 | |||||||||
| Sales for the year ended February 2, 2014 | $ | 151,512 | $ | 155,313 | $ | 306,825 | ||||||
56
Sales at Company Stores increased 3.5% to $306.8 million in fiscal 2014 from $296.5 million in fiscal 2013. Excluding the 53rd week from fiscal 2013, sales increased 5.7%.
The following table presents sales metrics for Company stores:
| 52 Weeks Ended | ||||||||
| February 2, | January 27, | |||||||
| 2014 | 2013 | |||||||
| On-premises: | ||||||||
| Change in same store sales | 7.4 | % | 5.9 | % | ||||
| Change in same store customer count (retail sales only) | 5.3 | % | 7.6 | % | ||||
| Average guest check (retail sales only) | $ | 7.47 | $ | 7.29 | ||||
On-premises sales
On-premises sales increased 6.0% to $151.5 million in fiscal 2014 from $142.9 million in fiscal 2013. Excluding the 53rd week from fiscal 2013, on-premises sales increased 8.4%. The increases were driven principally by a combination of higher customer traffic and price increases.
The components of the change in same store sales at Company stores are as follows:
| 52 Weeks Ended | ||||||
| February 2, | January 27, | |||||
| 2014 | 2013 | |||||
| Change in same store sales attributable to: | ||||||
| Retail menu pricing | 3.4 | % | 0.7 | % | ||
| Guest check average (exclusive of the effects of menu pricing) | (0.9 | ) | (1.4 | ) | ||
| Customer count | 4.7 | 6.6 | ||||
| Other | 0.2 | 0.0 | ||||
| Total | 7.4 | % | 5.9 | % | ||
In February 2013, the Company implemented retail price increases averaging approximately 3% in its Company shops to help offset the rising costs of doughnut mixes, other ingredients and fuel resulting from higher commodity prices. As with all consumer products, higher prices may negatively affect unit volumes, which may negatively affect sales.
Wholesale sales
The following table presents wholesale sales metrics for Company stores:
| 52 Weeks Ended | ||||||
| February 2, | January 27, | |||||
| 2014 | 2013 | |||||
| Wholesale: | ||||||
| Grocers/mass merchants: | ||||||
| Change in average weekly number of doors | (6.2 | )% | (4.0 | )% | ||
| Change in average weekly sales per door | 9.7 | % | 8.9 | % | ||
| Convenience stores: | ||||||
| Change in average weekly number of doors | (0.3 | )% | (6.3 | )% | ||
| Change in average weekly sales per door | 3.2 | % | 8.8 | % | ||
Sales to wholesale accounts increased 1.1% to $155.3 million in fiscal 2014 from $153.6 million in fiscal 2013. Excluding the 53rd week from fiscal 2013, sales to wholesale accounts increased 3.2%.
Sales to grocers and mass merchants increased to $94.4 million in fiscal 2014 from $93.4 million in fiscal 2013. Excluding the 53rd week from fiscal 2013, sales to grocers and mass merchants increased 3.1%, with a 9.7% increase in average weekly sales per door partially offset by a 6.2% decline in the average number of doors served. The Company believes that average weekly sales per door in the grocery/mass merchant channel have grown as a result of, among other things, improved customer service, introduction of additional price points, and the addition of new relatively higher volume doors. The decline in the average number of doors served in the grocery/mass merchant channel reflects, among other things, the reduction in the number of doors served as a result of refranchising stores in the Kansas/Missouri and Dallas markets, the elimination of loose doughnut sales at a regional grocer, although the Company continued to sell packaged products to this customer, as well as a program change with another customer to include only a limited number of doors. Sales of packaged products comprise substantially all of the Company’s sales to grocers and mass merchants.
57
Convenience store sales increased to $57.4 million in fiscal 2014 from $57.0 million in fiscal 2013. Excluding the 53rd week form fiscal 2013, sales to convenience stores increased 2.8%, reflecting a 3.2% increase in the average weekly sales per door partially offset by a 0.3% decline in the average number of doors served. The slight decline in the average number of doors served in the convenience store channel reflects the reduction of doors associated with the refranchising of stores in the Kansas/Missouri and Dallas markets and a reduction in the number of stops at relatively low volume doors. Sales of loose unpackaged products comprised approximately 80% of sales to convenience store customers in fiscal 2014, with the balance comprised of sales of packaged products.
Costs and expenses
Total cost of sales as a percentage of revenues declined by 0.5 percentage points from 70.7% in fiscal 2013 to 70.2% of revenues in fiscal 2014. A small increase in the cost of food, beverage and packaging as a percentage of revenue, driven by, among other things, a slight shift in product mix toward relatively higher cost limited time product offerings, was more than offset by reductions in shop and delivery labor. The improvement in labor costs as a percentage of revenues reflects the retail price increase taken in February 2013 and, to lesser extent, labor efficiencies resulting from efforts to reduce the number of relatively low volume doors served in the wholesale distribution channel.
Vehicle costs as a percentage of revenues decreased from 5.8% of revenues in fiscal 2013 to 5.6% of revenues in fiscal 2014, principally due to higher revenues, lower fuel costs, a reduction in mileage as a result of account rationalization and an increase in average weekly sales per door which generally results in reduced transportation costs per sales dollar.
The Company is self-insured for workers’ compensation, vehicle and general liability claims, but maintains stop-loss coverage for individual claims exceeding certain amounts. The Company provides for claims under these self-insured programs using actuarial methods as described in Note 1 to the consolidated financial statements appearing elsewhere herein, and periodically updates actuarial valuations of its self-insurance reserves at least annually. Such periodic actuarial valuations result in changes over time in the estimated amounts which ultimately will be paid for claims under these programs to reflect the Company’s actual claims experience for each policy year as well as trends in claims experience over multiple years. Such claims, particularly workers’ compensation claims, often are paid over a number of years following the year in which the insured events occur, and the estimated ultimate cost of each year’s claims accordingly is adjusted over time as additional information becomes available. As a result of the periodic update of its actuarial valuation, the Company recorded favorable adjustments for changes in estimates to its self-insurance claims liabilities related to prior policy years of approximately $1.1 million in fiscal 2014, of which $520,000 was recorded in the fourth quarter, and $730,000 in 2013, of which $360,000 was recorded in the fourth quarter. The $1.1 million in favorable adjustments recorded in fiscal 2014 includes a favorable adjustment relating to workers’ compensation liability claims of approximately $650,000 included in employee benefits in the table above, a favorable adjustment relating to vehicle liability claims of approximately $200,000 included in vehicle costs, and a favorable adjustment relating to general liability claims of approximately $210,000 included in other operating costs. An additional $20,000 of favorable adjustments was recorded in other segments of the business. The $730,000 in favorable adjustments recorded in fiscal 2013 includes an unfavorable adjustment relating to workers’ compensation liability claims of approximately $10,000, a favorable adjustment relating to vehicle liability claims of approximately $390,000, and a favorable adjustment relating to general liability claims of approximately $275,000. An additional $75,000 of favorable adjustments was recorded in other segments of the business.
Depreciation expense increased in fiscal 2014 compared to fiscal 2013 as a result of capital expenditures, including construction of new stores, store refurbishment efforts on existing stores, and investments in information technology systems.
During fiscal 2014, the Company refranchised three stores in the Dallas market to a new franchisee as more fully described in Note 21 to the consolidated financial statements appearing elsewhere herein. The Company realized a gain of approximately $876,000 on this refranchising transaction.
Other store level operating expenses decreased to 6.8% of revenues in the fiscal 2014 from 6.9% of revenues in fiscal 2013. During the third quarter of fiscal 2014, the Company realized a gain of approximately $275,000 on the disposal of a closed store.
Other segment operating expense increased in fiscal 2014 to 4.5% of revenues from 4.2% of revenues in fiscal 2013. These costs include approximately $790,000 and $330,000 in legal costs in fiscal 2014 and fiscal 2013, respectively, related to the litigation associated with the Company’s former landlord in Lorton, Virginia which was settled in the fourth quarter of fiscal 2014. The increase in other segment operating costs also reflects an increase in personnel costs to support anticipated Company Stores shop openings.
58
Many segment operating costs are fixed or semi-fixed in nature and, accordingly, segment profit margins are sensitive to changes in sales volumes.
Domestic Franchise
| Year Ended | ||||||||
| February 2, | February 3, | |||||||
| 2014 | 2013 | |||||||
| (In thousands) | ||||||||
| Revenues: | ||||||||
| Royalties | $ | 10,934 | $ | 9,672 | ||||
| Development and franchise fees | 313 | 288 | ||||||
| Other | 592 | 365 | ||||||
| Total revenues | 11,839 | 10,325 | ||||||
| Operating expenses: | ||||||||
| Segment operating expenses | 4,904 | 4,171 | ||||||
| Gain on sale of assets to a franchisee | (1,667 | ) | - | |||||
| Depreciation expense | 119 | 164 | ||||||
| Allocated corporate overhead | 400 | 400 | ||||||
| Total operating expenses | 3,756 | 4,735 | ||||||
| Segment operating income | $ | 8,083 | $ | 5,590 | ||||
| Segment operating margin | 68.3 | % | 54.1 | % | ||||
Domestic Franchise revenues rose 14.7% to $11.8 million in fiscal 2014 from $10.3 million in fiscal 2013. Excluding the 53rd week from fiscal 2013, Domestic Franchise revenues increased 17.4%. The increase reflects higher domestic royalties resulting from a 13.0% increase in sales by domestic franchise stores from $281 million on a 52-week basis in fiscal 2013 to $318 million in fiscal 2014. Approximately 3.1 percentage points of the increase resulted from refranchising six Company shops in fiscal 2014. Domestic Franchise same store sales rose 10.4% in fiscal 2014.
The increase in other Domestic Franchise revenues principally reflects rental income charged to two franchisees for stores leased or subleased to the franchisees in connection with the Kansas/Missouri and Dallas refranchising transactions in the first and second quarters of fiscal 2014, respectively.
Domestic Franchise segment operating expenses include costs to recruit new domestic franchisees, to assist in domestic store openings, and to monitor and aid in the performance of domestic franchise stores, as well as allocated corporate costs. Domestic Franchise operating expenses in fiscal 2014 reflect increased costs related to the addition of new personnel in fiscal 2013 and other costs associated with the execution of the Company’s domestic franchise expansion program.
Domestic Franchise segment operating expenses for fiscal 2014 reflect a gain of $1.7 million on the sale of leasehold interests to a franchisee that occurred in September 2012. Recognition of such gain previously was deferred because the franchisee’s initial and continuing investment was less than the 20% of the purchase price required by GAAP to permit recognition of a gain on the transaction. In the third quarter of fiscal 2014, the franchisee’s initial and continuing investment first exceeded 20% of the purchase price and, accordingly, the Company recognized the previously deferred gain as described in Note 21 to the consolidated financial statements appearing elsewhere herein.
Domestic franchisees opened 11 stores in fiscal 2014. As of February 2, 2014, development agreements for territories in the United States provided for the development of 102 additional stores through fiscal 2021. Royalty revenues are directly related to sales by franchise stores and, accordingly, the success of franchisees’ operations has a direct effect on the Company’s revenues, results of operations and cash flows.
59
International Franchise
| Year Ended | ||||||||
| February 2, | February 3, | |||||||
| 2014 | 2013 | |||||||
| (In thousands) | ||||||||
| Revenues: | ||||||||
| Royalties | $ | 24,139 | $ | 23,336 | ||||
| Development and franchise fees | 1,468 | 1,605 | ||||||
| Total revenues | 25,607 | 24,941 | ||||||
| Operating expenses: | ||||||||
| Segment operating expenses | 6,423 | 6,344 | ||||||
| Depreciation expense | 7 | 10 | ||||||
| Allocated corporate overhead | 1,200 | 1,200 | ||||||
| Total operating expenses | 7,630 | 7,554 | ||||||
| Segment operating income | $ | 17,977 | $ | 17,387 | ||||
| Segment operating margin | 70.2 | % | 69.7 | % | ||||
International Franchise royalties rose 3.4% to $24.1 million in fiscal 2014 from $23.3 million in fiscal 2013. Excluding the 53rd week from fiscal 2013, International Franchise royalties increased 5.3%. Sales by international franchise stores rose 3.5% from $423 million on a 52-week basis in fiscal 2013 to $438 million in fiscal 2014. Changes in the rates of exchange between the U.S. dollar and the foreign currencies in which the Company’s international franchisees do business decreased sales by international franchisees measured in U.S. dollars by approximately $21.1 million in fiscal 2014 compared to fiscal 2013, which adversely affected international royalty revenues by approximately $1.3 million.
International Franchise same store sales, measured on a constant currency basis to remove the effects of changing exchange rates between foreign currencies and the U.S. dollar (“constant dollar same store sales”), fell 5.6%. The decline in International Franchise same store sales reflects, among other things, waning honeymoon effects from the large number of new stores opened internationally in recent years and the cannibalization effects on initial stores in new markets of additional store openings in those markets.
Constant dollar same store sales in established markets increased 1.0% in fiscal 2014 and fell 11.7% in new markets. “Established markets” means countries in which the first Krispy Kreme store opened before fiscal 2007. Sales at stores in established markets comprised approximately 52% of aggregate constant dollar same store sales for fiscal 2014. While the Company considers countries in which Krispy Kreme first opened stores before fiscal 2007 to be established markets, franchisees in those markets continue to develop their business. Of the 535 international shops in operation at February 2, 2014 that opened since the beginning of fiscal 2007, 226 shops were in these established markets.
International Franchise operating expenses include costs to recruit new international franchisees, to assist in international store openings, and to monitor and aid in the performance of international franchise stores, as well as allocated corporate costs. International Franchise operating expenses increased to $6.4 million in fiscal 2014 compared to $6.3 million fiscal 2013, principally reflecting higher personnel and personnel-related costs and other costs to support continuing and anticipated international growth. The increase in the operating expenses in fiscal 2014 was partially offset by a decrease in share-based compensation expense of approximately $450,000 due to the departure of an executive officer. In addition, fiscal 2014 operating expenses reflect a net credit of $180,000 in bad debts expense resulting principally from recoveries of accounts charged to bad debt expense and written off in fiscal 2013.
International franchisees opened 96 stores and closed 31 stores in fiscal 2014. As of February 2, 2014, development and franchise agreements for territories outside the United States provided for the development of 409 additional stores through fiscal 2019. Royalty revenues are directly related to sales by franchise stores and, accordingly, the success of franchisees’ operations has a direct effect on the Company’s revenues, results of operations and cash flows.
60
KK Supply Chain
The components of KK Supply Chain revenues and expenses (expressed in dollars and as a percentage of total revenues before intersegment sales elimination) are set forth in the following table (percentage amounts may not add to totals due to rounding).
| Percentage of Total Revenues | ||||||||||||
| Before Intersegment | ||||||||||||
| Sales Elimination | ||||||||||||
| Year Ended | Year Ended | |||||||||||
| February 2, | February 3, | February 2, | February 3, | |||||||||
| 2014 | 2013 | 2014 | 2013 | |||||||||
| (In thousands) | ||||||||||||
| Revenues: | ||||||||||||
| Doughnut mixes | $ | 80,773 | $ | 73,864 | 34.9 | % | 34.3 | % | ||||
| Other ingredients, packaging and supplies | 135,674 | 130,397 | 58.7 | 60.5 | ||||||||
| Equipment | 11,928 | 8,388 | 5.2 | 3.9 | ||||||||
| Fuel surcharge | 2,854 | 2,763 | 1.2 | 1.3 | ||||||||
| Total revenues before intersegment sales elimination | 231,229 | 215,412 | 100.0 | 100.0 | ||||||||
| Operating expenses: | ||||||||||||
| Cost of sales: | ||||||||||||
| Cost of goods produced and purchased | 157,897 | 149,551 | 68.3 | 69.4 | ||||||||
| (Gain) loss on agricultural derivatives | 1,459 | (837 | ) | 0.6 | (0.4 | ) | ||||||
| Inbound freight | 6,570 | 5,906 | 2.8 | 2.7 | ||||||||
| Total cost of sales | 165,926 | 154,620 | 71.8 | 71.8 | ||||||||
| Distribution costs | 14,326 | 14,535 | 6.2 | 6.7 | ||||||||
| Other segment operating costs | 12,137 | 11,869 | 5.2 | 5.5 | ||||||||
| Depreciation expense | 687 | 738 | 0.3 | 0.3 | ||||||||
| Allocated corporate overhead | 1,200 | 1,200 | 0.5 | 0.6 | ||||||||
| Total operating costs | 194,276 | 182,962 | 84.0 | 84.9 | ||||||||
| Segment operating income | $ | 36,953 | $ | 32,450 | 16.0 | % | 15.1 | % | ||||
KK Supply Chain revenues before intersegment sales eliminations rose 7.3% to $231.2 million in fiscal 2014 from $215.4 million in fiscal 2013. Excluding the 53rd week from fiscal 2013, KK Supply Chain revenues before intersegment sales eliminations increased 9.6%.
Sales of doughnut mixes rose 11.6% on a 52-week basis in fiscal 2014, due to higher unit volumes reflecting higher sales at Company and franchise shops and higher selling prices.
Sales of other ingredients, packaging and supplies, made principally to Company and Domestic Franchise stores, rose 6.4% on a 52-week basis in fiscal 2014 due to higher unit volumes reflecting higher sales at Company and franchise shops and a slight shift in product mix toward relatively higher cost limited time product offerings.
Equipment sales rose to $11.9 million in fiscal 2014 from $8.3 million on a 52-week basis principally due to increased store openings and increased sales of replacement parts.
KK Supply Chain utilizes a fuel surcharge program. Charges under the program are based upon the excess, if any, of the price of diesel fuel over a pre-established base level, with the base level generally adjusted annually.
KK Supply Chain revenues were derived from the following customers:
| Year Ended | |||||
| February 2, | February 3, | ||||
| 2014 | 2013 | ||||
| (In thousands) | |||||
| Revenues: | |||||
| Company Stores | $ | 115,169 | $ | 111,329 | |
| Domestic Franchise shops | 93,179 | 84,062 | |||
| International Franchise shops | 21,981 | 19,067 | |||
| Other | 900 | 954 | |||
| Total revenues before intersegment sales elimination | $ | 231,229 | $ | 215,412 | |
61
KK Supply Chain cost of sales remained flat at 71.8% of revenues in fiscal 2014 compared to fiscal 2013. The cost of goods produced and purchased fell 1.1 percentage points. The improvement reflects, among other things, a reduction in reserves for obsolete and excess equipment inventories resulting from an increase in equipment production in fiscal 2014 related to current and anticipated store openings, and from increased demand for replacement parts. KK Supply Chain had net losses on agricultural derivative positions of $1.5 million in fiscal 2014 compared to net gains of $837,000 in fiscal 2013. The Company had not designated any of its derivative positions as cash flow hedges and accordingly, changes in the market value of those positions are reflected in earnings as they occur.
Distribution costs as a percentage of revenues declined by 0.5 percentage points to 6.2% in the fiscal 2014 reflecting a reduction in third party distribution fees in fiscal 2014 and economies of scale.
Other segment operating costs include segment management, purchasing, customer service and support, laboratory and quality control costs, and research and development expenses. These costs as a percentage of revenues declined by 0.3 percentage points to 5.2% in fiscal 2014, principally reflecting economies of scale.
Franchisees opened 107 stores and closed 31 stores in fiscal 2014. A substantial portion of KK Supply Chain’s revenues are directly related to sales by franchise stores and, accordingly, the success of franchisees’ operations has a direct effect on the Company’s revenues, results of operations and cash flows.
A significant portion of franchise store sales is attributable to sales by franchisees outside the United States. The Company sells doughnut mixes, either manufactured by the Company in the United States or blended by contract mix manufacturers using concentrates supplied by the Company, to all its international franchisees. Most of these franchisees purchase substantially all other ingredients, packaging and supplies through sourcing arrangements approved by the Company. Accordingly, KK Supply Chain revenues are less correlated with sales by international franchisees than with sales by domestic franchisees, which purchase substantially all of their ingredients from KK Supply Chain. Like all international businesses, the Company and its international franchisees must address the risks of international trade, including taxes, tariffs, duties and transportation costs, which can affect the franchisees’ product costs and therefore indirectly affect the pace of development. The Company, in cooperation with its international franchisees, continually seeks to mitigate the impact of these factors. For example, the Company has developed premix and concentrate doughnut mix production models, and has been continuously pursuing alternative sourcing arrangements in various markets.
General and Administrative Expenses
General and administrative expenses consist of costs incurred in various functional areas whose activities are not associated exclusively with an individual business segment. Such costs include expenses associated with finance and accounting; internal and external financial reporting, including financial planning and analysis; internal audit; human resources; risk management; information technology; training; corporate office occupancy; public company costs; and executive management. Certain personnel and other costs in some of these functional areas (for example, some of the costs of information technology and human resources) are associated primarily with the operation of individual business segments, and are allocated to those segments as allocated corporate costs. General and administrative expenses in the consolidated statement of income are presented net of such allocated costs, which are reflected in the results of operations of the four operating segments. Such allocated costs totaled $7.1 million in fiscal 2014 and 2013.
General and administrative expenses were flat at $25.1 million in fiscal 2014 and fiscal 2013 but as a percentage of sales decreased to 5.5% from 5.8%.
General and administrative expenses include costs of approximately $820,000 in fiscal 2014 and $570,000 in fiscal 2013 related to the selection and implementation of a new enterprise resource planning system.
Impairment Charges and Lease Termination Costs
Impairment charges and lease termination costs were $1.4 million in fiscal 2014 compared to $306,000 in fiscal 2013. The components of these charges are set forth in the following table:
| Year Ended | |||||
| February 2, | February 3, | ||||
| 2014 | 2013 | ||||
| (In thousands) | |||||
| Impairment of long-lived assets | $ | - | $ | - | |
| Lease termination costs | 1,374 | 306 | |||
| $ | 1,374 | $ | 306 | ||
62
The Company tests long-lived assets for impairment when events or changes in circumstances indicate that their carrying value may not be recoverable. These events and changes in circumstances include store closing and refranchising decisions, the effects of changing costs on current results of operations, observed trends in operating results, and evidence of changed circumstances observed as a part of periodic reforecasts of future operating results and as part of the Company’s annual budgeting process. Impairment charges generally relate to Company stores expected to be closed or refranchised, as well as to stores management believes will not generate sufficient future cash flows to enable the Company to recover the carrying value of the stores’ assets, but which management has not yet decided to close. When the Company concludes that the carrying value of long-lived assets is not recoverable (based on future projected undiscounted cash flows), the Company records impairment charges to reduce the carrying value of those assets to their estimated fair values. The fair values of these assets are estimated based on the present value of estimated future cash flows, on independent appraisals and, in the case of assets the Company currently is negotiating to sell, based on the Company’s negotiations with unrelated third-party buyers.
Lease termination costs represent the estimated fair value of liabilities related to unexpired leases, after reduction by the amount of accrued rent expense, if any, related to the leases, and are recorded when the lease contracts are terminated or, if earlier, the date on which the Company ceases use of the leased property. The fair value of these liabilities were estimated as the excess, if any, of the contractual payments required under the unexpired leases over the current market lease rates for the properties, discounted at a credit-adjusted risk-free rate over the remaining term of the leases. The provision for lease termination costs also includes adjustments to liabilities recorded in prior periods arising from changes in estimated sublease rentals and from settlements with landlords.
In November 2013, the Fairfax County court entered a judgment against the Company in its dispute with the landlord of a former Company commissary in Lorton, Virginia. The Company subsequently agreed to settle the matter with the former landlord, as more fully described in Note 15 to the consolidated financial statements appearing elsewhere herein, and the Company recorded an additional lease termination charge of approximately $1.4 million in fiscal 2014 related to the resolution of the matter.
In fiscal 2013, the Company recorded lease termination charges of $306,000, principally reflecting a change in estimated sublease rentals and settlements with landlords on stores previously closed.
Interest Expense
The components of interest expense are as follows:
| Year Ended | |||||
| February 2, | February 3, | ||||
| 2014 | 2013 | ||||
| (In thousands) | |||||
| Interest accruing on outstanding indebtedness | $ | 259 | $ | 708 | |
| Letter of credit and unused revolver fees | 217 | 303 | |||
| Amortization of cost of interest rate derivatives | 39 | 34 | |||
| Amortization of deferred financing costs | 285 | 398 | |||
| Other | 257 | 199 | |||
| $ | 1,057 | $ | 1,642 | ||
On July 12, 2013, the Company retired its secured credit facilities and repaid the $21.7 million remaining balance of its term loan as described in Note 11 to the consolidated financial statements appearing elsewhere herein.
Loss on Retirement of Debt
The Company recorded a charge of $967,000 in fiscal 2014 on the retirement of its secured credit facilities, consisting of a $451,000 write-off of unamortized deferred financing costs related principally to the Company’s term loan, which was retired in full, and a $516,000 write-off related to the termination of an interest rate hedge related to the term loan. The $516,000 charge related to the interest rate hedge was reclassified from accumulated other comprehensive income to “Loss on retirement of debt” in the consolidated statement of income because the hedged forecasted transaction (interest on the term loan) would not occur.
63
Equity in Income (Losses) of Equity Method Franchisees
The Company recorded equity in the losses of equity method franchisees of $221,000 in fiscal 2014 compared to losses of $202,000 in fiscal 2013. This caption represents the Company’s share of operating results of equity method franchisees which develop and operate Krispy Kreme stores.
Other Non-Operating Income and (Expense), Net
Other non-operating income and (expense), net in fiscal 2014 included credits of approximately $125,000 representing reductions in liabilities for franchisee loan guarantee obligations to reflect reductions in the amount of the guaranteed indebtedness and therefore in the Company’s guarantee exposure, liability for which had been fully accrued by the Company in prior periods. As more fully described in Note 7 to the consolidated financial statements appearing elsewhere herein, in November 2013, following the lender’s demand for payment of the loan, which had matured in by its terms in October 2009, the Company made a loan of approximately $1.6 million to the franchisee, the proceeds of which the franchisee used retire the debt. Such amount was charged against the guarantee accrual, and the remaining balance of the accrual of approximately $30,000 was credited to other non-operating income. In light of the uncertainty regarding the collectability of the note, the Company is recording payments on the note in non-operating earnings as they are received, and expects to do so until such time as the Company concludes that the collectibility of some or all of the balance of the note is reasonably assured. Such payments totaled approximately $95,000 in the fourth quarter of fiscal 2014.
Other non-operating income and expense in fiscal 2013 included credits of $318,000 representing reductions in recorded liabilities for franchisee guarantee obligations resulting from decreases in the guaranteed amounts.
Provision for Income Taxes
The provision for income taxes was $10.8 million in fiscal 2014 and $15.5 million in fiscal 2013. The Company’s effective income tax rate was 24.0% compared to 42.8%.
The Company establishes valuation allowances for deferred tax assets in accordance with GAAP, which provides that such valuation allowances shall be established unless realization of the deferred tax assets is more likely than not. Realization of net deferred tax assets generally is dependent on generation of taxable income in future periods.
In the fourth quarter of fiscal 2014, after considering all relevant factors and objectively verifiable evidence having an impact on the likelihood of future realization of the Company’s deferred tax assets, management concluded that it was more likely than not that deferred tax assets would be realized in future years in excess of amounts previously estimated. Accordingly, the Company reversed $4.3 million of the valuation allowance on deferred tax assets, with an offsetting credit to the provision for income taxes. The deferred tax assets with respect to which management concluded that a valuation allowance was no longer required related principally to state income tax net operating loss carryovers.
Also in the fourth quarter of fiscal 2014, the Company concluded that certain foreign tax credit carryovers which management previously forecasted would be deducted from future taxable income rather than being taken as a credit against future income taxes payable, would, based on updated estimates, ultimately be taken as a credit rather than as a deduction. This increase in management’s estimate of the amount of tax benefits to be realized from the credit carryovers was reflected as a credit to income tax expense in the fourth quarter of fiscal 2014. The change in estimate with respect to foreign tax credit carryovers generated in prior years was $4.5 million. The change in estimate with respect to the $2.3 million of foreign taxes paid in fiscal 2014 was approximately $1.5 million.
The aggregate credit to income tax expense in the fourth quarter of fiscal 2014 from the reduction in management’s estimate of the necessary valuation allowance, and the increase in the aggregate amount of tax benefits expected to be realized from the foreign tax credit carryovers, was $10.3 million. Of this amount, $8.8 million represents the effect of fourth quarter changes in estimates related to tax assets arising in prior years, which reduced the effective income tax rate for fiscal 2014 by approximately 20 percentage points. All of both adjustments resulted from an increase in the fourth quarter of fiscal 2014 in management’s estimate of the amount of annual pretax income to be earned in future periods.
In the second quarter of fiscal 2014, the North Carolina state legislature enacted a prospective reduction in the corporate income tax rate, which caused the Company to revalue its deferred income tax assets to reflect the lower income tax rate. Such revaluation reduced the Company’s deferred tax assets by approximately $1.0 million. Because a portion of the deferred tax assets were already subject to a valuation allowance, the revaluation of the assets resulted in a reduction in the necessary valuation allowance of approximately $314,000. The effect of the legislation was therefore to reduce the Company’s net deferred tax assets by $686,000.
In addition to adjustments to the valuation allowance on deferred tax assets, the provision for income taxes includes amounts estimated to be payable or refundable currently. The portion of the income tax provision representing taxes estimated to be payable currently was approximately $2.8 million and $2.1 million in fiscal 2014 and fiscal 2013, respectively, the majority of which represents foreign withholding taxes related to royalties and franchise fees paid by international franchisees.
64
Net Income
The Company reported net income of $34.3 million for fiscal 2014 compared to $20.8 million for fiscal 2013.
LIQUIDITY AND CAPITAL RESOURCES
The following summarizes the Company’s cash flows from operating, investing and financing activities for fiscal 2015, 2014 and 2013:
| Year Ended | |||||||||||
| February 1, | February 2, | February 3, | |||||||||
| 2015 | 2014 | 2013 | |||||||||
| (In thousands) | |||||||||||
| Net cash provided by operating activities | $ | 62,874 | $ | 56,912 | $ | 59,310 | |||||
| Net cash used for investing activities | (33,645 | ) | (22,166 | ) | (14,438 | ) | |||||
| Net cash used for financing activities | (34,006 | ) | (45,330 | ) | (22,859 | ) | |||||
| Net increase (decrease) in cash and cash equivalents | $ | (4,777 | ) | $ | (10,584 | ) | $ | 22,013 | |||
Cash Flows from Operating Activities
Cash provided by operating activities increased $6.0 million in fiscal 2015 compared to fiscal 2014 which reflects, among other things, a $3.2 million increase in pretax income.
Receivables rose $4.0 million during fiscal 2015, principally reflecting an increase of $2.5 million in receivables from franchisees, including an increase in royalties from higher franchisee sales and an increase in initial franchise fees. In addition, the increase in franchise receivables reflects $1.2 million in receivables from franchisees related principally to the Company’s financing of certain franchisee purchases of equipment from the Company.
The increase in inventories in fiscal 2015 principally reflects a net increase of twelve Krispy Kreme Company shops during the year (exclusive of stores acquired from franchisees), partially offset by a reduction in certain packaging inventories, the levels of which rose temporarily late in fiscal 2014.
The increase in other current and non-current assets in fiscal 2015 reflects, among other things, an increase of $2.0 million in margin deposits in derivative brokerage accounts resulting from unfavorable mark-to-market adjustments on agricultural and fuel futures positions.
The increase in accounts payable and accrued liabilities reflects, among other things, a $2.5 million accrual recorded in fiscal 2015 related to payments to be made related to the settlement of an employment contract with a former executive officer, partially offset by lower accruals for incentive compensation (see “Fiscal 2015 Compared to Fiscal 2014 – General and Administrative Expenses” above).
Cash provided by operating activities decreased $2.4 million to $56.9 million in fiscal 2014 from $59.3 million in fiscal 2013. A $13.5 million increase in net income was partially offset by adjustments for non-cash items.
Inventories increased $4.6 million in fiscal 2014, principally due to a temporary rise in packaging inventory and higher levels of equipment inventories related to an anticipated increase in new store openings. A smaller increase in equipment inventory in fiscal 2013 was offset by a decrease in inventories associated with the outsourcing of distribution of doughnut mixes and other KK Supply Chain products for international and certain domestic stores to a third party vendor.
In fiscal 2014, the Company recovered a cash deposit of $2.0 million related to the lease of its corporate headquarters; such recovery is reflected in the increase in other current and non-current assets in fiscal 2014. Also in fiscal 2014, the Company made a loan of $1.6 million to a franchisee related to the Company’s guarantee of certain of the franchisee’s indebtedness, as described in Note 7 to the consolidated financial statement appearing elsewhere herein; such payment is reflected in the decrease in accounts payable and accrued liabilities in fiscal 2014. The remainder of the change in cash flows from operating activities principally reflects normal fluctuations in working capital.
65
Cash Flows from Investing Activities
Net cash used for investing activities was $33.6 million in fiscal 2015, $22.2 million in fiscal 2014 and $14.4 million in fiscal 2013.
Cash used for capital expenditures increased to $31.4 million in the fiscal 2015 from $23.4 million in fiscal 2014 and $14.2 million in fiscal 2013. The components of capital expenditures in each of the last three fiscal years were approximately as follows:
| Year Ended | |||||||||||
| February 1, | February 2, | February 3, | |||||||||
| 2015 | 2014 | 2013 | |||||||||
| (In thousands) | |||||||||||
| New store construction | $ | 22,788 | $ | 10,260 | $ | 4,229 | |||||
| Store remodels and betterments | 3,748 | 4,304 | 1,613 | ||||||||
| Capital leases on stores acquired | 1,052 | - | - | ||||||||
| Other store equipment, including vehicles and technology | 3,819 | 3,994 | 4,875 | ||||||||
| Corporate office remodel | 11 | 1,703 | 3,758 | ||||||||
| Corporate information technology | 5,607 | 4,872 | 362 | ||||||||
| Other | 1,835 | 622 | 530 | ||||||||
| Total capital expenditures | 38,860 | 25,755 | 15,367 | ||||||||
| Assets acquired under leasing arrangements | (8,045 | ) | (918 | ) | (516 | ) | |||||
| Net change in unpaid capital expenditures included in accounts payable | |||||||||||
| and accrued liabilities | 632 | (1,418 | ) | (633 | ) | ||||||
| Cash used for capital expenditures | $ | 31,447 | $ | 23,419 | $ | 14,218 | |||||
Proceeds from the disposal of property and equipment include approximately $2.1 million in fiscal 2015 of proceeds from the sale of two stores to a franchisee that it previously leased from the Company, as more fully described in Note 21 to the consolidated financial statements appearing elsewhere herein. In fiscal 2014, proceeds from the disposal of property and equipment include approximately $1.0 million from the disposal of a closed store.
In fiscal 2015, the Company refranchised a store in Maryland, and in fiscal 2014 refranchised three stores in Dallas, to new franchisees. The aggregate purchase price for the assets was $1.8 million and $681,000 cash, respectively, as more fully described in Note 21 to the consolidated financial statements.
In fiscal 2015, the Company acquired the business and operating assets of its franchisee in Birmingham, Alabama, consisting of four Krispy Kreme shops in exchange for $7.2 million cash. In fiscal 2014, the Company acquired a Krispy Kreme shop in Illinois from a franchisee for $1.6 million in cash. In fiscal 2013, the Company acquired the assets and operations of one of its franchisees in exchange for $915,000 in cash. Each of these transactions also is described in Note 21 to the consolidated financial statements.
Cash Flows from Financing Activities
Net cash used by financing activities was $34.0 million in fiscal 2015, $45.3 million in fiscal 2014 and $22.9 million in fiscal 2013.
Cash flows from financing activities in fiscal 2015 consisted principally of $10.3 million in proceeds from the exercise of stock options and $43.9 million of cash used to repurchase shares of the Company’s common stock.
During fiscal 2014, the Company repaid approximately $24.7 million of outstanding term loan and capitalized lease indebtedness. The Company repaid the $21.7 million remaining outstanding balance of its term loan in connection with the retirement of its credit facilities described in Note 11 in the consolidated financial statements appearing elsewhere herein. Additional payments included approximately $1.3 million of scheduled principal amortization, $930,000 of prepayments from the sale of assets, and $730,000 of prepayments from the proceeds of stock option exercises. Cash flows from financing activities in fiscal 2014 also reflect $23.1 million of share repurchases.
During fiscal 2013, the Company repaid approximately $2.3 million of outstanding term loan and capitalized lease indebtedness, consisting of approximately $2.2 million of scheduled principal amortization and $120,000 of prepayments from the proceeds of the exercise of stock options. Also during fiscal 2013, the Company repurchased approximately $20.8 million of its common stock.
In July 2013, the Company’s Board of Directors authorized the repurchase of up to $50 million of the Company's common stock, which authorization has been subsequently increased to $105 million. The Company has repurchased approximately 3.4 million shares of its common stock for $61.6 million pursuant to this authorization, of which $39.2 million was purchased in fiscal 2015 and $22.3 million was purchased in fiscal 2014. Settlements of such purchases were $41.1 million in fiscal 2015 and $20.5 million in fiscal 2014. The average price per share cumulatively is $17.99.
66
At February 1, 2015, there remains approximately $43.4 million available for additional share repurchases pursuant to authorizations approved by the Company’s Board of Directors.
During fiscal 2013, pursuant to an earlier authorization, the Company repurchased approximately 3.1 million shares of its common stock for $20.0 million, an average price of $6.42 per share.
In addition to share repurchases made pursuant to formal repurchase programs, repurchase of common shares includes $2.8 million, $2.6 million and $758,000 in fiscal 2015, 2014 and 2013, respectively, representing the value of shares surrendered by employees to satisfy their obligations to reimburse the Company for the minimum required statutory withholding taxes arising from the vesting of restricted stock awards by surrendering vested common shares in lieu of reimbursing the Company in cash.
Capital Resources, Contractual Obligations and Off-Balance Sheet Arrangements
In addition to cash generated from operations, the Company utilizes other capital resources and financing arrangements to fund its business. A discussion of these capital resources and financing techniques is included below.
Debt
The Company continuously monitors its funding requirements for general working capital purposes and other financing and investing activities. In the last three fiscal years, management focused on reducing outstanding debt and on restructuring the Company’s borrowing arrangements to maintain credit availability and while lowering financing costs to facilitate accomplishment of the Company’s business expansion initiatives.
The $40 million 2013 Revolving Credit Facility described in Note 11 to the consolidated financial statements appearing elsewhere herein is the Company’s principal source of external financing. This facility contains financial and other covenants with which the Company must comply. Based on the Company’s current working capital and its fiscal 2016 operating plan, management believes the Company can comply with the financial and other covenants and that the Company can meet its projected operating, investing and financing cash requirements.
The operation of the financial covenants described above could limit the amount the Company may borrow under the credit facility. In addition, the maximum amount which may be borrowed under the facility is reduced by the amount of outstanding letters of credit, which totaled approximately $8.7 million as of February 1, 2015, substantially all of which secure the Company’s reimbursement obligations to insurers under the Company’s self-insurance arrangements. The unused borrowing capacity available to the Company as of February 1, 2015 was approximately $31.3 million. The restrictive covenants did not limit the Company’s ability to borrow the full $31.3 million of unused credit under the facility at that date.
The facility contains customary events of default including, without limitation, payment defaults, breaches of representations and warranties, covenant defaults, cross-defaults to other indebtedness in excess of $5 million, certain events of bankruptcy and insolvency, judgment defaults in excess of $5 million and the occurrence of a change of control.
Leases
The Company conducts some of its operations from leased facilities and leases certain equipment. Generally, these leases have initial terms of three to 20 years and contain provisions for renewal options of three to 20 years. In determining whether to enter into a lease for an asset, the Company evaluates the nature of the asset and the associated lease terms to determine if leasing is an effective financing tool.
Off-Balance Sheet Arrangements
The Company’s only off-balance sheet arrangements, as defined by Item 303(a)(4) of SEC Regulation S-K, consist principally of the Company’s guarantee of certain franchisee leases, as discussed in Note 13 to the consolidated financial statements appearing elsewhere herein.
67
Contractual Cash Obligations at February 1, 2015
The Company’s contractual cash obligations as of February 1, 2015 are as follows:
| Payments Due In | ||||||||||||||
| Less than 1 | More Than 5 | |||||||||||||
| Total Amount | Year | 1-3 Years | 3-5 Years | Years | ||||||||||
| (In thousands) | ||||||||||||||
| Interest payment obligations | $ | 546 | $ | 156 | $ | 312 | $ | 78 | $ | - | ||||
| Capital and financing lease obligations | 9,687 | 334 | 495 | 43 | 8,815 | |||||||||
| Capital and financing lease interest obligations | 20,749 | 1,182 | 2,345 | 2,394 | 14,828 | |||||||||
| Operating lease obligations | 137,350 | 11,379 | 17,764 | 14,720 | 93,487 | |||||||||
| Purchase obligations | 59,967 | 58,853 | 1,114 | - | - | |||||||||
| Other long-term obligations, including current portion, | ||||||||||||||
| reflected on the Company’s balance sheet: | ||||||||||||||
| Self-insurance claims, principally worker's | ||||||||||||||
| compensation | 11,870 | 3,773 | 3,881 | 1,615 | 2,601 | |||||||||
| 401(k) mirror plan liability | 2,496 | - | - | - | 2,496 | |||||||||
| Total | $ | 242,665 | $ | 75,677 | $ | 25,911 | $ | 18,850 | $ | 122,227 | ||||
The preceding table of contractual cash obligations excludes income tax liabilities of approximately $2.0 million as of February 1, 2015 for uncertain tax positions due to uncertainty in predicting the timing of any such related payments.
Capital and Liquidity Requirements
In the next five years, the Company plans to use cash primarily for the following activities:
| ● | Working capital and other general corporate
purposes; |
| ● | Opening new Company stores, principally small
retail shops, in selected markets; |
| ● | Remodeling, replacement and relocation of
selected older Company shops; |
| ● | Routine capital expenditures to maintain the
appearance and functionality of the Company’s facilities and equipment,
including its wholesale commissaries and retail Krispy Kreme shops; |
| ● | Maintaining and enhancing the KK Supply Chain
manufacturing and distribution capabilities; |
| ● | Investing in information technology; and |
| ● | Returning capital to shareholders. |
The Company’s capital requirements for these activities may be significant. The amount of these capital requirements will depend on many factors, including the Company’s overall performance, the pace of store expansion, securing desirable real estate for new stores, the number of store remodels, and other infrastructure needs. The Company currently estimates that its capital expenditures for fiscal 2016 will be in the range of $35 million to $45 million. The most significant capital expenditures currently planned for fiscal 2016 are for 10 to 15 new stores, refurbishments and replacement of existing stores, continuing investments in a new enterprise resource planning system and enhancements to and replacements of existing information technology systems, and ongoing smaller, routine capital expenditures. The Company plans to fund these expenditures principally using cash provided by operations and current cash resources, although the Company may use leases to acquire certain assets, including new shops, vehicles and certain information technology and office equipment.
The Company has repurchased $81.6 million of its common shares over the past three fiscal years in connection with share repurchases authorizations by its board of directors. As of March 20, 2015, the current authorization provides for up to approximately $43 million of additional repurchases. The Company intends to make additional share repurchases from time to time when the Company’s liquidity exceeds its immediate needs and when management concludes such repurchases are in the best interest of the Company’s shareholders.
The Company believes that its current cash balances, cash expected to be generated from operations and the liquidity afforded by the 2013 Revolving Credit Facility are sufficient to meet the Company’s liquidity requirements for the foreseeable future.
Inflation
The Company does not believe that general price inflation has had a material effect on its results of operations in recent years. However, prices of agricultural commodities and fuel have been volatile in recent years. Those price changes have had a significant effect on the cost of flour, shortening and sugar, the three most significant ingredients used in the production of the Company’s products, as well as on the cost of gasoline consumed by the Company’s wholesale delivery fleet.
68
Critical Accounting Policies
The Company’s discussion and analysis of its financial condition and results of operations is based upon its financial statements that have been prepared in accordance with GAAP. The preparation of financial statements in accordance with GAAP requires management to make estimates and assumptions that affect the reported amounts of assets, liabilities, revenues and expenses and related disclosures, including disclosures of contingencies and uncertainties. GAAP provides the framework from which to make these estimates, assumptions and disclosures. The Company chooses accounting policies within GAAP that management believes are appropriate to accurately and fairly report the Company’s operating results and financial position in a consistent manner. Management regularly assesses these policies in light of changes in facts and circumstances and discusses the selection of accounting policies and significant accounting judgments with the Audit Committee of the Board of Directors. The Company believes that application of the following accounting policies involves judgments and estimates that are among the more significant used in the preparation of the financial statements, and that an understanding of these policies is important to understanding the Company’s financial condition and results of operations.
Asset Impairment
The Company assesses asset groups for potential impairment whenever events or changes in circumstances indicate that its carrying amount may not be recoverable. The assessment is based upon a comparison of the carrying amount of the asset group, consisting primarily of property and equipment, to the estimated undiscounted cash flows expected to be generated from the asset group. To estimate cash flows, management projects the net cash flows anticipated from continuing operation of the asset group or store until its closing or abandonment as well as cash flows, if any, anticipated from disposal of the related assets. If the carrying amount of the assets exceeds the sum of the undiscounted cash flows, the Company records an impairment charge in an amount equal to the excess of the carrying value of the assets over their estimated fair value.
Determining undiscounted cash flows and the fair value of an asset group involves estimating future cash flows, revenues, operating expenses and disposal values. The projections of these amounts represent management’s best estimates at the time of the review. If different cash flows had been estimated, property and equipment balances and related impairment charges could have been affected. Further, if management uses different assumptions or estimates in the future or if conditions exist in future periods that are different than those anticipated, future operating results could be affected. In addition, the sale of assets whose carrying value has been reduced by impairment charges could result in the recognition of gains or losses to the extent the sales proceeds realized differ from the reduced carrying amount of the assets. In fiscal 2015, the Company recorded impairment charges related to long-lived assets totaling $901,000. The Company recorded no impairment charges in fiscal 2014 or 2013.
The most significant judgment as to potential asset impairment as of February 1, 2015 related to a commissary which commenced operations late in fiscal 2012 and which has not performed consistent with management’s initial expectations, although its results improved in fiscal 2015 compared to fiscal 2014. If operations of this asset group do not improve in accordance with management’s current plans and expectations, impairment charges related to this group could be required in the future. The aggregate carrying value of assets associated with this asset group totaled approximately $1.3 million as of February 1, 2015. In addition, the Company has opened a significant number of new factory shops in the past two years, and expects to open more new shops in fiscal 2016. The Company recorded an impairment charge of $901,000 with respect to one of these new shops in fiscal 2015, and it is possible that not all of these shops will be successful. In addition, normal changes in conditions in individual markets could result in a loss of profitability of existing shops. Impairment charges could result in future periods related to new or existing shops or related to other asset groups.
The Company tests amortizable intangible assets, consisting of reacquired franchise rights, for impairment when a change in circumstances suggests there is a possibility that the assets are impaired, using the same approach it uses for long-lived tangible assets described above.
Goodwill
The Company performs the annual test for goodwill impairment as of December 31, or whenever events or changes in circumstances indicate that the carrying amount of such assets may not be recoverable. As part of its annual impairment testing, management may elect to assess qualitative factors as a basis for determining whether it is necessary to perform quantitative impairment testing. If management’s assessment of these qualitative factors indicates that it is not more likely than not that the fair value of the reporting unit is less than its carrying value, then no further testing is required. Otherwise, the reporting unit must be quantitatively tested for impairment.
Goodwill is quantitatively tested for possible impairment which involves determining the estimated fair values of the reporting units to which goodwill is assigned and comparing those estimated fair values to the reporting units’ carrying values, including goodwill. The Company estimates the fair value of its reporting units by forecasting future revenues, expenses and any capital spending to derive future reporting unit cash flows, then discounts those cash flows to present value. The Company also considers the estimated fair values of its reporting units relative to the Company’s overall market capitalization in connection with its goodwill impairment assessment. Changes in projections or estimates could significantly change the estimated fair values of reporting units. In addition, if management uses different assumptions or estimates in the future, or if conditions exist in future periods that are different than those anticipated, operating results and the balances of goodwill could be affected by impairment charges.
69
There were no goodwill impairment charges in fiscal 2015, 2014 or 2013. As of February 1, 2015, the remaining goodwill had a carrying value of $26.1 million, of which $7.8 million and $15.7 million was associated with the Domestic and International Franchise segments, respectively, and $2.6 million associated with the Company Stores segment. The risk of goodwill impairment would increase in the event that the franchise or Company Stores segments’ operating results were to significantly deteriorate or the overall market capitalization of the Company were to decline below the book value of the Company’s shareholders’ equity.
Insurance
The Company is subject to workers’ compensation, vehicle and general liability claims. The Company is self-insured for the cost of all workers’ compensation, vehicle and general liability claims up to the amount of stop-loss insurance coverage purchased by the Company from commercial insurance carriers. The Company maintains accruals for the estimated cost of claims on an undiscounted basis, without regard to the effects of stop-loss coverage, using actuarial methods which evaluate known open and incurred but not reported claims and consider historical loss development experience. In addition, the Company records receivables from the insurance carriers for claims amounts estimated to be recovered under the stop-loss insurance policies when these amounts are estimable and probable of collection. The Company estimates such stop-loss receivables using the same actuarial methods used to establish the related claims accruals, and taking into account the amount of risk transferred to the carriers under the stop-loss policies. Many estimates and assumptions are involved in estimating future claims, and differences between future events and prior estimates and assumptions could affect future operating results and result in adjustments to these loss accruals and related insurance receivables.
Income Taxes
The Company recognizes deferred income tax assets and liabilities based upon management’s expectation of the future tax consequences of temporary differences between the income tax and financial reporting bases of assets and liabilities. Deferred tax liabilities generally represent tax expense recognized for which payment has been deferred, or expenses which have been deducted in the Company’s tax returns but which have not yet been recognized as an expense in the financial statements. Deferred tax assets generally represent tax deductions or credits that will be reflected in future tax returns for which the Company has already recorded a tax benefit in its consolidated financial statements.
The Company had valuation allowances against deferred income tax assets of $2.6 million and $2.7 million at February 1, 2015 and February 2, 2014, respectively, representing the portion of such deferred tax assets which, as of such dates, management estimated would not be realized. Under GAAP, future realization of deferred tax assets is evaluated under a “more likely than not” standard.
Realization of net deferred tax assets generally is dependent on generation of taxable income in future periods. The evaluation of the amount of net deferred tax assets expected to be realized, and therefore the necessary amount of any valuation allowance on those assets, necessarily involves forecasting the amount of taxable income that will be generated in future years. In addition, because a substantial portion of the Company’s deferred tax assets consist of net operating loss and tax credit carryforwards that are subject to expiration, the specific future periods in which taxable income is generated may have a material effect on the amount of deferred tax assets that ultimately are realized.
In determining the amount of the necessary valuation allowance as of the end of both fiscal 2014 and fiscal 2015, management estimated that the Company’s annual pretax income in subsequent years would be $45 million, which approximated the Company’s pretax income for fiscal 2014. The Company’s pretax income rose to $48.2 million in fiscal 2015. Management believes that because estimates of future earnings are inherently subjective, and because such estimates necessarily involve forecasting many years into the future, frequent revisions to such estimates should not be expected. While the Company’s results of operations continued to improve in fiscal 2015 and exceeded management’s estimated annual pretax income for future years of $45 million, the Company believes that additional evidence is necessary before concluding that a level of pretax income substantially in excess of $45 million is sustainable on a long-term basis. Management believed that such evidence should include, among other things, at least one additional year of pretax profits substantially in excess of $45 million before it would be appropriate for management to revise upward its estimate of future annual pretax income, although management will revisit this assessment at the end of each quarter of the coming fiscal year.
70
The Company has forecasted future earnings using estimates management believes to be reasonable and which are based on objective verifiable evidence, most significantly the Company’s results of operations for the two most recent fiscal years. Assuming the Company generates pretax income in each future year approximating $45 million, management estimates that $91.5 million of its deferred tax assets will be realized in future periods, and that a valuation allowance of $2.6 million was appropriate as of February 1, 2015, representing deferred tax assets management expects will not be realized. A 20% increase or reduction in the amount of assumed future annual pretax income would have had no material effect on management’s estimate of the amount of deferred tax valuation allowance. If the Company’s earnings continue to increase, it is reasonably likely that management would conclude that its estimate of annual income in future years should increase. However, management currently expects that the resulting future downward adjustments to the valuation allowance, if any, are unlikely to exceed approximately $500,000 in any case. However, a significant upward adjustment in the amount of pretax income estimated to be earned in future periods could have the effect of enabling the Company to utilize certain foreign tax credit carryforwards as credits against taxes otherwise payable rather than as deductions against future taxable income as currently forecasted. The maximum amount of such additional tax benefits which might be realized is approximately $3.4 million. Any future downward adjustment to the valuation allowance or increase in tax benefits associated with foreign tax credits would result in an increase in the Company’s aggregate net deferred tax assets, with an offsetting credit to the provision for income taxes.
The realization of deferred income tax assets is dependent on future events. While management believes its forecast of future pretax income is reasonable, actual results inevitably will vary from management’s forecasts. Such variances could result in adjustments to the valuation allowance on deferred tax assets in future periods, and such adjustments could be material to the financial statements.
Item 7A. QUANTITATIVE AND QUALITATIVE DISCLOSURES ABOUT MARKET RISK.
Interest Rate Risk
The Company is exposed to market risk from increases in interest rates on any borrowings outstanding under its secured revolving credit facility. As of February 1, 2015, there were no borrowings outstanding under such facility, and there were no borrowings outstanding at any time during fiscal 2015, 2014 or 2013 under this facility or predecessor revolving credit facilities. In addition, during fiscal 2014 the Company repaid in full the remaining balance of its term loan.
Currency Risk
The substantial majority of the Company’s revenue, expense and capital purchasing activities are transacted in U.S. dollars. Although royalties from international franchisees are payable to the Company in U.S. dollars, those royalties are computed based on local currency sales, and changes in the rate of exchange between the U.S. dollar and the foreign currencies used in the countries in which the international franchisees operate affect the Company’s royalty revenues. Because royalty revenues are derived from a relatively large number of foreign countries, and royalty revenues are not highly concentrated in a small number of such countries, the Company believes that the relatively small size of any currency hedging activities would adversely affect the economics of hedging strategies and, accordingly, the Company historically has not attempted to hedge these exchange rate risks.
In fiscal 2015, the Company’s international franchisees had sales of approximately $476 million, and the Company’s related royalty revenues were approximately $27 million. A hypothetical 10% change in the average rate of exchange between the U.S. dollar and the currencies in which the Company’s international franchisees do business would have a corresponding effect on the Company’s international royalty revenues of approximately $2.7 million.
Commodity Price Risk
The Company is exposed to the effects of commodity price fluctuations on the cost of ingredients of its products, of which flour, sugar and shortening are the most significant. In order to secure adequate supplies of materials and bring greater stability to the cost of ingredients, the Company routinely enters into forward purchase contracts and other purchase arrangements with suppliers. Under the forward purchase contracts, the Company commits to purchasing agreed-upon quantities of ingredients at agreed-upon prices at specified future dates. The outstanding purchase commitment for these commodities at any point in time typically ranges from one month’s to two years’ anticipated requirements, depending on the ingredient.
In addition to entering into forward purchase contracts, from time to time the Company purchases exchange-traded commodity futures contracts, and options on such contracts, for raw materials which are ingredients of its products or which are components of such ingredients, including wheat and soybean oil. The Company typically assigns the futures contract to a supplier in connection with entering into a forward purchase contract for the related ingredient.
The Company operates a large fleet of delivery vehicles and is exposed to the effects of changes in gasoline prices. The Company periodically uses futures and options on futures to hedge a portion of its exposure to rising gasoline prices.
71
Commodity Derivatives Outstanding at February 1, 2015
Quantitative information about the Company’s unassigned option contracts and futures contracts and options on such contracts as of February 1, 2015, which mature in fiscal 2016 and 2017, is set forth in the following table.
| Weighted | |||||||||||
| Average Contract | Aggregate | ||||||||||
| Price or Strike | Contract Price or | Aggregate Fair | |||||||||
| Contract Volume | Price | Strike Price | Value | ||||||||
| (Dollars in thousands, except average prices) | |||||||||||
| Futures contracts: | |||||||||||
| Wheat | 1,255,000 bu. | $ | 6.38 | $ | 8,004 | $ | (874 | ) | |||
| Gasoline | 2,478,000 gal. | $ | 1.97 | $ | 4,876 | $ | (937 | ) | |||
Although the Company utilizes forward purchase contracts and futures contracts and options on such contracts to mitigate the risks related to commodity price fluctuations, such contracts do not fully mitigate price risk. In addition, the portion of the Company’s anticipated future commodity requirements that are subject to such contracts vary from time to time. Adverse changes in commodity prices could materially adversely affect the Company’s profitability and liquidity.
Sensitivity to Price Changes in Commodities
The following table illustrates the potential effect on the Company’s costs resulting from hypothetical changes in the cost of the Company’s three most significant ingredients and in the cost of gasoline used to fuel the Company’s delivery fleet.
| Approximate Annual | ||||||||||
| Approximate Anticipated | Approximate Range of Prices | Hypothetical Price | Effect Of Hypothetical | |||||||
| Ingredient | Fiscal 2016 Purchases | Paid In Fiscal 2015 | Increase | Price Increase | ||||||
| (In thousands) | ||||||||||
| Flour | 74 million lbs. | $0.1650 - $0.2906/lb. | $ | 0.05/lb. | $ | 3,700 | ||||
| Shortening | 47 million lbs. | $0.3886 - $0.8138/lb. | $ | 0.10/lb. | $ | 4,700 | ||||
| Sugar | 55 million lbs. | $0.4779 - $0.5278/lb. | $ | 0.05/lb. | $ | 2,750 | ||||
| Gasoline | 2.5 million gal. | $2.03 - $3.70/gal. | $ | 0.30/gal. | $ | 750 | ||||
Anticipated fiscal 2016 purchases of flour, shortening and sugar set forth in the preceding table represent aggregate estimated purchases by KK Supply Chain. Approximately 50% of KK Supply Chain’s fiscal 2015 sales were to Company Stores, with the remaining 50% of sales made to domestic and international franchisees. KK Supply Chain adjusts the selling prices of it products quarterly to reflect changes in its input costs. To the extent KK Supply Chain adjusts selling prices to exactly offset changes in its input costs, the Company, through its Company Stores segment, is directly exposed to only about half of such changes in KK Supply Chain input costs. However, to the extent higher selling prices resulting from adverse movements in the cost of agricultural commodities adversely affect sales by Company franchisees, the Company’s financial results could be indirectly adversely affected by lower KK Supply Chain sales to franchisees, as well as by lower royalty revenues.
The ranges of prices paid for fiscal 2015 set forth in the table above reflect the effects of any forward purchase contracts entered into at various times prior to delivery of the goods and, accordingly, do not necessarily reflect the ranges of prices of these ingredients prevailing in the market during the fiscal year.
As of March 2015, the Company has either entered into forward purchase contracts or taken hedging positions to reduce its exposure to price fluctuations on a substantial portion of its anticipated flour, shortening, sugar and gasoline purchases for fiscal 2016.
72
Item 8. FINANCIAL STATEMENTS AND SUPPLEMENTARY DATA.
73
REPORT OF INDEPENDENT REGISTERED PUBLIC ACCOUNTING FIRM
To the Board of Directors and Shareholders of Krispy Kreme Doughnuts, Inc.
In our opinion, the consolidated financial statements listed in the accompanying index present fairly, in all material respects, the financial position of Krispy Kreme Doughnuts, Inc. and its subsidiaries (the "Company") at February 1, 2015 and February 2, 2014, and the results of their operations and their cash flows for each of the three years in the period ended February 1, 2015 in conformity with accounting principles generally accepted in the United States of America. In addition, in our opinion, the financial statement schedule listed in the index appearing under 15(a)2 presents fairly, in all material respects, the information set forth therein when read in conjunction with the related consolidated financial statements. Also in our opinion, the Company maintained, in all material respects, effective internal control over financial reporting as of February 1, 2015, based on criteria established in Internal Control - Integrated Framework (2013) issued by the Committee of Sponsoring Organizations of the Treadway Commission (COSO). The Company's management is responsible for these financial statements and financial statement schedule, for maintaining effective internal control over financial reporting and for its assessment of the effectiveness of internal control over financial reporting, included in Management’s Report on Internal Control over Financial Reporting appearing under Item 9A. Our responsibility is to express opinions on these financial statements, on the financial statement schedule, and on the Company's internal control over financial reporting based on our integrated audits. We conducted our audits in accordance with the standards of the Public Company Accounting Oversight Board (United States). Those standards require that we plan and perform the audits to obtain reasonable assurance about whether the financial statements are free of material misstatement and whether effective internal control over financial reporting was maintained in all material respects. Our audits of the financial statements included examining, on a test basis, evidence supporting the amounts and disclosures in the financial statements, assessing the accounting principles used and significant estimates made by management, and evaluating the overall financial statement presentation. Our audit of internal control over financial reporting included obtaining an understanding of internal control over financial reporting, assessing the risk that a material weakness exists, and testing and evaluating the design and operating effectiveness of internal control based on the assessed risk. Our audits also included performing such other procedures as we considered necessary in the circumstances. We believe that our audits provide a reasonable basis for our opinions.
A company’s internal control over financial reporting is a process designed to provide reasonable assurance regarding the reliability of financial reporting and the preparation of financial statements for external purposes in accordance with generally accepted accounting principles. A company’s internal control over financial reporting includes those policies and procedures that (i) pertain to the maintenance of records that, in reasonable detail, accurately and fairly reflect the transactions and dispositions of the assets of the company; (ii) provide reasonable assurance that transactions are recorded as necessary to permit preparation of financial statements in accordance with generally accepted accounting principles, and that receipts and expenditures of the company are being made only in accordance with authorizations of management and directors of the company; and (iii) provide reasonable assurance regarding prevention or timely detection of unauthorized acquisition, use, or disposition of the company’s assets that could have a material effect on the financial statements.
Because of its inherent limitations, internal control over financial reporting may not prevent or detect misstatements. Also, projections of any evaluation of effectiveness to future periods are subject to the risk that controls may become inadequate because of changes in conditions, or that the degree of compliance with the policies or procedures may deteriorate.
/s/ PricewaterhouseCoopers LLP
Greensboro, North Carolina
April 2, 2015
74
KRISPY KREME DOUGHNUTS, INC.
CONSOLIDATED STATEMENT OF INCOME
| Year Ended | |||||||||||
| February 1, | February 2, | February 3, | |||||||||
| 2015 | 2014 | 2013 | |||||||||
| (In thousands, except per share amounts) | |||||||||||
| Revenues | $ | 490,334 | $ | 460,331 | $ | 435,843 | |||||
| Operating expenses: | |||||||||||
| Direct operating expenses (exclusive of depreciation and amortization | |||||||||||
| expense shown below) | 399,744 | 376,132 | 362,828 | ||||||||
| General and administrative expenses | 28,558 | 25,149 | 25,089 | ||||||||
| Depreciation and amortization expense | 12,840 | 11,106 | 9,891 | ||||||||
| Impairment charges and lease termination costs | 955 | 1,374 | 306 | ||||||||
| Operating income | 48,237 | 46,570 | 37,729 | ||||||||
| Interest income | 406 | 616 | 114 | ||||||||
| Interest expense | (856 | ) | (1,057 | ) | (1,642 | ) | |||||
| Loss on retirement of debt | - | (967 | ) | - | |||||||
| Equity in losses of equity method franchisees | (118 | ) | (221 | ) | (202 | ) | |||||
| Other non-operating income and (expense), net | 547 | 119 | 317 | ||||||||
| Income before income taxes | 48,216 | 45,060 | 36,316 | ||||||||
| Provision for income taxes | 18,156 | 10,804 | 15,537 | ||||||||
| Net income | $ | 30,060 | $ | 34,256 | $ | 20,779 | |||||
| Earnings per common share: | |||||||||||
| Basic | $ | 0.45 | $ | 0.51 | $ | 0.31 | |||||
| Diluted | $ | 0.44 | $ | 0.48 | $ | 0.30 | |||||
The accompanying notes are an integral part of the financial statements.
75
KRISPY KREME DOUGHNUTS, INC.
CONSOLIDATED STATEMENT OF COMPREHENSIVE INCOME
| Year Ended | ||||||||||
| February 1, | February 2, | February 3, | ||||||||
| 2015 | 2014 | 2013 | ||||||||
| (In thousands) | ||||||||||
| Net income | $ | 30,060 | $ | 34,256 | $ | 20,779 | ||||
| Other comprehensive income (loss): | ||||||||||
| Unrealized gain (loss) on cash flow hedge | - | 36 | (3 | ) | ||||||
| Less income taxes | - | (14 | ) | 1 | ||||||
| - | 22 | (2 | ) | |||||||
| Loss on cash flow hedge reclassified to net income, previously charged to | ||||||||||
| other comprehensive income | - | 516 | - | |||||||
| Less income taxes | - | (200 | ) | - | ||||||
| - | 316 | - | ||||||||
| Total other comprehensive income (loss) | - | 338 | (2 | ) | ||||||
| Comprehensive income | $ | 30,060 | $ | 34,594 | $ | 20,777 | ||||
The accompanying notes are an integral part of the financial statements.
76
KRISPY KREME DOUGHNUTS, INC.
| February 1, | February 2, | ||||||
| 2015 | 2014 | ||||||
| (In thousands) | |||||||
| ASSETS | |||||||
| CURRENT ASSETS: | |||||||
| Cash and cash equivalents | $ | 50,971 | $ | 55,748 | |||
| Receivables | 27,799 | 25,268 | |||||
| Receivables from equity method franchisees | 782 | 675 | |||||
| Inventories | 18,194 | 16,750 | |||||
| Deferred income taxes | 23,245 | 23,847 | |||||
| Other current assets | 6,856 | 5,199 | |||||
| Total current assets | 127,847 | 127,487 | |||||
| Property and equipment | 115,758 | 92,823 | |||||
| Investments in equity method franchisees | - | - | |||||
| Goodwill and other intangible assets | 30,070 | 24,097 | |||||
| Deferred income taxes | 68,278 | 83,461 | |||||
| Other assets | 10,760 | 10,678 | |||||
| Total assets | $ | 352,713 | $ | 338,546 | |||
| LIABILITIES AND SHAREHOLDERS’ EQUITY | |||||||
| CURRENT LIABILITIES: | |||||||
| Current portion of lease obligations | $ | 333 | $ | 344 | |||
| Accounts payable | 17,095 | 16,788 | |||||
| Accrued liabilities | 32,530 | 29,276 | |||||
| Total current liabilities | 49,958 | 46,408 | |||||
| Lease obligations, less current portion | 9,354 | 1,659 | |||||
| Other long-term obligations and deferred credits | 25,615 | 25,386 | |||||
| Commitments and contingencies | |||||||
| SHAREHOLDERS’ EQUITY: | |||||||
| Preferred stock, no par value; 10,000 shares authorized; none issued and outstanding | - | - | |||||
| Common stock, no par value; 300,000 shares authorized; shares issued and outstanding: | |||||||
| February 1, 2015 - 64,926 and February 2, 2014 - 64,940 | 310,768 | 338,135 | |||||
| Accumulated other comprehensive income | - | - | |||||
| Accumulated deficit | (42,982 | ) | (73,042 | ) | |||
| Total shareholders’ equity | 267,786 | 265,093 | |||||
| Total liabilities and shareholders’ equity | $ | 352,713 | $ | 338,546 | |||
The accompanying notes are an integral part of the financial statements.
77
KRISPY KREME DOUGHNUTS, INC.
CONSOLIDATED STATEMENT OF CASH FLOWS
| Year Ended | |||||||||||
| February 1, | February 2, | February 3, | |||||||||
| 2015 | 2014 | 2013 | |||||||||
| (In thousands) | |||||||||||
| CASH FLOWS FROM OPERATING ACTIVITIES: | |||||||||||
| Net income | $ | 30,060 | $ | 34,256 | $ | 20,779 | |||||
| Adjustments to reconcile net income to net cash provided by operating | |||||||||||
| activities: | |||||||||||
| Depreciation and amortization expense | 12,840 | 11,106 | 9,891 | ||||||||
| Deferred income taxes | 15,729 | 8,014 | 13,413 | ||||||||
| Impairment charges | 901 | - | - | ||||||||
| Accrued rent expense | 789 | 784 | 585 | ||||||||
| Loss on retirement of debt | - | 967 | - | ||||||||
| (Gain) loss on disposal of property and equipment | 238 | (1,879 | ) | 543 | |||||||
| (Gain) on refranchising | (1,247 | ) | (876 | ) | - | ||||||
| Share-based compensation | 4,466 | 6,452 | 6,801 | ||||||||
| Provision for doubtful accounts | 90 | (345 | ) | 194 | |||||||
| Amortization of deferred financing costs | 108 | 285 | 398 | ||||||||
| Equity in losses of equity method franchisees | 118 | 221 | 202 | ||||||||
| Unrealized losses on commodity derivative positions | 1,498 | 298 | 36 | ||||||||
| Other | 23 | 27 | (255 | ) | |||||||
| Change in assets and liabilities: | |||||||||||
| Receivables | (3,962 | ) | 556 | (248 | ) | ||||||
| Inventories | (1,343 | ) | (4,553 | ) | 299 | ||||||
| Other current and non-current assets | (2,358 | ) | 1,917 | (1,012 | ) | ||||||
| Accounts payable and accrued liabilities | 4,867 | (1,913 | ) | 4,740 | |||||||
| Other long-term obligations and deferred credits | 57 | 1,595 | 2,944 | ||||||||
| Net cash provided by operating activities | 62,874 | 56,912 | 59,310 | ||||||||
| CASH FLOWS FROM INVESTING ACTIVITIES: | |||||||||||
| Purchase of property and equipment | (31,447 | ) | (23,419 | ) | (14,218 | ) | |||||
| Proceeds from disposals of property and equipment | 2,341 | 1,719 | 178 | ||||||||
| Proceeds from refranchising | 1,847 | 681 | - | ||||||||
| Acquisition of stores from franchisees | (7,152 | ) | (1,603 | ) | (915 | ) | |||||
| Other investing activities | 766 | 456 | 517 | ||||||||
| Net cash used for investing activities | (33,645 | ) | (22,166 | ) | (14,438 | ) | |||||
| CASH FLOWS FROM FINANCING ACTIVITIES: | |||||||||||
| Repayment of long-term debt and lease obligations | (384 | ) | (24,658 | ) | (2,346 | ) | |||||
| Deferred financing costs | - | (132 | ) | (11 | ) | ||||||
| Proceeds from exercise of stock options | 10,259 | 2,517 | 247 | ||||||||
| Proceeds from exercise of warrants | - | - | 9 | ||||||||
| Repurchase of common shares | (43,881 | ) | (23,057 | ) | (20,758 | ) | |||||
| Net cash used for financing activities | (34,006 | ) | (45,330 | ) | (22,859 | ) | |||||
| Net increase (decrease) in cash and cash equivalents | (4,777 | ) | (10,584 | ) | 22,013 | ||||||
| Cash and cash equivalents at beginning of year | 55,748 | 66,332 | 44,319 | ||||||||
| Cash and cash equivalents at end of year | $ | 50,971 | $ | 55,748 | $ | 66,332 | |||||
| Supplemental schedule of non-cash investing and financing activities: | |||||||||||
| Assets acquired under leasing arrangements | $ | 8,045 | $ | 918 | $ | 516 | |||||
The accompanying notes are an integral part of the financial statements.
78
KRISPY KREME DOUGHNUTS, INC.
CONSOLIDATED STATEMENT OF CHANGES IN SHAREHOLDERS' EQUITY
| Accumulated | ||||||||||||||||||
| Common | Other | |||||||||||||||||
| Shares | Common | Comprehensive | Accumulated | |||||||||||||||
| Outstanding | Stock | Income (Loss) | Deficit | Total | ||||||||||||||
| (In thousands) | ||||||||||||||||||
| Balance at January 29, 2012 | 68,092 | $ | 377,539 | $ | (336 | ) | $ | (128,077 | ) | $ | 249,126 | |||||||
| Comprehensive income (loss) for the year ended | ||||||||||||||||||
| February 3, 2013 | - | - | (2 | ) | 20,779 | 20,777 | ||||||||||||
| Write-off of deferred tax assets related to the | ||||||||||||||||||
| expiration of unexercised stock warrants | - | (9,770 | ) | - | - | (9,770 | ) | |||||||||||
| Exercise of warrants | 1 | 9 | - | - | 9 | |||||||||||||
| Exercise of stock options | 128 | 247 | - | - | 247 | |||||||||||||
| Share-based compensation | 348 | 6,801 | - | - | 6,801 | |||||||||||||
| Repurchase of common shares | (3,213 | ) | (20,758 | ) | - | - | (20,758 | ) | ||||||||||
| Balance at February 3, 2013 | 65,356 | 354,068 | (338 | ) | (107,298 | ) | 246,432 | |||||||||||
| Comprehensive income for the year ended | ||||||||||||||||||
| February 2, 2014 | - | - | 338 | 34,256 | 34,594 | |||||||||||||
| Exercise of stock options | 460 | 2,517 | - | - | 2,517 | |||||||||||||
| Share-based compensation | 445 | 6,452 | - | - | 6,452 | |||||||||||||
| Repurchase of common shares | (1,321 | ) | (24,902 | ) | - | - | (24,902 | ) | ||||||||||
| Balance at February 2, 2014 | 64,940 | 338,135 | - | (73,042 | ) | 265,093 | ||||||||||||
| Comprehensive income for the year ended | ||||||||||||||||||
| February 1, 2015 | - | - | - | 30,060 | 30,060 | |||||||||||||
| Write-off of deferred tax assets related to the | ||||||||||||||||||
| expiration of unexercised stock options | - | (56 | ) | - | - | (56 | ) | |||||||||||
| Exercise of stock options | 1,930 | 10,259 | - | - | 10,259 | |||||||||||||
| Share-based compensation | 446 | 4,466 | - | - | 4,466 | |||||||||||||
| Repurchase of common shares | (2,390 | ) | (42,036 | ) | - | - | (42,036 | ) | ||||||||||
| Balance at February 1, 2015 | 64,926 | $ | 310,768 | $ | - | $ | (42,982 | ) | $ | 267,786 | ||||||||
The accompanying notes are an integral part of the financial statements.
79
KRISPY KREME DOUGHNUTS, INC.
Note 1 — Accounting Policies
Krispy Kreme Doughnuts, Inc. (“KKDI”) and its subsidiaries (collectively, the “Company”) are engaged in the sale of doughnuts and complementary products through Company-owned stores. The Company also licenses the Krispy Kreme business model and certain of its intellectual property to franchisees in the United States and over 20 other countries around the world, and derives revenue from franchise and development fees and royalties from those franchisees. Additionally, the Company sells doughnut mixes, other ingredients and supplies and doughnut-making equipment to franchisees.
Significant Accounting Policies
The Company prepares its financial statements in accordance with accounting principles generally accepted in the United States of America (“GAAP”). The significant accounting policies followed by the Company in preparing the accompanying consolidated financial statements are as follows:
BASIS OF CONSOLIDATION. The financial statements include the accounts of KKDI and its subsidiaries.
Investments in entities over which the Company has the ability to exercise significant influence but which the Company does not control, and whose financial statements are not otherwise required to be consolidated, are accounted for using the equity method.
REVENUE RECOGNITION. Revenue is recognized when there is a contract or other arrangement of sale; the sales price is fixed or determinable; title and the risks of ownership have been transferred to the customer; and collection of the receivable is reasonably assured. A summary of the revenue recognition policies for the Company’s business segments is as follows:
| ● |
Company Stores revenue is derived from the
sale of doughnuts and complementary products to on-premises and wholesale
customers. Revenue is recognized at the time of delivery for on-premises
sales. For wholesale sales, revenue is recognized either at the time of
delivery, net of provisions for estimated product returns, or, with
respect to those wholesale customers that take title to products purchased
from the Company at the time those products are sold by the wholesale
customer to consumers, simultaneously with such consumer purchases.
|
| ● |
Domestic and International Franchise revenue
is derived from development and initial franchise fees relating to new
store openings and ongoing royalties charged to franchisees based on their
sales. Development and franchise fees are recognized when the store is
opened, at which time the Company has performed substantially all of the
initial services it is required to provide. Royalties are recognized in
income as underlying franchisee sales occur unless there is significant
uncertainty concerning the collectibility of such revenues, in which case
royalty revenues are recognized when received. |
| ● |
KK Supply Chain revenue is derived from the sale of doughnut mix, other ingredients and supplies and doughnut-making equipment. Revenues for the sale of doughnut mix and supplies are recognized upon delivery to the customer or, in the case of franchisees located outside North America, when the goods are loaded on the transport vessel at the U.S. port. Revenue for equipment sales and installation associated with new store openings is recognized at the store opening date. Revenue for equipment sales not associated with new store openings is recognized when the equipment is installed if the Company is responsible for the installation, and otherwise upon shipment of the equipment. |
FISCAL YEAR. The Company’s fiscal year ends on the Sunday closest to January 31, which periodically results in a 53-week year. Fiscal 2015 and fiscal 2014 each contained 52 weeks, while fiscal 2013 contained 53 weeks.
CASH AND CASH EQUIVALENTS. The Company considers cash on hand, demand deposits in banks and all highly liquid debt instruments with an original maturity of three months or less to be cash and cash equivalents.
ALLOWANCE FOR DOUBTFUL ACCOUNTS. The Company maintains allowances for doubtful accounts related to its accounts receivable, including receivables from franchisees, in amounts which management believes are sufficient to provide for losses estimated to be sustained on realization of these receivables. Such estimates inherently involve uncertainties and assessments of the outcome of future events, and changes in facts and circumstances may result in adjustments to the allowance for doubtful accounts.
INVENTORIES. Inventories are recorded at the lower of cost or market, with cost determined using the first-in, first-out method.
80
PROPERTY AND EQUIPMENT. Depreciation of property and equipment is provided using the straight-line method over the assets’ estimated useful lives, which are as follows: buildings — 5 to 35 years; machinery and equipment — 3 to 15 years; computer software — 3 to 10 years; and leasehold improvements — 5 to 20 years.
REACQUIRED FRANCHISE RIGHTS. Franchise rights reacquired in connection with business combinations are valued based on the present value of the cash flows of the acquired business and are amortized on a straight-line basis from the acquisition date through the expiration date of the terminated franchise agreement.
GOODWILL. Goodwill represents the excess of the purchase price over the value of identifiable net assets acquired in business combinations. Goodwill has an indefinite life and is not amortized, but is tested for impairment annually or more frequently if events or circumstances indicate the carrying amount of the asset may be impaired. Such impairment testing is performed for each reporting unit to which goodwill has been assigned.
LEGAL COSTS. Legal costs associated with litigation and other loss contingencies are charged to expense as services are rendered.
ASSET IMPAIRMENT. The Company assesses asset groups for potential impairment whenever events or changes in circumstances indicate that its carrying amount may not be recoverable. The assessment is based upon a comparison of the carrying amount of the asset group, consisting primarily of property and equipment, to the estimated undiscounted cash flows expected to be generated from the asset group. To estimate cash flows, management projects the net cash flows anticipated from continuing operation of the asset group or store until its closing or abandonment as well as cash flows, if any, anticipated from disposal of the related assets. If the carrying amount of the assets exceeds the sum of the undiscounted cash flows, the Company records an impairment charge in an amount equal to the excess of the carrying value of the assets over their estimated fair value.
EARNINGS PER SHARE. The computation of basic earnings per share is based on the weighted average number of common shares outstanding during the period. The computation of diluted earnings per share reflects the additional common shares that would have been outstanding if dilutive potential common shares had been issued, computed using the treasury stock method. Such potential common shares consist of shares issuable upon the exercise of stock options and warrants and the vesting of currently unvested shares of restricted stock and restricted stock units.
The following table sets forth amounts used in the computation of basic and diluted earnings per share:
| Year Ended | |||||||||
| February 1, | February 2, | February 3, | |||||||
| 2015 | 2014 | 2013 | |||||||
| (In thousands) | |||||||||
| Numerator: net income | $ | 30,060 | $ | 34,256 | $ | 20,779 | |||
| Denominator: | |||||||||
| Basic earnings per share - weighted average shares | |||||||||
| outstanding | 66,360 | 67,261 | 67,624 | ||||||
| Effect of dilutive securities: | |||||||||
| Stock options and warrants | 2,037 | 2,998 | 1,781 | ||||||
| Restricted stock and restricted stock units | 532 | 795 | 491 | ||||||
| Diluted earnings per share - weighted average shares | |||||||||
| outstanding plus dilutive potential common shares | 68,929 | 71,054 | 69,896 | ||||||
Stock options and warrants with respect to 257,000, 301,000 and 2.7 million shares for fiscal 2015, fiscal 2014 and fiscal 2013, respectively, as well as 57,000 and 98,000 unvested shares of restricted stock and unvested restricted stock units for fiscal 2015 and fiscal 2013, respectively, have been excluded from the computation of the number of shares used to compute diluted earnings per share because their inclusion would be antidilutive. There were no antidilutive unvested shares of restricted stock and unvested restricted stock units in fiscal 2014.
SHARE-BASED COMPENSATION. The Company measures and recognizes compensation expense for share-based payment awards by charging the fair value of each award at its grant date to earnings over the service period necessary for each award to vest.
MARKETING AND BRAND PROMOTION. Costs associated with the Company’s products, including advertising and other brand promotional activities, are expensed as incurred, and were approximately $9.8 million, $8.2 million and $7.5 million in fiscal 2015, 2014 and 2013, respectively.
81
CONCENTRATION OF CREDIT RISK. Financial instruments that subject the Company to credit risk consist principally of receivables from wholesale customers and franchisees, guarantees of certain franchisee leases and, in prior years, guarantees of certain indebtedness of franchisees. Wholesale receivables are primarily from grocer/mass merchants and convenience stores. The Company maintains allowances for doubtful accounts which management believes are sufficient to provide for losses which may be sustained on realization of these receivables. In fiscal 2015, 2014 and 2013, no customer accounted for more than 10% of Company Stores segment revenues. The two largest wholesale customers collectively accounted for approximately 16%, 17% and 16% of Company Stores segment revenues in fiscal 2015, 2014 and 2013, respectively. The two wholesale customers with the largest trade receivables balances collectively accounted for approximately 24% and 27% of total wholesale customer receivables at February 1, 2015 and February 2, 2014, respectively.
The Company also evaluates the recoverability of receivables from its franchisees and maintains allowances for doubtful accounts which management believes are sufficient to provide for losses which may be sustained on realization of these receivables. In addition, the Company evaluates the likelihood of potential payments by the Company under loan and lease guarantees and records estimated liabilities for payments the Company considers probable.
SELF-INSURANCE RISKS AND RECEIVABLES FROM INSURERS. The Company is subject to workers’ compensation, vehicle and general liability claims. The Company is self-insured for the cost of all workers’ compensation, vehicle and general liability claims up to the amount of stop-loss insurance coverage purchased by the Company from commercial insurance carriers. The Company maintains accruals for the estimated cost of claims, without regard to the effects of stop-loss coverage, using actuarial methods which evaluate known open and incurred but not reported claims and consider historical loss development experience. In addition, the Company records receivables from the insurance carriers for claims amounts estimated to be recovered under the stop-loss insurance policies when these amounts are estimable and probable of collection. The Company estimates such stop-loss receivables using the same actuarial methods used to establish the related claims accruals, and taking into account the amount of risk transferred to the carriers under the stop-loss policies. The stop-loss policies provide coverage for claims in excess of retained self-insurance risks, which are determined on a claim-by-claim basis.
The Company recorded favorable adjustments to its self-insurance claims liabilities related to prior years of approximately $1.7 million, $1.1 million and $730,000 in fiscal 2015, 2014 and 2013, respectively. Such adjustments represent changes in estimates of the ultimate cost of incurred claims.
The Company provides health and medical benefits to eligible employees, and purchases stop-loss insurance from commercial insurance carriers which pays covered medical costs in excess of a specified annual amount incurred by each claimant.
DERIVATIVE FINANCIAL INSTRUMENTS AND DERIVATIVE COMMODITY INSTRUMENTS. The Company reflects derivative financial instruments, which typically consist of interest rate derivatives and commodity futures contracts and options on such contracts, in the consolidated balance sheet at their fair value. The difference between the cost, if any, and the fair value of the interest rate derivatives is reflected in income unless the derivative instrument qualifies as a cash flow hedge and is effective in offsetting future cash flows of the underlying hedged item, in which case such amount is reflected in other comprehensive income. The difference between the cost, if any, and the fair value of commodity derivatives is reflected in earnings because the Company has not designated any of these instruments as cash flow hedges.
COMPREHENSIVE INCOME. Accounting standards on reporting comprehensive income require that certain items, including mark-to-market adjustments on interest rate derivative contracts accounted for as cash flow hedges (which are not reflected in net income) be presented as components of comprehensive income. The cumulative amounts recognized by the Company under these standards are reflected in the consolidated balance sheet as accumulated other comprehensive income, a component of shareholders’ equity.
USE OF ESTIMATES. The preparation of financial statements in conformity with GAAP requires management to make estimates and assumptions that affect the reported amounts of assets and liabilities and disclosure of contingent assets and liabilities at the date of the financial statements and the reported amounts of revenues and expenses during the reporting period. Actual results will differ from these estimates, and the differences could be material.
Recent Accounting Pronouncements
In February 2015, the Financial Accounting Standards Board (the “FASB”) issued Accounting Standards Update ("ASU") No. 2015-02, "Consolidation: Amendments to the Consolidation Analysis." This update improves targeted areas of the consolidation guidance and reduces the number of consolidation models. This update is effective for annual and interim periods in fiscal years beginning after December 15, 2015. Adoption of this guidance is not expected to have any effect on the Company’s consolidated financial statements.
82
In June 2014, the FASB issued ASU No. 2014-12, “Compensation – Stock Compensation”, an update to its accounting guidance related to share-based compensation. The guidance requires that a performance target that affects vesting, and that could be achieved after the requisite service period, be treated as a performance condition, and therefore shall not be reflected in determining the fair value of the award at the grant date. The guidance is effective for annual and interim periods beginning after December 15, 2015; adoption of this guidance is not expected to have any effect on the Company’s consolidated financial statements.
In May 2014, the FASB issued ASU No. 2014-09, “Revenue from Contracts with Customers,” to clarify the principles used to recognize revenue for all entities. The guidance is effective for annual and interim periods beginning after December 15, 2016. The Company will evaluate the effects, if any, adoption of this guidance will have on the Company’s consolidated financial statements.
In April 2014, the FASB issued ASU No. 2014-08, “Reporting Discontinued Operations and Disposals of Components of an Entity,” which changes the criteria for determining which disposals can be presented as discontinued operations and modifies related disclosure requirements. The guidance is effective for annual and interim periods beginning after December 15, 2014. Adoption of this guidance could have an effect on the Company’s presentation and disclosure of a future disposal compared to prior GAAP.
Note 2 — Segment Information
The Company’s operating and reportable segments are Company Stores, Domestic Franchise, International Franchise and KK Supply Chain.
The Company Stores segment is comprised of the stores operated by the Company. These stores sell doughnuts and complementary products through both on-premises and wholesale channels, although some stores serve only one of these distribution channels.
The Domestic Franchise and International Franchise segments consist of the Company’s franchise operations. Under the terms of franchise agreements, domestic and international franchisees pay royalties and fees to the Company in return for the use of the Krispy Kreme name and ongoing brand and operational support. Revenues and costs related to licensing certain Krispy Kreme trademarks to domestic third parties other than franchisees also are included in the Domestic Franchise segment. Expenses for these segments include costs to recruit new franchisees, to assist in store openings, to support franchisee operations and marketing efforts, as well as allocated corporate costs.
The majority of the ingredients and materials used by Company stores are purchased from the KK Supply Chain segment, which supplies doughnut mix, other ingredients and supplies and doughnut making equipment to both Company and franchisee-owned stores. All intercompany sales by the KK Supply Chain segment to the Company Stores segment are at prices intended to reflect an arms-length transfer price and are eliminated in consolidation. Operating income for the Company Stores segment does not include any profit earned by the KK Supply Chain segment on sales of doughnut mix and other items to the Company Stores segment; such profit is included in KK Supply Chain operating income.
83
The following table presents the results of operations of the Company’s operating and reportable segments for fiscal 2015, 2014 and 2013. Segment operating income is consolidated operating income before general and administrative expenses, corporate depreciation and amortization, and impairment charges and lease termination costs.
| Year Ended | ||||||||||||
| February 1, | February 2, | February 3, | ||||||||||
| 2015 | 2014 | 2013 | ||||||||||
| (In thousands) | ||||||||||||
| Revenues: | ||||||||||||
| Company Stores | $ | 325,306 | $ | 306,825 | $ | 296,494 | ||||||
| Domestic Franchise | 13,450 | 11,839 | 10,325 | |||||||||
| International Franchise | 28,598 | 25,607 | 24,941 | |||||||||
| KK Supply Chain: | ||||||||||||
| Total revenues | 244,688 | 231,229 | 215,412 | |||||||||
| Less – intersegment sales elimination | (121,708 | ) | (115,169 | ) | (111,329 | ) | ||||||
| External KK Supply Chain revenues | 122,980 | 116,060 | 104,083 | |||||||||
| Total revenues | $ | 490,334 | $ | 460,331 | $ | 435,843 | ||||||
| Operating income: | ||||||||||||
| Company Stores | $ | 9,287 | $ | 11,334 | $ | 8,534 | ||||||
| Domestic Franchise | 8,103 | 8,083 | 5,590 | |||||||||
| International Franchise | 20,026 | 17,977 | 17,387 | |||||||||
| KK Supply Chain | 41,823 | 36,953 | 32,450 | |||||||||
| Total segment operating income | 79,239 | 74,347 | 63,961 | |||||||||
| General and administrative expenses | (28,558 | ) | (25,149 | ) | (25,089 | ) | ||||||
| Corporate depreciation and amortization expense | (1,489 | ) | (1,254 | ) | (837 | ) | ||||||
| Impairment charges and lease termination costs | (955 | ) | (1,374 | ) | (306 | ) | ||||||
| Consolidated operating income | $ | 48,237 | $ | 46,570 | $ | 37,729 | ||||||
| Depreciation and amortization expense: | ||||||||||||
| Company Stores | $ | 10,534 | $ | 9,039 | $ | 8,142 | ||||||
| Domestic Franchise | 135 | 119 | 164 | |||||||||
| International Franchise | 5 | 7 | 10 | |||||||||
| KK Supply Chain | 677 | 687 | 738 | |||||||||
| Corporate | 1,489 | 1,254 | 837 | |||||||||
| Total depreciation and amortization expense | $ | 12,840 | $ | 11,106 | $ | 9,891 | ||||||
Segment information for total assets and capital expenditures is not presented as such information is not used in measuring segment performance or allocating resources among segments.
Revenues for fiscal 2015, 2014 and 2013 include approximately $52 million, $48 million and $44 million, respectively, from customers outside the United States.
84
Note 3 — Receivables
The components of receivables are as follows:
| February 1, | February 2, | |||||||
| 2015 | 2014 | |||||||
| (In thousands) | ||||||||
| Receivables: | ||||||||
| Wholesale customers | $ | 9,557 | $ | 9,919 | ||||
| Unaffiliated franchisees | 12,743 | 10,934 | ||||||
| Due from third-party distributors | 4,075 | 3,262 | ||||||
| Other receivables | 867 | 640 | ||||||
| Current portion of notes receivable | 1,052 | 754 | ||||||
| 28,294 | 25,509 | |||||||
| Less — allowance for doubtful accounts: | ||||||||
| Wholesale customers | (204 | ) | (191 | ) | ||||
| Unaffiliated franchisees | (291 | ) | (50 | ) | ||||
| (495 | ) | (241 | ) | |||||
| $ | 27,799 | $ | 25,268 | |||||
| Receivables from equity method franchisees (Note 7): | ||||||||
| Trade | $ | 782 | $ | 675 | ||||
The changes in the allowances for doubtful accounts are summarized as follows:
| Year Ended | |||||||||||
| February 1, | February 2, | February 3, | |||||||||
| 2015 | 2014 | 2013 | |||||||||
| (In thousands) | |||||||||||
| Allowance for doubtful accounts related to receivables: | |||||||||||
| Balance at beginning of year | $ | 241 | $ | 615 | $ | 1,158 | |||||
| Provision for doubtful accounts | 202 | (275 | ) | 259 | |||||||
| Net recoveries (chargeoffs) | 52 | (99 | ) | (802 | ) | ||||||
| Balance at end of year | $ | 495 | $ | 241 | $ | 615 | |||||
See Note 9 for information about notes receivable from franchisees.
Note 4 — Inventories
The components of inventories are as follows:
| February 1, | February 2, | ||||
| 2015 | 2014 | ||||
| (In thousands) | |||||
| Raw materials | $ | 6,779 | $ | 6,200 | |
| Work in progress | 115 | 114 | |||
| Finished goods and purchased merchandise | 11,300 | 10,436 | |||
| $ | 18,194 | $ | 16,750 | ||
85
Note 5 — Other Current Assets
Other current assets consist of the following:
| February 1, | February 2, | ||||
| 2015 | 2014 | ||||
| (In thousands) | |||||
| Current portion of claims against insurance carriers related to self-insurance | |||||
| programs (Notes 1, 9, 10 and 12) | $ | 1,012 | $ | 893 | |
| Margin deposits in derivative brokerage accounts | 2,744 | 792 | |||
| Prepaid expenses and other | 3,100 | 3,514 | |||
| $ | 6,856 | $ | 5,199 | ||
Note 6 — Property and Equipment
Property and equipment consists of the following:
| February 1, | February 2, | ||||||
| 2015 | 2014 | ||||||
| (In thousands) | |||||||
| Land | $ | 13,512 | $ | 13,822 | |||
| Buildings | 86,337 | 71,873 | |||||
| Leasehold improvements | 15,200 | 14,527 | |||||
| Machinery and equipment | 65,596 | 57,611 | |||||
| Computer software | 7,911 | 7,100 | |||||
| Construction and projects in progress | 12,295 | 5,913 | |||||
| 200,851 | 170,846 | ||||||
| Less: accumulated depreciation | (85,093 | ) | (78,023 | ) | |||
| $ | 115,758 | $ | 92,823 | ||||
Machinery and equipment acquired under capital leases had a net book value of $839,000 and $921,000 at February 1, 2015 and February 2, 2014, respectively. Buildings acquired under capital leases had a net book value of $1.8 million and $920,000 at February 1, 2015 and February 2, 2014, respectively. Buildings acquired under build-to-suit leasing arrangements had a net book value of $5.7 million at February 1, 2015 and construction and projects in progress included assets acquired under build-to-suit leasing arrangements with a carrying value of $1.0 million at February 1, 2015. Depreciation expense was $12.4 million, $11.0 million and $9.9 million in fiscal 2015, 2014, and 2013, respectively.
86
Note 7 — Investments in Franchisees
As of February 1, 2015, the Company had an ownership interest in three franchisees, the aggregate carrying value of which was zero.
Information about the Company’s ownership in, and the markets served by, these franchisees is set forth below:
| Number of | |||||||||
| Stores as of | |||||||||
| February 1, | Ownership% | ||||||||
| Geographic Market | 2015 | Company | Third Parties | ||||||
| Kremeworks, LLC | Alaska, Hawaii, Oregon, | ||||||||
| Washington | 9 | 25.0 | % | 75.0 | % | ||||
| Kremeworks Canada, LP | Western Canada | 1 | 24.5 | % | 75.5 | % | |||
| Krispy Kreme of South Florida, LLC | South Florida | 3 | 35.3 | % | 64.7 | % | |||
The Company’s financial exposures related to franchisees in which the Company has an investment are summarized in the tables below.
| February 1, 2015 | ||||||||||
| Investments and | ||||||||||
| Advances | Receivables | Loan Guarantees | ||||||||
| (In thousands) | ||||||||||
| Kremeworks, LLC | $ | 900 | $ | 353 | $ | - | ||||
| Kremeworks Canada, LP | 667 | 30 | - | |||||||
| Krispy Kreme of South Florida, LLC | - | 399 | - | |||||||
| 1,567 | 782 | $ | - | |||||||
| Less: reserves and allowances | (1,567 | ) | - | |||||||
| $ | - | $ | 782 | |||||||
| February 2, 2014 | |||||||||
| Investments and | |||||||||
| Advances | Receivables | Loan Guarantees | |||||||
| (In thousands) | |||||||||
| Kremeworks, LLC | $ | 900 | $ | 280 | $ | 140 | |||
| Kremeworks Canada, LP | 667 | 19 | - | ||||||
| Krispy Kreme of South Florida, LLC | - | 376 | - | ||||||
| 1,567 | 675 | $ | 140 | ||||||
| Less: reserves and allowances | (1,567 | ) | - | ||||||
| $ | - | $ | 675 | ||||||
The loan guarantee amount in the preceding table represents the portion of the principal amount outstanding under the related loan that was subject to the Company’s guarantee.
The Company has a 25% interest in Kremeworks, LLC (“Kremeworks”) and had guaranteed 20% of the outstanding principal balance of certain of Kremeworks’ bank indebtedness which was paid in full in fiscal 2015. The carrying values of the Company’s investments and advances in Kremeworks and Kremeworks Canada, LP (“Kremeworks Canada”) were zero at February 1, 2015 and February 2, 2014. In addition, the Company had reserved all of the balance of its advances to Kremeworks and Kremeworks Canada at such dates; accrued but uncollected interest on such advances of approximately $390,000 at February 1, 2015 had not been reflected in income at such date.
87
Current liabilities at February 3, 2013 included an accrual of $1.6 million (originally recorded in fiscal 2008) for potential payments under a loan guarantee related to Krispy Kreme of South Florida, LLC (“KKSF”), representing the amount the Company estimated it was likely to pay under such guarantee. KKSF failed to repay the indebtedness upon its maturity in October 2009; however, the lender did not immediately exercise its right to call the loan, and KKSF continued to make payments pursuant to an informal forbearance agreement with the lender. In October 2012, KKSF received notice that the original lender had sold the loan to a new lender, who thereafter advised KKSF that the entire balance due under the loan was due and owing, but made no demand for payment on KKSF or the Company. KKSF then entered into refinancing negotiations with the new lender, while continuing to make payments on the loan. Such negotiations were unsuccessful, and in October 2013 the new lender made demand on KKSF to retire the loan in full and on the Company to perform under its guarantee. On November 1, 2013, the Company made a loan of approximately $1.6 million to KKSF, the proceeds of which KKSF used to retire the debt in full, including accrued interest and lender expenses. Such amount was charged against the guarantee liabilities accrual, and the remaining balance of the accrual of approximately $30,000 was credited to other non-operating income. The amount advanced to KKSF pursuant to the Company’s guarantee is evidenced by a promissory note payable to the Company by KKSF, which is secured by a mortgage on real property at KKSF’s most significant operating location as well as other KKSF assets, and which is guaranteed by KKSF’s 65% majority owner; such collateral is substantially the same as that held by the prior lenders. The loan is payable in 36 monthly installments, including interest at three-month LIBOR plus 3.0%. In light of the uncertainty regarding the collectability of the note, including KKSF’s failure to repay the indebtedness when due in 2009, failure to refinance the indebtedness with either of the prior lenders, and the lender ultimately demanding payment of the debt, the Company is recording payments on the note as a component of other non-operating income as they are received, and expects to do so until such time as the Company concludes that the collectibility of some or all of the $1.0 million remaining balance at February 1, 2015 of the note is reasonably assured.
In December 2011, the Company, KKSF and KKSF’s majority owner entered into a restructuring agreement pursuant to which KKSF is to pay to the Company past due amounts totaling approximately $825,000, all of which the Company had written off in prior years. KKSF paid a total of $180,000 of such amount following the execution of the agreement, and commenced repayment of the remaining amount in fiscal 2012. All amounts paid under the agreement are being recorded as received. At such time as KKSF has paid all the agreed upon amounts and the Company has been reimbursed for all amounts paid by the Company pursuant to the Company’s guarantee of the KKSF indebtedness described above, the Company has agreed to convey to KKSF’s majority owner all of the Company’s membership interests in KKSF, provided that neither KKSF nor its majority owner are then in default under any agreement between either of them and the Company.
The following table summarizes certain financial information with respect to the Company’s investments in franchisees:
| Summary Financial Information (1) | |||||||||||||||||||||||||||
| Operating | |||||||||||||||||||||||||||
| Income | Net Income | Current | Noncurrent | Current | Noncurrent | Total Equity | |||||||||||||||||||||
| Revenues | (Loss) | (Loss) (2) | Assets | Assets | Liabilities | Liabilities | (Deficit) | ||||||||||||||||||||
| (In thousands) | |||||||||||||||||||||||||||
| Kremeworks, LLC | |||||||||||||||||||||||||||
| 2015 | $ | 19,691 | $ | 1,038 | $ | 893 | $ | 2,397 | $ | 8,851 | $ | 6,520 | $ | 1,849 | $ | 2,879 | |||||||||||
| 2014 | 18,512 | $ | 637 | $ | 463 | $ | 1,982 | $ | 9,791 | $ | 7,172 | $ | 1,946 | $ | 2,655 | ||||||||||||
| 2013 | 17,383 | (561 | ) | (781 | ) | 1,083 | 10,622 | 8,438 | 1,883 | 1,384 | |||||||||||||||||
| Kremeworks Canada, LP | |||||||||||||||||||||||||||
| 2015 | 1,973 | (119 | ) | (233 | ) | 565 | 859 | 448 | 3,107 | (2,131 | ) | ||||||||||||||||
| 2014 | 1,800 | (92 | ) | (201 | ) | 572 | 1,061 | 672 | 3,041 | (2,080 | ) | ||||||||||||||||
| 2013 | 1,516 | 1 | (106 | ) | 534 | 1,247 | 883 | 2,912 | (2,014 | ) | |||||||||||||||||
| Krispy Kreme of South | |||||||||||||||||||||||||||
| Florida, LLC | |||||||||||||||||||||||||||
| 2015 | 12,098 | 280 | 207 | 1,142 | 2,105 | 1,669 | 3,713 | (2,135 | ) | ||||||||||||||||||
| 2014 | 12,408 | 848 | 626 | 1,237 | 2,887 | 2,120 | 3,251 | (1,247 | ) | ||||||||||||||||||
| 2013 | 13,271 | 1,421 | 1,290 | 1,182 | 3,182 | 3,418 | 1,754 | (808 | ) | ||||||||||||||||||
|
(1) |
Amounts shown for each of these franchisees represents the amounts reported by the franchisee for calendar 2014, 2013 and 2012, and on or about December 31, 2014, 2013 and 2012. | |
|
(2) |
The net income or loss of each of these entities is includable on the income tax returns of their owners to the extent required by law. Accordingly, the financial statements of these entities do not include a provision for income taxes and, as a result, pretax income or loss for each of these entities is also their net income or loss. |
88
Note 8 — Goodwill and Other Intangible Assets
Goodwill and other intangible assets consist of the following:
| February 1, | February 2, | ||||
| 2015 | 2014 | ||||
| (In thousands) | |||||
| Goodwill: | |||||
| Goodwill associated with International Franchise segment | $ | 15,664 | $ | 15,664 | |
| Goodwill associated with Domestic Franchise segment | 7,832 | 7,832 | |||
| Goodwill associated with Company Stores segment (Note 21) | 2,594 | - | |||
| Reacquired franchise rights associated with Company Stores segment, net of accumulated | |||||
| amortization of $556,000 at February 1, 2015 and $82,000 at February 2, 2014 | 3,980 | 601 | |||
| $ | 30,070 | $ | 24,097 | ||
The goodwill and reacquired franchise rights associated with Company Stores segment in the preceding table are net of accumulated impairment losses totaling $139.4 million and $1.8 million, respectively, recorded principally in fiscal 2005 through fiscal 2008.
The changes in reacquired franchise rights are as follows:
| February 1, | February 2, | ||||||
| 2015 | 2014 | ||||||
| (In thousands) | |||||||
| Balance at beginning of year | $ | 601 | $ | 699 | |||
| Acquisition of stores from franchisee (Note 21) | 3,853 | - | |||||
| Amount related to refranchised store | - | (40 | ) | ||||
| Amortization expense | (474 | ) | (58 | ) | |||
| Balance at end of year | $ | 3,980 | $ | 601 | |||
The Company has acquired the assets and operations of certain of its franchisees as described in Note 21. The allocation of the purchase price included amounts allocated to reacquired franchise rights, which are being amortized over the terms of the reacquired franchise agreements.
Note 9 — Other Assets
The components of other assets are as follows:
| February 1, | February 2, | ||||
| 2015 | 2014 | ||||
| (In thousands) | |||||
| Non-current portion of notes receivable | $ | 3,482 | $ | 3,172 | |
| Non-current portion of claims against insurance carriers related to self-insurance | |||||
| programs (Notes 1, 5, 10 and 12) | 3,290 | 3,207 | |||
| 401(k) mirror plan assets (Notes 12 and 18) | 2,496 | 2,585 | |||
| Deposits | 734 | 765 | |||
| Deferred financing costs, net of accumulated amortization | 370 | 478 | |||
| Other | 388 | 471 | |||
| $ | 10,760 | $ | 10,678 | ||
89
The Company has notes receivable from certain of its franchisees which are summarized in the following table. As of February 1, 2015 and February 2, 2014, substantially all of the notes receivable were being paid in accordance with their terms.
| February 1, | February 2, | |||||||
| 2015 | 2014 | |||||||
| (In thousands) | ||||||||
| Notes receivable: | ||||||||
| Note receivable from franchisees | $ | 4,534 | $ | 3,980 | ||||
| Less — portion due within one year included in receivables (Note 3) | (1,052 | ) | (754 | ) | ||||
| Less — allowance for doubtful accounts | - | (54 | ) | |||||
| $ | 3,482 | $ | 3,172 | |||||
Notes receivable at February 1, 2015 and February 2, 2014, consist principally of amounts payable to the Company related to a refranchising transaction, to the sale of certain leasehold interests, and to sales of equipment.
The changes in the allowance for doubtful accounts related to notes receivable are summarized as follows:
| Year Ended | ||||||||||||
| February 1, | February 2, | February 3, | ||||||||||
| 2015 | 2014 | 2013 | ||||||||||
| (In thousands) | ||||||||||||
| Balance at beginning of year | $ | 54 | $ | 62 | $ | 68 | ||||||
| Provision for doubtful accounts | (54 | ) | (8 | ) | (6 | ) | ||||||
| Balance at end of year | $ | - | $ | 54 | $ | 62 | ||||||
In addition to the foregoing notes receivable, the Company had promissory notes totaling approximately $1.9 million February 1, 2015 and $2.9 million at February 2, 2014 principally representing royalties and fees due to the Company which, as a result of doubt about their collection, the Company has not yet recorded as revenues. During fiscal 2015 and 2014, the Company collected approximately $900,000 and $380,000, respectively, related to these promissory notes and recorded such collections in revenues as received because of the uncertainty as to the timing and amount of such collections.
Finally, the Company has a promissory note receivable from KKSF totaling approximately $1.0 million and $1.5 million at February 1, 2015 and February 2, 2014, respectively, arising from the Company’s advance to KKSF of approximately $1.6 million in November 2013 to enable KKSF to retire certain indebtedness with respect to which KKSF had been in default since October 2009, payment of which was demanded by the lender in October 2013. The lender also made demand on the Company to perform under its guarantee of such indebtedness. Because of the uncertainty of recovery of amounts advanced to KKSF as more fully described in Note 7, the note receivable is not reflected as an asset in the accompanying consolidated balance sheet. The Company is recording payments on the note as they are received from KKSF, and reflecting such amounts as a component of other non-operating income. Such collections were approximately $550,000 and $95,000 in fiscal 2015 and 2014, respectively. KKSF has informed the Company that it is negotiating a new term loan with a third-party lender, the proceeds of which would be used by KKSF to, among other things, expand its business and repay to the Company the amounts owed described above.
Note 10 — Accrued Liabilities
The components of accrued liabilities are as follows:
| February 1, | February 2, | ||||
| 2015 | 2014 | ||||
| (In thousands) | |||||
| Accrued compensation | $ | 10,533 | $ | 8,901 | |
| Accrued vacation pay | 5,732 | 5,530 | |||
| Current portion of self-insurance claims, principally worker's compensation | |||||
| (Notes 1, 5, 9, and 12) | 3,773 | 3,765 | |||
| Accrued taxes, other than income | 2,541 | 2,043 | |||
| Accrued health care claims | 1,330 | 1,240 | |||
| Customer deposits | 1,017 | 1,115 | |||
| Gasoline commodity futures contracts | 937 | - | |||
| Accrued guarantee liabilities (Note 13) | 906 | 929 | |||
| Current portion of deferred franchise fee revenue (Note 12) | 906 | 893 | |||
| Agricultural commodity futures contracts | 874 | 313 | |||
| Current portion of lease termination costs (Notes 12 and 15) | 94 | 74 | |||
| Other | 3,887 | 4,473 | |||
| $ | 32,530 | $ | 29,276 | ||
90
The changes in the assets and liabilities associated with self-insurance programs are summarized as follows:
| Year Ended | ||||||||||||
| February 1, | February 2, | February 3, | ||||||||||
| 2015 | 2014 | 2013 | ||||||||||
| (In thousands) | ||||||||||||
| Accrual for self-insurance programs, net of receivables from stop-loss policies: | ||||||||||||
| Balance at beginning of year | $ | 8,047 | $ | 8,455 | $ | 8,203 | ||||||
| Additions charged to costs and expenses | 2,600 | 3,436 | 3,777 | |||||||||
| Claims payments | (3,079 | ) | (3,844 | ) | (3,525 | ) | ||||||
| Balance at end of year | $ | 7,568 | $ | 8,047 | $ | 8,455 | ||||||
| Accrual reflected in: | ||||||||||||
| Accrued liabilities | $ | 3,773 | $ | 3,765 | $ | 4,156 | ||||||
| Other long-term obligations and deferred credits | 8,097 | 8,382 | 9,979 | |||||||||
| Claims receivable under stop-loss insurance policies included in: | ||||||||||||
| Other current assets | (1,012 | ) | (893 | ) | (1,194 | ) | ||||||
| Other assets | (3,290 | ) | (3,207 | ) | (4,486 | ) | ||||||
| $ | 7,568 | $ | 8,047 | $ | 8,455 | |||||||
Note 11 — Credit Facilities and Lease Obligations
Lease obligations consist of the following:
| February 1, | February 2, | |||||||
| 2015 | 2014 | |||||||
| (In thousands) | ||||||||
| Capital lease obligations | $ | 2,940 | $ | 2,003 | ||||
| Financing obligations | 6,747 | - | ||||||
| 9,687 | 2,003 | |||||||
| Less: current portion | (333 | ) | (344 | ) | ||||
| $ | 9,354 | $ | 1,659 | |||||
2013 Revolving Credit Facility
On July 12, 2013, the Company entered into a $40 million revolving secured credit facility (the “2013 Revolving Credit Facility”) which matures in July 2018. The 2013 Revolving Credit Facility is secured by a first lien on substantially all of the personal property assets of the Company and certain of its domestic subsidiaries. No borrowings were made on the 2013 Revolving Credit Facility on the closing date, and the Company repaid the $21.7 million remaining balance of the 2011 Term Loan and terminated the 2011 Secured Credit Facilities described below. The Company recorded a pretax charge of approximately $967,000 in the second quarter of fiscal 2014 to write off the unamortized deferred debt issuance costs related to the terminated facility and to reflect the termination of a related interest rate hedge described below.
Interest on borrowings under the 2013 Revolving Credit Facility is payable either at LIBOR or the Base Rate (which is the greatest of the prime rate, the Fed funds rate plus 0.50%, or the one-month LIBOR rate plus 1.00%), in each case plus the Applicable Percentage. The Applicable Percentage for LIBOR loans ranges from 1.25% to 2.15%, and for Base Rate loans ranges from 0.25% to 1.15%, in each case depending on the Company’s leverage ratio. As of February 1, 2015, the Applicable Percentage was 1.25%.
The 2013 Revolving Credit Facility contains provisions which permit the Company to obtain letters of credit, issuance of which constitutes usage of the lending commitments and reduces the amount available for cash borrowings. At closing, $9.2 million of letters of credit were issued under the 2013 Revolving Credit Facility to replace letters of credit issued under the terminated credit facilities, substantially all of which secure the Company’s reimbursement obligations to insurers under the Company’s self-insurance programs. At February 1, 2015, the Company had approximately $8.7 million of letters of credits outstanding.
91
The Company is required to pay a fee equal to the Applicable Percentage for LIBOR-based loans on the outstanding amount of letters of credit. There also is a fee on the unused portion of the 2013 Revolving Credit Facility lending commitment, ranging from 0.15% to 0.35%, depending on the Company’s leverage ratio. As of February 1, 2015, the fee on the unused portion of the 2013 Revolving Credit Facility was 0.15%.
The 2013 Revolving Credit Facility requires the Company to meet certain financial tests, including a maximum leverage ratio and a minimum fixed charge coverage ratio. The leverage ratio is required to be not greater than 2.25 to 1.0 and the fixed charge coverage ratio is required to be not less than 1.3 to 1.0.
As of February 1, 2015, the Company’s leverage ratio was 0.3 to 1.0 and the fixed charge coverage ratio was 3.1 to 1.0.
The leverage ratio is calculated by dividing total debt as of the end of each fiscal quarter by Consolidated EBITDA for the Reference Period (each consisting of the four most recent fiscal quarters). For this purpose, debt includes not only indebtedness reflected in the consolidated balance sheet, but also, among other things, the amount of undrawn letters of credit, the principal balance of indebtedness of third parties to the extent such indebtedness is guaranteed by the Company, and any amounts reasonably expected to be paid with respect to any other guaranty obligations. The fixed charge coverage ratio is calculated for each Reference Period by dividing (a) the sum of (i) Consolidated EBITDA, plus (ii) Cash Lease Payments, minus (iii) cash income taxes, minus (iv) unfinanced capital expenditures, minus (v) purchases, redemptions, retirements, and cash dividend payments or other distributions in respect of the Company’s common stock in excess of certain amounts, and minus (vi) the purchase price of all acquisitions of all or substantially all of the assets of any Krispy Kreme store or franchisee shops by (b) Consolidated Fixed Charges.
“Consolidated EBITDA” is a non-GAAP measure and is defined in the 2013 Revolving Credit Facility to mean, for each Reference Period, generally, consolidated net income or loss, exclusive of unrealized gains and losses on hedging instruments, gains or losses on asset dispositions, and provisions for payments on guarantee obligations, plus the sum of interest expense, income taxes, depreciation, rent expense and lease termination costs, and certain non-cash charges; and minus the sum of non-cash credits, interest income, Cash Lease Payments, and payments on guaranty obligations in excess of $1 million during the Reference Period or $3 million in the aggregate.
“Cash Lease Payments” means the sum of cash paid or required to be paid for obligations under operating leases for real property and equipment (net of sublease income), lease payments on closed stores (but excluding payments in settlement of future obligations under terminated operating leases), and cash payments in settlement of future obligations under terminated operating leases to the extent the aggregate amount of such payments exceeds $1.5 million during a Reference Period or $5.0 million in the aggregate.
“Consolidated Fixed Charges” means the sum of cash interest expense, Cash Lease Payments, and scheduled principal payments of indebtedness.
The operation of the restrictive financial covenants described above may limit the amount the Company may borrow under the 2013 Revolving Credit Facility. The restrictive covenants did not limit the Company’s ability to borrow the full $31.3 million of unused credit under the 2013 Revolving Credit Agreement as of February 1, 2015.
The 2013 Revolving Credit Facility also contains covenants which, among other things, generally limit (with certain exceptions): liquidations, mergers, and consolidations; the incurrence of additional indebtedness (including guarantees); the incurrence additional liens; the sale, assignment, lease, conveyance or transfer of assets; certain investments; dividends and stock redemptions or repurchases in excess of certain amounts; transactions with affiliates; engaging in materially different lines of business; certain sale-leaseback transactions; and other activities customarily restricted in such agreements. The 2013 Revolving Credit Facility also prohibits the transfer of cash or other assets to the Parent Company, whether by dividend, loan or otherwise, but provides for exceptions to enable the Parent Company to pay taxes, directors’ fees and operating expenses, as well as exceptions to permit dividends in respect of the Company’s common stock and stock redemptions and repurchases, to the extent permitted by the 2013 Revolving Credit Facility.
The 2013 Revolving Credit Facility also contains customary events of default including, without limitation, payment defaults, breaches of representations and warranties, covenant defaults, cross-defaults to other indebtedness in excess of $5 million, certain events of bankruptcy and insolvency, judgment defaults in excess of $5 million and the occurrence of a change of control.
Borrowings and issuances of letters of credit under the 2013 Revolving Credit Facility are subject to the satisfaction of usual and customary conditions, including the accuracy of representations and warranties and the absence of defaults.
92
2011 Secured Credit Facilities
On January 28, 2011, the Company entered into secured credit facilities (the “2011 Secured Credit Facilities”), consisting of a $25 million revolving credit line (the “2011 Revolver”) and a $35 million term loan (the “2011 Term Loan”), each of which were scheduled to mature in January 2016. The 2011 Secured Credit Facilities were secured by a first lien on substantially all of the assets of the Company and its domestic subsidiaries. On July 12, 2013, the 2011 Term Loan was paid in full and the 2011 Secured Credit Facilities were terminated.
Interest on borrowings under the 2011 Secured Credit Facilities was payable either at LIBOR or the Base Rate (which is the greatest of the prime rate, the Fed funds rate plus 0.50%, or the one-month LIBOR rate plus 1.00%), in each case plus the Applicable Percentage. The Applicable Percentage for LIBOR loans ranged from 2.25% to 3.00%, and for Base Rate loans ranged from 1.25% to 2.00%, in each case depending on the Company’s leverage ratio.
On March 3, 2011, the Company entered into an interest rate derivative contract having an aggregate notional principal amount of $17.5 million. The derivative contract entitled the Company to receive from the counterparty the excess, if any, of the three-month LIBOR rate over 3.00% for each of the calendar quarters in the period beginning April 2012 and ending December 2015. The Company accounted for this derivative contract as a cash flow hedge. The contract was terminated in July 2013 following the retirement in full of the 2011 Term Loan. In the second quarter of fiscal 2014, the $516,000 unrealized loss on the contract previously included in AOCI was reclassified to earnings in the consolidated statement of income because the hedged forecasted transaction (interest on the 2011 Term Loan) would not occur.
The 2011 Revolver contained provisions which permitted the Company to obtain letters of credit, issuance of which constituted usage of the lending commitments and reduced the amount available for cash borrowings.
The Company was required to pay a fee equal to the Applicable Percentage for LIBOR-based loans on the outstanding amount of letters of credit, as well as a fronting fee of 0.125% of the amount of such letter of credit. There also was a fee on the unused portion of the 2011 Revolver lending commitment ranging from 0.35% to 0.65%, depending on the Company’s leverage ratio.
Lease Obligations
The Company acquires equipment and facilities under capital and operating leases and build-to-suit arrangements.
In certain build-to-suit leasing arrangements, the Company is involved in the construction of leased stores and is deemed the owner of the leased stores for accounting purposes during the construction period. The Company records the related assets and liabilities for construction costs incurred under these build-to-suit leasing arrangements during the construction period. Upon completion of the leased store, the Company considers whether the assets and liabilities qualify for derecognition under the sale-leaseback accounting guidance. These leasing arrangements entered into to date do not qualify for sale-leaseback treatment and, accordingly, the Company records the transactions as financing obligations. A portion of the lease payments is allocated to land and is classified as an operating lease. The remainder of the lease payments is allocated between interest expense and amortization of the financing obligations. The assets are depreciated over their estimated useful lives. At the end of the lease term, the carrying value of the leased asset and of the remaining financing obligation are expected to be equal, at which time the Company may either surrender the leased assets as settlement of the remaining financing obligation or enter into a new arrangement for the continued use of the asset.
93
The approximate future minimum lease payments under non-cancelable leases and build-to-suit leasing arrangements as of February 1, 2015 are set forth in the following table:
| Operating | Capital | Financing | ||||||||||
| Fiscal Year | Leases | Leases | Obligations | |||||||||
| (In thousands) | ||||||||||||
| 2016 | $ | 11,379 | $ | 840 | $ | 764 | ||||||
| 2017 | 9,207 | 791 | 764 | |||||||||
| 2018 | 8,557 | 660 | 764 | |||||||||
| 2019 | 7,382 | 472 | 765 | |||||||||
| 2020 | 7,338 | 427 | 783 | |||||||||
| Thereafter | 93,487 | 6,482 | 14,257 | |||||||||
| $ | 137,350 | 9,672 | 18,097 | |||||||||
| Portion representing interest | (6,495 | ) | (14,254 | ) | ||||||||
| Portion representing executory costs | (237 | ) | - | |||||||||
| Unamortized balance of financing obligations at end of lease term | - | 2,904 | ||||||||||
| Total capital lease and financing obligations | $ | 2,940 | $ | 6,747 | ||||||||
Rent expense, net of rental income, totaled $13.4 million in fiscal 2015, $12.3 million in fiscal 2014 and $12.8 million in fiscal 2013. Such rent expense includes rents under non-cancelable operating leases as well as sundry short-term rentals.
Cash Payments of Interest
Interest paid, inclusive of deferred financing costs, totaled approximately $750,000 in fiscal 2015, $940,000 in fiscal 2014 and $1.2 million in fiscal 2013.
Note 12 — Other Long-Term Obligations and Deferred Credits
The components of other long-term obligations and deferred credits are as follows:
| February 1, | February 2, | |||||
| 2015 | 2014 | |||||
| (In thousands) | ||||||
| Non-current portion of self-insurance claims, principally worker's | ||||||
| compensation (Notes 1, 5, 9 and 10) | $ | 8,097 | $ | 8,382 | ||
| Accrued rent expense | 6,571 | 6,025 | ||||
| Non-current portion of deferred franchise fee revenue (Note 10) | 4,877 | 4,526 | ||||
| Mirror 401(k) plan liability (Notes 9 and 18) | 2,496 | 2,585 | ||||
| Landlord upfit allowances on leased premises | 2,445 | 2,647 | ||||
| Non-current portion of lease termination costs (Notes 10 and 15) | 22 | 104 | ||||
| Other | 1,107 | 1,117 | ||||
| $ | 25,615 | $ | 25,386 | |||
Note 13 — Commitments and Contingencies
Except as disclosed below, the Company currently is not a party to any material legal proceedings.
Pending Litigation
K2 Asia Litigation
On April 7, 2009, a Cayman Islands corporation, K2 Asia Ventures, and its owners filed a lawsuit in Forsyth County, North Carolina Superior Court against the Company, its franchisee in the Philippines, and other persons associated with the franchisee. The suit alleges that the Company and the other defendants conspired to deprive the plaintiffs of claimed “exclusive rights” to negotiate franchise and development agreements with prospective franchisees in the Philippines, and seeks unspecified damages. The Company therefore does not know the amount or range of possible loss related to this matter. The Company believes that these allegations are false and intends to vigorously defend against the lawsuit. On July 26, 2013, the Superior Court dismissed the Philippines-based defendants for lack of personal jurisdiction, and the plaintiffs appealed that decision. On January 22, 2015, the North Carolina Supreme Court denied the plaintiffs’ request to review the case.
94
The Company does not believe it is probable that a loss has been incurred with respect to this matter, and accordingly no liability related to it has been reflected in the accompanying financial statements.
Other Legal Matters
The Company also is engaged in various legal proceedings arising in the normal course of business. The Company maintains insurance policies against certain kinds of such claims and suits, including insurance policies for workers’ compensation and personal injury, all of which are subject to deductibles. While the ultimate outcome of these matters could differ from management’s expectations, management currently does not believe their resolution will have a material adverse effect on the Company’s consolidated financial statements.
Other Commitments and Contingencies
The Company has guaranteed certain franchisee lease obligations, usually in connection with subleasing or assigning leases in connection with refranchising transactions. The aggregate liability recorded for such obligations was $906,000 at February 1, 2015, and is included in accrued liabilities.
The Company’s primary bank had issued letters of credit on behalf of the Company totaling $8.7 million at February 1, 2015, substantially all of which secure the Company’s reimbursement obligations to insurers under the Company’s self-insurance arrangements.
The Company is exposed to the effects of commodity price fluctuations on the cost of ingredients of its products, of which flour, shortening and sugar are the most significant. In order to secure adequate supplies of products and bring greater stability to the cost of ingredients, the Company routinely enters into forward purchase contracts with suppliers under which the Company commits to purchase agreed-upon quantities of ingredients at agreed-upon prices at specified future dates. Typically, the aggregate outstanding purchase commitment at any point in time will range from one month’s to several years’ anticipated ingredients purchases, depending on the ingredient. In addition, from time to time the Company enters into contracts for the future delivery of equipment purchased for resale and components of doughnut-making equipment manufactured by the Company. As of February 1, 2015, the Company had approximately $60 million of commitments under ingredient and other forward purchase contracts. While the Company has multiple suppliers for most of its ingredients, the termination of the Company’s relationships with vendors with whom the Company has forward purchase agreements, or those vendors’ inability to honor the purchase commitments, could adversely affect the Company’s results of operations and cash flows.
In addition to entering into forward purchase contracts, the Company from time to time purchases exchange-traded commodity futures contracts or options on such contracts for raw materials which are ingredients of the Company’s products or which are components of such ingredients, including wheat and soybean oil. The Company typically assigns the futures contract to a supplier in connection with entering into a forward purchase contract for the related ingredient. The Company may also purchase futures, options on futures or enter into other contracts to hedge its exposure to rising gasoline prices. See Note 20 for additional information about these derivatives.
95
Note 14 — Shareholders’ Equity
Share-Based Compensation for Employees and Directors
The Company’s shareholders have approved the Krispy Kreme Doughnuts, Inc. 2012 Stock Incentive Plan (the “2012 Plan”), which provides for the grant of incentive stock options, non-qualified stock options, restricted stock awards, restricted stock units, stock awards, performance unit awards, performance share awards, stock appreciation rights and phantom stock awards.
The 2012 Plan provides for the issuance of approximately 5.1 million shares of Company common stock (as adjusted to reflect forfeitures and expirations subsequent to January 29, 2012 of awards issued under predecessor plans, pursuant to the 2012 Plan), of which approximately 3.5 million remain available for grant through June 2022. Any shares that are subject to options or stock appreciation rights awarded under the 2012 Plan will be counted against the 2012 Plan limit as one share for every one share granted, and any shares that are subject to 2012 Plan awards other than options or stock appreciation rights will be counted against this limit as one and thirty three-hundredths (1.33) shares for every one share granted. The 2012 Plan provides that options may be granted with exercise prices not less than the closing sale price of the Company’s common stock on the date of grant.
The Company measures and recognizes compensation expense for share-based payment (“SBP”) awards based on their fair values. The fair value of SBP awards for which employees and directors render the requisite service necessary for the award to vest is recognized over the related vesting period. The fair value of SBP awards which vest in increments and for which vesting is subject solely to service conditions is charged to expense on a straight-line basis over the aggregate vesting period of each award, which generally is four years.
The aggregate cost of SBP awards charged to earnings for fiscal 2015, 2014 and 2013 is set forth in the following table. The Company did not realize any excess tax benefits from the exercise of stock options or the vesting of restricted stock or restricted stock units during any of the periods.
| Year Ended | |||||||||
| February 1, | February 2, | February 3, | |||||||
| 2015 | 2014 | 2013 | |||||||
| (In thousands) | |||||||||
| Costs charged to earnings related to: | |||||||||
| Stock options | $ | 1,209 | $ | 1,865 | $ | 1,537 | |||
| Restricted stock and restricted stock units | 3,257 | 4,587 | 5,264 | ||||||
| Total costs | $ | 4,466 | $ | 6,452 | $ | 6,801 | |||
| Costs included in: | |||||||||
| Direct operating expenses | $ | 2,145 | $ | 2,487 | $ | 2,614 | |||
| General and administrative expenses | 2,321 | 3,965 | 4,187 | ||||||
| Total costs | $ | 4,466 | $ | 6,452 | $ | 6,801 | |||
The fair value of stock options was estimated using the Black-Scholes option pricing model. Options granted generally have contractual terms of 10 years, the maximum term permitted under the 2012 Plan and predecessor plans. The weighted average assumptions used in valuing stock options in are set forth in the following table. There were no stock options granted in fiscal 2013.
| Year Ended | ||||||||
| February 1, | February 2, | February 3, | ||||||
| 2015 | 2014 | 2013 | ||||||
| Expected life of option | 7.0 years | 7.0 years | N/A | |||||
| Risk-free interest rate | 2.14 | % | 2.19 | % | N/A | |||
| Expected volatility of stock | 65.0 | % | 65.0 | % | N/A | |||
| Expected dividend yield | 0.0 | % | 0.0 | % | N/A | |||
The expected life of stock options valued using the Black-Scholes option pricing model is estimated by reference to historical experience and any relevant characteristics of the option. The risk-free rate of interest is based on the yield of a zero-coupon U.S. Treasury bond on the date the award is granted having a maturity approximately equal to the expected term of the award. Expected volatility is estimated based upon the historical volatility of the Company’s common shares. The Company uses historical employee turnover data to estimate forfeitures of awards prior to vesting.
96
The number of options granted and the aggregate and weighed average fair value of such options were as follows:
| Year Ended | ||||||||
| February 1, | February 2, | February 3, | ||||||
| 2015 | 2014 | 2013 | ||||||
| Weighted average fair value per share of options granted | $ | 12.07 | $ | 11.17 | N/A | |||
| Total number of options granted | 88,300 | 251,000 | N/A | |||||
| Total fair value of all options granted | $ | 1,065,200 | $ | 2,804,800 | N/A | |||
The following table summarizes stock option transactions for fiscal 2015, 2014 and 2013.
| Weighted | |||||||||||
| Average | |||||||||||
| Weighted Average | Aggregate | Remaining | |||||||||
| Shares Subject | Exercise Price Per | Intrinsic | Contractual | ||||||||
| to Option | Share | Value | Term | ||||||||
| (Dollars in thousands, except per share amounts) | |||||||||||
| Outstanding at January 29, 2012 | 5,809,400 | $ | 9.35 | $ | 14,572 | 6.6 years | |||||
| Granted | - | $ | - | ||||||||
| Exercised | (128,000 | ) | $ | 1.93 | $ | 947 | |||||
| Expired | (304,900 | ) | $ | 34.40 | |||||||
| Forfeited | (170,000 | ) | $ | 6.84 | |||||||
| Outstanding at February 3, 2013 | 5,206,500 | $ | 8.15 | $ | 36,388 | 5.8 years | |||||
| Granted | 251,000 | $ | 17.47 | ||||||||
| Exercised | (459,500 | ) | $ | 5.25 | $ | 5,324 | |||||
| Expired | (391,000 | ) | $ | 38.66 | |||||||
| Forfeited | - | $ | - | ||||||||
| Outstanding at February 2, 2014 | 4,607,000 | $ | 6.27 | $ | 51,044 | 5.7 years | |||||
| Granted | 88,300 | $ | 18.88 | ||||||||
| Exercised | (1,929,600 | ) | $ | 5.32 | $ | 25,515 | |||||
| Expired | (129,800 | ) | $ | 18.15 | |||||||
| Forfeited | (90,700 | ) | $ | 8.66 | |||||||
| Outstanding at February 1, 2015 | 2,545,200 | $ | 6.75 | $ | 32,382 | 5.6 years | |||||
| Exercisable at February 1, 2015 | 2,227,400 | $ | 5.65 | $ | 30,775 | 5.2 years | |||||
Additional information regarding stock options outstanding as of February 1, 2015 is as follows:
| Options Outstanding | Options Exercisable | ||||||||||||||||
| Weighted Average | |||||||||||||||||
| Remaining | |||||||||||||||||
| Contractual Life | Weighted Average | Weighted Average | |||||||||||||||
| Range of Exercise Prices | Shares | (Years) | Exercise Price | Shares | Exercise Price | ||||||||||||
| $ | 1.40 | - | $ | 3.08 | 962,600 | 3.9 | $ | 2.65 | 962,600 | $ | 2.65 | ||||||
| $ | 6.39 | - | $ | 9.71 | 1,259,000 | 6.1 | $ | 7.02 | 1,154,000 | $ | 7.02 | ||||||
| $ | 17.47 | - | $ | 19.00 | 323,600 | 9.1 | $ | 17.86 | 110,800 | $ | 17.47 | ||||||
97
In addition to stock options, the Company periodically has awarded restricted stock and restricted stock units (which are settled in common stock). The fair value of the restricted stock and restricted stock units is equal to the quoted market price of the Company’s common stock on the date of grant. The following table summarizes changes in unvested restricted stock and restricted stock unit awards for fiscal 2015, 2014 and 2013:
| Weighted | ||||||
| Average Grant | ||||||
| Unvested | Date Fair | |||||
| Shares | Value | |||||
| Unvested at January 29, 2012 | 1,056,500 | $ | 5.95 | |||
| Granted | 757,700 | $ | 10.28 | |||
| Vested | (497,300 | ) | $ | 5.76 | ||
| Forfeited | (78,700 | ) | $ | 6.49 | ||
| Unvested at February 3, 2013 | 1,238,200 | $ | 8.65 | |||
| Granted | 300,200 | $ | 18.14 | |||
| Vested | (509,900 | ) | $ | 8.46 | ||
| Forfeited | (52,600 | ) | $ | 7.38 | ||
| Unvested at February 2, 2014 | 975,900 | $ | 11.73 | |||
| Granted | 129,700 | $ | 19.13 | |||
| Vested | (480,700 | ) | $ | 11.45 | ||
| Forfeited | (80,300 | ) | $ | 12.35 | ||
| Unvested at February 1, 2015 | 544,600 | $ | 13.65 | |||
The total fair value as of the grant date of the restricted stock and restricted stock unit awards vesting during fiscal 2015, 2014 and 2013 was $2.5 million, $4.3 million and $2.9 million, respectively.
As of February 1, 2015, the total unrecognized compensation cost related to SBP awards was approximately $8.8 million. The remaining service periods over which compensation cost will be recognized for these awards range from approximately three months to four years, with a weighted average remaining service period of approximately 1.5 years.
At February 1, 2015, there were approximately 6.6 million shares of common stock reserved for issuance pursuant to awards granted under the 2012 Plan and predecessor plans.
Common Shares and Warrants Issued in Connection With Settlement of Litigation
In fiscal 2008, the Company issued warrants to acquire 4.3 million shares of common stock at a price of $12.21 per share in connection with the settlement of certain litigation. The warrants expired unexercised on March 2, 2012.
Warrant Issued in Exchange for Services
In fiscal 2006, the Company issued a warrant to purchase 1.2 million shares of the Company’s common stock at a price of $7.75 per share as part of the consideration paid to a corporate recovery and advisory firm. The warrant expired unexercised on January 31, 2013.
Tax Asset Protection Plan
As of February 1, 2015, the Company had approximately $159 million of federal net operating losses, as well as state net operating losses and federal foreign tax credits, that can be carried forward to future years to reduce the amount of taxes payable by the Company in subsequent years. These carryforwards are more fully described in Note 16.
Under the Internal Revenue Code (the “Code”), the Company’s ability to make use of these carryforwards would be subject to limitation in the event of a cumulative change of more than 50% of the Company’s shares during any three year period by shareholders owning 5% or more of the Company’s stock.
Because a limitation in the Company’s ability to utilize its tax carryforwards could increase the amount of the Company’s future tax payments or accelerate the timing of such payments, in January 2013, the Company’s Board of Directors adopted a tax asset protection plan (the “Plan”) intended to discourage persons from acquiring more than 4.99% of the Company’s common shares, in order to reduce the likelihood of an ownership change and a resulting limitation on the Company’s ability to utilize its carryforwards that could adversely affect the Company’s cash flows. Under the Plan, subject to certain exceptions, the acquisition by any person or group of 4.99% or more of the Company’s outstanding shares of common stock could have resulted in significant dilution in the ownership and economic interest of such acquiring person.
Under the Plan, the Board was granted the discretion to exempt persons from the 4.99% threshold if it were to determine that such ownership is in the best interests of shareholders and not inconsistent with the purpose of the Plan. During fiscal 2014, the Board granted one person a limited exemption from the 4.99% threshold.
98
In January 2015, the Company’s Board of Directors determined that the Plan was no longer necessary to protect the Company’s income tax assets and amended it to accelerate its expiration to February 2, 2015, effectively terminating the Plan.
Repurchases of Common Shares
In fiscal 2014, the Company’s Board of Directors authorized the repurchase of up to $50 million of the Company's common stock, and subsequently twice increased such authorization such that it now totals $105 million. The authorization has no expiration date. Through February 1, 2015, the Company had cumulatively repurchased approximately 3,422,000 shares under the repurchase authorization at an average price of $17.99 per share, for a total cost of $61.6 million.
In fiscal 2013, the Company repurchased $20 million of its common stock pursuant to an earlier authorization.
During each of the last three fiscal years, the Company permitted holders of restricted stock awards to satisfy their obligations to reimburse the Company for the minimum required statutory withholding taxes arising from the vesting of such awards by surrendering vested common shares in lieu of reimbursing the Company in cash. The aggregate fair value of common shares surrendered related to the vesting of restricted stock awards was $2.8 million, $2.6 million and $758,000 in fiscal 2015, 2014 and 2013, respectively. The aggregate fair value of the surrendered shares has been reflected as a financing activity in the accompanying consolidated statement of cash flows and as a repurchase of common shares in the accompanying consolidated statement of changes in shareholders’ equity.
99
The following table summarizes repurchases of common stock for fiscal 2015, 2014 and 2013:
| Year Ended | |||||||||||||||
| February 1, | February 2, | February 3, | |||||||||||||
| 2015 | 2014 | 2013 | |||||||||||||
| Common | Common | Common | |||||||||||||
| Shares | Stock | Shares | Stock | Shares | Stock | ||||||||||
| (In thousands) | |||||||||||||||
| Shares repurchased under share | |||||||||||||||
| repurchase authorizations | 2,237 | $ | 39,225 | 1,185 | $ | 22,342 | 3,113 | $ | 20,000 | ||||||
| Shares surrendered in reimbursement | |||||||||||||||
| for withholding taxes | 153 | 2,811 | 136 | 2,560 | 100 | 758 | |||||||||
| 2,390 | $ | 42,036 | 1,321 | $ | 24,902 | 3,213 | $ | 20,758 | |||||||
Note 15 — Impairment Charges and Lease Termination Costs
The components of impairment charges and lease termination costs are as follows:
| Year Ended | ||||||||||
| February 1, | February 2, | February 3, | ||||||||
| 2015 | 2014 | 2013 | ||||||||
| (In thousands) | ||||||||||
| Impairment of long-lived assets - current period charges | $ | 901 | $ | - | $ | - | ||||
| Lease termination costs: | ||||||||||
| Provision for termination costs | 56 | 1,374 | 306 | |||||||
| Less - reversal of previously recorded accrued rent expense | (2 | ) | - | - | ||||||
| 54 | 1,374 | 306 | ||||||||
| Total impairment charges and lease termination costs | $ | 955 | $ | 1,374 | $ | 306 | ||||
The Company tests long-lived assets for impairment when events or changes in circumstances indicate that their carrying value may not be recoverable. These events and changes in circumstances include store closing and refranchising decisions, the effects of changing costs on current results of operations, unfavorable observed trends in operating results, and evidence of changed circumstances observed as a part of periodic reforecasts of future operating results and as part of the Company’s annual budgeting process. When the Company concludes that the carrying value of long-lived assets is not recoverable (based on future projected undiscounted cash flows), the Company records impairment charges to reduce the carrying value of those assets to their estimated fair values. The fair values of these assets are estimated based on the present value of estimated future cash flows, on independent appraisals and, in the case of assets the Company currently is negotiating to sell, based on the Company’s negotiations with unrelated third-party buyers. Impairment charges related to Company Stores long-lived assets were $901,000 in fiscal 2015. Such charges relate to an underperforming store which management believed would not generate sufficient future cash flows to enable the Company to recover the carrying value of the store’s assets, but which management had not yet decided to close. The store’s impaired assets consist of a building constructed on leased land and certain other equipment.
Lease termination costs represent the estimated fair value of liabilities related to unexpired leases, after reduction by the amount of accrued rent expense, if any, related to the leases, and are recorded when the lease contracts are terminated or, if earlier, the date on which the Company ceases use of the leased property. The fair value of these liabilities were estimated as the excess, if any, of the contractual payments required under the unexpired leases over the current market lease rates for the properties, discounted at a credit-adjusted risk-free rate over the remaining term of the leases. The provision for lease termination costs also includes adjustments to liabilities recorded in prior periods arising from changes in estimated sublease rentals and from settlements with landlords.
In November 2013, the Fairfax County court entered a judgment against the Company in its dispute with the landlord of a former Company commissary in Lorton, Virginia. Following entry of the judgment, the Company recorded an additional lease termination charge of approximately $1.4 million related to the matter, and in the fourth quarter of fiscal 2014 settled with the landlord on all issues in exchange for a payment by the Company of $1.8 million.
100
The transactions reflected in the accrual for lease termination costs are summarized as follows:
| Year Ended | ||||||||||||
| February 1, | February 2, | February 3, | ||||||||||
| 2015 | 2014 | 2013 | ||||||||||
| (In thousands) | ||||||||||||
| Balance at beginning of year | $ | 178 | $ | 646 | $ | 709 | ||||||
| Provision for lease termination costs: | ||||||||||||
| Provisions associated with store closings, net of estimated | ||||||||||||
| sublease rentals | 44 | - | - | |||||||||
| Adjustments to previously recorded provisions resulting from settlements | ||||||||||||
| with lessors and adjustments of previous estimates | (5 | ) | 1,351 | 276 | ||||||||
| Accretion of discount | 17 | 23 | 30 | |||||||||
| Total provision | 56 | 1,374 | 306 | |||||||||
| Payments on unexpired leases, including settlements with lessors | (118 | ) | (1,842 | ) | (369 | ) | ||||||
| Balance at end of year | $ | 116 | $ | 178 | $ | 646 | ||||||
| Accrued lease termination costs are included in the consolidated balance sheet | ||||||||||||
| as follows: | ||||||||||||
| Accrued liabilities | $ | 94 | $ | 74 | $ | 464 | ||||||
| Other long-term obligations and deferred credits | 22 | 104 | 182 | |||||||||
| $ | 116 | $ | 178 | $ | 646 | |||||||
Note 16 — Income Taxes
The components of the provision for income taxes are as follows:
| Year Ended | |||||||||
| February 1, | February 2, | February 3, | |||||||
| 2015 | 2014 | 2013 | |||||||
| (In thousands) | |||||||||
| Current | $ | 2,427 | $ | 2,790 | $ | 2,124 | |||
| Deferred | 15,729 | 8,014 | 13,413 | ||||||
| $ | 18,156 | $ | 10,804 | $ | 15,537 | ||||
A reconciliation of the tax provision computed at the statutory federal income tax rate and the Company’s provision for income taxes follows:
| Year Ended | ||||||||||||
| February 1, | February 2, | February 3, | ||||||||||
| 2015 | 2014 | 2013 | ||||||||||
| (In thousands) | ||||||||||||
| Income taxes at statutory federal rate | $ | 16,875 | $ | 15,771 | $ | 12,710 | ||||||
| State income taxes, net of federal income tax benefit | 1,662 | 1,902 | 1,340 | |||||||||
| Reversal of valuation allowance on deferred income tax assets | (150 | ) | (4,306 | ) | - | |||||||
| Benefit of foreign tax credits in excess of benefit previously recorded | - | (4,481 | ) | - | ||||||||
| Foreign taxes, principally withholding taxes | 2,457 | 2,309 | 2,168 | |||||||||
| Credit for foreign income taxes | (2,457 | ) | (2,309 | ) | - | |||||||
| Deduction for foreign income taxes | - | - | (759 | ) | ||||||||
| Other changes in tax credit carryforwards | - | 118 | (86 | ) | ||||||||
| Accruals for uncertain tax positions | - | 359 | (50 | ) | ||||||||
| Accruals for interest and penalties | 15 | 3 | (82 | ) | ||||||||
| Reduction in net deferred tax assets from enacted change in North Carolina | ||||||||||||
| statutory income tax rate | - | 686 | - | |||||||||
| Other changes in estimated future blended state income tax rate | 73 | 31 | (565 | ) | ||||||||
| Other | (319 | ) | 721 | 861 | ||||||||
| $ | 18,156 | $ | 10,804 | $ | 15,537 | |||||||
101
The Company establishes valuation allowances for deferred income tax assets in accordance with GAAP, which provides that such valuation allowances shall be established unless realization of the income tax benefits is more likely than not.
In the fourth quarter of fiscal 2014, after considering all relevant factors and objectively verifiable evidence having an impact on the likelihood of future realization of the Company’s deferred tax assets, management concluded that it was more likely than not that deferred tax assets would be realized in future years in excess of amounts previously estimated. Accordingly, the Company reversed $4.3 million of the valuation allowance on deferred tax assets, with an offsetting credit to the provision for income taxes. The deferred tax assets with respect to which management concluded that a valuation allowance was no longer required related principally to state income tax net operating loss carryovers.
Also in the fourth quarter of fiscal 2014, the Company concluded that foreign tax credit carryovers related to certain tax years which management previously forecasted would be deducted from future taxable income rather than being taken as a credit against future income taxes payable, would ultimately be taken as a credit rather than as a deduction. The resulting increase in management’s estimate of the amount of tax benefits to be realized from the credit carryovers also was reflected as a credit to income tax expense in the fourth quarter of fiscal 2014. The effect of the change in estimate with respect to foreign tax credit carryovers generated in prior years was $4.5 million. The effect of the change in estimate with respect to the $2.3 million of foreign taxes paid in fiscal 2014 was approximately $1.5 million.
The aggregate credit to income tax expense in the fourth quarter of fiscal 2014 from the reduction in management’s estimate of the necessary valuation allowance at February 2, 2014, and the increase in the aggregate amount of tax benefits expected to be realized from the foreign tax credit carryovers, was $10.3 million. All of both adjustments resulted from the increase in the fourth quarter of fiscal 2014 in management’s estimate of the amount of annual pretax income to be earned in future periods.
As of February 1, 2015 and February 2, 2014, the Company had approximately $5.2 million of foreign tax credits related to other tax years which the Company continued to forecast would be reflected as a deduction from future taxable income rather than as a credit against future taxes payable.
In the second quarter of fiscal 2014, the North Carolina state legislature enacted a prospective reduction in the corporate income tax rate, which caused the Company to revalue its deferred income tax assets to reflect the lower income tax rate. Such revaluation reduced the Company’s deferred tax assets by approximately $1.0 million. Because a portion of these deferred tax assets was already subject to a valuation allowance, the revaluation of the assets resulted in a reduction in the necessary valuation allowance of $314,000. The effect of the legislation was therefore to reduce the Company’s net deferred tax assets by $686,000, with a corresponding charge to income tax expense.
The Company recognizes deferred income tax assets and liabilities based upon management’s expectation of the future tax consequences of temporary differences between the income tax and financial reporting bases of assets and liabilities. Deferred tax liabilities generally represent tax expense recognized for which payment has been deferred, or expenses which have been deducted in the Company’s tax returns but which have not yet been recognized as an expense in the financial statements. Deferred tax assets generally represent tax deductions or credits that will be reflected in future tax returns for which the Company has already recorded a tax benefit in its consolidated financial statements.
The tax effects of temporary differences are as follows:
| February 1, | February 2, | |||||||
| 2015 | 2014 | |||||||
| (In thousands) | ||||||||
| Deferred income tax assets: | ||||||||
| Goodwill and other intangible assets | $ | 2,830 | $ | 5,710 | ||||
| Allowance for doubtful accounts | 191 | 93 | ||||||
| Other current assets | 1,124 | 989 | ||||||
| Property and equipment | 6,202 | 5,083 | ||||||
| Other non-current assets | 2,777 | 2,830 | ||||||
| Self-insurance accruals | 3,434 | 3,586 | ||||||
| Deferred revenue | 2,608 | 2,584 | ||||||
| Accrued compensation | 5,154 | 4,938 | ||||||
| Other current liabilities | 998 | 1,263 | ||||||
| Other non-current liabilities | 3,488 | 3,444 | ||||||
| Share-based compensation | 8,489 | 10,507 | ||||||
| Federal net operating loss carryforwards | 34,709 | 48,171 | ||||||
| Federal tax credit carryforwards | 12,642 | 10,216 | ||||||
| State net operating loss and credit carryforwards | 8,938 | 10,083 | ||||||
| Other | 505 | 486 | ||||||
| Gross deferred income tax assets | 94,089 | 109,983 | ||||||
| Valuation allowance on deferred income tax assets | (2,566 | ) | (2,675 | ) | ||||
| Deferred income tax assets, net of valuation allowance | 91,523 | 107,308 | ||||||
| Deferred income tax liabilities | - | - | ||||||
| Net deferred income tax assets | $ | 91,523 | $ | 107,308 | ||||
102
Deferred income tax assets are reflected in the accompanying balance sheet as follows:
| February 1, | February 2, | |||||
| 2015 | 2014 | |||||
| (In thousands) | ||||||
| Net current assets | $ | 23,245 | $ | 23,847 | ||
| Net noncurrent assets | 68,278 | 83,461 | ||||
| $ | 91,523 | $ | 107,308 | |||
The changes in the valuation allowance on deferred income tax assets are summarized as follows:
| Year Ended | ||||||||||||
| February 1, | February 2, | February 3, | ||||||||||
| 2015 | 2014 | 2013 | ||||||||||
| (In thousands) | ||||||||||||
| Valuation allowance on deferred tax assets: | ||||||||||||
| Balance at beginning of year | $ | 2,675 | $ | 9,767 | $ | 10,652 | ||||||
| Reduction in allowance due to amendment of tax return | - | - | (885 | ) | ||||||||
| Reversal of allowance credited to earnings | (150 | ) | (4,306 | ) | - | |||||||
| Reclassification of valuation allowance against deferred tax assets | ||||||||||||
| not affecting earnings | - | (2,472 | ) | - | ||||||||
| Reduction in valuation allowance related to enacted change in | ||||||||||||
| North Carolina statutory income tax rate | - | (314 | ) | - | ||||||||
| Other | 41 | - | - | |||||||||
| Balance at end of year | $ | 2,566 | $ | 2,675 | $ | 9,767 | ||||||
During fiscal 2013, the Company’s gross deferred tax assets and the related valuation allowance were each reduced in the amount of $885,000 as a result of the Company’s amendment of a prior year income tax return; the amendment had no effect on the Company’s net deferred tax assets.
As more fully described above, in the fourth quarter of fiscal 2014, the Company concluded that foreign tax credit carryovers related to certain tax years which management previously forecasted would be deducted from future taxable income rather than being taken as a credit against future income taxes payable, would, based on estimates of future annual taxable income updated in the fourth quarter, ultimately be taken as a credit rather than as a deduction. As of February 3, 2013, foreign tax credits related to other, earlier years, which total approximately $3.8 million, were reflected as foreign tax credit deferred tax assets, partially offset by a valuation allowance of $2.5 million to reduce their carrying value to the amount of tax benefit the Company forecasted ultimately would be realized. In the fourth quarter of fiscal 2014, the Company reversed the $3.8 million foreign tax credit deferred tax asset and the related $2.5 million valuation allowance related to these earlier years, and reclassified the net carrying value of $1.3 million to the federal net operating loss carryforward deferred tax asset based on management’s plans to amend tax returns related to those years to utilize the foreign tax credits as deductions. Such reversal and reclassification had no effect on the net carrying value of the Company’s deferred tax assets or on income tax expense.
The valuation allowance of $2.6 million as of February 1, 2015 represents the portion of the Company’s deferred tax assets management estimates will not be realized in the future. Such assets are associated principally with state net operating loss carryforwards related to states in which the scope of the Company’s operations has decreased, which adversely affects the Company’s ability to realize the net operating loss carryforwards because the Company has little income earned in or apportioned to those states.
Realization of net deferred tax assets generally is dependent on generation of taxable income in future periods. While management believes its forecast of future taxable income is reasonable, actual results inevitably will vary from management’s forecasts. Such variances could result in adjustments to the valuation allowance on deferred tax assets in future periods, and such adjustments could be material to the financial statements.
103
The Company has approximately $103 million of federal income tax loss carryforwards expiring in fiscal 2027 through 2031. In addition to this amount, the Company has approximately $56 million of income tax loss carryforwards resulting from tax deductions related to stock options and other equity awards to employees, the tax benefits of which, if subsequently realized, will be recorded as additions to common stock; the amount of such potential benefits is approximately $21 million. The Company also has state income tax loss carryforwards expiring in fiscal 2016 through 2033. The Company has $12.6 million of federal tax credit carryforwards expiring in fiscal 2021 through 2035, principally consisting of federal foreign tax credit carryforwards.
In fiscal 2008, the Company issued warrants to acquire shares of the Company’s common stock at $12.21 per share as more fully described in Note 14. The warrants expired unexercised in the first quarter of fiscal 2013 and, accordingly, the Company will not be entitled to any income tax deductions related to them. Deferred tax assets at January 29, 2012 included approximately $7.2 million related to these warrants. In accordance with GAAP, such amounts were charged to common stock in the first quarter of fiscal 2013 because common stock in the accompanying consolidated balance sheet includes cumulative credits related to share based compensation in excess of such amounts.
In fiscal 2006, the Company issued a warrant to acquire shares of the Company’s common stock at $7.75 per share as more fully described in Note 14. The warrant expired unexercised in the fourth quarter of fiscal 2013 and, accordingly, the Company will not be entitled to any income tax deductions related to it. Deferred tax assets at January 29, 2012 included approximately $2.6 million related to the warrant. In accordance with GAAP, such amounts were charged to common stock in the fourth quarter of fiscal 2013 because common stock in the accompanying consolidated balance sheet includes cumulative credits related to share based compensation in excess of such amounts.
The Company is subject to U.S. federal income tax, as well as income tax in multiple U.S. state and local jurisdictions and a limited number of foreign jurisdictions. The Company’s income tax returns periodically are examined by the Internal Revenue Service (the “IRS”) and by other tax authorities in various jurisdictions. The Company assesses the likelihood of adverse outcomes resulting from these examinations in determining the provision for income taxes. Because of special rules applicable to companies which have incurred net operating losses that may be carried back to earlier years or forward to subsequent years, the Company’s income tax returns for fiscal 2002 and later years are subject to examination and adjustment notwithstanding the normal three year statute of limitations. With the exception of fiscal 2010, which was examined by the IRS, without adjustment, the IRS has not examined the Company’s federal income tax returns for years subsequent to fiscal 2004. The Company’s state income tax returns generally are subject to adjustment by state tax authorities for similar reasons.
Income tax payments, net of refunds, were $2.5 million, $2.5 million and $2.3 million in fiscal 2015, 2014 and 2013, respectively. The tax payments in all three fiscal years were comprised largely of foreign withholding taxes on amounts received from foreign franchisees.
The following table presents a reconciliation of the beginning and ending amounts of unrecognized tax benefits:
| Year Ended | ||||||||||||
| February 1, | February 2, | February 3, | ||||||||||
| 2015 | 2014 | 2013 | ||||||||||
| (In thousands) | ||||||||||||
| Unrecognized tax benefits at beginning of year | $ | 1,952 | $ | 1,327 | $ | 1,378 | ||||||
| Increases related to positions taken in the current year | 108 | 105 | 128 | |||||||||
| Increases (decreases) related to positions taken in prior years | (21 | ) | 702 | - | ||||||||
| Lapsing of statutes of limitations | (74 | ) | (182 | ) | (179 | ) | ||||||
| Unrecognized tax benefits at end of year | $ | 1,965 | $ | 1,952 | $ | 1,327 | ||||||
Approximately all of the aggregate $2.0 million of unrecognized income tax benefits at February 1, 2015, would, if recognized, be reflected as a reduction in income tax expense.
Management does not expect any material change in fiscal 2016 in the amount of unrecognized tax benefits.
The Company’s policy is to recognize interest and penalties related to income tax issues as components of income tax expense. The Company’s balance sheet reflects approximately $313,000 and $298,000 of accrued interest and penalties as of February 1, 2015 and February 2, 2014, respectively.
104
Note 17 — Related Party Transactions
All franchisees are required to purchase doughnut mix and production equipment from the Company. Revenues include $9.5 million, $9.4 million and $8.9 million in fiscal 2015, 2014 and 2013, respectively, of KK Supply Chain sales to stores owned by franchisees in which the Company has an ownership interest. Revenues also include royalties from these franchisees of $1.3 million in each of fiscal 2015, 2014 and 2013. Trade receivables from these franchisees are included in receivables from related parties as shown in Note 3. These transactions were conducted pursuant to and franchise agreements, the terms of which are substantially the same as the agreements with unaffiliated franchisees.
The Company’s franchisee for the Middle East was an affiliate of an entity which was the beneficial owner of approximately 13% of the Company’s common stock. On February 11, 2013, the affiliate reported that as of December 20, 2012, it no longer held an investment in the Company. The Company had transactions in the normal course of business with this franchisee (including sales of doughnut mix and equipment to the franchisee and royalties payable to the Company by the franchisee based on its sales at Krispy Kreme franchise stores) totaling approximately $6.7 million in fiscal 2013. Such transactions were conducted pursuant to development and franchise agreements, the terms of which are substantially the same as the agreements with other international franchisees.
Note 18 — Employee Benefit Plans
The Company has a 401(k) savings plan (the “401(k) Plan”) to which eligible employees may contribute up to 100% of their salary and bonus on a tax deferred basis, subject to statutory limitations. The Company currently matches 50% of the first 6% of compensation contributed by each employee to the 401(k) Plan. Contributions expense for this plan totaled approximately $910,000 in fiscal 2015, $860,000 in fiscal 2014 and $820,000 in fiscal 2013.
The Company also has a Nonqualified Deferred Compensation Plan (the “401(k) Mirror Plan”) designed to enable officers of the Company whose contributions to the 401(k) Plan are limited by certain statutory limitations to have the same opportunity to defer compensation as is available to other employees of the Company under the qualified 401(k) savings plan. Participants may defer from 1% to 15% of their base salary and from 1% to 100% of their bonus (reduced by their contributions to the 401(k) Plan), subject to statutory limitations, into the 401(k) Mirror Plan and may direct the investment of the amounts they have deferred. The investments, however, are not a legally separate fund of assets, are subject to the claims of the Company’s general creditors, and are included in other assets in the consolidated balance sheet. The corresponding liability to participants is included in other long-term obligations. The balance in the asset and corresponding liability account was $2.5 million and $2.6 million at February 1, 2015 and February 2, 2014, respectively.
Note 19 — Fair Value Measurements
The accounting standards for fair value measurements define fair value as the price that would be received for an asset or paid to transfer a liability in the principal or most advantageous market for the asset or liability in an orderly transaction between market participants at the measurement date.
The accounting standards for fair value measurements establish a three-level fair value hierarchy that prioritizes the inputs used to measure fair value. This hierarchy requires entities to maximize the use of observable inputs and minimize the use of unobservable inputs. The three levels of inputs used to measure fair value are as follows:
| ● | Level 1 - Quoted prices in active markets that are accessible at the measurement date for identical assets or liabilities. |
| ● | Level 2 - Observable inputs other than quoted prices included within Level 1, such as quoted prices for similar assets and liabilities in active markets; quoted prices for identical or similar assets and liabilities in markets that are not active; or other inputs that are observable or can be corroborated by observable market data. |
| ● | Level 3 - Unobservable inputs that are supported by little or no market activity and that are significant to the fair value measurement of the assets or liabilities. These include certain pricing models, discounted cash flow methodologies and similar techniques that use significant unobservable inputs. |
105
Assets and Liabilities Measured at Fair Value on a Recurring Basis
The following table presents the Company’s assets and liabilities that are measured at fair value on a recurring basis at February 1, 2015 and February 2, 2014.
| February 1, 2015(1) | |||||||||
| Level 1 | Level 2 | Level 3 | |||||||
| (In thousands) | |||||||||
| Assets: | |||||||||
| 401(k) mirror plan assets | $ | 2,496 | $ | - | $ | - | |||
| Liabilities: | |||||||||
| Agricultural commodity futures contracts | 874 | - | - | ||||||
| Gasoline commodity futures contracts | 937 | - | - | ||||||
| Total liabilities | $ | 1,811 | $ | - | $ | - | |||
| February 2, 2014(1) | |||||||||
| Level 1 | Level 2 | Level 3 | |||||||
| (In thousands) | |||||||||
| Assets: | |||||||||
| 401(k) mirror plan assets | $ | 2,585 | $ | - | $ | - | |||
| Liabilities: | |||||||||
| Agricultural commodity futures contracts | $ | 313 | $ | - | $ | - | |||
(1) There were no transfers of financial assets or liabilities among the levels within the fair value hierarchy during the years ended February 1, 2015 or February 2, 2014.
Assets and Liabilities Measured at Fair Value on a Non-Recurring Basis
The following table presents the nonrecurring fair value measurements recorded during fiscal 2015. There were no material nonrecurring fair value measurements recorded in fiscal 2014 or 2013.
| Year Ended February 1, 2015 | |||||||||||||
| Level 1 | Level 2 | Level 3 | Total gain (loss) | ||||||||||
| (In thousands) | |||||||||||||
| Long-lived assets | $ | - | $ | 270 | $ | - | $ | (901 | ) | ||||
During fiscal 2015, long-lived assets associated with a Krispy Kreme shop having an aggregate carrying value of $1.2 million were written down to their estimated fair value of $270,000, resulting in recorded impairment charges of $901,000 as described in Note 15. The charge relates to a store which currently generates negative cash flows and which management believes is unlikely to generate sufficient future cash flows to enable the Company to recover the carrying value of the stores’ assets. The $270,000 fair value of the asset group relates entirely to the portion of the equipment and fixtures in the store that management believes could be moved to a different shop in the event management decides to close the shop with respect to which the impairment charge was recorded; such amount was based on the replacement cost of the equipment and fixtures, after considering refurbishment and transportation costs. These inputs are classified as Level 2 within the valuation hierarchy. No significant value was ascribed to the shop’s building constructed on leased land because the value of such improvements likely would revert to the landlord if the Company closes the shop.
106
Fair Values of Financial Instruments at the Balance Sheet Dates
The carrying values and approximate fair values of certain financial instruments as of February 1, 2015 and February 2, 2014 were as follows:
| February 1, 2015 | February 2, 2014 | |||||||||||
| Carrying | Fair | Carrying | Fair | |||||||||
| Value | Value | Value | Value | |||||||||
| (In thousands) | ||||||||||||
| Assets: | ||||||||||||
| Cash and cash equivalents | $ | 50,971 | $ | 50,971 | $ | 55,748 | $ | 55,748 | ||||
| Receivables | 27,799 | 27,799 | 25,268 | 25,268 | ||||||||
| Receivables from equity method franchisees | 782 | 782 | 675 | 675 | ||||||||
| Liabilities: | ||||||||||||
| Accounts payable | 17,095 | 17,095 | 16,788 | 16,788 | ||||||||
| Agriculture commodity futures contracts | 874 | 874 | 313 | 313 | ||||||||
| Gasoline commodity futures contracts | 937 | 937 | - | - | ||||||||
| Lease obligations (including current portion) | 9,687 | 9,687 | 2,003 | 2,003 | ||||||||
The carrying values of all financial instruments approximate their fair values at February 1, 2015 and February 2, 2014.
Note 20 — Derivative Instruments
The Company is exposed to certain risks relating to its ongoing business operations. The primary risk managed by using derivative instruments is commodity price risk. The Company does not hold or issue derivative instruments for trading purposes.
The Company is exposed to credit-related losses in the event of non-performance by the counterparties to its derivative instruments. The Company mitigates this risk of nonperformance by dealing with highly rated counterparties.
Additional disclosure about the fair value of derivative instruments is included in Note 19.
Commodity Price Risk
The Company is exposed to the effects of commodity price fluctuations in the cost of ingredients of its products, of which flour, sugar and shortening are the most significant. In order to bring greater stability to the cost of ingredients, from time to time the Company purchases exchange-traded commodity futures contracts, and options on such contracts, for raw materials which are ingredients of its products or which are components of such ingredients, including wheat and soybean oil. The Company is also exposed to the effects of commodity price fluctuations in the cost of gasoline used by its delivery vehicles. To mitigate the risk of fluctuations in the price of its gasoline purchases, the Company may purchase exchange-traded commodity futures contracts and options on such contracts. The difference between the cost, if any, and the fair value of commodity derivatives is reflected in earnings because the Company has not designated any of these instruments as hedges. Gains and losses on these contracts are intended to offset losses and gains on the hedged transactions in an effort to reduce the earnings volatility resulting from fluctuating commodity prices. The settlement of commodity derivative contracts is reported in the consolidated statement of cash flows as a cash flow from operating activities. At February 1, 2015, the Company had commodity derivatives with an aggregate contract volume of 1.3 million bushels of wheat and 2.5 million gallons of gasoline. Other than the requirement to meet minimum margin requirements with respect to the commodity derivatives, there are no collateral requirements related to such contracts.
Interest Rate Risk
The Company is exposed to market risk from increases in interest rates on any borrowings outstanding under its secured revolving credit facility. As of February 1, 2015, there were no borrowings outstanding under such facility. During the second quarter of fiscal 2014, the Company repaid in full the remaining balance of its 2011 Term Loan.
On March 3, 2011, the Company entered into an interest rate derivative contract having an aggregate notional principal amount of $17.5 million. The derivative contract entitled the Company to receive from the counterparty the excess, if any, of the three-month LIBOR rate over 3.00% for each of the calendar quarters in the period beginning April 2012 and ending December 2015. The Company accounted for this derivative contract as a cash flow hedge. In the second quarter of fiscal 2014, as a result of the termination of the contract, the $516,000 unrealized loss on the contract previously included in AOCI was reclassified to earnings in the consolidated statement of income because the hedged forecasted transaction (interest on the 2011 Term Loan) would not occur.
107
Quantitative Summary of Derivative Positions and Their Effect on Results of Operations
The following table presents the fair values of derivative instruments included in the consolidated balance sheet as of February 1, 2015 and February 2, 2014:
| Liability Derivatives | ||||||||
| Fair Value | ||||||||
| Derivatives Not Designated as | February 1, | February 2, | ||||||
| Hedging Instruments | Balance Sheet Location | 2015 | 2014 | |||||
| (In thousands) | ||||||||
| Agricultural commodity futures contracts | Accrued liabilities | $ | 874 | $ | 313 | |||
| Gasoline commodity futures contracts | Accrued liabilities | 937 | - | |||||
| $ | 1,811 | $ | 313 | |||||
The effect of derivative instruments on the consolidated statement of income for the year ended February 1, 2015, February 2, 2014 and February 3, 2013, was as follows:
| Amount of Derivative Gain or (Loss) | |||||||||||||
| Recognized in Income | |||||||||||||
| Year Ended | |||||||||||||
| Derivatives Not Designated as Hedging | Location of Derivative Gain or (Loss) | February 1, | February 2, | February 3, | |||||||||
| Instruments | Recognized in Income | 2015 | 2014 | 2013 | |||||||||
| (In thousands) | |||||||||||||
| Agricultural commodity futures contracts | Direct operating expenses | $ | (903 | ) | $ | (1,459 | ) | $ | 837 | ||||
| Gasoline commodity futures contracts | Direct operating expenses | (1,221 | ) | - | - | ||||||||
| Total | $ | (2,124 | ) | $ | (1,459 | ) | $ | 837 | |||||
108
| Amount of Derivative Gain or (Loss) | |||||||||||||
| Recognized in Income | |||||||||||||
| Year Ended | |||||||||||||
| Location of Derivative Gain or (Loss) | February 1, | February 2, | February 3, | ||||||||||
| Derivatives Designated as a Cash Flow Hedge | Recognized in Income | 2015 | 2014 | 2013 | |||||||||
| (In thousands) | |||||||||||||
| Interest rate derivative | Interest expense | $ | - | $ | (39 | ) | $ | (34 | ) | ||||
| Interest rate derivative | Loss on retirement of debt | $ | - | $ | (516 | ) | $ | - | |||||
The effect of derivative instruments on other comprehensive income for the years ended February 1, 2015, February 2, 2014 and February 3, 2013, was as follows:
| Amount of Derivative Gain | |||||||||||||
| or (Loss) Recognized in OCI | |||||||||||||
| Year Ended | |||||||||||||
| Derivative Gain or (Loss) Recognized in | February 1, | February 2, | February 3, | ||||||||||
| Derivatives Designated as a Cash Flow Hedge | OCI | 2015 | 2014 | 2013 | |||||||||
| (In thousands) | |||||||||||||
| Interest rate derivative | Change in fair value of derivative | $ | - | $ | 36 | $ | (3 | ) | |||||
| Less-income tax effect | - | (14 | ) | 1 | |||||||||
| $ | - | $ | 22 | $ | (2 | ) | |||||||
| Loss on cash flow hedge | |||||||||||||
| reclassified to net income, | |||||||||||||
| previously charged to other | |||||||||||||
| comprehensive income | - | 516 | - | ||||||||||
| Less - income tax effect | - | (200 | ) | - | |||||||||
| - | 316 | - | |||||||||||
| Net change in amount recognized | |||||||||||||
| in OCI | $ | - | $ | 338 | $ | (2 | ) | ||||||
Note 21 — Acquisitions and Divestitures
Acquisition of Krispy Kreme Shops
On June 17, 2014, the Company acquired the business and operating assets of its franchisee in Birmingham, Alabama, consisting of four Krispy Kreme shops that had fiscal 2014 sales of approximately $9 million. The acquired assets also include the seller’s franchise rights for 13 counties in Alabama. The total consideration was approximately $7.5 million cash. In connection with the acquisition, the Company entered into leases with the seller for three of the shops and assumed a lease with an unrelated party on the fourth shop.
109
The Company recorded charges to earnings related to the acquisition of $431,000 in the quarter ended August 3, 2014, which are included in direct operating expenses. The charges include $343,000 for the settlement of the pre-existing franchise contract between the Company and the franchisee, certain terms of which were unfavorable, from the Company’s point of view, to current market terms. The charge was determined by discounting to present value as of the acquisition date the excess of royalties on the acquired business’s sales at the Company’s current prevailing royalty rates over the lower royalties otherwise payable by the former franchisee pursuant to the terminated franchise agreement. The discount rate used reflected both the time value of money and the level of risk associated with achievement of the related cash flows. The Company also expensed transaction costs related to the acquisition of $88,000.
The cost of the acquired business was allocated as follows:
| (In thousands) | ||||
| Purchase price allocated to: | ||||
| Working capital, exclusive of cash | $ | (5 | ) | |
| Property and equipment | 710 | |||
| Reacquired franchise rights associated with the Company Stores segment | 3,853 | |||
| Goodwill associated with the Company Stores segment | 2,594 | |||
| $ | 7,152 | |||
Amounts allocated to reacquired franchise rights are being amortized by charges to earnings on a straight-line basis through March 2020, which was the expiration date of the terminated franchise agreement. All of the goodwill recognized in the acquisition for financial reporting purposes is expected to be deductible for income tax purposes.
The results of operations of the acquired business subsequent to the acquisition had no material effect on the Company’s consolidated results of operations. The Company’s results of operations for the year ended February 2, 2014, computed on a pro forma basis assuming the acquisition had been consummated at the beginning of those periods, would not be materially different from the Company’s historical results of operations and, accordingly, have been omitted.
In December 2013, the Company acquired the land, building and doughnut-making equipment at a facility in Illinois that had fiscal 2014 sales of approximately $3 million. The aggregate purchase price for the facility was approximately $1.6 million cash, all of which was allocated to property and equipment. The facility was being operated as a Krispy Kreme shop pursuant to a management agreement approved by the Company between the facility’s former owner and one of the Company’s franchisees. The management agreement was terminated in connection with the Company’s acquisition of the facility, and was replaced by an operating agreement between the Company and the franchisee. Pursuant to the operating agreement, the Company agreed to permit the franchisee to continue to operate the facility for its account through June 2014 in exchange for monthly rental payments, and the payment of amounts based on the facility’s sales equivalent to the amounts that would be payable to the Company if the facility were subject to a franchise agreement. The Company assumed operation of the facility for its own account in July 2014. The Company’s results of operations for the year ended February 2, 2014, computed on a pro forma basis assuming the acquisition had been consummated at the beginning of those periods, would not be materially different from the Company’s historical results of operations and, accordingly, have been omitted.
On August 30, 2012, the Company acquired the assets and operations of one of its franchisees in exchange for $915,000 cash. The acquired assets consisted principally of two Krispy Kreme stores. The allocation of the purchase price was as follows: $464,000 to property and equipment, $8,000 to other assets, and the balance of $443,000 to reacquired franchise rights. The Company’s results of operations for the year ended February 3, 2013 on a pro forma basis assuming the acquisition had been consummated at the beginning of those periods are not materially different from the Company’s historical results of operations and, accordingly, have been omitted. The acquired business’s revenues and earnings for periods subsequent to the acquisition are not material to the Company’s consolidated financial statements.
Asset Divestitures
On September 9, 2014, the Company refranchised its retail Krispy Kreme shop in Rockville, Maryland to a new franchisee for approximately $1.8 million cash. The Company Stores segment realized a gain of $1.2 million on the refranchising transaction, which is reflected in direct operating expenses in fiscal 2015. The refranchising included the execution of a development agreement pursuant to which the new franchisee has agreed to develop an additional 20 retail Krispy Kreme shops in Virginia, Washington, DC and Maryland over the next seven years.
110
On July 11, 2013, the Company refranchised three Company-owned stores in the Dallas market to a new franchisee. The aggregate purchase price for the assets was $681,000 cash. The three stores had total sales of approximately $7.0 million in fiscal 2013, of which approximately 45% represented wholesales sales. The franchise agreements with the new franchisee do not include wholesale sales rights. The Company Stores segment recorded a gain of $876,000 on the refranchising transaction, which is included in direct operating expenses. The gain includes approximately $462,000 related to the sale of equipment, and approximately $414,000 related to the reversal of accrued rent expense related to a store lease assigned to the franchisee where the Company has been relieved of the primary lease obligation. The Company leased the other two stores, which the Company owned, to the franchisee. In connection with the refranchising, the Company executed a development agreement with the franchisee to develop 15 additional Krispy Kreme locations in the market through fiscal 2019. In October 2014, the franchisee purchased from the Company the two stores it previously leased for $2.1 million cash, which approximated the properties’ aggregate carrying value.
On February 22, 2013, the Company refranchised three stores in the Kansas/Missouri market to a new franchisee who was a former employee of the Company; the Company closed a fourth store in the market in January 2013 in anticipation of the transaction. The aggregate purchase price of the assets was approximately $1.1 million, evidenced by a 7% promissory note payable in installments equal to 3.5% of the stores’ sales beginning in February 2013. The four stores had total sales of approximately $9 million in fiscal 2013. The Company did not record a significant gain or loss on this refranchising transaction.
On September 27, 2012, the Company sold to one of its franchisees the leasehold interests and certain other assets, including rights under franchise agreements, of three Krispy Kreme stores operated by the franchisee. The Company acquired the leasehold interests and other assets related to the three stores from the franchisee in August 2006 for $2.9 million cash. After the Company’s acquisition of the assets, the franchisee continued to operate the stores for its own account pursuant to an operating agreement between the Company and the franchisee. The aggregate purchase price of the three stores and the related assets in the September 2012 transaction was approximately $3.6 million, of which approximately $360,000 was paid in cash at closing. The balance of the purchase price was evidenced by a promissory note in the approximate amount of $3.2 million, payable in monthly installments of approximately $51,000, including interest, beginning in November 2012, and a final installment of the remaining principal balance on October 1, 2017. The carrying value of the divested assets was approximately $1.9 million. Because the initial investment made by the franchisee to acquire the assets was less than the 20% minimum amount of the purchase price required by GAAP to recognize a gain on the sale, the Company initially deferred recognition of the $1.7 million gain, and such deferred gain was reflected as a reduction in the carrying value of the note receivable. Subsequently, the Company reported the principal and interest payments received from the franchisee as a reduction of the carrying value of the note. During the third quarter of fiscal 2014, the cumulative investment made by the franchisee to acquire the assets first exceeded the required 20% of the purchase price and, accordingly, the Company recognized the deferred gain of $1.7 million, which is reflected as a reduction in direct operating expenses of the Domestic Franchise segment. In addition, coincident with the recognition of the deferred gain, the Company recognized approximately $210,000 of interest income for interest payments received from the franchisee which initially were reported as a reduction in the carrying value of the note.
Note 22 — Selected Quarterly Financial Data (Unaudited)
The tables below present selected quarterly financial data for fiscal 2015 and 2014.
| Quarter Ended | |||||||||||||||
| May 4, | August 3, | November 2, | February 1, | ||||||||||||
| 2014 | 2014 | 2014 | 2015 | ||||||||||||
| (In thousands, except per share data) | |||||||||||||||
| Revenues | $ | 121,580 | $ | 120,516 | $ | 122,871 | $ | 125,367 | |||||||
| Operating expenses: | |||||||||||||||
| Direct operating expenses (exclusive of depreciation and | |||||||||||||||
| amortization expense shown below) | 95,172 | 101,084 | 101,165 | 102,323 | |||||||||||
| General and administrative expenses | 7,047 | 6,737 | 5,553 | 9,221 | |||||||||||
| Depreciation and amortization expense | 3,173 | 3,033 | 3,280 | 3,354 | |||||||||||
| Impairment charges and lease termination costs | 8 | 38 | 4 | 905 | |||||||||||
| Operating income | 16,180 | 9,624 | 12,869 | 9,564 | |||||||||||
| Interest income | 171 | 64 | 62 | 109 | |||||||||||
| Interest expense | (143 | ) | (162 | ) | (230 | ) | (321 | ) | |||||||
| Equity in losses of equity method franchisees | (57 | ) | (61 | ) | (53 | ) | 53 | ||||||||
| Other non-operating income and (expense), net | 168 | 152 | 91 | 136 | |||||||||||
| Income before income taxes | 16,319 | 9,617 | 12,739 | 9,541 | |||||||||||
| Provision for income taxes | 6,663 | 3,865 | 4,633 | 2,995 | |||||||||||
| Net income | $ | 9,656 | $ | 5,752 | $ | 8,106 | $ | 6,546 | |||||||
| Earnings per common share: | |||||||||||||||
| Basic | $ | 0.15 | $ | 0.09 | $ | 0.12 | $ | 0.10 | |||||||
| Diluted | $ | 0.14 | $ | 0.08 | $ | 0.12 | $ | 0.10 | |||||||
111
The sum of the quarterly earnings per share amounts does not necessarily equal earnings per share for the year.
| Quarter Ended | |||||||||||||||
| May 4, | August 3, | November 2, | February 1, | ||||||||||||
| 2014 | 2014 | 2014 | 2015 | ||||||||||||
| (In thousands) | |||||||||||||||
| Revenues by business segment: | |||||||||||||||
| Company Stores | $ | 80,448 | $ | 78,535 | $ | 82,579 | $ | 83,744 | |||||||
| Domestic Franchise | 3,499 | 3,296 | 3,274 | 3,381 | |||||||||||
| International Franchise | 6,581 | 7,534 | 6,852 | 7,631 | |||||||||||
| KK Supply Chain: | |||||||||||||||
| Total revenues | 60,312 | 59,503 | 61,581 | 63,292 | |||||||||||
| Less - intersegment sales elimination | (29,260 | ) | (28,352 | ) | (31,415 | ) | (32,681 | ) | |||||||
| External KK Supply Chain revenues | 31,052 | 31,151 | 30,166 | 30,611 | |||||||||||
| Total revenues | $ | 121,580 | $ | 120,516 | $ | 122,871 | $ | 125,367 | |||||||
| Operating income: | |||||||||||||||
| Company Stores | $ | 4,416 | $ | 1,261 | $ | 2,233 | $ | 1,377 | |||||||
| Domestic Franchise | 2,156 | 1,900 | 1,989 | 2,058 | |||||||||||
| International Franchise | 4,280 | 5,111 | 5,048 | 5,587 | |||||||||||
| KK Supply Chain | 12,754 | 8,489 | 9,529 | 11,051 | |||||||||||
| Total segment operating income | 23,606 | 16,761 | 18,799 | 20,073 | |||||||||||
| General and administrative expenses | (7,047 | ) | (6,737 | ) | (5,553 | ) | (9,221 | ) | |||||||
| Corporate depreciation and amortization expense | (371 | ) | (362 | ) | (373 | ) | (383 | ) | |||||||
| Impairment charges and lease termination costs | (8 | ) | (38 | ) | (4 | ) | (905 | ) | |||||||
| Consolidated operating income | $ | 16,180 | $ | 9,624 | $ | 12,869 | $ | 9,564 | |||||||
| Quarter Ended | |||||||||||||||
| May 5, | August 4, | November 3, | February 2, | ||||||||||||
| 2013 | 2013 | 2013 | 2014 | ||||||||||||
| (In thousands, except per share data) | |||||||||||||||
| Revenues | $ | 120,625 | $ | 112,729 | $ | 114,231 | $ | 112,746 | |||||||
| Operating expenses: | |||||||||||||||
| Direct operating expenses (exclusive of depreciation | |||||||||||||||
| and amortization expense shown below) | 96,558 | 93,806 | 92,466 | 93,302 | |||||||||||
| General and administrative expenses | 6,055 | 5,655 | 5,730 | 7,709 | |||||||||||
| Depreciation and amortization expense | 2,820 | 2,664 | 2,788 | 2,834 | |||||||||||
| Impairment charges and lease termination costs | 8 | 4 | 1,531 | (169 | ) | ||||||||||
| Operating income | 15,184 | 10,600 | 11,716 | 9,070 | |||||||||||
| Interest income | 61 | 70 | 341 | 144 | |||||||||||
| Interest expense | (437 | ) | (354 | ) | (131 | ) | (135 | ) | |||||||
| Loss on retirement of debt | - | (967 | ) | - | - | ||||||||||
| Equity in losses of equity method franchisees | (53 | ) | (60 | ) | (61 | ) | (47 | ) | |||||||
| Other non-operating income and (expense), net | (5 | ) | (1 | ) | 29 | 96 | |||||||||
| Income before income taxes | 14,750 | 9,288 | 11,894 | 9,128 | |||||||||||
| Provision for income taxes | 6,751 | 4,571 | 5,114 | (5,632 | ) | ||||||||||
| Net income | $ | 7,999 | $ | 4,717 | $ | 6,780 | $ | 14,760 | |||||||
| Earnings per common share: | |||||||||||||||
| Basic | $ | 0.12 | $ | 0.07 | $ | 0.10 | $ | 0.22 | |||||||
| Diluted | $ | 0.11 | $ | 0.07 | $ | 0.09 | $ | 0.21 | |||||||
112
The sum of the quarterly earnings per share amounts does not necessarily equal earnings per share for the year.
| Quarter Ended | |||||||||||||||
| May 5, | August 4, | November 3, | February 2, | ||||||||||||
| 2013 | 2013 | 2013 | 2014 | ||||||||||||
| (In thousands) | |||||||||||||||
| Revenues by business segment: | |||||||||||||||
| Company Stores | $ | 81,921 | $ | 75,689 | $ | 74,886 | $ | 74,329 | |||||||
| Domestic Franchise | 2,871 | 2,799 | 3,026 | 3,143 | |||||||||||
| International Franchise | 6,445 | 6,057 | 6,205 | 6,900 | |||||||||||
| KK Supply Chain: | |||||||||||||||
| Total revenues | 59,811 | 57,201 | 58,304 | 55,913 | |||||||||||
| Less - intersegment sales elimination | (30,423 | ) | (29,017 | ) | (28,190 | ) | (27,539 | ) | |||||||
| External KK Supply Chain revenues | 29,388 | 28,184 | 30,114 | 28,374 | |||||||||||
| Total revenues | $ | 120,625 | $ | 112,729 | $ | 114,231 | $ | 112,746 | |||||||
| Operating income: | |||||||||||||||
| Company Stores | $ | 5,314 | $ | 1,790 | $ | 2,599 | $ | 1,631 | |||||||
| Domestic Franchise | 1,439 | 1,526 | 3,156 | 1,962 | |||||||||||
| International Franchise | 4,531 | 4,239 | 4,449 | 4,758 | |||||||||||
| KK Supply Chain | 10,239 | 8,999 | 9,098 | 8,617 | |||||||||||
| Total segment operating income | 21,523 | 16,554 | 19,302 | 16,968 | |||||||||||
| General and administrative expenses | (6,055 | ) | (5,655 | ) | (5,730 | ) | (7,709 | ) | |||||||
| Corporate depreciation and amortization expense | (276 | ) | (295 | ) | (325 | ) | (358 | ) | |||||||
| Impairment charges and lease termination costs | (8 | ) | (4 | ) | (1,531 | ) | 169 | ||||||||
| Consolidated operating income | $ | 15,184 | $ | 10,600 | $ | 11,716 | $ | 9,070 | |||||||
| Item 9. | CHANGES IN AND DISAGREEMENTS WITH ACCOUNTANTS ON ACCOUNTING AND FINANCIAL DISCLOSURE. |
None.
Item 9A. CONTROLS AND PROCEDURES.
Evaluation of Disclosure Controls and Procedures
As of February 1, 2015, the end of the period covered by this Annual Report on Form 10-K, management performed, under the supervision and with the participation of the Company’s chief executive officer and chief financial officer, an evaluation of the effectiveness of the Company’s disclosure controls and procedures as defined in Rules 13a-15(e) and 15d-15(e) of the Exchange Act. The Company’s disclosure controls and procedures are designed to ensure that information required to be disclosed in the reports the Company files or submits under the Exchange Act is recorded, processed, summarized and reported within the time periods specified in the SEC’s rules and forms, and that such information is accumulated and communicated to management, including the Company’s chief executive officer and chief financial officer, to allow timely decisions regarding required disclosures. Based on this evaluation, the Company’s chief executive officer and chief financial officer have concluded that, as of February 1, 2015, the Company’s disclosure controls and procedures were effective.
Management’s Report on Internal Control over Financial Reporting
Management is responsible for establishing and maintaining adequate internal control over financial reporting, as such term is defined in Rules 13a-15(f) and 15d-15(f) of the Exchange Act. Internal control over financial reporting is a process, effected by an entity’s board of directors, management and other personnel, designed to provide reasonable assurance regarding the reliability of financial reporting and the preparation of consolidated financial statements for external purposes in accordance with GAAP. Internal control over financial reporting includes those policies and procedures which pertain to the maintenance of records that, in reasonable detail, accurately and fairly reflect the transactions and dispositions of assets; provide reasonable assurance that transactions are recorded as necessary to permit preparation of consolidated financial statements in accordance with GAAP; provide reasonable assurance that receipts and expenditures are being made only in accordance with management’s and/or the Board of Directors’ authorization; and provide reasonable assurance regarding prevention or timely detection of unauthorized acquisition, use or disposition of our assets that could have a material effect on our consolidated financial statements.
113
Because of its inherent limitations, internal control over financial reporting may not prevent or detect material errors in our financial statements. Also, projection of any evaluation of the effectiveness of our internal control over financial reporting to future periods is subject to the risk that controls may become inadequate because of changes in conditions, because the degree of compliance with our policies and procedures may deteriorate.
Management assessed the effectiveness of our internal control over financial reporting as of February 1, 2015, using the criteria established in Internal Control — Integrated Framework (2013) issued by the Committee of Sponsoring Organizations of the Treadway Commission (“COSO”). Based on our assessment, management has concluded that we maintained effective internal control over financial reporting as of February 1, 2015, based on the COSO criteria.
The effectiveness of the Company’s internal control over financial reporting as of February 1, 2015, has been audited by PricewaterhouseCoopers LLP, an independent registered public accounting firm, as stated in their report which appears herein.
Changes in Internal Control Over Financial Reporting
During the quarter ended February 1, 2015, there were no changes in the Company’s internal control over financial reporting that materially affected, or are reasonably likely to materially affect, the Company’s internal control over financial reporting.
None.
Item 10. DIRECTORS, EXECUTIVE OFFICERS AND CORPORATE GOVERNANCE.
Except as set forth below, the information required by this item is contained under the captions “Corporate Governance,” “Board of Directors,” “Election of Directors,” “Executive Officers,” and “Section 16(a) Beneficial Ownership Reporting Compliance” in our proxy statement for our 2015 Annual Meeting of Shareholders to be held on June 17, 2015, to be filed pursuant to Section 14 of the Exchange Act, and is incorporated herein by reference.
NYSE and SEC Certifications
In accordance with Section 303A.12(a) of the NYSE Listed Company Manual, the Chief Executive Officer of the Company submits annual certifications to the NYSE stating that he is not aware of any violations by the Company of the NYSE corporate governance listing standards, qualifying the certification to the extent necessary. The last such annual certification was submitted on July 7, 2014 and contained no qualifications.
We have filed certifications executed by our Chief Executive Officer and Chief Financial Officer with the SEC pursuant to Sections 302 and 906 of the Sarbanes-Oxley Act as exhibits to this Annual Report on Form 10-K.
Item 11. EXECUTIVE COMPENSATION.
The information required by this item is contained under the captions “Executive Compensation,” “Director Compensation,” and “Compensation Committee Interlocks and Insider Participation” in our proxy statement for our 2015 Annual Meeting of Shareholders to be held on June 17, 2015, to be filed pursuant to Section 14 of the Exchange Act, and is incorporated herein by reference.
| Item 12. | SECURITY OWNERSHIP OF CERTAIN BENEFICIAL OWNERS AND MANAGEMENT AND RELATED STOCKHOLDER MATTERS. |
The information required by this item is contained under the captions “Voting Securities and Principal Shareholders” and “Equity Compensation Plan Information” in our proxy statement for our 2015 Annual Meeting of Shareholders to be held on June 17, 2015, to be filed pursuant to Section 14 of the Exchange Act, and is incorporated herein by reference.
114
Item 13. CERTAIN RELATIONSHIPS AND RELATED TRANSACTIONS AND DIRECTOR INDEPENDENCE.
The information required by this item is contained under the captions “Corporate Governance” and “Transactions with Related Persons” in our proxy statement for our 2015 Annual Meeting of Shareholders to be held on June 17, 2015, to be filed pursuant to Section 14 of the Exchange Act, and is incorporated herein by reference.
Item 14. PRINCIPAL ACCOUNTANT FEES AND SERVICES
The information required by this item is contained under the caption “Information Related to Our Independent Registered Public Accounting Firm” in our proxy statement for our 2015 Annual Meeting of Shareholders to be held on June 17, 2015, to be filed pursuant to Section 14 of the Exchange Act, and is incorporated herein by reference.
Item 15. EXHIBITS AND FINANCIAL STATEMENT SCHEDULES.
(a) Financial Statements and Schedules
1. Financial Statements. See Item 8, “Financial Statements and Supplementary Data.”
2. Financial Statement Schedules.
For each of the three fiscal years in the period ended February 1, 2015:
| Schedule I — Condensed Financial Information of Registrant | 121 |
3. Exhibits.
The exhibits listed in the accompanying Exhibit Index are filed as part of this report.
115
Pursuant to the requirements of Section 13 or 15(d) of the Securities Exchange Act of 1934, the registrant has duly caused this report to be signed on its behalf by the undersigned, thereunto duly authorized.
| Krispy Kreme Doughnuts, Inc. | |||
| Date: April 2, 2015 | By: | /s/ Douglas R. Muir | |
| Name: | Douglas R. Muir | ||
| Title: | Chief Financial Officer | ||
| (Duly Authorized Officer and Principal Financial Officer) | |||
POWER OF ATTORNEY
Each person whose signature appears below hereby constitutes and appoints Tony Thompson and G. Price Cooper, IV, or either of them, his or her true and lawful attorney-in-fact and agent, with full power of substitution and resubstitution, for him or her and in his or her name, place and stead, in any and all capacities, to sign any or all amendments or supplements to this Annual Report on Form 10-K and to file the same with all exhibits thereto and other documents in connection therewith, with the Securities and Exchange Commission, granting unto said attorney-in-fact and agent full power and authority to do and perform each and every act and thing necessary or appropriate to be done with this Annual Report on Form 10-K and any amendments or supplements hereto, as fully to all intents and purposes as he or she might or could do in person, hereby ratifying and confirming all that said attorney-in-fact and agent, or his or her substitute or substitutes, may lawfully do or cause to be done by virtue hereof.
Pursuant to the requirements of the Securities Exchange Act of 1934, this report has been signed below by the following persons on behalf of the Registrant and in the capacities indicated on: April 2, 2015.
| Signature | Title | |
| /s/ James H. Morgan | Chairman of the Board of Directors | |
| James H. Morgan | ||
| /s/ Tony Thompson | Chief Executive Officer (Principal Executive | |
| Tony Thompson | Officer) and Director | |
| /s/ Douglas R. Muir | Executive Vice President and Chief Financial Officer | |
| Douglas R. Muir | (Principal Financial and Accounting Officer) | |
| /s/ Tim E. Bentsen | Director | |
| Tim E. Bentsen | ||
| /s/ Charles A. Blixt | Director | |
| Charles A. Blixt | ||
| /s/ Lynn Crump-Caine | Director | |
| Lynn Crump-Caine | ||
| /s/ Carl E. Lee, Jr. | Director | |
| Carl E. Lee, Jr. | ||
| /s/ C. Stephen Lynn | Director | |
| C. Stephen Lynn | ||
| /s/ Robert S. McCoy, Jr. | Director | |
| Robert S. McCoy, Jr. | ||
| /s/ Andrew J. Schindler | Director | |
| Andrew J. Schindler | ||
| /s/ Michael H. Sutton | Director | |
| Michael H. Sutton | ||
| /s/ Lizanne Thomas | Director | |
| Lizanne Thomas | ||
| /s/ Togo D. West, Jr. | Director | |
| Togo D. West, Jr. | ||
116
| Exhibit Number |
Description of Exhibits | |||
| 3.1 | — | Restated Articles of Incorporation of the Registrant (incorporated by reference to exhibit 3.1 to the Registrant’s Annual Report on Form 10-K filed on April 15, 2010) | ||
| 3.2 | — | Articles of Amendment dated June 18, 2013 to the Restated Articles of Incorporation of the Registrant (incorporated by reference to the Registrant’s Current Report on Form 8-K filed on June 19, 2013) | ||
| 3.3 | — | Amended and Restated Bylaws of the Registrant (incorporated by reference to Exhibit 3.1 to the Registrant’s Current Report on Form 8-K filed December 15, 2008) | ||
| 4.1 | — | Form of Certificate for Common Stock (incorporated by reference to Exhibit 4.1 to the Registrant’s Amendment No. 4 to Registration Statement on Form S-1 (Commission File No. 333-92909) filed on April 3, 2000) | ||
| 4.2 | — | Tax Asset Protection Plan between the Krispy Kreme Doughnuts, Inc. and American Stock Transfer & Trust Company, LLC, as Rights Agent, dated as of January 14, 2013 (incorporated by reference to Exhibit 4.1 to the Registrant’s Current Report on Form 8-K filed on January 15, 2013) | ||
| 4.3 | — | Amendment No. 1 to Tax Asset Protection Plan between the Krispy Kreme Doughnuts, Inc. and American Stock Transfer & Trust Company, LLC, as Rights Agent, dated as of February 2, 2015 (incorporated by reference to Exhibit 4.2 to the Registrant’s Current Report on Form 8-K filed on February 5, 2015) | ||
| 10.1 | — | Trademark License Agreement, dated May 27, 1996, between HDN Development Corporation and Krispy Kreme Doughnut Corporation (incorporated by reference to Exhibit 10.22 to the Registrant’s Amendment No. 1 to Registration Statement on Form S-1 (Commission File No. 333-92909), filed on February 22, 2000) | ||
| 10.2 | — | Employment Agreement, dated as of May 13, 2014, among Krispy Kreme Doughnuts, Inc., Krispy Kreme Doughnut Corporation and Anthony N. Thompson (incorporated by reference to Exhibit 10.1 to the Registrant’s Current Report on Form 8-K filed on May 13, 2014)** | ||
| 10.3 | — | Amended and Restated Employment Agreement, dated as of June 30, 2013, among Krispy Kreme Doughnuts, Inc., Krispy Kreme Doughnut Corporation and James H. Morgan (incorporated by reference to Exhibit 10.1 to the Registrant’s Current Report on Form 8-K filed on July 1, 2013)** | ||
| 10.4 | — | Amended and Restated Employment Agreement, dated as of March 11, 2011, among Krispy Kreme Doughnuts, Inc., Krispy Kreme Doughnut Corporation and Douglas R. Muir (incorporated by reference to Exhibit 10.2 to the Registrant’s Current Report on Form 8-K filed on March 17, 2011)** | ||
| 10.5 | * | — | Employment Agreement, dated as of January 26, 2015, among Krispy Kreme Doughnuts, Inc., Krispy Kreme Doughnut Corporation and G. Price Cooper, IV** | |
| 10.6 | — | Amended and Restated Employment Agreement, dated as of March 11, 2011, among Krispy Kreme Doughnuts, Inc., Krispy Kreme Doughnut Corporation and Cynthia A. Bay (incorporated by reference to Exhibit 10.8 to the Registrant’s Annual Report on Form 10-K filed on March 31, 2011)** | ||
| 10.7 | — | Employment Agreement, dated as of March 24, 2014, among Krispy Kreme Doughnuts, Inc., Krispy Kreme Doughnut Corporation and Daniel L. Beem (incorporated by reference to Exhibit 10.4 to the Registrant’s Annual Report on Form 10-K filed on April 3, 2014) ** | ||
| 10.8 | — | Amended and Restated Employment Agreement, dated as of March 11, 2011, among Krispy Kreme Doughnuts, Inc., Krispy Kreme Doughnut Corporation and G. Dwayne Chambers (incorporated by reference to Exhibit 10.10 to the Registrant’s Annual Report on Form 10-K filed on March 31, 2011)** | ||
| 10.9 | — | Amended and Restated Employment Agreement, dated as of March 11, 2011, among Krispy Kreme Doughnuts, Inc., Krispy Kreme Doughnut Corporation and Darryl R. Marsch (incorporated by reference to Exhibit 10.9 to the Registrant’s Annual Report on Form 10-K filed on March 31, 2011)** | ||
| 10.10 | * | — | Employment Agreement, dated as of May 13, 2014, among Krispy Kreme Doughnuts, Inc., Krispy Kreme Doughnut Corporation and Cathleen D. Allred** | |
| 10.11 | — | Krispy Kreme Doughnut Corporation Nonqualified Deferred Compensation Plan, effective October 1, 2000 (incorporated by reference to Exhibit 10.20 to the Registrant’s Annual Report on Form 10-K for fiscal 2005 filed on April 28, 2006)** | ||
| 10.12 | — | 2000 Stock Incentive Plan, as amended as of January 31, 2011 (incorporated by reference to Exhibit 10.14 to the Registrant’s Annual Report on Form 10-K filed on March 31, 2011)** |
117
| 10.13 | — | Form of Restricted Stock Agreement under the 2000 Stock Incentive Plan (incorporated by reference to Exhibit 10.33 to the Registrant’s Annual Report on Form 10-K filed on April 17, 2009) ** | ||
| 10.14 | — | Form of Restricted Stock Unit Agreement under the 2000 Stock Incentive Plan (incorporated by reference to Exhibit 10.8 to the Registrant’s Current Report on Form 8-K filed on March 17, 2011)** | ||
| 10.15 | — | Form of Director Restricted Stock Unit Agreement under the 2000 Stock Incentive Plan (incorporated by reference to Exhibit 10.17 to the Registrant’s Annual Report on Form 10-K filed on March 31, 2011)** | ||
| 10.16 | — | Form of Nonqualified Stock Option Agreement under the 2000 Stock Incentive Plan (incorporated by reference to Exhibit 10.7 to the Registrant’s Current Report on Form 8-K filed on March 17, 2011)** | ||
| 10.17 | — | Form of Incentive Stock Option Agreement under the 2000 Stock Incentive Plan (incorporated by reference Exhibit 10.1 to the Registrant’s Current Report on Form 8-K filed on February 3, 2011)** | ||
| 10.18 | — | 2012 Stock Incentive Plan, effective June 12, 2012 (incorporated by reference to Exhibit 10.1 to the Registrant’s Current Report on Form 8-K filed on June 14, 2012)** | ||
| 10.19 | — | Form of Nonqualified Stock Option Agreement under the 2012 Stock Incentive Plan (incorporated by reference to Exhibit 10.1 to the Registrant’s Quarterly Report on Form 10-Q filed on December 7, 2012)** | ||
| 10.20 | — | Form of Incentive Stock Option Agreement under the 2012 Stock Incentive Plan (incorporated by reference to Exhibit 10.2 to the Registrant’s Quarterly Report on Form 10-Q filed on December 7, 2012)** | ||
| 10.21 | — | Incentive Stock Option Agreement, dated as of June 2, 2014, between Krispy Kreme Doughnuts, Inc. and Anthony N. Thompson related to commencement of employment (incorporated by reference to Exhibit 10.2 to the Registrant’s Quarterly Report on Form 10-Q filed on September 12, 2014)** | ||
| 10.22 | — | Form of Restricted Stock Unit Agreement under the 2012 Stock Incentive Plan (incorporated by reference to Exhibit 10.4 to the Registrant’s Quarterly Report on Form 10-Q filed on December 7, 2012)** | ||
| 10.23 | — | Restricted Stock Unit Agreement, dated as of June 2, 2014, between Krispy Kreme Doughnuts, Inc. and Anthony N. Thompson related to commencement of employment (incorporated by reference to Exhibit 10.3 to the Registrant’s Quarterly Report on Form 10-Q filed on September 12, 2014)** | ||
| 10.24 | * | — | Restricted Stock Unit Agreement, dated as of February 3, 2015, among Krispy Kreme Doughnuts, Inc. and G. Price Cooper, IV related to commencement of employment** | |
| 10.25 | — | Form of Director Restricted Stock Unit Agreement under the 2012 Stock Incentive Plan (incorporated by reference to Exhibit 10.5 to the Registrant’s Quarterly Report on Form 10-Q filed on December 7, 2012)** | ||
| 10.26 | — | Form of Director Nonqualified Stock Option Agreement under the 2012 Stock Incentive Plan (incorporated by reference to Exhibit 10.6 to the Registrant’s Quarterly Report on Form 10-Q filed on December 7, 2012)** | ||
| 10.27 | — | Annual Incentive Plan (incorporated by reference to Exhibit 10.32 to the Registrant’s Annual Report on Form 10-K filed on April 17, 2008)** | ||
| 10.28 | — | Compensation Recovery Policy (incorporated by reference to Exhibit 10.35 to the Registrant’s Annual Report on Form 10-K filed on April 17, 2009)** | ||
| 10.29 | — | Credit Agreement, dated as of July 12, 2013, among Krispy Kreme Doughnuts Corporation, Krispy Kreme Doughnuts, Inc., the Lenders party thereto and Wells Fargo Bank, National Association, as administrative agent (incorporated by reference to Exhibit 10.1 to the Registrant’s Current Report on Form 8-K filed on July 15, 2013) | ||
| 10.30 | — | Pledge and Security Agreement, dated as of July 12, 2013, among Krispy Kreme Doughnut Corporation, Krispy Kreme Doughnuts, Inc., the Pledgors party thereto, the Lenders party thereto and Wells Fargo Bank, National Association, as administrative agent (incorporated by reference to Exhibit 10.2 to the Registrant’s Current Report on Form 8-K filed on July 15, 2013) | ||
| 10.31 | — | Guaranty Agreement, dated as of July 12, 2013, among Krispy Kreme Doughnuts Corporation, Krispy Kreme Doughnuts, Inc., the Subsidiary Guarantors party thereto, the Lenders party thereto and Wells Fargo Bank, National Association, as administrative agent (incorporated by reference to Exhibit 10.3 to the Registrant’s Current Report on Form 8-K filed on July 15, 2013) | ||
| 10.32 | — | Form of Indemnification Agreement entered into between Krispy Kreme Doughnuts, Inc. and Lizanne Thomas and Michael H. Sutton (incorporated by reference to Exhibit 99.3 to the Registrant’s Current Report on Form 8-K filed on October 8, 2004)** |
118
| 10.33 | — | Form of Indemnification Agreement entered into between Krispy Kreme Doughnuts, Inc. and Tim E. Bentsen and Carl E. Lee, Jr. (incorporated by reference to Exhibit 10.1 to the Registrant’s Current Report on Form 8-K filed on November 12, 2014)** | |||
| 10.34 | — | Form of Indemnification Agreement entered into between Krispy Kreme Doughnuts, Inc. and members of the Registrant’s Board of Directors (other than Lizanne Thomas, Michael H. Sutton, Carl E. Lee, Jr. and Tim E. Bentsen) (incorporated by reference to Exhibit 10.42 to the Registrant’s Annual Report on Form 10-K for fiscal 2005 filed on April 26, 2006)** | |||
| 10.35 | — | Form of Indemnification Agreement entered into between Krispy Kreme Doughnuts, Inc. and Officers of the Registrant (incorporated by reference to Exhibit 10.1 to the Registrant’s Current Report on Form 8-K filed on September 18, 2007) | |||
| 21 | * | — | List of Subsidiaries | ||
| 23 | * | — | Consent of PricewaterhouseCoopers LLP | ||
| 24 | * | — | Powers of Attorney of certain officers and directors of the Company (included on the signature page of this Annual Report on Form 10-K) | ||
| 31.1 | * | — | Certification of Chief Executive Officer pursuant to Rule 13a-14(a) and Rule 15d-14(a) of the Securities Exchange Act of 1934, as amended | ||
| 31.2 | * | — | Certification of Chief Financial Officer pursuant to Rule 13a-14(a) and Rule 15d-14(a) of the Securities Exchange Act of 1934, as amended | ||
| 32.1 | * | — | Certification by Chief Executive Officer pursuant to 18 U.S.C. Section 1350, as adopted pursuant to Section 906 of the Sarbanes-Oxley Act of 2002 | ||
| 32.2 | * | — | Certification by Chief Financial Officer pursuant to 18 U.S.C. Section 1350, as adopted pursuant to Section 906 of the Sarbanes-Oxley Act of 2002 | ||
| 101 | — | The following materials from our Annual Report on Form 10-K for the year ended February 1, 2015 , formatted in XBRL (eXtensible Business Reporting Language): (i) the Consolidated Statement of Income for each of the three years in the period ended February 1, 2015 ; (ii) the Consolidated Statement of Comprehensive Income for each of the three years in the period ended February 1, 2015 (iii) the Consolidated Balance Sheet as of February 1, 2015 and February 2, 2014; (iv) the Consolidated Statement of Cash Flows for each of the three years in the period ended February 1, 2015 ; (v) the Consolidated Statement of Changes in Shareholders’ Equity for each of the three years in the period ended February 1, 2015 ; and (vi) the Notes to the Consolidated Financial Statements |
| * | Filed herewith | |
| ** | Identifies management contracts and executive compensation plans or arrangements required to be filed as exhibits pursuant to Item 15(b), “Exhibits and Financial Statement Schedules — Exhibits,” of this Annual Report on Form 10-K. | |
Our SEC file number for documents filed with the SEC pursuant to the Securities Exchange Act of 1934, as amended, is 001-16485.
119
SCHEDULE I - CONDENSED FINANCIAL INFORMATION OF REGISTRANT
KRISPY KREME DOUGHNUTS,
INC.
(PARENT COMPANY ONLY)
STATEMENT OF INCOME
| Year Ended | |||||||||
| February 1, | February 2, | February 3, | |||||||
| 2015 | 2014 | 2013 | |||||||
| (In thousands, except per share amounts) | |||||||||
| Equity in income of subsidiaries | $ | 30,060 | $ | 34,256 | $ | 20,779 | |||
| Miscellaneous expenses | - | - | - | ||||||
| Income before income taxes | 30,060 | 34,256 | 20,779 | ||||||
| Provision for income taxes | - | - | - | ||||||
| Net income | $ | 30,060 | $ | 34,256 | $ | 20,779 | |||
| Earnings per common share: | |||||||||
| Basic | $ | 0.45 | $ | 0.51 | $ | 0.31 | |||
| Diluted | $ | 0.44 | $ | 0.48 | $ | 0.30 | |||
120
SCHEDULE I - CONDENSED FINANCIAL INFORMATION OF REGISTRANT
KRISPY KREME DOUGHNUTS,
INC.
(PARENT COMPANY ONLY)
STATEMENT OF COMPREHENSIVE INCOME
| Year Ended | ||||||||||
| February 1, | February 2, | February 3, | ||||||||
| 2015 | 2014 | 2013 | ||||||||
| (In thousands) | ||||||||||
| Net income | $ | 30,060 | $ | 34,256 | $ | 20,779 | ||||
| Other comprehensive income (loss) | - | 338 | (2 | ) | ||||||
| Comprehensive income | $ | 30,060 | $ | 34,594 | $ | 20,777 | ||||
121
SCHEDULE I - CONDENSED FINANCIAL INFORMATION OF REGISTRANT
KRISPY KREME DOUGHNUTS,
INC.
(PARENT COMPANY ONLY)
BALANCE SHEET
| February 1, | February 2, | |||||||
| 2015 | 2014 | |||||||
| (In thousands) | ||||||||
| ASSETS | ||||||||
| Investment in and advances to subsidiaries | $ | 267,786 | $ | 265,093 | ||||
| SHAREHOLDERS’ EQUITY | ||||||||
| Preferred stock | $ | - | $ | - | ||||
| Common stock | 310,768 | 338,135 | ||||||
| Accumulated other comprehensive loss | - | - | ||||||
| Accumulated deficit | (42,982 | ) | (73,042 | ) | ||||
| Total shareholders’ equity | $ | 267,786 | $ | 265,093 | ||||
122
SCHEDULE I - CONDENSED FINANCIAL INFORMATION OF REGISTRANT
KRISPY KREME DOUGHNUTS,
INC.
(PARENT COMPANY ONLY)
STATEMENT OF CASH FLOWS
| Year Ended | ||||||||||||
| February 1, | February 2, | February 3, | ||||||||||
| 2015 | 2014 | 2013 | ||||||||||
| (In thousands) | ||||||||||||
| CASH FLOW FROM OPERATING ACTIVITIES: | ||||||||||||
| Net income | $ | 30,060 | $ | 34,256 | $ | 20,779 | ||||||
| Equity in income of subsidiaries | (30,060 | ) | (34,256 | ) | (20,779 | ) | ||||||
| Net cash provided by (used for) operating activities | - | - | - | |||||||||
| CASH FLOW FROM INVESTING ACTIVITIES: | ||||||||||||
| Investments in subsidiaries | 33,622 | 20,540 | 20,502 | |||||||||
| Net cash provided by (used for) investing activities | 33,622 | 20,540 | 20,502 | |||||||||
| CASH FLOW FROM FINANCING ACTIVITIES: | ||||||||||||
| Proceeds from exercise of stock options | 10,259 | 2,517 | 247 | |||||||||
| Proceeds from exercise of warrants | - | - | 9 | |||||||||
| Repurchase of common shares | (43,881 | ) | (23,057 | ) | (20,758 | ) | ||||||
| Net cash provided by (used for) financing activities | (33,622 | ) | (20,540 | ) | (20,502 | ) | ||||||
| Net increase (decrease) in cash and cash equivalents | - | - | - | |||||||||
| Cash and cash equivalents at beginning of period | - | - | - | |||||||||
| Cash and cash equivalents at end of period | $ | - | $ | - | $ | - | ||||||
123