Attached files
| file | filename |
|---|---|
| EXCEL - IDEA: XBRL DOCUMENT - Walmart Inc. | Financial_Report.xls |
| EX-21 - LIST OF THE COMPANY'S SIGNIFICANT SUBSIDIARIES - Walmart Inc. | wmt2113115.htm |
| EX-32.1 - CHIEF EXECUTIVE OFFICER SECTION 906 CERTIFICATION - Walmart Inc. | wmt32113115.htm |
| EX-31.1 - CHIEF EXECUTIVE OFFICER SECTION 302 CERTIFICATION - Walmart Inc. | wmt31113115.htm |
| EX-10.(C) - AMENDMENT TO THE RULES OF THE ASDA SHARESAVE PLAN 2000 - Walmart Inc. | wmt10c13115.htm |
| EX-12.1 - STATEMENT REGARDING COMPUTATION OF THE EARNINGS TO FIXED CHARGES RATIOS - Walmart Inc. | wmt12113115.htm |
| EX-31.2 - CHIEF FINANCIAL OFFICER SECTION 302 CERTIFICATION - Walmart Inc. | wmt31213115.htm |
| EX-32.2 - CHIEF FINANCIAL OFFICER SECTION 906 CERTIFICATION - Walmart Inc. | wmt32213115.htm |
| EX-10.(O).1 - AMENDMENT TO FORM OF POST-TERMINATION AGREEMENT - Walmart Inc. | wmt10o113115.htm |
| 10-K - FORM 10-K - Walmart Inc. | wmtform10-kx13115.htm |
| EX-23 - CONSENT OF INDEPENDENT REGISTERED PUBLIC ACCOUNTING FIRM - Walmart Inc. | wmt2313115.htm |
Five-Year Financial Summary | Exhibit 13 |
Wal-Mart Stores, Inc. | |
As of and for the Fiscal Years Ended January 31, | ||||||||||||||||||||
(Amounts in millions, except per share and unit count data) | 2015 | 2014 | 2013 | 2012 | 2011 | |||||||||||||||
Operating results | ||||||||||||||||||||
Total revenues | $ | 485,651 | $ | 476,294 | $ | 468,651 | $ | 446,509 | $ | 421,395 | ||||||||||
Percentage change in total revenues from previous fiscal year | 2.0 | % | 1.6 | % | 5.0 | % | 6.0 | % | 3.4 | % | ||||||||||
Net sales | 482,229 | 473,076 | 465,604 | 443,416 | 418,500 | |||||||||||||||
Percentage change in net sales from previous fiscal year | 1.9 | % | 1.6 | % | 5.0 | % | 6.0 | % | 3.4 | % | ||||||||||
Increase (decrease) in calendar comparable sales(1) in the United States | 0.5 | % | (0.5 | )% | 2.4 | % | 1.6 | % | (0.6 | )% | ||||||||||
Walmart U.S. | 0.6 | % | (0.6 | )% | 2.0 | % | 0.3 | % | (1.5 | )% | ||||||||||
Sam's Club | 0.0 | % | 0.3 | % | 4.1 | % | 8.4 | % | 3.9 | % | ||||||||||
Gross profit margin | 24.3 | % | 24.3 | % | 24.3 | % | 24.5 | % | 24.8 | % | ||||||||||
Operating, selling, general and administrative expenses, as a percentage of net sales | 19.4 | % | 19.3 | % | 19.0 | % | 19.2 | % | 19.4 | % | ||||||||||
Operating income | $ | 27,147 | $ | 26,872 | $ | 27,725 | $ | 26,491 | $ | 25,508 | ||||||||||
Income from continuing operations attributable to Walmart | 16,182 | 15,918 | 16,963 | 15,734 | 15,340 | |||||||||||||||
Net income per common share: | ||||||||||||||||||||
Diluted income per common share from continuing operations attributable to Walmart | $ | 4.99 | $ | 4.85 | $ | 5.01 | $ | 4.53 | $ | 4.18 | ||||||||||
Dividends declared per common share | 1.92 | 1.88 | 1.59 | 1.46 | 1.21 | |||||||||||||||
Financial position | ||||||||||||||||||||
Inventories | $ | 45,141 | $ | 44,858 | $ | 43,803 | $ | 40,714 | $ | 36,437 | ||||||||||
Property, equipment and capital lease assets, net | 116,655 | 117,907 | 116,681 | 112,324 | 107,878 | |||||||||||||||
Total assets | 203,706 | 204,751 | 203,105 | 193,406 | 180,782 | |||||||||||||||
Long-term debt and long-term capital lease obligations (excluding amounts due within one year) | 43,692 | 44,559 | 41,417 | 47,079 | 43,842 | |||||||||||||||
Total Walmart shareholders' equity | 81,394 | 76,255 | 76,343 | 71,315 | 68,542 | |||||||||||||||
Unit counts | ||||||||||||||||||||
Walmart U.S. segment | 4,516 | 4,203 | 4,005 | 3,868 | 3,804 | |||||||||||||||
Walmart International segment | 6,290 | 6,107 | 5,783 | 5,287 | 4,191 | |||||||||||||||
Sam's Club segment | 647 | 632 | 620 | 611 | 609 | |||||||||||||||
Total units | 11,453 | 10,942 | 10,408 | 9,766 | 8,604 | |||||||||||||||
(1) | Comparable sales include sales from stores and clubs open for the previous 12 months, including remodels, relocations and expansions, as well as e-commerce sales. Comparable store and club sales include fuel. |
Wal-Mart Stores, Inc.
Form 10-K
For the Fiscal Year Ended January 31, 2015
Table of Contents
Page | |||
Consolidated Statements of Shareholders' Equity and Redeemable Noncontrolling Interest | |||
2
Item 2. Management's Discussion and Analysis of Financial Condition and Results of Operations
Overview
Wal-Mart Stores, Inc. ("Walmart," the "Company" or "we") is engaged in the operation of retail, wholesale and other units in various formats around the world. Our operations consist of three reportable segments: Walmart U.S., Walmart International and Sam's Club.
• | Walmart U.S. is our largest segment and operates retail stores in all 50 states in the United States ("U.S."), Washington D.C. and Puerto Rico, with three primary store formats, as well as digital retail. Walmart U.S. generated approximately 60% of our net sales in fiscal 2015 and, of our three segments, Walmart U.S. is the largest and has historically had the highest gross profit as a percentage of net sales ("gross profit rate"). In addition, Walmart U.S. has historically contributed the greatest amount to the Company's net sales and operating income. |
• | Walmart International consists of operations in 26 countries outside of the U.S. and includes retail, wholesale and other businesses. These businesses consist of numerous formats, including supercenters, supermarkets, hypermarkets, warehouse clubs, including Sam's Clubs, cash & carry, home improvement, specialty electronics, restaurants, apparel stores, drug stores and convenience stores, as well as digital retail. Walmart International generated approximately 28% of our fiscal 2015 net sales. The overall gross profit rate for Walmart International is lower than that of Walmart U.S. because of its merchandise mix. Walmart International is our second largest segment and has grown through acquisitions, as well as by adding retail, wholesale and other units. |
• | Sam's Club consists of membership-only warehouse clubs and operates in 48 states in the U.S. and in Puerto Rico, as well as digital retail. Sam's Club accounted for approximately 12% of our fiscal 2015 net sales. As a membership-only warehouse club, membership income is a significant component of the segment's operating income. As a result, Sam's Club operates with a lower gross profit rate and lower operating expenses as a percentage of net sales than our other segments. |
Each of our segments contributes to the Company's operating results differently, but each has generally maintained a consistent contribution rate to the Company's net sales and operating income in recent years.
Through the operations in each of our segments, we help people around the world save money and live better – anytime and anywhere – in retail stores or through our e-commerce and mobile capabilities. Through innovation, we are striving to create a customer-centric experience that seamlessly integrates digital and physical shopping. Physical retail encompasses our brick and mortar presence in each of the markets we operate. Digital retail is comprised of our e-commerce websites and mobile commerce applications. Each week, we serve nearly 260 million customers who visit our over 11,000 stores under 72 banners in 27 countries and e-commerce websites in 11 countries. Our strategy is to lead on price, invest to differentiate on access, be competitive on assortment and deliver a great experience. By leading on price we earn the trust of our customers every day by providing a broad assortment of quality merchandise and services at everyday low prices ("EDLP"), while fostering a culture that rewards and embraces mutual respect, integrity and diversity. EDLP is our pricing philosophy under which we price items at a low price every day so our customers trust that our prices will not change under frequent promotional activity. Price leadership is core to who we are. Everyday low cost ("EDLC") is our commitment to control expenses so those cost savings can be passed along to our customers. Our digital and physical presence provides customers access to our broad assortment anytime and anywhere. We strive to give our customers and members a great digital and physical shopping experience.
Our fiscal year ends on January 31 for our U.S. and Canadian operations. We consolidate all other operations generally using a one-month lag and on a calendar year basis. Our business is seasonal to a certain extent due to calendar events and national and religious holidays, as well as weather patterns. Historically, our highest sales volume and operating income have occurred in the fiscal quarter ending January 31.
This discussion, which presents our results for the fiscal years ended January 31, 2015 ("fiscal 2015"), January 31, 2014 ("fiscal 2014") and January 31, 2013 ("fiscal 2013"), should be read in conjunction with our Consolidated Financial Statements and the accompanying notes. We intend for this discussion to provide the reader with information that will assist in understanding our financial statements, the changes in certain key items in those financial statements from period to period and the primary factors that accounted for those changes. We also discuss certain performance metrics that management uses to assess the Company's performance. Additionally, the discussion provides information about the financial results of the three segments of our business to provide a better understanding of how each of those segments and its results of operations affect the financial condition and results of operations of the Company as a whole.
Throughout this Management's Discussion and Analysis of Financial Condition and Results of Operations, we discuss segment operating income, comparable store and club sales and other measures. Management measures the results of the Company's segments using each segment's operating income, including certain corporate overhead allocations, as well as other measures. From time to time, we revise the measurement of each segment's operating income, including certain corporate overhead allocations, and other measures as determined by the information regularly reviewed by our chief operating decision maker. When we do so, the previous period amounts and balances are reclassified to conform to the current period's presentation. The
3
amounts disclosed for "Corporate and support" in the leverage discussion of the Company's performance metrics consist of corporate overhead and other items not allocated to any of the Company's segments.
Comparable store and club sales is a metric that indicates the performance of our existing U.S. stores and clubs by measuring the change in sales for such stores and clubs, including e-commerce sales, for a particular period from the corresponding period in the previous year. Walmart's definition of comparable store and club sales includes sales from stores and clubs open for the previous 12 months, including remodels, relocations, expansions and conversions, as well as e-commerce sales. We measure the e-commerce sales impact by including those sales initiated through our websites and fulfilled through our e-commerce distribution facilities, as well as an estimate for sales initiated online, but fulfilled through our stores and clubs. Changes in format are excluded from comparable store and club sales when the conversion is accompanied by a relocation or expansion that results in a change in retail square feet of more than five percent. Comparable store and club sales are also referred to as "same-store" sales by others within the retail industry. The method of calculating comparable store and club sales varies across the retail industry. As a result, our calculation of comparable store and club sales is not necessarily comparable to similarly titled measures reported by other companies.
In discussing our operating results, the term currency exchange rates refers to the currency exchange rates we use to convert the operating results for all countries where the functional currency is not the U.S. dollar. We calculate the effect of changes in currency exchange rates as the difference between current period activity translated using the current period's currency exchange rates, and the comparable prior year period's currency exchange rates. Throughout our discussion, we refer to the results of this calculation as the impact of currency exchange rate fluctuations. When we refer to constant currency operating results, we are referring to our operating results without the impact of the currency exchange rate fluctuations and without the impact of acquisitions until the acquisitions are included in both comparable periods. The disclosure of constant currency amounts or results permits investors to understand better Walmart's underlying performance without the effects of currency exchange rate fluctuations or acquisitions. Volatility in currency exchange rates may impact the results, including net sales and operating income, of the Company and the Walmart International segment in the future.
We made certain reclassifications to prior period amounts or balances to conform to the presentation in the current fiscal year. These reclassifications did not impact the Company's operating income or consolidated net income. Additionally, certain prior period segment asset and expense allocations have been reclassified among segments to be comparable with the current period presentation.
The Retail Industry
We operate in the highly competitive retail industry in all of the markets we serve. We face strong sales competition from other discount, department, drug, dollar, variety and specialty stores, warehouse clubs and supermarkets, as well as e-commerce and catalog businesses. Many of these competitors are national, regional or international chains or have a national or international online presence. We compete with a number of companies for prime retail site locations, as well as in attracting and retaining quality employees (whom we call "associates"). We, along with other retail companies, are influenced by a number of factors including, but not limited to: catastrophic events, weather, competitive pressures, consumer disposable income, consumer debt levels and buying patterns, consumer credit availability, cost of goods, currency exchange rate fluctuations, customer preferences, deflation, inflation, fuel and energy prices, general economic conditions, insurance costs, interest rates, labor costs, tax rates, cybersecurity attacks and unemployment. Further information on the factors that can affect our operating results and on certain risks to our Company and an investment in its securities can be located in "Item 1A. Risk Factors" in our Annual Report on Form 10-K for the fiscal year ended January 31, 2015, and in the discussion under "Cautionary Statement Regarding Forward-Looking Statements and Information" in our Annual Report on Form 10-K for the fiscal year ended January 31, 2015.
Company Performance Metrics
Our performance metrics emphasize three priorities for improving shareholder value: growth, leverage and returns. Our priority of growth focuses on sales through growth in net sales, comparable store and club sales, including e-commerce sales, and unit square feet growth; the priority of leverage encompasses our objective to increase our operating income at the same rate as or a faster rate than the growth in net sales by growing our operating, selling, general and administrative expenses ("operating expenses") at a slower rate than the growth of our net sales; and the priority of returns focuses on how efficiently we employ assets through return on investment and how effectively we manage working capital through free cash flow. While all three priorities are important, our top priority is growth, with increased investment in digital retail and our associates. Sales growth will contribute to improving leverage and returns over time.
4
Growth
Net Sales
Fiscal Years Ended January 31, | |||||||||||||||||||||||||||
2015 | 2014 | 2013 | |||||||||||||||||||||||||
(Amounts in millions) | Net Sales | Percent of Total | Percent Change | Net Sales | Percent of Total | Percent Change | Net Sales | Percent of Total | |||||||||||||||||||
Walmart U.S. | $ | 288,049 | 59.8 | % | 3.1 | % | $ | 279,406 | 59.0 | % | 1.8 | % | $ | 274,433 | 59.0 | % | |||||||||||
Walmart International | 136,160 | 28.2 | % | (0.3 | )% | 136,513 | 28.9 | % | 1.3 | % | 134,748 | 28.9 | % | ||||||||||||||
Sam's Club | 58,020 | 12.0 | % | 1.5 | % | 57,157 | 12.1 | % | 1.3 | % | 56,423 | 12.1 | % | ||||||||||||||
Net sales | $ | 482,229 | 100.0 | % | 1.9 | % | $ | 473,076 | 100.0 | % | 1.6 | % | $ | 465,604 | 100.0 | % | |||||||||||
Our consolidated net sales increased 1.9% and 1.6% for fiscal 2015 and 2014, respectively, when compared to the previous fiscal year. The increase in net sales for fiscal 2015 was primarily due to 3.0% year-over-year growth in retail square feet, positive comparable sales in the U.S. and higher e-commerce sales across the Company. The increase was partially offset by $5.3 billion of negative impact from fluctuations in currency exchange rates for fiscal 2015. The increase in net sales for fiscal 2014 was due to 3.1% growth in retail square feet, higher e-commerce sales, the impact of fiscal 2013 acquisitions and positive comparable club sales at Sam's Club. The increase in net sales for fiscal 2014 was partially offset by $5.1 billion of negative impact from fluctuations in currency exchange rates.
Calendar Comparable Store and Club Sales
Comparable store and club sales is a metric which indicates the performance of our existing U.S. stores and clubs by measuring the change in sales for such stores and clubs, including e-commerce sales, for a particular period over the corresponding period in the previous year. The retail industry generally reports comparable store and club sales using the retail calendar (also known as the 4-5-4 calendar). To be consistent with the retail industry, we provide comparable store and club sales using the retail calendar in our quarterly earnings releases. However, when we discuss our comparable store and club sales below, we are referring to our calendar comparable store and club sales calculated using our fiscal calendar. As our fiscal calendar differs from the retail calendar, our calendar comparable store and club sales also differ from the retail calendar comparable store and club sales provided in our quarterly earnings releases. Calendar comparable store and club sales, as well as the impact of fuel, for fiscal 2015 and 2014, were as follows:
Fiscal Years Ended January 31, | ||||||||||||
2015 | 2014 | 2015 | 2014 | |||||||||
With Fuel | Fuel Impact | |||||||||||
Walmart U.S. | 0.6 | % | (0.6 | )% | 0.0 | % | 0.0 | % | ||||
Sam's Club | 0.0 | % | 0.3 | % | (0.6 | )% | (0.3 | )% | ||||
Total U.S. | 0.5 | % | (0.5 | )% | (0.1 | )% | (0.1 | )% | ||||
Comparable store and club sales in the U.S., including fuel, increased 0.5% in fiscal 2015 and decreased 0.5% in fiscal 2014, when compared to the previous fiscal year. The fiscal 2015 total U.S. comparable store and club sales were positively impacted by higher traffic and lower gas prices during the end of the fiscal year. E-commerce sales positively impacted comparable sales approximately 0.3% and 0.2% for Walmart U.S. and Sam's Club, respectively, for the fiscal year ended January 31, 2015. For fiscal 2014, the total U.S. comparable store and club sales were negatively impacted by lower consumer spending primarily due to the slow recovery in general economic conditions, the 2% increase in the 2013 payroll tax rate, and the reduction in government food benefits and severe winter storms that occurred during the fourth quarter. These factors were partially offset by increased member traffic at Sam's Club primarily coming from Savings Members. Additionally, e-commerce sales positively impacted the Walmart U.S. comparable store and Sam's Club comparable club sales percentages by approximately 0.3% for fiscal 2014.
As we continue to add new stores and clubs in the U.S., we do so with an understanding that additional stores and clubs may take sales away from existing units. We estimate the negative impact on comparable store and club sales as a result of opening new stores and clubs was approximately 0.9% and 0.8% in fiscal 2015 and 2014, respectively. Our estimate is calculated primarily by comparing the sales trends of the impacted stores and clubs, which are identified based on their proximity to the new stores and clubs, to those of nearby non-impacted stores and clubs, in each case, as measured after the new stores and clubs are opened.
5
Leverage
Operating Income
Fiscal Years Ended January 31, | ||||||||||||||||||||||||||
2015 | 2014 | 2013 | ||||||||||||||||||||||||
(Amounts in millions) | Operating Income | Percent of Total | Percent Change | Operating Income | Percent of Total | Percent Change | Operating Income | Percent of Total | ||||||||||||||||||
Walmart U.S. | $ | 21,336 | 78.6 | % | (2.1 | )% | $ | 21,787 | 81.0 | % | 3.2 | % | $ | 21,103 | 76.1 | % | ||||||||||
Walmart International | 6,171 | 22.7 | % | 19.8 | % | 5,153 | 19.2 | % | (19.0 | )% | 6,365 | 23.0 | % | |||||||||||||
Sam's Club | 1,976 | 7.3 | % | 7.2 | % | 1,843 | 6.9 | % | (0.9 | )% | 1,859 | 6.7 | % | |||||||||||||
Corporate and support | (2,336 | ) | (8.6 | )% | (22.2 | )% | (1,911 | ) | (7.1 | )% | (19.3 | )% | (1,602 | ) | (5.8 | )% | ||||||||||
Operating income | $ | 27,147 | 100.0 | % | 1.0 | % | $ | 26,872 | 100.0 | % | (3.1 | )% | $ | 27,725 | 100.0 | % | ||||||||||
We believe comparing both the growth of our operating expenses and our operating income to the growth of our net sales are meaningful measures, as they indicate how effectively we manage costs and leverage operating expenses. Our objective for a fiscal year is to grow operating expenses at a slower rate than net sales and to grow operating income at the same rate as or a faster rate than net sales. On occasion, we may make strategic growth investments that may, at times, cause our operating expenses to grow at a faster rate than net sales and that may result in our operating income growing at a slower rate than net sales.
Operating Expenses
For fiscal 2015, operating expenses increased 2.3%, when compared to the previous fiscal year, while net sales increased 1.9%, respectively, when compared to the previous fiscal year. Accordingly, we did not meet our objective of growing operating expenses at a slower rate than net sales. Our continued investments in digital retail, higher health-care expenses in the U.S. from increased enrollment and medical cost inflation, the $249 million impact of wage and hour litigation in the U.S., as well as expenses of $148 million related to the closure of approximately 30 underperforming stores in Japan were the primary factors that caused us not to leverage for fiscal 2015. For fiscal 2014, we did not meet our objective of growing operating expenses at a slower rate than net sales as operating expenses as a percentage of net sales increased 27 basis points. Overall, lower than anticipated sales, higher investment in key areas, such as global leverage and digital retail initiatives, and the nearly $1.0 billion of increased expenses for various matters described in the Walmart International segment discussion, were the primary cause for the increase in operating expenses as a percentage of net sales.
During the first quarter of fiscal 2016, the Company announced a new associate wage structure combined with comprehensive associate training and educational programs. We anticipate the additional expenses in fiscal 2016 resulting from these programs will be approximately $1.0 billion, which may impact our ability to leverage operating expenses in fiscal 2016.
Operating Income
For fiscal 2015, we did not meet our objective of growing operating income at the same rate or a faster rate than net sales as operating income increased 1.0%, while net sales increased 1.9% when compared to the previous fiscal year. This was primarily due to the factors we discussed for not leveraging operating expenses. For fiscal 2014, we also did not meet our objective of growing operating income at a faster rate than net sales as operating income decreased 3.1% while net sales increased 1.6%, when compared to the previous fiscal year. This was primarily due to the factors we discussed for not leveraging operating expenses, partially offset by increases in membership and other income of 5.6%.
6
Returns
Return on Investment
Management believes return on investment ("ROI") is a meaningful metric to share with investors because it helps investors assess how effectively Walmart is deploying its assets. Trends in ROI can fluctuate over time as management balances long-term potential strategic initiatives with possible short-term impacts.
ROI was 16.9% and 17.0% for the fiscal years ended January 31, 2015 and 2014, respectively. The slight change in ROI was primarily due to continued investments in store growth and digital retail initiatives, offset by currency exchange rate fluctuations.
We define ROI as adjusted operating income (operating income plus interest income, depreciation and amortization, and rent expense) for the trailing 12 months divided by average invested capital during that period. We consider average invested capital to be the average of our beginning and ending total assets, plus average accumulated depreciation and average amortization, less average accounts payable and average accrued liabilities for that period, plus a rent factor equal to the rent for the fiscal year or trailing 12 months multiplied by a factor of eight. When we have discontinued operations, we exclude the impact of the discontinued operations.
Our calculation of ROI is considered a non-GAAP financial measure because we calculate ROI using financial measures that exclude and include amounts that are included and excluded in the most directly comparable GAAP financial measure. For example, we exclude the impact of depreciation and amortization from our reported operating income in calculating the numerator of our calculation of ROI. In addition, we include a factor of eight for rent expense that estimates the hypothetical capitalization of our operating leases. We consider return on assets ("ROA") to be the financial measure computed in accordance with generally accepted accounting principles ("GAAP") that is the most directly comparable financial measure to our calculation of ROI. ROI differs from ROA (which is consolidated income from continuing operations for the period divided by average total assets of continuing operations for the period) because ROI: adjusts operating income to exclude certain expense items and adds interest income; adjusts total assets of continuing operations for the impact of accumulated depreciation and amortization, accounts payable and accrued liabilities; and incorporates a factor of rent to arrive at total invested capital.
Although ROI is a standard financial metric, numerous methods exist for calculating a company's ROI. As a result, the method used by management to calculate our ROI may differ from the methods used by other companies to calculate their ROI. We urge you to understand the methods used by other companies to calculate their ROI before comparing our ROI to that of such other companies.
7
The calculation of ROI, along with a reconciliation to the calculation of ROA, the most comparable GAAP financial measure, is as follows:
Fiscal Years Ended January 31, | ||||||||
(Amounts in millions) | 2015 | 2014 | ||||||
CALCULATION OF RETURN ON INVESTMENT | ||||||||
Numerator | ||||||||
Operating income | $ | 27,147 | $ | 26,872 | ||||
+ Interest income | 113 | 119 | ||||||
+ Depreciation and amortization | 9,173 | 8,870 | ||||||
+ Rent | 2,777 | 2,828 | ||||||
= Adjusted operating income | $ | 39,210 | $ | 38,689 | ||||
Denominator | ||||||||
Average total assets of continuing operations(1) | $ | 203,999 | $ | 203,680 | ||||
+ Average accumulated depreciation and amortization(1) | 63,375 | 57,907 | ||||||
- Average accounts payable(1) | 37,913 | 37,748 | ||||||
- Average accrued liabilities(1) | 18,973 | 18,802 | ||||||
+ Rent x 8 | 22,216 | 22,624 | ||||||
= Average invested capital | $ | 232,704 | $ | 227,661 | ||||
Return on investment (ROI) | 16.9 | % | 17.0 | % | ||||
CALCULATION OF RETURN ON ASSETS | ||||||||
Numerator | ||||||||
Income from continuing operations | $ | 16,814 | $ | 16,551 | ||||
Denominator | ||||||||
Average total assets of continuing operations(1) | $ | 203,999 | $ | 203,680 | ||||
Return on assets (ROA) | 8.2 | % | 8.1 | % | ||||
As of January 31, | ||||||||||||
2015 | 2014 | 2013 | ||||||||||
Certain Balance Sheet Data | ||||||||||||
Total assets of continuing operations | $ | 203,706 | $ | 204,291 | $ | 203,068 | ||||||
Accumulated depreciation and amortization | 65,979 | 60,771 | 55,043 | |||||||||
Accounts payable | 38,410 | 37,415 | 38,080 | |||||||||
Accrued liabilities | 19,152 | 18,793 | 18,808 | |||||||||
(1) The average is based on the addition of the account balance at the end of the current period to the account balance at the end of the prior period and dividing by 2.
8
Free Cash Flow
Free cash flow is considered a non-GAAP financial measure. Management believes, however, that free cash flow, which measures our ability to generate additional cash from our business operations, is an important financial measure for use in evaluating the Company's financial performance. Free cash flow should be considered in addition to, rather than as a substitute for, consolidated income from continuing operations as a measure of our performance and net cash provided by operating activities as a measure of our liquidity.
We define free cash flow as net cash provided by operating activities in a period minus payments for property and equipment made in that period. We generated free cash flow of $16.4 billion, $10.1 billion and $12.7 billion for fiscal 2015, 2014 and 2013, respectively. The increase in free cash flow for fiscal 2015, when compared to the previous fiscal year, was primarily due to the timing of payments for accounts payable and accrued liabilities, as well as the timing of income tax payments, combined with lower capital expenditures. The fiscal 2014 decline in free cash flow, when compared to the previous fiscal year, was primarily due to the timing of income tax payments, as well as lower income from continuing operations and slightly higher capital expenditures.
Walmart's definition of free cash flow is limited in that it does not represent residual cash flows available for discretionary expenditures due to the fact that the measure does not deduct the payments required for debt service and other contractual obligations or payments made for business acquisitions. Therefore, we believe it is important to view free cash flow as a measure that provides supplemental information to our Consolidated Statements of Cash Flows.
Although other companies report their free cash flow, numerous methods may exist for calculating a company's free cash flow. As a result, the method used by Walmart's management to calculate our free cash flow may differ from the methods used by other companies to calculate their free cash flow. We urge you to understand the methods used by other companies to calculate their free cash flow before comparing our free cash flow to that of such other companies.
The following table sets forth a reconciliation of free cash flow, a non-GAAP financial measure, to net cash provided by operating activities, which we believe to be the GAAP financial measure most directly comparable to free cash flow, as well as information regarding net cash used in investing activities and net cash used in financing activities.
Fiscal Years Ended January 31, | ||||||||||||
(Amounts in millions) | 2015 | 2014 | 2013 | |||||||||
Net cash provided by operating activities | $ | 28,564 | $ | 23,257 | $ | 25,591 | ||||||
Payments for property and equipment | (12,174 | ) | (13,115 | ) | (12,898 | ) | ||||||
Free cash flow | $ | 16,390 | $ | 10,142 | $ | 12,693 | ||||||
Net cash used in investing activities(1) | $ | (11,125 | ) | $ | (12,526 | ) | $ | (12,637 | ) | |||
Net cash used in financing activities | (15,071 | ) | (10,789 | ) | (11,946 | ) | ||||||
(1) "Net cash used in investing activities" includes payments for property and equipment, which is also included in our computation of free cash flow.
9
Results of Operations
Consolidated Results of Operations
Fiscal Years Ended January 31, | ||||||||||||
(Amounts in millions, except unit counts) | 2015 | 2014 | 2013 | |||||||||
Total revenues | $ | 485,651 | $ | 476,294 | $ | 468,651 | ||||||
Percentage change from comparable period | 2.0 | % | 1.6 | % | 5.0 | % | ||||||
Net sales | $ | 482,229 | $ | 473,076 | $ | 465,604 | ||||||
Percentage change from comparable period | 1.9 | % | 1.6 | % | 5.0 | % | ||||||
Total U.S. calendar comparable store and club sales increase (decrease) | 0.5 | % | (0.5 | )% | 2.4 | % | ||||||
Gross profit margin as a percentage of net sales | 24.3 | % | 24.3 | % | 24.3 | % | ||||||
Operating income | $ | 27,147 | $ | 26,872 | $ | 27,725 | ||||||
Operating income as a percentage of net sales | 5.6 | % | 5.7 | % | 6.0 | % | ||||||
Income from continuing operations | $ | 16,814 | $ | 16,551 | $ | 17,704 | ||||||
Unit counts at period end | 11,453 | 10,942 | 10,408 | |||||||||
Retail square feet at period end | 1,135 | 1,101 | 1,070 | |||||||||
Our total revenues, which are mostly comprised of net sales, but also include membership and other income, increased 2.0% and 1.6% for fiscal 2015 and 2014, respectively, when compared to the previous fiscal year. The increase in total revenues was consistent with the 1.9% and 1.6% increases in net sales. The increase in net sales was primarily due to 3.0% year-over-year growth in retail square feet, positive comparable sales in the U.S. and higher e-commerce sales across the Company. The increase was partially offset by $5.3 billion of negative impact from fluctuations in currency exchange rates for fiscal 2015. The increase in net sales for fiscal 2014 was due to 3.1% growth in retail square feet, higher e-commerce sales, the impact of fiscal 2013 acquisitions and positive comparable club sales at Sam's Club. The increase in net sales for fiscal 2014 was partially offset by $5.1 billion of negative impact from fluctuations in currency exchange rates. An increase in membership and other income in both fiscal years, primarily due to growth in membership income at Sam's Club, also contributed to the increase in total revenues.
Our gross profit rate was relatively flat for fiscal 2015, when compared to the previous fiscal year. While the gross profit rate at Walmart International increased, the gross profit rate at Walmart U.S. and Sam's Club decreased. Our gross profit rate decreased 3 basis points for fiscal 2014, when compared to the previous fiscal year, primarily due to our ongoing investment in price, as well as merchandise mix.
For fiscal 2015, we did not meet our objective of growing operating expenses at a slower rate than net sales as operating expenses as a percentage of net sales increased 6 basis points when compared to the same period in the previous fiscal year. Our continued investments in digital retail, higher health-care expenses in the U.S. from increased enrollment and medical cost inflation, the $249 million impact of wage and hour litigation in the U.S., as well as expenses of $148 million related to the closure of approximately 30 underperforming stores in Japan were the primary factors that caused us not to leverage for fiscal 2015. For fiscal 2014, we did not meet our objective of growing operating expenses at a slower rate than net sales as operating expenses as a percentage of net sales increased 27 basis points. Overall, lower than anticipated net sales, higher investment in key areas, such as global leverage and e-commerce initiatives, and nearly $1.0 billion of increased expenses for various matters described in the Walmart International segment discussion, were the primary cause for the increase in operating expenses as a percentage of net sales.
For fiscal 2015, we did not meet our objective of growing operating income at the same rate or a faster rate than net sales as operating income increased 1.0% while net sales increased 1.9% when compared to the previous fiscal year. This was primarily due to the factors we discussed for not leveraging operating expenses. For fiscal 2014, we also did not meet our objective of growing operating income at a faster rate than net sales as operating income decreased 3.1% while net sales increased 1.6%, when compared to the previous fiscal year. This was primarily due to the factors we discussed for not leveraging operating expenses, partially offset by increases in membership and other income.
Our effective income tax rates were 32.2%, 32.9% and 31.0%, for fiscal 2015, 2014 and 2013, respectively. The reconciliation from the U.S. statutory rate to the effective income tax rates for fiscal 2015, 2014 and 2013 is presented in Note 9 in the "Notes to Consolidated Financial Statements."
As a result of the factors discussed above, we reported $16.8 billion, $16.6 billion and $17.7 billion of consolidated income from continuing operations for fiscal 2015, 2014 and 2013, respectively, an increase of $263.0 million for fiscal 2015 and a decrease of $1.1 billion for fiscal 2014 when compared to the previous fiscal year. Diluted income from continuing operations per common share attributable to Walmart ("EPS") was $4.99, $4.85 and $5.01 for fiscal 2015, 2014 and 2013, respectively.
10
Walmart U.S. Segment
Fiscal Years Ended January 31, | |||||||||||||
(Amounts in millions, except unit counts) | 2015 | 2014 | 2013 | ||||||||||
Net sales | $ | 288,049 | $ | 279,406 | $ | 274,433 | |||||||
Percentage change from comparable period | 3.1 | % | 1.8 | % | 3.9 | % | |||||||
Calendar comparable store sales increase (decrease) | 0.6 | % | (0.6 | )% | 2.0 | % | |||||||
Operating income | $ | 21,336 | $ | 21,787 | $ | 21,103 | |||||||
Operating income as a percentage of net sales | 7.4 | % | 7.8 | % | 7.7 | % | |||||||
Unit counts at period end | 4,516 | 4,203 | 4,005 | ||||||||||
Retail square feet at period end | 680 | 659 | 641 | ||||||||||
Net sales for the Walmart U.S. segment increased 3.1% and 1.8% for fiscal 2015 and 2014, respectively, when compared to the previous fiscal year. For fiscal 2015, the increase in net sales was due to year-over-year growth in retail square feet of 3.2%, as well as an increase in comparable store sales of 0.6%. Positive traffic and lower gas prices late in the fiscal year contributed to the increase in comparable store sales. For fiscal 2014, the increase in net sales was due to year-over-year growth in retail square feet of 2.9%, partially offset by a decline in comparable store sales of 0.6%. Fiscal 2014 comparable store sales were negatively impacted by lower consumer spending primarily due to the slow recovery in general economic conditions, the 2% increase in the 2013 payroll tax rate and the reduction in government food benefits.
The fiscal 2015 gross profit rate decreased 12 basis points compared to the previous fiscal year. The decrease in the gross profit rate was primarily the result of the segment's strategic focus on price investment, pharmacy cost inflation, reductions in third-party reimbursement rates and changes in merchandise mix. The fiscal year 2014 gross profit rate was relatively flat when compared to the previous fiscal year primarily due to price investment and low price leadership, partially offset by cost of goods savings initiatives and supply chain productivity.
Walmart U.S. did not leverage operating expenses for fiscal 2015, as operating expenses as a percentage of segment net sales increased 24 basis points. The increase in operating expenses as a percentage of segment net sales was primarily driven by higher health-care expenses from increased enrollment and medical cost inflation. In addition, expenses from severe winter storms early in the year contributed to the increase in operating expenses as a percentage of segment net sales. Walmart U.S. leveraged operating expenses for fiscal 2014, driven by productivity initiatives as well as lower incentive expenses in fiscal 2014.
As a result of the factors discussed above, segment operating income was $21.3 billion, $21.8 billion and $21.1 billion during fiscal 2015, 2014 and 2013, respectively. Walmart U.S. did not grow operating income faster than sales during fiscal 2015, but grew operating income faster than sales during fiscal 2014.
11
Walmart International Segment
Fiscal Years Ended January 31, | ||||||||||||
(Amounts in millions, except unit counts) | 2015 | 2014 | 2013 | |||||||||
Net sales | $ | 136,160 | $ | 136,513 | $ | 134,748 | ||||||
Percentage change from comparable period | (0.3 | )% | 1.3 | % | 7.4 | % | ||||||
Operating income | $ | 6,171 | $ | 5,153 | $ | 6,365 | ||||||
Operating income as a percentage of net sales | 4.5 | % | 3.8 | % | 4.7 | % | ||||||
Unit counts at period end | 6,290 | 6,107 | 5,783 | |||||||||
Retail square feet at period end | 368 | 358 | 346 | |||||||||
Net sales for the Walmart International segment decreased 0.3% and increased 1.3% for fiscal 2015 and 2014, respectively, when compared to the previous fiscal year. For fiscal 2015, the decrease in net sales was due to $5.3 billion of negative impact from fluctuations in currency exchange rates, partially offset by year-over-year net growth in retail square feet of 2.6% and higher e-commerce sales in each country with e-commerce operations, particularly in the United Kingdom, China and Brazil. For fiscal 2014, the increase in net sales was due to year-over-year net growth in retail square feet of 3.6% and the impact of fiscal 2013 acquisitions, which accounted for $730 million of the net sales increase. In addition, higher e-commerce sales in each country with e-commerce operations contributed to the increase. The increase in net sales was partially offset by $5.1 billion of negative impact from fluctuations in currency exchange rates.
Gross profit rate increased 12 basis points for fiscal 2015 and decreased 10 basis points for fiscal 2014, when compared to the previous fiscal year. The fiscal 2015 increase in gross profit rate was primarily due to changes in the merchandise mix in a number of the segment's larger operations. The fiscal 2014 decrease in gross profit rate was primarily due to price investments in certain countries, including Brazil, Canada and Mexico.
Operating expenses as a percentage of net sales decreased 51 basis points for fiscal 2015, when compared to the previous fiscal year. The decrease was due to the nearly $1.0 billion of aggregated expenses incurred in fiscal 2014 detailed below, which were partially offset by fiscal 2015 expenses of $148 million related to the closure of approximately 30 underperforming stores in Japan.
For fiscal 2014, operating expenses as a percentage of net sales increased 80 basis points, when compared to the previous fiscal year. Operating expenses as a percentage of net sales were primarily impacted by the nearly $1.0 billion of aggregated expenses for the following matters:
• | Charges for contingencies for non-income taxes and employment claims in Brazil; |
• | Charges for the closure of 29 units in China and 25 units in Brazil due to poor performance; |
• | Store lease expenses in China and Mexico to correct a historical accounting practice that did not conform to our global accounting policies; and |
• | Expenses for the termination of the joint venture, franchise and supply agreements related to our former partner's retail store operations in India. |
As a result of the factors discussed above, segment operating income was $6.2 billion, $5.2 billion and $6.4 billion for fiscal 2015, 2014 and 2013, respectively. Fluctuations in currency exchange rates negatively impacted operating income $225 million, $26 million and $111 million in fiscal 2015, 2014 and 2013 respectively. Although currency fluctuations caused net sales for Walmart International to decline, operating income grew for fiscal 2015. Operating income did not grow faster than net sales in fiscal 2014.
12
Sam's Club Segment
We believe the information in the following table under the caption "Excluding Fuel" is useful to investors because it permits investors to understand the effect of the Sam's Club segment's fuel sales on its results of operations, which are impacted by the volatility of fuel prices. Volatility in fuel prices may continue to impact the operating results of the Sam's Club segment in the future.
Fiscal Years Ended January 31, | ||||||||||||
(Amounts in millions, except unit counts) | 2015 | 2014 | 2013 | |||||||||
Including Fuel | ||||||||||||
Net sales | $ | 58,020 | $ | 57,157 | $ | 56,423 | ||||||
Percentage change from comparable period | 1.5 | % | 1.3 | % | 4.9 | % | ||||||
Calendar comparable club sales increase | 0.0 | % | 0.3 | % | 4.1 | % | ||||||
Operating income | $ | 1,976 | $ | 1,843 | $ | 1,859 | ||||||
Operating income as a percentage of net sales | 3.4 | % | 3.2 | % | 3.3 | % | ||||||
Unit counts at period end | 647 | 632 | 620 | |||||||||
Retail square feet at period end | 87 | 84 | 83 | |||||||||
Excluding Fuel | ||||||||||||
Net sales | $ | 51,630 | $ | 50,574 | $ | 49,789 | ||||||
Percentage change from comparable period | 2.1 | % | 1.6 | % | 4.6 | % | ||||||
Operating income | $ | 1,854 | $ | 1,817 | $ | 1,812 | ||||||
Operating income as a percentage of net sales | 3.6 | % | 3.6 | % | 3.6 | % | ||||||
Net sales for the Sam's Club segment increased 1.5% and 1.3% for fiscal 2015 and 2014, respectively, when compared to the previous fiscal year. The fiscal 2015 increase in net sales was primarily due to year-over-year growth in retail square feet of 2.5%, driven by the addition of 15 new clubs, partially offset by a decrease in fuel sales due to the lower average selling price. Comparable club sales were flat for fiscal 2015. The fiscal 2014 increase in net sales was due to year-over-year growth in retail square feet of 2.1%, driven by the addition of 12 new clubs, as well as positive comparable club sales of 0.3%. The fiscal 2014 positive comparable club sales were the result of increased member traffic primarily coming from our Savings Members, partially offset by severe winter storms that occurred in the fourth quarter of fiscal 2014.
Gross profit rate decreased 12 basis points for fiscal 2015 and was flat for fiscal 2014, when compared to the previous fiscal year. For fiscal 2015, the gross profit rate decreased primarily due to the segment's investment in the Cash Rewards program, changes in merchandise mix, and commodity cost inflation, partially offset by an increased gross profit rate on fuel sales. For fiscal 2014, our gross profit was negatively impacted by an increase to our product warranty liabilities, which was offset by a favorable impact from merchandise mix.
Membership and other income increased 7.7% and 14.1% for fiscal 2015 and 2014, respectively, when compared to the previous fiscal year. For fiscal 2015, the increase was primarily the result of increased membership upgrades, Plus Member renewals and an increase in members from the opening of 15 new clubs. For fiscal 2014, the increase was primarily due to improved contract terms relating to the profit sharing arrangement with our credit card provider, increased membership fees that were introduced on May 15, 2013, $24 million of income from the sale of two real estate properties and an increase in members from the opening of 12 new clubs.
Sam's Club leveraged operating expenses for fiscal 2015, as operating expenses as a percentage of segment net sales decreased 16 basis points compared to the previous fiscal year. The decrease in operating expenses as a percentage of segment net sales for fiscal 2015 was primarily due to better expense management in a number of areas, including the optimization of the new in-club staffing structure announced in fiscal 2014, which resulted in decreases in wage expense and payroll taxes. This was partially offset by higher health-care expenses, mostly from increased enrollment and medical cost inflation. For fiscal 2014, Sam's Club did not leverage expenses, as operating expenses as a percentage of segment net sales increased 26 basis points, when compared to the previous fiscal year. The increase in operating expenses as a percentage of segment net sales was primarily due to a $59 million charge for the implementation of the new in-club staffing structure and the pending closure of one club, as well as a state excise tax refund credit we received in the previous fiscal year.
As a result of the factors discussed above, operating income was $2.0 billion, $1.8 billion and $1.9 billion for fiscal 2015, 2014 and 2013, respectively. Sam's Club did grow operating income faster than net sales in fiscal 2015, but did not grow operating income faster than sales in fiscal 2014.
13
Liquidity and Capital Resources
Liquidity
The strength and stability of our operations have historically supplied us with a significant source of liquidity. Our cash flows provided by operating activities, supplemented with our long-term debt and short-term borrowings, have been sufficient to fund our operations while allowing us to invest in activities that support the long-term growth of our operations. Generally, some or all of the remaining available cash flow has been used to fund the dividends on our common stock and share repurchases. We believe our sources of liquidity will continue to be adequate to fund operations, finance our global expansion activities, pay dividends and fund our share repurchases for the foreseeable future.
Net Cash Provided by Operating Activities
Fiscal Years Ended January 31, | ||||||||||||
(Amounts in millions) | 2015 | 2014 | 2013 | |||||||||
Net cash provided by operating activities | $ | 28,564 | $ | 23,257 | $ | 25,591 | ||||||
Net cash provided by operating activities was $28.6 billion, $23.3 billion and $25.6 billion for fiscal 2015, 2014 and 2013, respectively. The increase in net cash provided by operating activities for fiscal 2015, when compared to the previous fiscal year, was primarily due to the timing of payments for accounts payable and accrued liabilities, as well as the timing of income tax payments. The decrease in cash flows provided by operating activities in fiscal 2014, when compared to the previous fiscal year, was primarily due to the timing of income tax payments, as well as lower income from continuing operations.
During the first quarter of fiscal 2016, the Company announced a new associate wage structure combined with comprehensive associate training and educational programs. We anticipate cash flows provided by operating activities will be sufficient to fund these programs.
Cash Equivalents and Working Capital
Cash and cash equivalents were $9.1 billion and $7.3 billion for fiscal 2015 and 2014, respectively. Our working capital deficit was $2.0 billion and $8.2 billion at January 31, 2015 and 2014, respectively. The decrease in our working capital deficit is primarily the result of using less of our net cash provided by operating activities for share repurchases and capital expenditures during fiscal 2015, which allowed us to reduce our short-term borrowings. We generally operate with a working capital deficit due to our efficient use of cash in funding operations, consistent access to the capital markets and in providing returns to our shareholders in the form of payments of cash dividends and share repurchases.
We use intercompany financing arrangements in an effort to ensure cash can be made available in the country in which it is needed with the minimum cost possible. We do not believe it will be necessary to repatriate cash and cash equivalents held outside of the U.S. and anticipate our domestic liquidity needs will be met through cash flows provided by operating activities, supplemented with long-term debt and short-term borrowings. Accordingly, we intend, with only certain exceptions, to continue to indefinitely reinvest our cash and cash equivalents held outside of the U.S. in our foreign operations. When the income earned, either from operations or through intercompany financing arrangements, and indefinitely reinvested outside of the U.S. is taxed at local country tax rates, which are generally lower than the U.S. statutory rate, we realize an effective tax rate benefit. If our intentions with respect to reinvestment were to change, most of the amounts held within our foreign operations could be repatriated to the U.S., although any repatriation under current U.S. tax laws would be subject to U.S. federal income taxes, less applicable foreign tax credits. As of January 31, 2015 and 2014, cash and cash equivalents of approximately $1.7 billion and $1.9 billion, respectively, may not be freely transferable to the U.S. due to local laws or other restrictions. We do not expect local laws, other limitations or potential taxes on anticipated future repatriations of cash amounts held outside of the U.S. to have a material effect on our overall liquidity, financial condition or results of operations.
Net Cash Used in Investing Activities
Fiscal Years Ended January 31, | ||||||||||||
(Amounts in millions) | 2015 | 2014 | 2013 | |||||||||
Net cash used in investing activities | $ | (11,125 | ) | $ | (12,526 | ) | $ | (12,637 | ) | |||
Net cash used in investing activities was $11.1 billion, $12.5 billion and $12.6 billion for fiscal 2015, 2014 and 2013, respectively, and generally consisted of payments to add stores, remodel numerous existing stores, expand our digital retail capabilities and invest in other technologies. Net cash used in investing activities decreased $1.4 billion for fiscal 2015, when compared to the previous fiscal year, primarily due to lower capital expenditures. The following table provides additional capital expenditure detail:
14
(Amounts in millions) | Allocation of Capital Expenditures Fiscal Years Ending January 31, | |||||||
Capital Expenditures | 2015 | 2014 | ||||||
New stores and clubs, including expansions and relocations | $ | 4,128 | $ | 5,083 | ||||
Information systems, distribution, digital retail and other | 3,288 | 2,539 | ||||||
Remodels | 822 | 1,030 | ||||||
Total U.S. | 8,238 | 8,652 | ||||||
Walmart International | 3,936 | 4,463 | ||||||
Total capital expenditures | $ | 12,174 | $ | 13,115 | ||||
Also reducing net cash used in investing activities were cash proceeds of $671 million received from the sale of the Vips Restaurant Business in Mexico ("Vips") on May 12, 2014, which is further described in Note 13 to our Consolidated Financial Statements.
We continue to focus on striving to seamlessly integrate the digital and physical shopping experience for our customers and expanded in digital retail in each of our segments during fiscal 2015, with Walmart U.S. and Sam's Club focused on digital retail in the U.S. and Walmart International focused on digital retail in countries outside of the U.S. Some of our fiscal 2015 accomplishments in this area were to successfully launch our new web platform in the U.S., grow mobile and increase our third-party marketplace offering.
Growth Activities
In fiscal 2016, we plan to add between 26 and 30 million square feet, which will include a continued investment in Neighborhood Markets and a moderation of Supercenter growth in the U.S. compared to recent fiscal years. In addition, we plan to accelerate the growth of our digital retail capabilities by investing $1.2 billion to $1.5 billion in e-commerce websites and mobile commerce applications that will include technology, infrastructure and other areas to better serve our customers and support our stores and clubs. We anticipate financing these growth activities through cash flows provided by operating activities and future debt financings.
The following table provides our estimated range for fiscal 2016 capital expenditures, as well as our estimated range for growth in retail square feet. Our anticipated digital retail expenditures are included in our estimated range for fiscal 2016 capital expenditures. The amounts in the table do not include capital expenditures or growth in retail square feet from any pending or future acquisitions.
Fiscal 2016 Projected Capital Expenditures (in billions) | Fiscal 2016 Projected Growth in Retail Square Feet (in thousands) | |||||||||||||||||
Walmart U.S. | $ | 6.1 | to | $ | 6.6 | 15,000 | to | 16,000 | ||||||||||
Walmart International | 3.7 | to | 4.2 | 10,000 | to | 13,000 | ||||||||||||
Sam's Club | 0.8 | to | 0.8 | 1,000 | to | 1,000 | ||||||||||||
Corporate and support | 1.0 | to | 1.3 | — | to | — | ||||||||||||
Total | $ | 11.6 | to | $ | 12.9 | 26,000 | to | 30,000 | ||||||||||
15
Net Cash Used in Financing Activities
Fiscal Years Ended January 31, | ||||||||||||
(Amounts in millions) | 2015 | 2014 | 2013 | |||||||||
Net cash used in financing activities | $ | (15,071 | ) | $ | (10,789 | ) | $ | (11,946 | ) | |||
Cash flows used in financing activities generally consist of transactions related to our short-term and long-term debt, as well as dividends paid and the repurchase of Company stock. Transactions with noncontrolling interest shareholders are also classified as cash flows from financing activities.
Short-term Borrowings
Short-term borrowings decreased $6.3 billion for fiscal 2015 and increased $0.9 billion for fiscal 2014, when compared to the previous fiscal year. We generally utilize the liquidity provided by short-term borrowings to provide funding used for our operations, dividend payments, share repurchases, capital expenditures and other cash requirements. However, more cash provided from operating activities combined with less cash used for share repurchases and capital expenditures during fiscal 2015, allowed us to minimize our short-term borrowings at January 31, 2015. In addition to our short-term borrowings, we also have various undrawn committed lines of credit that provide $15.0 billion of additional liquidity, if needed.
Long-term Debt
The following table provides the changes in our long-term debt for fiscal 2015:
(Amounts in millions) | Long-term debt due within one year | Long-term debt | Total | |||||||||
Balances as of February 1, 2014 | $ | 4,103 | $ | 41,771 | $ | 45,874 | ||||||
Proceeds from issuance of long-term debt | — | 5,174 | 5,174 | |||||||||
Payments of long-term debt | (3,904 | ) | — | (3,904 | ) | |||||||
Reclassifications of long-term debt | 4,267 | (4,267 | ) | — | ||||||||
Other | 344 | (1,592 | ) | (1,248 | ) | |||||||
Balances as of January 31, 2015 | $ | 4,810 | $ | 41,086 | $ | 45,896 | ||||||
Our total outstanding long-term debt balance was relatively flat as of January 31, 2015 compared to the balance as of January 31, 2014. During fiscal 2015, we used the proceeds from the issuance of long-term debt to pay down and refinance existing debt and for other corporate purposes.
Dividends
Our total dividend payments were $6.2 billion, $6.1 billion and $5.4 billion for fiscal 2015, 2014 and 2013, respectively, and on February 19, 2015, the Board of Directors approved the fiscal 2016 annual dividend of $1.96 per share, an increase compared to the fiscal 2015 annual dividend of $1.92 per share. For fiscal 2016, the annual dividend will be paid in four quarterly installments of $0.49 per share, according to the following record and payable dates:
Record Date | Payable Date | |
March 13, 2015 | April 6, 2015 | |
May 8, 2015 | June 1, 2015 | |
August 7, 2015 | September 8, 2015 | |
December 4, 2015 | January 4, 2016 | |
Company Share Repurchase Program
From time to time, we repurchase shares of our common stock under share repurchase programs authorized by the Board of Directors. The current $15.0 billion share repurchase program has no expiration date or other restrictions limiting the period over which we can make share repurchases. At January 31, 2015, authorization for $10.3 billion of share repurchases remained under the current share repurchase program. Any repurchased shares are constructively retired and returned to an unissued status.
16
We regularly review share repurchase activity and consider several factors in determining when to execute share repurchases, including, among other things, current cash needs, capacity for leverage, cost of borrowings, our results of operations and the market price of our common stock. The following table provides, on a settlement date basis, the number of shares repurchased, average price paid per share and total cash paid for share repurchases for fiscal 2015, 2014 and 2013:
Fiscal Years Ended January 31, | ||||||||||||
(Amounts in millions, except per share data) | 2015 | 2014 | 2013 | |||||||||
Total number of shares repurchased | 13.4 | 89.1 | 113.2 | |||||||||
Average price paid per share | $ | 75.82 | $ | 74.99 | $ | 67.15 | ||||||
Total cash paid for share repurchases | $ | 1,015 | $ | 6,683 | $ | 7,600 | ||||||
We decreased the total cash paid for share repurchases by $5.7 billion for fiscal 2015, compared to the previous fiscal year, as a result of current cash needs, capacity for leverage and increased cash used in transactions with noncontrolling interests described further below. In addition, our results of operations influenced our share repurchase activity.
Transactions with Noncontrolling Interests
As described in Note 13 to our Consolidated Financial Statements, during fiscal 2015, we completed the purchase of substantially all of the remaining noncontrolling interest in Walmart Chile for approximately $1.5 billion, using existing cash to complete this transaction.
Capital Resources
We believe cash flows from continuing operations, our current cash position and access to capital markets will continue to be sufficient to meet our anticipated operating cash needs, including to fund seasonal buildups in merchandise inventories, and to fund our capital expenditures, dividend payments and share repurchases.
We have strong commercial paper and long-term debt ratings that have enabled and should continue to enable us to refinance our debt as it becomes due at favorable rates in capital markets. At January 31, 2015, the ratings assigned to our commercial paper and rated series of our outstanding long-term debt were as follows:
Rating agency | Commercial paper | Long-term debt | ||
Standard & Poor's | A-1+ | AA | ||
Moody's Investors Service | P-1 | Aa2 | ||
Fitch Ratings | F1+ | AA | ||
Credit rating agencies review their ratings periodically and, therefore, the credit ratings assigned to us by each agency may be subject to revision at any time. Accordingly, we are not able to predict whether our current credit ratings will remain consistent over time. Factors that could affect our credit ratings include changes in our operating performance, the general economic environment, conditions in the retail industry, our financial position, including our total debt and capitalization, and changes in our business strategy. Any downgrade of our credit ratings by a credit rating agency could increase our future borrowing costs or impair our ability to access capital and credit markets on terms commercially acceptable to us. In addition, any downgrade of our current short-term credit ratings could impair our ability to access the commercial paper markets with the same flexibility that we have experienced historically, potentially requiring us to rely more heavily on more expensive types of debt financing. The credit rating agency ratings are not recommendations to buy, sell or hold our commercial paper or debt securities. Each rating may be subject to revision or withdrawal at any time by the assigning rating organization and should be evaluated independently of any other rating. Moreover, each credit rating is specific to the security to which it applies.
We monitor our credit rating and our capacity for long-term financing using various qualitative and quantitative factors, including our debt-to-total capitalization, as support for our long-term financing decisions. For the purpose of the debt-to-total capitalization calculation, debt is defined as the sum of short-term borrowings, long-term debt due within one year, obligations under capital leases due within one year, long-term debt and long-term obligations under capital leases. Total capitalization is defined as debt plus total Walmart shareholders' equity. At January 31, 2015 and 2014, the ratio of our debt-to-total capitalization was 38.2% and 42.6%, respectively. The decrease in our debt-to-total capitalization ratio was the result of using less cash for share repurchases and capital expenditures during fiscal 2015, which allowed us to minimize our short-term borrowings at January 31, 2015. The reduced share repurchases also resulted in increased growth in retained earnings. These impacts were partially offset by additional currency translation losses recorded in accumulated other comprehensive income (loss).
17
Contractual Obligations and Other Commercial Commitments
The following table sets forth certain information concerning our obligations and commitments to make contractual future payments, such as debt and lease agreements, and certain contingent commitments:
Payments Due During Fiscal Years Ending January 31, | ||||||||||||||||||||
(Amounts in millions) | Total | 2016 | 2017-2018 | 2019-2020 | Thereafter | |||||||||||||||
Recorded contractual obligations: | ||||||||||||||||||||
Long-term debt(1) | $ | 45,896 | $ | 4,810 | $ | 3,835 | $ | 4,032 | $ | 33,219 | ||||||||||
Short-term borrowings | 1,592 | 1,592 | — | — | — | |||||||||||||||
Capital lease obligations(2) | 5,454 | 504 | 920 | 778 | 3,252 | |||||||||||||||
Unrecorded contractual obligations: | ||||||||||||||||||||
Non-cancelable operating leases | 17,910 | 1,759 | 3,097 | 2,590 | 10,464 | |||||||||||||||
Estimated interest on long-term debt | 32,910 | 1,950 | 3,690 | 3,399 | 23,871 | |||||||||||||||
Trade letters of credit | 2,723 | 2,723 | — | — | — | |||||||||||||||
Stand-by letters of credit | 1,898 | 1,898 | — | — | — | |||||||||||||||
Purchase obligations | 10,712 | 6,548 | 3,428 | 652 | 84 | |||||||||||||||
Total commercial commitments | $ | 119,095 | $ | 21,784 | $ | 14,970 | $ | 11,451 | $ | 70,890 | ||||||||||
(1) | "Long-term debt" includes the fair value of our derivatives classified as fair value hedges. |
(2) | "Capital lease obligations" includes executory costs and imputed interest related to capital lease obligations that are not yet recorded. Refer to Note 11 in the "Notes to the Consolidated Financial Statements" for more information. |
Additionally, the Company has $15.0 billion in undrawn committed lines of credit which, if drawn upon, would be included in the current liabilities section of the Company's Consolidated Balance Sheets.
Estimated interest payments are based on our principal amounts and expected maturities of all debt outstanding at January 31, 2015, and management's forecasted market rates for our variable rate debt.
Purchase obligations include legally binding contracts, such as firm commitments for inventory and utility purchases, as well as commitments to make capital expenditures, software acquisition and license commitments and legally binding service contracts. Purchase orders for inventory and other services are not included in the table above. Purchase orders represent authorizations to purchase rather than binding agreements. For the purposes of this table, contractual obligations for the purchase of goods or services are defined as agreements that are enforceable and legally binding and that specify all significant terms, including: fixed or minimum quantities to be purchased; fixed, minimum or variable price provisions; and the approximate timing of the transaction. Our purchase orders are based on our current inventory needs and are fulfilled by our suppliers within short time periods. We also enter into contracts for outsourced services; however, the obligations under these contracts are not significant and the contracts generally contain clauses allowing for cancellation without significant penalty.
The expected timing for payment of the obligations discussed above is estimated based on current information. Timing of payments and actual amounts paid with respect to some unrecorded contractual commitments may be different depending on the timing of receipt of goods or services or changes to agreed-upon amounts for some obligations.
In addition to the amounts shown in the table above, $838 million of unrecognized tax benefits are considered uncertain tax positions and have been recorded as liabilities. The timing of the payment, if any, associated with these liabilities is uncertain. Refer to Note 9 in the "Notes to Consolidated Financial Statements" for additional discussion of unrecognized tax benefits.
Off Balance Sheet Arrangements
In addition to the unrecorded contractual obligations presented above, we have entered into certain arrangements, as discussed below, for which the timing of payment, if any, is unknown.
The Company has future lease commitments for land and buildings for approximately 282 future locations. These lease commitments have lease terms ranging from 1 to 30 years and provide for certain minimum rentals. If executed, payments under operating leases would increase by $58 million for fiscal 2016, based on current estimates.
In connection with certain long-term debt issuances, we could be liable for early termination payments if certain unlikely events were to occur. At January 31, 2015, the aggregate termination payment would have been $64 million. The arrangement pursuant to which this payment could be made will expire in fiscal 2019.
18
Market Risk
In addition to the risks inherent in our operations, we are exposed to certain market risks, including changes in interest rates and fluctuations in currency exchange rates.
The analysis presented below for each of our market risk sensitive instruments is based on a hypothetical scenario used to calibrate potential risk and does not represent our view of future market changes. The effect of a change in a particular assumption is calculated without adjusting any other assumption. In reality, however, a change in one factor could cause a change in another, which may magnify or negate other sensitivities.
Interest Rate Risk
We are exposed to changes in interest rates as a result of our short-term borrowings and long-term debt issuances. We hedge a portion of our interest rate risk by managing the mix of fixed and variable rate debt and by entering into interest rate swaps. For fiscal 2015, the net fair value of our interest rate swaps decreased approximately $158 million primarily due to fluctuations in market interest rates and the termination of forward starting receive variable-rate, pay fixed-rate swaps in October and April 2014 concurrently with the issuance of debt.
The table below provides information about our financial instruments that are sensitive to changes in interest rates. For debt obligations, the table represents the principal cash flows and related weighted-average interest rates by expected maturity dates. For interest rate swaps, the table represents the contractual cash flows and weighted-average interest rates by the contractual maturity date, unless otherwise noted. The notional amounts are used to calculate contractual cash flows to be exchanged under the contracts. The weighted-average variable rates are based upon prevailing market rates at January 31, 2015.
Expected Maturity Date | ||||||||||||||||||||||||||||
(Amounts in millions) | Fiscal 2016 | Fiscal 2017 | Fiscal 2018 | Fiscal 2019 | Fiscal 2020 | Thereafter | Total | |||||||||||||||||||||
Liabilities | ||||||||||||||||||||||||||||
Short-term borrowings: | ||||||||||||||||||||||||||||
Variable rate | $ | 1,592 | $ | — | $ | — | $ | — | $ | — | $ | — | $ | 1,592 | ||||||||||||||
Weighted-average interest rate | 0.5 | % | — | % | — | % | — | % | — | % | — | % | 0.5 | % | ||||||||||||||
Long-term debt(1): | ||||||||||||||||||||||||||||
Fixed rate | $ | 4,055 | $ | 2,055 | $ | 1,523 | $ | 3,518 | $ | 514 | $ | 33,219 | $ | 44,884 | ||||||||||||||
Weighted-average interest rate | 2.5 | % | 1.9 | % | 4.0 | % | 3.1 | % | 4.3 | % | 4.9 | % | 4.4 | % | ||||||||||||||
Variable rate | $ | 755 | $ | 257 | $ | — | $ | — | $ | — | $ | — | $ | 1,012 | ||||||||||||||
Weighted-average interest rate | 3.8 | % | 4.2 | % | — | % | — | % | — | % | — | % | 3.9 | % | ||||||||||||||
Interest rate derivatives | ||||||||||||||||||||||||||||
Interest rate swaps: | ||||||||||||||||||||||||||||
Variable to fixed | $ | 255 | $ | — | $ | — | $ | — | $ | — | $ | — | $ | 255 | ||||||||||||||
Weighted-average pay rate | 0.9 | % | — | % | — | % | — | % | — | % | — | % | 0.9 | % | ||||||||||||||
Weighted-average receive rate | 0.6 | % | — | % | — | % | — | % | — | % | — | % | 0.6 | % | ||||||||||||||
Fixed to variable | $ | — | $ | — | $ | — | $ | — | $ | — | $ | 500 | $ | 500 | ||||||||||||||
Weighted-average pay rate | — | % | — | % | — | % | — | % | — | % | 1.5 | % | 1.5 | % | ||||||||||||||
Weighted-average receive rate | — | % | — | % | — | % | — | % | — | % | 3.3 | % | 3.3 | % | ||||||||||||||
(1) | The long-term debt amounts in the table exclude the Company's derivatives classified as fair value hedges. |
As of January 31, 2015, our variable rate borrowings, including the effect of our commercial paper and interest rate swaps, represented 7% of our total short-term and long-term debt. Based on January 31, 2015 debt levels, a 100 basis point change in prevailing market rates would cause our annual interest costs to change by approximately $23 million.
19
Foreign Currency Risk
We are exposed to fluctuations in foreign currency exchange rates as a result of our net investments and operations in countries other than the U.S. For fiscal 2015, movements in currency exchange rates and the related impact on the translation of the balance sheets of the Company's subsidiaries in Canada, the United Kingdom, Japan, Mexico and Chile were the primary cause of the $3.6 billion net loss in the currency translation and other category of accumulated other comprehensive income (loss). We hedge a portion of our foreign currency risk by entering into currency swaps and designating certain foreign-currency-denominated long-term debt as net investment hedges.
We hold currency swaps to hedge the currency exchange component of our net investments and also to hedge the currency exchange rate fluctuation exposure associated with the forecasted payments of principal and interest of non-U.S. denominated debt. The aggregate fair value of these swaps was in a liability position of $110 million at January 31, 2015 and in an asset position of $550 million at January 31, 2014. The change in the fair value of these swaps was due to fluctuations in currency exchange rates, primarily the strengthening of the U.S. dollar relative to other currencies in the latter half of fiscal 2015. A hypothetical 10% increase or decrease in the currency exchange rates underlying these swaps from the market rate at January 31, 2015 would have resulted in a loss or gain in the value of the swaps of $435 million. A hypothetical 10% change in interest rates underlying these swaps from the market rates in effect at January 31, 2015 would have resulted in a loss or gain in value of the swaps of $20 million.
In addition to currency swaps, we have designated foreign-currency-denominated long-term debt as nonderivative hedges of net investments of certain of our foreign operations. At January 31, 2015 and 2014, we had £2.5 billion of outstanding long-term debt designated as a hedge of our net investment in the United Kingdom. At January 31, 2015, a hypothetical 10% increase or decrease in the value of the U.S. dollar relative to the British pound would have resulted in a gain or loss in the value of the debt of $342 million. In addition, we had outstanding long-term debt of ¥100 billion at January 31, 2015 and ¥200 billion at January 31, 2014, that was designated as a hedge of our net investment in Japan. At January 31, 2015, a hypothetical 10% increase or decrease in value of the U.S. dollar relative to the Japanese yen would have resulted in a gain or loss in the value of the debt of $77 million.
Other Matters
We discuss our existing FCPA investigation and related matters in the Annual Report on Form 10-K for fiscal 2015, including certain risks arising therefrom, in Part I, Item 1A of the Form 10-K under the caption "Risk Factors" and in Note 10 to our Consolidated Financial Statements, which is captioned "Contingencies," under the sub-caption "FCPA Investigation and Related Matters." We also discuss various legal proceedings related to the FCPA investigation in Item 3 of the Form 10-K under the caption "Item 3. Legal Proceedings," under the sub-caption "II. Certain Other Proceedings." We discuss our "equal value" claims against our United Kingdom subsidiary, ASDA Stores, Ltd., in the Annual Report on Form 10-K for fiscal 2015, including certain risks arising therefrom, in Part I, Item 1A of the Form 10-K under the caption "Risk Factors" and in Note 10 to our Consolidated Financial Statements, which is captioned "Contingencies," under the sub-caption "Legal Proceedings."
20
Summary of Critical Accounting Estimates
Management strives to report our financial results in a clear and understandable manner, although in some cases accounting and disclosure rules are complex and require us to use technical terminology. In preparing the Company's Consolidated Financial Statements, we follow accounting principles generally accepted in the U.S. These principles require us to make certain estimates and apply judgments that affect our financial position and results of operations as reflected in our financial statements. These judgments and estimates are based on past events and expectations of future outcomes. Actual results may differ from our estimates.
Management continually reviews our accounting policies, how they are applied and how they are reported and disclosed in our financial statements. Following is a summary of our critical accounting estimates and how they are applied in preparation of the financial statements.
Inventories
We value inventories at the lower of cost or market as determined primarily by the retail method of accounting, using the last-in, first-out ("LIFO") method for substantially all of the Walmart U.S. segment's inventories. The inventory at the Walmart International segment is valued primarily by the retail inventory method of accounting, using the first-in, first-out ("FIFO") method. The retail method of accounting results in inventory being valued at the lower of cost or market since permanent markdowns are immediately recorded as a reduction of the retail value of inventory. The inventory at the Sam's Club segment is valued based on the weighted-average cost using the LIFO method.
Under the retail method of accounting, inventory is valued at the lower of cost or market, which is determined by applying a cost-to-retail ratio to each merchandise grouping's retail value. The FIFO cost-to-retail ratio is generally based on the fiscal year purchase activity. The cost-to-retail ratio for measuring any LIFO provision is based on the initial margin of the fiscal year purchase activity less the impact of any permanent markdowns. The retail method of accounting requires management to make certain judgments and estimates that may significantly impact the ending inventory valuation at cost, as well as the amount of gross profit recognized. Judgments made include recording markdowns used to sell inventory and shrinkage. When management determines the ability to sell inventory has diminished, markdowns for clearance activity and the related cost impact are recorded. Factors considered in the determination of markdowns include current and anticipated demand, customer preferences and age of merchandise, as well as seasonal and fashion trends. Changes in weather and customer preferences could cause material changes in the amount and timing of markdowns from year to year.
When necessary, we record a LIFO provision for the estimated annual effect of inflation, and these estimates are adjusted to actual results determined at year-end. Our LIFO provision is calculated based on inventory levels, markup rates and internally generated retail price indices. At January 31, 2015 and 2014, our inventories valued at LIFO approximated those inventories as if they were valued at FIFO.
We provide for estimated inventory losses, or shrinkage, between physical inventory counts on the basis of a percentage of sales. Following annual inventory counts, the provision is adjusted to reflect updated historical results.
Impairment of Assets
We evaluate long-lived assets other than goodwill and assets with indefinite lives for indicators of impairment whenever events or changes in circumstances indicate their carrying amounts may not be recoverable. Management's judgments regarding the existence of impairment indicators are based on market conditions and operational performance, such as operating income and cash flows. The evaluation for long-lived assets is performed at the lowest level of identifiable cash flows, which is generally at the individual store level or, in certain markets, at the market group level. The variability of these factors depends on a number of conditions, including uncertainty about future events and changes in demographics. Thus, our accounting estimates may change from period to period. These factors could cause management to conclude that indicators of impairment exist and require impairment tests be performed, which could result in management determining the value of long-lived assets is impaired, resulting in a write-down of the related long-lived assets.
Goodwill and other indefinite-lived acquired intangible assets are not amortized, but are evaluated for impairment annually or whenever events or changes in circumstances indicate that the value of a certain asset may be impaired. Generally, this evaluation begins with a qualitative assessment to determine whether a quantitative impairment test is necessary. If we determine, after performing an assessment based on the qualitative factors, that the fair value of the reporting unit is more likely than not less than the carrying amount, or that a fair value of the reporting unit substantially in excess of the carrying amount cannot be assured, then a quantitative impairment test would be performed. The quantitative test for impairment requires management to make judgments relating to future cash flows, growth rates and economic and market conditions. These evaluations are based on determining the fair value of a reporting unit or asset using a valuation method such as discounted cash flow or a relative, market-based approach. Historically, our reporting units have generated sufficient returns to recover the cost of goodwill and other indefinite-lived acquired intangible assets. Because of the nature of the factors used in these tests, if different conditions occur in future periods, future operating results could be materially impacted.
21
As of January 31, 2015, the fair value of certain recently acquired indefinite-lived intangible assets approximated their carrying value of $419 million. Any deterioration in the fair value of these assets would result in a related impairment charge. Management will continue to monitor the fair value of these assets in future periods.
Income Taxes
Income taxes have a significant effect on our net earnings. We are subject to income taxes in the U.S. and numerous foreign jurisdictions. Accordingly, the determination of our provision for income taxes requires significant judgment, the use of estimates and the interpretation and application of complex tax laws. Our effective income tax rate is affected by many factors, including changes in our assessment of certain tax contingencies, increases and decreases in valuation allowances, changes in tax law, outcomes of administrative audits, the impact of discrete items and the mix of earnings among our U.S. and international operations where the statutory rates are generally lower than the U.S. statutory rate, and may fluctuate as a result.
Our tax returns are routinely audited and settlements of issues raised in these audits sometimes affect our tax provisions. The benefits of uncertain tax positions are recorded in our financial statements only after determining a more likely than not probability that the uncertain tax positions will withstand challenge, if any, from taxing authorities. When facts and circumstances change, we reassess these probabilities and record any changes in the financial statements as appropriate. We account for uncertain tax positions by determining the minimum recognition threshold that a tax position is required to meet before being recognized in the financial statements. This determination requires the use of significant judgment in evaluating our tax positions and assessing the timing and amounts of deductible and taxable items.
Deferred tax assets represent amounts available to reduce income taxes payable on taxable income in future years. Such assets arise because of temporary differences between the financial reporting and tax bases of assets and liabilities, as well as from net operating loss and tax credit carryforwards. Deferred tax assets are evaluated for future realization and reduced by a valuation allowance to the extent that a portion is not more likely than not to be realized. Many factors are considered when assessing whether it is more likely than not that the deferred tax assets will be realized, including recent cumulative earnings, expectations of future taxable income, carryforward periods and other relevant quantitative and qualitative factors. The recoverability of the deferred tax assets is evaluated by assessing the adequacy of future expected taxable income from all sources, including reversal of taxable temporary differences, forecasted operating earnings and available tax planning strategies. This evaluation relies heavily on estimates.
22
Cautionary Statement Regarding Forward-Looking Statements
This Annual Report to Shareholders contains statements that we believe are "forward-looking statements" entitled to the protection of the safe harbor for forward-looking statements provided by the Private Securities Litigation Reform Act of 1995, as amended.
Forward-looking Statements
Those forward-looking statements include statements:
in our Management's Discussion and Analysis of Financial Condition and Results of Operations regarding:
• | volatility of currency exchange rates possibly affecting future results of Walmart and Walmart International; |
• | our objectives of growing net sales at a faster rate than operating expenses and operating income at a faster rate than net sales and our strategic growth investments affecting those metrics in certain ways; |
• | the possible fluctuation of our effective tax rate for future periods; |
• | volatility of fuel prices possibly affecting the operating results of our Sam's Club segment in the future; |
• | meeting our liquidity needs through sources other than cash held outside of the U.S., intending to permanently reinvest such cash outside of the U.S., and our ability to repatriate cash held outside of the U.S. (which statements also appear in Note 1 to our Consolidated Financial Statements); |
• | the recently announced new associate wage structure and comprehensive associate training and educational programs adversely affecting Walmart's ability to leverage in the future and cash provided by operating activities being sufficient to fund those programs; |
• | our fiscal 2016 global expansion plans, continued investment in Neighborhood Markets, moderation in U.S. supercenter growth, growing our retail square feet and expanding our digital retail capabilities and our plans to finance our growth activities; |
• | our estimated range of capital expenditures (including digital retail capital expenditures) in fiscal 2016 for each of our reportable segments, in the "Corporate and support" category and in total; |
• | the estimated/projected growth in retail square feet in total and by reportable segment in fiscal 2016; |
• | our cash flows from continuing operations, current cash position and access to debt and capital markets continuing to be sufficient to meet our cash needs for operations and other specified purposes; and |
• | the amount of increases in payments under operating leases if certain leases are executed (which statement also appears in Note 11 to our Consolidated Financial Statements); |
in the Notes to our Consolidated Financial Statements regarding:
• | any portion of our net investment and cash flow instruments that is an ineffective hedge being insignificant and the amounts related to our derivatives expected to be reclassified from accumulated other comprehensive income (loss) to net income during the next 12 months being insignificant (Note 8); |
• | the realization of certain net deferred tax assets, tax audit resolutions over fiscal 2016 reducing unrecognized tax benefits within a certain range or beyond and the reasons for that reduction, any change not having a significant impact on our Consolidated Financial Statements and the possibility that the resolution of a group of related non-income tax matters might result in a material liability to Walmart (Note 9); |
• | an adverse decision in, or settlement of, certain litigation possibly resulting in material liability to us and matters relating to an FCPA investigation not having a material adverse effect on our business (Note 10); |
in this Annual Report regarding:
• | under "Our framework for growth," our strategic plan, Walmart always being aggressive on price and equipping customers with information and technology to facilitate great customer service; |
• | in our Chief Executive Officer's letter, driving sales growth by executing well in stores and e-commerce, our objective of running great stores, clubs and e-commerce to grow our business, investment in increased wages and other initiatives for our U.S. associates, our fresh food offering and e-commerce innovations being future growth drivers and generating increased shareholder value when we operate and grow efficiently and our commitment to compliance, ethics and doing business the right way; |
• | under "Delivering an improved shopping experience.," in connection with our Walmart U.S. segment, certain wage increases for U.S. associates, continuing to strengthen fresh departments, certain factors ensuring a superior fresh offering to Walmart U.S.'s customers, addition of items sold on walmart.com, continuing to work with supplier partners to ensure everyday low cost and ensuring everyday low cost allowing investment in and strengthening of the segment's everyday low cost pricing strategy and offering value to customers, the ranges of the number of units and amount of retail square feet to be added by Walmart U.S. in fiscal 2016, and transparent pricing for customers occurring through new tools and capabilities; |
23
• | under "Driving increased profitability through balanced growth.," in connection with our Walmart International segment, the segment strategically optimizing its global positioning across key geographies and formats to maximize growth potential and its objective of strengthening customer trust with a focus on everyday low price, high quality fresh food and excellent customer service; |
• | under "Creating a more rewarding member experience.," in connection with our Sam's Club segment, Sam's Club's goal of having a suite of business member services making membership in Sam’s Club such members’ most valuable business card and the range for the number of new and relocated clubs to be opened, and the number of clubs to be remodeled, in fiscal 2016; and |
• | under "A solid FY 15 performance; investing for a stronger future," currency exchange rates possibly continuing to be a headwind to operating results in fiscal 2016, the range of net retail square footage we will add in fiscal 2016, Walmart enabling customers to shop anytime and anywhere, incremental e-commerce investment in fiscal 2016 and Walmart continuing to seek the right balance between sales growth and profitability as we grow our e-commerce business and the investment in wages and other initiatives for U.S. associates leading to higher sales and returns. |
The forward-looking statements described above are identified by the use in such statements of one or more of the words or phrases "aim," "anticipate," "could be," "could reduce," "estimated," "expansion," "expect," "goal," "grow," "intend," "investment," "is expected," "may cause," "may continue," "may fluctuate," "may impact," "may not be," "may result," "objective," "plan," "priority is to," "projected," "should continue," "more to come," "we'll," "we'll accomplish," "we'll also equip," "we'll always be," "we'll continue," "we'll drive," "we'll generate," "we'll reinvent," "will add," "will allow," "will be," "will be met," "will be paid," "will continue," "will depend," "will ensure," "will have," "will impact," "will include," "will increase," "will open," "would be," and "would increase," variations of such words and phrases and other similar words or phrases.
The forward-looking statements included in this Annual Report and that we make elsewhere are subject to certain risks, factors and uncertainties that could materially affect our actual results and the realization of our objectives and plans. These risks, factors and uncertainties include, but are not limited to:
Risks, Factors and Uncertainties Relating to the Markets in which We Operate
• | economic, geo-political, financial markets, capital markets and business conditions, changes, trends and events globally and in one or more of the markets in which we operate; |
• | unemployment and underemployment levels globally and in one or more of the markets in which we operate; |
• | monetary policies of the U.S. government, the Board of Governors of the Federal Reserve System, other governments or central banks, economic or sovereign debt crises and disruptions in the financial markets; |
• | supply of and demand for particular commodities and commodity prices, including the prices of crude oil, natural gas, refined petroleum products and electricity; |
• | inflation and deflation; |
• | currency exchange rate fluctuations and volatility; |
• | fluctuations in market rates of interest; |
• | market labor costs in the U.S.; |
• | market selling prices of gasoline and diesel fuel; |
• | competitive initiatives of other retailers, other competitive pressures and new competitors entering a market; |
• | adoption of or changes in tax, labor and other laws and regulations and interpretations thereof that affect our business, including changes in corporate and personal tax rates and the imposition of new taxes and surcharges; |
Risks, Factors and Uncertainties Relating to Consumers Generally and Our Customers
• | consumer confidence, disposable income, debt levels, credit availability, spending levels, shopping patterns and demand for certain merchandise in one or more of the markets in which we operate; |
• | consumer acceptance of our stores and clubs, e-commerce websites and mobile commerce applications, our digital and physical retail initiatives, programs and merchandise offerings, including our fresh food offerings, globally in one or more of the markets in which we operate; |
Risks, Factors and Uncertainties Specifically Relating to Our Operations in Any or All of the Markets in which We Operate
• | our historical financial performance, including our U.S. and Walmart International cash flows, for one or more periods or historical financial position as of one or more dates completed or occurring after the date the pertinent forward-looking statement is made; |
• | the cost of the goods we sell; |
• | the availability, at an acceptable cost, of adequate supplies of consistent, high-quality produce from suppliers in the local markets in which we operate; |
24
• | the availability of persons with the skills and abilities necessary to meet our needs for managing and staffing our operations, including to manage and staff new and relocated units; |
• | the mix of merchandise we sell globally or in one or more of the markets in which we operate; |
• | the size of and turnover in our hourly workforce; |
• | our selling prices of gasoline and diesel fuel; |
• | cyberattacks on our information systems, including any of those used to operate our e-commerce websites and our information security costs and any costs and liabilities we would incur as a result of a successful cyberattack; |
• | disruption in the availability of our e-commerce websites and mobile commerce applications; |
• | the availability of attractive opportunities for investment in retail operations in the markets in which we currently operate and in new markets and for investment in digital retail acquisitions and initiatives; |
• | disruption in our supply chain, including of the availability and transport of goods from domestic and foreign suppliers to our stores and other facilities; |
• | the mix of our earnings from our U.S. and operations in one or more of the markets in which we operate; |
• | the amounts of our net sales and expenses for a period denominated in particular currencies other than the U.S. dollar; |
• | changes in our assessment of certain tax contingencies, increases or decreases in valuation allowances, outcome of administrative audits, the impact of discrete items on our effective tax rate and the resolution of other tax matters; |
• | developments in and the outcome of legal and regulatory proceedings to which we are a party or are subject and the expenses associated therewith; |
• | the requirements for expenditures in connection with the FCPA-related matters; |
• | unanticipated changes in operating philosophy, plans and objectives; |
• | availability and the cost of acceptable building sites for new and relocated stores, clubs and other facilities; |
• | real estate, zoning, land use and other laws, ordinances, legal restrictions and initiatives that may prevent Walmart from building, or that impose limitations on Walmart's ability to build new units in certain locations or relocate or expand existing units; |
• | availability of necessary utilities for new or expanded units; and |
• | availability of skilled labor and labor, material and other construction costs in areas in which new or relocated units are proposed to be constructed or existing units are proposed to be expanded or remodeled. |
Other Risk Factors; No Duty to Update
We discuss certain of these factors more fully, as well as certain other risk factors that may affect the results and other matters discussed in the forward-looking statements identified above, in our filings with the Securities and Exchange Commission (the "SEC"), including our Annual Report on Form 10-K under the heading "Item 1A. Risk Factors." We filed our Annual Report on Form 10-K for the fiscal year ended January 31, 2015, with the SEC on April 1, 2015. The forward-looking statements described above are made based on knowledge of our business and the environment in which we operate and assumptions that we believe to be reasonable at the time such forward-looking statements are made. However, as a consequence of the risks, factors and uncertainties we discuss above, and in the other reports mentioned above, other risks not known to us at this time, changes in facts, assumptions not being realized or other circumstances, our actual results may differ materially from those results discussed in or implied or contemplated by such forward-looking statements. We cannot assure the reader that the results or developments expected or anticipated by us will be realized or, even if substantially realized, that those results or developments will result in the expected consequences for us or affect us, our business or our operations in the way we expect. You are urged to consider all of these risks, factors and uncertainties carefully in evaluating the forward-looking statements and not to place undue reliance on such forward-looking statements. The forward-looking statements included in this Annual Report speak only as of the date of this report, and we undertake no obligation to update these forward-looking statements to reflect subsequent events or circumstances, except as may be required by applicable law.
25
Wal-Mart Stores, Inc.
Consolidated Statements of Income
Fiscal Years Ended January 31, | ||||||||||||
(Amounts in millions, except per share data) | 2015 | 2014 | 2013 | |||||||||
Revenues: | ||||||||||||
Net sales | $ | 482,229 | $ | 473,076 | $ | 465,604 | ||||||
Membership and other income | 3,422 | 3,218 | 3,047 | |||||||||
Total revenues | 485,651 | 476,294 | 468,651 | |||||||||
Costs and expenses: | ||||||||||||
Cost of sales | 365,086 | 358,069 | 352,297 | |||||||||
Operating, selling, general and administrative expenses | 93,418 | 91,353 | 88,629 | |||||||||
Operating income | 27,147 | 26,872 | 27,725 | |||||||||
Interest: | ||||||||||||
Debt | 2,161 | 2,072 | 1,977 | |||||||||
Capital leases | 300 | 263 | 272 | |||||||||
Interest income | (113 | ) | (119 | ) | (186 | ) | ||||||
Interest, net | 2,348 | 2,216 | 2,063 | |||||||||
Income from continuing operations before income taxes | 24,799 | 24,656 | 25,662 | |||||||||
Provision for income taxes: | ||||||||||||
Current | 8,504 | 8,619 | 7,976 | |||||||||
Deferred | (519 | ) | (514 | ) | (18 | ) | ||||||
Total provision for income taxes | 7,985 | 8,105 | 7,958 | |||||||||
Income from continuing operations | 16,814 | 16,551 | 17,704 | |||||||||
Income from discontinued operations, net of income taxes | 285 | 144 | 52 | |||||||||
Consolidated net income | 17,099 | 16,695 | 17,756 | |||||||||
Less consolidated net income attributable to noncontrolling interest | (736 | ) | (673 | ) | (757 | ) | ||||||
Consolidated net income attributable to Walmart | $ | 16,363 | $ | 16,022 | $ | 16,999 | ||||||
Basic net income per common share: | ||||||||||||
Basic income per common share from continuing operations attributable to Walmart | $ | 5.01 | $ | 4.87 | $ | 5.03 | ||||||
Basic income per common share from discontinued operations attributable to Walmart | 0.06 | 0.03 | 0.01 | |||||||||
Basic net income per common share attributable to Walmart | $ | 5.07 | $ | 4.90 | $ | 5.04 | ||||||
Diluted net income per common share: | ||||||||||||
Diluted income per common share from continuing operations attributable to Walmart | $ | 4.99 | $ | 4.85 | $ | 5.01 | ||||||
Diluted income per common share from discontinued operations attributable to Walmart | 0.06 | 0.03 | 0.01 | |||||||||
Diluted net income per common share attributable to Walmart | $ | 5.05 | $ | 4.88 | $ | 5.02 | ||||||
Weighted-average common shares outstanding: | ||||||||||||
Basic | 3,230 | 3,269 | 3,374 | |||||||||
Diluted | 3,243 | 3,283 | 3,389 | |||||||||
Dividends declared per common share | $ | 1.92 | $ | 1.88 | $ | 1.59 | ||||||
See accompanying notes.
26
Wal-Mart Stores, Inc.
Consolidated Statements of Comprehensive Income
Fiscal Years Ended January 31, | ||||||||||||
(Amounts in millions) | 2015 | 2014 | 2013 | |||||||||
Consolidated net income | $ | 17,099 | $ | 16,695 | $ | 17,756 | ||||||
Less consolidated net income attributable to nonredeemable noncontrolling interest | (736 | ) | (606 | ) | (684 | ) | ||||||
Less consolidated net income attributable to redeemable noncontrolling interest | — | (67 | ) | (73 | ) | |||||||
Consolidated net income attributable to Walmart | 16,363 | 16,022 | 16,999 | |||||||||
Other comprehensive income (loss), net of income taxes | ||||||||||||
Currency translation and other | (4,179 | ) | (3,146 | ) | 1,042 | |||||||
Derivative instruments | (470 | ) | 207 | 136 | ||||||||
Minimum pension liability | (69 | ) | 153 | (166 | ) | |||||||
Other comprehensive income (loss), net of income taxes | (4,718 | ) | (2,786 | ) | 1,012 | |||||||
Less other comprehensive income (loss) attributable to nonredeemable noncontrolling interest | 546 | 311 | (138 | ) | ||||||||
Less other comprehensive income (loss) attributable to redeemable noncontrolling interest | — | 66 | (51 | ) | ||||||||
Other comprehensive income (loss) attributable to Walmart | (4,172 | ) | (2,409 | ) | 823 | |||||||
Comprehensive income, net of income taxes | 12,381 | 13,909 | 18,768 | |||||||||
Less comprehensive income (loss) attributable to nonredeemable noncontrolling interest | (190 | ) | (295 | ) | (822 | ) | ||||||
Less comprehensive income (loss) attributable to redeemable noncontrolling interest | — | (1 | ) | (124 | ) | |||||||
Comprehensive income attributable to Walmart | $ | 12,191 | $ | 13,613 | $ | 17,822 | ||||||
See accompanying notes.
27
Wal-Mart Stores, Inc.
Consolidated Balance Sheets
As of January 31, | ||||||||
(Amounts in millions) | 2015 | 2014 | ||||||
ASSETS | ||||||||
Current assets: | ||||||||
Cash and cash equivalents | $ | 9,135 | $ | 7,281 | ||||
Receivables, net | 6,778 | 6,677 | ||||||
Inventories | 45,141 | 44,858 | ||||||
Prepaid expenses and other | 2,224 | 1,909 | ||||||
Current assets of discontinued operations | — | 460 | ||||||
Total current assets | 63,278 | 61,185 | ||||||
Property and equipment: | ||||||||
Property and equipment | 177,395 | 173,089 | ||||||
Less accumulated depreciation | (63,115 | ) | (57,725 | ) | ||||
Property and equipment, net | 114,280 | 115,364 | ||||||
Property under capital leases: | ||||||||
Property under capital leases | 5,239 | 5,589 | ||||||
Less accumulated amortization | (2,864 | ) | (3,046 | ) | ||||
Property under capital leases, net | 2,375 | 2,543 | ||||||
Goodwill | 18,102 | 19,510 | ||||||
Other assets and deferred charges | 5,671 | 6,149 | ||||||
Total assets | $ | 203,706 | $ | 204,751 | ||||
LIABILITIES, REDEEMABLE NONCONTROLLING INTEREST, AND EQUITY | ||||||||
Current liabilities: | ||||||||
Short-term borrowings | $ | 1,592 | $ | 7,670 | ||||
Accounts payable | 38,410 | 37,415 | ||||||
Accrued liabilities | 19,152 | 18,793 | ||||||
Accrued income taxes | 1,021 | 966 | ||||||
Long-term debt due within one year | 4,810 | 4,103 | ||||||
Obligations under capital leases due within one year | 287 | 309 | ||||||
Current liabilities of discontinued operations | — | 89 | ||||||
Total current liabilities | 65,272 | 69,345 | ||||||
Long-term debt | 41,086 | 41,771 | ||||||
Long-term obligations under capital leases | 2,606 | 2,788 | ||||||
Deferred income taxes and other | 8,805 | 8,017 | ||||||
Redeemable noncontrolling interest | — | 1,491 | ||||||
Commitments and contingencies | ||||||||
Equity: | ||||||||
Common stock | 323 | 323 | ||||||
Capital in excess of par value | 2,462 | 2,362 | ||||||
Retained earnings | 85,777 | 76,566 | ||||||
Accumulated other comprehensive income (loss) | (7,168 | ) | (2,996 | ) | ||||
Total Walmart shareholders' equity | 81,394 | 76,255 | ||||||
Nonredeemable noncontrolling interest | 4,543 | 5,084 | ||||||
Total equity | 85,937 | 81,339 | ||||||
Total liabilities, redeemable noncontrolling interest, and equity | $ | 203,706 | $ | 204,751 | ||||
See accompanying notes.
28
Wal-Mart Stores, Inc.
Consolidated Statement of Shareholders' Equity and Redeemable Noncontrolling Interest
Accumulated | Total | ||||||||||||||||||||||||||||||||||
Capital in | Other | Walmart | Nonredeemable | Redeemable | |||||||||||||||||||||||||||||||
(Amounts in millions) | Common Stock | Excess of | Retained | Comprehensive | Shareholders' | Noncontrolling | Total | Noncontrolling | |||||||||||||||||||||||||||
Shares | Amount | Par Value | Earnings | Income (Loss) | Equity | Interest | Equity | Interest | |||||||||||||||||||||||||||
Balances as of February 1, 2012 | 3,418 | $ | 342 | $ | 3,692 | $ | 68,691 | $ | (1,410 | ) | $ | 71,315 | $ | 4,446 | $ | 75,761 | $ | 404 | |||||||||||||||||
Consolidated net income | — | — | — | 16,999 | — | 16,999 | 684 | 17,683 | 73 | ||||||||||||||||||||||||||
Other comprehensive income, net of income taxes | — | — | — | — | 823 | 823 | 138 | 961 | 51 | ||||||||||||||||||||||||||
Cash dividends declared ($1.59 per share) | — | — | — | (5,361 | ) | — | (5,361 | ) | — | (5,361 | ) | — | |||||||||||||||||||||||
Purchase of Company stock | (115 | ) | (11 | ) | (357 | ) | (7,341 | ) | — | (7,709 | ) | — | (7,709 | ) | — | ||||||||||||||||||||
Nonredeemable noncontrolling interest of acquired entity | — | — | — | — | — | — | 469 | 469 | — | ||||||||||||||||||||||||||
Other | 11 | 1 | 285 | (10 | ) | — | 276 | (342 | ) | (66 | ) | (9 | ) | ||||||||||||||||||||||
Balances as of January 31, 2013 | 3,314 | 332 | 3,620 | 72,978 | (587 | ) | 76,343 | 5,395 | 81,738 | 519 | |||||||||||||||||||||||||
Consolidated net income | — | — | — | 16,022 | — | 16,022 | 595 | 16,617 | 78 | ||||||||||||||||||||||||||
Other comprehensive loss, net of income taxes | — | — | — | — | (2,409 | ) | (2,409 | ) | (311 | ) | (2,720 | ) | (66 | ) | |||||||||||||||||||||
Cash dividends declared ($1.88 per share) | — | — | — | (6,139 | ) | — | (6,139 | ) | — | (6,139 | ) | — | |||||||||||||||||||||||
Purchase of Company stock | (87 | ) | (9 | ) | (294 | ) | (6,254 | ) | — | (6,557 | ) | — | (6,557 | ) | — | ||||||||||||||||||||
Redemption value adjustment of redeemable noncontrolling interest | — | — | (1,019 | ) | — | — | (1,019 | ) | — | (1,019 | ) | 1,019 | |||||||||||||||||||||||
Other | 6 | — | 55 | (41 | ) | — | 14 | (595 | ) | (581 | ) | (59 | ) | ||||||||||||||||||||||
Balances as of January 31, 2014 | 3,233 | 323 | 2,362 | 76,566 | (2,996 | ) | 76,255 | 5,084 | 81,339 | 1,491 | |||||||||||||||||||||||||
Consolidated net income | — | — | — | 16,363 | — | 16,363 | 736 | 17,099 | — | ||||||||||||||||||||||||||
Other comprehensive income, net of income taxes | — | — | — | — | (4,172 | ) | (4,172 | ) | (546 | ) | (4,718 | ) | — | ||||||||||||||||||||||
Cash dividends declared ($1.92 per share) | — | — | — | (6,185 | ) | — | (6,185 | ) | — | (6,185 | ) | — | |||||||||||||||||||||||
Purchase of Company stock | (13 | ) | (1 | ) | (29 | ) | (950 | ) | — | (980 | ) | — | (980 | ) | — | ||||||||||||||||||||
Purchase of redeemable noncontrolling interest | — | — | — | — | — | — | — | — | (1,491 | ) | |||||||||||||||||||||||||
Other | 8 | 1 | 129 | (17 | ) | — | 113 | (731 | ) | (618 | ) | — | |||||||||||||||||||||||
Balances as of January 31, 2015 | 3,228 | $ | 323 | $ | 2,462 | $ | 85,777 | $ | (7,168 | ) | $ | 81,394 | $ | 4,543 | $ | 85,937 | $ | — | |||||||||||||||||
See accompanying notes.
29
Wal-Mart Stores, Inc.
Consolidated Statements of Cash Flows
Fiscal Years Ended January 31, | ||||||||||||
(Amounts in millions) | 2015 | 2014 | 2013 | |||||||||
Cash flows from operating activities: | ||||||||||||
Consolidated net income | $ | 17,099 | $ | 16,695 | $ | 17,756 | ||||||
Income from discontinued operations, net of income taxes | (285 | ) | (144 | ) | (52 | ) | ||||||
Income from continuing operations | 16,814 | 16,551 | 17,704 | |||||||||
Adjustments to reconcile income from continuing operations to net cash provided by operating activities: | ||||||||||||
Depreciation and amortization | 9,173 | 8,870 | 8,478 | |||||||||
Deferred income taxes | (503 | ) | (279 | ) | (133 | ) | ||||||
Other operating activities | 785 | 938 | 602 | |||||||||
Changes in certain assets and liabilities, net of effects of acquisitions: | ||||||||||||
Receivables, net | (569 | ) | (566 | ) | (614 | ) | ||||||
Inventories | (1,229 | ) | (1,667 | ) | (2,759 | ) | ||||||
Accounts payable | 2,678 | 531 | 1,061 | |||||||||
Accrued liabilities | 1,249 | 103 | 271 | |||||||||
Accrued income taxes | 166 | (1,224 | ) | 981 | ||||||||
Net cash provided by operating activities | 28,564 | 23,257 | 25,591 | |||||||||
Cash flows from investing activities: | ||||||||||||
Payments for property and equipment | (12,174 | ) | (13,115 | ) | (12,898 | ) | ||||||
Proceeds from the disposal of property and equipment | 570 | 727 | 532 | |||||||||
Proceeds from the disposal of certain operations | 671 | — | — | |||||||||
Other investing activities | (192 | ) | (138 | ) | (271 | ) | ||||||
Net cash used in investing activities | (11,125 | ) | (12,526 | ) | (12,637 | ) | ||||||
Cash flows from financing activities: | ||||||||||||
Net change in short-term borrowings | (6,288 | ) | 911 | 2,754 | ||||||||
Proceeds from issuance of long-term debt | 5,174 | 7,072 | 211 | |||||||||
Payments of long-term debt | (3,904 | ) | (4,968 | ) | (1,478 | ) | ||||||
Dividends paid | (6,185 | ) | (6,139 | ) | (5,361 | ) | ||||||
Purchase of Company stock | (1,015 | ) | (6,683 | ) | (7,600 | ) | ||||||
Dividends paid to noncontrolling interest | (600 | ) | (426 | ) | (282 | ) | ||||||
Purchase of noncontrolling interest | (1,844 | ) | (296 | ) | (132 | ) | ||||||
Other financing activities | (409 | ) | (260 | ) | (58 | ) | ||||||
Net cash used in financing activities | (15,071 | ) | (10,789 | ) | (11,946 | ) | ||||||
Effect of exchange rates on cash and cash equivalents | (514 | ) | (442 | ) | 223 | |||||||
Net increase (decrease) in cash and cash equivalents | 1,854 | (500 | ) | 1,231 | ||||||||
Cash and cash equivalents at beginning of year | 7,281 | 7,781 | 6,550 | |||||||||
Cash and cash equivalents at end of year | $ | 9,135 | $ | 7,281 | $ | 7,781 | ||||||
Supplemental disclosure of cash flow information: | ||||||||||||
Income taxes paid | 8,169 | 8,641 | 7,304 | |||||||||
Interest paid | 2,433 | 2,362 | 2,262 | |||||||||
See accompanying notes.
30
Wal-Mart Stores, Inc.
Notes to Consolidated Financial Statements
Note 1. Summary of Significant Accounting Policies
General
Wal-Mart Stores, Inc. ("Walmart" or the "Company") helps people around the world save money and live better – anytime and anywhere – in retail stores or through the Company's e-commerce and mobile capabilities. Through innovation, the Company is striving to create a customer-centric experience that seamlessly integrates digital and physical shopping. Each week, the Company serves nearly 260 million customers who visit its over 11,000 stores under 72 banners in 27 countries and e-commerce websites in 11 countries. The Company's strategy is to lead on price, invest to differentiate on access, be competitive on assortment and deliver a great experience.
The Company's operations comprise three reportable segments: Walmart U.S., Walmart International and Sam's Club.
Principles of Consolidation
The Consolidated Financial Statements include the accounts of Walmart and its subsidiaries as of and for the fiscal years ended January 31, 2015 ("fiscal 2015"), January 31, 2014 ("fiscal 2014") and January 31, 2013 ("fiscal 2013"). All material intercompany accounts and transactions have been eliminated in consolidation. Investments in unconsolidated affiliates, which are 50% or less owned and do not otherwise meet consolidation requirements, are accounted for primarily using the equity method. These investments are immaterial to the Company's Consolidated Financial Statements.
The Company's Consolidated Financial Statements are based on a fiscal year ending on January 31, for the United States ("U.S.") and Canadian operations. The Company consolidates all other operations generally using a one-month lag and based on a calendar year. There were no significant intervening events during January 2015 that materially affected the Consolidated Financial Statements.
Use of Estimates
The Consolidated Financial Statements have been prepared in conformity with U.S. generally accepted accounting principles. Those principles require management to make estimates and assumptions that affect the reported amounts of assets and liabilities. Management's estimates and assumptions also affect the disclosure of contingent assets and liabilities at the date of the financial statements and the reported amounts of revenues and expenses during the reporting period. Actual results may differ from those estimates.
Cash and Cash Equivalents
The Company considers investments with a maturity when purchased of three months or less to be cash equivalents. All credit card, debit card and electronic benefits transfer transactions that process in less than seven days are classified as cash and cash equivalents. The amounts due from banks for these transactions classified as cash and cash equivalents totaled $2.9 billion and $1.6 billion at January 31, 2015 and 2014, respectively. In addition, cash and cash equivalents included restricted cash of $345 million and $654 million at January 31, 2015 and 2014, respectively, which was primarily related to cash collateral holdings from various counterparties, as required by certain derivative and trust agreements.
The Company's cash balances are held in various locations around the world. Of the Company's $9.1 billion and $7.3 billion of cash and cash equivalents at January 31, 2015 and 2014, respectively, $6.3 billion and $5.8 billion, respectively, were held outside of the U.S. and were generally utilized to support liquidity needs in the Company's non-U.S. operations.
The Company uses intercompany financing arrangements in an effort to ensure cash can be made available in the country in which it is needed with the minimum cost possible. Management does not believe it will be necessary to repatriate cash and cash equivalents held outside of the U.S. and anticipates the Company's domestic liquidity needs will be met through cash flows provided by operating activities, supplemented with long-term debt and short-term borrowings. Accordingly, the Company intends, with only certain exceptions, to continue to indefinitely reinvest the Company's cash and cash equivalents held outside of the U.S. in our foreign operations. When the income earned, either from operations or through intercompany financing arrangements, and indefinitely reinvested outside of the U.S. is taxed at local country tax rates, which are generally lower than the U.S. statutory rate, the Company realizes an effective tax rate benefit. If the Company's intentions with respect to reinvestment were to change, most of the amounts held within the Company's foreign operations could be repatriated to the U.S., although any repatriation under current U.S. tax laws would be subject to U.S. federal income taxes, less applicable foreign tax credits. As of January 31, 2015 and 2014, cash and cash equivalents of approximately $1.7 billion and $1.9 billion, respectively, may not be freely transferable to the U.S. due to local laws or other restrictions. The Company does not expect local laws, other limitations or potential taxes on anticipated future repatriations of cash amounts held outside of the U.S. to have a material effect on the Company's overall liquidity, financial condition or results of operations.
31
Receivables
Receivables are stated at their carrying values, net of a reserve for doubtful accounts. Receivables consist primarily of amounts due from:
• | insurance companies resulting from pharmacy sales; |
• | banks for customer credit and debit cards and electronic bank transfers that take in excess of seven days to process; |
• | consumer financing programs in certain international operations; |
• | suppliers for marketing or incentive programs; and |
• | real estate transactions. |
The Walmart International segment offers a limited number of consumer credit products, primarily through its financial institutions in select markets. The receivable balance from consumer credit products was $1.2 billion, net of a reserve for doubtful accounts of $114 million at January 31, 2015, compared to a receivable balance of $1.3 billion, net of a reserve for doubtful accounts of $119 million at January 31, 2014. These balances are included in receivables, net, in the Company's Consolidated Balance Sheets.
Inventories
The Company values inventories at the lower of cost or market as determined primarily by the retail inventory method of accounting, using the last-in, first-out ("LIFO") method for substantially all of the Walmart U.S. segment's inventories. The inventory at the Walmart International segment is valued primarily by the retail inventory method of accounting, using the first-in, first-out ("FIFO") method. The retail inventory method of accounting results in inventory being valued at the lower of cost or market since permanent markdowns are immediately recorded as a reduction of the retail value of inventory. The inventory at the Sam's Club segment is valued based on the weighted-average cost using the LIFO method. At January 31, 2015 and January 31, 2014, the Company's inventories valued at LIFO approximated those inventories as if they were valued at FIFO.
Property and Equipment
Property and equipment are stated at cost. Gains or losses on disposition are recognized as earned or incurred. Costs of major improvements are capitalized, while costs of normal repairs and maintenance are charged to expense as incurred. The following table summarizes the Company's property and equipment balances and includes the estimated useful lives that are generally used to depreciate the assets on a straight-line basis:
Fiscal Years Ended January 31, | ||||||||||
(Amounts in millions) | Estimated Useful Lives | 2015 | 2014 | |||||||
Land | N/A | $ | 26,261 | $ | 26,184 | |||||
Buildings and improvements | 3-40 years | 97,496 | 95,488 | |||||||
Fixtures and equipment | 2-30 years | 45,044 | 42,971 | |||||||
Transportation equipment | 3-15 years | 2,807 | 2,785 | |||||||
Construction in progress | N/A | 5,787 | 5,661 | |||||||
Property and equipment | $ | 177,395 | $ | 173,089 | ||||||
Accumulated depreciation | (63,115 | ) | (57,725 | ) | ||||||
Property and equipment, net | $ | 114,280 | $ | 115,364 | ||||||
Leasehold improvements are depreciated over the shorter of the estimated useful life of the asset or the remaining expected lease term. Depreciation expense for property and equipment, including amortization of property under capital leases, for fiscal 2015, 2014 and 2013 was $9.1 billion, $8.8 billion and $8.4 billion, respectively. Interest costs capitalized on construction projects were $59 million, $78 million and $74 million in fiscal 2015, 2014 and 2013, respectively.
Long-Lived Assets
Long-lived assets are stated at cost. Management reviews long-lived assets for indicators of impairment whenever events or changes in circumstances indicate that the carrying amount may not be recoverable. The evaluation is performed at the lowest level of identifiable cash flows, which is at the individual store or club level or, in certain circumstances, a market group of stores. Undiscounted cash flows expected to be generated by the related assets are estimated over the assets' useful lives based on updated projections. If the evaluation indicates that the carrying amount of the assets may not be recoverable, any potential impairment is measured based upon the fair value of the related asset or asset group as determined by an appropriate market appraisal or other valuation technique. Impairment charges of long-lived assets for fiscal 2015, 2014 and 2013 were not significant.
32
Goodwill and Other Acquired Intangible Assets
Goodwill represents the excess of the purchase price over the fair value of net assets acquired in business combinations and is allocated to the appropriate reporting unit when acquired. Other acquired intangible assets are stated at the fair value acquired as determined by a valuation technique commensurate with the intended use of the related asset. Goodwill and indefinite-lived intangible assets are not amortized; rather, they are evaluated for impairment annually and whenever events or changes in circumstances indicate that the value of the asset may be impaired. Definite-lived intangible assets are considered long-lived assets and are amortized on a straight-line basis over the periods that expected economic benefits will be provided.
Goodwill is evaluated for impairment using either a qualitative or quantitative approach for each of the Company's reporting units. Generally, a qualitative assessment is first performed to determine whether a quantitative goodwill impairment test is necessary. If management determines, after performing an assessment based on the qualitative factors, that the fair value of the reporting unit is more likely than not less than the carrying amount, or that a fair value of the reporting unit substantially in excess of the carrying amount cannot be assured, then a quantitative goodwill impairment test would be required. The quantitative test for goodwill impairment is performed by determining the fair value of the related reporting units. Fair value is measured based on the discounted cash flow method and relative market-based approaches.
The Company's reporting units were evaluated using a quantitative impairment test. Management determined the fair value of each reporting unit is greater than the carrying amount and, accordingly, the Company has not recorded any impairment charges related to goodwill.
The following table reflects goodwill activity, by reportable segment, for fiscal 2015 and 2014:
(Amounts in millions) | Walmart U.S. | Walmart International | Sam's Club | Total | ||||||||||||
Balances as of February 1, 2013 | $ | 443 | $ | 19,741 | $ | 313 | $ | 20,497 | ||||||||
Changes in currency translation and other | — | (1,000 | ) | — | (1,000 | ) | ||||||||||
Acquisitions(1) | 8 | 5 | — | 13 | ||||||||||||
Balances as of January 31, 2014 | 451 | 18,746 | 313 | 19,510 | ||||||||||||
Changes in currency translation and other | — | (1,418 | ) | — | (1,418 | ) | ||||||||||
Acquisitions(1) | 10 | — | — | 10 | ||||||||||||
Balances as of January 31, 2015 | $ | 461 | $ | 17,328 | $ | 313 | $ | 18,102 | ||||||||
(1) | Goodwill recorded for fiscal 2015 and 2014 acquisitions relates to acquisitions that are not significant, individually or in the aggregate, to the Company's Consolidated Financial Statements. |
Indefinite-lived intangible assets are included in other assets and deferred charges in the Company's Consolidated Balance Sheets. These assets are evaluated for impairment based on their fair values using valuation techniques which are updated annually based on the most recent variables and assumptions. There were no impairment charges related to indefinite-lived intangible assets recorded for fiscal 2015, 2014 and 2013.
Self Insurance Reserves
The Company uses a combination of insurance and self insurance for a number of risks, including, but not limited to, workers' compensation, general liability, auto liability, product liability and the Company's obligation for employee-related health care benefits. Liabilities relating to the claims associated with these risks are estimated by considering historical claims experience, frequency, severity, demographic factors and other actuarial assumptions, including incurred but not reported claims. In estimating its liability for such claims, the Company periodically analyzes its historical trends, including loss development, and applies appropriate loss development factors to the incurred costs associated with the claims. To limit exposure to certain risks, the Company maintains stop-loss insurance coverage for workers' compensation of $5 million per occurrence, and in most instances, $15 million per occurrence for general liability.
33
Income Taxes
Income taxes are accounted for under the balance sheet method. Deferred tax assets and liabilities are recognized for the estimated future tax consequences attributable to differences between the financial statement carrying amounts of existing assets and liabilities and their respective tax bases ("temporary differences"). Deferred tax assets and liabilities are measured using enacted tax rates in effect for the year in which those temporary differences are expected to be recovered or settled. The effect on deferred tax assets and liabilities of a change in tax rate is recognized in income in the period that includes the enactment date.
Deferred tax assets are evaluated for future realization and reduced by a valuation allowance to the extent that a portion is not more likely than not to be realized. Many factors are considered when assessing whether it is more likely than not that the deferred tax assets will be realized, including recent cumulative earnings, expectations of future taxable income, carryforward periods, and other relevant quantitative and qualitative factors. The recoverability of the deferred tax assets is evaluated by assessing the adequacy of future expected taxable income from all sources, including reversal of taxable temporary differences, forecasted operating earnings and available tax planning strategies. These sources of income rely heavily on estimates.
In determining the provision for income taxes, an annual effective income tax rate is used based on annual income, permanent differences between book and tax income, and statutory income tax rates. Discrete events such as audit settlements or changes in tax laws are recognized in the period in which they occur.
The Company records a liability for unrecognized tax benefits resulting from uncertain tax positions taken or expected to be taken in a tax return. The Company records interest and penalties related to unrecognized tax benefits in interest expense and operating, selling, general and administrative expenses, respectively, in the Company's Consolidated Statements of Income. Refer to Note 9 for additional income tax disclosures.
Revenue Recognition
Sales
The Company recognizes sales revenue, net of sales taxes and estimated sales returns, at the time it sells merchandise to the customer.
Membership Fee Revenue
The Company recognizes membership fee revenue both in the U.S. and internationally over the term of the membership, which is typically 12 months. The following table summarizes membership fee activity for fiscal 2015, 2014 and 2013:
Fiscal Years Ended January 31, | ||||||||||||
(Amounts in millions) | 2015 | 2014 | 2013 | |||||||||
Deferred membership fee revenue, beginning of year | $ | 641 | $ | 575 | $ | 559 | ||||||
Cash received from members | 1,410 | 1,249 | 1,133 | |||||||||
Membership fee revenue recognized | (1,292 | ) | (1,183 | ) | (1,117 | ) | ||||||
Deferred membership fee revenue, end of year | $ | 759 | $ | 641 | $ | 575 | ||||||
Membership fee revenue is included in membership and other income in the Company's Consolidated Statements of Income. The deferred membership fee is included in accrued liabilities in the Company's Consolidated Balance Sheets.
Shopping Cards
Customer purchases of shopping cards are not recognized as revenue until the card is redeemed and the customer purchases merchandise using the shopping card. Shopping cards in the U.S. do not carry an expiration date; therefore, customers and members can redeem their shopping cards for merchandise indefinitely. Shopping cards in certain foreign countries where the Company does business may have expiration dates. A certain number of shopping cards, both with and without expiration dates, will not be fully redeemed. Management estimates unredeemed shopping cards and recognizes revenue for these amounts over shopping card historical usage periods based on historical redemption rates. Management periodically reviews and updates its estimates of usage periods and redemption rates.
Financial and Other Services
The Company recognizes revenue from service transactions at the time the service is performed. Generally, revenue from services is classified as a component of net sales in the Company's Consolidated Statements of Income.
34
Cost of Sales
Cost of sales includes actual product cost, the cost of transportation to the Company's distribution facilities, stores and clubs from suppliers, the cost of transportation from the Company's distribution facilities to the stores, clubs and customers and the cost of warehousing for the Sam's Club segment and import distribution centers. Cost of sales is reduced by supplier payments that are not a reimbursement of specific, incremental and identifiable costs.
Payments from Suppliers
The Company receives consideration from suppliers for various programs, primarily volume incentives, warehouse allowances and reimbursements for specific programs such as markdowns, margin protection, advertising and supplier-specific fixtures. Payments from suppliers are accounted for as a reduction of cost of sales and are recognized in the Company's Consolidated Statements of Income when the related inventory is sold, except when the payment is a reimbursement of specific, incremental and identifiable costs.
Operating, Selling, General and Administrative Expenses
Operating, selling, general and administrative expenses include all operating costs of the Company, except cost of sales, as described above. As a result, the majority of the cost of warehousing and occupancy for the Walmart U.S. and Walmart International segments' distribution facilities is included in operating, selling, general and administrative expenses. Because the Company does not include most of the cost of its Walmart U.S. and Walmart International segments' distribution facilities in cost of sales, its gross profit and gross profit as a percentage of net sales may not be comparable to those of other retailers that may include all costs related to their distribution facilities in cost of sales and in the calculation of gross profit.
Advertising Costs
Advertising costs are expensed as incurred and were $2.4 billion for both fiscal 2015 and fiscal 2014 and $2.3 billion for fiscal 2013. Advertising costs consist primarily of print, television and digital advertisements and are recorded in operating, selling, general and administrative expenses in the Company's Consolidated Statements of Income. Reimbursements from suppliers that are for specific, incremental and identifiable advertising costs are recognized as a reduction of advertising costs in operating, selling, general and administrative expenses.
Leases
The Company estimates the expected term of a lease by assuming the exercise of renewal options where an economic penalty exists that would preclude the abandonment of the lease at the end of the initial non-cancelable term and the exercise of such renewal is at the sole discretion of the Company. The expected term is used in the determination of whether a store or club lease is a capital or operating lease and in the calculation of straight-line rent expense. Additionally, the useful life of leasehold improvements is limited by the expected lease term or the economic life of the asset, whichever is shorter. If significant expenditures are made for leasehold improvements late in the expected term of a lease and renewal is reasonably assured, the useful life of the leasehold improvement is limited to the end of the renewal period or economic life of the asset, whichever is shorter.
Rent abatements and escalations are considered in the calculation of minimum lease payments in the Company's capital lease tests and in determining straight-line rent expense for operating leases.
Pre-Opening Costs
The cost of start-up activities, including organization costs, related to new store openings, store remodels, relocations, expansions and conversions are expensed as incurred and included in operating, selling, general and administrative expenses in the Company's Consolidated Statements of Income. Pre-opening costs totaled $317 million, $338 million and $316 million for fiscal 2015, 2014 and 2013, respectively.
Currency Translation
The assets and liabilities of all international subsidiaries are translated from the respective local currency to the U.S. dollar using exchange rates at the balance sheet date. Related translation adjustments are recorded as a component of accumulated other comprehensive income (loss). The income statements of all international subsidiaries are translated from the respective local currencies to the U.S. dollar using average exchange rates for the period covered by the income statements.
Reclassifications
Certain reclassifications have been made to previous fiscal year amounts and balances to conform to the presentation in the current fiscal year. These reclassifications did not impact consolidated operating income or net income. Additionally, certain segment asset and expense allocations have been reclassified among segments in the current period. See Note 14 for further discussion of the Company's segments.
35
Recent Accounting Pronouncements
In April 2014, the Financial Accounting Standards Board issued Accounting Standards Update ("ASU") 2014-08, Reporting Discontinued Operations and Disclosures of Disposals of Components of an Entity, which provides guidance for the recognition of discontinued operations, changes the requirements for reporting discontinued operations and requires additional disclosures about discontinued operations. This ASU applies to prospective transactions beginning on or after December 15, 2014, with early adoption permitted. The Company adopted this ASU for the fiscal year ended January 31, 2015 and adoption did not materially impact the Company's consolidated net income, financial position or cash flows.
In May 2014, the Financial Accounting Standards Board issued ASU 2014-09, Revenue from Contracts with Customers. This ASU is a comprehensive new revenue recognition model that requires a company to recognize revenue to depict the transfer of goods or services to a customer at an amount that reflects the consideration it expects to receive in exchange for those goods or services. This ASU is effective for annual reporting periods beginning after December 15, 2016 and early adoption is not permitted. Accordingly, the Company will adopt this ASU on February 1, 2017. Companies may use either a full retrospective or a modified retrospective approach to adopt this ASU. Management is currently evaluating this standard, including which transition approach to use, and does not expect this ASU to materially impact the Company's consolidated net income, financial position or cash flows.
Note 2. Net Income Per Common Share
Basic income per common share from continuing operations attributable to Walmart is based on the weighted-average common shares outstanding during the relevant period. Diluted income per common share from continuing operations attributable to Walmart is based on the weighted-average common shares outstanding during the relevant period adjusted for the dilutive effect of share-based awards. The Company did not have significant share-based awards outstanding that were antidilutive and not included in the calculation of diluted income per common share from continuing operations attributable to Walmart for fiscal 2015, 2014 and 2013.
The following table provides a reconciliation of the numerators and denominators used to determine basic and diluted income per common share from continuing operations attributable to Walmart:
Fiscal Years Ended January 31, | ||||||||||||
(Amounts in millions, except per share data) | 2015 | 2014 | 2013 | |||||||||
Numerator | ||||||||||||
Income from continuing operations | $ | 16,814 | $ | 16,551 | $ | 17,704 | ||||||
Less income from continuing operations attributable to noncontrolling interest | (632 | ) | (633 | ) | (741 | ) | ||||||
Income from continuing operations attributable to Walmart | $ | 16,182 | $ | 15,918 | $ | 16,963 | ||||||
Denominator | ||||||||||||
Weighted-average common shares outstanding, basic | 3,230 | 3,269 | 3,374 | |||||||||
Dilutive impact of stock options and other share-based awards | 13 | 14 | 15 | |||||||||
Weighted-average common shares outstanding, diluted | 3,243 | 3,283 | 3,389 | |||||||||
Income per common share from continuing operations attributable to Walmart | ||||||||||||
Basic | $ | 5.01 | $ | 4.87 | $ | 5.03 | ||||||
Diluted | 4.99 | 4.85 | 5.01 | |||||||||
36
Note 3. Shareholders' Equity
Share-Based Compensation
The Company has awarded share-based compensation to associates and nonemployee directors of the Company. The compensation expense recognized for all plans was $462 million, $388 million and $378 million for fiscal 2015, 2014 and 2013, respectively. Share-based compensation expense is included in operating, selling, general and administrative expenses in the Company's Consolidated Statements of Income. The total income tax benefit recognized for share-based compensation was $173 million, $145 million and $142 million for fiscal 2015, 2014 and 2013, respectively. The following table summarizes the Company's share-based compensation expense by award type:
Fiscal Years Ended January 31, | |||||||||||
(Amounts in millions) | 2015 | 2014 | 2013 | ||||||||
Restricted stock and performance share units | $ | 157 | $ | 141 | $ | 152 | |||||
Restricted stock units | 277 | 224 | 195 | ||||||||
Other | 28 | 23 | 31 | ||||||||
Share-based compensation expense | $ | 462 | $ | 388 | $ | 378 | |||||
The Company's shareholder-approved Stock Incentive Plan of 2010 (the "Plan") became effective June 4, 2010 and amended and restated the Company's Stock Incentive Plan of 2005. The Plan was established to grant stock options, restricted (non-vested) stock, performance shares units and other equity compensation awards for which 210 million shares of common stock issued or to be issued under the Plan have been registered under the Securities Act of 1933, as amended. The Company believes that such awards serve to align the interests of its associates with those of its shareholders.
The Plan's award types are summarized as follows:
• | Restricted Stock and Performance Share Units. Restricted stock awards are for shares that vest based on the passage of time and include restrictions related to employment. Performance share units vest based on the passage of time and achievement of performance criteria and may range from 0% to 150% of the original award amount. Vesting periods for these awards are generally between one and three years. Restricted stock and performance share units may be settled or deferred in stock and are accounted for as equity in the Company's Consolidated Balance Sheets. The fair value of restricted stock awards is determined on the date of grant and is expensed ratably over the vesting period. The fair value of performance share units is determined on the date of grant using the Company's stock price discounted for the expected dividend yield through the vesting period and is recognized over the vesting period. |
• | Restricted Stock Units. Restricted stock units provide rights to Company stock after a specified service period; 50% vest three years from the grant date and the remaining 50% vest five years from the grant date. The fair value of each restricted stock unit is determined on the date of grant using the stock price discounted for the expected dividend yield through the vesting period and is recognized ratably over the vesting period. The expected dividend yield is based on the anticipated dividends over the vesting period. The weighted-average discount for the dividend yield used to determine the fair value of restricted stock units granted in fiscal 2015, 2014 and 2013 was 9.5%, 10.3% and 12.2%, respectively. |
In addition to the Plan, the Company's subsidiary in the United Kingdom has stock option plans for certain colleagues which generally vest over three years. The stock option share-based compensation expense is included in the other line in the table above.
37
The following table shows the activity for restricted stock and performance share units and restricted stock units during fiscal 2015:
Restricted Stock and Performance Share Units(1) | Restricted Stock Units | |||||||||||||
(Shares in thousands) | Shares | Weighted- Average Grant-Date Fair Value Per Share | Shares | Weighted- Average Grant-Date Fair Value Per Share | ||||||||||
Outstanding at February 1, 2014 | 9,951 | $ | 63.26 | 17,785 | $ | 55.87 | ||||||||
Granted | 3,328 | 75.30 | 5,671 | 69.39 | ||||||||||
Vested/exercised | (2,799 | ) | 55.64 | (4,554 | ) | 47.81 | ||||||||
Forfeited or expired | (1,757 | ) | 62.35 | (1,334 | ) | 61.63 | ||||||||
Outstanding at January 31, 2015 | 8,723 | $ | 68.89 | 17,568 | $ | 61.00 | ||||||||
(1) | Assumes payout rate at 100% for Performance Share Units. |
The following table includes additional information related to restricted stock and performance share units and restricted stock units:
Fiscal Years Ended January 31, | |||||||||||
(Amounts in millions) | 2015 | 2014 | 2013 | ||||||||
Fair value of restricted stock and performance share units vested | $ | 156 | $ | 116 | $ | 155 | |||||
Fair value of restricted stock units vested | 218 | 189 | 168 | ||||||||
Unrecognized compensation cost for restricted stock and performance share units | 154 | 200 | 233 | ||||||||
Unrecognized compensation cost for restricted stock units | 570 | 497 | 437 | ||||||||
Weighted average remaining period to expense for restricted stock and performance share units (years) | 1.3 | 2.0 | 2.0 | ||||||||
Weighted average remaining period to expense for restricted stock units (years) | 1.7 | 2.1 | 1.7 | ||||||||
Share Repurchase Program
From time to time, the Company repurchases shares of its common stock under share repurchase programs authorized by the Board of Directors. On June 6, 2013, the Company's Board of Directors replaced the previous $15.0 billion share repurchase program, which had approximately $712 million of remaining authorization for share repurchases as of that date, with a new $15.0 billion share repurchase program, which was announced on June 7, 2013. As was the case with the replaced share repurchase program, the current share repurchase program has no expiration date or other restrictions limiting the period over which the Company can make share repurchases. At January 31, 2015, authorization for $10.3 billion of share repurchases remained under the current share repurchase program. Any repurchased shares are constructively retired and returned to an unissued status.
The Company considers several factors in determining when to execute share repurchases, including, among other things, current cash needs, capacity for leverage, cost of borrowings, its results of operations and the market price of its common stock. The following table provides, on a settlement date basis, the number of shares repurchased, average price paid per share and total cash paid for share repurchases for fiscal 2015, 2014 and 2013:
Fiscal Years Ended January 31, | ||||||||||||
(Amounts in millions, except per share data) | 2015 | 2014 | 2013 | |||||||||
Total number of shares repurchased | 13.4 | 89.1 | 113.2 | |||||||||
Average price paid per share | $ | 75.82 | $ | 74.99 | $ | 67.15 | ||||||
Total cash paid for share repurchases | $ | 1,015 | $ | 6,683 | $ | 7,600 | ||||||
38
Note 4. Accumulated Other Comprehensive Income (Loss)
The following table provides the fiscal 2015, 2014 and 2013 changes in the composition of total accumulated other comprehensive income (loss), including the amounts reclassified out of accumulated other comprehensive income (loss) by component for fiscal 2015 and 2014:
(Amounts in millions and net of income taxes) | Currency Translation and Other | Derivative Instruments | Minimum Pension Liability | Total | ||||||||||||
Balances as of January 31, 2012 | $ | (806 | ) | $ | (7 | ) | $ | (597 | ) | $ | (1,410 | ) | ||||
Other comprehensive income (loss) before reclassifications | 853 | 136 | (166 | ) | 823 | |||||||||||
Balances as of January 31, 2013 | 47 | 129 | (763 | ) | (587 | ) | ||||||||||
Other comprehensive income (loss) before reclassifications | (2,769 | ) | 194 | 149 | (2,426 | ) | ||||||||||
Amounts reclassified from accumulated other comprehensive income (loss) | — | 13 | 4 | 17 | ||||||||||||
Balances as of January 31, 2014 | (2,722 | ) | 336 | (610 | ) | (2,996 | ) | |||||||||
Other comprehensive income (loss) before reclassifications | (3,633 | ) | (496 | ) | (58 | ) | (4,187 | ) | ||||||||
Amounts reclassified from accumulated other comprehensive income (loss) | — | 26 | (11 | ) | 15 | |||||||||||
Balances as of January 31, 2015 | $ | (6,355 | ) | $ | (134 | ) | $ | (679 | ) | $ | (7,168 | ) | ||||
Amounts reclassified from accumulated other comprehensive income (loss) for derivative instruments are recorded in interest, net, in the Company's Consolidated Statements of Income, and the amounts for the minimum pension liability are recorded in operating, selling, general and administrative expenses in the Company's Consolidated Statements of Income.
The Company's unrealized net gains and losses on net investment hedges, included in the currency translation and other category of accumulated other comprehensive income (loss), were not significant as of January 31, 2015 and January 31, 2014.
Note 5. Accrued Liabilities
The Company's accrued liabilities consist of the following:
As of January 31, | ||||||||
(Amounts in millions) | 2015 | 2014 | ||||||
Accrued wages and benefits(1) | $ | 4,954 | $ | 4,652 | ||||
Self-insurance(2) | 3,306 | 3,477 | ||||||
Accrued non-income taxes(3) | 2,592 | 2,554 | ||||||
Other(4) | 8,300 | 8,110 | ||||||
Total accrued liabilities | $ | 19,152 | $ | 18,793 | ||||
(1) | Accrued wages and benefits include accrued wages, salaries, vacation, bonuses and other incentive plans. |
(2) | Self-insurance consists of all insurance-related liabilities, such as workers' compensation, general liability, vehicle liability, property liability and employee-related health care benefits. |
(3) | Accrued non-income taxes include accrued payroll, value added, sales and miscellaneous other taxes. |
(4) | Other accrued liabilities consist of various items such as maintenance, utilities, advertising and interest. |
39
Note 6. Short-term Borrowings and Long-term Debt
Short-term borrowings consist of commercial paper and lines of credit. Short-term borrowings outstanding at January 31, 2015 and 2014 were $1.6 billion and $7.7 billion, respectively. The following table includes additional information related to the Company's short-term borrowings for fiscal 2015, 2014 and 2013:
Fiscal Years Ended January 31, | ||||||||||||
(Amounts in millions) | 2015 | 2014 | 2013 | |||||||||
Maximum amount outstanding at any month-end | $ | 11,581 | $ | 13,318 | $ | 8,740 | ||||||
Average daily short-term borrowings | 7,009 | 8,971 | 6,007 | |||||||||
Weighted-average interest rate | 0.5 | % | 0.1 | % | 0.1 | % | ||||||
The Company has various committed lines of credit, committed with 23 financial institutions, totaling $15.0 billion as of January 31, 2015 and with 24 financial institutions, totaling $15.4 billion as of January 31, 2014. The committed lines of credit are summarized in the following table:
Fiscal Years Ended January 31, | ||||||||||||||||||||||||
2015 | 2014 | |||||||||||||||||||||||
(Amounts in millions) | Available | Drawn | Undrawn | Available | Drawn | Undrawn | ||||||||||||||||||
Five-year credit facility(1) | $ | 6,000 | $ | — | $ | 6,000 | $ | 6,000 | $ | — | $ | 6,000 | ||||||||||||
364-day revolving credit facility(2) | 9,000 | — | 9,000 | 9,400 | — | 9,400 | ||||||||||||||||||
Total | $ | 15,000 | $ | — | $ | 15,000 | $ | 15,400 | $ | — | $ | 15,400 | ||||||||||||
(1) | In June 2014, the Company renewed and extended its existing five-year credit facility, which is used to support its commercial paper program. |
(2) | In June 2014, the Company renewed and extended its existing 364-day revolving credit facility, which is used to support its commercial paper program. |
The committed lines of credit mature at various times between June 2015 and June 2019, carry interest rates generally ranging between LIBOR plus 10 basis points and LIBOR plus 75 basis points, and incur commitment fees ranging between 1.5 and 4.0 basis points. In conjunction with the lines of credit listed in the table above, the Company has agreed to observe certain covenants, the most restrictive of which relates to the maximum amount of secured debt.
Apart from the committed lines of credit, the Company has trade and stand-by letters of credit totaling $4.6 billion and $4.7 billion at January 31, 2015 and 2014, respectively. These letters of credit are utilized in normal business activities.
40
The Company's long-term debt, which includes the fair value instruments further discussed in Note 8, consists of the following:
January 31, 2015 | January 31, 2014 | |||||||||||||
(Amounts in millions) | Maturity Dates By Fiscal Year | Amount | Average Rate(1) | Amount | Average Rate(1) | |||||||||
Unsecured debt | ||||||||||||||
Fixed | 2016 - 2045 | $ | 36,000 | 4.3% | $ | 35,500 | 4.3% | |||||||
Variable | 2019 | 500 | 5.4% | 500 | 5.4% | |||||||||
Total U.S. dollar denominated | 36,500 | 36,000 | ||||||||||||
Fixed | 2023 - 2030 | 2,821 | 3.3% | 1,356 | 4.9% | |||||||||
Variable | — | — | ||||||||||||
Total Euro denominated | 2,821 | 1,356 | ||||||||||||
Fixed | 2031 - 2039 | 5,271 | 5.3% | 5,770 | 5.3% | |||||||||
Variable | — | — | ||||||||||||
Total Sterling denominated | 5,271 | 5,770 | ||||||||||||
Fixed | 2016 - 2021 | 596 | 1.0% | 1,490 | 1.3% | |||||||||
Variable | 2016 | 255 | 0.6% | 457 | 0.7% | |||||||||
Total Yen denominated | 851 | 1,947 | ||||||||||||
Total unsecured debt | 45,443 | 45,073 | ||||||||||||
Total other debt (in USD)(2) | 453 | 801 | ||||||||||||
Total debt | 45,896 | 45,874 | ||||||||||||
Less amounts due within one year | (4,810 | ) | (4,103 | ) | ||||||||||
Long-term debt | $ | 41,086 | $ | 41,771 | ||||||||||
(1) | The average rate represents the weighted-average stated rate for each corresponding debt category, based on year-end balances and year-end interest rates. Interest costs are also impacted by certain derivative financial instruments described in Note 8. |
(2) | A portion of other debt at January 31, 2015 and 2014 includes secured debt in the amount of $139 million and $572 million, respectively, which was collateralized by property that had an aggregate carrying amount of approximately $19 million and $471 million, respectively. |
At January 31, 2015 and 2014, the Company had $500 million in debt with embedded put options. The issuance of money market puttable reset securities in the amount of $500 million is structured to be remarketed in connection with the annual reset of the interest rate. If, for any reason, the remarketing of the notes does not occur at the time of any interest rate reset, the holders of the notes must sell, and the Company must repurchase, the notes at par. Accordingly, this issuance has been classified as long-term debt due within one year in the Company's Consolidated Balance Sheets.
Annual maturities of long-term debt during the next five years and thereafter are as follows:
(Amounts in millions) | Annual | ||
Fiscal Year | Maturities | ||
2016 | $ | 4,810 | |
2017 | 2,312 | ||
2018 | 1,523 | ||
2019 | 3,518 | ||
2020 | 514 | ||
Thereafter | 33,219 | ||
Total | $ | 45,896 | |
41
Debt Issuances
Information on significant long-term debt issued during fiscal 2015 is as follows:
(Amounts in millions) | ||||||||||||
Issue Date | Principal Amount | Maturity Date | Fixed vs. Floating | Interest Rate | Proceeds | |||||||
April 8, 2014 | 850 Euro | April 8, 2022 | Fixed | 1.900% | $ | 1,161 | ||||||
April 8, 2014 | 650 Euro | April 8, 2026 | Fixed | 2.550% | 885 | |||||||
April 22, 2014 | 500 USD | April 21, 2017 | Fixed | 1.000% | 499 | |||||||
April 22, 2014 | 1,000 USD | April 22, 2024 | Fixed | 3.300% | 992 | |||||||
April 22, 2014 | 1,000 USD | April 22, 2044 | Fixed | 4.300% | 985 | |||||||
October 22, 2014 | 500 USD | April 22, 2024 | Fixed | 3.300% | 508 | |||||||
Total | $ | 5,030 | ||||||||||
Information on significant long-term debt issued during fiscal 2014 is as follows:
(Amounts in millions) | ||||||||||||
Issue Date | Principal Amount | Maturity Date | Fixed vs. Floating | Interest Rate | Proceeds | |||||||
April 11, 2013 | 1,000 USD | April 11, 2016 | Fixed | 0.600% | $ | 997 | ||||||
April 11, 2013 | 1,250 USD | April 11, 2018 | Fixed | 1.130% | 1,244 | |||||||
April 11, 2013 | 1,750 USD | April 11, 2023 | Fixed | 2.550% | 1,738 | |||||||
April 11, 2013 | 1,000 USD | April 11, 2043 | Fixed | 4.000% | 988 | |||||||
October 2, 2013 | 1,000 USD | December 15, 2018 | Fixed | 1.950% | 995 | |||||||
October 2, 2013 | 750 USD | October 2, 2043 | Fixed | 4.750% | 738 | |||||||
Total | $ | 6,700 | ||||||||||
During fiscal 2015 and 2014, the Company also received additional proceeds from other, smaller long-term debt issuances by several of its non-U.S. operations. The proceeds in both fiscal years were used to pay down and refinance existing debt and for other general corporate purposes.
Maturities
On February 3, 2014, $500 million of 3.000% Notes matured and were repaid; on April 14, 2014, $1.0 billion of 1.625% Notes matured and were repaid; on May 15, 2014, $1.0 billion of 3.200% Notes matured and were repaid; and on August 6, 2014, ¥100 billion of floating rate Notes matured and were repaid.
On April 15, 2013, $1.0 billion of 4.250% Notes matured and were repaid; on May 1, 2013, $1.5 billion of 4.550% Notes matured and were repaid; on June 1, 2013, $500 million of 7.250% Notes matured and were repaid; on August 5, 2013, ¥25 billion of 2.010% and ¥50 billion of floating rate Notes matured and were repaid; and on October 25, 2013, $750 million of 0.750% Notes matured and were repaid.
During fiscal 2015 and 2014, the Company also repaid other, smaller long-term debt as it matured in several of its non-U.S. operations.
42
Note 7. Fair Value Measurements
The Company records and discloses certain financial and non-financial assets and liabilities at fair value. The fair value of an asset is the price at which the asset could be sold in an ordinary transaction between unrelated, knowledgeable and willing parties able to engage in the transaction. The fair value of a liability is the amount that would be paid to transfer the liability to a new obligor in a transaction between such parties, not the amount that would be paid to settle the liability with the creditor. Assets and liabilities recorded at fair value are measured using the fair value hierarchy, which prioritizes the inputs used in measuring fair value. The levels of the fair value hierarchy are:
• | Level 1: observable inputs such as quoted prices in active markets; |
• | Level 2: inputs other than quoted prices in active markets that are either directly or indirectly observable; and |
• | Level 3: unobservable inputs for which little or no market data exists, therefore requiring the Company to develop its own assumptions. |
Recurring Fair Value Measurements
The Company holds derivative instruments that are required to be measured at fair value on a recurring basis. The fair values are the estimated amounts the Company would receive or pay upon termination of the related derivative agreements as of the reporting dates. The fair values have been measured using the income approach and Level 2 inputs, which include the relevant interest rate and foreign currency forward curves. As of January 31, 2015 and 2014, the notional amounts and fair values of these derivatives were as follows:
January 31, 2015 | January 31, 2014 | ||||||||||||||
(Amounts in millions) | Notional Amount | Fair Value | Notional Amount | Fair Value | |||||||||||
Receive fixed-rate, pay variable-rate interest rate swaps designated as fair value hedges | $ | 500 | $ | 12 | $ | 1,000 | $ | 5 | |||||||
Receive fixed-rate, pay fixed-rate cross-currency interest rate swaps designated as net investment hedges | 1,250 | 207 | 1,250 | 97 | |||||||||||
Receive fixed-rate, pay fixed-rate cross-currency interest rate swaps designated as cash flow hedges | 4,329 | (317 | ) | 3,004 | 453 | ||||||||||
Receive variable-rate, pay fixed-rate interest rate swaps designated as cash flow hedges | 255 | (1 | ) | 457 | (2 | ) | |||||||||
Receive variable-rate, pay fixed-rate forward starting interest rate swaps designated as cash flow hedges | — | — | 2,500 | 166 | |||||||||||
Total | $ | 6,334 | $ | (99 | ) | $ | 8,211 | $ | 719 | ||||||
Nonrecurring Fair Value Measurements
In addition to assets and liabilities that are recorded at fair value on a recurring basis, the Company's assets and liabilities are also subject to nonrecurring fair value measurements. Generally, assets are recorded at fair value on a nonrecurring basis as a result of impairment charges. The Company did not record any significant impairment charges to assets measured at fair value on a nonrecurring basis during the fiscal years ended January 31, 2015, or 2014.
Other Fair Value Disclosures
The Company records cash and cash equivalents and short-term borrowings at cost. The carrying values of these instruments approximate their fair value due to their short-term maturities.
The Company's long-term debt is also recorded at cost. The fair value is estimated using Level 2 inputs based on the Company's current incremental borrowing rate for similar types of borrowing arrangements. The carrying value and fair value of the Company's long-term debt as of January 31, 2015 and 2014, are as follows:
January 31, 2015 | January 31, 2014 | |||||||||||||||
(Amounts in millions) | Carrying Value | Fair Value | Carrying Value | Fair Value | ||||||||||||
Long-term debt, including amounts due within one year | $ | 45,896 | $ | 56,237 | $ | 45,874 | $ | 50,757 | ||||||||
43
Note 8. Derivative Financial Instruments
The Company uses derivative financial instruments for hedging and non-trading purposes to manage its exposure to changes in interest and currency exchange rates, as well as to maintain an appropriate mix of fixed- and variable-rate debt. Use of derivative financial instruments in hedging programs subjects the Company to certain risks, such as market and credit risks. Market risk represents the possibility that the value of the derivative financial instrument will change. In a hedging relationship, the change in the value of the derivative financial instrument is offset to a great extent by the change in the value of the underlying hedged item. Credit risk related to a derivative financial instrument represents the possibility that the counterparty will not fulfill the terms of the contract. The notional, or contractual, amount of the Company's derivative financial instruments is used to measure interest to be paid or received and does not represent the Company's exposure due to credit risk. Credit risk is monitored through established approval procedures, including setting concentration limits by counterparty, reviewing credit ratings and requiring collateral (generally cash) from the counterparty when appropriate.
The Company only enters into derivative transactions with counterparties rated "A-" or better by nationally recognized credit rating agencies. Subsequent to entering into derivative transactions, the Company regularly monitors the credit ratings of its counterparties. In connection with various derivative agreements, including master netting arrangements, the Company held cash collateral from counterparties of $323 million and $641 million at January 31, 2015 and January 31, 2014, respectively. The Company records cash collateral received as amounts due to the counterparties exclusive of any derivative asset. Furthermore, as part of the master netting arrangements with these counterparties, the Company is also required to post collateral if the Company's net derivative liability position exceeds $150 million with any counterparty. The Company did not have any cash collateral posted with counterparties at January 31, 2015 or January 31, 2014. The Company records cash collateral it posts with counterparties as amounts receivable from those counterparties exclusive of any derivative liability.
The Company uses derivative financial instruments for the purpose of hedging its exposure to interest and currency exchange rate risks and, accordingly, the contractual terms of a hedged instrument closely mirror those of the hedged item, providing a high degree of risk reduction and correlation. Contracts that are effective at meeting the risk reduction and correlation criteria are recorded using hedge accounting. If a derivative financial instrument is recorded using hedge accounting, depending on the nature of the hedge, changes in the fair value of the instrument will either be offset against the change in fair value of the hedged assets, liabilities or firm commitments through earnings or be recognized in accumulated other comprehensive income (loss) until the hedged item is recognized in earnings. Any hedge ineffectiveness is immediately recognized in earnings. The Company's net investment and cash flow instruments are highly effective hedges and the ineffective portion has not been, and is not expected to be, significant. Instruments that do not meet the criteria for hedge accounting, or contracts for which the Company has not elected hedge accounting, are recorded at fair value with unrealized gains or losses reported in earnings during the period of the change.
Fair Value Instruments
The Company is a party to receive fixed-rate, pay variable-rate interest rate swaps that the Company uses to hedge the fair value of fixed-rate debt. The notional amounts are used to measure interest to be paid or received and do not represent the Company's exposure due to credit loss. The Company's interest rate swaps that receive fixed-interest rate payments and pay variable-interest rate payments are designated as fair value hedges. As the specific terms and notional amounts of the derivative instruments match those of the fixed-rate debt being hedged, the derivative instruments are assumed to be perfectly effective hedges. Changes in the fair values of these derivative instruments are recorded in earnings, but are offset by corresponding changes in the fair values of the hedged items, also recorded in earnings, and, accordingly, do not impact the Company's Consolidated Statements of Income. These fair value instruments will mature in October 2020.
Net Investment Instruments
The Company is a party to cross-currency interest rate swaps that the Company uses to hedge its net investments. The agreements are contracts to exchange fixed-rate payments in one currency for fixed-rate payments in another currency. All changes in the fair value of these instruments are recorded in accumulated other comprehensive income (loss), offsetting the currency translation adjustment of the related investment that is also recorded in accumulated other comprehensive income (loss). These instruments will mature on dates ranging from October 2023 to February 2030.
The Company has issued foreign-currency-denominated long-term debt as hedges of net investments of certain of its foreign operations. These foreign-currency-denominated long-term debt issuances are designated and qualify as nonderivative hedging instruments. Accordingly, the foreign currency translation of these debt instruments is recorded in accumulated other comprehensive income (loss), offsetting the foreign currency translation adjustment of the related net investments that is also recorded in accumulated other comprehensive income (loss). At January 31, 2015 and January 31, 2014, the Company had ¥100 billion and ¥200 billion, respectively, of outstanding long-term debt designated as a hedge of its net investment in Japan, as well as outstanding long-term debt of £2.5 billion at January 31, 2015 and 2014 that was designated as a hedge of its net investment in the United Kingdom. These nonderivative net investment hedges will mature on dates ranging from July 2015 to January 2039.
44
Cash Flow Instruments
The Company is a party to receive variable-rate, pay fixed-rate interest rate swaps that the Company uses to hedge the interest rate risk of certain non-U.S. denominated debt. The swaps are designated as cash flow hedges of interest expense risk. Amounts reported in accumulated other comprehensive income (loss) related to these derivatives are reclassified from accumulated other comprehensive income (loss) to earnings as interest is expensed for the Company's variable-rate debt, converting the variable-rate interest expense into fixed-rate interest expense. These cash flow instruments will mature in July 2015.
The Company is also a party to receive fixed-rate, pay fixed-rate cross-currency interest rate swaps to hedge the currency exposure associated with the forecasted payments of principal and interest of certain non-U.S. denominated debt. The swaps are designated as cash flow hedges of the currency risk related to payments on the non-U.S. denominated debt. The effective portion of changes in the fair value of derivatives designated as cash flow hedges of foreign exchange risk is recorded in accumulated other comprehensive income (loss) and is subsequently reclassified into earnings in the period that the hedged forecasted transaction affects earnings. The hedged items are recognized foreign currency-denominated liabilities that are remeasured at spot exchange rates each period, and the assessment of effectiveness (and measurement of any ineffectiveness) is based on total changes in the related derivative's cash flows. As a result, the amount reclassified into earnings each period includes an amount that offsets the related transaction gain or loss arising from that remeasurement and the adjustment to earnings for the period's allocable portion of the initial spot-forward difference associated with the hedging instrument. These cash flow instruments will mature on dates ranging from April 2022 to March 2034.
The Company used forward starting receive variable-rate, pay fixed-rate swaps ("forward starting swaps") to hedge its exposure to the variability in future cash flows due to changes in the LIBOR swap rate for debt issuances forecasted to occur in the future. These forward starting swaps were terminated in October 2014, April 2014 and April 2013 concurrently with the issuance of the hedged debt. Upon termination of the forward starting swaps, the Company received net cash payments from the related counterparties of $96 million in fiscal 2015 and made net cash payments to the related counterparties of $74 million in fiscal 2014. The payments were recorded in accumulated other comprehensive income (loss) and will be reclassified to earnings over the life of the related debt through May 2044, effectively adjusting interest expense to reflect the fixed interest rates entered into by the forward starting swaps.
Financial Statement Presentation
Although subject to master netting arrangements, the Company does not offset derivative assets and derivative liabilities in its Consolidated Balance Sheets. Derivative instruments with an unrealized gain are recorded in the Company's Consolidated Balance Sheets as either current or non-current assets, based on maturity date, and those hedging instruments with an unrealized loss are recorded as either current or non-current liabilities, based on maturity date.
The Company's derivative instruments, as well as its nonderivative debt instruments designated and qualifying as net investment hedges, were classified as follows in the Company's Consolidated Balance Sheets:
January 31, 2015 | January 31, 2014 | ||||||||||||||||||||||
(Amounts in millions) | Fair Value Instruments | Net Investment Instruments | Cash Flow Instruments | Fair Value Instruments | Net Investment Instruments | Cash Flow Instruments | |||||||||||||||||
Derivative instruments | |||||||||||||||||||||||
Prepaid expenses and other | $ | — | $ | — | $ | — | $ | 5 | $ | — | $ | — | |||||||||||
Other assets and deferred charges | 12 | 207 | 293 | — | 97 | 619 | |||||||||||||||||
Derivative asset subtotals | $ | 12 | $ | 207 | $ | 293 | $ | 5 | $ | 97 | $ | 619 | |||||||||||
Accrued liabilities | $ | — | $ | — | $ | 1 | $ | — | $ | — | $ | 1 | |||||||||||
Deferred income taxes and other | — | — | 610 | — | — | 1 | |||||||||||||||||
Derivative liability subtotals | $ | — | $ | — | $ | 611 | $ | — | $ | — | $ | 2 | |||||||||||
Nonderivative hedging instruments | |||||||||||||||||||||||
Long-term debt due within one year | $ | — | $ | 766 | $ | — | $ | — | $ | 973 | $ | — | |||||||||||
Long-term debt | — | 3,850 | — | — | 5,095 | — | |||||||||||||||||
Nonderivative hedge liability subtotals | $ | — | $ | 4,616 | $ | — | $ | — | $ | 6,068 | $ | — | |||||||||||
Gains and losses related to the Company's derivatives primarily relate to interest rate hedges, which are recorded in interest, net, in the Company's Consolidated Statements of Income. Amounts related to the Company's derivatives expected to be reclassified from accumulated other comprehensive income (loss) to net income during the next 12 months are not significant.
45
Note 9. Taxes
Income from Continuing Operations
The components of income from continuing operations before income taxes are as follows:
Fiscal Years Ended January 31, | |||||||||||
(Amounts in millions) | 2015 | 2014 | 2013 | ||||||||
U.S. | $ | 18,610 | $ | 19,412 | $ | 19,352 | |||||
Non-U.S. | 6,189 | 5,244 | 6,310 | ||||||||
Total income from continuing operations before income taxes | $ | 24,799 | $ | 24,656 | $ | 25,662 | |||||
A summary of the provision for income taxes is as follows:
Fiscal Years Ended January 31, | |||||||||||
(Amounts in millions) | 2015 | 2014 | 2013 | ||||||||
Current: | |||||||||||
U.S. federal | $ | 6,165 | $ | 6,377 | $ | 5,611 | |||||
U.S. state and local | 810 | 719 | 622 | ||||||||
International | 1,529 | 1,523 | 1,743 | ||||||||
Total current tax provision | 8,504 | 8,619 | 7,976 | ||||||||
Deferred: | |||||||||||
U.S. federal | (387 | ) | (72 | ) | 38 | ||||||
U.S. state and local | (55 | ) | 37 | (8 | ) | ||||||
International | (77 | ) | (479 | ) | (48 | ) | |||||
Total deferred tax expense (benefit) | (519 | ) | (514 | ) | (18 | ) | |||||
Total provision for income taxes | $ | 7,985 | $ | 8,105 | $ | 7,958 | |||||
Effective Income Tax Rate Reconciliation
The Company's effective income tax rate is typically lower than the U.S. statutory tax rate primarily because of benefits from lower-taxed global operations, including the use of global funding structures and certain U.S. tax credits as further discussed in the "Cash and Cash Equivalents" section of the Company's significant accounting policies in Note 1. The Company's non-U.S. income is generally subject to local country tax rates that are below the 35% U.S. statutory tax rate. Certain non-U.S. earnings have been indefinitely reinvested outside the U.S. and are not subject to current U.S. income tax. A reconciliation of the significant differences between the U.S. statutory tax rate and the effective income tax rate on pretax income from continuing operations is as follows:
Fiscal Years Ended January 31, | ||||||||
2015 | 2014 | 2013 | ||||||
U.S. statutory tax rate | 35.0 | % | 35.0 | % | 35.0 | % | ||
U.S. state income taxes, net of federal income tax benefit | 1.8 | % | 2.0 | % | 1.7 | % | ||
Income taxed outside the U.S. | (2.7 | )% | (2.8 | )% | (2.6 | )% | ||
Net impact of repatriated international earnings | (1.5 | )% | (1.4 | )% | (2.5 | )% | ||
Other, net | (0.4 | )% | 0.1 | % | (0.6 | )% | ||
Effective income tax rate | 32.2 | % | 32.9 | % | 31.0 | % | ||
46
Deferred Taxes
The significant components of the Company's deferred tax account balances are as follows:
January 31, | ||||||||
(Amounts in millions) | 2015 | 2014 | ||||||
Deferred tax assets: | ||||||||
Loss and tax credit carryforwards | $ | 3,255 | $ | 3,566 | ||||
Accrued liabilities | 3,395 | 2,986 | ||||||
Share-based compensation | 184 | 126 | ||||||
Other | 1,119 | 1,573 | ||||||
Total deferred tax assets | 7,953 | 8,251 | ||||||
Valuation allowances | (1,504 | ) | (1,801 | ) | ||||
Deferred tax assets, net of valuation allowance | 6,449 | 6,450 | ||||||
Deferred tax liabilities: | ||||||||
Property and equipment | 5,972 | 6,295 | ||||||
Inventories | 1,825 | 1,641 | ||||||
Other | 1,618 | 1,827 | ||||||
Total deferred tax liabilities | 9,415 | 9,763 | ||||||
Net deferred tax liabilities | $ | 2,966 | $ | 3,313 | ||||
The deferred taxes are classified as follows in the Company's Consolidated Balance Sheets:
January 31, | ||||||||
(Amounts in millions) | 2015 | 2014 | ||||||
Balance Sheet classification: | ||||||||
Assets: | ||||||||
Prepaid expenses and other | $ | 728 | $ | 822 | ||||
Other assets and deferred charges | 1,033 | 1,151 | ||||||
Asset subtotals | 1,761 | 1,973 | ||||||
Liabilities: | ||||||||
Accrued liabilities | 56 | 176 | ||||||
Deferred income taxes and other | 4,671 | 5,110 | ||||||
Liability subtotals | 4,727 | 5,286 | ||||||
Net deferred tax liabilities | $ | 2,966 | $ | 3,313 | ||||
Unremitted Earnings
U.S. income taxes have not been provided on accumulated but undistributed earnings of the Company's international subsidiaries of approximately $23.3 billion and $21.4 billion as of January 31, 2015 and 2014, respectively, as the Company intends to permanently reinvest these amounts outside of the U.S. However, if any portion were to be distributed, the related U.S. tax liability may be reduced by foreign income taxes paid on those earnings. Determination of the unrecognized deferred tax liability related to these undistributed earnings is not practicable because of the complexities with its hypothetical calculation. The Company provides deferred or current income taxes on earnings of international subsidiaries in the period that the Company determines it will remit those earnings.
Net Operating Losses, Tax Credit Carryforwards and Valuation Allowances
At January 31, 2015, the Company had net operating loss and capital loss carryforwards totaling approximately $5.6 billion. Of these carryforwards, approximately $2.9 billion will expire, if not utilized, in various years through 2033. The remaining carryforwards have no expiration. At January 31, 2015, the Company had foreign tax credit carryforwards of $2.0 billion, which will expire in various years through 2025, if not utilized.
The recoverability of these future tax deductions and credits is evaluated by assessing the adequacy of future expected taxable income from all sources, including taxable income in prior carryback years, reversal of taxable temporary differences, forecasted operating earnings and available tax planning strategies. To the extent management does not consider it more likely than not that a deferred tax asset will be realized, a valuation allowance is established. If a valuation allowance has been established and management subsequently determines that it is more likely than not that the deferred tax assets will be realized, the valuation allowance is released.
47
As of January 31, 2015 and 2014, the Company had valuation allowances recorded of approximately $1.5 billion and $1.8 billion, respectively, on deferred tax assets associated primarily with net operating loss carryforwards for which management has determined it is more likely than not that the deferred tax asset will not be realized. The $0.3 billion net decrease in the valuation allowance during fiscal 2015 related to releases arising from the use of deferred tax assets, changes in judgment regarding the future realization of deferred tax assets, increases from certain net operating losses and deductible temporary differences arising in fiscal 2015, decreases due to operating loss expirations and fluctuations in currency exchange rates. Management believes that it is more likely than not that the remaining net deferred tax assets will be fully realized.
Uncertain Tax Positions
The benefits of uncertain tax positions are recorded in the Company's Consolidated Financial Statements only after determining a more likely than not probability that the uncertain tax positions will withstand challenge, if any, from taxing authorities.
As of January 31, 2015 and 2014, the amount of unrecognized tax benefits related to continuing operations was $838 million and $763 million, respectively. The amount of unrecognized tax benefits that would affect the Company's effective income tax rate was $763 million and $698 million for January 31, 2015 and 2014, respectively.
A reconciliation of unrecognized tax benefits from continuing operations was as follows:
Fiscal Years Ended January 31, | |||||||||||
(Amounts in millions) | 2015 | 2014 | 2013 | ||||||||
Unrecognized tax benefits, beginning of year | $ | 763 | $ | 818 | $ | 611 | |||||
Increases related to prior year tax positions | 7 | 41 | 88 | ||||||||
Decreases related to prior year tax positions | (17 | ) | (112 | ) | (232 | ) | |||||
Increases related to current year tax positions | 174 | 133 | 431 | ||||||||
Settlements during the period | (89 | ) | (117 | ) | (80 | ) | |||||
Lapse in statutes of limitations | — | — | — | ||||||||
Unrecognized tax benefits, end of year | $ | 838 | $ | 763 | $ | 818 | |||||
The Company classifies interest and penalties related to uncertain tax benefits as interest expense and as operating, selling, general and administrative expenses, respectively. During fiscal 2015, 2014 and 2013, the Company recognized interest and penalty expense (benefit) related to uncertain tax positions of $18 million, $(7) million and $2 million, respectively. As of January 31, 2015 and 2014, accrued interest related to uncertain tax positions of $57 million and $40 million, respectively, was recorded in the Company's Consolidated Balance Sheets. The Company did not have any accrued penalties recorded for income taxes as of January 31, 2015 or 2014.
During the next twelve months, it is reasonably possible that tax audit resolutions could reduce unrecognized tax benefits by between $50 million and $350 million, either because the tax positions are sustained on audit or because the Company agrees to their disallowance. The Company is focused on resolving tax audits as expeditiously as possible. As a result of these efforts, unrecognized tax benefits could potentially be reduced beyond the provided range during the next twelve months. The Company does not expect any change to have a significant impact to its Consolidated Financial Statements.
The Company remains subject to income tax examinations for its U.S. federal income taxes generally for fiscal 2013 through 2015. The Company also remains subject to income tax examinations for international income taxes for fiscal 2000 through 2015, and for U.S. state and local income taxes generally for the fiscal years ended 2006 through 2015.
Other Taxes
The Company is subject to tax examinations for payroll, value added, sales-based and other non-income taxes. A number of these examinations are ongoing in various jurisdictions, including Brazil. In certain cases, the Company has received assessments from the respective taxing authorities in connection with these examinations. Where a probable loss has occurred, the Company has made accruals, which are reflected in the Company's Consolidated Financial Statements. While the possible losses or range of possible losses associated with these matters are individually immaterial, a group of related matters, if decided adversely to the Company, could result in a liability material to the Company's Consolidated Financial Statements.
48
Note 10. Contingencies
Legal Proceedings
The Company is involved in a number of legal proceedings. The Company has made accruals with respect to these matters, where appropriate, which are reflected in the Company's Consolidated Financial Statements. For some matters, a liability is not probable or the amount cannot be reasonably estimated and therefore an accrual has not been made. However, where a liability is reasonably possible and may be material, such matters have been disclosed. The Company may enter into discussions regarding settlement of these matters, and may enter into settlement agreements, if it believes settlement is in the best interest of the Company's shareholders.
Unless stated otherwise, the matters, or groups of related matters, discussed below, if decided adversely to or settled by the Company, individually or in the aggregate, may result in a liability material to the Company's financial condition or results of operations.
Wage-and-Hour Class Action: The Company is a defendant in Braun/Hummel v. Wal-Mart Stores, Inc., a class-action lawsuit commenced in March 2002 in the Court of Common Pleas in Philadelphia, Pennsylvania. The plaintiffs allege that the Company failed to pay class members for all hours worked and prevented class members from taking their full meal and rest breaks. On October 13, 2006, a jury awarded back-pay damages to the plaintiffs of approximately $78 million on their claims for off-the-clock work and missed rest breaks. The jury found in favor of the Company on the plaintiffs' meal-period claims. On November 14, 2007, the trial judge entered a final judgment in the approximate amount of $188 million, which included the jury's back-pay award plus statutory penalties, prejudgment interest and attorneys' fees. By operation of law, post-judgment interest accrues on the judgment amount at the rate of six percent per annum from the date of entry of the judgment, which was November 14, 2007, until the judgment is paid, unless the judgment is set aside on appeal. On December 7, 2007, the Company filed its Notice of Appeal. On June 10, 2011, the Pennsylvania Superior Court of Appeals issued an opinion upholding the trial court's certification of the class, the jury's back pay award, and the awards of statutory penalties and prejudgment interest, but reversing the award of attorneys' fees. On September 9, 2011, the Company filed a Petition for Allowance of Appeal with the Pennsylvania Supreme Court. On July 2, 2012, the Pennsylvania Supreme Court granted the Company's Petition. On December 15, 2014, the Pennsylvania Supreme Court issued its opinion affirming the Superior Court of Appeals' decision. At that time, the Company recorded expenses of $249 million for the judgment amount and post-judgment interest incurred to date. The Company will continue to accrue for the post-judgment interest until final resolution. However, the Company continues to believe it has substantial factual and legal defenses to the claims at issue and, on March 13, 2015, the Company filed a petition for writ of certiorari with the U.S. Supreme Court.
ASDA Equal Value Claims: ASDA Stores, Ltd. ("ASDA"), a wholly-owned subsidiary of the Company, is a defendant in over 4,000 "equal value" claims that are proceeding before an Employment Tribunal in Manchester (the "Employment Tribunal") in the United Kingdom ("UK") on behalf of current and former ASDA store employees, who allege that the work performed by female employees in ASDA's retail stores is of equal value in terms of, among other things, the demands of their jobs to that of male employees working in ASDA's warehouse and distribution facilities, and that the disparity in pay between these different job positions is not objectively justified. Claimants are requesting differential back pay based on higher wage rates in the warehouse and distribution facilities and those higher wage rates on a prospective basis as part of these equal value proceedings. ASDA believes that further claims may be asserted in the near future. On March 23, 2015, ASDA asked the Employment Tribunal to stay all proceedings, contending that the High Court, which is the superior first instance civil court in the UK that is headquartered in the Royal Courts of Justice in the City of London, is the more convenient and appropriate forum to hear these claims. On March 23, 2015, ASDA also asked the Employment Tribunal to "strike out" substantially all of the claims for failing to comply with Employment Tribunal rules. At present, the Company cannot predict the number of such claims that may be filed, and cannot reasonably estimate any loss or range of loss that may arise from these proceedings. The Company believes it has substantial factual and legal defenses to these claims, and intends to defend the claims vigorously.
49
FCPA Investigation and Related Matters
The Audit Committee (the "Audit Committee") of the Board of Directors of the Company, which is composed solely of independent directors, is conducting an internal investigation into, among other things, alleged violations of the U.S. Foreign Corrupt Practices Act ("FCPA") and other alleged crimes or misconduct in connection with foreign subsidiaries, including Wal-Mart de México, S.A.B. de C.V. ("Walmex"), and whether prior allegations of such violations and/or misconduct were appropriately handled by the Company. The Audit Committee and the Company have engaged outside counsel from a number of law firms and other advisors who are assisting in the on-going investigation of these matters.
The Company is also conducting a voluntary global review of its policies, practices and internal controls for FCPA compliance. The Company is engaged in strengthening its global anti-corruption compliance program through appropriate remedial anti-corruption measures. In November 2011, the Company voluntarily disclosed that investigative activity to the U.S. Department of Justice (the "DOJ") and the Securities and Exchange Commission (the "SEC"). Since the implementation of the global review and the enhanced anti-corruption compliance program, the Audit Committee and the Company have identified or been made aware of additional allegations regarding potential violations of the FCPA. When such allegations are reported or identified, the Audit Committee and the Company, together with their third party advisors, conduct inquiries and when warranted based on those inquiries, open investigations. Inquiries or investigations regarding allegations of potential FCPA violations have been commenced in a number of foreign markets where the Company operates, including, but not limited to, Brazil, China and India.
The Company has been informed by the DOJ and the SEC that it is also the subject of their respective investigations into possible violations of the FCPA. The Company is cooperating with the investigations by the DOJ and the SEC. A number of federal and local government agencies in Mexico have also initiated investigations of these matters. Walmex is cooperating with the Mexican governmental agencies conducting these investigations. Furthermore, lawsuits relating to the matters under investigation have been filed by several of the Company's shareholders against it, certain of its current directors, certain of its former directors, certain of its current and former officers and certain of Walmex's current and former officers.
The Company could be exposed to a variety of negative consequences as a result of the matters noted above. There could be one or more enforcement actions in respect of the matters that are the subject of some or all of the on-going government investigations, and such actions, if brought, may result in judgments, settlements, fines, penalties, injunctions, cease and desist orders, debarment or other relief, criminal convictions and/or penalties. The shareholder lawsuits may result in judgments against the Company and its current and former directors and officers named in those proceedings. The Company cannot predict at this time the outcome or impact of the government investigations, the shareholder lawsuits, or its own internal investigations and review. In addition, the Company has incurred and expects to continue to incur costs in responding to requests for information or subpoenas seeking documents, testimony and other information in connection with the government investigations, in defending the shareholder lawsuits, and in conducting the review and investigations. These costs will be expensed as incurred. For the fiscal years ended January 31, 2015, 2014 and 2013, the Company incurred the following third-party expenses in connection with the FCPA investigation and related matters:
Fiscal Years Ended January 31, | ||||||||||||
(Amounts in millions) | 2015 | 2014 | 2013 | |||||||||
Ongoing inquiries and investigations | $ | 121 | $ | 173 | $ | 100 | ||||||
Global compliance program and organizational enhancements | 52 | 109 | 57 | |||||||||
Total | $ | 173 | $ | 282 | $ | 157 | ||||||
These matters may require the involvement of certain members of the Company's senior management that could impinge on the time they have available to devote to other matters relating to the business. The Company expects that there will be on-going media and governmental interest, including additional news articles from media publications on these matters, which could impact the perception among certain audiences of the Company's role as a corporate citizen.
The Company's process of assessing and responding to the governmental investigations and the shareholder lawsuits continues. While the Company believes that it is probable that it will incur a loss from these matters, given the on-going nature and complexity of the review, inquiries and investigations, the Company cannot reasonably estimate any loss or range of loss that may arise from these matters. Although the Company does not presently believe that these matters will have a material adverse effect on its business, given the inherent uncertainties in such situations, the Company can provide no assurance that these matters will not be material to its business in the future.
50
Note 11. Commitments
The Company has long-term leases for stores and equipment. Rentals (including amounts applicable to taxes, insurance, maintenance, other operating expenses and contingent rentals) under operating leases and other short-term rental arrangements were $2.8 billion in both fiscal 2015 and 2014 and $2.6 billion in fiscal 2013.
Aggregate minimum annual rentals at January 31, 2015, under non-cancelable leases are as follows:
(Amounts in millions) | ||||||||
Fiscal Year | Operating Leases | Capital Leases | ||||||
2016 | $ | 1,759 | $ | 504 | ||||
2017 | 1,615 | 476 | ||||||
2018 | 1,482 | 444 | ||||||
2019 | 1,354 | 408 | ||||||
2020 | 1,236 | 370 | ||||||
Thereafter | 10,464 | 3,252 | ||||||
Total minimum rentals | $ | 17,910 | $ | 5,454 | ||||
Less estimated executory costs | 49 | |||||||
Net minimum lease payments | 5,405 | |||||||
Less imputed interest | 2,512 | |||||||
Present value of minimum lease payments | $ | 2,893 | ||||||
Certain of the Company's leases provide for the payment of contingent rentals based on a percentage of sales. Such contingent rentals were not material for fiscal 2015, 2014 and 2013. Substantially all of the Company's store leases have renewal options, some of which may trigger an escalation in rentals.
The Company has future lease commitments for land and buildings for approximately 282 future locations. These lease commitments have lease terms ranging from 1 to 30 years and provide for certain minimum rentals. If executed, payments under operating leases would increase by $58 million for fiscal 2016, based on current cost estimates.
In connection with certain long-term debt issuances, the Company could be liable for early termination payments if certain unlikely events were to occur. At January 31, 2015, the aggregate termination payment would have been $64 million. The arrangement pursuant to which this payment could be made will expire in fiscal 2019.
51
Note 12. Retirement-Related Benefits
The Company offers a 401(k) plan for associates in the U.S. under which eligible associates can begin contributing to the plan immediately upon hire. The Company also offers a 401(k) type plan for associates in Puerto Rico under which associates can begin to contribute generally after one year of employment. Under these plans, after one year of employment, the Company matches 100% of participant contributions up to 6% of annual eligible earnings. The matching contributions immediately vest at 100% for each associate. Participants can contribute up to 50% of their pretax earnings, but not more than the statutory limits. Participants age 50 or older may defer additional earnings in catch-up contributions up to the maximum statutory limits.
Associates in international countries who are not U.S. citizens are covered by various defined contribution post-employment benefit arrangements. These plans are administered based upon the legislative and tax requirements in the countries in which they are established.
Additionally, the Company's subsidiaries in the United Kingdom and Japan have sponsored defined benefit pension plans. The plan in the United Kingdom was underfunded by $85 million and $69 million at January 31, 2015 and 2014, respectively. The plan in Japan was underfunded by $223 million and $281 million at January 31, 2015 and 2014, respectively. These underfunded amounts are recorded as liabilities in the Company's Consolidated Balance Sheets in deferred income taxes and other. Certain other international operations also have defined benefit arrangements that are not significant.
The following table summarizes the contribution expense related to the Company's retirement-related benefits for fiscal 2015, 2014 and 2013:
Fiscal Years Ended January 31, | |||||||||||
(Amounts in millions) | 2015 | 2014 | 2013 | ||||||||
Defined contribution plans: | |||||||||||
U.S. | $ | 898 | $ | 877 | $ | 818 | |||||
International | 167 | 165 | 166 | ||||||||
Defined benefit plans: | |||||||||||
International | 5 | 20 | 26 | ||||||||
Total contribution expense for retirement-related benefits | $ | 1,070 | $ | 1,062 | $ | 1,010 | |||||
Note 13. Acquisitions, Disposals and Related Items
In fiscal 2015, the Company completed the following transactions that impact the operations of Walmart International:
Walmart Chile
In fiscal 2014, the redeemable noncontrolling interest shareholders exercised put options that required the Company to purchase their shares in Walmart Chile. At that time, the Company recorded an increase to redeemable noncontrolling interest of $1.0 billion, with a corresponding decrease to capital in excess of par value, to reflect the redemption value of the redeemable noncontrolling interest at $1.5 billion. In February 2014, the Company completed this transaction using existing cash of the Company, increasing its ownership interest in Walmart Chile to 99.7 percent. In March 2014, the Company completed a tender offer for most of the remaining noncontrolling interest shares at the same value per share as was paid to the redeemable noncontrolling interest shareholders. As a result of completing these transactions, the Company owns substantially all of Walmart Chile.
Vips Restaurant Business in Mexico
In September 2013, Walmex, a majority-owned subsidiary of the Company, entered into a definitive agreement with Alsea S.A.B. de C.V. to sell the Vips restaurant business ("Vips") in Mexico. The sale of Vips was completed on May 12, 2014. Upon completion of the sale, the Company received $671 million of cash and recognized a net gain of $262 million, which is recorded in discontinued operations in the Company's Consolidated Statements of Income for the fiscal year ended January 31, 2015.
52
Note 14. Segments
The Company is engaged in the operation of retail, wholesale and other units located in the U.S., Africa, Argentina, Brazil, Canada, Central America, Chile, China, India, Japan, Mexico and the United Kingdom. The Company's operations are conducted in three business segments: Walmart U.S., Walmart International and Sam's Club. The Company defines its segments as those operations whose results its chief operating decision maker ("CODM") regularly reviews to analyze performance and allocate resources. The Company sells similar individual products and services in each of its segments. It is impractical to segregate and identify revenues for each of these individual products and services.
The Walmart U.S. segment includes the Company's mass merchant concept in the U.S. operating under the "Walmart" or "Wal-Mart" brands, as well as walmart.com. The Walmart International segment consists of the Company's operations outside of the U.S., including various retail websites. The Sam's Club segment includes the warehouse membership clubs in the U.S., as well as samsclub.com. Corporate and support consists of corporate overhead and other items not allocated to any of the Company's segments.
The Company measures the results of its segments using, among other measures, each segment's net sales and operating income, which includes certain corporate overhead allocations. From time to time, the Company revises the measurement of each segment's operating income, including any corporate overhead allocations, as determined by the information regularly reviewed by its CODM. When the measurement of a segment changes, previous period amounts and balances are reclassified to be comparable to the current period's presentation.
Information for the Company's segments, as well as for Corporate and support, including the reconciliation to income from continuing operations before income taxes, is provided in the following table:
(Amounts in millions) | Walmart U.S. | Walmart International | Sam's Club | Corporate and support | Consolidated | |||||||||||||||
Fiscal Year Ended January 31, 2015 | ||||||||||||||||||||
Net sales | $ | 288,049 | $ | 136,160 | $ | 58,020 | $ | — | $ | 482,229 | ||||||||||
Operating income (loss) | 21,336 | 6,171 | 1,976 | (2,336 | ) | 27,147 | ||||||||||||||
Interest expense, net | (2,348 | ) | ||||||||||||||||||
Income from continuing operations before income taxes | $ | 24,799 | ||||||||||||||||||
Total assets | 101,381 | 80,505 | 13,995 | 7,825 | $ | 203,706 | ||||||||||||||
Depreciation and amortization | 2,665 | 2,665 | 473 | 3,370 | 9,173 | |||||||||||||||
Capital expenditures | 6,286 | 3,936 | 753 | 1,199 | 12,174 | |||||||||||||||
Fiscal Year Ended January 31, 2014 | ||||||||||||||||||||
Net sales | $ | 279,406 | $ | 136,513 | $ | 57,157 | $ | — | $ | 473,076 | ||||||||||
Operating income (loss) | 21,787 | 5,153 | 1,843 | (1,911 | ) | 26,872 | ||||||||||||||
Interest expense, net | (2,216 | ) | ||||||||||||||||||
Income from continuing operations before income taxes | $ | 24,656 | ||||||||||||||||||
Total assets | $ | 98,745 | $ | 85,370 | $ | 14,053 | $ | 6,583 | $ | 204,751 | ||||||||||
Depreciation and amortization | 2,640 | 2,658 | 437 | 3,135 | 8,870 | |||||||||||||||
Capital expenditures | 6,378 | 4,463 | 1,071 | 1,203 | 13,115 | |||||||||||||||
Fiscal Year Ended January 31, 2013 | ||||||||||||||||||||
Net sales | $ | 274,433 | $ | 134,748 | $ | 56,423 | $ | — | $ | 465,604 | ||||||||||
Operating income (loss) | 21,103 | 6,365 | 1,859 | (1,602 | ) | 27,725 | ||||||||||||||
Interest expense, net | (2,063 | ) | ||||||||||||||||||
Income from continuing operations before income taxes | $ | 25,662 | ||||||||||||||||||
Total assets | $ | 96,234 | $ | 85,695 | $ | 13,479 | $ | 7,697 | $ | 203,105 | ||||||||||
Depreciation and amortization | 2,644 | 2,605 | 410 | 2,819 | 8,478 | |||||||||||||||
Capital expenditures | 5,994 | 4,640 | 868 | 1,396 | 12,898 | |||||||||||||||
53
Total revenues, consisting of net sales and membership and other income, and long-lived assets, consisting primarily of property and equipment, net, aggregated by the Company's U.S. and non-U.S. operations for fiscal 2015, 2014 and 2013, are as follows:
Fiscal Years Ended January 31, | |||||||||||
(Amounts in millions) | 2015 | 2014 | 2013 | ||||||||
Total revenues | |||||||||||
U.S. operations | $ | 348,227 | $ | 338,681 | $ | 332,788 | |||||
Non-U.S. operations | 137,424 | 137,613 | 135,863 | ||||||||
Total revenues | $ | 485,651 | $ | 476,294 | $ | 468,651 | |||||
Long-lived assets | |||||||||||
U.S. operations | $ | 80,879 | $ | 79,644 | $ | 77,692 | |||||
Non-U.S. operations | 35,776 | 38,263 | 38,989 | ||||||||
Total long-lived assets | $ | 116,655 | $ | 117,907 | $ | 116,681 | |||||
No individual country outside of the U.S. had total revenues or long-lived assets that were material to the consolidated totals. Additionally, the Company did not generate material total revenues from any single customer.
Note 15. Subsequent Event
Dividends Declared
On February 19, 2015, the Board of Directors approved the fiscal 2016 annual dividend at $1.96 per share, an increase from the fiscal 2015 dividend of $1.92 per share. For fiscal 2016, the annual dividend will be paid in four quarterly installments of $0.49 per share, according to the following record and payable dates:
Record Date | Payable Date | |
March 13, 2015 | April 6, 2015 | |
May 8, 2015 | June 1, 2015 | |
August 7, 2015 | September 8, 2015 | |
December 4, 2015 | January 4, 2016 | |
54
Note 16. Quarterly Financial Data (Unaudited)
Fiscal Year Ended January 31, 2015 | ||||||||||||||||||||
(Amounts in millions, except per share data) | Q1 | Q2 | Q3 | Q4 | Total | |||||||||||||||
Total revenues | $ | 114,960 | $ | 120,125 | $ | 119,001 | $ | 131,565 | $ | 485,651 | ||||||||||
Net sales | 114,167 | 119,336 | 118,076 | 130,650 | 482,229 | |||||||||||||||
Cost of sales | 86,714 | 90,010 | 89,247 | 99,115 | 365,086 | |||||||||||||||
Income from continuing operations | 3,711 | 4,089 | 3,826 | 5,188 | 16,814 | |||||||||||||||
Consolidated net income | 3,726 | 4,359 | 3,826 | 5,188 | 17,099 | |||||||||||||||
Consolidated net income attributable to Walmart | 3,593 | 4,093 | 3,711 | 4,966 | 16,363 | |||||||||||||||
Basic net income per common share(1): | ||||||||||||||||||||
Basic income per common share from continuing operations attributable to Walmart | 1.10 | 1.22 | 1.15 | 1.54 | 5.01 | |||||||||||||||
Basic income (loss) per common share from discontinued operations attributable to Walmart | 0.01 | 0.05 | — | — | 0.06 | |||||||||||||||
Basic net income per common share attributable to Walmart | 1.11 | 1.27 | 1.15 | 1.54 | 5.07 | |||||||||||||||
Diluted net income per common share(1): | ||||||||||||||||||||
Diluted income per common share from continuing operations attributable to Walmart | 1.10 | 1.21 | 1.15 | 1.53 | 4.99 | |||||||||||||||
Diluted income (loss) per common share from discontinued operations attributable to Walmart | 0.01 | 0.05 | — | — | 0.06 | |||||||||||||||
Diluted net income per common share attributable to Walmart | 1.11 | 1.26 | 1.15 | 1.53 | 5.05 | |||||||||||||||
Fiscal Year Ended January 31, 2014 | ||||||||||||||||||||
Q1 | Q2 | Q3 | Q4 | Total | ||||||||||||||||
Total revenues | $ | 114,071 | $ | 116,829 | $ | 115,688 | $ | 129,706 | $ | 476,294 | ||||||||||
Net sales | 113,313 | 116,101 | 114,876 | 128,786 | 473,076 | |||||||||||||||
Cost of sales | 85,991 | 87,420 | 86,687 | 97,971 | 358,069 | |||||||||||||||
Income from continuing operations | 3,932 | 4,205 | 3,870 | 4,544 | 16,551 | |||||||||||||||
Consolidated net income | 3,944 | 4,216 | 3,885 | 4,650 | 16,695 | |||||||||||||||
Consolidated net income attributable to Walmart | 3,784 | 4,069 | 3,738 | 4,431 | 16,022 | |||||||||||||||
Basic net income per common share(1): | ||||||||||||||||||||
Basic income per common share from continuing operations attributable to Walmart | 1.14 | 1.24 | 1.14 | 1.35 | 4.87 | |||||||||||||||
Basic income (loss) per common share from discontinued operations attributable to Walmart | 0.01 | — | 0.01 | 0.02 | 0.03 | |||||||||||||||
Basic net income per common share attributable to Walmart | 1.15 | 1.24 | 1.15 | 1.37 | 4.90 | |||||||||||||||
Diluted net income per common share(1): | ||||||||||||||||||||
Diluted income per common share from continuing operations attributable to Walmart | 1.14 | 1.23 | 1.14 | 1.34 | 4.85 | |||||||||||||||
Diluted income (loss) per common share from discontinued operations attributable to Walmart | — | 0.01 | — | 0.02 | 0.03 | |||||||||||||||
Diluted net income per common share attributable to Walmart | 1.14 | 1.24 | 1.14 | 1.36 | 4.88 | |||||||||||||||
(1) | The sum of quarterly income per common share attributable to Walmart data may not agree to annual amounts due to rounding. |
55
Report of Independent Registered Public Accounting Firm
The Board of Directors and Shareholders of Wal-Mart Stores, Inc.
We have audited the accompanying consolidated balance sheets of Wal-Mart Stores, Inc. as of January 31, 2015 and 2014, and the related consolidated statements of income, comprehensive income, shareholders' equity and redeemable noncontrolling interest, and cash flows for each of the three years in the period ended January 31, 2015. These financial statements are the responsibility of the Company's management. Our responsibility is to express an opinion on these financial statements based on our audits.
We conducted our audits in accordance with the standards of the Public Company Accounting Oversight Board (United States). Those standards require that we plan and perform the audit to obtain reasonable assurance about whether the financial statements are free of material misstatement. An audit includes examining, on a test basis, evidence supporting the amounts and disclosures in the financial statements. An audit also includes assessing the accounting principles used and significant estimates made by management, as well as evaluating the overall financial statement presentation. We believe that our audits provide a reasonable basis for our opinion.
In our opinion, the financial statements referred to above present fairly, in all material respects, the consolidated financial position of Wal-Mart Stores, Inc. at January 31, 2015 and 2014, and the consolidated results of its operations and its cash flows for each of the three years in the period ended January 31, 2015, in conformity with U.S. generally accepted accounting principles.
We also have audited, in accordance with the standards of the Public Company Accounting Oversight Board (United States), Wal-Mart Stores, Inc.'s internal control over financial reporting as of January 31, 2015, based on criteria established in Internal Control-Integrated Framework issued by the Committee of Sponsoring Organizations of the Treadway Commission (2013 framework) and our report dated April 1, 2015 expressed an unqualified opinion thereon.
/s/ Ernst & Young LLP
Rogers, Arkansas
April 1, 2015
56
Report of Independent Registered Public Accounting Firm on Internal Control over Financial Reporting
The Board of Directors and Shareholders of Wal-Mart Stores, Inc.
We have audited Wal-Mart Stores, Inc.'s internal control over financial reporting as of January 31, 2015, based on criteria established in Internal Control-Integrated Framework issued by the Committee of Sponsoring Organizations of the Treadway Commission (2013 framework) (the COSO criteria). Wal-Mart Stores, Inc.'s management is responsible for maintaining effective internal control over financial reporting, and for its assessment of the effectiveness of internal control over financial reporting included in the accompanying "Management's Report to Our Shareholders." Our responsibility is to express an opinion on the Company's internal control over financial reporting based on our audit.
We conducted our audit in accordance with the standards of the Public Company Accounting Oversight Board (United States). Those standards require that we plan and perform the audit to obtain reasonable assurance about whether effective internal control over financial reporting was maintained in all material respects. Our audit included obtaining an understanding of internal control over financial reporting, assessing the risk that a material weakness exists, testing and evaluating the design and operating effectiveness of internal control based on the assessed risk, and performing such other procedures as we considered necessary in the circumstances. We believe that our audit provides a reasonable basis for our opinion.
A company's internal control over financial reporting is a process designed to provide reasonable assurance regarding the reliability of financial reporting and the preparation of financial statements for external purposes in accordance with generally accepted accounting principles. A company's internal control over financial reporting includes those policies and procedures that (1) pertain to the maintenance of records that, in reasonable detail, accurately and fairly reflect the transactions and dispositions of the assets of the company; (2) provide reasonable assurance that transactions are recorded as necessary to permit preparation of financial statements in accordance with generally accepted accounting principles, and that receipts and expenditures of the company are being made only in accordance with authorizations of management and directors of the company; and (3) provide reasonable assurance regarding prevention or timely detection of unauthorized acquisition, use or disposition of the company's assets that could have a material effect on the financial statements.
Because of its inherent limitations, internal control over financial reporting may not prevent or detect misstatements. Also, projections of any evaluation of effectiveness to future periods are subject to the risk that controls may become inadequate because of changes in conditions, or that the degree of compliance with the policies or procedures may deteriorate.
In our opinion, Wal-Mart Stores, Inc. maintained, in all material respects, effective internal control over financial reporting as of January 31, 2015, based on the COSO criteria.
We also have audited, in accordance with the standards of the Public Company Accounting Oversight Board (United States), the consolidated balance sheets of Wal-Mart Stores, Inc. as of January 31, 2015 and 2014, and related consolidated statements of income, comprehensive income, shareholders' equity and redeemable noncontrolling interest and cash flows for each of the three years in the period ended January 31, 2015 and our report dated April 1, 2015 expressed an unqualified opinion thereon.
/s/ Ernst & Young LLP
Rogers, Arkansas
April 1, 2015
57
Management's Report to Our Shareholders
Wal-Mart Stores, Inc.
Management of Wal-Mart Stores, Inc. ("Walmart," the "company" or "we") is responsible for the preparation, integrity and objectivity of Walmart's Consolidated Financial Statements and other financial information contained in this Annual Report to Shareholders. Those Consolidated Financial Statements were prepared in conformity with accounting principles generally accepted in the United States. In preparing those Consolidated Financial Statements, management is required to make certain estimates and judgments, which are based upon currently available information and management's view of current conditions and circumstances.
The Audit Committee of the Board of Directors, which consists solely of independent directors, oversees our process of reporting financial information and the audit of our Consolidated Financial Statements. The Audit Committee stays informed of the financial condition of Walmart and regularly reviews management's financial policies and procedures, the independence of our independent auditors, our internal control over financial reporting and the objectivity of our financial reporting. Both the independent auditors and the internal auditors have free access to the Audit Committee and meet with the Audit Committee periodically, both with and without management present.
Acting through our Audit Committee, we have retained Ernst & Young LLP, an independent registered public accounting firm, to audit our Consolidated Financial Statements found in this Annual Report to Shareholders. We have made available to Ernst & Young LLP all of our financial records and related data in connection with their audit of our Consolidated Financial Statements. We have filed with the Securities and Exchange Commission ("SEC") the required certifications related to our Consolidated Financial Statements as of and for the year ended January 31, 2015. These certifications are attached as exhibits to our Annual Report on Form 10-K for the year ended January 31, 2015. Additionally, we have also provided to the New York Stock Exchange the required annual certification of our Chief Executive Officer regarding our compliance with the New York Stock Exchange's corporate governance listing standards.
Report on Internal Control Over Financial Reporting
Management has responsibility for establishing and maintaining adequate internal control over financial reporting. Internal control over financial reporting is a process designed to provide reasonable assurance regarding the reliability of financial reporting and the preparation of financial statements for external reporting purposes in accordance with accounting principles generally accepted in the United States. Because of its inherent limitations, internal control over financial reporting may not prevent or detect misstatements. Management has assessed the effectiveness of the Company's internal control over financial reporting as of January 31, 2015. In making its assessment, management has utilized the criteria set forth by the Committee of Sponsoring Organizations ("COSO") of the Treadway Commission in Internal Control-Integrated Framework (2013). Management concluded that based on its assessment, Walmart's internal control over financial reporting was effective as of January 31, 2015. The Company's internal control over financial reporting as of January 31, 2015, has been audited by Ernst & Young LLP as stated in their report which appears in this Annual Report to Shareholders.
Evaluation of Disclosure Controls and Procedures
We maintain disclosure controls and procedures designed to provide reasonable assurance that information required to be timely disclosed is accumulated and communicated to management in a timely fashion. Management has assessed the effectiveness of these disclosure controls and procedures as of January 31, 2015, and determined they were effective as of that date to provide reasonable assurance that information required to be disclosed by us in the reports we file or submit under the Securities Exchange Act of 1934, as amended, was accumulated and communicated to management, as appropriate, to allow timely decisions regarding required disclosure and were effective to provide reasonable assurance that such information is recorded, processed, summarized and reported within the time periods specified by the SEC's rules and forms.
58
Report on Ethical Standards
Our Company was founded on the belief that open communications and the highest standards of ethics are necessary to be successful. Our long-standing "Open Door" communication policy helps management be aware of and address issues in a timely and effective manner. Through the open door policy all associates are encouraged to inform management at the appropriate level when they are concerned about any matter pertaining to Walmart.
Walmart has adopted a Statement of Ethics to guide our associates in the continued observance of high ethical standards such as honesty, integrity and compliance with the law in the conduct of Walmart's business. Familiarity and compliance with the Statement of Ethics is required of all associates who are part of management. The Company also maintains a separate Code of Ethics for our senior financial officers. Walmart also has in place a Related-Party Transaction Policy. This policy applies to Walmart's senior officers and directors and requires material related-party transactions to be reviewed by the Audit Committee. The senior officers and directors are required to report material related-party transactions to Walmart. We maintain a global ethics office which oversees and administers an ethics helpline. The ethics helpline provides a channel for associates to make confidential and anonymous complaints regarding potential violations of our statements of ethics, including violations related to financial or accounting matters.
/s/ C. Douglas McMillon |
C. Douglas McMillon President and Chief Executive Officer |
/s/ Charles M. Holley, Jr. |
Charles M. Holley, Jr. Executive Vice President and Chief Financial Officer |
59
Unit Counts as of January 31, 2015
Wal-Mart Stores, Inc.
United States
The Walmart U.S. and Sam's Club segments comprise the Company's operations in the U.S. As of January 31, 2015, unit counts for Walmart U.S. and Sam's Club are summarized by format for each state and territory as follows:
Walmart U.S. | Sam's Club | ||||||||||||||
State or Territory | Supercenters | Discount Stores | Neighborhood Markets and other small formats | Clubs | Grand Total | ||||||||||
Alabama | 99 | 1 | 24 | 14 | 138 | ||||||||||
Alaska | 8 | 2 | — | 3 | 13 | ||||||||||
Arizona | 79 | 3 | 26 | 16 | 124 | ||||||||||
Arkansas | 75 | 8 | 38 | 7 | 128 | ||||||||||
California | 117 | 92 | 64 | 33 | 306 | ||||||||||
Colorado | 67 | 5 | 18 | 15 | 105 | ||||||||||
Connecticut | 12 | 22 | 2 | 3 | 39 | ||||||||||
Delaware | 6 | 3 | — | 1 | 10 | ||||||||||
Florida | 216 | 13 | 65 | 46 | 340 | ||||||||||
Georgia | 150 | 3 | 29 | 23 | 205 | ||||||||||
Hawaii | — | 10 | — | 2 | 12 | ||||||||||
Idaho | 22 | 1 | 2 | 1 | 26 | ||||||||||
Illinois | 133 | 23 | 8 | 33 | 197 | ||||||||||
Indiana | 92 | 9 | 9 | 16 | 126 | ||||||||||
Iowa | 57 | 3 | — | 8 | 68 | ||||||||||
Kansas | 57 | 4 | 18 | 9 | 88 | ||||||||||
Kentucky | 76 | 8 | 8 | 9 | 101 | ||||||||||
Louisiana | 87 | 2 | 23 | 15 | 127 | ||||||||||
Maine | 19 | 3 | — | 3 | 25 | ||||||||||
Maryland | 26 | 21 | — | 12 | 59 | ||||||||||
Massachusetts | 26 | 23 | — | 3 | 52 | ||||||||||
Michigan | 89 | 5 | — | 26 | 120 | ||||||||||
Minnesota | 64 | 6 | — | 14 | 84 | ||||||||||
Mississippi | 62 | 4 | 9 | 7 | 82 | ||||||||||
Missouri | 109 | 11 | 16 | 18 | 154 | ||||||||||
Montana | 13 | — | — | 2 | 15 | ||||||||||
Nebraska | 35 | — | 7 | 5 | 47 | ||||||||||
Nevada | 30 | 2 | 11 | 7 | 50 | ||||||||||
New Hampshire | 17 | 10 | — | 4 | 31 | ||||||||||
New Jersey | 25 | 34 | — | 10 | 69 | ||||||||||
New Mexico | 35 | 2 | 6 | 7 | 50 | ||||||||||
New York | 77 | 22 | 2 | 16 | 117 | ||||||||||
North Carolina | 138 | 6 | 43 | 23 | 210 | ||||||||||
North Dakota | 14 | — | — | 3 | 17 | ||||||||||
Ohio | 139 | 7 | — | 29 | 175 | ||||||||||
Oklahoma | 79 | 9 | 30 | 11 | 129 | ||||||||||
Oregon | 28 | 7 | 10 | — | 45 | ||||||||||
Pennsylvania | 114 | 22 | — | 24 | 160 | ||||||||||
Rhode Island | 5 | 4 | — | 1 | 10 | ||||||||||
South Carolina | 81 | — | 11 | 12 | 104 | ||||||||||
South Dakota | 14 | — | — | 2 | 16 | ||||||||||
Tennessee | 113 | 2 | 10 | 16 | 141 | ||||||||||
Texas | 363 | 24 | 91 | 81 | 559 | ||||||||||
Utah | 40 | — | 10 | 8 | 58 | ||||||||||
Vermont | 1 | 4 | — | — | 5 | ||||||||||
Virginia | 104 | 6 | 12 | 16 | 138 | ||||||||||
Washington | 51 | 10 | 5 | 3 | 69 | ||||||||||
Washington D.C. | 2 | — | — | — | 2 | ||||||||||
West Virginia | 38 | — | 1 | 5 | 44 | ||||||||||
Wisconsin | 80 | 8 | 5 | 12 | 105 | ||||||||||
Wyoming | 11 | — | — | 2 | 13 | ||||||||||
Puerto Rico | 12 | 6 | 26 | 11 | 55 | ||||||||||
U.S. total | 3,407 | 470 | 639 | 647 | 5,163 | ||||||||||
60
International
The Walmart International segment comprises the Company's operations outside of the U.S. and is represented in three major brand categories. Unit counts(1) as of January 31, 2015 for Walmart International are summarized by brand category for each geographic market as follows:
Geographic Market | Retail | Wholesale | Other(2) | Total | ||||||||
Africa(3) | 302 | 94 | — | 396 | ||||||||
Argentina | 105 | — | — | 105 | ||||||||
Brazil | 468 | 76 | 13 | 557 | ||||||||
Canada | 394 | — | — | 394 | ||||||||
Central America(4) | 689 | 1 | — | 690 | ||||||||
Chile | 377 | 3 | 24 | 404 | ||||||||
China | 400 | 11 | — | 411 | ||||||||
India | — | 20 | — | 20 | ||||||||
Japan | 372 | — | 59 | 431 | ||||||||
Mexico | 2,120 | 160 | 10 | 2,290 | ||||||||
United Kingdom | 589 | — | 3 | 592 | ||||||||
International total | 5,816 | 365 | 109 | 6,290 | ||||||||
(1) | Walmart International unit counts, with the exception of Canada, are stated as of December 31, 2014, to correspond with the balance sheet date of the related geographic market. Canada unit counts are stated as of January 31, 2015. |
(2) | "Other" includes restaurants, drug stores, convenience stores and banks operating under varying banners. |
(3) | Africa unit counts by country are Botswana (11), Ghana (1), Lesotho (3), Malawi (2), Mozambique (5), Namibia (4), Nigeria (6), South Africa (360), Swaziland (1), Tanzania (1), Uganda (1) and Zambia (1). |
(4) | Central America unit counts by country are Costa Rica (217), El Salvador (89), Guatemala (217), Honduras (81) and Nicaragua (86). |
61
Board of Directors
Aida M. Alvarez
Ms. Alvarez is the former Administrator of the U.S. Small Business Administration and was a member of President Clinton's Cabinet from 1997 to 2001.
James I. Cash, Jr., Ph.D.
Dr. Cash is the James E. Robison Emeritus Professor of Business Administration at Harvard Business School, where he served from July 1976 to October 2003.
Roger C. Corbett
Mr. Corbett is the retired Chief Executive Officer and Group Managing Director of Woolworths Limited, the largest retail company in Australia.
Pamela J. Craig
Ms. Craig is the retired Chief Financial Officer of Accenture plc, a global management consulting, technology services, and outsourcing company.
Douglas N. Daft
Mr. Daft is the retired Chairman of the Board of Directors and Chief Executive Officer of The Coca-Cola Company, a beverage manufacturer, where he served in that capacity from February 2000 until May 2004, and in various other capacities since 1969.
Michael T. Duke
Mr. Duke is the former Chairman of the Executive Committee of the Board of Directors of Wal-Mart Stores, Inc., where he served in that capacity until January 31, 2015. He previously served as the President and Chief Executive Officer of Wal-Mart Stores, Inc. from February 2009 to January 2014.
Timothy P. Flynn
Mr. Flynn is the retired Chairman of KPMG International, a professional services firm.
Thomas W. Horton
Mr. Horton is the former Chairman of American Airlines Group Inc. and the former Chairman of American Airlines, Inc. He also previously served as the Chairman and Chief Executive Officer of AMR Corporation and CEO of American Airlines, Inc.
Marissa A. Mayer
Ms. Mayer is the Chief Executive Officer and President and Director of Yahoo!, Inc., a digital media company.
C. Douglas McMillon
Mr. McMillon is the President and Chief Executive Officer of Wal-Mart Stores, Inc.
Gregory B. Penner
Mr. Penner is the Vice Chairman of the Board of Directors of Wal-Mart Stores, Inc. and a General Partner at Madrone Capital Partners, an investment firm.
Steven S Reinemund
Mr. Reinemund is the retired Dean of Business and Professor of Leadership and Strategy at Wake Forest University. He previously served as the Chairman of the Board and Chairman and Chief Executive Officer of PepsiCo, Inc.
Kevin Y. Systrom
Mr. Systrom is the Chief Executive Officer and co-founder of Instagram, a social media application.
Jim C. Walton
Mr. Walton is the Chairman of the Board of Directors and Chief Executive Officer of Arvest Bank Group, Inc., a group of banks operating in the states of Arkansas, Kansas, Missouri and Oklahoma.
S. Robson Walton
Mr. Walton is Chairman of the Board of Directors of Wal-Mart Stores, Inc.
Linda S. Wolf
Ms. Wolf is the retired Chairman of the Board of Directors and Chief Executive Officer of Leo Burnett Worldwide, Inc., an advertising agency and division of Publicis Groupe S.A.
62
Corporate and Stock Information
Wal-Mart Stores, Inc.
Listing
New York Stock Exchange
Stock Symbol: WMT
Corporate information
Stock Registrar and Transfer Agent:
Computershare Trust Company, N.A.
P.O. Box 43069
Providence, Rhode Island 02940-3069
1-800-438-6278
TDD for hearing-impaired inside the U.S. 1-800-952-9245
Internet: http://www.computershare.com
Annual meeting
Our Annual Meeting of Shareholders will be held on Friday, June 5, 2015, at 7:30 a.m. (Central Time) in the Bud Walton Arena on the University of Arkansas campus, Fayetteville, Arkansas.
Communication with shareholders
Wal-Mart Stores, Inc. periodically communicates with its shareholders and other members of the investment community about our operations. For further information regarding our policy on shareholder and investor communications refer to our website, www.stock.walmart.com.
The following reports are available without charge upon request by writing the Company c/o Investor Relations or by calling (479) 273-8446. These reports are also available via the corporate website.
Annual Report on Form 10-K
Quarterly Reports on Form 10-Q
Earnings Releases
Current Reports on Form 8-K
Annual Shareholders' Meeting Proxy Statement
Global Responsibility Report
Diversity and Inclusion Report (Includes the content previously reported in the "Workforce Diversity Report")
Independent registered public accounting firm
Ernst & Young LLP
5417 Pinnacle Point Dr., Suite 501
Rogers, AR 72758
Market price of common stock
The high and low market price per share for the Company's common stock in fiscal 2015 and 2014 were as follows:
2015 | 2014 | |||||||||||||||
High | Low | High | Low | |||||||||||||
1st Quarter | $ | 79.99 | $ | 72.27 | $ | 79.50 | $ | 68.13 | ||||||||
2nd Quarter | 79.76 | 73.54 | 79.96 | 72.90 | ||||||||||||
3rd Quarter | 79.37 | 72.61 | 79.00 | 71.51 | ||||||||||||
4th Quarter | 90.97 | 75.59 | 81.37 | 73.64 | ||||||||||||
63
The high and low market price per share for the Company's common stock for the first quarter of fiscal 2016, were as follows:
2016 | |||||||
High | Low | ||||||
1st Quarter(1) | $ | 88.00 | $ | 80.43 | |||
(1) | Through April 1, 2015. |
Dividends payable per share
For fiscal 2016, dividends will be paid based on the following schedule:
April 6, 2015 | $ | 0.49 | |
June 1, 2015 | $ | 0.49 | |
September 8, 2015 | $ | 0.49 | |
January 4, 2016 | $ | 0.49 | |
Dividends paid per share
For fiscal 2015, dividends were paid based on the following schedule:
April 1, 2014 | $ | 0.48 | |
June 2, 2014 | $ | 0.48 | |
September 3, 2014 | $ | 0.48 | |
January 5, 2015 | $ | 0.48 | |
For fiscal 2014, dividends were paid based on the following schedule:
April 1, 2013 | $ | 0.47 | |
June 3, 2013 | $ | 0.47 | |
September 3, 2013 | $ | 0.47 | |
January 2, 2014 | $ | 0.47 | |
64
Stock Performance Chart
This graph compares the cumulative total shareholder return on Walmart's common stock during the five fiscal years ending with fiscal 2015 to the cumulative total returns on the S&P 500 Retailing Index and the S&P 500 Index. The comparison assumes $100 was invested on February 1, 2010, in shares of our common stock and in each of the indices shown and assumes that all of the dividends were reinvested.
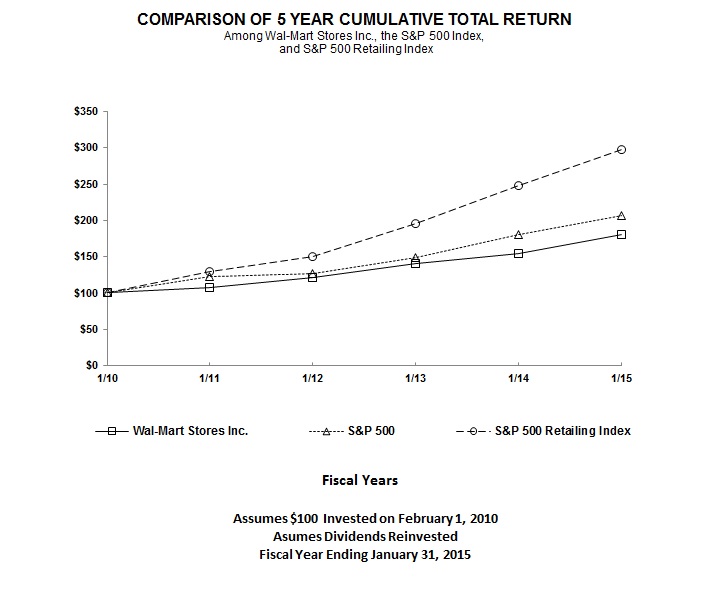
Shareholders
As of March 30, 2015, there were 249,876 holders of record of Walmart's common stock.
65