Attached files
| file | filename |
|---|---|
| EXCEL - IDEA: XBRL DOCUMENT - SIEBERT FINANCIAL CORP | Financial_Report.xls |
| EX-23 - CONSENT OF INDEPENDENT AUDITORS - SIEBERT FINANCIAL CORP | ex_23.htm |
| EX-32.1 - CERTIFICATION - SIEBERT FINANCIAL CORP | ex_32-1.htm |
| EX-31.1 - CERTIFICATION - SIEBERT FINANCIAL CORP | ex_31-1.htm |
|
|
|
|
|
UNITED STATES |
||
|
SECURITIES AND EXCHANGE COMMISSION |
||
|
Washington, D.C. 20549 |
||
|
|
|
|
|
Form 10-K |
||
|
|
||
|
(Mark One) |
||
|
|
||
|
☒ ANNUAL REPORT PURSUANT TO SECTION 13 OR 15(d) |
||
|
OF THE SECURITIES EXCHANGE ACT OF 1934 |
||
|
|
||
|
For the fiscal year ended: December 31, 2014 |
||
|
|
||
|
☐ TRANSITION REPORT PURSUANT TO SECTION 13 OR 15(d) |
||
|
OF THE SECURITIES EXCHANGE ACT OF 1934 |
||
|
|
||
|
For the transition period from______________to________________ |
||
|
|
||
|
Commission file number 0-5703 |
||
|
|
|
|
|
Siebert Financial Corp. |
||
|
(Exact name of registrant as specified in its charter) |
||
|
|
|
|
|
|
|
|
New York |
11-1796714 |
|
|
|
|
885 Third Avenue, New York, New York |
10022 |
|
|
|
|
|
(212) 644-2400 |
||
|
Registrant’s telephone number, including area code |
||
|
|
|
|
|
Securities registered pursuant to Section 12(b) of the Exchange Act: |
||
|
|
|
|
Title of each class |
Name of each exchange on which registered |
|
COMMON STOCK, PAR VALUE $.01 PER SHARE |
THE NASDAQ CAPITAL MARKET |
Securities registered under Section 12(g) of the Exchange Act:
NONE
(Title of class)
Indicate by check mark if the registrant is a well- known seasoned issuer, as defined in Rule 405 of the Securities Act. YES ☐ NO ☒
Indicate by check mark if the registrant is not required to file reports pursuant to Section 13 or Section 15(d) of the Act. YES ☐ NO ☒
Indicate by check mark whether the registrant (1) has filed all reports required to be filed by Section 13 or 15(d) of the Securities Exchange Act of 1934 during the preceding 12 months (or for such shorter period that the registrant was required to file such reports), and (2) has been subject to such filing requirements for the past 90 days. YES ☒ NO ☐
Indicate by check mark whether the registrant has submitted electronically and posted on its corporate Web site, if any, every Interactive Data File required to be submitted and posted pursuant to Rule 405 of Regulation S-T during the preceding 12 months (or for such shorter period that the registrant was required to submit and post such files). YES ☒ NO ☐
Indicate by check mark if disclosure of delinquent filers pursuant to Item 405 of Regulation S-K is not contained herein, and will not be contained, to the best of registrant’s knowledge, in definitive proxy or information statements incorporated by reference in Part III of this Form 10-K or any amendment to this Form 10-K. ☒
Indicate by check mark whether the registrant is a large accelerated filer, an accelerated filer, a non-accelerated filer or a smaller reporting company. See the definitions of “large accelerated filer,” “accelerated filer” and “smaller reporting company” in Rule 12b-2 of the Exchange Act. (Check one):
Large accelerated filer ☐ Accelerated filer ☐ Non-accelerated filer ☐ Smaller reporting company ☒
Indicate by check mark whether the registrant is a shell company (as defined in Rule 12b-2 of the Act). YES ☐ NO ☒
The aggregate market value of the Common Stock held by non-affiliates of the registrant (based upon the last sale price of the Common Stock reported on the NASDAQ Capital Market as of the last business day of the registrant’s most recently completed second fiscal quarter (June 30, 2014), was $5,517,182.
The number of shares of the registrant’s outstanding Common Stock, as of March 13, 2015, was 22,085,126 shares.
Documents Incorporated by Reference: Definitive Proxy Statement to be filed pursuant to Regulation 14A of the Exchange Act on or before April 30, 2015 is incorporated by reference into Part III.
Special Note Regarding Forward-Looking Statements
Statements in this Annual Report on Form 10-K, as well as oral statements that may be made by the Company or by officers, directors or employees of the Company acting on the Company’s behalf, that are not statements of historical or current fact constitute “forward looking statements” within the meaning of the Private Securities Litigation Reform Act of 1995. Such forward looking statements involve risks and uncertainties and known and unknown factors that could cause the actual results of the Company to be materially different from historical results or from any future results expressed or implied by such forward looking statements, including without limitation: changes in general economic and market conditions; changes and prospects for changes in interest rates; fluctuations in volume and prices of securities; demand for brokerage and investment banking services; competition within and without the discount brokerage business, including the offer of broader services; competition from electronic discount brokerage firms offering greater discounts on commissions than the Company; the prevalence of a flat fee environment; decline in participation in corporate or municipal finance underwritings; limited trading opportunities; the method of placing trades by the Company’s customers; computer and telephone system failures; the level of spending by the Company on advertising and promotion; trading errors and the possibility of losses from customer non-payment of amounts due; other increases in expenses and changes in net capital or other regulatory requirements. We undertake no obligation to publicly release the results of any revisions to these forward-looking statements which may be made to reflect events or circumstances after the date when such statements were made or to reflect the occurrence of unanticipated events. An investment in us involves various risks, including those mentioned above and those which are detailed from time to time in our Securities and Exchange Commission filings.
- 2 -
PART I
|
|
|
|
Item 1. |
BUSINESS |
General
Siebert Financial Corp. is a holding company that conducts its retail discount brokerage and investment banking business through its wholly-owned subsidiary, Muriel Siebert & Co., Inc., a Delaware corporation. In addition, in 2014 we began business as a registered investment advisor through our wholly-owned subsidiary, Siebert Investment Advisors, Inc. The estate of Muriel F. Siebert, our former Chairwoman, Chief Executive Officer and President, owns approximately 90% of our outstanding common stock, par value $.01 per share (the “Common Stock”). For purposes of this Annual Report, the terms “Siebert,” “Company,” “we,” “us” and “our” refer to Siebert Financial Corp. and its consolidated subsidiaries, unless the context otherwise requires.
Our principal offices are located at 885 Third Avenue, New York, New York 10022, and our phone number is (212) 644-2400. Our Internet address is www.siebertnet.com. Our SEC filings are available through our website at www.siebertnet.com, where you are able to obtain copies of the Company’s public filings free of charge. Our Common Stock trades on the NASDAQ Capital Market under the symbol “SIEB”.
Business Overview
Siebert’s principal activity is providing online and traditional discount brokerage and related services to retail investors. In addition, Siebert, Brandford, Shank Financial, L.L.C. (“SBSF”), a company in which Siebert holds a 49% ownership interest, is the largest Minority and Women’s Business Enterprise (“MWBE”) in the tax-exempt underwriting business in the United States.
The Retail Division
Discount Brokerage and Related Services. Siebert became a discount broker on May 1, 1975. Siebert believes that it has been in business and a member of The New York Stock Exchange, Inc. (the “NYSE”) longer than any other discount broker. In 1998, Siebert began to offer its customers access to their accounts through SiebertNet, its Internet website. Siebert’s focus in its discount brokerage business is to serve retail clients seeking a wide selection of quality investment services, including trading through a broker on the telephone, through a wireless device or via the Internet, at commissions that are substantially lower than those of full-commission firms. Siebert clears its securities transactions on a fully disclosed basis through National Financial Services Corp. (“NFS”), a wholly owned subsidiary of Fidelity Investments.
Siebert serves investors who make their own investment decisions. Siebert seeks to assist its customers in their investment decisions by offering a number of value added services, including easy access to account information. Siebert’s representatives are available to assist customers with information via toll-free 800 service Monday through Friday between 7:30 a.m. and 7:30 p.m. Eastern Time. Through its SiebertNet, Mobile Broker, inter-active voice recognition and Siebert Brokerage Express services, 24-hour access is available to customers.
Independent Retail Execution Services. Siebert and our clearing agent monitor order flow in an effort to ensure that we are getting the best possible trade executions for customers. Siebert does not make markets in securities, nor does it take positions against customer orders.
Siebert’s equity orders are routed by its clearing agent in a manner intended to afford its customers the opportunity for price improvement on all orders. The firm also offers customers execution services through various electronic communication networks (“ECNs”) for an additional fee. These systems give customers access to numerous ECNs before and after regular market hours. Siebert believes that its over-the counter executions consistently afford its customers the opportunity for price improvement.
Customers may also indicate online interest in buying or selling fixed income securities, including municipal bonds, corporate bonds, mortgage-backed securities, government sponsored enterprises, unit investment trusts or certificates of deposit. These transactions are serviced by registered representatives.
Retail Customer Service. Siebert believes that superior customer service enhances its ability to compete with larger discount brokerage firms and therefore provides retail customers, at no additional charge, with personal service via toll-free access to dedicated customer support personnel for all of its products and services. Customer service personnel are located in each of Siebert’s branch offices. Siebert has retail offices in New York, New York; Jersey City, New Jersey; Boca Raton, Florida; and Beverly Hills, California. Siebert uses a proprietary Customer Relationship Management System that enables representatives, no matter where located, to view a customer’s service requests and the response thereto. Siebert’s telephone system permits the automatic routing of calls to the next available agent having the appropriate skill set.
Retirement Accounts. Siebert offers customers a variety of self-directed retirement accounts for which it acts as agent on all transactions. Custodial services are provided through an affiliate of NFS, the firm’s clearing agent, which also serves as trustee for such accounts. Each IRA, SEP IRA, ROTH IRA, 401(k) and KEOGH account can be invested in mutual funds, stocks, bonds and other investments in a consolidated account.
Customer Financing. Customer’s margin accounts are carried through Siebert’s clearing agent which lends customers a portion of the market value of certain securities held in the customer’s account. Margin loans are collateralized by these securities.
- 3 -
Customers also may sell securities short in a margin account, subject to minimum equity and applicable margin requirements, and the availability of such securities to be borrowed. In permitting customers to engage in margin, short sale or any other transaction, Siebert assumes the risk of its customers’ failure to meet their obligations in the event of adverse changes in the market value of the securities positions. Both Siebert and its clearing agents reserve the right to set margin requirements higher than those established by the Federal Reserve Board.
Siebert has established policies with respect to maximum purchase commitments for new customers or customers with inadequate collateral to support a requested purchase. Managers have some flexibility in the allowance of certain transactions. When transactions occur outside normal guidelines, Siebert monitors accounts closely until their payment obligations are completed; if the customer does not meet the commitment, Siebert takes steps to close out the position and minimize any loss. Siebert has not had significant credit losses in the last five years.
Information and Communications Systems. Siebert relies heavily on the data technology platform provided by its clearing agent, NFS. This platform offers an interface to NFS’ main frame computing system where all customer account records are kept and is accessible by Siebert’s network. Siebert’s systems also utilize browser based access and other types of data communications. Siebert’s representatives use NFS systems, by way of Siebert’s technology platform, to perform daily operational functions which include trade entry, trade reporting, clearing related activities, risk management and account maintenance.
Siebert’s data technology platform offers services used in direct relation to customer related activities as well as support for corporate use. Some of these services include email and messaging, market data systems and third party trading systems, business productivity tools and customer relationship management systems. Siebert’s branch offices are connected to the main offices in New York, New York and Jersey City, New Jersey via a virtual private network. Siebert’s data network is designed with redundancy in case a significant business disruption occurs.
Siebert’s voice network offers a call center feature that can route and queue calls for certain departments within the organization. Additionally, the systems call manager offers reporting and tracking features which enable staff to determine how calls are being managed, such as time on hold, call duration and total calls by agent.
To ensure reliability and to conform to regulatory requirements related to business continuity, Siebert maintains backup systems and backup data. However, in the event of a wide-spread disruption, such as a massive natural disaster, Siebert’s ability to satisfy the obligations to customers and other securities firms could be significantly hampered or completely disrupted. For more information regarding Siebert’s Business Continuity Plan, please visit our website at www.siebertnet.com or write to us at Muriel Siebert & Co., Inc., Compliance Department, 885 Third Avenue, Suite 3100, New York, NY 10022.
Our website has design, navigation, and functionality features such as:
|
|
|
|
|
|
▪ |
Informative trading screens: Customers can stay in touch while trading, double-check balances, positions and order status, see real time quotes, intraday and annual charts and news headlines – automatically – as they place orders. |
|
|
|
|
|
|
▪ |
Multiple orders: Customers can place as many as 10 orders at one time. |
|
|
|
|
|
|
▪ |
Tax-lot trading: Our online equity order entry screen allows customers to specify tax lots which display with cost basis and current gain/loss on a real-time positions page. |
|
|
|
|
|
|
▪ |
Trailing stop orders: Customers can enter an order that trails the market as a percentage of share price or with a flat dollar value and the system will execute their instructions automatically. |
|
|
|
|
|
|
▪ |
Contingent orders: Customers can place One-Triggers-Two Bracket and One-Cancels-Other Bracket orders. |
|
|
|
|
|
|
▪ |
An easy-to-install desktop security program that may be installed to help protect against certain types of online fraud such as “keylogging” and “phishing.” |
- 4 -
The Capital Markets Division
Siebert’s Capital Markets Group (“SCM”) division served the Company as a co-manager, underwriting syndicate member, or selling group member on a wide spectrum of securities offerings for corporations and Federal agencies. The principal activities of SCM were investment banking and institutional equity execution services. SCM provided Muriel Siebert & Co., Inc. high-quality brokerage service to both institutional investors and issuers of equity and fixed-income securities.
On November 4, 2014, the Company, which held a 49% membership interest in, and the other members of, Siebert Brandford Shank & Co., LLC (“SBS”), contributed their SBS membership interests into a newly formed Delaware limited liability company, Siebert Brandford Shank Financial, L.L.C. (“SBSF”), in exchange for the same percentage interests in SBSF. On the same day, the Company entered into an Asset Purchase Agreement (the “Purchase Agreement”) with SBS and SBSF, pursuant to which the Company sold substantially all of the SCM assets to SBSF. Pursuant to the Purchase Agreement, SBSF assumed post-closing liabilities relating to the transferred business.
The Purchase Agreement provides for an aggregate purchase price for the disposition of $3,000,000, payable by SBSF after closing in annual installments commencing on March 1, 2016 and continuing on each of March 1, 2017, 2018, 2019 and 2020. The transferred business was contributed by SBSF to, and operated by SBS. The amount payable to the Company on each annual payment date will equal 50% of the net income attributable to the transferred business recognized by SBS in accordance with generally accepted accounting principles during the fiscal year ending immediately preceding the applicable payment date; provided that, if net income attributable to the transferred business generated prior to the fifth annual payment date is insufficient to pay the remaining balance of the purchase price in full on the fifth annual payment date, then the unpaid amount of the purchase price will be paid in full on March 1, 2021.
Transferred assets of SCM, consisted of customer accounts and goodwill, which had no carrying value to the Company, and the Company recorded a gain on sale of $1,820,000, which reflected the fair value of the purchase obligation. Such fair value was based on the present value of estimated annual installments to be received during 2016 through 2020 from forecasted net income of the transferred business plus a final settlement in 2021, discounted at 11.5% (representing SBS’s weighted average cost of capital).
The discount recorded for the purchase obligation will be amortized as interest income using an effective yield initially calculated based on the original carrying amount of the obligation and estimated annual installments to be received and adjusted in future periods to reflect actual installments received and changes in estimates of future installments. Interest income recognized on the obligation for the period from November 4, 2014 to December 31, 2014 amounted to approximately $37,000 based on a yield of approximately 12%.
As a result of the Company’s continuing involvement in the capital markets business through its 49% ownership in SBSF, results of operations of the capital market business and the gain on sale were not reflected as discontinued operations in the accompanying financial statements.
Siebert, Brandford, Shank Financial, L.L.C.
Muriel Siebert & Co., Inc. (“Siebert”) owns 49% of Siebert, Brandford, Shank Financial, L.L.C. (“SBSF”). The remaining 51% is owned by Napoleon Brandford III and Suzanne F. Shank. SBSF has been serving the public sector and growing the firm since 1996. SBSF provides municipal underwriting and financial advisory services to state and local governments across the nation for the funding of education, housing, health services, transportation, utilities, capital facilities, redevelopment and general infrastructure projects, serving important issuers across the nation. SBSF has offices across the nation. With the purchase discussed above SBSF will serve as a co-manager, underwriting syndicate member, or selling group member on a wide spectrum of securities offerings for corporations and Federal agencies. The principal activities of SCM, purchased as described above, are investment banking and institutional equity execution services which provide high-quality brokerage service to both institutional investors and issuers of equity and fixed-income securities.
Effective April 19, 2005, Siebert Financial Corp. (“SFC”) entered into an Operating Agreement with Suzanne Shank and Napoleon Brandford III, the two individual principals (the “Principals”) of SBS Financial Products Company, LLC, a Delaware limited liability company (“SBSFPC”). Pursuant to the terms of the Operating Agreement, SFC and each of the Principals made an initial capital contribution of 33.33% initial interest in SBSFPC. SBSFPC engaged in derivatives transactions related to the municipal underwriting business. SBSFPC closed down operations as of December 31, 2014.
Certain risks are involved in the underwriting of securities. Underwriting syndicates agree to purchase securities at a discount from the initial public offering price. An underwriter is exposed to losses on the securities that it has committed to purchase if the securities must be sold below the cost to the syndicate. In the last several years, investment banking firms have increasingly underwritten corporate and municipal offerings with fewer syndicate participants or, in some cases, without an underwriting syndicate.
In these cases, the underwriter assumes a larger part or all of the risk of an underwriting transaction. Under Federal securities laws, other laws and court decisions, an underwriter is exposed to substantial potential liability for material misstatements or omissions of fact in the prospectus used to describe the securities being offered.
Siebert Investment Advisors, Inc.
Siebert Investment Advisors Inc. (“SIA”) is a registered investment adviser that began business in 2014. SIA is a wholly owned subsidiary of Siebert Financial Corp and affiliated with Muriel Siebert & Co., a registered broker dealer. SIA is a boutique investment management firm that greatly extends our ability to meet our customer’s investment needs.
SIA offers advice to clients regarding asset allocation and the selection of investments. Our investment management services include the design, implementation, and continued monitoring of client accounts on a discretionary or non-discretionary basis. Investment selections and recommendation are guided by the stated objectives of the customer, other considerations include the customer’s risk profile and financial status.
SIA offers to its clients a number of Asset Management Programs (“Managed Programs”) consisting of asset allocation, flexible asset management and focused or completion strategies. In these Managed Programs, SIA acts as the co-adviser to clients. IA Representatives will assist each client in reviewing information about the programs, completing a client questionnaire to determine the client's risk tolerance, financial situation and investment objectives and selecting an investment strategy. SIA does not ever act as portfolio manager directly; SIA selects other investment advisers to act as portfolio manager on behalf of its clients.
- 5 -
Advertising, Marketing and Promotion
Siebert develops and maintains its retail customer base through printed advertising in financial publications, broadcast commercials over national and local cable TV channels. Additionally, a significant number of the firm’s new accounts are developed directly from referrals by satisfied customers.
Competition
Siebert encounters significant competition from full-commission, online and discount brokerage firms, as well as from financial institutions, mutual fund sponsors and other organizations, many of which are significantly larger and better capitalized than Siebert. Although there has been consolidation in the industry in both the online and traditional brokerage business during recent years, Siebert believes that additional competitors such as banks, insurance companies, providers of online financial and information services and others will continue to be attracted to the online brokerage industry. Many of these competitors are larger, more diversified, have greater capital resources, and offer a wider range of services and financial products than Siebert. Some of these firms are offering their services over the Internet and have devoted more resources to and have more elaborate websites than Siebert. Siebert competes with a wide variety of vendors of financial services for the same customers. Siebert believes that its main competitive advantages are high quality customer service, responsiveness, cost and products offered, the breadth of product line and excellent executions.
Regulation
The securities industry in the United States is subject to extensive regulation under both Federal and state laws. The Securities and Exchange Commission (“SEC”) is the Federal agency charged with administration of the Federal securities laws. Siebert is registered as a broker-dealer with the SEC, and is a member of the New York Stock Exchange (“NYSE”) and the Financial Industry Regulatory Authority (“FINRA”). Much of the regulation of broker-dealers has been delegated to self-regulatory organizations, principally FINRA and national securities exchanges such as the NYSE, which is Siebert’s primary regulator with respect to financial and operational compliance. These self-regulatory organizations adopt rules (subject to approval by the SEC) governing the industry and conduct periodic examinations of broker-dealers. Securities firms are also subject to regulation by state securities authorities in the states in which they do business. Siebert is registered as a broker-dealer in 50 states, the District of Columbia and Puerto Rico.
The principal purpose of regulation and discipline of broker-dealers is the protection of customers and the securities markets, rather than protection of creditors and stockholders of broker-dealers. The regulations to which broker-dealers are subject cover all aspects of the securities business, including training of personnel, sales methods, trading practices among broker-dealers, uses and safekeeping of customers’ funds and securities, capital structure of securities firms, record keeping, fee arrangements, disclosure to clients, and the conduct of directors, officers and employees. Additional legislation, changes in rules promulgated by the SEC and by self-regulatory organizations or changes in the interpretation or enforcement of existing laws and rules may directly affect the method of operation and profitability of broker-dealers. The SEC, self-regulatory organizations and state securities authorities may conduct administrative proceedings which can result in censure, fine, cease and desist orders or suspension or expulsion of a broker-dealer, its officers or its employees.
As a registered broker-dealer and FINRA member organization, Siebert is required by Federal law to belong to the Securities Investor Protection Corporation (“SIPC”) which provides, in the event of the liquidation of a broker-dealer, protection for securities held in customer accounts held by the firm of up to $500,000 per customer, subject to a limitation of $250,000 on claims for cash balances. SIPC is funded through assessments on registered broker-dealers. In addition, Siebert, through its clearing agent, has purchased from private insurers additional account protection in the event of liquidation up to the net asset value, as defined, of each account. Stocks, bonds, mutual funds and money market funds are included at net asset value for purposes of SIPC protection and the additional protection. Neither SIPC protection nor the additional protection insures against fluctuations in the market value of securities.
Siebert is also authorized by the Municipal Securities Rulemaking Board (the “MSRB”) to effect transactions in municipal securities on behalf of its customers and has obtained certain additional registrations with the SEC and state regulatory agencies necessary to permit it to engage in certain other activities incidental to its brokerage business.
Margin lending arranged by Siebert is subject to the margin rules of the Board of Governors of the Federal Reserve System and the NYSE. Under such rules, broker-dealers are limited in the amount they may lend in connection with certain purchases and short sales of securities and are also required to impose certain maintenance requirements on the amount of securities and cash held in margin accounts. In addition, those rules and rules of the Chicago Board Options Exchange govern the amount of margin customers must provide and maintain in writing uncovered options.
- 6 -
Net Capital Requirements
As a registered broker-dealer, Siebert is subject to the SEC’s Uniform Net Capital Rule (Rule 15c3-1) (the “Net Capital Rule”), which has also been adopted by the NYSE. The Net Capital Rule specifies minimum net capital requirements for all registered broker-dealers and is designed to measure financial integrity and liquidity. Failure to maintain the required regulatory net capital may subject a firm to suspension or expulsion by the NYSE and FINRA, certain punitive actions by the SEC and other regulatory bodies and, ultimately, may require a firm’s liquidation.
Regulatory net capital is defined as net worth (assets minus liabilities), plus qualifying subordinated borrowings, less certain deductions that result from excluding assets that are not readily convertible into cash and from conservatively valuing certain other assets. These deductions include charges that discount the value of security positions held by Siebert to reflect the possibility of adverse changes in market value prior to disposition.
The Net Capital Rule requires notice of equity capital withdrawals to be provided to the SEC prior to and subsequent to withdrawals exceeding certain sizes. The Net Capital Rule also allows the SEC, under limited circumstances, to restrict a broker-dealer from withdrawing equity capital for up to 20 business days. The Net Capital Rule of the NYSE also provides that equity capital may not be drawn or cash dividends paid if resulting net capital would be less than 5 percent of aggregate debits.
Under applicable regulations, Siebert is required to maintain regulatory net capital of at least $250,000. At December 31, 2014 and 2013, Siebert had net capital of $5.1 million and $13.0 million, respectively. Siebert claims exemption from the reserve requirement under Section 15c3-3(k)(2)(ii).
Employees
As of March 13, 2015, we had approximately 48 full-time employees, one of whom was a corporate officer. None of our employees is represented by a union, and we believe that relations with our employees are good.
- 7 -
|
|
|
|
Item 1A. |
RISK FACTORS |
Securities market volatility and other securities industry risk could adversely affect our business
Most of our revenues are derived from our securities brokerage business. Like other businesses operating in the securities industry, our business is directly affected by volatile trading markets, fluctuations in the volume of market activity, economic and political conditions, upward and downward trends in business and finance at large, legislation and regulation affecting the national and international business and financial communities, currency values, inflation, market conditions, the availability and cost of short-term or long-term funding and capital, the credit capacity or perceived credit-worthiness of the securities industry in the marketplace and the level and volatility of interest rates. We also face risks relating to trading losses, losses resulting from the ownership or underwriting of securities, counterparty failure to meet commitments, customer fraud, employee fraud, issuer fraud, errors and misconduct, failures in connection with the processing of securities transactions and litigation. A reduction in our revenues or a loss resulting from our underwriting or ownership of securities or sales or trading of securities could have a material adverse effect on our business, results of operations and financial condition. In addition, as a result of these risks, our revenues and operating results may be subject to significant fluctuations from quarter to quarter and from year to year.
Lower price levels in the securities markets may reduce our profitability.
Lower price levels of securities may result in (i) reduced volumes of securities, options and futures transactions, with a consequent reduction in our commission revenues, and (ii) losses from declines in the market value of securities we held in investment and underwriting positions. In periods of low volume, our levels of profitability are further adversely affected because certain of our expenses remain relatively fixed. Sudden sharp declines in market values of securities and the failure of issuers and counterparties to perform their obligations can result in illiquid markets which, in turn, may result in our having difficulty selling securities. Such negative market conditions, if prolonged, may also lower our revenues from investment banking and other activities. A reduction in our revenues from investment banking or other activities could have a material adverse affect on our business, results of operations and financial condition.
There is intense competition in the brokerage industry.
Siebert encounters significant competition from full-commission, online and other discount brokerage firms, as well as from financial institutions, mutual fund sponsors and other organizations many of which are significantly larger and better capitalized than Siebert. SBS also encounters significant competition from firms engaged in the municipal finance business. Over the past several years, price wars and lower commission rates in the discount brokerage business in general have strengthened our competitors. Siebert believes that such changes in the industry will continue to strengthen existing competitors and attract additional competitors such as banks, insurance companies, providers of online financial and information services, and others. Many of these competitors are larger, more diversified, have greater capital resources, and offer a wider range of services and financial products than Siebert. Siebert competes with a wide variety of vendors of financial services for the same customers. Siebert may not be able to compete effectively with current or future competitors.
Some competitors in the discount brokerage business offer services which we may not. In addition, some competitors have continued to offer lower flat rate execution fees that are difficult for any conventional discount firm to meet. Industry-wide changes in trading practices are expected to cause continuing pressure on fees earned by discount brokers for the sale of order flow. Many of the flat fee brokers impose charges for services such as mailing, transfers and handling exchanges which Siebert does not and also direct their execution to captive market makers. Continued or increased competition from ultra low cost, flat fee brokers and broader service offerings from other discount brokers could limit our growth or lead to a decline in Siebert’s customer base which would adversely affect our business, results of operations and financial condition.
We are subject to extensive government regulation.
Our business is subject to extensive regulation in the United States, at both the Federal and state level. We are also subject to regulation by self–regulatory organizations and other regulatory bodies in the United States, such as the SEC, the NYSE, FINRA and the MSRB. We are registered as a broker-dealer in 50 states, the District of Columbia and Puerto Rico. The regulations to which we are subject as a broker-dealer cover all aspects of the securities business including: training of personnel, sales methods, trading practices, uses and safe keeping of customers’ funds and securities, capital structure, record keeping, fee arrangements, disclosure and the conduct of directors, officers and employees. Failure to comply with any of these laws, rules or regulations, which may be subject to the uncertainties of interpretation, could result in civil penalties, fines, suspension or expulsion and have a material adverse effect on our business, results of operations and financial condition.
- 8 -
The laws, rules and regulations, as well as governmental policies and accounting principles, governing our business and the financial services and banking industries generally have changed significantly over recent years and are expected to continue to do so. We cannot predict which changes in laws, rules, regulations, governmental policies or accounting principles will be adopted. Any changes in the laws, rules, regulations, governmental policies or accounting principles relating to our business could materially and adversely affect our business, results of operations and financial condition.
We are subject to net capital requirements.
The SEC, FINRA, and various other securities and commodities exchanges and other regulatory bodies in the United States have rules with respect to net capital requirements which affect us. These rules have the effect of requiring that at least a substantial portion of a broker-dealer’s assets be kept in cash or highly liquid investments. Our compliance with the net capital requirements could limit operations that require intensive use of capital, such as underwriting or trading activities. These rules could also restrict our ability to withdraw our capital, even in circumstances where we have more than the minimum amount of required capital, which, in turn, could limit our ability to implement growth strategies. In addition, a change in such rules, or the imposition of new rules, affecting the scope, coverage, calculation or amount of such net capital requirements, or a significant operating loss or any unusually large charge against net capital, could have similar adverse effects.
Our customers may fail to pay us.
A principal credit risk to which we are exposed on a regular basis is that our customers may fail to pay for their purchases or fail to maintain the minimum required collateral for amounts borrowed against securities positions maintained by them. We cannot assure you that the policies and procedures we have established will be adequate to prevent a significant credit loss.
We face risks relating to our investment banking activities.
Certain risks are involved in the underwriting of securities. Investment banking and underwriting syndicates agree to purchase securities at a discount from the public offering price. If the securities must be sold below the syndicate cost, an underwriter is exposed to losses on the securities that it has committed to purchase. In the last several years, investment banking firms increasingly have underwritten corporate and municipal offerings with fewer syndicate participants or, in some cases, without an underwriting syndicate. In these cases, the underwriter assumes a larger part or all of the risk of an underwriting transaction.
Under Federal securities laws, other laws and court decisions, an underwriter is exposed to substantial potential liability for material misstatements or omissions of fact in the prospectus used to describe the securities being offered. While municipal securities are exempt from the registration requirements of the Securities Act of 1933, underwriters of municipal securities are exposed to substantial potential liability for material misstatements or omissions of fact in the offering documents prepared for these offerings.
An increase in volume on our systems or other events could cause them to malfunction.
During 2014, we received and processed up to approximately 67% of our trade orders electronically. This method of trading is heavily dependent on the integrity of the electronic systems supporting it. While we have never experienced a significant failure of our trading systems, heavy stress placed on our systems during peak trading times could cause our systems to operate at unacceptably low speeds or fail altogether. Any significant degradation or failure of our systems or the systems of third parties involved in the trading process (e.g., online and Internet service providers, record keeping and data processing functions performed by third parties, and third party software), even for a short time, could cause customers to suffer delays in trading. These delays could cause substantial losses for customers and could subject us to claims from these customers for losses. There can be no assurance that our network structure will operate appropriately in the event of a subsystem, component or software failure. In addition, we cannot assure you that we will be able to prevent an extended systems failure in the event of a power or telecommunications failure, an earthquake, terrorist attack, fire or any act of God. Any systems failure that causes interruptions in our operations could have a material adverse effect on our business, financial condition and operating results.
We rely on information processing and communications systems to process and record our transactions.
Our operations rely heavily on information processing and communications systems. Our system for processing securities transactions is highly automated. Failure of our information processing or communications systems for a significant period of time could limit our ability to process a large volume of transactions accurately and rapidly. This could cause us to be unable to satisfy our obligations to customers and other securities firms, and could result in regulatory violations. External events, such as an earthquake, terrorist attack or power failure, loss of external information feeds, such as security price information, as well as internal malfunctions such as those that could occur during the implementation of system modifications, could render part or all of these systems inoperative.
- 9 -
We may not be able to keep up pace with continuing changes in technology.
Our market is characterized by rapidly changing technology. To be successful, we must adapt to this rapidly changing environment by continually improving the performance, features and reliability of our services. We could incur substantial costs if we need to modify our services or infrastructure or adapt our technology to respond to these changes. A delay or failure to address technological advances and developments or an increase in costs resulting from these changes could have a material and adverse effect on our business, financial condition and results of operations.
We depend on our ability to attract and retain key personnel.
Our continued success was principally dependent on our founder, Muriel F. Siebert, our former Chairwoman, Chief Executive Officer and President, and our senior management. In addition, the continued success of SBSF may be dependent on the services of Napoleon Brandford III and Suzanne Shank. The loss of the services of any of these individuals could significantly harm our business, financial condition and operating results. However the appointment of Suzanne Shank as Acting Chief Executive Officer and Joseph Ramos as Chief Operating Officer has stabilized the Company as a result of our loss of Ms. Siebert. On March 3, 2015 Suzanne Shank completed her role as acting Chief Executive Officer of our Company to devote full time to her continuing position as Chief Executive Officer of SBSF.
Our principal shareholder may control many key decisions.
The estate of Ms. Muriel F. Siebert currently owns approximately 90% of our outstanding common stock. The executors of the estate, Jane Macon and Patricia Francy, who are both directors of the Company, have the power to elect the entire Board of Directors and, except as otherwise provided by law or our Certificate of Incorporation or by-laws, to approve any action requiring shareholder approval without a shareholders meeting.
There may be no public market for our common stock.
Only approximately 2,200,000 shares, or approximately 10% of our shares outstanding, are currently held by the public. Although our common stock is traded in The NASDAQ Capital Market, there can be no assurance that an active public market will continue.
|
|
|
|
Item 1B. |
UNRESOLVED STAFF COMMENTS |
None.
|
|
|
|
Item 2. |
PROPERTIES |
Siebert currently maintains four retail discount brokerage offices. Customers can visit these offices to obtain market information, place orders, open accounts, deliver and receive checks and securities, and obtain related customer services in person. Nevertheless, most of Siebert’s activities are conducted on the Internet or by telephone and mail.
- 10 -
Siebert operates its business out of the following four leased offices:
|
|
|
|
|
|
|
|
|
|
|
|
|
Location |
|
Approximate |
|
Expiration Date |
|
Renewal |
|
|||
|
|
|
|
|
|
|
|
|
|
|
|
|
Corporate Headquarters, Retail and Investment Banking Office |
|
|
|
|
|
|
|
|
|
|
|
885 Third Avenue |
|
|
|
|
|
|
|
|
|
|
|
New York, NY 10022 |
|
|
8,585 |
|
|
2/28/17 |
|
|
None |
|
|
|
|
|
|
|
|
|
|
|
|
|
|
Retail Offices |
|
|
|
|
|
|
|
|
|
|
|
|
|
|
|
|
|
|
|
|
|
|
|
9701 Wilshire Boulevard, Suite 1111 |
|
|
|
|
|
|
|
|
|
|
|
Beverly Hills, CA 90212 |
|
|
1,189 |
|
|
10/31/15 |
|
|
None |
|
|
|
|
|
|
|
|
|
|
|
|
|
|
4400 North Federal Highway |
|
|
|
|
|
|
|
|
|
|
|
Boca Raton, FL 33431 |
|
|
2,438 |
|
|
Month to Month |
|
|
None |
|
|
|
|
|
|
|
|
|
|
|
|
|
|
111 Pavonia Avenue(1) |
|
|
|
|
|
|
|
|
|
|
|
Jersey City, NJ 07310 |
|
|
8,141 |
|
|
6/30/15 |
|
|
None |
|
|
|
|
|
|
|
|
|
|
|
|
|
|
|
|
|
|
(1) |
Certain of our administrative and back office functions are performed at this location. We believe that our properties are in good condition and are suitable for our operations. |
|
|
|
|
|
Item 3. |
LEGAL PROCEEDINGS |
In 2012, Siebert was named as one of the defendants in a class action pending in the United States District Court, Southern District of New York. The complaint was brought on behalf of a class of purchasers in a public offering by Lehman Brothers Holdings, Inc. of $1,500,000,000 of 6.75% Subordinated Notes due 2017 (the “Notes”) as to Siebert and certain smaller issuances of other securities. The complaint asserted that Siebert and other underwriters of the Notes violated Section 11 of the Securities Act of 1933 in that relevant offering materials were false and misleading. Siebert had agreed to purchase $15 million of the Notes and $462,953 of the other securities as an underwriter in the offerings. Siebert and the plaintiffs’ class agreed to resolve all claims against Siebert in consideration of a $1 million payment by Siebert in the prior year. Certain plaintiffs did not agree to a settlement or purchased securities which were not covered by the settlement. In 2013 all such claims were either dismissed or settled for an amount that was not material.
In July 2014, the Company entered into a settlement agreement in regards to a dispute with a former employee, in which the former employee sought, among other things, damages arising from his separation from the Company. The Company asserted counter claims in the arbitration. Pursuant to the settlement, the Company paid $4,300,000 to the former employee, and the claims and counterclaims have been dismissed and released. The accompanying statement of operations reflects a change to give effect to the settlement.
The Company is party to certain claims, suits and complaints arising in the ordinary course of business. In the opinion of management, all such matters are without merit, or involve amounts which would not have a significant effect on the financial position of the Company.
|
|
|
|
Item 4. |
MINE SAFETY DISCLOSURES |
Not applicable
- 11 -
PART II
|
|
|
|
Item 5. |
MARKET FOR REGISTRANT’S COMMON EQUITY, RELATED STOCKHOLDER MATTERS AND ISSUER PURCHASES OF EQUITY SECURITIES |
Our common stock traded on the NASDAQ Global Market until June 29, 2011 when our common stock started trading on the NASDAQ Capital Market, under the symbol “SIEB”. The high and low sales prices of our common stock reported by NASDAQ during the following calendar quarters were:
|
|
|
|
|
|
|
|
|
|
|
|
High |
|
Low |
|
||
|
First Quarter - 2013 |
|
$ |
1.81 |
|
$ |
1.27 |
|
|
|
|
|
|
|
|
|
|
|
Second Quarter - 2013 |
|
$ |
1.75 |
|
$ |
1.35 |
|
|
|
|
|
|
|
|
|
|
|
Third Quarter - 2013 |
|
$ |
1.82 |
|
$ |
1.39 |
|
|
|
|
|
|
|
|
|
|
|
Fourth Quarter - 2013 |
|
$ |
1.77 |
|
$ |
1.43 |
|
|
|
|
|
|
|
|
|
|
|
First Quarter – 2014 |
|
$ |
4.45 |
|
$ |
1.61 |
|
|
|
|
|
|
|
|
|
|
|
Second Quarter – 2014 |
|
$ |
3.44 |
|
$ |
2.67 |
|
|
|
|
|
|
|
|
|
|
|
Third Quarter – 2014 |
|
$ |
2.85 |
|
$ |
2.05 |
|
|
|
|
|
|
|
|
|
|
|
Fourth Quarter – 2014 |
|
$ |
2.90 |
|
$ |
2.03 |
|
On March 13, 2015, the closing price of our common stock on the NASDAQ Capital Market was $1.70 per share. There were 130 holders of record of our common stock and more than 1,500 beneficial owners of our common stock on March 13, 2015.
On January 4, 2011, we received notice from The NASDAQ Stock Market stating that for more than 30 consecutive business days, the market value of publicly held shares closed below the minimum $5 million required for continued listing on The NASDAQ Global Market under NASDAQ Rule 5450(b)(1)(C). Market value of publicly held shares is calculated by multiplying the publicly held shares, which is total shares outstanding less any shares held by officers, directors, or beneficial owners of more than 10%, by the closing bid price. The estate of Muriel F. Siebert owns approximately 90% of our outstanding common stock. The value of shares by the estate of Muriel F. Siebert’s estate, and the value of shares beneficially owned by other officers and directors of the Company, is therefore excluded from the market value of publicly held shares of the Company.
NASDAQ Rule 5810(c)(3)(D) provided the Company a grace period of 180 calendar days, or until July 5, 2011, to regain compliance with The NASDAQ Stock Market requirement. As the market value of publicly held shares did not reach the required value during the grace period, our common stock was transferred to the NASDAQ Capital Market on June 29, 2011.
Dividend Policy
Our Board of Directors periodically considers whether to declare dividends. In considering whether to pay such dividends, our Board of Directors will review our earnings capital requirements, economic forecasts and such other factors as are deemed relevant. Some portion of our earnings will be retained to provide capital for the operation and expansion of our business.
Issuer Purchases of Equity Securities
On January 23, 2008, our Board of Directors authorized the repurchase of up to 300,000 shares of our common stock. We will purchase shares from time to time, in our discretion, in the open market and in private transactions. No shares were purchased in 2014.
- 12 -
A summary of our repurchase activity for the three months ended December 31, 2014 is as follows:
|
|
|
|
|
|
|
|
|
|
|
|
|
|
|
|
Period |
|
Total |
|
Average Price |
|
Cumulative Number |
|
Maximum |
|
||||
|
October 2014 |
|
|
— |
|
$ |
— |
|
|
129,137 |
|
|
170,863 |
|
|
|
|
|
|
|
|
|
|
|
|
|
|
|
|
|
November 2014 |
|
|
— |
|
$ |
— |
|
|
129,137 |
|
|
170,863 |
|
|
|
|
|
|
|
|
|
|
|
|
|
|
|
|
|
December 2014 |
|
|
— |
|
$ |
— |
|
|
129,137 |
|
|
170,863 |
|
|
|
|
|
|
|
|
|
|
|
|
|
|
|
|
|
Total |
|
|
0 |
|
$ |
0 |
|
|
129,137 |
|
|
170,863 |
|
Equity Compensation Plan Information
The following table sets forth information as of December 31, 2014 with respect to our equity compensation plans.
|
|
|
|
|
|
|
|
|
|
|
|
|
Plan Category |
|
Number of Securities to be |
|
Weighted- |
|
Number of Securities |
|
|||
|
|
|
(a) |
|
(b) |
|
(c) |
|
|||
|
Equity compensation plans approved by security holders (1) |
|
|
265,000 |
|
$ |
3.02 |
|
|
1,760,000 |
|
|
|
|
|
|
|
|
|
|
|
|
|
|
Total |
|
|
265,000 |
|
$ |
3.02 |
|
|
1,760,000 |
|
|
|
|
|
(1) Consists of our 1997 and 2007 compensation plans. |
|
- 13 -
|
|
|
|
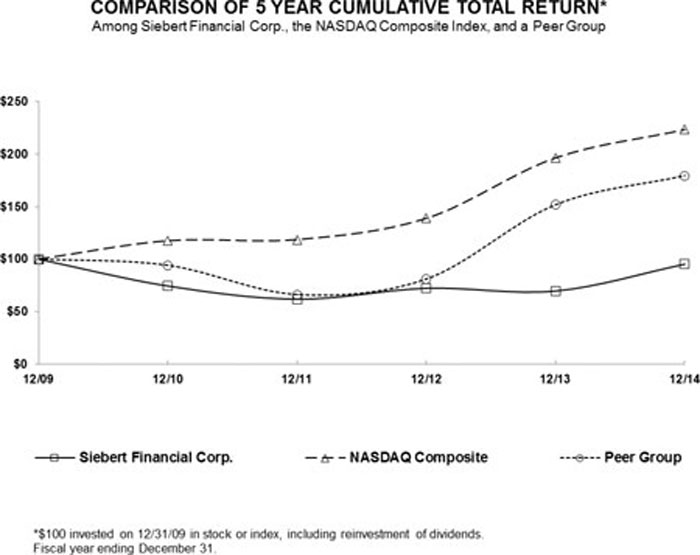
Our Performance |
The graph below compares our performance from December 31, 2009 through December 31, 2014 against the performance of the NASDAQ Composite Index and a peer group. The peer group consists of A.B. Watley Group Inc., Ameritrade Holding Corporation, E*Trade Financial Corporation and The Charles Schwab Corporation. |
- 14 -
|
|
|
|
Item 6. |
SELECTED FINANCIAL DATA |
(In thousands except share and per share data)
The Following Selected Financial Information
Should Be Read In Conjunction with Our Consolidated Financial
Statements and the Related Notes Thereto.
|
|
|
|
|
|
|
|
|
|
|
|
|
|
|
|
|
|
|
|
|
2014 |
|
2013 |
|
2012 |
|
2011 |
|
2010 |
|
|||||
|
Income statement data: |
|
|
|
|
|
|
|
|
|
|
|
|
|
|
|
|
|
Total Revenues |
|
$ |
15,852 |
|
$ |
16,401 |
|
$ |
20,983 |
|
$ |
20,199 |
|
$ |
20,770 |
|
|
Net loss |
|
$ |
(6,557 |
) |
$ |
(5,912 |
) |
$ |
(171 |
) |
$ |
(5,379 |
) |
$ |
(2,640 |
) |
|
|
|
|
|
|
|
|
|
|
|
|
|
|
|
|
|
|
|
Net loss per share of common stock |
|
|
|
|
|
|
|
|
|
|
|
|
|
|
|
|
|
Basic |
|
$ |
(0.30 |
) |
$ |
(0.27 |
) |
$ |
(0.01 |
) |
$ |
(0.24 |
) |
$ |
(0.12 |
) |
|
Diluted |
|
$ |
(0.30 |
) |
$ |
(0.27 |
) |
$ |
(0.01 |
) |
$ |
(0.24 |
) |
$ |
(0.12 |
) |
|
|
|
|
|
|
|
|
|
|
|
|
|
|
|
|
|
|
|
Weighted average shares outstanding (basic) |
|
|
22,085,126 |
|
|
22,087,324 |
|
|
22,100,759 |
|
|
22,114,121 |
|
|
22,167,218 |
|
|
Weighted average shares outstanding (diluted) |
|
|
22,085,126 |
|
|
22,087,324 |
|
|
22,100,759 |
|
|
22,114,121 |
|
|
22,167,218 |
|
|
|
|
|
|
|
|
|
|
|
|
|
|
|
|
|
|
|
|
Statement of financial condition data (at year end): |
|
|
|
|
|
|
|
|
|
|
|
|
|
|
|
|
|
|
|
|
|
|
|
|
|
|
|
|
|
|
|
|
|
|
|
Total assets |
|
$ |
20,728 |
|
$ |
27,970 |
|
$ |
33,456 |
|
$ |
34,823 |
|
$ |
40,103 |
|
|
Total liabilities excluding subordinated borrowings |
|
$ |
2,176 |
|
$ |
2,861 |
|
$ |
2,416 |
|
$ |
3,599 |
|
$ |
3,477 |
|
|
Stockholders’ equity |
|
$ |
18,552 |
|
$ |
25,109 |
|
$ |
31,040 |
|
$ |
31,224 |
|
$ |
36,626 |
|
|
Cash dividends declared on common shares |
|
$ |
0 |
|
$ |
0 |
|
$ |
0 |
|
$ |
0 |
|
$ |
0 |
|
|
|
|
|
Item 7. |
MANAGEMENT’S DISCUSSION AND ANALYSIS OF FINANCIAL CONDITION AND RESULTS OF OPERATIONS |
This discussion should be read in conjunction with our audited Consolidated Financial Statements and the Notes thereto contained elsewhere in this Annual Report.
Our working capital is invested primarily in money market funds, so that liquidity has not been materially affected. The recent financial crisis did have the effect of reducing participation in the securities market by our retail and institutional customers, which had an adverse effect on our revenues. While the stock market improved in 2014 our revenues did not. In 2012 we did have one customer account generate commissions that accounted for 12% of the total revenue. Income of our affiliate, SBSF, decreased in 2014 to $171,000 as a result of a decrease in the number of offerings by municipalities. As a result, the Company’s income from SBSF decreased in 2014 to $84,000. The Company’s professional expenses during 2014, 2013 and 2012 include the costs of an arbitration proceeding commenced by a former employee following the termination of his employment, which was resolved in 2014 resulting in a $4,300,000 settlement payment. The action has adversely affected the Company’s results of operations. Competition in the brokerage industry remains intense.
On November 4, 2014, the Company, which held a 49% membership interest in, and the other members of, Siebert Brandford Shank & Co., LLC (“SBS”), contributed their SBS membership interests into a newly formed Delaware limited liability company, Siebert Brandford Shank Financial, L.L.C. (“SBSF”), in exchange for the same percentage interests in SBSF. On the same day, the Company entered into an Asset Purchase Agreement (the “Purchase Agreement”) with SBS and SBSF, pursuant to which the Company sold substantially all of the assets relating to the Company’s capital markets business to SBSF. Pursuant to the Purchase Agreement, SBSF assumed post-closing liabilities relating to the transferred business.
The Purchase Agreement provides for an aggregate purchase price for the disposition of $3,000,000, payable by SBSF after closing in annual installments commencing on March 1, 2016 and continuing on each of March 1, 2017, 2018, 2019 and 2020. The transferred business was contributed by SBSF to, and operated by SBS. The amount payable to the Company on each annual payment date will equal 50% of the net income attributable to the transferred business recognized by SBS in accordance with generally accepted accounting principles during the fiscal year ending immediately preceding the applicable payment date; provided that, if net income attributable to the transferred business generated prior to the fifth annual payment date is insufficient to pay the remaining
- 15 -
balance of the purchase price in full on the fifth annual payment date, then the unpaid amount of the purchase price will be paid in full on March 1, 2021.
Transferred assets of the Company’s capital markets business consisted of issuer relationships and goodwill, which assets had no carrying value to the Company, and the Company recorded a gain on sale of $ 1,820,000, which reflected the fair value of the purchase obligation. Such fair value (Level 3) was based on the present value of estimated annual installments to be received during 2016 through 2020 from forecasted net income of the transferred business plus a final settlement in 2021, discounted at 11.5% (representing SBS’s weighted average cost of capital),
The discount recorded for the purchase obligation will be amortized as interest income using an effective yield, initially calculated based on the original carrying amount of the obligation and estimated annual installments to be received and adjusted in future periods to reflect actual installments received and changes in estimates of future installments. Interest income recognized on the obligation for the period from November 4, 2014 to December 31, 2014, amounted to approximately $37,000 based on a yield of approximately 12%.
As a result of the Company’s continuing involvement in the capital markets business through its 49% ownership in SBSF, results of operations of the capital markets business and the gain on sale were not reflected as discontinued operations in the accompanying statement of operations.
The following table sets forth certain metrics as of December 31, 2014, 2013 and 2012, respectively, which we use in evaluating our business.
|
|
|
|
|
|
|
|
|
|
|
|
|
|
|
For the Twelve Months |
|
|||||||
|
Retail Customer Activity: |
|
2014 |
|
2013 |
|
2012 |
|
|||
|
|
|
|
|
|
|
|
|
|
|
|
|
Total retail trades: |
|
|
293,419 |
|
|
327,285 |
|
|
321,687 |
|
|
Average commission per retail trade: |
|
$ |
19.50 |
|
$ |
21.70 |
|
$ |
27.80 |
|
|
|
|
|
|
|
|
|
|
|
|
|
As of December 31, |
|
||||
|
|
|
2014 |
|
2013 |
|
||
|
|
|
|
|
|
|
|
|
|
Retail customer balances: |
|
|
|
|
|
|
|
|
Retail customer net worth (in billions): |
|
$ |
7.3 |
|
$ |
7.3 |
|
|
Retail customer money market fund value (in billions): |
|
$ |
1.0 |
|
$ |
1.1 |
|
|
Retail customer margin debit balances (in millions): |
|
$ |
232.3 |
|
$ |
215.7 |
|
|
Retail customer accounts with positions: |
|
|
32,962 |
|
|
35,591 |
|
Description:
|
|
|
|
|
|
• |
Total retail trades represents retail trades that generate commissions. |
|
|
|
|
|
|
• |
Average commission per retail trade represents the average commission generated for all types of retail customer trades. |
|
|
|
|
|
|
• |
Retail customer net worth represents the total value of securities and cash in the retail customer accounts before deducting margin debits. |
|
|
|
|
|
|
• |
Retail customer money market fund value represents all retail customers accounts invested in money market funds. |
|
|
|
|
|
|
• |
Retail customer margin debit balances represents credit extended to our customers to finance their purchases against current positions. |
|
|
|
|
|
|
• |
Retail customer accounts with positions represent retail customers with cash and/or securities in their accounts. |
We, like other securities firms, are directly affected by general economic and market conditions including fluctuations in volume and prices of securities, changes and the prospect of changes in interest rates, and demand for brokerage and investment banking services, all of which can affect our profitability. In addition, in periods of reduced financial market activity, profitability is likely to be adversely affected because certain expenses remain relatively fixed, including salaries and related costs, portions of communications costs and occupancy expenses. Accordingly, earnings for any period should not be considered representative of earnings to be expected for any other period.
- 16 -
Competition continues to intensify among all types of brokerage firms, including established discount brokers and new firms entering the on-line brokerage business. Electronic trading continues to account for an increasing amount of trading activity, with some firms charging very low trading execution fees that are difficult for any conventional discount firm to meet. Some of these brokers, however, impose asset based charges for services such as mailing, transfers and handling exchanges which we do not currently impose, and also direct their orders to market makers where they have a financial interest. Continued competition could limit our growth or even lead to a decline in our customer base, which would adversely affect our results of operations. Industry-wide changes in trading practices, such as the continued use of Electronic Communications Networks, are expected to put continuing pressure on commissions/fees earned by brokers while increasing volatility.
We are a party to an Operating Agreement (the “Operating Agreement”), with Suzanne Shank and Napoleon Brandford III, the two individual principals (the “Principals”) of SBSFPC. Pursuant to the terms of the Operating Agreement, the Company and each of the Principals made an initial capital contribution of $400,000 in exchange for a 33.33% initial interest in SBSFPC. SBSFPC engages in derivatives transactions related to the municipal underwriting business. The Operating Agreement provides that profit and loss will be shared 66.66% by the Principals and 33.33% by us. The Company and principals closed down the operations of SBSFPC in 2014.
In 2014, we began business as a registered investment advisor through our wholly-owned subsidiary, Siebert Investment Advisors, Inc. (“SIA”). SIA is a boutique investment management firm that greatly extends our ability to meet our customer’s investment needs. SIA offers advice to clients regarding asset allocation and the selection of investments. Our investment management services include the design, implementation, and continued monitoring of client accounts on a discretionary or non-discretionary basis. Investment selections and recommendation are guided by the stated objectives of the customer, other considerations include the customer’s risk profile and financial status.
SIA offers to its clients a number of Asset Management Programs (“Managed Programs”) consisting of asset allocation, flexible asset management and focused or completion strategies. In these Managed Programs, SIA acts as the co-adviser to clients. IA Representatives will assist each client in reviewing information about the programs, completing a client questionnaire to determine the client's risk tolerance, financial situation and investment objectives and selecting an investment strategy. SIA does not ever act as portfolio manager directly, SIA selects other investment advisers to act as portfolio manager on behalf of its clients. During 2014, the results of SIA operations are immaterial to the operations of the Company.
On January 23, 2008, our Board of Directors authorized a buy back of up to 300,000 shares of our common stock. Under this program, shares are purchased from time to time, at our discretion, in the open market and in private transactions. No shares were purchased during 2014.
Critical Accounting Policies
We generally follow accounting policies standard in the brokerage industry and believe that our policies appropriately reflect our financial position and results of operations. Our management makes significant estimates that affect the reported amounts of assets, liabilities, revenues and expenses and the related disclosure of contingent assets and liabilities included in the financial statements. The estimates relate primarily to revenue and expense items in the normal course of business as to which we receive no confirmations, invoices, or other documentation, at the time the books are closed for a period. We use our best judgment, based on our knowledge of revenue transactions and expenses incurred, to estimate the amount of such revenue and expenses. We are not aware of any material differences between the estimates used in closing our books for the last five years and the actual amounts of revenue and expenses incurred when we subsequently receive the actual confirmations, invoices or other documentation. Estimates are also used in determining the useful lives of intangibles assets, and the fair market value of intangible assets. Our management believes that its estimates are reasonable.
- 17 -
Results of Operations
Year Ended December 31, 2014 Compared to Year Ended December 31, 2013
Revenues. Total revenues for 2014 were $15.9 million, a decrease of $549,000, or 3.3%, from 2013. Commission and fee income decreased $1.2 million, or 9.9%, from the prior year to $10.8 million primarily due to a decrease in retail trading and in the average commission charged per retail trade. Capital Markets Division was sold to our affiliate SBSF on November 4, 2014 resulting in reduced institutional trading commissions and investment banking revenues. Commission recapture operations were shut down on September 30, 2014.
Investment banking revenues decreased $588,000 or 24.3%, from the prior year to $1.8 million in 2014 due to our participation in fewer new issues in the equity and debt capital markets. The Capital Markets division was sold on November 4, 2014 to our affiliate.
Trading profits decreased $625,000, or 31.6%, from the prior year to $1.4 million in 2014 primarily due to an overall decrease in trading volume primarily in the debt markets.
The Company recorded a gain on the sale of our Capital Markets Segment of $ 1,820,000, which reflected the fair value of the purchase obligation (transferred assets of the Company’s capital markets business, consisted of customer accounts and goodwill, which had no carrying value to the Company. Such fair value was based on the present value of estimated annual installments to be received during 2016 through 2020 from forecasted net income of the transferred business plus a final settlement in 2021, discounted at 11.5% (representing SBS’s weighted average cost of capital), the sale was for $3,000,000 recorded at a discount.
The discount recorded for the purchase obligation will be amortized as interest income using an effective yield initially calculated based on the original carrying amount of the obligation and estimated annual installments to be received and adjusted in future periods to reflect actual installments received and changes in estimates of future installments. Interest income recognized on the obligation for the period from November 4, 2014 to December 31, 2014 amounted to $36,641 based on a yield of approximately 12%.
Income from interest and dividends increased $32,000, or 51.6%, from the prior year to $94,000 in 2014 primarily due to accrued interest on our receivable from business sold to affiliate (see above paragraph).
Expenses. Total expenses for 2014 were $22.5 million, an increase of $247,000, or 1.1%, from the prior year.
Employee compensation and benefit costs decreased $995,000, or 10.7%, from the prior year to $8.3 million in 2014. This decrease was due a reduction in head count from the previous year.
Clearing and floor brokerage fees decreased $717,000, or 30.1%, from the prior year to $1.7 million in 2014 primarily due to lower retail trading volumes, lower execution charges for institutional equity trading, as well as shutting down our rebate recapture business on September 30, 2014.
Professional fees decreased $1.0 million, or 18.6% from the prior year to $4.3 million in 2014 primarily due to a decrease in legal fees relating to a dispute with a former employee (see settlement of case below).
In July 2014, the Company entered into a settlement agreement in regard to a dispute with a former employee, in which the former employee sought, among other things, damages arising from his separation from the Company. The Company asserted counter claims in the arbitration. Pursuant to the settlement, the Company paid $4,300,000 to the former employee, and the claims and counterclaims have been dismissed and released.
Advertising and promotion expense decreased $157,000, or 38.8%, from the prior year to $248,000 in 2014 due to a decrease in online and print advertising.
Communications expense decreased $431,000, or 33.3%, from the prior year to $865,000 in 2014 due to a new phone system and phone vendor. Quote fees were down as well due to the reduction in Bloomberg terminals due to the sale of our Capital Markets segment on November 4, 2014. Retail trading revenues were down causing quotes to go down.
Occupancy costs decreased $258,000, or 24.7%, from the prior year to $788,000 in 2014 due to our Palm Beach branch closing on March 31, 2014, reduction in our Jersey City branch operating expenses, and New York rent rebates as per our lease.
Impairment of intangibles of $300,000 in 2013 was the result of the Company writing down the carrying value of its unamortized intangible assets to zero.
Other general and administrative expenses decreased $212,000, or 9.4%, from the prior year to $2.0 million in 2014 due decreases in office expense in travel, entertainment, computer security updates, and registration expense.
- 18 -
Income from our equity investment in SBSF, an entity in which Siebert holds a 49% equity interest, for 2014 was $84,000 compared to income of $94,000 for 2013, a decrease of $10,000, primarily due to SBSF participating in fewer municipal bond offerings as senior- and co-manager. Losses from our equity investment in SBSFPC, an entity in which we hold a 33% equity interest, for 2014 was a loss of $17,000 as compared to a loss of $159,000 from the same period in 2013. This decrease was principally due to SBSFPC winding down and shutting down their operations in 2014.
Taxes. The tax provision for the year ended December 31, 2014 and 2013 was $0 and $19,000, respectively. The provision for income taxes for 2013 represents New York State, New York City and Internal Revenue Service payments. The Company has recorded a valuation allowance to fully offset our deferred tax asset at December 31, 2014 and 2013.
Results of Operations
Year Ended December 31, 2013 Compared to Year Ended December 31, 2012
Revenues. Total revenues for 2013 were $16.4 million, a decrease of $4.6 million, or 21.8%, from 2012. Commission and fee income decreased $2.7 million, or 18.4%, from the prior year to $11.9 million primarily due to a decrease in average commission charged per trade as a result of a decrease in retail options trading by one customer, which accounted for approximately 18% of total commission and fees in 2012, as well as an decrease in our institutional trading commissions and our commission recapture operations.
Investment banking revenues decreased $1.5 million, or 38.3%, from the prior year to $2.4 million in 2013 due to our participation in fewer new issues in the equity and debt capital markets.
Trading profits decreased $384,000, or 16.3%, from the prior year to $2.0 million in 2013 primarily due to a fixed income sales- trader being on medical leave.
Income from interest and dividends decreased $14,000, or 18.4%, from the prior year to $62,000 in 2013 primarily due to lower cash balances.
Expenses. Total expenses for 2013 were $22.2 million, an increase of $303,000, or 1.4%, from the prior year.
Employee compensation and benefit costs decreased $783,000, or 7.8%, from the prior year to $9.3 million in 2013. This decrease was due to lower commission and bonus payouts based on production offset by severance paid to former key employees released in 2013.
Clearing and floor brokerage fees decreased $360,000, or 13.1%, from the prior year to $2.4 million in 2013 primarily due to lower retail trading volumes as well as execution charges for institutional equity customers.
Professional fees increased $2.2 million, or 70.4% from the prior year to $5.3 million in 2013 primarily due to an increase in legal fees relating to a dispute with a former employee.
Advertising and promotion expense decreased $13,000, or 3.1%, from the prior year to $405,000 in 2013 due to an increase in online advertising.
Communications expense decreased $305,000, or 19.1%, from the prior year to $1.3 million in 2013 due to the elimination of costs associated with the discontinuance of our website developed and maintained by a software vendor as of June 2012.
Occupancy costs increased $139,000, or 15.3%, from the prior year to $1.0 million in 2013 due to the lease in New York.
Impairment of intangibles of $300,000 in 2013 was the result of the Company writing down the carrying value of its unamortized intangible assets to zero.
Write off of software development costs of $433,000 in 2012 was due to the Company’s discontinuation of its relationship with a software vendor on June 30, 2012, which had developed and maintained our website. As a result, the Company wrote off its remaining unamortized carrying value of development costs of $433,000. Effective July 1, 2012, such services are provided by our clearing broker.
Other general and administrative expenses decreased $129,000 or 5.4% from the prior year to $2.2 million in 2013 due to decreases in depreciation, computer security updates, and registration expense offset by increases in office expenses, sipc expenses, and state and local taxes.
Income from our equity investment in SBS, an entity in which Siebert holds a 49% equity interest, for 2013 was $94,000 compared to income of $774,000 for 2012, a decrease of $680,000, primarily due to SBS participating in less municipal bond offerings as senior- and co-manager. Losses from our equity investment in SBSFPC, an entity in which we hold a 33% equity interest, for 2013 was $159,000 as compared to income of $32,000 from the same period in 2012. This decrease was principally due to
- 19 -
SBSFPC terminating swap position and mark to market positions. Results of operations of equity investees are considered to be integral to our operations and material to the results of operations.
Taxes. The tax provision for the year ended December 31, 2013 and 2012 was $19,000 and $34,000, respectively. The provision for income taxes for 2013 represents New York State, New York City and Internal Revenue Service payments. The Company has recorded a valuation allowance to fully offset our deferred tax asset at December 31, 2013 and 2012.
Liquidity and Capital Resources
Our assets are highly liquid, consisting generally of cash and money market funds. Our total assets at December 31, 2014 were $20.7 million, of which we regarded $7.7 million, or 37.2%, as highly liquid.
Siebert is subject to the net capital requirements of the SEC, the NYSE and other regulatory authorities. At December 31, 2014, Siebert’s regulatory net capital was $5.1 million, which was $4.8 million in excess of its minimum capital requirement of $250,000.
Siebert has entered into a Secured Demand Note Collateral Agreement with SBS under which it is obligated to loan to SBS up to $1.2 million on a subordinated basis collateralized by cash equivalents of approximately $1.5 million as of December 31, 2014. Amounts obligated to be loaned by Siebert under the facility are reflected on our balance sheet as “cash equivalents - restricted”. SBS pays Siebert interest on this amount at the rate of 4% per annum. The facility expires on August 31, 2015 at which time SBS is obligated to repay to Siebert any amounts borrowed by SBS thereunder.
Contractual Obligations
Below is a table that presents our obligations and commitments at December 31, 2014:
|
|
|
|
|
|
|
|
|
|
|
|
|
|
|
|
|
|
|
|
|
Payment Due By Period |
|
|||||||||||||
|
Contractual Obligations |
|
Total |
|
Less Than |
|
1-3 Years |
|
3-5 Years |
|
More Than |
|
|||||
|
Operating lease obligations |
|
$ |
1,177,000 |
|
$ |
615,000 |
|
$ |
562,000 |
|
$ |
0 |
|
$ |
0 |
|
Off-Balance Sheet Arrangements
Retail customer transactions are cleared through clearing brokers on a fully disclosed basis. If customers do not fulfill their contractual obligations, the clearing broker may charge Siebert for any loss incurred in connection with the purchase or sale of securities at prevailing market prices to satisfy the customer obligations. Siebert regularly monitors the activity in its customer accounts for compliance with its margin requirements. Siebert is exposed to the risk of loss on unsettled customer transactions if customers and other counterparties are unable to fulfill their contractual obligations. There were no material losses for unsettled customer transactions in 2014.
|
|
|
|
Item 7A. |
QUANTITATIVE AND QUALITATIVE DISCLOSURES ABOUT MARKET RISK |
Financial Instruments Held For Trading Purposes:
Through Siebert, we maintain inventories in exchange-listed equity securities and municipal securities on both a long and short basis. We did not have any short positions at December 31, 2014. The Company does not directly engage in derivative transactions, has no interest in any special purpose entity and has no liabilities, contingent or otherwise, for the debt of another entity except for Siebert’s obligation under its Secured Demand Note Collateral Agreement of $1.2 million executed in favor of SBS. SBS pays Siebert interest on this amount at the rate of 4% per annum. Siebert earned interest of $48,000 in 2014, 2013 and 2012, from SBS.
Financial Instruments Held For Purposes Other Than Trading:
We generally invest working capital temporarily in dollar denominated money market funds and commercial paper. These investments are not subject to material changes in value due to interest rate movements.
Retail customer transactions are cleared through clearing brokers on a fully disclosed basis. If customers do not fulfill their contractual obligations, the clearing broker may charge Siebert for any loss incurred in connection with the purchase or sale of securities at prevailing market prices to satisfy the customers’ obligations. Siebert regularly monitors the activity in its customer accounts for compliance with its margin requirements. Siebert is exposed to the risk of loss on unsettled customer transactions if customers and other counterparties are unable to fulfill their contractual obligations. There were no material losses for unsettled customer transactions in 2014.
- 20 -
|
|
|
|
Item 8. |
FINANCIAL STATEMENTS AND SUPPLEMENTARY DATA |
See financial statements and supplementary data required pursuant to this item beginning on page F-1 of this Annual Report on Form 10-K.
|
|
|
|
Item 9. |
CHANGES IN AND DISAGREEMENTS WITH ACCOUNTANTS ON ACCOUNTING AND FINANCIAL DISCLOSURE |
None.
|
|
|
|
Item 9A. |
CONTROLS AND PROCEDURES |
We carried out an evaluation, under the supervision and with the participation of management, including our former Chief Executive Officer and Chief Financial Officer, of the effectiveness of the design and operation of our disclosure controls and procedures as of the end of the period covered by this report pursuant to Rule 13a-15 of Securities Exchange of 1934, as amended. Based on that evaluation, our management, including our former Chief Executive Officer and Chief Financial Officer, concluded that our disclosure controls and procedures are effective to ensure that the information we are required to disclose in reports that we file or submit under the Securities Exchange Act of 1934, as amended, is recorded, processed, summarized and reported within the time periods specified in the rules and forms of the Securities and Exchange Commission and to ensure that information required to be disclosed is accumulated and communicated to our management, including our former Chief Executive Officer and Chief Financial Officer, to allow timely decisions regarding timely disclosure.
Management’s Report on Internal Control over Financial Reporting
Our management is responsible for establishing and maintaining adequate internal control over financial reporting (as that term is defined in Exchange Act Rule 13a-15(f)). To evaluate the effectiveness of our internal control over financial reporting, we use the 2013 framework in Internal Control—Integrated Framework issued by the Committee of Sponsoring Organizations of the Treadway Commission (the “2013 COSO Framework”). Using the 2013 COSO Framework, our management, including our former Chief Executive Officer and Chief Financial Officer, evaluated our internal control over financial reporting and concluded that our internal control over financial reporting was effective as of December 31, 2014.
Changes in Internal Control over Financial Reporting
There were no changes in our internal control over financial reporting during the most recently completed fiscal quarter that materially affected, or are reasonably likely to materially affect, our internal control over financial reporting.
Limitation of the Effectiveness of Internal Controls
None
|
|
|
|
Item 9B. |
OTHER INFORMATION |
None
- 21 -
PART III
|
|
|
|
Item 10. |
DIRECTORS, EXECUTIVE OFFICERS AND CORPORATE GOVERNANCE |
(a) Identification of Directors
This information is incorporated by reference from our definitive proxy statement to be filed by the Company pursuant to Regulation 14A on or prior to April 30, 2015.
(b) Identification of Executive Officers
|
|
|
|
|
|
|
|
|
Name |
|
Age |
|
Position |
|
|
|
|
|
|
|
|
|
Joseph M. Ramos, Jr. |
|
56 |
|
Executive Vice President, Chief Operating Officer, Chief Financial Officer and Secretary |
Certain information regarding each executive officer’s business experience is set forth below.
Joseph M. Ramos, Jr. has been Executive Vice President, Chief Financial Officer and Assistant Secretary of Siebert since February 10, 2003, Chief Financial Officer of Siebert, Brandford, Shank, &Co., L.L.C. since April 20, 2009 and Chief Operating Officer Since June 10, 2013. From May 1999 to February 2002, Mr. Ramos served as Chief Financial Officer of Internet Financial Services, Inc. From November 1996 to May 1999, Mr. Ramos served as Chief Financial Officer of Nikko Securities International, Inc. From September 1987 to March 1996, Mr. Ramos worked at Cantor Fitzgerald and held various accounting and management positions, the last as Chief Financial Officer of their registered broker-dealer based in Los Angeles. From October 1982 to September 1987, Mr. Ramos was an audit manager for Deloitte &Touche LLP, a public accounting firm. Mr. Ramos is a Certified Public Accountant licensed in the State of New York.
(c) Compliance with Section 16(a) of the Exchange Act
This information is incorporated by reference from our definitive proxy statement to be filed pursuant to Regulation 14A on or prior to April 30, 2015.
(d) Code of Ethics
We have adopted a financial code of ethics that applies to our principal executive officer, principal financial officer, principal accounting officer and all other employees performing similar functions. This financial code of ethics is posted on our website. The Internet address for our website is http://www.siebertnet.com. We intend to satisfy the disclosure requirement under Item 5.05 of Form 8-K regarding an amendment to, or waiver from, a provision of this code of ethics by either filing a Form 8-K or posting such information on our website, at the address and location specified above, within four business days following the date of such amendment or waiver.
The information required by this item not set forth herein is incorporated by reference to our definitive proxy statement to be filed pursuant to Regulation 14A on or prior to April 30, 2015.
|
|
|
|
Item 11. |
EXECUTIVE COMPENSATION |
The information required by this item is incorporated by reference from our definitive proxy statement to be filed pursuant to Regulation 14A on or prior to April 30, 2015.
|
|
|
|
Item 12. |
SECURITY OWNERSHIP OF CERTAIN BENEFICIAL OWNERS AND MANAGEMENT AND RELATED STOCKHOLDER MATTERS |
The information required by this item is incorporated by reference from our definitive proxy statement to be filed pursuant to Regulation 14A on or prior to April 30, 2015.
|
|
|
|
Item 13. |
CERTAIN RELATIONSHIPS AND RELATED TRANSACTIONS, AND DIRECTOR INDEPENDENCE |
The information required by this item is incorporated by reference from our definitive proxy statement to be filed pursuant to Regulation 14A on or prior to April 30, 2015.
|
|
|
|
Item 14. |
PRINCIPAL ACCOUNTING FEES AND SERVICES |
The information required in this item is incorporated by reference from our definitive proxy statement to be filed pursuant to Regulation 14A on or prior to April 30, 2015.
- 22 -
PART IV
|
|
|
|
Item 15. |
EXHIBITS, FINANCIAL STATEMENT SCHEDULES |
The exhibits required by Item 601 of Regulation S-K filed as part of, or incorporated by reference in, this Annual Report are listed in the accompanying Exhibit Index.
|
|
|
|
|
|
(a) |
The following documents are filed as part of this report: |
|
|
|
|
|
|
1. |
Financial Statements |
The consolidated Financial statements for the year ended December 31, 2014 commence on page F-1 of this Annual Report on Form 10-K.
|
|
|
|
|
|
2. |
Financial Statement Schedules |
|
|
|
|
|
|
|
None. |
|
|
|
|
|
|
3. |
Exhibits |
The exhibits required by Item 601 of Regulation S-K filed as part of, or incorporated by reference in, this report are listed in the accompanying Exhibit Index. Exhibit Numbers 10.1, 10.2 and 10.6 are management contracts, compensatory plans or arrangements.
- 23 -
INDEX TO CONSOLIDATED FINANCIAL STATEMENTS
|
|
|
|
|
|
|
Page |
|
SIEBERT FINANCIAL CORP. |
|
|
|
|
|
|
|
Report of Independent Registered Public Accounting Firm |
|
F-1 |
|
|
|
|
|
Consolidated Statements of Financial Condition at December 31, 2014 and 2013 |
|
F-2 |
|
|
|
|
|
|
F-3 |
|
|
|
|
|
|
|
F-4 |
|
|
|
|
|
|
|
F-5 |
|
|
|
|
|
|
|
F-6 |
|
|
|
|
|
|
SIEBERT, BRANDFORD, SHANK FINANCIAL, L.L.C. AND SUBSIDIARY AT 2014 AND SIEBERT, BRANDFORD, SHANK & CO., L.L.C. AT 2013 |
|
|
|
|
|
|
|
Report of Independent Registered Public Accounting Firm |
|
F-15 |
|
|
|
|
|
Statements of Financial Condition at December 31, 2014 and 2013 |
|
F-16 |
|
|
|
|
|
Statements of Operations for each of the years in the three-year period ended December 31, 2014 |
|
F-17 |
|
|
|
|
|
|
F-18 |
|
|
|
|
|
|
Statements of Cash Flows for each of the years in the three-year period ended December 31, 2014 |
|
F-19 |
|
|
|
|
|
|
F-20 |
REPORT OF INDEPENDENT REGISTERED PUBLIC ACCOUNTING FIRM
Board of Directors and Shareholders
Siebert Financial Corp.
We have audited the accompanying consolidated statements of financial condition of Siebert Financial Corp. and subsidiaries (the “Company”) as of December 31, 2014 and 2013, and the related consolidated statements of operations, changes in stockholders’ equity and cash flows for each of the years in the three-year period ended December 31, 2014. These financial statements are the responsibility of the Company’s management. Our responsibility is to express an opinion on these financial statements based on our audits.
We conducted our audits in accordance with the standards of the Public Company Accounting Oversight Board (United States). Those standards require that we plan and perform the audit to obtain reasonable assurance about whether the financial statements are free of material misstatement. The Company is not required to have, nor were we engaged to perform, an audit of its internal control over financial reporting. Our audits included consideration of internal control over financial reporting as a basis for designing audit procedures that are appropriate in the circumstances, but not for the purpose of expressing an opinion on the effectiveness of the Company’s internal control over financial reporting. Accordingly, we express no such opinion. An audit also includes examining, on a test basis, evidence supporting the amounts and disclosures in the financial statements, assessing the accounting principles used and significant estimates made by management, as well as evaluating the overall financial statement presentation. We believe that our audits provide a reasonable basis for our opinion.
In our opinion, the financial statements referred to above present fairly, in all material respects, the consolidated financial position of Siebert Financial Corp. and subsidiaries as of December 31, 2014 and 2013, and the consolidated results of their operations and their cash flows for each of the years in the three-year period ended December 31, 2014, in conformity with accounting principles generally accepted in the United States of America.
/s/ EisnerAmper LLP
New York, New York
March 31, 2015
F-1
SIEBERT FINANCIAL CORP. AND SUBSIDIARIES
CONSOLIDATED STATEMENTS OF FINANCIAL CONDITION
|
|
|
|
|
|
|
|
|
|
December 31, |
|
||||
|
|
2014 |
|
2013 |
|
||
ASSETS |
|
|
|
|
|
|
|
|
|
|
|
|
|
|
|
Cash and cash equivalents |
|
$ |
6,749,000 |
|
$ |
15,424,000 |
|
Cash equivalents - restricted |
|
|
1,532,000 |
|
|
1,532,000 |
|
Receivable from brokers |
|
|
788,000 |
|
|
1,105,000 |
|
Receivable from business sold to affiliate net of unamortized discount of $1,143,000 |
|
|
1,857,000 |
|
|
— |
|
Securities owned, at fair value |
|
|
488,000 |
|
|
406,000 |
|
Furniture, equipment and leasehold improvements, net |
|
|
609,000 |
|
|
712,000 |
|
Investments in and advances to affiliates |
|
|
7,979,000 |
|
|
8,022,000 |
|
Prepaid expenses and other assets |
|
|
718,000 |
|
|
751,000 |
|
Intangibles, net |
|
|
8,000 |
|
|
18,000 |
|
|
|
|
|
|
|
|
|
|
|
$ |
20,728,000 |
|
$ |
27,970,000 |
|
|
|
|
|
|
|
|
|
LIABILITIES AND STOCKHOLDERS’ EQUITY |
|
|
|
|
|
|
|
|
|
|
|
|
|
|
|
Liabilities: |
|
|
|
|
|
|
|
|
|
|
|
|
|
|
|
Accounts payable and accrued liabilities |
|
$ |
2,176,000 |
|
$ |
2,861,000 |
|
|
|
|
|
|
|
|
|
Commitments and contingent liabilities - Note I |
|
|
|
|
|
|
|
|
|
|
|
|
|
|
|
Stockholders’ equity: |
|
|
|
|
|
|
|
|
|
|
|
|
|
|
|
Common stock, $.01 par value; 49,000,000 shares authorized, 23,211,846 shares issued, 22,085,126 shares outstanding |
|
|
232,000 |
|
|
232,000 |
|
Additional paid-in capital |
|
|
19,490,000 |
|
|
19,490,000 |
|
Retained earnings |
|
|
3,590,000 |
|
|
10,147,000 |
|
Less: 1,126,720 shares of treasury stock, at cost |
|
|
(4,760,000 |
) |
|
(4,760,000 |
) |
|
|
|
|
|
|
|
|
|
|
|
18,552,000 |
|
|
25,109,000 |
|
|
|
|
|
|
|
|
|
|
|
$ |
20,728,000 |
|
$ |
27,970,000 |
|
See notes to consolidated financial statements.
F-2
CONSOLIDATED STATEMENTS OF OPERATIONS
|
|
|
|
|
|
|
|
|
|
|
|
|
Year Ended December 31, |
|
|||||||
|
|
2014 |
|
2013 |
|
2012 |
|
|||
Revenue: |
|
|
|
|
|
|
|
|
|
|
Commissions and fees |
|
$ |
10,757,000 |
|
$ |
11,945,000 |
|
$ |
14,630,000 |
|
Investment banking |
|
|
1,830,000 |
|
|
2,418,000 |
|
|
3,917,000 |
|
Trading gains, net |
|
|
1,351,000 |
|
|
1,976,000 |
|
|
2,360,000 |
|
Gain on the disposition of business to affiliate |
|
|
1,820,000 |
|
|
— |
|
|
— |
|
Interest and dividends |
|
|
57,000 |
|
|
62,000 |
|
|
76,000 |
|
|
|
|
|
|
|
|
|
|
|
|
|
|
|
15,815,000 |
|
|
16,401,000 |
|
|
20,983,000 |
|
|
|
|
|
|
|
|
|
|
|
|
Expenses: |
|
|
|
|
|
|
|
|
|
|
Employee compensation and benefits |
|
|
8,267,000 |
|
|
9,262,000 |
|
|
10,045,000 |
|
Clearing fees, including floor brokerage |
|
|
1,665,000 |
|
|
2,382,000 |
|
|
2,742,000 |
|
Professional fees |
|
|
4,310,000 |
|
|
5,293,000 |
|
|
3,106,000 |
|
Loss related to arbitration settlement |
|
|
4,300,000 |
|
|
— |
|
|
— |
|
Advertising and promotion |
|
|
248,000 |
|
|
405,000 |
|
|
418,000 |
|
Communications |
|
|
865,000 |
|
|
1,296,000 |
|
|
1,601,000 |
|
Occupancy |
|
|
788,000 |
|
|
1,046,000 |
|
|
907,000 |
|
Impairment of intangibles |
|
|
— |
|
|
300,000 |
|
|
300,000 |
|
Write off of software development costs |
|
|
— |
|
|
— |
|
|
433,000 |
|
Other general and administrative |
|
|
2,033,000 |
|
|
2,245,000 |
|
|
2,374,000 |
|
|
|
|
|
|
|
|
|
|
|
|
|
|
|
22,476,000 |
|
|
22,229,000 |
|
|
21,926,000 |
|
|
|
|
|
|
|
|
|
|
|
|
Income (loss) from equity investees, including, in 2014, interest on receivable of $37,000 |
|
|
104,000 |
|
|
(65,000 |
) |
|
806,000 |
|
|
|
|
|
|
|
|
|
|
|
|
|
|
|
|
|
|
|
|
|
|
|
Loss before income taxes |
|
|
(6,557,000 |
) |
|
(5,893,000 |
) |
|
(137,000 |
) |
Provision for income taxes |
|
|
— |
|
|
19,000 |
|
|
34,000 |
|
|
|
|
|
|
|
|
|
|
|
|
Net loss |
|
$ |
(6,557,000 |
) |
$ |
(5,912,000 |
) |
$ |
(171,000 |
) |
|
|
|
|
|
|
|
|
|
|
|
Net loss per share of common stock – basic and diluted |
|
$ |
(0.30 |
) |
$ |
(0.27 |
) |
$ |
(0.01 |
) |
|
|
|
|
|
|
|
|
|
|
|
Weighted average shares outstanding – basic and diluted |
|
|
22,085,126 |
|
|
22,087,324 |
|
|
22,100,759 |
|
See notes to consolidated financial statements.
F-3
CONSOLIDATED STATEMENTS OF CHANGES IN STOCKHOLDERS’ EQUITY
|
|
|
|
|
|
|
|
|
|
|
|
|
|
|
|
|
|
|
|
|
|
|
|
|
Common Stock |
|
Treasury Stock |
|
|
|
|||||||||||||||
|
|
Number |
|
$.01
Par |
|
Additional |
|
Retained |
|
Number |
|
Amount |
|
Total |
|
|||||||
Balance - January 1, 2012 |
|
|
23,211,846 |
|
|
232,000 |
|
|
19,490,000 |
|
|
16,230,000 |
|
|
1,106,347 |
|
|
(4,728,000 |
) |
|
31,224,000 |
|
Net loss |
|
|
|
|
|
|
|
|
|
|
|
(171,000 |
) |
|
|
|
|
|
|
|
(171,000 |
) |
Treasury share purchases |
|
|
|
|
|
|
|
|
|
|
|
|
|
|
8,107 |
|
|
(13,000 |
) |
|
(13,000 |
) |
|
|
|
|
|
|
|
|
|
|
|
|
|
|
|
|
|
|
|
|
|
|
|
Balance - December 31, 2012 |
|
|
23,211,846 |
|
|
232,000 |
|
|
19,490,000 |
|
|
16,059,000 |
|
|
1,114,454 |
|
|
(4,741,000 |
) |
|
31,040,000 |
|
Net loss |
|
|
|
|
|
|
|
|
|
|
|
(5,912,000 |
) |
|
|
|
|
|
|
|
(5,912,000 |
) |
Treasury share purchases |
|
|
|
|
|
|
|
|
|
|
|
|
|
|
12,266 |
|
|
(19,000 |
) |
|
(19,000 |
) |
|
|
|
|
|
|
|
|
|
|
|
|
|
|
|
|
|
|
|
|
|
|
|
Balance - December 31, 2013 |
|
|
23,211,846 |
|
|
232,000 |
|
|
19,490,000 |
|
|
10,147,000 |
|
|
1,126,720 |
|
|
(4,760,000 |
) |
|
25,109,000 |
|
Net loss |
|
|
|
|
|
|
|
|
|
|
|
(6,557,000 |
) |
|
|
|
|
|
|
|
(6,557,000 |
) |
Balance - December 31, 2014 |
|
|
23,211,846 |
|
|
232,000 |
|
|
19,490,000 |
|
|
3,590,000 |
|
|
1,126,720 |
|
|
(4,760,000 |
) |
|
18,552,000 |
|
See notes to consolidated financial statements.
F-4
CONSOLIDATED STATEMENTS OF CASH FLOWS
|
|
|
|
|
|
|
|
|
|
|
|
|
Year Ended December 31, |
|
|||||||
|
|
2014 |
|
2013 |
|
2012 |
|
|||
Cash Flows From Operating Activities: |
|
|
|
|
|
|
|
|
|
|
|
|
|
|
|
|
|
|
|
|
|
Net loss |
|
$ |
(6,557,000 |
) |
$ |
(5,912,000 |
) |
$ |
(171,000 |
) |
Adjustments to reconcile net loss to net cash used in operating activities: |
|
|
|
|
|
|
|
|
|
|
Depreciation and amortization |
|
|
267,000 |
|
|
130,000 |
|
|
284,000 |
|
Gain on the disposition of business sold to affiliate |
|
|
(1,820,000 |
) |
|
— |
|
|
— |
|
(Income) loss from equity investees |
|
|
(67,000 |
) |
|
65,000 |
|
|
(806,000 |
) |
Interest accrued on receivable from business sold to affiliate |
|
|
(37,000 |
) |
|
— |
|
|
— |
|
Distributions from equity investees |
|
|
13,000 |
|
|
1,212,000 |
|
|
97,000 |
|
Write off of software development costs |
|
|
— |
|
|
— |
|
|
433,000 |
|
Impairment of intangibles |
|
|
— |
|
|
300,000 |
|
|
300,000 |
|
Changes in: |
|
|
|
|
|
|
|
|
|
|
Securities owned, at fair value |
|
|
(82,000 |
) |
|
(151,000 |
) |
|
(5,000 |
) |
Receivable from affiliate |
|
|
(76,000 |
) |
|
— |
|
|
— |
|
Receivable from brokers |
|
|
317,000 |
|
|
818,000 |
|
|
(890,000 |
) |
Prepaid expenses and other assets |
|
|
33,000 |
|
|
149,000 |
|
|
(73,000 |
) |
Accounts payable and accrued liabilities |
|
|
(685,000 |
) |
|
445,000 |
|
|
(1,183,000 |
) |
|
|
|
|
|
|
|
|
|
|
|
Net cash used in operating activities |
|
|
(8,694,000 |
) |
|
(2,944,000 |
) |
|
(2,014,000 |
) |
|
|
|
|
|
|
|
|
|
|
|
Cash Flows From Investing Activities: |
|
|
|
|
|
|
|
|
|
|
|
|
|
|
|
|
|
|
|
|
|
Purchase of furniture, equipment and leasehold improvements |
|
|
(154,000 |
) |
|
(520,000 |
) |
|
(262,000 |
) |
Distributions from equity investees |
|
|
173,000 |
|
|
6,000 |
|
|
— |
|
(Payment) collection of advances made to equity investees |
|
|
— |
|
|
(1,000 |
) |
|
24,000 |
|
|
|
|
|
|
|
|
|
|
|
|
Net cash provided by/ (used in) investing activities |
|
|
19,000 |
|
|
(515,000 |
) |
|
(238,000 |
) |
|
|
|
|
|
|
|
|
|
|
|
Cash Flows From Financing Activities: |
|
|
|
|
|
|
|
|
|
|
|
|
|
|
|
|
|
|
|
|
|
Purchase of treasury shares |
|
|
— |
|
|
(19,000 |
) |
|
(13,000 |
) |
|
|
|
|
|
|
|
|
|
|
|
Net decrease in cash and cash equivalents |
|
|
(8,675,000 |
) |
|
(3,478,000 |
) |
|
(2,265,000 |
) |
Cash and cash equivalents - beginning of year |
|
|
15,424,000 |
|
|
18,902,000 |
|
|
21,167,000 |
|
|
|
|
|
|
|
|
|
|
|
|
Cash and cash equivalents - end of year |
|
$ |
6,749,000 |
|
$ |
15,424,000 |
|
$ |
18,902,000 |
|
Supplemental Cash Flow Disclosures: |
|
|
|
|
|
|
|
|
|
|
Cash for: |
|
|
|
|
|
|
|
|
|
|
Income taxes paid (received), net |
|
$ |
— |
|
$ |
19,000 |
|
$ |
34,000 |
|
See notes to consolidated financial statements.
F-5
SIEBERT FINANCIAL CORP. AND SUBSIDIARIES
NOTES TO CONSOLIDATED FINANCIAL STATEMENTS
Note A - Business:
|
|
|
Siebert Financial Corp. (“Financial”), through its wholly - owned subsidiary, Muriel Siebert &Co., Inc. (“Siebert”), engages in the business of providing discount brokerage services for retail customers, investment banking and equity execution services for institutional clients (representing the capital markets business) and trading securities for its own account. In addition, in 2014 we began business as a registered investment advisor through our wholly-owned subsidiary, Siebert Investment Advisors, Inc. (“SIA”). On November 4, 2014, Siebert sold its capital markets business to an affiliate (see Note B). Another wholly owned subsidiary, Siebert’s Women’s Financial Network Inc. (“WFN”) engaged in providing products, services and information devoted to women’s financial needs. In the fourth quarter of 2013, management decided to substantially reduce the resources allocated to the WFN operation (see Note F). The accompanying consolidated financial statements include the accounts of Financial and its subsidiaries. All significant intercompany accounts and transactions have been eliminated. Financial, Siebert, WFN and SIA collectively are referred to herein as the “Company”. |
|
|
|
The municipal bond investment banking business is conducted by Siebert, Brandford, Shank &Co., L.L.C., a wholly-owned subsidiary of Siebert, Brandford, Shank Financial, L.L.C. (“SBSF”), and related derivatives transactions were conducted by SBS Financial Products Company, LLC (“SBSFP”), non - controlled investees in which the Company has a 49% and 33% equity interest respectively. Such investees are accounted for by the equity method of accounting (see Note D). The equity method provides that the Company records its share of the investees’ earnings or losses in its results of operations with a corresponding adjustment to the carrying value of its investment. In addition, the investment is adjusted for capital contributions to and distributions from the investees. Operations of equity investee SBSF are considered integral to the Company’s operations. Operations of equity investee SBSFP ceased in December 2014. |
Note B – SALE OF BUSINESS
|
|
|
On November 4, 2014, the Company, which held a 49% membership interest in, and the other members of, Siebert Brandford Shank &Co., LLC (“SBS”), contributed their SBS membership interest into a newly formed Delaware limited liability company, Siebert Brandford Shank Financial, L.L.C. (“SBSF”), in exchange for the same percentage interests in SBSF. On the same day the Company entered an Asset Purchase Agreement (the “Purchase Agreement”) with SBS and SBSF, pursuant to which the Company sold substantially all of the assets relating to the Company’s capital markets business to SBSF. Pursuant to the Purchase Agreement, SBSF assumed post-closing liabilities relating to the transferred business. |
|
|
|
The Purchase Agreement provides for an aggregate purchase price for the disposition of $3,000,000, payable by SBSF after closing in annual installments commencing on March 1, 2016 and continuing on each of March 1, 2017, 2018, 2019 and 2020. The transferred business was contributed by SBSF to, and operated by SBS. The amount payable to the Company on each annual payment date will equal 50% of the net income attributable to the transferred business recognized by SBS in accordance with generally accepted accounting principles during the fiscal year ending immediately preceding the applicable payment date; provided that, if net income attributable to the transferred business generated prior to the fifth annual payment date is insufficient to pay the remaining balance of the purchase price in full on the fifth annual payment date, then the unpaid amount of the purchase price will be paid in full on March 1, 2021.Transferred assets of the Company’s capital markets business, consisted of customer accounts and goodwill, which had no carrying value to the Company, and the Company recorded a gain on sale of $1,820,000, which reflected the fair value of the purchase obligation. Such fair value (Level 3) was based on the present value of estimated annual installments to be received during 2016 through 2020 from forecasted net income of the transferred business plus a final settlement in 2021, discounted at 11.5% (representing SBS’s weighted average cost of capital). |
|
|
|
The discount recorded for the purchase obligation will be amortized as interest income using an effective yield initially calculated based on the original carrying amount of the obligation and estimated annual installments to be received and adjusted in future periods to reflect actual installments received and changes in estimates of future installments. Interest income recognized on the obligation for the period from November 4, 2014 to December 31, 2014 amounted to $36,641 based on a yield of approximately 12%. |
|
|
|
As a result of the Company’s continuing involvement in the capital markets business through the its 49% ownership in SBSF, results of operations of the capital markets business and the gain on sale were not reflected as discontinued operations in the accompanying financial statements. |
F-6
Note C - Summary Of Significant Accounting Policies
|
|
[1] |
Cash Equivalents: |
|
|
|
Cash equivalents consist of highly liquid investments purchased with an original maturity of 3 months or less. Cash equivalents are carried at fair value and amount to $6,179,000 and $14,839,000 at December 31, 2014 and 2013, respectively, consisting of money market funds. |
|
|
|
Cash equivalents – restricted of $1,532,000 at December 31, 2014 and 2013 representing cash invested in a money market fund which serves as collateral for a secured demand note payable in the amount of $1,200,000 to SBS (see Note J). |
|
|
[2] |
Securities: |
|
|
|
Securities owned are carried at fair value with realized and unrealized gains and losses reflected in trading profits. Siebert clears all its security transactions through unaffiliated clearing firms on a fully disclosed basis. Accordingly, Siebert does not hold funds or securities for, or owe funds or securities to, its customers. Those functions are performed by the clearing firms. |
|
|
[3] |
Fair value of financial instruments: |
|
|
|
Authoritative accounting guidance defines fair value, establishes a framework for measuring fair value and establishes a fair value hierarchy. Fair value is the price that would be received to sell an asset or paid to transfer a liability in an orderly transaction between participants at the measurement date. Fair value measurements are not adjusted for transaction costs. The fair value hierarchy prioritizes inputs to valuation techniques used to measure fair value into three levels: |
|
|
|
Level 1 – Unadjusted quoted prices in active markets for identical assets or liabilities. |
|
|
|
Level 2 – Inputs other than quoted market prices that are observable, either directly or indirectly, and reasonably available. |
|
|
|
Level 3 – Unobservable inputs which reflect the assumptions that management develops based on available information about the assumptions market participants would use in valuing the asset or liability. |
|
|
|
The classification of financial instruments valued at fair value as of December 31, 2014 is as follows: |
|
|
|
|
|
|
|
|
|
|
2014 |
|
2013 |
|
||
Financial Instrument |
|
Level 1 |
|
Level 1 |
|
||
Cash equivalents |
|
$ |
7,711,000 |
|
$ |
16,371,000 |
|
Securities |
|
|
488,000 |
|
|
406,000 |
|
|
|
$ |
8,199,000 |
|
$ |
16,777,000 |
|
|
|
|
Securities consist of common stock, which is valued on the last business day of the year at the last available reported sales price on the primary securities exchange. |
|
|
[4] |
Income Taxes: |
|
|
|
The Company accounts for income taxes utilizing the asset and liability approach requiring the recognition of deferred tax assets and liabilities for the expected future tax consequences of net operating loss carryforwards and temporary differences between the basis of assets and liabilities for financial reporting purposes and tax purposes. |
|
|
[5] |
Furniture, Equipment and Leasehold Improvements: |
|
|
|
Furniture, equipment and leasehold improvements are stated at cost, net of accumulated depreciation and amortization. Depreciation is calculated using the straight-line method over the estimated useful lives of the assets, generally five years. Leasehold improvements are amortized over the shorter of the estimated useful life of the improvements or period of the lease. |
|
|
[6] |
Advertising Costs: |
|
|
|
Advertising costs are charged to expense as incurred. |
F-7
Note C - Summary Of Significant Accounting Policies (continued)
|
|
[7] |
Use of Estimates: |
|
|
|
The preparation of financial statements in conformity with accounting principles generally accepted in the United States of America requires management to make estimates and assumptions that affect the reported amounts of assets and liabilities and disclosure of contingent assets and liabilities at the date of the financial statements and the reported amounts of revenues and expenses during the reporting period. Actual results could differ from those estimates. |
|
|
[8] |
Per Share Data: |
|
|
|
Basic earnings (loss) per share is calculated by dividing net income (loss) by the weighted average outstanding common shares during the year. Diluted earnings per share is calculated by dividing net income by the number of shares outstanding under the basic calculation and adding all dilutive securities, which consist of options. As the Company incurred a net loss for each of the years ended December 31, 2014, 2013 and 2012, basic and diluted net loss per common share are the same for each year as the effect of stock options is anti-dilutive. In 2014, 2013 and 2012, 265,000, 350,000 and 400,000 common shares, respectively, issuable upon the exercise of options were not included in the computation. |
|
|
[9] |
Revenue: |
|
|
|
Commission revenues and related clearing expenses are recorded on a trade-date basis. Fees, consisting principally of revenue participation with the Company’s clearing broker in distribution fees and interest are recorded as earned. In 2014, fees also include investment advisory fees, which are recorded as earned. |
|
|
|
Investment banking revenue includes gains and fees, net of syndicate expenses, arising from underwriting syndicates in which the Company participates. Investment banking management fees are recorded on the offering date, sales concessions on the settlement date and underwriting fees at the time the underwriting is completed and the income is reasonably determinable. |
|
|
|
Trading gains and losses are also recorded on a trade-date basis and principally represent riskless principal transactions which the Company, after receiving an order, buys or sells securities as principal and at the same time sells or buys the securities with a markup or markdown to satisfy the order. |
|
|
|
Interest is recorded on an accrual basis and dividends are recorded on the ex-dividend date. |
|
|
[10] |
Stock-Based Compensation: |
|
|
|
Share-based payments to employees, including grants of employee stock options, are recognized in the statement of operations as an operating expense, based on their fair values on the grant date. Share-based compensation costs are recognized on a straight-line basis over the requisite service periods of awards which would normally be the vesting period of the options. |
|
|
[11] |
Intangibles: |
|
|
|
Purchased intangibles which have finite useful lives are principally being amortized using the straight-line method over estimated useful lives of three to five years. Domain names and other intellectual property which are deemed to have an indefinite useful life are not amortized but are tested for impairment annually or more frequently if events or changes in circumstances indicate that the asset might be impaired. The impairment test for indefinite-lived intangibles consists of a comparison of their fair value with their carrying amount (see note F). |
|
|
[12] |
Valuation of Long-Lived Assets: |
|
|
|
The Company evaluates the recoverability of its long-lived assets including amortizable intangibles and recognizes an impairment loss in the event the carrying value of these assets exceeds the estimated future undiscounted cash flows attributable to these assets. The Company assesses potential impairment to its long-lived assets when events or changes in circumstances indicate that its carrying value may not be recoverable. Should impairment exist, the impairment loss would be measured based on the excess of the carrying value of the assets over their fair value. |
F-8
Note D - Investment In Affiliates
Investment in and advances to, equity in income / (loss) of, and distributions received from, affiliates consist of the following:
|
|
|
|
|
|
|
|
|
|
|
|
December 31, 2014 |
|
|
SBSF |
|
SBSFPC |
|
TOTAL |
|
|||
|
|
|
|
|
|
|
|
|
|
|
|
Investment and advances |
|
$ |
7,979,000 |
|
|
— |
|
|
7,979,000 |
|
|
Income (loss) from equity investees |
|
$ |
84,000 |
|
|
(17,000 |
) |
|
67,000 |
|
|
Distributions |
|
$ |
13,000 |
|
|
173,000 |
|
|
186,000 |
|
|
|
|
|
|
|
|
|
|
|
|
|
|
December 31, 2013 |
|
|
SBS |
|
SBSFPC |
|
TOTAL |
|
|||
|
|
|
|
|
|
|
|
|
|
|
|
Investment and advances |
|
$ |
7,832,000 |
|
|
190,000 |
|
|
8,022,000 |
|
|
Income (loss) from equity investees |
|
$ |
94,000 |
|
|
(159,000 |
) |
|
(65,000 |
) |
|
Distributions |
|
$ |
1,212,000 |
|
|
6,000 |
|
|
1,218,000 |
|
|
|
|
|
|
|
|
|
|
|
|
|
|
December 31, 2012 |
|
|
SBS |
|
SBSFPC |
|
TOTAL |
|
|||
|
|
|
|
|
|
|
|
|
|
|
|
Income from equity investees |
|
$ |
774,000 |
|
$ |
32,000 |
|
$ |
806,000 |
|
|
Distributions |
|
$ |
95,000 |
|
$ |
2,000 |
|
$ |
97,000 |
|
|
Siebert and two individuals (the “Principals”) formed SBS to succeed to the tax-exempt underwriting business of the Siebert Brandford Shank division of Siebert. The agreements with the Principals provide that profits will be shared 51% to the Principals and 49% to Siebert.
Pursuant to the terms of the Operating Agreement, Financial and each of the Principals owned a 33.33% interest in SBSFPC which engaged in derivatives transactions related to the municipal underwriting business. The Operating Agreement provides that income/(loss) be shared 66.66% by the Principals and 33.33% by Financial. SBSFPC ceased operations in December 2014.
Summarized consolidated financial data of SBSF and SBS in 2014 and financial data for SBS in 2013 and 2012 is as follows:
|
|
|
|
|
|
|
|
|
|
|
|
|
2014 |
|
2013 |
|
2012 |
|
|||
|
|
|
|
|
|
|
|
|
|
|
Total assets, including secured demand note of $1,200,000 in each year due from Siebert |
|
$ |
28,518,000 |
|
$ |
22,999,000 |
|
|
|
|
Total liabilities, including subordinated liabilities $1,200,000 in each year and a purchase obligation of $1,857,000 in 2014 due to Siebert |
|
|
12,458,000 |
|
|
7,083,000 |
|
|
|
|
Total members’ capital |
|
|
16,060,000 |
|
|
15,916,000 |
|
|
|
|
Regulatory minimum net capital requirement |
|
|
250,000 |
|
|
250,000 |
|
|
|
|
Total revenue |
|
|
24,806,000 |
|
|
24,965,000 |
|
$ |
28,246,000 |
|
Net income |
|
|
171,000 |
|
|
193,000 |
|
|
1,579,000 |
|
During 2014, 2013 and 2012 Siebert charged SBS $100,000, $100,000, and $75,000 for each year, respectively, for general and administrative services, which Siebert believes approximates the cost of furnishing such services. In addition, during each of the years 2014, 2013 and 2012, Siebert earned interest income of $48,000 from SBS in connection with subordinated loans available or made to SBS and Siebert paid SBS interest earned on restricted cash equivalents of $1,028, $1,500 and $2,900 in 2014, 2013 and 2012, respectively. In addition, in 2014, Siebert earned interest income of $36,641 from SBSF on the purchase obligation in connection with the sale of the capital markets business (see Note B).
Siebert’s share of undistributed earnings from SBSF at December 31, 2014 amounted to $7,477,000 and from SBS at December 31, 2013 amounted to $7,407,000. Undistributed earnings may not be immediately available for distribution to Siebert for various reasons including the amount of SBSF’s available cash, the provisions of the agreement between Siebert and the Principals and SBSF’s continued compliance with its regulatory net capital requirements.
Summarized financial data of SBSFPC is as follows:
|
|
|
|
|
|
|
|
|
|
|
|
|
2014 |
|
2013 |
|
2012 |
|
|||
|
|
|
|
|
|
|
|
|
|
|
Total assets |
|
$ |
26,000 |
|
$ |
584,000 |
|
|
|
|
Total liabilities |
|
|
26,000 |
|
|
15,000 |
|
|
|
|
Total members’ capital |
|
|
0 |
|
|
569,000 |
|
|
|
|
Total revenue |
|
|
0 |
|
|
(222,000 |
)* |
$ |
293,000 |
|
Net income (loss) |
|
|
(51,000 |
) |
|
(478,000 |
) |
|
98,000 |
|
*Negative balance was attributable to loss in derivative contracts
F-9
Note D - Investment In Affiliates (continued)
In July 2013, as a result of the filing of a bankruptcy petition by the City of Detroit, SBSFPC unwound certain derivative contracts with a financial institution pursuant to the terms of the contracts. The contracts were recorded as liabilities with a carrying value of $123,063,000. In connection therewith, SBSFPC assigned certain derivative contracts with the City of Detroit to the financial institution, which were recorded as assets with a carrying value of $123,063,000. No gain or loss was recognized by SBSFPC as a result of the unwinding and assignment of these derivative contracts and SBSFPC has no continuing obligations or rights with respect to the derivative contracts. During the quarter ended March 31, 2013 SBSFPC incurred a loss of $241,000 on the write down in value of the derivative contracts with the City of Detroit to adjust their carrying value to the carrying value of the derivative contracts with the financial institution. The Company received distributions from SBSFPC of $173,000 during 2014 and $6,000 during 2013 which is shown on the statement of cash flows as an investing activity as they represent a return of capital.
Effective September 16, 2013, Suzanne Shank, one of the Principals having 25.5% ownership in SBS and 33.3% interest in SBSFP became the Company’s chief executive officer. On March 3, 2015 Ms. Shank completed her role as acting chief executive officer of the Company to devote full time to her continuing position as chief executive officer of SBSF.
Note E - Furniture, Equipment And Leasehold Improvements, Net
Furniture, equipment and leasehold improvements consist of the following:
|
|
|
|
|
|
|
|
|
|
December 31, |
|
||||
|
|
2014 |
|
2013 |
|
||
|
|
|
|
|
|
|
|
Equipment |
|
$ |
524,000 |
|
$ |
518,000 |
|
Leasehold improvements |
|
|
546,000 |
|
|
427,000 |
|
Furniture and fixtures |
|
|
43,000 |
|
|
14,000 |
|
|
|
|
1,113,000 |
|
|
959,000 |
|
Less accumulated depreciation and amortization |
|
|
(504,000 |
) |
|
(247,000 |
) |
|
|
|
|
|
|
|
|
|
|
$ |
609,000 |
|
$ |
712,000 |
|
Depreciation and amortization expense for the years ended December 31, 2014, 2013 and 2012 amounted to $257,000, $120,000 and $274,000, respectively.
Due to the Company’s discontinuation of its relationship with a software vendor on June 30, 2012, which had developed and maintained the Company’s website, the Company wrote-off remaining related software development costs of $433,000. The unamortized carrying value of such development costs consisted of $1,856,000 of cost net of $1,423,000 of accumulation amortization. Effective July 1, 2012, such services are provided by the Company’s clearing broker.
Note F - Intangible Assets
In 2000, WFN acquired the stock of Women’s Financial Network, Inc. and HerDollar.com, Inc., companies in the development stage which had yet to commence principal operations and had no significant revenue for aggregate consideration of $2,310,000, including costs. The transactions were accounted for as purchases of assets consisting of domain name, website and content, and a non-compete agreement (the “Acquired Intangible Assets”). Related deferred tax assets attributable to net operating loss carryforwards of the acquired companies and deferred tax liabilities attributable to the excess of the statement bases of the acquired assets over their tax bases were reflected as an adjustment to the carrying amount of such intangibles (see Note G).
Intangible assets consist of the following:
|
|
|
|
|
|
|
|
|
|
|
|
|
|
|
|
December 31, 2014 |
|
December 31, 2013 |
|
||||||||
|
|
Gross |
|
Accumulated |
|
Gross |
|
Amortization |
|
||||
Amortizable intangible assets: |
|
|
|
|
|
|
|
|
|
|
|
|
|
Website, content and non-compete |
|
$ |
1,850,000 |
|
|
1,850,000 |
|
$ |
1,850,000 |
|
$ |
1,850,000 |
|
Retail brokerage accounts |
|
|
2,638,000 |
|
|
2,630,000 |
|
|
2,638,000 |
|
|
2,620,000 |
|
|
|
$ |
4,488,000 |
|
|
4,480,000 |
|
$ |
4,488,000 |
|
$ |
4,470,000 |
|
|
|
|
|
|
|
|
|
|
|
|
|
|
|
Amortization expense |
|
|
|
|
$ |
10,000 |
|
|
|
|
$ |
10,000 |
|
F-10
Note F - Intangible Assets (continued)
During 2012, the Company recorded impairment charges and wrote down the carrying value of its unamortized intangible assets consisting of domain name and intellectual property by $300,000, representing the excess of carrying value over its fair value due to a continuing decline in the Company’s revenue attributable to such intangibles. During the fourth quarter of 2013, as a result of management’s continuing strategic review of its operations, the Company determined to substantially reduce the amount of resources allocated to the WFN domain. Accordingly, the Company wrote off the remaining carrying value of the intangible asset of $300,000. No significant residual value is estimated for the asset.
Note G - Income Taxes
Financial files a consolidated federal income tax return with its subsidiaries.
Income tax expense consists of the following:
|
|
|
|
|
|
|
|
|
|
|
|
|
Year Ended December 31, |
|
|||||||
|
|
2014 |
|
2013 |
|
2012 |
|
|||
|
|
|
|
|
|
|
|
|
|
|
Federal income tax expense: |
|
|
|
|
|
|
|
|
|
|
|
|
|
|
|
|
|
|
|
|
|
Current |
|
$ |
— |
|
$ |
19,000 |
|
$ |
— |
|
Deferred |
|
|
— |
|
|
— |
|
|
— |
|
|
|
|
— |
|
|
19,000 |
|
|
— |
|
|
|
|
|
|
|
|
|
|
|
|
State and local: |
|
|
|
|
|
|
|
|
|
|
|
|
|
|
|
|
|
|
|
|
|
Current |
|
|
— |
|
|
— |
|
|
34,000 |
|
Deferred |
|
|
— |
|
|
— |
|
|
— |
|
|
|
|
— |
|
|
— |
|
|
34,000 |
|
|
|
|
|
|
|
|
|
|
|
|
Total: |
|
|
|
|
|
|
|
|
|
|
Current |
|
|
— |
|
|
19,000 |
|
|
34,000 |
|
Deferred |
|
|
— |
|
|
— |
|
|
— |
|
|
|
$ |
— |
|
$ |
19,000 |
|
$ |
34,000 |
|
Reconciliation between the income tax provision and income taxes computed by applying the statutory Federal income tax rate to loss before income taxes is as follows:
|
|
|
|
|
|
|
|
|
|
|
|
|
Year Ended December 31, |
|
|||||||
|
|
2014 |
|
2013 |
|
2012 |
|
|||
|
|
|
|
|
|
|
|
|
|
|
Expected income tax benefit at statutory Federal tax rate (34%) |
|
$ |
(2,229,000 |
) |
$ |
(2,004,000 |
) |
$ |
(47,000 |
) |
State and local taxes, net of Federal tax effect |
|
|
(459,000 |
) |
|
(413,000 |
) |
|
22,000 |
|
Increase in valuation allowance |
|
|
2,551000 |
|
|
2,342,000 |
|
|
— |
|
Permanent difference |
|
|
39,000 |
|
|
46,000 |
|
|
36,000 |
|
Other |
|
|
98,000 |
|
|
48,000 |
|
|
23,000 |
|
|
|
|
|
|
|
|
|
|
|
|
Income tax expense |
|
$ |
0 |
|
$ |
19,000 |
|
$ |
34,000 |
|
F-11
Note G - Income Taxes (Continued)
The principal items giving rise to deferred tax assets (liabilities) are as follows:
|
|
|
|
|
|
|
|
|
|
December 31, |
|
||||
|
|
2014 |
|
2013 |
|
||
Deferred tax assets: |
|
|
|
|
|
|
|
Net operating loss credit carryforwards |
|
$ |
8,046,000 |
|
$ |
4,670,000 |
|
Alternative minimum tax carryforward |
|
|
9,000 |
|
|
15,000 |
|
Employee stock based compensation |
|
|
237,000 |
|
|
237,000 |
|
Retail brokerage accounts |
|
|
211,000 |
|
|
281,000 |
|
Contribution carryover |
|
|
223,000 |
|
|
347,000 |
|
Furniture, equipment and leasehold improvements |
|
|
115,000 |
|
|
96,000 |
|
Accrued expenses |
|
|
337,000 |
|
|
83,000 |
|
Investment in affiliate (a) |
|
|
736,000 |
|
|
1,001,000 |
|
Accrued compensation and other |
|
|
— |
|
|
44,000 |
|
Capital loss carryforwards |
|
|
24,000 |
|
|
— |
|
Other |
|
|
30,000 |
|
|
— |
|
|
|
|
|
|
|
|
|
Total |
|
|
9,968,000 |
|
|
6,774,000 |
|
Valuation allowance |
|
|
(9,218,000 |
) |
|
(6,774,000 |
) |
|
|
|
|
|
|
|
|
Net deferred tax assets |
|
|
750,000 |
|
|
— |
|
Deferred tax liability: |
|
|
|
|
|
|
|
Receivable from affiliate (b) |
|
|
(750,000 |
) |
|
— |
|
|
|
|
|
|
|
|
|
|
|
$ |
0 |
|
$ |
0 |
|
|
|
|
|
(a) |
Attributable to non-deductible bonus accrued at December 31, 2014 and 2013 by an affiliate, which will be deductible in 2015 and 2014, respectively. |
|
|
|
|
(b) |
Relates to receivable from business sold to affiliate treated as an installment sale for tax purposes. |
Due to cumulative losses incurred by the Company during the current and prior two years, the Company is unable to conclude that it is more likely than not that it will realize its deferred tax asset in excess of the deferred tax liability and, accordingly, has recorded a valuation allowance to fully offset such amount at December 31, 2014 and 2013.
At December 31, 2014, the Company has state net operating loss carryforwards aggregating $23.6 million, which expires through 2034 in various states. In addition, the Company has federal net operating loss carryforwards of $18.1 million at December 31, 2014, which expires through 2034. The Company also has additional federal net operating loss carryforwards of $410,000 at December 31, 2014 which is attributable to WFN and expires through 2020. Utilization of WFN’s federal net operating loss carryforwards is subject to annual limitations under Section 382 of the Internal Revenue Code.
The Company applied the “more-likely-than not” recognition threshold to all tax positions taken or expected to be taken in a tax return which resulted in no unrecognized tax benefits reflected in the financial statements as of December 31, 2014. The Company classifies interest and penalties that would accrue according to the provisions of relevant tax law as income taxes.
The provision for income taxes in 2013 represents a federal minimum tax assessment of $19,000 including $4,000 of interest and penalties, relating to the year 2012.The provision for income taxes in 2012 represents a state tax assessment of 34,000 relating to years 2007, 2008 and 2009 based on a tax examination completed by New York State in 2012. Tax years 2011 and thereafter are subject to examinations by federal and certain state authorities. For other states the 2009 through 2013 tax years remain open for examinations. The Company is currently under tax examination by New York State for the tax years 2010 and 2011.
Note H - Stockholders’ Equity
Siebert is subject to the SEC’s Uniform Net Capital Rule (Rule 15c3-1), which requires the maintenance of minimum net capital. Siebert has elected to use the alternative method, permitted by the rule, which requires that Siebert maintain minimum net capital, as defined, equal to the greater of $250,000 or 2 percent of aggregate debit balances arising from customer transactions, as defined. The Net Capital Rule of the New York Stock Exchange also provides that equity capital may not be withdrawn or cash dividends paid if resulting net capital would be less than 5% of aggregate debits. At December 31, 2014 and 2013, Siebert had net capital of approximately $5,100,000 and $13,000,000, respectively, as compared with net capital requirements of $250,000. Siebert claims exemption from the reserve requirement under Section 15c3-3(k)(2)(ii) as it clears its customer transactions through an unaffiliated clearing firm on a fully disclosed basis.
F-12
Note h - Stockholders’ Equity (continued)
On January 23, 2008, the Board of Directors of the Company authorized a buy back of up to 300,000 shares of common stock. Shares will be purchased from time to time in the open market and in private transactions. During 2012 and 2013, the Company repurchased 8,107 and 12,266 shares of common stock at an average price of $1.67 and $1.56, respectively. No shares were purchased during 2014. As of December 31, 2014, 129,137 of common shares have been repurchased pursuant to such authorization.
Note I - Options
The Company’s 2007 Long-Term Incentive Plan (the “Plan”) authorizes the grant of options to purchase up to an aggregate of 2,000,000 shares, subject to adjustment in certain circumstances. Both non-qualified options and options intended to qualify as “Incentive Stock Options” under Section 422 of the Internal Revenue Code may be granted under the Plan. A Stock Option Committee of the Board of Directors administers the Plan. The committee has the authority to determine when options are granted, the term during which an option may be exercised (provided no option has a term exceeding 10 years), the exercise price and the exercise period. The exercise price shall not be less than the fair market value on the date of grant. No option may be granted under the Plan after December 2017. Generally, employee options vest 20% per year for five years and expire ten years from the date of grant. At December 31, 2014, options for 1,760,000 shares of common stock are available for grant under the Plan.
A summary of the Company’s stock option transactions for the three years ended December 31, 2014 is presented below:
|
|
|
|
|
|
|
|
|
|
|
|
|
|
|
|
|
|
|
|
|
|
2014 |
|
2013 |
|
2012 |
|
||||||||||||
|
|
|
|
|
|||||||||||||||
|
|
Shares |
|
Weighted |
|
Shares |
|
Weighted |
|
Shares |
|
Weighted |
|
||||||
|
|
|
|
|
|
|
|
||||||||||||
Outstanding - beginning of the year |
|
|
350,000 |
|
|
3.10 |
|
|
400,000 |
|
|
3.33 |
|
|
1,228,200 |
|
$ |
3.88 |
|
Cancelled |
|
|
(60,000 |
) |
|
3.05 |
|
|
— |
|
|
— |
|
|
— |
|
|
— |
|
Forfeited |
|
|
— |
|
|
|
|
|
(25,000 |
) |
|
5.06 |
|
|
— |
|
|
— |
|
Expired |
|
|
(25,000 |
) |
|
4.04 |
|
|
(25,000 |
) |
|
4.75 |
|
|
(828,200 |
) |
$ |
4.14 |
|
|
|
|
|
|
|
|
|
||||||||||||
|
|
|
|
|
|
|
|
|
|
|
|
|
|
|
|
|
|
|
|
Outstanding - end of year |
(a) |
|
265,000 |
|
|
3.02 |
|
|
350,000 |
|
|
3.10 |
|
|
400,000 |
|
$ |
3.33 |
|
|
|
|
|
|
|
|
|
||||||||||||
|
|
|
|
|
|
|
|
|
|
|
|
|
|
|
|
|
|
|
|
Fully vested and exercisable at end of year |
(a) |
|
265,000 |
|
|
3.02 |
|
|
350,000 |
|
|
3.10 |
|
|
400,000 |
|
$ |
3.33 |
|
|
|
|
|
|
|
|
|
||||||||||||
|
|
(a) |
Weighted average remaining contractual terms of 3.51 years and no aggregate intrinsic value. |
For the year ended December 31, 2014, 2013 and 2012, no stock options were granted.
As of December 31, 2014, there was no unrecognized compensation cost.
Note J - Commitments, Contingencies And Other
|
|
|
|
(1) |
Retail customer transactions are cleared through clearing brokers on a fully disclosed basis. If customers do not fulfill their contractual obligations, the clearing broker may charge Siebert for any loss incurred in connection with the purchase or sale of securities at prevailing market prices to satisfy the customer obligations. Siebert regularly monitors the activity in its customer accounts for compliance with its margin requirements. Siebert is exposed to the risk of loss on unsettled customer transactions if customers are unable to fulfill their contractual obligations. There were no material losses for unsettled customer transactions in 2014, 2013 or 2012. Credit risk represents the potential loss that would occur if counterparties fail to perform pursuant to the terms of their obligations. The Company is subject to credit risk to the extent a custodian or broker with whom it conducts business is unable to fulfill contractual obligations. |
|
|
|
|
(2) |
In 2012, Siebert was named as one of the defendants in a class action pending in the United States District Court, Southern District of New York. The complaint was brought on behalf of a class of purchasers in a public offering by Lehman Brothers Holdings, Inc. of $1,500,000,000 of 6.75% Subordinated Notes due 2017 (the “Notes”) as to Siebert and certain smaller issuances of other securities. The complaint asserted that Siebert and other underwriters of the Notes violated Section 11 of The Securities Act of 1933 in that relevant offering materials were false and misleading. Siebert had agreed to purchase $15 million of the Notes and $462,953 of the other securities as an underwriter in the offerings. Siebert and the plaintiffs’ class agreed to resolve all claims against Siebert in consideration of a $1 million payment by Siebert which was accrued and |
F-13
|
|
|
|
Note J - Commitments, Contingencies And Other (continued) |
|
|
|
|
|
charged to expense in 2011 and paid in 2012. In the prior year certain plaintiffs did not agree to a settlement or purchased securities which were not covered by the settlement. In 2013, all such claims were either dismissed or settled for an amount that was not material. |
|
|
|
|
|
Siebert is party to certain claims, suits and complaints arising in the ordinary course of business. In the opinion of management, all such claims, suits and complaints are without merit, or involve amounts which would not have a significant effect on the financial position or results of operations of the Company. |
|
|
|
|
(3) |
In July 2014, the Company entered into a settlement agreement in regards to a dispute with a former employee, in which the former employee sought, among other things, damages arising from his separation from the Company. The Company asserted counter claims in the arbitration. Pursuant to the settlement, the Company paid $4,300,000 to the former employee, and the claims and counterclaims have been dismissed and released. The accompanying 2014 statement of operations reflects a charge to give effect to the settlement. |
|
|
|
|
(4) |
The Company rents discount retail brokerage and other office space under long-term operating leases expiring in various periods through 2017. These leases call for base rent plus escalations for taxes and operating expenses. |
|
|
|
|
|
Future minimum base rental payments under these operating leases are as follows: |
|
|
|
|
|
|
Year Ending |
|
Amount |
|
|
|
|
|
|
|
2015 |
|
|
615,000 |
|
2016 |
|
|
482,000 |
|
2017 |
|
|
80,000 |
|
|
|
|
||
|
|
$ |
1,177,000 |
|
|
|
|
||
|
|
|
|
Rent expense, including escalations for operating costs, amounted to approximately $788,000, $1,046,000 and $907,000 for the years ended December 31, 2014, 2013 and 2012, respectively. Rent is being charged to expense over the entire lease term on a straight-line basis. |
|
|
|
|
(5) |
Siebert sponsors a defined contribution retirement plan under Section 401(k) of the Internal Revenue Code that covers substantially all employees. Participant contributions to the plan are voluntary and are subject to certain limitations. Siebert may also make discretionary contributions to the plan. No contributions were made by Siebert in 2014, 2013 and 2012. |
|
|
|
|
(6) |
Siebert is party to a Secured Demand Note Collateral Agreement with SBS which obligates Siebert to lend SBS, on a subordinated basis, up to $1,200,000. The secured demand note payable held by SBS and a related $1,200,000 receivable due from SBS are included in investments in and advances to equity investees in the accompanying consolidated statement of financial condition. Amounts that Siebert is obligated to lend under this arrangement are collateralized by cash equivalents of $1,532,000. Any amounts loaned will bear interest at 4% per annum and are repayable on August 31, 2015. |
|
|
|
|
(7) |
During 2012, commission income earned from one customer accounted for approximately 12% of total revenue. |
|
Note k - Summarized Quarterly Financial Data (Unaudited)
|
|
|
|
|
|
|
|
|
|
|
|
|
|
|
|
|
|
|
|
|
|
|
|
|
|
|
|
2014 |
|
2013 |
|
||||||||||||||||||||
|
|
First |
|
Second |
|
Third |
|
Fourth |
|
First |
|
Second |
|
Third |
|
Fourth |
|
||||||||
Revenue |
|
$ |
3,718,000 |
|
|
3,705,000 |
|
|
3,454,000 |
|
|
4,975,000 |
|
$ |
4,266,000 |
|
|
4,278,000 |
|
|
3,666,000 |
|
|
4,191,000 |
|
Net income (loss) |
|
$ |
28,000 |
|
|
(6,077,000 |
)* |
|
(1,456,000 |
) |
|
948,000 |
|
$ |
(1,369,000 |
) |
|
(1,353,000 |
) |
|
(1,644,000 |
) |
|
(1,546,000 |
) |
Earnings (loss) per share: |
|
|
|
|
|
|
|
|
|
|
|
|
|
|
|
|
|
|
|
|
|
|
|
|
|
Basic |
|
$ |
.00 |
|
|
(.28 |
) |
|
(.07 |
) |
|
.04 |
|
$ |
(.06 |
) |
|
(.06 |
) |
|
(.07 |
) |
|
(.07 |
) |
Diluted |
|
$ |
.00 |
|
|
(.28 |
) |
|
(.07 |
) |
|
.04 |
|
$ |
(.06 |
) |
|
(.06 |
) |
|
(.07 |
) |
|
(.07 |
) |
|
|
|
|
|
|
|
|
|
|
|
|
|
|
|
|
|
|
|
|
|
|
|
|
|
|
• Includes $4,300,000 (0.19 per share) loss related to arbitration settlement (see Note J3). |
|
|
|
|
|
|
|
|
|
|
|
|
|
|
|
|
|
|
|
|
|
|
|
|
|
F-14
REPORT OF INDEPENDENT REGISTERED PUBLIC ACCOUNTING FIRM
Board
of Managers
Siebert Brandford Shank Financial, L.L.C.
Siebert Brandford Shank & Co., L.L.C.
New York, New York
We have audited the accompanying statements of financial condition of Siebert Brandford Shank Financial L.L.C. and subsidiary (the “Company”) as of December 31, 2014 and of Siebert, Brandford, Shank & Co., L.L.C. at December 31, 2013 (the “Company”), and the related statements of operations, changes in members’ capital and cash flows for each of the years in the three-year period ended December 31, 2014. These financial statements are the responsibility of the Company’s management. Our responsibility is to express an opinion on these financial statements based on our audits.
We conducted our audits in accordance with the standards of the Public Company Accounting Oversight Board (United States). Those standards require that we plan and perform the audit to obtain reasonable assurance about whether the financial statements are free of material misstatement. The Company is not required to have, nor were we engaged to perform, an audit of its internal control over financial reporting. Our audits included consideration of internal control over financial reporting as a basis for designing audit procedures that are appropriate in the circumstances, but not for the purpose of expressing an opinion on the effectiveness of the Company’s internal control over financial reporting. Accordingly, we express no such opinion. An audit also includes examining, on a test basis, evidence supporting the amounts and disclosures in the financial statements, assessing the accounting principles used and significant estimates made by management, as well as evaluating the overall financial statement presentation. We believe that our audits provide a reasonable basis for our opinion.
In our opinion, the financial statements referred to above present fairly, in all material respects, the consolidated financial position of Siebert Brandford Shank Financial L.L.C. and subsidiary as of December 31, 2014 and the financial position of Siebert, Brandford, Shank & Co., L.L.C. at December 31, 2013, and the results of their operations and their cash flows for each of the years in the three-year period ended December 31, 2014, in conformity with accounting principles generally accepted in the United States of America.
/s/ EisnerAmper LLP
New York, New York
February 26, 2015
F-15
Statements of Financial Condition
|
|
|
|
|
|
|
|
|
|
December 31, |
|
||||
|
|
2014 |
|
2013 |
|
||
|
|
SIEBERT,
BRANDFORD, |
|
SIEBERT,
BRANDFORD, |
|
||
|
|
|
|
|
|
|
|
ASSETS |
|
|
|
|
|
|
|
Cash and cash equivalents |
|
$ |
20,065,062 |
|
$ |
19,787,407 |
|
Accounts receivable |
|
|
1,593,614 |
|
|
562,147 |
|
Due from broker |
|
|
2,522,557 |
|
|
8,158 |
|
Secured demand note |
|
|
1,200,000 |
|
|
1,200,000 |
|
Goodwill - Note B |
|
|
1,001,000 |
|
|
— |
|
Issuer relationships, net of amortization of $41,212 - Note B |
|
|
777,788 |
|
|
— |
|
Furniture, equipment and leasehold improvements, net |
|
|
684,736 |
|
|
822,133 |
|
Other assets |
|
|
673,276 |
|
|
618,743 |
|
|
|
|
|
|
|
|
|
|
|
$ |
28,518,033 |
|
$ |
22,998,588 |
|
|
|
|
|
|
|
|
|
LIABILITIES AND MEMBERS’ CAPITAL |
|
|
|
|
|
|
|
Liabilities: |
|
|
|
|
|
|
|
Payable to affiliate |
|
$ |
104,320 |
|
$ |
28,264 |
|
Asset purchase obligation payable to affiliate, net of unamortized discount of $1,143,359 |
|
|
1,856,641 |
|
|
— |
|
Accounts payable and accrued expenses |
|
|
4,747,648 |
|
|
4,006,608 |
|
Bank Overdraft |
|
|
— |
|
|
1,225,779 |
|
Deferred rent |
|
|
549,287 |
|
|
622,075 |
|
|
|
|
7,257,896 |
|
|
|
|
|
|
|
|
|
|
5,882,726 |
|
|
|
|
|
|
|
|
|
Subordinated debt |
|
|
5,200,000 |
|
|
1,200,000 |
|
|
|
|
|
|
|
|
|
Total liabilities |
|
|
12,457,896 |
|
|
7,082,726 |
|
Commitments (Note G) |
|
|
|
|
|
|
|
Members’ capital |
|
|
16,060,137 |
|
|
15,915,862 |
|
|
|
|
|
|
|
|
|
|
|
$ |
28,518,033 |
|
$ |
22,998,588 |
|
See notes to financial statements
F-16
|
|
|
|
|
|
|
|
|
|
|
|
|
Years Ended December 31, |
|
|||||||
|
|
2014 |
|
2013 |
|
2012 |
|
|||
|
|
SIEBERT,
BRANDFORD, |
|
SIEBERT,
BRANDFORD, |
|
SIEBERT,
BRANDFORD, |
|
|||
Revenues: |
|
|
|
|
|
|
|
|
|
|
Investment banking |
|
$ |
20,949,508 |
|
$ |
20,847,546 |
|
$ |
23,092,819 |
|
Trading profits |
|
|
3,670,726 |
|
|
4,114,958 |
|
|
5,149,140 |
|
Commissions |
|
|
182,771 |
|
|
— |
|
|
— |
|
Interest and other |
|
|
3,395 |
|
|
2,817 |
|
|
4,389 |
|
|
|
|
|
|
|
|
|
|
|
|
|
|
|
24,806,400 |
|
|
24,965,321 |
|
|
28,246,348 |
|
|
|
|
|
|
|
|
|
|
|
|
Expenses: |
|
|
|
|
|
|
|
|
|
|
Employee compensation and benefits |
|
|
17,819,595 |
|
|
18,619,549 |
|
|
20,541,452 |
|
Clearing fees |
|
|
383,538 |
|
|
122,209 |
|
|
129,694 |
|
Communications |
|
|
929,496 |
|
|
889,207 |
|
|
905,970 |
|
Occupancy |
|
|
1,186,967 |
|
|
1,088,755 |
|
|
1,052,908 |
|
Professional fees |
|
|
895,951 |
|
|
528,313 |
|
|
591,175 |
|
Interest, including amortization of discount (including $84,691, 48,000 and 48,000 to affiliate) |
|
|
136,936 |
|
|
48,000 |
|
|
66,718 |
|
State and local income tax |
|
|
31,901 |
|
|
36,326 |
|
|
78,706 |
|
General and administrative (including $100,000, 100,000 and 75,000 to affiliate) |
|
|
3,251,269 |
|
|
3,440,071 |
|
|
3,300,549 |
|
|
|
|
|
|
|
|
|
|
|
|
|
|
|
24,635,653 |
|
|
24,772,430 |
|
|
26,667,172 |
|
|
|
|
|
|
|
|
|
|
|
|
Net income |
|
$ |
170,747 |
|
$ |
192,891 |
|
$ |
1,579,176 |
|
See notes to financial statements
F-17
SIEBERT, BRANDFORD, SHANK FINANCIAL, L.L.C. AND SUBSIDIARY
Statements of Changes in Members’ Capital
|
|
|
|
|
Balance - January 1, 2012 (a) |
|
$ |
16,811,116 |
|
Distributions to members |
|
|
(193,792 |
) |
Net income |
|
|
1,579,176 |
|
|
|
|
|
|
Balance - December 31, 2012 (a) |
|
|
18,196,500 |
|
Distributions to members |
|
|
(2,473,529 |
) |
Net income |
|
|
192,891 |
|
|
|
|
|
|
Balance - December 31, 2013 (a) |
|
|
15,915,862 |
|
Distributions to members |
|
|
(26,472 |
) |
Net income |
|
|
170,747 |
|
|
|
|
|
|
Balance - December 31, 2014 |
|
$ |
16,060,137 |
|
(a) Represents members’ capital of Siebert, Brandford, Shank & Co., L.L.C.
See notes to financial statements
F-18
|
|
|
|
|
|
|
|
|
|
|
|
|
Years Ended December 31, |
|
|||||||
|
|
2014 |
|
2013 |
|
2012 |
|
|||
|
|
SIEBERT,
BRANDFORD, |
|
SIEBERT,
BRANDFORD, |
|
SIEBERT,
BRANDFORD, |
|
|||
Cash flows from operating activities: |
|
|
|
|
|
|
|
|
|
|
Net income |
|
$ |
170,747 |
|
$ |
192,891 |
|
$ |
1,579,176 |
|
Adjustments to reconcile net income to net cash (used in) /provided by operating activities: |
|
|
|
|
|
|
|
|
|
|
Amortization of discount on obligation due affiliate |
|
|
36,641 |
|
|
— |
|
|
— |
|
Depreciation and amortization |
|
|
267,973 |
|
|
250,154 |
|
|
266,093 |
|
Changes in: |
|
|
|
|
|
|
|
|
|
|
Accounts receivable |
|
|
(1,031,467 |
) |
|
395,913 |
|
|
(739,538 |
) |
Due to/from broker |
|
|
(2,514,399 |
) |
|
(2,328,918 |
) |
|
2,323,885 |
|
Securities owned, at fair value |
|
|
0 |
|
|
11,264,998 |
|
|
(11,264,998 |
) |
Other assets |
|
|
(54,533 |
) |
|
139,264 |
|
|
81,554 |
|
Payable to (receivable from) affiliates |
|
|
76,056 |
|
|
36,929 |
|
|
(27,506 |
) |
Accounts payable and accrued expenses |
|
|
741,040 |
|
|
(1,368,577 |
) |
|
(1,277,796 |
) |
Bank overdraft |
|
|
(1,225,779 |
) |
|
1,225,779 |
|
|
— |
|
Deferred rent |
|
|
(72,788 |
) |
|
(9,740 |
) |
|
(54,848 |
) |
|
|
|
|
|
|
|
|
|
|
|
Net cash (used in) /provided by operating activities |
|
|
(3,606,509 |
) |
|
9,798,693 |
|
|
(9,113,978 |
) |
|
|
|
|
|
|
|
|
|
|
|
Cash flows from investing activities: |
|
|
|
|
|
|
|
|
|
|
Purchase of leasehold improvements and equipment |
|
|
(89,364 |
) |
|
(47,759 |
) |
|
(63,381 |
) |
|
|
|
|
|
|
|
|
|
|
|
Cash flows from financing activities: |
|
|
|
|
|
|
|
|
|
|
Distributions to members |
|
|
(26,472 |
) |
|
(2,473,529 |
) |
|
(193,792 |
) |
Subordinated borrowings |
|
|
9,000,000 |
|
|
— |
|
|
— |
|
Subordinated repayments |
|
|
(5,000,000 |
) |
|
— |
|
|
(6,000,000 |
) |
|
|
|
|
|
|
|
|
|
|
|
Net cash provided by/ (used in) financing activities |
|
|
3,973,528 |
|
|
(2,473,529 |
) |
|
(6,193,792 |
) |
|
|
|
|
|
|
|
|
|
|
|
Net increase/(decrease) in cash and cash equivalents |
|
|
277,655 |
|
|
7,277,405 |
|
|
(15,371,151 |
) |
Cash and cash equivalents - beginning of year |
|
|
19,787,407 |
|
|
12,510,002 |
|
|
27,881,153 |
|
|
|
|
|
|
|
|
|
|
|
|
Cash and cash equivalents - end of year |
|
$ |
20,065,062 |
|
$ |
19,787,407 |
|
$ |
12,510,002 |
|
|
|
|
|
|
|
|
|
|
|
|
Supplemental disclosures of cash flow information: |
|
|
|
|
|
|
|
|
|
|
Taxes paid |
|
$ |
24,323 |
|
$ |
28,177 |
|
$ |
101,517 |
|
Interest paid |
|
$ |
100,295 |
|
$ |
48,000 |
|
$ |
66,718 |
|
|
|
|
|
|
|
|
|
|
|
|
Non-cash investing and financing activities: |
|
|
|
|
|
|
|
|
|
|
|
|
|
|
|
|
|
|
|
|
|
Note payable for purchase of business from affiliate |
|
$ |
1,820,000 |
|
|
|
|
|
|
|
Intangible assets acquired related to business acquired from affiliate: |
|
|
|
|
|
|
|
|
|
|
Issuer relationships |
|
$ |
(819,000 |
) |
|
|
|
|
|
|
|
|
|
|
|
|
|
|
|
|
|
Goodwill |
|
$ |
(1,001,000 |
) |
|
|
|
|
|
|
See notes to financial statements
F-19
SIEBERT, BRANDFORD, SHANK FINANCIAL, L.L.C. AND SUBSIDIARY
Notes to Financial Statements
December 31, 2014 and 2013
NOTE A – BUSINESS ORGANIZATION:
Siebert, Brandford, Shank Financial, L.L.C. (“SBSF” or the “Company”) was organized on November 4, 2014 and through its wholly owned subsidiary, Siebert, Brandford, Shank & Co., L.L.C. (“SBS”), engages in the business of tax-exempt underwriting and related trading activities and, commencing on November 4, 2014, the capital markets business (see Note B). The Company qualifies as a Minority and Women Owned Business Enterprise in certain municipalities.
NOTE B – BUSINESS ACQUISITION
On November 4, 2014, the members of SBS contributed their membership interest into a newly formed Delaware limited liability company, Siebert Brandford Shank Financial, L.L.C. (“SBSF”), in exchange for the same percentage interests in SBSF. On the same day Muriel Siebert & Co., Inc., (“Siebert”) entered an Asset Purchase Agreement (the “Purchase Agreement”) with SBS and SBSF, pursuant to which Siebert sold substantially all of the assets relating to Siebert’s capital markets business to SBSF. Pursuant to the Purchase Agreement, SBSF assumed post-closing liabilities relating to the transferred business. An individual having a 25.5% membership interest in SBS prior to the contribution of membership interests to SBSF, is Siebert’s chief executive officer.
The Purchase Agreement provides for an aggregate purchase price for the disposition of $3,000,000, payable by SBSF after closing in annual installments commencing on March 1, 2016 and continuing on each of March 1, 2017, 2018, 2019 and 2020. The transferred business was contributed by SBSF to, and operated by SBS. The amount payable on each annual payment date will equal 50% of the net income attributable to the transferred business recognized by SBS in accordance with generally accepted accounting principles during the fiscal year ending immediately preceding the applicable payment date; provided that, if net income attributable to the transferred business generated prior to the fifth annual payment date is insufficient to pay the remaining balance of the purchase price in full on the fifth annual payment date, then the unpaid amount of the purchase price will be paid in full on March 1, 2021.
The fair value (Level 3 – see Note C(3)) of the $3,000,000 purchase obligation was determined to be $1,820,000, based on the present value of estimated annual installments to be paid during 2016 through 2020 from forecasted net income of the transferred business plus a final settlement in 2021, discounted at 11.5% (representing SBS’s weighted average cost of capital). The discount of $1,180,000 recorded for the purchase obligation is being amortized as interest expense using an effective yield initially calculated based on the original carrying amount of the obligation and estimated annual installments to be paid and adjusted in future periods to reflect actual installments paid and changes in estimates of future installments. Interest expense recognized on the obligation for the period from November 4, 2014 to December 31, 2014 amounted to $36,641 based on a yield of approximately 12%.
Transferred assets of Siebert’s capital markets business, consisted of issuer relationships and goodwill. Issuer relationships, were recorded at $819,000 representing their fair value at the date of acquisition determined based on a discounted cash flow analysis (Level 3). Goodwill, which includes employees of Siebert who transferred to SBS, was recorded at $1,001,000, representing the excess of the fair value ($1,820,000) of SBSF’s purchase obligation to Siebert over the fair value of the issuer relationships.
Since the date of acquisition, revenue of $199,000 and net loss of $129,000 attributable to the capital markets business is included in the accompanying statement of operations.
The following represents the unaudited pro forma amounts of revenue and net income of the Company for the year ended December 31, 2014, assuming the capital markets business had been acquired as of January 1, 2014:
|
|
|
|
|
Revenue |
|
$ |
27,729,000 |
|
Net Income |
|
$ |
672,000 |
|
The above net income reflects the additional amortization that would have been charged assuming the fair value adjustment to customer accounts had been applied as of January 1, 2014 and amortization of discount on the purchase obligation for the entire year.
F-20
NOTE C – SUMMARY OF SIGNIFICANT ACCOUNTING POLICIES
|
|
|
[1] |
Principles of Consolidation: |
|
|
|
|
|
Commencing on November 4, 2014, the accompanying financial statements include the accounts of SBSF and its wholly-owned subsidiary SBS after elimination of intercompany balances and transactions. Prior thereto, the financial statements represent those of SBS. The creation of SBSF and related transfer thereto of the members’ interest in SBS did not result in any change in the carrying value of the existing assets or liabilities of SBS in the consolidated financial statements as both entities were under common control. |
|
|
|
|
[2] |
Revenues: |
|
|
|
|
|
Investment banking revenues include gains and fees, net of syndicate expenses, arising primarily from municipal bond offerings in which the Company acts as an underwriter or agent. Investment banking management fees are recorded on the offering date, sales concessions on the settlement date, and underwriting fees at the time the underwriting is completed and the income is reasonably determinable |
|
|
|
|
|
Security transactions are recorded on a trade-date basis. Securities owned are valued at fair value. The resulting realized and unrealized gains and losses are reflected as trading profits. |
|
|
|
|
|
Commission revenue which relates to the capital market business are recorded on a trade date basis. |
|
|
|
|
|
Dividends are recorded on the ex-dividend date, and interest income is recognized on an accrual basis. |
|
|
|
|
[3] |
Fair value: |
|
|
|
|
|
Authoritative accounting guidance defines fair value, establishes a framework for measuring fair value and establishes a fair value hierarchy. Fair value is the price that would be received to sell an asset or paid to transfer a liability in an orderly transaction between market participants at the measurement date. Fair value measurements are not adjusted for transaction costs. The fair value hierarchy prioritizes inputs to valuation techniques used to measure fair value into three levels: |
|
|
|
|
|
Level 1 |
Unadjusted quoted prices in active markets for identical assets or liabilities. |
|
|
|
|
Level 2 |
Inputs other than quoted market prices that are observable, either directly or indirectly, and reasonably available. |
|
|
|
|
Level 3 |
Unobservable inputs which reflect the assumptions that the managing members develop based on available information about the assumptions market participants would use in valuing the asset or liability. |
|
|
|
|
See Note C(4) for financial instruments measured at fair value. |
|
F-21
SIEBERT, BRANDFORD, SHANK FINANCIAL, L.L.C. AND SUBSIDIARY
Notes to Financial Statements
December 31, 2014 and 2013
NOTE C – SUMMARY OF SIGNIFICANT ACCOUNTING POLICIES (CONTINUED)
|
|
|
[4] |
Cash equivalents: |
|
|
|
|
|
Cash equivalents represent short-term, highly liquid investments which are readily convertible to cash and have maturities of three months or less at time of purchase. Cash equivalents, which are valued at fair value, consist of money market funds which amounted to $15,965,885 and $19,787,407 at December 31, 2014 and 2013, respectively (Level 1). The Company maintains its assets with financial institutions which may at times exceed federally insured limits. In the event of financial institutions insolvency, recovery of the assets may be limited. |
|
|
|
|
[5] |
Furniture, equipment and leasehold improvements, net: |
|
|
|
|
|
Furniture, equipment and leasehold improvements are stated at cost, net of accumulated depreciation and amortization. Depreciation is calculated using the straight-line method over the estimated useful lives of the assets, generally five years. Leasehold improvements are amortized over the period of the lease. |
|
|
|
|
[6] |
Intangible Assets |
|
|
|
|
|
Issuer relationships, which were recorded in connection with the acquisition of the capital markets business (see Note B), are being amortized by the straight-line method over 2.9 years. |
|
|
|
|
|
Intangible assets with finite lives are tested for recoverability whenever events or changes in circumstances indicate that the carrying amount may not be recoverable. The Company assesses the recoverability of its intangible assets by determining whether the unamortized balance can be recovered over the assets’ remaining useful life through undiscounted estimated future cash flows. If undiscounted estimated future cash flows indicate that the unamortized amounts will not be recovered, an adjustment will be made to reduce such amounts to fair value based on estimated future cash flows discounted at a rate commensurate with the risk associated with achieving such cash flows. |
|
|
|
|
[7] |
Goodwill |
|
|
|
|
|
Goodwill, which was recorded in connection with the acquisition of the capital markets business (see Note B), is not subject to amortization and is tested for impairment annually, or more frequently if events or changes in circumstances indicate that the asset may be impaired. The impairment test consists of a comparison of the fair value of the reporting unit with the carrying amount its net assets, including goodwill. Fair value is typically based upon estimated future cash flows discounted at a rate commensurate with the risk involved or market-based comparables. If the carrying amount of the Company’s net assets exceeds the fair value of the reporting unit, then an analysis will be performed to compare the implied fair value of goodwill with the carrying amount of goodwill. An impairment loss will be recognized in an amount equal to the excess of the carrying amount over its implied fair value. |
|
|
|
|
[8] |
Use of estimates: |
|
|
|
|
|
The preparation of financial statements in conformity with accounting principles generally accepted in the United States of America requires management to make estimates and assumptions that affect the reported amounts of assets and liabilities and disclosure of contingent assets and liabilities at the date of the financial statements and the reported amounts of revenues and expenses during the reporting period. Actual results could differ from those estimates. |
|
|
|
|
[9] |
Income taxes: |
|
|
|
|
|
The Company is not subject to federal income taxes. Instead, the members are required to include in their income tax returns their respective share of the Company’s income or loss. The Company is subject to tax in certain state and local jurisdictions. Deferred taxes are not significant. |
|
F-22
NOTE D - SUBORDINATED BORROWINGS AND SECURED DEMAND NOTE RECEIVABLE
The subordinated debt at December 31, consists of the following:
|
|
|
|
|
|
|
|
|
|
2014 |
|
2013 |
|
||
|
|
|
|
|
|
|
|
Payable to affiliate (a) |
|
$ |
1,200,000 |
|
$ |
1,200,000 |
|
Payable to clearing broker (b) |
|
$ |
4,000,000 |
|
|
— |
|
|
|
|
|
|
|
|
|
|
|
$ |
5,200,000 |
|
$ |
1,200,000 |
|
|
|
|
|
(a) |
Consists of a Secured Demand Note Collateral Agreement payable to Siebert, an indirect member of the Company, bearing 4% interest and due August 31, 2015, at which time SBS is obligated to repay Siebert any amounts borrowed. Interest expense paid to Siebert in each of 2014, 2013 and 2012 amounted to $48,000. |
|
|
|
|
|
The secured demand note receivable of $1,200,000 is collateralized by cash equivalents of Siebert of approximately $1,544,000 at December 31, 2014. Interest earned on the collateral amounted to approximately $1,028, $1,500 and $2,900 in 2014, 2013 and 2012, respectively. |
|
|
|
|
(b) |
On December 9, 2014, SBS entered into a temporary subordinated loan agreement with National Financial Services, its clearing broker, in the amount of $4,000,000 bearing interest at the federal funds rate plus 6% and maturing January 22, 2015. The note was repaid on January 22, 2015. Interest expense accrued in 2014 amounted to approximately $16,000. |
|
|
|
|
|
The subordinated borrowings are available in computing net capital under the Securities and Exchange Commission’s (“SEC”) Uniform Net Capital Rule. To the extent that such borrowing is required for the Company’s continued compliance with minimum net capital requirements, it may not be repaid. |
|
|
|
|
|
On March 24, 2014, SBS entered into a temporary subordinated loan agreement with National Financial Services, its clearing broker, in the amount of $5,000,000 bearing interest at the federal funds rate plus 6% and maturing May 5, 2014. The note was repaid on May 5, 2014. Interest expense paid was $36,542. |
F-23
SIEBERT, BRANDFORD, SHANK FINANCIAL, L.L.C. AND SUBSIDIARY
Notes to Financial Statements
December 31, 2014 and 2013
NOTE E - FURNITURE, EQUIPMENT AND LEASEHOLD IMPROVEMENTS, NET
Furniture, equipment, and leasehold improvements consist of the following:
|
|
|
|
|
|
|
|
|
|
December 31, |
|
||||
|
|
2014 |
|
2013 |
|
||
|
|
|
|
|
|
|
|
Equipment |
|
$ |
926,654 |
|
$ |
896,376 |
|
Furniture and leasehold improvements |
|
|
1,718,826 |
|
|
1,659,740 |
|
|
|
|
|
|
|
|
|
|
|
|
2,645,480 |
|
|
2,556,116 |
|
Less accumulated depreciation and amortization |
|
|
1,960,744 |
|
|
1,733,983 |
|
|
|
|
|
|
|
|
|
|
|
$ |
684,736 |
|
$ |
822,133 |
|
Depreciation and amortization expense for 2014, 2013 and 2012 amounted to $226,761, $250,154 and $266,093 respectively.
NOTE F - NET CAPITAL
SBS is subject to the SEC’s Uniform Net Capital Rule 15c3-1, which requires the maintenance of minimum net capital and that the ratio of aggregate indebtedness to net capital, both as defined, shall not exceed 15 to 1. At December 31, 2014 and 2013, SBS had net capital of $22,807,796 and $18,271,172, respectively, which was $22,557,796 and $18,021,172, respectively, in excess of its required net capital and its ratio of aggregate indebtedness to net capital was 0.10 and 0.16 to 1, respectively. SBS claims exemption from the reserve requirements under Section 15c3-3(k)(2)(ii).
NOTE G - COMMITMENTS
SBS rents office space under long-term operating leases expiring through 2020. These leases call for base rent plus escalations for property taxes and other operating expenses. Future minimum base rent under these operating leases as of December 31, 2014 are as follows:
|
|
|
|
|
Year Ending |
|
|
|
|
December 31, |
|
Amount |
|
|
|
|
|
|
|
|
|
|
|
|
2015 |
|
|
1,043,000 |
|
2016 |
|
|
886,000 |
|
2017 |
|
|
639,000 |
|
2018 |
|
|
627,000 |
|
2019 |
|
|
587,000 |
|
Thereafter |
|
|
185,000 |
|
|
|
|
|
|
|
|
|
|
|
|
|
$ |
3,967,000 |
|
Rent expense, including taxes and operating expenses for 2014, 2013 and 2012 amounted to $1,186,967, $1,088,755, and $1,052,908 respectively.
In prior years, SBS purchased leasehold improvements of approximately $620,000 which were reimbursed by the landlord. SBS recorded such reimbursement as a credit to deferred rent liability, which is being recognized as a reduction of rental expense on a straight-line basis over the term of the lease.
Rent expense is being charged to operations on a straight-line basis resulting in a deferred rent liability which, including the reimbursement discussed above amounted to $549,287 at December 31, 2014 and $622,075 at December 31, 2013.
F-24
SIEBERT, BRANDFORD, SHANK FINANCIAL, L.L.C. AND SUBSIDIARY
Notes to Financial Statements
December 31, 2014 and 2013
NOTE H - ACCOUNTS PAYABLE AND ACCRUED EXPENSES
Accounts payable and accrued expenses consist of the following:
|
|
|
|
|
|
|
|
|
|
December 31, |
|
||||
|
|
2014 |
|
2013 |
|
||
|
|
|
|
|
|
|
|
Accounts payable |
|
$ |
313,285 |
|
$ |
171,761 |
|
Accrued bonus and other employee compensation |
|
|
4,233,521 |
|
|
3,785,271 |
|
Other accrued expenses |
|
|
200,842 |
|
|
49,576 |
|
|
|
|
|
|
|
|
|
|
|
$ |
4,747,648 |
|
$ |
4,006,608 |
|
NOTE I - OTHER
During each of 2014 and 2013, SBS was charged $100,000 by Siebert for general and administrative services. During 2012 SBS was charged $75,000 by Siebert for general and administrative services. In January 2014, SBS transferred funds from its money market accounts to its bank account to cover the $1,225,779 overdraft at December 31, 2013.
F-25
SIGNATURES
Pursuant to the requirements of Section 13 or 15(d) of the Securities Exchange Act of 1934, the registrant has duly caused this report to be signed on its behalf by the undersigned, thereunto duly authorized.
SIEBERT FINANCIAL CORP.
|
|
|
|
By: |
/s/ Joseph M. Ramos, Jr. |
|
|
Joseph M. Ramos, Jr. |
|
|
Executive Vice President, Chief Operating Officer, Chief Financial Officer and Secretary |
|
|
(principal executive, financial and accounting officer) |
|
|
|
|
Date: |
March 31, 2015 |
Pursuant to the requirements of the Securities Exchange Act of 1934, this report has been signed below by the following persons on behalf of the registrant and in the capacities and on the dates indicated.
|
|
|
|
|
Name |
|
Title |
|
Date |
|
|
Executive Vice President, Chief Operating Officer and Chief |
|
|
/s/ Joseph M. Ramos, Jr. |
|
Financial Officer and Secretary (principal financial and accounting |
|
March 31, 2015 |
Joseph M. Ramos, Jr. |
|
officer) |
|
|
|
|
|
|
|
/s/ Patricia L. Francy |
|
Director |
|
March 31, 2015 |
Patricia L. Francy |
|
|
|
|
|
|
|
|
|
/s/ Jane H. Macon |
|
Director |
|
March 31, 2015 |
Jane H. Macon |
|
|
|
|
|
|
|
|
|
/s/ Robert P. Mazzarella |
|
Director |
|
March 31, 2015 |
Robert P. Mazzarella |
|
|
|
|
|
|
|
|
|
/s/ Nancy Peterson Hearn |
|
Director |
|
March 31, 2015 |
Nancy Peterson Hearn |
|
|
|
|
|
|
|
EXHIBIT INDEX |
||
|
|
|
Exhibit No. |
|
Description Of Document |
|
|
|
2.1 |
|
Plan and Agreement of Merger between J. Michaels, Inc. (“JMI”) and Muriel Siebert Capital Markets Group, Inc. (“MSCMG”), dated as of April 24, 1996 (“Merger Agreement”) (incorporated by reference to Siebert Financial Corp.’s Annual Report on Form 10-K for the fiscal year ended December 31, 1996) |
|
|
|
2.2 |
|
Amendment No. 1 to Merger Agreement, dated as of June 28, 1996 (incorporated by reference to Siebert Financial Corp.’s Annual Report on Form 10-K for the fiscal year ended December 31, 1996) |
|
|
|
2.3 |
|
Amendment No. 2 to Merger Agreement, dated as of September 30, 1996 (incorporated by reference to Siebert Financial Corp.’s Annual Report on Form 10-K for the fiscal year ended December 31, 1996) |
|
|
|
2.4 |
|
Amendment No. 3 to Merger Agreement, dated as of November 7, 1996 (incorporated by reference to Siebert Financial Corp.’s Annual Report on Form 10-K for the fiscal year ended December 31, 1996) |
|
|
|
3.1 |
|
Certificate of Incorporation of Siebert Financial Corp., formerly known as J. Michaels, Inc. originally filed on April 9, 1934, as amended and restated to date (incorporated by reference to Siebert Financial Corp.’s Annual Report on Form 10-K for the fiscal year ended December 31, 1997) |
|
|
|
3.2 |
|
By-laws of Siebert Financial Corp. (incorporated by reference to Siebert Financial Corp.’s Registration Statement on Form S- 1 (File No. 333-49843) filed with the Securities and Exchange Commission on April 10, 1998) |
|
|
|
10.1** |
|
Siebert Financial Corp. 1998 Restricted Stock Award Plan (incorporated by reference to Siebert Financial Corp.’s Annual Report on Form 10-K for the fiscal year ended December 31, 1997) |
|
|
|
10.2** |
|
Siebert Financial Corp. 1997 Stock Option Plan (incorporated by reference to Siebert Financial Corp.’s Annual Report on Form 10-K for the fiscal year ended December 31, 1996) |
|
|
|
10.3 |
|
Siebert, Brandford, Shank & Co., LLC Operating Agreement, among Siebert, Brandford, Shank & Co., L.L.C., Muriel Siebert & Co., Inc., Napoleon Brandford III and Suzanne F. Shank, dated as of March 10, 1997 (incorporated by reference to Siebert Financial Corp.’s Annual Report on Form 10-K for the fiscal year ended December 31, 1996) |
|
|
|
10.4 |
|
Services Agreement, between Siebert, Brandford, Shank & Co., L.L.C. and Muriel Siebert & Co., Inc., dated as of March 10, 1997 (incorporated by reference to Siebert Financial Corp.’s Annual Report on Form 10-K for the fiscal year ended December 31, 1996) |
|
|
|
10.5 |
|
Operating Agreement of SBS Financial Products Company, LLC, dated effective as of April 19, 2005, by and among Siebert Financial Corp., Napoleon Brandford III and Suzanne Shank. (incorporated by reference to Siebert Financial Corp.’s Current Report on Form 8-K filed with the Securities and Exchange Commission on May 17, 2005) |
|
|
|
10.6** |
|
Siebert Financial Corp. 2007 Long-Term Incentive Plan (incorporated by reference to Siebert Financial Corp.’s Registration Statement on Form S-8 (File No. 333-144680) filed with the Securities and Exchange Commission on July 18, 2007) |
|
|
|
10.7* |
|
Fully Disclosed Clearing Agreement, by and between National Financial Services LLC and Muriel Siebert & Co., Inc. dated May 5, 2010. (incorporated by reference to Siebert Financial Corp.’s Quarterly Report on Form 10-Q filed with the Securities and Exchange Commission on August 16, 2010) |
|
|
|
21 |
|
Subsidiaries of the registrant (incorporated by reference to Siebert Financial Corp.’s Annual Report on Form 10-K for the year ended December 31, 2001) |
|
|
|
23 |
|
Consent of Independent Auditors |
|
|
|
31.1 |
|
Certification of Joseph M. Ramos, Jr. pursuant to Securities Exchange Act Rules 13a-14(a) and 15d-14(a), as adopted pursuant to Section 302 of the Sarbanes-Oxley Act of 2002 |
|
|
|
32.1 |
|
Certification of Joseph M. Ramos, Jr. of Periodic Financial Report under Section 906 of the Sarbanes-Oxley Act of 2002 |
|
|
* |
Portions of the indicated document have been afforded confidential treatment and have been filed separately with the Securities and Exchange Commission pursuant to Rule 24b-2 of the General Rules and Regulations promulgated under the Securities Exchange Act of 1934, as amended. |
|
|
** |
Management contract or compensatory plan or arrangement. |