Attached files
| file | filename |
|---|---|
| EX-31.1 - EX-31.1 - Oro East Mining, Inc. | ex31-1.htm |
| EX-32.1 - EX-32.1 - Oro East Mining, Inc. | ex32-1.htm |
| EX-31.2 - EX-31.2 - Oro East Mining, Inc. | ex31-2.htm |
| EXCEL - IDEA: XBRL DOCUMENT - Oro East Mining, Inc. | Financial_Report.xls |
UNITED STATES
SECURITIES AND EXCHANGE COMMISSION
Washington, D.C. 20549
FORM 10-K
x Annual Report Pursuant to Section 13 or 15(D) of the Securities Exchange Act of 1934
for the fiscal year ended December 31, 2014
¨ Transition Report Under Section 13 or 15(D) of the Securities Exchange Act of 1934
for the transition period from _______________ to _______________
Commission File Number: 000-53136
Oro East Mining, Inc.
(formerly known as Accelerated Acquisitions I, Inc.)
|
Delaware
|
26-2012582
|
|
|
(State or other jurisdiction of incorporation or
|
(IRS Employer Identification No.)
|
|
|
organization)
|
||
|
7817 Oakport Street, Suite 205,
|
||
|
Oakland, CA
|
94621
|
|
|
(Address of principal executive offices)
|
(Zip Code)
|
Issuer's telephone number, including area code: (510) 638-5000
Former address if changed since last report:
Securities registered under Section 12(b) of the Exchange Act: None
Securities registered under Section 12(g) of the Exchange Act:
Common Stock, par value $0.0001 per share
Check whether the issuer (1) filed all reports required to be filed by Section 13 or 15(d) of the Securities Exchange Act of 1934 during the preceding 12 months (or for such shorter period that the registrant was required to file such reports), and (2) has been subject to such filing requirements for the past 90 days. Yes x No ¨
Check if there is no disclosure of delinquent filers in response to Item 405 of Regulation S-K contained in this form, and no disclosure will be contained, to the best of registrant's knowledge, in definitive proxy or information statements incorporated by reference in Part III of this Form 10-K or any amendment to this Form 10-K. ¨
Indicate by check mark whether the registrant has submitted electronically and posted on its corporate Website, if any, every interactive Data File required to be submitted and posted pursuant to Rule 405 of Regulation S-T during the preceding 12 months (or for such shorter period that the registrant was required to submit and post such files). Yes x No ¨
Indicate by check mark whether the registrant is a large accelerated filer, an accelerated filer, a non-accelerated filer or a smaller reporting company. See the definitions of “large accelerated filer,” “accelerated filer” and “smaller reporting company” in Rule 12b-2 of the Exchange Act.
|
Large Accelerated Filer o
|
Accelerated Filer o
|
Non-Accelerated Filer o
(Do not check if a smaller reporting company)
|
Smaller Reporting Company x
|
Indicate by check mark whether the registrant is a shell company (as defined in Rule 12b-2 of the Exchange Act). Yes o No x
State the number of shares outstanding of each of the issuer’s classes of common equity, as of the latest practicable date: 581,203,700 shares of common stock, par value $.0001 per share, outstanding as of March 23, 2015.
Reporting Currency, Financial, and Other Information
All amounts in this report are expressed in United States (U.S.) dollars, unless otherwise indicated.
Financial information is presented in accordance with accounting principles generally accepted in the United States ("U.S. GAAP").
References in this annual report to the “Company,” “we,” “our”, “us”, “Oro East” or “Oro East Mining, Inc.” refer to Oro East Mining, Inc. unless the context otherwise indicates.
A Note Regarding Forward-Looking Statements
This report contains forward-looking statements that relate to future events or our future financial performance. In some cases, forward-looking statements may be identified by terminology such as “may”, “should”, “expects”, “plans”, “anticipates”, “believes”, “estimates”, “predicts”, “potential” or “continue” or the negative of these terms or other comparable terminology. These statements are only predictions and involve known and unknown risks, uncertainties and other factors, including the risks in the section entitled “Risk Factors,” that may cause our or our industry’s actual results, levels of activity, performance or achievements to be materially different from any future results, levels of activity, performance or achievements expressed or implied by these forward-looking statements.
While these forward-looking statements, and any assumptions upon which they are based, are made in good faith and reflect our current judgment regarding the direction of our business, actual results will almost always vary, sometimes materially, from any estimates, predictions, projections, assumptions or other future performance suggested herein. Except as required by applicable law, including the securities laws of the United States, we do not intend to update any of the forward-looking statements to conform these statements to actual results.
Glossary of Exploration Terms
The following terms, when used herein, have the respective meanings specified below:
|
Deposit
|
When mineralized material has been systematically drilled and explored to the degree that a reasonable estimate of tonnage and economic grade can be made.
|
|
Development
|
Preparation of a mineral deposit for commercial production, including installation of plant and machinery and the construction of all related facilities. The development of a mineral deposit can only be made after a commercially viable mineral deposit, a reserve, has been appropriately evaluated as economically and legally feasible.
|
|
Diamond drill
|
A type of rotary drill in which the cutting is done by abrasion rather than percussion. The cutting bit is set with diamonds and is attached to the end of long hollow rods through which water is pumped to the cutting face. The drill cuts a core of rock, which is recovered in long cylindrical sections an inch or more in diameter.
|
|
Exploration
|
The prospecting, trenching, mapping, sampling, geochemistry, geophysics, diamond drilling and other work involved in searching for mineral bodies’ a mining prospect which has not yet reached either the development or production stage.
|
|
Mineral
|
A naturally occurring inorganic element or compound having an orderly internal structure and characteristic chemical composition, crystal form and physical properties.
|
|
Mineral Reserve
|
A mineral reserve is that part of a deposit which could be economically and legally extracted or produced at the time of the reserve determination.
|
|
Mineralization
|
Rock containing an undetermined amount of minerals or metals.
|
|
Waste
|
Material that is too low in grade to be mined and milled at a profit.
|
|
Waste Management Units (WMUs)
|
Heap leaches of mining waste and leached ore with residual tailings of gold values. The heap leaches referenced as WMUs herein are sealed by temporary geotextile covers. Through flotation, gold values can be extracted from the leached ore.
|
TABLE OF CONTENTS
|
PART I
|
||
|
Page
|
||
|
ITEM 1.
|
4
|
|
|
ITEM 1A.
|
21
|
|
|
ITEM 1B.
|
21
|
|
|
ITEM 2.
|
21
|
|
|
ITEM 3.
|
21
|
|
|
ITEM 4.
|
21
|
|
|
PART II
|
||
|
ITEM 5.
|
22
|
|
|
ITEM 6.
|
23
|
|
|
ITEM 7.
|
23
|
|
|
ITEM 7A.
|
26
|
|
|
ITEM 8.
|
26
|
|
|
ITEM 9.
|
39
|
|
|
ITEM 9A(T).
|
39
|
|
|
ITEM 9B.
|
39
|
|
|
PART III
|
||
|
ITEM 10.
|
40
|
|
|
ITEM 11.
|
41
|
|
|
ITEM 12.
|
42
|
|
|
ITEM 13.
|
43
|
|
|
ITEM 14
|
44
|
|
|
PART IV
|
||
|
ITEM 15.
|
45
|
|
|
47
|
||
PART I
Item 1. Description of Business.
ORGANIZATION WITHIN THE LAST THREE YEARS
Oro East Mining, Inc. (“Oro East”) was incorporated in Delaware as Accelerated Acquisitions I, Inc. on February 15, 2008.
The Company’s primary business focus at present is the development of its three substantial piles of crushed gold ores (“WMUs”) at an aggregate mine in Carson Hill, California (the “Carson Hill Project”) owned and managed by the Company’s privately held subsidiary, Oro East Mariposa, LLC, a California limited liability company. The real property that the crushed gold ores and Carson Hill Project is situated on is owned by Sutton Enterprises, located on the south side of Highway 49 in the central Sierra foothills of Calaveras County. The Company, through Oro Eat Mariposa, LLC has obtained a right of entry and access to the crushed ores, which are personal property now owned by Oro East Mariposa, LLC.
On January 21, 2015, Oro East entered into a Convertible Note Purchase Agreement and Convertible Promissory Note with a foreign investor lender for the sum of $720,000.00 (Seven Hundred Twenty Thousand U.S. Dollars) at an interest rate of 8% (Eight Percent) to be repaid on or before July 21, 2015.
On December 12, 2014, Oro East entered into a binding letter of intent (“Red Bank LOI”) with Red Bank Trust for the purchase of certain lode and placer mining claims and all mineral rights thereto, spanning 55 deeded acres in Mariposa County known as the Red Bank Mines, including an easement, right of entry, and other rights and interests as set forth in the Red Bank LOI (“Mining Claims and Mineral Rights”). A long-form purchase agreement for the Mining Claims and Mineral Rights that integrates the Red Bank LOI will be prepared by mutually agreed upon legal counsel or licensed brokers within 20 days of the expiration of the “Due Diligence Period” as set forth in the Red Bank LOI. The Company may at its complete discretion, with or without cause, cancel, null, and/or void the LOI during the Due Diligence Period. The parties have agreed to a consideration valuation of $2,000,000.00 (Two Million U.S. Dollars) paid in part with 20,000,000 restricted shares of Company, paid in part with a Convertible Promissory Note and Convertible Note Purchase Agreement to Yan Ming Wu, the named beneficiary of the Redbank Trust, in the sum of $1,000,000.00. Yan Ming Wu is a foreign national and citizen of the People’s Republic of China. The Company had previously entered into a Mining Lease and Royalties Agreement executed on June 24, 2013 (“Agreement”). Upon the execution of the Red Bank LOI, the Agreement is voided, though in the event that the transactions contemplated by the Red Bank LOI are not completed, the Agreement will be automatically effective again and enforceable upon termination of the Red Bank LOI.
On September 24, 2014, the California Environmental Protection Agency’s Central Valley Water Board (“Water Board”) approved Oro East’s Carson Hill Mining Waste Reclassification Project in a memorandum issued by the Water Board. The waste management unit stockpiles of gold concentrates, or the WMUs, at Carson Hill, one of the Company’s current gold production projects, consist of spent gold ore currently classified by the Water Board as “Group B mining waste.” Group B mining waste is considered hazardous or to contain soluble pollutants that exceed water quality objectives. Under Oro East’s Reclassification Project, the spent gold ore would be processed into waste that qualifies for a reclassification to “Group C mining waste.” Group C mining waste fully complies with water quality objectives and therefore fundamentally transforms the gold production process at Carson Hill into a green, environmentally-friendly, and sustainable process.
On September 8, 2014, Rex Yuen, Chief Financial Officer of Oro East Mining, Inc. (“Company”) resigned from his position at the Company. The Company issued a press release on September 8, 2014 announcing Mr. Yuen’s departure.
On August 1, 2014, the Company entered into a promissory note for a principal sum of $800,000 (Eight Hundred Thousand U.S. Dollars) with a 15% interest payment per annum on the unpaid principal, calculated yearly and not in advance. On February 2, 2015, the note was extended to August 1, 2015.
The Sale and Purchase Agreement with Royal Asset Management (“RAM”), a trading company based in Dubai, the United Arab Emirates, executed on January 31, 2014 with the May 6, 2014 amendment converting the $1,000,000 payment advanced to the Company was paid off effective August 1, 2014.
On July 14, 2014, the Company entered into a Convertible Note Purchase Agreement with an individual investor. Under the terms of the Agreement, the Company offered and sold a Convertible Promissory Note (the “Note”) for aggregate proceeds of $500,000. The Note bears interest at 12% annually, which interest compounds annually, and all principal and interest is due not later than January 14, 2015. All principal and interest due under the Note is convertible, at the election of the holder of the Note, into shares of common stock of the Company at a rate of $0.20 (Twenty Cents) per share. On January 15, 2015, the converted note was extended to April 14, 2015 with the conversion price changed to $0.08 (Eight Cents) per share.
On July 7, 2014, the Company completed a shipment of 15 tons of gold concentrates to Royal Asset Management (“RAM”), an Abu Dhabi based asset management company held by His Highness Shaikh Saqer Al Nahyan and royal family. RAM remains one of OROE’s top buyers. The RAM shipment marks an important nascent milestone for the Carson Hill Gold Project. The success of the pilot test phase bodes well for the Company’s continued expansion of its current gold stockpile operations.
On July 3, 2014, the Company executed a Consulting Agreement with Hobson Consultants Limited (“Hobson”), a Hong Kong consulting firm, for a two-year engagement of consulting services to help the Company build strategic relationships in East Asia. Hobson would be compensated in shares of Company stock, 6,750,000 restricted shares, and the shares will vest through the service term.
Also on July 3, 2014, the Company executed a Finder’s Fee Agreement with Smarteam Asia Limited (“Smarteam”), a Hong Kong investor relations management company, for a two-year engagement of services to help the Company promote and fund raise in East Asia. Smarteam would be compensated in shares of Company stock,7,500,000 restricted shares, and the shares will vest through the service term. In addition, Smarteam would be compensated with a finder’s fee equivalent to 10% of any total funding raised by the direct promotional efforts of Smarteam, payable as Company stock at $0.15 per share.
On May 27, 2014, the board of directors with the majority of voting power held by the stockholders of the Company approved an amendment to the Company’s Certificate of Incorporation (i) increasing the number of authorized shares of common stock from 100,000,000 to 2,000,000,000, and (ii) effecting a twenty-for-one (20:1) forward split of the Company’s issued and outstanding shares of common stock. The forward split was effective with the Financial Industry Regulatory Authority as of the opening of business on June 12, 2014. As a result of the forward stock split, each share of the Company’s common stock issued and outstanding at the close of business on June 12, 2014 was split into 20 shares of the Company’s common stock.
On December 24, 2013, Oro East Mariposa, LLC, a California limited liability company and a wholly-owned subsidiary of the Company (“Subsidiary”) entered into an Asset Purchase and Option Agreement (the “Agreement”) with Sutton Enterprises, a general partnership. Under the terms of the Agreement, Subsidiary purchased certain mineralized material we believe are gold tailings, tangible property, and other entitlements commonly referred to by the parties as the WMUs located on certain parcels of real property located in the County of Calaveras, State of California. The total purchase price for the WMUs is $6,000,000.00 and 30% net royalties contingent on the obtaining of all local, state, and other applicable agency approvals for the gold mineral concentrates production contemplated. Thereafter, the $6,000,000.00 shall be paid in certain installments, and the 30% net royalties will be held in escrow as secured collateral against the Agreement in favor of the Subsidiary. The Agreement further reserves an Option in favor of the Subsidiary for purchase of 39 parcels of real property as described in the Agreement and all claims rights, business assets, and additional property and assets as set forth in the Agreement for a purchase price of $32,000,000.00 less the $6,000,000.00 already paid on the WMUs. The Option period is for 180 days from the date of the contract and was expired. The Subsidiary made payments totaling about $127,000 to Sutton Enterprises that will be applied towards the purchase price. The said payment was included and presented as “Other Current Assets” on the consolidated financial statements.
The business related to the Agreement is now the primary business of the Company and the Company has discontinued most of its exploration activities related to its former exploration activity in the Philippines. To date, the Company is in the process of compiling all information related to test results on assays it has conducted on the gold tailings its has purchased under the Agreement. There is the likelihood of the mineralized material we believe are gold tailings purchased pursuant to the Agreement containing little or no economic mineralization or of gold content or other minerals.
On December 5, 2013, we entered into a Convertible Note Purchase Agreement (the “Note Agreement”) with one investor. Under the terms of the Note Agreement, the Company offered and sold a Convertible Promissory Note (the “Note”) for aggregate proceeds of $360,000. Closing for the Note sale took place on December 6, 2013. The Note bears interest at 12% annually, which interest compounds annually, and all principal and interest is due no later than June 5, 2014. All principal and interest due under the Note is convertible, at the election of the holder of the Note, into shares of common stock of the Company at a rate of $3.00 per share. The Company offered and sold the Note in reliance on the exemption from registration afforded by Rule 903(b)(3) of Regulation S, promulgated pursuant to the Securities Act of 1933, as amended, where the Company offered and sold the Note offshore of the US, to a non-US person, there were no directed selling efforts in the US and offering restrictions were implemented.
On November 8, 2013, Typhoon Haiyan devastated the Davao region of the Philippines where the Company’s MPSA 320-2010-XI claim is located. The typhoon swept away and destroyed roads, developed lands, and buildings. On the grounds of force majeure, the Company’s mining operations ceased and are presently ceased indefinitely as the region focuses on rebuilding itself. As a result of Typhoon Haiyan, there have been no further activities by the company in the Philippines.
That same month the Company directors convened to discuss the trajectory of its business and decided unanimously to focus business in the United States, in particular gold and other precious mineral acquisitions in California. The Company voted to cease exploration in the Philippines and invest fully in developing its business acquisitions in the mineral industry within the United States.
In October 2013, Oro East Mariposa issued an additional 158,000 units to a foreign corporation owned by a shareholder. The Company now owns 95% equity interest of Oro East Mariposa. Through Oro East Mariposa, the Company sought out prospective minerals investment opportunities throughout California.
On June 3, 2013, the Company established the California subsidiary Oro East Mariposa, LLC for the purpose of conducting mining or minerals exploration business in the State of California, in the United States. On June 24, 2013, the Company, through its subsidiary, entered into an exclusive Mining Lease and Royalties Agreement for the Red Bank Gold Mine (“Red Bank”). Red Bank is located in the Mother Lode vein system just east of San Francisco and within the western Sierra Nevada Ranges.
On May 13, 2013 the Company redeemed from AVP 1,500,000 shares of common stock of the Company for an aggregate redemption price of $150.00, pursuant to a Stock Redemption Agreement. AVP is still a holder of 1,500,000 shares of common stock of the Company following the redemption. The Company returned the 1,500,000 shares redeemed from AVP to the authorized stock of the Company.
On May 8, 2013, the Board of Directors of the Company approved and adopted the terms and provisions of a 2013 Stock Incentive Plan (the “Plan”) for the Company. An aggregate of 5,000,000 shares of the Company’s common stock are initially reserved for issuance under the Plan. As of December 31, 2013, 4,959,000 shares were available for grant under the Plan.
In September 2012, the Company established its foreign wholly owned subsidiary, Oro East Mining LLC, for the purpose of conducting mining business in Mexico. There have been no activities for the subsidiary since its establishment.
IN GENERAL
Oro East Mining, Inc. (“Oro East”), a Delaware corporation, has discontinued exploration activities, and is focusing on producing gold concentrates.
At present, the Company is building a facility for processing mining waste from the WMUs purchased from Sutton Enterprises with the intent of selling the gold concentrates produced from flotation.
Previously the Company, through its subsidiary Oro East Mariposa, LLC had worked with the Central Valley Regional Water Quality Control Board (“Regional Water Board”) to reclassify the mining waste held in the crushed ores. In early 2014 a proposal was made to the California Water Board and Central Valley Regional Water Quality Control Board to conduct a pilot study consisting of a field scale flotation plant and portable filter press for the processing of 15,000 tons of ore to recover the gold values at Carson Hill. The crushed ores potentially contain significant gold values and concentrates that Oro East Mariposa, LLC seeks to recover. It was proposed that the wet processing it would conduct would remove sulfides and generate tailings that met the criteria for Group C classification of mining waste in accordance with Section 22480 of Title 27 of the California Code of Regulations.
DESCRIPTION OF THE RED BANK PROJECT
On December 12, 2014, The Company entered into a binding letter of intent (“LOI”) with Red Bank Trust for the purchase of certain lode and placer mining claims and all mineral rights thereto, in Mariposa County, California, known as the Red Bank Mine. The Company may at its complete discretion, with or without cause, cancel, null, and/or void the LOI during the Due Diligence Period as set forth in the LOI. Under the LOI, the Company must pay for the purchase of the Red Bank Mine Property with (i) 20,000,000 shares of common stock of the Company, and (ii) delivery of a convertible promissory note to Yan Ming Wu, the named beneficiary of the Redbank Trust, in the sum of $1,000,000.
The source of information contained in this discussion is our geology report dated December 29, 2014, and prepared by Robert Campbell, M.S., California Professional Geologist, California Certified Engineering Geologist and Principal Engineering Geologist of GeoSolve, Inc.
While we intend to test for commercially viable reserves of precious metals and rare earth element (REE) production and for propose additional drilling locations to isolate gold- and REE-bearing zones at the site, there is the likelihood of our mineral claim containing little or no economic mineralization or reserves of gold, REEs, or other minerals. We are presently in the exploration stage of our business and we can provide no assurance that any commercially viable mineral deposits exist on our mineral claims, that we will discover commercially exploitable levels of mineral resources on our property, or, if such deposits are discovered, that we will enter into further substantial exploration programs. Further exploration is required before a final determination can be made as to whether our mineral claims possess commercially exploitable mineral deposits. If our claim does not contain any reserves all funds that we spend on exploration will be lost.
We engaged Mr. Campbell to prepare a geological evaluation report on the Red Bank Mine property. Mr. Campbell is the professional geologist who authored the report. Mr. Campbell graduated from the University of California at Davis with a Bachelor’s of Science (B.S.) in geology in 1989 and a graduate of California State University East Bay with a Master’s of Science (M.S.) in geology in 2006. He is a member of the California Board of Professional Engineers, Land Surveyors and Geologists with a Professional Geologist (P.G.) license number 6454 and Certified Engineering Geologist (C.E.G.) license number 2089, and a member of the American Institute of Professional Geologists (A.I.P.G.) member number 1564.
We received the geological evaluation report on the Red Bank Mine property, entitled “National Instrument 43-101 Technical Report on Red Bank Mine – 81 Acres, Apns 003-350-0050; 003-340-0070; And 003-330-0060, Mariposa County, California, for Oro East Mining, Inc.” (the “Report”) prepared by Mr. Campbell on December 29, 2014. The Report summarizes the results of the history of the exploration of the mineral claims, the regional and local geology of the mineral claims and the mineralization and the geological formations identified as a result of the prior exploration. The Report also gives conclusions regarding potential mineralization of the mineral claims and recommends a further geological exploration program on the mineral claims. The Report does not make any recommendation regarding any work program or the anticipated costs of any exploration activities. The description of the Red Bank Mine property provided below is based on the Report.
Summary
The purpose of the Report was to evaluate the Red Bank Mine for precious metals and rare earth element (REE) production and for propose additional drilling locations to isolate gold- and REE-bearing zones at the site. The Red Bank Mine property consists of patented claims comprised of the Stevenson, Jubilee and Daisy Quartz mines, which comprises approximately 81 acres. The property is situated approximately 17 miles north of the town of Mariposa, California and is bounded by Lake McClure and Highway 49 on a steep dipping slope from below Highway 49 to the shores of Lake McClure.
Based on the laboratory analytical results obtained from the 14 mineral samples collected at the Red Bank mine property, which were analyzed by ALS Minerals, mineable ore was determined to be present along the strike of two quartz veins and the talc-carbonate schist matrix bounded by the quartz veins. Up to 0.056 ounce of gold per troy ton of ore and 0.059 ounce of silver per troy ton of ore were determined to be present at the Red Bank mine property. Additionally, moderate to high concentrations of REEs were detected within the mineral samples collected from the talc-carbonate schist matrix within the lower tunnel mine adit.
Introduction
The Red Bank Mine property consists of patented claims comprised of the Stevenson, Jubilee and Daisy Quartz mines, which comprises approximately 81 acres. The property is situated approximately 17 miles north of the town of Mariposa, California and is bounded by Lake McClure and Highway 49 on a steep dipping slope from below Highway 49 to the shores of Lake McClure.
GeoSolve, Inc. relied on information provided by the Company. The Report is based on the following sources of information: 1) discussions with Oro East Mariposa, LLC; 2) visual inspection of the Red Bank mine project area; 3) information obtained from public domain resources; and 4) regional geology published by the United States Geological Survey (USGS) and Jason Jordon, a geologist.
Mr. Campbell visited the Red Bank mine property on October 15, 2014. During the site visit, the Stevenson Crosscut (lower tunnel mine audit), quartz vein open-pit mine and serpentinized ultra-mafic knob areas were observed and mineral samples were collected from all three areas for assaying and laboratory analyses to evaluate the areas for future mining reserves. A review of previous work was summarized within the Red Bank mine area and areas for future exploration were proposed.
Reliance on Other Experts
The information, opinions, and conclusions contained in the Report are based on the following:
|
·
|
Information available to GeoSolve, Inc. at the time of the Report preparation;
|
|
·
|
Assumptions, conditions, and qualifications established in the Report;
|
|
·
|
Laboratory analytical data from ALS Minerals and UC Davis; and
|
|
·
|
Geologic data, published reports, and other information supplied by Oro East Mariposa, LLC and third party sources.
|
Mr. Robert D. Campbell, M.S., P.G., C.E.G., Principal Engineering Geologist of GeoSolve, Inc. did, however, rely on a former NI 43-101 Technical Report prepared by Mr. Bartlett J. Hanford, licensed mining engineer, for portions of this report, especially the historical aspects of Red Bank mine. All other information was obtained by Mr. Robert D. Campbell.
Property Description and Location
The Red Bank Mine property consists of patented claims comprised of the Stevenson, Jubilee and Daisy Quartz mines, which comprises approximately 81 acres. The property is situated approximately 17 miles north of the town of Mariposa, California and is bounded by Lake McClure and Highway 49 on a steep dipping slope from below Highway 49 to the shores of Lake McClure. The Red Bank mine lies in the northern part of Mariposa County in the area between Coulterville District to the north and Bagby District to the south. The Coulterville District is in the southwestern Tuolumne County and northwestern Mariposa County.
Geosolve, Inc. reviewed and relied on the ownership information provided by Oro East Mariposa, LLC, which to GeoSolve, Inc.’s knowledge is correct. GeoSolve, Inc. obtained a copy of the quick claim deed transfers, where the subject property was transferred to Oro East Mariposa, LLC from Mr. Timothy Chen. GeoSolve, Inc. has relied on Mr. Timothy Chen’s documents to establish mineral title of the subject property. Oro East Mariposa, LLC is unaware of any environmental liabilities associated with the subject property. During the site visit conducted on October 15, 2014, GeoSolve, Inc. did not notice any existing obvious environmental liabilities associated with the Red Bank mine property. However, limiting drainage from existing the mine adits and open pit areas during investigation and future ore production activities would significantly reduce any future environmental acid-mine drainage, if any, originating from the Red Bank mine property to Lake McClure.
Mining and Reclamation plans were submitted to the Mariposa Planning Department for review, which will also include the United States Bureau of Land Management for California (http://www.blm.gov/ca/st/en/prog/minerals.html). A California Regional Water Quality Control Board (RWQCB) storm water pollution prevention permit will be required for industrial activities prior to commencement of mining at the Red Bank mine to insure sedimentation is not being eroded into Lake McClure. California Occupational Safety and Health Administration (Cal OSHA) is the agency responsible for tunnel and mine safety, as well as testing for mine atmosphere. A blasting permit (Federal Explosive Permit) can be obtained through the Federal Department of Alcohol Tobacco and Firearms (ATF). Access to the Red Bank mine property is from Highway 49, approximately 17 miles north of the town of Mariposa on the left side of the road (west side) via a minor and un-improved dirt road. Four-wheel drive vehicles are strongly recommended while entering the Red Bank Mine property. Due to the steep slopes and steep inclinations encountered on the dirt access road from Highway 49 to the Red Bank mine, slow speed is also strongly recommended due to safety concerns. Improving the access road conditions would greatly increase production and safety at the Red Bank mine property.
Accessibility, Climate, Local Resources, Infrastructure and Physiography
As discussed in Section 4.0, access to the Red Bank mine property is attainable via Highway 49 approximately 17 miles north of the town of Mariposa, California and/or 10 miles south of Coulterville, California, and is entered from a dirt and un-improved road on the western side of Highway 49, which significantly decreases by approximately 350 feet in elevation. The entrance is on a slight blind-curve on Highway 49 and care should be taken while entering the Red Bank mine property. Access to the Red Bank mine property is highly not recommended during and immediately after a significant precipitation event due to the clayey nature and un-safe driving conditions at the Red Bank mine property.
Mariposa, California climate is mild during summer when temperatures tend to be in the 60's and very cold during winter when temperatures tend to be in the 30's. The warmest month of the year is July with an average maximum temperature of 77.60 degrees Fahrenheit (F), which can reach over 110 degrees F. The coldest month of the year is December with an average minimum temperature of 25.30 degrees Fahrenheit.
Temperature variations between night and day tend to be moderate during summer with a difference that can reach 29 degrees Fahrenheit, and moderate during winter with an average difference of 20 degrees Fahrenheit.
The annual average precipitation at Mariposa is 30.18 inches. Winter months tend to be wetter than summer months. The wettest month of the year is January with an average rainfall of 6.20 inches (http://www.idcide.com/weather/ca/mariposa.htm).
Ideal mining operating seasons would be from late spring (May) to late fall (October), when rainfall is least.
Due to the limited horizontal (flat) topography at the Red Bank mine property, ore is recommended to be consolidated and removed to another area for processing. This will also reduce potential environmental liabilities associated with leaks and spills associated with producing mineral concentrates on the property.
Regional Mining History
Gold quartz veins in the Motherlode have a long history in California. The Mother Lode Belt (MLB) produced an excess of 40 million oz. of gold through 1964 and recent mining activities in the 1990s and 2000s has produced an estimated 10 to 20 million additional oz. of gold. The Red Bank mine property is situated on the southern end of the MLB.
The history in the Coulterville District initiated with the surface portions of the veins and in the streams as placer mining. Coulterville was named for George Coulter, who opened a store at this location in 1849. Quartz mining initiated in approximately 1852 with the discovery of the McAlpine and Mary Harrison veins. Considerable ore mining was conducted from the 1860s until the 1890s, when many of the claims were owned by the Cook estate. Minor mining activity continued from the early 1900s until 1942. In recent years, minor mining was performed on the Virginia, McAlpine and Red Bank mine (Chen, personal communication).
In the Bagby District, streams were placer mined in the beginning of the gold rush and the Pine Tree and Josephine veins were discovered in 1849, which a portion of the claims were on the Las Mariposa Spanish Land grant of General John C. Fremont. Bagby was originally known as Benton Mills, named by Fremont for Senator Thomas Hart Benton, his father-in-law. Benton Mills was re-named in the 1890s for A. Bagby, a hotel owner along the stop to Yosemite Valley Railroad, which traversed up the Merced River canyon to Yosemite National Park.
Gold mining activity continued until 1875 and again in the early 1900s in the Bagby District. The Pine Tree-Josephine mine operated on a significant scale from 1933 to 1944 and, as stated above, the Red Bank mine was active in recent years. A portion of the mining district, including the town of Bagby, was inundated by Lake McClure in 1967 (Hanford, 2014).
Notable mine production records in the Coulterville District prior to 1964 indicated values from $100,000 on the Louisa claim to $1.5 million on the Mary Harrison claim based on $35 per oz. value. Notable mine production records in the Bagby District prior to 1964 indicated values from $50,000 on the Mexican and Oso claims up to $4 million on the Pine Tree-Josephine claims. A $100,000 specimen was obtained from the Red Bank mine.
Geologically, the gold deposit characteristics observed in the Pine Tree-Josephine mines are very similar to the Red Bank mine deposits (Hanford, 2014). Approximately 118,000 oz. of gold were recovered from the Pine Tree-Josephine mine. The gold-producing mineralized zone is comprised of gray to black schist cross-just and juxtaposed by a stockwork of quartz veins and a zone of carbonate-mariposite-talc-pyrite alteration, which defines the pre-historic New Melones Fault shears.
Red Bank Mine History
The Red Bank mine was originally owned by Mr. Percy D Pettigrew of Palo Alto, California and Horace Meyer of Cathey, California, which were comprised of the Daisy, Jubilee and Syndicate Lode placer Claims totaling approximately 165 acres. The Red Bank mine was most likely discovered in the 1860s and consisted mostly of placer mining (Hanford, 2014).
Initial hard-rock mining was undertaken from 1894 to 1897 by the Red Bank Mining Company, under Mr. Isaac Solinger and two tunnel adits to approximately 400 horizontal feet were constructed; however, the Mother lode vein was never encountered. In 1897, the mine owners were listed as Mr. Heney Bratnoble and Mr. A. Wartenweiler attempted to sell the Red Bank mine to Hamilton Smith and Associates for $100,000; however, the deal was not brokered and the property was sold to London Exploration Company. The Daisy Tunnel was extended by the London Exploration Company to approximately 500 feet, which stuck the Mother Lode vein approximately 1,000 feet below the outcrop. The producing vein was determined to be approximately 30 feet in width with ore assaying at approximately $16.00 per ton at a historical $16.00 per oz. gold value (Hanford, 2014). The Red Bank mine closed down in 1898 with little production realized. Minor mining was performed from 1910 to 1918 and approximately ten tons of ore were milled, producing 28 oz. of gold and 40 oz. of silver (Hanford, 2014). Historically, a 5-ton stamp mill and later a 125 ton stamp mill were previously on the property and operated from 1918 through 1935. During 1939 and 1940, a total of 12,786 tons of ore was milled, which yielded approximately 1,551 oz. of gold and 6,896 oz. of silver. The total production of the mine was in excess of $100,000 and contained an abnormally high concentration of silver for a Motherlode mine (Hanford, 2014).
In 1954, Mr. Jack Wildt continued mining on the eastern portion of the Red Bank mine by constructing a shaft to approximately 60 feet below ground surface (bgs). Mr. Wildt produced enough gold and silver to sustain a living for over 41 years from the Red Bank mine Wildt shaft. Drifts were installed to the north and south of the shaft at 40 feet and 60 feet bgs. Milling was relegated to talc-schist material rather than the quartz rich-gold ore due to lack of larger milling equipment, and amalgamation using mercury. As the price of gold dropped to $370 per oz. in 1995, mining activities at Red Bank mine ceased (Hanford, 2014).
Approximately 5,000 oz. of gold were recovered from the Red Bank mine by 1964 (Discovery Consultants, 1987).
Regional Geology
The Mother Lode region of California is a complex geological system of quartz veins and mineralized rock approximately 195 km long and approximately 1.5 km in width, with localized along east dipping ancient fault traces with geologic offsets of over 10 km. The quartz ore deposits are not continuous, but discontinuous lenticular masses up to 20 m in thickness. Ore bodies appear to be associated with the thickest portions of the quartz veins and are localized where veins intersect or branch outward. Ore zones typically have short strike lengths, but can be continuous in the down dip-direction for thousands of m, which dip easterly along the ancient transform fault shear zones.
Typically, zones of mineralization are porphyritic and consist of massive white quartz, opaque with coarse crystalline structure, and often contains inclusions of host country rock. Alteration is common and pervasive with ankerite dominating (Bohlke, 1989). Most gold lies within the contact between the quartz veins and footwall metamorphics, often finely disseminated in rocks around the quartz veins within the southern portion of the MLB (Bohlke, 1989).
The Sierra Nevada Mountains are the backbone of California’s topography and extend from the Cascade province to the north, the Transverse Range province to the south, the Basin and Range and Mojave provinces to the east and southeast and Great Valley to the west. The Garlock Fault is the Southern Boundary between the Mojave and Transverse Ranges provinces. The Sierra Nevada Mountains are 400 miles long and 40 to 100 miles wide and the western edge of the Sierra Nevada batholith along the ancient plate-boundary transform fault created the MLB.
The subjacent rocks are mainly igneous and metamorphic units (meta-sedimentary and meta-igneous) of diverse composition and age. Approximately 60% of the rocks are siliceous granites. The Sierra Nevada Batholith is a composite of over 100 distinct plutons from the Nevadan Orogeny (Late Jurassic to Late Cretaceous – 160 million years ago [ma] to 66 ma). The Nevadan Orogeny produced the Nevada Mountains, site of the present Sierra Nevada Mountains. The modern Sierra Nevada represents the highly eroded Nevada Mountains, which were significantly uplifted by faulting.
Ordovician meta-sediments (500 ma to 439 ma) were thought to be the oldest rocks in the Sierra (near Lake Crowley) found in the Mount Morrison roof pendant. However, the oldest rocks are Lower Cambrian archaeocyathids (540 ma) in the Big Pine pendant, about 60 km south of Crowley Lake. These roof pendants are found in the eastern Inyo-White Mountains. The Shoo Fly complex (Silurian – 439 ma – 409 ma) is overlain by Paleozoic island arc sequences) in the northern Sierra is truncated by late Devonian volcanic rocks of the Sierra Buttes Formation (409 ma to 354 ma). More volcanic rocks in the northern Sierra than in the central or eastern Sierra.
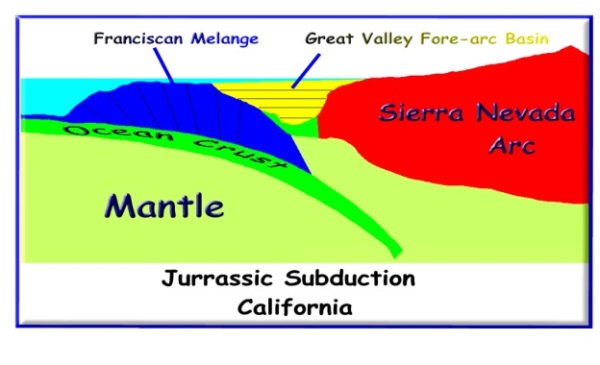
Two main orogenic events caused unconformities within the rock units, the Antler Orogeny (Devonian) and the Sonoma Orogeny (Permian). The early Jurassic sediments were the youngest rocks involved with the Nevada Orogeny. Pre-Cenozoic sedimentation on the site of today’s Sierra formerly was attributed to the presence of a Cordilleran geosyncline during much of the Paleozoic and most of the Mesozoic. The shallow trough was presumed to have extended from the Gulf of Mexico to the Arctic. The continental margin of North America in the Sierra-Klamath area is thought to have grown ocean ward by the tectonic accretion during the Phanerozoic (540 ma to 354 ma). A graphic showing the formation of Sierra Nevada Mountains is presented below.
The earliest plutons within the Sierra were small, mafic and often coarse-textured hornblende phenocrysts in a plagioclase matrix – dioritic to gabbroic. Remnants of these intrusives became inclusions in later granitic rocks. The batholith is composed of granitic rocks ranging from granite, quartz-monzonite, granodiorite and quartz diorite. These rocks were intruded into pre-Jurassic roof rocks as a series of over-lapping plutons from 88 ma to 206 ma. The Nevada Orogeny took place between 150 million years in bursts of plutonic activity with intervening periods of quiescence.
Studies in the northern Sierra reinforce the position that granitic magmas were crustally derived, while the older gabbroic and dioritic plutons were probably mantle sources. Faults controlled the placement of the different mountain building event.
The New Melones fault is an east-dipping thrust fault along which older rocks thrust westward over the Calaveras Complex. The New Melones fault is traced from the northernmost Sierra southward to the Merced River near Mariposa and bisects the subject Red Bank mine property.
Overlying the Sierran basement are late Mesozoic and Cenozoic sediments and volcanics deposited after the long erosional interval that followed the Nevadan Orogeny. Although the region generally had low relief during this period, local relief may have reached up to 3,300 feet. The Cenozoic volcanic flows and vocaniclastics were deposited discontinuously. Non marine basins received continental, lacustrine and fluvial deposits and marine sediments overlapped the western margin of the former Nevadan Mountain. These rocks comprise the superjacent series (Unruh, 1991).
The Nevadan Orogeny may have been caused by the arrival of a complex island arc at the New Melones thrust boundary. The Shoo Fly Complex contains old ocean crust and some geologists are convinced that the Shoo Fly complex is a pre-Devonian subduction complex, which incorporated large amounts of sediment from land-derived deep sea fans as well as portions from the continental slope and rise rocks. These rocks were stacked upon one another during subduction and are now overlain by the Late Devonian Grizzly Formation. The Grizzly Formation is the base of a series of Paleozoic island arc deposits that accumulated during the late Devonian to early Mississippian Antler Orogeny. The late Paleozoic Calaveras Complex appears to have jointed the continent during the early Triassic Sonoma Orogeny when it was thrust beneath the Shoo Fly, which indicates a dominantly depositional environment for much of the central and southern Sierra throughout the Paleozoic. This combination of continental shelf accumulation and terrain accretion was profoundly altered, folded, faulted by the Nevadan Orogeny in the early Jurassic. Based on the accumulation of sediments within the Sacramento Valley (25,000 feet or 5.75 miles), paleo-pollen grain studies showed aridity east of the mountains (much like today), which indicates very high mountains up to 10,000 feet and more geographically extensive than the Sierra’s.
The New Melones fault is a zone of en-echelon dip-slip faults, which have off-set up to 5,000 feet in the northern Sierra and up to 11,000 feet in the southern Sierra. Movement began in the middle Miocene and accelerated in the Pleistocene, as evidenced by the glacial till, volcanic and fault scarp deposits/surfaces.
Approximately 107 million oz. (6.6 million pounds or 3,300 tons) of gold have been extracted from the Mother Lode, primarily before 1900. The gold is found mainly in the Jurassic Mariposa slate of the Foothill Metamorphic belt.
The gold found in the Mother Lode rocks was mobilized by connate water released during metamorphism of the original marine sedimentary rocks and circulating in deep hydrothermal systems. The emplacement of plutons provided heat to drive the hot water systems. The water dissolved gold and sulfides and acquired carbon dioxide from the cooling granite magmas. The pregnant solution precipitated gold and quartz in veins and altered other rocks to form the low-grade disseminated gold deposits (Unruh, 1991) and (Wernicke, 1996).
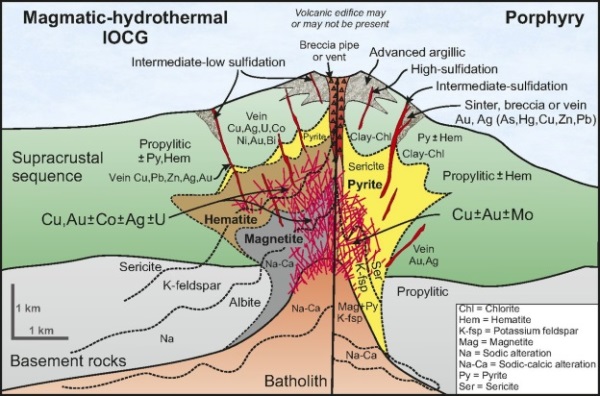
The Red Bank mine deposits are porphyritic in nature and are large geochemical anomalies of iron and sulfur with economically important enrichments of copper and gold. Porphyry deposits consist of veins and disseminations with variable proportions of chalcopyrite, bornite, molybdentie, pyrite, and magnetite, and are formed from magmatic-hydrothermal fluids exsolved from relatively oxidized, sulfur rich, calc-alkaline to mildly alkaline arc-related magmas (Richards, 2013). Deposition of gold, silver and other metals in a porphyry environment are shown below from Richards (2013); however, the volcanic pipe is preplaced by the New Melones Fault zone.
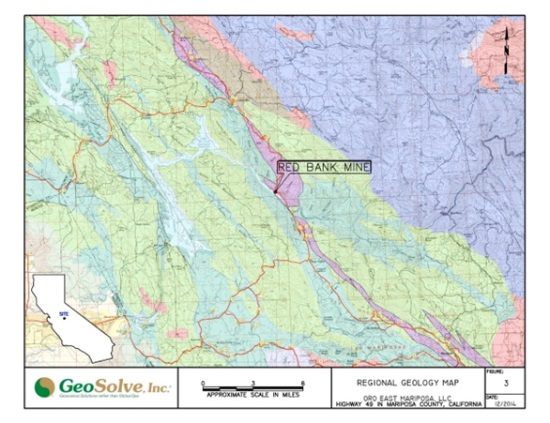
Porphyry deposits occur most commonly in Cenozoic and Mesozoic rocks, are less abundant in the Paleozoic, and are very rare in the Precambrian. One explanation for this temporal distribution is that arc-related porphyry deposits form in environments of active uplift and erosion, commonly followed by collision, and as such they are highly susceptible to loss through erosion (Richards, 2013). In addition, most porphyry deposits are formed at shallow levels (~1–5 km depth) above deeper batholiths (~5–10 km), and thus in cooler country rocks. High ambient temperatures in the host rocks would facilitate the formation of extensive zones of high-temperature alteration, from which a significant flux of crustally-derived lithophile elements such as iron, potassium, calcium, uranium, and rare earth elements (REEs). A regional geologic map of the Red Bank mine property and surrounding region is shown on Figure 3, Regional Geologic Map.
Red Bank Mine Geology and Mineralization
The local geology at the Red Bank mine property is consistent with metamorphism and metasomatism associated with porphyry induced epithermal deposition in the Miocene along the New Melones fault zone. The epithermal depositions were derived from the mobilization, alteration, and emplacement of silica-rich Cretaceous marine sediment rocks from plutonic derived heated fluids generated at depth into carbonate-rich rocks and the silica-mobilized fluid was deposited along with gold and silver within the quartz and ankerite (mariposite) veins, which trended along strike of the New Melones fault shear zones. Due to the emplacement of the Sierra Nevada plutons and the New Melones transform fault metamorphosed the bedrock at Red Bank Mine and along strike of the New Melones Fault zone. These metamorphic rocks include phyllite, slate, and meta-volcanic rocks. A belt of serpentine extends along strike of the New Melones Fault zone, especially along the northern portion of the Red Bank Mine property. Hydrated talc and highly serpentinitized zones are also juxtaposed within the fault zone, and exhibit relatively low gold and silver concentrations.
Two main quartz-mariposite veins traverse the Red Bank mine property with strikes ranging from N10W to N40W and dipping northeast up to 60 degrees from horizontal. Mariposite and ankerite deposits (silica-carbonate rocks) are the main vein rock types. Ore minerals are pryrite, argentiferous galena and native gold with minor accessories of tetrahedrite, chalcopyrite and sphalerite. The quartz veins are approximately 30 feet in width with an unknown depth, which truncate on the northern portion of the property into a knob of highly ultra-mafic serpentinite. Gold occurs in several northwest trending quartz veins and stringers with brecciated slate, schist and associated bodies of pyrite, ankerite, and arsenopyrite (Discovery Consultants, 1987).
Sample Collection and Analyses
The main mineral deposits investigated at the Red Bank mine property included quartz veins, quartz-mariposite veins, ankerite-mariposite deposits and serpentinite knob deposits. Although GeoSolve, Inc. assumed the highest gold concentrations should be within the quartz veins, mineral samples were collected from the ankerite-mariposite and serpentinte deposits for mining production evaluation purposes. Due to poor air quality, no samples were collected from the Wildt shaft. Mr. Campbell was able to enter the mine shaft until poor air quality at one of the horizontal mine adits prevented further exploration. Mineral samples were collected from the initial 45 feet into the lower tunnel adit due to the instability within the mine tunnel. Although a few rotted wood timbers were observed along the mine adit floor, no wood supports or framing was observed within the lower tunnel mine adit. Furthermore, the mine adit was partially collapsed at approximately 50 feet into the tunnel due to groundwater saturation of the mine footwall and hanging walls.
The quartz veins were extremely hard and not easily broken with hammers or using mechanical drilling methods. Similarly, the ankerite and mariposite exposed within the lower tunnel adit are very hard, but easily loosed due to extensive cleavage along strike of the New Melones Fault shear zone. No free gold was observed within hand samples collected for analyses; however, extensive mineralization was observed within the ankerite and mariposite samples. Gold ore material was also observed within the quartz vein samples. The following photograph depicts the open pit quartz vein.
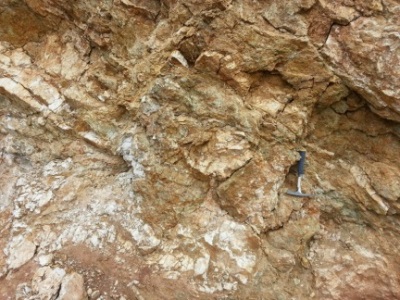
Area of Sample OP-3 from quartz vein.
The following are pictures of collecting OP-2 and LT-3 below.
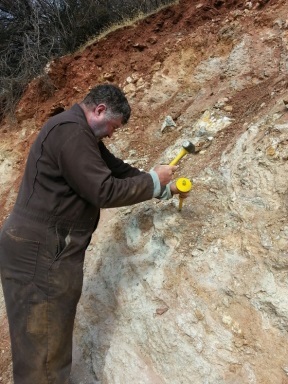
Collecting Sample OP-2 from quartz vein.
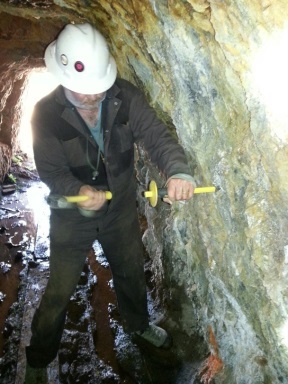
Collecting Sample LT-3 within lower tunnel mine.
Fourteen mineral samples were collected from the Red Bank mine property, four samples were collected from the open pit mine area (OP-1 through OP-4) within the quartz veins, seven samples from the lower tunnel adit (LT-1 through LT-6 and LT-6D), and three samples from the ultra-mafic serpentinite knob (S-1 through S-3), as shown below.
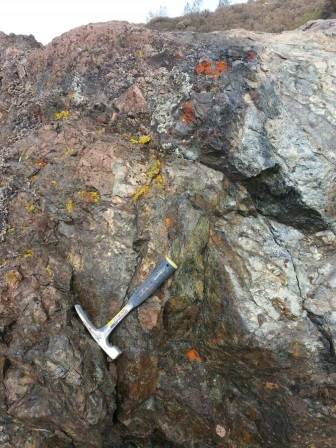
Collecting Sample S-3 within the serpentinite knob.
All mineral samples were collected using rock hammers and powered drills, which were placed into clean zip-lock bags, labeled, and placed within a sample box for temporary storage. Smaller portions of each mineral sample were also collected, placed in separate clean zip-lock bags, and labeled for potential electron microprobe analyses at the University of California at Davis.
Table 1
Mineral Sample Locations
Red Bank Mine Property
Mariposa, California
October 15, 2014
|
Sample ID
|
Mineral Type
|
|
|
OP-1
|
Quartz Porphyry
|
|
|
OP-2
|
Quartz Porphyry
|
|
|
OP-3
|
Quartz Porphyry-Mariposite
|
|
|
OP-4
|
Quartz Porphyry
|
|
|
LT-1
|
Ankerite-Mariposite-Talc
|
|
|
LT-2
|
Ankerite-Mariposite-Talc
|
|
|
LT-3
|
Ankerite-Mariposite-Talc
|
|
|
LT-4
|
Ankerite-Mariposite-Talc
|
|
|
LT-5
|
Quartz-Ankerite
|
|
|
LT-6
|
Quartz-Ankerite
|
|
|
TL-6D
|
Quartz-Ankerite
|
|
| S-1 |
Serpentinite
|
|
| S-2 |
Serpentinite
|
|
| S-3 |
Serpentinite
|
All fourteen mineral samples were submitted to ALS Minerals in Reno, Nevada under a chain-of-custody form for fine rock crushing and pulverizing to 85% less than 75 microns. The crushed and pulverized mineral samples were then analyzed for 34 elements using ICP-MS, base metals, gold (au), platinum (pt) and palladium (pd) by ICP-AES, total carbon and total sulfur by LECO and lithium borate fusion by ICP-MS. The ALS Minerals laboratory analytical report is attached to Appendix A, ALS Minerals Laboratory Report and the precious metals and REEs concentrations are shown on Table 2, Laboratory Analytical Results of Mineral Samples – Precious Metals, Table 3, Laboratory Analytical Results of Mineral Samples – Rare Earth Elements, and Table 4, Analytical Results of Averaged Concentrations for Mineral Oxides and Non-Metal Elements in Mineral Samples.
Four split mineral samples, OP-2, OP-4, LT-4 and LT-6 were submitted for electron microprobe analyses under chain-of-custody documentation to University of California at Davis department of Earth and Planetary Sciences (UC Davis). The purpose of the electron microprobe analyses was to evaluate the geochemistry of gold and silver mineralization on the ore body at the Red Bank mine property.
Table 2
Laboratory Analytical Results of Mineral Samples – Precious Metals
Red Bank Mine
Mariposa County, California
October 15, 2014
|
Sample ID
|
Au
(ppm)
|
Au
(oz/tt)
|
Ag
(ppm)
|
Ag
(oz/tt)
|
Pt
(ppm)
|
Pd
(ppm)
|
Cu
(ppm)
|
||||||||||||||||||||||
|
OP-1
|
0.389 | 0.0125 | 1.7 | 0.0546 | 0.0000 | 0.0030 | 19.0 | ||||||||||||||||||||||
|
OP-2
|
3.16 | 0.1016 | 1.7 | 0.0546 | 0.0050 | 0.0090 | 16.0 | ||||||||||||||||||||||
|
OP-3
|
0.09 | 0.0029 | 0 | 0.0000 | 0.0000 | 0.0030 | 41.0 | ||||||||||||||||||||||
|
OP-4
|
1.61 | 0.0517 | 0 | 0.0000 | 0.0000 | 0.0030 | 11.0 | ||||||||||||||||||||||
|
LT-1
|
0.026 | 0.0008 | 0.7 | 0.0225 | 0.0000 | 0.0030 | 62.0 | ||||||||||||||||||||||
|
LT-2
|
0.028 | 0.0009 | 3.0 | 0.0964 | 0.0000 | 0.0040 | 63.0 | ||||||||||||||||||||||
|
LT-3
|
0.58 | 0.0186 | 0 | 0.0000 | 0.0000 | 0.0020 | 31.0 | ||||||||||||||||||||||
|
LT-4
|
1.005 | 0.0323 | 0.6 | 0.0193 | 0.0000 | 0.0020 | 25.0 | ||||||||||||||||||||||
|
LT-5
|
0.308 | 0.0099 | 0.5 | 0.0161 | 0.0000 | 0.0080 | 105 | ||||||||||||||||||||||
|
LT-6
|
0.511 | 0.0164 | 1.5 | 0.0482 | 0.0000 | 0.0080 | 71.0 | ||||||||||||||||||||||
|
LT-6D
|
0.424 | 0.0136 | 1.1 | 0.0353 | 0.0000 | 0.0100 | 105 | ||||||||||||||||||||||
| S-1 | 0.003 | 0.0001 | 0 | 0.0000 | 0.0050 | 0.0040 | 7.0 | ||||||||||||||||||||||
| S-2 | 0.002 | 0.0001 | 0 | 0.0000 | 0.0000 | 0.0020 | 7.0 | ||||||||||||||||||||||
| S-3 | 0.001 | 0.000 | 0 | 0.0000 | 0.0050 | 0.0030 | 7.0 | ||||||||||||||||||||||
|
Average
|
0.739 | 0.0237 | 0.771 | 0.0315 | 0.0017 | 0.0050 | 49.909 | ||||||||||||||||||||||
Au = Gold
Ag = Silver
Cu = Copper
Pt = Platinum
Pd = Palladium
Table 3
Laboratory Analytical Results of Mineral Samples – Rare Earth Elements
Red Bank Mine
Mariposa County, California
October 15, 2014
|
Sample ID
|
Dy
(ppm)
|
Er
(ppm)
|
Ho
(ppm)
|
Lu
(ppm)
|
Tb
(ppm)
|
Tm
(ppm)
|
Y
(ppm)
|
Yb
(ppm)
|
|||||||||||||||||||||||||
|
OP-1
|
0.27 | 0.16 | 0.05 | 0.03 | 0.04 | 0.03 | 1.8 | 0.16 | |||||||||||||||||||||||||
|
OP-2
|
0.76 | 0.45 | 0.15 | 0.08 | 0.14 | 0.07 | 5.5 | 0.46 | |||||||||||||||||||||||||
|
OP-3
|
0.14 | 0.05 | 0.02 | 0.01 | 0.02 | 0.02 | 0.70 | 0.06 | |||||||||||||||||||||||||
|
OP-4
|
0.42 | 0.20 | 0.10 | 0.03 | 0.06 | 0.03 | 2.1 | 0.18 | |||||||||||||||||||||||||
|
LT-1
|
2.76 | 1.75 | 0.58 | 0.30 | 0.47 | 0.27 | 17.3 | 1.77 | |||||||||||||||||||||||||
|
LT-2
|
2.38 | 1.50 | 0.51 | 0.23 | 0.42 | 0.26 | 14.7 | 1.57 | |||||||||||||||||||||||||
|
LT-3
|
2.18 | 1.39 | 0.45 | 0.18 | 0.34 | 0.22 | 14.3 | 1.37 | |||||||||||||||||||||||||
|
LT-4
|
1.89 | 1.11 | 0.37 | 0.20 | 0.29 | 0.17 | 9.7 | 1.11 | |||||||||||||||||||||||||
|
LT-5
|
4.0 | 2.43 | 0.87 | 0.36 | 0.70 | 0.37 | 24.5 | 2.46 | |||||||||||||||||||||||||
|
LT-6
|
2.31 | 1.46 | 0.5 | 0.25 | 0.40 | 0.23 | 14.0 | 1.43 | |||||||||||||||||||||||||
|
LT-6D
|
3.84 | 2.37 | 0.82 | 0.37 | 0.61 | 0.35 | 23.4 | 2.21 | |||||||||||||||||||||||||
| S-1 | 0.32 | 0.23 | 0.06 | 0.03 | 0.04 | 0.04 | 1.9 | 0.19 | |||||||||||||||||||||||||
| S-2 | 0.17 | 0.13 | 0.04 | 0.03 | 0.02 | 0.02 | 1.0 | 0.17 | |||||||||||||||||||||||||
| S-3 | 0.50 | 0.32 | 0.10 | 0.05 | 0.06 | 0.06 | 2.8 | 0.34 | |||||||||||||||||||||||||
|
Average
|
1.56 | 0.97 | 0.33 | 0.15 | 0.25 | 0.15 | 9.55 | 0.96 | |||||||||||||||||||||||||
Dy = Dysprosium
Er = Erbium
Ho = Holmium
Lu = Lutetium
Tb = Terbium
Tm = Thulium
Y = Yttrium
Yb = Ytterbium
Table 4
Analytical Results of Averaged Concentrations for
Mineral Oxides and Non-Metal Elements in Mineral Samples
Red Bank Mine
Mariposa County, California
October 15, 2014
|
Mineral Oxide &
Non-Metal Elements
|
Average
(ppm)
|
||||
| C | 1.47 | ||||
| S | 0.09 | ||||
|
BaO
|
0.05 | ||||
|
SiO2
|
64.63 | ||||
|
TiO2
|
0.23 | ||||
|
Al2O3
|
5.82 | ||||
|
Cr2O3
|
0.11 | ||||
|
Fe2O3
|
4.98 | ||||
|
MnO
|
0.08 | ||||
|
MgO
|
12.24 | ||||
|
CaO
|
1.67 | ||||
|
Na2O
|
0.11 | ||||
| K2O | 1.22 | ||||
| P2O5 | 0.01 | ||||
|
LOI (%)
|
9.88 | ||||
Mineral Oxides
SiO2 = quartz
TiO2 = titanium oxide
Al2O3 = aluminum oxide
Cr2O3 = chromium oxide
MnO = manganese oxide
CaO = calcium oxide
Na2O = sodium oxide
K2O = potassium oxide
P2O5 = phosphorus oxide
MgO = magnesium oxide
Physical Testing & Non-Metal Elements
C = Carbon
S = Sulfur
LOI = loss of ignition measured in percent (%)
Summary of Laboratory Analytical Results
The laboratory analytical results of the mineral samples OP-1 through OP-4, LT-1 through LT-6 and LT-6D and S-1 through S-3 indicated moderate to high gold and silver concentrations within mineral samples collected from the open mine pit within the quartz vein (OP-1 through OP-4). Low to moderate gold concentrations were detected in samples collected from the lower tunnel mine adit (LT-1 through LT-6 and LT-6D; however, moderate to very high concentrations of REEs were detected in mineral samples from the lower tunnel mine adit, which was within the ankerite-mariposite mineralization zone. No significant gold, silver or REE’s were detected in samples S-1 through S-3 collected from the ultra-mafic serpentinite knob outcrop. Moderate to high copper concentrations were detected in mineral samples OP-1 through OP-4 and LT-1 through LT-6 and LT-6D. Platinum concentrations were very low in all mineral samples analyzed. Low concentrations of palladium were also detected in all mineral samples analyzed. These results are summarized on Tables 2 and 3.
Moderate to high averaged silica concentrations were detected in all mineral samples analyzed. Low to moderate averaged aluminum oxides, iron oxides and magnesium oxides were detected in all mineral samples analyzed and very low averaged concentrations of carbon and sulfur were detected in mineral samples analyzed. Low averaged concentrations of calcium oxides, potassium oxides, and phosphorus oxides were also detected in all mineral samples analyzed. These results are summarized on Table 4.
UC Davis Microprobe Analyses
Four samples from Red Bank Mine were examined in an electron microprobe, which allows scanning of a planar surface for particular elements and visually image how elements exist in the mineralization phase. This qualitative view of the elements’ abundances and distribution is combined with our knowledge of mineralogy to make a determination of what mineral phases are present. The samples analyzed were OP-2, OP-4, LT-4 and LT-6. Gold was detected in samples LT-6 and OP-2. The other two samples did not have detectable gold at the surface of the cut.
The surfaces were selected by targeting the contact region between quartz and carbonate veins and adjacent sulfides or clays. After primary cuts were made the cut surfaces were epoxied to a glass slide and the adjacent material was trimmed with a rock saw down to approximately 100 microns (µm) thick, then polished with fine diamond or aluminum-oxide grit. The polished surface was coated with approximately 200 angstroms of vaporized carbon to make the surface conductive. Back-scattered electron (BSE) imaging is the primary tool to identify gold (Au) and other elements of interest. The brightness in an image is due to increased amounts of back-scattered electrons, which is directly related to the total mass of the material. Thus Au and other precious elements, which are very dense relative to the surrounding silicates and carbonates, will be very bright in BSE images. Once Au or other phases of interest are identified by BSE, one can determine what elements are present by using EDS (energy dispersive spectrometry) and WDS (wave-length dispersive spectrometry). The EDS scans show the elements present in a volume approximately 1 µm-wide by approximately 6 to 10 µm deep in volume of the total grain. This method may pick up elements from surrounding minerals when the gold is very fine (less than 5 µm), which is the case in these samples. Thus some of the EDS plots have elements which are not likely to be part of the Au-bearing compound but are from the surrounding matrix mineral(s). A copy of the UC Davis Report of Gold Occurrence Identified by Imaging and Qualitative Chemical Analysis is attached to Appendix A.
Discussion of Mineral Resource Estimates
The yellow high-lighted areas in Tables 2 and 3 indicate sample locations and mineral concentrations recommended for additional mineral exploration for gold, silver, and REEs.
The gold concentration average for samples OP-1 through OP-4 and LT-1 through LT-6 and LT-6D was calculated at 0.739 ppm and the 95% upper confidence level (UCL) using the EPA computer program ProUCL version 4.02 was calculated at 1.617 ppm. UCL is a statistical method of numerically evaluating and comparing sets of numbers, such as chemical concentrations to a mathematical mean and 95% confidence level of statistical accuracy. The average ounce (oz) per troy ton (tt) of gold within mineral samples OP-1 through OP-4 and LT-1 through LT-6 and LT-6D was calculated at 0.0237 oz/tt and the 95% UCL using the EPA computer program ProUCL version 4.02 was calculated at 0.052 oz/tt.
The silver concentration average for samples OP-1 through OP-4 and LT-1 through LT-6 and LT-6D was calculated at 0.925 ppm and the 95% UCL using the EPA computer program ProUCL version 4.02 was calculated at 1.56 ppm. The average troy ounce per ton of silver within mineral samples OP-1 through OP-4 and LT-1 through LT-6 and LT-6D was calculated at 0.031 oz/tt and the 95% UCL using the EPA computer program ProUCL version 4.02 was calculated at 0.059 oz/tt.
The Pine Tree-Josephine mine immediately south of the Red Bank mine property, indicated gold was deposited within two quartz veins bounding a pyritic grey talc carbonate schist between the quartz veins (Discovery Consultants, 1987). An average gold concentration of 0.058 oz/tt was reported within this deposit, which is very similar in geology to the deposited mapped in the lower tunnel mine adit on the Red Bank mine property.
Based on the UC Davis microprobe analyses, Au occurs in different mineral associations in the two samples. Sample LT-6 has 0.5 to 5 µm gold occurring as almost pure Au with minor Ag. Au also occurs both as a phase within quartz (Figure 2) and in a chlorite-smectite clay layer within the quartz vein material (Figure 1). The Au in sample OP-2 is always associated with Fe-rich material that appears to be a mixture of goethite (FeO(OH)), actinolite or tremolite, and Fe-oxide (Figure 4). These minerals are replacing some coarser phase, which may have been pyrite (minor primary pyrite found in one grain). The Au in OP-2 contains Ag in varying abundance, from very minor to significant. Platinum and palladium were actively searched for but no evidence for either was found. Sample OP-2 does contain a few crystals of a Ni-As-Sb-S phase. The latter could be a solid-solution between Gersdorfitte (NiAsS) and Ullmannite (NiSbS). Arsenopyrite was also identified. These Ni- and As-bearing sulfides are associated with moderate-temperature hydrothermal veins. A copy of the UC Davis Report of Gold Occurrence Identified by Imaging and Qualitative Chemical Analysis is attached to Appendix A.
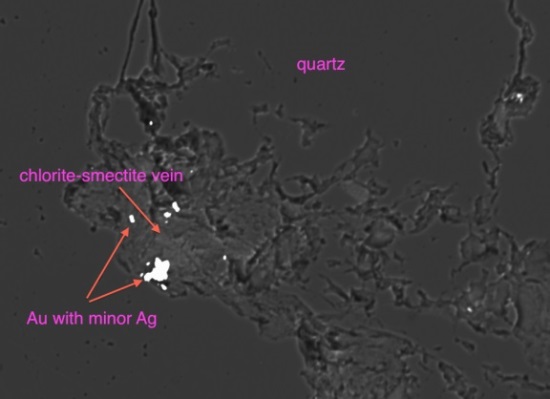
Figure 1 - LT-6 sample. Back-scattered electron image showing association of Au with
Chlorite-smectite vein material within quartz vein. Scale bar on Figure 2.
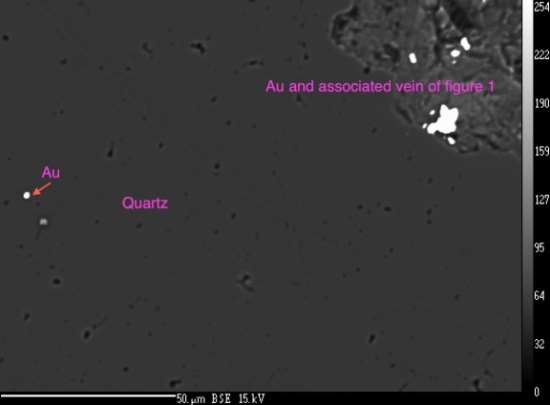
Figure 2 - LT-6 sample. Back-scattered electron image showing very fine Au in quartz vein.
Other occurrences in this sample show similar fine Au aligned within quartz.
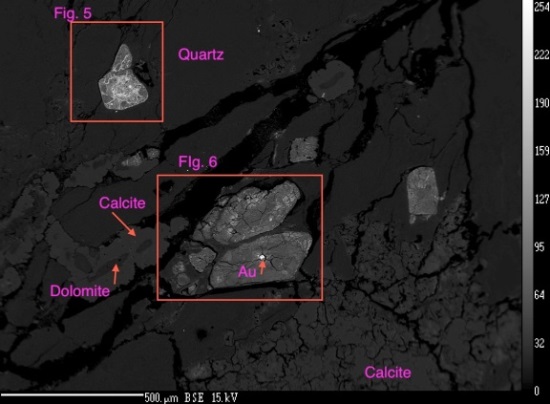
Figure 4 - OP-2 dominantly quartz and carbonate veins.
The carbonates include low-Mg calcite and dolomite. Gold is only found within grains of dominantly goethite, which may have been replacing pyrite (based on morphology and minor pyrite found in one grain (Fig. 5).
The Report does not make any recommendation regarding any work program or the anticipated costs of any exploration activities.
EMPLOYEES
We have used the services of subcontractors for manual labor. We have also engaged a North American educated geoscientist as outside consultant to evaluate and conform to American standards and to render independent recommendations. The Company currently has five full and part-time employees and will hire engineers and other subcontractors on an as needed basis.
See also “Significant Employees” under Part III, Item 10(b) below.
Item 1A. Risk Factors.
As a “smaller reporting company” as defined by Item 10 of Regulation S-K, the Company is not required to provide this information.
Item 1B. Unresolved Staff Comments.
None.
Item 2. Description of Properties.
OFFICE FACILITIES
The Company was incorporated in the State of Delaware on February 15, 2008, and established an end of December fiscal year end. Its corporate headquarters is located at 7817 Oakport Street, Suite 205, Oakland, CA 94621, which the Company is leasing, with telephone number (510) 638-5000.
Item 3. Legal Proceedings.
The civil complaint that the Company’s subsidiary, Oro East Mariposa, LLC filed against Allied Business Financial Services, Inc. for breach of contract and other claims The suit was filed on July 11, 2014 in the Superior Court of California in the County of Orange, Case Number 30-2014-00733630-CU-BC-CJC and is still pending.
In July and August 2013, the Internal Revenue Service (“IRS”) issued penalties against the Company under Section 6038 and 6038A of the Internal Revenue Code for failure to file Form 5471 and 5472. The total penalty assessment was $60,000 plus interest charges. As of December 31, 2014, total penalty assessment including interest charges was about $60,323. In response, the Company filed a Reasonable Cause Statement to appeal for full abatement of the penalty, citing reasonable cause and requesting an administrative waiver or offer-in-compromise. Subsequently, the Company retained Louie and Wong LLP, tax professionals to assist in handling the matter with the IRS. The final result of the proceeding is still pending as of this filing.
Aside from the foregoing matters, there are no other pending legal proceedings to which the Company is a party or in which any director, officer or affiliate of the Company, any owner of record or beneficially of more than 5% of any class of voting securities of the Company, or security holder is a party adverse to the Company or has a material interest adverse to the Company. The Company’s mineral claim is not the subject of any pending legal proceedings.
Item 4. Mine Safety Disclosures.
Not applicable.
PART II
Item 5. Market for Common Equity, Related Stockholder Matters and Small Business Issuer Purchases of Equity Securities.
Common Stock
Our Certificate of Incorporation, as amended on May 23, 2014, authorizes the issuance of up to 2,000,000,000 shares of common stock, par value of $.0001 per share (the “Common Stock”). The number of shares outstanding of each of the issuer’s classes of common equity, as of the latest practicable date: 581,023,700 shares of common stock, par value $.0001 per share, outstanding as of March 23, 2015.
The Company sold 8,546,000 shares of common stock to other investors for cash of $1,281,900 during 2013. The Company did not issue any shares for cash during 2014.
The Company issued 14,957,400 and 840,000 common shares for services during 2014 and 2013. The Company recognized a total of $1,120,637 and $51,324 share-based payment expenses during 2014 and 2013, respectively. The Company also issued 160,000 common shares to pay for the accrued salaries of $16,000.
The Company issued 22,400,000 common shares for conversion of $460,000 short-term notes during 2014.
Dividend Policy
We have not declared or paid dividends on our common stock since our formation, and we do not anticipate paying dividends in the foreseeable future. Declaration or payment of dividends, if any, in the future, will be at the discretion of our Board of Directors and will depend on our then current financial condition, results of operations, capital requirements and other factors deemed relevant by the Board of Directors. There are no contractual restrictions on our ability to declare or pay dividends.
Securities Authorized for Issuance under Equity Compensation Plans
Please refer to Item 12 of this annual report for further information of the 2013 Stock Incentive Plan, which was adopted in May 2013 and provides up to 100,000,000 shares of the Company’s common stock for issuance.
Recent Sales of Unregistered Securities
On July 3, 2014, the Company offered and sold 14,250,000 shares of common stock to two offerees in exchange for their services for a period of two years. The offerings were made in reliance on the exemption from registration afforded by Rule 903(b)(3) of Regulation S, promulgated pursuant to the Securities Act of 1933, as amended (the “Securities Act”). The Company made the offer and sale offshore of the US, to a non-US person, with no directed selling efforts in the US, where offering restrictions were implemented.
On September 18, 2014, the Company offered and sold 5,000,000 shares of common stock to one offeree in exchange for the cancelation of debt of $25,000, or $0.005 per share. The offering was made in reliance on the exemption from registration afforded by Rule 903(b)(3) of Regulation S, promulgated pursuant to the Securities Act of 1933, as amended (the “Securities Act”). The Company made the offer and sale offshore of the US, to a non-US person, with no directed selling efforts in the US, where offering restrictions were implemented.
On September 18, 2014, the Company offered and sold 5,000,000 shares of common stock to one offeree in exchange for the cancelation of debt of $25,000, or $0.005 per share. The offering was made in reliance on the exemption from registration afforded by Section 4(a)(2) of the Securities Act, in a non-public offering to a sophisticated investor who had access to registration-type information of the Company.
On September 24, 2014, the Company offered and sold 10,000,000 shares of common stock to one offeree in exchange for the cancelation of debt of $50,000, or $0.005 per share. The offering was made in reliance on the exemption from registration afforded by Rule 903(b)(3) of Regulation S, promulgated pursuant to the Securities Act. The Company made the offer and sale offshore of the US, to a non-US person, with no directed selling efforts in the US, where offering restrictions were implemented.
Issuer Purchases of Equity Securities
None in 2014.
Item 6. Selected Financial Data.
As a “smaller reporting company” as defined by Item 10 of Regulation S-K, the Company is not required to provide this information.
Item 7. Management’s Discussion and Analysis of Financial Condition and Results of Operation.
The following discussion provides information that the Company’s management believes is relevant to an assessment and understanding of our results of operations and financial condition. The discussion should be read along with the Company’s consolidated financial statements and notes thereto. This section includes a number of forward-looking statements that reflect our current views with respect to future events and financial performance. Forward-looking statements are often identified by words like believe, expect, estimate, anticipate, intend, project and similar expressions, or words which, by their nature, refer to future events. Undue certainty should not be placed on these forward-looking statements. These forward-looking statements are subject to certain risks and uncertainties that could cause actual results to differ materially from our predictions.
Business Overview
The current business activity of the Company does not include any mining exploration. Rather, after the purchase of the WMUs at Carson Hill, the Company is focused on producing gold concentrates from the mining waste and leached ore.
The Company had set as one of its 2014 goals to obtain reclassification approval of the waste at the WMUs as Group “C” Mining Waste. As of September, 2014, the Company is pleased to inform that the California Environmental Protection Agency’s Central Valley Water Board (“Water Board”) approved Oro East’s Carson Hill Mining Waste Reclassification Project in a memorandum issued by the Water Board.
One of the Company’s target objectives for 2014 was also to complete the pilot scale froth flotation system that the Company has set up at the Carson Hill site along with a Sand Plant. The leached ore from the WMUs are being crushed and transported to the Sand Plant to produce, bag, and ship gold concentrates. The Company is pleased to inform that such pilot systems were implemented and operated successfully.
The Company also sought to advance aggressive sales of the gold concentrates from the WMUs. In fiscal year 2014, the Company secured several major corporate buyers in China and the Middle East as noted in the Company’s various 8-K filings for the year.
Our plan of operation for the period through December 31, 2015 is as follows:
|
·
|
Seek additional mineral exploration opportunities in the State of California;
|
|
·
|
Develop and bring to operation the Red Bank mining site;
|
|
·
|
Continue the water flotation at the Carson Hill WMUs;
|
|
·
|
Continue to secure joint venturers, major investors, and buyers for gold concentrates and related precious mineral products.
|
Liquidity and Capital Resources
As of December 31, 2014 and 2013, the Company had a total of $940,024 and $647,489 in assets, respectively. The Company also had $2,544,660 and $959,796 current liabilities as of December 31, 2014 and 2013, respectively.
The following is a summary of the Company's cash flows provided by (used in) operating, investing, and financing activities for the years ended December 31, 2014 and 2013:
|
2014
|
2013
|
|||||||
|
Net Cash Used In Operating Activities
|
$
|
(1,548,898
|
)
|
$
|
(1,743,210
|
)
|
||
|
Net Cash Used In Investing Activities
|
(540,666
|
)
|
(159,441
|
)
|
||||
|
Net Cash Provided By Financing Activities
|
2,098,780
|
1,611,433
|
||||||
|
Effect of exchange rate on cash
|
(2,356
|
)
|
(25,558
|
)
|
||||
|
Net Increase (Decrease) In Cash
|
$
|
6,860
|
$
|
(316,776
|
)
|
|||
Total cash increased by about $7,000 was mainly due to about $1,550,000, $1,115,000, and $540,000 of cash used in funding the operations, repayment of notes, and acquisition of property and equipment, respectively, with about $2,840,000 and $372,000 of cash provided by the notes issuances and shareholder advances, respectively, during the year ended December 31, 2014.
Results of Operations
The following is a summary of the Company’s operation results for the years ended December 31, 2014 and 2013:
|
2014
|
2013
|
|||||||
|
Total revenues
|
$
|
16,918
|
$
|
127,234
|
||||
|
Total cost of revenues
|
(14,001
|
)
|
(73,390
|
)
|
||||
|
Gross profit
|
2,917
|
53,844
|
||||||
|
Total operating expenses
|
(2,649,459
|
)
|
(1,629,086
|
)
|
||||
|
Total other expense
|
(696,218
|
)
|
(25,482
|
)
|
||||
|
Net loss
|
$
|
(3,342,760
|
)
|
$
|
(1,600,724
|
)
|
||
As explained in Part I Item 1 and the Business Overview section above, the Company is no longer in the exploration stage upon changing of the Company’s business plan.
Net loss increased by about $1,740,000 from 2013 to 2014 due to the increase of about $1,455,000 and $670,000 in general and administrative and other expenses, respectively, with about $436,000 and $51,000 decrease in exploration costs and gross profit.
Increase of about $1,455,000 in general and administrative expenses was mainly due to the increase of $1,060,000 in share-based compensation, $100,000 in payroll expenses, $70,000 in legal and professional fees, $80,000 in depreciation, and $145,000 in other general and administrative of Oro East Mariposa, respectively. Increase about of $670,000 in other expenses was mainly due to the increase in about $634,000 in interest expense and $36,000 in loss on disposal of assets, respectively. There were no exploration costs in 2014 as the Company ceased any exploration activities in 2014.
Off-Balance Sheet Arrangements
The Company does not have any off-balance sheet arrangements that have or are reasonably likely to have a current or future effect on the Company’s financial condition, changes in financial condition, revenues or expenses, results of operations, liquidity, capital expenditures or capital resources that is material to investors.
Seasonality
Our operating results are not affected by seasonality.
Inflation
Our business and operating results are not affected in any material way by inflation.
Critical Accounting Policies
Emerging Growth Company
We are an “emerging growth company,” as defined in the Jumpstart our Business Startups Act of 2012, and we may take advantage of certain exemptions from various reporting requirements that are applicable to other public companies, including, but not limited to, not being required to comply with the auditor attestation requirements of Section 404 of the Sarbanes-Oxley Act, reduced disclosure obligations regarding executive compensation in our periodic reports and proxy statements, and exemptions from the requirements of holding a nonbinding advisory vote on executive compensation and shareholder approval of any golden parachute payments not previously approved.
Under the Jumpstart Our Business Startups Act, “emerging growth companies” can delay adopting new or revised accounting standards until such time as those standards apply to private companies. We have elected not to avail ourselves to this exemption from new or revised accounting standards and, therefore, we will be subject to the same new or revised accounting standards as other public companies that are not “emerging growth companies.”
Use of Estimates
The preparation of consolidated financial statements in conformity with accounting principles generally accepted in the United States requires management to make estimates and assumptions that affect the amounts of assets and liabilities and disclosure of contingent assets and liabilities at the date of the balance sheet and reported amounts of revenues and expenses during the reporting period. Actual results could differ from those estimates.
Revenue
Revenue from gold concentrate sales is recognized when the title and risk of loss pass to the buyer and when collectability is reasonably assured. The title and risk of loss is passed to the buyer based on the terms of the sales contract entered into with the buyer when the gold concentrates are shipped at the loading port.
Revenue is recorded and buyer is invoiced based on a provisional sales price as determined in accordance with the terms as specified in the sales contract at the time of shipment. Upon final settlement with the buyer (generally one to two months from the shipment date), the provisional sales price is adjusted based on the contract terms. Between shipment and final settlement, changes in gold futures settlement price on the Commodity Exchange Inc. (“COMEX”) result in adjustment to the revenue. The gold concentrate sales contain an embedded derivative that is required to be bifurcated from the host contract, which is the sale of the metal gold contained in the concentrates at the COMEX gold future settlement prices as specified in the contract. The embedded derivative does not qualify for hedge accounting and is adjusted to fair value through earnings each reporting period, using the COMEX gold future settlement prices at period-end, until final settlement.
Exploration Costs
Mineral property exploration costs are expensed as incurred until such time as economic reserves are quantified.
Share-based Compensation
The Company recognizes the services received in a share-based payment transaction as the services are received. The services received are measured at the fair value of the equity instruments issued.
Concentrations
Major Customers
During 2014 and 2013, all of the Company’s revenues were from one customer.
Credit Risk
Financial instruments that potentially subject the Company to concentration of credit risk consist primarily of cash. The Company’s cash are held at various recognized financial institutions, and we do not believe significant concentration of credit risk exists.
Foreign Currency Translation
The consolidated financial statements are presented in United States dollars. In accordance with ASC 830, foreign denominated monetary assets and liabilities are translated into their United States dollar equivalents using foreign exchange rates which prevailed at the balance sheet date. Revenue and expenses are translated at average rates of exchange during the year. Gains or losses resulting from foreign currency transactions are included in results of operations.
Going Concern
The accompanying consolidated financial statements have been prepared on a going concern basis, which assumes the Company will realize its assets and discharge its liabilities in the normal course of business. As reflected in the accompanying consolidated financial statements, the Company has an accumulated deficit of $8,011,200 and a negative working capital of $2,262,681 at December 31, 2014. The Company’s ability to continue as a going concern is dependent upon its ability to generate future profit from operations and/or to obtain the necessary financing to meet its obligations and repay its liabilities arising from the normal business operations when they come due. Management’s plan includes obtaining additional funds by equity and debt financing and/or related party advances, but there is no assurance of additional funding being available. These conditions raise substantial doubt about the Company’s ability to continue as a going concern. The accompanying consolidated financial statements do not include any adjustments that might arise as a result of this uncertainty.
Contractual Obligations
As a “smaller reporting company” as defined by Item 10 of Regulation S-K, the Company is not required to provide this information.
Item 7A. Quantitative and Qualitative Disclosures about Market Risk.
As a “smaller reporting company” as defined by Item 10 of Regulation S-K, the Company is not required to provide this information.
Item 8. Financial Statements and Supplementary Data.
Audited Consolidated financial statements begin on the following page of this report.
REPORT OF INDEPENDENT REGISTERED PUBLIC ACCOUNTING FIRM
To the Board of Directors and Stockholders
Oro East Mining, Inc.
Oakland, California
We have audited the accompanying consolidated balance sheets of Oro East Mining, Inc. and its subsidiaries, (collectively, the “Company”) as of December 31, 2014 and 2013 and the related consolidated statements of operations and comprehensive loss, changes in stockholders' deficit, and cash flows for the years then ended. These financial statements are the responsibility of the Company’s management. Our responsibility is to express an opinion on these financial statements based on our audits.
We conducted our audits in accordance with the standards of the Public Company Accounting Oversight Board (United States of America).Those standards require that we plan and perform the audit to obtain reasonable assurance about whether the financial statements are free of material misstatement. The company is not required to have, nor were we engaged to perform, an audit of its internal control over financial reporting. Our audits included consideration of internal control over financial reporting as a basis for designing audit procedures that are appropriate in the circumstances, but not for the purpose of expressing an opinion on the effectiveness of the company’s internal control over financial reporting. Accordingly, we express no such opinion. An audit also includes examining, on a test basis, evidence supporting the amounts and disclosures in the financial statements, assessing the accounting principles used and significant estimates made by management, as well as evaluating the overall financial statement presentation. We believe that our audits provide a reasonable basis for our opinion.
In our opinion, the consolidated financial statements referred to above present fairly, in all material respects, the financial position of Oro East Mining, Inc. and its subsidiaries as of December 31, 2014 and 2013 and the results of their operations, and their cash flows for the years then ended in conformity with accounting principles generally accepted in the United States of America.
The accompanying financial statements have been prepared assuming that the Company will continue as a going concern. As discussed in Note 1 to the financial statements, the Company has recurring losses and has not generated revenues from its planned principal operations. These factors raise substantial doubt that the Company will be able to continue as a going concern. Management’s plans regarding those matters also are described in Note 1. The financial statements do not include any adjustments that might result from the outcome of this uncertainty.
/s/ MALONE BAILEY, LLP
www.malonebailey.com
Houston, Texas
March 31, 2015
ORO EAST MINING, INC
CONSOLIDATED BALANCE SHEETS
|
December 31,
|
||||||||
|
2014
|
2013
|
|||||||
|
ASSETS
|
||||||||
|
Current assets:
|
||||||||
|
Cash
|
$
|
64,832
|
$
|
57,972
|
||||
|
Accounts receivable
|
-
|
24,633
|
||||||
|
Inventories
|
18,734
|
19,578
|
||||||
|
Prepaid expenses
|
43,693
|
99,162
|
||||||
|
Other current assets
|
154,720
|
48,926
|
||||||
|
Total current assets
|
281,979
|
250,271
|
||||||
|
Property and equipment, net of accumulated depreciation of $106,669 and $119,349, respectively
|
658,045
|
397,218
|
||||||
|
TOTAL ASSETS
|
$
|
940,024
|
$
|
647,489
|
||||
|
LIABILITIES AND STOCKHOLDERS' DEFICIT
|
||||||||
|
Current liabilities:
|
||||||||
|
Current portion of long-term debt
|
$
|
15,554
|
$
|
11,661
|
||||
|
Current portion of capital lease obligation
|
4,179
|
3,576
|
||||||
|
Accounts payable
|
148,322
|
205,102
|
||||||
|
Short-term notes payable
|
1,150,000
|
200,000
|
||||||
|
Convertible note payable, net of unamortized discount of $81,222 and $77,500, respectively
|
610,778
|
282,500
|
||||||
|
Accrued consulting costs
|
-
|
112,385
|
||||||
|
Other accrued liabilities
|
243,810
|
144,572
|
||||||
|
Advances-related party
|
372,017
|
-
|
||||||
|
Total current liabilities
|
2,544,660
|
959,796
|
||||||
|
Capital lease obligation, less current portion
|
3,171
|
7,350
|
||||||
|
Long-term debt, less current portion
|
16,838
|
32,392
|
||||||
|
TOTAL LIABILITIES
|
2,564,669
|
999,538
|
||||||
|
COMMITMENTS AND CONTINGENCIES
|
-
|
-
|
||||||
|
STOCKHOLDERS' DEFICIT
|
||||||||
|
Preferred stock, $.0001 par value per share, 10,000,000 shares
authorized; no shares issued and outstanding
|
-
|
-
|
||||||
|
Common stock, $.0001 par value per share, 2,000,000,000 shares
authorized; 580,883,200 and 543,365,800 shares issued
and outstanding, respectively
|
58,088
|
54,337
|
||||||
|
Additional paid-in capital
|
6,413,945
|
4,345,176
|
||||||
|
Accumulated deficit
|
(8,011,200
|
)
|
(4,723,329
|
)
|
||||
|
Accumulated other comprehensive loss
|
(24,115
|
)
|
(21,759
|
)
|
||||
|
Total Oro East Mining Inc. stockholders’ deficit
|
(1,563,282
|
)
|
(345,575
|
)
|
||||
|
Noncontrolling interest
|
(61,363
|
)
|
(6,474
|
)
|
||||
|
TOTAL STOCKHOLDERS' DEFICIT
|
(1,624,645
|
)
|
(352,049
|
)
|
||||
|
TOTAL LIABILITIES AND STOCKHOLDERS' DEFICIT
|
$
|
940,024
|
$
|
647,489
|
||||
See accompanying notes to consolidated audited financial statements.
ORO EAST MINING, INC
CONSOLIDATED STATEMENTS OF OPERATIONS AND COMPREHENSIVE LOSS
|
Year ended
|
Year ended
|
|||||||
|
December 31,
|
December 31,
|
|||||||
|
2014
|
2013
|
|||||||
|
Revenues:
|
||||||||
|
Sales of gold concentrates, net
|
$
|
16,918
|
$
|
127,234
|
||||
|
Cost of revenues
|
14,001
|
73,390
|
||||||
|
Gross profit
|
2,917
|
53,844
|
||||||
|
Operating expenses:
|
||||||||
|
General and administrative
|
2,649,459
|
1,192,989
|
||||||
|
Exploration costs
|
-
|
436,097
|
||||||
|
Total operating expenses
|
2,649,459
|
1,629,086
|
||||||
|
Other income (expense):
|
||||||||
|
Interest expense
|
(659,632
|
)
|
(24,836
|
)
|
||||
|
Loss on disposal of assets
|
(36,389
|
)
|
-
|
|||||
|
Foreign currency gain (loss)
|
(197
|
)
|
(646
|
)
|
||||
|
Total other expense
|
(696,218
|
)
|
(25,482
|
)
|
||||
|
Net loss
|
(3,342,760
|
)
|
(1,600,724
|
)
|
||||
|
Net loss attributable to noncontrolling interest
|
(54,889
|
)
|
(11,624
|
)
|
||||
|
Net loss attributable to Oro East Mining Inc.
|
(3,287,871
|
)
|
(1,589,100
|
)
|
||||
|
Other comprehensive loss,
|
||||||||
|
Foreign currency translation adjustment
|
(2,356
|
)
|
(25,558
|
)
|
||||
|
Comprehensive loss
|
$
|
(3,290,227
|
)
|
$
|
(1,614,658
|
)
|
||
|
Net income (loss) attributable to Oro East Mining Inc. common stockholders per share - Basic and diluted
|
$
|
(0.01
|
)
|
$
|
(0.00
|
)
|
||
|
Weighted average number of common shares outstanding
|
569,832,870
|
552,685,160
|
||||||
See accompanying notes to consolidated audited financial statements.
ORO EAST MINING, INC
CONSOLIDATED STATEMENTS OF STOCKHOLDERS’ DEFICIT
| Common Stock |
Additional
Paid-in |
Accumulated |
Accumulated
Other |
Total
Oro East |
Noncontrolling |
Total
Stockholders'
|
|||||||||||||||||||||||||
| Shares | Amount | Capital | Deficit | Income | (Deficit) | Interest | (Deficit) | ||||||||||||||||||||||||
|
Balance at December 31, 2012
|
563,979,800
|
$
|
56,398
|
$
|
2,825,191
|
$
|
(3,134,229
|
)
|
$
|
3,799
|
$
|
(248,841
|
)
|
$
|
-
|
$
|
(248,841
|
)
|
|||||||||||||
|
Shares issued for cash
|
8,546,000
|
855
|
1,283,815
|
-
|
-
|
1,284,670
|
-
|
1,284,670
|
|||||||||||||||||||||||
|
Shares issued for services
|
840,000
|
84
|
-
|
-
|
-
|
84
|
-
|
84
|
|||||||||||||||||||||||
|
Subsidiary shares issued to noncontrolling interest
|
-
|
-
|
94,850
|
-
|
-
|
94,850
|
5,150
|
100,000
|
|||||||||||||||||||||||
|
Stock redemption
|
(30,000,000
|
)
|
(3,000
|
)
|
-
|
-
|
-
|
(3,000
|
)
|
-
|
(3,00
|
)
|
|||||||||||||||||||
|
Convertible note issuance
|
-
|
-
|
90,000
|
-
|
-
|
90,000
|
-
|
90,000
|
|||||||||||||||||||||||
|
Share-based compensation
|
-
|
-
|
51,320
|
-
|
-
|
51,320
|
-
|
51,320
|
|||||||||||||||||||||||
|
Net loss
|
-
|
-
|
-
|
(1,589,100
|
)
|
-
|
(1,589,100
|
)
|
(11,624
|
)
|
(1,600,724
|
)
|
|||||||||||||||||||
|
Other comprehensive loss
|
-
|
-
|
-
|
-
|
(25,558
|
)
|
(25,558
|
)
|
-
|
(25,558
|
)
|
||||||||||||||||||||
|
Balance at December 31, 2013
|
543,365,800
|
$
|
54,337
|
$
|
4,345,176
|
$
|
(4,723,329
|
)
|
$
|
(21,759
|
)
|
$
|
(345,575
|
)
|
$
|
(6,474
|
)
|
$
|
(352,049
|
)
|
|||||||||||
|
Shares issued for services
|
14,957,400
|
1,495
|
1,119,142
|
-
|
-
|
1,120,637
|
-
|
1,120,637
|
|||||||||||||||||||||||
|
Shares issued for settlement of accrued salaries
|
160,000
|
16
|
15,984
|
16,000
|
16,000
|
||||||||||||||||||||||||||
|
Debt conversion
|
22,400,000
|
2,240
|
457,760
|
-
|
-
|
460,000
|
-
|
460,000
|
|||||||||||||||||||||||
|
Convertible notes issuance at discount
|
-
|
-
|
475,883
|
475,883
|
475,883
|
||||||||||||||||||||||||||
|
Net loss
|
-
|
-
|
-
|
(3,287,871
|
)
|
-
|
(3,287,871
|
)
|
(54,889
|
)
|
(3,342,760
|
)
|
|||||||||||||||||||
|
Other comprehensive loss
|
-
|
-
|
-
|
-
|
(2,356
|
)
|
(2,356
|
)
|
-
|
(2,356
|
)
|
||||||||||||||||||||
|
Balance at December 31, 2014
|
580,883,200
|
$
|
58,088
|
$
|
6,413,945
|
$
|
(8,011,200
|
)
|
$
|
(24,115
|
)
|
$
|
(1,563,282
|
)
|
$
|
(61,363
|
)
|
$
|
(1,624,645
|
)
|
|||||||||||
See accompanying notes to consolidated audited financial statements.
ORO EAST MINING, INC
CONSOLIDATED STATEMENTS OF CASH FLOWS
|
Year ended
|
Year ended
|
|||||||
|
December 31,
|
December 31,
|
|||||||
|
2014
|
2013
|
|||||||
|
CASH FLOW FROM OPERATING ACTIVITIES:
|
||||||||
|
Net loss
|
$
|
(3,342,760
|
)
|
$
|
(1,600,724
|
)
|
||
|
Adjustments to reconcile net loss to net cash used in operating activities:
|
||||||||
|
Depreciation
|
124,962
|
48,436
|
||||||
|
Loss on disposal of assets
|
36,389
|
-
|
||||||
|
Share-based compensation
|
1,120,637
|
51,324
|
||||||
|
Amortization of debt discount
|
472,161
|
12,500
|
||||||
|
Changes in operating assets and liabilities:
|
||||||||
|
Accounts receivable
|
24,633
|
(24,633
|
)
|
|||||
|
Inventories
|
844
|
|
(19,578
|
)
|
||||
|
Prepaid expenses and other current assets
|
(50,325
|
) |
(59,808
|
)
|
||||
|
Accounts payable
|
(56,780
|
)
|
184,271
|
|||||
|
Accounts payable- related party
|
-
|
(11,000
|
)
|
|||||
|
Accrued liabilities
|
121,341
|
(323,998
|
)
|
|||||
|
Net cash used in operating activities
|
(1,548,898
|
)
|
(1,743,210
|
)
|
||||
|
CASH FLOW FROM INVESTING ACTIVITIES:
|
||||||||
|
Purchases of property and equipment
|
(540,666
|
)
|
(159,441
|
)
|
||||
|
Net cash used in investing activities
|
(540,666
|
) |
(159,441
|
) | ||||
|
CASH FLOW FROM FINANCING ACTIVITIES:
|
||||||||
|
Proceeds from issuance of common stock
|
-
|
1,281,900
|
||||||
|
Proceeds from shares issuance to noncontrolling interest
|
-
|
100,000
|
||||||
|
Stock redemption
|
-
|
(150
|
)
|
|||||
|
Principal payments under capital lease obligation
|
(3,576
|
)
|
(1,074
|
)
|
||||
|
Proceeds from short-term notes
|
2,150,000
|
250,000
|
||||||
|
Proceeds from convertible notes
|
692,000
|
360,000
|
||||||
|
Repayment of short-term notes
|
(1,100,000
|
)
|
(50,000
|
)
|
||||
|
Repayment of convertible notes
|
-
|
(199,169)
|
||||||
|
Repayment of long-term debt
|
(11,661
|
)
|
(2,747
|
)
|
||||
|
Net proceeds from (repayment of) shareholder advances
|
372,017
|
(127,327
|
)
|
|||||
|
Net cash provided by financing activities
|
2,098,780
|
1,611,433
|
||||||
|
Effect of exchange rate on cash
|
(2,356
|
)
|
(25,558
|
)
|
||||
|
NET INCREASE (DECREASE) IN CASH
|
6,860
|
(316,776
|
)
|
|||||
|
CASH AT BEGINNING OF PERIOD
|
57,972
|
374,748
|
||||||
|
CASH AT END OF PERIOD
|
$
|
64,832
|
$
|
57,972
|
||||
|
SUPPLEMENTAL DISCLOSURE OF CASH FLOW INFORMATION:
|
||||||||
|
Interest paid
|
$
|
83,255
|
$
|
19,626
|
||||
|
NON-CASH INVESTING AND FINANCING ACTIVITIES:
|
||||||||
|
Share issuance for conversion of notes
|
$
|
460,000
|
$
|
-
|
||||
|
Share issuance for conversion of accrued salary
|
$
|
16,000
|
-
|
|||||
|
Convertible note issued at discount
|
$
|
475,883
|
$
|
90,000
|
||||
|
Equipment acquired under capital lease obligation
|
$
|
-
|
$
|
12,000
|
||||
|
Equipment purchased on short-term note and long-term debt
|
$
|
-
|
$
|
46,800
|
||||
See accompanying notes to consolidated audited financial statements.
ORO EAST MINING, INC
NOTES TO CONSOLIDATED FINANCIAL STATEMENTS
NOTE 1 ORGANIZATION AND SUMMARY OF SIGNIFICANT ACCOUNTING POLICIES
(a) Organization and Business
Oro East Mining, Inc. (“we”, “our”, or the “Company”) was incorporated in Delaware on February 15, 2008 for the purpose of raising capital that is intended to be used in connection with its business plan which may include a possible merger, acquisition or other business combination with an operating business.
(b) Emerging Growth Company
We are an “emerging growth company,” as defined in the Jumpstart our Business Startups Act of 2012, and we may take advantage of certain exemptions from various reporting requirements that are applicable to other public companies, including, but not limited to, not being required to comply with the auditor attestation requirements of Section 404 of the Sarbanes-Oxley Act, reduced disclosure obligations regarding executive compensation in our periodic reports and proxy statements, and exemptions from the requirements of holding a nonbinding advisory vote on executive compensation and shareholder approval of any golden
parachute payments not previously approved.
Under the Jumpstart Our Business Startups Act, “emerging growth companies” can delay adopting new or revised accounting standards until such time as those standards apply to private companies. We have elected not to avail ourselves to this exemption from new or revised accounting standards and, therefore, we will be subject to the same new or revised accounting standards as other public companies that are not “emerging growth companies.”
(c) Basis of Consolidation
The consolidated financial statements include the accounts of the Company and its wholly owned subsidiary. All significant intercompany accounts and transactions have been eliminated.
(d) Stock Split
A twenty-for-one forward stock split was effected on June 12, 2014. All share and per share information has been adjusted retroactively to reflect the stock split.
(e) Use of Estimates
The preparation of consolidated financial statements in conformity with accounting principles generally accepted in the United States requires management to make estimates and assumptions that affect the amounts of assets and liabilities and disclosure of contingent assets and liabilities at the date of the balance sheet and reported amounts of revenues and expenses during the reporting period. Actual results could differ from those estimates.
(f) Cash and Cash Equivalents
Cash consists of deposits with banks or other financial institutions. The Company considers all highly liquid investments with original maturity of three months or less to be cash equivalents. There were no cash equivalents as of December 31, 2014 and 2013
(h) Accounts Receivable
Accounts receivable consists of trade receivables from gold concentrate sales. We have not established an allowance for doubtful accounts as payments from all outstanding receivables as of December 31, 2013 have been collected subsequently.
(i) Inventories
Inventories consist of ore stockpiles and chemical reagents carried at cost not to exceed their net realizable value. Cost related to chemical reagents includes applicable taxes and freights.
(j) Property and Equipment
Property and equipment are carried at the cost of acquisition or construction and depreciated over the estimated useful lives of the assets. Costs associated with repair and maintenance are expensed as incurred. Costs associated with improvements which extend the life, increase the capacity or improve the efficiency of our property and equipment are capitalized and depreciated over the remaining life of the related asset. Gains and losses on dispositions of equipment are reflected in operations. Depreciation is provided using the straight-line method over the estimated useful lives of the assets, which are 5 to 7 years.
(k) Revenue Recognition
Revenue from gold concentrate sales is recognized when the title and risk of loss pass to the buyer and when collectability is reasonably assured. The title and risk of loss is passed to the buyer based on the terms of the sales contract entered into with the buyer when the gold concentrates are shipped at the loading port.
Revenue is recorded and buyer is invoiced based on a provisional sales price as determined in accordance with the terms as specified in the sales contract at the time of shipment. Upon final settlement with the buyer (generally one to two months from the shipment date), the provisional sales price is adjusted based on the contract terms. Between shipment and final settlement, changes in gold futures settlement price on the Commodity Exchange Inc. (“COMEX”) result in adjustment to the revenue. The gold concentrate sales contain an embedded derivative that is required to be bifurcated from the host contract, which is the sale of the metal gold contained in the concentrates at the COMEX gold future settlement prices as specified in the contract. The embedded derivative does not qualify for hedge accounting and is adjusted to fair value through earnings each reporting period, using the COMEX gold future settlement prices at period-end, until final settlement.
(l) Exploration Costs
Mineral property exploration costs are expensed as incurred until such time as economic reserves are quantified.
(m) Share-based Compensation
The Company recognizes the services received in a share-based payment transaction as the services are received. The services received are measured at the fair value of the equity instruments issued. See Note 3.
(n) Income Taxes
Income taxes are recognized for under the liability method. Deferred tax assets and liabilities are recognized for the estimated future tax consequences attributable to differences between the financial statement carrying amounts of existing assets and liabilities and their respective tax bases. Deferred tax assets and liabilities are measured using enacted tax rates in effect for the year in which those temporary differences are expected to be recovered or settled. The effect on deferred tax assets and liabilities of a change in tax rate is recognized in income in the period that includes the enactment date. Valuation allowances are established when necessary to reduce deferred tax assets to the amounts more likely than not to be realized.
(o) Foreign Currency Translation
The consolidated financial statements are presented in United States dollars. Foreign denominated monetary assets and liabilities are translated into their United States dollar equivalents using foreign exchange rates which prevailed at the balance sheet date. Revenue and expenses are translated at average rates of exchange prevailing during the year. Gains or losses resulting from foreign currency transactions are included in results of operations, and translation adjustments are recorded to Other Comprehensive Income.
(p) Earnings (Loss) per Common Share
Basic earnings (loss) per share is calculated using the weighted-average number of common shares outstanding during each reporting period. Diluted earnings (loss) per share includes potentially dilutive securities such as outstanding options and warrants, using various methods such as the treasury stock or modified treasury stock method in the determination of dilutive shares outstanding during each reporting period.
(q) Concentrations
Major Customers
During 2014 and 2013, all of the Company’s revenues were from one customer.
Credit Risk
Financial instruments that potentially subject the Company to concentration of credit risk consist primarily of cash and trade receivables. The Company’s cash are held at various recognized financial institutions, and we do not believe significant concentration of credit risk exists. The Company performed credit evaluation of its customer’s financial condition, and the receivables were secured by the letter of credit issued per contract terms. Therefore, we do not believe a significant risk of loss exists from a concentration of credit.
(r) Recent Accounting Pronouncements
We do not expect the adoption of recently issued accounting pronouncements to have a significant impact on the Company’s results of operations, financial position or cash flow.
(s) Going Concern
The accompanying consolidated financial statements have been prepared on a going concern basis, which assumes the Company will realize its assets and discharge its liabilities in the normal course of business. As reflected in the accompanying consolidated financial statements, the Company has an accumulated deficit of $8,011,200 and a negative working capital of $2,262,681 at December 31, 2014. The Company’s ability to continue as a going concern is dependent upon its ability to generate future profit from operations and/or to obtain the necessary financing to meet its obligations and repay its liabilities arising from the normal business operations when they come due. Management’s plan includes obtaining additional funds by equity and debt financing and/or related party advances, but there is no assurance of additional funding being available. These conditions raise substantial doubt about the Company’s ability to continue as a going concern. The accompanying consolidated financial statements do not include any adjustments that might arise as a result of this uncertainty.
NOTE 2 FAIR VALUE MEASUREMENT
Accounting Standards Codification (“ASC”) 820 - Fair Value Measurement establishes a fair value hierarchy that categorizes into three levels the inputs to valuation techniques used to measure fair value. The fair value hierarchy gives the highest priority to quoted prices (unadjusted) in active markets for identical assets or liabilities (Level 1 inputs) and the lowest priority to unobservable inputs (Level 3 inputs).
|
|
Level 1
|
Quoted prices (unadjusted) in active markets for identical assets or liabilities that the reporting entity can access at the measurement date;
|
|
|
Level 2
|
Input other than quoted prices included within Level 1 that are observable for the asset or liability, either directly or indirectly; and
|
|
|
Level 3
|
Unobservable inputs for the asset or liability.
|
The Company’s financial instruments include cash, accounts receivable and payable, short- and long-term debt, and derivative financial instrument. The carrying amounts of cash, accounts payable, short-term loans and long-term debt approximate fair value. The following table sets forth the Company’s financial instruments measured at fair value on a recurring basis:
|
Fair Value at December 31, 2013
|
||||||||||||||||
|
Level 1
|
Level 2
|
Level 3
|
Total
|
|||||||||||||
|
Accounts receivable (1)
|
$
|
24,633
|
$
|
-
|
$
|
-
|
$
|
24,633
|
||||||||
|
(1)
|
As disclosed in Note 1(k), the sales contain an embedded derivative due to the changes in the gold futures settlement price on the COMEX between the shipment date and final settlement, which is bifurcated and accounted for as a derivative.
The embedded derivative included in the accounts receivable is adjusted to fair value through earnings at the end of each reporting period and classified within Level 1 of the fair value hierarchy because it is valued using quoted market prices in active market. We recorded a loss of $1,032 to the gold concentrate sales.
|
There were no financial instruments as of December 31, 2014 subject to the fair value measurement under ASC 820.
NOTE 3 CAPITAL STOCK AND SHARE-BASED COMPENSATION
The Company sold 8,546,000 shares of common stock to other investors for cash of $1,281,900 during 2013. The Company did not issue any shares for cash during 2014.
The Company issued 14,957,400 and 840,000 common shares for services during 2014 and 2013. The Company recognized a total of $1,120,637 and $51,324 share-based payment expenses during 2014 and 2013, respectively. The Company also issued 160,000 common shares to pay for the accrued salaries of $16,000.
The Company issued 22,400,000 common shares for conversion of $460,000 short-term notes during 2014.
As of December 31, 2014, there were 98,292,600 shares available for grant under the 2013 Stock Incentive Plan (the “Plan”). Below is a summary of the status of the Company’s nonvested restricted stock units (“RSUs”) as of December 31, 2014 and 2013 and changes during the years ended December 31, 2014 and 2013:
|
2014
|
||||||||
|
Nonvested RSUs
|
Number of RSUs
|
Weighted-Average Grant
Date Fair Value
|
||||||
|
Nonvested at January 1, 2014
|
1,534,000
|
$
|
0.15
|
|||||
|
Granted
|
1,800,000
|
0.17
|
||||||
|
Vested
|
(153,400
|
)
|
0.16
|
|||||
|
Forfeited
|
(1,080,000
|
)
|
0.08
|
|||||
|
Nonvested at December 31, 2014
|
2,100,600
|
$
|
0.15
|
|||||
|
2013
|
||||||||
|
Nonvested RSUs
|
Number of RSUs
|
Weighted-Average Grant
Date Fair Value
|
||||||
|
Nonvested at January 1, 2013
|
-
|
$
|
||||||
|
Granted
|
1,534,000
|
0.15
|
||||||
|
Vested
|
-
|
|||||||
|
Forfeited
|
-
|
|||||||
|
Nonvested at December 31, 2013
|
1,534,000
|
$
|
0.15
|
|||||
NOTE 4 PROPERTY AND EQUIPMENT
A summary of property and equipment and useful lives is as follows:
|
December 31,
|
Useful life
|
|||||||||
|
2014
|
2013
|
(in years)
|
||||||||
|
Mining and lab equipment
|
$
|
34,557
|
$
|
244,779
|
7
|
|||||
|
Improvements
|
127,033
|
5
|
||||||||
|
Refinery plant machinery
|
585,086
|
182,200
|
5
|
|||||||
|
Trucks and autos
|
1,800
|
81,482
|
5 - 7
|
|||||||
|
Office furniture and equipment
|
16,328
|
8,106
|
5 - 7
|
|||||||
|
Total
|
764,714
|
516,567
|
||||||||
|
Less: accumulated depreciation
|
(106,669
|
)
|
(119,349
|
)
|
||||||
|
$
|
658,045
|
$
|
397,218
|
|||||||
The Company recorded depreciation expense of $124,962 and $48,436 for 2014 and 2013, respectively.
NOTE 5 SHORT-TERM NOTES PAYABLE
A summary of the short-term notes payable is as follows:
|
As of
December 31, 2014
|
As of
December 31, 2013
|
|||||||
|
Fixed-rate 12% note, due September 30, 2014 (1)
|
$
|
-
|
$
|
50,000
|
||||
|
Fixed-rate 12% note, due September 30, 2014 (1)
|
-
|
50,000
|
||||||
|
Fixed-rate 15% note, due May 15, 2014 (2)
|
-
|
50,000
|
||||||
|
Fixed-rate 15% note, due May 31, 2014 (2)
|
-
|
50,000
|
||||||
|
Fixed-rate 15% note, due April 1, 2015
|
50,000
|
-
|
||||||
|
Fixed-rate 12% note, due April 30, 2015
|
100,000
|
-
|
||||||
|
Fixed-rate 12% note, due April 30, 2015
|
100,000
|
-
|
||||||
|
Fixed-rate 15% note, due February 1, 2015 (3)
|
800,000
|
-
|
||||||
|
Fixed-rate 12% note, due June 21, 2015
|
100,000
|
-
|
||||||
|
$
|
1,150,000
|
$
|
200,000
|
|||||
|
(1)
|
The notes were assigned to other unrelated parties and paid off by issuing a total of 20,000,000 common shares on September 18 and 24, 2014.
|
|
(2)
|
The notes were paid off on July 16, 2014.
|
|
(3)
|
The note was extended to August 1, 2015 with the same terms on February 2, 2015.
|
NOTE 6 CONVERTIBLE NOTE PAYABLE
A summary of the convertible notes payable is as below:
|
As of
December 31, 2014
|
As of
December 31, 2013
|
|||||||
|
Fixed-rate 12% convertible note, conversion price @$0.15/share, due June 30, 2014 (1)
|
$
|
-
|
$
|
360,000
|
||||
|
Fixed-rate 12% convertible note, conversion price @$0.20/share, due January 14, 2015 (2)
|
500,000
|
-
|
||||||
|
Fixed-rate 12% convertible note, conversion price @$0.20/share, due February 20, 2015(3)
|
20,000
|
-
|
||||||
|
Fixed-rate 12% convertible note, conversion price @$0.20/share, due February 29, 2015 (3)
|
25,000
|
-
|
||||||
|
Fixed-rate 12% convertible note, conversion price @$0.20/share, due March 16, 2015 (3)
|
30,000
|
-
|
||||||
|
Fixed-rate 12% convertible note, conversion price @$0.06/share, due April 14, 2015
|
20,000
|
-
|
||||||
|
Fixed-rate 12% convertible note, conversion price @$0.06/share, due April 23, 2015
|
40,000
|
-
|
||||||
|
Fixed-rate 12% convertible note, conversion price @$0.03/share, due May 17, 2015
|
30,000
|
-
|
||||||
|
Fixed-rate 12% convertible note, conversion price @$0.05/share, due June 1, 2015
|
17,000
|
-
|
||||||
|
Fixed-rate 12% convertible note, conversion price @$0.05/share, due June 10, 2015
|
10,000
|
-
|
||||||
|
Total
|
692,000
|
360,000
|
||||||
|
Less: unamortized discount
|
(81,222
|
)
|
(77,500
|
)
|
||||
|
$
|
610,778
|
$
|
282,500
|
|||||
|
(1)
|
The note was converted into 2,400,000 common shares upon maturity.
|
|
(2)
|
The note was extended to April 15, 2015 with the conversion price changed to $0.08/share on January 15, 2015
|
|
(3)
|
The notes were paid off on March 16, 2015.
|
NOTE 7 LONG-TERM DEBT
Following is a summary of all long-term debt:
|
December 31, 2014
|
December 31, 2013
|
|||||||
|
Note payable to a financial institution, collateralized by equipment, due in monthly principal and interest payments of $1,918 at 29% imputed interest through October 15, 2016
|
$
|
32,392
|
$
|
44,053
|
||||
|
Less: current maturities
|
(15,554
|
)
|
(11,661
|
)
|
||||
|
$
|
16,838
|
$
|
32,392
|
|||||
Principal payments on long-term debt are due as follows:
|
Year ending December 31:
|
Total
|
|||
|
2015
|
15,554
|
|||
|
2016
|
16,838
|
|||
|
$
|
32,392
|
|||
NOTE 8 INCOME TAXES
During 2014 and 2013, the Company incurred a net operating loss and therefore has no tax liability. As of December 31, 2014, our federal net operating loss carryforwards for income tax purposes were approximately $6.3 million. If not utilized, the federal net operating loss carryforwards will begin to expire in 2028. The effective tax rate was about 34% for 2014 and 2013. The net operating loss carryforwards may be subject to various annual limitations under Section 382 of the Internal Revenue Code.
The net deferred tax asset generated by the operating loss carry-forward has been fully reserved as we believe it is more likely than not that those assets will not be realized.
At December 31, 2014 and 2013, deferred tax asset consisted approximately of $2,000,000 and $1,400,000, respectively, with full valuation allowance for both years.
NOTE 9 COMMITMENTS AND CONTINGENCIES
Capital Leases
The Company classifies the equipment lease, which is for 3 years expiring in 2016, as a capital lease. The following is an analysis of the leased equipment under capital leases by major classes.
|
Classes of Equipment
|
December 31, 2014
|
December 31, 2013
|
||||||
|
Mining equipment
|
$
|
12,000
|
$
|
12,000
|
||||
|
Less: Accumulated depreciation
|
(2,359
|
)
|
(643
|
)
|
||||
|
$
|
9,641
|
$
|
11,357
|
|||||
The following is a schedule by years of future minimum lease payments under capital leases together with the present value of the net minimum lease payments as of December 31, 2013.
|
Year ending December 31:
|
Total
|
|||
|
2015
|
5,040
|
|||
|
2016
|
3,360
|
|||
|
8,400
|
||||
|
Less: Amount representing interest (a)
|
(1,050
|
)
|
||
|
Present value of net minimum lease payment (b)
|
$
|
7,350
|
||
|
(a)
|
Amount necessary to reduce net minimum lease payments to present value calculated at the Company's incremental borrowing rate at lease inception.
|
|
(b)
|
Reflected in the balance sheet as current and noncurrent obligation under capital lease of $3,576 and $7,350, respectively.
|
Tax Penalties
In July and August 2013, the Internal Revenue Service (“IRS”) issued penalties against the Company under Section 6038 and 6038A of the Internal Revenue Code for failure to file Form 5471 and 5472. The total penalty assessment was $60,000 plus interest charges. As of December 31, 2014, total penalty assessment including interest charges was about $60,323. In response, the Company filed a Reasonable Cause Statement to appeal for full abatement of the penalty, citing reasonable cause and requesting an administrative waiver or offer-in-compromise. The final result of the proceeding is still pending as of this filing.
NOTE 10 RELATED PARTY TRANSACTIONS
The shareholder and officer of the Company paid expenses on behalf of the Company during 2014 and 2013. As of December 31, 2014 and 2013, the Company owed shareholder and officer the amount of $372,017 and $0, respectively. The balances are unsecured, non-interest bearing and due on demand.
NOTE 11 SUBSEQUENT EVENTS
On January 15, 2015, the $500,000 convertible note was extended to April 15, 2015 with the conversion price changed to $0.08/share.
On January 21, 2015, the Company issued a $720,000 principal amount of 8% convertible note and due July 21, 2015. The note is unsecured and may be paid in full by the Company at any time prior to its maturity date without penalty. Upon maturity of the note, the holder may convert all the outstanding principal and interest due at $0.09 per share into common stock of the Company.
On February 2, 2015, the $800,000 promissory note was extended to August 1, 2015 with the same terms.
In February 2015, the Company issued a total of 320,500 common shares for employee compensation and consulting services.
On March 16, 2015, the Company paid off matured convertible notes principal and interest totaling $75,000 and $4,812, respectively.
As of the filing date of this annual report, the Company is still performing its due diligence related to the Red Bank LOI, which it entered into with Red Bank Trust on December 12, 2014 for the purchase of certain lode and placer mining claims and all mineral rights thereto, in Mariposa County, California. The Company may at its complete discretion, with or without cause, cancel, null, and/or void the LOI during the Due Diligence Period as set forth in the LOI. Under the LOI, the Company must pay for the purchase of the Red Bank Mine Property with (i) 20,000,000 shares of common stock of the Company, and (ii) delivery of a convertible promissory note to Yan Ming Wu, the named beneficiary of the Red Bank Trust, in the sum of $1,000,000.
ITEM 9. CHANGES IN AND DISAGREEMENTS WITH ACCOUNTANTS ON ACCOUNTING AND FINANCIAL DISCLOSURE.
As of this reporting, there are none.
ITEM 9A(T). CONTROLS AND PROCEDURES.
Evaluation of Disclosure Controls and Procedures
The Company’s Chief Executive Officer and Chief Financial Officer evaluated the effectiveness of the Company’s disclosure controls and procedures pursuant to Rule 13a-15 under the Exchange Act, as of the end of the period covered by this Annual Report on Form 10-K. Disclosure controls and procedures include, without limitation, controls and procedures designed to ensure that information we are required to disclose in reports that we files or submits under the Securities Exchange Act of 1934 is accumulated and communicated to the our management, including its Chief Executive Officer and Chief Financial Officer, as appropriate to allow timely decisions regarding required disclosure. Based on this evaluation, the Chief Executive Officer and Chief Financial Officer have concluded that the Company’s disclosure controls and procedures are not effective as of December 31, 2014 due to a material weakness in internal control over financial reporting described below.
Management’s Annual Report on Internal Control over Financial Reporting
Our management is responsible for establishing and maintaining adequate internal control over financial reporting, as defined in Rule 13a-15(f) of the Exchange Act. Our management conducted an evaluation of the effectiveness of our internal control over financial reporting based on the framework in Internal Control—Integrated Framework issued by the Committee of Sponsoring Organizations of the Treadway Commission. Based on this evaluation, management identified a material weakness in its internal control over financial reporting as described below.
We had limited segregation of duties for recording and reviewing accounting transactions.
This annual report does not include an attestation report of the Company’s registered public accounting firm regarding internal control over financial reporting. Management’s report was not subject to attestation by the Company’s registered public accounting firm pursuant to rules of the Securities and Exchange Commission adopted on September 21, 2010 that permit the Company to provide only management’s report in this annual report.
Limitations on the Effectiveness of Controls
Because of its inherent limitations, internal control over financial reporting may not prevent or detect misstatements. Also, projections of any evaluation of effectiveness to future periods are subject to the risk that controls may become inadequate because of changes in conditions, or that the degree of compliance with the policies or procedures may deteriorate.
Changes in Internal Control over Financial Reporting
Other than the material weakness as identified above, there were no changes in the Company’s internal controls over financial reporting during the fiscal year ended December 31, 2014 that materially affected, or are reasonably likely to materially affect, the Company’s internal control over financial reporting.
Management’s Plans to remediate the Material Weakness
The Company will engage an outside independent certified public accounting firm or certified public accountant with competent experiences in US GAAP and SEC reporting to improve our management review control and financial reporting and to mitigate the control deficiencies due to limited segregation of duties.
ITEM 9B. OTHER INFORMATION
As of this reporting, there are none.
PART III
ITEM 10. DIRECTORS, EXECUTIVE OFFICERS AND CORPORATE GOVERNANCE.
(a) Identification of Directors and Executive Officers. The following table sets forth certain information regarding the Company’s officers and directors:
|
Name
|
Age
|
Positions
|
||
|
Tian Qing Chen
|
52 |
CEO, CFO and Chairman of the Board
|
||
|
Linda Chen
|
60 |
Director
|
Tian Qing Chen Chairman, Chief Executive Officer and Chief Financial Officer
Mr. Chen has served as Chief Executive Officer, Chief Financial Officer and Chairman of the Company since July of 2010. He currently devotes approximately 90% of his working time to the Company. Mr. Chen has been an entrepreneur in finance and real estate investments for over 20 years. Since 2007 until he joined the Company, he has been the COO of Oro East Mining Ltd. Additionally, Mr. Chen is the President and CEO of Mutual Gain Hong Kong Group Limited, a venture capital firm based in Hong Kong since 1990, where he has worked with family conglomerates throughout East Asia to learn the trade in gold, iron, silver, steel and other precious metals. His firm has successfully invested and acquired mines in Singapore, Malaysia, the Republic of Philippines, the People’s Republic of China, and elsewhere across the Asian continent. Mr. Chen was educated in East Asia and received his Bachelor’s degree from Guang Dong University. Mr. Chen’s knowledge about our mining properties led to our conclusion that Mr. Chen should be serving as a member of our Board of Directors.
Linda Chen Director
Ms. Chen received her Master degree from Washington State University and has over 28 years of experience in international trade and has launched several trading companies. She has worked with major family conglomerates throughout East Asia while gaining experience and knowledge on trade in gold, iron, silver, steel and other precious metals. Ms. Chen has successfully achieved additional skill and knowledge of the mining industry from deals in Malaysia, the Republic of Philippines, and the People’s Republic of China. Starting in 2006, she worked about 5 years as a consultant for Skynix Holdings Inc. She is currently the Vice President and Director of a mid-size global equity and investment firm. Additionally, she has been and currently is a director at Oro East Mining Inc. Ms. Chen’s general knowledge about mining led to our conclusion that Mr. Chen should be serving as a member of our Board of Directors.
(b) Significant Employees.
At present, there are three employees with the Company, two under written employment agreements. The subsidiary Oro East Mariposa, LLC has two employees. Except for the 2013 Stock Incentive Plan (“Plan”) adopted by the Company in May 2013 authorizing 100,000,000 shares to be issued under the Plan, we presently do not have any pension, health, annuity, insurance, profit sharing or similar benefit plans. During 2014, we granted a total of 1,800,000 Restricted Stock Units (“RSUs”) under the Plan to the Company’s Chief Executive Officer.
(c) Involvement in Certain Legal Proceedings.
There have been no events under any bankruptcy act, no criminal proceedings and no judgments, injunctions, orders or decrees material to the evaluation of the ability and integrity of any director, executive officer, promoter or control person of Registrant during the past five years.
There are no pending legal proceedings to which the Company is a party or in which any director, officer or affiliate of the Company, any owner of record or beneficially of more than 5% of any class of voting securities of the Company, or security holder is a party adverse to the Company or has a material interest adverse to the Company. The Company’s mineral claim is not the subject of any pending legal proceedings.
Audit Committee and Audit Committee Financial Expert
No audit committee has been formed as of the filing date of this Annual Report.
Section 16(a) Beneficial Ownership Reporting Compliance.
Section 16(a) of the Securities Act of 1934 requires the Company's officers and directors, and greater than 10% stockholders, to file reports of ownership and changes in ownership of its securities with the Securities and Exchange Commission. Copies of the reports are required by SEC regulation to be furnished to the Company. Based on management's review of these reports during the fiscal year ended December 31, 2014, all reports required to be filed were filed on a timely basis.
Code of Ethics
Our board of directors has adopted a code of ethics that our officers, directors and any person who may perform similar functions is subject to. The Code of Ethics does not indicate the consequences of a breach of the code. If there is a breach, the board of directors would review the facts and circumstances surrounding the breach and take action that it deems appropriate, which action may include dismissal of the employee who breached the code.
ITEM 11. EXECUTIVE COMPENSATION.
Summary Compensation Table
The table below summarizes all compensation awarded to, earned by, or paid to our officers for all services rendered in all capacities to us for the fiscal periods indicated:
|
Name and Principal Position
|
Year
|
Salary ($)
|
Bonus ($)
|
Stock Awards ($)
|
Option Awards ($)
|
Non-Equity Incentive Plan Compensation($)
|
Nonqualified Deferred Compensation ($)
|
All Other Compensation ($)
|
Total ($)
|
|||||||||||||||||||||||||
|
Tian Qing Chen (1)
|
2014
|
95,000
|
0
|
342,000 (2)
|
0
|
0
|
0
|
0
|
437,000
|
|||||||||||||||||||||||||
|
2013
|
79,167
|
0
|
0
|
0
|
0
|
0
|
0
|
79,167
|
||||||||||||||||||||||||||
|
(1) Chairman, Chief Executive Officer and Chief Financial Officer.
|
||||||||||||||||||||||||||||||||||
|
(2) 1,800,000 Restricted Stock Units (“RSU”) were granted on April 7, 2014 pursuant to a 5-year vesting schedule based on the year of employment. The grant date fair value of $180,000 was computed based on $0.19 per share, which is the closest trading price of the Company’s common stock to the grant date when there were limited trading activities on the OTCBB. No RSUs were vested as of December 31, 2014. See Note 3 to the consolidated financial statements.
|
||||||||||||||||||||||||||||||||||
Employment Agreements
We maintain written employment agreements with each of our named executive officers. Their employments are at-will, and each named executive officer receives his base salary and a predetermined amount of RSUs pursuant to a 5-year vesting schedule based on the year of employment. The annual base salary amounts were $95,000 for Tian Qing Chen.
Outstanding Equity Awards at December 31, 2014
The following table summarizes the outstanding equity awards of our named executive officers’ at the fiscal year ended December 31, 2014:
|
Option awards
|
Stock awards
|
|||||||||||||||||||||||||||||||||||
|
Number of Securities underlying unexercised options
(#)
exercisable
|
Number of securities underlying unexercised options
(#)
unexercisable
|
Equity incentive plan awards:
Number of securities underlying unexercised unearned options
(#)
|
Option exercise price
($)
|
Option expiration date
|
Number of shares or units of stock that have not vested
(#)
|
Market value of shares or units of stock that have not vested
($)
|
Equity incentive plan awards:
Number of unearned shares, units or other rights that have not vested
(#)
|
Equity incentive plan awards:
Market or payout value of unearned shares, units or other rights that have not vested
($)
|
||||||||||||||||||||||||||||
|
Tian Qing Chen
|
-
|
-
|
-
|
-
|
-
|
-
|
-
|
1,800,0001
|
180,0001
|
|||||||||||||||||||||||||||
1 As of December 31, 2014, 1,800,000 RSUs granted in 2014 were all unvested, and the market value was computed based on $0.10 per share of the Company’s common stock last traded on December 31, 2014.
Director Compensation
The following table sets forth director compensation as of December 31, 2013:
|
Name
|
Fees Earned Paid in Cash ($)
|
Stock Awards ($)
|
Option Awards ($)
|
Non-Equity Incentive Plan Compensation($)
|
Nonqualified Deferred Compensation ($)
|
All Other Compensation ($)
|
Total ($)
|
|||||||||||||||||||||
|
Tian Qing Chen
|
0
|
0
|
0
|
0
|
0
|
0
|
0
|
|||||||||||||||||||||
|
Linda Chen
|
0
|
0
|
0
|
0
|
0
|
0
|
0
|
|||||||||||||||||||||
ITEM 12. SECURITY OWNERSHIP OF CERTAIN BENEFICIAL OWNERS AND MANAGEMENT AND RELATED STOCKHOLDER MATTERS.
The following table lists, as of December 31, 2014, the number of shares of common stock of the Company that are beneficially owned by (i) each person or entity known to the Company to be the beneficial owner of more than 5% of the outstanding common stock; (ii) each officer and director of the Company; and (iii) all officers and directors as a group. Information relating to beneficial ownership of common stock by our principal shareholders and management is based upon information furnished by each person using “beneficial ownership” concepts under the rules of the Securities and Exchange Commission. Under these rules, a person is deemed to be a beneficial owner of a security if that person has or shares voting power, which includes the power to vote or direct the voting of the security, or investment power, which includes the power to vote or direct the voting of the security. The person is also deemed to be a beneficial owner of any security of which that person has a right to acquire beneficial ownership within 60 days. Under the Securities and Exchange Commission rules, more than one person may be deemed to be a beneficial owner of the same securities, and a person may be deemed to be a beneficial owner of securities as to which he or she may not have any pecuniary beneficial interest. Except as noted below, each person has sole voting and investment power.
The percentages below are calculated based on 581,203,700 shares of our common stock issued and outstanding as of the date of this annual report. We do not have any outstanding warrant, options or other securities exercisable for or convertible into shares of our common stock.
|
Name of Shares Owned
|
Percent of Class
|
|||||||||
|
Title of Class
|
Name and Address of Beneficial Owner
|
Beneficially
|
Owned
|
|||||||
|
Common Stock
|
Tian Qing Chen, Chief Executive Officer, and Director (1)
|
471,566,000
|
81.14
|
%
|
||||||
|
Common Stock
|
Accelerated Venture Partners, LLC
|
30,000,000
|
5.20
|
%
|
||||||
|
Common Stock
|
Linda Chen, Director (1)
|
1,800
|
*
|
|||||||
|
Common Stock
|
All executive officers and directors as a group
|
471,567,800
|
81.20
|
%
|
||||||
|
(1) c/o Oro East Mining, Inc., 7817 Oakport Street, Suite 205, Oakland, CA 94621
|
||||||||||
|
* Less than 1%
|
||||||||||
Equity Compensation Plan Information
The 2013 Stock Incentive Plan provides for the grant of Options, Restricted Stock, Restricted Stock Units, Stock Appreciation Rights, Performance Awards, Other Stock-Based Awards and Dividend Equivalents, or any combination of the foregoing, up to 100,000,000 shares of the Company’s common stock as is best suited to the circumstances of the particular Employee, Consultant or Director as determined by the Board of Directors in its sole discretion.
|
Number of Securities To be Issued Upon Exercise of Outstanding Options, Warrants and Rights
(a)
|
Weighted-Average Exercise Price of Outstanding Options, Warrants and Rights
(b)
|
Number of Securities Remaining Available for Future Issuance Under Equity Compensation Plans (Excluding Securities Reflected in Column (a))
(c)
|
||||||||||
|
Equity compensation plans approved by security holders
|
-
|
-
|
-
|
|||||||||
|
Equity compensation plans not approved by security holders
|
2,100,600
|
1
|
-
|
98,292,600
|
2
|
|||||||
|
Total
|
2,100,600
|
-
|
98,292,600
|
|||||||||
1 Represents unvested restricted stock units outstanding as of December 31, 2014 under the Plan. See Note 3 to the consolidated financial statements.
2 As of December 31, 2014, 98,292,600 shares remaining available for future issuance under the Plan. 887,400 shares were issued for employee compensation and consulting services during 2014. See Note 3 to the consolidated financial statements.
ITEM 13. RELATIONSHIPS AND RELATED TRANSACTIONS AND DIRECTOR INDEPENDENCE.
Certain Relationships and Related Transactions
There are family relationships between one of our officers and directors. Each director is elected at our annual meeting of stockholders and holds office until the next annual meeting of stockholders, or until his successor is elected and qualified.
The shareholder and officer of the Company paid expenses on behalf of the Company during 2014 and 2013. As of December 31, 2014 and 2013, the Company owed shareholder and officer the amount of $372,017 and $0, respectively. The balances are unsecured, non-interest bearing and due on demand.
Director Independence
Our board of directors is currently composed of two members, and both do not qualify as an independent director under the Sarbanes-Oxley Act of 2002 and section 10A(m)(3) of the Exchange Act.
Conflicts of Interest
Since we do not have an audit or compensation committee comprised of independent directors, the functions that would have been performed by such committees are performed by our director. The Board of Directors has not established an audit committee and does not have an audit committee financial expert, nor has the Board established a nominating committee. The Board is of the opinion that such committees are not necessary since the Company is an early exploration stage company and has only two directors, and to date, such director has been performing the functions of such committees. Thus, there is a potential conflict of interest in that our director and officer has the authority to determine issues concerning management compensation, nominations, and audit issues that may affect management decisions.
Other than as described above, we are not aware of any other conflicts of interest of our executive officer and director.
ITEM 14. PRINCIPAL ACCOUNTANT FEES AND SERVICES.
Audit Fees
For 2014 and 2013, we were charged approximately $30,000 and $18,300 for professional services rendered for the audit and review of our consolidated financial statements.
Audit-Related Fees
-$0-
Tax Fees
-$0-
All Other Fees
-$0-
The Board Of Directors Pre-Approval Policies
We do not have a separate audit committee. Our board of directors performs the functions of an audit committee. Before an independent auditor is engaged by us to render audit or non-audit services, our board of directors pre-approves the engagement. Board of directors pre-approval of audit and non-audit services will not be required if the engagement for the services is entered into pursuant to pre-approval policies and procedures established by our board of directors regarding our engagement of the independent auditor, provided the policies and procedures are detailed as to the particular service, our board of directors is informed of each service provided, and such policies and procedures do not include delegation of our board of directors' responsibilities under the Exchange Act to our management. Our board of directors may delegate to one or more designated members of our board of directors the authority to grant pre-approvals, provided such approvals are presented to the board of directors at a subsequent meeting. If our board of directors elects to establish pre-approval policies and procedures regarding non-audit services, the board of directors must be informed of each non-audit service provided by the independent auditor. Board of directors pre-approval of non-audit services, other than review and attest services, also will not be required if such services fall within available exceptions established by the SEC. For the year ended December 31, 2014, 100% of audit-related services performed by our independent auditors were pre-approved by our board of directors.
Our board has considered whether the services described above under the caption "All Other Fees", which are currently none, is compatible with maintaining the auditor's independence.
The board approved all fees described above.
PART IV
ITEM 15. EXHIBITS, FINANCIAL STATEMENT SCHEDULES.
The following documents are filed as part of this 10-K:
1. The following exhibits are filed as part of this report:
|
Exhibit
|
Description
|
|
|
3.1.1
|
Articles of Incorporation of Accelerated Acquisitions I, Inc.(1)
|
|
|
3.1.2
|
Certificate of Amendment to Articles of Incorporation (5)
|
|
|
3.1.3
|
Certificate of Amendment to Articles of Incorporation (6)
|
|
|
3.2
|
Bylaws of the Registrant (3)
|
|
|
4.1
|
Specimen Stock Certificate (4)
|
|
|
10.1
|
Assignment Agreement between Accelerated Acquisitions I, Inc. and Oro-East Mining Company Ltd. (2)
|
|
|
10.2
|
2013 Stock Incentive Plan adopted on May 8, 2013 (7)
|
|
|
10.3
|
Employment Agreement with the Chief Executive Officer, dated April 7, 2014 (8)
|
|
|
10.4
|
Stock Redemption Agreement, dated May 13, 2013, between Oro East Mining, Inc. and Accelerated Venture Partners, LLC (9)
|
|
|
10.5
|
Mining Lease and Royalties Agreement, dated June 24, 2013, between Oro East Mariposa, LLC and Red Bank Trust (10)
|
|
|
10.6
|
Asset Purchase and Option Agreement, dated December 24, 2013, between Oro East Mariposa, LLC and Sutton Enterprises (11)
|
|
|
10.7
|
Sale and Purchase Agreement, dated January 31, 2014, between Oro East Mining, Inc. and Royal Asset Management (12)
|
|
|
10.8
|
Addendum to the Sale and Purchase Agreement between Oro East Mining, Inc. and Royal Asset Management (13)
|
|
|
10.9
|
Consulting Agreement, dated July 3, 2014, between Oro East Mining, Inc. and Hobson Consultants Limited (14)
|
|
|
10.10
|
Consulting Agreement, dated July 3, 2014, between Oro East Mining, Inc. and Smarteam Asia Limited (15)
|
|
|
10.11
|
Convertible Note Purchase Agreement for $500,000 dated July 14, 2014 (16)
|
|
|
10.12
|
Promise Note Agreement for $800,000 dated August 1, 2014 (17)
|
|
|
10.13
|
Binding Letter of Intent, dated December 12, 2014, between Oro East Mining, Inc. and Redbank Trust (18)
|
|
|
31.1
|
||
|
31.2
|
||
|
32.1
|
||
|
101.INS
|
XBRL Instance Document *
|
|
|
101.SCH
|
XBRL Taxonomy Extension Schema Document. *
|
|
|
101.CAL
|
XBRL Taxonomy Extension Calculation Linkbase Document *
|
|
|
101.DEF
|
XBRL Taxonomy Extension Definition Linkbase Document *
|
|
|
101.LAB
|
XBRL Taxonomy Extension Labels Linkbase Document *
|
|
|
101.PRE
|
XBRL Taxonomy Extension Presentation Linkbase Document *
|
|
(1)
|
Incorporated by reference to Exhibit 3.1 to the Registrant’s Form 10-12G (File No. 000-53136) filed with the Commission on March 19, 2008
|
|
(2)
|
Incorporated by reference to Exhibit 10.1 to the Registrant’s Amendment No. 1 to Form S-1 (File No. 333-177509) filed with the Commission on January 30, 2012.
|
|
(3)
|
Incorporated by reference to Exhibit 3.2 to the Registrant’s Form 10-12G (File No. 000-53136) filed with the Commission on March 19, 2008.
|
|
(4)
|
Incorporated by reference to Exhibit 4.1 to the Registrant’s Amendment No. 1 to Form S-1 (File No. 333-177509) filed with the Commission on January 30, 2012.
|
|
(5)
|
Incorporated by reference to Exhibit 3.1.2 to the Registrant’s Amendment No. 1 to Form S-1 (File No. 333-177509) filed with the Commission on January 30, 2012.
|
|
(6)
|
Incorporated by reference to Exhibit 3.1 to the Registrant’s Form 8-K (File No. 000-53136) filed with the Commission on June 17, 2014
|
|
(7)
|
Incorporated by reference to Exhibit 4.1 to the Registrant’s Form 10-Q (File No. 000-53136) filed with the Commission on May 10, 2013.
|
|
(8)
|
Incorporated by reference to Exhibit 10.5 to the Registrant’s Form 10-K (File No. 000-53136) filed with the Commission on April 9, 2014.
|
|
(9)
|
Incorporated by reference to Exhibit 10.1 to the Registrant’s Form 8-K (File No. 000-53136) filed with the Commission on May 17, 2013.
|
|
(10)
|
Incorporated by reference to Exhibit 10.1 to the Registrant’s Form 8-K (File No. 000-53136) filed with the Commission on June 27, 2013.
|
|
(11)
|
Incorporated by reference to Exhibit 10.1 to the Registrant’s Form 8-K (File No. 000-53136) filed with the Commission on January 2, 2014.
|
|
(12)
|
Incorporated by reference to Exhibit 10.1 to the Registrant’s Form 8-K (File No. 000-53136) filed with the Commission on February 5, 2014.
|
|
(13)
|
Incorporated by reference to Exhibit 10.1 to the Registrant’s Form 8-K (File No. 000-53136) filed with the Commission on May 6, 2014.
|
|
(14)
|
Incorporated by reference to Exhibit 1.1 to the Registrant’s Form 8-K (File No. 000-53136) filed with the Commission on July 10, 2014.
|
|
(15)
|
Incorporated by reference to Exhibit 1.2 to the Registrant’s Form 8-K (File No. 000-53136) filed with the Commission on July 10, 2014.
|
|
(16)
|
Incorporated by reference to Exhibit 10.1 to the Registrant’s Form 8-K (File No. 000-53136) filed with the Commission on July 18, 2014.
|
|
(17)
|
Incorporated by reference to Exhibit 10.1 to the Registrant’s Form 8-K (File No. 000-53136) filed with the Commission on August 6, 2014.
|
|
(18)
|
Incorporated by reference to Exhibit 10.1 to the Registrant’s Form 8-K (File No. 000-53136) filed with the Commission on December 16, 2014.
|
|
*
|
Filed herewith.
|
2. FINANCIAL STATEMENTS
The following documents are filed in Part II, Item 8 of this annual report on Form 10-K:
|
·
|
Report of MaloneBailey, LLP Independent Registered Certified Public Accounting Firm
|
|
·
|
Consolidated Balance Sheets as of December 31, 2014 and 2013
|
|
·
|
Consolidated Statements of Operations and Comprehensive Loss for the years ended December 31, 2014 and 2013
|
|
·
|
Consolidated Statements of Stockholders’ Deficit for the years ended December 31, 2004 and 2013
|
|
·
|
Consolidated Statement of Cash Flows for the years ended December 31, 2014 and 2013
|
|
·
|
Notes to Consolidated Financial Statements
|
3. FINANCIAL STATEMENT SCHEDULES
All financial statement schedules have been omitted as they are not required, not applicable, or the required information is otherwise included.
Pursuant to the requirements of Section 13 or 15(d) of the Exchange Act of 1934, the registrant has duly caused this report to be signed on its behalf by the undersigned, thereunto duly authorized.
|
Oro East Mining, Inc.
|
||
|
(Registrant)
|
||
|
Date: March 31, 2015
|
By
|
|
|
/s/ Tian Qing Chen
|
||
|
Tian Qing Chen
Chairman and Chief Executive Officer
|
||
|
(Principal Executive Officer)
|
Pursuant to the requirements of the Securities Exchange Act of 1934, this report has been signed below by the following person on behalf of the registrant and in the capacity and on the date indicated.
|
Date: March 31, 2015
|
By
|
|
|
/s/ Tian Qing Chen
|
||
|
Tian Qing Chen
|
||
|
Chief Executive Officer and Director
(Principal Executive Officer and
Principal Financial and Accounting Officer)
|
|
Date: March 31, 2015
|
By
|
|
|
/s/ Linda Chen
|
||
|
Linda Chen
|
||
|
Director
|
||
47