Attached files
| file | filename |
|---|---|
| EX-21 - EXHIBIT 21 - Deyu Agriculture Corp. | v404346_ex21.htm |
| EX-32.1 - EXHIBIT 32.1 - Deyu Agriculture Corp. | v404346_ex32-1.htm |
| EX-31.2 - EXHIBIT 31.2 - Deyu Agriculture Corp. | v404346_ex31-2.htm |
| EX-32.2 - EXHIBIT 32.2 - Deyu Agriculture Corp. | v404346_ex32-2.htm |
| EXCEL - IDEA: XBRL DOCUMENT - Deyu Agriculture Corp. | Financial_Report.xls |
| EX-31.1 - EXHIBIT 31.1 - Deyu Agriculture Corp. | v404346_ex31-1.htm |
UNITED STATES
SECURITIES AND EXCHANGE COMMISSION
Washington, D.C. 20549
Form 10-K
| x | ANNUAL REPORT PURSUANT TO SECTION 13 OR 15(d) OF THE SECURITIES EXCHANGE ACT OF 1934: For the Fiscal Year Ended December 31, 2014 |
| ¨ | TRANSITION REPORT PURSUANT TO SECTION 13 OR 15(d) OF THE SECURITIES EXCHANGE ACT OF 1934 |
Commission File Number 333-160476
| DEYU AGRICULTURE CORP. |
| (Exact name of registrant as specified in its charter) |
| Nevada | 80-0329825 | |
| (State or other jurisdiction of | (I.R.S. Employer | |
| incorporation or organization) | Identification No.) |
Headquarters in China
Unit 1010, Block B, Huizhi Building,
No. 9 Xueqing Road,
Haidian District, Beijing, PRC
Zip Code: 10085
(Address, including zip code, of principal executive offices)
In China: 86-10-8273-2870
(Registrants’ telephone number, including area code)
| Securities Registered Under Section 12(b) of the Exchange Act: | None |
| Name of exchange on which registered: | None |
| Securities registered pursuant to Section 12(g) of the Act: | Common Stock, par value $0.001 per share |
Indicate by check mark if the registrant is a well-known seasoned issuer, as defined in Rule 405 of the Securities Act. Yes ¨ No x
Indicate by check mark if the registrant is not required to file reports pursuant to Section 13 or Section 15(d) of the Exchange Act. Yes ¨ No x
Indicate by check mark whether the registrant (1) has filed all reports required to be filed by Section 13 or 15(d) of the Securities Exchange Act of 1934 during the preceding 12 months and (2) has been subject to such filing requirements for the past 90 days. Yes x No ¨
Indicate by check mark whether the registrant has submitted electronically and posted on its corporate Web site, if any, every Interactive Data File required to be submitted and posted pursuant to Rule 405 of Regulation S-T during the preceding 12 months (or such shorter period that the registrant was required to submit and post such files). Yes x No ¨
Indicate by check mark if disclosure of delinquent filers pursuant to Item 405 of Regulation S-K is not contained herein, and will not be contained, to the best of registrant’s knowledge, in definitive proxy or information statements incorporated by reference in Part III of this Form 10-K or any amendment to this Form 10-K. ¨
Indicate by check mark whether the registrant is a large accelerated filer, an accelerated filer, a non-accelerated filer, or a smaller reporting company. See the definitions of “large accelerated filer,” “accelerated filer” and “smaller reporting company” in Rule 12b-2 of the Exchange Act.
| Large accelerated filer ¨ | Accelerated filer ¨ | Non-accelerated filer ¨ |
| Smaller Reporting Company x |
Indicate by check mark whether the registrant is a shell company (as defined in Rule 12b-2 of the Exchange Act). Yes ¨ No x
As of the end of the issuer’s most recently completed second fiscal quarter, the issuer’s public float was approximately $1,071,828. As of the end of the issuer’s fiscal year ended December 31, 2014, its net revenue was $109,677,220. The number of outstanding shares of the registrant’s Common Stock on March 23, 2015 was 11,044,328.
Documents Incorporated By Reference:
NONE
DEYU AGRICULTURE CORP.
FORM 10-K
INDEX
| - 2 - |
DEYU AGRICULTURE CORP.
Overview
In this Annual Report on Form 10-K, unless otherwise indicated, the words “we”, “us” and “our” refer to Deyu Agriculture Corp., a Nevada corporation and all entities owned or controlled by Deyu Agriculture Corp. All references to “Deyu” or the “Company” in this Annual Report mean Deyu Agriculture Corp., and all entities owned or controlled by Deyu Agriculture Corp., except where it is made clear that the term only means the parent or a subsidiary company. References in this Annual Report to the “PRC” or “China” are to the People’s Republic of China and references to “SEC” are to the U.S. Securities and Exchange Commission.
We are a vertically integrated producer, processor, marketer and distributor of organic and other agricultural products made from corn and grains operating in Shanxi Province in the People's Republic of China. We have a sales network covering manufacturers, grain traders, wholesalers, distributors and retail stores throughout China. Our facilities include modern warehouses with storage capacity of over 100,000 tons and sophisticated production lines with annual production capacity of over 108,000 and 700,000 tons for grain products and corn, respectively.
Our business operations are mainly conducted through our wholly owned PRC subsidiaries, JinzhongDeyu Agriculture Trading Co. Limited (“JinzhongDeyu”), JinzhongYuliang Agriculture Trading Co. Limited (“Yuliang”), Shanxi Taizihu Food Co. Ltd. (“Taizihu”) and Shanxi Huichun Bean Products Co., Ltd (“Huichun”). Yuliang focus on processing and distributing our corn and corn byproducts. Our grain processing, distribution and bulk trading business are mainly conducted through JinzhongDeyu, Taizihu and Huichun.
A brief description of our products is set forth below, by division:
| · | Corn Division –acquires unprocessed corn for value-added processing such as cleaning, drying packaging, etc. The main customers for this division range from livestock feed companies to corn oil/corn starch manufacturing companies as well as governmental procurement agencies in China. |
| · | Grain Division –acquires unprocessed grains including millet, green bean, soy bean, black rice and many other varieties of grains traditionally grown and consumed in China for value-added processing such as peeling, cleaning, grinding, packaging, etc. The Grain Division also produces and distributes deep processed food products, such as bean based products, fruit vinegars and juices, noodles and other grain products. We sell our processed grain products to wholesalers, distributors, institutional clients, etc. |
| · | Bulk Trading Division –conducts bulk trading through procuring and wholesales of rice, flour, wheat, kidney beans, green beans and other agricultural products. The majority of the customers of this division include food manufacturers, grain trading companies, wholesalers and governmental procurement agencies in China. |
Operating revenue from continuing operations for the year ended December 31, 2014 was $109,667,220, representing a 55.5% decrease from $246,350,104 for the year ended December 31, 2013. Our net loss available to common stockholders for the year ended December 31, 2014 was $17,356,472, representing a 35.3% decrease from our net income of $26,818,546 for the year ended December 31, 2013.
Our principal office is located at Unit 1010, Block B, Huizhi Building, No. 9 Xueqing Road, Haidan District, Beijing, PRC 100085. Our telephone number in China is +(8610)-8273-2870 and our fax number is +(8610)- 8273 2870 x 8518. Our corporate website is www.deyuagri.com (information on our website is not made a part of this Annual Report).
| - 3 - |
Corporate History
2010 Share Exchange and Preferred Stock Financings
On April 27, 2010, Deyu (then known as Eco Building International, Inc.) completed the acquisition of City Zone Holdings Limited, an emerging organic and non-organic agricultural products distributor in Shanxi Province, China, engaged in procuring, processing, marketing and distributing various grain and corn products (“City Zone”), by means of a share exchange (the “Exchange”). As a result of the Exchange, City Zone became a wholly owned subsidiary of Deyu.
Simultaneously with the acquisition, we completed a private placement offering in the aggregate amount of $8,211,166 of the sale of securities to accredited investors at $4.40 per unit, with each “Unit” consisting of one share of our Series A convertible preferred stock and one warrant to purchase 0.4 shares of our common stock with an exercise price of $5.06 per share.
On May 10, 2010, we closed on the second and final round of the private placement offering as disclosed in our Current Report on Form 8-K filed with the SEC on May 3, 2010 through the sale of 589,689 Units comprised of 589,689 shares of our Series A convertible preferred stock and 235,882 five-year warrants with an exercise price of $5.06 per share, to certain accredited investors for total aggregate proceeds of $2,594,607. We raised an aggregate amount of $10,805,750 in the two rounds of offerings.
Pursuant to the private placement we issued an aggregate 2,455,863 shares of Series A convertible preferred stock and warrants exercisable into 982,362 shares of common stock to certain investors (collectively, the “Investors”). Pursuant to its terms, the Series A convertible preferred stock receive cumulative dividends at a rate of 5% per annum and can be converted into common stock on a 1:1 basis, subject to applicable adjustments. Pursuant to its terms, the warrants can be converted into 982,362 shares of common stock at an exercise price of $5.06 per share (the "Warrants"). The Warrants will expire on April 27, 2015.
In connection with the private placement, we also entered into a registration rights agreement pursuant to which we agreed to file a registration statement on Form S-1 (or other applicable Form) within 60 days of the close of such financing. We filed a Registration Statement on Form S-1 with the SEC on June 15, 2010, and on October 21, 2010, the SEC declared the Form S-1 effective.
Additionally, as a result of the Exchange, we changed our fiscal year end to December 31.
On May 19, 2010, we changed our name from “Eco Building International, Inc.” to “Deyu Agriculture Corp.” FINRA declared the name change effective on June 2, 2010.
Recent Developments
As a result of changes in the economic environment and market conditions, as well as the negative impacts from some unexpected extreme weather conditions, our business has faced great challenges in 2014.
| - 4 - |
Corn is mainly used as raw material for livestock feeds and deep processed products such as corn starch and ethanol. The corn market experienced a downturn as result of weak demand from the downstream industries with consecutive increase of output in the past few years in China. The on-going downturn continued to impact our business in 2014, for the demand of corn continued to be weak. In order to stabilize the market, the Chinese government started to implement some measures in the second quarter 2014, including government procurement and providing subsidies to downstream manufacturers. The market showed some fluctuation and the average sales prices in the second half of the year had a slight increase. The Company increased the corn sales volume slightly according to the market situation although the Company is still undertaking a conservative strategy.
The weather during the past winter in Shanxi Province in China was abnormally warm compared to winters of previous years and has caused serious damage to our inventories. This badly affected our operations. The Company incurred a substantial gross loss of $5.9 million from the disposal of the damaged corn inventory which mildewed in the first quarter of 2014. The Company has taken effective measures to prevent further mildewing, such as isolating the damaged inventories, continuous and constant drying of the stock by machines and improving air ventilation in the warehouses. The Company prevented further damage after imposing stricter control measures.
For the business of our Grain Division, we slow downed our retail grain package business due to the deteriorating efficiency of existing retail. During 2014 we developed our direct export business by selling grain products directly to other countries including, without limitation, the U.S., Australia, Canada, Israel, Denmark.
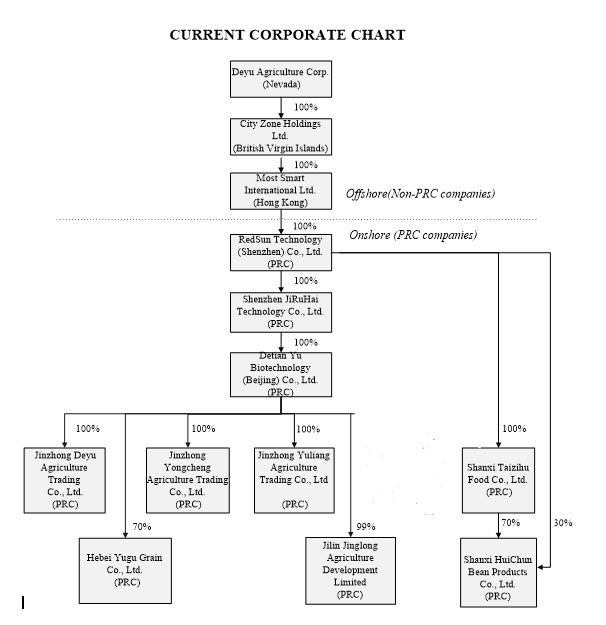
Corporate Structure
The Company’s current corporate structure is set forth below:
| - 5 - |
Competitive Advantages
Cultivation Base
Our corn and grains are mainly grown in the hilly area near Taihang Mountain, at an altitude of between 5,000 to 8,000 feet above sea level. This region has a wide temperature variation between night and day and a long daily exposure to sunlight. These geographic characteristics produce grains that are rich in nutrients, especially minerals, rutin, cellulose, amino acids, chlorophyll, lecithin and linoleic acid.
Partnership with Farmers
With the support of our local government, we have adopted the operation mode of “Company + Farmers + Cultivation Base”. We have established stable partnerships with over 60,000 farmers to grow crops on the farmland. We provide instruction to the farmers for planting crops and technical support for seeding and cultivation. The scale cultivation ensures our stable supply of raw material with high quality.
Advanced Production Lines
We have a modern processing center for corn with five drying cylinders and six warehouses, the construction of which was completed in 2011. Our total capacity of storage and annual turnover of corn has exceeded 100,000 tons and 700,000 tons, respectively. We are also equipped with fully automatic and advanced production lines for grain processing with a total production capacity of over 108,000 tons. The advanced production lines and production technologies help produce grain products with high quality by maintaining the nutritional components of the products.
Warehousing and Logistics
We operate six self-owned warehouses and some rental warehouses with total storage capacity of over 100,000 tons of food products and an annual turnover of 700,000 tons. This capacity helps us to reach economies of scale with low cost of processing and storage. Our production bases are located in Jinzhong and Quwo in Shanxi Province with convenient transportation. The Jinzhong facilities and warehouses are in proximity to Shitai Railway and Provincial Road 317. The Quwo facilities are several kilometers away from Houma, a transportation hub. We have exclusive lease agreements with three railway lines for freight transportation in Jinzhong: (a) Shanxi Cereal & Oil Group, Mingli Reservation Depot; (b) Shanxi Yuci Cereal Reservation Depot; and (c) YuciDongzhao Railway Freight Station. These advantageous geographical positions and exclusive agreements help us ensure speedy delivery of our products at a low cost.
Established Sales Network
We have cultivated a national network in China for corn and bulk trading with customers including various livestock feed companies, food manufacturers, corn oil/corn starch manufacturing companies, grain trading companies, wholesalers and governmental procurement agencies. Meanwhile, we sell our processed grain products to wholesalers, distributors, institutional clients and retail stores. We also directly export organic bean-based products to countries including, without limitation, the U.S., Australia, Canada, Israel, Denmark.
Our Current Products and Product Characteristics
Our products in our Corn Division are simple processed corn. Our products in our Grain Division include packaged and unpackaged grains including millet, soy bean, green bean, black rice, wheat, etc. Packaged products include: (1) simple processed grain products packaged under our registered trademarks “Deyu” and “Shitie”; (2) bean based products under the brand name “Huichun” including vegetarian products and instant noodles made from soybeans, black beans and green beans; and (3) fruit vinegars and juices under the brand “Longquan Villa”. Our products in our Bulk Trading Division include rice, flour, wheat, kidney beans, green beans and other agricultural products.
Our farmland is located in the center of Shanxi Province, which has a relatively dry climate and which is ideal for grain cultivation. Grain crop growth relies principally on the climate and rainfall, and is not dependent on the application of chemical fertilizers or pesticides. Our simple and deep processing of grains maintain the grain’s original nutritional components. A portion of JinzhongDeyu’s grain products are certified as “organic” by the Beijing ZhongluHuaxia Organic Food Certification Centre, the chief organic food certification organization accredited and approved by the Certification and Accreditation Administration of the PRC (CNCA).
| - 6 - |
We provide technological guidance and support to our farmers regarding seed dissemination, cultivation methods, ecological fertilizer, irrigation, cultivation, weeding and harvesting. We believe working closely with our farmers helps ensure that we receive high quality raw materials for production. We also utilize an advanced product control system to help ensure high-quality finished products.
Key Customers
Our customers are mainly in China, composed mainly of (a) livestock feed companies, corn oil/corn starch manufacturing companies and governmental procurement agencies in our Corn Division; (b) wholesalers distributors, institutional clients and retail stores in our Grain Division; and (c) grain trading companies, wholesalers and governmental procurement agencies in our Bulk Trading Division. Our OEM products made of beans are also sold directly to the U.S., Australia, Canada, Israel, Denmark and other countries.
For the year ended December 31, 2014, sales revenue generated from Deyufang Innovation Food (Beijing) Co., Ltd. (“Deyufang”) accounted for 19.7% of the Company's consolidated gross revenue, while no single customer accounted for greater than 10% of the Company’s consolidated gross revenue for the years ended December 31, 2013. As of December 31, 2014, accounts receivable due from Deyufang Innovation Food (Beijing) Co., Ltd. accounted for 12.3% of the Company’s consolidated accounts receivables, while no single customer accounted for greater than 10% of the consolidated accounts receivable as of December 31, 2013
For our Corn Division, we developed large livestock feed companies as our customers, but our customer base is still diversified and no single customer accounted for greater than 10% of the division’s gross revenue in 2014 or 2013.
For our Grain Division, we provided OEM products in 2014 and 2013. Deyufang accounted for 64.6% and 53.3% of gross sales of the Grain Division for the year ended December 31, 2014 and 2013, respectively.
For our Bulk Trading Division, Shanxi Helifahua Trading Co., Ltd., Shenzhen Xinjiawang Agriculture and By-products Development Co., Ltd., and Yuchi Kaiwang Grain and Oil Wholesale Department accounted for 27.8%, 14.6% and 10.9% of gross sales of the Bulk Trading Division, respectively for the year ended December 31, 2014, while Shanxi Helifahua Trading Co., Ltd. and JinzhongKangshuaijianmin Food Trading Co., Ltd. accounted for 12.7% and 10.4% of gross sales of the Bulk Trading Division, respectively for the fiscal year ended December 31, 2013.
Sources of Raw Materials and Key Suppliers
We procure raw materials at our cultivation base in Jinzhong, Shanxi Province, which produces grains rich in nutrients, especially minerals, rutin, cellulose, amino acids, chlorophyll, lecithin and linoleic acid. Shanxi Province is located on the Loess Plateau in the western part of China. The city of Jinzhong is located in the center of Shanxi Province. We believe the topography of the region creates optimal conditions for growing grains. Favorable weather conditions, combined with our geographical conditions lead to high-quality products. There has been no serious flood or drought in the region in the past 100 years. The temperature difference between day and night is greater than 10 degrees Celsius. The weather is dry and cold. There are about 158 days without frost during the year and the growing period is longer than 135 days. The weather conditions are especially favorable for growing corn and grains. Grains are highly drought resistant. We rely on natural rainfall, and no irrigation is required throughout the year and no application of chemical fertilizers or pesticides is needed. Irrigation by underground water is only required under exceptional circumstances.
The growing season for our corn and grain in the Shanxi Province is 135+ days, which requires only one planting per year of the farmland. Our warehouses have storage capacity of 100,000+ tons and a turnover capacity of 700,000+ tons. We believe that our storage capacity, combined with our ability to expand our network of cooperative farmers and farmer’s agents, as well as the ability to expand our purchasing into other geographical areas in Shanxi Province, reduces our risks which may be attributable to raw material seasonality.
We purchase most of the raw materials directly from farmers and farmer’s agents by payment in advance or immediately after the procurement. We also purchase raw materials from grain traders. We purchased raw materials from several suppliers, including State Grain Reserves Changzi Directly-subordinate, Shanxi China Grain Reserves Corporation Shouyang Directly-Subordinate Warehouse, Shanxi China Grain Reserves Corporation Trading Company and Shanxi China Grain Reserves Corporation Taigu Directly-subordinate Warehouse, which accounted for 21.8%, 20.5%, 18.5% and 17.8% for the fiscal year ended December 31, 2014, respectively; and Shanxi China Grain Reserves Corporation Yangshou Directly-Subordinate Warehouse, Shanxi China Grain Reserves Corporation Taigu Directly-subordinate Warehouse, State Grain Reserves Changzhi Directly-subordinate Warehouse and Shanxi China Grain Reserves Corporation Trading Company, which accounted for 27.3%, 26%, 24.2% and 18.5% for the fiscal year ended December 31, 2013, respectively.
| - 7 - |
Market Opportunity
Corn and Corn Byproducts
Corn is primarily used as raw feed material for pigs, cattle, chicken and other livestock. Corn byproducts, including corn stalks, are also used as an important source of feed. Since 1997, feed production has maintained steady growth. China is now the world’s second largest feed producer according to USDA.
In many developed countries, corn is generally regarded as a “health food”. In the United States, it is believed that over 10% of health foods are made with corn or corn byproducts. Corn oil squeezed from corn germ contains over 10 types of fatty acids, more than 50% of which are acids rich in vitamins A and E. Corn oil is low in cholesterol and is believed to have positive effects on high blood pressure and heart disease. Corn oil is also widely used in the pharmaceutical and chemical industries. In recent years, demand for corn for food products in international markets has grown.
Corn is also used as raw material for highly processed industrial products. Corn can be used to produce ethanol as renewable fuels. Global energy shortages make corn an attractive alternative energy source. With the requirement of environmental protection, the demand for corn from ethanol producers has increased dramatically in recent years.
Grain Products
Grain products contain high levels of vitamin B1, dietary fiber and trace elements. Coarse grains are believed to be beneficial to people with diabetes or high blood pressure. The Chinese Nutrition Society, commissioned by the Ministry of Health in 2011 to formulate dietary guidelines, recommends consumption of 250-400 grams per day of processed grain foods for adults. They also recommended that adults consume 50-100 grams per day of coarse grains and whole grain foods and consume 30-50 grams per day of bean or bean-based products. Over 70% of adults in China, amounting to approximately 665 million people, are urban residents. Based on these guidelines, the demand for grain products by people in urban cities could reach 134 million tons per year.
As a result of the economic growth and improved living standards in China, the dietary components of the Chinese population have changed dramatically. In general, the population pays more attention to diet and nutrition. Management believes that the increased awareness of the value and benefits of grain products has resulted in an increased demand for our grain products.
Competitive Landscape
In the corn market and grain bulk trading industry, our current major competitors are smaller and local focus traders such as JinzhongDexinchang Trading Co., Ltd., Jinjian Rice Industry Co., Ltd. and Beijing Guchuan Food Co., Ltd., which are mainly engaged in the corn and grain bulk procurement and wholesale businesses.
In the grain consumption marketplace, we primarily compete with smaller grain processers and food manufacturers, which are local in focus, have a single production line, little brand recognition and limited distribution networks. The following table lists our competitors with their main products:
| - 8 - |
| Competitors | Products of Competitors Produced and /or sold by Competitors | |
| Shanxi Jin Wei Yuan Grains Company Limited | packaged and unpackaged grain | |
| Shanxi Qinzhou Huang Millet Group Limited Company | packaged and unpackaged millet, soybean | |
| HeshunXinma Grains Development Co., LTD | packaged and unpackaged millet,beans, flour | |
| HebeiGaopaidianDouDou Food (Group) Co., Ltd. | bean products | |
| Shandong Daogongfang Food Co., Ltd. | bean products | |
| YantaiYiyuan Beverage Co., Ltd. | fruit vinegars, especially apple vinegars | |
| Zhengzhou Luer Biotechnology Development Co., Ltd. | fruit vinegars and fruit juices |
Sales Network
We have established a nationwide and diversified customer base in China, including Shanxi, Hebei, Henan, Shandong, Anhui, Shaanxi, Sichuan, Hunan, Hubei, Guangdong, Jiangsu, Liaoning and Chongqing with stable partnerships with various livestock feed companies, corn oil/corn starch manufacturing companies and food manufacturers, grain trading companies, wholesalers and governmental procurement agencies.
We sell our grain products to wholesalers, distributors and retail stores in China. We develop commercial sales of refined grain products to institutional clients. Our OEM products made of beans are also sold directly to the U.S., Australia, Canada, Israel, Denmark and other countries.
Processing and Warehousing Capacities
General
We maintain facilities in central and southern Shanxi Province with total site coverage of approximately 1,780,000 square feet (approximately 165,000 square meters) and constructed area of 500,000 square feet (approximately 46,000 square meters). Our facilities are equipped with advanced crop production, processing and packaging lines as well as modern equipment.
Corn Production Capacity
Our Corn Division’s warehousing, processing and logistics center is located in Jinzhong with site coverage of 503,000 square feet (approximately 47,000 square meters) and constructed area of 144,000 square feet (approximately 13,000 square meters). The processing center has five drying cylinders and six warehouses for the storage of 70,000 tons. We have a large rental cave-type warehouse named Shanxi 661 Warehouse with storage capacity of 30,000 tons. We also have contracts for temporary warehouses near railway stations which supplement our storage capacity. Our total capacity of storage and annual turnover reach over 100,000 tons and 700,000 tons, respectively.
We process drying and water removal treatments for corn before the corn is stored in our warehouses. The five drying cylinders are equipped with the most advanced equipment for corn drying. After the drying process, the corn is packaged in bags and moved into warehouses. Then, the products undergo insecticide and anti-bacterial treatments. After being sealed and air ventilated, the products are then stored in enclosed warehouses.
Our six warehouses are equipped with advanced detection and air ventilation devices to ensure cereals are being kept in good condition. Ventilation ducts are installed on the ground level of the warehouses. Once moisture is detected, air ventilation driven by a blower will help disseminate the overall heat on the cereals. Infrared temperature sensors and 360-degree high resolution cameras have been installed in each warehouse to allow the control room to conduct 24-hour monitoring for real-time analysis of water, moisture, mildew and pests so that we can quickly take corrective measures.
The cave-type warehouse that we rent is fully enclosed and have thermostatic and moisture proof characteristics. The cave-type warehouse is built with 1.5 meter thick walls and moisture proof layers. They maintain a temperature of 10 degrees Celsius throughout the year, which is well-suited for food storage. Since no air conditioning is required, the operating costs of these warehouses are low. These warehouses are also equipped with infrared sensors that can accurately detect temperature changes and the presence of rodents, insects and other pests.
| - 9 - |
Grain Production Capacity
We are equipped with three fully automatic production lines for millet, grain and flour at our Jinzhong production base in the center of Shanxi Province, with site coverage of approximately 199,000 square feet (approximately 18,000 square meters) and a constructed area of 119,000 square feet (approximately 11,000 square meters). These lines include various kinds of rice milling machines, filtering machines, elevators, color selection machines, exhaust fans, automatic packing machines and other equipment. The production capacity of grain is over 60,000 tons.
Another production base in Quwo, in the southern part of Shanxi Province, has site coverage of over 1,076,000 square feet (approximately 100,000 square meters) and a constructed area of 238,000 square feet (approximately 22,000 square meters). This base is equipped with three kinds of advanced production lines: (1) two production lines for bean-based products with an annual production capacity of 15,000 tons; (2) two production lines for other grain products with an annual production capacity of over 26,000 tons; and (3) two production lines for fruit vinegar and fruit juices with an annual production capacity of 4,000 tons. These production lines are comprised of advanced grain milling, degreasing, automatic drying, packaging, inspection and testing equipment. At present, less than one third of the land at this production base has been developed. We believe we can develop more production lines for future demand without acquiring land use rights for more land.
To ensure high quality, we have installed fully automated production equipment at our facilities. Characteristics of our production lines and equipment are as follows:
| · | Production equipment for grain processing is fully automated. We use elevators to move raw materials through the production process. The production process is fully enclosed for protection against any pollution or contamination. We have installed equipment with advanced color selection technology for grains. We believe the device is stable and reliable, and it features automatic temperature control, automatic removal of dust and impurities, automatic air pressure detection, self injection and light testing. We have a cooling system that helps millet maintain its nutritious components, color and appearance. Selective application of the polishing process helps maintain nutritional components. |
| · | Soybean food series production uses advanced technology of dry heat extrusion equipment in oil extraction, oil purification filling, milling, squeezing and other equipment which undertake processes of peeling, crushing, oil extraction, milling, forming, drying, shaping, sterilization, packaging and other processes in the production of various soybean products while retaining most of the raw nutrients. |
| · | Production lines for our fruit vinegar and fruit juice include water treatment equipment, sugar devices, dispensing equipment, homogenization equipment, sterilization equipment and aseptic filling equipment. We use Ro water treatment equipment and remote infrared automatic filling equipment. Sterilization technology adopts aseptic filling and high temperature sterilization processes to ensure high quality of products and advanced, reliable, automatic and stable quality for the entire production line. |
Our modern equipment and technology, combined with advanced processing techniques, helps to ensure that grain production is high-quality, natural, green and ecological. Additionally, a portion of our grains can be categorized as organic by the Beijing ZhongluHuaxia Organic Food Certification Centre. We believe the careful management of breeding, cultivation, production, packaging and storage also leads to high quality products.
We implement strict quality control with each process in purchasing, storage, processing, packaging and distribution. We keep all items that are examined in the course of quality control inspections for one year in accordance with National Technology Quality Supervision Bureau requirements. We cooperate fully with the Bureau during their random testing and examination of our products.
Research and Development
Research and development expenses were immaterial for the years ended December 31, 2014 and 2013.
| - 10 - |
Operating Model
We have adopted the operating model of “Company + Farmers + Cultivation Base” supplemented by advanced production, strong warehousing capacity and exclusive logistics. We have established partnerships with over 60,000 farmers for the cultivation of high quality grains and corn. Based on our supply base, we have developed the “Deyu” operating chain of breading, cultivating, processing, warehousing and distributing our products.
In order to adapt to the changing market for grain products sold to consumers, we are streamlining our operational structure. Our initiatives continue to cultivate the entire value chain concept. With the implementation of new business strategies and resource consolidation/sharing, we believe that we can compete effectively in the industry under the new emerging market conditions.
Government Regulation
Corn Purchase and Sale Business
We are engaged in the purchase and sale of raw corn products. The supervising authority for the purchase and sale of raw corn products is the State Administration of Grain in China. Pursuant to Regulation 6 of the Food Distribution Management Regulations announced by the State Council of the PRC, the State Council Development and Reform Department and the National Food Administration Departments (the commissions of the National Food Authority) are responsible for the mid and long-term planning of China’s overall balance of food, regulation, restructuring of important food species and food distribution. The National Food Administration Department is responsible for food distribution, guidance to the industry, oversight of the food distribution laws, regulations, policies and implementation of rules and regulations. Pursuant to Regulation 9, food operators must obtain permits and register pursuant to relevant registration regulations. We have obtained the necessary Food Products Purchase Permit and operate in compliance with the relevant standards of food quality, storage, logistics and facilities.
Grain Production and Sales Business
Our production, purchases and sales of grain food products are subject to the following rules and regulations in China:
| · | “The Food Safety Law of the People’s Republic of China” (the “Food Safety Law”) | |
| · | “Regulations on the Implementation of the Food Safety Law of the People’s Republic of China” (the “Regulations”) | |
| · | “Law of the People’s Republic of China on Quality and Safety of Agricultural Products” and the “Food Distribution Management Ordinance” |
We are engaged in exporting grain food products in oversea markets and therefore our production, purchase and sales of grain food products are also subject to the following rules or regulations as they pertain to the food products exporting business:
| · | “Administrative Provisions on the Filing of Export Food Manufacturers” | |
| · | “Hygiene Requirements for Export Food Manufacturers” | |
| · | “List of Products Requiring HACCP Audit for Filing of Export Food Manufacturers” |
| - 11 - |
We are engaged in the sale of packaged grain products. The supervising authority for such products is the Beijing Bureau of the Industry and Commerce. Pursuant to Regulation 29 of the Food Safety Laws, entities engaging in food production, food distribution and food service, must obtain a Food Production Permit, Food Distribution Permit and Food Service Permit. Those entities that have obtained the Food Production Permit are authorized to operate a food production business and are not required to apply for a Food Distribution Permit. However, we have also obtained the Food Distribution Permit from the Beijing Bureau of Industry and Commerce.
We are also engaged in the production and sale of grain foods. The supervising authority for such production is the Technology Quality Supervision Bureau of Shanxi Province. Pursuant to Food Safety Laws and ancillary regulations, China’s Head Office of the Technology Quality Supervision Bureau supervises technology quality of enterprises which are engaged in food production. The Bureau issues Food Production Permits, undertakes mandatory examinations of technology quality for entry into the industry and is responsible for investigation of incidents regarding food safety. Pursuant to Regulation 29 of the Food Safety Laws, entities engaging in food production, food distribution and food service, must obtain the Food Production Permit, Food Distribution Permit and Food Service Permit. Those who have obtained the Food Production Permit are authorized to operate food production businesses and are not required to apply for a Food Distribution Permit. Deyu has also obtained the nation’s Industrial Production Permit from the Technology Quality Supervision Bureau (Cereals: QS140701040051 and Flour: QS140701016210). Our food labeling complies with the Interim Measures for Labeling of Food Products of Enterprises in Shanxi Province and GB7718-1994 Standards for Food Products Labeling and has obtained the relevant registration certificate (Record number SB/1407000-009-01).
Intellectual Property
With the exception of our registered trademarks “Deyu”, “Shitie”, “Huichun”, “LongQuan Villa” and “Fushite”, we do not own any patents, trademarks, licenses or franchises on our products or processes. We also own the rights to the domain name www.deyuagri.com , which is currently in good standing.
Employees
We currently have approximately 445 full time employees and varying numbers of part-time employees working on a seasonal basis.
We are a “smaller reporting company” and as such, are not required to provide this information.
ITEM 1B. Unresolved Staff Comments
None.
Our production facilities are located in Jinzhong and Quwo of Shanxi Province with total site coverage of approximately 1,780,000 square feet (approximately 165,000 square meters) and constructed area of 482,000 square feet (approximately 45,000 square meters). We own a modern processing center with five drying cylinders for corn and the six warehouses for storage of 70,000 tons and have a large rental warehouse named the Shanxi 661 Warehouse with a storage capacity of 30,000 tons, of which the total capacity of annual turnover may reach more than 700,000 tons. We have eight production lines for grain processing with total production capacity of over 108,000 tons. Our facilities are equipped with advanced crop production, processing and packaging lines as well as modern equipment.
| - 12 - |
According to government regulations of the PRC, the PRC Government owns all land. We own the following land use rights for farmland and/or industrial lands: (1) land use rights of farmland in Jinzhong Shanxi consisting of 17,000 acres (approximately 70,000,000 square meters) for the remaining average of 35 years; (2) land use right of the industrial land in Quwo, Shanxi consisting of 1,076,000 square feet (approximately 100,000 square meters) for the remaining 42 years (3) land use right of the industrial land in Yuci District of Jinzhong, Shanxi consisting of 504,000 square feet (approximately 47,000 square meters) for the remaining 46 years; (4) land use right of the industrial land in Shanzhuangtou, JinzhongDeyu of 125,000 square feet (approximately 12,000 square meters) for the remaining 23 years; (5) land use right of the industrial land in Shanzhuangtou, JinzhongDeyu of 73,000 square feet (approximately 6,800 square meters) for the remaining 47 years.
To our knowledge, there is no action, suit, proceeding, inquiry or investigation before or by any court, public board, government agency, self-regulatory organization or body pending or, to the knowledge of our executive officers or any of our subsidiaries, threatened against or affecting us, our common stock, any of our subsidiaries or any of our companies or our companies’ subsidiaries’ officers or directors in their capacities as such, in which an adverse decision could have a material adverse effect.
ITEM 4. Mine Safety Disclosures.
Not applicable.
| ITEM 5. | Market for Registrant’s Common Equity, Related Stockholder Matters and Issuer Purchases of Equity Securities |
Market Information
Our common stock is quoted on the OTCBB and the OTC Markets (OTCQB) under the symbol “DEYU”. There can be no assurance that a liquid market for our securities will ever develop. Transfer of our common stock may also be restricted under the securities or blue sky laws of various states and foreign jurisdictions. Consequently, investors may not be able to liquidate their investments and should be prepared to hold the common stock for an indefinite period of time.
| - 13 - |
The following table summarizes the high and low closing bid prices per share of the common stock for the periods indicated as reported provided by the OTC Markets Group, Inc. These quotations reflect inter-dealer prices, without retail mark-up, markdown or commissions, and may not necessarily represent actual transactions.
Closing Bid Prices
| High ($) | Low ($) | |||||||
| Fiscal Year Ended December 31, 2013 | ||||||||
| 1st Quarter (January 1 – March 31): | 1.05 | 0.32 | ||||||
| 2rd Quarter (April 1 – June 30): | 0.60 | 0.21 | ||||||
| 3nd Quarter (July 1 – September 30): | 0.43 | 0.20 | ||||||
| 4th Quarter (October 1 – December 31): | 0.36 | 0.20 | ||||||
| Fiscal Year Ended December 31, 2014 | ||||||||
| 1st Quarter: | 0.44 | 0.20 | ||||||
| 2rd Quarter: | 0.45 | 0.19 | ||||||
| 3nd Quarter: | 0.30 | 0.20 | ||||||
| 4th Quarter: | 0.35 | 0.18 | ||||||
The following table presents certain information with respect to our equity compensation plan as of December 31, 2014:
| Number of | ||||||||||||
| securities remaining | ||||||||||||
| Number of securities | available for future | |||||||||||
| to be issued | Weighted-average | issuance under equity | ||||||||||
| upon exercise of | exercise price of | compensation plans | ||||||||||
| outstanding options, | outstanding options, | (excluding securities | ||||||||||
| warrants and rights | warrants and rights | reflected in column (a)) | ||||||||||
| Plan Category | (a) | (b) | (c) | |||||||||
| Equity compensation plans approved by security holders | - | $ | - | - | ||||||||
| Equity compensation plans not approved by security holders(1) | 670,000 | 2.99 | 575,586 | |||||||||
| Total | 670,000 | $ | 2.99 | 575,586 | ||||||||
| (1) | On November 4, 2010, the Company’s Board of Directors approved the Company’s 2010 Share Incentive Plan. On November 8, 2010, a total of 931,000 non-qualified incentive stock options were approved by our Board of Directors and granted under the Plan to executives, key employees, independent directors, and consultants at an exercise price of $4.40 per share and on December 15, 2010, 40,000 non-qualified incentive stock shares were approved by our Board of Directors and granted under the Plan to a consultant at an exercise price of $4.40 per share, all of the granted options have vested: |
| - 14 - |
On March 8, 2012, the Company’s Board of Directors increased the number of shares allocated to and authorized for use under the Plan from 1,000,000 shares to 1,245,586 shares, the maximum number of shares allowable pursuant to the terms of the Plan and granted 420,000 options under the Plan to independent directors, officers and key employees of the Company, of which included some new options and those re-granted after such options were forfeited by other former employees as a result of their resignations from the Company in accordance with the terms of their option agreements. All of the granted options have vested:
On November 23, 2012, our Board of Directors allocated to and authorized to re-grant 150,000 options to a director of the Company after such options were forfeited by other former employees as a result of their resignations from the Company in accordance with the terms of their option agreements. All of the granted options have vested:
On November 5, 2011, we filed a Registration Statement with the SEC on Form S-8 covering up to 1,000,000 shares underlying options which may be granted under the Plan. As of March 31, 2015, none of the options granted pursuant to the Plan have been exercised.
Performance Graph
We are a “smaller reporting company” and as such, are not required to provide this information.
Recent Sales of Unregistered Securities; Use of Proceeds from Registered Securities
The Company did not sell any securities during the period covered by this Report which were not registered under the Act and not previously reported on a quarterly report on Form 10-Q or a current report on Form 8-K.
Holders of Common Equity
On March 23, 2015, we had 11,044,328 shares of common stock issued and outstanding to 27 holders of record, and the closing price of our common stock as quoted on the OTCQB was $0.34 per share. The number of record holders does not include beneficial owners of common stock whose shares are held in the names of banks, brokers, nominees or other fiduciaries.
Dividends
We have not paid cash dividends on any class of common equity since formation.
In connection with our private placement in May 2010, we issued an aggregate 2,455,863 shares of our Series A convertible preferred shares and warrants exercisable into 982,362 shares of common stock to Investors. Pursuant to the terms of our Series A convertible preferred share designations, the holders of our Series A convertible preferred shares are entitled to receive cumulative dividends at a rate of 5% per annum, and such shares of Series A convertible preferred stock are convertible into shares of our common stock on a 1:1 basis, subject to applicable adjustments.
On July 29, 2011, we issued 66,379 shares of Series A convertible preferred shares as a cumulative Series A convertible preferred share dividend of $212,420 in aggregate, to such holders of Series A convertible preferred stock on a pro rata basis and on January 27, 2012, we issued a Series A convertible preferred share dividend equal to $219,721, in the aggregate, to such holders of Series A convertible preferred stock on a pro rata basis.
On July 26, 2012, we issued 55,995 shares of Series A convertible preferred shares and $40,315.22 in cash as cumulative Series A convertible preferred share dividend of $220,052 in aggregate, to such holders of Series A convertible preferred stock on a pro rata basis and on January 29, 2013, we issued 70,124 shares of Series A convertible preferred shares as a cumulative Series A convertible preferred share dividend of $224,397 in aggregate, to such holders of Series A convertible preferred stock on a pro rata basis.
| - 15 - |
On July 26, 2013, we issued 72,534 shares of Series A convertible preferred shares as a cumulative Series A convertible preferred share dividend of $232,110 in aggregate, to such holders of Series A convertible preferred stock on a pro rata basis.
On January 23, 2014, we issued 75,035 shares of Series A convertible preferred shares as a cumulative Series A convertible preferred share dividend of $240,089 in aggregate, to such holders of Series A convertible preferred stock on a pro rata basis.
On July 11, 2014, we issued 63,391 shares of Series A convertible preferred shares as a cumulative Series A convertible preferred share dividend of $278,920 in aggregate, to such holders of Series A convertible preferred stock on a pro rata basis.
On January 9, 2015, we issued 65,140 shares of Series A convertible preferred shares as a cumulative Series A convertible preferred share dividend of $208,449 in aggregate, to such holders of Series A convertible preferred stock on a pro rata basis.
ITEM 6. Selected Financial Data
We are a “smaller reporting company” and as such, are not required to provide this information.
ITEM 7. Management’s Discussion and Analysis of Financial Condition and Results of Operations
Forward-Looking Statements
In this Annual Report on Form 10-K, unless otherwise indicated, the words “we”, “us”, “our”, “Deyu” or the “Company”) refer to Deyu Agriculture Corp. and all entities owned or controlled by Deyu Agriculture Corp., except where it is made clear that the term only means the parent or a subsidiary company. References in this report to the “PRC” or “China” are to the People’s Republic of China.
This report contains forward-looking statements. The words “anticipate”, “believe”, “expect”, “plan”, “intend”, “seek”, “estimate”, “project,”, “could”, “may” and similar expressions are intended to identify forward-looking statements. These statements include, among others, information regarding future operations, future capital expenditures, and future net cash flow. Such statements reflect our management’s current views with respect to future events and financial performance and involve risks and uncertainties, including, without limitation, the current economic downturn adversely affecting demand for the our products; our reliance on our major customers for a large portion of our net sales; our ability to develop and market new products; our ability to raise additional capital to fund our operations; our ability to accurately forecast amounts of supplies needed to meet customer demand; market acceptance of our products; exposure to product liability and defect claims; fluctuations in the availability of raw materials and components needed for our products; protection of our intellectual property rights; changes in the laws of the PRC that affect our operations; inflation and fluctuations in foreign currency rates and various other matters, many of which are beyond our control. Should one or more of these risks or uncertainties occur, or should underlying assumptions prove to be incorrect, actual results may vary materially and adversely from those anticipated, believed, estimated or otherwise indicated. Consequently, all of the forward-looking statements made in this report are qualified by these cautionary statements and there can be no assurance of the actual results or developments.
The following discussion and analysis should be read in conjunction with our consolidated financial statements and the related notes thereto and other financial information contained elsewhere in this Annual Report.
| - 16 - |
Recent Developments
Operating revenue for the year ended December 31, 2014 was $109,677,220, representing a 55.5% decrease from $246,350,104 for the year ended December 31, 2013. Our net loss available to common stockholders for the year ended December 31, 2014 was $17,356, 472 representing a 35.3% decrease from $26,818,546 of net income for the year ended December 31, 2013.
As a result of changes in the economic environment and market conditions, as well as the negative impacts from some unexpected extreme weather conditions, our business faced great challenges in 2014.
Corn is mainly used as raw material for livestock feeds and deep processed products such as corn starch and ethanol. The corn market experienced a downturn as result of weak demand from the downstream industries with consecutive increase of output in the past few years in China. The on-going downturn continued to impact our business in 2014, for the demand of corn continued to be weak. In order to stabilize the market, the Chinese government started to implement some measures in the second quarter 2014, including government procurement and providing subsidies to downstream manufacturers. The market showed some fluctuation and the average sales prices in the second half of the year had a slight increase. The Company increased the corn sales volume slightly according to the market situation although the Company is still undertaking a conservative strategy.
| - 17 - |
The weather during the past winter in Shanxi Province in China was abnormally warm compared to winters of previous years and has caused serious damage to our inventories. This badly affected our operations. The Company incurred a substantial gross loss of $5.9 million from the disposal of the damaged corn inventory which mildewed in the first quarter of 2014. The Company has taken effective measures to prevent further mildewing, such as isolating the damaged inventories, continuous and constant drying of the stock by machines and improving air ventilation in the warehouses. The Company’s prevented further damage after imposing stricter control measures.
For the business of our Grain Division, we slow downed our retail grain package business due to the deteriorating efficiency of existing retail. During 2014 we developed our direct export business by selling grain products directly to other countries including, without limitation, the U.S., Australia, Canada, Israel, Denmark.
Plan of Operation
The demand in the corn market showed some signs of recovery since the second quarter of 2014, but it still needs time for full recovery, for the demand from livestock feed companies was still weak and deep processed corn companies have been running in the red for several years. However, we still believe that the agriculture sector is very promising in the long term even though the evolving market conditions in China currently present great challenges.
The Company has been undertaking measures to optimize operations, to increase efficiency and to reduce operational costs. At the same time, the Company is continuing its business development initiatives to cultivate the entire value chain concept and develop new business strategies with resources integration. We expect these measures, together with new business development, will help us get through this difficult period and restore the growth in the future. And with the implementation of new business strategies and resource consolidation/sharing, we believe that we can compete effectively in the industry under the new emerging market conditions.
Results of Operations for the year ended December 31, 2014 as Compared to the year ended December 31, 2013
| For The Year Ended | ||||||||||||||||
| December 31, | ||||||||||||||||
| 2014 | 2013 | Change | % | |||||||||||||
| Net revenue | ||||||||||||||||
| Normal inventory | $ | 106,256,045 | $ | 246,350,104 | $ | (140,094,059 | ) | -56.9 | % | |||||||
| Damaged corn | 3,421,175 | - | 3,421,175.00 | 100.0 | % | |||||||||||
| Total Net Revenue | 109,677,220 | 246,350,104 | (136,672,884 | ) | -55.5 | % | ||||||||||
| Cost of goods sold | ||||||||||||||||
| Normal inventory | (99,085,690 | ) | (227,250,013 | ) | 128,164,323 | -56.4 | % | |||||||||
| Damaged corn | (9,328,942 | ) | - | -9,328,942.00 | 100.0 | % | ||||||||||
| Loss on inventory valuation reserve | - | -4,478,174.00 | 4,478,174.00 | 100.0 | % | |||||||||||
| Total Cost of Good Sold | (108,414,632 | ) | (227,250,013 | ) | 118,835,381 | -52.3 | % | |||||||||
| Gross Profit | 1,262,588 | 14,621,917 | (13,359,329 | ) | -91.4 | % | ||||||||||
| Selling expenses | (9,600,879 | ) | (17,447,531 | ) | 7,846,652 | -45.0 | % | |||||||||
| General and administrative expenses | (7,468,660 | ) | (13,195,537 | ) | 5,726,877 | -43.4 | % | |||||||||
| Loss on impairment of assets | - | (7,346,776 | ) | (7,346,776 | ) | 100.0 | % | |||||||||
| Total Operating Expense | (17,069,539 | ) | (37,989,844 | ) | 20,920,305 | -55.1 | % | |||||||||
| Operating income (loss) | (15,806,951 | ) | (23,367,927 | ) | 7,560,976 | -32.4 | % | |||||||||
| Interest income | 6,263 | 35,193 | (28,930 | ) | -82.2 | % | ||||||||||
| Interest expense | (783,560 | ) | (790,438 | ) | 6,878 | -0.9 | % | |||||||||
| Non-operating income (loss) | 146,623 | (403,885 | ) | 550,508 | -136.3 | % | ||||||||||
| Total Other Expense | (630,674 | ) | (1,159,130 | ) | 528,456 | -45.6 | % | |||||||||
| Income (loss) before income taxes | (16,437,625 | ) | (24,527,057 | ) | 8,089,432 | -33.0 | % | |||||||||
| Income taxes | (501,262 | ) | (604,450 | ) | 103,188 | -17.1 | % | |||||||||
| Net income (loss) | (16,938,887 | ) | (25,131,507 | ) | 8,192,620 | -32.6 | % | |||||||||
| Extraordinary loss (after taxes) | 0 | (1,212,430 | ) | (1,212,430 | ) | 100 | % | |||||||||
| Net Income (loss) attributable to noncontrolling interests | 1,039 | 4,160 | (3,121 | ) | -75.0 | % | ||||||||||
| Net income (loss) attributable to Deyu Agriculture Corp. | (16,937,848 | ) | (26,339,777 | ) | 9,401,929 | -35.7 | % | |||||||||
| Preferred stock dividends | (418,624 | ) | (478,769 | ) | 60,145 | -12.6 | % | |||||||||
| Net income (loss) available to common stockholders | $ | (17,356,472 | ) | (26,818,546 | ) | $ | 9,462,074 | -35.3 | % | |||||||
Net Revenue
Our net revenue for the year ended December 31, 2014 was $109.7 million, a decrease of $136.7 million, or 55.5%, compared to $246.4 million for the year ended December 31, 2013. This decrease was the combined result of a decrease of $70.7 million in corn sales, a decrease of $8.2 million in grain sales and a decrease of $61.1 million in bulk trading sales. Sales derived from our Corn Division, Grain Division and Bulk Trading Division for the year ended December 31, 2014 were $75.3 million, $33.4 million and $1.0 million, respectively, accounting for 68.6%, 30.5% and 0.9% of total net revenue, respectively.
| - 18 - |
The following table breaks down the distribution of our sales volume and amount by division and as a percentage of gross sales:
| For The Year Ended December 31 | ||||||||||||||||||||||||||||||||
| 2014 | 2013 | |||||||||||||||||||||||||||||||
| Volume (ton) | Net Revenue | %
of total sales | Volume (ton) | Net Revenue | % of total sales | Changes | % | |||||||||||||||||||||||||
| Corn Division | ||||||||||||||||||||||||||||||||
| Normal inventory | 195,300 | $ | 71,842,623 | 65.5 | % | 398,940 | 142,560,749 | 57.9 | % | $ | (70,718,126 | ) | -49.6 | % | ||||||||||||||||||
| Damaged corn | 40,880 | 3,421,175 | 3.1 | % | - | - | - | $ | 3,421,175 | 100 | % | |||||||||||||||||||||
| Subtotal | 236,180 | 75,263,798 | 68.6 | % | 398,940 | 142,560,749 | 57.9 | % | (67,296,951 | ) | -47.2 | % | ||||||||||||||||||||
| Grain Division | 20,797 | 33,399,849 | 30.5 | % | 23,022 | 41,637,805 | 16.9 | % | (8,237,956 | ) | -19.8 | % | ||||||||||||||||||||
| Bulk Trading Division | 1,170 | 1,013,573 | 0.9 | % | 92,576 | 62,151,550 | 25.2 | % | (61,137,977 | ) | -98.4 | % | ||||||||||||||||||||
| Total | 258,147 | $ | 109,677,220 | 100.0 | % | 514,538 | 246,350,104 | 100.0 | % | $ | (136,672,884 | ) | -55.5 | % | ||||||||||||||||||
Net revenue from our Corn Division for the year ended December 31, 2014 was approximately $75.3 million, a decrease of $70.7 million, or approximately 49.6%, as compared to $142.6 million for the year ended December 31, 2013. The decrease was mainly the combined result of a decrease of 51.0% in sales volume and an increase of 2.9% in the average annual selling price of corn. The decrease was primarily due to the conservative strategy temporarily taken by the Company to cope with the weak demand in the corn market.
Net revenue from our Grain Division for the year ended December 31, 2014 was approximately $33.4 million, a decrease of $8.2 million, or 19.8%, as compared to $41.6 million for the year ended December 31, 2013. The decrease was mainly attributable to the decline in retail sales in supermarket and convenience stores, which was caused by the rising distribution channel cost of traditional retail sales.
Net revenue from our Bulk Trading Division for the year ended December 31, 2014 was approximately $1.0 million, a decrease of $61.1 million, or 98.4% as compared to $62.1 million for the year ended December 31, 2013. This decrease was mainly attributable to the lack of cash resources temporarily for bulk trading business.
| - 19 - |
Cost of Goods Sold
Cost of goods sold mainly consisted of the cost of raw materials, labor, utilities, manufacturing costs, manufacturing related depreciation and packaging costs. Our cost of goods sold was $108.4 million, to a decrease of $118.8 million, or 52.3%, as compared to $227.3 million for the year ended December 31, 2013. This decrease was primarily attributable to the decrease in sales volume.
Gross Profit
The following table breaks down the gross profit and gross margin by division:
| For The Year Ended December 31, | ||||||||||||||||||||||||
| 2014 | 2013 | |||||||||||||||||||||||
| Gross Profit | % of total Gross Profit | Margin | Gross Profit | % of total Gross Profit | Margin | |||||||||||||||||||
| Corn Division | ||||||||||||||||||||||||
| Normal inventory | $ | 2,995,765 | 237.3 | % | 4.2 | % | $ | 11,493,696 | 78.6 | % | 8.1 | % | ||||||||||||
| Damaged corn | -5,907,766 | -467.9 | % | -172.7 | % | - | - | - | ||||||||||||||||
| Subtotal | (2,912,001 | ) | -230.6 | % | -3.9 | % | 11,493,696 | 78.6 | % | 8.1 | % | |||||||||||||
| Grain Division | 4,386,304 | 347.4 | % | 13.1 | % | 5,489,331 | 37.5 | % | 13.2 | % | ||||||||||||||
| Bulk Trading Division | -211,715 | -17 | % | -20.9 | % | 2,117,064 | 14.5 | % | 3.4 | % | ||||||||||||||
| Total | 1,262,588 | 100.0 | % | 1.2 | % | 19,100,091 | 130.6 | % | 7.8 | % | ||||||||||||||
| Loss on inventory valuation reserve | $ | - | (4,478,174 | ) | -30.6 | % | -1.8 | % | ||||||||||||||||
| 1,262,588 | 1.2 | % | 14,621,917 | 100.0 | % | 6.0 | % | |||||||||||||||||
Our gross profit for the year ended December 31, 2014 was $1.3 million, a decrease of $13.4 million, or 91.4%, as compared to $14.6 million for the year ended December 31, 2013. The decrease was a combined result of a decrease in gross profits of $14.4 million in the Corn Division, a decrease of $1.1 million in the Grain Division, a decrease of $2.3 million in the Bulk Trading Division and a loss on inventory valuation reserve of $4.5 million occurred in the year ended December 31, 2013. Our gross margin decreased from 6.0% for the year ended December 31, 2013 to 1.2% for the year ended December 31, 2014. The decrease in gross margin was mainly the result of the decline of gross margin in Corn division.
Gross loss in the Corn Division was $2.9 million for the year ended December 31, 2014, while gross profit for the year ended December 31, 2013 was $11.5 million. Gross margin for the corn division for the year 2014 was (3.9%), compared with the gross margin of 8.1% for the year ended December 31, 2013. The Company incurred the gross loss of $5.9 million from the sales of the mildewed corn inventory to third parties at prices lower than the cost during the first quarter of 2014. Taking out the impact of disposal of mildewed corn, gross profit and gross margin from the sales of the normal corn was $3.0 million and 4.2%, respectively. Gross margin from normal corn sales decreased for 393 basis points, which was primarily due to the pressure from the government’s intervention on the corn pricing and the weak demand for corn from the downstream industries.
Gross profit in the Grain Division was $4.4 million. Gross margin for the Grain Division was 13.1 % for the year ended December 31, 2014, which decreased by 7 basis points from 13.2% for the year ended December 31, 2013. This decrease in gross margin was the combined result of the increase in the gross margin of the export business and decrease of the gross margin of the retail sales.
Gross loss in the Bulk Trading Division was $0.2 million. Gross margin in the Bulk Trading Division was (20.9%) for the year ended December 31, 2014, while gross margin of the bulk trading was 3.4% for the year ended December 31, 2013. This decrease in gross margin was primarily due to the market fluctuation.
| - 20 - |
Selling Expenses
Selling expenses included expenses of freight, warehousing, handling, distribution, advertising, farmer subsidies, payroll and other expenses. Selling expenses for the year ended December 31, 2014 were $9.6 million, a decrease of $7.8 million, or 45.0% from $17.4 million for the year ended December 31, 2013. The decrease was mainly attributable to the decline of the freight costs caused by the reduction in sales volume.
General and Administrative Expenses
General and administrative expenses included payroll, professional services, rental, travel, depreciation and amortization. General and administrative expenses for the year ended December 31, 2014 was $7.5 million, a decrease of $5.7 million or 43.4% compared to the year ended December 31, 2013. This decrease was a combined result of a reduction of $4.7 million in general expenses as a result of the Company are cost saving measures and a $1.8 million decrease in bad debt expenses. The Company offered $0.8 million of incentives to customers for accelerating collections of accounts receivable in 2014, and recorded as write-off of allowance for doubtful accounts.
Loss on Impairment of Asset Valuation
Loss on impairment of asset valuation was $7.3 million for the year ended December 31, 2013, which represented a $5.8 million impairment loss of the land use rights of farmland located in Yuci, Shanxi Province, a $0.8 million loss resulted from the termination of the construction of an uncompleted building in the subsidiary Huichun and a $0.7 million loss resulted from the idle ERP system for retail sales in the Grain Division.
Interest Expense
Interest expense for the year ended December 31, 2014 was $0.8 million, compared to $0.8 million for the year ended December 31, 2013 as there was no significant fluctuation on the average loan balances.
Non-operating Income (Loss)
Non-operating income for the year ended December 31, 2014 was $0.1 million, representing the income from the disposal of unqualified inventory in Huichun, while non-operating loss for the year ended December 31, 2013 was $0.4 million, representing customary donations to the local community.
Provision for Income Taxes
Under the Enterprise Income Tax (“EIT”) Law of the PRC, the standard EIT rate is 25%. Our PRC subsidiaries are subject to PRC income taxes on an entity basis on income arising in or derived from the tax jurisdiction in which they operate. According to the Tax Pronouncement [2008] No. 149 issued by the State Administration of Tax of the PRC, the preliminary processing industry of agricultural products is entitled to EIT exemption starting January 1, 2008. Three of the Company’s wholly-owned subsidiaries located in Shanxi Province, namely JinzhongDeyu, JinzhongYongcheng and JinzhongYuliang, are subject to the EIT exemption. All of our other subsidiaries are subject to the 25% EIT rate.
Income tax expenses were $501,262 for the year ended December 31, 2014, mainly representing current income tax expenses derived from Huichun, which was subject to the 25% EIT rate. Income tax expenses were $604,450 for the year ended December 31, 2013, mainly representing the current income tax expenses derived from Taizihu and Huichun, The decrease in income taxes was mainly due to the decline of income before tax.
Extraordinary loss (after taxes)
Extraordinary loss (after taxes) for the year ended December 31, 2013 represents $1.2 million in inventory loss due to the collapse of our warehouses under a heavy snow storm in April 2013.
Net Income (Loss)
As a result of the above, we had net loss available to common stockholders of $17. 4 million for the year ended December 31, 2014 compared to a net loss of $26.8 million for the year ended December 31, 2013, a decrease of $9.5 million, or 35.9%.
| - 21 - |
Liquidity and Capital Resources
The following summarizes the key components of our cash flows for the year ended December 31, 2014 and 2013:
| For The Year Ended December 31, | ||||||||
| 2014 | 2013 | |||||||
| Net cash provided by operating activities | $ | 620,727 | $ | 5,741,093 | ||||
| Net cash used in investing activities | (576,839 | ) | (518,165 | ) | ||||
| Net cash provided by (used in) financing activities | 1,622 | (9,268,200 | ) | |||||
| Effect of exchange rate change on cash and cash equivalents | (12,049 | ) | 87,275 | |||||
| Net (decrease) increase in cash and cash equivalents | $ | 33,461 | $ | (3,957,997 | ) | |||
Net cash provided by operating activities totaled approximately $0.6 million for the year ended December 31, 2014 and $5.7 million for the year ended December 31, 2013, a decrease of $5.1 million or 89.5%. We incurred $17.4 million of net loss available to common stockholders for the year ended December 31, 2014, while we incurred $26.8 million of net loss available to common stockholders for the year ended December 31, 2013. This decrease was primarily attributable to continue losses which weakened the operating cash flow.
Net cash used in investing activities for the year ended December 31, 2014 and 2013 was $0.5 million and $0.5 million, respectively. There was no material net cash used in investing activities for the year ended December 31, 2014 and 2013.
Net cash used in financing activities for the years ended December 31, 2014 were immaterial, while net cash used in financing activities for the year ended December 31, 2013 were approximately $9.3 million .We repaid $9.1 million of short-term loans from related parties, repaid $1.0 million of short-term bank loans and received $0.8 million of cash released from restriction on a credit line of bank loans for the year ended December 31, 2013.
We believe that our current levels of cash, cash flows from operations, and bank, related party and unrelated party borrowings will be sufficient to meet our anticipated cash needs for at least the next 12 months. However, we may need additional cash resources in the future if we experience changed business conditions or other developments. We may also need additional cash resources in the future if we find and wish to pursue opportunities for investment, acquisition, strategic cooperation or other similar actions. If we ever determine that our cash requirements exceed our amounts of cash and cash equivalents on hand, we may seek to issue debt or equity securities or obtain a credit facility. Any future issuance of equity securities could cause dilution to our shareholders. Any incurrence of indebtedness could increase our debt service obligations and cause us to be subject to restrictive operating and financial covenants. It is possible that, when we need additional cash resources, financing will only be available to us in amounts or on terms that would not be acceptable to us, if at all.
Contractual Obligations
The following table presents the Company’s material contractual obligations as of December 31, 2014:
| Contractual | Less than | More than | ||||||||||||||||||
| Obligations | Total | 1 year | 1-2 years | 3-5 years | 5 years | |||||||||||||||
| Bank Loans | $ | 7,268,801 | $ | 7,268,801 | $ | - | $ | - | $ | - | ||||||||||
| Operating Lease Obligations | 1,810,046 | 211,698 | 187,592 | 508,656 | 902,100 | |||||||||||||||
| $ | 9,078,847 | $ | 7,480,499 | $ | 187,592 | $ | 508,656 | $ | 902,100 | |||||||||||
Off-Balance Sheet Arrangements
We do not have any off-balance sheet arrangements, financings, or other relationships with unconsolidated entities or other persons, also known as “special purpose entities”.
Critical Accounting Policies and Estimates
This discussion and analysis of financial condition and results of operations has been prepared by management based on our consolidated financial statements, which have been prepared in accordance with U.S. GAAP. The preparation of these financial statements requires management to make estimates and judgments that affect the reported amounts of assets, liabilities, revenues, and expenses, and related disclosure of contingent assets and liabilities. On an ongoing basis, management evaluates our critical accounting policies and estimates, including those related to revenue recognition, valuation of accounts receivable, inventory, property and equipment, long-lived assets, intangible assets, derivative liabilities and contingencies. Estimates are based on historical experience and on various assumptions believed to be reasonable under the circumstances, the results of which form the basis for making judgments about the carrying values of assets and liabilities that are not readily apparent from other sources. These judgments and estimates affect the reported amounts of assets and liabilities and the reported amounts of revenue and expenses during the reporting periods. We consider the following accounting policies important in understanding our operating results and financial condition:
| - 22 - |
Basis of presentation
The audited consolidated financial statements include the financial statements of Deyu Agriculture Corp. and its subsidiaries. All significant intercompany account balances and transactions have been eliminated in consolidation. Results of operations of companies purchased are included from the dates of acquisition.
These accompanying consolidated financial statements have been prepared in accordance with US GAAP. The Company’s functional currency is the Chinese Yuan, or Renminbi (“RMB”); however, the accompanying consolidated financial statements have been translated and presented in United States Dollars (“USD”).
On April 27, 2010, as a result of the consummation of the Share Exchange, we changed our fiscal year end from May 31 to December 31 to conform to the fiscal year end of City Zone.
Use of estimates
The preparation of the consolidated financial statements in conformity with US GAAP requires management to make estimates and assumptions that affect the reported amounts of assets and liabilities and disclosure of contingent assets and liabilities at the date of the financial statements and the reported amounts of revenues and expenses during the reporting period. Management makes its estimates based on historical experience and various other assumptions and information that are available and believed to be reasonable at the time the estimates are made. Therefore, actual results could differ from those estimates under different assumptions and conditions.
Cash and cash equivalents
Cash and cash equivalents consist of cash on hand, cash in banks and all highly liquid investments with original maturities of three months or less.
Accounts receivable
Accounts receivable are recorded at net realizable value consisting of the carrying amount less allowance for doubtful accounts, as needed. We assess the collectability of accounts receivable based primarily upon the creditworthiness of the customer as determined by credit checks and analysis, as well as the customer’s payment history. Management reviews the composition of accounts receivable and analyzes historical bad debts, customer concentrations, customer credit worthiness, current economic trends, and changes in customer payment patterns to evaluate the adequacy of these reserves. While management uses the best information available upon which to base estimates, future adjustments to the allowance may be necessary if economic conditions differ substantially from the assumptions used for the purposes of analysis. The balance of allowance for doubtful accounts as of December 31, 2014 and December 31, 2013 was $1,337,364 and $984,717, respectively.
Inventories
The Company's inventories are stated at lower of cost or market. Cost is determined on a moving-average basis. Costs of inventories include purchase and related costs incurred in delivering products to their present location and condition. Market value is determined by reference to selling prices after the balance sheet date or to management’s estimates based on prevailing market conditions. Management periodically evaluates the composition of its inventories at least quarterly to identify slow-moving and obsolete inventories to determine if a valuation allowance is required. The balance of reserve for inventory valuation as of December 31, 2014 and December 31, 2013 was $140,582 and $4,603,929, respectively.
| - 23 - |
Property, plant, and equipment
Property, plant, and equipment are stated at cost less accumulated depreciation. Expenditures for maintenance and repairs are charged to earnings as incurred; in addition, renewals and betterments are capitalized. When property, plant, and equipment are retired or otherwise disposed of, the related cost and accumulated depreciation are removed from the respective accounts, and any gain or loss is included in operations.
Depreciation is computed using the straight-line method over the estimated useful lives of the assets as follows:
| Useful Life (in years) |
|||
| Automobiles | 5 | ||
| Buildings | 10-30 | ||
| Office equipment | 5 | ||
| Machinery and equipment | 5-10 | ||
| Furniture & fixtures | 5 |
Construction-in-progress
Construction-in-progress consists of amounts expended for the construction of a new factory park, and the cost of the portion of the land use right that the new factory park occupied. Construction-in-progress is not depreciated until such time as the assets are completed and put into service. Once factory park construction is completed, the cost accumulated in construction-in-progress will be transferred to property, plant, and equipment.
Long-lived assets
The Company applies the provisions of FASB ASC Topic 360 (ASC 360), "Property, Plant, and Equipment" which addresses financial accounting and reporting for the impairment or disposal of long-lived assets. The Company periodically evaluates the carrying value of long-lived assets to be held and used in accordance with ASC 360, at least on an annual basis. ASC 360 requires the impairment losses to be recorded on long-lived assets used in operations when indicators of impairment are present and the undiscounted cash flows estimated to be generated by those assets are less than the assets' carrying amounts. In that event, a loss is recognized based on the amount by which the carrying amount exceeds the fair market value of the long-lived assets. Loss on long-lived assets to be disposed of is determined in a similar manner, except that fair market values are reduced for the cost of disposal. As of December 31, 2014 and December 31, 2013, the balance of impairment of construction-in-progress was $772,091 and $773,874, respectively.
Intangible assets
For intangible assets subject to amortization, an impairment loss is recognized if the carrying amount of the intangible asset is not recoverable and exceeds fair value. The carrying amount of the intangible asset is considered not recoverable if it exceeds the sum of the undiscounted cash flows expected to result from the use of the assets. As of December 31, 2014 and December 31, 2013, the balance of impairment of intangible assets was $6,557,755 and $6,572,902, respectively.
Fair value measurements
FASB ASC 820, “Fair Value Measurements” (formerly SFAS No. 157) defines fair value for certain financial and nonfinancial assets and liabilities that are recorded at fair value, establishes a framework for measuring fair value and expands disclosures about fair value measurements. It requires that an entity measure its financial instruments to base fair value on exit price, maximize the use of observable units and minimize the use of unobservable inputs to determine the exit price. It establishes a hierarchy which prioritizes the inputs to valuation techniques used to measure fair value. This hierarchy increases the consistency and comparability of fair value measurements and related disclosures by maximizing the use of observable inputs and minimizing the use of unobservable inputs by requiring that observable inputs be used when available. Observable inputs are inputs that reflect the assumptions market participants would use in pricing the assets or liabilities based on market data obtained from sources independent of the Company. Unobservable inputs are inputs that reflect the Company’s own assumptions about the assumptions market participants would use in pricing the asset or liability developed based on the best information available in the circumstances. The hierarchy prioritizes the inputs into three broad levels based on the reliability of the inputs as follows:
| - 24 - |
| · | Level 1 – Inputs are quoted prices in active markets for identical assets or liabilities that the Company has the ability to access at the measurement date. Valuation of these instruments does not require a high degree of judgment as the valuations are based on quoted prices in active markets that are readily and regularly available. |
| · | Level 2 – Inputs other than quoted prices in active markets that are either directly or indirectly observable as of the measurement date, such as quoted prices for similar assets or liabilities; quoted prices in markets that are not active; or other inputs that are observable or can be corroborated by observable market data for substantially the full term of the assets or liabilities. |
| · | Level 3 – Valuations based on inputs that are unobservable and not corroborated by market data. The fair value for such assets and liabilities is generally determined using pricing models, discounted cash flow methodologies, or similar techniques that incorporate the assumptions a market participant would use in pricing the asset or liability. |
This guidance applies to other accounting pronouncements that require or permit fair value measurements. On February 12, 2008, the FASB finalized FASB Staff Position (FSP) No. 157-2, Effective Date of FASB Statement No. 157 (ASC 820). This Staff Position delays the effective date of SFAS No. 157 (ASC 820) for nonfinancial assets and liabilities to fiscal years beginning after November 15, 2008 and interim periods within those fiscal years, except for those items that are recognized or disclosed at fair value in the financial statements on a recurring basis (at least annually). The adoption of SFAS No. 157 (ASC 820) had no effect on the Company's financial position or results of operations for the year ended December 31, 2014.
We also analyze all financial instruments with features of both liabilities and equity under ASC 480-10 (formerly SFAS 150, “Accounting for Certain Financial Instruments with Characteristics of Both Liabilities and Equity”) and ASC 815-40 (formerly EITF 00-19, “Accounting for Derivative Financial Instruments Indexed to, and Potentially Settled in, a Company’s Own Stock”). We have determined ASC 480-10 (formerly SFAS 150) and ASC 815-40 (formerly EITF 00-19) had no material effect on our financial position or results of operations for the year ended December 31, 2014.
Revenue recognition
The Company’s revenue recognition policies are in compliance with the SEC Staff Accounting Bulletin No. 104 (“SAB 104”). The Company recognizes product revenue when the following fundamental criteria are met: (i) persuasive evidence of an arrangement exists, (ii) delivery has occurred, (iii) our price to the customer is fixed or determinable and (iv)collection of the resulting accounts receivable is reasonably assured. The Company recognizes revenue for product sales upon transfer of title to the customer. Customer purchase orders and/or contracts are generally used to determine the existence of an arrangement. Shipping documents and the completion of any customer acceptance requirements, when applicable, are used to verify product delivery or that services have been rendered. The Company assesses whether a price is fixed or determinable based upon the payment terms associated with the transaction and whether the sales price is subject to refund or adjustment.
The Company’s revenue is recognized net of value-added tax (VAT), reductions to revenue for estimated product returns, and sales discounts based on volume achieved in the same period that the related revenue is recorded. The estimates are based on historical sales returns, analysis of credit memo data and other factors known at the time. The sales discounts for the years ended December 31, 2014 and 2013 were not material.
We offer a right of exchange on our grain products sold through our relationships with grocery store networks. The consumer who purchases the product may exchange it for the same kind and quantity of product originally purchased. In accordance with FASB ASC 605-15-25-1 and 605-15-15-2, these are not considered returns for revenue recognition purposes. The returns of our products for the year ended December 31, 2014 and 2013 were not material.
| - 25 - |
Advertising costs
The Company expenses the cost of advertising as incurred or, as appropriate, the first time the advertising takes place. Advertising costs for the year ended December 31, 2014 and 2013 were $423,498 and $298,040, respectively.
Research and development
The Company expenses its research and development costs as incurred. Research and development expenses for the year ended December 31, 2014 and 2013 were not material.
Stock-based compensation
In December 2004, the Financial Accounting Standard Board, or the FASB, issued the Statement of Financial Accounting Standards, or SFAS, No. 123(R), “Share-Based Payment”, which replaces SFAS No. 123 and supersedes APB Opinion No. 25. SFAS No. 123(R) is now included in the FASB’s ASC Topic 718, “Compensation – Stock Compensation.” Under SFAS No. 123(R), companies are required to measure the compensation costs of share-based compensation arrangements based on the grant-date fair value and recognize the costs in the financial statements over the period during which employees or independent contractors are required to provide services. Share-based compensation arrangements include stock options and warrants, restricted share plans, performance-based awards, share appreciation rights and employee share purchase plans. In March 2005, the SEC issued Staff Accounting Bulletin No. 107, or SAB 107, which expresses views of the staff regarding the interaction between SFAS No. 123(R) and certain SEC rules and regulations and provides the staff’s views regarding the valuation of share-based payment arrangements for public companies. SFAS No. 123(R) permits public companies to adopt its requirements using one of two methods. On April 14, 2005, the SEC adopted a new rule amending the compliance dates for SFAS No. 123(R). Companies may elect to apply this statement either prospectively, or on a modified version of retrospective application under which financial statements for prior periods are adjusted on a basis consistent with the pro forma disclosures required for those periods under SFAS No. 123.
The Company has fully adopted the provisions of FASB ASC 718 and related interpretations as provided by SAB 107. As such, compensation cost is measured on the date of grant as the fair value of the share-based payments. Such compensation amounts, if any, are amortized over the respective vesting periods of the option grant.
Income taxes
The Company accounts for income taxes in accordance with FASB ASC Topic 740, “Income Taxes.” ASC 740 requires a company to use the asset and liability method of accounting for income taxes, whereby deferred tax assets are recognized for deductible temporary differences, and deferred tax liabilities are recognized for taxable temporary differences. Temporary differences are the differences between the reported amounts of assets and liabilities and their tax bases. Deferred tax assets are reduced by a valuation allowance when, in the opinion of management, it is more likely than not that some portion, or all of, the deferred tax assets will not be realized. Deferred tax assets and liabilities are adjusted for the effects of changes in tax laws and rates on the date of enactment.
Under ASC 740, a tax position is recognized as a benefit only if it is “more likely than not” that the tax position would be sustained in a tax examination, with a tax examination being presumed to occur. The amount recognized is the largest amount of tax benefit that is greater than 50% likely of being realized on examination. For tax positions not meeting the “more likely than not” test, no tax benefit is recorded. The adoption had no material effect on the Company’s consolidated financial statements for the year ended December 31, 2014.
Foreign currency translation and comprehensive income
U.S. GAAP requires that recognized revenue, expenses, gains, and losses be included in net income. Certain statements, however, require entities to report specific changes in assets and liabilities, such as gain or loss on foreign currency translation, as a separate component of the equity section of the balance sheet. Such items, along with net income, are components of comprehensive income. The functional currency of the Company is RMB. The unit of RMB is in Yuan. Translation gains are classified as an item of other comprehensive income in the stockholders’ equity section of the consolidated balance sheet.
| - 26 - |
Statement of cash flows
In accordance with FASB ASC Topic 230, “Statement of Cash Flows,” cash flows from the Company’s operations are calculated based upon the local currencies. As a result, amounts related to assets and liabilities reported on the consolidated statement of cash flows will not necessarily agree with changes in the corresponding balances on the consolidated balance sheets.
Recent pronouncements
In July 2012, FASB issued an amendment (ASU No. 2012-02) to Intangibles–Goodwill and Other (ASC Topic 350). In accordance with the amendments in this update, an entity has the option first to assess qualitative factors to determine whether the existence of events and circumstances indicates that it is more likely than not that the indefinite-lived intangible asset is impaired. If, after assessing the totality of events and circumstances, an entity concludes that it is not more likely than not that the indefinite-lived intangible asset is impaired, then the entity is not required to take further action. However, if an entity concludes otherwise, then it is required to determine the fair value of the indefinite-lived intangible asset and perform the quantitative impairment test by comparing the fair value with the carrying amount in accordance with Subtopic 350-30. An entity also has the option to bypass the qualitative assessment for any indefinite-lived intangible asset in any period and proceed directly to performing the quantitative impairment test. An entity will be able to resume performing the qualitative assessment in any subsequent period. The amendments are effective for annual and interim impairment tests performed for fiscal years beginning after September 15, 2012, with early adoption permitted. The adoption of this guidance had no material impact on our consolidated financial position or results of operations for the year ended December 31, 2014.
In February 2013, the FASB issued ASU 2013-02, “Comprehensive Income (Topic 220): Reporting of Amounts Reclassified out of Accumulated Other Comprehensive Income.” This ASU does not change the current requirements for reporting net income or other comprehensive income in financial statements. However, this guidance requires an entity to provide information about the amounts reclassified out of accumulated other comprehensive income by component. In addition, an entity is required to present, either on the face of the statement where net income is presented or in the notes, significant amounts reclassified out of accumulated other comprehensive income by the respective line items of net income but only if the amount reclassified is required under U.S. GAAP to be reclassified to net income in its entirety in the same reporting period. For other amounts that are not required under U.S. GAAP to be reclassified in their entirety to net income, an entity is required to cross-reference to other disclosures required under U.S. GAAP that provide additional detail about those amounts. For public entities, the guidance is effective prospectively for reporting periods beginning after December 15, 2012. For nonpublic entities, the guidance is effective prospectively for reporting periods beginning after December 15, 2013. Early adoption is permitted. The adoption of this standard is not expected to have a material impact on the Company’s consolidated financial position and results of operations.
In July 2013, the FASB issued ASU 2013-11, “Income Taxes (Topic 740): Presentation of an Unrecognized Tax Benefit When a Net Operating Loss Carryforward, a Similar Tax Loss, or a Tax Credit Carryforward Exists.” An unrecognized tax benefit, or a portion of an unrecognized tax benefit, should be presented in the financial statements as a reduction to a deferred tax asset. To the extent a net operating loss carryforward, a similar tax loss, or a tax credit carryforward is not available at the reporting date under the tax law of the applicable jurisdiction to settle any additional income taxes that would result from the disallowance of a tax position or the tax law of the applicable jurisdiction does not require the entity to use, and the entity does not intend to use, the deferred tax asset for such purpose, the unrecognized tax benefit should be presented in the financial statements as a liability and should not be combined with deferred tax assets. The assessment of whether a deferred tax asset is available is based on the unrecognized tax benefit and deferred tax asset that exist at the reporting date and should be made presuming disallowance of the tax position at the reporting date. For public entities, the guidance is effective prospectively for reporting periods beginning after December 15, 2013. For nonpublic entities, the guidance is effective prospectively for reporting periods beginning after December 15, 2014. Early adoption is permitted. The adoption of this standard is not expected to have a material impact on the Company’s consolidated financial position and results of operations.
| - 27 - |
In December 2013, the FASB issued ASU 2013-12, “Definition of a Public Business Entity”. The Board has decided that it should proactively determine which entities would be within the scope of the Private Company Decision-Making Framework: A Guide for Evaluating Financial Accounting and Reporting for Private Companies (Guide). This will aim to minimize the inconsistency and complexity of having multiple definitions of, or a diversity in practice as to what constitutes, a nonpublic entity and public entity within U.S. generally accepted accounting principles (GAAP) on a going-forward basis. This Update addresses those issues by defining public business entity. The Accounting Standards Codification includes multiple definitions of the terms nonpublic entity and public entity. The amendment in this Update improves U.S. GAAP by providing a single definition of public business entity for use in future financial accounting and reporting guidance. The amendment does not affect existing requirements. There is no actual effective date for the amendment in this Update. However, the term public business entity will be used in Accounting Standards Updates which are the first Updates that will use the term public business entity. The adoption of this standard is not expected to have a material impact on the Company’s consolidated financial position and results of operations.
In May 2014, the FASB issued ASU 2014-9, “Revenue from Contracts with Customers”. The core principle of the guidance is that an entity should recognize revenue to depict the transfer of promised goods or services to customers in an amount that reflects the consideration to which the entity expects to be entitled in exchange for those goods or services. An entity should disclose sufficient information to enable users of financial statements to understand the nature, amount, timing, and uncertainty of revenue and cash flows arising from contracts with customers. For a public entity, the amendments in this Update are effective for annual reporting periods beginning after December 15, 2016, including interim periods within that reporting period. Early application is not permitted. The adoption of this standard is not expected to have a material impact on the Company’s consolidated financial position and results of operations.
In August 2014, the FASB issued ASU 2014-15, “Presentation of Financial Statements—Going Concern (Subtopic 205-40)”. In connection with preparing financial statements for each annual and interim reporting period, an entity’s management should evaluate whether there are conditions or events, considered in the aggregate, that raise substantial doubt about the entity’s ability to continue as a going concern within one year after the date that the financial statements are issued (or within one year after the date that the financial statements are available to be issued when applicable). The amendments in this Update are effective for the annual period ending after December 15, 2016, and for annual periods and interim periods thereafter. Early application is permitted. The adoption of this standard is not expected to have a material impact on the Company’s consolidated financial position and results of operations.
Jumpstart Our Business Startups Act of 2012 (the “JOBS Act”)
The JOBS Act permits an “emerging growth company” such as us to take advantage of an extended transition period to comply with new or revised accounting standards applicable to public companies. We are choosing to “opt out” of this provision and, as a result, we will comply with new or revised accounting standards as required when they are adopted. This decision to opt out of the extended transition period under the JOBS Act is irrevocable.
ITEM 7A. Quantitative and Qualitative Disclosures About Market Risk
We are a “smaller reporting company” and as such, are not required to provide this information.
ITEM 8. Financial Statements and Supplementary Data.
Reference is made to the “F” pages herein comprising a portion of this Annual Report.
ITEM 9. Changes in and Disagreements with Accountants on Accounting and Financial Disclosures
None.
Item 9A. Controls and Procedures
Evaluation of Disclosure Controls and Procedures
Under the supervision and with the participation of our management, including our principal executive officer and principal financial officer, we conducted an evaluation of the effectiveness of the design and operation of our disclosure controls and procedures, as defined in Rule 13a-15(e) under the Exchange Act. Based on this evaluation, our management, including our principal executive officer and our principal financial officer, concluded that our disclosure controls and procedures were effective as of the period covered by this Annual Report, to ensure that information required to be disclosed by us in the reports filed or submitted by us under the Exchange Act (i) is recorded, processed, summarized and reported within the time period specified in SEC rules and forms, and (ii) is accumulated and communicated to our management, including our principal executive officer and our principal financial officer, as appropriate to allow appropriate decisions on a timely basis regarding required disclosure.
Management’s Annual Report on Internal Control over Financial Reporting
Management is responsible for establishing and maintaining adequate internal control structure and procedures over financial reporting (as defined in Rules 13a-15(f) and 15d-15(f)) under the Exchange Act. Our management conducted an assessment of the effectiveness of our internal control over financial reporting as of the fiscal year ended December 31, 2014 based on the framework similarly set forth in Internal Control — Integrated Framework issued by the Committee of Sponsoring Organizations of the Treadway Commission.
| - 28 - |
Internal control over financial reporting cannot provide absolute assurance of achieving financial reporting objectives because of its inherent limitations. Internal control over financial reporting is a process that involves human diligence and compliance and is subject to lapses in judgment and breakdowns resulting from human failures. Because of such limitations, there is a risk that material misstatements may not be prevented or detected on a timely basis by internal control over financial reporting. Also, projections of any evaluation of effectiveness to future periods are subject to the risk that controls may become inadequate because of changes in conditions, or that the degree of compliance with the policies or procedures may deteriorate.
Based on that evaluation, our principal executive officer and principal financial officer concluded that our internal control over financial reporting as of December 31, 2014 was effective.
This Annual Report does not include an attestation report of the Company’s registered public accounting firm regarding internal control over financial reporting. Management’s report was not subject to attestation by the Company’s registered public accounting firm pursuant to the permanent exemption rules for smaller reporting companies, which require the Company to provide only management’s report in this Annual Report.
Changes in Internal Control over Financial Reporting
There were no changes in our internal control over financial reporting that occurred during our last fiscal quarter that have materially affected, or are reasonably likely to materially affect, our internal control over financial reporting. However, continuing to strengthening and improving the Company’s internal and financial controls will remain one of the top priorities for our management.
The Company intends to continue to conduct periodical reviews and take measures to further strengthen the Company’s, including subsidiaries, resources sharing, strategic planning and management of funds.
None.
ITEM 10. Directors, Executive Officers and Corporate Governance
Provided below is a list of the names, ages and positions of all our directors and executive officers as of the date of this filing.
| Name | Age | Position | ||
| Hong Wang | 40 | Acting Chief Executive Officer, Chairman of the Board of Directors. | ||
| Emma Wan | 46 | Acting Financial Officer and Corporate Secretary | ||
| Al Carmona | 56 | Independent Director and member of Audit Committee | ||
| Timothy Stevens | 63 | Independent Director and Chairman of Audit Committee | ||
| Xinli Li | 50 | Independent Director and member of the Audit Committee |
Provided below is a list of the names, ages and positions of certain of our significant employees:
| Name | Age | Position | ||
| YongqingRen | 33 | Vice President for the Corn Division | ||
| Yunlin Ding | 42 | Vice President |
| - 29 - |
Family Relationships
There is no family relationship between any of the officers, directors and significant employees of the Company.
Election of Directors and Officers
All directors hold office until the next annual meeting of shareholders and until their successors have been duly elected and qualified. Officers are elected by and serve at the discretion of the Board.
Our directors are reimbursed for expenses incurred by them in connection with attending Board meetings, but they do not receive any other compensation for serving on the Board.
Biographies of Officers and Directors
Mr. Hong Wang, Acting Chief Executive Officer, Director and Chairman of the Board of Directors
Effective as of March 31, 2014, the Company appointed Mr. Wang to serve as Acting Chief Executive Officer following the resignation of Greg Chen as Chief Executive Officer. Mr. Wang was appointed to serve as a director and subsequently as Chairman of the Board of Directors of the Company effective April 30, 2012 and August 16, 2013, respectively. Mr. Wang has served as Vice President of Detian Yu since October 2009. Prior to that, Mr. Wang served as General Manager of Shanxi Dongsheng Guarantee Company Limited from February 2009 through October 2009. Prior to that, Mr. Wang worked for the Labor Bureau of Jinzhong in Shanxi Province from July 1996 through January 2009. Mr. Wang received his bachelor's degree from the Chinese Agriculture University in 1996.
Ms. Emma Wan, Acting Financial Officer and Corporate Secretary
Effective August 11, 2014 the Company appointed Ms. Wan to serve as Acting Financial Officer and Effective June 30, 2012, the Company appointed Ms. Wan to serve as the Company’s Corporate Secretary. Since July 2011, Ms. Wan has served as Corporate Controller for the Company. From July 2009 through December 2010, Ms. Wan served as Associate Director of KTO Corporate Finance Co. Ltd., a Hong Kong company. From August 2004 through June 2009, Ms. Wan served as M&A Transaction Service Manager of Deloitte & Touche Financial Advisory Services Limited, Guangzhou Branch in China. From August 2003 through September 2004 Ms. Wan served as audit senior associate of Deloitte Touche Tohmatsu CPA Ltd., Shenzhen Branch in China. Ms. Wan is a fellow of the Association of Chartered Certified Accountants and a member of The Chinese Institution of Certified Public Accountants.
| - 30 - |
Mr. Al Carmona, Independent Director and Member of Audit Committee
Mr. Carmona is an independent director of the Company effective August 19, 2010. During the last 25 years, Mr. Carmona has been with Mars & Co, a high end international strategy consulting firm, during which he served as Executive Vice President and Senior Advisor and has coordinated their Global Business Development Council. With the assistance of Mr. Carmona, Mars & Co. grew to over 250 professionals worldwide. Mr. Carmona has deep experience in a wide variety of areas including cost and supply chain optimization, brand strategy, pricing and demand building optimization, competitive analysis, portfolio optimization, business unit turnarounds, as well as acquisition and divestiture analysis. Mr. Carmona has a Bachelor of Science degree in Chemical Engineering from Princeton University and a MBA degree from the Wharton Business School, University of Pennsylvania.
Mr. Timothy C. Stevens, Independent Director and Chairman of Audit Committee
Mr. Stevens is an independent director of the Company effective August 19, 2010. Mr. Stevens has over 30 years of executive leadership, management, and client service experience with the world’s leading law, public accounting, and management consulting firms. Since January 2011 until recently, Mr. Stevens served as the Regional Chief Operating Officer, Asia of Simmons & Simmons, an international law firm. Prior to that since 2004, Mr. Stevens served as the Executive Director of Saul Ewing LLP, a Philadelphia law firm where he oversaw all aspects of its day to day business operations with a focus on improving the bottom line and supporting the Firm’s growth strategy and other key objectives. From 1999 to 2003, he served as the Chief Operating Officer and a member of the Management Committee in the Hong Kong and China offices of the international law firm Baker & McKenzie where he was responsible for all operations (other than client service) for Baker & McKenzie’s large Hong Kong and China practice. From 1995 to 1998, Mr. Stevens served in the Chairman’s office as the Finance and Administrative Partner of PricewaterhouseCoopers China, one of the world’s largest auditing firms, where he supervised the business plans, office openings and expansions as well as the financial management of the firm. Mr. Stevens graduated from Clifton College and Bristol University in the United Kingdom. He received the ACA qualification from the UK Chartered Accountants’ Qualification Program in 1974. Mr. Stevens is a licensed CPA in Massachusetts as well as being a Hong Kong FCPA.
Mr. Xinli Li, Independent Director and Member of Audit Committee
Mr. Li is an independent director of the Company effective August 16, 2013. Since September 2011, Mr. Li, age 48, has served as a researcher with the Culture Industry Research Institute at Shenzhen University. Prior to such position, Mr. Li served as the Head of the Department of Advertising and as Associate Professor, at Shenzhen University beginning in November 2004. Also, from June 1995 until October 2004, Mr. Li served as Lecturer in the Department of Advertising at Shenzhen University. Mr. Li earned his Bachelor of Science degree from Huazhong Normal University, and his Masters Degree in Tourism Economics from Nankai University.
| - 31 - |
Mr. YongqingRen, Vice President for the Corn Division
Mr. Ren has been the Vice President and General Manager of our Corn Division since April 2004. He was conferred the honorable title of Industrial Restructuring Leader for two consecutive years and the prize of Top Ten Youth Career Development Contributor by the Yuci Municipal Government. Mr. Ren is the holder of an undergraduate degree. He is well experienced in corn breeding, cultivation, processing, marketing and management.
Mr. Yunlin Ding, Vice President
Effective February 3, 2012, the Company appointed Mr. Yunlin Ding to serve as Vice President of Company. Immediately prior to Mr. Ding’s appointment as the Company’s Vice President, he served as Vice President of Detian Yu since July 2009. Mr. Ding also served as vice general manager of the investment department of BeidaQingniao Group, a company organized under the laws of China and the holding company for three companies listed in China and two companies listed in Hong Kong, from February 2002 to July 2009. Mr. Ding earned a Bachelor’s Degree and a Master’s Degree in Economics from Nankai University in 1996 and 1999, respectively.
Director Qualifications and Experience
The Board considers various characteristics, such as experience, qualifications, attributes and skills, in making its decision to appoint and nominate directors to the Board.
Mr. Carmona has the experience, qualifications, attributes and skills to qualify him to serve as a director. His past work experience working with companies to optimize their operations and maximize profits gives us the confidence that he will be an asset to our Board of Directors. Because of this experience, we expect that he will act in the best interest of the Company.
Mr. Li has the experience, qualifications, attributes and skills to qualify him to serve as a director. His past experience in research and as the head of the Department of Advertising at Shenzhen University will be an asset to the Company. Because of this experience, we expect that he will act in the best interest of the Company.
Mr. Stevens has the experience, qualifications, attributes and skills to qualify him to serve as a director. His past work experience overseeing the world’s leading law, public accounting and management consulting firms will be an asset to us and he will be in a strong position to oversee our operations and corporate governance. Mr. Stevens has financial management expertise, he is a certified public accountant (Massachusetts) and he is a chartered accountant (England and Wales). Because of this experience, we expect that he will act in the best interest of the Company.
Mr. Wang has the experience, qualifications, attributes and skills to qualify him to serve as a director. His experience in agriculture business and industry will be an asset to us and good for us in building public relationship with farmers, local governments and financial institution. Because of this experience, we expect that he will act in the best interest of the Company.
| - 32 - |
Legal Proceedings
Unless otherwise indicated, to the knowledge of the Company after reasonable inquiry, no current director or executive officer of the Company during the past ten years, has (i) been convicted in a criminal proceeding (excluding traffic violations or other minor offenses), (ii) been a party to any judicial or administrative proceeding (except for any matters that were dismissed without sanction or settlement) that resulted in a judgment, decree or final order enjoining the person from future violations of, or prohibiting activities subject to, U.S. federal or state securities laws, or a finding of any violation of U.S. federal or state securities laws, (iii) filed a petition under federal bankruptcy laws or any state insolvency laws or has had a receiver appointed for the person’s property or (iv) been subject to any judgment, decree or final order enjoining, suspending or otherwise limiting for more than 60 days, the person from engaging in any type of business practice , acting as a futures commission merchant, introducing broker, commodity trading advisor, commodity pool operator, floor broker, leverage transaction merchant, any other person regulated by the Commodity Futures Trading Commission, or an associated person of any of the foregoing, or as an investment adviser, underwriter, broker or dealer in securities, or as an affiliated person, director or employee of any investment company, bank, savings and loan association or insurance company, or engaging in or continuing any conduct or practice in connection with such activity or engaging in any activity in connection with the purchase or sale of any security or commodity or in connection with any violation of Federal or State securities laws or Federal commodities laws, (v) been found by a court of competent jurisdiction in a civil action or by the Commission to have violated any Federal or State securities law, and the judgment in such civil action or finding by the Commission has not been subsequently reversed, suspended, or vacated, (vi) been found by a court of competent jurisdiction in a civil action or by the Commodity Futures Trading Commission to have violated any Federal commodities law, and the judgment in such civil action or finding by the Commodity Futures Trading Commission has not been subsequently reversed, suspended or vacated, (vii) been the subject of, or a party to, any Federal or State judicial or administrative order, judgment, decree, or finding, not subsequently reversed, suspended or vacated, relating to an alleged violation of: (a) any Federal or State securities or commodities law or regulation, (b) any law or regulation respecting financial institutions or insurance companies including, but not limited to, a temporary or permanent injunction, order of disgorgement or restitution, civil money penalty or temporary or permanent cease-and-desist order, or removal or prohibition order, or (c) any law or regulation prohibiting mail or wire fraud or fraud in connection with any business entity, or (viii) been the subject of, or a party to, any sanction or order, not subsequently reversed, suspended or vacated, of any self-regulatory organization (as defined in Section 3(a)(26) of the Exchange Act (15 U.S.C. 78c(a)(26))), any registered entity (as defined in Section 1(a)(29) of the Commodity Exchange Act (7 U.S.C. 1(a)(29))), or any equivalent exchange, association, entity or organization that has disciplinary authority over its members or persons associated with a member.
There are no material pending legal proceedings to which any of the individuals listed above is party adverse to us or any of our subsidiaries or has a material interest adverse to us or any of our subsidiaries.
CORPORATE GOVERNANCE
Director Independence and Board Committees
Director Independence
Our stock is currently quoted on the OTCBB and the OTC Markets (OTCQB). Neither the OTCBB nor the OTC Markets have rules regarding director independence. Accordingly, although our audit committee charter states that each member shall meet the independence requirements set out by the applicable listing standards of the securities exchange, securities association, SRO, or stock market on which the Company’s securities are quoted or listed for trading, we determined that the NASDAQ Marketplace independence requirements were an appropriate standard to determine independence because these requirements are stricter than the requirements of the OTCBB and the OTC Markets. Additionally, we adopted these stricter standards to strengthen our corporate governance and improve internal controls.
Subject to certain exceptions, under the listing standards of the NASDAQ Marketplace, a listed company’s board of directors must consist of a majority of independent directors. Currently, our board of directors has determined that each of the non-management directors, Al Carmona, Timothy Stevens and Xinli Li, are “independent” directors as defined by the listing standards of NASDAQ currently in effect and approved by the U.S. Securities and Exchange Commission and all applicable rules and regulations. All members of the Audit Committee satisfy the “independence” standards applicable to members of such committee. The board of directors made this affirmative determination regarding these directors’ independence based on discussions with the directors and on its review of the directors’ responses to a standard questionnaire regarding employment and compensation history; affiliations, family and other relationships; and transactions with the Company. The board of directors considered relationships and transactions between each director or any member of his immediate family and the Company and its subsidiaries and affiliates. The purpose of the board of director’s review with respect to each director was to determine whether any such relationships or transactions were inconsistent with a determination that the director is independent under the NASDAQ rules.
| - 33 - |
Audit Committee
On August 19, 2010, we established our Audit Committee. The Audit Committee consists of Timothy Stevens, Al Carmona and Xinli Li, each of whom is an independent director. Timothy Stevens, Chairman of the Audit Committee is each deemed an “audit committee financial expert” as defined under Item 407(d) of Regulation S-K. The purpose of the Audit Committee is to represent and assist our board of directors in its general oversight of our accounting and financial reporting processes, audits of the financial statements and internal control and audit functions. The Audit Committee’s responsibilities include:
| · | The appointment, replacement, compensation, and oversight of work of the independent auditor, including resolution of disagreements between management and the independent auditor regarding financial reporting, for the purpose of preparing or issuing an audit report or performing other audit, review or attest services; and |
| · | Reviewing and discussing with management and the independent auditor various topics and events that may have significant financial impact on our company or that are the subject of discussions between management and the independent auditors. |
The board of directors has adopted a written charter for the Audit Committee. During the fiscal year ended December 31, 2014, the Audit Committee met 5 times.
Procedures for Determining Executive Compensation
On August 19, 2010, our Board of Directors approved the adoption of independent director oversight of executive officer compensation. Hereby all matters regarding executive officer compensation shall be submitted for approval or recommendation by a majority of our independent directors.
Procedures for Selection of Director Nominees
On August 19, 2010, the Board of Directors of the Company approved the adoption of the procedures for the selection of director nominees. Hereby a majority of our independent directors shall recommend and select director nominees.
Section 16(a) Beneficial Ownership Reporting Compliance
Section 16(a) of the Exchange Act requires our officers and directors, and persons who own more than 10% of a registered class of our equity securities, to file reports of ownership and changes in ownership with the SEC. Officers, directors and greater than ten percent shareholders are required by SEC regulation to furnish us with copies of all Section 16(a) forms they file.
To the Company’s knowledge, based solely on a review of the copies of such reports furnished to the Company during its most recent fiscal year, all reports under Section 16(a) required to be filed by its officers and directors and greater than 10% beneficial owners were filed as of the date of this filing.
Code of Ethics
On August 19, 2010, our Board of Directors adopted a Code of Conduct applicable to all directors, officers and employees. A copy of such Code of Conduct is referenced as Exhibit 14.1 herein.
| - 34 - |
ITEM 11. Executive Compensation
The following table sets forth all cash compensation paid by us, as well as certain other compensation paid or accrued, in 2013 and 2014, to each of the following named executive officers:
| Stock and Option | All Other | |||||||||||||||||||||||
| Fiscal | Salary | Bonus | Awards | Compensation | Total | |||||||||||||||||||
| Name and Principal Position | Year | ($) | ($) | number | ($) | ($) | ||||||||||||||||||
| Wang Hong (1) | 2014 | 19,474 | - | - | - | 19,474 | ||||||||||||||||||
| (Acting Chief Executive Officer and President) | 2013 | 19,519 | - | - | 19,519 | |||||||||||||||||||
| Greg Chen (2) | 2014 | 32,308 | - | - | - | 32,308 | ||||||||||||||||||
| (Former Chief Executive Officer and Former President) | 2013 | 73,846 | - | - | 10,578 | 84,424 | ||||||||||||||||||
| Amy He (3) | 2014 | 10,805 | 153,197 | 164,002 | ||||||||||||||||||||
| (Former Chief Financial Officer) | 2013 | 15,615 | - | - | 116,139 | 131,754 | ||||||||||||||||||
| Jan Poulsen (4) | 2014 | 32,308 | - | - | - | 32,308 | ||||||||||||||||||
| (Former President) | 2013 | 73,846 | - | - | 3,003 | 76,849 | ||||||||||||||||||
| Jianbin Zhou (5) | 2014 | - | - | - | - | - | ||||||||||||||||||
| (Fomer Chief Operating Officer} | 2013 | 14,639 | - | - | - | 14,639 | ||||||||||||||||||
| Emma Wan (6) | 2014 | 10,370 | 97,371 | 107,741 | ||||||||||||||||||||
| (Acting Chief Financial Officer, Corporate Secretary) | 2013 | 9,760 | - | - | 97,596 | 107,356 | ||||||||||||||||||
| Junde Zhang (7)(9) | 2014 | - | - | - | - | - | ||||||||||||||||||
| (Former Vice President of the Grains Division) | 2013 | 6,832 | - | - | - | 6,832 | ||||||||||||||||||
| Yongqing Ren (8)(9) | 2014 | 6,856 | 6,856 | |||||||||||||||||||||
| (Vice President of the Corn Division) | 2013 | 6,832 | - | - | - | 6,832 | ||||||||||||||||||
| Yunling Ding (8)(9) | 2014 | - | 67,673 | 67,673 | ||||||||||||||||||||
| (Vice President) | 2013 | 1,952 | - | - | 73,197 | 75,149 | ||||||||||||||||||
| - 35 - |
(1) Effective April 1, 2014, Mr. Wang Hong was appointed as Acting Chief Executive Officer of the Company.
(2) Effective April 15, 2013, the Board accepted the amicable resignation of Mr. Chen as President and appointed him as Chief Executive Officer of the Company. Effective March 31, 2014, Mr. Chen resigned as Chief Executive Officer of the Company.
(3) Effective as of August 11, 2014, Amy He resigned from her position as Chief Financial Officer of the Company.
(4) Effective March 31, 2014, Mr. Poulsen resigned as President of the Company.
(5) Effective October 16, 2013, the Board accepted the amicable resignation of Mr. Jianbin Zhou as Chief Operation Officer of the Company.
(6) Effective August 11, 2014, Ms. Emma Wan was appointed to serve as Acting Financial Officer of the Company.
(7) Effective February 28, 2014, Mr. Junde Zhang resigned as the Company’s Vice President.
(8) Effective February 3, 2012, Mr. Yunlin Ding was appointed to serve the Company’s Vice President.
(9) Based on the compensation received by Mr. Junde Zhang, Mr. YongqingRen and Mr. Yunlin Ding, they are qualified as executive officers for purposes of this table.
Outstanding Equity Awards at the End of the Fiscal Year
The following table summarizes the number of securities underlying outstanding plan awards for each named executive officer as of December 31, 2014:
| Option Awards | Stock Awards | |||||||||||||||||||||||||||||||||||
| Number
of Securities Underlying Unexercised Options (#) | Number
of Securities Underlying Unexercised Options (#) | Equity
Incentive Plan Awards:Number of Securities Underlying Unearned Options (#) | Option Exercise Price ($) | Option Expiration Date | Number
of Shares or Units of Stock That Have Not Vested (#) | Market Value of Shares or Units of Stock That Have Not Vested ($) | Equity Incentive Plan Awards: Number of Unearned Shares, Units or Other Rights That Have Not Vested (#) | Equity Incentive Plan Awards: Market or Payout Value of Unearned Shares, Units or Other Rights That Have Not Vested ($) | ||||||||||||||||||||||||||||
| Name | Batch | Exercisable | Unexercisable | — | — | — | — | — | — | — | ||||||||||||||||||||||||||
| Emma Wan | #2 | 40,000 | - | - | $ | 1.45 | 8-Mar-22 | - | - | - | - | |||||||||||||||||||||||||
| Yongqing Ren | #1 | 40,000 | - | - | $ | 4.40 | 5-Nov-20 | - | - | - | - | |||||||||||||||||||||||||
| Yunling Ding | #1 | 15,000 | - | - | $ | 4.40 | 5-Nov-20 | - | - | - | - | |||||||||||||||||||||||||
| #2 | 40,000 | - | - | $ | 1.45 | 8-Mar-22 | - | - | - | - | ||||||||||||||||||||||||||
| - 36 - |
Option Exercises and Stock Vested
None.
Director Compensation
Our directors are reimbursed for expenses incurred by them in connection with attending Board meetings. The following table presents compensation distributed to our directors during the year ended December 31, 2014 and 2013 for serving on the Board of Directors:
| Fees Earned or Paid in Cash | Option Awards (1) | All Other | Total | |||||||||||||
| ($) | ($) | Compensation ($) | ($) | |||||||||||||
| 2014 | ||||||||||||||||
| Al Carmona | $ | 48,000 | $ | - | $ | - | $ | 48,000 | ||||||||
| Hong Wang | 19,474 | - | - | 19,474 | ||||||||||||
| Timothy Stevens | 48,000 | - | - | 48,000 | ||||||||||||
| Xinli Li (1) | 3,246 | - | - | 3,246 | ||||||||||||
| Jan Poulsen (2) | 32,308 | - | - | 32,308 | ||||||||||||
| Longjiang Yuan (1) | - | - | - | - | ||||||||||||
| $ | 151,028 | $ | - | $ | - | $ | 151,028 | |||||||||
| 2013 | ||||||||||||||||
| Al Carmona | $ | 48,000 | $ | - | $ | - | $ | 48,000 | ||||||||
| Hong Wang | 19,519 | - | - | 19,519 | ||||||||||||
| Timothy Stevens | 48,000 | - | - | 48,000 | ||||||||||||
| Xinli Li (1) | 1,627 | - | - | 1,627 | ||||||||||||
| Jan Poulsen (2) | 20,000 | - | - | 20,000 | ||||||||||||
| Longjiang Yuan (1) | 8,133 | - | - | 8,133 | ||||||||||||
| $ | 145,279 | $ | 0 | $ | - | $ | 145,279 | |||||||||
| (1) | Mr. Xinli Li replaced Mr. Longjiang Yuan as independent director of the Company on August 16, 2013. |
| (2) | Mr. Jan Poulsen resigned as director of the Company on April 15, 2013. |
Bonuses and Deferred Compensation
We do not have any bonus, deferred compensation or retirement plan. All decisions regarding compensation are determined by our Board of Directors.
Options and Stock Appreciation Rights
On November 4, 2010, the Company’s Board of Directors approved the Company’s 2010 Share Incentive Plan. On November 8, 2010, a total of 931,000 non-qualified incentive stock options were approved by our Board of Directors and granted under the Plan to executives, key employees, independent directors, and consultants at an exercise price of $4.40 per share and on December 15, 2010, 40,000 non-qualified incentive stock shares were approved by our Board of Directors and granted under the Plan to a consultant at an exercise price of $4.40 per share, all of which have vested.
On March 8, 2012, the Company’s Board of Directors increased the number of shares allocated to and authorized for use under the Plan from 1,000,000 shares to the maximum number of shares allowable pursuant to the terms of the Plan and granted 420,000 options under the Plan to independent directors, officers and key employees of the Company, of which included some new options and those re-granted after such options were forfeited by other former employees as a result of their resignations from the Company in accordance with the terms of their option agreements. All of the granted options have vested.
On November 23, 2012, our Board of Directors allocated to and authorized to re-grant 150,000 options to a director of the Company after such options were forfeited by other former employees as a result of their resignations from the Company in accordance with the terms of their option agreements. All of the granted options have vested:
| - 37 - |
On November 5, 2011, we filed a Registration Statement with the SEC on Form S-8 covering up to 1,000,000 shares underlying options which may be granted under the Plan. As of March 31, 2015, none of the options granted pursuant to the Plan have been exercised.
Payment of Post-Termination Compensation
We do not have change-in-control agreements with any of our directors or executive officers, and we are not obligated to pay severance or other enhanced benefits to executive officers upon termination of their employment.
ITEM 12. Security Ownership of Certain Beneficial Owners and Management
The following table sets forth certain information regarding beneficial ownership of our common stock as of, March 23, 2015: (i) by each of our directors, (ii) by each of the named executive officers, (iii) by all of our executive officers and directors as a group, and (iv) by each person or entity known by us to beneficially own more than 5% of any class of our outstanding shares. As of March 31, 2015, there were 11,044,328 shares of our common stock outstanding:
| Title of Class | Beneficial Owner (1)(2) | Amount and Nature of Beneficial Ownership (number of shares) |
Fully Diluted Percentage of Outstanding Shares of Common Stock (3) |
|||||||
| Certain Beneficial Owners - Over 5% Ownership | ||||||||||
| Common Stock | Yam Sheung Kwok (4) | 2,683,656 | 18.18 | % | ||||||
| Common Stock | Hong Wang | 2,430,196 | 16.46 | % | ||||||
| Common Stock | Yongqin Ren (4) | 1,116,284 | 7.56 | % | ||||||
| Common Stock | Junde Zhang (4)(7) | 1,076,284 | 7.29 | % | ||||||
| Directors and Executive Officers and Significant Employees | ||||||||||
| Common Stock | Greg Chen | 0 | 0.00 | % | ||||||
| Common Stock | Amy He (5) | 0 | 0.00 | % | ||||||
| Common Stock | Jan Poulsen | 0 | 0.00 | % | ||||||
| Common Stock | Hong Wang (10)(4) | 2,430,196 | 16.46 | % | ||||||
| Common Stock | Yongqin Ren (8) | 1,116,284 | 7.56 | % | ||||||
| Common Stock | Yunlin Ding (9) | 55,000 | 0.37 | % | ||||||
| Common Stock | Emma Wan (6) | 40,000 | 0.27 | % | ||||||
| Common Stock | Al Carmona (11) | 157,303 | 1.07 | % | ||||||
| Common Stock | Timothy Stevens (12) | 80,000 | 0.54 | % | ||||||
| Common Stock | Xinli Li | 0 | 0.00 | % | ||||||
| Officers and Significant Employees and Directors as a Group (10 Persons) | 3,878,783 | 26.27 | % | |||||||
| * | Effective March 31, 2014, Greg Chen and Jan Poulsen resigned as Chief Executive Officer and President, respectively. Effective April 1, 2014, Greg Chen resigned as Director of the Company. The Company appointed Hong Wang to serve as Acting Chief Executive Officer effective as of April 1, 2014. |
| (1) | Pursuant to Rule 13d-3 under the Exchange Act, a person has beneficial ownership of any securities as to which such person, directly or indirectly, through any contract, arrangement, undertaking, relationship or otherwise has or shares voting power and/or investment power or as to which such person has the right to acquire such voting and/or investment power within sixty (60) days. |
| (2) | Unless otherwise stated, each beneficial owner has sole power to vote and dispose of the shares. |
| (3) | Applicable percentage of ownership is based on 11,044,328 shares of common stock outstanding as of December 31, 2014, together with 1,894,992 shares of common stock issuable upon the conversion of convertible preferred stock, 1,154,273 shares of common stock issuance upon the exercise of warrants, and 670,000 shares of common stock issuance upon the exercise of exercisable stock options within sixty (60) days for each beneficial owner. |
| (4) | Mr. Wang, Mr. Zhang, Mr. Ren and Mr. Kwok hold common stock of the Company through Expert Venture Limited, which registered address is P.O. Box 957, Offshore Incorporation Centre, Road Town, Tortola, British Virgin Islands. The fully diluted percentages of the Company’s outstanding shares of common stock ultimately held by Mr. Wang, Mr. Zhang, Mr. Ren and Mr. Kwok are 16.46%, 7.29%, 7.56% and 18.18%, respectively. |
| (5) | The Company has granted to Ms. He options to purchase 60,000 shares of our common stock under the Plan, which have vested. Effective as of August 11, 2014, Amy He resigned from her position as Chief Financial Officer of the Company. |
| (6) | The Company has granted to Ms. Wan options to purchase 40,000 shares of our common stock under the Plan, which have vested. |
| (7) | Mr. Zhang holds a 20.0% interest in Expert Venture Limited and accordingly, indirectly beneficially owns 1,076,284 shares of our common stock. In addition, the Company has granted to Mr. Zhang options to purchase 40,000 shares of our common stock under the Plan, which have vested. Effective February 28, 2014, Mr. Junde Zhang resigned as the Company’s Vice President. |
| (8) | Mr. Ren holds a 20.0% interest in Expert Venture Limited and accordingly, indirectly beneficially owns 1,076,284 shares of our common stock. In addition, the Company has granted to Mr. Ren options to purchase 40,000 shares of our common stock under the Plan, which have vested. |
| (9) | The Company has granted to Mr. Ding options to purchase 55,000 shares of our common stock under the Plan, which have vested. |
| (10) | Mr. Wang holds a 42.0% interests in Expert Venture Limited and accordingly, indirectly beneficially owns 2,260,196 shares of our common stock. In addition, the Company has granted to Mr. Wang options to purchase 170,000 shares of our common stock under the Plan, 170,000 of which have vested. |
| (11) | Mr. Carmona was an investor in the financing that closed immediately following the Exchange. As of December 31, 2014, Mr. Carmona owned 55,117 shares of Series A convertible preferred stock, 9,186 shares of common stock and a warrant exercisable into 18,000 shares of common stock at an exercise price of $5.06. In addition, the Company has granted to Mr. Carmona options to purchase 75,000 shares of our common stock under the Plan, which have vested. |
| (12) | The Company has granted to Mr. Stevens options to purchase 80,000 shares of our common stock under the Plan, which have vested. |
| - 38 - |
ITEM 13. Certain Relationships and Related Transactions, and Director Independence
Due to Related Parties
Mr. He Hao, the former shareholder of Huichun and Taizihu, had some business expenses which need to be reimbursed from the Company. As of December 31, 2014 and 2013, the amounts due to Mr. He Hao were $13,958 and $14,306, respectively.
Guarantee Transactions
On August 23, 2014, YuciJinmao Food Processing Factory, the legal representative of which is JunlianZheng, the wife of Junde Zhang, the previous Vice President of the Company, provided a two-year guarantee on a $1.4 million renewed short-term bank loan payable to Jinzhong City Yuci District Rural Credit Union Co., Ltd. by JinzhongYongcheng, bearing interest at a fixed rate of prime rate plus 145% of prime rate, of which prime rate was based on the six-month to one-year loan interest rate released by The People's Bank of China. The actual interest rate as of December 31, 2013 was 15.084% and the actual interest rate as of December 31, 2014 was 14.688%. The maturity date for renewed loan is September 11, 2015. JinzhongYongcheng paid $0 towards principal and $212,426 towards interest on the loan during the fiscal year ended December 31, 2014. $1.4 million was outstanding under the loan as of December 31, 2014.
On August 23, 2014, YuciJinmao Food Processing Factory, the legal representative of which is JunlianZheng, the wife of Junde Zhang, the previous Vice President of the Company, provided a two-year guarantee on a $1.4 million renewed short-term bank loan payable to Jinzhong City Yuci District Rural Credit Union Co., Ltd. by JinzhongYuliang, bearing interest at a fixed rate of prime rate plus 145% of prime rate, of which prime rate was based on the six-month to one-year loan interest rate released by The People's Bank of China. The actual interest rate as of December 31, 2013 was 15.084% and the actual interest rate as of December 31, 2014 was 14.688%. The maturity date is September 11, 2015. JinzhongYuliang paid $0 towards principal and $212,363 towards interest on the loan during the fiscal year ended December 31, 2014. $1.4 million was outstanding under the loan as of December 31, 2014.
Promoters and Certain Control Persons
None.
Conflicts of Interest
We have certain potential conflicts of interest that are inherent in the relationships between our officers and directors.
From time to time, one or more of our affiliates may form or hold an ownership interest in and/or manage other businesses both related and unrelated to the type of business that we own and operate. These persons expect to continue to form, hold an ownership interest in and/or manage additional other businesses which may compete with ours with respect to operations, including financing and marketing, management time and services and potential customers. These activities may give rise to conflicts between or among the interests of us and other businesses with which our affiliates are associated. Our affiliates are in no way prohibited from undertaking such activities, and neither we nor our shareholders will have any right to require participation in such other activities.
Further, because we intend to transact business with some of our officers, directors and affiliates, as well as with firms in which some of our officers, directors or affiliates have a material interest, potential conflicts may arise between the respective interests of us and these related persons or entities. We believe that such transactions will be effected on terms at least as favorable to us as those available from unrelated third parties.
With respect to transactions involving real or apparent conflicts of interest, we have adopted policies and procedures which require that: (a) the fact of the relationship or interest giving rise to the potential conflict be disclosed or known to the directors who authorize or approve the transaction prior to such authorization or approval, (b) the transaction be approved by a majority of our disinterested outside directors and (c) the transaction be fair and reasonable to us at the time it is authorized or approved by our directors.
| - 39 - |
ITEM 14. Principal Accountant Fees and Services
Public Accounting Fees
The following chart sets forth public accounting fees paid and payable to KCCW Accountancy Corp. (“KCCW”) during the years ended December 31, 2013 and 2014:
| 2013 | 2014 | |||||||
| Audit Fees | $ | 220,000 | $ | 150,000 | ||||
| Audit Related Fees | $ | - | $ | - | ||||
| Tax Fees | $ | 10,000 | $ | 12,000 | ||||
| All Other Fees | $ | - | $ | - | ||||
Audit fees were for professional services rendered by KCCW for the audit of our annual financial statements and the review of the financial statements included in our quarterly reports on Forms 10-Q, and services that are normally provided by KCCW in connection with statutory and regulatory filings or engagements for that fiscal year.
Audit related fees consist of services by KCCW that are reasonably related to the performance of the audit or review of our financial statements and are not reported above under Audit Fees. This category includes accounting consultations on transaction and proposed transaction related matters.
Tax fees primarily include tax compliance service fees, which relate to the preparation of U.S. tax returns.
The Company was not billed by its independent registered public accounting firm for any other fees.
Pre-Approval of Services
The Audit Committee appoints the independent accountant each year and pre-approves the audit services. The Audit Committee chair is authorized to pre-approve specified non-audit services for fees not exceeding specified amounts, if he promptly advises the other Audit Committee members of such approval.
Audit of Financial Statements
During the years ended December 31, 2013 and 2014, KCCW was our principal auditor and no work was performed by persons outside of KCCW.
ITEM 15. Exhibits and Financial Statement Schedules
(a) Financial Statements and Schedules
The financial statements are set forth under the “F” pages of this Annual Report. Financial statement schedules have been omitted because they are either not required, not applicable, or the information is otherwise included.
| - 40 - |
(b) Exhibits
| 2.1 | Share Exchange Agreement Dated April 27, 2010 (1) |
| 3.1 | Articles of Incorporation of Deyu Agriculture Corp. (2) |
| 3.2 | Certificate of Amendment of Articles of Incorporation of Deyu Agriculture Corp. (3) |
| 3.3 | Bylaws of Deyu Agriculture Corp. (2) |
| 4.1 | Certificate of Designation of Rights and Preferences of Series A Convertible Preferred Stock (1) |
| 4.2 | Form of Series A Warrant (1) |
| 10.1 | Securities Purchase Agreement Dated April 27, 2010 (1) |
| 10.2 | Registration Rights Agreement Dated April 27, 2010 (1) |
| 10.3 | Form of Lock-Up Agreement Dated April 27, 2010 (1) |
| 10.4 | Securities Escrow Agreement Dated April 27, 2010 (1) |
| 10.5 | Placement Agent Agreement between the Company and Maxim Group, LLC dated January 27, 2010(6) |
| 10.6 | Share Transfer Agreement between Hong Wang and Yam Sheung Kwok dated April 26, 2010 (6) |
| 10.7 | Share Transfer Agreement between JianmingHao and Yam Sheung Kwok dated April 26, 2010 (6) |
| 10.8 | Share Transfer Agreement between WenjunTian and Yam Sheung Kwok dated April 26, 2010 (6) |
| 10.9 | Share Transfer Agreement between YongqingRen and Yam Sheung Kwok dated April 26, 2010 (6) |
| 10.10 | Share Transfer Agreement between Junde Zhang and Yam Sheung Kwok dated April 26, 2010 (6) |
| 10.11 | Employment Agreement between David Lethem, as Chief Financial Officer, and the Company dated June 18, 2010 (4) |
| 10.12 | Certificate from China Organic Food Certification Center dated December 21, 2009 (6) |
| 10.13 | Corn Purchase Letter of Intent between Shanghai Yihai Trading Co., Ltd., Shanxi Office and JinzhongYuliang Agricultural Trading Co., Limited dated December 20, 2009 (6) |
| 10.14 | Warehouse Lease Agreement between Shanxi 661 Warehouse and JinzhongYongcheng Agricultural Trading Co., Limited dated December 21, 2006 (6) |
| 10.15 | Warehouse Lease Agreement between Shanxi Means of Production Company, Yuci Warehouse (formerly, the 671 Warehouse) and JinzhongYongcheng Agricultural Trading Co., Limited dated December 28, 2008 (6) |
| 10.16 |
Railway Lease Agreement between Shanxi Cereal & Oil Group, Mingli Reservation Depot and JinzhongYongcheng Agriculture Trading Co., Limited dated December 21, 2006 (6) |
| - 41 - |
| 10.17 | Railway Lease Agreement between Shanxi Yuci Cereal Reservation Depot and JinzhongYongcheng Agriculture Trading Co., Limited dated November 15, 2007 (6) |
| 10.18 | Railway Lease Agreement between YuciDongzhao Railway Freight Station and JinzhongYongcheng Agriculture Trading Co., Limited dated December 21, 2006 (6) |
| 10.19 | Agricultural Technology Cooperation Agreement between JinzhongDeyu Agriculture Trading Co., Ltd. and Millet Research Institute, Shanxi Academy of Agricultural Science dated October 2007 (6) |
| 10.20 | Agricultural Technology Cooperation Agreement between Sorghum Institute, Shanxi Academy of Agricultural Sciences and JinzhongDeyu Agriculture Trading Co., Ltd. dated August 24, 2008 (6) |
| 10.21 | Certificate of Forest Rights for the Yuci Forest Right Certificate (2005) No. 01518 dated August 11, 2006 (6) |
| 10.22 | Farmland Transfer Agreement between Detian Yu Biotechnology (Beijing) Co. Ltd. and Shanxi Jinbei Plant Technology Co, Ltd. dated September 30, 2010 (6) |
| 10.23 | Land Use Rights Acquisition Contract Dated September 30, 2010 (5) |
| 10.24 | Deyu Agriculture Corp. 2010 Share Incentive Plan (7) |
| 10.25 | Exclusive Management and Consulting Service Agreement, dated November 16, 2010, by and between Detian Yu Biotechnology (Beijing) Co. Limited and Beijing Jundaqianyuan Investment Management Co., Ltd. (English translated version) (8) |
| 10.26 | Exclusive Management and Consulting Service Agreement, dated November 16, 2010, by and between Detian Yu Biotechnology (Beijing) Co. Limited and JinzhongLongyue Investment Consulting Co., Ltd. (English translated version) (8) |
| 10.27 | Business Cooperation Agreement, dated November 16, 2010, by and between Detian Yu Biotechnology (Beijing) Co. Limited and Beijing Jundaqianyuan Investment Management Co., Ltd. (English Translated Version) (8) |
| 10.28 | Business Operation Agreement, dated November 16, 2010, by and among Detian Yu Biotechnology (Beijing) Co. Limited, Beijing Jundaqianyuan Investment Management Co., Ltd. and each of the shareholders of Beijing Jundaqianyuan Investment Management Co., Ltd. (English translated version) (8) |
| 10.29 | Business Operation Agreement, dated November 16, 2010, by and among Detian Yu Biotechnology (Beijing) Co. Limited, JinzhongLongyue Investment Consulting Co., Ltd. and both of the shareholders of JinzhongLongyue Investment Consulting Co., Ltd. (English translated version) (8) |
| 10.30 | Share Pledge Agreement, dated November 16, 2010, by and among Detian Yu Biotechnology (Beijing) Co. Limited and the following shareholders of Beijing Jundaqianyuan Investment Management Co., Ltd.: TianWenjun, HaoJianming, Yang Jianhui, Zhou Jianbin, Ren Li, RenYongqing, Zhang Junde and Wang Tao (English translated version) (8) |
| 10.31 | Share Pledge Agreement, dated November 16, 2010, by and among Detian Yu Biotechnology (Beijing) Co. Limited and the following shareholders of JinzhongLongyue Investment Consulting Co., Ltd.: Zhao Jing and Zhao Peilin (English translated version) (8) |
| 10.32 | Form of Power of Attorney (English translated version) (8) |
| 10.33 | Equity Acquisition Option Agreement, dated November 16, 2010, by and among Detian Yu Biotechnology (Beijing) Co. Limited and the following shareholders of Beijing Jundaqianyuan Investment Management Co., Ltd.: TianWenjun, HaoJianming, Yang Jianhui, Zhou Jianbin, Ren Li, RenYongqing, Zhang Junde and Wang Tao (English translated version) (8) |
| 10.34 | Equity Acquisition Option Agreement, dated November 16, 2010, by and among Detian Yu Biotechnology (Beijing) Co. Limited and the following shareholders of JinzhongLongyue Investment Consulting Co., Ltd.: Zhao Jing and Zhao Peilin (English translated version) (8) |
| - 42 - |
| 10.35 | Business Cooperation Agreement, dated November 16, 2010, by and between Detian Yu Biotechnology (Beijing) Co. Limited and JinzhongLongyue Investment Consulting Co., Ltd. (English Translated Version) (8) |
| 10.36 | Village Collective Farmland Transfer Agreement, dated December 20, 2010, by and between Detian Yu Biotechnology (Beijing) Co., Ltd. and Shanxi Jinbei Plant Technology Development Co., Ltd. (English Translated and Mandarin Versions) (9) |
| 10.37 | Contract of Agreement, effective as of January 10, 2011, by and between Deyu Agriculture Corp. and Charlie Lin (10) |
| 14.1 | Code of Conduct (6) |
| 16.1 | Letter from Auditor (11) |
| 21 | List of Subsidiaries* |
| 31.1 | Certifications of the Chief Executive Officer pursuant to Section 302 of the Sarbanes-Oxley Act of 2002* |
| 31.2 | Certifications of the Chief Financial Officer pursuant to Section 302 of the Sarbanes-Oxley Act of 2002* |
| 32.1 | Certification Pursuant To 18 U.S.C. Section 1350, As Adopted Pursuant To Section 906 of the Sarbanes-Oxley Act Of 2002** |
| 32.2 | Certification Pursuant To 18 U.S.C. Section 1350, As Adopted Pursuant To Section 906 of the Sarbanes-Oxley Act Of 2002** |
| 99.1 | Audit Committee Charter adopted August 19, 2010 (6) |
| 99.2 | Resignation Letter, dated March 31, 2014, submitted by Greg Chen as Chief Executive Officer and Jan Poulsen as President of the Company (12) |
| 99.3 | Resignation Letter, dated April 1, 2014, submitted by Greg Chen as Director of the Company (12) |
| 101. INS | XBRL Instance Document* |
| 101. CAL | XBRL Taxonomy Extension Calculation Link base Document* |
| 101. DEF | XBRL Taxonomy Extension Definition Link base Document* |
| 101. LAB | XBRL Taxonomy Label Link base Document* |
| 101. PRE | XBRL Extension Presentation Link base Document* |
| 101. SCH | XBRL Taxonomy Extension Scheme Document* |
| (1) | Incorporated by reference to our Form 8-K filed on May 3, 2010. |
| (2) | Incorporated by reference to our Registration Statement on Form S-1 filed on July 8, 2009. |
| (3) | Incorporated by reference to our Form 8-K filed on June 4, 2010. |
| (4) | Incorporated by reference to our Form 8-K filed on June 18, 2010. |
| (5) | Incorporated by reference to our Form 8-K filed on October 6, 2010. |
| (6) | Incorporated by reference to our Form S-1/A filed on October 21, 2010. |
| (7) | Incorporated by reference to our Form S-8 filed on November 5, 2010. |
| (8) | Incorporated by reference to our Form 8-K filed on November 17, 2010. |
| (9) | Incorporated by reference to our Form 8-K filed on December 21, 2010. |
| (10) | Incorporated by reference to our Form 8-K filed on January 10, 2011. |
| (11) | Incorporated by reference to our Form 8-K filed on May 3, 2010. |
| (12) | Incorporated by reference to our Form 10-K filed on April 4, 2014. |
* Filed herewith.
** Furnished, not filed herewith.
| - 43 - |
In accordance with Section 13 or 15(d) of the Securities Exchange Act of 1934, the Registrant has duly caused this report to be signed on its behalf by the undersigned, thereunto duly authorized.
| DEYU AGRICULTURE CORP. | ||
| Date: March 31, 2015 | ||
| By: | /s/ Hong Wang | |
| Hong Wang, Principal Executive Officer, Acting Chief Executive Officer and Director | ||
In accordance with the requirements of the Securities Exchange Act of 1934, this report has been signed below by the following persons on behalf of the registrant and in the capacities indicated on the dates indicated.
| Signatures | Title | Date | ||
| /s/ Hong Wang | ||||
| Hong Wang | Director and Chairman of the Board, Principal Executive Officer and Acting Chief Executive Officer | March 31, 2015 | ||
| /s/ Emma Wan | ||||
| Emma Wan | Principal Financial and Accounting Officer and Acting Chief Financial Officer | March 31, 2015 | ||
| /s/ Al Carmona | ||||
| Al Carmona | Independent Director | March 31, 2015 | ||
| /s/ Xinli Li | ||||
| Xinli Li | Independent Director | March 31, 2015 | ||
| /s/ Timothy Stevens | ||||
| Timothy Stevens | Independent Director | March 31, 2015 |
| - 44 - |
DEYU AGRICULTURE CORP AND SUBSIDIARIES
INDEX TO CONSOLIDATED FINANCIAL STATEMENTS
December 31, 2013
| - 45 - |
 |
Audit • T ax • Consulting • Financial Advisory Registered with Public Company Accounting Oversight |
REPORT OF INDEPENDENT REGISTERED PUBLIC ACCOUNTING FIRM
To the Board of Directors and Stockholders of:
Deyu Agriculture Corp.
We have audited the accompanying consolidated balance sheets of Deyu Agriculture Corp. and Subsidiaries (the “Company”) as of December 31, 2014 and 2013, and the related consolidated statements of income and comprehensive income, equity, and cash flows for the years then ended. The Company’s management is responsible for these consolidated financial statements. Our responsibility is to express an opinion on these consolidated financial statements based on our audits.
We conducted our audits in accordance with standards of the Public Company Accounting Oversight Board (United States). Those standards require that we plan and perform the audits to obtain reasonable assurance about whether the consolidated financial statements are free of material misstatement. The Company is not required to have, nor were we engaged to perform, an audit of its internal control over financial reporting. Our audits included consideration of internal control over financial reporting as a basis for designing audit procedures that are appropriate in the circumstances, but not for the purpose of expressing an opinion on the effectiveness of the Company’s internal control over financial reporting. Accordingly, we express no such opinion. An audit includes examining, on a test basis, evidence supporting the amounts and disclosures in the consolidated financial statements. An audit also includes assessing the accounting principles used and significant estimates made by management, as well as evaluating the overall consolidated financial statement presentation. We believe that our audits provide a reasonable basis for our opinion.
In our opinion, the consolidated financial statements referred to above present fairly, in all material respects, the consolidated financial position of Deyu Agriculture Corp. and Subsidiaries as of December 31, 2014 and 2013 and the consolidated results of their operations and their cash flows for the years then ended in conformity with accounting principles generally accepted in the United States of America.
/s/ KCCW Accountancy Corp.
Diamond Bar, California
March 31, 2015
KCCW Accountancy Corp.
22632 Golden Springs Dr. #230, Diamond Bar, CA 91765, USA
Tel: +1 909 348 7228 • Fax: +1 626 529 1580 • info@kccwcpa.com
| - 46 - |
DEYU AGRICULTURE CORP. AND SUBSIDIARIES
CONSOLIDATED BALANCE SHEETS
| December 31, 2014 | December 31, 2013 | |||||||
| Assets | ||||||||
| Current Assets | ||||||||
| Cash and cash equivalents | $ | 1,012,743 | $ | 979,282 | ||||
| Restricted cash | - | 16,519 | ||||||
| Accounts receivable, net | 21,536,525 | 32,326,897 | ||||||
| Inventory | 9,815,931 | 15,318,224 | ||||||
| Advance to supplier | 732,976 | 4,363,298 | ||||||
| Prepaid expenses | 939,429 | 1,161,302 | ||||||
| Other current assets | 254,817 | 159,948 | ||||||
| Total Current Assets | 34,292,421 | 54,325,470 | ||||||
| Property, plant, and equipment, net | 17,020,127 | 19,251,051 | ||||||
| Construction-in-progress | 353,963 | - | ||||||
| Long-term Investment | 58,666 | 60,129 | ||||||
| Intangible assets, net | 7,459,320 | 7,827,809 | ||||||
| Total Assets | $ | 59,184,497 | $ | 81,464,459 | ||||
| Liabilities and Equity | ||||||||
| Current Liabilities | ||||||||
| Short-term loan | $ | 7,268,801 | $ | 7,464,856 | ||||
| Accounts payable | 4,355,395 | 8,538,544 | ||||||
| Advance from customers | 1,972,193 | 1,990,479 | ||||||
| Accrued expenses | 1,406,519 | 1,002,885 | ||||||
| Tax payable | 107,228 | 73,790 | ||||||
| Preferred stock dividends payable | 212,094 | 247,614 | ||||||
| Due to related parties | 13,958 | 14,306 | ||||||
| Other current liabilities | 293,456 | 282,179 | ||||||
| Total Current Liabilities | 15,629,644 | 19,614,653 | ||||||
| Equity | ||||||||
| Series A convertible preferred stock, $.001 par value, 10,000,000 shares authorized, 1,894,992 and 2,182,628 shares outstanding, respectively | 1,895 | 2,183 | ||||||
| Common stock, $.001 par value; 75,000,000 shares authorized, 11,044,328 and 10,618,266 shares outstanding, respectively | 11,044 | 10,618 | ||||||
| Additional paid-in capital | 21,670,346 | 21,225,146 | ||||||
| Other comprehensive income | 6,515,733 | 7,897,730 | ||||||
| Retained earnings | 15,325,116 | 32,681,588 | ||||||
| Total Stockholders' Equity | 43,524,134 | 61,817,265 | ||||||
| Noncontrolling Interests | 30,719 | 32,541 | ||||||
| Total Equity | 43,554,853 | 61,849,806 | ||||||
| Total Liabilities and Equity | $ | 59,184,497 | $ | 81,464,459 | ||||
The accompanying notes are an integral part of these consolidated financial statements.
| - 47 - |
DEYU AGRICULTURE CORP. AND SUBSIDIARIES
CONSOLIDATED STATEMENTS OF INCOME AND COMPREHENSIVE INCOME
| For The Years Ended | ||||||||
| December 31, | ||||||||
| 2014 | 2013 | |||||||
| Net revenue | ||||||||
| Normal inventory | $ | 106,256,045 | $ | 246,350,104 | ||||
| Damaged corn | 3,421,175 | - | ||||||
| Total Net Revenue | 109,677,220 | 246,350,104 | ||||||
| Cost of goods sold | ||||||||
| Normal inventory | (99,085,690 | ) | (227,250,013 | ) | ||||
| Damaged corn | (9,328,942 | ) | - | |||||
| Total Cost of Goods Sold | (108,414,632 | ) | (227,250,013 | ) | ||||
| Loss on inventory valuation reserve | - | (4,478,174 | ) | |||||
| Gross Profit (loss) | 1,262,588 | 14,621,917 | ||||||
| Selling expenses | (9,600,879 | ) | (17,447,531 | ) | ||||
| General and administrative expenses | (7,468,660 | ) | (13,195,537 | ) | ||||
| Loss on impairment of assets | - | (7,346,776 | ) | |||||
| Total Operating Expenses | (17,069,539 | ) | (37,989,844 | ) | ||||
| Operating income (loss) | (15,806,951 | ) | (23,367,927 | ) | ||||
| Interest income | 6,263 | 35,193 | ||||||
| Interest expense | (783,560 | ) | (790,438 | ) | ||||
| Non-operating income (loss) | 146,623 | (403,885 | ) | |||||
| Total Other Expenses | (630,674 | ) | (1,159,130 | ) | ||||
| Income (loss) before income taxes | (16,437,625 | ) | (24,527,057 | ) | ||||
| Income taxes | (501,262 | ) | (604,450 | ) | ||||
| Income (loss) before extraordinary items | (16,938,887 | ) | (25,131,507 | ) | ||||
| Extraordinary loss (after taxes) | - | (1,212,430 | ) | |||||
| Net income (loss) | (16,938,887 | ) | (26,343,937 | ) | ||||
| Net income (loss) attributable to noncontrolling interest | 1,039 | 4,160 | ||||||
| Net income (loss) attributable to Deyu Agriculture Corp. | (16,937,848 | ) | (26,339,777 | ) | ||||
| Preferred stock dividends | (418,624 | ) | (478,769 | ) | ||||
| Net income (loss) available to common stockholders | (17,356,472 | ) | (26,818,546 | ) | ||||
| Foreign currency translation gain (loss) | (1,382,780 | ) | 2,150,517 | |||||
| Comprehensive income (loss) | (18,739,252 | ) | (24,668,029 | ) | ||||
| Other comprehensive income (loss) attributable to noncontrolling interests | 783 | 9,420 | ||||||
| Comprehensive income (loss) attributable to Deyu Agriculture Corp. | $ | (18,738,469 | ) | $ | (24,658,609 | ) | ||
| Net income (loss) attributable to common stockholders per share – basic | $ | (1.58 | ) | $ | (2.52 | ) | ||
| Net income (loss) attributable to common stockholders per share - diluted | (1.58 | ) | (2.52 | ) | ||||
| Weighted average number of common shares outstanding - basic | 10,974,596 | 10,625,170 | ||||||
| Weighted average number of common shares outstanding - diluted | 10,974,596 | 10,625,170 | ||||||
The accompanying notes are an integral part of these consolidated financial statements.
| - 48 - |
DEYU AGRICULTURE CORP AND SUBSIDIARIES
CONSOLIDATED STATEMENTS OF EQUITY
| Series A Convertible | Common Stock | Additional | Other | |||||||||||||||||||||||||||||||||
| Paid-in | Comprehensive | Retained | Noncontrolling | |||||||||||||||||||||||||||||||||
| Shares | Amount | Shares | Amount | Capital | Income | Earnings | Interest | Total | ||||||||||||||||||||||||||||
| Balance at December 31, 2012 | 2,039,970 | 2,040 | 10,658,266 | 10,658 | 20,781,439 | 5,737,793 | 59,500,134 | 426,329 | 86,458,393 | |||||||||||||||||||||||||||
| Covertible preferred stocks issued for payment of preferred stock dividends | 142,658 | 143 | - | - | 456,363 | - | - | - | 456,506 | |||||||||||||||||||||||||||
| Share-based compensation | - | - | - | - | 44,504 | - | - | - | 44,504 | |||||||||||||||||||||||||||
| Common stocks retired for service contract termination | - | - | (40,000 | ) | (40 | ) | (57,160 | ) | - | - | - | (57,200 | ) | |||||||||||||||||||||||
| Net changes in foreign currency translation adjustment | - | - | - | - | - | 2,159,937 | - | (9,420 | ) | 2,150,517 | ||||||||||||||||||||||||||
| Subsidiary capital withdraw by noncontrolling interest at the liquidation of Hebei Yugu | - | - | - | - | - | - | - | (469,147 | ) | (469,147 | ) | |||||||||||||||||||||||||
| Loss assumed by Noncontrollinginterets at the liquidation of Hebei Yugu | - | - | - | - | - | - | - | 88,939 | 88,939 | |||||||||||||||||||||||||||
| Net earnings for the year ended December 31, 2013 | - | - | - | - | - | - | (26,818,546 | ) | (4,160 | ) | (26,822,706 | ) | ||||||||||||||||||||||||
| Balance at December 31, 2013 | 2,182,628 | 2,183 | 10,618,266 | 10,618 | 21,225,146 | 7,897,730 | 32,681,588 | 32,541 | 61,849,806 | |||||||||||||||||||||||||||
| Covertible preferred stocks issued for payment of preferred stock dividends | 138,426 | 138 | - | - | 442,825 | - | - | - | 442,963 | |||||||||||||||||||||||||||
| Share-based compensation | - | - | - | - | 2,375 | - | - | - | 2,375 | |||||||||||||||||||||||||||
| Conversion of convertible preferred stocks to common stocks | (426,062 | ) | (426 | ) | 426,062 | 426 | - | - | - | - | - | |||||||||||||||||||||||||
| Net changes in foreign currency translation adjustment | - | - | - | - | - | (1,381,997 | ) | - | (783 | ) | (1,382,780 | ) | ||||||||||||||||||||||||
| Net earnings for the period ended September 30, 2014 | - | - | - | - | - | - | (17,356,472 | ) | (1,039 | ) | (17,357,511 | ) | ||||||||||||||||||||||||
| Balance at December 31, 2014 | 1,894,992 | $ | 1,895 | 11,044,328 | $ | 11,044 | $ | 21,670,346 | $ | 6,515,733 | $ | 15,325,116 | $ | 30,719 | $ | 43,554,853 | ||||||||||||||||||||
The accompanying notes are an integral part of these consolidated financial statements.
| - 49 - |
DEYU AGRICULTURE CORP. AND SUBSIDIARIES
CONSOLIDATED STATEMENTS OF CASH FLOWS
| For The Year Ended | ||||||||
| December 31, | ||||||||
| 2014 | 2013 | |||||||
| CASH FLOWS FROM OPERATING ACTIVITIES | ||||||||
| Net income (loss) available to common stockholders | $ | (17,356,472 | ) | $ | (26,818,546 | ) | ||
| Adjustments to reconcile net income (loss) to net cash provided by operating activities: | ||||||||
| Depreciation & amortization | 2,174,049 | 2,366,220 | ||||||
| Loss on impairment of asset valuation | - | 7,346,776 | ||||||
| Extraordinary loss | - | 1,212,430 | ||||||
| Provision for Inventory valuation | - | 4,478,174 | ||||||
| Bad debt expenses | 1,238,755 | 1,925,357 | ||||||
| Write-off of allowance for doubtful accounts | (834,917 | ) | - | |||||
| Share-based compensation | 2,375 | 44,504 | ||||||
| Preferred stock dividends accrued | 418,624 | 478,769 | ||||||
| Common stocks issued for services | - | (57,200 | ) | |||||
| Noncontrolling interests | (1,039 | ) | (4,160 | ) | ||||
| Decrease (increase) in current assets: | ||||||||
| Accounts receivable | 9,694,132 | 1,649,532 | ||||||
| Related-parties trade receivable | 43,660 | 358,771 | ||||||
| Inventories | 5,165,207 | 11,182,382 | ||||||
| Advance to suppliers | 3,548,568 | 1,931,601 | ||||||
| Prepaid expense and other current assets | 22,796 | (244,860 | ) | |||||
| Increase (decrease) in liabilities: | ||||||||
| Accounts payable | (4,002,968 | ) | 1,841,803 | |||||
| Advance from customers | 30,332 | (319,381 | ) | |||||
| Accrued expense and other liabilities | 477,625 | (1,631,079 | ) | |||||
| Net cash provided by operating activities | 620,727 | 5,741,093 | ||||||
| CASH FLOWS FROM INVESTING ACTIVITIES | ||||||||
| Purchase of machinery and equipment | (220,429 | ) | (518,165 | ) | ||||
| Construction and remodeling of factory and warehouses | (356,410 | ) | - | |||||
| Net cash used in investing activities | (576,839 | ) | (518,165 | ) | ||||
| CASH FLOWS FROM FINANCING ACTIVITIES | ||||||||
| Net proceeds (repayment) of short-term loans from related parties | - | (9,053,440 | ) | |||||
| Net repayment from short-term loans from bank and others | (14,606 | ) | (1,024,757 | ) | ||||
| Cash released from restriction for credit line of bank loans | 16,228 | 809,997 | ||||||
| Net cash provided by (used in) financing activities | 1,622 | (9,268,200 | ) | |||||
| EFFECT OF EXCHANGE RATE CHANGE ON CASH AND CASH EQUIVALENTS | (12,049 | ) | 87,275 | |||||
| NET (DECREASE) INCREASE IN CASH & CASH EQUIVALENTS | 33,461 | (3,957,997 | ) | |||||
| CASH & CASH EQUIVALENTS, BEGINNING BALANCE | 979,282 | 4,937,279 | ||||||
| CASH & CASH EQUIVALENTS, ENDING BALANCE | $ | 1,012,743 | $ | 979,282 | ||||
| SUPPLEMENTAL DISCLOSURES: | ||||||||
| Income tax paid | $ | 468,715 | $ | 841,593 | ||||
| Interest paid | $ | 424,789 | $ | 743,653 | ||||
| NONCASH INVESTING AND FINANCING ACTIVITIES: | ||||||||
| Construction completed and transferred to property, plant, and equipment | $ | - | $ | 767,494 | ||||
| Construction transferred to land use rights | $ | - | $ | 1,045,640 | ||||
The accompanying notes are an integral part of these consolidated financial statements.
| - 50 - |
DEYU AGRICULTURE CORP. AND SUBSIDIARIES
NOTES TO CONSOLIDATED FINANCIAL STATEMENTS
NOTE 1. NATURE OF BUSINESS AND BASIS OF FINANCIAL STATEMENT PREPARATION
Deyu Agriculture Corp. (the “Company”), formerly known as Eco Building International, Inc., was incorporated under the laws of the State of Nevada on December 23, 2008. We completed the acquisition of City Zone Holdings Limited (“City Zone”), an agricultural products distributor in the Shanxi Province of the People’s Republic of China (the “PRC”) engaged in procuring, processing, marketing, and distributing various grain and corn products, by means of a share exchange effective April 27, 2010. As a result of the share exchange, City Zone became our wholly-owned subsidiary. We currently conduct our business primarily through operating PRC subsidiaries, including JinzhongDeyu Agriculture Trading Co., Ltd. (“JinzhongDeyu”), JinzhongYuliang Agriculture Trading Co., Ltd. (“JinzhongYuliang”), JinzhongYongcheng Agriculture Trading Co., Ltd. (“JinzhongYongcheng”), Shanxi Taizihu Food Co., Ltd. (“Taizihu”), Shanxi Huichun Bean Products Co., Ltd. (“Huichun” and together with Taizihu, the “Taizihu Group”) and Detian Yu Biotechnology (Beijing) Co., Ltd. (“Detian Yu”) and Detian Yu’s subsidiaries.
On May 11, 2010, our Board of Directors adopted a resolution to change our name to "Deyu Agriculture Corp." and FINRA declared the name change effective on June 2, 2010.
Reverse Acquisition
On April 27, 2010, we entered into a Share Exchange Agreement (“Share Exchange”) pursuant to which we issued 8,736,932 shares of our common stock, par value $ 0.001 per share, to Expert Venture Limited (“Expert Venture”), a company organized under the laws of the British Virgin Islands, and the other shareholders of City Zone (the “City Zone Shareholders”). As a result of the Share Exchange, City Zone became our wholly-owned subsidiary and City Zone Shareholders acquired a majority of our issued and outstanding shares of common stock.
As a result, the Share Exchange has been accounted for as a reverse acquisition using the purchase method of accounting, whereby City Zone is deemed to be the accounting acquirer (the legal acquiree) and we are to be the accounting acquiree (legal acquirer). The financial statements before the date of the Share Exchange are those of City Zone with our results being consolidated from the date of the Share Exchange. The equity section and earnings per share have been retroactively restated to reflect the reverse acquisition and no goodwill has been recorded.
City Zone was incorporated in the British Virgin Islands (“BVI”) on July 27, 2009 under the BVI Business Companies Act of 2004. In November 2009, pursuant to the restructuring plan set out below, City Zone became the holding company of a group of companies comprising Most Smart International Limited ("Most Smart"), Redsun Technology (Shenzhen) Co. Limited (“Shenzhen Redsun”), Shenzhen JiRuHai Technology Co., Ltd. ("Shenzhen JiRuHai"), Detian Yu, JinzhongDeyu, JinzhongYongcheng and JinzhongYuliang.
Restructuring
In November 2009, pursuant to a restructuring plan intended to ensure compliance with PRC rules and regulations, City Zone, through a series of acquisitions and wholly-owned subsidiaries, acquired 100% of the equity interests in JinzhongDeyu, JinzhongYuliang, and JinzhongYongcheng. The former shareholders and key management of JinzhongDeyu, JinzhongYongcheng, and JinzhongYuliang became the ultimate controlling parties and key management of City Zone. This restructuring has been accounted for as a recapitalization of JinzhongDeyu, JinzhongYongcheng and JinzhongYuliang with no adjustment to the historical basis of the assets and liabilities of these companies, while the historical financial positions and results of operations are consolidated as if the restructuring occurred as of the beginning of the earliest period presented in our accompanying consolidated financial statements. For the purpose of a consistent and comparable presentation, the consolidated financial statements have been prepared as if City Zone had been in existence since the beginning of the earliest and throughout the whole periods covered by these consolidated financial statements.
The Acquisition of the Taizihu Group
On February 2, 2012, Shenzhen Redsun, a company organized under the laws of PRC and a wholly-owned subsidiary of the Company, entered into a Stock Equity Transfer Agreement (the “Agreement”) whereby Shenzhen Redsun acquired 100 % of the issued and outstanding registered share capital of the Taizihu Group. In consideration for the acquisition of Taizihu Group, Shenzhen Redsun paid $ 2,342,168 (RMB14,773,222 ) in cash to Mr. Hao He, an individual, for 50 % of Taizihu, $ 1,522,409 (RMB 9,602,594 ) in cash to Mr. QingheXu, an individual, for 32.5 % of Taizihu and $ 819,759 (RMB 5,170,628 ) in cash to Mr. JinqingXie, an individual, for the remaining 17.5 % of Taizihu. Immediately prior to the execution of the Agreement, Taizihu owned 85 % of the issued and outstanding registered share capital of Huichun, and pursuant to the terms of the Agreement, Shenzhen Redsun acquired the remaining 15 % of the share capital of Huichun from Beijing Kanggang Food Development Co., Ltd. for $ 817,845 (RMB 5,158,556). The total amount of the consideration paid for the acquisition of the Taizihu Group was $ 5,502,181 (RMB 34,705,000), and such consideration was determined pursuant to arm’s length negotiations between the parties. As a result of the acquisition, the Company currently owns and controls 100 % of the Taizihu Group.
| - 51 - |
Consolidation Scope:
Details of our subsidiaries subject to consolidation are as follows:
| Domicile and | Percentage | |||||||||||
| Date of | Registered | of | ||||||||||
| Name of Subsidiary | Incorporation | Capital | Ownership | Principal Activities | ||||||||
| City Zone Holdings Limited ("City Zone") | British Virgin Islands, July 27, 2009 | $ | 20,283,581 | 100 | % | Holding company of Most Smart | ||||||
| Most Smart International Limited ("Most Smart") | Hong Kong, March 11, 2009 | $ | 1 | 100 | % | Holding company of Shenzhen Redsun | ||||||
| Redsun Technology (Shenzhen) Co., Ltd. ("Shenzhen Redsun") | The PRC, August 20, 2009 | $ | 30,000 | 100 | % | Holding company of Shenzhen JiRuHai, Taizihu and Huichun | ||||||
| Shenzhen JiRuHai Technology Co., Ltd.("Shenzhen JiRuHai") | The PRC, August 20, 2009 | $ | 14,638 | 100 | % | Holding company of Beijing Detian Yu | ||||||
| Detian Yu Biotechnology (Beijing) Co., Ltd. ("Detian Yu") | The PRC, November 30, 2006 | $ | 7,637,723 | 100 | % | Wholesale distribution of simple-processed and deep-processed packaged food products and staple food. Holding company of the following first five entities. | ||||||
| JinzhongDeyu Agriculture Trading Co., Ltd. ("JinzhongDeyu") | The PRC, April 22, 2004 | $ | 1,492,622 | 100 | % | Organic grains preliminary processing and wholesale distribution. | ||||||
| JinzhongYongcheng Agriculture Trading Co., Ltd. ("JinzhongYongcheng") | The PRC, May 30, 2006 | $ | 1,025,787 | 100 | % | Corns preliminary processing and wholesale | ||||||
| JinzhongYuliang Agriculture Trading Co., Ltd. ("JinzhongYuliang") | The PRC, March 17, 2008 | $ | 13,963,243 | 100 | % | Corns preliminary processing and wholesale distribution. | ||||||
| Tianjin Guandu Food Co., Ltd. ("Tianjin Guandu") * | The PRC, June 21, 2011 | $ | 1,544,497 | 100 | % | Wholesale distribution of simple-processed and deep-processed packaged food products and staple food. | ||||||
| HebeiYugu Grain Co., Ltd. ("HebeiYugu") | The PRC, July 25, 2011 | $ | 1,563,824 | 70 | % | Wholesale distribution of grain products and operating or acting as an agent of import & export business for grain products. | ||||||
| Shanxi Taizihu Food Co., Ltd. (“Taizihu”) | The PRC, July 27, 2003 | $ | 1,208,233 | 100 | % | Producing and selling fruit beverages and soybean products. | ||||||
| Shanxi HuiChun Bean Products Co., Ltd. (“Huichun”) | The PRC, September 2, 2007 | $ | 2,636,192 | 100 | % | Producing and selling fruit beverages and soybean products. | ||||||
| Jilin Jinglong Agriculture Development Limited (“Jinglong”) | The PRC, October 10, 2012 | $ | 3,152,138 | 99 | % | Procurement, storage and sales of corn and grain. | ||||||
| * | Tianjin Guandu completed the deregistration procedure with the Tianjin Industrial and Commercial Bureau on May 28, 2014. |
NOTE 2. SUMMARY OF SIGNIFICANT ACCOUNTING POLICIES
Basis of presentation
The unaudited consolidated financial statements include the financial statements of Deyu Agriculture Corp. and its subsidiaries. All significant intercompany account balances and transactions have been eliminated in consolidation. Results of operations of companies purchased are included from the dates of acquisition.
| - 52 - |
These accompanying consolidated financial statements have been prepared in accordance with US GAAP. The Company’s functional currency is the Chinese Yuan, or Renminbi (“RMB”); however, the accompanying consolidated financial statements have been translated and presented in United States Dollars (“USD”).
On April 27, 2010, as a result of the consummation of the Share Exchange, we changed our fiscal year end from May 31 to December 31 to conform to the fiscal year end of City Zone.
Use of estimates
The preparation of the consolidated financial statements in conformity with US GAAP requires management to make estimates and assumptions that affect the reported amounts of assets and liabilities and disclosure of contingent assets and liabilities at the date of the financial statements and the reported amounts of revenues and expenses during the reporting period. Management makes its estimates based on historical experience and various other assumptions and information that are available and believed to be reasonable at the time the estimates are made. Therefore, actual results could differ from those estimates under different assumptions and conditions.
Cash and cash equivalents
Cash and cash equivalents consist of cash on hand, cash in banks and all highly liquid investments with original maturities of three months or less.
Accounts receivable
Accounts receivable are recorded at net realizable value consisting of the carrying amount less allowance for doubtful accounts, as needed. We assess the collectability of accounts receivable based primarily upon the creditworthiness of the customer as determined by credit checks and analysis, as well as the customer’s payment history. Management reviews the composition of accounts receivable and analyzes historical bad debts, customer concentrations, customer credit worthiness, current economic trends, and changes in customer payment patterns to evaluate the adequacy of these reserves. While management uses the best information available upon which to base estimates, future adjustments to the allowance may be necessary if economic conditions differ substantially from the assumptions used for the purposes of analysis. The Company wrote off $834,917 of allowance for doubtful accounts for the period ended September 30, 2014 as a result of incentives offered to customers for accelerating collections of accounts receivable. The balance of allowance for doubtful accounts As of December 31, 2014 and December 31, 2013 was $1,337,364 and $984,717 respectively.
Inventories
The Company's inventories are stated at lower of cost or market. Cost is determined on a moving-average basis. Costs of inventories include purchase and related costs incurred in delivering products to their present location and condition. Market value is determined by reference to selling prices after the balance sheet date or to management’s estimates based on prevailing market conditions. Management periodically evaluates the composition of its inventories at least ddquarterly to identify slow-moving and obsolete inventories to determine if a valuation allowance is required. The balance of reserve for inventory valuation as of December 31, 2014 and December 31, 2013 was $140,582 and $4,603,929, respectively.
Property, plant, and equipment
Property, plant, and equipment are stated at cost less accumulated depreciation. Expenditures for maintenance and repairs are charged to earnings as incurred; in addition, renewals and betterments are capitalized. When property, plant, and equipment are retired or otherwise disposed of, the related cost and accumulated depreciation are removed from the respective accounts, and any gain or loss is included in operations.
Depreciation is computed using the straight-line method over the estimated useful lives of the assets as follows:
| Useful Life (in years) | ||
| Automobiles | 5 | |
| Buildings | 10-30 | |
| Office equipment | 5 | |
| Machinery and equipment | 5-10 | |
| Furniture & fixtures | 5 |
| - 53 - |
Construction-in-progress
Construction-in-progress consists of amounts expended for the construction of a new factory park, and the cost of the portion of the land use right that the new factory park occupied. Construction-in-progress is not depreciated until such time as the assets are completed and put into service. Once factory park construction is completed, the cost accumulated in construction-in-progress will be transferred to property, plant, and equipment.
Long-lived assets
The Company applies the provisions of FASB ASC Topic 360 (ASC 360), "Property, Plant, and Equipment" which addresses financial accounting and reporting for the impairment or disposal of long-lived assets. The Company periodically evaluates the carrying value of long-lived assets to be held and used in accordance with ASC 360, at least on an annual basis. ASC 360 requires the impairment losses to be recorded on long-lived assets used in operations when indicators of impairment are present and the undiscounted cash flows estimated to be generated by those assets are less than the assets' carrying amounts. In that event, a loss is recognized based on the amount by which the carrying amount exceeds the fair market value of the long-lived assets. Loss on long-lived assets to be disposed of is determined in a similar manner, except that fair market values are reduced for the cost of disposal. As of December 31, 2014 and December 31, 2013, the balance of impairment of construction-in-progress was $772,091 and $773,874, respectively.
Intangible assets
For intangible assets subject to amortization, an impairment loss is recognized if the carrying amount of the intangible asset is not recoverable and exceeds fair value. The carrying amount of the intangible asset is considered not recoverable if it exceeds the sum of the undiscounted cash flows expected to result from the use of the assets. As of December 31, 2014 and December 31, 2013, the balance of impairment of intangible assets was $6,557,755 and $6,572,902, respectively.
Fair value measurements
FASB ASC 820, “Fair Value Measurements” (formerly SFAS No. 157) defines fair value for certain financial and nonfinancial assets and liabilities that are recorded at fair value, establishes a framework for measuring fair value and expands disclosures about fair value measurements. It requires that an entity measure its financial instruments to base fair value on exit price, maximize the use of observable units and minimize the use of unobservable inputs to determine the exit price. It establishes a hierarchy which prioritizes the inputs to valuation techniques used to measure fair value. This hierarchy increases the consistency and comparability of fair value measurements and related disclosures by maximizing the use of observable inputs and minimizing the use of unobservable inputs by requiring that observable inputs be used when available. Observable inputs are inputs that reflect the assumptions market participants would use in pricing the assets or liabilities based on market data obtained from sources independent of the Company. Unobservable inputs are inputs that reflect the Company’s own assumptions about the assumptions market participants would use in pricing the asset or liability developed based on the best information available in the circumstances. The hierarchy prioritizes the inputs into three broad levels based on the reliability of the inputs as follows:
| · | Level 1 – Inputs are quoted prices in active markets for identical assets or liabilities that the Company has the ability to access at the measurement date. Valuation of these instruments does not require a high degree of judgment as the valuations are based on quoted prices in active markets that are readily and regularly available. | |
| · | Level 2 – Inputs other than quoted prices in active markets that are either directly or indirectly observable as of the measurement date, such as quoted prices for similar assets or liabilities; quoted prices in markets that are not active; or other inputs that are observable or can be corroborated by observable market data for substantially the full term of the assets or liabilities. | |
| · | Level 3 – Valuations based on inputs that are unobservable and not corroborated by market data. The fair value for such assets and liabilities is generally determined using pricing models, discounted cash flow methodologies, or similar techniques that incorporate the assumptions a market participant would use in pricing the asset or liability. |
| - 54 - |
This guidance applies to other accounting pronouncements that require or permit fair value measurements. On February 12, 2008, the FASB finalized FASB Staff Position (FSP) No. 157-2, Effective Date of FASB Statement No. 157 (ASC 820). This Staff Position delays the effective date of SFAS No. 157 (ASC 820) for nonfinancial assets and liabilities to fiscal years beginning after November 15, 2008 and interim periods within those fiscal years, except for those items that are recognized or disclosed at fair value in the financial statements on a recurring basis (at least annually). The adoption of SFAS No. 157 (ASC 820) had no effect on the Company's financial position or results of operations for the year 2014
We also analyze all financial instruments with features of both liabilities and equity under ASC 480-10 (formerly SFAS 150, “Accounting for Certain Financial Instruments with Characteristics of Both Liabilities and Equity”) and ASC 815-40 (formerly EITF 00-19, “Accounting for Derivative Financial Instruments Indexed to, and Potentially Settled in, a Company’s Own Stock”). We have determined ASC 480-10 (formerly SFAS 150) and ASC 815-40 (formerly EITF 00-19) had no material effect on our financial position or results of operations for the year 2014
Revenue recognition
The Company’s revenue recognition policies are in compliance with the SEC Staff Accounting Bulletin No. 104 (“SAB 104”). The Company recognizes product revenue when the following fundamental criteria are met: (i) persuasive evidence of an arrangement exists, (ii) delivery has occurred, (iii) our price to the customer is fixed or determinable and (iv) collection of the resulting accounts receivable is reasonably assured. The Company recognizes revenue for product sales upon transfer of title to the customer. Customer purchase orders and/or contracts are generally used to determine the existence of an arrangement. Shipping documents and the completion of any customer acceptance requirements, when applicable, are used to verify product delivery or that services have been rendered. The Company assesses whether a price is fixed or determinable based upon the payment terms associated with the transaction and whether the sales price is subject to refund or adjustment.
The Company’s revenue is recognized net of value-added tax (VAT), reductions to revenue for estimated product returns, and sales discounts based on volume achieved in the same period that the related revenue is recorded. The estimates are based on historical sales returns, analysis of credit memo data and other factors known at the time. The sales discounts for the year ended December 31, 2014 and 2013 were not material.
We offer a right of exchange on our grain products sold through our relationships with grocery store networks. The consumer who purchases the product may exchange it for the same kind and quantity of product originally purchased. In accordance with FASB ASC 605-15-25-1 and 605-15-15-2, these are not considered returns for revenue recognition purposes. The returns of our products for the year ended December 31, 2014 and 2013 were not material.
Advertising costs
The Company expenses the cost of advertising as incurred or, as appropriate, the first time the advertising takes place. Advertising costs for the year ended December 31, 2014 and 2013 were $423,498 and $298,040, respectively.
Research and development
The Company expenses its research and development costs as incurred. Research and development expenses for the year ended December 31, 2014 and 2013 were not material.
Stock-based compensation
In December 2004, the Financial Accounting Standard Board, or the FASB, issued the Statement of Financial Accounting Standards, or SFAS, No. 123(R), “Share-Based Payment”, which replaces SFAS No. 123 and supersedes APB Opinion No. 25. SFAS No. 123(R) is now included in the FASB’s ASC Topic 718, “Compensation – Stock Compensation.” Under SFAS No. 123(R), companies are required to measure the compensation costs of share-based compensation arrangements based on the grant-date fair value and recognize the costs in the financial statements over the period during which employees or independent contractors are required to provide services. Share-based compensation arrangements include stock options and warrants, restricted share plans, performance-based awards, share appreciation rights and employee share purchase plans. In March 2005, the SEC issued Staff Accounting Bulletin No. 107, or SAB 107, which expresses views of the staff regarding the interaction between SFAS No. 123(R) and certain SEC rules and regulations and provides the staff’s views regarding the valuation of share-based payment arrangements for public companies. SFAS No. 123(R) permits public companies to adopt its requirements using one of two methods. On April 14, 2005, the SEC adopted a new rule amending the compliance dates for SFAS No. 123(R). Companies may elect to apply this statement either prospectively, or on a modified version of retrospective application under which financial statements for prior periods are adjusted on a basis consistent with the pro forma disclosures required for those periods under SFAS No. 123.
| - 55 - |
The Company has fully adopted the provisions of FASB ASC 718 and related interpretations as provided by SAB 107. As such, compensation cost is measured on the date of grant as the fair value of the share-based payments. Such compensation amounts, if any, are amortized over the respective vesting periods of the option grant.
Income taxes
The Company accounts for income taxes in accordance with FASB ASC Topic 740, “Income Taxes.” ASC 740 requires a company to use the asset and liability method of accounting for income taxes, whereby deferred tax assets are recognized for deductible temporary differences, and deferred tax liabilities are recognized for taxable temporary differences. Temporary differences are the differences between the reported amounts of assets and liabilities and their tax bases. Deferred tax assets are reduced by a valuation allowance when, in the opinion of management, it is more likely than not that some portion, or all of, the deferred tax assets will not be realized. Deferred tax assets and liabilities are adjusted for the effects of changes in tax laws and rates on the date of enactment.
Under ASC 740, a tax position is recognized as a benefit only if it is “more likely than not” that the tax position would be sustained in a tax examination, with a tax examination being presumed to occur. The amount recognized is the largest amount of tax benefit that is greater than 50% likely of being realized on examination. For tax positions not meeting the “more likely than not” test, no tax benefit is recorded. The adoption had no material effect on the Company’s consolidated financial statements for the year 2014
Foreign currency translation and comprehensive income
U.S. GAAP requires that recognized revenue, expenses, gains, and losses be included in net income. Certain statements, however, require entities to report specific changes in assets and liabilities, such as gain or loss on foreign currency translation, as a separate component of the equity section of the balance sheet. Such items, along with net income, are components of comprehensive income. The functional currency of the Company is RMB. The unit of RMB is in Yuan. Translation gains are classified as an item of other comprehensive income in the stockholders’ equity section of the consolidated balance sheet.
Statement of cash flows
In accordance with FASB ASC Topic 230, “Statement of Cash Flows,” cash flows from the Company’s operations is calculated based upon the local currencies. As a result, amounts related to assets and liabilities reported on the consolidated statement of cash flows will not necessarily agree with changes in the corresponding balances on the consolidated balance sheets.
Recent pronouncements
In February 2013, the FASB issued ASU 2013-02, “Comprehensive Income (Topic 220): Reporting of Amounts Reclassified out of Accumulated Other Comprehensive Income.” This ASU does not change the current requirements for reporting net income or other comprehensive income in financial statements. However, this guidance requires an entity to provide information about the amounts reclassified out of accumulated other comprehensive income by component. In addition, an entity is required to present, either on the face of the statement where net income is presented or in the notes, significant amounts reclassified out of accumulated other comprehensive income by the respective line items of net income but only if the amount reclassified is required under U.S. GAAP to be reclassified to net income in its entirety in the same reporting period. For other amounts that are not required under U.S. GAAP to be reclassified in their entirety to net income, an entity is required to cross-reference to other disclosures required under U.S. GAAP that provide additional detail about those amounts. For public entities, the guidance is effective prospectively for reporting periods beginning after December 15, 2012. For nonpublic entities, the guidance is effective prospectively for reporting periods beginning after December 15, 2013. Early adoption is permitted. The adoption of this standard is not expected to have a material impact on the Company’s consolidated financial position and results of operations.
In July 2013, the FASB issued ASU 2013-11, “Income Taxes (Topic 740): Presentation of an Unrecognized Tax Benefit When a Net Operating Loss Carryforward, a Similar Tax Loss, or a Tax Credit Carryforward Exists.” An unrecognized tax benefit, or a portion of an unrecognized tax benefit, should be presented in the financial statements as a reduction to a deferred tax asset. To the extent a net operating loss carryforward, a similar tax loss, or a tax credit carryforward is not available at the reporting date under the tax law of the applicable jurisdiction to settle any additional income taxes that would result from the disallowance of a tax position or the tax law of the applicable jurisdiction does not require the entity to use, and the entity does not intend to use, the deferred tax asset for such purpose, the unrecognized tax benefit should be presented in the financial statements as a liability and should not be combined with deferred tax assets. The assessment of whether a deferred tax asset is available is based on the unrecognized tax benefit and deferred tax asset that exist at the reporting date and should be made presuming disallowance of the tax position at the reporting date. For public entities, the guidance is effective prospectively for reporting periods beginning after December 15, 2013. For nonpublic entities, the guidance is effective prospectively for reporting periods beginning after December 15, 2014. Early adoption is permitted. The adoption of this standard is not expected to have a material impact on the Company’s consolidated financial position and results of operations.
| - 56 - |
In December 2013, the FASB issued ASU 2013-12, “Definition of a Public Business Entity”. The Board has decided that it should proactively determine which entities would be within the scope of the Private Company Decision-Making Framework: A Guide for Evaluating Financial Accounting and Reporting for Private Companies (Guide). This will aim to minimize the inconsistency and complexity of having multiple definitions of, or a diversity in practice as to what constitutes, a nonpublic entity and public entity within U.S. generally accepted accounting principles (GAAP) on a going-forward basis. This Update addresses those issues by defining public business entity. The Accounting Standards Codification includes multiple definitions of the terms nonpublic entity and public entity. The amendment in this Update improves U.S. GAAP by providing a single definition of public business entity for use in future financial accounting and reporting guidance. The amendment does not affect existing requirements. There is no actual effective date for the amendment in this Update. However, the term public business entity will be used in Accounting Standards Updates which are the first Updates that will use the term public business entity. The adoption of this standard is not expected to have a material impact on the Company’s consolidated financial position and results of operations.
In May 2014, the FASB issued ASU 2014-9, “Revenue from Contracts with Customers”. The core principle of the guidance is that an entity should recognize revenue to depict the transfer of promised goods or services to customers in an amount that reflects the consideration to which the entity expects to be entitled in exchange for those goods or services. An entity should disclose sufficient information to enable users of financial statements to understand the nature, amount, timing, and uncertainty of revenue and cash flows arising from contracts with customers. For a public entity, the amendments in this Update are effective for annual reporting periods beginning after December 15, 2016, including interim periods within that reporting period. Early application is not permitted. The adoption of this standard is not expected to have a material impact on the Company’s consolidated financial position and results of operations.
In August 2014, the FASB issued ASU 2014-15, “Presentation of Financial Statements—Going Concern (Subtopic 205-40)”. In connection with preparing financial statements for each annual and interim reporting period, an entity’s management should evaluate whether there are conditions or events, considered in the aggregate, that raise substantial doubt about the entity’s ability to continue as a going concern within one year after the date that the financial statements are issued (or within one year after the date that the financial statements are available to be issued when applicable). The amendments in this Update are effective for the annual period ending after December 15, 2016, and for annual periods and interim periods thereafter. Early application is permitted. The adoption of this standard is not expected to have a material impact on the Company’s consolidated financial position and results of operations.
NOTE 3. ACCOUNTS RECEIVABLE
Accounts receivable consisted of the following:
| December 31, | December 31, | |||||||
| 2014 | 2013 | |||||||
| Accounts receivable | $ | 22,873,889 | $ | 33,311,614 | ||||
| Less: Allowance for doubtful accounts | (1,337,364 | ) | (984,717 | ) | ||||
| Accounts receivable, net | $ | 21,536,525 | $ | 32,326,897 | ||||
| - 57 - |
NOTE 4. INVENTORY
Inventory consisted of the following:
| December 31, | December 31, | |||||||
| 2014 | 2013 | |||||||
| Raw materials | $ | 751,095 | $ | 1,020,486 | ||||
| Work in process | - | 49,717 | ||||||
| Finished goods | 8,125,176 | 17,752,203 | ||||||
| Supplies | 1,080,242 | 1,099,747 | ||||||
| Reserve for inventory valuation | (140,582 | ) | (4,603,929 | ) | ||||
| Total Inventory | $ | 9,815,931 | $ | 15,318,224 | ||||
The balance of reserve for inventory valuation as of December 31, 2014 and December 31, 2013 was $140, 582 and $4,603,929 respectively.
NOTE 5. PREPAID EXPENSES
Prepaid expenses consisted of the following:
| December 31, | December 31, | |||||||
| 2014 | 2013 | |||||||
| Deductible value-added taxes (VAT) | $ | 637,612 | $ | 356,876 | ||||
| Prepaid rent | 290,190 | 368,827 | ||||||
| Prepaid other expenses | 11,627 | 435,599 | ||||||
| Total | $ | 939,429 | $ | 1,161,302 | ||||
NOTE 6. PROPERTY, PLANT, AND EQUIPMENT
Property, plant, and equipment consisted of the following:
| December 31, | December 31, | |||||||
| 2014 | 2013 | |||||||
| Automobiles | $ | 1,021,089 | $ | 1,046,542 | ||||
| Buildings | 16,587,178 | 17,480,188 | ||||||
| Office equipment | 986,892 | 1,012,007 | ||||||
| Machinery and equipment | 8,869,381 | 8,386,357 | ||||||
| Furniture and fixtures | 111,615 | 114,398 | ||||||
| Total cost | 27,576,155 | 28,039,492 | ||||||
| Less: Accumulated depreciation | (10,556,028 | ) | (8,788,441 | ) | ||||
| Property, plant, and equipment, net | $ | 17,020,127 | $ | 19,251,051 | ||||
The buildings owned by the Company located in Jinzhong and Quwo in Shanxi Province, China are used for production, warehousing and offices for our corn and grains business.
As of December 31, 2014, $5.7 million (RMB 35.2 million) of buildings, machinery and equipment owned by the Taizihu Group were pledged as collateral for short-term bank loans.
Depreciation expense for the year ended December 31, 2014 and 2013 was $1,767,588 and $1,983,394, respectively.
| - 58 - |
NOTE 7. CONSTRUCTION-IN-PROGRESS
Construction-in-progress amounted to $353, 963 as of December 31, 2014 was mainly represents the cost of the water purification system, building and workshop decoration of a new bean-based products production line in Huichun.
NOTE 8. INTANGIBLE ASSETS
Intangible assets consisted of the following:
| December 31, | December 31, | |||||||
| 2014 | 2013 | |||||||
| Land use rights | $ | 14,341,429 | $ | 14,698,916 | ||||
| Software-ERP System and B2C platform | 740,945 | 1,081,531 | ||||||
| Less: Accumulated amortization | (1,110,323 | ) | (1,277,565 | ) | ||||
| Impairment loss | (6,512,731 | ) | (6,675,073 | ) | ||||
| Total | $ | 7,459,320 | $ | 7,827,809 | ||||
According to government regulations of the PRC, the PRC Government owns all land. The Company owns the land use rights of farmland and industrial land.
JingzhongDeyu, one of the Company-owned land use rights of the 17,000 acres of farmlands in Jinzhong, Shanxi Province. There is no active market for trading of land use rights of those farmlands and the Company could not assess the fair market value of the land use rights based on quoted prices in active markets. The Company assessed fair value of the land use rights based on discounted cash flow and determined that it was less than the carrying value. The balance of impairment of farmland use rights as of December 31, 2014 and December 31, 2013 was $5,819,359 and $5,832,800, respectively. As of December 31, 2014, the original value of the land use rights of the farmland was $7,516,359 and was written-down to $1,697,000.
The Company determined the ERP system and B2C platform owned by JingzhongDeyu for retail sales of the Grain Division was not applicable for its current business operations due to the reduction of retail sales. The balance of impairment of ERP system and B2C platform as of December 31, 2014 and December 31, 2013 was $738,396 and $740,102, respectively. As of December 31, 2014, the carrying value of ERP system and B2C platform was $1,047,610 and was written down to $0.
The Company leases and has obtained a certificate of right of use on 11,667 square meters with the PRC Government in Jinzhong, Shanxi Province where JinzhongDeyu's buildings and production facility are located. The term of the right is four to five years and is automatically renewed upon expiration. The right was fully amortized as of December 31, 2010 using the straight-line method. On June 18, 2012, the Company received the extended land use right certificate and the term of the right was extended to March 14, 2037.
Huichun leases and has obtained a certificate of right to use on 100,000 square meters of industrial land with the PRC Government in Quwo County, Shanxi Province where Taizihu Group’s buildings and production facility are located. The term of the right is 50 years from October 28, 2008 to October 27, 2058. The amortization of the land use right was commenced in October 2008 using the straight-line method over 50 years.
As of December 31, 2014, $3,892,585 (RMB 19 million) of the land use right owned by Taizihu Group was pledged as collateral for short-term bank loans.
Amortization expense of the intangible assets for the year ended December 31, 2014 and 2013 was $167,242 and $382,826, respectively.
| - 59 - |
NOTE 9. SHORT-TERM LOANS
Short-term loans consisted of the following:
| December 31, | December 31, | |||||||
| 2014 | 2013 | |||||||
| Bank loan payable to Agriculture Development Bank of China, bearing interest at the prime rate based on six-month to one-year loan interest rate released by The People's Bank of China. The actual interest rates as of December 31, 2014 and December 31, 2013 were 6.00% and the pass-due interest rate was 7.8%. The term of the loan started from August 14, 2012 with maturity date on August 13, 2013. The loan was obtained by Taizihu and pledged by its buildings and land use right. On July 31, 2013 the loan was repaid for $66,075 (or RMB400,000). As of December 31, 2014, the loan balance was $2,353,093 (or RMB14,600,000). As of the date of this filing, the Company has been in negotiation with the lender on renewal of the loan. The Company is not currently able to predict the probability of the success on the renewal and will repay the loan immediately if the loan cannot be renewed. | $ | 2,353,093 | $ | 2,411,748 | ||||
| Bank loan payable to Agriculture Development Bank of China, bearing interest at the prime rate, based on six-month to one-year loan interest rate released by The People's Bank of China. The actual interest rates as of December 31, 2014 and December 31, 2013 were 6.0% and the pass-due interest rate was 7.8%. The term of the loan started from September 18, 2012 with maturity date on September 17, 2013. The loan was obtained by Taizihu and pledged by its buildings and land use right. As of the date of this filing, the Company has been in negotiation with the lender on renewal of the loan. The Company is not currently able to predict the probability of the success on the renewal and will repay the loan immediately if the loan cannot be renewed. | 1,450,537 | 1,486,694 | ||||||
| Bank loan payable to Jinzhong City Yuci District Rural Credit Union Co., Ltd., bearing interest at a fixed rate of prime rate plus 145% of prime rate, of which prime rate was based on six-month to one-year loan interest rate released by The People's Bank of China. The actual interest rates as of December 31, 2014 were 14.688%. The renewed term of the loan started from September 12, 2014 with maturity date on September 11, 2015. The loan was obtained by JinzhongYongcheng and guaranteed by YuciJinmao Food Processing Factory, a related party, for a period of two years starting from September 17, 2015. | 1,369,951 | - | ||||||
| Bank loan payable to Jinzhong City Yuci District Rural Credit Union Co., Ltd., bearing interest at a fixed rate of prime rate plus 145% of prime rate, of which prime rate was based on six-month to one-year loan interest rate released by The People's Bank of China. The actual interest rates as of December 31, 2014 were 14.688%. The renewed term of the loan started from September 12, 2014 with maturity date on September 11, 2015. The loan was obtained by JinzhongYuliang and guaranteed by YuciJinmao Food Processing Factory, a related party, for a period of two years starting from September 17, 2015. | 1,369,951 | - | ||||||
| Bank loan payable to Agriculture Development Bank of China, bearing interest at the prime rate, based on six-month to one-year loan interest rate released by The People's Bank of China. The actual interest rate as of December 31, 2014 was 6.0% and the pass-due interest rate was 7.8%. The term of the loan started from January 4, 2013 with maturity date on January 3, 2014. The loan was obtained by Taizihu and pledged by its buildings and land use right. As of the date of this filing, the Company has been in negotiation with the lender on renewal of the loan. The Company is not currently able to predict the probability of the success on the renewal and will repay the loan immediately if the loan cannot be renewed. | 725,269 | 743,347 | ||||||
| Bank loan payable to Bank of Communications Gongzhufensubbranch, bearing interest at a fix rate of prime rate, of which prime rate was based on one-year loan interest rate released by The People's Bank of China. The term of the loan started from December 15, 2013 with maturity date on December 16, 2014. The loan was obtained by Detian Yu. The loan was paid off on December 25, 2014. | - | 14,867 | ||||||
| Bank loan payable to Jinzhong City Yuci District Rural Credit Union Co., Ltd., bearing interest at a fixed rate of prime rate plus 130% of prime rate, of which prime rate was based on six-month to one-year loan interest rate released by The People's Bank of China. The actual interest rates as of June 30, 2014 were 15.084%. The term of the loan started from September 6, 2013 with maturity date on August 22, 2014. The loan was obtained by JinzhongYongcheng and guaranteed by YuciJinmao Food Processing Factory, a related party, for a period of two years starting from August 23, 2014. The loan was paid off on September 11, 2014. | - | 1,404,100 | ||||||
| Bank loan payable to Jinzhong City Yuci District Rural Credit Union Co., Ltd., bearing interest at a fixed rate of prime rate plus 130% of prime rate, of which prime rate was based on six-month to one-year loan interest rate released by The People's Bank of China. The actual interest rates as of June 30, 2014 were 15.084%. The term of the loan started from September 6, 2013 with maturity date on August 22, 2014. The loan was obtained by JinzhongYongcheng and guaranteed by YuciJinmao Food Processing Factory, a related party, for a period of two years starting from August 23, 2014. The loan was paid off on September 11, 2014. | - | 1,404,100 | ||||||
| Total | $ | 7,268,801 | $ | 7,464,856 | ||||
NOTE 10. ACCRUED EXPENSES
Accrued expenses consisted of the following:
| December 31, | December 31, | |||||||
| 2014 | 2013 | |||||||
| Accrued VAT and other taxes | $ | 422,049 | $ | 261,714 | ||||
| Accrued payroll | 179,117 | 167,046 | ||||||
| Others | 805,353 | 574,125 | ||||||
| Total | $ | 1,406,519 | $ | 1,002,885 | ||||
| - 60 - |
NOTE 11. LOSS ON INVENTORY VALUATION RESERVE
Loss on inventory valuation reserve for the year ended December 31, 2013 represents $4,391,580 of loss on inventory valuation reserve due to the quality deterioration of some of the corn inventories caused by extreme weather condition and $86,594 of loss on inventory valuation reserve for obsolete grain products.
NOTE 12. LOSS ON IMPAIRMENT OF ASSET VALUATION
Loss on impairment of asset valuation was $7,346,776 for the year ended December 31, 2013, which represents $5,832,800 impairment loss of the land use rights of farmland located in Jinzhong, Shanxi Province, $773,874 loss resulted from the termination of the construction of an uncompleted building in the subsidiary Huichun, and $740,102 loss resulted from the idle ERP system for retail sales in the Grain Division.
NOTE 13. INCOME TAXES
United States
Deyu Agriculture Corp. is incorporated in the State of Nevada in the United States of America and is subject to the U.S. federal and state taxation. No provision for income taxes have been made as the Company has no taxable income in the U.S. The applicable income tax rate for the Company for the year ended December 31, 2014 and 2013 was 34%. No tax benefit has been realized since a 100% valuation allowance has offset deferred tax asset resulting from the net operating losses.
British Virgin Islands
City Zone, a wholly-owned subsidiary of the Company, is incorporated in the BVI and, under the current laws of the BVI, is not subject to income taxes.
Hong Kong
Most Smart, a wholly-owned subsidiary of the Company, is incorporated in Hong Kong. Most Smart is subject to Hong Kong taxation on its activities conducted in Hong Kong and income arising in or derived from Hong Kong. No provision for income taxes have been made as Most Smart has no taxable income in Hong Kong.
People’s Republic of China
Under the Enterprise Income Tax (“EIT”) Law of the PRC, the standard EIT rate is 25%. The PRC subsidiaries of the Company are subject to PRC income taxes on an entity basis on income arising in or derived from the tax jurisdiction in which they operate. According to the Tax Pronouncement [2008] No. 149 issued by the State Administration of Tax of the PRC, the preliminary processing industry of agricultural products is entitled to EIT exemption starting January 1, 2008. Three of the Company’s wholly-owned subsidiaries located in the Shanxi Province, China, including JinzhongDeyu, JinzhongYongcheng and JinzhongYuliang, are subject to the EIT exemption. All other subsidiaries are subject to the 25% EIT rate.
The provision for income taxes on income consisted of the following for the year ended December 31, 2014 and 2013:
| For The Year Ended | ||||||||
| December 31, | ||||||||
| 2014 | 2013 | |||||||
| Current income tax expense (benefit) | ||||||||
| U.S. | $ | - | $ | - | ||||
| PRC | 501,262 | 604,450 | ||||||
| Total current expense (benefit) | $ | 501,262 | $ | 604,450 | ||||
| Deferred income tax expense (benefit) | ||||||||
| U.S. | $ | - | $ | - | ||||
| PRC | - | - | ||||||
| Income tax expense (benefit) | $ | 501,262 | $ | 604,450 | ||||
| - 61 - |
The following is a reconciliation of the statutory tax rate to the effective tax rate for the year ended December 31, 2014 and 2013:
| For The Year Ended | ||||||||
| December 31, | ||||||||
| 2014 | 2013 | |||||||
| Expected U.S. income tax expense | 34.0 | % | 34.0 | % | ||||
| Increase (decrease) in taxes resulting from: | ||||||||
| Tax-exempt income | -33.9 | % | -28.1 | % | ||||
| Foreign tax differential | 0.3 | % | -1.8 | % | ||||
| Change in valuation allowance | 3.4 | % | -8.5 | % | ||||
| Intercompany elimination | 0.0 | % | 2.0 | % | ||||
| Other | -6.9 | % | 0.1 | % | ||||
| Income tax expense | -3.0 | % | -2.3 | % | ||||
Significant components of the Company’s net deferred tax assets as of December 31, 2014 and December 31, 2013 are presented in the following table:
| December 31, | December 31, | |||||||
| 2014 | 2013 | |||||||
| Deferred tax assets | ||||||||
| Net operating loss carryforwards (NOL) | $ | 5,696,456 | $ | 5,090,602 | ||||
| Share-based compensation | 407,099 | 435,844 | ||||||
| Others | 438,122 | 440,331 | ||||||
| Total | 6,541,677 | 5,966,777 | ||||||
| Less: Valuation allowance | (6,541,677 | ) | (5,966,777 | ) | ||||
| Total deferred tax assets, net | $ | - | $ | - | ||||
As of December 31, 2014, the Company accrued a 100% valuation allowance on its deferred tax assets based on the assessment on the probability of future reversion.
| - 62 - |
NOTE 14. EXTRAORDINARY LOSS (AFTER TAXES)
On April 19, 2013 , an unexpected heavy snow storm collapsed the warehouses located in Taiyuan, Shanxi Province which were leased by the Company’s Grain Division and caused about $1,212,430 in damage to our grain goods stored in those warehouses.
NOTE 15. NET INCOME (LOSS) PER SHARE
Reconciliation of the basic and diluted net income (loss) per share was as follows:
| Amounts | Shares | Per Share | ||||||||||
| (Numerator) | (Denominator) | Amount | ||||||||||
| For the Year ended December 31, 2014: | ||||||||||||
| Net income (loss) attributable to common stockholders - basic | $ | (17,356,472 | ) | 10,974,596 | $ | (1.58 | ) | |||||
| Preferred dividends applicable to convertible preferred stocks | - | - | ||||||||||
| Net income (loss) attributable to common stockholders - diluted | $ | (17,356,472 | ) | 10,974,596 | $ | (1.58 | ) | |||||
| For the Year ended December 31, 2013: | ||||||||||||
| Net income (loss) attributable to common stockholders - basic | $ | (26,818,546 | ) | 10,625,170 | $ | (2.52 | ) | |||||
| Preferred dividends applicable to convertible preferred stocks | ||||||||||||
| Net income (loss) attributable to common stockholders - diluted | $ | (26,818,546 | ) | 10,625,170 | $ | (2.52 | ) | |||||
NOTE 16. SHAREHOLDERS’ EQUITY
Reverse Acquisition and Private Placement
On April 27, 2010, we completed the acquisition of City Zone by means of a Share Exchange with (i) City Zone, (ii) the City Zone Shareholders and (iii) our principal shareholders (see NOTE 1). Pursuant to the terms of the Share Exchange, Expert Venture and the other City Zone Shareholders transferred to us all of the shares of City Zone in exchange for the issuance of 8,736,932 shares of our common stock so that Expert Venture and the other minority shareholders of City Zone shall own at least a majority of our outstanding shares.
Our directors approved the Share Exchange and the transactions contemplated thereby. The directors of City Zone also approved the Share Exchange and the transactions contemplated thereby.
As a result of the Share Exchange, we acquired 100% of the equity interests of City Zone, the business and operations of which now constitute our primary business and operations through its wholly-owned PRC subsidiaries. Specifically, as a result of the Share Exchange:
| · | We issued 8,736,932 shares of our common stock to the City Zone Shareholders; | |
| · | The ownership position of our shareholders who were holders of common stock immediately prior to the Share Exchange changed from 100% to 9.5% (fully diluted) of our outstanding shares; and | |
| · | City Zone Shareholders were issued our common stock constituting approximately 65.71% of our fully diluted outstanding shares. |
Immediately after the Share Exchange, we entered into a securities purchase agreement (the “Purchase Agreement”) with certain accredited investors (the “Investors”) for the issuance and sale in a private placement of 1,866,174 Units at $4.40 per Unit, with each Unit consisting of one share of Series A convertible preferred stock, par value $ 0.001 per share (the “Investor Shares”) and a warrant to purchase 0.4 shares of our common stock with an exercise price of $ 5.06 per share (the “Warrants”). We initially received gross proceeds from the sale of the 1,866,174 Investor Shares and Warrants to purchase up to 746,479 shares of our common stock of $8,211,166 (the “Private Placement”).
In connection with the Private Placement, we also entered into a registration rights agreement (the “Registration Rights Agreement”) with the Investors, in which we agreed to file a registration statement (the “Registration Statement”) with the Securities and Exchange Commission (the “SEC”) to register for resale the Investor Shares, within 60 calendar days of April 27, 2010, and use our best efforts to have the Registration Statement declared effective within 180 calendar days of April 27, 2010. On October 21, 2010, the SEC declared the Registration Statement effective and no liquidated damages were incurred.
| - 63 - |
In connection with the Private Placement, Maxim Group, LLC acted as our financial advisor and placement agent (the “Placement Agent” or “Maxim”). The Placement Agent received a cash fee equal to 7% of the gross proceeds of the Private Placement. Maxim also received warrants to purchase 171,911 shares of our common stock at a price per share of $4.84 (the “Placement Agent Warrants”). Pursuant to the original placement agreement entered into by and between Detian Yu and the Placement Agent on January 27, 2010 (the “Original Placement Agreement”), we engaged the Placement Agent to act as the exclusive agent to sell the Units in this offering on a “commercially reasonable efforts basis.” The Placement Agent also received a cash corporate finance fee equally to 1% of our gross proceeds raised in the offering, payable at the time of each closing; five (5) year warrants to purchase that number of shares of Series A convertible preferred stock equal to 5% of the aggregate number of shares of Series A convertible preferred stock underlying the Units issued pursuant to the offering; and a non-refundable cash retainer of $25,000 payable upon the execution of the retainer agreement. We also agreed to pay for all of the reasonable expenses the Placement Agent incurred in connection with the offering.
On May 10, 2010, we closed on the second and final round of the private placement offering for the issuance and sale of 589,689 Units, consisting of 589,689 shares of Series A convertible preferred stock and 235,883 five-year Series A Warrants with an exercise price of $ 5.06 per share, to certain Investors for total gross proceeds of $2,594,607.
We raised an aggregate amount of $10,805,750 in the offering in two closing events. As of the final closing, we had 9,999,999 shares of common stock issued and outstanding. In connection with the offering, we issued a total of 2,455,863 shares of Series A convertible preferred shares and 982,362 Series A Warrants to the investors. Additionally, the Placement Agent received 171,911 warrants.
Common Stock
As of the final closing of the Private Placement, we had 9,999,999 shares of common stock issued and outstanding. Between the final closing of the Private Placement and December 31, 2014, an aggregate of 964,329 shares of Series A convertible preferred stock were converted into 964,329 shares of common stock, and 80,000 common stocks were issued. As of December 31, 2014, the total number of shares of common stock issued and outstanding was 11,044,328 shares.
Series A Convertible Preferred Stock
Holders of Series A convertible preferred stock (“Series A Preferred”) are entitled to receive cumulative dividends in preference to the holders of our common stock at an annual rate of 5% of the applicable per Series A Preferred original purchase price (the “Dividend Preference” and the “Dividends”). If, after the Dividend Preference has been fully paid or declared and set apart, the Company shall make any additional distributions, then the holders of Series A Preferred shall participate with the holders of common stock on an as-converted basis with respect to such distributions. Dividends are payable in cash or shares of Series A Preferred, at the Company’s option.
Upon any liquidation, dissolution or winding up of the Company, the holders of Series A Preferred will be entitled to receive, out of the assets of the Company available for distribution to its shareholders, an amount equal to $4.40 per share (the “Liquidation Preference Amount”), before any payment shall be made or any assets distributed to the holders of the common stock (the “Liquidation Preference”).
| - 64 - |
Each holder of Series A Preferred will have the right, at the option of the holder at any time on or after the issuance of the Series A Preferred, without the payment of additional consideration, to convert the Series A Preferred into a number of fully paid and nonassessable shares of common stock equal to: (i) the Liquidation Preference Amount of such share divided by (ii) the Conversion Price in effect as of the date of the conversion in accordance with the Certificate of Designations of the Series A Preferred.
For a period of two (2) years following the issuance of the Series A Preferred, the conversion price of Series A Preferred was subject to adjustment for issuances of common stock (or securities convertible or exchangeable into shares of common stock) at a purchase price less than the conversion price of the Series A Preferred. The Series A Preferred does not contain any repurchase or redemption rights.
Current accounting standards require that we evaluate the terms and conditions of convertible preferred stock to determine (i) if the nature of the hybrid financial instrument, based upon its economic risks, is more akin to an equity contract or a debt contract for purposes of establishing classification of the embedded conversion feature and (ii) the classification of the host or hybrid financial instrument. Based upon a review of the terms and conditions of the Series A Preferred, the Company has concluded that the financial instrument is more akin to an equity financial instrument. The major consideration underlying this conclusion is that the Series A Preferred is a perpetual financial instrument with no stated maturity or redemption date, or other redemption that is not within the Company’s control. Other considerations in support of the equity conclusion included the voting rights and conversion feature into common shares. While the cumulative dividend feature may, in some instances, be likened to a debt-type coupon, the absence of a stated maturity date was determined to establish the cumulative dividend as a residual return, which does not obviate the equity nature of the financial instrument. Further, there are no cash redemption features that are not within the control of our management. As a result, classification in shareholders’ equity is appropriate for the Series A Preferred.
As of December 31, 2014, an aggregate of 964,329 shares of Series A Preferred were converted into 964,329 shares of common stock and an aggregate of 403,458 shares of Series A Preferred were issued as dividends to the shareholders of Series A Preferred. As of December 31, 2014, the total number of shares of Series A Preferred issued and outstanding was 1,894,992 shares.
For the year ended December 31, 2014 and 2013, the Company recorded $418,624 and $478,769 in preferred dividend expenses, respectively.
Series A Warrants
We issued Series A Warrants to the Investors and the Placement Agent having strike prices of $5.06 and $4.84, respectively, and they expire five (5) years from the original date of issuance. The strike prices are subject to adjustment only for changes in our capital structure, but allow for cashless exercise under a formula that limits the aggregate issuable common shares. There are no redemption features embodied in the warrants and they have met the conditions provided in current accounting standards for equity classification.
There were 982,362 Series A Warrants sold together with the Series A Preferred to the Investors, each of which:
| (a) | entitles the holder to purchase one (1) share of common stock; |
| (b) | are exercisable at any time after consummation of the transactions contemplated by the Purchase Agreement and shall expire on the date that is five years following the original issuance date of the Series A Warrants; |
| (c) | are exercisable, in whole or in part, at an exercise price of $5.06 per share of common stock; and |
| (d) | are exercisable only for cash (except that there will be a cashless exercise option if, after twelve months from the Issue Date, (i) the Per Share Market Value of one share of common stock is greater than the Warrant Price (at the date of calculation) and (ii) a registration statement under the Securities Act providing for the resale of the common stock issuable upon exercise of Warrant Shares is not in effect, in lieu of exercising the Series A Warrant by payment of cash). |
Aggregate gross proceeds from the two (2) closing events amounted to $10,805,750. Direct financing costs totaled $1,742,993, of which $1,555,627 was paid in cash and the balance of $187,366 represents the fair value of warrants linked to 171,911 shares of our common stock that were issued to Maxim. The proceeds and the related direct financing costs were allocated to the Series A Preferred and the Series A Warrants (classified in paid-in capital) based upon their relative fair values. The following table summarizes the components of the allocation:
| - 65 - |
| Paid-in | ||||||||||||
| Series A | Capital | |||||||||||
| Preferred | Warrants | Total | ||||||||||
| Fair values of financial instruments | $ | 10,248,092 | $ | 1,039,978 | $ | 11,288,070 | ||||||
| Gross proceeds | $ | 9,810,227 | $ | 995,523 | $ | 10,805,750 | ||||||
| Direct financing costs | (1,581,550 | ) | (161,443 | ) | (1,742,993 | ) | ||||||
| Fair value of placement agent warrants | - | 187,366 | 187,366 | |||||||||
| $ | 8,228,677 | $ | 1,021,446 | $ | 9,250,123 | |||||||
Fair value considerations:
Our accounting for the sale of Series A Preferred and Series A Warrants, and the issuance of the Series A Warrants to Maxim required the estimation of fair values of the financial instruments on the financing inception date. The development of fair values of financial instruments requires the selection of appropriate methodologies and the estimation of often subjective assumptions. We selected the valuation techniques based upon consideration of the types of assumptions that market participants would likely consider in exchanging the financial instruments in market transactions. The Series A Preferred was valued based upon a common stock equivalent method, enhanced by the cumulative dividend feature. The dividend feature was valued as the estimated cash flows of the dividends discounted to present value using an estimated weighted average cost of capital. The warrants were valued using a Black-Scholes-Merton Valuation Technique because it embodies all of the requisite assumptions (including trading volatility, estimated terms and risk free rates) necessary to fair value these instruments.
These fair values were necessary to develop relative fair value calculation for allocations of certain elements of the financing arrangement, principally proceeds and the related direct financing costs. The following tables reflect assumptions used to determine the fair value of the Series A Preferred:
| Series A | Series A | |||||||||||
| Fair Value | Preferred | Preferred | ||||||||||
| Hierarchy | April 27, | May 10, | ||||||||||
| Level | 2010 | 2010 | ||||||||||
| Indexed common shares | 1,866,174 | 589,689 | ||||||||||
| Components of fair value: | ||||||||||||
| Common stock equivalent value | $ | 6,631,403 | $ | 2,083,094 | ||||||||
| Dividend feature | 659,821 | 209,439 | ||||||||||
| $ | 7,291,224 | $ | 2,292,533 | |||||||||
| Significant assumptions: | ||||||||||||
| Common stock price | 3 | 3.55 | 3.53 | |||||||||
| Horizon for dividend cash flow projection | 3 | 2.00 | 2.00 | |||||||||
| Weighted average cost of capital ("WACC") | 3 | 15.91 | % | 15.55 | % | |||||||
Fair value hierarchy of the above assumptions can be categorized as follows:
| (1) | Level 1 inputs are quoted prices in active markets for identical assets and liabilities, or derived there from. There were no level 1 inputs. |
| (2) | Level 2 inputs are significant other observable inputs. There were no level 2 inputs. |
| (3) | Level 3 inputs are unobservable inputs. Inputs for which any parts are level 3 inputs are classified as level 3 in their entirety. |
| - 66 - |
| · | Stock price- Given that management did not believe our trading market price was indicative of the fair value of our common stock at the measurement date, the common stock price value was derived implicitly from an iterative process based upon the assumption that the consideration of the Private Placement was the result of an arm’s length transaction. The Private Placement was composed of shares of Series A Preferred and Series A Warrants which were both indexed to our common stock; accordingly, we used an iterative process to determine the value of our common stock in order for the fair value of the Series A Preferred and Series A Warrants to equal the amount of consideration received in the Private Placement. |
| · | Dividend horizon- We estimated the horizon for dividend payment at 2 years. |
| · | WACC- The rates utilized to discount the cumulative dividend cash flows to their present values were based on a weighted average cost of capital of 18.94 % and 18.60 %, as of April 27, 2010 and May 10, 2010, respectively. This discount rate was determined after consideration of the rate of return on debt capital and equity that typical investors would require in an investment in companies similar in size and operating in similar markets as Deyu Agriculture Corp. The cost of equity was determined using a build-up method which begins with a risk free rate and adds expected risk premiums designed to reflect the additional risk of the investment. Additional premiums or discounts related specifically to us and the industry are also added or subtracted to arrive at the final cost of equity rate. The cost of debt was determined based upon available financing terms. |
| · | Significant inputs and assumptions underlying the model calculations related to the warrant valuations are as follows: |
The following tables reflect assumptions used to determine the fair value of the Series A Warrants:
| Fair Value | April 27, 2010 | May 10, 2010 | ||||||||||||||||||
| Hierarchy | Investor | Agent | Investor | Agent | ||||||||||||||||
| Level | warrants | warrants | warrants | Warrants | ||||||||||||||||
| Indexed shares | 746,479 | 130,632 | 235,883 | 41,279 | ||||||||||||||||
| Exercise price | 5.06 | 4.84 | 5.06 | 4.84 | ||||||||||||||||
| Significant assumptions: | ||||||||||||||||||||
| Stock price | 3 | 3.55 | 3.55 | 3.53 | 3.53 | |||||||||||||||
| Remaining term | 3 | 5 years | 5 years | 5 years | 5 years | |||||||||||||||
| Risk free rate | 2 | 2.39 | % | 2.39 | % | 2.24 | % | 2.24 | % | |||||||||||
| Expected volatility | 2 | 45.25 | % | 45.25 | % | 45.47 | % | 45.47 | % | |||||||||||
Fair value hierarchy of the above assumptions can be categorized as follows:
| (1) | There were no Level 1 inputs. |
| (2) | Level 2 inputs include: |
| • | Risk-free rate- This rate is based on publicly-available yields on zero-coupon U.S. Treasury securities with remaining terms to maturity consistent with the remaining contractual term of the Series A Warrants. |
| • | Expected volatility- We did not have a historical trading history sufficient to develop an internal volatility rate for use in the model. As a result, we have used a peer approach wherein the historical trading volatilities of certain companies with similar characteristics as ours and who had a sufficient trading history were used as an estimate of our volatility. In developing this model, no one company was weighted more heavily than another. |
| - 67 - |
| (3) | Level 3 inputs include: |
| • | Stock price- Given that management did not believe our trading market price was indicative of the fair value of our common stock at the measurement date, the stock price was determined implicitly from an iterative process based upon the assumption that the consideration of the Private Placement was the result of an arm’s length transaction. | |
| • | Remaining term- We do not have a history to develop the expected term for our warrants. Accordingly, we have used the contractual remaining term in our calculations. |
The following is a summary of the status and activity of warrants outstanding as of December 31, 2014:
| Outstanding Warrants | ||||||||
| Exercise Price | Number of Warrants | Average Remaining Contractual Life | ||||||
| $ | 5.06 | 982,362 | 0.32 years | |||||
| $ | 4.84 | 171,911 | 0.32 years | |||||
| Total | 1,154,273 | |||||||
| Number of Warrants | ||||
| Outstanding as of January 1, 2014 | 1,154,273 | |||
| Granted | - | |||
| Forfeited | - | |||
| Exercised | - | |||
| Outstanding as of December 31, 2014 | 1,154,273 | |||
NOTE 17. SHARE-BASED COMPENSATION
As of December 31, 2014, the Company had one share-based compensation plan as described below. The compensation cost that had been charged against income for the plan was $2,375 and $ 44,504 for the year ended December 31, 2014 and 2013, respectively. The related income tax benefit recognized was $808 and $15,131 for the year ended December 31, 2014 and 2013, respectively. A 100 % valuation allowance was assessed against the deferred tax assets derived from such tax benefit as of December 31, 2014 and 2013.
On November 4, 2010, the Company’s Board of Directors approved the Company’s 2010 Share Incentive Plan. On November 8, 2010, a total of 931,000 non-qualified incentive stock options were approved by our Board of Directors and granted under the Plan to executives, key employees, independent directors, and consultants at an exercise price of $4.40 per share and on December 15, 2010, 40,000 non-qualified incentive stock shares were approved by our Board of Directors and granted under the Plan to a consultant at an exercise price of $4.40 per share, of which shall vest as follows:
33 1/3% of the option grants vested one (1) month after the date of grant;
33 1/3% of the option grants vested twelve (12) months after the date of grant; and
33 1/3% of the option grants will vest twenty-four (24) months after the date of grant.
On March 8, 2012, the Company’s Board of Directors increased the number of shares allocated to and authorized for use under the Plan from 1,000,000 shares to the maximum number of shares allowable pursuant to the terms of the Plan and granted 420,000 options under the Plan to independent directors, officers and key employees of the Company, of which included some new options and those re-granted after such options were forfeited by other former employees as a result of their resignations from the Company in accordance with the terms of their option agreements. All of the granted options vest as follows:
50 % of the options granted vested six (6) months after the date of the grant; and
| - 68 - |
50 % of the options granted vested twelve (12) months after the date of the grant.
On November 23, 2012, our Board of Directors allocated to and authorized to re-grant 150,000 options to a director of the Company after such options were forfeited by other former employees as a result of their resignations from the Company in accordance with the terms of their option agreements. All of the granted options vest as follows:
33 1/3% of the option grants vested one (1) month after the date of grant;
33 1/3% of the option grants vested twelve (12) months after the date of grant; and
33 1/3% of the option grants will vest twenty-four (24) months after the date of grant.
The fair value of each option award was estimated on the date of grant using a Black-Scholes option pricing model that uses the assumptions noted in the following table. The model is based on the assumption that it is possible to set up a perfectly hedged position consisting of owning the shares of stock and selling a call option on the stock. Any movement in the price of the underlying stock will be offset by an opposite movement in the options value, resulting in no risk to the investor. This perfect hedge is riskless and, therefore, should yield the riskless rate of return. As the Black-Scholes option pricing model applies to stocks that do not pay dividends, we made an adjustment developed by Robert Merton to approximate the option value of a dividend-paying stock. Under this adjustment method, it is assumed that the Company’s stock will generate a constant dividend yield during the remaining life of the options.
The following tables reflect assumptions used to determine the fair value of the option award:
Options granted on November 8, 2010:
| Exercisable Period | 12/8/2010 - 11/8/2020 |
11/8/2011 - 11/8/2020 |
11/8/2012 - 11/8/2020 |
|||||||||
| Risk-free Rate (%) | 1.12 | 1.27 | 1.46 | |||||||||
| Expected Lives (years) | 5.04 | 5.50 | 6.00 | |||||||||
| Expected Volatility (%) | 46.10 | 44.49 | 43.04 | |||||||||
| Expected forfeitures per year (%) | 0.00-55.00 | 0.00-55.00 | 0.00-55.00 | |||||||||
| Dividend Yield (%) | 0.00 | 0.00 | 0.00 | |||||||||
Options granted on December 15, 2010:
| Exercisable Period | 1/15/2011 - 12/15/2020 |
12/15/2011 - 12/15/2020 |
12/15/2012 - 12/15/2020 |
|||||||||
| Risk-free Rate (%) | 2.15 | 2.32 | 2.50 | |||||||||
| Expected Lives (years) | 5.04 | 5.50 | 6.00 | |||||||||
| Expected Volatility (%) | 46.15 | 44.52 | 43.09 | |||||||||
| Expected forfeitures per year (%) | 0.00 | 0.00 | 0.00 | |||||||||
| Dividend Yield (%) | 0.00 | 0.00 | 0.00 | |||||||||
Options granted on March 8, 2012:
| Exercisable Period | 09/08/2012 - 03/08/2020 |
03/08/2013 - 03/08/2020 |
||||||
| Risk-free Rate (%) | 0.94 | 1.00 | ||||||
| Expected Lives (years) | 5.25 | 5.49 | ||||||
| Expected Volatility (%) | 45.91 | 45.22 | ||||||
| Expected forfeitures per year (%) | 0.00 | 0.00 | ||||||
| Dividend Yield (%) | 0.00 | 0.00 | ||||||
| - 69 - |
Options granted on November 23, 2012:
| Exercisable Period | 12/23/2012 - 11/8/2020 |
11/23/2013 - 11/8/2020 |
11/23/2014 - 11/8/2020 |
|||||||||
| Risk-free Rate (%) | 0.53 | 0.60 | 0.68 | |||||||||
| Expected Lives (years) | 4.02 | 4.48 | 4.98 | |||||||||
| Expected Volatility (%) | 37.43 | 46.48 | 46.45 | |||||||||
| Expected forfeitures per year (%) | 0.00 | 0.00 | 0.00 | |||||||||
| Dividend Yield (%) | 0.00 | 0.00 | 0.00 | |||||||||
Fair value hierarchy of the above assumptions can be categorized as follows:
| (1) | There were no Level 1 inputs. |
| (2) | Level 2 inputs include: |
| · | Risk-free rate- This rate is based on continuous compounding of publicly-available yields on U.S. Treasury securities with remaining terms to maturity consistent with the expected term of the options at the dates of grant. |
| · | Expected volatility- We did not have a historical trading history sufficient to develop an internal volatility rate for use in the model. As a result, we have used a peer approach wherein the historical trading volatilities of certain companies with similar characteristics as ours and who had a sufficient trading history were used as an estimate of our volatility. In developing this model, no one company was weighted more heavily than another. |
| (3) | Level 3 inputs include: |
| · | Expected lives- The expected lives of options granted were derived from the output of the option valuation model and represented the period of time that options granted are expected to be outstanding. |
| · | Expected forfeitures per year- The expected forfeitures are estimated at the dates of grant and will be revised in subsequent periods pursuant to actual forfeitures, if significantly different from the previous estimates. |
The estimates of fair value from the model are theoretical values of stock options and changes in the assumptions used in the model could result in materially different fair value estimates. The actual value of the stock options will depend on the market value of the Company’s common stock when the stock options are exercised.
A summary of option activity under the Plan as of December 31, 2014, and changes during the year ended December 31, 2014 are presented below:
| Weighted- | ||||||||||||||
| Weighted- | Average | |||||||||||||
| Average | Remaining | Aggregate | ||||||||||||
| Exercise | Contractual | Intrinsic | ||||||||||||
| Options | Shares | Price | Term | Value | ||||||||||
| Outstanding as of January 1, 2014 | 750,000 | $ | 3.14 | |||||||||||
| Granted | - | $ | - | |||||||||||
| Exercised | - | $ | - | |||||||||||
| Forfeited | (80,000 | ) | $ | 4.40 | ||||||||||
| Outstanding as of December 31, 2014 | 670,000 | $ | 2.99 | 3.25 Years | $ | 537,202 | ||||||||
| Exercisable as of December 31, 2014 | 670,000 | $ | 2.99 | 3.03 Years | $ | 537,202 | ||||||||
| Vested and expected to vest (1) | 670,000 | $ | 2.99 | 3.25 Years | ||||||||||
| - 70 - |
(1) Includes vested shares and unvested shares after a forfeiture rate is applied.
A summary of the status of the Company’s unvested shares as of December 31, 2014, and changes during the year ended December 31, 2014, is presented below:
| Weighted- | ||||||||
| Average | ||||||||
| Grant- | ||||||||
| Date Fair | ||||||||
| Unvested Shares | Shares | Value | ||||||
| Unvested as of January 1, 2014 | 50,000 | $ | 3,573 | |||||
| Granted | - | - | ||||||
| Vested | (50,000) | (3,573) | ||||||
| Forfeited | - | - | ||||||
| Unvested as of December 31, 2014 | - | $ | - | |||||
NOTE 18. RELATED PARTY TRANSACTIONS
Due to related parties
| December 31, | December 31, | |||||||
| 2014 | 2013 | |||||||
| Due to Mr. He Hao | $ | 13,958 | $ | 14,306 | ||||
| Total | $ | 13,958 | $ | 14,306 | ||||
Mr. Hao He is the former shareholder of Huichun and Taizihu.
Guarantees
As of December 31, 2014, YuciJinmao Food Processing Factory, of which the legal representative is JunlianZheng, the wife of Junde Zhang, the previous Vice President of the Company, provided guarantees on short-term loans obtained by JinzhongYongcheng and JinzhongYuliang.
NOTE 19. SEGMENT REPORTING
The Company defined reportable segments according to ASC Topic 280. The segments, including corn division, grain division and bulk trading division, are identified primarily based on the structure of allocating resources and assessing performance of the group.
The corn division is in the business of purchasing corn from farmers, simple processing and distributing to agricultural product trading companies through wholesale. The business of the grain division is conducted by processing and distributing grains and other products. The business of the bulk trading division is conducted by bulk purchasing and the sale of raw grain.
| - 71 - |
| For the year ended | Corn | Grain | Bulk Trading |
|||||||||||||||||
| December 31, 2014 | Division | Division | Division | Others | Total | |||||||||||||||
| Revenues from external customers | $ | 75,263,798 | $ | 33,399,849 | $ | 1,013,573 | $ | 109,677,220 | ||||||||||||
| Loss on inventory valuation reserve | ||||||||||||||||||||
| Intersegment revenues | - | - | - | - | - | |||||||||||||||
| Interest revenue | 3,298 | 2,498 | 275 | 192 | 6,263 | |||||||||||||||
| Interest expense | (424,795 | ) | (357,939 | ) | - | (826 | ) | (783,560 | ) | |||||||||||
| Net interest (expense) income | (421,497 | ) | (355,441 | ) | 275 | (635 | ) | (777,297 | ) | |||||||||||
| Depreciation and amortization | (576,927 | ) | (1,376,640 | ) | (5,235 | ) | (215,246 | ) | (2,174,048 | ) | ||||||||||
| Noncontrolling interest | - | - | - | 1,039 | 1,039 | |||||||||||||||
| Segment net profit (loss) | (13,512,424 | ) | (424,133 | ) | (472,859 | ) | (2,529,471 | ) | (16,938,887 | ) | ||||||||||
| For the year ended | Corn | Grain | Bulk Trading | |||||||||||||||||
| December 31, 2013 | Division | Division | Division | Others | Total | |||||||||||||||
| Revenues from external customers | $ | 142,560,749 | $ | 41,637,805 | $ | 62,151,550 | - | $ | 246,350,104 | |||||||||||
| Loss on inventory valuation reserve | (4,391,580 | ) | (86,594 | ) | - | - | (4,478,174) | |||||||||||||
| Intersegment revenues | - | - | - | - | - | |||||||||||||||
| Interest revenue | 8,773 | 2,844 | 6,869 | 16,707 | 35,193 | |||||||||||||||
| Interest expense | (425,773 | ) | (316,831 | ) | (47,834 | ) | - | (790,438 | ) | |||||||||||
| Net interest (expense) income | (417,000 | ) | (313,987 | ) | (40,965 | ) | 16,707 | (755,245 | ) | |||||||||||
| Depreciation and amortization | (533,709 | ) | (1,718,252 | ) | (4,202 | ) | (110,058 | ) | (2,366,221 | ) | ||||||||||
| Noncontrolling interest | - | - | - | 4,160 | 4,160 | |||||||||||||||
| Segment net profit (loss) | (11,316,324 | ) | (2,614,032 | ) | (64,083 | ) | (12,349,498 | ) | (26,343,937 | ) | ||||||||||
Since April 2014, our grain business includes direct exporting the organic bean-based products to countries including the U.S., Australia, Canada, Israel, and Denmark. The export businesses were denominated in US Dollar. All long-lived assets are located in China. The following tables set forth our three major customers in each segment:
| For the Nine Months Ended | ||||||||
| December 31, | ||||||||
| 2014 | 2013 | |||||||
| Corn Division : | ||||||||
| Guangdong Wen‘s poultry Co., Ltd. | 5.4 | % | 0.8 | % | ||||
| Chengdu Zhengda Co., Ltd. | 4.7 | % | 3.3 | % | ||||
| ShuangliuZhengda Co., Ltd. | 4.4 | % | 2.3 | % | ||||
| Top Three Customers as % of Total Gross Sales: | 14.5 | % | 6.5 | % | ||||
| Grain Division : | ||||||||
| Deyufang Innovation Food (Beijing) Co., Ltd. | 64. 6 | % | 53.3 | % | ||||
| Ethical Food SA | 12.9 | % | 0.0 | % | ||||
| JingzhongShengde Grain Trading Co., Ltd. | 3.0 | % | 0.0 | % | ||||
| Top Three Customers as % of Total Gross Sales | 80.5 | % | 53.3 | % | ||||
| Bulk Trading Division : | ||||||||
| Shanxi Helifeihua Trading Co., Ltd. | 27.8 | % | 12.7 | % | ||||
| Shenzhen XinJiawang Agricultural By-products development Co. Ltd. | 14.6 | % | 4.2 | % | ||||
| Yuchi Kaiwang Grain and Oil Wholesale Department | 10.9 | % | 4.5 | % | ||||
| Top Three Customers as % of Total Gross Sales: | 53.4 | % | 21.4 | % | ||||
NOTE 20. CONCENTRATION OF CREDIT RISK
As of December 31, 2014 and December 31, 2013, all of the Company’s cash balances in banks were maintained within the PRC where no rule or regulation currently in place to provide obligatory insurance for bank deposits in the event of bank failure. However, the Company has not experienced any losses in such accounts and believes it is not exposed to such risks on its cash balances in banks.
| - 72 - |
For the year ended December 31, 2014 and 2013, the sales generated from overseas countries were $4, 308, 033 and $0, respectively. Accounts receivable as of December 31, 2014 and December 31, 2013 that were due from customers located outside of China were $328, 610 and $0, respectively.
For the year ended December 31, 2014, sales revenue generated from Deyufang Innovation Food (Beijing) Co., Ltd. accounted for 19.7% of the Company's consolidated gross revenue, while there was no single customer that accounted for greater than 10% of the Company's consolidated gross revenue for the year ended December 31, 2013.
As of December 31, 2014 the account receivable due from Deyufang Innovation Food (Beijing) Co., Ltd. accounted for 12.4% of the Company’s consolidated accounts receivable, while no single customer accounted for greater than 10% of the Company’s consolidated accounts receivable as of December 31, 2013.
NOTE 21. COMMITMENTS AND CONTINGENCIES
Lease Commitments
The Company leases railroad lines, warehouses and offices under operating leases. Future minimum lease payments under operating leases with initial or remaining terms of one year or more are as follows:
| As of December 31, | Operating Leases | |||
| 2015 | $ | 211,698 | ||
| 2016 | 187,592 | |||
| 2017 | 169,552 | |||
| 2018 | 169,552 | |||
| 2019 | 169,552 | |||
| Thereafter | 902,100 | |||
| $ | 1,810,046 | |||
NOTE 22. SUBSEQUENT EVENTS
Management has considered all events occurring through the date which the financial statements were available to be issued. All subsequent events requiring recognition as of December 31, 2014 have been incorporated into the accompanying consolidated and combined financial statements, and those requiring disclosure have been fully disclosed in accordance with FASB ASC Topic 855, “Subsequent Events”.
| - 73 - |