Attached files
| file | filename |
|---|---|
| 8-K - CURRENT REPORT ON FORM 8-K - Sow Good Inc. | blackridge_8k.htm |
| EX-99.1 - PRESS RELEASE - Sow Good Inc. | blackridge_ex9901.htm |
Exhibit 99.2
2014 Results and 2015 Plan OTCQB: ANFC Focused Growth in the Williston Basin March 30, 2015
Forward Looking Statements www.blackridgeoil.com 2 Statements made by representatives of Black Ridge Oil & Gas, Inc . (“Black Ridge” or the “Company”) during the course of this presentation that are not historical facts are “forward-looking statements” within the meaning of federal securities laws . These statements are based on certain assumptions and expectations made by the Company which reflect management’s experience, estimates and perception of historical trends, current conditions, anticipated future developments and other factors believed to be appropriate . No assurances can be given that such assumptions and expectations will occur as anticipated and actual results may differ materially from those implied or anticipated in the forward looking statements . Such statements are subject to a number of risks and uncertainties, many of which are beyond the control of the Company, and which include risks relating to the global financial crisis, our ability to obtain additional capital needed to implement our business plan, declines in prices and demand for gas, oil and natural gas liquids, loss of key personnel, lack of business diversification, reliance on strategic third-party relationships, ability to obtain rights to explore and develop oil and gas reserves, the rate of in - fill drilling on our leased acreage, financial performance and results, our indebtedness under our line of credit, our ability to replace reserves and efficiently develop our current reserves, our ability to make acquisitions on economically acceptable terms, our ability to effectively utilize hedging, our ability to become listed on a national exchange, and other important factors . Black Ridge undertakes no obligation to publicly update any forward-looking statements, whether as a result of new information or future events .
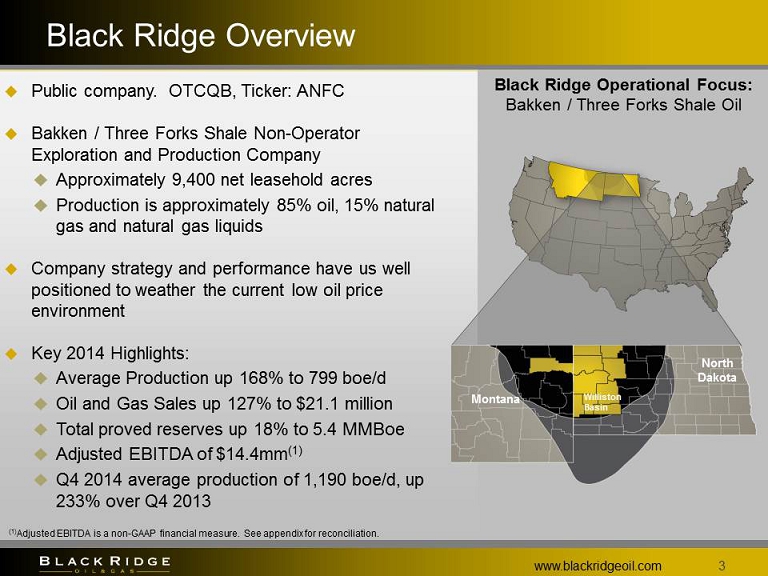
Black Ridge Overview www.blackridgeoil.com 3 Public company. OTCQB, Ticker: ANFC Bakken / Three Forks Shale Non - Operator Exploration and Production Company Approximately 9,400 net leasehold acres Production is approximately 85% oil, 15% natural gas and natural gas liquids Company strategy and performance have us well positioned to weather the current low oil price environment Key 2014 Highlights: Average Production up 168% to 799 boe /d Oil and Gas Sales up 127% to $21.1 million Total proved reserves up 18% to 5.4 MMBoe Adjusted EBITDA of $ 14.4mm (1) Q4 2014 average production of 1,190 boe /d, up 233% over Q4 2013 Black Ridge Operational Focus: Bakken / Three Forks Shale Oil North Dakota Montana Williston Basin (1) Adjusted EBITDA is a non - GAAP financial measure. See appendix for reconciliation.
Why The Non - Operator Business Model? www.blackridgeoil.com 4 Ability to selectively invest in the highest return projects, without the need to control a drilling unit Knowledge and data from approximately 350 gross wells to make capital allocation decisions Low cost structure Fragmented nature of non - operator leaseholds will continue to provide growth opportunity as the play matures Flexible capex decision - making: option to participate in all well proposals from operating partners
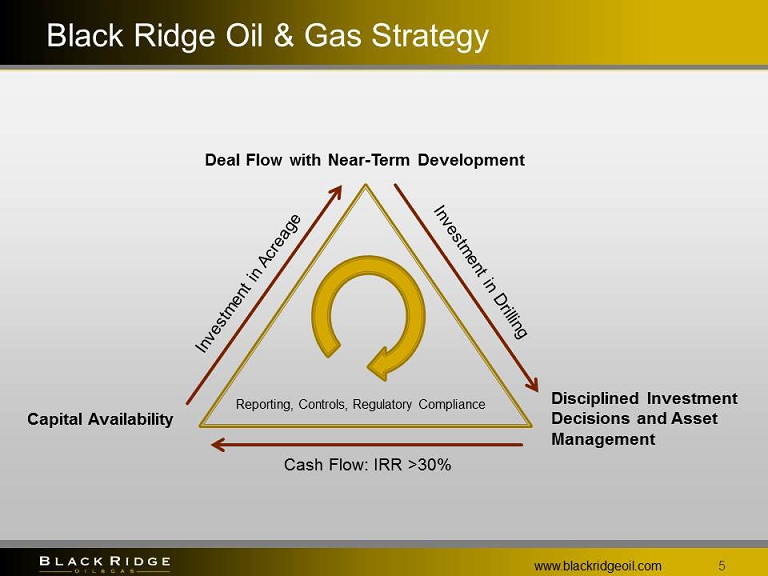
Black Ridge Oil & Gas Strategy www.blackridgeoil.com 5 Deal Flow with Near - Term Development Disciplined Investment D ecisions and Asset Management Capital Availability Reporting, Controls, Regulatory C ompliance Cash Flow: IRR >30%
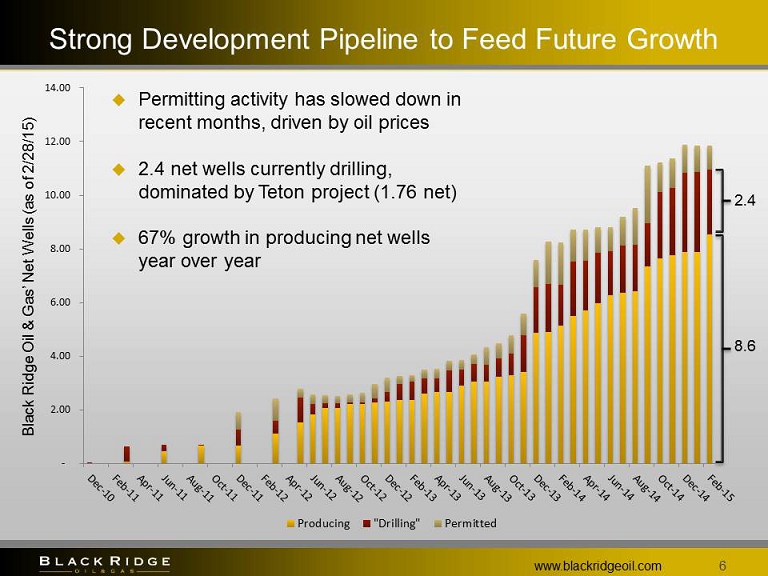
- 2.00 4.00 6.00 8.00 10.00 12.00 14.00 Producing "Drilling" Permitted www.blackridgeoil.com 6 Strong Development Pipeline to Feed Future Growth 8.6 2.4 Black Ridge Oil & Gas’ Net Wells (as of 2/28/15) Permitting activity has slowed down in recent months, driven by oil prices 2.4 net wells currently drilling, dominated by Teton project (1.76 net) 67% growth in producing net wells year over year
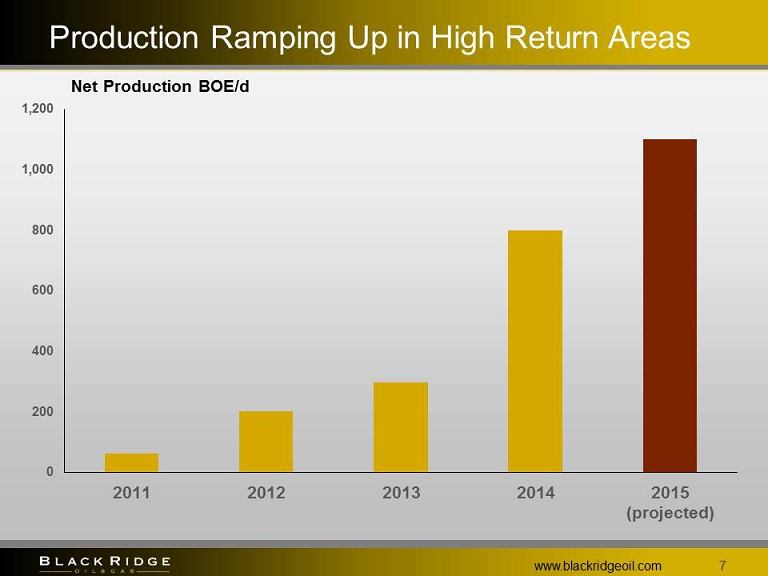
0 200 400 600 800 1,000 1,200 2011 2012 2013 2014 2015 (projected) www.blackridgeoil.com 7 Production Ramping Up in High Return Areas Net Production BOE/d
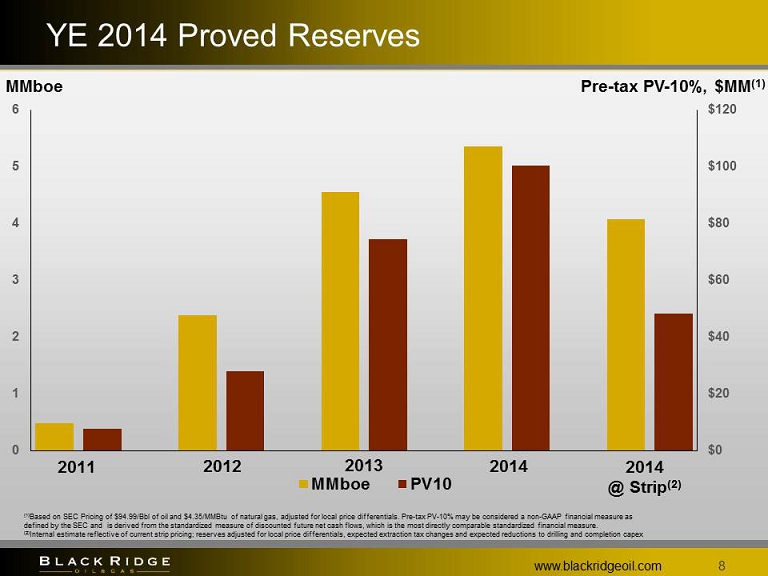
$0 $20 $40 $60 $80 $100 $120 0 1 2 3 4 5 6 MMboe PV10 MMboe 2011 2012 2013 2014 2014 @ Strip (2) YE 2014 Proved Reserves www.blackridgeoil.com 8 Pre - tax PV - 10%, $MM (1) (1) Based on SEC Pricing of $94.99/ Bbl of oil and $4.35/ MMBtu of natural gas, adjusted for local price differentials. Pre - tax PV - 10% may be considered a non - GAAP financial measure as defined by the SEC and is derived from the standardized measure of discounted future net cash flows, which is the most direc tly comparable standardized financial measure. (2) Internal estimate reflective of current strip pricing; reserves adjusted for local price differentials, expected extraction t ax changes and expected reductions to drilling and completion capex
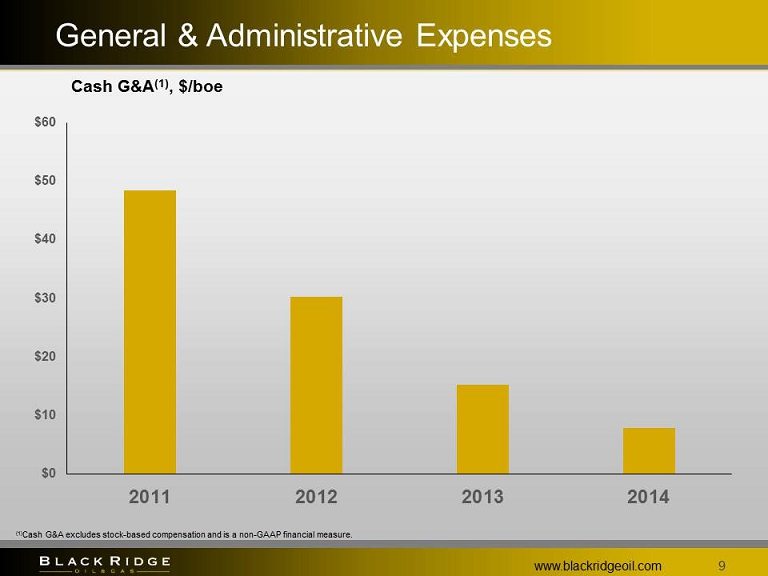
General & Administrative Expenses www.blackridgeoil.com 9 $0 $10 $20 $30 $40 $50 $60 2011 2012 2013 2014 Cash G&A (1) , $/ boe (1) Cash G&A excludes stock - based compensation and is a non - GAAP financial measure.
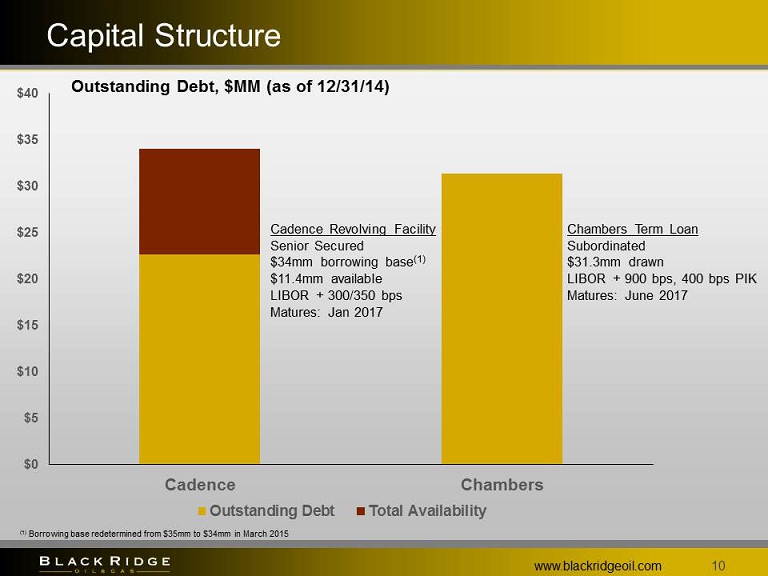
$0 $5 $10 $15 $20 $25 $30 $35 $40 Cadence Chambers Outstanding Debt Total Availability Capital Structure www.blackridgeoil.com 10 Outstanding Debt, $MM (as of 12/31/14) Cadence Revolving Facility Senior Secured $34mm borrowing base (1) $11.4mm available LIBOR + 300/350 bps Matures: Jan 2017 Chambers Term Loan Subordinated $31.3mm drawn LIBOR + 900 bps, 400 bps PIK Matures: June 2017 (1) Borrowing base redetermined from $35mm to $34mm in March 2015
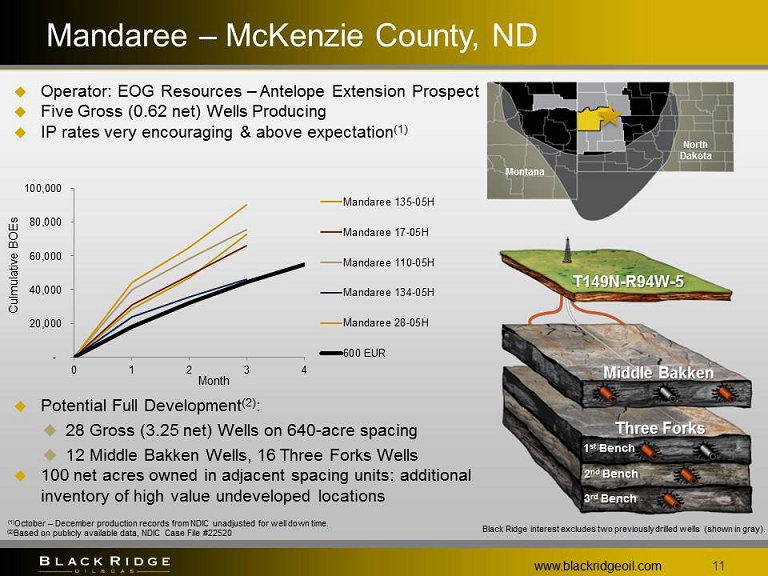
Mandaree – McKenzie County, ND Operator: EOG Resources – Antelope Extension Prospect Five Gross (0.62 net) Wells Producing IP rates very encouraging & above expectation (1) Potential Full Development (2) : 28 Gross (3.25 net) Wells on 640 - acre spacing 12 Middle Bakken Wells, 16 Three Forks Wells 100 net acres owned in adjacent spacing units: additional inventory of high value undeveloped locations www.blackridgeoil.com 11 (2) Based on publicly available data, NDIC Case File #22520 1 st Bench 2 nd Bench 3 rd Bench Middle Bakken Three Forks (1) October – December production records from NDIC unadjusted for well down time. Montana North Dakota Black Ridge interest excludes two previously drilled wells (shown in gray). T149N - R94W - 5 - 20,000 40,000 60,000 80,000 100,000 0 1 2 3 4 Mandaree 135-05H Mandaree 17-05H Mandaree 110-05H Mandaree 134-05H Mandaree 28-05H 600 EUR Month Culmulative BOEs
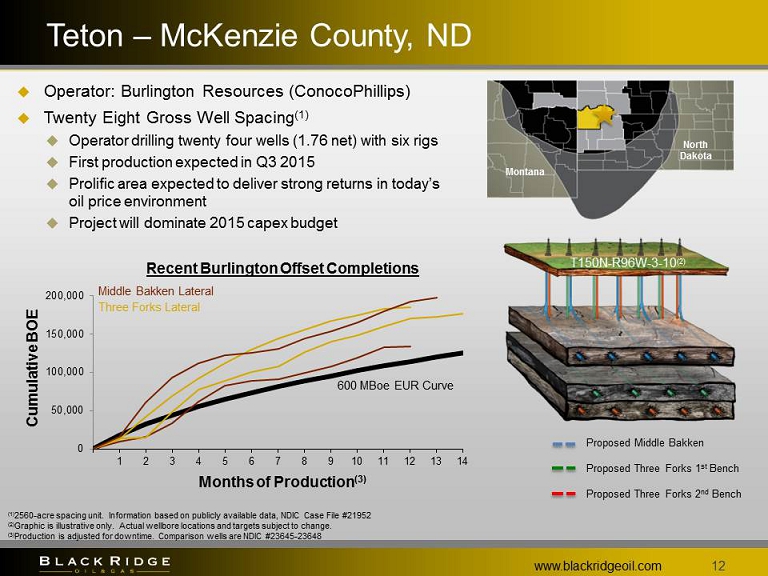
0 50,000 100,000 150,000 200,000 1 2 3 4 5 6 7 8 9 10 11 12 13 14 Teton – McKenzie County, ND Operator: Burlington Resources (ConocoPhillips) Twenty Eight Gross Well Spacing (1) Operator drilling twenty four wells (1.76 net) with six rigs First production expected in Q3 2015 Prolific area expected to deliver strong returns in today’s oil price environment Project will dominate 2015 capex budget www.blackridgeoil.com 12 ( 1) 2560 - acre spacing unit. Information based on publicly available data, NDIC Case File #21952 (2) Graphic is illustrative only. Actual wellbore locations and targets subject to change. (3) Production is adjusted for downtime. Comparison wells are NDIC #23645 - 23648 Montana North Dakota Proposed Middle Bakken Proposed Three Forks 2 nd Bench Proposed Three Forks 1 st Bench T150N - R96W - 3 - 10 (2) Cumulative BOE Three Forks Lateral Months of Production (3) Middle Bakken Lateral 600 MBoe EUR Curve Recent Burlington Offset Completions
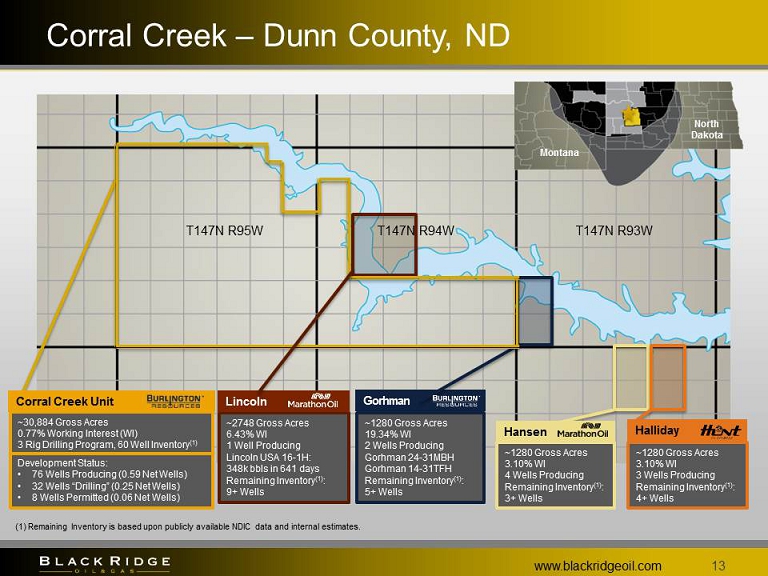
Corral Creek – Dunn County, ND www.blackridgeoil.com 13 ~30,884 Gross Acres 0.77% Working Interest (WI) 3 Rig Drilling Program, 60 Well Inventory (1) Development Status: • 76 Wells Producing (0.59 Net Wells) • 32 Wells “Drilling” (0.25 Net Wells) • 8 Wells Permitted (0.06 Net Wells) ~2748 Gross Acres 6.43% WI 1 Well Producing Lincoln USA 16 - 1H: 348k bbls in 641 days Remaining Inventory (1) : 9+ Wells ~1280 Gross Acres 19.34% WI 2 Wells Producing Gorhman 24 - 31MBH Gorhman 14 - 31TFH Remaining Inventory (1) : 5+ Wells ~1280 Gross Acres 3.10% WI 4 Wells Producing Remaining Inventory (1) : 3+ Wells ~1280 Gross Acres 3.10% WI 3 Wells Producing Remaining Inventory (1) : 4+ Wells Corral Creek Unit Hansen Halliday Lincoln Gorhman Montana North Dakota T147N R93W T147N R95W T147N R94W (1) Remaining Inventory is based upon publicly available NDIC data and internal estimates.
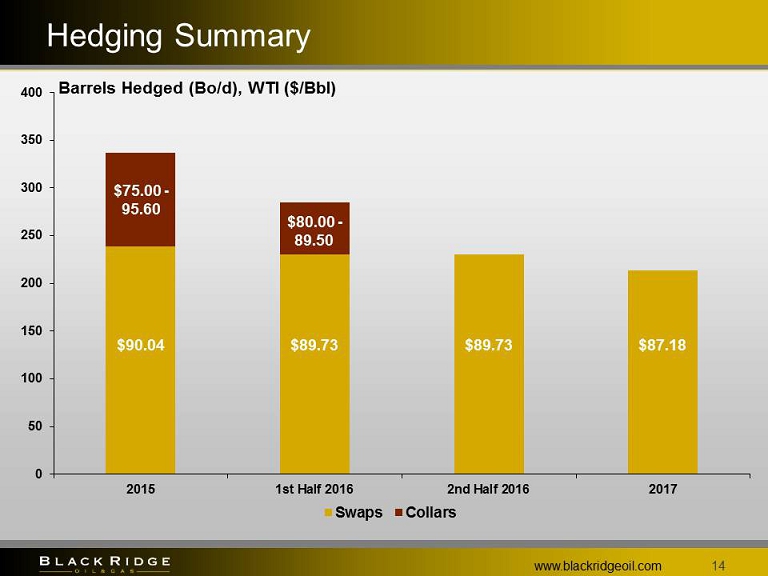
0 50 100 150 200 250 300 350 400 2015 1st Half 2016 2nd Half 2016 2017 Swaps Collars Hedging Summary 14 www.blackridgeoil.com $89.73 $90.04 $89.73 $87.18 $75.00 - 95.60 $80.00 - 89.50 Barrels Hedged (Bo/d), WTI ($/ Bbl )
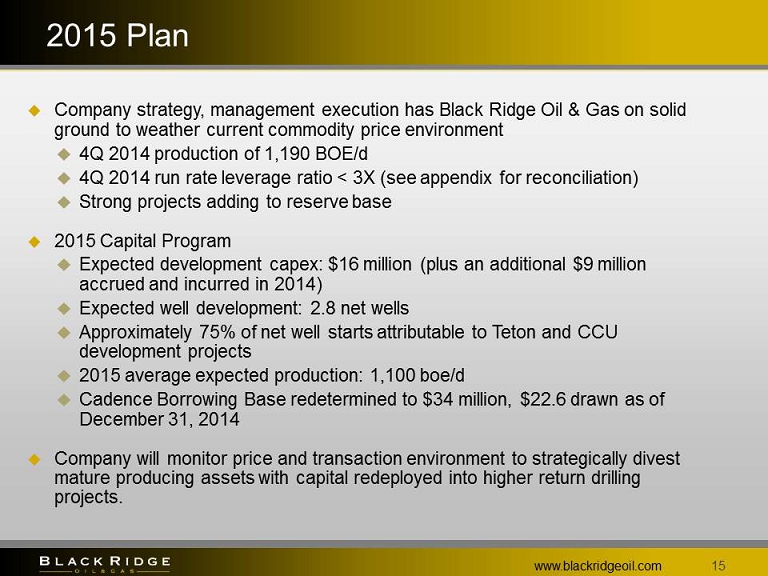
2015 Plan www.blackridgeoil.com 15 Company strategy, management execution has Black Ridge Oil & Gas on solid ground to weather current commodity price environment 4Q 2014 production of 1,190 BOE/d 4Q 2014 run rate leverage ratio < 3X (see appendix for reconciliation) Strong projects adding to reserve base 2015 Capital Program Expected development capex: $16 million (plus an additional $9 million accrued and incurred in 2014) Expected well development: 2.8 net wells Approximately 75% of net well starts attributable to Teton and CCU development projects 2015 average expected production: 1,100 boe /d Cadence Borrowing Base redetermined to $34 million, $22.6 drawn as of December 31, 2014 Company will monitor price and transaction environment to strategically divest mature producing assets with capital redeployed into higher return drilling projects.
For More Information www.blackridgeoil.com 16 Ken DeCubellis Chief Executive Officer ken.decubellis@blackridgeoil.com 952 - 426 - 1241 Stay Up to Date on Black Ridge Oil & Gas www.blackridgeoil.com

www.blackridgeoil.com 17 Appendix
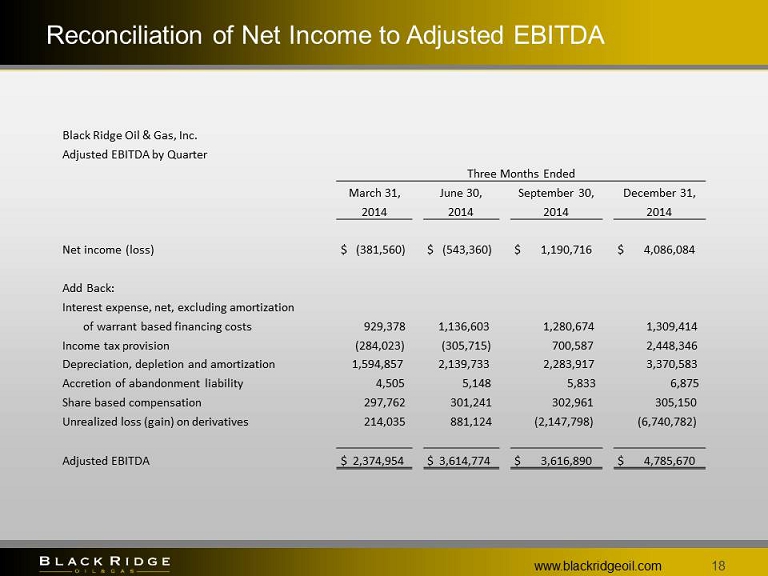
Reconciliation of Net Income to Adjusted EBITDA www.blackridgeoil.com 18 Black Ridge Oil & Gas, Inc. Adjusted EBITDA by Quarter Three Months Ended March 31, June 30, September 30, December 31, 2014 2014 2014 2014 Net income (loss) $ (381,560) $ (543,360) $ 1,190,716 $ 4,086,084 Add Back: Interest expense, net, excluding amortization of warrant based financing costs 929,378 1,136,603 1,280,674 1,309,414 Income tax provision (284,023) (305,715) 700,587 2,448,346 Depreciation, depletion and amortization 1,594,857 2,139,733 2,283,917 3,370,583 Accretion of abandonment liability 4,505 5,148 5,833 6,875 Share based compensation 297,762 301,241 302,961 305,150 Unrealized loss (gain) on derivatives 214,035 881,124 (2,147,798) (6,740,782) Adjusted EBITDA $ 2,374,954 $ 3,614,774 $ 3,616,890 $ 4,785,670
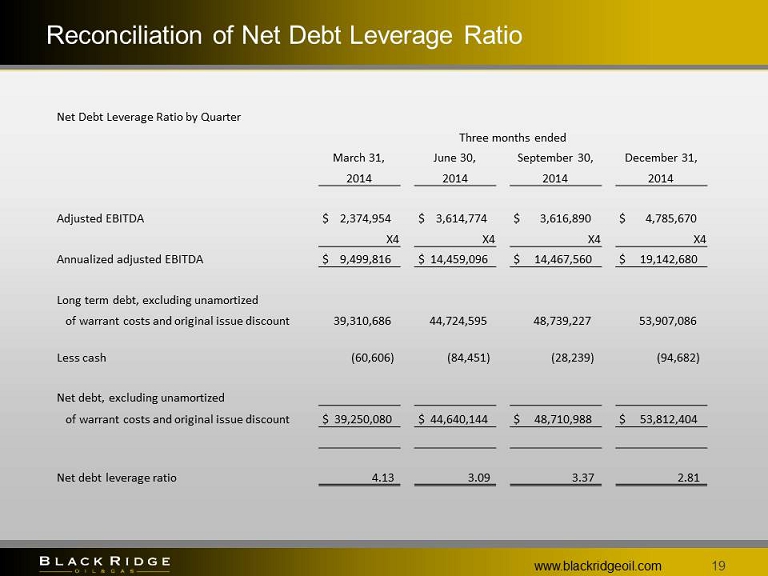
Reconciliation of Net Debt Leverage Ratio www.blackridgeoil.com 19 Net Debt Leverage Ratio by Quarter Three months ended March 31, June 30, September 30, December 31, 2014 2014 2014 2014 Adjusted EBITDA $ 2,374,954 $ 3,614,774 $ 3,616,890 $ 4,785,670 X4 X4 X4 X4 Annualized adjusted EBITDA $ 9,499,816 $ 14,459,096 $ 14,467,560 $ 19,142,680 Long term debt, excluding unamortized of warrant costs and original issue discount 39,310,686 44,724,595 48,739,227 53,907,086 Less cash (60,606) (84,451) (28,239) (94,682) Net debt, excluding unamortized of warrant costs and original issue discount $ 39,250,080 $ 44,640,144 $ 48,710,988 $ 53,812,404 Net debt leverage ratio 4.13 3.09 3.37 2.81
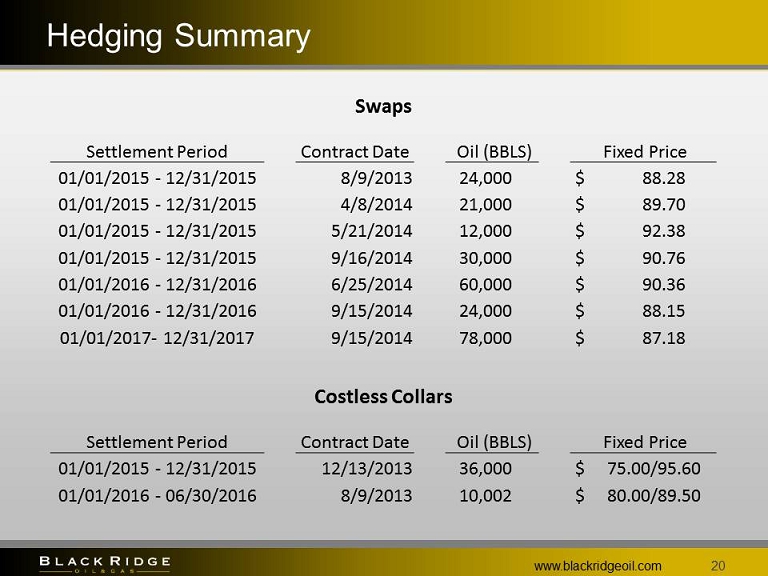
Hedging Summary 20 www.blackridgeoil.com Swaps Settlement Period Contract Date Oil (BBLS) Fixed Price 01/01/2015 - 12/31/2015 8/9/2013 24,000 $ 88.28 01/01/2015 - 12/31/2015 4/8/2014 21,000 $ 89.70 01/01/2015 - 12/31/2015 5/21/2014 12,000 $ 92.38 01/01/2015 - 12/31/2015 9/16/2014 30,000 $ 90.76 01/01/2016 - 12/31/2016 6/25/2014 60,000 $ 90.36 01/01/2016 - 12/31/2016 9/15/2014 24,000 $ 88.15 01/01/2017 - 12/31/2017 9/15/2014 78,000 $ 87.18 Costless Collars Settlement Period Contract Date Oil (BBLS) Fixed Price 01/01/2015 - 12/31/2015 12/13/2013 36,000 $ 75.00/95.60 01/01/2016 - 06/30/2016 8/9/2013 10,002 $ 80.00/89.50