Attached files
| file | filename |
|---|---|
| EXCEL - IDEA: XBRL DOCUMENT - FHC Holdings Corp | Financial_Report.xls |
| EX-23.1 - CONSENT OF ERNST & YOUNG - FHC Holdings Corp | v403683_ex23.htm |
| EX-32.1 - CERTIFICATION - FHC Holdings Corp | v403683_ex32-1.htm |
| EX-21.1 - SUBSIDIARIES OF FRANCESCA'S HOLDINGS CORPORATION - FHC Holdings Corp | v403683_ex21-1.htm |
| EX-31.2 - CERTIFICATION - FHC Holdings Corp | v403683_ex31-2.htm |
| EX-31.1 - CERTIFICATION - FHC Holdings Corp | v403683_ex31-1.htm |
| EX-10.18 - EXHIBIT 10.18 - FHC Holdings Corp | v403683_ex10-18.htm |
| EX-10.19 - EXHIBIT 10.19 - FHC Holdings Corp | v403683_ex10-19.htm |
UNITED STATES
SECURITIES AND EXCHANGE COMMISSION
WASHINGTON, D. C. 20549
FORM 10-K
ANNUAL REPORT PURSUANT TO SECTION 13 OR 15(d)
OF THE SECURITIES EXCHANGE ACT OF 1934
For the fiscal year ended January 31, 2015
Commission file number 001-35239
FRANCESCA’S HOLDINGS CORPORATION
(Exact name of registrant as specified in its charter)
| Delaware | 20-8874704 |
| (State or other jurisdiction of | (I.R.S. Employer |
| incorporation or organization) | Identification Number) |
8760 Clay Road Houston, TX 77080
(Address of principal executive offices including ZIP code)
(713) 864-1358
(Registrant’s telephone number, including area code)
Securities registered pursuant to Section 12(b) of the Act:
|
Title of each class |
Name of each exchange on which registered | |
| Common Stock, par value $.01 per share | The NASDAQ Stock Market LLC |
Securities registered pursuant to Section 12(g) of the Act: None
Indicate by check mark if the registrant is a well-known seasoned issuer, as defined in Rule 405 of the Securities Act. Yes x No ¨
Indicate by check mark if the registrant is not required to file reports pursuant to Section 13 or Section 15(d) of the Act. Yes ¨ No x
Indicate by check mark whether the registrant (1) has filed all reports required to be filed by Section 13 or 15(d) of the Securities Exchange Act of 1934 during the preceding 12 months (or for such shorter period that the Registrant was required to file such reports), and (2) has been subject to such filing requirements for the past 90 days. Yes x No ¨
Indicate by check mark whether the registrant has submitted electronically and posted on its corporate Web site, if any, every Interactive Data File required to be submitted and posted pursuant to Rule 405 of Regulation S-T during the preceding 12 months (or for such shorter period that the registrant was required to submit and post such files). Yes x No ¨
Indicate by check mark if disclosure of delinquent filers pursuant to Item 405 of Regulation S-K is not contained herein, and will not be contained, to the best of registrant’s knowledge, in definitive proxy or information statements incorporated by reference in Part III of this Form 10-K or any amendment to this Form 10-K ¨
Indicate by check mark whether the registrant is a large accelerated filer, an accelerated filer, a non-accelerated filer, or a smaller reporting company. See the definitions of “large accelerated filer,” “accelerated filer” and “smaller reporting company” in Rule 12b-2 of the Exchange Act. (Check one):
| Large accelerated filer x | Accelerated filer ¨ |
| Non-accelerated filer ¨ (Do not check if a smaller reporting company) | Smaller reporting company ¨ |
Indicate by check mark whether the registrant is a shell company (as defined in Rule 12b-2 of the Exchange Act).Yes ¨ No x
The aggregate market value of the registrant’s common stock held by non-affiliates of the registrant as of August 1, 2014, the last business day of the registrant’s most recently completed second quarter, was approximately $525.1 million.
As of March 15, 2015, there were 42,297,833 shares (excluding 3,179,581 of treasury stock) of Common Stock outstanding.
DOCUMENTS INCORPORATED BY REFERENCE
Portions of the Proxy Statement for the Annual Meeting of Stockholders to be held June 9, 2015 are incorporated by reference into Part III of this report.
SPECIAL NOTE REGARDING FORWARD-LOOKING STATEMENTS
This Annual Report on Form 10-K contains statements that constitute forward-looking statements within the meaning of the Private Securities Litigation Reform Act of 1995, as amended. These statements concern our business, operations and financial performance and condition as well as our plans, objectives and expectations for our business operations and financial performance and condition, which are subject to risks and uncertainties. All statements other than statements of historical fact included in this Annual Report on Form 10-K are forward-looking statements. These statements may include words such as “aim”, “anticipate”, “assume”, “believe”, “can have”, “could”, “due”, “estimate”, “expect”, “goal”, “intend”, “likely”, “may”, “objective”, “plan”, “potential”, “positioned”, “predict”, “should”, “target”, “will”, “would” and other words and terms of similar meaning in connection with any discussion of the timing or nature of future operating or financial performance or other events or trends. For example, all statements we make relating to our estimated and projected earnings, sales, costs, expenditures, cash flows, growth rates, market share and financial results, our plans and objectives for future operations, growth or initiatives, strategies or the expected outcome or impact of pending or threatened litigation are forward-looking statements.
These forward-looking statements are based on current expectations, estimates, forecasts and projections about our business and the industry in which we operate and our management’s beliefs and assumptions. These statements are not guarantees of future performance or development and involve known and unknown risks, uncertainties and other factors that are in many cases beyond our control. All of our forward-looking statements are subject to risks and uncertainties that may cause our actual results to differ materially from our expectations. These risks and uncertainties include, but are not limited to, the following: the risk that we cannot anticipate, identify and respond quickly to changing fashion trends and customer preferences; our ability to attract a sufficient number of customers to our boutiques or sell sufficient quantities of our merchandise through our direct-to-consumer business; our ability to successfully open and operate new boutiques each year; and our ability to efficiently source and distribute additional merchandise quantities necessary to support our growth. For additional information regarding these risks and other risks and uncertainties that could cause actual results to differ materially from those contained in our forward-looking statements, please refer to “Risk Factors,” contained in Part I of this Annual Report on Form 10-K and any risk factors contained in subsequent Quarterly Reports on Form 10-Q we file with the Securities and Exchange Commission (“SEC”).
We derive many of our forward-looking statements from our own operating budgets and forecasts, which are based upon many detailed assumptions. While we believe that our assumptions are reasonable, we caution that it is very difficult to predict the impact of known factors, and it is impossible for us to anticipate all factors that could affect our actual results. Important factors that could cause actual results to differ materially from our expectations, or cautionary statements, are disclosed under “Risk Factors”, “Management’s Discussion and Analysis of Financial Condition and Results of Operations” and elsewhere in this Annual Report on Form 10-K. All written and oral forward-looking statements attributable to us, or persons acting on our behalf, are expressly qualified in their entirety by the cautionary statements contained in this Annual Report on Form 10-K as well as other cautionary statements that are made from time to time in our other SEC filings and public communications. You should evaluate all forward-looking statements made in this Annual Report on Form 10-K and otherwise in the context of these risks and uncertainties.
Potential investors and other readers are urged to consider these factors carefully in evaluating the forward-looking statements and are cautioned not to place undue reliance on any forward-looking statements we make. These forward-looking statements speak only as of the date of this Annual Report on Form 10-K. Except as required by law, we undertake no obligation to update or revise any forward-looking statements after the date of this report to reflect actual results or future events or circumstances whether as a result of new information, future developments or otherwise.
| 3 |
General
Francesca’s Holdings Corporation was incorporated in Delaware in 2007. We are a holding company and all of our business operations are conducted through our subsidiaries. Our principal executive office is located at 8760 Clay Road, Houston, Texas 77080, our telephone number is (713) 864-1358 and our fax number is (713) 426-2751. We maintain a website at www.francescas.com. We may post information that is important to our investors on our website. Information included or referred to on, or otherwise accessible through, our website is not intended to form part or be incorporated by reference into this report. Except where the context otherwise requires or where otherwise indicated, the terms “francesca’s ®,” “we,” “us,” “our,” “the Company,” and “our business” refer to Francesca’s Holdings Corporation and its consolidated subsidiaries as a combined entity.
We operate on a fiscal calendar which, in a given fiscal year, consists of a 52- or 53-week period ending on the Saturday closest to January 31st. The reporting periods contained in our audited consolidated financial statements included in this Annual Report on Form 10-K contain 52 weeks of operations in fiscal year 2014, which ended on January 31, 2015, 52 weeks of operations in fiscal year 2013, which ended on February 1, 2014 and 53 weeks of operations in fiscal year 2012, which ended on February 2, 2013. Our fiscal years 2011 and 2010 each included 52 weeks of operations which ended on January 28, 2012 and January 29, 2011, respectively.
Our Company
francesca’s® is a growing specialty retailer with retail locations designed and merchandised to feel like independently owned, upscale boutiques providing customers a fun and differentiated shopping experience. The merchandise assortment is a diverse and balanced mix of apparel, jewelry, accessories and gifts. As of January 31, 2015, francesca’s ® operated 539 boutiques in 47 states and the District of Columbia and also served its customers through www.francescas.com, our direct-to-consumer website.
By offering a differentiated shopping experience and high-quality, trend-right merchandise at a compelling value, our boutiques have been successful across a wide variety of geographic markets and shopping venues. We believe we have an opportunity to continue to grow our boutique base from 539 locations in 47 states and the District of Columbia as of January 31, 2015 to approximately 900 boutiques in the United States over the next five to six years based on our flexible boutique format, the financial characteristics of our boutiques and our ongoing analysis of shopping venues that meet our criteria for new boutiques.
Our Competitive Strengths
We believe the following strengths differentiate us from our competitors and are key drivers of our success:
| · | Proven Trend-Right Merchandise Delivered at a Compelling Value. Our boutiques carry a broad and shallow selection of high-quality, trend-right apparel, jewelry, accessories and gifts at attractive prices. Our buyers closely monitor the marketplace to identify and source proven fashion trends we believe will appeal to our core customers. We primarily offer exclusive items under our proprietary labels, but carry a small selection of third-party, nationally recognized brands that we use opportunistically in certain categories. We offer a broad selection of merchandise, but intentionally purchase small quantities of individual items for each boutique such that we frequently replenish our boutiques with new merchandise, keeping the shopping experience fresh and exciting for our customers. The short lead times of our vendors maximizes our speed to market, as it generally takes four to twelve weeks from the time an order is placed to the time merchandise are available on the boutique floor. With these short lead times, we are able to make more informed buying decisions to meet customers’ merchandise expectations, and to react quickly to changing fashion trends. This approach, combined with our balanced product mix of approximately 50% apparel and 50% jewelry, accessories and gifts, is designed to encourage more frequent visits by our customers and reduce the seasonal fluctuations in sales and merchandise margin. We believe the expertise of our buyers and our broad base of vendors allows us to quickly identify and respond to emerging fashion trends in apparel, jewelry, accessories and gifts to offer quality merchandise at prices that ‘surprise and delight’ our customers. |
| · | Differentiated Shopping Experience. Each of our retail locations is uniquely designed and merchandised to feel like an independently owned, upscale boutique. Merchandise presentations, including display windows, tables and walls, are refreshed frequently to keep our boutiques new and exciting. Our boutique managers and associates, with the support of corporate guidelines, are encouraged to individualize each boutique with their personality, which increases their motivation and enhances the shopping experience. We believe these attributes, along with our strategy of carrying a broad selection but limited quantities of individual styles, create an atmosphere that strongly appeals to our customers and differentiates us in the marketplace. |
| 4 |
| · | Powerful Boutique Economics and Rigorous Real Estate Selection Process. We have a proven boutique format that works across a wide variety of shopping venues, market sizes, climates and demographics. Our boutiques average approximately 1,350 square feet, which is meaningfully smaller than most specialty retailers. The performance of our boutiques and our flexible real estate format enhance our ability to secure prominent, highly visible locations in regional malls, lifestyle centers, street locations, strip centers and outlet locations. We deploy a rigorous real estate selection process with all new boutique opportunities measured against specific financial and geographic criteria. We currently fund all of our growth from cash generated from operations. In our real estate selection process, we assess the viability of potential sites by analyzing the demographics of the trade area and the performance of the shopping venue, including selected relevant and adjacent retailers. Based on this analysis, we believe the financial characteristics of our new boutiques, coupled with our ability to operate across different shopping venues and geographies, provide us with a wide scope of new boutique opportunities and enhance our ability to profitably expand our boutique base. |
| · | Solid and Scalable Infrastructure. We continually invest in systems, controls and human resources to support our growth. In recent years we have made significant improvements to the infrastructure of our finance, buying and planning, real estate, boutique operations and IT departments. For instance, we believe that we have developed an integrated sourcing, distribution and merchandising process that is scalable and will facilitate the continued growth in the number of boutiques we operate, including buyers who work closely with an established and diverse group of vendors to identify trend-right, high-quality merchandise for our boutiques, as well as delivery, distribution and merchandising processes that enable us to execute a broad and shallow merchandising approach as we grow. |
| · | Experienced Management Team with a Disciplined Operating Philosophy. Our senior management has extensive experience across a broad range of disciplines in the retail industry, including merchandising, real estate, supply chain and finance. Our management team has built a solid operating foundation based on sound retail principles that define our culture. Our disciplined operating philosophy is grounded in a relentless focus on providing great merchandise and a best-in class boutique experience supported by uncompromising site selection and continual enhancements to our infrastructure. |
Our Growth Strategy
We believe we can continue to grow our revenues and earnings by executing on the following strategies:
| · | Grow Our Boutique Base. We believe there is an opportunity to significantly increase the number of boutiques we operate. Based on our proven ability to open our flexible retail format in various shopping venues in new and existing markets, the financial characteristics of our boutiques and our ongoing analysis of shopping venues that meet our criteria for new boutiques (including a third party research study), we believe we have the potential to grow our base from 539 locations in 47 states and the District of Columbia as of January 31, 2015 to approximately 900 boutiques in the United States over the next five to six years. We opened 88 new boutiques in fiscal year 2014 and we plan to open approximately 85 new boutiques in fiscal year 2015. |
| · | Drive Comparable Sales. We intend to drive comparable sales by featuring high-quality, trend-right merchandise at a compelling value and refining our distinctive boutique experience. We intend to maintain our broad and shallow merchandising approach, which we believe will drive units and dollars per transaction and protect margins. In addition, we are increasing the sophistication of our buying and planning infrastructure, enhancing our buying team with additional category-specific buyers, and augmenting the field leadership structure. |
| · | Expand the Penetration and Presence of Our Direct-to-Consumer Business. We complement our boutiques with a growing direct-to-consumer business. Our direct-to-consumer business not only generates incremental sales and profits but also builds brand awareness and boutique traffic and helps us access markets where we do not currently have a boutique. Our direct-to-consumer sales grew by 64% in fiscal year 2014 and represented 3.8% of our total net sales. In fiscal year 2013, we implemented several enhancements to our existing website that improved its overall design and functionality. We will continue to make investments in our direct-to-consumer website that will further enhance our customers’ shopping experience as well as establish the framework of our long-term direct-to-consumer strategies. We expect direct-to-consumer sales growth to continue as consumers discover the complementary nature of shopping with us online and through our boutiques. |
Our History
Our Company was founded in 1999. We opened our first boutique in Houston, Texas that same year. Initially, we focused on selling fashion jewelry, accessories and selected home décor. As our boutique base grew across the United States we expanded our merchandise offering to include apparel, which has become our largest category and, we believe, a significant driver of growing customer loyalty and return visits. On July 27, 2011, we completed our initial public offering (“IPO”). Subsequent to the IPO, we completed three follow-on offerings on April 2, 2013, April 23, 2012 and February 1, 2012.
| 5 |
Our Market
Our distinct boutique environment and carefully selected, trend-right merchandise attract a wide demographic. Our unique merchandise combination of apparel, jewelry, accessories and gifts allows us to participate in a number of large market segments. While our broad assortment appeals to women of varying ages and diverse backgrounds, from value-conscious to the more affluent, our primary targeted customer is a fashion conscious woman between the ages of 18 and 35. She tends to be college educated and has moderate to high disposable income. She enjoys shopping for the latest fashions and is attracted to our upscale boutique shopping environment, compelling value proposition and highly personalized customer service. We believe she spends a higher proportion of her income on fashion than the general population.
Our Merchandise Offering and Merchandising Strategy
We offer a broad and shallow selection of fashion apparel, jewelry, accessories and gifts targeted to our core customer, who seeks trend-right, high-quality merchandise at attractive prices. We use the term broad and shallow to refer to a diverse merchandise assortment with relatively small inventory of each product. We have a well-balanced assortment of product categories with approximately 50% of our fiscal year 2014 sales generated by non-apparel items. Our diverse merchandise contributes to the ‘treasure hunt’ atmosphere in our boutiques and is one which we aim to maintain as we grow. We carry a broad selection but limited quantities of each style and we deliver new merchandise to our boutiques five days a week. This contributes to a sense of scarcity and newness within our boutiques, mitigates fashion risk, reduces the seasonality of the inventory and protects margins.
Our wide range of apparel, jewelry, accessories and gifts fills the various casual and dressy fashion needs of our customers and our selection of gifts ranges from the elegant to the irreverent. Our approximately 1,350 square foot boutiques carry in excess of 3,000 SKUs at any one time and we stock more than 15,000 different styles during the course of a year. The majority of our merchandise are sold under our proprietary labels and we also sell a select assortment of third-party, nationally recognized brands. Our direct-to-consumer business features an edited selection of our boutique merchandise and on-line exclusives. The table below shows the approximate breakdown of our fiscal year 2014 net sales by product category:
|
Apparel 48% of Net Sales |
Jewelry 22% of Net Sales |
Accessories 17% of Net Sales |
Gifts 13% of Net Sales | |||
| Dresses, Fashion Tops, Sweaters, Cardigans and Wraps, Bottoms, Outerwear and Jackets, Tees and Tanks, Intimates | Necklaces, Earrings, Bracelets, Rings | Handbags, Clutches, Wallets, Shoes, Belts, Hats, Scarves, Sunglasses, Watches, Hair Accessories | Fragrance, Candles, Bath and Body, Home Accessories, Books, Wall Art, Nail Polish, Miscellaneous Items |
Our buying and planning team is responsible for selecting and sourcing our merchandise, managing inventory levels and allocating items to boutiques. Each product category has a set of dedicated buyers with oversight provided by our Chief Merchandising Officer. The buying and planning team holds weekly meetings to review merchandise performance and identify new fashion trends. Our buyers also make regular trips to important industry markets and trade shows. We have access to the expertise of hundreds of designers employed by our large vendor base who provide us with a large selection of new styles for review each week. Our buyers collaborate with vendors to place special orders and to modify presented styles based on current fashion trends and their in-depth knowledge of our customers’ preferences, which means most of our merchandise are unique to francesca’s ®. Before placing an order, every item is evaluated for style, quality, fit, value and profitability to ensure it meets standards consistent with the francesca’s ® brand. In order to clear slow moving inventory, in addition to normal promotional activities, we regularly mark certain merchandise out-of-stock at a pace suitable for our merchandising strategy.
Our Sourcing Strategy
Our ability to quickly make decisions on trend-right items combined with the short production lead times of our vendors maximizes our speed to market. We use vendors based in the United States that source from both domestic and overseas markets and it generally takes four to twelve weeks from the time an order is placed to the time merchandise are available on the boutique floor. With these short lead times, we are able to make more informed buying decisions in terms of customers’ merchandise expectations, and to quickly react to changing fashion trends. This also supports our merchandise strategy of offering a broad but limited assortment that is infused with new items five days a week. Due to the limited quantity of our buys in any one style, we minimize material inventory positions in individual style which enhances our ability to quickly deliver trend-right merchandise and reduce the risk of fashion misses, which can lead to increased inventory markdowns and diminished gross margins.
We do not own or operate any manufacturing facilities. We have relationships with a diverse base of over 500 vendors and transact business on a purchase order-by-purchase order basis. In fiscal year 2014, we sourced approximately 91% of our merchandise from 200 vendors while our top 10 vendors sourced approximately 25% of our merchandise, with no single vendor accounting for more than 5% of our purchases. We believe that the loss of any of our current vendors will not result in a material disruption to our business.
| 6 |
We do not enter into exclusive contracts with our vendors and we continue to expand our vendor network. This provides us with access to an even more extensive variety of merchandise from a greater number of vendors at competitive prices. We believe our vendors view us as an important customer given our growth and market position. Our vendors utilize a network of domestic and overseas factories, providing them access to significant capacity. We source our inventory primarily from domestic vendors.
Each of our vendors is required to adhere to our vendor standards, which are designed to ensure that our vendors conduct their business in a legal, ethical and responsible manner. This also includes the requirement that all of our vendors comply with the applicable laws and regulations of the United States, those of the respective country of manufacture or exportation and all state and local laws and regulations.
Our Sales Channels
We conduct business through our boutiques and our direct-to-consumer website, www.francescas.com. We do not incorporate the information contained on, or accessible through, our website into this Annual Report on Form 10-K, and it should not be considered a part of this Annual Report on Form 10-K.
Boutiques
In fiscal year 2014, our boutiques generated net sales of $363.1 million which represented 96.2% of total net sales. As of January 31, 2015, we operated 539 boutiques under the name francesca’s ® in 47 states throughout the United States and the District of Columbia. The following list shows the number of boutiques operated by state as of January 31, 2015, and demonstrates that we have been successful in opening boutiques in a wide range of geographies.
|
Number of Boutiques |
Number of Boutiques | |||||
| Alabama | 15 | Montana | 1 | |||
| Arizona | 10 | Nebraska | 3 | |||
| Arkansas | 7 | Nevada | 7 | |||
| California | 49 | New Hampshire | 4 | |||
| Colorado | 7 | New Jersey | 22 | |||
| Connecticut | 8 | New Mexico | 2 | |||
| Delaware | 3 | New York | 17 | |||
| District of Columbia* | 1 | North Carolina | 16 | |||
| Florida | 38 | North Dakota | 2 | |||
| Georgia | 19 | Ohio | 17 | |||
| Idaho | 2 | Oklahoma | 6 | |||
| Illinois | 27 | Oregon | 8 | |||
| Indiana | 11 | Pennsylvania | 22 | |||
| Iowa | 5 | Rhode Island | 3 | |||
| Kansas | 5 | South Carolina | 8 | |||
| Kentucky | 7 | South Dakota | 3 | |||
| Louisiana | 11 | Tennessee | 12 | |||
| Maine | 1 | Texas | 47 | |||
| Maryland | 12 | Utah | 3 | |||
| Massachusetts | 18 | Vermont | 1 | |||
| Michigan | 12 | Virginia | 15 | |||
| Minnesota | 16 | Washington | 10 | |||
| Mississippi | 3 | West Virginia | 2 | |||
| Missouri | 11 | Wisconsin | 10 |
*Not considered a state.
Boutique Design and Environment
The differentiated shopping experience offered through our boutiques is central to the francesca’s® brand. Our boutiques are designed and merchandised to deliver a warm and inviting atmosphere that creates the sense for our customers that they are shopping in an independently owned, upscale boutique. Although we strive to maintain a relatively consistent look and feel in all of our boutiques, the intricacies of each boutique’s physical properties, geographic market and shopping venue, as well as the autonomy we provide to our boutique managers in visually merchandising the boutiques, make each feel different and in tune with its local clientele.
| 7 |
Our boutiques typically range in size from 1,000 to 1,800 square feet, with an average size of approximately 1,350 square feet. We seek locations that have a boutique front that is at least 20 feet wide, which we adorn with visually appealing architectural lighting, signage and display window presentations. Inside, we use a variety of color palettes and soft lighting. Each boutique’s merchandise presentation, including display windows, tables and walls, is refreshed frequently to keep our shopping experience new and exciting. We believe by constantly changing our visual merchandising and presentation, we give our customers a reason to shop our boutiques frequently, building customer loyalty. Our boutique managers also use our intranet website to share best-practices with each other, such as ideas for displays. We believe these grass-root interactions improve the sense of community among our boutique managers and enhance the shopping experience for our customers.
Staffing in our boutiques consists of a boutique manager, an assistant manager and a minimum of three part-time associates. Our compensation structure includes a bonus component payable upon the achievement of certain financial goals. We endeavor to hire boutique personnel that are friendly and customer-service driven individuals. In addition to training programs for visual merchandising, customer service and operations, boutique managers benefit from ongoing field-level support and training updates as well as guides and manuals.
Boutique Economics
We believe that our broad and shallow merchandising strategy and the differentiated shopping experience we offer to our customers contributes to the success of our boutiques and generates attractive returns. Over the previous two fiscal years, we opened 179 boutiques which averaged approximately 1,288 square feet and, of the locations open 12 or more months, boutique sales averaged approximately $636,000 in the first year. On average,these boutiques paid back our net investment on a pre-tax basis in less than one year. In fiscal year 2014, the cost of build-out with related fixtures and equipment to open a new boutique was approximately $200,000 per boutique while tenant allowance averaged approximately $87,000 per boutique. We allocated approximately $51,000 of opening inventory per new boutique in fiscal year 2014. We expect that the costs of opening new boutiques to increase in future years. However, we expect that any such increase will not be material and should not adversely impact our expansion plans or our payback period. Based on our disciplined, rigorous real estate selection process and similarity of site characteristics, we expect new boutique economics to be consistent with our recent history.
Boutique Growth and Site Selection
We have a proven track record of increasing our boutique base. The table below indicates certain historical information regarding our boutiques as of the end of each of the periods indicated below:
| Fiscal Year 2014 | Fiscal Year 2013 | Fiscal Year 2012 | Fiscal Year 2011 | Fiscal Year 2010 | ||||||||||||||||
| Mall | 278 | 226 | 180 | 128 | 69 | |||||||||||||||
| Non-mall(1) | 261 | 225 | 180 | 155 | 138 | |||||||||||||||
| Total Boutiques | 539 | 451 | 360 | 283 | 207 | |||||||||||||||
| Boutiques Opened | 88 | 91 | 77 | 76 | 62 | |||||||||||||||
| Boutiques Closed | – | – | – | – | 2 | |||||||||||||||
| Total Gross Square Feet at the end of the period (in thousands) | 728 | 613 | 499 | 399 | 296 | |||||||||||||||
| Average Square Feet Per Boutique at the end of the period (2) | 1,350 | 1,359 | 1,385 | 1,409 | 1,428 | |||||||||||||||
| Net Sales Per Average Square Foot for the period (3) | $ | 545 | $ | 592 | $ | 632 | $ | 554 | $ | 508 | ||||||||||
| (1) | Non-mall includes boutiques in lifestyle centers, street locations, strip centers and outlet locations. |
| (2) | Average square feet per boutique is calculated by dividing total gross square feet at the end of the period by the number of boutiques open at the end of the period. |
| (3) | Net sales per average square foot are calculated by dividing net sales for the period by the average total square feet during the period. Because of our rapid growth, for purposes of providing net sales per square foot measure, we use average square feet during the period as opposed to total gross square feet at the end of the period. Average square feet is calculated as (a) the sum of total gross square feet at the beginning of the period and total gross square feet at the end of each fiscal quarter within the period, divided by (b) the number of fiscal quarters within the period plus one (which, for a fiscal year, is five). There may be variations in the way in which some of our competitors and other retailers calculate sales per square foot or similarly titled measures. As a result, average square feet and net sales per average square foot for the period may not be comparable to similar data made available by other retailers. |
Our flexible boutique format has enabled us to successfully open boutiques across a variety of shopping venues, market sizes, climates and demographics. We believe this provides us with a wide scope of real estate opportunities and enhances our ability to profitably expand our boutique base. Based on our rigorous real estate selection process, our flexible boutique format and the financial characteristics of our boutiques, we believe that the per boutique costs associated with opening new boutiques over the next twelve months should not be materially different from our current costs for opening new boutiques. We expect to fund the costs of our boutique growth through cash flow generated by our operations and through our revolving credit facility, if necessary. We expect to open boutiques in both new and existing markets and across regional malls, lifestyle centers, street locations, strip centers and outlet locations. We expect our overall boutique mix to consist of approximately 45% mall and 55% non-mall, if we are successful in opening 900 boutiques.
| 8 |
Our real estate committee utilizes a disciplined approach to site selection, which analyzes the prospective shopping venue for factors such as overall shopping venue productivity, competitive environment and specific sales of other retailers deemed most relevant as well as the configuration of available space for potential new boutique locations. We seek prominent locations in high-traffic areas of the shopping venue and in close proximity to other retailers targeting similar customers. We also evaluate each new boutique location based on projected sales and determine whether the capital investment and estimated boutique four-wall contribution satisfies our targeted return threshold, occupancy costs, and boutique contribution. We have closed two boutiques since we began business in 1999.
See Item 1A, “Risk Factors” for certain risks related to our boutique growth and site selection.
Direct-to-Consumer
Our direct-to-consumer business consists of our www.francescas.com website. Through our website, our customers are able to purchase individual items, shop the latest jewelry, gift or fashion merchandise and special promotions, create a wish list, sign up for our emailing list, connect and follow us on social media sites such as Facebook, Twitter, Instagram and Pinterest, as well as obtain current information on our boutique locations. This channel enables us to reach customers in all states and further build our brand. We currently obtain and collect customer email information from our boutiques and website and use it to generate marketing programs, such as our email campaign. In fiscal year 2013, we implemented several enhancements to our existing website that improved its overall design and functionality. We will continue to make investments to our website that will further enhance our customers’ shopping experience as well as establish the framework for our long-term direct-to-consumer strategies. We believe there is significant potential to expand this channel over time.
Marketing and Advertising
We currently focus on organic, viral and in-boutique marketing to increase customer loyalty and build our brand image. By locating our boutiques in prominent, high-traffic locations and by making very limited use of traditional television and print advertising, we encourage people to ‘discover’ francesca’s ® . We believe that many of our customers develop a personal connection with our boutiques and become our ambassadors in the local community by spreading the word about francesca’s®. We also use email communications, our website and, increasingly, social networking sites, such as Facebook, Twitter, Instagram and Pinterest and fashion related blogs to achieve our marketing goals. Our boutique managers are passionate about francesca’s ® and contribute to our marketing effort by hosting in-boutique activities, such as fashion shows and private parties.
Distribution
We distribute most of our merchandise from our distribution center (located within our corporate headquarters) in Houston, Texas. Our current facility occupies approximately 218,000 square feet, consisting of approximately 165,000 square feet of warehouse and distribution space, which services our boutiques and direct-to-consumer business, and approximately 53,000 square feet of office space for our corporate headquarters. Our merchandise are received, inspected, managed, stored and distributed through our distribution warehouse, with the exception of less than 1% of our merchandise which are drop-shipped by our vendors directly to our boutiques. The majority of our merchandise are currently pre-ticketed and pre-sorted by our vendors, which allows us to efficiently ship from our distribution center directly to our boutiques, thereby reducing labor costs. Due to the relatively smaller size of our sales area, we ship smaller packages of fresh merchandise five days a week. Hence, we are able to utilize third party shipping vendors to effectively distribute fresh merchandise on a continuous basis, ensuring successful implementation of our broad and shallow merchandising strategy. We believe that our current facilities will be sufficient to support our growth plans for several years.
Management Information Systems
Our management information technology systems provide support and timely information to our management team. We believe our current systems provide us with operational efficiencies, scalability, management control and timely reporting that allows us to identify and respond to operating trends in our business. We use a combination of customized and industry-standard software systems to support boutique point-of-sale, merchandise planning and buying, direct-to-consumer, inventory management, financial reporting and administrative functions.
We have made significant investments in our management information systems over the last several years. Our core merchandising system consists of software licensed from JDA Software Group, Inc. (“JDA”) which was fully implemented in fiscal year 2013. The complete JDA suite consists of a merchandise management system, a merchandise performance analysis application, merchandise allocation system, point-of-sale software and an enterprise planning system. In fiscal year 2014, we deployed several upgrades to the JDA suite to enhance its functionalities. We will remain diligent in our efforts to continuously improve the functionality and performance of our existing enterprise applications and infrastructure to support the Company’s continued growth.
| 9 |
Competition
The women’s apparel, jewelry, accessories and gifts market is large, fragmented and highly competitive. Our largest competitors include national and regional department stores, specialty retailers, mass merchants and internet-based retailers. Due to the breadth of our merchandise, it is difficult to identify companies that compete with us in every product category. We generally compete with individual, often owner-operated specialty shops in each of the markets that we operate as well as broadly merchandised department stores and certain specialty stores. We may face new competitors and increased competition from existing competitors as we expand into new markets and increase our presence in existing markets.
The principal basis upon which we compete is by offering a differentiated shopping experience through high-quality, trend-right merchandise at attractive prices in a warm and inviting boutique environment with excellent customer service. In addition, our manageable boutique size and flexible but disciplined real estate strategy provide us with a competitive advantage that is not easily replicated by our major competitors. Our success also depends in substantial part on our ability to respond quickly to fashion trends so that we can meet the changing demands of our customers.
Intellectual Property
We have registered our trademark francesca’s® with the United States Patent and Trademark Office. In addition, we own domain names, including www.francescas.com, and we own unregistered copyright rights in our website content. We believe our trademarks have value, and we diligently protect them against infringement. For instance, we have filed applications to register our trademark internationally. We will also continue to file new applications as appropriate to protect our intellectual property rights.
Regulation and Legislation
We are subject to labor and employment laws, laws governing advertising and promotions, privacy laws, product and other safety regulations, consumer protection regulations, environmental requirements and other laws that regulate retailers and govern the promotion and sale of merchandise and the operation of boutiques and warehouse facilities. We monitor changes in these laws and believe that we are in compliance with applicable laws in all material respects.
Insurance
We use insurance for a number of risk management activities, including workers’ compensation, general liability, automobile liability, cyber security and employee-related health care benefits, a portion of which is paid by the employees. We evaluate our insurance requirements on an ongoing basis and believe we maintain adequate levels of coverage.
Our Employees
As of January 31, 2015, we had approximately 4,056 total employees. Of our total employees, approximately 239 were based at our corporate headquarters in Houston, Texas, and approximately 3,817 were boutique employees. We had approximately 1,144 full-time employees and approximately 2,912 part-time employees, who are primarily boutique employees. None of our employees are represented by a labor union, and we have had no labor-related work stoppages as of January 31, 2015. Our relationship with our employees is one of the keys to our success, and we believe that relationship is satisfactory.
Seasonality
Our wide-range of merchandise and our strategy of carrying a broad selection but limited quantities of each item reduce our overall seasonality relative to other specialty retailers. Nevertheless, our business is mildly seasonal in nature and demand is generally the highest in the fourth fiscal quarter due to the year-end holiday season and lowest in the first fiscal quarter. As a result of this seasonality and generally because of variation in consumer spending habits, we experience fluctuations in net sales and working capital requirements during the year. See “Management’s Discussion and Analysis of Financial Condition and Results of Operations-Seasonality” for more information.
Privacy Policy
In the course of our business, we collect information about our customers, including customer data submitted to us in connection with purchases of our merchandise at boutiques as well as from our direct-to-consumer business. We respect the privacy of our customers and take steps to safeguard the confidentiality of the information that they provide to us.
| 10 |
Securities and Exchange Commission Filings
We maintain a website at www.francescas.com. We provide, free of charge, access to various reports that we file with, or furnish to, the SEC through our website, as soon as reasonably practicable after they have been filed or furnished with the SEC. These reports include, but not limited to, our Annual Reports on Form 10-K, Quarterly Reports on Form 10-Q, Current Reports on Form 8-K, and any amendments to those reports. The SEC maintains a website that contains reports, proxy and information statements, and other information regarding our filings at http://www.sec.gov.
If any of the following risks actually occurs, our business, financial condition, results of operation, cash flow and prospects could be materially and adversely affected. As a result, the trading price of our common stock could decline.
Our success depends on our ability to anticipate, identify and respond quickly to new and changing fashion trends, customer preferences and other factors, and our inability to anticipate, identify and respond to these changes and trends could have a material adverse effect on our business, financial condition and results of operations.
Our core market, apparel, jewelry, accessories and gifts for women from 18 to 35-years old, is subject to rapidly shifting fashion trends, customer tastes and demands. Accordingly, our success is dependent on our ability to anticipate, identify and respond to the latest fashion trends and customer demands, and to translate such trends and demands into appropriate, saleable product offerings in a timely manner. A small number of our employees are primarily responsible for performing this analysis and making product purchase decisions. Our failure to anticipate, identify or react swiftly and appropriately to new and changing styles, trends or desired image preferences or to accurately anticipate and forecast demand for certain product offerings is likely to lead to lower demand for our merchandise, which could cause, among other things, sales declines, excess inventories and a greater number of markdowns resulting in a decreased merchandise margin. For example, in fiscal year 2014, we disposed of certain slow-moving merchandise at a cost of $4.8 million. We will take such action again in the future in order to clear slow-moving merchandise at a pace suitable for our merchandising strategy. Further, if we are not able to anticipate, identify and respond to changing fashion trends and customer preferences, we may lose customers and market share to those of our competitors who are able to better anticipate, identify and respond to such trends and preferences. In addition, because our success depends on our brand image, our business could be materially adversely affected if new product offerings are not accepted by our customers. Our new product offerings may not be met with the same level of acceptance as our past product offerings and we may not be able to adequately respond to fashion trends in a timely manner or the preferences of our customers. If we do not accurately forecast or analyze fashion trends and sales levels, our business, financial condition and results of operations will be adversely affected.
If we are not able to successfully maintain a broad and shallow merchandise assortment, we may be unable to attract a sufficient number of customers to our boutiques or sell sufficient quantities of our merchandise through our direct-to-consumer business, which could result in excess inventories and markdowns.
We use the term broad and shallow to refer to a diverse merchandise assortment with relatively small inventory of each product. We believe that our strategy to offer our customers a broad and shallow merchandise assortment has contributed significantly to the success of our business. Among other things, we believe that this strategy creates a constant sense of newness and scarcity value, which drives repeat boutique visits and increased sales. In addition, we believe that this strategy helps us reduce markdowns. There can be no assurance that we will be able to continue to adequately stock our boutiques with a sufficiently broad and shallow assortment of merchandise. As we increase order volumes in connection with opening new boutiques and expanding our direct-to-consumer business, it may become increasingly difficult for us to accurately forecast the optimal amount of merchandise to order from our vendors and continue to offer a broad and shallow merchandise assortment at each boutique. If we are unable to offer a broad and shallow merchandise assortment, customers may choose to visit our boutiques less frequently, our brand could be impaired, our market share may decline and our results of operations could deteriorate. Further, any failure to maintain a broad and shallow merchandise assortment could lead to excess inventories which could lead to markdowns and increased promotions, which would result in a decrease in our merchandise margin. For example, in fiscal year 2014, we disposed of certain slow-moving merchandise at a cost of $4.8 million. This caused a 140 basis points decrease to our gross profit, as a percentage of sales, in fiscal year 2014 as compared to fiscal year 2013.
Our growth strategy depends in large part upon our ability to successfully open and operate new boutiques each year in a timely and cost-effective manner.
Our strategy to grow our business depends in large part on continuing to successfully open a substantial number of new boutiques each year for the foreseeable future. The success of this strategy will depend largely upon our ability to find a sufficient number of suitable locations, our ability to recruit, hire and train qualified personnel to operate our new boutiques and our ability to scale our infrastructure to successfully integrate our new boutiques.
Our ability to successfully open and operate new boutiques depends on many factors that may be outside of our control including, among others, our ability to:
| · | identify desirable boutique locations, primarily in malls, lifestyle centers, street locations and strip centers, as well as other types of shopping venues and outlet malls, which may be difficult and costly, particularly in an improving real estate environment; |
| 11 |
| · | negotiate acceptable lease terms, including favorable levels of tenant allowances, which may be difficult, particularly in an improving real estate environment; |
| · | maintain out-of-pocket, build-out costs in line with our boutique economic model, including by receiving expected levels of tenant allowances for a portion of our construction expenses, and managing these construction expenses at reasonable levels, which may be difficult, particularly in an improving real estate environment; |
| · | efficiently source and distribute additional merchandise; |
| · | hire, train and retain a growing workforce of boutique managers, boutique associates and other personnel; |
| · | successfully integrate new boutiques into our existing control structure and operations, including our information technology systems; |
| · | efficiently expand the operations of our distribution facility to meet the needs of a growing boutique network; |
| · | identify and satisfy the merchandise and other preferences of our customers in new geographic areas and markets; and |
| · | address competitive, merchandising, marketing, distribution and other challenges encountered in connection with expansion into new geographic areas and markets. |
Our expansion plans have us opening new boutiques in or near the areas where we have existing boutiques. To the extent that we open boutiques in markets where we already have existing boutiques, we may experience reduced net sales at those existing boutiques. Also, as we expand into new geographic areas, we will need to successfully identify and satisfy the fashion preferences of customers in those areas. In addition, we will need to address competition, merchandising, marketing, distribution and other challenges encountered in connection with any expansion and our limited brand recognition in new markets may limit our expansion strategy and cause our business and growth to suffer. New geographic areas may also have different operational characteristics, including employment and labor, logistics, real estate and legal requirements which may divert financial, operation and managerial resources from our existing operations.
Finally, newly opened boutiques may not be received as well as, or achieve net sales or profitability levels comparable to those of, our existing boutiques in our estimated time periods, or at all. If our boutiques fail to achieve, or are unable to sustain, acceptable net sales and profitability levels, our business may be materially harmed and we may incur significant costs associated with closing or relocating boutiques. In addition, our current expansion plans are only estimates, and the actual number of boutiques we open each year and the actual number of suitable locations for our new boutiques could differ significantly from these estimates. If we fail to successfully open and operate new boutiques and execute our growth plans, the price of our common stock could decline.
We may not be able to efficiently source and distribute the additional merchandise quantities necessary to support our growth.
Our success depends on our ability to source and distribute merchandise efficiently. The sourcing of our merchandise are dependent, in part, on our relationships with our vendors. If we are unable to maintain these relationships we may not be able to continue to source merchandise at competitive prices that appeal to our customers. If we do not succeed in maintaining good relationships with our vendors or if our growth outpaces the ability of our vendors to scale up and the company cannot identify new vendors to meet the demand for additional merchandise production, the company could see its costs go up or the delivery time on its new orders substantially increase.
Increases in the cost of the raw materials or other inputs used in the production of our merchandise could result in the loss of suppliers, increase our cost of goods sold and occupancy costs and adversely affect our financial results.
The success of our business is in part driven by the compelling price-value proposition we offer our customers. If the costs of the raw materials, particularly cotton, leather and synthetics, used in producing our merchandise increase, our vendors would look to pass these cost increases along to us. The price and availability of such raw materials may fluctuate significantly, depending on many factors which are outside of our control, including commodity prices, crop yields and weather patterns. If our vendors attempt to pass any cost increases on to us and we refuse to pay the increases, we could lose certain vendors as suppliers, resulting in the risk that we could not fill our orders in a timely manner or at all. If we pay the increases, we could either attempt to raise retail prices, which could adversely affect our sales and our brand image, or choose not to raise prices, which could adversely affect the profitability of our merchandise sales.
In addition, changes in laws affecting our supply chain and portions of the Dodd-Frank Wall Street Reform and Consumer Protection Act relating to conflict minerals, may adversely affect the sourcing, availability and pricing of certain materials which may be used in the manufacture of some of our products.
| 12 |
If we are unable to effectively operate, replace or upgrade any of our existing information technology systems, our operations could be disrupted which could adversely affect our financial results.
The efficient operation of our business is significantly dependent on our information technology systems, including our ability to operate them effectively and successfully implementing new systems and controls. Any failure of these systems to operate effectively or any difficulty in implementing information technology systems changes could disrupt and adversely impact the promptness and accuracy of our merchandise distribution, transaction processing, financial accounting and reporting, including the implementation of our internal controls over financial reporting, the efficiency of our operations and our ability to properly forecast earnings and cash requirements. Any resulting disruptions could harm our business, prospects, financial condition and results of operations.
Our current growth plans will place a strain on our existing resources and could cause us to encounter challenges we have not faced before.
As our number of boutiques and our direct-to-consumer sales grow, our operations will become more complex. While we have grown substantially as a company since inception, much of this growth occurred in the last five fiscal years. As we move forward, we expect our growth to bring new challenges that we have not faced before. Among other difficulties that we may encounter, this growth will place a strain on our existing infrastructure, including our distribution facilities, information technology systems, financial controls, real estate and boutique operations staffs, and may make it more difficult for us to adequately forecast expenditures, such as real estate and construction expenses, and budgeting will become more complex. We may also place increased burdens on our vendors, as we will likely increase the size of our merchandise orders. The increased demands that our growth plans will place on our infrastructure may cause us to operate our business less efficiently, which could cause deterioration in the performance of our existing boutiques. New order delivery times could lengthen as a result of the strains that growth will place on our existing resources and our growth may make it otherwise difficult for us to respond quickly to changing trends, consumer preferences and other factors. This could impair our ability to continue to offer trend-right merchandise which could result in excess inventory, greater markdowns, loss of market share and decreased sales.
In addition, our planned expansion is expected to place increased demands on our existing operational, managerial, administrative and other resources. Specifically, our inventory management systems and personnel processes may need to be further upgraded to keep pace with our current growth strategy. We cannot anticipate all of the demands that our expanding operations will impose on our business, and our failure to appropriately address these demands could have an adverse effect on us.
Our business is sensitive to consumer spending and economic conditions.
Consumer purchases of discretionary retail items and specialty retail products, which include our apparel, jewelry, accessories and gifts, may be adversely affected by economic conditions such as employment levels, salary and wage levels, the availability of consumer credit, inflation, high interest rates, high tax rates, high fuel prices and consumer confidence with respect to current and future economic conditions. Consumer purchases may decline during recessionary periods or at other times when unemployment is higher or disposable income is lower. These risks may be exacerbated for retailers like us that focus significantly on selling discretionary fashion merchandise. Consumer willingness to make discretionary purchases may decline, may stall or may be slow to increase due to national and regional economic conditions. Our financial performance is particularly susceptible to economic and other conditions in regions or states where we have a significant number of boutiques. There remains considerable uncertainty and volatility in the national and global economy. Further or future slowdowns or disruptions in the economy could adversely affect mall traffic and new mall and shopping center development and could materially and adversely affect us and our growth plans. We may not be able to maintain our recent rate of growth in net sales if there is a decline in consumer spending.
In addition, a deterioration of economic conditions and future recessionary periods may exacerbate the other risks faced by our business, including those risks we encounter as we attempt to execute our growth plans. Such risks could be exacerbated individually or collectively.
We operate in the highly competitive specialty retail apparel and accessories industry and the size and resources of some of our competitors may allow them to compete more effectively than we can, which could adversely impact our growth and market share.
We face intense competition in the specialty retail apparel and accessories industry. We compete on the basis of a combination of factors, including price, breadth, quality and style of merchandise, as well as our in-boutique experience and level of customer service, our brand image and our ability to anticipate, identify and respond to new and changing fashion trends. While we believe that we compete primarily with specialty retailers and internet businesses that specialize in women’s apparel and accessories, we also face competition from department stores, mass merchandisers and value retailers. We believe our primary competitors include specialty apparel and accessories retailers that offer their own private labels. In addition, our expansion into markets served by our competitors and entry of new competitors or expansion of existing competitors into our markets could have an adverse effect on our business.
We also compete with a wide variety of large and small retailers for customers, vendors, suitable boutique locations and personnel. The competitive landscape we face, particularly among specialty retailers, is subject to rapid change as new competitors emerge and existing competitors change their offerings. We cannot assure you that we will be able to compete successfully and navigate the shifts in our market.
| 13 |
Many of our competitors are, and many of our potential competitors may be, larger and have greater name recognition and access to greater financial, marketing and other resources. Therefore, these competitors may be able to adapt to changes in trends and customer desires more quickly, devote greater resources to the marketing and sale of their products, generate greater brand recognition or adopt more aggressive pricing policies than we can. As a result, we may lose market share, which could reduce our sales and adversely affect our results of operations. Many of our competitors also utilize advertising and marketing media, including advertising through the use of direct mail, newspapers, magazines, billboards, television and radio, which may provide them with greater brand recognition than we have given our very limited use of traditional television and print advertising.
Our competitors may also sell certain products or substantially similar products through the Internet or through outlet centers or discount stores, increasing the competitive pressure for those products. We cannot assure you that we will continue to be able to compete successfully against existing or future competitors. Our expansion into markets served by our competitors and entry of new competitors or expansion of existing competitors into our markets could have a material adverse effect on us. Competitive forces and pressures may intensify as our presence in the retail marketplace grows.
We do not possess exclusive rights to many of the elements that comprise our in-boutique experience and merchandise offerings. Some specialty retailers offer a personalized shopping experience that in certain ways is similar to the one we strive to provide to our customers. Our competitors may seek to emulate facets of our business strategy and in-boutique experience, which could result in a reduction of any competitive advantage or special appeal that we might possess. In addition, some of our merchandise offerings are sold to us on a non-exclusive basis. As a result, our current and future competitors, especially those with greater financial, marketing or other resources, may be able to duplicate or improve upon some or all of the elements of our in-boutique experience or merchandise offerings that we believe are important in differentiating our boutiques and our customers’ shopping experience. If our competitors were to duplicate or improve upon some or all of the elements of our in-boutique experience or product offerings, our competitive position and our business could suffer.
Our inability to maintain or increase our comparable sales could adversely impact our net sales, profitability, cash flow and stock price.
Our comparable sales declined in fiscal years 2014 and 2013 as compared to the prior year periods. We may not be able to sustain or increase the levels of comparable sales that we have experienced in the recent past. If our future comparable sales continue to decline or fail to meet market expectations, our profitability could be harmed and the price of our common stock could decline. In addition, the aggregate comparable sales levels of our boutiques have fluctuated in the past and can be expected to fluctuate in the future. A variety of factors affect comparable sales, including fashion trends, competition, current national and regional economic conditions, pricing, changes in our merchandise mix, prior period comparable sales levels, inventory shrinkage, the timing and amount of markdowns, the success of our marketing programs, holiday timing and weather conditions. Our planned expansion may cause additional pressure on our comparable sales. These factors may cause our comparable sales results to be materially lower than in recent periods and lower than market expectations, which could harm our business and our earnings and result in a decline in the price of our common stock.
Our inability to maintain our operating margins could adversely affect the price of our common stock.
Our operating margins declined in fiscal years 2014 and 2013 as compared to the prior year periods. We aim to increase our operating margins through scale efficiencies, improved systems, continued cost discipline and enhancements to our merchandise offerings. If we are unable to successfully manage the potential difficulties associated with our growth plans, we may not be able to capture the scale efficiencies that we expect from expansion. If we are not able to capture scale efficiencies, improve our systems, continue our cost discipline and enhance our merchandise offerings, we may not be able to achieve our goals with respect to operating margins. In addition, if we do not adequately refine and improve our various ordering, tracking and allocation systems, we may not be able to increase sales and reduce inventory shrinkage. As a result, our operating margins may stagnate or further decline, which could adversely affect the price of our common stock.
Our ability to attract customers to our boutiques depends on locating our boutiques in suitable locations. Conditions or changes affecting boutique locations, including any decrease in customer traffic, could cause our sales to be less than expected.
Boutique locations and related sales and customer traffic may be adversely affected by, among other things, economic conditions in a particular area, competition from nearby retailers selling similar merchandise, changing lifestyle choices of consumers in a particular market and the closing or decline in popularity of other businesses located near our boutique. Although we have opened many boutiques in mall locations, our approach to identifying locations for our boutiques has historically favored street locations and lifestyle centers. As a result, many of our boutiques are located outside of malls near other retailers or public venues that we believe are consistent with our customers’ lifestyle choices. Changes in areas around our boutique locations that result in reductions in customer foot traffic or otherwise render the locations unsuitable could cause our sales to be less than expected. Boutiques located in street locations and lifestyle centers may be more susceptible to such changes than boutiques located in malls.
| 14 |
Our business depends on a strong brand image, and if we are not able to maintain and enhance our brand, particularly in new markets where we have limited brand recognition, we may be unable to attract a sufficient number of customers to our boutiques or sell sufficient quantities of our merchandise.
We believe that our brand image and brand awareness has contributed significantly to the success of our business. We also believe that maintaining and enhancing our brand image particularly in new markets where we have limited brand recognition is important to maintaining and expanding our customer base. Maintaining and enhancing our brand image may require us to make substantial investments in areas such as merchandising, marketing, boutique operations, community relations, boutique promotions and employee training. These investments may be substantial and may not ultimately be successful.
We are dependent on shopping malls and other retail centers to attract customers to our boutiques.
Many of our boutiques are located in shopping malls and other retail centers that benefit from the ability of “anchor” retail tenants, generally large department centers, and other attractions, to generate sufficient levels of consumer traffic in the vicinity of our boutiques. Any decline in the volume of consumer traffic at these shopping centers, whether because of economic slowdown, severe weather, a decline in the popularity of shopping centers, the closing of anchor stores or otherwise, could result in reduced sales at our boutiques and excess inventory. We may have to respond by increasing markdowns or increasing promotions to reduce excess inventory, which could have a material adverse effect on our margins and operating results.
Our use of traditional advertising channels is very limited and if we fail to adequately continue to connect with our customer base, our business could be adversely affected.
We currently focus on organic, viral and in-boutique marketing to capture the interest of our customers and drive them to our boutiques and website. We limit our use of traditional advertising channels, such as newspapers, magazines, billboards, television and radio, which are used by some of our competitors. We expect to increase our use of social media, such as Facebook and Twitter, in the future. If our marketing efforts are not successful, there may be no immediately available or cost effective alternative marketing channel for us to use to build or maintain brand awareness. As we execute our growth strategy, our ability to successfully integrate new boutiques into their surrounding communities or to expand into new markets will be adversely impacted if we fail to connect with our target customers. Failure to successfully connect with our target customers in new and existing markets could harm our business, results of operations and financial condition.
We depend on our senior management personnel and may not be able to retain or replace these individuals or recruit additional personnel, which could harm our business.
Our future success is substantially dependent on the continued service of our senior management, particularly Mr. Michael Barnes the Chairman of our Board of Directors and our Chief Executive Officer and President since December 4, 2014. The loss of services of one or more of our named executive officers could impair our ability to manage our business effectively and could have an adverse effect on our business, as we may not be able to find suitable individuals to replace them on a timely basis or at all. In addition, any departures of key personnel could be viewed in a negative light by investors and analysts, which could cause our common stock price to decline. We do not maintain key person insurance on any employee.
In addition to these key employees, we have other employees in positions, including those employees responsible for our merchandising and operations departments that, if vacant, could cause a temporary disruption in our business until such positions are filled.
If we are unable to find, train and retain key personnel, including new boutique employees that reflect our brand image and embody our culture, we may not be able to grow or sustain our operations.
Our success depends in part upon our ability to attract, motivate and retain a sufficient number of boutique employees, including boutique managers, who understand and appreciate our customers, brand and corporate culture, and are able to adequately and effectively represent our culture and establish credibility with our customers. Like most retailers, we experience significant employee turnover rates, particularly among boutique employees. Our planned growth will require us to hire and train even more personnel to manage such growth. If we are unable to hire and retain boutique personnel capable of consistently providing a high level of customer service, as demonstrated by their enthusiasm for our culture, understanding of our customers and knowledge of the merchandise we offer, our ability to open new boutiques may be impaired, the performance of our existing and new boutiques could be materially adversely affected and our brand image may be negatively impacted. There is a high level of competition for experienced, qualified personnel in the retail industry and we compete for personnel with a variety of companies looking to hire for retail positions. Historically, we have prided ourselves on our commitment to employee growth and development and we focus on promoting from within our team. Our growth plans will strain our ability to staff our new boutiques, particularly at the boutique manager level, which could have an adverse effect on our ability to maintain a cohesive and consistently strong team, which in turn could have an adverse impact on our business. If we are unable to attract, train and retain employees in the future, we may not be able to serve our customers effectively, thus reducing our ability to continue our growth and to operate our existing boutiques as profitably as we have in the past.
| 15 |
Union attempts to organize our employees could negatively affect our business.
None of our employees are currently subject to a collective bargaining agreement. As we continue to grow and enter different regions, unions may attempt to organize all or part of our employee base at certain boutiques or within certain regions. Responding to such organization attempts may distract management and employees and may have a negative financial impact on individual boutiques, or on our business as a whole.
We have one corporate headquarters and distribution facility and have not yet implemented disaster recovery procedures. Disruptions to the operations at that location could have an adverse effect on our business operations.
Our corporate headquarters and our only distribution facility are located in Houston, Texas. Our distribution facility supports both our boutiques and our direct-to-consumer business. A majority of our merchandise are shipped from our vendors to the distribution facility and then packaged and shipped from our distribution facility to our boutiques and our direct-to-consumer customers. The success of our boutiques depends on the timely receipt of merchandise because they must receive merchandise in a timely manner in order to stay current with the fashion preferences of our customers. The efficient flow of our merchandise requires that we have adequate capacity and uninterrupted service in our distribution facility to support both our current level of operations, and the anticipated increased levels that may follow from our growth plans. We believe that our current distribution facility is capable of supporting our growth plans for several years.
In addition, if we encounter difficulties associated with our distribution facility or if it were to shut down for any reason, including fire, hurricanes or other natural disaster or severe weather, we could face inventory shortages resulting in “out-of-stock” conditions in our boutiques, and delays in shipments to our customers, resulting in significantly higher costs and longer lead times associated with distributing our merchandise. See “-The current geographic concentration of our boutiques creates an exposure to local economies, regional downturns and severe weather or other catastrophic occurrences that may materially adversely affect our financial condition and results of operations” below. Also, most of our computer equipment and senior management, including critical resources dedicated to merchandising, financial and administrative functions are located at our corporate headquarters. Our management and our operations and distribution staff would need to find an alternative location, causing further disruption and expense to our business and operations.
We recognize the need for, and are in the early stages of, developing disaster recovery, business continuity and document retention plans that would allow us to be operational despite casualties or unforeseen events impacting our corporate headquarters or distribution center. Without disaster recovery, business continuity and document retention plans, if we encounter difficulties or disasters with our distribution facility or at our corporate headquarters, our critical systems, operations and information may not be restored in a timely manner, or at all, and this could have an adverse effect on our business.
Our business requires that we lease substantial amounts of space and we may not be able to continue to lease space on terms as favorable as the leases negotiated in the past.
We do not own any real estate. Instead, we lease all of our boutique locations, as well as our corporate headquarters and distribution facility in Houston, Texas. Our boutiques are leased from third parties, with lease terms of five to ten years. Many of our lease agreements also have additional five-year renewal options. We believe that we have been able to negotiate favorable rental rates and tenant allowances over the last few years due in large part to the state of the economy and higher than usual vacancy rates in a number of regional malls and shopping centers. These trends may not continue, and there is no guarantee that we will be able to continue to negotiate such favorable terms. Many of our leases have early cancellation clauses, which permit the lease to be terminated by us or the landlord if certain sales levels are not met in specific periods or if the shopping venue does not meet specified occupancy standards. In addition to fixed minimum lease payments, most of our boutique leases provide for additional rental payments based on a percentage of sales, or “percentage rent,” if sales at the respective boutiques exceed specified levels, as well as the payment of common area maintenance charges, real property insurance and real estate taxes. Many of our lease agreements have defined escalating rent provisions over the initial term and any extensions. Increases in our already substantial occupancy costs and difficulty in identifying economically suitable new boutique locations could have significant negative consequences, which include:
| · | requiring that a greater portion of our available cash be applied to pay our rental obligations, thus reducing cash available for other purposes and reducing our profitability; |
| · | increasing our vulnerability to general adverse economic and industry conditions; and |
| · | limiting our flexibility in planning for, or reacting to changes in, our business or in the industry in which we compete. |
We depend on cash flow from operations to pay our lease expenses and to fulfill our other cash needs. If our business does not generate sufficient cash flow from operating activities to fund these expenses and needs and sufficient funds are not otherwise available to us, we may not be able to service our lease expenses, grow our business, respond to competitive challenges or fund our other liquidity and capital needs, which could harm our business. Additional sites that we lease may be subject to long-term non-cancelable leases if we are unable to negotiate our current standard lease terms. If an existing or future boutique is not profitable, and we decide to close it, we may nonetheless be committed to perform our obligations under the applicable lease including, among other things, paying the base rent for the balance of the lease term. Moreover, even if a lease has an early cancellation clause, we may not satisfy the contractual requirements for early cancellation under that lease. In addition, if we are not able to enter into new leases or renew existing leases on terms acceptable to us, this could have an adverse effect on our results of operations.
| 16 |
Our ability to obtain merchandise on a timely basis at competitive prices could suffer as a result of any deterioration or change in our vendor relationships or events that adversely affect our vendors or their ability to obtain financing for their operations.
We have many important vendor relationships that we believe provide us with a competitive advantage. We do not own or operate any manufacturing facilities. Instead, we purchase our merchandise from third-party vendors. Our top 10 vendor vendors sourced approximately 25% of our merchandise in fiscal year 2014 with no single vendor accounting for more than 5% of our purchases. Our business and financial performance depend in large part on our ability to evaluate merchandise quickly for style and then modify any undesirable designs or to improve the quality, look, and fit of the item. We do not have long-term contracts with any of these vendors and we generally operate without any contractual assurances of continued supply, pricing or access to new products. Rather, we receive and review samples almost daily for fit and fashion evaluation. Any of our vendors could discontinue supplying us with desired products in sufficient quantities for a variety of reasons.
The benefits we currently experience from our vendor relationships could be adversely affected if our vendors:
| · | choose to stop providing merchandise samples to us or otherwise discontinue selling merchandise to us; |
| · | raise the prices they charge us; |
| · | change pricing terms to require us to pay on delivery or upfront, including as a result of changes in the credit relationships some of our vendors have with their various lending institutions; |
| · | reduce our access to styles, brands and merchandise by entering into broad exclusivity arrangements with our competitors or otherwise in the marketplace; |
| · | sell similar merchandise to our competitors with similar or better pricing, many of whom already purchase merchandise in significantly greater volume and, in some cases, at lower prices than we do; |
| · | lengthen their lead times; or |
| · | initiate or expand sales of apparel and accessories to retail customers directly through their own stores, catalogs or on the internet and compete with us directly. |
We historically have established good working relationships with many small- to mid-sized vendors that often have more limited resources, production capacities and operating histories. Market and economic events that adversely impact our vendors could impair our ability to obtain merchandise in sufficient quantities. Such events include difficulties or problems associated with our vendors’ business, finances, labor, ability to import merchandise, costs, production, insurance and reputation. There can be no assurance that we will be able to acquire desired merchandise in sufficient quantities on acceptable terms or at all in the future, especially if we need significantly greater amounts of inventory in connection with the growth of our business. We may need to develop new relationships with larger vendors, as our current vendors may be unable to supply us with needed quantities and we may not be able to find similar merchandise on the same terms from larger vendors. If we are unable to acquire suitable merchandise in sufficient quantities, at acceptable prices with adequate delivery times due to the loss of or a deterioration or change in our relationship with one or more of our key vendors or events harmful to our vendors occur, it may adversely affect our business and results of operations.
A failure in our direct-to-consumer operations could significantly disrupt our business and lead to reduced sales, growth prospects and reputational damage.
While accounting for only 3.8% and 2.6% of our net sales in fiscal years 2014 and 2013, respectively, our direct-to-consumer business is steadily growing and is an important element of our brand and relationship with our customers. Net sales attributable to our direct-to-consumer business increased 64% and 92% in fiscal years 2014 and 2013, respectively. Further expanding our direct-to-consumer business is an important part of our growth strategy. In addition to changing consumer preferences, shifting traffic patterns and related customer acquisition costs and buying trends in our direct-to-consumer business, we are vulnerable to certain additional risks and uncertainties associated with direct-to-consumer sales, including rapid changes in technology, diversion of sales from our boutiques, credit card fraud, website downtime and other technical failures, security breaches, consumer privacy concerns, changes in state tax regimes and government regulation of internet activities. Our failure to successfully respond to these risks and uncertainties could reduce our direct-to-consumer sales, increase our costs, diminish our growth prospects, and damage our brand, which could negatively impact our results of operations and stock price.
| 17 |
In addition, there is no guarantee that we will be able to further expand our direct-to-consumer business. Many of our competitors already have direct-to-consumer businesses that are substantially larger and more developed than ours, which places us at a competitive disadvantage. Moreover, online shopping has benefitted from technology improving the online shopping experience and, in some cases, has resulted in a shift of consumer spending from brick-and-mortar to online where competition is even greater since “pure play” internet retailers do not have significant occupancy costs and boutique payroll expenses like we do. If we are unable to further expand our direct-to-consumer business, our growth plans will suffer and the price of our common stock could decline.
System security risk issues, including our failure to protect our customers’ privacy and disruption of our internal operations or information technology systems, could harm our reputation and adversely affect our financial results and stock price.
Experienced computer programmers and hackers, or even internal users, may be able to penetrate or create systems disruptions or cause shutdowns of our network security or that of third-party companies with which we have contracted to provide services. We generally collect and store customer information for marketing purposes and any compromise of customer information could subject us to customer or government litigation and harm our reputation, which could adversely affect our business and growth. Breaches of our system, which would compromise our customers’ private information, might cause our customers to lose confidence in our ability to protect their personal information, which could cause them to discontinue usage of our website or stop shopping with us altogether. The loss of confidence from a significant data security breach involving employees could also hurt our reputation, cause employee recruiting and retention challenges, increase our labor costs and adversely affect our business and financial results. Moreover, we could incur significant expenses or disruptions of our operations in connection with system failures or data breaches. An increasing number of websites and retailers, including several large internet companies and retailers, have disclosed breaches of their security, some of which have involved sophisticated and highly targeted attacks on portions of their sites. Because the techniques used to obtain unauthorized access, disable or degrade service or sabotage systems, change frequently and often are not recognized until launched against a target, we may be unable to anticipate these techniques or to implement adequate preventative measures. In addition, sophisticated hardware and operating system software and applications that we buy or license from third-parties may contain defects in design or manufacture, including “bugs” and other problems that could unexpectedly interfere with the security and operation of the systems. The costs to us to eliminate or alleviate security problems, viruses and bugs, or any problems associated with the outsourced services provided to us, could be significant, and efforts to address these problems could result in interruptions, delays or cessation of service that may impede our sales, distribution or other critical functions.
In addition, almost all states have adopted breach of data security statutes or regulations that require notification to consumers if the security of their personal information is breached, and at least one state has adopted regulations requiring every company that maintains or stores personal information to adopt a comprehensive written information security program. Governmental focus on data security may lead to additional legislative action, and the increased emphasis on information security may lead customers to request that we take additional measures to enhance security or restrict the manner in which we collect and use customer information to gather insights into customer behavior and craft our marketing programs. As a result, we may have to modify our business systems and practices with the goal of further improving data security, which would result in reduced net sales, increased expenditures and operating complexity. Any compromise of our security or accidental loss or theft of customer data in our possession could result in a violation of applicable privacy and other laws, significant legal and financial exposure and damage to our reputation, which could adversely impact our business, results of operations and stock price.
Our inability or failure to recognize, respond to and effectively manage the accelerated impact of social media could materially adversely impact our business.
There has been a marked increase in the use of social media platforms, including weblogs (blogs), social media websites (such as Facebook, Twitter and Instagram), and other forms of internet-based communications which allow individuals access to a broad audience of consumers and other interested persons. Many social media platforms immediately publish the content to their subscribers and participants posts, often without filters or checks on accuracy of the content posted. The dissemination of information online could harm our business, prospects, financial condition and results of operations, regardless of the information’s accuracy. The harm may be immediate without affording us an opportunity for redress or correction.
Other risks associated with the use of social media include improper disclosure of proprietary information, negative comments about our business, fraud and out-of-date information. The inappropriate use of social media by our customers or employees could increase our costs, lead to litigation or result in negative publicity that could damage our reputation.
The current geographic concentration of our boutiques creates an exposure to local economies, regional downturns and severe weather or other catastrophic occurrences that may materially adversely affect our financial condition and results of operations.
We operated 49 boutiques in California as of January 31, 2015, making California our largest market, representing approximately 9% of our total boutiques. We also have boutique concentration in Texas, Florida and the Northeast region, operating 47 boutiques, 38 boutiques and 96 boutiques in these regions, respectively, as of January 31, 2015. As a result, our business is currently more susceptible to regional conditions than the operations of more geographically diversified competitors, and we are vulnerable to economic downturns in those regions. Any unforeseen events or circumstances that negatively affect these areas could materially adversely affect our sales and profitability. These factors include, among other things, changes in demographics and population and severe weather or natural disasters.
| 18 |
Further, our corporate headquarters and only distribution center are currently located at a single facility in Houston, Texas. Our single distribution center receives, stores and distributes merchandise to all of our boutiques and fulfills all sales for our direct-to-consumer business. Most of our computer equipment and senior management, including critical resources dedicated to merchandising and financial and administrative functions, are located at our corporate headquarters. As described elsewhere in the risk factors in this report, we do not have adequate disaster recovery systems and plans at our corporate headquarters and distribution facility. As a result, our business may be more susceptible to regional natural disasters, severe weather and catastrophes than the operations of more geographically diversified competitors. See “-We have one corporate headquarters and distribution facility and have not yet implemented disaster recovery procedures. Disruptions to the operations at that location could have an adverse effect on our business operations” above.
In addition, a substantial number of our boutiques are located in the northeastern and southeastern United States. These regions of the United States, Texas and other states along the Gulf Coast, in particular, are prone to severe weather conditions. For example, hurricanes have passed through these regions and caused extensive damage. Adverse weather conditions impacting these regions of the United States generally could harm our business, results of operations and financial condition. Severe weather can also result in weather-related supply disruptions, which could impact our ability to supply boutiques. In addition, weather conditions can affect our net sales because inclement weather may discourage travel or require temporary boutique closures, thereby reducing customer traffic. Unseasonably warmer weather during typically colder months or unreasonably colder weather during typically warmer months can also affect the seasonal composition and demand for our merchandise, which could harm our business, results of operations and financial condition.
All of our boutique locations expose us to additional diverse risks, given that natural disasters or other unanticipated catastrophes, such as telecommunications failures, cyber-attacks, fires or terrorist attacks, can occur anywhere and could cause disruptions in our operations. Extensive or multiple disruptions in our operations, whether at our boutiques or our corporate headquarters and distribution center, due to natural disasters, severe weather or other catastrophes could have an adverse effect on our business, results of operations and stock price.
Our results may be adversely affected by fluctuations in energy costs.
Energy costs have fluctuated dramatically in the past and may fluctuate in the future. These fluctuations may result in an increase in our transportation costs for distribution, utility costs for our retail boutiques and costs to purchase product from our vendors. A continual rise in energy costs could adversely affect consumer spending and demand for our merchandise and increase our operating costs and we may be unable to pass along to our customers such increased cost, all of which could have a material adverse effect on our business, results of operations and stock price.
Our net sales and merchandise fluctuate on a seasonal basis, leaving our operating results susceptible to adverse changes in seasonal shopping patterns, weather and related risks.
Due to the seasonal nature of the retail industry, we have historically experienced and expect to continue to experience some fluctuations in our net sales and net income. Our net sales and earnings are typically highest in the fourth fiscal quarter due to the year-end holiday season. Net sales during this period cannot be used as an accurate indicator of annual results. Likewise, as is the case with many retailers of apparel, jewelry, accessories and gifts, we typically experience lower net sales in the first fiscal quarter relative to other quarters. If for any reason, including for example poor weather conditions, soft economic environments and loss of consumer confidence, our net sales were below seasonal norms or expectations during typically higher-volume time periods, our net sales, inventory levels and results of operations could be adversely affected. In addition, in order to prepare for these periods, we must order and keep in stock significantly more merchandise than we carry during other parts of the year. This inventory build-up may require us to expend cash faster than is generated by our operations during these periods. Any unanticipated decrease in demand for our merchandise during peak shopping periods could result in excess inventory levels which could require us to sell excess inventory at a substantial markdown, which could have an adverse effect on our business, profitability and brand image. In addition, we may experience variability in net sales as a result of a variety of other factors, including the timing of new boutique openings, boutique events, other marketing activities, sales tax holidays and other holidays, which may cause our results of operations to fluctuate on a quarterly basis and relative to corresponding periods in prior years.
If our vendors fail to comply with applicable laws, including a failure to use acceptable labor practices, or if our vendors suffer disruptions in their businesses, we could suffer adverse business consequences.
Our vendors source the merchandise sold in our boutiques and our direct-to-consumer website from manufacturers both inside and outside of the United States. Although each of our purchase orders is subject to our vendor manuals, which require compliance with labor, immigration, manufacturing and product safety, environmental and other laws, we do not supervise, control or audit our vendors or the manufacturers that produce the merchandise we sell. The violation, or perception of any violation, of any labor, immigration, manufacturing safety or other laws by any of our vendors or their U.S. and non-U.S. manufacturers, such as use of child labor, or the divergence of the labor practices followed by any of our vendors or these manufacturers from those generally accepted in the United States, could damage our brand image or subject us to boycotts by our customers or activist groups.
| 19 |
Any event causing a sudden disruption of manufacturing or imports, including the imposition of additional import restrictions, could interrupt, or otherwise disrupt the shipment of finished products to us by our vendors and materially harm our operations. Political and financial instability outside the United States, strikes, adverse weather conditions or natural disasters that may occur or acts of war or terrorism in the United States or worldwide, may affect the production, shipment or receipt of merchandise. These factors, which are beyond our control, could materially hurt our business, financial condition and results of operations or may require us to modify our current business practices or incur increased costs.
Changes in laws, including employment laws and laws related to our merchandise could make conducting our business more expensive or otherwise cause us to change the way we do business.
We are subject to numerous regulations, including labor and employment, truth-in-advertising, consumer protection, product safety, environmental and zoning and occupancy laws and ordinances that regulate retailers generally or govern the promotion and sale of merchandise and the operation of boutiques and warehouse facilities. If these regulations were to change or were violated by our management, employees or vendors, the costs of certain goods could increase, or we could experience delays in shipments of our goods, be subject to fines, penalties or other liabilities or suffer reputational harm, which could reduce demand for our merchandise and hurt our business and results of operations.
In addition to increased regulatory compliance requirements, changes in laws could make the ordinary conduct of our business more expensive or require us to change the way we do business. Laws related to employee benefits and treatment of employees, including laws related to limitations on employee hours, immigration laws, child labor laws, supervisory status, leaves of absence, mandated health benefits or overtime pay, could also negatively impact us, such as by increasing compensation and benefits costs for overtime and medical expenses. Moreover, changes in product safety or other consumer protection laws could lead to increased costs to us for some merchandise, or additional labor costs associated with readying merchandise for sale. It is often difficult for us to plan and prepare for potential changes to applicable laws, and future actions or payments related to these changes could be material to us.
We will require significant capital to fund our expanding business, which may not be available to us on satisfactory terms or at all. We plan to use cash from operations to fund our operations and execute our growth strategy. If we are unable to maintain sufficient levels of cash flow, we may not meet our growth expectations or we may require additional financing which could adversely affect our financial health and impose covenants that limit our business activities.
We plan to continue our growth and expansion, including opening a number of new boutiques, remodeling existing boutiques and upgrading our information technology systems and other infrastructure as opportunities arise. Our plans to expand our boutique base may not be successful and the implementation of these plans may not result in expected increases in our net sales even though they increase our costs. To support our expanding business and execute on our growth strategy, we will require significant capital.
We currently primarily depend on cash flow from operations and our revolving credit facility to fund our business and growth plans. If our business does not generate sufficient cash flow from operations to fund these activities, and sufficient funds are not otherwise available to us from our revolving credit facility, we may need additional equity or debt financing. If such financing is not available to us, or is not available on satisfactory terms, our ability to operate and expand our business or respond to competitive pressures would be curtailed and we may need to delay, limit or eliminate planned boutique openings or operations or other elements of our growth strategy. If we raise additional capital by issuing equity securities or securities convertible into equity securities, your ownership would be diluted.
We may incur additional indebtedness in the future, which may require us to use a substantial portion of our cash flow to service debt and limit our financial and operating flexibility in important ways.
We may incur additional indebtedness in the future. Any borrowings under any future debt financing will require interest payments and need to be repaid or refinanced, could require us to divert funds identified for other purposes to debt service and would create additional cash demands and could impair our liquidity position and add financial risk for us. Diverting funds identified for other purposes for debt service may adversely affect our business and growth prospects. If we cannot generate sufficient cash flow from operations to service our debt, we may need to refinance our debt, dispose of assets or issue equity to obtain necessary funds. We do not know whether we would be able to take any of these actions on a timely basis, on terms satisfactory to us, or at all.
Our level of indebtedness has important consequences to you and your investment in our common stock. For example, our level of indebtedness may:
| · | require us to use a substantial portion of our cash flow from operations to pay interest and principal on our debt, which would reduce the funds available to us for working capital, capital expenditures and other general corporate purposes; |
| · | limit our ability to pay future dividends; |
| 20 |
| · | limit our ability to obtain additional financing for working capital, capital expenditures, expansion plans and other investments, which may limit our ability to implement our business strategy; |
| · | heighten our vulnerability to downturns in our business, the specialty apparel and accessories retail industry or in the general economy and limit our flexibility in planning for, or reacting to, changes in our business and the specialty apparel and accessories retail industry; or |
| · | prevent us from taking advantage of business opportunities as they arise or successfully carrying out our plans to expand our boutique base and product offerings. |
Our business may not generate sufficient cash flow from operations and future borrowings may not be available to us in amounts sufficient to enable us to make payments on our indebtedness or to fund our operations.
The terms of our revolving credit facility do, and the terms of any additional debt financing may, restrict our current and future operations, which could adversely affect our ability to manage our operations and respond to changes in our business.
Our revolving credit facility contains, and any additional debt financing we may incur would likely contain, covenants that restrict our operations, including limitations on our ability to incur additional debt, grant liens, make certain investments, acquisitions loans and advances, sell assets, pay dividends or make distributions or other restricted payments, prepay other indebtedness, engage in mergers or consolidations, change the business conducted by Francesca’s Collections and its subsidiaries, engage in certain transactions with affiliates, enter into agreements that restrict dividends from subsidiaries or amend certain charter documents and material agreements governing subordinated and junior indebtedness. A failure by us to comply with the covenants or financial ratios contained in our revolving credit facility or any additional debt financing we may incur could result in an event of default, which could adversely affect our ability to respond to changes in our business and manage our operations. Upon the occurrence of an event of default, the lenders could elect to declare all amounts outstanding to be due and payable and exercise other remedies. If the indebtedness under our revolving credit facility or any additional debt financing we may incur were to be accelerated, our future financial condition could be materially adversely affected.
We are involved on an ongoing basis in litigation arising in the ordinary course of business or otherwise that could distract management from our business activities and result in significant liability or damage to our brand.
As a growing company with expanding operations, we increasingly face the risk of litigation and other claims against us. We are involved on an ongoing basis in litigation arising in the ordinary course of our business or otherwise, which may include class actions involving consumers, shareholders or employees, and claims relating to employees, commercial disputes, landlord-tenant disputes, intellectual property issues, product-oriented allegations and slip and fall claims. These actions and claims can raise complex factual and legal issues that are subject to risks and uncertainties and could require significant management time. Litigation and other actions and claims against us could result in unexpected expenses and liabilities, which could materially adversely affect our operations and our reputation.
We may be unable to protect our trademarks or other intellectual property rights.
We believe that our trademarks are integral to our boutique design, our direct-to-consumer business and our success in building our brand image and customer loyalty. We rely on trademark registrations and common law trademark rights to protect the distinctiveness of our brand and have registered those trademarks that we believe are important to our business with the United States Patent and Trademark Office. We cannot assure you that these registrations will prevent imitation of our name, merchandising concept, boutique design or private label merchandise, or the infringement of our other intellectual property rights by others. In most cases, the merchandise we sell is purchased on a non-exclusive basis from vendors that also sell to our competitors. While we use our brand name on these items, our competitors may seek to replicate aspects of our business strategy and in-boutique experience, thereby diluting the experience we offer and adversely affecting our brand and competitive position. Imitation of our name, concept, boutique design or merchandise in a manner that projects lesser quality or carries a negative connotation of our brand image could have an adverse effect on our business, financial condition and results of operations.
We are not aware of any claims of infringement upon or challenges to our right to use any of our brand names or trademarks in the United States. Nevertheless, we cannot be certain that the actions we have taken to establish and protect our trademarks will be adequate to prevent imitation of our merchandise by others or to prevent others from seeking to block sales of our merchandise as a violation of the trademarks or proprietary rights of others. Although we cannot currently estimate the likelihood of success of any such lawsuit or ultimate resolution of such a conflict, such a controversy could have an adverse effect on our business, financial condition and results of operations. If disputes arise in the future, we may not be able to successfully resolve these types of conflicts to our satisfaction.
| 21 |
We are currently in the process of registering our trademarks in several foreign countries to seek protection outside the United States. However, international protection of our brand image and the use of these marks may be unavailable or could be limited. Also, other entities may have rights to trademarks that contain portions of our marks or may have registered similar or competing marks for merchandise in foreign countries in which our vendors source our merchandise. There may also be other prior registrations of trademarks identical or similar to our trademarks in other foreign countries of which we are not aware. Accordingly, it may be possible for others to prevent the manufacture of our branded goods in certain foreign countries or the sale or exportation of our branded goods from certain foreign countries to the United States. If we were unable to reach a licensing arrangement with these parties, our vendors may be unable to manufacture our merchandise in those countries. Our inability to register our trademarks or purchase or license the right to use our trademarks or logos in these jurisdictions could limit our ability to obtain supplies from less costly markets or penetrate new markets should our business plan change to include selling our merchandise in those foreign jurisdictions.
Litigation may be necessary to protect our trademarks and other intellectual property rights or to enforce these rights. Any litigation or claims brought by us could result in substantial costs and diversion of our resources, which could have a material adverse effect on our business, financial condition, results of operations or cash flows.
We may be subject to liability and other risks if we, our vendors or the manufacturers of our merchandise infringe upon the trademarks or other intellectual property rights of third parties, including the risk that we could acquire merchandise from our vendors without the full right to sell it.
We purchase merchandise that may be subject to design copyrights, design patents or otherwise may incorporate protected intellectual property. While we are not involved in the manufacture of any of the merchandise we purchase from our vendors for sale to our customers, we may be subject to liability if our vendors or the manufacturers of our merchandise infringe upon the trademarks or other intellectual property rights of third parties. We do not independently investigate whether our vendors or the manufacturers with whom they do business legally hold intellectual property rights to the merchandise we purchase. Third parties may bring legal claims, or threaten to bring legal claims, against us that their intellectual property rights are being infringed or violated by our use of intellectual property. Litigation or threatened litigation could be costly and distract our senior management from operating our business. If we were to be found liable for any such infringement, we could be required to pay substantial damages and could be subject to injunctions preventing further infringement. In addition, any payments we are required to make and any injunctions with which we are required to comply as a result of infringement claims could be costly and thereby adversely affect our financial results.
If a third party claims to have licensing rights with respect to merchandise we purchased from a vendor, or if we acquire unlicensed merchandise, we may be obligated to remove this merchandise from our boutiques, incur costs associated with this removal if the distributor or vendor is unwilling or unable to reimburse us and be subject to liability under various civil and criminal causes of action, including actions to recover unpaid royalties and other damages and injunctions. Additionally, we will be required to purchase new merchandise to replace any we remove.
We rely upon independent third-party transportation providers for substantially all of our merchandise shipments.
We currently rely upon independent third-party transportation providers for substantially all of our merchandise shipments, including shipments to all of our boutiques and our direct customers. Our use of outside delivery services for shipments is subject to risks, including increases in fuel prices, which would increase our shipping costs, and employee strikes and inclement weather, which may impact a shipper’s ability to provide delivery services that adequately meet our shipping needs. If we change shipping companies, we could face logistical difficulties that could adversely impact deliveries and we would incur costs and expend resources in connection with such change. Moreover, we may not be able to obtain terms as favorable as those received from the independent third-party transportation providers we currently use, which would increase our costs.
Disruptions in transportation, including disruptions at shipping ports through which our merchandise are imported, could prevent us from timely distribution and delivery of merchandise, which could reduce our net sales and operating margin.
From time to time, shipping ports experience capacity constraints, labor strikes, work stoppages or other disruptions that may delay the delivery of imported products. A lengthy contract dispute may lead to protracted delays in the movement of our merchandise, which could further delay the delivery of merchandise to our boutiques and impact net sales and operating margin. In addition, other conditions outside of our control, such as adverse weather conditions or acts of terrorism, could significantly disrupt operations at shipping ports or otherwise impact transportation of the imported merchandise we sell.
Future disruptions in transportation services or at a shipping port at which our merchandise are received may result in delays in the transportation of such merchandise to our distribution center and may ultimately delay the distribution to our boutiques resulting in reduced net sales and / or profitability.
| 22 |
Our ability to source our merchandise efficiently and profitably could be hurt if new trade restrictions are imposed, existing trade restrictions become more burdensome, or the countries where our merchandise are sourced experience political instability.
We currently purchase all of our inventory from domestic vendors, who source our merchandise both domestically and internationally. In fiscal years 2014 and 2013, we believe most of the merchandise sourced by our vendors was produced outside the United States. These vendors, to the extent they obtain merchandise from outside of the United States, are subject to trade restrictions, including tariffs, safeguards or quotas, changes to which could increase the cost or reduce the supply of merchandise available to us. Under the World Trade Organization Agreement, effective January 1, 2005, the United States and other World Trade Organization member countries removed quotas on goods from World Trade Organization members, which in certain instances we believe afford our vendors greater flexibility in importing textile and apparel products from World Trade Organization countries from which they source our merchandise. However, as the removal of quotas resulted in an import surge from China, the United States imposed safeguard quotas on a number of categories of goods and apparel from China, and may impose additional quotas in the future. These and other trade restrictions could have a significant impact on our vendors’ sourcing patterns in the future. The extent of this impact, if any, and the possible effect on our purchasing patterns and costs, cannot be determined at this time. We cannot predict whether any of the countries in which our vendors’ merchandise are currently manufactured or may be manufactured in the future will be subject to additional trade restrictions imposed by the United States or foreign governments, nor can we predict the likelihood, type or effect of any restrictions. Trade restrictions, including increased tariffs or quotas, embargoes, safeguards and customs restrictions against items we offer in our boutiques, as well as United States or foreign labor strikes, work stoppages or boycotts, could increase the cost or reduce the supply of merchandise to our vendors, and we would expect the costs to be passed along in increased prices to us, which could hurt our profitability.
Additionally, political instability or acts of terrorism, significant fluctuations in the value of the U.S. dollar against foreign currencies and restrictions on the transfer of funds between the U.S. and foreign jurisdictions, any of which if they effect the countries where our merchandise are sourced, could adversely affect our merchandise flow and, consequently, cause our sales to decline.
We may be subject to sales tax in states where we operate our direct-to-consumer business, which could have an adverse effect on our business, financial condition and results of operations.
Under current state and federal laws, we are not required to collect and remit sales tax in some states where we sell through our direct-to-consumer business. Legislation is pending in some states that may require us to collect and remit sales tax on direct-to-consumer sales or institute use tax reporting. If states pass sales or use tax laws, we may need to collect and remit current and past sales tax and could face greater exposure to income tax and franchise taxes in these states. Any increase in sales tax or use tax reporting on our internet sales could discourage customers from purchasing through our direct-to-consumer business, which could have an adverse effect on growth prospects.
Increases in the minimum wage could have an adverse effect on our financial results.
From time to time, legislative proposals are made to increase the federal minimum wage in the United States, as well as the minimum wage in a number of individual states and municipalities. Legislation to increase the minimum wage is currently pending or being contemplated in some states in which we operate. Base wage rates for many of our employees are at or slightly above the minimum wage. As federal or state minimum wage rates increase, we may need to increase not only the wage rates of our minimum wage employees, but also the wages paid to our other hourly employees as well. Any increase in the cost of our labor could have an adverse effect on our operating costs, financial condition and results of operations.
Anti-takeover provisions of Delaware law and our certificate of incorporation and bylaws could delay and discourage takeover attempts that stockholders may consider to be favorable.
Our amended and restated certificate of incorporation and amended and restated bylaws contain provisions that make it difficult for our stockholders to change the composition of our board of directors, preventing them from changing the composition of management. In addition, the same provisions may discourage, delay or prevent a merger or acquisition that our stockholders may consider favorable. These provisions, among other things:
| · | establish a staggered, or classified, board of directors so that not all members of our board of directors are elected at one time; |
| · | prohibit cumulative voting in the election of directors; |
| · | authorize the issuance by our board of directors of “blank check” preferred stock, the terms of which may be established and the shares of which may be issued without stockholder approval, and which may include super-majority voting, special approval, dividend or other rights or preferences superior to the rights of the holders of common stock; |
| · | limit the persons who may call special meetings of stockholders; |
| · | prohibit stockholder action by written consent, which requires all stockholder actions to be taken at a meeting of our stockholders; and |
| · | establish advance notice requirements for stockholder nominations for elections to our board of directors or for proposing matters that can be acted upon by stockholders at stockholder meetings. |
| 23 |
These anti-takeover provisions and other provisions under Delaware law could substantially impede the ability of our common stockholders to benefit from a change in control and, as a result, could materially adversely affect the market price of our common stock and your ability to realize any potential change-in-control premium.
Our costs to comply with changing regulations applicable to public companies have increased significantly and our management is required to devote substantial time in complying with these public company regulations.
As a public company, we are required to incur additional legal, accounting, compliance and other expenses that we did not incur as a private company. We are obligated to file with the SEC annual and quarterly information and other reports that are specified in Section 13 and other sections of the Securities Exchange Act of 1934, as amended (the “Exchange Act”). In addition, we are also subject to other reporting and corporate governance requirements, including certain requirements of The NASDAQ Stock Market, certain provisions of the Sarbanes-Oxley Act of 2002 (“Sarbanes-Oxley”), certain provisions of the Dodd-Frank Act of 2010 (“Dodd-Frank”) and the regulations promulgated thereunder, which impose significant compliance obligations upon us. We must be certain that we have the ability to institute and maintain a comprehensive compliance function; established internal policies; ensure that we have the ability to prepare financial statements that are fully compliant with all SEC reporting requirements on a timely basis; design, establish, evaluate and maintain a system of internal controls over financial reporting in compliance with Sarbanes-Oxley; involve and retain outside counsel and accountants in the above activities and maintain an investor relations function.
Sarbanes-Oxley and Dodd-Frank, as well as rules subsequently implemented by the SEC and The NASDAQ Stock Market, have imposed increased regulation and disclosure and have required enhanced corporate governance practices of public companies. Our efforts to comply with evolving laws, regulations and standards in this regard have resulted and will likely continue to result in increased administrative expenses and a diversion of management’s time and attention from revenue-generating activities to compliance activities. These require a significant commitment of additional resources. We may not be successful in implementing or maintaining these requirements, any failure of which could materially adversely affect our business, results of operations and financial condition. In addition, if we fail to implement or maintain the requirements with respect to our internal accounting and audit functions, our ability to continue to report our operating results on a timely and accurate basis could be impaired. If we do not implement or maintain such requirements in a timely manner or with adequate compliance, we might be subject to sanctions or investigation by regulatory authorities, such as the SEC or The NASDAQ Stock Market. Any such action could harm our reputation and the confidence of investors and customers in our company and could materially adversely affect our business and cause our share price to fall.
ITEM 1B. UNRESOLVED STAFF COMMENTS
None.
We do not own any real property, but rather lease our properties. Our corporate headquarters, warehouse and distribution center are located in an approximately 218,000 square foot facility in Houston, Texas. The lease will expire on April 30, 2020; however, we have options to renew the lease for an additional period of up to ten years. We believe that our current facility will be sufficient to support our growth plans for several years.
As of January 31, 2015, we had 539 boutiques in 47 states and the District of Columbia and had executed leases for 52 new boutiques we plan to open in fiscal year 2015. In total we have approximately 728,000 gross square feet across all of our boutiques. Our boutiques are leased from third parties with lease terms of five to ten years and many of our lease agreements have additional five-year renewal options. A majority of our leases have early termination clauses, which permit the lease to be terminated by us if certain sales levels are not met in specific periods or if a shopping center does not meet specified occupancy standards. In addition to fixed minimum lease payments, most of our boutique leases provide for additional rental payments based on a percentage of sales if sales at the respective boutiques exceed specified levels. In addition, a majority of our leases also provide for additional payments associated with common area maintenance, real estate taxes and insurance. In addition, many of our lease agreements have defined escalating rent provisions over the initial term and extensions.
For information regarding legal proceedings involving us, please refer to Note 9 to our audited consolidated financial statements included in “Financial Statements and Supplementary Data” in Item 8 of this Annual Report, which is incorporated herein by reference.
ITEM 4. MINE SAFETY DISCLOSURES
Not applicable.
| 24 |
| ITEM 5. | MARKET FOR REGISTRANT’S COMMON EQUITY, RELATED STOCKHOLDER MATTERS AND ISSUER PURCHASES OF EQUITY SECURITIES |
Our common stock is listed on the NASDAQ Global Select Market under the symbol “FRAN.” As of March 13, 2015, there were approximately 74 holders of record of our common stock. The number of holders of record is based upon the actual number of holders registered at such date and does not include holders of shares in “street names” or persons, partnerships, associates, corporations or other entities identified in security position listing maintained by depositories.
The following table sets forth, for the periods indicated, the high and low sales prices of our common stock as reported by the NASDAQ Global Select Market:
| High | Low | |||||||
| Fiscal Year 2014 | ||||||||
| First Quarter (February 2, 2014 to May 3, 2014) | $ | 21.23 | $ | 15.93 | ||||
| Second Quarter (May 4, 2014 to August 2, 2014) | $ | 17.34 | $ | 12.39 | ||||
| Third Quarter (August 3, 2014 to November 1, 2014) | $ | 15.01 | $ | 11.43 | ||||
| Fourth Quarter (November 2, 2014 to January 31, 2015) | $ | 17.43 | $ | 11.02 | ||||
| Fiscal Year 2013 | ||||||||
| First Quarter (February 3, 2013 to May 4, 2013) | $ | 30.98 | $ | 24.02 | ||||
| Second Quarter (May 5, 2013 to August 3, 2013) | $ | 32.43 | $ | 24.43 | ||||
| Third Quarter (August 4, 2013 to November 2, 2013) | $ | 25.99 | $ | 16.40 | ||||
| Fourth Quarter (November 3, 2013 to February 1, 2014) | $ | 22.60 | $ | 15.62 | ||||
Dividend Policy
We did not declare or pay any dividends on our common stock during fiscal years 2014 and 2013. We presently do not have plans to pay any cash dividends in the near future. Any future determination to pay dividends will be at the discretion of our Board, subject to compliance with applicable law and any contractual provisions, including under agreements for indebtedness we may incur, that restrict or limit our ability to pay dividends, and will depend upon, among other factors, our results of operations, financial condition, earnings, capital requirements and other factors that our Board deems relevant. Because we are a holding company, our ability to pay dividends depends on our receipt of cash dividends from our operating subsidiaries, which may further restrict our ability to pay dividends as a result of the laws of their jurisdiction of organization, agreements of our subsidiaries or covenants under future indebtedness we may incur. For information regarding restrictions on the payment of dividends imposed by the Second Amended and Restated Credit Agreement, See Note 5 to our audited consolidated financial statements included in “Financial Statements and Supplementary Data” in Item 8 of this Annual Report, which is incorporated herein by reference.
Performance Graph
The following graph compares the yearly percentage change in the cumulative stockholder return on our common stock with the cumulative total return for the NASDAQ Global Select Market Index and the NASDAQ Retail Trade Index. The graph assumes $100 was invested at the close of market on July 22, 2011, the date of our IPO, in the stock of Francesca’s Holdings Corporation, the NASDAQ Global Stock Market, and the NASDAQ Retail Trade Stocks. It also assumes that all dividends are reinvested.
| 25 |
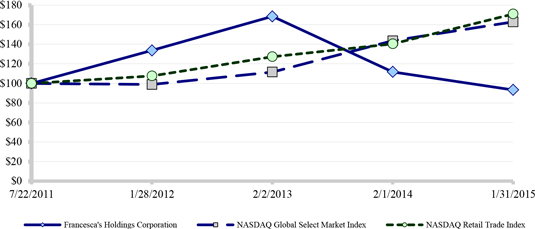
| July 22, 2011 | January 28, 2012 | February 2, 2013 | February 1, 2014 | January 31, 2015 | ||||||||||||||||
| Francesca's Holdings Corporation | $ | 100.00 | $ | 133.71 | $ | 168.53 | $ | 111.76 | $ | 93.29 | ||||||||||
| NASDAQ Global Select Market Index | $ | 100.00 | $ | 98.89 | $ | 111.61 | $ | 143.64 | $ | 162.89 | ||||||||||
| NASDAQ Retail Trade Index | $ | 100.00 | $ | 107.63 | $ | 127.32 | $ | 140.46 | $ | 171.03 | ||||||||||
The foregoing graph is based on historical data and is not necessarily indicative of future performance.
The foregoing performance graph shall not be deemed “filed” for purposes of Section 18 of the Exchange Act, or otherwise subject to the liabilities under that section and shall not be deemed to be incorporated by reference into any filing of Francesca’s Holdings Corporation under the Securities Act of 1933, as amended, or the Exchange Act.
Purchases of Equity Securities by the Issuer
The Company did not purchase any of its common stock in the thirteen weeks ended January 31, 2015.
ITEM 6. SELECTED FINANCIAL DATA
The following selected consolidated financial data for each of the years ended January 31, 2015, February 1, 2014, and February 2, 2013, and the selected consolidated balance sheet data as of January 31, 2015 and February 1, 2014 have been derived from our audited consolidated financial statements, which are included elsewhere in this Annual Report on Form 10-K. The selected consolidated financial data for the year ended January 28, 2012 and January 29, 2011 and the consolidated balance sheet data as of February 2, 2013, January 28, 2012 and January 29, 2011 have been derived from our audited consolidated financial statements, which are not included in this Annual Report on Form 10-K.
We operate on a fiscal calendar which, in a given fiscal year, consists of a 52- or 53-week period ending on the Saturday closest to January 31st. The reporting periods contained in our audited consolidated financial statements included in this report contain 52 of weeks of operation in fiscal year 2014, which ended on January 31, 2015, 52 weeks of operations in fiscal year 2013, which ended on February 1, 2014, and 53 weeks of operations in fiscal year 2012, which ended on February 2, 2013. Our fiscal years 2011 and 2010 each included 52 weeks of operations which ended on January 28, 2012 and January 29, 2011, respectively. The historical results presented below are not necessarily indicative of the results to be expected for any future period. You should read the selected consolidated financial and operating data for the periods presented in conjunction with “Risk Factors”, “Management’s Discussion and Analysis of Financial Condition and Results of Operations” and our consolidated financial statements and the related notes, which are included elsewhere in this Annual Report on Form 10-K.
| Fiscal Year Ended | ||||||||||||||||||||
| January 31, | February 1, | February 2, | January 28, | January 29, | ||||||||||||||||
| 2015 | 2014 | 2013 | 2012 | 2011 | ||||||||||||||||
| (in thousands, except per share data and percentages) | ||||||||||||||||||||
| Consolidated Statements of Operations | ||||||||||||||||||||
| Net sales | $ | 377,497 | $ | 340,325 | $ | 296,373 | $ | 204,158 | $ | 135,176 | ||||||||||
| Cost of goods sold and occupancy costs | 199,919 | 164,260 | 137,873 | 97,365 | 65,008 | |||||||||||||||
| Gross profit | 177,578 | 176,065 | 158,500 | 106,793 | 70,168 | |||||||||||||||
| Selling, general, and administrative expense | 124,804 | 101,795 | 80,560 | 63,262 | 40,525 | |||||||||||||||
| Income from operations | 52,774 | 74,270 | 77,940 | 43,531 | 29,643 | |||||||||||||||
| 26 |
| Fiscal Year Ended | ||||||||||||||||||||
| January 31, | February 1, | February 2, | January 28, | January 29, | ||||||||||||||||
| 2015 | 2014 | 2013 | 2012 | 2011 | ||||||||||||||||
| (in thousands, except per share data and percentages) | ||||||||||||||||||||
| Interest expense | (623 | ) | (588 | ) | (672 | ) | (4,868 | ) | (1,633 | ) | ||||||||||
| Loss on early extinguishment of debt | - | - | - | (1,591 | ) | - | ||||||||||||||
| Other income (expense) | 88 | 208 | 230 | 284 | (2 | ) | ||||||||||||||
| Income before income tax expense | 52,239 | 73,890 | 77,498 | 37,356 | 28,008 | |||||||||||||||
| Income tax expense | 20,131 | 29,051 | 30,437 | 14,855 | 11,113 | |||||||||||||||
| Net income | $ | 32,108 | $ | 44,839 | $ | 47,061 | $ | 22,501 | $ | 16,895 | ||||||||||
| Basic earnings per common share (1) | $ | 0.76 | $ | 1.03 | $ | 1.08 | $ | 0.53 | $ | 0.43 | ||||||||||
| Diluted earnings per common share (1) | $ | 0.76 | $ | 1.02 | $ | 1.05 | $ | 0.52 | $ | 0.41 | ||||||||||
| Dividends declared per common share | $ | - | $ | - | $ | - | $ | - | $ | 2.39 | ||||||||||
| Weighted average shares outstanding: | ||||||||||||||||||||
| Basic shares | 42,259 | 43,372 | 43,744 | 42,087 | 39,385 | |||||||||||||||
| Diluted shares | 42,380 | 44,123 | 44,807 | 42,948 | 40,907 | |||||||||||||||
| Consolidated Balance Sheet and Operating Data | ||||||||||||||||||||
| Total current assets | $ | 85,899 | $ | 82,425 | $ | 59,685 | $ | 36,319 | $ | 31,851 | ||||||||||
| Total assets | 165,545 | 150,545 | 113,174 | 72,590 | 59,253 | |||||||||||||||
| Long-term debt | - | 25,000 | - | 22,000 | 87,875 | |||||||||||||||
| Total liabilities | 56,331 | 72,478 | 41,117 | 55,687 | 114,721 | |||||||||||||||
| Total stockholders’ equity (deficit) | $ | 109,214 | $ | 78,067 | $ | 72,057 | $ | 16,902 | $ | (55,468 | ) | |||||||||
| Operating data: | ||||||||||||||||||||
| Comparable sales change for period (2)(3) | (5 | )% | (2 | )% | 16 | % | 11 | % | 16 | % | ||||||||||
| Number of boutiques open at end of period (not in thousands) | 539 | 451 | 360 | 283 | 207 | |||||||||||||||
Net sales per average square foot for period (not in thousands) (4) | $ | 545 | $ | 592 | $ | 632 | $ | 554 | $ | 508 | ||||||||||
Average square feet per boutique at the end of the period (not in thousands) (5) | 1,350 | 1,359 | 1,385 | 1,409 | 1,428 | |||||||||||||||
| Total gross square feet at end of period | 728 | 613 | 499 | 399 | 296 | |||||||||||||||
| (1) | Please see Note 2 to our consolidated financial statements included elsewhere in this Annual Report on Form 10-K for an explanation of per share calculations. |
| (2) | A boutique is included in comparable sales on the first day of the fifteenth full month following the boutique’s opening. When a boutique that is included in comparable sales is relocated, we continue to consider sales from that boutique to be comparable sales. If a boutique is closed for thirty days or longer for a remodel or as a result of weather damage, fire or the like, we no longer consider sales from that boutique to be comparable sales. Beginning in the first quarter of fiscal year 2013, comparable sales results include our direct-to-consumer sales. To facilitate comparability with the prior year period, prior year comparable sales change was recalculated and now includes direct-to-consumer sales results. |
| (3) | Fiscal year 2012 was a 53-week year. In calculating comparable sales change for fiscal year 2013, comparable sales for the period February 3, 2013 through February 1, 2014 were compared against comparable sales for the period February 5, 2012 through February 2, 2013. In calculating comparable sales change for fiscal year 2012, comparable sales in the 53rd week of fiscal year 2012 were excluded. |
| (4) | Net sales per average square foot for the period is calculated by dividing net sales for the period by the average square feet during the period. Because of our rapid growth, for purposes of providing a net sales per square foot measure, we use average square feet during the period as opposed to total gross square feet at the end of the period. Average square feet is calculated as (a) the sum of total gross square feet at the beginning of the period and total gross square feet at the end of each fiscal quarter within the period, divided by (b) the number of fiscal quarters within the period plus one (which, for a fiscal year, is five). There may be variations in the way in which some of our competitors and other retailers calculate sales per square foot or similarly titled measures. As a result, average total square feet and net sales per average square foot for the period may not be comparable to similar data made available by other retailers. |
| (5) | Average square feet per boutique is calculated by dividing total gross square feet at the end of the period by the number of boutiques open at the end of the period. |
| 27 |
ITEM 7. MANAGEMENT’S DISCUSSION AND ANALYSIS OF FINANCIAL CONDITION AND RESULTS OF OPERATIONS
You should read the following discussion and analysis of our financial condition and results of operations together with “Selected Consolidated Financial and Operating Data” and our consolidated financial statements and the related notes and other financial information and operating data, which are included elsewhere in this Annual Report on Form 10-K. Some of the information contained in this discussion and analysis, including information with respect to our plans and strategy for our business, includes forward-looking statements that involve risks and uncertainties. You should review the “Risk Factors” and “Special Note Regarding Forward-Looking Statements” sections of this Annual Report on Form 10-K for a discussion of important factors that could cause actual results to differ materially from the results described in or implied by the forward-looking statements contained in the following discussion and analysis.
We operate on a fiscal calendar which, in a given fiscal year, consists of a 52- or 53-week period ending on the Saturday closest to January 31st. The reporting periods contained in our audited consolidated financial statements included in this report contain 52 weeks of operations in fiscal year 2014, which ended on January 31, 2015, 52 weeks of operations in fiscal year 2013, which ended on February 1, 2014, and 53 weeks of operation in fiscal year 2012, which ended on February 2, 2013. Our fiscal years 2011 and 2010 each included 52 weeks of operations, which ended on January 28, 2012 and January 29, 2011, respectively. Historical results are not necessarily indicative of the results to be expected for any future period.
Overview
Our company was founded in 1999. We believe francesca’s® is currently one of the fastest growing specialty retailers in the United States. Our growth and operating results reflect the initiatives taken by our management team which include accelerating the rate of new boutique openings and further investing in our distribution capability and in our internet site and direct-to-consumer capability, as well as the acceptance of our brand and merchandise as we have expanded into additional regions of the United States. We also continue to strengthen our capital and liquidity positions by generating positive cash flows from operations and maintaining appropriate debt levels.
In assessing the performance of our business, we consider a variety of performance and financial measures. The key measures for determining how our business is performing are net sales, comparable sales, cost of goods sold and occupancy costs, selling, general and administrative expenses and income from operations. A summary of our financial results are as follows.
| · | Between fiscal year 2012 and 2014 our net sales increased from $296.4 million to $377.5 million, representing a compound annual growth rate of approximately 13%. |
| · | Our comparable sales (see footnotes 2 and 3 to the table under “Selected Financial Data” in Item 6 of this Annual Report) decreased by 5% and 2% in fiscal years 2014 and 2013, respectively, after a 16% increase in fiscal year 2012. |
| · | Between fiscal year 2012 and 2014 our direct-to-consumer sales increased from $4.6 million to $14.4 million, representing a compound annual growth rate of approximately 77%. |
| · | Our income from operations was $52.8 million, $74.3 million and $77.9 million in fiscal years 2014, 2013 and 2012, respectively. |
| · | Between the end of fiscal year 2012 and 2014 our boutique count increased from 360 to 539. |
Since the beginning of fiscal year 2014, we have increased our boutique base from 451 boutiques to 539 boutiques as of January 31, 2015. We expect to continue our strong growth in the future. We believe there is a significant opportunity to grow our boutique base to approximately 900 boutiques over the next five to six years. We plan to open approximately 85 new boutiques in fiscal year 2015.
We continue to invest capital to build the corporate and distribution infrastructure necessary to support our growth. We also continue to invest in our systems infrastructure, including implementation of a fully integrated enterprise software platform and enhancements to our direct-to-consumer website and other software applications. We will remain diligent in our efforts to continuously improve the functionality and performance of our existing enterprise applications and infrastructure to support the Company’s continued growth.
| 28 |
Results of Operations
Fiscal Year 2014 Compared to Fiscal Year 2013
| Fiscal Year Ended | ||||||||||||||||||||||||||||
| January 31, 2015 | February 1, 2014 | Variance | ||||||||||||||||||||||||||
| In Dollars | As
a % of Net Sales(1) | In Dollars | As
a % of Net Sales(1) | In Dollars | % | Basis Points(1) | ||||||||||||||||||||||
| (in thousands, except percentages) | ||||||||||||||||||||||||||||
| Net sales | $ | 377,497 | 100.0 | % | $ | 340,325 | 100.0 | % | $ | 37,172 | 11 | % | - | |||||||||||||||
| Cost of goods sold and occupancy costs | 199,919 | 53.0 | % | 164,260 | 48.3 | % | 35,659 | 22 | % | 470 | ||||||||||||||||||
| Gross profit | 177,578 | 47.0 | % | 176,065 | 51.7 | % | 1,513 | 1 | % | (470 | ) | |||||||||||||||||
| Selling, general and administrative expenses | 124,804 | 33.1 | % | 101,795 | 29.9 | % | 23,009 | 23 | % | 320 | ||||||||||||||||||
| Income from operations | 52,774 | 14.0 | % | 74,270 | 21.8 | % | (21,496 | ) | (29 | )% | (780 | ) | ||||||||||||||||
| Interest expense | (623 | ) | (0.2 | )% | (588 | ) | (0.2 | )% | (35 | ) | 6 | % | - | |||||||||||||||
| Other expense | 88 | 0.0 | % | 208 | 0.1 | % | (120 | ) | (58 | )% | (10 | ) | ||||||||||||||||
| Income before income tax expense | 52,239 | 13.8 | % | 73,890 | 21.7 | % | (21,651 | ) | (29 | )% | (790 | ) | ||||||||||||||||
| Income tax expense | 20,131 | 5.3 | % | 29,051 | 8.5 | % | (8,920 | ) | (31 | )% | (320 | ) | ||||||||||||||||
| Net income | $ | 32,108 | 8.5 | % | $ | 44,839 | 13.2 | % | $ | (12,731 | ) | (28 | )% | (470 | ) | |||||||||||||
(1) Percentage totals or differences in the above table may not equal the sum or difference of the components due to rounding.
Net Sales
Net sales increased 11%, or $37.2 million, to $377.5 million in fiscal year 2014 compared to $340.3 million in fiscal year 2013. This increase is attributable to the increase in non-comparable sales driven by 88 new boutiques opened in fiscal year 2014. This change was partially offset by a 5% decrease in comparable sales driven by a 4% decrease in comparable transactions. Our direct-to-consumer sales increased 64%, or $5.7 million, to $14.4 million in fiscal year 2014 from $8.8 million in fiscal year 2013 primarily due to increased website traffic. There were 446 comparable boutiques and 93 non-comparable boutiques open at January 31, 2015 compared to 359 and 92, respectively, at February 1, 2014.
Cost of Goods Sold and Occupancy Costs
Cost of goods sold and occupancy costs increased 22 %, or $35.7 million, to $199.9 million in fiscal year 2014 compared to $164.3 million in fiscal year 2013. Cost of merchandise and freight expenses increased by $25.0 million due to increased sales volume as well as the disposal of certain slow-moving inventory in the second and fourth quarters of fiscal year 2014. Occupancy costs increased by $10.7 million principally due to the increase in the number of boutiques in operation during fiscal year 2014 as compared to fiscal year 2013.
As a percentage of net sales, cost of goods sold and occupancy costs increased to 53.0% in fiscal year 2014 from 48.3% in fiscal year 2013, an unfavorable variance of 470 basis points. This unfavorable variance was due to 330 basis points of lower merchandise margin and 140 basis points from deleveraging of occupancy costs. The decrease in merchandise margin was driven by the disposal of certain slow moving inventory in the second and fourth quarters of fiscal year 2014 at a cost of $3.0 million and $1.8 million, respectively, as well as increased markdowns and promotions and a merchandise mix change to the lower margin categories.
Selling, General and Administrative Expenses
Selling, general and administrative expenses increased 23%, or $23.0 million, to $124.8 million in fiscal year 2014 compared to $101.8 million in fiscal year 2013 due to higher boutique and corporate payroll associated with the expansion of the our field leadership structure and those needed to support the increasing boutique base and our sales growth. Additionally, in the fourth quarter of fiscal year 2014, we incurred approximately $2.2 million of expenses related to the transition to a new Chief Executive Officer (“CEO”). In fiscal year 2014, we also recognized a non-cash impairment charge of $2.5 million in connection with the abandonment of previously capitalized expenses related to the development of our e-commerce website. As a percentage of net sales, selling, general and administrative expenses increased to 33.1% in fiscal year 2014 from 29.9% in fiscal year 2013 due to deleveraging of expenses resulting from lower sales growth as well as the CEO transition costs and impairment charge previously discussed.
Income Tax Expense
Income tax expense decreased to $20.1 million in fiscal year 2014 compared to $29.1 million in fiscal year 2013 due to a decrease in taxable income. Our effective tax rate was 38.5% and 39.3% in fiscal years 2014 and 2013, respectively.
| 29 |
Fiscal Year 2013 Compared to Fiscal Year 2012
| Fiscal Year Ended | ||||||||||||||||||||||||||||
| February 1, 2014 | February 2, 2013 | Variance | ||||||||||||||||||||||||||
| As a % | As a % | |||||||||||||||||||||||||||
| In | of Net | In | of Net | Basis | ||||||||||||||||||||||||
| Dollars | Sales (1) | Dollars | Sales (1) | In Dollars | % | Points(1) | ||||||||||||||||||||||
| (in thousands, except percentages) | ||||||||||||||||||||||||||||
| Net sales | $ | 340,325 | 100.0 | % | $ | 296,373 | 100.0 | % | $ | 43,952 | 15 | % | 0 | |||||||||||||||
| Cost of goods sold and occupancy costs | 164,260 | 48.3 | % | 137,873 | 46.5 | % | 26,387 | 19 | % | 170 | ||||||||||||||||||
| Gross profit | 176,065 | 51.7 | % | 158,500 | 53.5 | % | 17,565 | 11 | % | (170 | ) | |||||||||||||||||
| Selling, general and administrative expenses | 101,795 | 29.9 | % | 80,560 | 27.2 | % | 21,235 | 26 | % | 270 | ||||||||||||||||||
| Income from operations | 74,270 | 21.8 | % | 77,940 | 26.3 | % | (3,670 | ) | (5 | )% | (450 | ) | ||||||||||||||||
| Interest income (expense) | (588 | ) | (0.2 | )% | (672 | ) | (0.2 | )% | 84 | (13 | )% | 10 | ||||||||||||||||
| Other income (expense) | 208 | 0.1 | % | 230 | 0.1 | % | (22 | ) | (10 | )% | 0 | |||||||||||||||||
| Income before income tax expense | 73,890 | 21.7 | % | 77,498 | 26.1 | % | (3,608 | ) | (5 | )% | (440 | ) | ||||||||||||||||
| Income tax expense | 29,051 | 8.5 | % | 30,437 | 10.3 | % | (1,386 | ) | (5 | )% | (170 | ) | ||||||||||||||||
| Net income | $ | 44,839 | 13.2 | % | $ | 47,061 | 15.9 | % | $ | (2,222 | ) | (5 | )% | (270 | ) | |||||||||||||
| (1) | Percentage totals or differences in the above table may not equal the sum or difference of the components due to rounding. |
Net Sales
Net sales increased 15%, or $44.0 million, to $340.3 million in fiscal year 2013 compared to $296.4 million in fiscal year 2012. This increase is attributable to the increase in non-comparable sales driven by 91 new boutiques opened in fiscal year 2013. This change was partially offset by a 2% decrease in comparable sales due to lower comparable boutique transactions. Our direct-to-consumer sales increased 92%, or $4.2 million, to $8.8 million in fiscal year 2013 from $4.6 million in fiscal year 2012 primarily due to increased website traffic. There were 359 comparable boutiques and 92 non-comparable boutiques open at February 1, 2014 compared to 283 and 77, respectively, at February 2, 2013.
Cost of Goods Sold and Occupancy Costs
Cost of goods sold and occupancy costs increased 19%, or $26.4 million, to $164.3 million in fiscal year 2013 compared to $137.9 million in fiscal year 2012. Cost of merchandise and freight expenses increased by $16.9 million primarily driven by the increased sales volume. Occupancy costs increased by $9.5 million principally due to the increase in the number of boutiques in operation during fiscal year 2013 as compared to fiscal year 2012. As a percentage of net sales, cost of goods sold and occupancy costs increased to 48.3% in fiscal year 2013 from 46.5% in fiscal year 2012. This unfavorable variance was due to 100 basis points of deleveraging of fixed occupancy costs as well as 70 basis points of lower merchandise margins. The decrease in merchandise margin was due to increased level of markdowns and promotions offered in a more competitive retail environment.
Selling, General and Administrative Expenses
Selling, general and administrative expenses increased 26%, or $21.2 million, to $101.8 million in fiscal year 2013 compared to $80.6 million in fiscal year 2012. This increase was primarily due to higher boutique and corporate payroll associated with the expansion of our field leadership structure and those needed to support the increasing boutique base and sales growth. As a percentage of net sales, selling, general and administrative expenses increased to 29.9% in fiscal year 2013 from 27.2% in fiscal year 2012 due to the increased boutique and corporate payroll as well as deleveraging of fixed expenses.
Income Tax Expense
Income tax expense decreased to $29.1 million in fiscal year 2013 compared to $30.4 million in fiscal year 2012 due to a decrease in taxable income. Our effective tax rate was 39.3% in each of the fiscal years 2013 and 2012.
| 30 |
Sales by Merchandise Category
The following table presents merchandise by category, in dollars and as a percentage of total sales, for the periods indicated.
| Fiscal Year Ended | ||||||||||||||||||||||||
| January 31, 2015 | February 1, 2014 | February 2, 2013 | ||||||||||||||||||||||
| As a % | As a % | As a % | ||||||||||||||||||||||
| In | of Net | In | of Net | In | of Net | |||||||||||||||||||
| Dollars | Sales | Dollars | Sales | Dollars | Sales | |||||||||||||||||||
| (in thousands, except percentages) | ||||||||||||||||||||||||
| Apparel | $ | 180,736 | 48.0 | % | $ | 163,946 | 48.3 | % | $ | 145,935 | 49.2 | % | ||||||||||||
| Jewelry | 81,751 | 21.7 | % | 81,186 | 23.9 | % | 68,039 | 23.0 | % | |||||||||||||||
| Accessories | 65,270 | 17.3 | % | 56,516 | 16.6 | % | 45,825 | 15.5 | % | |||||||||||||||
| Gifts | 48,981 | 13.0 | % | 37,875 | 11.2 | % | 36,602 | 12.3 | % | |||||||||||||||
| Merchandise sales (1) | 376,738 | 100.0 | % | 339,523 | 100.0 | % | 296,401 | 100.0 | % | |||||||||||||||
| (1) | Excludes gift card breakage income, shipping and change in return reserve. |
Seasonality
Our business is mildly seasonal in nature and demand is generally the highest in the fourth fiscal quarter due to the year-end holiday season and lowest in the first fiscal quarter. In addition, to prepare for these periods, we must order and keep in stock more merchandise than we carry during other parts of the year. We expect inventory levels, along with an increase in accounts payable and accrued expenses, generally to reach their highest levels in the fourth fiscal quarter in anticipation of the increased net sales during this period. As a result of this seasonality and generally because of variation in consumer spending habits, we experience fluctuations in net sales and working capital requirements during the year.
Liquidity and Capital Resources
Our primary sources of liquidity are cash flows from operations and borrowings under our revolving credit facility. Our primary cash needs are for capital expenditures in connection with opening new boutiques and remodeling existing boutiques, investing in improved technology and distribution facility enhancements, funding normal working capital requirements and payments of interest and principal, if any, under our revolving credit facility. We may use cash or our revolving credit facility to issue letters of credit to support merchandise imports or for other corporate purposes. The most significant components of our working capital are cash and cash equivalents, merchandise inventories, accounts payable and other current liabilities. Our working capital position benefits from the fact that we generally collect cash from sales to customers the day of or, in the case of credit or debit card transactions, within several days of the related sales and we typically have up to 30 days to pay our vendors.
We were in compliance with all covenants under our revolving credit facility as of January 31, 2015. At January 31, 2015, we had $39.1 million of cash and cash equivalents and $75.0 million in borrowing availability under our revolving credit facility. There were no letters of credit outstanding at January 31, 2015.
We expect that our cash flow from operations along with borrowings under our revolving credit facility and tenant allowances for new boutiques will be sufficient to fund capital expenditures, our working capital requirements and our principal and interest requirements under our revolving credit facility for at least the next twelve months.
Cash Flow
A summary of our operating, investing and financing activities are shown in the following table.
| Fiscal Year Ended | ||||||||||||
| January 31, | February 1, | February 2, | ||||||||||
| 2015 | 2014 | 2013 | ||||||||||
| (in thousands) | ||||||||||||
| Provided by operating activities | $ | 54,444 | $ | 49,278 | $ | 56,999 | ||||||
| Used in investing activities | (24,242 | ) | (24,535 | ) | (23,663 | ) | ||||||
| Used in financing activities | (28,629 | ) | (17,122 | ) | (17,505 | ) | ||||||
| Net increase in cash and cash equivalents | $ | 1,573 | $ | 7,621 | $ | 15,831 | ||||||
| 31 |
Operating Activities
Net cash provided by operating activities consist primarily of net income adjusted for non-cash items (including depreciation and amortization and deferred taxes), the effect of working capital changes and tenant allowances received from landlords.
Cash provided by operating activities increased $5.2 million in fiscal year 2014 as compared to fiscal year 2013 primarily due to increases in non-cash items (including the impairment charge, inventory write-off and depreciation) and gift card liability as well as decreases in inventory and prepaid and other assets. These changes were partially offset by the decrease in net income. Our merchandise inventory decreased primarily due to improved inventory management, which included the disposal of certain slow-moving inventory, while the decrease in prepaid and other assets was due to lower prepaid marketing and on-hand boutique supplies.
Cash provided by operating activities decreased $7.7 million in fiscal year 2013 as compared to fiscal year 2012 primarily due to lower net income and tenant allowances received as well as increases in income taxes receivable and inventories. Inventories increased due the increase in number of boutique in operations in fiscal year 2013 as compared to the prior year period and carryover clearance inventory from the fourth quarter. This change was partially offset by an increase in non-cash items, primarily depreciation, as well as increases in gift card liability and accounts payable due to the increase in the number of boutiques in operation in fiscal year 2013 as compared to fiscal year 2012. Additionally, accounts payable increased in connection with build-outs for boutiques that will open in fiscal year 2014.
Investing Activities
Net cash used in investing activities consist primarily of capital expenditures for new boutiques, improvements to existing boutiques, as well as investment in information technology and our distribution facility.
| Fiscal Year Ended | ||||||||||||
| January 31, | February 1, | February 2, | ||||||||||
| 2015 | 2014 | 2013 | ||||||||||
| (in thousands) | ||||||||||||
| Capital expenditures for: | ||||||||||||
| New boutiques | $ | 18,668 | $ | 17,453 | $ | 15,692 | ||||||
| Existing boutiques | 3,997 | 2,407 | 1,263 | |||||||||
| Technology | 1,143 | 3,563 | 1,838 | |||||||||
| Corporate and distribution | 447 | 1,210 | 4,870 | |||||||||
| $ | 24,255 | $ | 24,633 | $ | 23,663 | |||||||
Our total capital expenditures for fiscal years 2014, 2013 and 2012 were $24.3 million, $24.6 million and $23.7 million, respectively, with new boutiques accounting for most of our spending at $18.7 million, $17.5 million and $15.7 million over the same period, respectively. Spending for new boutiques included amounts associated with boutiques that will open in the subsequent fiscal year. We opened 88 boutiques in fiscal year 2014, 91 boutiques in fiscal year 2013 and 77 boutiques in fiscal year 2012. The average cost of the leasehold improvements, furniture and fixtures, excluding tenant allowances, for new boutiques opened in fiscal year 2014, 2013 and 2012 were $200,000, $175,000 and $186,000, respectively. We expect that the costs of opening new boutiques to increase in future years. However, we expect that any such increase will not be material and should not adversely impact our expansion plans or our payback period. The average tenant allowance per new boutique were $87,000, $68,000 and $92,000 in fiscal years 2014, 2013 and 2012, respectively, while total cash inflows from tenant allowances totaled $7.4 million, $6.0 million and $7.5 million over the same period, respectively. The decrease in average tenant allowance in fiscal year 2013 was principally due to opening more boutiques in non-mall locations as compared to the other years. Tenant allowances are amortized as a reduction in rent expense over the term of the lease. The average collection period for these allowances is approximately six months after boutique opening. As a result, we fund the cost of new boutiques with cash flow from operations, tenant allowances from our landlords, or borrowings under our revolving credit facility. We also spent $4.0 million, $2.4 million and $1.3 million over the same periods, respectively, in connection with existing boutiques. The majority of these amounts were spent on remodeling or relocating 53 boutiques in fiscal years 2014, 27 boutiques in fiscal year 2013 and 17 boutiques in fiscal year 2012. The remaining capital expenditures in each of the fiscal years 2014, 2013 and 2012 were primarily used for investments in information technology (including enhancements to our direct-to consumer website and implementation of an enterprise planning software in fiscal year 2013), our corporate offices (including our new corporate office build out in fiscal year 2012) and for distribution facility enhancements.
Management anticipates that capital expenditures in fiscal year 2015 will be approximately $30.0 million to $32.0 million. The majority of this amount will be spent on investments in new and existing boutiques.
Financing Activities
Net cash used in financing activities consist principally of borrowings and payments under our revolving credit facilities as well as proceeds from the exercise of stock options and the related tax consequence.
| 32 |
Net cash used in financing activities in fiscal year 2014 was $28.6 million. This consisted of cash outflows for the repayment of amounts outstanding under our revolving credit facility amounting to $25.0 million and repurchases of our common stock amounting to $5.3 million. These cash outflows were partially offset by $1.6 million proceeds from stock option exercises and the related tax consequence. Net cash used in financing activities in fiscal year 2013 was $17.1 million. This consisted of cash outflows for repurchases of our common stock amounting to $54.0 million and $0.4 million payment of debt issuance costs partially offset by $25.0 million proceeds from borrowings under our revolving credit facility and $12.3 million proceeds from the exercise of stock options and the related tax consequence. Net cash used in financing activities in fiscal year 2012 of $17.5 million consisted of a $22.0 million repayment of borrowings under our revolving credit facility partially offset by $4.5 million of proceeds from stock option exercises and the related tax benefit.
Revolving Credit Facility
On August 30, 2013, Francesca’s Collections, Inc. (“Francesca’s Collections”), as borrower, and its parent company, Francesca’s LLC (the “Parent”), a wholly-owned subsidiary of Francesca’s Holdings Corporation, entered into a Second Amended and Restated Credit Agreement (“Second Amended and Restated Credit Agreement”) with Royal Bank of Canada, as Administrative Agent and Collateral Agent, and the lenders party thereto, which amends and restates the existing Amended and Restated Credit Agreement, dated as of July 27, 2011, by and among Francesca’s Collections, the Parent, Royal Bank of Canada, as Administrative Agent and Collateral Agent, and the lenders party thereto, as amended by Amendment No. 1 to the Amended and Restated Credit Agreement, dated February 7, 2013.
The Second Amended and Restated Credit Agreement provides an aggregate amount of $75.0 million in credit facility (including up to $10.0 million for letters of credit) and matures on August 30, 2018. The Second Amended and Restated Credit Agreement also contains an increase option permitting Francesca’s Collections, subject to certain requirements, to arrange with the lenders for additional incremental commitments up to an aggregate of $25.0 million, subject to reductions in the event Francesca’s Collections has certain indebtedness outstanding. At January 31, 2015, there was no amount outstanding under the Second Amended and Restated Credit Agreement.
All obligations under the Second Amended and Restated Credit Agreement are unconditionally guaranteed by, subject to certain exceptions, the Parent and each of Francesca’s Collections’ existing and future direct and indirect wholly-owned domestic subsidiaries. There are currently no subsidiary guarantors for the Second Amended and Restated Credit Agreement because Francesca’s Collections does not currently have any subsidiaries. All obligations under the Second Amended and Restated Credit Agreement, and the guarantees of those obligations (as well as cash management obligations and any interest rate hedging or other swap agreements), are secured by substantially all of Francesca’s Collections’ assets as well as the assets of any subsidiary guarantor.
The borrowings under the Second Amended and Restated Credit Agreement bear interest at a rate equal to an applicable margin plus, at the option of Francesca’s Collections, either (a) in the case of base rate borrowings, a rate equal to the highest of (1) the prime rate of Royal Bank of Canada, (2) the federal funds rate plus 1/2 of 1%, and (3) the LIBOR for an interest period of one month plus 1.00%, or (b) in the case of LIBOR borrowings, a rate equal to the LIBOR for the interest period relevant to such borrowing. The applicable margin for borrowings under the Second Amended and Restated Credit Agreement ranges from 0.75% to 1.25% with respect to base rate borrowings and from 1.75% to 2.25% with respect to LIBOR borrowings, in each case based upon the achievement of specified levels of a ratio of consolidated total debt to consolidated EBITDA. In addition, the Borrower is required to pay a commitment fee on the unused portion of the revolver at a rate ranging from 0.25% to 0.38%. During fiscal year 2014, amounts outstanding under the Second Amended and Restated Credit Agreement accrued interest at an average rate of 2.1%.
The Second Amended and Restated Credit Agreement contains customary affirmative and negative covenants, including limitations on the ability of Francesca’s Collections and its subsidiaries to (i) incur additional debt; (ii) create liens; (iii) make certain investments, acquisitions, loans and advances; (iv) sell assets; (v) pay dividends or make distributions or make other restricted payments; (vi) prepay other indebtedness; (vii) engage in mergers or consolidations; (viii) change the business conducted by Francesca’s Collections and its subsidiaries; (ix) engage in certain transactions with affiliates; (x) enter into agreements that restrict dividends from subsidiaries; and (xi) amend certain charter documents and material agreements governing subordinated and junior indebtedness. However, Francesca’s Collections is permitted to pay dividends to the extent it has available capacity in its available investment basket (as defined in the Second Amended and Restated Credit Agreement), no default or event of default is continuing, certain procedural requirements have been satisfied and Francesca’s Collections is in pro forma compliance with a maximum secured leverage ratio. At January 31, 2015, Francesca’s Collections would have met the conditions for paying dividends out of the available investment basket, including compliance with the required total secured leverage ratio.
In addition, the Second Amended and Restated Credit Agreement requires Francesca’s Collections to comply with the following financial covenants:
| · | A maximum ratio of (i) lease-adjusted consolidated total debt (as defined in the Second Amended and Restated Credit Agreement) to (ii) consolidated EBITDAR of 4.25 to 1.00. |
| 33 |
| · | Maximum capital expenditures of $30.0 million per fiscal year, with any unused portion allowed to be carried over to the next two fiscal years subject to a 50.0% cap. |
As of January 31, 2015, Francesca’s Collections was in compliance with all covenants under the Second Amended and Restated Credit Agreement.
The Second Amended and Restated Credit Agreement also contains customary events of default, including: (i) failure to pay principal, interest, fees or other amounts under the Second Amended and Restated Credit Agreement when due taking into account any applicable grace period; (ii) any representation or warranty proving to have been incorrect in any material respect when made; (iii) a cross default with respect to other material indebtedness; (iv) bankruptcy and insolvency events; (v) unsatisfied material final judgments; (vi) a “change of control”; (vii) certain defaults under the Employee Retirement Income Security Act of 1974; (viii) the invalidity or impairment of any loan document or any security interest; and (ix) the subordination provisions of any material subordinated debt or junior debt shall cease to be in full force.
Share Repurchase Program
For information regarding our share repurchase program, please refer to Note 6 to our audited consolidated financial statements included in “Financial Statements and Supplementary Data” in Item 8 of this Annual Report, which is incorporated herein by reference.
Critical Accounting Policies
Management’s discussion and analysis of financial condition and results of operations is based upon our consolidated financial statements which have been prepared in accordance with accounting principles generally accepted in the United States. The preparation of these financial statements requires estimates and judgments that affect the reported amounts of our assets, liabilities, net sales and expenses, and disclosure of contingent assets and liabilities. Management bases estimates on historical experience and other assumptions it believes to be reasonable given the circumstances and evaluates these estimates on an ongoing basis. Actual results may differ from these estimates under different assumptions or conditions.
We believe that the following critical accounting policies involve a higher degree of judgment and complexity. See Note 1 to our audited consolidated financial statements which are included elsewhere in this Annual Report on Form 10-K for a complete discussion of our significant accounting policies. The following reflect the significant estimates and judgments used in the preparation of our consolidated financial statements.
Revenue Recognition
We recognize revenue upon purchase of merchandise by customers, net of estimated merchandise returns and discounts and sales taxes collected. Revenue is recognized, for boutique sales, at the point at which the customer receives and pays for the merchandise at the register. For direct-to-consumer sales, revenue is recognized upon delivery and includes shipping charges. Management estimates future returns on previously sold merchandise based on return history and current sales levels. The estimated sales returns are periodically compared to actual sales returns and adjusted, if appropriate. We do not believe that there is a reasonable likelihood that there will be material changes in future estimates or assumptions we use to calculate our merchandise return reserve. However, if the actual rate of merchandise returns increases significantly, our operating results may be adversely affected.
Gift Cards and Gift Card Breakage
We account for the sale of gift cards as a liability at the time a gift card is sold. The liability is relieved and revenue is recognized upon redemption of the gift card. The gift cards we issue are owned by an unrelated third party. Our gift cards do not have an expiration date. We recognize income from the breakage of gift cards when the likelihood of redemption of the gift card is deemed to be remote based on historical redemption patterns. We recognized $0.1 million, $0.4 million and $0 of gift card breakage income in fiscal years 2014, 2013 and 2012, respectively. The gift card breakage income is included in net sales.
Inventory Valuation
We value merchandise inventory at the lower of cost or market on a weighted average cost basis. Inventory costs include cost of merchandise and freight costs. We record merchandise receipts at the time they are delivered to our distribution center or to our boutiques directly from vendors.
We review our inventory levels to identify slow-moving merchandise and generally use promotional markdowns to clear slow-moving merchandise. Each period we evaluate recent selling trends and the related promotional events or pricing strategies in place to sell through the current inventory levels. Promotional markdowns or additions to the lower of cost or market (“LCM”) reserve may occur when inventory exceeds customer demand for reasons of style, seasonal adaptation, changes in customer preference, lack of consumer acceptance of fashion items, competition or if it is determined that the inventory in stock will not sell at its currently ticketed price. Such markdowns may have an adverse impact on earnings, depending on the extent and amount of inventory affected. In addition, the anticipated deployment of new merchandise are reflected within the estimated future promotional markdown plan as such new inventory, in certain circumstances, will displace merchandise currently on-hand. To accelerate the flow of new merchandise into our boutiques, we disposed of certain slow-moving merchandise in the second and fourth quarters of fiscal year 2014 at a cost of $3.0 million and $1.8 million, respectively. We believed that regular markdowns were insufficient to clear such slow-moving merchandise at a pace suitable for our merchandising strategy.
| 34 |
We also estimate an inventory shrinkage reserve for the period of time between the last physical inventory count and the balance sheet date. The estimate for shrinkage reserve can be affected by changes in merchandise mix and changes in actual shrinkage trends.
Additions to the LCM and shrinkage reserves are included in cost of goods sold and occupancy costs in the consolidated statements of operations.
If there are material changes in the estimates or assumptions we use to calculate our LCM or shrinkage reserves, our operating results could be affected.
Impairment of Long-lived Assets
We evaluate long-lived assets held for use and held for sale whenever events or changes in circumstances indicate that the carrying amount of those assets may not be recoverable. Assets are grouped and evaluated for impairment at the lowest level for which there are identifiable cash flows, which is generally at a boutique level. Long-lived assets are reviewed for impairment using factors including, but not limited to, our current and future operating plans and projected cash flows. The determination of whether impairment has occurred is based on an estimate of undiscounted future cash flows directly related to that asset compared to its carrying value. If the carrying value of the asset is greater than the sum of the undiscounted future cash flows, an impairment loss is recognized for the difference between the carrying value of the asset and its estimated fair value; provided, however, that no other facts or circumstances indicate that recognition of such loss is premature. Fair value is determined using Level 3 inputs based on discounted future cash flows associated with the asset using a discount rate commensurate with the risk.
In addition, at the time a decision is made to close a boutique, we accelerate depreciation over the revised useful life of the asset.
In fiscal year 2014, we recognized a non-cash impairment charge of $2.5 million in connection with the abandonment of previously capitalized expenditures related to the development of the Company’s e-commerce website. No impairment was recognized in fiscal years 2013 and 2012. The impairment charge is included in selling, general and administrative expenses.
Income Taxes
We account for income taxes using the liability method. Under this method, the amount of taxes currently payable or refundable is accrued, and deferred tax assets and liabilities are recognized for the estimated future tax consequences of temporary differences that currently exist between the tax basis and the financial reporting basis of the company’s assets and liabilities. Valuation allowances are established against deferred tax assets when it is more-likely-than-not that the realization of those deferred tax assets will not occur.
Deferred tax assets and liabilities are measured using the enacted tax rates in effect in the years when those temporary differences are expected to reverse. The effect on deferred taxes from a change in tax rate is recognized through continuing operations in the period that includes the enactment date of the change. Changes in tax laws and rates could affect recorded deferred tax assets and liabilities in the future.
A tax benefit from an uncertain tax position may be recognized when it is more-likely-than-not that the position will be sustained upon examination, including resolutions of any related appeals or litigation processes, based on the technical merits. Income tax positions must meet a more-likely-than-not recognition threshold to be recognized.
We recognize tax liabilities for uncertain tax positions and adjust these liabilities when the company’s judgment changes as a result of the evaluation of new information not previously available. Interest and penalties related to unrecognized tax benefits are recognized in income tax expense. There were no uncertain tax positions requiring accrual at January 31, 2015 and February 1, 2014.
Stock-based Compensation
Stock-based compensation is measured based on the grant date fair value and is recognized as expense over the requisite service period (which generally is the vesting period of the award) for awards that are expected to vest. We recognized stock-based compensation amounting to $2.7 million, $3.8 million and $3.6 million in fiscal years 2014, 2013 and 2012, respectively.
We generally use the Black-Scholes option pricing model to determine the fair value of stock options, except for stock options subject to market conditions for which we use a Monte-Carlo simulation model. The determination of fair value using each of the models considers the following assumptions.
| 35 |
| · | Expected volatility. Due to lack of trading history of our common stock, we estimate expected volatility using historical and implied volatilities of similar entities whose shares prices are publicly available, including Company specific data in fiscal year 2014. Beginning in fiscal year 2015, we expect to estimate volatility using the historical volatility of our own common stock. We do not expect significant change in expected volatility as a result. |
| · | Expected term. The expected term represents the period of time options are expected to be outstanding. Due to lack of sufficient historical data, we use the “simplified method” as allowed by SEC Staff Accounting Bulletin Topic 14D2 to estimate the expected term. The simplified method defines expected term as the midpoint between the vesting date and the contractual term of the stock option. |
| · | Risk-free interest rate. The risk-free interest rate is based on the rate of treasury instruments whose maturities are similar to those of the expected term of the award being valued. |
| · | Expected dividend yield. The expected dividend yield is based on our expectations of not paying dividends on our common stock for the foreseeable future. |
In fiscal years 2014, 2013 and 2012, the grant date fair value of stock options was estimated using the following assumptions:
| Fiscal Year | ||||||||||||
| 2014 | 2013 | 2012 | ||||||||||
| Expected volatility rate | 57.0%- 60.3 | % | 59.7% - 61.3 | % | 50.3% - 68.2 | % | ||||||
| Expected term (in years) | 6.0 – 7.5 | 6.0 – 6.5 | 6.0 - 6.5 | |||||||||
| Risk-free interest rate | 1.9% - 2.0 | % | 1.0% - 2.0 | % | 0.8% - 1.0 | % | ||||||
| Expected dividend yield | - | - | - | |||||||||
The fair value of restricted stocks awards is determined based on the closing price of our common stock on the award date. For restricted stock awards subject to performance conditions, compensation expense is recognized when it is probable that the specified performance goals will be achieved. We assess the probability of vesting at each reporting period and adjust stock-based compensation based on the results of such assessment.
Changes in these inputs and assumptions can materially affect the measurement of the estimated fair value of our stock-based compensation.
Off Balance Sheet Arrangements
We are not party to any off balance sheet arrangements.
Contractual Obligations
The following table summarizes our contractual obligations as of January 31, 2015 and the effect such obligations are expected to have on our liquidity and cash flows in future periods.
| Payments Due by Period | ||||||||||||||||||||
| Less than | More than | |||||||||||||||||||
| Total | 1 year | 1-3 years | 3-5 years | 5 years | ||||||||||||||||
| (in thousands) | ||||||||||||||||||||
| Long term debt(1) | $ | 680 | $ | 190 | $ | 379 | $ | 111 | $ | - | ||||||||||
| Operating lease obligations(2) | 242,681 | 35,785 | 70,828 | 63,433 | 72,635 | |||||||||||||||
| Merchandise purchase commitments | 37,781 | 37,781 | - | - | - | |||||||||||||||
| Contracts for software application implementation | 1,913 | 1,485 | 428 | - | - | |||||||||||||||
| (1) | This amount represents unused commitment fee. For purposes of this table, we estimated the amount of unused commitment fee using the amount available for borrowing and the average rate at January 31, 2015 of $75.0 million and 0.25%, respectively. |
| (2) | Excludes common area maintenance charges, real estate taxes and certain other expenses which amounted to approximately 41% of minimum lease obligations in fiscal year 2014. |
| 36 |
Impact of Inflation
Our results of operations and financial condition are presented based on historical cost. While it is difficult to accurately measure the impact of inflation due to the imprecise nature of the estimates required, we believe the effects of inflation, if any, on our results of operations and financial condition have been immaterial. We cannot assure you, however, that our results of operations and financial condition will not be materially impacted by inflation in the future.
Recent Accounting Pronouncements
For a description of recent accounting pronouncements, please refer to Note 1 to our audited consolidated financial statements included in “Financial Statements and Supplementary Date” in Item 8 of this Annual Report, which is incorporated herein by reference.
Item 7a. Quantitative and Qualitative Disclosures about Market Risk
Our principal exposure to market risk relates to changes in interest rates. Our revolving credit facility carries floating interest rates that are tied to LIBOR, the federal funds rate and the prime rate, and therefore, our statements of operations and our cash flows could be exposed to changes in interest rates to the extent that we do not use effective hedging arrangements. We historically have not used derivative financial instruments for speculative or trading purposes, however, this does not preclude our adoption of specific hedging strategies in the future. At January 31, 2015, there was no amount outstanding under the Second Amended and Restated Credit Agreement.
| 37 |
ITEM 8. FINANCIAL STATEMENTS AND SUPPLEMENTARY DATA
Report of Independent Registered Public Accounting Firm
The Board of Directors and Shareholders of
Francesca’s Holdings Corporation
We have audited the accompanying consolidated balance sheets of Francesca’s Holdings Corporation (the “Company”) as of January 31, 2015 and February 1, 2014 and the related consolidated statements of operations, changes in stockholders’ equity, and cash flows for each of the three years in the period ended January 31, 2015. These financial statements are the responsibility of the Company’s management. Our responsibility is to express an opinion on these financial statements based on our audits.
We conducted our audits in accordance with the standards of the Public Company Accounting Oversight Board (United States). Those standards require that we plan and perform the audit to obtain reasonable assurance about whether the financial statements are free of material misstatement. An audit includes examining, on a test basis, evidence supporting the amounts and disclosures in the financial statements. An audit also includes assessing the accounting principles used and significant estimates made by management, as well as evaluating the overall financial statement presentation. We believe that our audits provide a reasonable basis for our opinion.
In our opinion, the financial statements referred to above present fairly, in all material respects, the consolidated financial position of Francesca’s Holdings Corporation at January 31, 2015 and February 1, 2014 and the consolidated results of its operations and its cash flows for each of the three years in the period ended January 31, 2015, in conformity with U.S. generally accepted accounting principles.
We also have audited, in accordance with the standards of the Public Company Accounting Oversight Board (United States), Francesca’s Holdings Corporation’s internal control over financial reporting as of January 31, 2015, based on criteria established in Internal Control-Integrated Framework issued by the Committee of Sponsoring Organizations of the Treadway Commission (2013 framework) and our report dated March 27, 2015 expressed an unqualified opinion thereon.
/S/ ERNST & YOUNG LLP
Dallas, Texas
March 27, 2015
| 38 |
Francesca’s Holdings Corporation
Consolidated Balance Sheets
(In thousands, except share data)
| January 31, | February 1, | |||||||
| 2015 | 2014 | |||||||
| ASSETS | ||||||||
| Current assets: | ||||||||
| Cash and cash equivalents | $ | 39,071 | $ | 37,498 | ||||
| Accounts receivable | 12,279 | 8,984 | ||||||
| Inventories | 23,801 | 24,614 | ||||||
| Deferred income taxes | 4,858 | 4,565 | ||||||
| Prepaid expenses and other current assets | 5,890 | 6,764 | ||||||
| Total current assets | 85,899 | 82,425 | ||||||
| Property and equipment, net | 74,095 | 64,131 | ||||||
| Deferred income taxes | 3,642 | 2,335 | ||||||
| Other assets, net | 1,909 | 1,654 | ||||||
| TOTAL ASSETS | $ | 165,545 | $ | 150,545 | ||||
| LIABILITIES AND STOCKHOLDERS’ EQUITY | ||||||||
| Current liabilities: | ||||||||
| Accounts payable | $ | 11,550 | $ | 10,207 | ||||
| Accrued liabilities | 11,904 | 9,823 | ||||||
| Total current liabilities | 23,454 | 20,030 | ||||||
| Landlord incentives and deferred rent | 32,877 | 27,448 | ||||||
| Long-term debt | - | 25,000 | ||||||
| Total liabilities | 56,331 | 72,478 | ||||||
| Commitments and contingencies | ||||||||
| Stockholders’ equity: | ||||||||
| Common stock-$.01 par value, 80.0 million shares authorized, 45.5 million and 45.2 million shares issued as of January 31, 2015 and February 1, 2014, respectively. | 455 | 452 | ||||||
| Additional paid-in capital | 105,498 | 101,192 | ||||||
| Retained earnings | 63,404 | 31,296 | ||||||
| Treasury stock, at cost – 3.2 million and 2.9 million shares held at January 31, 2015 and February 1, 2014, respectively. | (60,143 | ) | (54,873 | ) | ||||
| Total stockholders’ equity | 109,214 | 78,067 | ||||||
| TOTAL LIABILITIES AND STOCKHOLDERS’ EQUITY | $ | 165,545 | $ | 150,545 | ||||
The accompanying notes are an integral part of these Consolidated Financial Statements.
| 39 |
Francesca’s Holdings Corporation
Consolidated Statements of Operations
(In thousands, except per share data)
| Fiscal Year Ended | ||||||||||||
| January 31, | February 1, | February 2, | ||||||||||
| 2015 | 2014 | 2013 | ||||||||||
| Net sales | $ | 377,497 | $ | 340,325 | $ | 296,373 | ||||||
| Cost of goods sold and occupancy costs | 199,919 | 164,260 | 137,873 | |||||||||
| Gross profit | 177,578 | 176,065 | 158,500 | |||||||||
| Selling, general and administrative expenses | 124,804 | 101,795 | 80,560 | |||||||||
| Income from operations | 52,774 | 74,270 | 77,940 | |||||||||
| Interest expense | (623 | ) | (588 | ) | (672 | ) | ||||||
| Other income | 88 | 208 | 230 | |||||||||
| Income before income tax expense | 52,239 | 73,890 | 77,498 | |||||||||
| Income tax expense | 20,131 | 29,051 | 30,437 | |||||||||
| Net income | $ | 32,108 | $ | 44,839 | $ | 47,061 | ||||||
| Basic earnings per common share | $ | 0.76 | $ | 1.03 | $ | 1.08 | ||||||
| Diluted earnings per common share | $ | 0.76 | $ | 1.02 | $ | 1.05 | ||||||
| Weighted average shares outstanding: | ||||||||||||
| Basic shares | 42,259 | 43,372 | 43,744 | |||||||||
| Diluted shares | 42,380 | 44,123 | 44,807 | |||||||||
The accompanying notes are an integral part of these Consolidated Financial Statements.
| 40 |
Francesca’s Holdings Corporation
Consolidated Statements of Changes in Stockholders’ Equity
(In thousands)
| Common Stock | Additional | Retained | Treasury | Total | ||||||||||||||||||||
| Shares | Par | Paid-In | Earnings | Stock, | Stockholders’ | |||||||||||||||||||
| Outstanding | Value | Capital | (Deficit) | at cost | Equity | |||||||||||||||||||
| Balance, January 28, 2012 | 43,538 | $ | 435 | $ | 77,071 | $ | (60,604 | ) | $ | - | $ | 16,902 | ||||||||||||
| Net income | - | - | - | 47,061 | - | 47,061 | ||||||||||||||||||
| Stock-based compensation | - | 3,599 | - | - | 3,599 | |||||||||||||||||||
| Restricted stocks vested | 3 | - | - | - | - | - | ||||||||||||||||||
| Stock options exercised and related tax benefit | 339 | 4 | 4,491 | - | - | 4,495 | ||||||||||||||||||
| Balance, February 2, 2013 | 43,880 | 439 | 85,161 | (13,543 | ) | - | 72,057 | |||||||||||||||||
| Net income | - | - | - | 44,839 | - | 44,839 | ||||||||||||||||||
| Stock-based compensation | - | 3,781 | - | - | 3,781 | |||||||||||||||||||
| Restricted stocks vested | 2 | - | - | - | - | - | ||||||||||||||||||
| Stock options exercised and related tax benefit | 1,361 | 13 | 12,250 | - | - | 12,263 | ||||||||||||||||||
| Repurchases of common stock | (2,894 | ) | - | - | - | (54,873 | ) | (54,873 | ) | |||||||||||||||
| Balance, February 1, 2014 | 42,349 | 452 | 101,192 | 31,296 | (54,873 | ) | 78,067 | |||||||||||||||||
| Net income | - | - | - | 32,108 | - | 32,108 | ||||||||||||||||||
| Stock-based compensation | - | - | 2,668 | - | - | 2,668 | ||||||||||||||||||
| Restricted stocks vested | 2 | - | - | - | - | - | ||||||||||||||||||
| Stock options exercised and related tax benefit | 232 | 3 | 1,638 | - | - | 1,641 | ||||||||||||||||||
| Repurchases of common stock | (285 | ) | - | - | - | (5,270 | ) | (5,270 | ) | |||||||||||||||
| Balance, January 31, 2015 | 42,298 | $ | 455 | $ | 105,498 | $ | 63,404 | $ | (60,143 | ) | $ | 109,214 | ||||||||||||
The accompanying notes are an integral part of these Consolidated Financial Statements.
| 41 |
Francesca’s Holdings Corporation
Consolidated Statements of Cash flows
(In thousands)
| Fiscal Year Ended | ||||||||||||
| January 31, | February 1, | February 2, | ||||||||||
| 2015 | 2014 | 2013 | ||||||||||
| Cash Flows Provided by Operating Activities: | ||||||||||||
| Net income | $ | 32,108 | $ | 44,839 | $ | 47,061 | ||||||
| Adjustments to reconcile net income to net cash provided by operating activities: | ||||||||||||
| Depreciation and amortization | 13,151 | 10,054 | 7,151 | |||||||||
| Stock-based compensation expense | 2,668 | 3,781 | 3,599 | |||||||||
| Excess tax benefit from stock-based compensation | (309 | ) | (5,846 | ) | (2,296 | ) | ||||||
| Impairment charges | 2,470 | - | - | |||||||||
| Loss on disposal of assets | 364 | 343 | 188 | |||||||||
| Inventory write-off | 3,831 | - | - | |||||||||
| Amortization of debt issuance costs | 245 | 278 | 299 | |||||||||
| Deferred income taxes | (1,600 | ) | (1,014 | ) | (2,559 | ) | ||||||
| Changes in assets and liabilities: | ||||||||||||
| Accounts receivables | (2,986 | ) | (634 | ) | (70 | ) | ||||||
| Inventories | (3,018 | ) | (5,565 | ) | (4,587 | ) | ||||||
| Prepaid expenses and other assets | 373 | (2,021 | ) | (1,512 | ) | |||||||
| Accounts payable | (363 | ) | 551 | (547 | ) | |||||||
| Accrued liabilities | 2,081 | (844 | ) | 3,069 | ||||||||
| Landlord incentive and deferred rent | 5,429 | 5,356 | 7,203 | |||||||||
| Net cash provided by operating activities | 54,444 | 49,278 | 56,999 | |||||||||
| Cash Flows Used in Investing Activities: | ||||||||||||
| Purchase of property and equipment | (24,255 | ) | (24,633 | ) | (23,663 | ) | ||||||
| Other | 13 | 98 | - | |||||||||
| Net cash used in investing activities | (24,242 | ) | (24,535 | ) | (23,663 | ) | ||||||
| Cash Flows Used in Financing Activities: | ||||||||||||
| Repayment of borrowings under the revolving credit facility | (25,000 | ) | (22,000 | ) | ||||||||
| Proceeds from borrowings under the revolving credit facility | - | 25,000 | - | |||||||||
| Repurchases of common stock | (5,270 | ) | (54,009 | ) | - | |||||||
| Payment of debt issuance costs | - | (376 | ) | - | ||||||||
| Proceeds from the exercise of stock options | 1,332 | 8,697 | 2,199 | |||||||||
| Taxes paid related to net settlement of equity awards | - | (2,280 | ) | - | ||||||||
| Excess tax benefit from stock-based compensation | 309 | 5,846 | 2,296 | |||||||||
| Net cash used in financing activities | (28,629 | ) | (17,122 | ) | (17,505 | ) | ||||||
| Net increase in cash and cash equivalents | 1,573 | 7,621 | 15,831 | |||||||||
| Cash and cash equivalents, beginning of year | 37,498 | 29,877 | 14,046 | |||||||||
| Cash and cash equivalents, end of year | $ | 39,071 | $ | 37,498 | $ | 29,877 | ||||||
| Supplemental Disclosures of Cash Flow Information: | ||||||||||||
| Cash paid for income taxes | $ | 24,088 | $ | 32,401 | $ | 32,405 | ||||||
| Interest paid | 388 | 293 | 448 | |||||||||
The accompanying notes are an integral part of these Consolidated Financial Statements.
| 42 |
FRANCESCA’S HOLDINGS CORPORATION
NOTES TO CONSOLIDATED FINANCIAL STATEMENTS
1. Summary of Significant Accounting Policies
Nature of Business
Francesca’s Holdings Corporation (the “Company” or “Holdings”) is a holding company incorporated in 2007 under the laws of Delaware. The Company’s business operations are conducted through its subsidiaries. The Company operates a national chain of retail boutiques designed and merchandised to feel like independently owned, upscale boutiques and provide its customers with an inviting, intimate and fun shopping experience. The Company offers a diverse and balanced mix of apparel, jewelry, accessories and gifts at attractive prices. At January 31, 2015, the Company operated 539 boutiques, which are located in 47 states throughout the United States and the District of Columbia, and its direct-to-consumer website.
Fiscal Year
The Company maintains its accounts on a 52- to 53- week year ending on the Saturday closest to January 31. All references herein to fiscal year “2014” represents the 52-week period ended January 31, 2015, fiscal year “2013” represents the 52-week period ended February 1, 2014, and fiscal year “2012” represents the 53-week period ended February 2, 2013.
Principles of Consolidation and Presentation
The accompanying consolidated financial statements include the accounts of the Company and all its subsidiaries. All significant intercompany balances and transactions have been eliminated in consolidation.
Management Estimates and Assumptions
The preparation of financial statements in conformity with accounting principles generally accepted in the United States of America requires management to make estimates and assumptions that affect the reported amounts of assets and liabilities and disclosure of contingent assets and liabilities at the date of the financial statements and the reported amounts of revenues, net of estimated sales return, and expenses during the reporting periods. Actual results could differ from those estimates.
Fair Value Measurements
Fair value is defined as the price that would be received to sell an asset or paid to transfer a liability in an orderly transaction between market participants at the measurement date. Assets and liabilities measured at fair value are classified using the following hierarchy, which is based upon the transparency of inputs to the valuation at the measurement date.
| · | Level 1-Quoted prices in active markets for identical assets or liabilities. |
| · | Level 2-Inputs, other than the quoted prices in active markets, that are observable either directly or indirectly. |
| · | Level 3-Unobservable inputs based on the Company’s own assumptions. |
The classification of fair value measurements within the hierarchy is based upon the lowest level of input that is significant to the measurement.
Financial assets and liabilities with carrying amounts approximating fair value include cash and cash equivalents, accounts receivable, accounts payable and accrued liabilities. The carrying amount of these financial assets and liabilities approximates fair value because of their short maturities.
Non-financial assets and liabilities, including long-lived assets, are measured at fair value on a non-recurring basis. The fair value of those assets is determined using Level 3 inputs which generally requires that the company to make estimates of future cash flows based on historical experience, current trends, market conditions and other relevant factors deemed material.
Cash and Cash Equivalents
The Company considers all interest-bearing deposits and investments purchased with an original maturity of three months or less to be cash equivalents. The Company maintains cash balances at financial institutions that may from time to time exceed the Federal Deposit Insurance Corporation’s insurance limits. The Company mitigates this concentration of credit risk by monitoring the credit worthiness of the financial institutions.
| 43 |
FRANCESCA’S HOLDINGS CORPORATION
NOTES TO CONSOLIDATED FINANCIAL STATEMENTS
Accounts Receivable
Accounts receivable consist of amounts due from credit card companies, tenant allowances due from landlords and income tax refund receivable. The Company’s management has reviewed accounts receivable for collectability and has determined that an allowance for doubtful accounts is not necessary at January 31, 2015 and February 1, 2014.
Inventory
The Company values merchandise inventory at the lower of cost or market on a weighted-average cost basis. Inventory costs include freight costs. The Company records merchandise receipts at the time they are delivered to the distribution center or to its boutiques directly from vendors.
The Company reviews its inventory levels to identify slow-moving merchandise and generally uses promotional markdowns to clear slow-moving merchandise. Each period, the Company evaluates recent selling trends and the related promotional events or pricing strategies in place to sell through the current inventory levels. To accelerate the flow of new merchandise into its boutiques, the Company disposed of certain slow-moving merchandise in the second and fourth quarters of fiscal year 2014 at a cost of $3.0 million and $1.8 million, respectively.
The Company also estimates a shrinkage reserve for the period of time between the last physical count and the balance sheet date. The estimate for shrinkage reserve can be affected by changes in merchandise mix and changes in actual shrinkage trends.
Property and Equipment
Property and equipment is stated at cost. Depreciation of property and equipment is provided on a straight-line basis for financial reporting purposes using the following useful lives:
| Assets | Estimated Useful Lives | |
| Equipment | 3 - 5 years | |
| Furniture and fixtures | 5 years | |
| Software, including software developed for internal use | 3 - 12 years | |
| Signage and leasehold improvements | the lesser of 5 - 10 years or lease term |
Assets under construction are not depreciated until the asset is placed in service and / or ready for use.
Maintenance and repairs of property and equipment are expensed as incurred, and major improvements are capitalized. Upon retirement, sale or other disposition of property and equipment, the cost and accumulated depreciation are eliminated from the accounts, and any gain or loss is reflected in current earnings.
Impairment of Long-lived Assets
The Company evaluates long-lived assets held for use and held for sale whenever events or changes in circumstances indicate that the carrying amount of those assets may not be recoverable. Assets are grouped and evaluated for impairment at the lowest level for which there are identifiable cash flows, which is generally at the boutique level. Long-lived assets are reviewed for impairment using factors including, but not limited to, the Company’s current and future operating plans and projected cash flows. The determination of whether impairment has occurred is based on an estimate of undiscounted future cash flows directly related to the assets compared to its carrying value. If the carrying value of the asset is greater than the sum of the undiscounted future cash flows, an impairment loss is recognized for the difference between the carrying value and the estimated fair value of the asset; provided, however, that no other facts or circumstances indicate that recognition of such loss is premature. Fair value is determined using Level 3 inputs based on discounted future cash flows associated with the asset using a discount rate commensurate with the risk. In addition, at the time a decision is made to close a boutique, the Company accelerates depreciation over the revised useful life of the asset.
In fiscal year 2014, the Company recognized a non-cash impairment charge of $2.5 million in connection with the abandonment of previously capitalized expenditures related to the development the Company’s e-commerce website. No impairment was recognized in fiscal years 2013 and 2012. The impairment charge is included in selling, general and administrative expenses.
| 44 |
FRANCESCA’S HOLDINGS CORPORATION
NOTES TO CONSOLIDATED FINANCIAL STATEMENTS
Operating Leases
The Company leases boutiques and its distribution center and office space under operating leases. The majority of the Company’s lease agreements provide for tenant improvement allowances, rent escalation clauses and/or contingent rent provisions.
Landlord incentives, such as tenant improvement allowances, are deferred and amortized on a straight-line basis over the lease term as a reduction of rent expense. The unamortized portion of landlord incentives totaled $23.0 million and $19.2 million at January 31, 2015 and February 1, 2014, respectively.
The Company records straight-line rent expense beginning on the earlier of taking possession of the boutique (pre-opening or construction period) or the commencement date of the lease. Certain leases provide for contingent rents, in addition to a basic fixed rent, which are determined as a percentage of gross sales in excess of specified levels. The Company records a contingent rent liability and the corresponding rent expense when specified levels have been achieved or when management determines that achieving the specified levels during the fiscal year is probable.
Revenue Recognition
The Company recognizes revenue upon purchase of merchandise by customers, net of estimated merchandise returns and sales tax collected. Revenue is recognized for boutique sales at the point at which the customer receives and pays for the merchandise at the register. For direct-to-consumer sales, revenue is recognized upon delivery and includes shipping charges. Management estimates future returns on previously sold merchandise based on return history and current sales levels. Estimated sales returns are periodically compared to actual sales returns and adjusted, if appropriate.
Gift Cards and Gift Card Breakage
The Company accounts for the sale of gift cards as a liability at the time a gift card is sold. The liability is relieved and revenue is recognized upon redemption of the gift card. The gift cards issued by the Company are owned by an unrelated third party. The Company’s gift cards do not have an expiration date. Income from gift card breakage is recognized when the likelihood of redemption is deemed to be remote based on historical redemption patterns. The Company recognized $0.1 million, $0.4 million and $0 of gift card breakage income in fiscal years 2014, 2013 and 2012, respectively. The gift card breakage income is included in net sales.
Cost of Goods Sold and Occupancy Costs
Cost of goods sold and occupancy costs include the cost of purchased merchandise, freight costs from the Company’s suppliers to its distribution centers and freight costs for merchandise shipped directly from its vendors to its boutiques, allowances for inventory shrinkage and obsolescence, boutique occupancy costs including rent, utilities, common area maintenance, property taxes, boutique assets depreciation, boutique repair and maintenance costs, and shipping costs related to direct-to-consumer sales.
Selling, General and Administrative Expenses
Selling, general and administrative expenses include boutique and headquarters payroll (including buying department), employee benefits, freight from distribution centers to boutiques, boutique pre-opening expense, credit card merchant fees, costs of maintaining and operating the Company’s direct-to-consumer business, travel and administration costs, corporate asset depreciation, stock-based compensation and other expenses related to operations at the corporate headquarters.
Freight costs included in selling, general and administrative expenses amounted to $3.8 million, $2.8 million and $2.1 million in fiscal years 2014, 2013 and 2012, respectively.
Advertising
Advertising costs are charged to expense as incurred or, in the case of media production costs (such as television or print), when advertising first takes place. Advertising costs were $1.1 million, $0.7 million and less than $0.1 million in fiscal years 2014, 2013 and 2012, respectively.
Stock-Based Compensation
Stock-based compensation is measured at the grant date fair value and recognized as expense over the requisite service period (generally the vesting period of the award) for awards that are expected to vest. Please refer to Note 7 for additional information.
| 45 |
FRANCESCA’S HOLDINGS CORPORATION
NOTES TO CONSOLIDATED FINANCIAL STATEMENTS
Income Taxes
The Company accounts for income taxes using the liability method. Under this method, the amount of taxes currently payable or refundable is accrued, and deferred tax assets and liabilities are recognized for the estimated future tax consequences of temporary differences that currently exist between the tax basis and the financial reporting basis of the Company’s assets and liabilities. Valuation allowances are established against deferred tax assets when it is more-likely-than-not that the realization of those deferred tax assets will not occur.
Deferred tax assets and liabilities are measured using the enacted tax rates in effect in the years when those temporary differences are expected to reverse. The effect on deferred taxes from a change in tax rate is recognized through continuing operations in the period that includes the enactment date of the change. Changes in tax laws and rates could affect recorded deferred tax assets and liabilities in the future.
A tax benefit from an uncertain tax position may be recognized when it is more-likely-than-not that the position will be sustained upon examination, including resolutions of any related appeals or litigation processes, based on the technical merits. Income tax positions must meet a more-likely-than-not recognition threshold to be recognized. The Company recognizes tax liabilities for uncertain tax positions and adjusts these liabilities when the Company’s judgment changes as a result of the evaluation of new information not previously available. Interest and penalties related to unrecognized tax benefits are recognized in income tax expense. The Company has no uncertain tax positions requiring accrual at January 31, 2015 and February 1, 2014.
Recent Accounting Pronouncements
In August 2014, the Financial Accounting Standards Board ( “FASB” ) issued Accounting Standards Update ( “ASU” ) No. 2014-15, “Presentation of Financial Statements - Going Concern: Disclosure of Uncertainties about an Entity’s Ability to Continue as a Going Concern,” which requires management to evaluate, at each annual and interim reporting period, whether there are conditions or events that raise substantial doubt about the entity’s ability to continue as a going concern within one year after the date the financial statements are issued and provide related disclosures. This guidance is effective for annual periods ending after December 15, 2016 and for annual and interim periods thereafter. The adoption of this guidance is not expected to have a material effect on the Company’s consolidated financial statements or disclosures.
In May 2014 the FASB issued ASU No. 2014-09, “Revenue from Contracts with Customers.” This pronouncement was issued to improve the financial reporting of revenue and improve comparability of the top line in financial statements globally and is effective for reporting periods beginning on or after December 15, 2016. The Company is in the process of assessing the provisions of this new guidance and has not yet determined whether the adoption will have a material impact on the Company’s consolidated financial statements or disclosures.
2. Earnings per Share
Basic earnings per common share amounts are calculated using the weighted-average number of common shares outstanding for the period. Diluted earnings per common share amounts are calculated using the weighted-average number of common shares outstanding for the period and include the dilutive impact of stock options and restricted stock using the more dilutive of the treasury stock method or the two-class method. The following table summarizes the potential dilutive impact that could occur if outstanding options to acquire common stock were exercised or if outstanding restricted stocks have fully vested, and reconciles the weighted-average common shares outstanding used in the computation of basic and diluted earnings per share.
| Fiscal Years Ended | ||||||||||||
| January 31, | February 1, | February 2, | ||||||||||
| 2015 | 2014 | 2013 | ||||||||||
| (In thousands, except per share data) | ||||||||||||
| Numerator: | ||||||||||||
| Net income | $ | 32,108 | $ | 44,839 | $ | 47,061 | ||||||
| Denominator: | ||||||||||||
| Weighted-average common shares outstanding-basic | 42,259 | 43,372 | 43,744 | |||||||||
| Options and other dilutive securities | 121 | 751 | 1,063 | |||||||||
| Weighted-average common shares outstanding-diluted | 42,380 | 44,123 | 44,807 | |||||||||
| Per common share: | ||||||||||||
| 46 |
FRANCESCA’S HOLDINGS CORPORATION
NOTES TO CONSOLIDATED FINANCIAL STATEMENTS
| Fiscal Years Ended | ||||||||||||
| January 31, | February 1, | February 2, | ||||||||||
| 2015 | 2014 | 2013 | ||||||||||
| (In thousands, except per share data) | ||||||||||||
| Basic earnings per common share | $ | 0.76 | $ | 1.03 | $ | 1.08 | ||||||
| Diluted earnings per common share | $ | 0.76 | $ | 1.02 | $ | 1.05 | ||||||
Potentially issuable shares under the Company’s stock-based compensation plan amounting to approximately 1.9 million (includes approximately 1.1 million of performance awards), 0.8 million, and 0.7 million shares for the fiscal years 2014, 2013, and 2012, respectively, were outstanding but not included in the computation of diluted earnings per shares due to their anti-dilutive effect.
3. Detail of Certain Balance Sheet Accounts
| As of Fiscal Year Ended | ||||||||
| January 31, | February 1, | |||||||
| 2015 | 2014 | |||||||
| (in thousands) | ||||||||
| Accounts receivable: | ||||||||
| Credit card receivables | $ | 2,533 | $ | 2,395 | ||||
| Tenant allowances | 841 | 899 | ||||||
| Income tax receivable | 8,284 | 5,690 | ||||||
| Others | 621 | - | ||||||
| $ | 12,279 | $ | 8,984 | |||||
| Property and equipment, net: | ||||||||
| Signage and leasehold improvements | $ | 73,694 | $ | 56,717 | ||||
| Furniture and fixtures | 15,009 | 11,992 | ||||||
| Equipment | 4,485 | 4,086 | ||||||
| Software | 6,371 | 5,062 | ||||||
| Construction in progress | 11,331 | 12,242 | ||||||
| 110,890 | 90,099 | |||||||
| Less accumulated depreciation | (36,795 | ) | (25,968 | ) | ||||
| $ | 74,095 | $ | 64,131 | |||||
| Accrued liabilities: | ||||||||
| Gift cards and store credits outstanding | $ | 6,906 | $ | 5,757 | ||||
| Accrued payroll, benefits and bonuses | 4,014 | 3,439 | ||||||
| Accrued sales tax | 968 | 595 | ||||||
| Accrued interest | 16 | 32 | ||||||
| $ | 11,904 | $ | 9,823 | |||||
| Landlord incentives and deferred rent: | ||||||||
| Landlord incentives | $ | 23,013 | $ | 19,228 | ||||
| Deferred rent | 9,864 | 8,220 | ||||||
| $ | 32,877 | $ | 27,448 | |||||
| 47 |
FRANCESCA’S HOLDINGS CORPORATION
NOTES TO CONSOLIDATED FINANCIAL STATEMENTS
4. Income Taxes
The provision for income tax expense for fiscal years 2014, 2013 and 2012 is as follows:
| Fiscal Years Ended | ||||||||||||
| January 31, | February 1, | February 2, | ||||||||||
| 2015 | 2014 | 2013 | ||||||||||
| Current: | ||||||||||||
| Federal | $ | 18,498 | $ | 25,363 | $ | 27,352 | ||||||
| State | 3,345 | 4,702 | 5,644 | |||||||||
| Total | 21,843 | 30,065 | 32,996 | |||||||||
| Deferred: | ||||||||||||
| Federal | (1,069 | ) | (747 | ) | (1,812 | ) | ||||||
| State | (643 | ) | (267 | ) | (747 | ) | ||||||
| Total | (1,712 | ) | (1,014 | ) | (2,559 | ) | ||||||
| Income tax expense | $ | 20,131 | $ | 29,051 | $ | 30,437 | ||||||
A reconciliation of the statutory federal income tax rate to the effective tax rate follows:
| Fiscal Years Ended | ||||||||||||
| January 31, | February 1, | February 2, | ||||||||||
| 2015 | 2014 | 2013 | ||||||||||
| Income tax expense at statutory rate | 35.0 | % | 35.0 | % | 35.0 | % | ||||||
| Nondeductible expenses | 0.1 | 0.3 | 0.2 | |||||||||
| State tax, net of federal benefit | 2.9 | 4.1 | 4.1 | |||||||||
| Other | 0.5 | (0.1 | ) | - | ||||||||
| Effective tax rate | 38.5 | % | 39.3 | % | 39.3 | % | ||||||
Deferred tax assets and liabilities are recorded due to different carrying amounts for financial and income tax reporting purposes arising from cumulative temporary differences as measured by enacted tax rates, which will be in effect when these temporary differences reverse. These differences consist of the following as of the dates indicated:
| As of Fiscal Year Ended | ||||||||
| January 31, | February 1, | |||||||
| 2015 | 2014 | |||||||
| (in thousands) | ||||||||
| Deferred tax assets: | ||||||||
| Inventories | $ | 1,005 | $ | 941 | ||||
| Accrued liabilities | 3,853 | 3,624 | ||||||
| Landlord incentives and deferred rents | 12,514 | 10,484 | ||||||
| Equity based compensation | 2,662 | 2,075 | ||||||
| Other | 57 | 61 | ||||||
| Total deferred tax assets | 20,091 | 17,185 | ||||||
| Deferred tax liabilities | ||||||||
| Property and equipment | (11,591 | ) | (10,285 | ) | ||||
| Total deferred tax liabilities | (11,591 | ) | (10,285 | ) | ||||
| Net deferred tax assets | $ | 8,500 | $ | 6,900 | ||||
The Company’s tax years are subject to examination by federal authorities from 2011 forward, and by state taxing authorities from 2010 forward.
| 48 |
FRANCESCA’S HOLDINGS CORPORATION
NOTES TO CONSOLIDATED FINANCIAL STATEMENTS
5. Revolving Credit Facility
On August 30, 2013, Francesca’s Collections, Inc., (“Francesca’s Collections”), as borrower, and its parent company, Francesca’s LLC (the “Parent”), a wholly-owned subsidiary of Holdings, entered into a Second Amended and Restated Credit Agreement (“Second Amended and Restated Credit Agreement”) with Royal Bank of Canada, as Administrative Agent and Collateral Agent, and the lenders party thereto, which amends and restates the existing Amended and Restated Credit Agreement, dated as of July 27, 2011, as amended by Amendment No. 1 to the Amended and Restated Credit Agreement, dated February 7, 2013. The Second Amended and Restated Credit Agreement provides $75.0 million of credit facility (including up to $10.0 million for letters of credit) that matures on August 30, 2018. The Second Amended and Restated Credit Agreement also contains an increase option permitting Francesca’s Collections, subject to certain requirements, to arrange with the lenders for additional incremental commitments up to an aggregate of $25.0 million, subject to reductions in the event Francesca’s Collections has certain indebtedness outstanding. At January 31, 2015, no amount was outstanding under the Second Amended and Restated Credit Agreement.
All obligations under the Second Amended and Restated Credit Agreement are unconditionally guaranteed by, subject to certain exceptions, the Parent and each of Francesca’s Collections’ existing and future direct and indirect wholly-owned domestic subsidiaries. There are currently no subsidiary guarantors for the Second Amended and Restated Credit Agreement because Francesca’s Collections does not currently have any subsidiaries. All obligations under the Second Amended and Restated Credit Agreement, and the guarantees of those obligations (as well as cash management obligations and any interest rate hedging or other swap agreements), are secured by substantially all of Francesca’s Collections’ assets as well as the assets of any subsidiary guarantor. Additionally, the Second Amended and Restated Credit Agreement contains customary events of default and requires Francesca’s Collections to comply with certain financial covenants. Francesca’s Collections is permitted to pay dividends to the extent it has available capacity in its available investment basket (as defined in the Second Amended and Restated Credit Agreement), no default or event of default is continuing, certain procedural requirements have been satisfied and Francesca’s Collections is in pro forma compliance with a maximum secured leverage ratio. As of January 31, 2015, Francesca’s Collections was in compliance with all covenants under the Second Amended and Restated Credit Agreement. At January 31, 2015, Francesca’s Collections would have met the conditions for paying dividends out of the available investment basket, including compliance with the required total secured leverage ratio.
The borrowings under the Second Amended and Restated Credit Agreement bear interest at a rate equal to an applicable margin plus, at the option of Francesca’s Collection’s, either (a) in the case of base rate borrowings, a rate equal to the highest of (1) the prime rate of Royal Bank of Canada, (2) the federal funds rate plus 1/2 of 1%, and (3) the LIBOR for an interest period of one month plus 1.00%, or (b) in the case of LIBOR borrowings, a rate equal to the LIBOR for the interest period relevant to such borrowing. The applicable margin for borrowings under the Second Amended and Restated Credit Agreement ranges from 0.75% to 1.25% with respect to base rate borrowings and from 1.75% to 2.25% with respect to LIBOR borrowings, in each case based upon the achievement of specified levels of a ratio of consolidated total debt to consolidated EBITDA. In addition, the Borrower is required to pay a commitment fee on the unused portion of the revolver at a rate ranging from 0.25% to 0.38%. During fiscal year 2014, amounts outstanding under the Second Amended and Restated Credit Agreement accrued interest at an average rate of 2.1%.
In connection with the revolving credit facility, the Company incurred $0.4 million of debt issuance costs in fiscal year 2013 which is being amortized over the term of the loan.
6. Share Repurchases
On September 3, 2013, the Company’s Board of Directors authorized a $100.0 million share repurchase program commencing on the same date. This authorization has no expiration date. Under the repurchase program, purchases can be made from time to time in the open market, in privately negotiated transactions, under Rule 10b5-1 plans or through other available means. The specific timing and amount of the repurchases is dependent on market conditions, securities law limitations and other factors. During fiscal year 2014, the Company repurchased 0.3 million shares of its common stock at a cost of approximately $5.3 million or an average price (including brokers’ commission) of $18.49 per share. During fiscal year 2013, the Company repurchased 2.9 million shares of its common stock at a cost of approximately $54.9 million or an average price (including brokers’ commission) of $18.95 per share. The cost of repurchased shares is presented as treasury stock in the consolidated balance sheets. As of January 31, 2015, the remaining balance available for future share repurchase was approximately $39.9 million.
7. Stock-Based Compensation
Stock-based compensation expense for fiscal years 2014, 2013 and 2012 totaled approximately $2.7 million, $3.8 million and $3.6 million, respectively.
| 49 |
FRANCESCA’S HOLDINGS CORPORATION
NOTES TO CONSOLIDATED FINANCIAL STATEMENTS
Stock Incentive Plans
2010 Stock Incentive Plan
On February 27, 2010, the Company adopted the Francesca’s Holdings Corporation 2010 Stock Incentive Plan (the “2010 Plan”) to be administered by the Board or a Committee. Under the 2010 Plan, awards may be in the form of stock options, stock or restricted stock and may be granted to any officers, directors, eligible employees and consultants of the Company. Exercise prices shall not be less than the fair market value of the Company’s common stock at the date of grant as determined by the Board. The awards generally vest over four to five years and have a ten year contractual term. As of July 14, 2011, the Company can no longer grant awards under the 2010 Plan.
2011 Stock Incentive Plan
On July 14, 2011, the 2011 Equity Incentive Plan (the “2011 Plan”) was approved by the stockholders and became immediately effective. Under the 2011 Plan, awards may be in the form of nonqualified stock options, stock appreciation rights, stock bonuses, restricted stock, performance stock and other stock-based awards which can be granted to any officers, directors, employees and consultants of the Company. A total of 3,175,365 shares of common stock are authorized for issuance under the 2011 Plan. Awards granted under the 2011 Plan generally vest over three to five years and have a ten-year contractual life. As of January 1, 2015, there were approximately 1.2 million awards remaining that can be granted under the 2011 Plan.
Stock Options
The following table summarizes stock option activity during fiscal year 2014. The intrinsic value of the stock options was calculated based the closing price of the Company’s common stock on the last trading day closest to January 31, 2015.
| Weighted | ||||||||||||||||
| Average | ||||||||||||||||
| Weighted | Remaining | |||||||||||||||
| Number of | Average | Contractual | Aggregate | |||||||||||||
| Options | Exercise Price | Life | Intrinsic Value | |||||||||||||
| (in thousands) | (Per share data) | (in Years) | (In thousands) | |||||||||||||
| Stock options outstanding as of February 1, 2014 | 1,264 | $ | 19.39 | |||||||||||||
| Granted – service-based | 78 | $ | 15.68 | |||||||||||||
| Granted – service and market-based | 1,000 | $ | 11.56 | |||||||||||||
| Exercised | (232 | ) | $ | 5.73 | ||||||||||||
| Forfeited or expired | (237 | ) | $ | 26.69 | ||||||||||||
| Stock options outstanding as of January 31, 2015 | 1,873 | $ | 15.83 | 8 | $ | 6,835 | ||||||||||
| Stock options exercisable at January 31, 2015 | 507 | $ | 22.52 | 3 | $ | 1,459 | ||||||||||
On December 4, 2014, Michael Barnes was appointed as Chairman of the Board of Directors (“Board”), President and Chief Executive Officer (“CEO”) of the Company. In connection with such appointment, the Board awarded him stock options to purchase up to 1,000,000 shares of the Company’s common stock. The option is subject to both service and market conditions. Vesting occurs if the closing price of the Company’s common stock achieves the pre-established targets at any time during the specified performance period and he remains employed by the Company through the end of the vesting period. The award had a grant date fair value of $5.9 million (determined using the Monte Carlo simulation) that is being amortized over the requisite service period.
During fiscal years 2014, 2013 and 2012 stock options were granted at a weighted-average grant date fair value of $6.04, $14.15 and $14.21, respectively. The intrinsic value of stock options at the date of exercise amounted to $2.8 million, $20.8 million and $7.5 million in fiscal years 2014, 2013 and 2012, respectively.
Other than the market-based options described above, all other option grants are subject to service condition only. The fair value of stock options with a service condition was estimated using the Black Scholes option pricing model. The fair value of stock options subject to a service and a market condition was estimated using a Monte-Carlo simulation method. Each model considers the following significant assumptions in determining the fair value of awards. Changes in any of these inputs and assumptions can materially affect the measurement of the estimated fair value of stock-based compensation.
| Fiscal Year | ||||||
| 2014 | 2013 | 2012 | ||||
| Expected volatility(1) | 57.0% - 60.3% | 59.7% - 61.3% | 50.3% - 68.2% | |||
| Expected term (in years)(2) | 6.0 – 7.5 | 6.0 - 6.5 | 6.0 - 6.5 | |||
| Risk-free interest rate(3) | 1.9% - 2.0% | 1.0% - 2.0% | 0.8% - 1.0% | |||
| 50 |
FRANCESCA’S HOLDINGS CORPORATION
NOTES TO CONSOLIDATED FINANCIAL STATEMENTS
| Fiscal Year | ||||||||||||
| 2014 | 2013 | 2012 | ||||||||||
| Expected dividend yield(4) | - | - | - | |||||||||
| (1) | Due to lack of trading history of the Company’s own stock, expected volatility is estimated using historical and implied volatilities of similar entities whose share prices are publicly available, including Company specific data in fiscal year 2014. |
| (2) | Due to lack of sufficient historical data, the expected term was determined using the “simplified method” as allowed by SEC Staff Accounting Bulletin Topic 14D2. |
| (3) | The risk-free interest rate was determined based on the rate of Treasury instruments with maturities similar to those of the expected term of the award being valued. |
| (4) | The expected dividend yield was based on the Company’s expectations of not paying dividends on its common stock for the foreseeable future. |
As of January 31, 2015, there was approximately $8.7 million of total unrecognized compensation cost related to non-vested stock option awards that is expected to be recognized over a weighted-average period of 4 years.
Restricted Stocks
The following table summarizes restricted stock activity during fiscal year 2014.
| Weighted | ||||||||
| Number of | Average Grant | |||||||
| Shares | Date Fair Value | |||||||
| (in thousands) | (Per share data) | |||||||
| Non-vested restricted stocks as of February 1, 2014 | 2 | $ | 25.95 | |||||
| Granted – service-based | 40 | $ | 14.99 | |||||
| Granted – service and performance-based | 55 | $ | 16.94 | |||||
| Vested | (2 | ) | $ | 25.95 | ||||
| Forfeited or cancelled | (55 | ) | $ | 16.94 | ||||
| Non-vested restricted stocks as of January 31, 2015 | 40 | $ | 14.99 | |||||
The fair value of restricted stock awards is determined based on the closing price of the Company’s common stock on the award date. For awards subject to performance conditions, compensation expense is recognized when it is probable that the specified performance goals will be achieved.
In fiscal year 2014, the Company awarded a total of 169,964 service- and performance-based restricted stock awards to certain executives and other key employees. Of the total number of shares, 55,369 were considered “granted” as the performance goals related to those shares have been established. The awards are eligible to vest upon the achievement of pre-established performance goals and the employees’ continued employment through the end of the vesting period. In fiscal year 2014, no compensation expense was recognized related to these awards as the specified performance goals were not met, which resulted in the forfeiture of that portion of the award.
8. Employee Benefits
The Company has adopted Francesca’s Collections, Inc. 401(k) Retirement Plan (the “401(k) Plan”) under which full-time and part-time employees who are at least 21 years of age and have completed twelve consecutive months of employment are eligible to participate. Beginning on March 1, 2013, the service requirement period was reduced from twelve months to six months of service. Employees may elect to contribute a certain percentage of their earnings subject to limitations provided for by the law. The Company makes matching contributions of up to a maximum of 4% of the employees’ salary. The Company may also make discretionary profit sharing contributions to the 401(k) Plan. No profit sharing contributions were made in fiscal years 2014, 2013 and 2012. The Company’s matching contributions were $0.5 million, $0.3 million and $0.2 million in fiscal years 2014, 2013 and 2012, respectively.
| 51 |
FRANCESCA’S HOLDINGS CORPORATION
NOTES TO CONSOLIDATED FINANCIAL STATEMENTS
9. Commitments and Contingencies
Operating leases
The Company leases boutique space and office space under operating leases expiring in various years through the fiscal year ending 2026. Certain of the leases provide that the Company may cancel the lease, with penalties as defined in the lease, if the Company’s boutique sales at that location fall below an established level. Certain leases provide for additional rent payments to be made when sales exceed a base amount. Certain operating leases provide for renewal options for periods from three to five years at the market rate at the time of renewal.
Minimum future rental payments under non-cancellable operating leases as of January 31, 2015 are approximately as follows:
| Fiscal Year | Amount | |||
| (in thousands) | ||||
| 2015 | $ | 35,785 | ||
| 2016 | 35,987 | |||
| 2017 | 34,841 | |||
| 2018 | 33,091 | |||
| 2019 | 30,342 | |||
| Thereafter | 72,635 | |||
| $ | 242,681 | |||
During fiscal years 2014, 2013 and 2012, rent expense totaled $30.1 million, $26.3 million and $22.5 million, respectively.
Legal Proceedings
On September 27, 2013 and November 4, 2013, two purported class action lawsuits entitled Ortuzar v. Francesca’s Holdings Corp., et al. and West Palm Beach Police Pension Fund v. Francesca’s Holdings Corp., et al. were filed in the United States District Court for the Southern District of New York against the Company and certain of its current and former directors and officers for alleged violations of the federal securities laws arising from statements in certain public disclosures regarding the Company’s current and future business and financial condition. On December 19, 2013, the Court consolidated the actions and appointed Arkansas Teacher Retirement System as lead plaintiff. On March 14, 2014, lead plaintiff filed a consolidated class action complaint purportedly on behalf of shareholders that purchased or acquired the Company’s publicly traded common stock between July 22, 2011 and September 3, 2013 against the Company and certain of its current and former directors and officers. The consolidated complaint asserts claims under Sections 10(b) and 20(a) of the Securities Exchange Act of 1934 and Sections 11, 12(a) (2), and 15 of the Securities Act of 1933 for allegedly false and misleading statements in the Company’s public disclosures concerning, among other things, the Company’s relationship with certain vendors. The lawsuit seeks damages in an unspecified amount. On May 13, 2014 defendants moved to dismiss the consolidated complaint. That motion was fully briefed as of August 13, 2014. The Company believes that the allegations contained in the consolidated complaint are without merit and intends to vigorously defend itself against all claims asserted therein. A reasonable estimate of the amount of any possible loss or range of loss cannot be made at this time and, as such, the Company has not recorded an accrual for any possible loss.
On each of May 28, 2014 and July 8, 2014, a purported shareholder derivative action entitled Daniell v. De Merritt, et al. and Murphy v. Davis, et al., respectively, purportedly on behalf of the Company, was filed in the Delaware Court of Chancery, naming certain of the Company’s current and former officers, directors, and shareholders as defendants and naming the Company as a nominal defendant. On September 3, 2014, the Court of Chancery consolidated the Daniell and Murphy cases. Plaintiffs filed a consolidated amended complaint on September 23, 2014 alleging claims of breach of fiduciary duty and unjust enrichment. The consolidated amended complaint seeks damages in an unspecified amount, an order directing the Company “to reform and improve” corporate governance and internal controls, equitable and/or injunctive relief, restitution and disgorgement from the defendants, and costs and attorneys’ fees. On October 23, 2014, defendants filed a motion to dismiss the consolidated amended complaint, which is now fully briefed. The Company believes that any loss that may arise from this litigation will not have a material adverse effect on the Company’s results of operations or financial condition.
The Company, from time to time, is subject to various claims and legal proceedings arising in the ordinary course of business. While the outcome of any such claim cannot be predicted with certainty, in the opinion of management, the outcome of these matters will not have a material adverse effect on the Company’s business, results of operations or financial conditions.
10. Segment Reporting
The Company determined its operating segments on the same basis used internally to evaluate performance. The Company’s reporting segments are the operation of boutiques and the direct-to-consumer website, which have been aggregated into one reportable financial segment. The Company aggregates its operating segments because (i) the merchandise offered at retail locations and through the direct-to-consumer business is largely the same and (ii) management believes that the majority of its direct-to-consumer customers are also customers of retail locations. All of the Company’s identifiable assets are located in the United States.
| 52 |
FRANCESCA’S HOLDINGS CORPORATION
NOTES TO CONSOLIDATED FINANCIAL STATEMENTS
The following is net sales information regarding the Company’s major merchandise categories.
| Fiscal Year Ended | ||||||||||||
| January 31, | February 1, | February 2, | ||||||||||
| 2015 | 2014 | 2013 | ||||||||||
| (in thousands) | ||||||||||||
| Apparel | $ | 180,736 | $ | 163,946 | $ | 145,935 | ||||||
| Jewelry | 81,751 | 81,186 | 68,039 | |||||||||
| Accessories | 65,270 | 56,516 | 45,825 | |||||||||
| Gifts | 48,981 | 37,875 | 36,602 | |||||||||
| Merchandise sales | 376,738 | 339,523 | 296,401 | |||||||||
| Others(1) | 759 | 802 | (28 | ) | ||||||||
| Net sales | $ | 377,497 | $ | 340,325 | $ | 296,373 | ||||||
| (1) | Includes gift card breakage income, shipping and change in return reserve. |
11. Quarterly Financial Data (Unaudited)
| Fiscal Year 2014 | ||||||||||||||||
| Fourth | Third | Second | First | |||||||||||||
| Quarter | Quarter | Quarter | Quarter | |||||||||||||
| (in thousands, except per share data) | ||||||||||||||||
| Net sales | $ | 107,644 | $ | 87,110 | $ | 97,319 | $ | 85,424 | ||||||||
| Gross profit | 49,246 | 41,185 | 45,315 | 41,832 | ||||||||||||
| Income from operations | 10,717 | 11,375 | 16,662 | 14,020 | ||||||||||||
| Net income | 5,971 | 7,270 | 10,307 | 8,560 | ||||||||||||
| Basic earnings per common share | 0.14 | 0.17 | 0.24 | 0.20 | ||||||||||||
| Diluted earnings per common share | 0.14 | 0.17 | 0.24 | 0.20 | ||||||||||||
| Fiscal Year 2013 | ||||||||||||||||
| Fourth | Third | Second | First | |||||||||||||
| Quarter | Quarter | Quarter | Quarter | |||||||||||||
| (in thousands, except per share data) | ||||||||||||||||
| Net sales | $ | 92,140 | $ | 79,632 | $ | 89,566 | $ | 78,987 | ||||||||
| Gross profit | 46,580 | 40,357 | 47,756 | 41,372 | ||||||||||||
| Income from operations | 17,585 | 14,591 | 24,073 | 18,021 | ||||||||||||
| Net income | 10,612 | 8,671 | 14,619 | 10,937 | ||||||||||||
| Basic earnings per common share | 0.25 | 0.20 | 0.33 | 0.25 | ||||||||||||
| Diluted earnings per common share | 0.25 | 0.20 | 0.33 | 0.24 | ||||||||||||
| 53 |
ITEM 9. CHANGES IN AND DISAGREEMENTS WITH ACCOUNTANTS ON ACCOUNTING AND FINANCIAL DISCLOSURE
None.
ITEM 9A. CONTROLS AND PROCEDURES
Evaluation of Disclosure Controls and Procedures
Under the supervision and with the participation of our management, including our Chief Executive Officer, our Chief Financial Officer and our Chief Administrative Officer, we evaluated the effectiveness of the design and operation of our disclosure controls and procedures, as defined in Rule 13a-15(e) and Rule 15d-15(e) under the Securities Exchange Act of 1934, as amended (the “Exchange Act”), as of the end of the period covered by this report. Based on that evaluation, our Chief Executive Officer, our Chief Financial Officer and our Chief Administrative Officer have concluded that our disclosure controls and procedures as of January 31, 2015, were effective to ensure that information required to be disclosed by us in reports that we file or submit under the Exchange Act is recorded, processed, summarized, and reported within the time periods specified in the SEC’s rules and forms and the information required to be disclosed by us is accumulated and communicated to our management to allow timely decisions regarding required disclosure.
Changes in Internal Control Over Financial Reporting
There were no changes in our internal control over financial reporting during the quarter ended January 31, 2015 that have materially affected or are reasonably likely to materially affect our internal control over financial reporting.
Management’s Annual Report on Internal Control Over Financial Reporting
Our management is responsible for establishing and maintaining adequate internal control over financial reporting as defined in Rule 13a-15(f) under the Securities Exchange Act of 1934. Our internal control over financial reporting is a process designed under the supervision of our principal executive and principal financial officer, and effected by our Board of Directors, management and other personnel, to provide reasonable assurance regarding the reliability of financial reporting and the preparation of financial statements for external purposes in accordance with generally accepted accounting principles.
Because of its inherent limitations, internal control over financial reporting may not prevent or detect misstatements. Projections of any evaluation of effectiveness to future periods are subject to the risk that controls may become inadequate because of changes in conditions, or that the degree of compliance with policies or procedures may deteriorate.
Our management assessed the effectiveness of our internal control over financial reporting as of the end of our most recent fiscal year. In making this assessment, our management used the criteria set forth by the Committee of Sponsoring Organizations of the Treadway Commission in the 2013 Internal Control - Integrated Framework. Based on such assessment, management concluded that, as of January 31, 2015, our internal control over financial reporting is effective based on those criteria.
The Company’s independent registered public accounting firm, Ernst & Young LLP, has issued an attestation report on the effectiveness of our internal control over financial reporting as of January 31, 2015, as stated in their report, which follows.
| 54 |
Report of Independent Registered Public Accounting Firm
To the Board of Directors and Shareholders of
Francesca’s Holdings Corporation
We have audited Francesca’s Holdings Corporation’s (the “Company”) internal control over financial reporting as of January 31, 2015, based on the criteria established in Internal Control - Integrated Framework issued by the Committee of Sponsoring Organizations of the Treadway Commission (2013 framework) (the “COSO criteria”). The Company’s management is responsible for maintaining effective internal control over financial reporting and for its assessment of the effectiveness of internal control over financial reporting included in the accompanying “Management’s Annual Report on Internal Control Over Financial Reporting.” Our responsibility is to express an opinion on the Company’s internal control over financial reporting based on our audit.
We conducted our audit in accordance with the standards of the Public Company Accounting Oversight Board (United States). Those standards require that we plan and perform the audit to obtain reasonable assurance about whether effective internal control over financial reporting was maintained in all material respects. Our audit included obtaining an understanding of internal control over financial reporting, assessing the risk that a material weakness exists, testing and evaluating the design and operating effectiveness of internal control based on the assessed risk, and performing such other procedures as we considered necessary in the circumstances. We believe that our audit provides a reasonable basis for our opinion.
A company’s internal control over financial reporting is a process designed to provide reasonable assurance regarding the reliability of financial reporting and the preparation of financial statements for external purposes in accordance with generally accepted accounting principles. A company’s internal control over financial reporting includes those policies and procedures that (1) pertain to the maintenance of records that, in reasonable detail, accurately and fairly reflect the transactions and dispositions of the assets of the company; (2) provide reasonable assurance that transactions are recorded as necessary to permit preparation of financial statements in accordance with generally accepted accounting principles, and that receipts and expenditures of the company are being made only in accordance with authorizations of management and directors of the company; and (3) provide reasonable assurance regarding prevention or timely detection of unauthorized acquisition, use, or disposition of the company’s assets that could have a material effect on the financial statements.
Because of the inherent limitations, internal control over financial reporting may not prevent or detect misstatements. Also, projections of any evaluation of the effectiveness to future periods are subject to the risk that controls may become inadequate because of changes in conditions, or that the degree of compliance with the policies or procedures may deteriorate.
In our opinion, Francesca’s Holdings Corporation maintained, in all material respects, effective internal control over financial reporting as of January 31, 2015, based on the COSO criteria.
We have also audited, in accordance with the standards of the Public Company Accounting Oversight Board (United States), the consolidated balance sheets of Francesca’s Holdings Corporation as of January 31, 2015 and February 1, 2014, and the related consolidated statements of operations, change in stockholders’ equity and cash flows for each of the three years in the period ended January 31, 2015 and our report dated March 27, 2015 expressed an unqualified opinion thereon.
/S/ ERNST & YOUNG LLP
Dallas, Texas
March 27, 2015
| 55 |
None.
ITEM 10. DIRECTORS, EXECUTIVE OFFICERS AND CORPORATION GOVERNANCE
The information required by this Item is incorporated herein by reference from our Proxy Statement for the Annual Meeting to be held on June 9, 2015 and which will be filed with the SEC within 120 days after the end of the fiscal year ended January 31, 2015.
We have adopted a written Code of Ethics and Conduct, which applies to all of our directors, officers and employees, including our principal executive officer and our principal financial and accounting officer. Our Code of Ethics and Conduct is available on our website, www.francescas.com under the heading “Corporate Governance.” The information contained on our website is not incorporated by reference into this Annual Report on Form 10-K. We intend to disclose any amendment to, or waiver from, the Code of Ethics and Conduct for our directors, executive officers and employees of the Company, including our principal executive officer, principal financial officer, principal accounting officer or persons performing similar functions, to the extent disclosure is required by applicable rules of the SEC and NASDAQ Stock Market LLC by posting such information on our website, at the address and location specified above.
ITEM 11. EXECUTIVE COMPENSATION
The information required by this Item is incorporated herein by reference from our Proxy Statement for the Annual Meeting to be held on June 9, 2015 and which will be filed with the SEC within 120 days after the end of the fiscal year ended January 31, 2015.
ITEM 12. SECURITY OWNERSHIP OF CERTAIN BENEFICIAL OWNERS AND MANAGEMENT AND RELATED STOCKHOLDER MATTERS
The information required by this Item is incorporated herein by reference from our Proxy Statement for the Annual Meeting to be held on June 9, 2015 and which will be filed with the SEC within 120 days after the end of the fiscal year ended January 31, 2015.
Securities Authorized for Issuance under Equity Compensation Plans
The following table sets forth information regarding equity securities authorized for issuance under our equity compensation plans as of January 31, 2015.
| Number of securities | ||||||||||||
| Number of | Weighted- | remaining | ||||||||||
| Securities to be | average | available for future | ||||||||||
| issued upon | Exercise price | issuance | ||||||||||
| exercise of | of | under equity | ||||||||||
| outstanding | outstanding | compensation | ||||||||||
| options, | options, | plans (excluding | ||||||||||
| warrants and | warrants and | Securities reflected | ||||||||||
| rights | rights | in column (a)) | ||||||||||
| Plan Category | (a) | (b) | (c) | |||||||||
| Equity compensation plans approved by security holders (1) | 1,873,153 | $ | 15.83 | 1,206,539 | ||||||||
| Equity plan not approved by security holders | - | - | - | |||||||||
(1) Approved before our initial public offering.
ITEM 13. CERTAIN RELATIONSHIPS AND RELATED TRANSACTIONS, AND DIRECTOR INDEPENDENCE
The information required by this Item is incorporated herein by reference from our Proxy Statement for the Annual Meeting to be held on June 9, 2015 and which will be filed with the SEC within 120 days after the end of the fiscal year ended January 31, 2015.
ITEM 14. PRINCIPAL ACCOUNTING FEES AND SERVICES
The information required by this Item is incorporated herein by reference from our Proxy Statement for the Annual Meeting to be held on June 9, 2015 and which will be filed with the SEC within 120 days after the end of the fiscal year ended January 31, 2015.
| 56 |
ITEM 15. EXHIBITS, FINANCIAL STATEMENT SCHEDULES
(a) 1. Financial Statements
The following consolidated financial statements of the Company are included in Part II, Item 8:
| Reports of Independent Registered Public Accounting Firm | |
| Consolidated Balance Sheets as of January 31, 2015 and February 1, 2014 | |
| Consolidated Statements of Operations for the Fiscal Years Ended January 31, 2015, February 1, 2014, and February 2, 2013 | |
| Consolidated Statements of Changes in Stockholders’ Equity for the Fiscal years Ended January 31, 2015, February 1, 2014, and February 2, 2013 | |
| Consolidated Statements of Cash Flows for the Fiscal Years Ended January 31, 2015, February 1, 2014, and February 2, 2013 | |
| Notes to Consolidated Financial Statements |
2. Financial Statements Schedules
All schedules are omitted because they are not applicable or because the required information is either not material or is included in the Consolidated Financial Statements or Notes thereto.
3. Exhibits
| Exhibit No. | Description | |
| 3.1 | Amended and Restated Certificate of Incorporation of Francesca’s Holdings Corporation (incorporated by reference to Exhibit 3.3 of Amendment No. 5 to the Registration Statement on Form S-1 (File No. 333-173581) filed by Francesca’s Holdings Corporation on July 14, 2011). | |
| 3.2 | Amended and Restated Bylaws of Francesca’s Holdings Corporation (incorporated by reference to Exhibit 3.4 of Amendment No. 5 to the Registration Statement on Form S-1 (File No. 333-173581) filed by Francesca’s Holdings Corporation on July 14, 2011). | |
| 4.1 | Form of Specimen Common Stock of Francesca’s Holdings Corporation (incorporated by reference to Exhibit 4.1 of Amendment No. 4 to the Registration Statement on Form S-1 (File No. 333-173581) filed by Francesca’s Holdings Corporation on July 13, 2011). | |
| 10.1 | Second Amended and Restated Credit Agreement, dated as of August 30, 2013, between Francesca’s Collections, Inc., as Borrower, Francesca’s LLC, as Parent, the guarantors party thereto, the lenders party thereto, and Royal Bank of Canada, as Administrative Agent, Collateral Agent Joint Lead Arranger and Co-Bookrunner and KeyBank National Association, as Syndication Agent, Joint Lead Arranger and Co-Bookrunner (incorporated by reference to Exhibit 10.1 of the Current Report on Form 8-K filed by Francesca’s Holdings Corporation on September 4, 2013) | |
| 10.2 | Guaranty and Security Agreement, dated as of November 17, 2010, among Francesca’s Collections, Inc., the other guarantors party thereto, and Royal Bank of Canada, as administrative agent and collateral agent (incorporated by reference to Exhibit 10.3 of Amendment No. 1 to the Registration Statement on Form S-1 (File No. 333-173581) filed by Francesca’s Holdings Corporation on May 24, 2011). | |
| 10.3 | Form of Indemnification Agreement (incorporated by reference to Exhibit 10.4 of Amendment No. 5 to the Registration Statement on Form S-1 (File No. 333-173581) filed by Francesca’s Holdings Corporation on July 14, 2011). | |
| 10.4 + | Francesca’s Holdings Corporation 2010 Stock Incentive Plan (incorporated by reference to Exhibit 10.7 of Amendment No. 1 to the Registration Statement on Form S-1 (File No. 333-173581) filed by Francesca’s Holdings Corporation on May 24, 2011). |
| 57 |
| Exhibit No. | Description | |
| 10.5 + | Nonqualified Stock Option Agreement for Khalid M. Malik, dated as of March 31, 2010 (incorporated by reference to Exhibit 10.9 of Amendment No. 1 to the Registration Statement on Form S-1 (File No. 333-173581) filed by Francesca’s Holdings Corporation on May 24, 2011). | |
| 10.6 + | Nonqualified Stock Option Agreement for Richard J. Emmett, dated as of March 31, 2010 (incorporated by reference to Exhibit 10.12 of Amendment No. 1 to the Registration Statement on Form S-1 (File No. 333-173581) filed by Francesca’s Holdings Corporation on May 24, 2011). | |
| 10.7 + | Francesca’s Holdings Corporation 2011 Equity Incentive Plan (incorporated by reference to Exhibit 10.13 of Amendment No. 5 to the Registration Statement on Form S-1 (File No. 333-173581) filed by Francesca’s Holdings Corporation on July 14, 2011). | |
| 10.8 + | Francesca’s Holdings Corporation 2011 Equity Incentive Plan - Form of Nonqualified Stock Option Agreement (incorporated by reference to Exhibit 10.14 of Amendment No. 5 to the Registration Statement on Form S-1 (File No. 333-173581) filed by Francesca’s Holdings Corporation on July 14, 2011). | |
| 10.9 + | Francesca’s Holdings Corporation 2011 Equity Incentive Plan - Form of Restricted Stock Award Agreement (incorporated by reference to Exhibit 10.15 of Amendment No. 5 to the Registration Statement on Form S-1 (File No. 333-173581) filed by Francesca’s Holdings Corporation on July 14, 2011). | |
| 10.10 + | Francesca’s Holdings Corporation 2011 Executive Bonus Plan (incorporated by reference to Exhibit 10.16 of Amendment No. 5 to the Registration Statement on Form S-1 (File No. 333-173581) filed by Francesca’s Holdings Corporation on July 14, 2011). | |
| 10.11 + | Amended and Restated Employment Letter Agreement between Francesca’s Holdings Corporation and Kal Malik dated December 28, 2012 (incorporated by reference to Exhibit 10.3 of Form 8-K filed by Francesca’s Holdings Corporation on January 2, 2013). | |
| 10.12 + | Employment Letter Agreement between Francesca’s Holdings Corporation and Sei Jin Alt dated December 28, 2012 (incorporated by reference to Exhibit 10.2 of the Quarterly Report on Form 10-Q filed by Francesca’s Holdings Corporation on June 7, 2013). | |
| 10.13 + | Letter Agreement between Francesca’s Holdings Corporation and Richard J. Emmett, dated as of November 12, 2009 (incorporated by reference to Exhibit 10.23 of Amendment No. 1 to the Registration Statement on Form S-1 (File No. 333-173581) filed by Francesca’s Holdings Corporation on June 14, 2011). | |
| 10.14 + | Amendment to Letter Agreement between Francesca’s Holdings Corporation and Richard J. Emmett, dated as of February 26, 2010 (incorporated by reference to Exhibit 10.24 of Amendment No. 1 to the Registration Statement on Form S-1 (File No. 333-173581) filed by Francesca’s Holdings Corporation on May 24, 2011). | |
| 10.15 | Commercial Park Lease, dated as of December 27, 2011 between Francesca’s Collections, Inc. and Weingarten / Lufkin, Inc. (incorporated by reference to Exhibit 10.32 of the Registration Statement on Form S-1 (File No. 333-179069) filed by Francesca’s Holdings Corporation on January 18, 2012). | |
| 10.16 + | Employment Letter Agreement between Francesca’s Holdings Corporation and Mark Vendetti dated February 6, 2013 (incorporated by reference to Exhibit 10.2 of the Current Report on Form 8-K filed by Francesca’s Holdings Corporation on February 12, 2013). | |
| 10.17 + | Form of Restricted Stock Award Agreement (incorporated by reference to Exhibit 10.1 of the Quarterly Report on Form 10-Q filed by Francesca’s Holdings Corporation on June 11, 2014). |
| 58 |
| Exhibit No. | Description | |
| 10.18 + | Employment Letter Agreement between Francesca’s Holdings Corporation and Michael Barnes dated December 4, 2014 (filed herewith). | |
| 10.19 + | Nonqualified Stock Option Agreement between Francesca’s Holdings Corporation and Michael Barnes dated December 4, 2014 (filed herewith). | |
| 21.1 | Subsidiaries of Francesca’s Holdings Corporation (filed herewith) | |
| 23.1 | Consent of Ernst & Young, independent registered public accountants (filed herewith) | |
| 31.1 | Certification of the Annual Report Pursuant to Section 302 of the Sarbanes-Oxley Act of 2002 by the Chief Executive Officer (filed herewith) | |
| 31.2 | Certification of the Annual Report Pursuant to Section 302 of the Sarbanes-Oxley Act of 2002 by the Chief Financial Officer (filed herewith) | |
| 32.1 | Certification of Annual Report Pursuant to Section 906 of the Sarbanes-Oxley Act of 2002 by the Chief Executive Officer and Chief Financial Officer (filed herewith) | |
| 101 | The following financial information from Francesca’s Holdings Corporation’s Annual Report on Form 10-K for the year ended January 31, 2015, formatted in XBRL (Extensible Business Reporting Language) and furnished electronically herewith: (i) the Consolidated Balance Sheets; (ii) the Consolidated Statements of Operations; (iii) the Consolidated Statements of Changes in Stockholder’s Equity; (iv) Consolidated Statements of Cash Flows; and (v) the Notes to Consolidated Financial Statements. |
+ Indicates a management contract or compensatory plan or arrangement.
| 59 |
SIGNATURES
Pursuant to the requirements of the Section 13 or 15(d) of the Securities Exchange Act of 1934, the Registrant has duly caused this report to be signed on its behalf by the undersigned, thereunto duly authorized on the 27th day of March, 2015.
| FRANCESCA’S HOLDINGS CORPORATION | ||
| By: | /s/ Michael Barnes | |
| Name: Michael Barnes | ||
| Title: Chief Executive Officer | ||
Pursuant to the requirements of the Securities Exchange Act of 1934, this report has been signed by the following persons in the capacities held on the dates indicated.
| Signature | Title | Date | ||
| /s/ Michael Barnes | Chairman, President and Chief Executive Officer | March 27, 2015 | ||
| Michael Barnes | (Principal Executive Officer) | |||
| /s/ Mark Vendetti | Chief Financial Officer | March 27, 2015 | ||
| Mark Vendetti | (Principal Financial and Accounting Officer) | |||
| /s/ Greg Brenneman | Director | March 27, 2015 | ||
| Greg Brenneman | ||||
| /s/ Patricia A. Bender | Director | March 27, 2015 | ||
| Patricia A. Bender | ||||
| /s/ Richard Emmett | Director | March 27, 2015 | ||
| Richard Emmett | ||||
| /s/ Laurie Ann Goldman | Director | March 27, 2015 | ||
| Laurie Ann Goldman | ||||
| /s/ Richard Kunes | Director | March 27, 2015 | ||
| Richard Kunes | ||||
| /s/ Joseph O’Leary | Director | March 27, 2015 | ||
| Joseph O’Leary | ||||
| /s/ Marie Toulantis | Director | March 27, 2015 | ||
| Marie Toulantis | ||||
| /s/ Richard Zannino | Director | March 27, 2015 | ||
| Richard Zannino |
| 60 |