Attached files
| file | filename |
|---|---|
| EXCEL - IDEA: XBRL DOCUMENT - CNL Healthcare Properties, Inc. | Financial_Report.xls |
| EX-31.1 - CERTIFICATION OF CHIEF EXECUTIVE OFFICER - CNL Healthcare Properties, Inc. | d832382dex311.htm |
| EX-32.1 - CERTIFICATION OF CHIEF EXECUTIVE OFFICER AND CHIEF FINANCIAL OFFICER - CNL Healthcare Properties, Inc. | d832382dex321.htm |
| EX-21.1 - SUBSIDIARIES OF THE REGISTRANT - CNL Healthcare Properties, Inc. | d832382dex211.htm |
| EX-31.2 - CERTIFICATION OF CHIEF FINANCIAL OFFICER - CNL Healthcare Properties, Inc. | d832382dex312.htm |
| EX-10.58 - SCHEDULE OF OMITTED DOCUMENTS - CNL Healthcare Properties, Inc. | d832382dex1058.htm |
Table of Contents
UNITED STATES
SECURITIES AND EXCHANGE COMMISSION
Washington, D.C. 20549
FORM 10-K
| x | ANNUAL REPORT PURSUANT TO SECTION 13 OR 15 (d) OF THE SECURITIES EXCHANGE ACT OF 1934 |
For the fiscal year ended December 31, 2014
OR
| ¨ | TRANSITION REPORT PURSUANT TO SECTION 13 OR 15 (d) OF THE SECURITIES EXCHANGE ACT OF 1934 |
For the transition period from to
Commission file number: 000-54685
CNL Healthcare Properties, Inc.
(Exact name of registrant as specified in its charter)
| Maryland | 27-2876363 | |
| (State or other jurisdiction of incorporation or organization) |
(I.R.S. Employer Identification No.) | |
| CNL Center at City Commons 450 South Orange Avenue Orlando, Florida |
32801 | |
| (Address of principal executive offices) | (Zip Code) | |
Registrant’s telephone number, including area code (407) 650-1000
Securities registered pursuant to Section 12(b) of the Act:
| Title of each class |
Name of each exchange on which registered | |
| None | Not applicable |
Securities registered pursuant to Section 12(g) of the Act: Common Stock, $0.01 par value per share
Indicate by check mark if the registrant is a well-known seasoned issuer, as defined in Rule 405 of the Securities Act. Yes ¨ No x
Indicate by check mark if the registrant is not required to file reports pursuant to Section 13 or Section 15(d) of the Act. Yes ¨ No x
Indicate by check mark whether the registrant (1) has filed all reports required to be filed by Section 13 or 15(d) of the Securities Exchange Act of 1934 during the preceding 12 months (or for such shorter period that the registrant was required to file such reports), and (2) has been subject to such filing requirements for the past 90 days. Yes x No ¨
Indicate by check mark whether the registrant has submitted electronically and posted on its corporate Web site, if any, every Interactive Data File required to be submitted and posted pursuant to Rule 405 of Regulation S-T (§232.405 of this chapter) during the preceding 12 months (or for such shorter period that the registrant was required to submit and post such files). Yes x No ¨
Indicate by check mark if disclosure of delinquent filers pursuant to Item 405 of Regulation S-K is not contained herein, and will not be contained, to the best of registrant’s knowledge, in definitive proxy or information statements incorporated by reference in Part III of this Form 10-K or any amendment to this Form 10-K. x
Indicate by check mark whether the registrant is a large accelerated filer, an accelerated filer, a non-accelerated filer, or a smaller reporting company. See the definitions of “large accelerated filer,” “accelerated filer” and “smaller reporting company” in Rule 12b-2 of the Exchange Act.
| Large accelerated filer | ¨ | Accelerated filer | ¨ | |||
| Non-accelerated filer | x (Do not check if a smaller reporting company) | Smaller reporting company | ¨ | |||
Indicate by check mark whether the registrant is a shell company (as defined in Rule 12b-2 of the Exchange Act). Yes ¨ No x
There is currently no established public market for the registrant’s shares of common stock. Based on the $10.14 offering price of the shares in effect on June 30, 2014 (the last business day of the registrant’s most recently completed second fiscal quarter), the aggregate market value of the stock held by non-affiliates of the registrant on such date was $788.8 million.
The number of shares of common stock of the registrant outstanding as of March 18, 2015 was 133,533,876.
DOCUMENTS INCORPORATED BY REFERENCE
Registrant incorporates by reference portions of the CNL Healthcare Properties, Inc.
Definitive Proxy Statement for the 2015 Annual Meeting of Stockholders
(Items 10, 11, 12, 13 and 14 of Part III) to be filed no later than
April 30, 2015.
Table of Contents
| Page | ||||||||
| Part I. |
||||||||
| 3 | ||||||||
| Item 1. |
4 | |||||||
| Item 1A. |
15 | |||||||
| Item 1B. |
51 | |||||||
| Item 2. |
52 | |||||||
| Item 3. |
57 | |||||||
| Item 4. |
57 | |||||||
| Part II. |
||||||||
| Item 5. |
58 | |||||||
| Item 6. |
64 | |||||||
| Item 7. |
Management’s Discussion and Analysis of Financial Condition and Results of Operations |
66 | ||||||
| Item 7A. |
90 | |||||||
| Item 8. |
91 | |||||||
| Item 9. |
Changes in and Disagreements With Accountants on Accounting and Financial Disclosure |
146 | ||||||
| Item 9A. |
146 | |||||||
| Item 9B. |
146 | |||||||
| Part III. |
||||||||
| Item 10. |
147 | |||||||
| Item 11. |
147 | |||||||
| Item 12. |
Security Ownership of Certain Beneficial Owners and Management and Related Stockholder Matters |
147 | ||||||
| Item 13. |
Certain Relationships and Related Transactions, and Director Independent |
147 | ||||||
| Item 14. |
147 | |||||||
| Part IV. |
||||||||
| Item 15. |
148 | |||||||
| 157 | ||||||||
| 159 | ||||||||
| 160 | ||||||||
| 166 | ||||||||
Table of Contents
PART I
STATEMENT REGARDING FORWARD LOOKING INFORMATION
Statements contained under “Management’s Discussion and Analysis of Financial Condition and Results of Operations” and elsewhere in this Annual Report on Form 10-K for the fiscal year ended December 31, 2014 (this “Annual Report”) that are not statements of historical or current fact may constitute “forward-looking statements” within the meaning of the Federal Private Securities Litigation Reform Act of 1995. The Company intends that such forward-looking statements be subject to the safe harbor created by Section 21E of the Securities Exchange Act of 1934, as amended (the “Exchange Act”). Forward-looking statements are statements that do not relate strictly to historical or current facts, but reflect management’s current understandings, intentions, beliefs, plans, expectations, assumptions and/or predictions regarding the future of the Company’s business and its performance, the economy, and other future conditions and forecasts of future events and circumstances. Forward-looking statements are typically identified by words such as “believes,” “expects,” “anticipates,” “intends,” “estimates,” “plans,” “continues,” “pro forma,” “may,” “will,” “seeks,” “should,” “could” and words and terms of similar substance in connection with discussions of future operating or financial performance, business strategy and portfolios, projected growth prospects, cash flows, costs and financing needs, legal proceedings, amount and timing of anticipated future distributions, estimates of per share net asset value of the Company’s common stock, and/or other matters. The Company’s forward-looking statements are not guarantees of future performance. While the Company’s management believes its forward-looking statements are reasonable, such statements are inherently susceptible to uncertainty and changes in circumstances. As with any projection or forecast, forward-looking statements are necessarily dependent on assumptions, data and/or methods that may be incorrect or imprecise, and may not be realized. The Company’s forward-looking statements are based on management’s current expectations and a variety of risks, uncertainties and other factors, many of which are beyond the Company’s ability to control or accurately predict. Although the Company believes that the expectations reflected in such forward-looking statements are based upon reasonable assumptions, the Company’s actual results could differ materially from those set forth in the forward-looking statements due to a variety of risks, uncertainties and other factors. Given these uncertainties, the Company cautions you not to place undue reliance on such statements.
For further information regarding risks and uncertainties associated with the Company’s business, and important factors that could cause the Company’s actual results to vary materially from those expressed or implied in its forward-looking statements, please refer to the factors listed and described under “Management’s Discussion and Analysis of Financial Condition and Results of Operations” and the “Risk Factors” sections of the Company’s documents filed from time to time with the U.S. Securities and Exchange Commission, including, but not limited to, this Annual Report and the Company’s quarterly reports on Form 10-Q, copies of which may be obtained from the Company’s website at www.cnlhealthcareproperties.com.
All written and oral forward-looking statements attributable to the Company or persons acting on its behalf are qualified in their entirety by this cautionary note. Forward-looking statements speak only as of the date on which they are made, and the Company undertakes no obligation to, and expressly disclaims any obligation to, publicly release the results of any revisions to its forward-looking statements to reflect new information, changed assumptions, the occurrence of unanticipated subsequent events or circumstances, or changes to future operating results over time, except as otherwise required by law.
3
Table of Contents
| Item 1. | BUSINESS |
General
CNL Healthcare Properties, Inc. is a Maryland corporation incorporated on June 8, 2010 that qualified as a real estate investment trust (“REIT”) beginning with the year ended December 31, 2012 for U.S. federal income tax purposes. The terms “us,” “we,” “our,” “Company” and “CNL Healthcare Properties” include CNL Healthcare Properties, Inc. and each of its subsidiaries.
We are externally managed and advised by CNL Healthcare Corp. (our “Advisor”). Our Advisor is responsible for managing our day-to-day affairs and for identifying and making acquisitions and investments on our behalf. We have also retained CNL Healthcare Manager Corp. (our “Property Manager”) to manage our properties under a six year property management agreement, which goes until June 8, 2017.
We had no operations prior to the commencement of our initial public offering on June 27, 2011 (the “Initial Offering”). The net proceeds from our public offerings are contributed to CHP Partners, LP, our limited partnership, in exchange for partnership interests. Substantially all of our assets are held by, and all operations are conducted through, the limited partnership.
Our offices are located at 450 South Orange Avenue within the CNL Center at City Commons in Orlando, Florida, 32801, and our telephone number is (407) 650-1000.
Investment Objectives and Strategy
Our primary investment objectives are to invest in a diversified portfolio of assets that will allow us to:
| • | provide stockholders with attractive and stable cash distributions; |
| • | preserve, protect and grow stockholders’ invested capital; |
| • | explore liquidity opportunities in the future, such as the sale of either the Company or our assets, potential merger, or the listing of our common shares on a national securities exchange. |
There can be no assurance that we will be able to achieve our investment objectives.
Our investment focus is on acquiring a diversified portfolio of healthcare real estate or real estate-related assets, primarily in the United States, within the senior housing, medical office, post-acute care and acute care asset classes. The types of senior housing that we may acquire include active adult communities (age-restricted and age-targeted housing), independent and assisted living facilities, continuing care retirement communities, and memory care facilities. The types of medical office facilities that we may acquire include medical office buildings, specialty medical and diagnostic service facilities, surgery centers, outpatient rehabilitation facilities, and other facilities designed for clinical services. The types of post-acute care facilities that we may acquire include skilled nursing facilities, long-term acute care hospitals and inpatient rehabilitative facilities. The types of acute care facilities that we may acquire include general acute care hospitals and specialty surgical hospitals. We view, manage and evaluate our portfolio homogeneously as one collection of healthcare assets with a common goal of maximizing revenues and property income regardless of the asset class or asset type.
We are committed to investing the proceeds of our Offering through strategic investment types aimed to maximize stockholder value by generating sustainable cash flow growth and increasing the value of our healthcare assets. We expect to primarily lease senior housing properties to wholly-owned taxable REIT subsidiaries (“TRS”) and engage independent third-party managers under management agreements to operate the properties as permitted under the REIT Investment Diversification and Empowerment Act of 2007 (“RIDEA”); however, we may also lease our properties to third-party tenants under triple-net or similar lease structures, where the tenant bears all or substantially all of the costs (including cost increases, for real estate taxes, utilities, insurance and ordinary repairs). Medical office, post-acute care and acute care properties will be leased on a triple-net, net or modified gross basis to third-party tenants. In addition, we expect most investments will be wholly owned, although, we have and may continue to invest through partnerships with other entities where we believe it is appropriate and beneficial. We have and
4
Table of Contents
may continue to invest in new property developments or properties which have not reached full stabilization. Finally, we also may invest in and originate mortgage, bridge or mezzanine loans or in entities that make investments similar to the foregoing investment types. We generally make loans to the owners of properties to enable them to acquire land, buildings, or to develop property. In exchange, the owner generally grants us a first lien or collateralized interest in a participating mortgage collateralized by the property or by interests in the entity that owns the property.
Portfolio Overview
We believe recent demographic trends and compelling supply and demand indicators present a strong case for an investment focus on the acquisition of healthcare real estate or real estate-related assets. We believe that the healthcare sector will continue to provide attractive opportunities as compared to other asset sectors over the long-term. Our healthcare investment portfolio is geographically diversified with properties in 29 states. The map below shows our current property allocations across geographic regions as of March 18, 2015:
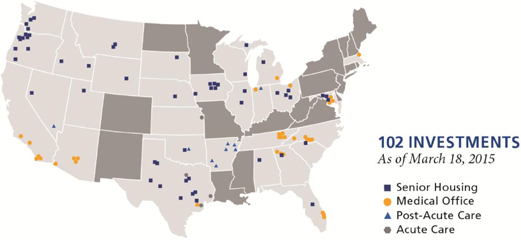
As of March 18, 2015, our healthcare investment portfolio consisted of interests in 102 properties, including 55 senior housing communities, 34 medical offices, nine post-acute care facilities and four acute care hospitals. Of our properties held at March 18, 2015, four of our 55 senior housing communities currently have real estate under development and five were owned through an unconsolidated joint venture. The following table summarizes our healthcare portfolio by asset class and investment structure as of March 18, 2015:
| Type of Investment |
Number of Investments |
Amount of Investments (in millions) |
Percentage of Total Investments |
|||||||||
| Consolidated investments: |
||||||||||||
| Senior housing leased (1) |
10 | $ | 157.1 | 7.8 | % | |||||||
| Senior housing managed (2) |
36 | 884.3 | 44.1 | % | ||||||||
| Senior housing developments (3) |
4 | 47.1 | 2.3 | % | ||||||||
| Medical office leased (1) |
34 | 641.8 | 32.0 | % | ||||||||
| Post-acute care leased (1) |
9 | 124.3 | 6.2 | % | ||||||||
| Acute care leased (1) |
4 | 122.1 | 6.1 | % | ||||||||
| Unconsolidated investments: |
||||||||||||
| Senior housing managed (4) |
5 | 31.1 | 1.5 | % | ||||||||
|
|
|
|
|
|
|
|||||||
| 102 | $ | 2,007.8 | 100.0 | % | ||||||||
|
|
|
|
|
|
|
|||||||
5
Table of Contents
FOOTNOTES:
| (1) | Properties that are leased to third-party tenants for which we report rental income from operating leases. |
| (2) | Senior housing communities that are leased to TRS entities and managed pursuant to third-party management contracts (i.e. RIDEA structure) where we report resident fees and services, and the corresponding property operating expenses. |
| (3) | Investments herein represent funded and accrued development costs as of December 31, 2014. |
| (4) | Properties that are owned through an unconsolidated joint venture and are leased to TRS entities and managed pursuant to third-party management contracts (i.e. RIDEA structure). The joint venture is accounted for using the equity method. |
Portfolio Evaluation
We monitor the performance of our tenants and third party operators to stay abreast of any material changes in the operations of the underlying properties by (1) reviewing the current, historical and prospective operating margins (measured by a tenant’s earnings before interest, taxes, depreciation, amortization and facility rent), (2) monitoring trends in the source of our tenants’ revenue, including the relative mix of public payors (including Medicare, Medicaid, etc.) and private payors (including commercial insurance and private pay patients), (3) evaluating the effect of evolving healthcare legislation and other regulations on our tenants’ profitability and liquidity, and (4) reviewing the competition and demographics of the local and surrounding areas in which the tenants operate.
In addition to operating statistics of the underlying properties, when evaluating the performance of our healthcare portfolio within the senior housing and post-acute care asset classes, management reviews occupancy levels and monthly revenue per occupied unit (“RevPOU”), which we define as total revenue divided by average number of occupied units or beds during a month and is considered a performance metric within these asset classes. Similarly, within the medical office and acute care asset classes, management reviews operating statistics of the underlying properties, including occupancy levels and monthly revenue per square foot. Lastly, when evaluating the performance of our third party operators or developers, management reviews monthly financial statements, property level operating performance versus budgeted expectations, conducts periodic operational review calls with operators and conducts periodic property inspections or site visits. All of the aforementioned metrics assist us in determining the ability of our properties or operators to achieve market rental rates, to assess the overall performance of our diversified healthcare portfolio, and to review compliance with leases, debt, licensure, real estate taxes, and other collateral.
Furthermore, in our evaluation of the properties that we have purchased and additional properties that we expect to purchase, we consider the operating stage of the investments within the following stages: development, value-add or stabilizing and stabilized. Development properties are those in which we or our joint venture have purchased land for the development of new operating properties. We typically hold rights as the owner or managing member of the development properties while a third-party or our joint venture partner manages the development, construction and certain day-to-day operations of the property subject to our oversight. Stabilizing properties are either developed properties that have been fully constructed and in lease-up phase (typically 18 months post-construction) or existing (“value-add”) properties in which we expect to make capital investments to upgrade or expand. A property is considered stabilized upon the earlier of (i) when the property reaches 85% occupancy for a trailing three month period, or (ii) a two year period from acquisition or completion of development. For those assets that are above an 85% occupancy level and subsequently drop below 85%, they are reclassified to stabilizing until they hit the trailing three month 85% occupancy metric.
We have increased the level of our investment in new ground-up development and value-add or stabilizing properties. During the construction and lease up phase, these types of investments are expected to generate limited cash flows from operations and may result in near term downward pressure on our net asset valuation. However, we believe that investing a portion of our capital into these types of properties is beneficial because they are expected to provide a higher yield on cost and higher net asset valuations in the long-term as compared to stabilized acquisitions. Additionally, these types of assets will result in our portfolio having a lower average age, which we believe will enhance our overall market value over the long-term.
6
Table of Contents
Based on revenues as of December 31, 2014, the Company’s portfolio is comprised of 69.2% stabilized properties and 30.8% value-add or stabilizing properties, of which 2.4% are recently completed developments that are currently in the lease-up phase.
The following table lists our occupancy, RevPOU and revenue per square feet by asset class within our healthcare portfolio as of December 31, 2014:
| Operating Stage |
Occupancy % | RevPOU | Rent per Square Foot |
|||||||||
| Value-add or Stabilizing: |
||||||||||||
| Senior Housing |
69.8 | % | $ | 3,595 | $ | — | ||||||
|
|
|
|
|
|
|
|||||||
| Medical Office |
77.6 | % | $ | — | $ | 2.45 | ||||||
|
|
|
|
|
|
|
|||||||
| Stabilized: |
||||||||||||
| Senior Housing |
91.0 | % | $ | 4,280 | $ | — | ||||||
|
|
|
|
|
|
|
|||||||
| Medical Office |
94.0 | % | $ | — | $ | 3.01 | ||||||
|
|
|
|
|
|
|
|||||||
| Acute Care |
100.0 | % | $ | — | $ | 4.51 | ||||||
|
|
|
|
|
|
|
|||||||
| Post-Acute Care (1) |
99.9 | % | $ | 6,888 | $ | 2.67 | ||||||
|
|
|
|
|
|
|
|||||||
FOOTNOTE:
| (1) | Post-acute care is comprised of skilled nursing facilities, which are evaluated based on RevPOU, and inpatient rehabilitation hospitals, which are evaluated based on revenue per square feet. |
Real Estate Under Development
As of March 18, 2015, we had interests in four senior housing developments that will provide us with 480 additional units upon completion as follows:
| Property Name (and Location) |
Developer | Number of Units Upon Completion |
Development Costs Incurred (in millions) (1) |
Remaining Development Budget (in millions) (2) |
Maximum Construction Loans (in millions) |
Estimated Completion Date | ||||||||||||||||
| Wellmore of Tega Cay (Tega Cay, SC) |
Maxwell Group, Inc. | 104 units | $ | 22.2 | $ | 18.3 | $ | 26.3 | 3rd quarter 2015 | |||||||||||||
| HarborChase of Shorewood (Shorewood, WI) |
|
Harbor Shorewood Development, LLC |
|
94 units | 9.3 | 17.2 | 16.7 | 4th quarter 2015 | ||||||||||||||
| Watercrest at Katy (Katy, TX) (3) |
South Bay Partners, Ltd | 210 units | 8.6 | 30.9 | 26.7 | 1st quarter 2016 | ||||||||||||||||
| Raider Ranch (Lubbock, TX) |
South Bay Partners, Ltd | 72 units | 7.0 | 10.0 | 9.7 | 1st quarter 2016 | ||||||||||||||||
|
|
|
|
|
|
|
|
|
|||||||||||||||
| Total | 480 units | $ | 47.1 | $ | 76.4 | $ | 79.4 | |||||||||||||||
|
|
|
|
|
|
|
|
|
|||||||||||||||
FOOTNOTES:
| (1) | This amount represents land and total capitalized costs for generally accepted accounting principles (“GAAP”) purposes for the acquisition, development and construction of the senior housing community as of December 31, 2014. Amounts include investment services fees, asset management fees, interest expense and other costs capitalized during the development period. |
| (2) | This amount includes preleasing and marketing costs which will be expensed as incurred. |
| (3) | This property is owned through a joint venture in which the Company’s initial ownership interest is 95%. |
The development budgets of the senior housing developments include the cost of the land, construction costs, development fees, financing costs, start-up costs and initial operating deficits of the respective properties. An affiliate of the developer of the respective community coordinates and supervises the management and administration of the development and construction. Each developer is responsible for any cost overruns beyond the approved development budget for the applicable project.
7
Table of Contents
Significant Tenants and Operators
Our real estate portfolio is operated by a mix of national or regional operators and the following represent the significant tenants and operators that lease or manage 5% or more of our rentable space as of December 31, 2014:
| Tenants and Operators |
Number of Tenants / Properties |
Rentable Square Feet (in thousands) |
Percentage of Rentable Square Feet |
Lease / Operator Expiration Year | ||||||||||
| Tenants |
||||||||||||||
| TSMM Management, LLC |
10 | 945 | 27.4 | % | 2022 | |||||||||
| Senior Living Centers |
6 | 261 | 7.6 | % | 2023 | |||||||||
| Novant Medical Group, Inc. |
30 | 185 | 5.4 | % | 2025 | |||||||||
| Other tenants (1) |
372 | 2,061 | 59.6 | % | 2015-2033 | |||||||||
|
|
|
|
|
|
|
|||||||||
| Tenants Total |
418 | 3,452 | 100.0 | % | ||||||||||
|
|
|
|
|
|
|
|||||||||
| Operators (2) |
||||||||||||||
| Integrated Senior Living, LLC |
5 | 1,319 | 32.4 | % | 2024 | |||||||||
| Prestige Senior Living, LLC |
13 | 895 | 22.0 | % | 2019 | |||||||||
| MorningStar Senior Management, LLC |
4 | 834 | 20.5 | % | 2018 | |||||||||
| Harbor Retirement Associates, LLC |
3 | 246 | 6.0 | % | 2018 - 2023 | |||||||||
| Jerry Erwin Associates, Inc. |
4 | 235 | 5.8 | % | 2019 | |||||||||
| Generations - UT, LLC |
1 | 229 | 5.6 | % | 2019 | |||||||||
| Capital Health Managers |
5 | 225 | 5.5 | % | 2017 | |||||||||
| Trinity Lifestyles Management II, LLC |
1 | 87 | 2.2 | % | 2019 | |||||||||
|
|
|
|
|
|
|
|||||||||
| Operators Total |
36 | 4,070 | 100.0 | % | ||||||||||
|
|
|
|
|
|
|
|||||||||
FOOTNOTES:
| (1) | Comprised of various tenants each of which comprise less than 5% of our rentable square footage. |
| (2) | Represent third-party managers that operate our senior housing communities under the RIDEA structure. |
While we are not directly impacted by the performance of the underlying properties leased to third party tenants, we believe that the financial and operational performance of our tenants provides an indication about the health of our tenants and their ability to pay rent. To the extent that our tenants, managers or joint venture partners experience operating difficulties and become unable to generate sufficient cash to make rent payments to us, there could be a material adverse impact on our consolidated results of operations, liquidity and/or financial condition. Our tenants and managers are contractually required to provide this information to us in accordance with their respective lease, management and joint venture agreements. Therefore, in order to mitigate the aforementioned risk, we monitor our investments through a variety of methods determined by the type of property.
We monitor the credit of our tenants to stay abreast of any material changes in quality. We monitor tenant credit quality by (1) reviewing financial statements that are publicly available or that are required to be delivered to us under the applicable lease, (2) direct interaction with onsite property managers, (3) monitoring news and rating agency reports regarding our tenants (or their parent companies) and their underlying businesses, (4) monitoring the timeliness of rent collections and (5) monitoring lease coverage.
8
Table of Contents
Tenant Lease Expirations
As of December 31, 2014, we owned 55 properties that were leased to tenants on a triple-net, net or modified gross basis, and accounted for as operating leases. During the year ended December 31, 2014, our rental revenues from operating leases represented approximately 27.2% of our total revenues. As of December 31, 2014, approximately 69.7% of our rental revenues from operating leases were scheduled to expire in 2019 or later. We do not expect lease turnover or any increases in property operating expenses to have a significant impact on our cash flow from operations in the near term.
Our asset management team collaborates with existing tenants to understand their current and anticipated space needs in advance of their lease term renewal date. As of December 31, 2014, approximately 30.3% of our rental revenues from operating leases were scheduled to expire through 2018. We work with and begin lease-related negotiations well in advance of the lease expirations or renewal period options in order for us to maintain a balanced lease rollover schedule and high occupancy levels, as well as to enhance the value of our properties through extended lease terms. Lease extensions are likely to create an obligation to pay lease commissions, lease incentives and/or tenant improvements and may also provide our tenants with some periods of reduced and/or “free rent.” Although modifications to leases could adversely impact our cash from operations in the near term, we anticipate that any extensions of existing lease terms could increase the value of our properties. Also, certain amendments or modifications to the terms of existing leases could require lender approval.
Under the terms of our triple-net lease agreements, each tenant is responsible for the payment of property taxes, general liability insurance, utilities, repairs and maintenance, including structural and roof expenses (“Triple-net Lease”). Each tenant is expected to pay real estate taxes directly to taxing authorities. However, if the tenant does not pay, we will be liable.
Under the terms of our net, modified gross or similar lease agreements for multi-tenant properties with third-party property managers, each tenant is responsible for the payment of their proportionate share of property taxes, general liability insurance, utilities, repairs and common area maintenance (“Modified Lease”). These amounts are billed monthly and recorded as tenant reimbursement income in the accompanying consolidated statements of operations.
The following table lists, on an aggregate basis, scheduled expirations for the next 10 years ending December 31st and thereafter on our consolidated healthcare investment portfolio (excludes real estate under development), assuming that none of the tenants exercise any of their renewal options (in thousands, except for number of tenants and percentages) as of December 31, 2014:
| Year of Expiration (1) |
Number of Tenants |
Expiring Rentable Square Feet |
Expiring Annualized Base Rents (2) |
Percentage of Expiring Annual Base Rents |
||||||||||||
| 2015 |
74 | 259 | $ | 6,498 | 8.5 | % | ||||||||||
| 2016 |
48 | 178 | 4,463 | 5.8 | % | |||||||||||
| 2017 |
45 | 198 | 4,936 | 6.4 | % | |||||||||||
| 2018 |
74 | 310 | 7,437 | 9.6 | % | |||||||||||
| 2019 |
55 | 249 | 6,596 | 8.5 | % | |||||||||||
| 2020 |
20 | 168 | 4,106 | 5.3 | % | |||||||||||
| 2021 |
11 | 84 | 2,002 | 2.6 | % | |||||||||||
| 2022 |
15 | 983 | 13,626 | 17.7 | % | |||||||||||
| 2023 |
55 | 602 | 15,769 | 20.4 | % | |||||||||||
| 2024 |
4 | 54 | 1,561 | 2.0 | % | |||||||||||
| Thereafter |
17 | 367 | 10,176 | 13.2 | % | |||||||||||
|
|
|
|
|
|
|
|
|
|||||||||
| Total |
418 | 3,452 | $ | 77,170 | 100.0 | % | ||||||||||
|
|
|
|
|
|
|
|
|
|||||||||
| Weighted Average Remaining Lease Term: (3) |
|
7.2 years | ||||||||||||||
9
Table of Contents
FOOTNOTES:
| (1) | Represents current lease expiration and does not take into consideration lease renewals available under existing leases at the option of the tenants. |
| (2) | Represents the current base rent, excluding tenant reimbursements and the impact of future rent bumps included in leases, multiplied by 12 and included in the year of expiration. |
| (3) | Weighted average remaining lease term is the average remaining term weighted by annualized current base rents. |
Share Price Valuation
We have adopted a valuation policy designed to follow recommendations of the Investment Product Association (“IPA”), in the IPA Practice Guideline 2013-01, Valuations of Publicly Registered Non-Listed REITs, which was adopted by the IPA effective May 1, 2013 (“IPA Valuation Guideline”). The purpose of our valuation policy is to establish guidelines to be followed in determining the net asset value per share of our common stock for regulatory and investor reporting and on-going evaluation of investment performance. Net asset value (“NAV”) means the fair value of real estate, real estate-related investments and all other assets less the fair value of total liabilities. Our NAV will be determined based on the fair value of our assets less liabilities under market conditions existing as of the time of valuation and assuming the allocation of the resulting net value among our stockholders after any adjustments for incentive, preferred or special interests, if applicable.
In accordance with our policy, the audit committee of our board of directors, comprised of our independent directors (“Valuation Committee”), oversees our valuation process and engages one or more third-party valuation advisors to assist in the process of determining the NAV per share of our common stock.
To assist our board of directors in its determination of the offering price per share of our common stock for our Offering, our board of directors engaged an independent valuation firm, CBRE Capital Advisors, Inc. (“CBRE Cap”) to provide property level and aggregate valuation analyses of the Company and a range for the net asset value per share of our common stock and to consider other information provided by our Advisor.
Our NAV per share was $9.52 as of September 30, 2014. In accordance with our valuation policy and as recommended by the IPA Valuation Guideline, we expect to produce an estimated NAV per share at least annually as of September 30 and disclose such amount as soon as possible after quarter end. However, the next valuation may be deferred, in the sole discretion of our board of directors, until after December 31, 2015.
For a detailed discussion of the determination of the offering price for our Offering and NAV per share of our common stock, including our valuation process and methodology, see Item 5. “Market For Registrant’s Common Equity, Related Stockholder Matters And Issuer Purchases Of Equity Securities—Determination of Estimated Net Asset Value per Share as of September 30, 2014 and Offering Price.”
Common Stock Offerings
On June 27, 2011, we commenced our Initial Offering, including shares being offered through our distribution reinvestment plan (“Reinvestment Plan”), pursuant to a registration statement on Form S-11 under the Securities Act of 1933 with the Securities and Exchange Commission (“SEC”). Upon commencement of the Initial Offering, the shares were offered at $10.00 per share, or $9.50 per share pursuant to the Reinvestment Plan. Effective December 11, 2013, our board of directors determined the new offering price for our shares to be $10.14 per share, or $9.64 per share pursuant to the Reinvestment Plan, based on our then-current NAV per share. Effective November 4, 2014, our board of directors determined the new offering price for our shares to be $10.58 per share, or $10.06 per share pursuant to the Reinvestment Plan, based on our updated NAV per share. In addition, we filed a follow-on registration statement on Form S-11 under the Securities Act of 1933 with the SEC in connection with the proposed offering of up to $1 billion in shares of common stock (“Follow-On Offering”), which was declared effective on February 2, 2015. We expect to sell shares of our common stock in the Follow-On Offering until the earlier of the date on which the maximum offering amount has been sold, or December 31, 2015; provided, however, that we will periodically evaluate the status of the Follow-On Offering, and our board of directors may extend the Follow-On Offering beyond December 31, 2015 after taking into account such factors as it deems appropriate, including but not limited to, the amount of capital raised, future acquisition opportunities, and economic or market trends.
10
Table of Contents
As of December 31, 2014 and December 31, 2013, we had received aggregate offering proceeds of approximately $1.1 billion (113.0 million shares) and $568.9 million (57.0 million shares), respectively, including approximately $27.1 million (2.8 million shares) and $9.4 million (1.0 million shares), respectively, received through our Reinvestment Plan. The shares sold and the gross offering proceeds received from such sales do not include 22,222 shares purchased by our Advisor for $200,000 preceding the commencement of the Initial Offering.
Distribution Policy
In order to qualify as a REIT, we are required to make distributions, other than capital gain distributions, to our stockholders each year in the amount of at least 90% of our REIT taxable income. We may make distributions in the form of cash or other property, including distributions of our own securities. Our Advisor, its affiliates or other related parties may defer or waive asset management fees, property management fees, expense reimbursements or other fees in order for us to have cash to pay distributions in excess of available cash flow from operating activities or funds from operations. Until we have sufficient cash flow from operating activities or funds from operations, we have decided and may continue to make stock distributions or to fund all or a portion of the payment of distributions from other sources; such as from cash flows generated by financing activities, a component of which includes our borrowings, whether collateralized by our assets or unsecured, and the proceeds of our public offerings, whether our Initial Offering or our Follow-On Offering (collectively, the “Offerings”).
On July 29, 2011, our board of directors authorized a distribution policy providing for monthly cash distributions of $0.03333 (which was equal to an annualized distribution rate of 4% based on our initial $10.00 share price) together with stock distributions of 0.00250 shares of common stock (which is equal to an annualized distribution rate of 3% on our initial $10.00 share price) for a total annualized distribution of 7% on each outstanding share of common stock payable to all common stockholders of record as of the close of business on the first business day of each month. Our board authorized a policy providing for distributions of cash and stock rather than solely of cash in order to retain cash for investment opportunities and to allow the Company to invest in new developments or newer value-add properties which have not yet reached stabilized occupancy, which we believe may result in higher value over our holding period.
In December 2013, in connection with the determination of our estimated NAV per share, our board of directors determined to increase the amount of monthly cash distributions to $0.03380 per share and together with monthly stock distributions of 0.00250 shares of common stock payable to all common stockholders of record as of the close of business on January 1, 2014.
In October 2014, in connection with the determination of our estimated NAV per share, our board of directors increased the amount of monthly cash distributions to $0.0353 per share together with monthly stock distributions of 0.0025 shares of common stock payable to all common stockholders of record as of the close of business on the first business day of each month beginning December 1, 2014. This change allows us to maintain our historical annual distribution rate of 4% in cash (based on the current $10.58 offering price) and 3% in stock (based on three shares for each 100 outstanding shares of common stock). The change will remain in effect until our board of directors determines otherwise. Our board of directors may increase the proportion of distributions paid in cash as our asset base grows and our cash flows increase. We anticipate that our stock dividend will be discontinued at or around the time in which our Follow-on Offering is closed, subject to the discretion of our board of directors.
The amount of distributions declared to our stockholders will be determined by our board of directors and is dependent upon a number of factors, including:
| • | Sources of cash available for distribution such as current year and inception to date cumulative cash flows from operating activities, Funds from Operations (“FFO”) and Modified Funds from Operations (“MFFO”), as well as, expected future long-term stabilized cash flows, FFO and MFFO; |
| • | The proportion of distributions paid in cash compared to the amount being reinvested through our Reinvestment Plan; |
11
Table of Contents
| • | Limitations and restrictions contained in the terms of our current and future indebtedness concerning the payment of distributions; and |
| • | Other factors, including but not limited to, the avoidance of distribution volatility, our objective of continuing to qualify as a REIT, capital requirements, the general economic environment and other factors. |
Distributions will be paid quarterly and will be calculated for each stockholder as of the first day of each month the stockholder has been a stockholder of record in such quarter. The cash portion of such distribution will be payable and the distribution of shares will be issued on or before the last day of the applicable quarter; however, in no circumstance will the cash distribution and the stock distribution be paid on the same day. Fractional shares of common stock accruing as distributions will be rounded to the nearest hundredth when issued on the distribution date. Declarations of distributions pursuant to this policy began on the first day of November 2011 and will continue on to be paid each calendar quarter thereafter as set forth above until such policy is terminated or amended by our board of directors.
Borrowings
We have borrowed, and intend to borrow, funds to acquire properties, make loans and other permitted investments and to pay certain related fees. We may borrow money to pay distributions to stockholders, for working capital and for other corporate purposes. We also intend to encumber assets in connection with such borrowings and are subject to certain customary covenants and limitations in connection with our borrowings. The aggregate amount of long-term financing is not expected to exceed 60% of our total assets on an annual basis.
There is no limitation on the amount we may invest in any single property or other asset or on the amount we can borrow for the purchase of any individual property or other investment. Our board of directors has adopted a policy to generally limit our aggregate borrowings to approximately 75% of the aggregate value of our assets, unless substantial justification exists that borrowing a greater amount is in our best interests. Our intent is to target our aggregate borrowings ranging from 40% to 60% of the aggregate value of our assets once we own a seasoned and stable asset portfolio, although initially our aggregate borrowings may be greater than 60% of the aggregate value of our assets. Under our articles of incorporation, the maximum amount of our indebtedness cannot exceed 300% of our “net assets,” as defined by the Statement of Policy Regarding Real Estate Investment Trusts adopted by the North American Securities Administrators Association on May 7, 2007 (the “NASAA REIT Guidelines”) as of the date of any borrowing unless any excess borrowing is approved by a majority of our independent directors and is disclosed to stockholders in our next quarterly report, together with a justification for the excess. As of December 31, 2014 and December 31, 2013, we had an aggregate debt leverage ratio of approximately 53.3% and 52.9%, respectively, of the aggregate carrying value of our assets.
Competition
The current market for healthcare real estate is highly competitive as is the leasing market for such properties. We compete for investments and financing with many other entities engaged in real estate investment activities, including individuals, corporations, bank and insurance company investment accounts, REITs, real estate limited partnerships, many of which will have greater resources and lower costs of capital than we do. The level of competition impacts both our ability to raise capital, find investments and locate suitable tenants. We may also compete with affiliates to acquire properties and other investments.
Our tenants and operators compete with other properties that provide comparable services in their local markets. Tenants and operators compete for patients, tenants and residents based on a variety of factors including, but not limited to: quality of care, reputation, location, services offered, physician groups, staff and price. We also face competition from other properties for tenants or residents, such as physicians and other health care providers that provide comparable facilities and services.
Employees
We are externally managed and as such we do not have any employees.
12
Table of Contents
Financial Information about Industry Segments
We have determined that we operate in one business segment, real estate ownership, which consists of owning, managing, leasing, acquiring, developing, investing in, and as conditions warrant, disposing of real estate assets. We internally evaluate all of our real estate assets as one operating segment and, accordingly, we do not report segment information.
Tax Status
We elected to be taxed as a REIT under the Internal Revenue Code (“Code”) beginning with our taxable year ending December 31, 2012. To qualify as a REIT, we must meet certain organizational and operational requirements, including a requirement to distribute to stockholders at least 90% of our annual REIT taxable income (which is computed without regard to the dividends-paid deduction or net capital gain and which does not necessarily equal net income as calculated in accordance with GAAP). As a REIT, we generally will not be subject to U.S. federal income tax on income that we distribute as dividends to our stockholders. If we fail to qualify as a REIT in any taxable year, we will be subject to U.S. federal income tax on our taxable income at regular corporate income tax rates and generally will not be permitted to qualify for treatment as a REIT for federal income tax purposes for the four taxable years following the year during which qualification is lost, unless the Internal Revenue Service grants us relief under certain statutory provisions. Such an event could materially adversely affect our net income and net cash available for distribution to stockholders. However, we believe that we are organized and will operate in such a manner as to qualify for treatment as a REIT. Notwithstanding our intent to be treated as a REIT, we may be subject to U.S. federal, state, or local taxes if our TRS entities have taxable income in any given year.
Advisor
Our Advisor has responsibility for our day-to-day operations, administering our accounting functions, serving as our consultant in connection with policy decisions to be made by our board of directors, and identifying and making acquisitions and investments on our behalf. In exchange for these services, our Advisor is entitled to receive certain fees from us.
Our Advisor and its affiliates are entitled to reimbursement of certain costs incurred on our behalf in connection with our organization, our Offerings, acquisitions, and operating activities. To the extent that operating expenses payable or reimbursable by us in any four consecutive fiscal quarters (“Expense Year”), commencing with the Expense Year ending June 30, 2013, exceed the greater of 2% of average invested assets or 25% of net income, the Advisor shall reimburse us, within 60 days after the end of the Expense Year, the amount by which the total operating expenses paid or incurred by us exceed the greater of the 2% or 25% threshold. Notwithstanding the above, we may reimburse the Advisor for expenses in excess of this limitation if a majority of our independent directors determines that such excess expenses are justified based on unusual and non-recurring factors. For the Expense Year ended December 31, 2014, the Company did not incur operating expenses in excess of the limitation.
The current advisory agreement, which was approved by the board of directors on March 4, 2014, continues through June 2015. Our independent directors are required to review and approve the terms of our advisory agreement at least annually.
For additional information on our Advisor, its affiliates or other related parties, as well as the fees and reimbursements we pay, see Item 8. “Financial Statements and Supplementary Data” – Note 11. “Related Party Arrangements.”
13
Table of Contents
Available Information
CNL Financial Group, LLC (our “Sponsor” or “CNL”) maintains a web site at www.cnlhealthcareproperties.com containing additional information about our business, and a link to the SEC web site (www.sec.gov). We make available free of charge on our web site, our Annual Report on Form 10-K, Quarterly Reports on Form 10-Q, Current Reports on Form 8-K, and, if applicable, amendments to those reports filed or furnished pursuant to Section 13(a) or 15(d) of the Securities Exchange Act of 1934, as amended, as soon as reasonably practical after we file such material, or furnish it to, the SEC. You may read and copy any materials we file with the SEC at the SEC’s Public Reference Room at 100 F Street, NE, Washington, DC 20549. You may obtain information on the operation of the Public Reference Room by calling the SEC at 1-800-SEC-0330. The SEC also maintains a web site (www.sec.gov) where you can search for annual, quarterly and current reports, proxy and information statements, and other information regarding us and other public companies.
The contents of our web site are not incorporated by reference in, or otherwise a part of, this report.
14
Table of Contents
| Item 1A. | RISK FACTORS |
Valuation Related Risks
In determining the Company’s estimated net asset value per share, the Company primarily relied upon a valuation of the Company’s portfolio of properties and debt as of September 30, 2014. Valuations and appraisals of the Company’s properties and outstanding debt are estimates of fair value and may not necessarily correspond to realizable value upon the sale of such properties. Therefore, the Company’s estimated net asset value per share may not reflect the amount that would be realized upon a sale of each of the Company’s properties.
For the purposes of calculating the Company’s estimated net asset value per share, the Company retained an investment banking firm as valuation expert to determine the Company’s estimated net asset value per share and the value of the Company’s properties and debt as of September 30, 2014. The valuation methodologies used to estimate the net asset value of the Company’s shares as well as the value of the Company’s properties and outstanding debt, involved certain subjective judgments, including but not limited to, discounted cash flow analyses for wholly owned and partially owned properties. Ultimate realization of the value of an asset depends to a great extent on economic and other conditions beyond the Company’s control and the control of the Company’s Advisor and the Company’s valuation expert. Further, valuations do not necessarily represent the price at which an asset would sell, since market prices of assets can only be determined by negotiation between a willing buyer and seller. Therefore, the valuations of the Company’s properties and the Company’s investments in real estate-related assets may not correspond to the realizable value upon a sale of those assets. Because the price investors will pay for shares in the Company’s offering is primarily based on the Company’s estimated net asset value per share, investors may pay more than realizable value for an investment when investors purchase shares or receive less than realizable value when investors sell their shares.
Company Related Risks
The Company and its Advisor have limited operating histories and there is no assurance the Company will achieve its goals.
The Company and the Advisor have limited operating histories. To be successful, the Advisor must, among other things:
| • | identify and acquire investments that meet the Company’s investment objectives; |
| • | attract, integrate, motivate and retain qualified personnel to manage the Company’s day-to-day operations; |
| • | respond to competition for the Company’s targeted real estate properties and other investments; and |
| • | continue to build and expand its operational structure to support the Company’s business. |
There can be no assurance that the Advisor will succeed in achieving these goals.
The Company has not had sufficient cash available from operations to pay distributions, and, therefore, has paid distributions from the net proceeds of the Company’s offering. The Company may continue to pay distributions from sources other than its cash flow from operations or funds from operations, and any such distributions may reduce the amount of cash the Company ultimately invest in assets, negatively impact the value of the Company’s stockholders’ investment and be dilutive to its stockholders.
Prior to 2013, the Company has generated little, if any, cash flow from operations or funds from operations and does not expect to do so until the Company makes substantial investments. Further, to the extent the Company invests in development or redevelopment projects, or in properties requiring significant capital, the Company’s ability to make cash distributions may be negatively affected, especially during the Company’s early stages of operations. The Company’s organizational documents permit it to make distributions from any source, such as from the proceeds of the Company’s offerings, cash advances to the Company by its Advisor, cash resulting from a deferral or waiver of asset management fees or expense reimbursements, and borrowings, which may be unsecured or secured by the Company’s assets, in anticipation of future net operating cash flow. Accordingly, until such time as the Company is generating
15
Table of Contents
sufficient operating cash flow or funds from operations to support the full distribution, the Company has determined to pay a portion of its distributions from sources other than net operating cash flows. The Company has not established any limit on the extent to which the Company may use alternate sources, including borrowings or proceeds of the Company’s offerings, to pay distributions. Commencing in the fourth fiscal quarter of 2011, the Company has made cash distributions from offering proceeds, which is dilutive to the Company’s stockholders. To the extent the Company makes cash distributions, or a portion thereof, from sources other than operating cash flow or funds from operations, the Company will have less capital available to invest in properties and other real estate-related assets, the book value per share may decline, which might cause the Company to reduce the offering price in this offering or in future offerings, and there will be no assurance that the Company will be able to sustain distributions at that level. Further, distributions that exceed cash flow from operations or funds from operations may not be sustainable. The use of offering proceeds to fund distributions benefits earlier investors who benefit from the investments made with funds raised later in the offering, while later investors may not benefit from all of the net offering proceeds raised from earlier investors. Distributions will be taxable as ordinary income to the stockholders to the extent such distributions are made from the Company’s current and accumulated earnings and profits. In addition, to the extent distributions exceed earnings and profits calculations on a tax basis, a stockholder’s basis in the Company’s stock will be reduced and, to the extent distributions exceed a stockholder’s basis, the stockholder may recognize a capital gain in the future.
There can be no assurance that the Company will be able to achieve expected cash flows necessary to pay or maintain distributions at any particular level or that distributions will increase over time.
There are many factors that can affect the availability and timing of distributions to stockholders. Distributions generally will be based upon such factors as the amount of cash available or anticipated to be available from real estate investments and investments in real estate-related securities, mortgage or other loans and assets, current and projected cash requirements and tax considerations. Distributions may be limited in whole or in part by covenants of the Company’s revolving credit facilities or other loans. Because the Company receives income from property operations and interest or rents at various times during the Company’s fiscal year, distributions paid may not reflect the Company’s income earned in that particular distribution period. The amount of cash available for distributions is affected by many factors, such as the Company’s ability to make asset acquisitions as offering proceeds become available, the income from those investments and yields on securities of other real estate programs that the Company invests in, as well as the Company’s operating expense levels and many other variables. Actual cash available for distribution may vary substantially from estimates. The Company’s actual results may differ significantly from the assumptions used by the Company’s board of directors in establishing the distribution rates to be paid on its shares.
The Company cannot assure investors that:
| • | rents or operating income from the Company’s properties will remain stable or increase; |
| • | tenants will not default under or terminate their leases; |
| • | securities the Company buys will increase in value or provide constant or increased distributions over time; |
| • | loans the Company makes will be repaid or paid on time; |
| • | loans will generate the interest payments that the Company expects; |
| • | acquisitions of real properties, mortgage or other loans, or the Company’s investments in securities or other assets, will increase the Company’s cash available for distributions to stockholders; or |
| • | development properties will be developed on budget or generate income once stabilized. |
Many of the factors that can affect the availability and timing of cash distributions to stockholders are beyond the Company’s control, and a change in any one factor could adversely affect the Company’s ability to pay distributions. For instance:
| • | Cash available for distributions may decrease if the Company is required to spend money to correct defects or to make improvements to properties. |
16
Table of Contents
| • | Cash available for distributions may decrease if the assets the Company acquires have lower yields than expected. |
| • | Federal income tax laws require REITs to distribute at least 90% of their taxable income to stockholders each year. The Company has elected to be treated as a REIT for tax purposes, and this limits the earnings that the Company may retain for corporate growth, such as asset acquisition, development or expansion, and will make the Company more dependent upon additional debt or equity financing than corporations that are not REITs. If the Company borrows more funds in the future, more of the Company’s operating cash will be needed to make debt payments and cash available for distributions may decrease. |
| • | The payment of principal and interest required to service the debt resulting from the Company’s policy to use leverage to acquire assets may leave the Company with insufficient cash to pay distributions. |
| • | As the Company has elected to be taxed as a REIT, the Company may pay distributions to the Company’s stockholders to comply with the distribution requirements of the Code, and to eliminate, or at least minimize, exposure to federal income taxes and the nondeductible REIT excise tax. Differences in timing between the receipt of income and the payment of expenses, and the effect of required debt payments, could require the Company to borrow funds on a short term basis to meet the distribution requirements that are necessary to achieve the tax benefits associated with qualifying as a REIT. |
If the Company decides to list the Company’s common stock on a national exchange, it may wish to lower the Company’s distribution rate in order to optimize the price at which the Company’s shares would trade. In addition, subject to the applicable REIT rules, the Company’s board of directors, in its discretion, may retain any portion of the Company’s cash on hand or use offering proceeds for capital needs and other corporate purposes. Future distribution levels are subject to adjustment based upon any one or more of the risk factors set forth in this prospectus, as well as other factors that the Company’s board of directors may, from time to time deem relevant to consider when determining an appropriate common stock distribution. As of December 31, 2014, the Company has experienced cumulative losses and cannot assure investors that it will generate or have sufficient cash available to continue paying distributions to investors at any specified level or that distributions the Company makes may not be decreased or be eliminated in the future.
Because the Company relies on affiliates of CNL for advisory, property management and managing dealer services, if these affiliates or their executive officers and other key personnel are unable to meet their obligations to the Company, the Company may be required to find alternative providers of these services, which could disrupt the Company’s business.
CNL, through one or more of its affiliates or subsidiaries, owns and controls the Sponsor, Advisor and Property Manager, as well as CNL Securities Corp., the managing dealer of the Company’s offering. In the event that any of these affiliates are unable to meet their obligations to the Company, the Company might be required to find alternative service providers, which could disrupt the Company’s business by causing delays and/or increasing the Company’s costs.
Further, the Company’s success depends to a significant degree upon the contributions of James M. Seneff, Jr., the Company’s chairman of the board of directors, Thomas K Sittema, vice chairman of the board of directors, Stephen H. Mauldin, the Company’s president and chief executive officer, and Joseph T. Johnson, the Company’s chief financial officer and treasurer, each of whom would be difficult to replace. If any of these key personnel were to cease their affiliation with the Company or the Company’s affiliates, the Company may be unable to find suitable replacement personnel and the Company’s operating results could suffer. In addition, the Company has entered into an advisory agreement with the Advisor which contains a non-solicitation and non-hire clause prohibiting the Company or the Company’s operating partnership from (i) soliciting or encouraging any person to leave the employment of the Advisor; or (ii) hiring on the Company’s behalf or on behalf of the Company’s operating partnership any person who has left the employment of the Advisor for one year after such departure. All of the Company’s executive officers and the executive officers of the Advisor are also executive officers of CNL Lifestyle Properties, Inc. and its Advisor, both of which are affiliates of the Advisor. In the event that CNL Lifestyle Properties, Inc. internalizes the management functions provided by its Advisor, such executive officers may cease their employment with the Company and the
17
Table of Contents
Advisor. In that case, the Advisor would need to find and hire an entirely new executive management team. The Company believes that its future success depends, in large part, upon the Advisor’s ability to hire and retain highly skilled managerial, operational and marketing personnel. Competition for such personnel is intense, and the Advisor may be unsuccessful in attracting and retaining such skilled personnel. The Company does not maintain key person life insurance on any of its officers..
Any adverse changes in CNL’s financial health, the public perception of CNL or the Company’s relationship with its sponsor or its affiliates could hinder the Company’s operating performance and the return on an investment.
Under certain circumstances, the Advisor and Property Manager have both committed to accept unvested restricted common stock in lieu of certain fees and expenses payable to them in order to provide additional cash to support of the Company’s distributions to investors. The Advisor and Property Manager may terminate their expense support obligations upon 30 days’ notice to the Company. If such expense support is terminated by either the Advisor, the Property Manager or both due to their or CNL’s financial health, the Company’s results from operations, cash from operations and funds from operations would all be negatively impacted and the Company’s ability to pay distributions to investors would be adversely impacted.
In addition, any deterioration in the perception of CNL in the broker-dealer and financial advisor industries could result in an adverse effect on fundraising in the Company’s Follow-on Offering and its ability to acquire assets and obtain financing from third parties on favorable terms.
Adverse changes in affiliated programs could also adversely affect our ability to raise capital.
CNL has one other public, non-traded, real estate investment program which has investment objectives similar to the Company’s, CNL Lifestyle Properties, Inc., which is closed to new investors and evaluating liquidity events, but still actively investing. Our Sponsor also has two other public, non-traded real estate investment programs, CNL Growth Properties, Inc. and Global Income Trust, Inc., which are closed to new investors. Adverse results in the other non-traded REITs on the CNL platform have the potential to affect CNL’s and the Company’s reputation among financial advisors and investors, which could affect the Company’s ability to raise capital.
The Company’s stockholders may experience dilution which could have a material adverse effect on the distributions investors receive from the Company.
The Company’s stockholders have no preemptive rights. If the Company commences a subsequent public offering of shares or securities convertible into shares or otherwise issue additional shares, then investors purchasing shares in the Company’s offering who do not participate in future stock issuances will experience dilution in the percentage of their equity investment. Stockholders will not be entitled to vote on whether or not the Company engages in additional offerings. In addition, depending on the terms and pricing of an additional offering of the Company’s shares and the value of the Company’s properties, the Company’s stockholders may experience dilution in both the book value and fair value of their shares. The Company’s board of directors has approved the filing with the Commission of a follow-on registration statement for the sale of additional shares of the Company’s common stock after the expiration of the current registration statement. Other public REITs sponsored by CNL have engaged in multiple offerings.
The interest of later investors in the Company’s common stock will be diluted as a result of the Company’s stock distribution policy.
The Company’s board of directors authorized a distribution policy under which the Company issues stock distributions monthly. This distribution policy will continue until terminated or amended by the Company’s board of directors. Therefore, investors who have purchased shares in the Company’s Initial Offering or who purchase shares early in the Follow-on Offering, as compared with later investors, will receive more shares for the same cash investment as a result of this distribution policy. Because they own more shares, upon a sale or liquidation of our Company, investors who purchased the Company’s shares early will receive more sales proceeds or liquidating distributions relative to their invested capital compared to later investors. The Company’s policy of paying distributions partially in stock was established in part to align investors with the anticipated appreciation and cash generating capabilities of the Company’s assets; however, unless the Company’s assets appreciate in an amount
18
Table of Contents
sufficient to offset the dilutive effect of the prior stock distributions and the Company’s offering, acquisition and operating expenses, the net asset value per share will be less than the public offering price paid for the share. Because of the Company’s ongoing stock distribution policy, the value of total shares held by a later investor purchasing the Company’s stock will be below the value of total shares held by an earlier investor, even if each initially acquired the same amount of shares at the same public offering price, because the earlier investor would have received a greater number of stock distribution shares. The Company anticipates that its stock distribution will be discontinued at or around the time in which the Follow-on Offering is closed, subject to the discretion of its board of directors.
The Company may be restricted in its ability to replace the Property Manager under certain circumstances which could have a material adverse effect on the Company’s business and financial condition.
The Company’s ability to replace the Property Manager may be limited. Under the terms of the Company’s property management and leasing agreement, the Company may terminate the agreement (a) in the event of the Property Manager’s voluntary or involuntary bankruptcy or a similar insolvency event or (b) for “cause.” In this case, “cause” means a material breach of the property management and leasing agreement of any nature by the property manager relating to all or substantially all of the properties being managed under the agreement that is not cured within 30 days after notice to the property manager. The Company may amend the property management and leasing agreement from time to time to remove a particular property from the pool of properties managed by the Property Manager (a) if the property is sold to a bona fide unaffiliated purchaser, or (b) for “cause.” The Company’s board of directors may find the performance of the property manager to be unsatisfactory. However, unsatisfactory performance by the property manager may not constitute “cause.” As a result, the Company may be unable to terminate the property management and leasing agreement even if the Company’s board of directors concludes that doing so is in the Company’s best interest.
An investment return may be reduced if the Company is required to register as an investment company under the Investment Company Act.
The Company is not registered, and does not intend to register the Company or any of its subsidiaries, as an investment company under the Investment Company Act. If the Company or any of its subsidiaries become obligated to register as an investment company, the registered entity would have to comply with a variety of substantive requirements under the Investment Company Act imposing, among other things:
| • | limitations on capital structure; |
| • | restrictions on specified investments; |
| • | prohibitions on transactions with affiliates; and |
| • | compliance with reporting, record keeping, voting, proxy disclosure and other rules and regulations that would significantly change the Company’s operations. |
The Company believes it conducts its operations, directly and through the Company’s wholly and majority owned subsidiaries, so that neither the Company nor any of its subsidiaries will be an investment company and, therefore, will not be required to register as an investment company under the Investment Company Act. Under Section 3(a)(1)(A) of the Investment Company Act, a company is deemed to be an “investment company” if it is, or holds itself out as being, engaged primarily, or proposes to engage primarily, in the business of investing, reinvesting or trading in securities. Under Section 3(a)(1)(C) of the Investment Company Act, a company is deemed to be an “investment company” if it is engaged, or proposes to engage, in the business of investing, reinvesting, owning, holding or trading in securities and owns or proposes to acquire “investment securities” having a value exceeding 40% of the value of its total assets (exclusive of government securities and cash items) on an unconsolidated basis, which the Company refer to as the “40% Test.”
Since the Company is primarily engaged in the business of acquiring real estate, the Company believes that the Company and most, if not all, of the Company’s wholly and majority-owned subsidiaries will not be considered investment companies under either Section 3(a)(1)(A) or Section 3(a)(1)(C) of the Investment Company Act. If the Company or any of the Company’s wholly or majority-owned subsidiaries would ever inadvertently fall within one of the definitions of “investment company,” the Company intends to rely on the exception provided by Section 3(c)(5)(C) of the Investment Company Act.
19
Table of Contents
Under Section 3(c)(5)(C), a company generally must maintain at least 55% of its assets directly in what are deemed “qualifying” real estate assets and at least 80% of the entity’s assets in such qualifying assets and in a broader category of what are deemed “real estate-related” assets to qualify for this exception. Mortgage-related securities may or may not constitute qualifying assets, depending on the characteristics of the mortgage-related securities, including the rights that the Company has with respect to the underlying loans. The Company’s ownership of mortgage-related securities, therefore, is limited by provisions of the Investment Company Act and Commission staff interpretations.
The method the Company uses to classify its assets for purposes of the Investment Company Act is based in large measure upon no-action positions taken by the Commission staff in the past. These no-action positions were issued in accordance with factual situations that may be substantially different from the factual situations the Company may face, and a number of these no-action positions were issued more than ten years ago. No assurance can be given that the Commission staff will concur with the Company’s classification of the Company’s assets. In addition, the Commission staff may, in the future, issue further guidance that may require the Company to re-classify the Company’s assets for purposes of qualifying for an exclusion from regulation under the Investment Company Act. If the Company is required to re-classify its assets, the Company may no longer be in compliance with the exception from the definition of an “investment company” provided by Section 3(c)(5)(C) of the Investment Company Act.
A change in the value of any of the Company’s assets could cause the Company or one or more of its wholly or majority-owned subsidiaries to fall within the definition of “investment company” and negatively affect the Company’s ability to maintain the Company’s exception from regulation under the Investment Company Act. To avoid being required to register as an investment company under the Investment Company Act, the Company and its subsidiaries may be unable to sell assets the Company would otherwise want to sell and may need to sell assets the Company would otherwise wish to retain. In addition, the Company may have to acquire additional income- or loss-generating assets that the Company might not otherwise have acquired or may have to forego opportunities to acquire interests in companies that the Company would otherwise want to acquire and would be important to the Company’s investment strategy.
If the Company were required to register as an investment company but failed to do so, it would be prohibited from engaging in the Company’s business, and criminal and civil actions could be brought against the Company. In addition, the Company’s contracts would be unenforceable unless a court required enforcement, and a court could appoint a receiver to take control of the Company and liquidate its business.
Stockholders have limited control over changes in the Company’s policies and operations.
The Company’s board of directors determines the Company’s investment policies, including its policies regarding financing, growth, debt capitalization, REIT qualification and distributions. The Company’s board of directors may amend or revise these and other policies without a vote of the Company’s stockholders. Under the Company’s charter and the Maryland General Corporation Law, its stockholders currently have a right to vote only on the following matters:
| • | the election or removal of directors; |
| • | any amendment of the Company’s charter, except that the Company’s board of directors may amend its charter without stockholder approval to change the Company’s name, increase or decrease the aggregate number of the Company’s shares or the number of shares of any class or series that the Company has the authority to issue, effect certain reverse stock splits, or change the name or other designation or par value of any class or series of the Company’s stock and the aggregate par value of the Company’s stock; |
| • | the Company’s liquidation and dissolution; and |
| • | except as otherwise permitted by law, the Company’s being a party to any merger, consolidation, sale or other disposition of substantially all of its assets or similar reorganization. |
20
Table of Contents
If the Company does not successfully implement a liquidity event, investors may have to hold an investment for an indefinite period.
It is currently contemplated that by 2018 the Company’s board of directors will begin to evaluate various strategic options to provide stockholders with liquidity of their investment. If the Company’s board of directors determines to pursue a liquidity event, the Company would be under no obligation to conclude the process within a set time. If the Company adopts a plan of liquidation, the timing of the sale of assets will depend on real estate and financial markets, economic conditions in areas in which its investments are located and federal income tax effects on stockholders that may prevail in the future. The Company cannot guarantee that the Company will be able to liquidate all of the Company’s assets on favorable terms, if at all. After the Company adopts a plan of liquidation, the Company would likely remain in existence until all its investments are liquidated. If the Company does not pursue a liquidity event or delays such a transaction due to market conditions, the Company’s common stock may continue to be illiquid and investors may, for an indefinite period of time, be unable to convert investor shares to cash easily, if at all, and could suffer losses on an investment in the Company’s shares.
Non-traded REITs have been the subject of increased scrutiny by regulators and media outlets resulting from inquiries and investigations initiated by Financial Industry Regulatory Authority, Inc. and the Commission.
The Company’s securities, like other non-traded REITs, are sold through broker-dealers and financial advisors. Governmental and self-regulatory organizations such as the Commission and self-regulatory organizations such as Financial Industry Regulatory Authority, Inc. (“FINRA”) impose and enforce regulations on broker-dealers, investment advisers and similar financial services companies. In disciplinary proceedings in 2012, the Enforcement Division of FINRA required a broker-dealer to pay restitution to investors of a non-traded REIT in connection with the broker-dealer’s sale and promotion activities. FINRA has also filed complaints against a broker-dealer firm with respect to (i) its solicitation of investors to purchase shares in a non-traded REIT without conducting a reasonable inquiry of investor suitability and (ii) its provision of misleading distribution information. In February 2014, four non-traded REITs with affiliated sponsors disclosed in public filings a settlement with the Commission with respect to allegations that these REITs misled investors about their share-pricing methods, concealing inter-fund transactions and extra payments to executives.
The above-referenced proceedings have resulted in increased regulatory scrutiny from the Commission regarding non-traded REITs. As a result of this increased scrutiny and accompanying negative publicity and coverage by media outlets, FINRA may impose additional restrictions on sales practices in the independent broker-dealer channel for non-traded REITs, and accordingly the Company may face increased difficulties in raising capital. If the Company becomes the subject of scrutiny, even if the Company has complied with all applicable laws and regulations, responding to such regulator inquiries could be expensive and distract the Company’s management.
Risks Related to Conflicts of Interest and the Company’s Relationships with Its Advisor and Its Affiliates
There may be conflicts of interest because of interlocking boards of directors with affiliated companies.
James M. Seneff, Jr. and Thomas K. Sittema serve as the Company’s chairman and vice chairman, respectively, of the Company’s board of directors and concurrently serve as directors for CNL Lifestyle Properties, Inc., an affiliate. Mr. Seneff also currently serves as the chairman and a director for each of CNL Growth Properties, Inc. and Global Income Trust, Inc., each of which are affiliates of the Company and/or the Advisor. These directors may experience conflicts of interest in managing the Company because they also have management responsibilities for these affiliated entities, which invest in properties in the same markets as the Company’s properties.
There will be competing demands on the Company’s officers and directors, and they may not devote all of their attention to the Company which could have a material adverse effect on its business and financial condition.
Two of the Company’s directors, James M. Seneff, Jr. and Thomas K. Sittema, are also officers and directors of the Advisor and other affiliated entities and may experience conflicts of interest in managing the Company because they also have management responsibilities for other companies including companies that may invest in some of the same types of assets in which the Company may invest. In addition, substantially all of the other companies that they work for are affiliates of the Company and/or the Advisor. For these reasons, all of these individuals share their management time and services among those companies and the Company and will not devote all of their attention to the Company and could take actions that are more favorable to the other companies than to the Company.
21
Table of Contents
In addition, Stephen H. Mauldin, the Company’s president and chief executive officer, Joseph T. Johnson, the Company’s chief financial officer and treasurer, and the Company’s other officers serve as officers of, and devote time to, the Advisor, as well as CNL Lifestyle Properties, Inc., an affiliate of the Advisor, which has certain similar investment objectives and which owns assets in one of the asset classes in which the Company has invested. Certain of the Company’s officers may also serve as officers of, and devote time to, CNL Growth Properties. Inc. and Global Income Trust, Inc., two other non-traded REITs affiliated with the Sponsor, and their respective advisors and other companies which may be affiliated with the Company in the future. These officers may experience conflicts of interest in managing the Company because they also have management responsibilities for multiple programs. For these reasons, these officers will share their management time and services among these other programs and the Company, and will not devote all of their attention to the Company and could take actions that are more favorable to CNL Lifestyle Properties, Inc. than to the Company.
Other real estate investment programs sponsored by CNL or the Sponsor use investment strategies that are similar to the Company’s. The Advisor and its affiliates and their and the Company’s executive officers will face conflicts of interest relating to the purchase and leasing of properties and other investments, and such conflicts may not be resolved in the Company’s favor.
One or more real estate investment programs sponsored by CNL or the Sponsor may seek to invest in properties and other real estate-related investments similar to the assets the Company seeks to acquire. CNL has one public, real estate investment program, CNL Lifestyle Properties, Inc., which has investment strategies similar to the Company. CNL Lifestyle Properties, Inc. is managed by the executive officers of the Advisor and invests in commercial properties, including lifestyle, lodging, attraction and senior housing properties. As a result, the Company may be buying properties and other real estate-related investments at the same time as CNL Lifestyle Properties, Inc. is buying properties and other real estate-related investments in certain of the asset classes in which the Company focuses. The Company cannot assure investors that properties the Company wants to acquire will be allocated to the Company in this situation. CNL is not required to allocate each prospective investment to the Advisor for review. The Advisor may choose a property that provides lower returns to the Company than a property allocated to CNL Lifestyle Properties, Inc. In addition, the Company may acquire properties in geographic areas where other programs sponsored by CNL or the Sponsor also invest. If one of such other programs sponsored by CNL or the Sponsor attracts a tenant for which the Company is competing, the Company could suffer a loss of revenue due to delays in locating another suitable tenant. Investors will not have the opportunity to evaluate the manner in which these conflicts of interest are resolved before or after making an investment.
The Advisor and its affiliates, including all of the Company’s executive officers and affiliated directors, will face conflicts of interest as a result of their compensation arrangements with the Company, which could result in actions that are not in the best interest of the Company’s stockholders.
The Company pays its Advisor and its affiliates, including the managing dealer of the Company’s offering and the Property Manager, substantial fees. These fees could influence their advice to the Company, as well as the judgment of affiliates of the Advisor performing services for the Company. Among other matters, these compensation arrangements could affect their judgment with respect to:
| • | the continuation, renewal or enforcement of the Company’s agreements with its Advisor and its affiliates; |
| • | additional public offerings of equity by the Company, which would create an opportunity for CNL Securities Corp., as managing dealer, to earn additional fees and for the Advisor to earn increased advisory fees; |
| • | property sales, which may entitle the Advisor to real estate commissions; |
| • | property acquisitions from third parties, which entitle the Advisor to an investment services fee; |
22
Table of Contents
| • | borrowings to acquire assets, which increase the investment services fees and asset management fees payable to the Advisor and which entitle the Advisor or its affiliates to receive other acquisition fees in connection with assisting in obtaining financing for assets if approved by the Company’s board of directors, including a majority of the Company’s independent directors; |
| • | whether the Company seeks to internalize its management functions, which could result in it retaining some of the Advisor’s and its affiliates’ key officers for compensation that is greater than that which they currently earn or which could require additional payments to affiliates of the Advisor to purchase the assets and operations of the Advisor and its affiliates performing services for the Company; |
| • | the listing of, or other liquidity event with respect to, the Company’s shares, which may entitle the Advisor to a subordinated incentive fee; |
| • | a sale of assets, which may entitle the Advisor to a subordinated share of net sales proceeds; and |
| • | whether and when the Company seeks to sell the Company’s operating partnership or its assets, which sale could entitle the Advisor to additional fees. |
The fees the Advisor receives in connection with transactions involving the purchase and management of the Company’s assets are not necessarily based on the quality of the investment or the quality of the services rendered to the Company. The basis upon which fees are calculated may influence the Advisor to recommend riskier transactions to the Company.
None of the agreements with the Advisor, Property Manager or any other affiliates were negotiated at arm’s length.
Agreements with the Advisor, Property Manager or any other affiliates may contain terms that would not otherwise apply if the Company entered into agreements negotiated at arm’s length with third parties.
If the Company internalizes the Company’s management functions, an interest in the Company could be diluted, the Company could incur other significant costs associated with being self-managed, the Company may not be able to retain or replace key personnel and may have increased exposure to litigation as a result of internalizing its management functions.
The Company may internalize management functions provided by the Advisor, Property Manager and their respective affiliates. The Company’s board of directors may decide in the future to acquire assets and personnel from the Advisor or its affiliates for consideration that would be negotiated at that time. However, as a result of the non-solicitation clause in the advisory agreement, generally the acquisition of Advisor personnel would require the prior written consent of the Advisor. There can be no assurances that the Company will be successful in retaining the Advisor’s key personnel in the event of an internalization transaction. In the event the Company acquires the Advisor or the Property Manager, the Company cannot be sure of the form or amount of consideration or other terms relating to any such acquisition, which could take many forms, including cash payments, promissory notes and shares of the Company’s stock. The payment of such consideration could reduce the percentage of the Company’s shares owned by persons who purchase shares in the Company’s offering and could reduce the net income per share and funds from operations per share attributable to an investment.
In addition, the Company may issue equity awards to officers and consultants, which would increase operating expenses and decrease net income and funds from operations. The Company cannot reasonably estimate the amount of fees to the Advisor, Property Manager and other affiliates the Company would save, and the costs it would incur, if the Company acquired these entities. If the expenses the Company assumes as a result of an internalization are higher than the expenses the Company avoid paying to the Advisor, Property Manager and other affiliates, its net income per share and funds from operations per share would be lower than they otherwise would have been had the Company not acquired these entities.
Additionally, if the Company internalizes its management functions, the Company could have difficulty integrating these functions. Currently, the officers of the Advisor and its affiliates perform asset management and general and administrative functions, including accounting and financial reporting, for multiple entities. The Company may fail to properly identify the appropriate mix of personnel and capital needs to operate as a stand-alone entity. An inability to manage an internalization transaction effectively could result in the Company’s incurring additional costs and divert its management’s attention from effectively managing the Company’s properties and overseeing other real estate-related assets.
23
Table of Contents
In recent years, internalization transactions have been the subject of stockholder litigation. Stockholder litigation can be costly and time-consuming, and there can be no assurance that any litigation expenses the Company might incur would not be significant or that the outcome of litigation would be favorable to the Company. Any amounts the Company is required to expend defending any such litigation will reduce the amount of funds available for investment by the Company in properties or other investments.
The Company is not in privity of contract with service providers that may be engaged by the Advisor to perform advisory services and they may be insulated from liabilities to the Company, and the Advisor has minimal assets with which to remedy any liabilities to the Company.
The Advisor sub-contracts with affiliated or unaffiliated service providers for the performance of substantially all of its advisory services. The Advisor has engaged affiliates of the Sponsor to perform certain services on its behalf pursuant to agreements to which the Company is not a party. As a result, the Company is not in privity of contract with any such service provider and, therefore, such service provider will have no direct duties, obligations or liabilities to the Company. In addition, the Company has no right to any indemnification to which the Advisor may be entitled under any agreement with a service provider. The service providers the Advisor may subcontract with may be insulated from liabilities to the Company for services they perform, but may have certain liabilities to the Advisor. The Advisor has minimal assets with which to remedy liabilities to the Company resulting under the advisory agreement.
Risks Related to The Company’s Business
The Company has not established investment criteria limiting the size of property acquisitions. If the Company has an investment that represents a material percentage of the Company’s assets which experiences a loss, the value of an investment in the Company would be significantly diminished.
The Company is not limited in the size of any single property acquisition the Company may make and certain of the Company’s investments may represent a significant percentage of its assets. Should the Company experience a loss on a portion or all of an investment that represents a significant percentage of the Company’s assets, this event would have a material adverse effect on the Company’s business and financial condition, which would result in an investment in the Company being diminished.
The Company depends on tenants for a significant portion of its revenue and lease defaults or terminations could have an adverse effect.
The Company’s ability to repay any outstanding debt and make distributions to stockholders depends upon the ability of its tenants to make payments to the Company, and their ability to make these payments depends primarily on their ability to generate sufficient revenues in excess of operating expenses from businesses conducted on the Company’s properties. For example, a tenant’s failure or delay in making scheduled rent payments to the Company may result from the tenant realizing reduced revenues at the properties it operates. Defaults on lease payment obligations by tenants would cause the Company to lose the revenue associated with those leases and require the Company to find an alternative source of revenue to pay the Company’s mortgage indebtedness and prevent a foreclosure action. In addition, if a tenant at one of the Company’s single-user facilities, which are properties designed or built primarily for a particular tenant or a specific type of use, defaults on its lease obligations, the Company may not be able to readily market a single-user facility to a new tenant without making capital improvements or incurring other significant costs.
24
Table of Contents
Significant tenant lease expirations may decrease the value of the Company’s investments.
Multiple, significant lease terminations in a given year in the Company’s medical office buildings produce tenant roll concentration and uncertainty as to the future cash flow of a property or portfolio and often decreases the value a potential purchaser will pay for one or more properties. There is no guarantee that medical office buildings acquired will not have tenant roll concentration, and if such concentration occurs it could decrease the Company’s ability to pay distributions to stockholders and the value of their investment.
The Company’s long-term leases may not result in fair market lease rates over time; therefore, the Company’s income and its distributions could be lower than if the Company did not enter into long-term leases.
The Company typically enters into long-term leases with tenants of certain of its properties. The Company’s long-term leases would likely provide for rent to increase over time. However, if the Company does not accurately judge the potential for increases in market rental rates, the Company may set the terms of these long-term leases at levels less than then-current market rental rates even after contractual rent increases. Further, the Company may have no ability to terminate those leases or to adjust the rent to then-prevailing market rates. As a result, the Company’s income and distributions could be lower than if the Company did not enter into long-term leases.
Medical office building properties that have vacancies for a significant period of time could be difficult to sell, which could diminish the return on your investment.
The Company’s medical office building properties may have vacancies as a result of the continued default of tenants under their leases or the expiration of tenant leases. If a high rate of vacancies persist, the Company may suffer reduced revenues. In addition, because properties’ market values depend principally upon the value of the properties’ leases, the resale value of properties with prolonged vacancies could suffer, which could further reduce your return.
The continuation of a slow economy could adversely affect certain of the properties in which the Company invests, and the financial difficulties of the Company’s tenants and operators could adversely affect the Company.
The continuation of a slow economy could adversely affect certain of the properties in which the Company invests. Although a general downturn in the real estate industry would be expected to adversely affect the value of the Company’s properties, a downturn in the senior housing and healthcare sectors in which the Company invests could compound the adverse effect. Continued economic weakness combined with higher costs, especially for energy, food and commodities, has put considerable pressure on consumer spending, which, along with the lack of available debt, could result in the Company’s tenants experiencing a decline in financial and operating performance and/or a decline in earnings from the Company’s TRS investments.
Further disruptions in the financial markets and deteriorating economic conditions could impact certain of the real estate properties the Company acquires and such real estate could experience reduced occupancy levels from that anticipated at the time of the Company’s acquisition of such real estate. The value of the Company’s real estate investments could decrease below the amounts the Company paid for the investments. Revenues from properties could decrease due to lower occupancy rates, reduced rental rates and potential increases in uncollectible rent. The Company will incur expenses, such as for maintenance costs, insurances costs and property taxes, even though a property is vacant. The longer the period of significant vacancies for a property, the greater the potential negative impact on the Company’s revenues and results of operations.
The inability of seniors to sell their homes could negatively impact occupancy rates, revenues, cash flows and results of operations of the properties the Company acquires.
Downturns in the housing markets could adversely affect the ability (or perceived ability) of seniors to currently afford entrance fees and resident fees as potential residents frequently use the proceeds from the sale of their homes to cover the cost of these fees. Specifically, if seniors have a difficult time selling their homes, these difficulties could impact their ability to relocate into, or finance their stays at, the Company’s senior housing and post-acute care properties with private resources. If the volatility in the housing market returns, the occupancy rates, revenues, cash flows and results of operations for these properties could be negatively impacted.
25
Table of Contents
The Company does not have control over market and business conditions that may affect its success.
The following external factors, as well as other factors beyond the Company’s control, may reduce the value of properties that it acquires, the ability of tenants to pay rent on a timely basis, or at all, the amount of the rent to be paid and the ability of borrowers to make loan payments on time, or at all:
| • | changes in general or local economic or market conditions; |
| • | the pricing and availability of debt, operating lines of credit or working capital; |
| • | inflation and other increases in operating costs, including utilities and insurance premiums; |
| • | increased costs and shortages of labor; |
| • | increased competition; |
| • | quality of management; |
| • | failure by a tenant to meet its obligations under a lease; |
| • | bankruptcy of a tenant or borrower; |
| • | the ability of an operator to fulfill its obligations; |
| • | limited alternative uses for properties; |
| • | changing consumer habits or other changes in supply of, or demand for, similar or competing products; |
| • | acts of God, such as earthquakes, floods and hurricanes; |
| • | condemnation or uninsured losses; |
| • | changing demographics; and |
| • | changing government regulations, including REIT taxation, real estate taxes, environmental, land use and zoning laws. |
Further, the results of operations for a property in any one period may not be indicative of results in future periods, and the long-term performance of such property generally may not be comparable to, and cash flows may not be as predictable as, other properties owned by third parties in the same or similar industry. If tenants are unable to make lease payments, TRS entities do not achieve the expected levels of operating income, or borrowers are unable to make loan payments as a result of any of these factors, cash available for distributions to the Company’s stockholders may be reduced.
The Company may be limited in its ability to vary the Company’s portfolio in response to changes in economic, market or other conditions, including by restrictions on transfer imposed by the Company’s limited partners, if any, in the Company’s operating partnership or by the Company’s lenders. Additionally, the return on the Company’s real estate assets also may be affected by a continued or exacerbated general economic slowdown experienced in the United States generally and in the local economies where its properties and the properties underlying the Company’s other real estate-related investments are located, including:
| • | poor economic conditions may result in a decline in the operating income at the Company’s properties and defaults by tenants of the Company’s properties and borrowers under its investments in mortgage, bridge or mezzanine loans; and |
| • | increasing concessions, reduced rental rates or capital improvements may be required to maintain occupancy levels. |
26
Table of Contents
The Company’s exposure to typical real estate investment risks could reduce its income.
The Company’s properties, loans and other real estate-related investments are subject to the risks typically associated with investments in real estate. Such risks include the possibility that the Company’s properties will generate operating income, rent and capital appreciation, if any, at rates lower than anticipated or will yield returns lower than those available through other investments. Further, there are other risks by virtue of the fact that the Company’s ability to vary its portfolio in response to changes in economic and other conditions will be limited because of the general illiquidity of real estate investments. Income from the Company’s properties may be adversely affected by many factors including, but not limited to, an increase in the local supply of properties similar to the Company’s properties, newer competing properties, a decrease in the number of people interested in the properties that the Company acquires, changes in government regulation, including healthcare regulation, international, national or local economic deterioration, increases in operating costs due to inflation and other factors that may not be offset by increased lease rates, and changes in consumer tastes.
The Company may be unable to sell assets if or when the Company decides to do so.
Maintaining the Company’s REIT qualification and continuing to avoid registration under the Investment Company Act as well as many other factors, such as general economic conditions, the availability of financing, interest rates and the supply and demand for the particular asset type, may limit the Company’s ability to sell real estate assets. These factors are beyond the Company’s control. The Company cannot predict whether it will be able to sell any real estate asset on favorable terms and conditions, if at all, or the length of time needed to sell an asset.
An increase in real estate taxes may decrease the Company’s income from properties.
From time to time, the amount the Company pays for property taxes will increase as either property values increase or assessment rates are adjusted. Increases in a property’s value or in the assessment rate will result in an increase in the real estate taxes due on that property. If the Company is unable to pass the increase in taxes through to its tenants, the Company’s net operating income for the property will decrease.
Acquiring or attempting to acquire multiple properties in a single transaction may adversely affect the Company’s operations.
From time to time, the Company acquires multiple properties in a single transaction. Portfolio acquisitions typically are more complex and expensive than single property acquisitions, and the risk that a multiple-property acquisition does not close may be greater than in a single-property acquisition. Portfolio acquisitions may also result in the Company’s ownership of investments in geographically dispersed markets, placing additional demands on the Advisor and Property Manager in managing the properties in the portfolio. In addition, a seller may require that a group of properties be purchased as a package even though the Company may not want to purchase one or more properties in the portfolio. The Company also may be required to accumulate a large amount of cash to fund such acquisitions. The Company would expect the returns that it earns on such cash to be less than the returns on real property. Therefore, acquiring multiple properties in a single transaction may reduce the overall yield on the Company’s portfolio.
If one or more of the Company’s tenants file for bankruptcy protection, the Company may be precluded from collecting all sums due.
If one or more of the Company’s tenants, or the guarantor of a tenant’s lease, commences, or has commenced against it, any proceeding under any provision of the U.S. federal bankruptcy code, as amended, or any other legal or equitable proceeding under any bankruptcy, insolvency, rehabilitation, receivership or debtor’s relief statute or law, the Company may be unable to collect sums due under the Company’s lease(s) with that tenant. Any or all of the tenants, or a guarantor of a tenant’s lease obligations, could be subject to a bankruptcy or similar proceeding. A bankruptcy or similar proceeding may bar the Company’s efforts to collect pre-bankruptcy debts from those entities or their properties unless the Company is able to obtain an order from the bankruptcy court. If a lease is rejected by a tenant in bankruptcy, the Company would only have a general unsecured claim against the tenant, and may not be entitled to any further payments under the lease. Such an event could cause a decrease or cessation of rental payments which would reduce the Company’s cash flow and the amount available for distribution to stockholders. In the event of a bankruptcy or similar proceeding, the Company cannot assure investors that the tenant or its trustee will assume the Company’s lease. If a given lease, or guaranty of a lease, is not assumed, the Company’s cash flow and the amounts available for distribution to stockholders may be adversely affected.
27
Table of Contents
If a sale-leaseback transaction is re-characterized in a tenant’s bankruptcy proceeding, the Company’s financial condition could be adversely affected.
The Company has entered into sale-leaseback transactions whereby the Company purchases a property and then leases the same property back to the person from whom it was purchased. In the event of the bankruptcy of a tenant, a transaction structured as a sale-leaseback may be re-characterized as either a financing or a joint venture, either of which outcomes could adversely affect the Company’s financial condition, cash flow, REIT qualification and the amount available for distributions to investors.
If the sale-leaseback were re-characterized as a financing, the Company might not be considered the owner of the property, and as a result would have the status of a creditor in relation to the tenant. In that event, the Company would no longer have the right to sell or encumber its ownership interest in the property. Instead, the Company would have a claim against the tenant for the amounts owed under the lease, with the claim arguably secured by the property. The tenant/debtor might have the ability to propose a plan restructuring the term, interest rate and amortization schedule of its outstanding balance. If confirmed by the bankruptcy court, the Company could be bound by the new terms and prevented from foreclosing its lien on the property. If the sale-leaseback were re-characterized as a joint venture, the Company’s lessee and the Company could be treated as co-venturers with regard to the property. As a result, the Company could be held liable, under some circumstances, for debts incurred by the lessee relating to the property.
Multiple property leases or loans with individual tenants or borrowers increase the Company’s risks in the event that such tenants or borrowers become financially impaired.
Defaults by a tenant or borrower may continue for some time before the Company determines that it is in the Company’s best interest to evict the tenant or foreclose on the property of the borrower. Tenants may lease more than one property, and borrowers may enter into more than one loan. As a result, a default by, or the financial failure of, a tenant or borrower could cause more than one property to become vacant or be in default or more than one lease or loan to become non-performing. Defaults or vacancies can reduce the Company’s rental income and funds available for distribution and could decrease the resale value of affected properties until they can be re-leased.
The Company relies on various security provisions in the Company’s leases for minimum rent payments which could have a material adverse effect on the Company’s financial condition.
The Company’s leases may, but are not required to, have security provisions such as deposits, stock pledges and guarantees or shortfall reserves provided by a third-party tenant or operator. These security provisions may terminate at either a specific time during the lease term once net operating income of the property exceeds a specified amount or upon the occurrence of other specified events. Certain security provisions may also have limits on the overall amount of the security under the lease. After the termination of a security feature, or in the event that the maximum limit of a security provision is reached, the Company may only look to the tenant to make lease payments. In the event that a security provision has expired or the maximum limit has been reached or a provider of a security provision is unable to meet its obligations, the Company’s results of operations and ability to pay distributions to the Company’s stockholders could be adversely affected if the Company’s tenants are unable to generate sufficient funds from operations to meet minimum rent payments and the tenants do not otherwise have the resources to make rent payments.
The Company’s real estate assets may be subject to impairment charges which could have a material adverse effect on the Company’s financial condition.
The Company is required to periodically evaluate the recoverability of the carrying value of the Company’s real estate assets for impairment indicators. Factors considered in evaluating impairment of the Company’s real estate assets held for investment include significant declines in property operating profits, recurring property operating losses and other significant adverse changes in general market conditions that are considered permanent in nature. Generally, a real estate asset held for investment is not considered impaired if the undiscounted, estimated future cash flows of the asset over its estimated holding period are in excess of the asset’s net book value at the balance sheet date. Management makes assumptions and estimates when considering impairments and actual results could vary materially from these assumptions and estimates.
28
Table of Contents
The Company is uncertain that its existing sources for funding of future capital needs will remain adequate.
The Company has established a revolving credit facility and capital reserves on a property-by-property basis, as the Company deems appropriate to fund anticipated capital improvements. If the Company’s revolving credit facility is inadequate to address its acquisition needs or if the Company does not have enough capital reserves to supply needed funds for capital improvements throughout the life of the Company’s investment in a property and there is insufficient cash available from operations or from other sources, the Company may be required to defer necessary improvements to a property. This may result in decreased cash flow and reductions in property values. If the Company’s reserves are insufficient to meet its cash needs, the Company may have to obtain financing from either affiliated or unaffiliated sources to fund its cash requirements. There can be no guarantee that these sources will be available to the Company. Accordingly, in the event that the Company develops a need for additional capital in the future for acquisitions or the maintenance or improvement of the Company’s properties or for any other reason, the Company has not identified any additional established sources for such funding, and the Company cannot assure investors that such sources of funding will be available to the Company in the future.
Increased competition for residents or patients may reduce the ability of certain of the Company’s operators to make scheduled rent payments to the Company or affect the Company’s operating results.
The types of properties in which the Company invests are expected to face competition for residents or patients from other similar properties, both locally and nationally. For example, competing senior housing properties may be located near the senior housing properties the Company owns or acquires. Any decrease in revenues due to such competition at any of the Company’s properties may adversely affect the Company’s operators’ ability to make scheduled rent payments to the Company and with respect to the Company’s senior housing and other healthcare properties leased to TRS entities, may adversely affect the Company’s operating results of those properties.
Lack of diversification of the Company’s properties may increase the Company’s exposure to the risks of adverse economic conditions as to particular asset classes and categories of property within asset classes.
Since the Company’s assets are concentrated in certain asset classes or any brand or other category within an asset class, an economic downturn in such class or asset category could have an adverse effect on the Company’s results of operations and financial condition.
The Company may be subject to litigation which could have a material adverse effect on its business and financial condition.
The Company may be subject to litigation, including claims relating to the Company’s operations, offerings, unrecognized pre-acquisition contingencies and otherwise in the ordinary course of business. Some of these claims may result in potentially significant judgments against the Company, some of which are not, or cannot be, insured against. The Company generally intends to vigorously defend itself; however, the Company cannot be certain of the ultimate outcomes of claims that may arise in the future. Resolution of these types of matters against the Company may result in its payment of significant fines or settlements, which, if not insured against, or if these fines and settlements exceed insured levels, would adversely impact the Company’s earnings and cash flows. Certain litigation or the resolution of certain litigation may affect the availability or cost of some of the Company’s insurance coverage which could adversely impact the Company’s results of operations and cash flows, expose the Company to increased risks that would be uninsured and/or adversely impact its ability to attract officers and directors.
The Company will have no economic interest in the land beneath ground lease properties that the Company may acquire.
Certain of the properties that the Company acquires may be on land owned by a governmental entity or other third party, while the Company owns a leasehold, permit, or similar interest. This means that the Company does not retain fee ownership in the underlying land. Accordingly, with respect to such properties, the Company will have no economic interest in the land or buildings at the expiration of the ground lease or permit. As a result, the Company
29
Table of Contents
will not share in any increase in value of the land associated with the underlying property and may forfeit rights to assets constructed on the land such as buildings and improvements at the end of the lease. Further, because the Company does not completely control the underlying land, the governmental or other third party owners that lease this land to the Company could take certain actions to disrupt the Company’s rights in the properties or the Company’s tenants’ operation of the properties or take the properties in an eminent domain proceeding. Such events are beyond the Company’s control. If the entity owning the land under one of the Company’s properties chose to disrupt the Company’s use either permanently or for a significant period of time, then the value of the Company’s assets could be impaired.
Existing senior housing, medical office buildings, acute care and post-acute care properties that the Company acquires may be subject to unknown or contingent liabilities which could cause the Company to incur substantial costs.
The Company has acquired operating senior housing, medical office buildings, acute care and post-acute care properties which may be subject to unknown or contingent liabilities for which the Company may have no recourse, or only limited recourse, against the sellers. In general, the representations and warranties provided under transaction agreements related to the Company’s acquisition of senior housing and healthcare properties do not survive the closing of the transactions. While the Company generally requires the sellers to indemnify the Company with respect to breaches of representations and warranties that survive, such indemnification may be limited and subject to various materiality thresholds, a significant deductible or an aggregate cap on indemnifiable losses. There is no guarantee that the Company will recover any amounts with respect to losses due to breaches by the sellers of their representations and warranties. In addition, the total amount of costs and expenses that may be incurred with respect to liabilities associated with these properties may exceed the Company’s expectations, and it may experience other unanticipated adverse effects, all of which may adversely affect the Company’s financial condition, results of operations, the market price of its common stock and its ability to make distributions to the Company’s stockholders.
The Company may not be able to compete effectively in those markets where overbuilding exists and the Company’s inability to compete in those markets may have a material adverse effect on the Company’s business, financial condition and results of operations and the Company’s ability to make distributions to investors.
Overbuilding in the senior housing segment in the late 1990s reduced occupancy and revenue rates at senior housing facilities. The occurrence of another period of overbuilding could adversely affect the Company’s future occupancy and resident fee rates, decreased occupancy and operating margins, and lower profitability, which in turn could materially adversely affect the Company’s business, financial condition and results of operations and the Company’s ability to make distributions to its stockholders.
The Company invests in private-pay senior housing properties, an asset class of the senior housing sector that is highly competitive.
Private-pay senior housing is a competitive asset class of the senior housing sector. The Company’s senior housing properties compete on the basis of location, affordability, quality of service, reputation and availability of alternative care environments. The Company’s senior housing properties also rely on the willingness and ability of seniors to select senior housing options. The Company’s property operators may have competitors with greater marketing and financial resources able to offer incentives or reduce fees charged to residents thereby potentially reducing the perceived affordability of the Company’s properties. Additionally, the high demand for quality caregivers in a given market could increase the costs associated with providing care and services to residents. These and other factors could cause the amount of the Company’s revenue generated by private payment sources to decline or the Company’s operating expenses to increase. In periods of weaker demand, as has occurred during the recent general economic recession, profitability may be negatively affected by the relatively high fixed costs of operating a senior housing property.
30
Table of Contents
Events which adversely affect the ability of seniors to afford the Company’s daily resident fees could cause the occupancy rates, resident fee revenues and results of operations of the Company’s senior housing properties to decline.
Costs to seniors associated with certain types of the senior housing properties the Company acquires generally are not reimbursable under government reimbursement programs such as Medicaid and Medicare. Substantially all of the resident fee revenues generated by the Company’s properties are derived from private payment sources consisting of income or assets of residents or their family members. Only seniors with income or assets meeting or exceeding certain standards can typically afford to pay the Company’s daily resident and service fees and, in some cases, entrance fees. Economic downturns such as the one recently experienced in the United States, reductions or declining growth of government entitlement programs, such as social security benefits, or stock market volatility could adversely affect the ability of seniors to afford the fees for the Company’s senior housing properties. If the Company’s tenants or managers are unable to attract and retain seniors with sufficient income, assets or other resources required to pay the fees associated with assisted and independent living services, the occupancy rates, resident fee revenues and results of operations for these properties could decline, which, in turn, could have a material adverse effect on the Company’s business.
Significant legal actions brought against the tenants or managers of the Company’s senior housing, acute and post-acute care properties could subject them to increased operating costs and substantial uninsured liabilities, which may affect their ability to meet their obligations to the Company.
The tenants or managers of the Company’s senior housing, acute care and post-acute care properties may be subject to claims that their services have resulted in resident injury or other adverse effects. The insurance coverage that is maintained by such tenants or managers, whether through commercial insurance or self-insurance, may not cover all claims made against them or continue to be available at a reasonable cost, if at all. In some states, insurance coverage for the risk of punitive damages arising from professional liability and general liability claims and/or litigation may not, in certain cases, be available to the Company’s tenants or managers due to state law prohibitions or limitations of availability. As a result, the tenants or managers of the Company’s healthcare properties operating in these states may be liable for punitive damage awards that are either not covered or are in excess of their insurance policy limits. From time to time, there may also be increases in government investigations of long-term care providers, as well as increases in enforcement actions resulting from these investigations. Insurance is not available to cover such losses. Any adverse determination in a legal proceeding or government investigation could lead to potential termination from government programs, large penalties and fines and otherwise have a material adverse effect on a facility operator’s financial condition. If a tenant or manager is unable to obtain or maintain insurance coverage, if judgments are obtained in excess of the insurance coverage, if a tenant or manager is required to pay uninsured punitive damages, or if a tenant or manager is subject to an uninsurable government enforcement action, the tenant or manager could be exposed to substantial additional liabilities, which could result in its bankruptcy or insolvency or have a material adverse effect on a tenant’s or manager’s business and its ability to meet its obligations to the Company.
Moreover, advocacy groups that monitor the quality of care at senior housing, acute care and post-acute care properties have sued facility operators and demanded that state and federal legislators enhance their oversight of trends in senior housing property ownership and quality of care. Patients have also sued operators of senior housing, acute care and post-acute care properties and have, in certain cases, succeeded in winning very large damage awards for alleged abuses. This litigation and potential future litigation may materially increase the costs incurred by the tenants and managers of the Company’s properties for monitoring and reporting quality of care compliance. In addition, the cost of medical malpractice and liability insurance has increased and may continue to increase so long as the present litigation environment affecting the operations of healthcare properties continues. Increased costs could limit the ability of the tenants and managers of the Company’s properties to meet their obligations to the Company, potentially decreasing the Company’s revenue and increasing its collection and litigation costs. To the extent the Company is required to remove or replace a manager, the Company’s revenue from the affected facility could be reduced or eliminated for an extended period of time.
Finally, if the Company leases a senior housing, acute care or post-acute care property to the Company’s TRS rather than leasing the property to a third-party tenant, the Company’s TRS will generally be the license holder and become subject to state licensing requirements and certain operating risks that apply to facility operators, including regulatory violations and third-party actions for negligence or misconduct. The TRS will have increased liability
31
Table of Contents
resulting from events or conditions that occur at the facility, including, for example, injuries to residents and deaths of residents at the facility. In the event the TRS incurs liability and a successful claim is made that the separate legal status of the TRS should be ignored for equitable or other reasons (i.e. a corporate veil piercing claim), the Company may also become liable for such matters. Insurance may not cover all such liabilities. Any negative publicity resulting from lawsuits related to the Company’s TRS status as a licensee could adversely affect the Company’s business reputation and ability to attract and retain residents in the Company’s leased properties, the Company’s ability to obtain or maintain licenses at the affected facility and other facilities, and the Company’s ability to raise additional capital.
Reductions in reimbursement from third-party payors, including Medicare and Medicaid, could adversely affect the profitability of tenants at any acute care and post-acute care healthcare properties that the Company may acquire, and hinder their ability to make rent payments to the Company.
Sources of revenue for tenants and operators at any acute care and post-acute care properties that the Company acquires include the federal Medicare program, state Medicaid programs, private insurance carriers and health maintenance organizations, among others. Efforts by these payors to reduce healthcare costs will likely continue, which may result in reductions or slower growth in reimbursement for certain services provided by some of these tenants. In addition, the failure of any of the Company’s tenants to comply with various laws and regulations could jeopardize their ability to continue participating in Medicare, Medicaid and other government-sponsored payment programs.
The healthcare property sector continues to face various challenges, including increased government and private payor pressure on healthcare providers to control or reduce costs. The Company believes that tenants at acute care and post-acute care properties will continue to experience a shift in payor mix away from fee-for-service payors, resulting in an increase in the percentage of revenues attributable to managed care payors, government payors and general industry trends that include pressures to control healthcare costs. Pressures to control healthcare costs and a shift away from traditional health insurance reimbursement have resulted in an increase in the number of patients whose healthcare coverage is provided under managed care plans, such as health maintenance organizations and preferred provider organizations. In addition, due to the aging of the population and the expansion of governmental payor programs, the Company anticipates that there will be a marked increase in the number of patients reliant on healthcare coverage provided by governmental payors. These changes could have a material adverse effect on the financial condition of tenants at the Company’s acute care and post-acute care properties.
Changes to Medicare and Medicaid budgets may adversely impact operations of certain acute care and post-acute care properties.
For post-acute care properties such as skilled nursing facilities, Medicare reimbursement has the greatest impact on performance and the Company believes it will continue to come under scrutiny given looming long-term budget issues with the aging of the population. Centers for Medicare and Medicaid Services (“CMS”) implements changes to Medicare budgets for various asset classes (i.e., skilled nursing facilities, inpatient hospitals, long-term acute care hospitals (“LTACHs”) and hospice) at the beginning of October for the next fiscal year. Changes to budgets for the different asset classes could significantly impact rent coverage ratios of operators. The latest round of CMS budget pronouncements for 2014 was largely within expectations and provided modest increases that were below inflation levels. However, LTACHs face a continued threat from CMS rulings on the 25% rule, which could reduce spending by 1.6%. The 25% rule serves to address CMS’ concern that LTACHs were receiving referrals from a related or host hospital to drive financial performance with no benefit to clinical outcomes. In order to avoid inappropriate referrals, the rule limits the proportion of patients who can be admitted from any one referral source or hospital to no more than 25% of total admissions, and admissions beyond 25% are to be paid at lower reimbursements.
The Company is exposed to various operational risks, liabilities and claims with respect to its senior housing, acute care and post-acute care properties that may adversely affect the Company’s ability to generate revenues and/or increase its costs.
Through the Company’s ownership of senior housing, acute care and post-acute care properties, the Company is exposed to various operational risks, liabilities and claims with respect to the Company’s properties in addition to those generally applicable to ownership of real property. These risks include fluctuations in occupancy levels, the inability to achieve economic resident fees (including anticipated increases in those fees), rent control regulations,
32
Table of Contents
and increases in labor costs (as a result of unionization or otherwise) and services. Any one or a combination of these factors, together with other market and business conditions beyond the Company’s control, could result in operating deficiencies at the Company’s senior housing, acute care and post-acute care properties, which could have a material adverse effect on the Company’s facility operators’ results of operations and their ability to meet their obligations to the Company and operate the properties effectively and efficiently, which in turn could adversely affect the Company.
Unanticipated expenses and insufficient demand for healthcare properties could adversely affect the Company’s profitability.
As part of the Company’s investment strategy, the Company may acquire senior housing, medical office buildings, acute and post-acute care properties in geographic areas where potential customers may not be familiar with the benefits of, and care provided by, that particular property. As a result, the Company may have to incur costs relating to the opening, operation and promotion of such properties that are substantially greater than those incurred in other areas where the properties are better known by the public. These properties may attract fewer residents or patients than other properties the Company acquires and may have increased costs, such as for marketing expenses, adversely affecting the results of operations of such properties as compared to those properties that are better known.
The Company’s failure or the failure of the tenants and managers of the Company’s properties to comply with licensing and certification requirements, the requirements of governmental programs, fraud and abuse regulations or new legislative developments may materially adversely affect the operations of the Company’s senior housing, acute care and post-acute care properties.
The operations of the Company’s senior housing, acute care and post-acute care properties are subject to numerous federal, state and local laws and regulations that are subject to frequent and substantial changes resulting from legislation, adoption of rules and regulations, and administrative and judicial interpretations of existing laws. The ultimate timing or effect of any changes in these laws and regulations cannot be predicted. Failure to obtain licensure or loss or suspension of licensure or certification may prevent a facility from operating or result in a suspension of certain revenue sources until all licensure or certification issues have been resolved. Properties may also be affected by changes in accreditation standards or procedures of accrediting agencies that are recognized by governments in the certification process. State laws may require compliance with extensive standards governing operations and agencies administering those laws regularly inspect such properties and investigate complaints. Failure to comply with all regulatory requirements could result in the loss of the ability to provide or bill and receive payment for healthcare services at the Company’s senior housing, acute care and/or post-acute care properties. Additionally, transfers of operations of certain facilities are subject to regulatory approvals not required for transfers of other types of commercial operations and real estate. The Company has no direct control over the tenant’s or manager’s ability to meet regulatory requirements and failure to comply with these laws, regulations and requirements may materially adversely affect the operations of these properties.
If the Company’s operators fail to cultivate new or maintain existing relationships with residents, community organizations and healthcare providers in the markets in which they operate, the Company’s occupancy percentage, payor mix and resident rates may deteriorate, which could have a material adverse effect on the Company’s business, financial condition and results of operations and the Company’s ability to make distributions to investors.
The Company continues to build relationships with several key senior housing and post-acute care operators upon whom the Company must depend to successfully market the Company’s facilities to potential residents and healthcare providers whose referral practices can impact the choices seniors make with respect to their housing. If the Company’s operators are unable to successfully cultivate and maintain strong relationships with these community organizations and other healthcare providers, occupancy rates at the Company’s facilities could decline, which could materially adversely affect the Company’s business, financial condition and results of operations and its ability to make distributions to investors.
33
Table of Contents
The Company cannot predict what the effect of new Healthcare Reform Laws or other healthcare proposals would have on those of the Company’s properties offering healthcare services and, thus, the Company’s business.
Healthcare, including the senior housing, medical office facilities, acute care and post-acute care sectors, remains a dynamic, evolving industry. On March 23, 2010, the Patient Protection and Affordable Care Act of 2010 was enacted and on March 30, 2010, the Health Care and Education Reconciliation Act was enacted, which in part modified the Patient Protection and Affordable Care Act (collectively, the “Healthcare Reform Laws”). Together, the Healthcare Reform Laws serve as the primary vehicle for comprehensive healthcare reform in the United States. The Healthcare Reform Laws are intended to reduce the number of individuals in the United States without health insurance and effect significant other changes to the ways in which healthcare is organized, delivered and reimbursed. The legislation became effective in a phased approach, beginning in 2010 and concluding in 2018. At this time, the effects of the legislation and its impact on the Company’s business are not yet known. The Company’s business could be materially and adversely affected by the Healthcare Reform Laws and further governmental initiatives undertaken pursuant to the Healthcare Reform Laws.
Government budget deficits could lead to a reduction in Medicare and Medicaid reimbursement.
If the U.S. experiences a weakening of the economy, states may be pressured to decrease reimbursement rates with the goal of decreasing state expenditures under state Medicaid programs. The need to control Medicaid expenditures may be exacerbated by the potential for increased enrollment in state Medicaid programs due to continued high unemployment, declines in family incomes and eligibility expansions authorized by the Healthcare Reform Laws. These potential reductions could be compounded by the potential for federal cost-cutting efforts that could lead to reductions in reimbursement rates under the federal Medicare program, state Medicaid programs and other healthcare-related programs. Potential reductions in reimbursements under these programs could negatively impact the Company’s business, financial condition and results of operations..
Adverse trends in healthcare provider operations may negatively affect the Company’s lease revenues and the Company’s ability to make distributions to the Company’s stockholders.
The healthcare industry currently is experiencing changes in the demand for and methods of delivering healthcare services; changes in third party reimbursement policies; significant unused capacity in certain areas, which has created substantial competition for patients among healthcare providers in those areas; continuing pressure by private and governmental payors to reduce payments to providers of services; and increased scrutiny of billing, referral and other practices by federal and state authorities. These factors may adversely affect the economic performance of some or all of the Company’s tenants and, in turn, the Company’s lease revenues and its ability to make distributions to the Company’s stockholders.
Termination of resident lease agreements could adversely affect the Company’s revenues and earnings for senior housing and post-acute care properties providing assisted living services.
Applicable regulations governing assisted living properties generally require written resident lease agreements with each resident. Most of these regulations also require that each resident have the right to terminate the resident lease agreement for any reason on reasonable notice or upon the death of the resident. The operators of senior housing and post-acute care properties cannot contract with residents to stay for longer periods of time, unlike typical apartment leasing arrangements with terms of up to one year or longer. In addition, the resident turnover rate in the Company’s properties may be difficult to predict. If a large number of resident lease agreements terminate at or around the same time, and if the Company’s units remained unoccupied, then the Company’s tenant’s ability to make scheduled rent payments to the Company or, with respect to certain of the Company’s senior housing and other healthcare properties lease to TRS entities, the Company’s operating results, the Company’s revenues and the Company’s earnings could be adversely affected.
Certain healthcare properties the Company acquires, such as medical office buildings, diagnostic service centers and surgery centers, may be unable to compete successfully.
Certain healthcare properties the Company acquires, such as medical office buildings, diagnostic service centers and surgery centers, often face competition from nearby hospitals and other medical office buildings that provide comparable services. Some of those competing properties are owned by governmental agencies and supported by tax revenues, and others are owned by nonprofit corporations and may be supported to a large extent by endowments and charitable contributions. These types of support are not available to the Company’s properties.
34
Table of Contents
Similarly, the Company’s tenants in such properties face competition from other medical practices in nearby hospitals and other medical properties. The Company’s tenants’ failure to compete successfully with these other practices could adversely affect their ability to make rental payments, which could adversely affect the Company’s rental revenues. Further, from time to time and for reasons beyond the Company’s control, referral sources, including physicians and managed care organizations, may change their lists of hospitals or physicians to which they refer patients. This could adversely affect the Company’s tenants’ ability to make rental payments, which could adversely affect its rental revenues.
Any reduction in rental revenues resulting from the inability of the Company’s medical office buildings and healthcare-related properties and the Company’s tenants to compete successfully may have a material adverse effect on the Company’s business, financial condition and results of operations and its ability to make distributions to its stockholders.
Some tenants of medical office buildings, diagnostic service centers, surgery centers, acute care properties and other healthcare properties are subject to fraud and abuse laws, the violation of which by a tenant may jeopardize the tenant’s ability to make rent payments to the Company.
There are various federal and state laws prohibiting fraudulent and abusive business practices by healthcare providers who participate in, receive payments from, or are in a position to make referrals in connection with government-sponsored healthcare programs, including the Medicare and Medicaid programs. Any lease arrangements the Company enter into with certain tenants could also be subject to these fraud and abuse laws concerning Medicare and Medicaid. These laws include:
| • | the Federal Anti-Kickback Statute, which prohibits, among other things, the offer, payment, solicitation or receipt of any form of remuneration in return for, or to induce, the referral of any item or service reimbursed by Medicare or Medicaid; |
| • | the Federal Physician Self-Referral Prohibition, which, subject to specific exceptions, restricts physicians from making referrals for specifically designated health services for which payment may be made under Medicare or Medicaid programs to an entity with which the physician, or an immediate family member, has a financial relationship; |
| • | the False Claims Act, which prohibits any person from knowingly presenting false or fraudulent claims for payment to the federal government, including claims paid by the Medicare and Medicaid programs; and |
| • | the Civil Monetary Penalties Law, which authorizes the U.S. Department of Health and Human Services to impose monetary penalties for certain fraudulent acts. |
Each of these laws includes criminal and/or civil penalties for violations that range from punitive sanctions, damage assessments, penalties, imprisonment, denial of Medicare and Medicaid payments and/or exclusion from the Medicare and Medicaid programs. Certain laws, such as the False Claims Act, allow for individuals to bring whistleblower actions on behalf of the government for violations thereof. Additionally, states in which the properties are located may have similar fraud and abuse laws. Investigation by a federal or state governmental body for violation of fraud and abuse laws or imposition of any of these penalties upon one of the Company’s tenants could jeopardize that tenant’s ability to operate or to make rent payments, which may have a material adverse effect on the Company’s business, financial condition and results of operations and the Company’s ability to make cash distributions.
The Company’s tenants may generally be subject to risks associated with the employment of unionized personnel for the Company’s senior housing, medical office buildings, acute care and post-acute care properties.
From time to time, the operations of any senior housing, medical office building, acute care and post-acute care properties may be disrupted through strikes, public demonstrations or other labor actions and related publicity. The Company or the Company’s tenants may also incur increased legal costs and indirect labor costs as a result of such
35
Table of Contents
disruptions, or contract disputes or other events. One or more of the Company’s tenants or the Company’s third-party managers operating some of these types of properties may be targeted by union actions or adversely impacted by the disruption caused by organizing activities. Significant adverse disruptions caused by union activities and/or increased costs affiliated with such activities could materially and adversely affect the Company’s operations and the financial condition of the senior housing and healthcare properties the Company own through a TRS and affect the operating income of the Company’s tenants for those properties the Company lease to third parties.
Construction and development projects are subject to risks that materially increase the costs of completion.
The Company develops and constructs new senior housing and healthcare properties or redevelops existing properties. In doing so, the Company is subject to risks and uncertainties associated with construction and development including, risks related to obtaining all necessary zoning, land-use, building occupancy and other governmental permits and authorizations, risks related to the environmental concerns of government entities or community groups, risks related to changes in economic and market conditions between development commencement and stabilization, risks related to construction labor disruptions, adverse weather, acts of God or shortages of materials which could cause construction delays and risks related to increases in the cost of labor and materials which could cause construction costs to be greater than projected.
The Company may not have control over construction on the Company’s properties.
The Company acquires sites on which a property the Company will own will be built, as well as sites that have existing properties (including properties that require renovation). The Company is subject to risks in connection with a developer’s ability to control construction costs and the timing of completion of construction or a developer’s ability to build in conformity with plans, specifications and timetables. A developer’s failure to perform may require legal action by the Company to terminate the development agreement or compel performance. The Company also incurs additional risks as it makes periodic payments or advances to developers prior to completion of construction. These and other factors can result in increased costs of a development project or loss of the Company’s investment. In addition, post-construction, the Company is subject to ordinary lease-up risks relating to newly-constructed projects.
Development and value add properties are expected to initially generate limited cash flows.
The Company has increased the level of its investment in new ground-up development and value add or stabilizing properties. During the construction and lease-phase, these types of investments are expected to initially generate limited cash flows, FFO and MFFO and may result in near term downward pressure on the Company’s net asset valuation.
Senior housing, acute care and post-acute care properties in which the Company invests may not be readily adaptable to other uses.
Senior housing, acute care and post-acute care properties in which the Company invests are specific-use properties that have limited alternative uses. Therefore, if the operations of any of the Company’s properties in these sectors become unprofitable for the Company’s tenant or operator or for the Company due to industry competition, a general deterioration of the applicable industry or otherwise, then the Company may have great difficulty re-leasing the property or developing an alternative use for the property and the liquidation value of the property may be substantially less than would be the case if the property were readily adaptable to other uses. Should any of these events occur, the Company’s income and cash available for distribution and the value of the Company’s property portfolio could be reduced.
The Company competes with other companies for investments and such competition may reduce the number of suitable acquisition opportunities that are available to the Company and adversely affect the Company’s ability to successfully acquire properties and other assets.
The Company competes with other companies and investors, including other REITs, real estate partnerships, mutual funds, institutional investors, specialty finance companies, opportunity funds, banks and insurance companies, for the acquisition of properties, loans and other real estate-related investments that the Company seeks to acquire or
36
Table of Contents
make. Some of the other entities that the Company competes with for acquisition opportunities will have substantially greater experience acquiring and owning the types of properties, loans or other real estate-related investments which the Company seeks to acquire or make, as well as greater financial resources and a broader geographic knowledge base than the Company has. As a result, competition may reduce the number of suitable acquisition opportunities available to the Company.
The Company will not control the management of the Company’s properties.
In order to maintain the Company’s status as a REIT for federal income tax purposes, the Company may not operate certain types of properties it acquires or participates in the decisions affecting their daily operations. The Company’s success, therefore, will depend on its ability to select qualified and creditworthy tenants or managers who can effectively manage and operate the properties. The Company’s tenants and managers will be responsible for maintenance and other day-to-day management of the properties or will enter into agreements with third-party operators. The Company’s financial condition will be dependent on the ability of third-party tenants and/or managers to operate the properties successfully. The Company generally enters into leasing agreements with tenants and management agreements with managers having substantial prior experience in the operation of the type of property being rented or managed; however, there can be no assurance that the Company will be able to make such arrangements. Additionally, if the Company elects to treat property it acquires as a result of a borrower’s default on a loan or a tenant’s default on a lease as “foreclosure property” for federal income tax purposes, the Company will be required to operate that property through an independent manager over whom it will not have control. If the Company’s tenants or third-party managers are unable to operate the properties successfully or if the Company selects unqualified managers, then such tenants and managers might not have sufficient revenue to be able to pay the Company’s rent, which could adversely affect the Company’s financial condition.
Since the Company’s properties leased to third-party tenants will generally be on a triple net or modified gross basis, the Company depends on its third-party tenants not only for rental income, but also to pay insurance, taxes, utilities and maintenance and repair expenses in connection with the leased properties. Any failure by the Company’s third-party tenants to effectively conduct their operations could adversely affect their business reputation and ability to attract and retain residents in the Company’s leased properties. The Company’s leases generally require such tenants to indemnify, defend and hold the Company harmless from and against various claims, litigation and liabilities arising in connection with the Company’s tenants’ respective businesses. The Company cannot assure investors that its tenants will have sufficient assets, income, access to financing and insurance coverage to enable it to satisfy these indemnification obligations. Any inability or unwillingness by the Company’s tenants to make rental payments to the Company or to otherwise satisfy their obligations under their lease agreements with the Company could adversely affect the Company.
The Company may not control its joint ventures.
The Company sometimes enters into joint ventures with unaffiliated parties to purchase a property or to make loans or other real estate-related investments, and the joint venture or general partnership agreement relating to that joint venture or partnership generally provides that the Company will share with the unaffiliated party management control of the joint venture. For example, the Company’s venture partners share approval rights on many major decisions. Those venture partners may have differing interests from the Company’s and the power to direct the joint venture or partnership on certain matters in a manner with which the Company does not agree. In the event the joint venture or general partnership agreement provides that the Company will have sole management control of the joint venture, the agreement may be ineffective as to a third party who has no notice of the agreement, and the Company may therefore be unable to control fully the activities of the joint venture. Should the Company enter into a joint venture with another program sponsored by an affiliate, the Company does not anticipate that the Company will have sole management control of the joint venture. In addition, when the Company invests in properties, loans or other real estate-related investments indirectly through the acquisition of interests in entities that own such properties, loans or other real estate-related investments, the Company may not be able to control the management of such assets which may adversely affect the Company’s REIT qualification, returns on investment and, therefore, cash available for distribution to the Company’s stockholders.
37
Table of Contents
Joint venture partners may have different interests than the Company has, which may negatively impact the Company’s control over the Company’s ventures.
Investments in joint ventures involve the risk that the Company’s co-venturer may have economic or business interests or goals which, at a particular time, are inconsistent with the Company’s interests or goals, that the co-venturer may be in a position to take action contrary to the Company’s instructions, requests, policies or objectives, or that the co-venturer may experience financial difficulties. Among other things, actions by a co-venturer might subject assets owned by the joint venture to liabilities in excess of those contemplated by the terms of the joint venture agreement or to other adverse consequences. This risk is also present when the Company makes investments in securities of other entities. If the Company does not have full control over a joint venture, the value of the Company’s investment will be affected to some extent by a third party that may have different goals and capabilities than the Company’s. As a result, joint ownership of investments and investments in other entities may adversely affect the Company’s REIT qualification, returns on investments and, therefore, cash available for distributions to the Company’s stockholders may be reduced.
It may be difficult for the Company to exit a joint venture after an impasse.
In the Company’s joint ventures, there is a potential risk of impasse in some business decisions because the Company’s approval and the approval of each co-venturer may be required for some decisions. In certain of the Company’s joint ventures, the Company has the right to buy the other co-venturer’s interest or to sell the Company’s own interest on specified terms and conditions in the event of an impasse regarding a sale. In the event of an impasse, it is possible that neither party will have the funds necessary to complete a buy-out. In addition, the Company may experience difficulty in locating a third-party purchaser for the Company’s joint venture interest and in obtaining a favorable sale price for the interest. As a result, it is possible that the Company may not be able to exit the relationship if an impasse develops.
Compliance with the Americans with Disabilities Act may reduce the Company’s expected distributions.
Under the Americans with Disabilities Act of 1992 (the “ADA”) all public accommodations and commercial properties are required to meet certain federal requirements related to access and use by disabled persons. Failure to comply with the ADA could result in the imposition of fines by the federal government or an award of damages to private litigants. Although the Company acquires properties that substantially comply with these requirements, the Company may incur additional costs to comply with the ADA. In addition, a number of federal, state, and local laws may require the Company to modify any properties the Company purchases or may restrict further renovations thereof with respect to access by disabled persons. Additional legislation could impose financial obligations or restrictions with respect to access by disabled persons. Although the Company believes that these costs will not have a material adverse effect on the Company, if required changes involve a greater amount of expenditures than the Company currently anticipates, the Company’s ability to make expected distributions could be adversely affected.
The Company’s properties may be subject to environmental liabilities that could significantly impact the Company’s return from the properties and the success of the Company’s ventures.
Operations at certain of the properties the Company acquires, or which are used to collateralize loans the Company may originate, may involve the use, handling, storage, and contracting for recycling or disposal of hazardous or toxic substances or wastes, including environmentally sensitive materials such as herbicides, pesticides, fertilizers, motor oil, waste motor oil and filters, transmission fluid, antifreeze, Freon, waste paint and lacquer thinner, batteries, solvents, lubricants, degreasing agents, gasoline and diesel fuels, and sewage. Accordingly, the operations of certain properties the Company acquires will be subject to regulation by federal, state, and local authorities establishing health and environmental quality standards. In addition, certain of the Company’s properties may maintain and operate underground storage tanks (“USTs”) for the storage of various petroleum products. USTs are generally subject to federal, state, and local laws and regulations that require testing and upgrading of USTs and the remediation of contaminated soils and groundwater resulting from leaking USTs.
As an owner of real estate, various federal and state environmental laws and regulations may require the Company to investigate and clean up certain hazardous or toxic substances, asbestos-containing materials, or petroleum products located on, in or emanating from the Company’s properties. Such laws often impose liability
38
Table of Contents
without regard to whether the owner knew of, or was responsible for, the release of hazardous substances. The Company may also be held liable to a governmental entity or to third parties for property damage and for investigation and cleanup costs incurred by those parties in connection with the contamination. In addition, some environmental laws create a lien on the contaminated site in favor of the government for damages and costs it incurs in connection with the contamination. Other environmental laws impose liability on a previous owner of property to the extent hazardous or toxic substances were present during the prior ownership period. A transfer of the property may not relieve an owner of such liability; therefore, the Company may have liability with respect to properties that the Company or the Company’s predecessors sold in the past.
The presence of contamination or the failure to remediate contamination at any of the Company’s properties may adversely affect the Company’s ability to sell or lease the properties or to borrow using the properties as collateral. While the Company’s leases are expected to provide that the tenant is solely responsible for any environmental hazards created during the term of the lease, the Company or an operator of a site may be liable to third parties for damages and injuries resulting from environmental contamination coming from the site.
The Company cannot be sure that all environmental liabilities associated with the properties that the Company acquires will have been identified or that no prior owner, operator or current occupant will have created an environmental condition not known to the Company. Moreover, the Company cannot be sure that: (i) future laws, ordinances or regulations will not impose any material environmental liability on the Company; or (ii) the environmental condition of the properties that it may acquire from time to time will not be affected by tenants and occupants of the properties, by the condition of land or operations in the vicinity of the properties (such as the presence of USTs), or by third parties unrelated to the Company. Environmental liabilities that the Company may incur could have an adverse effect on the Company’s financial condition, results of operations and ability to pay distributions.
In addition to the risks associated with potential environmental liabilities discussed above, compliance with environmental laws and regulations that govern the Company’s properties may require expenditures and modifications of development plans and operations that could have a detrimental effect on the operations of the properties and the Company’s financial condition, results of operations and ability to pay distributions to the Company’s stockholders. There can be no assurance that the application of environmental laws, regulations or policies, or changes in such laws, regulations and policies, will not occur in a manner that could have a detrimental effect on any property the Company may acquire.
The Company’s properties may contain or develop harmful mold, which could lead to liability for adverse health effects and costs of remediating the problem.
The presence of mold at any of the Company’s properties could require the Company to undertake a costly program to remediate, contain or remove the mold. Mold growth may occur when moisture accumulates in buildings or on building materials. Some molds may produce airborne toxins or irritants. Concern about indoor exposure to mold has been increasing because exposure to mold may cause a variety of adverse health effects and symptoms, including allergic or other reactions. The presence of mold could expose the Company to liability from the Company’s tenants, their employees and others if property damage or health concerns arise.
Legislation and government regulation may adversely affect the development and operations of properties the Company acquires.
In addition to being subject to environmental laws and regulations, certain of the development plans and operations conducted or to be conducted on properties the Company acquires require permits, licenses and approvals from certain federal, state and local authorities. Material permits, licenses or approvals may be terminated, not renewed or renewed on terms or interpreted in ways that are materially less favorable to the properties the Company purchases. Furthermore, laws and regulations that the Company or the Company’s operators are subject to may change in ways that are difficult to predict. There can be no assurance that the application of laws, regulations or policies, or changes in such laws, regulations and policies, will not occur in a manner that could have a detrimental effect on any property the Company may acquire, the operations of such property and the amount of rent it receives from the tenant of such property.
39
Table of Contents
The Company may be unable to obtain desirable types of insurance coverage at a reasonable cost, if at all, and the Company may be unable to comply with insurance requirements contained in mortgage or other agreements due to high insurance costs.
The Company may not be able either to obtain desirable types of insurance coverage, such as terrorism, earthquake, flood, hurricane and pollution or environmental matter insurance, or to obtain such coverage at a reasonable cost in the future, and this risk may limit the Company’s ability to finance or refinance debt secured by the Company’s prosperities. Additionally, the Company could default under debt or other agreements if the cost and/or availability of certain types of insurance make it impractical or impossible to comply with covenants relating to the insurance the Company is required to maintain under such agreements. In such instances, the Company may be required to self-insure against certain losses or seek other forms of financial assurance. The Company may not be able to obtain insurance coverage at reasonable rates due to high premium and/or deductible amounts. As a result, the Company’s cash flows could be adversely impacted due to these higher costs, which would adversely affect the Company’s ability to pay distributions to the Company’s stockholders.
Uninsured losses or losses in excess of insured limits could result in the loss or substantial impairment of one or more of the Company’s investments.
The nature of the activities at certain of the Company’s properties will expose the Company, the Company’s tenants and the Company’s operators to potential liability for personal injuries and, with respect to certain types of properties may expose the Company to property damage claims. The Company maintains, and requires the Company’s tenants and operators, as well as mortgagors to whom the Company has loaned money to maintain, insurance with respect to each of the Company’s properties that tenants lease or operate and each property securing a mortgage that the Company holds, including comprehensive liability, fire, flood and extended coverage insurance. There are, however, certain types of losses (such as from hurricanes, floods, earthquakes or terrorist attacks) that may be either uninsurable or not economically feasible to insure. Furthermore, an insurance provider could elect to deny or limit coverage under a claim. Should an uninsured loss or loss in excess of insured limits occur, the Company could lose all or a portion of the Company’s anticipated revenue stream from the affected property, as well as all or a portion of the Company’s invested capital. Accordingly, if the Company, as landlord, incurs any liability which is not fully covered by insurance, the Company would be liable for the uninsured amounts, cash available for distributions to stockholders may be reduced and the value of the Company’s assets may decrease significantly. In the case of an insurance loss, the Company might nevertheless remain obligated for any mortgage debt or other financial obligations related to the property.
The Company’s TRS structure subjects it to the risk of increased operating expenses.
The Company’s TRSs engage independent facility managers pursuant to management agreements and pay these managers a fee for operating the properties and reimburse certain expenses paid by these managers. However, the TRS receives all the operating profit or losses at the facility, net of corporate income tax, and the Company is subject to the risk of increased operating expenses.
The Company’s TRS structure subjects the Company to the risk that the leases with the Company’s TRSs do not qualify for tax purposes as arm’s-length, which would expose the Company to potentially significant tax penalties.
The Company’s TRSs generally will incur taxes or accrue tax benefits consistent with a “C” corporation. If the leases between the Company and the Company’s TRSs were deemed by the Internal Revenue Service to not reflect an arm’s-length transaction as that term is defined by tax law, the Company may be subject to significant tax penalties as the lessor that would adversely impact the Company’s profitability and the Company’s cash flows.
If the Company’s portfolio and risk management systems are ineffective, the Company may be exposed to material unanticipated losses.
The Company continues to refine the Company’s portfolio and risk management strategies and tools. However, the Company’s portfolio and risk management strategies may not fully mitigate the risk exposure of the Company’s operations in all economic or market environments, or against all types of risk, including risks that the Company might fail to identify or anticipate. Any failures in the Company’s portfolio and risk management strategies to accurately quantify such risk exposure could limit the Company’s ability to manage risks in the Company’s operations or to seek adequate risk-adjusted returns and could result in losses.
40
Table of Contents
Because not all REITs calculate MFFO the same way, the Company’s use of MFFO may not provide meaningful comparisons with other REITs.
The Company uses modified funds from operations, or “MFFO,” in order to evaluate the Company’s performance against other publicly registered, non-listed REITs, which intend to have limited lives with short and defined acquisition periods and targeted exit strategies shortly thereafter. Although we calculate our MFFO in compliance with IPA Practice Guideline 2010-01 — Supplemental Performance Measure for Publicly Registered, Non-Listed REITs: Modified Funds From Operations (“IPA PG 2010-01”) effective November 2, 2010, not all REITs calculate MFFO the same way. If REITs use different methods of calculating MFFO, it may not be possible for investors to meaningfully compare the performance of the Company to other REITs.
Changes in accounting pronouncements could adversely impact the Company’s or the Company’s tenants’ reported financial performance.
Accounting policies and methods are fundamental to how the Company records and reports its financial condition and results of operations. From time to time, the Financial Accounting Standards Board (“FASB”) and the Commission, entities that create and interpret appropriate accounting standards, may change the financial accounting and reporting standards or their interpretation and application of these standards that govern the preparation of the Company’s financial statements. These changes could have a material impact on the Company’s reported financial condition and results of operations. In some cases, the Company could be required to apply a new or revised standard retroactively, resulting in restating prior period financial statements.
A proposed change in U.S. accounting standards for leases could reduce the overall demand to lease the Company’s properties.
In order to address concerns raised by the Commission regarding the transparency of contractual lease obligations under the existing accounting standards for operating leases, the FASB, and the International Accounting Standards Board (“IASB”), initiated a joint project to develop new guidelines to lease accounting. Currently, accounting standards for leases require lessees to classify their leases as either capital or operating leases. Under a capital lease, both the leased asset, which represents the tenant’s right to use the property, and the contractual lease obligation are recorded on the tenant’s balance sheet if one of the following criteria are met: (i) the lease transfers ownership of the property to the lessee by the end of the lease term; (ii) the lease contains a bargain purchase option; (iii) the non-cancellable lease term is more than 75.0% of the useful life of the asset; or (iv) if the present value of the minimum lease payments equals 90.0% or more of the leased property’s fair value. If the terms of the lease do not meet these criteria, the lease is considered an operating lease, and no leased asset or contractual lease obligation is recorded by the tenant. The FASB and IASB, or collectively, the Boards, issued an Exposure Draft on May 16, 2013, (the “Exposure Draft”), which proposes substantial changes to the current lease accounting standards.
The Exposure Draft would create a new approach to lease accounting that would remove the old distinction between operating and capital leases, and require instead that all assets and liabilities arising from leases be recognized on the balance sheet. How leases with terms of more than 12 months are treated will now depend on how much of the economic benefit of the underlying asset the lessee is expected to consume, which in practice will generally come down to whether it’s a lease for real estate, including land and buildings, or for other property, such as equipment, aircraft or trucks. The Exposure Draft was subject to public comment through September 13, 2013.
The proposed changes could have a material impact on the Company’s tenants’ reported financial condition or results of operations and affect their preferences regarding leasing real estate. As a result, tenants may reassess their lease-versus-buy strategies. In such event, tenants may determine not to lease properties from the Company, or, if applicable, exercise their option to renew their leases with the Company. This could result in a greater renewal risk, a delay in investing proceeds from this offering, or shorter lease terms, all of which may negatively impact the Company’s operations and ability to pay distributions.
41
Table of Contents
The Company is highly dependent on information systems and their failure could significantly disrupt the Company’s business.
As a healthcare real estate company, the Company’s business will be highly dependent on communications and information systems, including systems provided by third parties for which the Company has no control. Any failure or interruption of the Company’s systems, whether as a result of human error or otherwise, could cause delays or other problems in the Company’s activities, which could have a material adverse effect on the Company’s financial performance.
Cyber security risks and cyber incidents could adversely affect the Company’s business and disrupt operations.
Cyber incidents can result from deliberate attacks or unintentional events. These incidents can include, but are not limited to, gaining unauthorized access to digital systems for purposes of misappropriating assets or sensitive information, corrupting data, or causing operational disruption. The result of these incidents could include, but are not limited to, disrupted operations, misstated financial data liability for stolen assets or information, increased cyber security protection costs, litigation and reputational damage adversely affecting customer or investor confidence.
Proposed changes to FINRA rules and regulations could have a material impact on the Company’s ability to raise capital through the Company’s offerings.
In March 2012, FINRA requested public comment through April 11, 2012 on its proposed amendment to NASD Rule 2340 to require that per share estimated values of non-traded REITs be reported on customer account statements and modify the account statement disclosures that accompany the per share estimated value. In April 2013, FINRA’s board of governors authorized the submission of the proposed amendment to the Commission. In February 2014, the Commission began soliciting comments on the proposed rule. In July 2014, FINRA requested that the Commission allow broker-dealers longer than originally sought in the proposed rule to implement any revised rule. As our managing dealer and participating brokers selling the Company’s common stock in the Company’s offerings are subject to FINRA rules and regulations, any significant changes to Rule 2340 or their firms’ policies could have a material impact on how the Company’s share price calculations and commissions are disclosed.
Lending Related Risks
Decreases in the value of the property underlying the Company’s mortgage loans and borrower defaults might decrease the value of the Company’s assets.
The mortgage loans in which the Company may invest will be collateralized by underlying real estate. When the Company makes these loans, the Company is at risk of default on these loans caused by many conditions beyond the Company’s control, including local and other economic conditions affecting real estate values and interest rate levels. The Company does not know whether the values of the properties collateralizing mortgage loans will remain at the levels existing on the dates of origination of the loans. If the values of the underlying properties drop or in some instances fail to rise, the Company’s risk will increase and the value of its assets may decrease.
If a borrower defaults under a mortgage, bridge or mezzanine loan the Company has made, the Company will bear the risk of loss of principal to the extent of any deficiency between the value of the collateral and the principal and accrued interest of the loan. In the event of the bankruptcy of a borrower, the loan to such borrower will be deemed to be collateralized only to the extent of the value of the underlying collateral at the time of bankruptcy (as determined by the bankruptcy court), and the lien securing the loan will be subject to the avoidance powers of the bankruptcy trustee or debtor-in-possession to the extent the lien is unenforceable under state law. Foreclosure on a loan can be an expensive and lengthy process, which could have a substantial negative effect on the Company’s anticipated return on the foreclosed loan. If the Company determines that the sale of a foreclosed property is in its best interest, delays in the sale of such property could negatively impact the price the Company receives and the Company may not be receiving any income from the property although the Company will be required to incur expenses, such as for maintenance costs, insurance costs and property taxes. The longer the Company is required to hold the property, the greater the potential negative impact on the Company’s revenues and results of operations. In addition, any restructuring, workout, foreclosure or other exercise of remedies with respect to loans that the Company has made or acquired could create income tax costs or make it more difficult for the Company to qualify
42
Table of Contents
as a REIT. Once the Company acquires a property by way of foreclosure or a deed in lieu of foreclosure or through a lease termination as a result of a tenant default, the Company may be subject to a 100% tax on net gain from a subsequent resale of that property under the prohibited transaction rules. Alternatively, if the Company makes an election to treat such property as “foreclosure property” under applicable income tax laws, the Company may avoid the 100% tax on prohibited transactions, but the net gain from the sale or operation of the property may be subject to corporate income tax at the highest applicable rate.
The loans the Company originates or invests in will be subject to interest rate fluctuations.
If the Company invests in fixed-rate, long-term loans and interest rates increase, the loans could yield a return that is lower than then-current market rates. Conversely, if interest rates decline, the Company will be adversely affected to the extent that loans are prepaid, because the Company may not be able to make new loans at the previously higher interest rate. If the Company invests in variable interest rate loans, if interest rates decrease, the Company’s revenues will likewise decrease.
If the Company sells properties by providing financing to purchasers, the Company will bear the risk of default by the purchaser.
The Company may, from time to time, sell a property or other asset by providing financing to the purchaser. There are no limits or restrictions on the Company’s ability to accept purchase money obligations secured by a mortgage as payment for the purchase price. The terms of payment to the Company will be affected by custom in the area where the property being sold is located and then-prevailing economic conditions. The Company will bear the risk of default by the purchaser and may incur significant litigation costs in enforcing its rights against the purchaser.
Financing Related Risks
Instability in the credit market and real estate market could have a material adverse effect on the Company’s results of operations and financial condition.
The Company may not be able to obtain financing for investments on terms and conditions acceptable to the Company, if at all. Currently, domestic and international financial markets have experienced unusual volatility and uncertainty. If this volatility and uncertainty persists, the Company’s ability to borrow monies to finance the purchase of, or other activities related to, real estate assets will be significantly impacted. If the Company is unable to borrow funds on terms and conditions that it finds acceptable, the Company likely will have to reduce the number of properties it can purchase, and the return on the properties the Company does purchase likely will be lower. In addition, if the Company pays fees to lock-in a favorable interest rate, falling interest rates or other factors could require it to forfeit these fees. Additionally, the reduction in equity and debt capital resulting from turmoil in the capital markets has resulted in fewer buyers seeking to acquire commercial properties leading to lower property values and the continuation of these conditions could adversely impact the Company’s timing and ability to sell the Company’s properties.
In addition to volatility in the credit markets, the real estate market is subject to fluctuation and can be impacted by factors such as general economic conditions, supply and demand, availability of financing and interest rates. To the extent the Company purchases real estate in an unstable market, the Company is subject to the risk that if the real estate market ceases to attract the same level of capital investment in the future that it attracts at the time of the Company’s purchases, or the number of parties seeking to acquire properties decreases, the value of the Company’s investments may not appreciate or may decrease significantly below the amount the Company pay for these investments.
The Company may enter into agreements with lenders which restrict the Company’s ability to pay distributions to investors.
The Company’s revolving credit facility contains limitations on distributions and the extent of allowable distributions. The Company’s revolving credit facility requires that allowable distributions not exceed 95% of adjusted FFO (as defined in the revolving credit facility agreement), and limits the minimum amount of distributions required to maintain the Company’s REIT status. These and other similar restrictions in loan agreements the Company may enter into impact the Company’s ability to pay distributions to you.
43
Table of Contents
Mortgage indebtedness and other borrowings will increase the Company’s business risks.
The Company sometimes acquires real estate properties and other real estate-related investments, including entity acquisitions, by assuming either existing financing collateralized by the asset or by borrowing new funds. In addition, the Company has incurred and may increase the Company’s mortgage debt by obtaining loans collateralized by some or all of the Company’s assets to obtain funds to acquire additional investments or to pay distributions to the Company’s stockholders. If necessary, the Company also may borrow funds to satisfy the requirement that the Company distribute at least 90% of the Company’s annual taxable income, or otherwise as is necessary or advisable to assure that the Company maintain the Company’s qualification as a REIT for federal income tax purposes.
The Company’s charter provides that it may not borrow more than 300% of the value of the Company’s net assets without the approval of a majority of the Company’s independent directors and the borrowing must be disclosed to the Company’s stockholders in the Company’s first quarterly report after such approval. Borrowing may be risky if the cash flow from the Company’s properties and other real estate-related investments is insufficient to meet the Company’s debt obligations. In addition, the Company’s lenders may seek to impose restrictions on future borrowings, distributions and operating policies, including with respect to capital expenditures and asset dispositions. If the Company mortgages assets or pledges equity as collateral and the Company cannot meet the Company’s debt obligations, then the lender could take the collateral, and the Company would lose the asset or equity and the income the Company were deriving from the asset.
The Company uses credit facilities to finance the Company’s investments, which may require the Company to provide additional collateral and significantly impact its liquidity position.
Some of the Company’s credit facilities contain mark-to-market provisions providing that if the market value of the commercial real estate debt or securities pledged by the Company declines in value due to credit quality deterioration, the Company may be required by the Company’s lenders to provide additional collateral or pay down a portion of the Company’s borrowings. In a weak economic environment, the Company would generally expect credit quality and the value of the commercial real estate debt or securities that serve as collateral for the Company’s credit facilities to decline, and in such a scenario it is likely that the terms of the Company’s credit facilities would require partial repayment from the Company, which could be substantial. Posting additional collateral to support the Company’s credit facilities could significantly reduce the Company’s liquidity and limit its ability to leverage its assets. In the event the Company does not have sufficient liquidity to meet such requirements, the Company’s lenders can accelerate the Company’s borrowings, which could have a material adverse effect on its business and operations.
The Company’s revenues are highly dependent on operating results of, and lease payments from, the Company’s properties. Defaults by the Company’s tenants would reduce the Company’s cash available for the repayment of the Company’s outstanding debt and for distributions.
The Company’s ability to repay any outstanding debt and make distributions to stockholders depends upon the ability of the Company’s tenants and managers to generate sufficient operating income to make payments to the Company, and their ability to make these payments will depend primarily on their ability to generate sufficient revenues in excess of operating expenses from businesses conducted on the Company’s properties. A tenant’s failure or delay in making scheduled rent payments to the Company may result from the tenant realizing reduced revenues at the properties it operates.
Defaults on the Company’s borrowings may adversely affect the Company’s financial condition and results of operations.
Defaults on loans collateralized by a property the Company owns may result in foreclosure actions and the Company’s loss of the property or properties securing the loan that is in default. Such legal actions are expensive. For tax purposes, in general a foreclosure would be treated as a sale of the property for a purchase price equal to the outstanding balance of the debt collateralized by the property. If the outstanding balance of the debt exceeds the Company’s tax basis in the property, the Company would recognize taxable income on the foreclosure, all or a portion of such taxable income may be subject to tax, and/or required to be distributed to the Company’s stockholders in order for the Company to qualify as a REIT. In such case, the Company would not receive any cash
44
Table of Contents
proceeds to enable it to pay such tax or make such distributions. If any mortgages contain cross collateralization or cross default provisions, more than one property may be affected by a default. If any of the Company’s properties are foreclosed upon due to a default, the Company’s financial condition, results of operations and ability to pay distributions to stockholders will be adversely affected.
Financing arrangements involving balloon payment obligations may adversely affect the Company’s ability to make distributions.
The Company sometimes enters into fixed-term financing arrangements which require it to make “balloon” payments at maturity. The Company’s ability to make a balloon payment at maturity is uncertain and may depend upon the Company’s ability to obtain additional financing or sell a particular property. At the time the balloon payment is due, the Company may not be able to raise equity or refinance the balloon payment on terms as favorable as the original loan or sell the property at a price sufficient to make the balloon payment. These refinancing or property sales could negatively impact the rate of return to stockholders and the timing of disposition of the Company’s assets. In addition, payments of principal and interest may leave the Company with insufficient cash to pay the distributions that the Company is required to pay to maintain its qualification as a REIT.
Increases in interest rates could increase the amount of the Company’s debt payments and adversely affect its ability to make distributions to its stockholders.
The Company also borrows money that bears interest at a variable rate and, from time to time, it may pay mortgage loans or refinance the Company’s properties in a rising interest rate environment. Accordingly, increases in interest rates could increase the Company’s interest costs, which could have a material adverse effect on the Company’s operating cash flow and its ability to make distributions to its stockholders.
Lenders may require the Company to enter into restrictive covenants relating to the Company’s operations, which could limit the Company’s ability to make distributions to its stockholders.
When providing financing, lenders may impose restrictions on the Company that affect the Company’s distributions, operating policies and ability to incur additional debt. Such limitations hamper the Company’s flexibility and may impair the Company’s ability to achieve its operating plans including maintaining the Company’s REIT status.
The Company may acquire various financial instruments for purposes of “hedging” or reducing the Company’s risks which may be costly and/or ineffective and will reduce the Company’s cash available for distribution to its stockholders.
The Company may engage in hedging transactions to manage the risk of changes in interest rates, price changes or currency fluctuations with respect to borrowings made or to be made, or ordinary obligations incurred or to be incurred, by the Company. The Company may use derivative financial instruments for this purpose, collateralized by the Company’s assets and investments. Derivative instruments may include interest rate swap contracts, interest rate cap or floor contracts, futures or forward contracts, options or repurchase agreements. The Company’s actual hedging decisions will be determined in light of the facts and circumstances existing at the time of the hedge and may differ from time to time. Hedging activities may be costly or become cost-prohibitive and the Company may have difficulty entering into hedging transactions.
To the extent that the Company uses derivative financial instruments to hedge against exchange rate and interest rate fluctuations, the Company will be exposed to credit risk, basis risk and legal enforceability risks. In this context, credit risk is the failure of the counterparty to perform under the terms of the derivative contract. If the fair value of a derivative contract is positive, the counterparty owes the Company, which creates credit risk for the Company. Basis risk occurs when the index upon which the contract is based is more or less variable than the index upon which the hedged asset or liability is based, thereby making the hedge less effective. Finally, legal enforceability risks encompass general contractual risks, including the risk that the counterparty will breach the terms of, or fail to perform its obligations under, the derivative contract. The Company may be unable to manage these risks effectively.
45
Table of Contents
Tax Related Risks
Failure to qualify as a REIT would adversely affect the Company’s operations and the Company’s ability to pay distributions to investors.
The Company intends to operate as a REIT under the Code and believes the Company has and will continue to operate as a REIT in such manner. However, qualification as a REIT involves the application of highly technical and complex Code provisions for which there are only limited judicial and administrative interpretations. The determination of various factual matters and circumstances not entirely within the Company’s control may also affect the Company’s ability to remain qualified as a REIT. If the Company fails to qualify as a REIT for any taxable year, (i) the Company will be subject to federal and state income tax, including any applicable alternative minimum tax, on the Company’s taxable income for that year at regular corporate rates, (ii) unless entitled to relief under relevant statutory provisions, the Company would generally be disqualified from taxation as a REIT for the four taxable years following the year of disqualification as a REIT; and (iii) distributions to stockholders would no longer qualify for the dividends paid deduction in computing the Company’s taxable income. If the Company does not qualify as a REIT, the Company would not be required to make distributions to stockholders as a non-REIT is not required to pay dividends to stockholders in order to maintain REIT status or avoid an excise tax. The additional income tax liability the Company would incur as a result of failing to qualify as a REIT would reduce the Company’s net earnings available for distributions to stockholders and also reduce the funds available for satisfying the Company’s obligations in general. If the Company fails to qualify as a REIT, the Company may be required to borrow funds or liquidate some investments in order to pay the applicable tax. As a result of all these factors, the Company’s failure to qualify as a REIT also could impair the Company’s ability to implement its business strategy and would adversely affect the value of its stock.
The Company’s leases may be re-characterized as financings which would eliminate depreciation deductions on the Company’s properties.
The Company believes that it would be treated as the owner of properties where the Company would own the underlying real estate, except with respect to leases structured as “financing leases,” which would constitute financings for federal income tax purposes. If the lease of a property does not constitute a lease for federal income tax purposes and is re-characterized as a secured financing by the Internal Revenue Service, then the Company believes the lease should be treated as a financing arrangement and the income derived from such a financing arrangement should satisfy the 75% and the 95% gross income tests for REIT qualification as it would be considered to be interest on a loan collateralized by real property. Nevertheless, the re-characterization of a lease in this fashion may have adverse tax consequences for the Company. In particular, the Company would not be entitled to claim depreciation deductions with respect to the property (although the Company should be entitled to treat part of the payments the Company would receive under the arrangement as the repayment of principal and not rent). In such event, in some taxable years the Company’s taxable income, and the corresponding obligation to distribute 90% of such income, would be increased. With respect to leases structured as “financing leases,” the Company will report income received as interest income and will not take depreciation deductions related to the real property. Any increase in the Company’s distribution requirements may limit the Company’s ability to invest in additional properties and to make additional mortgage loans. No assurance can be provided that the Internal Revenue Service would re-characterize such transactions as financings that would qualify under the 95% and 75% gross income tests.
Re-characterization of sale-leaseback transactions may cause the Company to lose the Company’s REIT status.
The Company sometimes purchase properties and lease them back to the sellers of such properties. While the Company uses the Company’s best efforts to structure any such sale-leaseback transaction so that the lease will be characterized as a “true lease,” thereby allowing the Company to be treated as the owner of the property for federal income tax purposes, the Internal Revenue Service could challenge such characterization. In the event that any sale-leaseback transaction is challenged and re-characterized as a financing transaction or loan for federal income tax purposes, deductions for depreciation and cost recovery relating to such property would be disallowed. If a sale-leaseback transaction were so re-characterized, the Company might fail to satisfy the REIT qualification “asset tests” or the “income tests” and, consequently, fail to qualify as a REIT status effective with the year of re-characterization. Alternatively, the amount of the Company’s taxable income could be recalculated, which might also cause the Company to fail to meet the distribution requirement for a taxable year.
46
Table of Contents
Excessive non-real estate asset values may jeopardize the Company’s REIT status.
In order to qualify as a REIT, among other requirements, at least 75% of the value of the Company’s assets must consist of investments in real estate, investments in other REITs, cash and cash equivalents and government securities. Accordingly, the value of any other property that is not considered a real estate asset for federal income tax purposes must represent in the aggregate not more than 25% of the Company’s total assets. In addition, under federal income tax law, the Company may not own securities in, or make loans to, any one company (other than a REIT, a qualified REIT subsidiary or a TRS) which represent in excess of 10% of the voting securities or 10% of the value of all securities of that company (other than certain securities), or which have, in the aggregate, a value in excess of 5% of the Company’s total assets, and the Company may not own securities of one or more TRSs which have, in the aggregate, a value in excess of 25% of the Company’s total assets.
The 75%, 25%, 10% and 5% REIT qualification tests are determined at the end of each calendar quarter. If the Company fails to meet any such test at the end of any calendar quarter, and such failure is not remedied within 30 days after the close of such quarter, the Company will cease to qualify as a REIT, unless certain requirements are satisfied.
The Company may have to borrow funds or sell assets to meet the Company’s distribution requirements.
Subject to some adjustments that are unique to REITs, a REIT generally must distribute 90% of its taxable income to its stockholders. For the purpose of determining taxable income, the Company may be required to accrue interest, rent and other items treated as earned for tax purposes, but that it has not yet received. In addition, the Company may be required not to accrue as expenses for tax purposes some items which actually have been paid, or some of the Company’s deductions might be subject to certain disallowance rules under the Code. As a result, the Company could have taxable income in excess of cash available for distribution. If this occurs, the Company may have to borrow funds or liquidate some of its assets in order to meet the distribution requirements applicable to a REIT.
Even as a REIT, the Company remains subject to various taxes which would reduce operating cash flow if and to the extent certain liabilities are incurred.
Even as a REIT, the Company is or could be subject to some federal, foreign and state and local taxes on the Company’s income and property that could reduce operating cash flow, including but not limited to: (i) tax on any undistributed taxable income; (ii) “alternative minimum tax” on the Company’s items of tax preference; (iii) certain state income taxes (because not all states treat REITs the same as they are treated for federal income tax purposes); (iv) a tax equal to 100% of net gain from “prohibited transactions”; (v) tax on net gains from the sale of certain “foreclosure property”; (vi) tax on gains of sale of certain “built-in gain” properties; and (vii) certain taxes and penalties if the Company fail to comply with one or more REIT qualification requirements, but nevertheless qualify to maintain the Company’s status as a REIT. Foreclosure property includes property with respect to which the Company acquires ownership by reason of a borrower default on a loan or possession by reason of a tenant’s default on a lease. The Company may elect to treat certain qualifying property as “foreclosure property,” in which case, the gross revenue and net gain from such property will be treated as qualifying income under the 75% and 95% gross income tests for three years following such acquisition. To qualify for such treatment, the Company must satisfy additional requirements, including that the Company operate the property through an independent contractor after a short grace period. The Company will be subject to tax on the Company’s net income from foreclosure property. Such net income generally means the excess of any gain from the sale or other disposition of foreclosure property and income derived from foreclosure property that otherwise does not qualify for the 75% gross income test, over the allowable deductions that relate to the production of such income. Any such tax incurred will reduce the amount of cash available for distribution.
The Company’s investment strategy may cause the Company to incur penalty taxes, fail to maintain the Company’s REIT status or own and sell properties through TRSs, each of which would diminish the return to the Company’s stockholders.
The sale of one or more of the Company’s properties may be considered a prohibited transaction under the Code. Any “inventory-like” sales would almost certainly be considered such a prohibited transaction. If the Company is deemed to have engaged in a “prohibited transaction” (i.e., the Company sell a property held by the Company primarily for sale in the ordinary course of the Company’s trade or business), all net gain that the Company derive from such sale would
47
Table of Contents
be subject to a 100% penalty tax. The Code sets forth a safe harbor for REITs that wish to sell property without risking the imposition of the 100% penalty tax. The principal requirements of the safe harbor are that: (i) the REIT must hold the applicable property for not less than two years for the production of rental income prior to its sale; (ii) the aggregate expenditures made by the REIT, or any partner of the REIT, during the two-year period preceding the date of sale which are includible in the basis of the property do not exceed 30% of the net selling price of the property; and (iii) the REIT does not make more than seven sales of property during the taxable year, the aggregate adjusted bases of property sold during the taxable year does not exceed 10% of the aggregate bases of all of the REIT’s assets as of the beginning of the taxable year or the fair market value of property sold during the taxable year does not exceed 10% of the fair market value of all of the REIT’s assets as of the beginning of the taxable year. Given the Company’s investment strategy, the sale of one or more of its properties may not fall within the prohibited transaction safe harbor.
If the Company desires to sell a property pursuant to a transaction that does not fall within the safe harbor, the Company may be able to avoid the prohibited transaction tax if the Company acquired the property through a TRS, or acquired the property and transferred it to a TRS for a non-tax business purpose prior to the sale (i.e., for a reason other than the avoidance of taxes). The Company may decide to forego the use of a TRS in a transaction that does not meet the safe harbor based on the Company’s own internal analysis, the opinion of counsel or the opinion of other tax advisors that the disposition will not be subject to the prohibited transaction tax. In cases where a property disposition is not effected through a TRS, the Internal Revenue Service could successfully assert that the disposition constitutes a prohibited transaction, in which event all of the net gain from the sale of such property will be payable as a tax which will have a negative impact on cash flow and the ability to make cash distributions.
As a REIT, the value of the Company’s ownership interests held in the Company’s TRSs may not exceed 25% of the value of all of the Company’s assets at the end of any calendar quarter. If the Internal Revenue Service were to determine that the value of the Company’s interests in all of the Company’s TRSs exceeded 25% of the value of the Company’s total assets at the end of any calendar quarter, then the Company would fail to qualify as a REIT. If the Company determines it to be in its best interest to own a substantial number of the Company’s properties through one or more TRSs, then it is possible that the Internal Revenue Service may conclude that the value of the Company’s interests in the Company’s TRSs exceeds 25% of the value of the Company’s total assets at the end of any calendar quarter and therefore cause the Company to fail to qualify as a REIT. Additionally, as a REIT, no more than 25% of the Company’s gross income with respect to any year may be from sources other than real estate. Distributions paid to the Company from a TRS are considered to be non-real estate income. Therefore, the Company may fail to qualify as a REIT if distributions from all of the Company’s TRSs, when aggregated with all other non-real estate income with respect to any one year, are more than 25% of the Company’s gross income with respect to such year.
Investors may have current tax liability on distributions investors elect to reinvest in the Company’s common stock.
Investors who participate in the Company’s distribution reinvestment plan will be deemed to have received, and for income tax purposes will be taxed on, the amount reinvested in shares of the Company’s common stock to the extent the amount reinvested was not a tax-free return of capital. In addition, investors will be treated for tax purposes as having received an additional distribution to the extent the shares are purchased at a discount to fair market value. As a result, unless investors are a tax-exempt entity, investors may have to use funds from other sources to pay a tax liability on the value of the shares of common stock received.
If the Company’s operating partnership fails to maintain its status as a partnership, the operating partnership’s income may be subject to taxation, which would reduce the cash available to the Company for distribution to its stockholders.
The Company maintains the status of its operating partnership as either a disregarded entity or an entity taxable as a partnership for federal income tax purposes. However, if the Internal Revenue Service were to successfully challenge the status of the operating partnership as a disregarded entity or an entity taxable as a partnership, the Company’s operating partnership would be taxable as a corporation. In such event, this would reduce the amount of distributions that the operating partnership could make to the Company. Additionally, this could also result in the Company’s failure to qualify as a REIT, and becoming subject to a corporate level tax on the Company’s taxable income. This would substantially reduce the cash available to the Company to pay distributions and the return on an investment. In addition, if any of the partnerships or limited liability companies through which the Company’s
48
Table of Contents
operating partnership owns its properties, in whole or in part, loses its characterization as a partnership or disregarded entity for federal income tax purposes, it would be subject to taxation as a corporation, thereby reducing distributions to the Company’s operating partnership. Such a re-characterization of an underlying property owner could also threaten the Company’s ability to maintain REIT status.
Equity participation in mortgage, bridge, mezzanine or other loans may result in taxable income and gains from these properties that could adversely impact the Company’s REIT status.
If the Company participates under a loan in any appreciation of the properties securing the mortgage loan or its cash flow and the Internal Revenue Service characterizes this participation as “equity” or as a “shared appreciation mortgage,” the Company might have to recognize income, gains and other items from the property as if an equity investor for federal income tax purposes. This could affect the Company’s ability to qualify as a REIT.
Tax related legislative or regulatory action could adversely affect the Company or an investment in the Company.
In recent years, numerous legislative, judicial and administrative changes have been made in the provisions of the federal income tax laws applicable to investments similar to an investment in shares of the Company’s common stock. Additional changes to the tax laws are likely to continue to occur, and the Company cannot assure investors that any such changes will not adversely affect the taxation of the Company’s stockholders. Any such changes could have an adverse effect on an investment in the Company’s shares or on the market value or the resale potential of the Company’s assets. Investors are urged to consult with their own tax advisor with respect to the impact of recent legislation and the status of legislative, regulatory or administrative developments on an investment in the Company’s shares. Investors also should note that the Company’s counsel’s tax opinion is based upon the Company’s representations and existing law and the regulations promulgated by the U.S. Department of Treasury, applicable as of the date of its opinion, all of which are subject to change, either prospectively or retroactively.
Although REITs continue to receive favorable tax treatment (a deduction for dividends paid), it is possible that future legislation would result in a REIT having fewer tax advantages, and it could become more advantageous for a company that invests in real estate to elect to be taxed for U.S. federal income tax purposes as a corporation. As a result, the Company’s charter provides its board of directors with the power, under certain circumstances, to revoke or otherwise terminate its REIT election and cause the Company to be taxed as a corporation, without the vote of the Company’s stockholders. The Company’s board of directors has fiduciary duties to the Company and the Company’s stockholders in accordance with the Maryland General Corporation Law and could only cause such changes in the Company’s tax treatment if it determines in good faith that such changes are in the best interest of its stockholders.
The lease of qualified health care properties to a TRS is subject to special requirements.
The Company leases certain qualified health care properties to TRSs (or limited liability companies of which the TRSs are members), which lessees contract with managers (or related parties) to manage the health care operations at these properties. The rents from this TRS lessee structure are treated as qualifying rents from real property if (1) they are paid pursuant to an arms-length lease of a qualified health care property with a TRS and (2) the manager qualifies as an eligible independent contractor (as defined in the Code). If any of these conditions are not satisfied, then the rents will not be qualifying rents and the Company might fail to meet the 95% and 75% gross income tests.
Risks Related to Investments by Tax-Exempt Entities and Benefit Plans Subject to ERISA
If the Company’s assets are deemed “plan assets” for the purposes of ERISA, the Company could be subject to excise taxes on certain prohibited transactions.
The Company believes that the Company’s assets will not be deemed to be “plan assets” for purposes of ERISA and/or the Code, but the Company has not requested an opinion of counsel to that effect, and no assurances can be given that the Company’s assets will never constitute “plan assets.” If the Company’s assets were deemed to be “plan assets” for purposes of ERISA and/or the Code, among other things, (a) certain of the Company’s transactions could constitute “prohibited transactions” under ERISA and the Code, and (b) ERISA’s prudence and other fiduciary standards would apply to the Company’s investments (and might not be met). Among other things, ERISA makes plan fiduciaries personally responsible for any losses resulting to the plan from any breach of fiduciary duty, and the Code imposes nondeductible excise taxes on prohibited transactions. If such excise taxes were imposed on the Company, the amount of funds available for the Company to make distributions to stockholders would be reduced.
49
Table of Contents
Risks Related to the Company’s Organizational Structure
The limit on the percentage of shares of the Company’s stock that any person may own may discourage a takeover or business combination that may benefit the Company’s stockholders.
The Company’s charter restricts the direct or indirect ownership by one person or entity to no more than 9.8%, by number or value, of any class or series of the Company’s equity securities (which includes common stock and any preferred stock the Company may issue). This restriction may deter individuals or entities from making tender offers for shares of the Company’s common stock on terms that might be financially attractive to stockholders or which may cause a change in the Company’s management. This ownership restriction may also prohibit business combinations that would have otherwise been approved by the Company’s board of directors and stockholders and may also decrease their ability to sell their shares of the Company’s common stock.
The Company’s board of directors can take many actions without stockholder approval which could have a material adverse effect on the distributions investors receive from the Company and/or could reduce the value of the Company’s assets.
The Company’s board of directors has overall authority to conduct the Company’s operations. This authority includes significant flexibility. For example, the Company’s board of directors can: (i) list the Company’s stock on a national securities exchange or include its stock for quotation on the National Market System of the NASDAQ Stock Market without obtaining stockholder approval; (ii) prevent the ownership, transfer and/or accumulation of shares in order to protect the Company’s status as a REIT or for any other reason deemed to be in the best interests of the stockholders; (iii) authorize and issue additional shares of any class or series of stock without obtaining stockholder approval, which could dilute an ownership interest; (iv) change the Company’s Advisor’s compensation, and employ and compensate affiliates; (v) direct the Company’s investments toward those that will not appreciate over time, such as loans and building-only properties, with the land owned by a third party; and (vi) establish and change minimum creditworthiness standards with respect to tenants. Any of these actions could reduce the value of the Company’s assets without giving investors, as stockholders, the right to vote.
Investors will be limited in their right to bring claims against the Company’s officers and directors.
The Company’s charter provides generally that a director or officer will be indemnified against liability as a director or officer so long as he or she performs his or her duties in accordance with the applicable standard of conduct and without negligence or misconduct in the case of the Company’s officers and non-independent directors, and without gross negligence or willful misconduct in the case of the Company’s independent directors. In addition, the Company’s charter provides that, subject to the applicable limitations set forth therein or under Maryland law, no director or officer will be liable to the Company or the Company’s stockholders for monetary or other damages. The Company’s charter also provides that, with the approval of the Company’s board of directors, the Company may indemnify the Company’s employees and agents for losses they may incur by reason of their service in such capacities so long as they satisfy these requirements. The Company has entered into separate indemnification agreements with each of the Company’s directors and executive officers. As a result, the Company and the Company’s stockholders may have more limited rights against these persons than might otherwise exist under common law. In addition, the Company may be obligated to fund the defense costs incurred by these persons in some cases.
The Company’s use of an operating partnership structure may result in potential conflicts of interest with limited partners other than the Company, if any, whose interests may not be aligned with those of the Company’s stockholders.
Limited partners other than the Company, if any, in the Company’s operating partnership will have the right to vote on certain amendments to the operating partnership agreement, as well as on certain other matters. Persons holding such voting rights may exercise them in a manner that conflicts with the interests of the Company’s stockholders. As general partner of the Company’s operating partnership, the Company is obligated to act in a manner that is in
50
Table of Contents
the best interest of all partners of the Company’s operating partnership. Circumstances may arise in the future when the interests of other limited partners in the operating partnership may conflict with the interests of the Company’s stockholders. These conflicts may be resolved in a manner stockholders do not believe are in their best interest.
| Item 1B. | Unresolved Staff Comments |
None.
51
Table of Contents
| Item 2. | Properties |
As of December 31, 2014, we had investments in 95 consolidated real estate properties. The following tables set forth details on our consolidated healthcare investment portfolio by asset class:
| Name and Location |
Structure |
Date Acquired |
Encumbrance at 12/31/2014 (in millions) |
Purchase Price (in millions) |
||||||||||
| Acute Care |
||||||||||||||
| Medical Portfolio I Properties |
||||||||||||||
| Doctors Specialty Hospital |
Modified Lease | 8/16/2013 | $ | 4.4 | $ | 10.0 | ||||||||
| Leawood, KS (“Kansas City”) |
||||||||||||||
| Houston Orthopedic & Spine Hospital (“HOSH”) |
Triple-net Lease | 6/2/2014 | 29.7 | 49.0 | ||||||||||
| Bellaire, TX (“Houston”) |
||||||||||||||
| Medical Portfolio II Properties |
||||||||||||||
| Hurst Specialty Hospital |
Modified Lease | 8/15/2014 | 19.1 | 29.5 | ||||||||||
| Hurst, TX (“Dallas/Fort Worth”) |
||||||||||||||
| Beaumont Specialty Hospital |
Modified Lease | 8/15/2014 | 21.8 | 33.6 | ||||||||||
| Beaumont, TX (“Houston”) |
||||||||||||||
| Medical Office |
||||||||||||||
| LaPorte Cancer Center |
Modified Lease | 6/14/2013 | 8.2 | 13.1 | ||||||||||
| Westville, IN |
||||||||||||||
| Knoxville Medical Office Properties |
||||||||||||||
| Physicians Plaza A at North Knoxville Medical Center |
Modified Lease | 7/10/2013 | 12.2 | 18.1 | ||||||||||
| Powell, TN (“Knoxville”) |
||||||||||||||
| Physicians Plaza B at North Knoxville Medical Center |
Modified Lease | 7/10/2013 | 14.7 | 21.8 | ||||||||||
| Powell, TN (“Knoxville”) |
||||||||||||||
| Physicians Regional Medical Center – Central Wing Annex |
Modified Lease | 7/10/2013 | 3.9 | 5.8 | ||||||||||
| Knoxville, TN |
||||||||||||||
| Jefferson Medical Commons |
Modified Lease | 7/10/2013 | 7.8 | 11.6 | ||||||||||
| Jefferson City, TN (“Knoxville”) |
||||||||||||||
| Medical Portfolio I Properties |
||||||||||||||
| John C. Lincoln Medical Office Plaza I |
Modified Lease | 8/16/2013 | 2.8 | 4.4 | ||||||||||
| Phoenix, AZ |
||||||||||||||
| John C. Lincoln Medical Office Plaza II |
Modified Lease | 8/16/2013 | 1.9 | 3.1 | ||||||||||
| Phoenix, AZ |
||||||||||||||
| North Mountain Medical Plaza |
Modified Lease | 8/16/2013 | 3.4 | 6.2 | ||||||||||
| Phoenix, AZ |
||||||||||||||
| Escondido Medical Arts Center |
Modified Lease | 8/16/2013 | 9.7 | 15.6 | ||||||||||
| Escondido, CA (“San Diego”) |
||||||||||||||
| Chestnut Commons Medical Office Building |
Modified Lease | 8/16/2013 | 12.5 | 20.2 | ||||||||||
| Elyria, OH (“Cleveland”) |
||||||||||||||
| Calvert Medical Office Properties |
||||||||||||||
| Calvert Medical Office Buildings I, II, & III |
Modified Lease | 8/30/2013 | 10.7 | 16.4 | ||||||||||
| Prince Frederick, MD (“Washington D.C.”) |
||||||||||||||
| Calvert Medical Arts Center |
Modified Lease | 8/30/2013 | 12.6 | 19.3 | ||||||||||
| Prince Frederick, MD (“Washington D.C.”) |
||||||||||||||
| Dunkirk Medical Center |
Modified Lease | 8/30/2013 | 3.0 | 4.6 | ||||||||||
| Dunkirk, MD (“Washington D.C.”) |
||||||||||||||
52
Table of Contents
| Name and Location |
Structure |
Date Acquired |
Encumbrance at 12/31/2014 (in millions) |
Purchase Price (in millions) |
||||||||||
| Coral Springs Medical Office Buildings |
||||||||||||||
| Coral Springs Medical Office Building I |
Modified Lease | 12/23/2013 | $ | — | $ | 14.9 | ||||||||
| Coral Springs, FL |
||||||||||||||
| Coral Springs Medical Office Building II |
Modified Lease | 12/23/2013 | — | 16.1 | ||||||||||
| Coral Springs, FL |
||||||||||||||
| Chula Vista Medical Arts Center |
Modified Lease | 12/23/2013 | — | 10.7 | ||||||||||
| Chula Vista, CA (“San Diego”) |
||||||||||||||
| Chula Vista Medical Arts Center |
Modified Lease | 1/21/2014 | — | 17.9 | ||||||||||
| Chula Vista, CA (“San Diego”) |
||||||||||||||
| HOSH Medical Office Building |
Modified Lease | 6/2/2014 | 19.9 | 27.0 | ||||||||||
| Bellaire, TX (“Houston”) |
||||||||||||||
| Claremont Medical Office |
Modified Lease | 8/29/2014 | 12.4 | 23.0 | ||||||||||
| Claremont, CA (“Los Angeles”) |
||||||||||||||
| Lee Hughes Medical Building |
Modified Lease | 9/29/2014 | 19.2 | 29.9 | ||||||||||
| Glendale, CA (“Los Angeles”) |
||||||||||||||
| Northwest Medical Park |
Modified Lease | 10/31/2014 | 7.1 | 10.8 | ||||||||||
| Margate, FL (“Fort Lauderdale”) |
||||||||||||||
| Newburyport Medical Center |
Modified Lease | 10/31/2014 | — | 18.0 | ||||||||||
| Newburyport, MA (“Boston”) |
||||||||||||||
| ProMed Medical Building I (1) |
Modified Lease | 12/19/2014 | — | 11.0 | ||||||||||
| Yuma, AZ |
||||||||||||||
| Southeast Medical Office Properties |
||||||||||||||
| Midtown Medical Plaza |
Modified Lease | 12/22/2014 | 30.2 | 54.7 | ||||||||||
| Charlotte, NC |
||||||||||||||
| Presbyterian Medical Tower |
Modified Lease | 12/22/2014 | 20.1 | 36.3 | ||||||||||
| Charlotte, NC |
||||||||||||||
| Metroview Professional Building |
Modified Lease | 12/22/2014 | 9.5 | 17.3 | ||||||||||
| Charlotte, NC |
||||||||||||||
| Physicians Plaza Huntersville |
Modified Lease | 12/22/2014 | 16.8 | 30.0 | ||||||||||
| Huntersville, NC (“Charlotte”) |
||||||||||||||
| Matthews Medical Office Building |
Modified Lease | 12/22/2014 | 11.8 | 21.2 | ||||||||||
| Matthews, NC (“Charlotte”) |
||||||||||||||
| Outpatient Care Center |
Modified Lease | 12/22/2014 | 11.0 | 15.5 | ||||||||||
| Clyde, NC (“Asheville”) |
||||||||||||||
| 330 Physicians Center |
Modified Lease | 12/22/2014 | 20.5 | 30.1 | ||||||||||
| Rome, GA |
||||||||||||||
| Spivey Station Physicians Center |
Modified Lease | 12/22/2014 | 10.0 | 14.4 | ||||||||||
| Atlanta, GA |
||||||||||||||
| Spivey Station ASC Building |
Modified Lease | 12/22/2014 | 12.8 | 18.6 | ||||||||||
| Atlanta, GA |
||||||||||||||
53
Table of Contents
| Name and Location |
Structure |
Date Acquired |
Encumbrance at 12/31/2014 (in millions) |
Purchase Price (in millions) |
||||||||||
| Post-Acute Care |
||||||||||||||
| Perennial Communities |
||||||||||||||
| Batesville Healthcare Center |
Triple-net Lease | 5/31/2013 | $ | 3.3 | $ | 6.2 | ||||||||
| Batesville, AR |
||||||||||||||
| Broadway Healthcare Center |
Triple-net Lease | 5/31/2013 | 6.3 | 11.8 | ||||||||||
| West Memphis, AR |
||||||||||||||
| Jonesboro Healthcare Center |
Triple-net Lease | 5/31/2013 | 8.1 | 15.2 | ||||||||||
| Jonesboro, AR |
||||||||||||||
| Magnolia Healthcare Center |
Triple-net Lease | 5/31/2013 | 6.3 | 11.8 | ||||||||||
| Magnolia, AR |
||||||||||||||
| Mine Creek Healthcare Center |
Triple-net Lease | 5/31/2013 | 1.8 | 3.4 | ||||||||||
| Nashville, AR |
||||||||||||||
| Searcy Healthcare Center |
Triple-net Lease | 5/31/2013 | 4.2 | 7.9 | ||||||||||
| Searcy, AR |
||||||||||||||
| Medical Portfolio II Properties |
||||||||||||||
| Oklahoma City Inpatient Rehabilitation Hospital |
Modified Lease | 7/15/2014 | 16.6 | 25.5 | ||||||||||
| Oklahoma City, OK |
||||||||||||||
| Las Vegas Inpatient Rehabilitation Hospital |
Modified Lease | 7/15/2014 | 14.5 | 22.3 | ||||||||||
| Las Vegas, NV |
||||||||||||||
| South Bend Inpatient Rehabilitation Hospital |
Modified Lease | 7/15/2014 | 13.1 | 20.2 | ||||||||||
| Mishawaka, IN (“South Bend”) |
||||||||||||||
| Senior Housing |
||||||||||||||
| Primrose I Communities |
||||||||||||||
| Primrose Retirement Community of Casper |
Triple-net Lease | 2/16/2012 | 12.3 | 18.8 | ||||||||||
| Casper, WY |
||||||||||||||
| Sweetwater Retirement Community |
Triple-net Lease | 2/16/2012 | 10.6 | 16.3 | ||||||||||
| Billings, MT |
||||||||||||||
| Primrose Retirement Community of Grand Island |
Triple-net Lease | 2/16/2012 | 8.7 | 13.3 | ||||||||||
| Grand Island, NE |
||||||||||||||
| Primrose Retirement Community of Mansfield |
Triple-net Lease | 2/16/2012 | 11.8 | 18.0 | ||||||||||
| Mansfield, OH |
||||||||||||||
| Primrose Retirement Community of Marion |
Triple-net Lease | 2/16/2012 | 9.8 | 17.7 | ||||||||||
| Marion, OH |
||||||||||||||
| HarborChase of Villages Crossing |
Managed | 8/29/2012 | 16.6 | 19.7 | ||||||||||
| Lady Lake, FL (“The Villages”) |
||||||||||||||
| Dogwood Forest of Acworth |
Managed | 12/18/2012 | 12.0 | 19.7 | ||||||||||
| Acworth, GA |
||||||||||||||
| Primrose II Communities |
||||||||||||||
| Primrose Retirement Community of Lima |
Triple-net Lease | 12/19/2012 | — | 18.6 | ||||||||||
| Lima, OH |
||||||||||||||
| Primrose Retirement Community of Zanesville |
Triple-net Lease | 12/19/2012 | 12.1 | 19.1 | ||||||||||
| Zanesville, OH (“Columbus”) |
||||||||||||||
| Primrose Retirement Community of Decatur |
Triple-net Lease | 12/19/2012 | 10.8 | 18.1 | ||||||||||
| Decatur, IL |
||||||||||||||
| Primrose Retirement Community of Council Bluffs |
Triple-net Lease | 12/19/2012 | — | 12.9 | ||||||||||
| Council Bluffs, IA (“Omaha”) |
||||||||||||||
| Primrose Retirement Community Cottages |
Triple-net Lease | 12/19/2012 | — | 4.3 | ||||||||||
| Aberdeen, SD |
||||||||||||||
54
Table of Contents
| Name and Location |
Structure |
Date Acquired |
Encumbrance at 12/31/2014 (in millions) |
Purchase Price (in millions) |
||||||||||
| Capital Health Communities |
||||||||||||||
| Brookridge Heights Assisted Living & Memory Care |
Managed | 12/21/2012 | $ | 7.4 | $ | 13.5 | ||||||||
| Marquette, MI |
||||||||||||||
| Curry House Assisted Living & Memory Care |
Managed | 12/21/2012 | 7.0 | 13.5 | ||||||||||
| Cadillac, MI |
||||||||||||||
| Symphony Manor |
Managed | 12/21/2012 | 13.6 | 24.0 | ||||||||||
| Baltimore, MD |
||||||||||||||
| Woodholme Gardens Assisted Living & Memory Care |
Managed | 12/21/2012 | 8.4 | 17.1 | ||||||||||
| Pikesville, MD (“Baltimore”) |
||||||||||||||
| Tranquillity at Fredericktowne |
Managed | 12/21/2012 | 7.2 | 17.0 | ||||||||||
| Frederick, MD |
||||||||||||||
| HarborChase of Jasper |
Managed | 8/1/2013 | — | 7.3 | ||||||||||
| Jasper, AL |
||||||||||||||
| South Bay I Communities |
||||||||||||||
| Raider Ranch |
Managed | 8/29/2013 | — | 55.0 | ||||||||||
| Lubbock, TX |
||||||||||||||
| Town Village |
Managed | 8/29/2013 | — | 22.5 | ||||||||||
| Oklahoma City, OK |
||||||||||||||
| Pacific Northwest I Communities |
||||||||||||||
| MorningStar of Billings |
Managed | 12/2/2013 | 20.2 | 48.3 | ||||||||||
| Billings, MT |
||||||||||||||
| MorningStar of Boise |
Managed | 12/2/2013 | 21.5 | 40.0 | ||||||||||
| Boise, ID |
||||||||||||||
| MorningStar of Idaho Falls |
Managed | 12/2/2013 | 18.4 | 44.4 | ||||||||||
| Idaho Falls, ID |
||||||||||||||
| MorningStar of Sparks |
Managed | 12/2/2013 | 24.4 | 55.2 | ||||||||||
| Sparks, NV (“Reno”) |
||||||||||||||
| Prestige Senior Living Arbor Place |
Managed | 12/2/2013 | 8.4 | 15.8 | ||||||||||
| Medford, OR |
||||||||||||||
| Prestige Senior Living Beaverton Hills |
Managed | 12/2/2013 | 9.5 | 12.9 | ||||||||||
| Beaverton, OR (“Portland”) |
||||||||||||||
| Prestige Senior Living Five Rivers |
Managed | 12/2/2013 | 7.9 | 16.7 | ||||||||||
| Tillamook, OR |
||||||||||||||
| Prestige Senior Living High Desert |
Managed | 12/2/2013 | 8.2 | 13.6 | ||||||||||
| Bend, OR |
||||||||||||||
| Prestige Senior Living Huntington Terrace |
Managed | 12/2/2013 | 10.5 | 15.0 | ||||||||||
| Gresham, OR (“Portland”) |
||||||||||||||
| Prestige Senior Living Orchard Heights |
Managed | 12/2/2013 | 12.7 | 17.8 | ||||||||||
| Salem, OR |
||||||||||||||
| Prestige Senior Living Riverwood |
Managed | 12/2/2013 | 4.6 | 9.7 | ||||||||||
| Tualatin, OR (“Portland”) |
||||||||||||||
| Prestige Senior Living Southern Hills |
Managed | 12/2/2013 | 7.7 | 12.9 | ||||||||||
| Salem, OR |
||||||||||||||
55
Table of Contents
| Name and Location |
Structure |
Date Acquired |
Encumbrance at 12/31/2014 (in millions) |
Purchase Price (in millions) |
||||||||||
| Pacific Northwest II Communities |
||||||||||||||
| Prestige Senior Living Auburn Meadows |
Managed | 2/3/2014 | $ | 10.8 | $ | 21.9 | ||||||||
| Auburn, WA (“Seattle”) |
||||||||||||||
| Prestige Senior Living Bridgewood |
Managed | 2/3/2014 | 13.5 | 22.1 | ||||||||||
| Vancouver, WA (“Portland”) |
||||||||||||||
| Prestige Senior Living Monticello Park |
Managed | 2/3/2014 | 18.9 | 27.4 | ||||||||||
| Longview, WA |
||||||||||||||
| Prestige Senior Living Rosemont |
Managed | 2/3/2014 | 9.7 | 16.9 | ||||||||||
| Yelm, WA |
||||||||||||||
| Prestige Senior Living West Hills |
Managed | 3/3/2014 | 9.0 | 15.0 | ||||||||||
| Corvallis, OR |
||||||||||||||
| South Bay II Communities |
||||||||||||||
| Isle at Cedar Ridge |
Managed | 2/28/2014 | — | 21.6 | ||||||||||
| Cedar Park, TX (“Austin”) |
||||||||||||||
| HarborChase of Plainfield |
Managed | 3/28/2014 | — | 26.5 | ||||||||||
| Plainfield, IL |
||||||||||||||
| Legacy Ranch Alzheimer’s Special Care Center |
Managed | 3/28/2014 | — | 12.0 | ||||||||||
| Midland, TX |
||||||||||||||
| The Springs Alzheimer’s Special Care Center |
Managed | 3/28/2014 | — | 10.9 | ||||||||||
| San Angelo, TX |
||||||||||||||
| Isle at Watercrest - Bryan |
Managed | 4/21/2014 | — | 22.1 | ||||||||||
| Bryan, TX |
||||||||||||||
| Watercrest at Bryan |
Managed | 4/21/2014 | — | 28.0 | ||||||||||
| Bryan, TX |
||||||||||||||
| Isle at Watercrest - Mansfield |
Managed | 5/5/2014 | — | 31.3 | ||||||||||
| Mansfield, TX (“Dallas/Fort Worth”) |
||||||||||||||
| Watercrest at Mansfield |
Managed | 6/30/2014 | 27.5 | 49.0 | ||||||||||
| Mansfield, TX (“Dallas/Fort Worth”) |
||||||||||||||
| Fairfield Village of Layton |
Managed | 11/20/2014 | — | 68.0 | ||||||||||
| Layton, UT (“Salt Lake City”) |
||||||||||||||
|
|
|
|
|
|||||||||||
| $ | 845.6 | $ | 1,865.4 | |||||||||||
|
|
|
|
|
|||||||||||
| Developments (2) |
||||||||||||||
| South Bay I Communities |
||||||||||||||
| Raider Ranch |
Development | 8/29/2013 | — | 7.0 | ||||||||||
| Lubbock, TX |
||||||||||||||
| Wellmore of Tega Cay |
Development | 2/7/2014 | 8.0 | 22.2 | ||||||||||
| Tega Cay, SC (“Charlotte”) |
||||||||||||||
| Watercrest at Katy |
Development | 6/27/2014 | — | 8.6 | ||||||||||
| Katy, TX (“Houston”) |
||||||||||||||
| HarborChase of Shorewood |
Development | 7/8/2014 | — | 9.3 | ||||||||||
| Shorewood, WI (“Milwaukee”) |
||||||||||||||
|
|
|
|
|
|||||||||||
| $ | 853.6 | $ | 1,912.5 | |||||||||||
|
|
|
|
|
|||||||||||
FOOTNOTES:
| (1) | Property owned through a consolidated joint venture in which we hold a 95% controlling interest. |
| (2) | Amounts include the cost of land and development budgets. See Item 1. “Business – Real Estate Under Development” for additional information relating to our senior housing community developments. |
56
Table of Contents
As of December 31, 2014, through an unconsolidated joint venture (“JV”), we had investments in five real estate properties. The following tables set forth details on the property holdings of our JV:
| Name |
Structure | Date Acquired |
Encumbrance at 12/31/2014 (in millions) |
Purchase Price (in millions) |
||||||||||
| Senior Housing |
||||||||||||||
| Windsor Manor I Communities - 75% JV Interest |
||||||||||||||
| Windsor Manor of Vinton |
Managed | 8/31/2012 | $ | 3.3 | $ | 5.8 | ||||||||
| Vinton, IA |
||||||||||||||
| Windsor Manor of Webster City |
Managed | 8/31/2012 | 3.0 | 6.8 | ||||||||||
| Webster City, IA |
||||||||||||||
| Windsor Manor of Nevada |
Managed | 8/31/2012 | 6.6 | 6.3 | ||||||||||
| Nevada, IA |
||||||||||||||
| Windsor Manor II Communities - 75% JV Interest |
||||||||||||||
| Windsor Manor of Indianola |
Managed | 4/2/2013 | 6.3 | 5.7 | ||||||||||
| Indianola, IA |
||||||||||||||
| Windsor Manor of Grinnell |
Managed | 4/2/2013 | 2.6 | 6.5 | ||||||||||
| Grinnell, IA |
||||||||||||||
|
|
|
|
|
|||||||||||
| $ | 21.8 | $ | 31.1 | |||||||||||
|
|
|
|
|
|||||||||||
Subsequent to December 31, 2014, we made additional investments in two consolidated real estate properties. The following tables set forth details on these additional investments by asset class as of March 18, 2015:
| Name |
Structure | Date Acquired |
Encumbrance (in millions) |
Purchase Price (in millions) |
||||||||||
| Medical Office |
||||||||||||||
| Novi Orthopedic Center |
Modified Lease | 2/13/2015 | $ | — | $ | 30.5 | ||||||||
| Novi, Michigan |
||||||||||||||
| Southeast Medical Office Properties |
||||||||||||||
| UT Cancer Institute |
Modified Lease | 2/20/2015 | — | 33.7 | ||||||||||
| Knoxville, TN |
||||||||||||||
|
|
|
|
|
|||||||||||
| $ | — | $ | 64.2 | |||||||||||
|
|
|
|
|
|||||||||||
| Item 3. | LEGAL PROCEEDINGS |
In the ordinary course of business, we may become subject to litigation or claims. There are no material pending legal proceedings known to be contemplated against us.
| Item 4. | MINE SAFETY DISCLOSURES |
None.
57
Table of Contents
PART II
| Item 5. | Market for Registrant’s Common Equity, Related Stockholder Matters and Issuer Purchases of Equity Securities |
Market Information
There is no established public trading market for our common stock. Therefore, there is a risk that a stockholder may not be able to sell our stock at a time or price acceptable to the stockholder, or at all. Unless and until our shares are listed on a national securities exchange, it is not expected that a public market for the shares will develop.
In August 2013, we adopted a valuation policy consistent with the IPA Valuation Guideline. The valuation process used by the Valuation Committee and the board of directors to determine the estimated NAV per share was designed to follow recommendations in the IPA Valuation Guideline and our valuation policy. In accordance with our valuation policy and in order to assist brokers in providing information on customer account statements consistent with the requirements of NASD Notice 01-08 and Financial Industry Regulatory Authority (“FINRA”) Rule 2340, we, based on the recommendation of the Valuation Committee and the approval of the board of directors, engaged CBRE Cap to assist us and the board of directors in determining the estimated NAV per share of our common stock as of September 30, 2014.
The following table details our historical Offering share prices, including the prices pursuant to our Reinvestment Plan since inception:
| Period |
Offering Price per Share |
Reinvestment Plan Price per Share |
||||||
| June 27, 2011 through December 10, 2013 |
$ | 10.00 | $ | 9.50 | ||||
|
|
|
|
|
|||||
| December 11, 2013 through November 3, 2014 |
$ | 10.14 | $ | 9.64 | ||||
|
|
|
|
|
|||||
| November 4, 2014 through date of this filing |
$ | 10.58 | $ | 10.06 | ||||
|
|
|
|
|
|||||
Stockholder Information
As of December 31, 2014, we had 34,012 stockholders of record. The number of stockholders is based on the records of DST Systems, Inc., who serves as our transfer agent.
Determination of Estimated Net Asset Value Per Share as of September 30, 2014 and Offering Price
The September 2014 Valuation and New Offering Price
In July 2014, the Valuation Committee initiated a process to estimate our NAV per share and engaged CBRE Cap to provide a report containing, among other things, a range for the NAV per share of our common stock (the “Valuation Report”). The Valuation Committee, upon its receipt and review of the Valuation Report, concluded that the range of between $9.00 and $10.03 for our estimated NAV per share proposed in CBRE Cap’s Valuation Report was reasonable, and recommended to our board of directors that it adopt $9.52 as the estimated NAV per share of our common stock. At a special meeting of our board of directors held on October 31, 2014, the board of directors accepted the recommendation of the Valuation Committee and approved $9.52 as the estimated NAV per share of our common stock as of September 30, 2014. Our board of directors also determined the new offering price to be $10.58 effective November 4, 2014 based on our $9.52 estimated NAV per share, plus selling commissions and marketing support fees.
58
Table of Contents
Valuation Methodologies
In preparing the Valuation Report, CBRE Cap, among other things:
| • | reviewed financial and operating information requested from or provided by our Advisor; |
| • | reviewed and discussed with our Advisor the historical and anticipated future financial performance of our properties, including forecasts prepared by our senior management, our Advisor, and our joint venture partners; |
| • | commissioned restricted use appraisals which contained analysis on each of our real property assets and performed analyses and studies for each property; |
| • | conducted or reviewed CBRE proprietary research, including market and sector capitalization rate surveys; |
| • | reviewed third-party research, including Wall Street equity reports and online data providers; |
| • | compared our financial information to similar information of companies that CBRE Cap deemed to be comparable; |
| • | reviewed our reports filed with the SEC, including our Annual Report on Form 10-K for the fiscal year ended December 31, 2013; and |
| • | the unaudited preliminary financial statements for the period ended September 30, 2014. |
Refer to our Form 8-K filed on November 4, 2014 for additional details on the estimated NAV per share, valuation methodologies, material assumptions, limitations and engagement of CBRE Cap.
Unregistered Sales of Equity Securities
During the period covered by this quarterly report, we did not sell any equity securities that were not registered under the Securities Act of 1933, and we did not repurchase any of our securities.
Securities Authorized for Issuance under Equity Compensation Plans
None.
Secondary Sales of Registered Shares between Investors
In July 2014, we became aware of transfers of 1,039 shares by investors. The shares were transferred at a sales price of $8.57 per share. We are not aware of any other transfers of shares by investors for the year ended December 31, 2014 and we are not aware of any other trades of our shares, other than previous purchases made in our public offerings and redemptions of shares by us.
Distributions
Distributions to our stockholders are governed by the provisions of our articles of incorporation. We intend to continue paying distributions to our stockholders on a quarterly basis. The amount or basis of distributions declared to our stockholders will be determined by our board of directors and is dependent upon a number of factors, including expected and actual net cash flow from operating activities, FFO, our financial condition, a balanced analysis of value creation reflective of both current and expected long-term stabilized cash flows from our properties, our objective of qualifying as a REIT for U.S. federal income tax purposes, the actual operating results of each month, economic conditions, other operating trends, capital requirements and avoidance of volatility of distributions.
On July 29, 2011, our board of directors authorized a distribution policy providing for monthly cash distribution of $0.03333 (which was equal to an annualized distribution rate of 4% based on our initial $10.00 offering price) together with stock distribution of 0.00250 shares of common stock (which is equal to an annualized distribution rate of 3% based on our initial $10.00 offering price) for a total annualized distribution of 7% on each outstanding share of common stock payable to all common stockholders of record as of the close of business on the first business day of each month. The distribution policy commenced on October 5, 2011, the day we received and accepted subscription proceeds exceeding $2.0 million and began our operations.
59
Table of Contents
In December 2013, in connection with the determination of our estimated NAV per share, our board of directors determined to increase the amount of monthly cash distributions to $0.03380 per share and together with monthly stock distributions of 0.00250 shares of common stock payable to all common stockholders of record as of the close of business on January 1, 2014.
In October 2014, in connection with the determination of our estimated NAV per share, our board of directors increased the amount of monthly cash distributions to $0.0353 per share together with monthly stock distributions of 0.0025 shares of common stock payable to all common stockholders of record as of the close of business on the first business day of each month beginning December 1, 2014. This change allows us to maintain our historical annual distribution rate of 4.0% in cash (based on the current $10.58 offering price) and 3% in stock (based on three shares for each 100 outstanding shares of common stock). The change will remain in effect until our board of directors determines otherwise.
For the years ended December 31, 2014, 2013 and 2012, we declared cash distributions of approximately $31.9 million, $14.2 million and $3.2 million, respectively. Of these amounts, approximately $14.2 million, $6.6 million and $1.5 million, respectively, were paid in cash to stockholders and approximately $17.7 million, $7.6 million and $1.7 million, respectively, were reinvested pursuant to our Reinvestment Plan. In addition, for the years ended December 31, 2014, 2013 and 2012, we declared and made stock distributions of approximately 2.4 million, 1.1 million and 0.2 million shares of common stock, respectively.
The tax composition of our distributions declared for years ended December 31, 2014, 2013 and 2012 were as follows:
| December 31, | ||||||||||||
| Distribution Type |
2014 | 2013 | 2012 | |||||||||
| Taxable as ordinary income |
30.8 | % | 0.0 | % | 0.0 | % | ||||||
|
|
|
|
|
|
|
|||||||
| Taxable as capital gain |
0.0 | % | 63.8 | % | 0.0 | % | ||||||
|
|
|
|
|
|
|
|||||||
| Return of capital |
69.2 | % | 36.2 | % | 100.0 | % | ||||||
|
|
|
|
|
|
|
|||||||
Due to a variety of factors, the characterization of distributions declared for the year ended December 31, 2014 may not be indicative of the characterization of distributions that may be expected for the year ending December 31, 2015. No amounts distributed to stockholders for the years ended December 31, 2014, 2013 and 2012 were required to be or have been treated as return of capital for purposes of calculating the stockholders’ return on their invested capital as described in our advisory agreement. In determining the apportionment between taxable income and return of capital, the amounts distributed to stockholders (other than amounts designated as capital gains dividends) in excess of current or accumulated Earnings and Profits (“E&P”) are treated as a return of capital to the stockholders. E&P is a statutory calculation which is derived from net income and determined in accordance with the Code. It is not intended to be a measure of the REIT’s performance, nor do we consider it to be an absolute measure or indicator of our source or ability to pay distributions to stockholders.
Approximately 66%, 87% and 100% of total distributions declared for 2014, 2013 and 2012, respectively, exceeded net cash provided by operating activities calculated on a quarterly basis in accordance with GAAP and, therefore, were considered funded from other sources for GAAP purposes. Net cash provided by operating activities calculated in accordance with GAAP includes deductions for acquisition fees and expenses, which we fund from other sources (i.e. Offering proceeds), and, therefore, is only one metric our board of directors considers in determining distributions.
The table in Item 5. “Market for Registrant’s Common Equity, Related Stockholder Matters and Issuer Purchases of Equity Securities – Use of Proceeds from Registered Securities” presents how we have used proceeds received from the Initial Offering, including amounts used to fund distributions since inception.
The table in Item 7. “Management’s Discussion and Analysis of Financial Condition and Results of Operations” presents total cash distributions declared and issued, including distributions reinvested in additional shares through our Reinvestment Plan, and net cash provided by (used in) operating activities for each quarter in the years ended December 31, 2014, 2013 and 2012.
60
Table of Contents
Redemption Plan
We have adopted a share redemption plan that allows our stockholders who hold shares for at least one year to request that we redeem between 25% and 100% of their shares. If we have sufficient funds available to do so and if we choose, at our sole discretion, to redeem shares, the number of shares we may redeem in any calendar year and the price at which they are redeemed are subject to conditions and limitations, including:
| • | If we elect to redeem shares, some or all of the proceeds from the sale of shares under our distribution reinvestment plan attributable to any quarter may be used to redeem shares presented for redemption during such quarter. In addition, we may use the unused amount of any offering proceeds available for use in future quarters to the extent not used to invest in assets or for other purposes; |
| • | No more than 5% of the weighted average number of shares of our common stock outstanding during such 12-month period may be redeemed during such 12-month period; and |
| • | Redemption pricing shall not exceed an amount equal to the lesser of (i) the then-current public offering price for our shares of common stock (other than the price at which the shares are sold under our Reinvestment Plan); and (ii) the purchase price paid by the stockholder. |
Our board of directors has the ability, in their sole discretion, to amend or suspend the redemption plan or to waive any specific conditions if it is deemed to be in our best interest.
During the years ended December 31, 2014 and 2013, we received requests for the redemption of common stock totaling approximately $3.0 million, of which $0.9 million was payable as of December 31, 2014 and paid in 2015. During the year ended December 31, 2013, we received requests for the redemption of common stock totaling approximately $0.8 million, of which approximately $0.1 million was payable as of December 31, 2013 and was paid in 2014. During the year ended December 31, 2012, we received and redeemed one redemption request for approximately $10,000.
The following tables present a summary of requests received and shares redeemed pursuant to our stock redemption plan during the quarters and years ended December 31, 2014, 2013 and 2012:
| 2014 Quarters |
First | Second | Third | Fourth | Total | |||||||||||||||
| Redemptions requested |
28,343 | 75,313 | 129,022 | 91,641 | 324,319 | |||||||||||||||
| Shares redeemed |
(28,343 | ) | (75,313 | ) | (129,022 | ) | (91,641 | ) | (324,319 | ) | ||||||||||
|
|
|
|
|
|
|
|
|
|
|
|||||||||||
| Average price paid per share |
$ | 9.13 | $ | 9.13 | $ | 9.13 | $ | 9.51 | $ | 9.24 | ||||||||||
|
|
|
|
|
|
|
|
|
|
|
|||||||||||
| 2013 Quarters |
First | Second | Third | Fourth | Total | |||||||||||||||
| Redemptions requested |
23,565 | 22,692 | 29,872 | 13,281 | 89,410 | |||||||||||||||
| Shares redeemed |
(23,565 | ) | (22,692 | ) | (29,872 | ) | (13,281 | ) | (89,410 | ) | ||||||||||
|
|
|
|
|
|
|
|
|
|
|
|||||||||||
| Average price paid per share |
$ | 9.30 | $ | 9.02 | $ | 9.43 | $ | 9.13 | $ | 9.25 | ||||||||||
|
|
|
|
|
|
|
|
|
|
|
|||||||||||
| 2012 Quarters |
First | Second | Third | Fourth | Total | |||||||||||||||
| Redemptions requested |
— | 1,049 | — | — | 1,049 | |||||||||||||||
| Shares redeemed |
— | (1,049 | ) | — | — | (1,049 | ) | |||||||||||||
|
|
|
|
|
|
|
|
|
|
|
|||||||||||
| Average price paid per share |
— | $ | 9.99 | — | — | $ | 9.99 | |||||||||||||
|
|
|
|
|
|
|
|
|
|
|
|||||||||||
61
Table of Contents
Issuer Purchases of Equity Securities
The following details our repurchases of securities between October 1, 2014 and December 31, 2014:
| Period |
Total number of shares purchased |
Average price paid per share |
Total number of shares purchased as part of a publically announced plan |
Maximum number of shares that may yet be purchased under the plan (1) |
||||||||||||
| October 1, 2014 through October 31, 2014 |
— | — | — | 1,554,816 | ||||||||||||
| November 1, 2014 through November 30, 2014 |
— | — | — | 1,640,872 | ||||||||||||
| December 1, 2014 through December 31, 2014 |
91,641 | $ | 9.51 | 91,641 | 1,650,809 | |||||||||||
|
|
|
|
|
|||||||||||||
| Total |
91,641 | $ | 9.51 | 91,641 | ||||||||||||
|
|
|
|
|
|||||||||||||
FOOTNOTE:
| (1) | This represents the maximum number of shares which can be redeemed under the redemption plan and is subject to a five percent limitation in a rolling 12-month period as described above. However, we are not obligated to redeem such amounts and this does not take into account the amount the board of directors has determined to redeem or whether there are sufficient proceeds under the Redemption Plan. Under the Redemption Plan, we can, at our discretion, use the full amount of the proceeds from the sale of shares under our Reinvestment Plan attributable to any month to redeem shares presented for redemption during such month. Any amount of proceeds from our Offerings, which are available for redemptions but remain unused, may be carried over to the next succeeding calendar quarter for use in addition to the amount of proceeds from our Offerings and Reinvestment Plan that would otherwise be available for redemptions. |
62
Table of Contents
Use of Proceeds from Registered Securities
On June 27, 2011, our registration statement (File No. 333-168129), covering a public offering of up to $3,000,000,000 in shares of common stock, was declared effective by the SEC and our Initial Offering commenced. In addition, our continuous Follow-on Offering was declared effective by the SEC on February 2, 2015 and is ongoing. The following table presents the use of proceeds from our Initial Offering, which are calculated based on quarterly cash flows since inception and represent the net proceeds used for such purposes on a cumulative basis as of December 31, 2014 (in thousands, except shares):
| Total | Payments to Affiliates (1) |
Payments to Others |
||||||||||
| Shares registered |
300,000,000 | |||||||||||
| Aggregate price of offering amount registered |
$ | 3,000,000 | ||||||||||
| Shares sold (2) |
112,985,776 | |||||||||||
| Aggregate amount sold (3) |
$ | 1,114,170 | ||||||||||
| Offering expenses (4) |
(125,466 | ) | $ | (81,075 | ) | $ | (44,391 | ) | ||||
|
|
|
|||||||||||
| Net offering proceeds to the issuer |
988,704 | |||||||||||
| Proceeds from borrowings, net of loan costs |
1,162,440 | |||||||||||
|
|
|
|||||||||||
| Total net offering proceeds and borrowings |
2,151,144 | |||||||||||
| Purchases of real estate and development costs |
(1,835,599 | ) | — | (1,835,599 | ) | |||||||
| Repayment of borrowings |
(143,710 | ) | — | (143,710 | ) | |||||||
| Payment of acquisition fees and expenses |
(59,574 | ) | (39,118 | ) | (20,456 | ) | ||||||
| Investments in unconsolidated entities |
(9,509 | ) | — | (9,509 | ) | |||||||
| Payment of distributions |
(3,911 | ) | (18 | ) | (3,893 | ) | ||||||
| Redemption of common stock |
(2,476 | ) | — | (2,476 | ) | |||||||
| Distribution to holder of promoted interest |
(2,000 | ) | — | (2,000 | ) | |||||||
| Operating expenses (5) |
(1,801 | ) | (1,466 | ) | (335 | ) | ||||||
| Payment of leasing costs |
(559 | ) | — | (559 | ) | |||||||
| Deposits on real estate |
(500 | ) | — | (500 | ) | |||||||
| Payment of lender deposits |
(150 | ) | — | (150 | ) | |||||||
|
|
|
|||||||||||
| Unused proceeds from Offering and borrowings |
$ | 91,355 | ||||||||||
|
|
|
|||||||||||
FOOTNOTES:
| (1) | Represents direct or indirect payments to directors, officers, or general partners of the issuer or their associates; to persons owning 10% or more of any class of equity securities of the issuer; and to affiliates of the issuer. |
| (2) | Excludes 22,222 unregistered shares of our common stock sold to the Advisor in June 2010 and approximately 3.7 million shares issued as stock distributions as of December 31, 2014. |
| (3) | Excludes dividend reinvestment proceeds of approximately $27.1 million. |
| (4) | Offering expenses paid to affiliates includes selling commissions and marketing support fees paid to the Managing Dealer of our Offerings (all or a portion of which may be paid to unaffiliated participating brokers by the Managing Dealer). Reimbursements to our Advisor of expenses of the Offerings that it has incurred on our behalf from unrelated parties such as legal fees, auditing fees, printing costs, and registration fees are included in payments to others for purposes of this table. |
| (5) | Until such time as we have sufficient operating cash flows from our assets to cover the full distribution, we will pay a portion of our distributions, debt service and/or operating expenses from net proceeds of our Offerings and/or borrowings. The amounts presented above are calculated based on quarterly cash flow since inception and represent the net proceeds used for such purposes on a cumulative basis as of December 31, 2014. |
63
Table of Contents
| Item 6. | SELECTED FINANCIAL DATA |
The following selected financial data for CNL Healthcare Properties, Inc. should be read in conjunction with “Item 7. – Management’s Discussion and Analysis of Financial Condition and Results of Operations” and “Item 8. – Financial Statements and Supplementary Data” (in thousands, except per share data):
| Years Ended December 31, | ||||||||||||||||||||
| 2014 | 2013 | 2012 | 2011(1) | 2010(1) | ||||||||||||||||
| Operating Data: |
||||||||||||||||||||
| Total revenues |
$ | 181,084 | $ | 52,605 | $ | 7,385 | $ | — | $ | — | ||||||||||
| Operating loss |
(23,178 | ) | (13,990 | ) | (6,043 | ) | (1,762 | ) | — | |||||||||||
| Net loss |
(52,511 | ) | (18,100 | ) | (10,720 | ) | (1,760 | ) | — | |||||||||||
| Weighted average shares outstanding (basic and diluted) (2) |
83,457 | 41,197 | 13,199 | 5,450 | — | |||||||||||||||
| Cash distributions declared and paid (3) |
31,919 | 14,170 | 3,197 | 56 | — | |||||||||||||||
| Cash distributions declared and paid per share |
0.38 | 0.34 | 0.24 | 0.01 | — | |||||||||||||||
| Cash provided by (used in) operating activities |
19,272 | 3,046 | (6,369 | ) | (1,085 | ) | — | |||||||||||||
| Cash used in investing activities |
(925,658 | ) | (643,792 | ) | (315,647 | ) | (400 | ) | — | |||||||||||
| Cash provided by financing activities |
953,532 | 666,693 | 330,276 | 11,286 | — | |||||||||||||||
| Other Data: |
||||||||||||||||||||
| FFO (4) |
10,797 | (3,054 | ) | (6,242 | ) | (1,760 | ) | — | ||||||||||||
| FFO per share |
0.13 | (0.07 | ) | (0.47 | ) | (0.32 | ) | — | ||||||||||||
| MFFO (4) |
32,017 | 12,581 | 797 | (868 | ) | — | ||||||||||||||
| MFFO per share |
0.38 | 0.31 | 0.06 | (0.16 | ) | — | ||||||||||||||
| As of December 31, | ||||||||||||||||||||
| 2014 | 2013 | 2012 | 2011 | 2010(1) | ||||||||||||||||
| Balance Sheet Data: |
||||||||||||||||||||
| Real estate assets, net |
$ | 1,704,653 | $ | 866,200 | $ | 238,873 | $ | — | $ | — | ||||||||||
| Intangibles, net |
140,264 | 52,400 | 7,024 | — | — | |||||||||||||||
| Cash |
91,355 | 44,209 | 18,262 | 10,002 | 201 | |||||||||||||||
| Total assets |
1,989,015 | 1,014,073 | 337,777 | 10,563 | 201 | |||||||||||||||
| Mortgage and other notes payable |
853,561 | 438,107 | 193,151 | — | — | |||||||||||||||
| Credit facilities |
206,403 | 98,500 | — | — | — | |||||||||||||||
| Total liabilities |
1,116,855 | 562,092 | 197,126 | 861 | 1 | |||||||||||||||
| Redeemable noncontrolling interest |
568 | — | — | — | — | |||||||||||||||
| Total equity |
872,160 | 451,981 | 140,651 | 9,702 | 200 | |||||||||||||||
FOOTNOTES:
| (1) | Significant operations commenced on October 5, 2011 when we received the minimum offering proceeds and approximately $2.3 million was released from escrow. The results of operations for the year ended December 31, 2011 include primarily general and administrative expenses and acquisition expenses. |
| (2) | For purposes of determining the weighted average number of shares of common stock outstanding, stock distributions are treated as if they were outstanding as of the beginning of each period presented. For the years ended December 31, 2014, 2013 and 2012, we declared and made stock distributions of approximately 2.4 million, 1.1 million and 0.2 million shares of common stock, respectively. In addition, we made stock distributions of approximately 0.9 million shares in March 2015. The distribution of new common shares to the recipients is non-taxable. |
64
Table of Contents
| (3) | For the years ended December 31, 2014, 2013, 2012 and 2011 our net loss was approximately $52.5 million, $18.1 million, $10.7 million and $1.8 million, respectively, while cash distributions declared were approximately $31.9 million, $14.2 million, $3.2 million and $0.06 million respectively, and total distributions declared were approximately $56.1 million, $24.8 million, $5.6 million and $0.1 million, respectively. For the years ended December 31, 2014, 2013, 2012 and 2011, approximately 60% , 23%, 0% and 0%, respectively, of cash distributions declared to stockholders were considered to be funded with cash provided by operating activities as calculated on a quarterly basis for GAAP purposes and approximately 40%, 77% 100% and 100%, respectively, were considered to be funded with other sources (i.e., Offering proceeds). For the years ended December 31, 2014, 2013, 2012 and 2011, approximately 34%, 13% 0% and 0%, respectively, of total distributions declared to stockholders were considered to be funded with cash provided by operating activities as calculated on a quarterly basis for GAAP purposes and approximately 66%, 87%, 100% and 100% respectively, of total distributions declared to stockholders were considered to be funded with other sources (i.e., proceeds from our Offerings). |
The tax composition of our distributions declared for the years ended December 31, 2014, 2013, 2012 and 2011 were as follows:
| December 31, | ||||||||||||||||
| Distribution Type |
2014 | 2013 | 2012 | 2011 | ||||||||||||
| Taxable as ordinary income |
30.8 | % | 0.0 | % | 0.0 | % | 1.9 | % | ||||||||
|
|
|
|
|
|
|
|
|
|||||||||
| Taxable as capital gain |
0.0 | % | 63.8 | % | 0.0 | % | 0.0 | % | ||||||||
|
|
|
|
|
|
|
|
|
|||||||||
| Return of capital |
69.2 | % | 36.2 | % | 100.0 | % | 98.1 | % | ||||||||
|
|
|
|
|
|
|
|
|
|||||||||
No amounts distributed to stockholders for the years ended December 31, 2014, 2013, 2012 and 2011 were required to be or have been treated as return of capital for purposes of calculating the stockholders’ return on their invested capital as described in our advisory agreement.
| (4) | Due to certain unique operating characteristics of real estate companies, as discussed below, National Association of Real Estate Investment Trust, (“NAREIT”), promulgated a measure known as FFO, which we believe to be an appropriate supplemental measure to reflect the operating performance of a REIT. The use of FFO is recommended by the REIT industry as a supplemental performance measure but is not equivalent to net income (loss) as determined under GAAP. |
We define FFO, a non-GAAP measure, consistent with the standards approved by the Board of Governors of NAREIT. NAREIT defines FFO as net income or loss computed in accordance with GAAP, excluding gains or losses from sales of property, asset impairment write-downs, plus depreciation and amortization, and after adjustments for unconsolidated partnerships and joint ventures. Our FFO calculation complies with NAREIT’s policy described above.
We define MFFO, a non-GAAP measure, consistent with the IPA, an industry trade group, Guideline 2010-01, Supplemental Performance Measure for Publicly Registered, Non-Listed REITs: MFFO, and the Practice Guideline, issued by the IPA in November 2010. The Practice Guideline defines MFFO as FFO further adjusted for the following items, as applicable, included in the determination of GAAP net income (loss): acquisition fees and expenses; amounts relating to deferred rent receivables and amortization of above and below market leases and liabilities (which are adjusted in order to remove the impact of GAAP straight-line adjustments from rental revenues); accretion of discounts and amortization of premiums on debt investments, mark-to-market adjustments included in net income; nonrecurring gains or losses included in net income from the extinguishment or sale of debt, hedges, foreign exchange, derivatives or securities holdings where trading of such holdings is not a fundamental attribute of the business plan, and unrealized gains or losses resulting from consolidation from, or deconsolidation to, equity accounting and after adjustments for consolidated and unconsolidated partnerships and joint ventures, with such adjustments calculated to reflect MFFO on the same basis.
FFO and MFFO are not necessarily indicative of cash flows available to fund cash needs and should not be considered (i) as an alternative to net income (loss), or net income (loss) from continuing operations, as an indication of our performance, (ii) as an alternative to cash flows from operating activities as an indication of our liquidity, or (iii) as indicative of funds available to fund our cash needs including our ability to make distributions to our stockholders. FFO and MFFO should not be construed as more relevant or accurate than the current GAAP methodology in calculating net income (loss) and its applicability in evaluating our operating performance.
See “Item 7. Management Discussion and Analysis of Financial Condition and Results of Operations” for additional disclosures relating to FFO and MFFO, including a reconciliation of net loss to FFO and MFFO for the years ended December 31, 2014, 2013 and 2012.
65
Table of Contents
| Item 7. | MANAGEMENT’S DISCUSSION AND ANALYSIS OF FINANCIAL CONDITION AND RESULTS OF OPERATIONS |
Overview
CNL Healthcare Properties, Inc. is a Maryland corporation incorporated on June 8, 2010 that qualified as a REIT for U.S. federal income tax purposes beginning with the year ended December 31, 2012.
Our Advisor and Property Manager are each wholly owned by affiliates of our sponsor, which is an affiliate of CNL, a private investment management firm providing global real estate and alternative investments. Our Advisor is responsible for managing our affairs on a day-to-day basis and for identifying, recommending and executing acquisitions and dispositions on our behalf pursuant to an advisory agreement. Substantially all of our acquisition, operating and administrative services, as well as certain property management services, are provided by sub-advisors to the Advisor and the Property Manager. In addition, certain unrelated property managers have been engaged to provide property management services under RIDEA structures.
On June 27, 2011, we commenced our Initial Offering of up to $3.0 billion of common stock, including shares being offered through our Reinvestment Plan, pursuant to a registration statement on Form S-11 under the Securities Act of 1933. Additionally, we filed a follow-on registration statement on Form S-11 with the SEC in connection with the proposed Follow-On Offering of up to $1 billion in shares of common stock. We extended the Initial Offering through the effective date of our subsequent continuous Follow-On Offering, which occurred on February 2, 2015. We expect to sell shares of our common stock in the Follow-On Offering until the earlier of the date on which the maximum offering amount has been sold, or December 31, 2015; provided, however, that we will periodically evaluate the status of the offering, and our board of directors may extend the offering beyond December 31, 2015 after taking into account such factors as it deems appropriate, including but not limited to, the amount of capital raised, future acquisition opportunities, and economic or market trends.
Our investment focus is on acquiring a diversified portfolio of healthcare real estate or real estate-related assets, primarily in the United States, within the senior housing, medical office, post-acute care and acute care asset classes. We believe recent demographic trends and strong supply and demand indicators present a compelling case for an investment focus on the acquisition of healthcare real estate or real estate-related assets. We believe that our investment focus on the healthcare industry will continue to provide more attractive opportunities as compared to other asset sectors. See Item 1. “Business – Investment Objectives and Strategy” for additional discussion of our investment focus.
For a description of the individual property holdings by asset class included in our healthcare real estate portfolio, including the location, date acquired, and purchase price, as of December 31, 2014, see Item 2. “Properties.”
Industry Trends
The primary drivers behind demand for healthcare real estate or real estate-related assets are the aging of the United States (“U.S.”) population and growth in national healthcare expenditures caused in part by recent federally enacted healthcare reform, The Patient Protection and Affordable Care Act (the “Affordable Care Act”).
Expanded Healthcare Insurance Coverage. As the U.S. population over the age of 65 increases, there will be a larger population of older Americans entitled to Medicare to cover their increasing healthcare needs and related costs. In addition, under the Affordable Care Act and other legislation, private healthcare insurance will be expanded to cover larger percentages of non-elderly, lower income populations. In “Updated Estimates for the Insurance Coverage Provisions of the Affordable Care Act,” dated March 2012, the Congressional Budget Office predicts that, as a result of the Affordable Care Act, approximately 93% of legal, non-elderly Americans are projected to have insurance coverage by 2022, compared with 82% in 2012 prior to the Affordable Care Act, and the number of uninsured Americans will be reduced by about 30 million people. We believe the resulting expansion of U.S. healthcare insurance coverage will create an increase in demand for healthcare services and related properties.
66
Table of Contents
Additionally, the National Real Estate Investor, in an article entitled “Health Care Reform: Boon for Commercial Real Estate?” dated March 24, 2010, estimates that the additional 32 million Americans covered by the new Affordable Care Act will require an additional 64 million square feet of medical office space. According to the Bank of America Merrill Lynch Global Research Report, “Healthcare REITs: a defensive play on aging demographics” dated September 24, 2013” (the “BofA Report”), growth in the need for medical office buildings is expected to increase by 30% over the next 10 years as a result of the increase in the number of additional insureds in the U.S. Moreover, there are indications that significant opportunities for consolidation exist in the healthcare real estate industry, which we believe will create value as our portfolio grows and achieves scale. The BofA Report projects that the total value of healthcare real estate ranges from $700 billion to over $1 trillion, with REIT ownership accounting for only 14% of the total, meaning the industry remains fragmented and provides opportunity for growth through consolidation.
The Aging of America. According to a July 2013 report of the U.S. Census Bureau, 10,000 people in the U.S. will turn 65 every day until 2050. By 2050, 84 million Americans or 21% of the U.S. population will be 65 years or older, compared to 14% of the population in 2012, an anticipated increase of 94% in the senior population between 2012 and 2050. “A Projection of Demand for Market Rate U.S. Seniors Housing 2010–2013” Special Issue Brief by the American Senior Housing Association and Senior Housing Analytics, Winter 2013 projects that the U.S. population over the age of 75 from 2010 to 2030 will increase by 84%, almost double the rate of the prior twenty years (43% from 1990–2010).
The 1990 Americans With Disabilities Act defines “disability” as a substantial limitation in a major life activity. Research indicates that age is positively correlated with the presence of a physical disability, and the oldest have the highest levels of both physical and cognitive disabilities. With the increased age of the U.S. population, the healthcare system faces an increase in the population with age-related physical and cognitive disabilities, which requires increased senior housing options, as well as increased demand for health-care facilities for physician management of such disabilities.
Since 2006 there has been only modest growth in the total national inventory according to the National Investment Center for Senior Housing and Care Industry (“NIC”) data with compound annual growth rate of -0.3% for skilled nursing facilities, 1.7% for assisted living facilities and 1.9% for independent living facilities. However, new units under construction are increasing. Muted supply growth has helped rental levels recover and occupancy improve despite a modest economic recovery. According to data from the NIC Map Monitor for the fourth quarter of 2014, overall senior housing occupancy was 90.5% in Q4 2014.
Rising Healthcare Expenditures. The rise in the aging population, the increase in an insured population and medical technology innovations contribute to increasing healthcare expenditures. Healthcare is the largest industry component of the U.S. gross domestic product. According to the Centers for Medicare & Medicaid Services, National Healthcare Expenditure Projections 2012-2022, during such period, U.S. healthcare expenditures are projected to rise from $2.8 to $5.0 trillion by 2022, comprising 19.9% of U.S. gross domestic product, and growing at an average annual rate of 6.2% between 2015 and 2022.
In addition, rising healthcare costs create pressure within the healthcare industry to move from an inpatient to an outpatient delivery setting in order to provide service more efficiently and contain costs. The outpatient model of healthcare services results in declining hospital stays and increasing outpatient procedures. Almost 65% of all surgeries today do not require an overnight hospital stay, compared with only 16% of all surgeries in 1980 according to “The Outlook for Healthcare,” a report of the Urban Land Institute published in 2011. Technology advances are also driving patient demand for more medical services and the space in which to deliver them. The shift to outpatient surgeries also continues to be encouraged by technological advances that involve smaller incisions, improved anesthetics, less risk of infection, and faster recoveries. We believe that these trends support increased demand for healthcare related real estate in the future.
67
Table of Contents
Liquidity and Capital Resources
General
Our primary source of capital has been, and is expected to continue to be, proceeds we receive from our Offerings. Our principal demands for funds will be for:
| • | the acquisition of real estate and real estate-related assets, |
| • | the payment of offering and operating expenses, |
| • | the payment of debt service on our outstanding indebtedness, and |
| • | the payment of distributions. |
Generally, we expect to meet cash needs for items other than acquisitions from our cash flows from operations, and we expect to meet cash needs for acquisitions from net proceeds from our Offerings and borrowings. However, until such time as we are fully invested, we may continue to use proceeds from our Offerings and borrowings to pay a portion of our operating expenses, distributions and debt service.
We intend to strategically leverage our real properties and possibly other assets and use debt as a means of providing additional funds for the acquisition of properties and the diversification of our portfolio. Our ability to increase our diversification through borrowing could be adversely affected by credit market conditions which result in lenders reducing or limiting funds available for loans, including loans collateralized by real estate. We may also be negatively impacted by rising interest rates on any unhedged variable rate debt or the timing of when we seek to refinance existing debt. During times when interest rates on mortgage loans are high or financing is otherwise unavailable on a timely basis, we may purchase certain properties for cash with the intention of obtaining a mortgage loan for a portion of the purchase price at a later time. In addition, we will continue to evaluate the need for additional interest rate swaps on unhedged variable rate debt.
Potential future sources of capital include proceeds from collateralized or uncollateralized financings from banks or other lenders, proceeds from the sale of properties, other assets and undistributed operating cash flows. If necessary, we may use financings or other sources of capital in the event of unforeseen significant capital expenditures.
The number of properties, loans and other permitted investments we may acquire or make will depend on the number of shares sold through our Offerings of common stock and the resulting amount of the net offering proceeds available for investment.
Sources of Liquidity and Capital Resources
Common Stock Offering
For the years ended December 31, 2014, 2013 and 2012, we received offering proceeds of approximately $554.6 million, $379.8 million and $166.5 million respectively. During the period from January 1, 2015 through March 18, 2015, we received additional subscription proceeds of approximately $164.8 million (15.6 million shares).
Our Follow-On Offering was declared effective on February 2, 2015 and we expect to sell shares of our common stock until the earlier of the date on which the maximum offering amount of $1 billion has been sold, or December 31, 2015; provided, however, that we will periodically evaluate the status of the offering, and our board of directors may extend the offering beyond December 31, 2015 after taking into account such factors as it deems appropriate, including but not limited to, the amount of capital raised, future acquisition opportunities, and economic or market trends.
As of December 31, 2014, we had unused offering proceeds of approximately $91.4 million as cash on hand. We plan to use the available uncommitted cash on hand as of December 31, 2014, as well as additional borrowings and offering proceeds obtained subsequently, to acquire additional healthcare real estate and real estate-related assets.
Borrowings
In December 2014, we amended and restated the terms of our credit agreement with KeyBank, as administrative agent, (“Amended Credit Agreement”) by entering into a $230 million senior unsecured revolving credit facility (“Revolving Credit Facility”) and a $175 million senior unsecured term loan facility (“Term Loan Facility” and,
68
Table of Contents
collectively, “Credit Facilities”). Pursuant to the Amended Credit Agreement, we have the ability to increase the collective borrowings under the Credit Facilities up to $700 million. Moreover, the Revolving Credit Facility has an initial term of 36 months plus two 12-month extension options; whereas, the Term Loan Facility has an initial term of 50 months plus one 12-month extension option. The Credit Facilities bear interest based on the London Interbank Offer Rate (“LIBOR”) and a spread that varies with our leverage ratio on the respective Credit Facilities. In addition, we are required to make interest only payments until the respective maturity dates of the Credit Facilities and to pay fees ranging from 0.15% to 0.25% for unused commitments on the Revolving Credit Facility. As of December 31, 2014, availability under the Revolving Credit Facility was approximately $14.0 million based on the value of the properties in the unencumbered collateral pool of assets supporting the loan.
We have borrowed and intend to continue borrowing money to acquire properties, make loans and other permitted investments, fund ongoing enhancements to our portfolio, and to cover periodic shortfalls between distributions paid and cash flows from operating activities. During the years ended December 31, 2014, 2013 and 2012, we borrowed net proceeds of approximately $510.3 million, $460.9 million and $264.8 million, respectively. These amounts were primarily used to acquire additional properties during the respective periods; however, in 2014, approximately $204.3 million was used to refinance our Revolving Credit Facility and in 2013, approximately $75.0 million was used to refinance an existing bridge loan.
We may borrow money to pay distributions to stockholders, for working capital and for other corporate purposes. See “Uses of Liquidity and Capital Resources – Distributions” below for additional information related to the payment of distributions with other sources for GAAP purposes. In many cases, we have pledged our assets in connection with our borrowings and intend to encumber assets in connection with additional borrowings. The aggregate amount of long-term financing is not expected to exceed 60% of our total assets on an annual basis. As of December 31, 2014 and December 31, 2013, we had an aggregate debt leverage ratio of approximately 53.3% and 52.9%, respectively, of the aggregate carrying value of our assets.
In January 2015, our joint venture obtained financing of approximately $7.1 million on ProMed Medical Building I, which was distributed to us as a return of capital.
The following table provides details of our indebtedness as of December 31, 2014 and 2013 (in thousands):
| December 31, | ||||||||
| 2014 | 2013 | |||||||
| Mortgages payable and other notes payable: |
||||||||
| Fixed rate debt |
$ | 370,854 | $ | 290,817 | ||||
| Variable rate debt (1) |
482,922 | 147,290 | ||||||
|
|
|
|
|
|||||
| Mortgages and other notes payable |
853,776 | 438,107 | ||||||
| Premium (discount), net (2) |
(215 | ) | — | |||||
|
|
|
|
|
|||||
| Total mortgages and other notes payable, net |
853,561 | 438,107 | ||||||
| Credit facilities: |
||||||||
| Term Loan Facility (1) |
175,000 | — | ||||||
| Revolving Credit Facility |
31,403 | 98,500 | ||||||
|
|
|
|
|
|||||
| Total borrowings |
$ | 1,059,964 | $ | 536,607 | ||||
|
|
|
|
|
|||||
FOOTNOTES:
| (1) | As of December 31, 2014, we had entered into interest rate swaps with notional amounts of approximately $182.1 million that were settling on a monthly basis; whereas, there were no such settlements during the year ended December 31, 2013. In addition, as of December 31, 2014 and December 31, 2013, we had entered into forward-starting interest rate swaps for total notional amounts of approximately $269.4 million and $124.3 million, respectively, in order to hedge our exposure to this variable rate debt in future periods. The remaining forward-starting interest rate swaps have a range of effective dates beginning in 2015 and continuing through the maturity date of the respective loan (ranging from 2016 through 2019). Refer to Item 8, “Financial Statements and Supplementary Data — Note 12. Derivative Financial Instruments,” for additional information. |
| (2) | Premium (discount), net is reflective of us recording mortgage note payables assumed at fair value on the respective acquisition date. |
69
Table of Contents
Generally, the loan agreements for our mortgage loans contain customary affirmative, negative and financial covenants, representations, warranties and borrowing conditions, as set forth in the loan agreements. The loan agreements also contain customary events of default and remedies for the lenders. The borrowers are normally direct or indirect subsidiaries of our operating partnership. As of December 31, 2014, we were in compliance with all of our debt covenants for our mortgage notes payable.
The Credit Facilities contain affirmative, negative, and financial covenants which are customary for loans of this type, including without limitation: (i) maximum leverage, (ii) minimum fixed charge coverage ratio, (iii) minimum consolidated net worth, (iv) restrictions on payments of cash distributions except if required by REIT requirements, (v) maximum secured and unsecured indebtedness, and (vi) limitations on certain types of investments and with respect to the pool of properties supporting borrowings under the Credit Facilities, minimum debt service coverage ratio, and remaining lease terms, as well as property type, MSA, operator, and asset value concentration limits. The limitations on distributions includes a limitation on the extent of allowable distributions, which are not to exceed the greater of 95% of adjusted FFO (as defined per the Credit Facilities) and the minimum amount of distributions required to maintain our REIT status. We do not expect this limitation to be a limiting factor for our board of directors when determining distribution levels now or in the future.
See Item 8. “Financial Statements and Supplementary Data — Note 10. Indebtedness” for additional information on our borrowings, including a schedule of future principal payments and maturity dates. In addition, see “Off-Balance Sheet and Other Arrangements” below for a description of the borrowings of our unconsolidated entities.
Contributions from Redeemable Noncontrolling Interests
During the year ended December 31, 2014, our co-venture partner made cash capital contributions of approximately $0.6 million to our consolidated joint venture relating to the Watercrest at Katy development. In accordance with the joint venture agreement, these amounts will be or have been used to fund part of the land acquisition and initial development costs of the development projects. Refer to Item 8. “Financial Statements and Supplementary Data — Note 13. Equity” for additional information.
Contributions from Noncontrolling Interests
During the year ended December 31, 2014, our co-venture partner made cash capital contributions to our consolidated joint venture of approximately $0.4 million, which was used to fund part of the acquisition of a medical office building in Yuma, Arizona.
Distributions from Unconsolidated Entities
As of December 31, 2014, we had an ownership interest in five properties through an investment in an unconsolidated entity. We are entitled to receive quarterly preferred cash distributions to the extent there is cash available to distribute. These distributions are generally received within 45 days after each quarter end.
In August 2014, we acquired our co-venture partner’s 10% interest in the Montecito joint venture for approximately $1.6 million. As a result of this transaction, we own 100% of the Montecito joint venture, and began consolidating all of the assets, liabilities and results of operations in our consolidated financial statements upon acquisition. Refer to Item 8. “Financial Statements and Supplementary Data — Note 3. Acquisitions – Purchase of Controlling Interest in Montecito Joint Venture” for additional information. In July 2013, we completed the sale of our interest in the CHTSunIV joint venture for a sales price of approximately $61.8 million, net of transaction costs, which reflects an aggregate gain of approximately $4.5 million.
For the year ended December 31, 2014, we received approximately $1.9 million of operating distributions from our investments in two unconsolidated entities; whereas, for the year ended December 31, 2013, we received approximately $5.5 million of operating distributions from our investments in three unconsolidated entities. See “Off-Balance Sheet Arrangements” below for additional information related to capital distributions received from the Windsor Manor joint venture during the year ended December 31, 2014 of approximately $2.2 million, which resulted from excess proceeds on refinancing the joint venture’s debt.
70
Table of Contents
Net Cash Provided by Operating Activities
We generally expect to meet future cash needs for general and administrative expenses, debt service and distributions from the net operating income (“NOI”) from our properties, which primarily is rental income from operating leases, resident fees and services, tenant reimbursement income and interest income less the property operating expenses and property management fees from managed properties. We experienced positive cash flow from operating activities for the years ended December 31, 2014 and 2013 of approximately $19.3 million and $3.0 million, respectively, and negative cash flow from operating activities for the year ended December 31, 2012 of approximately $6.4 million, which is reflective of 2012 being the year that we made our first real estate investment.
The change in cash flows from operating activities for the year ended December 31, 2014 as compared to the year ended December 31, 2013 was primarily the result of the following:
| • | an increase in total revenues and NOI for the year ended December 31, 2014, as compared to the year ended December 31, 2013, primarily as the result of having 95 consolidated operating properties in 2014 as compared with 55 consolidated operating properties in 2013, coupled with HarborChase of Villages Crossing and Dogwood Forest of Acworth being placed into service in December 2013 and June 2014, respectively, and the positive impact of growth in occupancy rates at these two stabilizing senior housing communities to 73.6% and 57.4%, respectively, as of December 31, 2014; and |
| • | approximately $4.9 million in asset management fees that were foregone by our Advisor under the Advisor Expense Support Agreement for the year ended December 31, 2014 (defined and discussed below), compared to approximately $1.4 million were foregone during the year ended December 31, 2013; |
| • | offset by lower distributions from our unconsolidated entities for the year ended December 31, 2014 as compared to the year ended December 31, 2013, which was primarily the result of the sale of our interest in the CHTSunIV joint venture in July 2013 and the buyout of our Montecito joint venture partner in August 2014; and |
| • | an increase of approximately $5.1 million in acquisition fees and expenses during the year ended December 31, 2014, in which we acquired 35 consolidated operating properties totaling $905.3 million, compared with the year ended December 31, 2013, in which we purchased 38 consolidated operating properties totaling $655.9 million. The acquisition fees and expenses were funded from proceeds of our Offerings or debt proceeds and are treated as an operating activity in accordance with GAAP. |
As we continue to acquire additional properties, we expect that cash flows provided by operating activities will continue to grow.
Expense Support Agreements
In March 2013, we entered into the advisor expense support and restricted stock agreement (“Advisor Expense Support Agreement”) pursuant to which the Advisor has agreed to accept certain payments in the form of forfeitable restricted common stock (“Restricted Stock”) in lieu of cash for asset management fees and specified expenses owed to the Advisor under the advisory agreement. The Advisor Expense Support Agreement commenced on April 1, 2013 and automatically renews for successive one-year periods each December 31st, subject to the right of the Advisor to terminate the Advisor Expense Support Agreement upon 30 days’ written notice.
Commencing on April 1, 2013, the Advisor has provided expense support to us through forgoing the payment of fees in cash and acceptance of restricted stock for services rendered and specified expenses incurred in an amount equal to the positive excess, if any, of (a) aggregate stockholder cash distributions declared for the applicable quarter, over (b) our aggregate modified funds from operations (as defined in the Advisor Expense Support Agreement). The Advisor expense support amount is determined for each calendar quarter, on a non-cumulative basis, with each such quarter-end date (“Determination Date”).
In August 2013, we entered into the property manager expense support and restricted stock agreement (“Property Manager Expense Support Agreement”) pursuant to which the Property Manager has agreed to accept certain payments in the form of forfeitable restricted common stock in lieu of cash for property management services owed under the property management and leasing agreement. The term of the Property Manager Expense Support Agreement commenced on July 1, 2013 and automatically renews for successive one-year periods each December 31st, subject to the right of the Property Manager to terminate the Property Manager Expense Support Agreement upon 30 days’ written notice.
71
Table of Contents
Commencing on July 1, 2013, the Property Manager is required to provide expense support to us through forgoing the payment of fees in cash and acceptance of restricted stock for services in an amount equal to the positive excess, if any, of (a) aggregate stockholder cash distributions declared for the applicable quarter, over (b) the Company’s aggregate modified funds from operations (as defined in the Property Manager Expense Support Agreement). The Property Manager expense support amount is determined, on a non-cumulative basis, after the calculation of the Advisor expense support amount pursuant to the Property Manager Expense Support Agreement on each Determination Date.
In exchange for services rendered and in consideration of the expense support provided, the Company will issue, within 45 days following each Determination Date, a number of shares of restricted stock equal to the quotient of the expense support amount provided by to the Advisor and Property Manager for the preceding quarter divided by the then-current public offering price per share of common stock, on the terms and conditions and subject to the restrictions set forth in the Advisor Expense Support Agreement and the Property Manager Expense Support Agreement (hereinafter collectively referred to as the “Expense Support Agreements”). Any amounts deferred, and for which restricted stock shares are issued, pursuant to the Expense Support Agreements will be permanently waived and the Company will have no obligation to pay such amounts to the Advisor or the Property Manager. The Restricted Stock is subordinated and forfeited to the extent that shareholders do not receive their original invested capital back with at least a 6% annualized return of investment upon ultimate liquidity of the company. Refer to Item 8. “Financial Statements and Supplementary Data — Note 2. Summary of Significant Accounting Policies” for treatment of issued Restricted Stock.
During the year ended December 31, 2014, our cash from operating activities was positively impacted by the Expense Support Agreements. For the year ended December 31, 2014, our Advisor had forgone approximately $4.9 million in asset management fees under the terms of the Advisor Expense Support Agreement. For the year ended December 31, 2013, our Advisor had forgone $1.4 million in asset management fees under the terms of the Advisor Expense Support Agreement. There were no amounts forgone under the Advisor Expenses Support Agreement for the year ended December 31, 2012. There were no amounts forgone under the Property Manager Expense Support Agreement for the years ended December 31, 2014, 2013 and 2012.
Refer to Item 8. “Financial Statements and Supplementary Data — Note 11. Related Party Arrangements” for additional information.
72
Table of Contents
Uses of Liquidity and Capital Resources
Acquisitions
During the years ended December 31, 2014, 2013 and 2012, we acquired 35, 38, and 15 consolidated operating properties, respectively, for an aggregate purchase price paid of approximately $869.5 million, $655.9 million, and $241.8 million, respectively, net of liabilities assumed. The acquired operating properties were spread across our targeted asset classes and located in 14, 13, and nine different states, respectively, which allowed us to expand both the variety of our asset classes and the geographical diversification of our healthcare investment portfolio. During the years ended December 31, 2014, 2013 and 2012, our total units increased by approximately 1,509, 2,163 and 348, respectively. Furthermore, during the years ended December 31, 2014, 2013 and 2012, our total leasable square footage increased by approximately 1.6 million, 0.9 million, and 1.0 million, respectively. We expect to continue to expand our healthcare investment portfolio in the near term through additional acquisitions.
Development Properties
In connection with our various senior housing developments, we funded approximately $47.2 million, $23.2 million and $8.1 million in development costs during the years ended December 31, 2014, 2013 and 2012, respectively. Pursuant to the development agreements for the other active senior housing communities under development as of December 31, 2014, we expect to fund approximately $76.4 million of additional development and other costs. We expect to fund the remaining development and other costs primarily from construction loans on each development or with proceeds from our Offerings. Our Advisor continues to evaluate additional development opportunities.
During the year ended December 31, 2014, we made distributions of approximately $2.0 million to a third-party developer, who is a holder of promoted interest related to our HarborChase of Villages Crossing, which has been recorded as a reduction to capital in excess of par value in the accompanying consolidated statements of stockholders’ equity and redeemable noncontrolling interest. No such payments were made during the years ended December 31, 2013 and 2012.
Debt Repayments
During the year ended December 31, 2014, we paid approximately $286.3 million of total repayments which is comprised of $259.3 million in repayments on our Revolving Credit Facility, $15.0 million in repayments on our unsecured bridge loan financing, $9.4 million of scheduled repayments and $2.6 million of prepayments on our Capital Health mortgage loan related to monies received under the Yield Guaranty. During the year ended December 31, 2013, we had total repayments of $117.4 million, which was comprised of the early repayment of $40.0 million on the CHTSunIV mezzanine loan, total repayments of $75.0 million on the Primrose II Bridge loan, and approximately $2.4 million of scheduled repayments. As part of the repayment of the CHTSunIV mezzanine loan, we paid an exit fee of $0.8 million upon extinguishment and expensed an additional $0.2 million in unamortized loan costs as a result of our CHTSunIV mezzanine loan being repaid in full prior to its maturity date.
Stock Issuance and Offering Costs
Under the terms of the Offerings, certain affiliates and third-party broker dealers are entitled to receive selling commissions of up to 7% of gross offering proceeds on all shares sold, a marketing support fee of up to 3% of gross offering proceeds, and reimbursement of actual expenses incurred in connection with the Offerings. In accordance with our articles of incorporation and the advisory agreement, the total amount of selling commissions, marketing support fees, due diligence expense reimbursements, and organizational and other offering costs to be paid by us may not exceed 15% of the gross aggregate proceeds of our Offerings.
During the years ended December 31, 2014, 2013 and 2012, we paid approximately $58.9 million, $41.8 million, and $22.9 million, respectively, of stock issuance and offering costs.
73
Table of Contents
Distributions
In order to qualify as a REIT, we are required to make distributions, other than capital gain distributions, to our stockholders each year in the amount of at least 90% of our taxable income. We may make distributions in the form of cash or other property, including distributions of our own securities. Until we have sufficient cash flow from operating activities or funds from operations, we have decided, and may continue, to make stock distributions or to fund all or a portion of the payment of distributions from other sources; such as from cash flows generated by financing activities, a component of which includes our borrowings and the proceeds of our Offerings.
In November 2014, in connection with the determination of our estimated NAV per share, our board of directors increased the amount of monthly cash distributions to $0.0353 per share (from $0.0338 per share) together with monthly stock distributions of 0.0025 shares of common stock payable to all common stockholders of record as of the close of business on the first business day of each month beginning December 1, 2014. The change allowed us to maintain our historical annual distribution rate of 4% cash and 3% stock on each 100 outstanding shares of our common stock based on our revised $10.58 offering price. The new distribution rates were payable to all common stockholders of record as of the close of business of the first day of each month beginning December 1, 2014.
The amount of distributions declared to our stockholders will be determined by our board of directors and is dependent upon a number of factors, including:
| • | Sources of cash available for distribution such as current year and inception to date cumulative cash flows from operating activities, FFO and MFFO, as well as, expected future long-term stabilized cash flows, FFO and MFFO; |
| • | The proportion of distributions paid in cash compared to the amount being reinvested through our Reinvestment Plan; |
| • | Limitations and restrictions contained in the terms of our current and future indebtedness concerning the payment of distributions; and |
| • | Other factors, including but not limited to, the avoidance of distribution volatility, our objective of continuing to qualify as a REIT, capital requirements, the general economic environment and other factors. |
74
Table of Contents
The following table represents total cash distributions declared, distributions reinvested and cash distributions per share for years ended December 31, 2014, 2013 and 2012 (in thousands, except per share data):
| Distributions Paid (1) | ||||||||||||||||||||||||||||||||
| Periods |
Cash Distributions per Share |
Total Cash Distributions Declared |
Reinvested via Reinvestment Plan |
Cash Distributions net of Reinvestment Proceeds |
Stock Distributions Declared (Shares) |
Stock Distributions Declared (at then-current offering price) |
Total Cash and Stock Distributions Declared (2) |
Cash Flows Provided by (Used in) Operating Activities (3) |
||||||||||||||||||||||||
| 2014 Quarters |
||||||||||||||||||||||||||||||||
| First |
$ | 0.1014 | $ | 6,147 | $ | 3,349 | $ | 2,798 | 455 | $ | 4,614 | $ | 10,761 | $ | 6,277 | |||||||||||||||||
| Second |
0.1014 | 7,145 | 3,916 | 3,229 | 529 | 5,364 | 12,509 | 5,035 | ||||||||||||||||||||||||
| Third |
0.1014 | 8,385 | 4,630 | 3,755 | 621 | 6,295 | 14,680 | 7,361 | ||||||||||||||||||||||||
| Fourth |
0.1029 | 10,242 | 5,821 | 4,421 | 751 | 7,946 | (4) | 18,188 | 599 | |||||||||||||||||||||||
|
|
|
|
|
|
|
|
|
|
|
|
|
|
|
|
|
|||||||||||||||||
| Total |
$ | 0.4071 | $ | 31,919 | $ | 17,716 | $ | 14,203 | 2,356 | $ | 24,219 | $ | 56,138 | $ | 19,272 | |||||||||||||||||
|
|
|
|
|
|
|
|
|
|
|
|
|
|
|
|
|
|||||||||||||||||
| 2013 Quarters |
||||||||||||||||||||||||||||||||
| First |
$ | 0.09999 | $ | 2,099 | $ | 1,112 | $ | 987 | 157 | $ | 1,574 | $ | 3,673 | $ | 212 | |||||||||||||||||
| Second |
0.09999 | 2,878 | 1,544 | 1,334 | 216 | 2,159 | 5,037 | 2,964 | ||||||||||||||||||||||||
| Third |
0.09999 | 4,038 | 2,151 | 1,887 | 303 | 3,029 | 7,067 | 106 | ||||||||||||||||||||||||
| Fourth |
0.09999 | 5,155 | 2,784 | 2,371 | 387 | 3,869 | 9,024 | (236 | ) | |||||||||||||||||||||||
|
|
|
|
|
|
|
|
|
|
|
|
|
|
|
|
|
|||||||||||||||||
| Total |
$ | 0.39996 | $ | 14,170 | $ | 7,591 | $ | 6,579 | 1,063 | $ | 10,631 | $ | 24,801 | $ | 3,046 | |||||||||||||||||
|
|
|
|
|
|
|
|
|
|
|
|
|
|
|
|
|
|||||||||||||||||
| 2012 Quarters |
||||||||||||||||||||||||||||||||
| First |
$ | 0.09999 | $ | 203 | $ | 113 | $ | 90 | 15 | $ | 152 | $ | 355 | $ | (1,954 | ) | ||||||||||||||||
| Second |
0.09999 | 558 | 309 | 249 | 42 | 417 | 975 | 2,452 | ||||||||||||||||||||||||
| Third |
0.09999 | 984 | 533 | 451 | 74 | 739 | 1,723 | (2,867 | ) | |||||||||||||||||||||||
| Fourth |
0.09999 | 1,452 | 783 | 669 | 109 | 1,089 | 2,541 | (4,000 | ) | |||||||||||||||||||||||
|
|
|
|
|
|
|
|
|
|
|
|
|
|
|
|
|
|||||||||||||||||
| Total |
$ | 0.39996 | $ | 3,197 | $ | 1,738 | $ | 1,459 | 240 | $ | 2,397 | $ | 5,594 | $ | (6,369 | ) | ||||||||||||||||
|
|
|
|
|
|
|
|
|
|
|
|
|
|
|
|
|
|||||||||||||||||
FOOTNOTES:
| (1) | Represents the amount of cash used to fund distributions and the amount of distributions paid which were reinvested in additional shares through our Reinvestment Plan. |
75
Table of Contents
| (2) | For the years ended December 31, 2014, 2013 and 2012, our net loss was approximately $52.5 million, $18.1 million and $10.7 million, respectively, while cash distributions declared were approximately $31.9 million, $14.2 million and $3.2 million, respectively, and total distributions declared were approximately $56.1 million, $24.8 million and $5.6 million, respectively. For the years ended December 31, 2014 and 2013, approximately 60%, 23% and 0%, respectively, of cash distributions declared to stockholders were considered to be funded with cash provided by operating activities as calculated on a quarterly basis for GAAP purposes and approximately 40%, 77% and 0%, respectively, were considered to be funded with other sources (i.e., Offering proceeds). For the years ended December 31, 2014, 2013 and 2012, approximately 34%, 13% and 0%, respectively, of total distributions declared to stockholders were considered to be funded with cash provided by operating activities as calculated on a quarterly basis for GAAP purposes and approximately 66%, 87% and 0%, respectively, of total distributions declared to stockholders were considered to be funded with other sources (i.e., Offering proceeds). |
| (3) | Cash flows from operating activities calculated in accordance with GAAP are not necessarily indicative of the amount of cash available to pay distributions. For example, GAAP requires that the payment of acquisition fees and costs related to business combinations be classified as a use of cash in operating activities in the statement of cash flows, which directly reduces the measure of cash flows from operations. However, acquisition fees and costs are paid for with proceeds from our Offerings as opposed to operating cash flows. For the years ended December 31, 2014, 2013 and 2012, we expensed approximately $23.9 million, $18.8 million and $6.6 million, respectively, in acquisition fees and expenses, which were paid from the proceeds of our Offerings. Additionally, the board of directors also uses other measures such as FFO and MFFO in order to evaluate the level of distributions. |
| (4) | The new offering price for our stock was effective beginning with the December 1, 2014 distributions. As such, the stock distributions were recalculated using the new offering price of $10.58. |
The tax composition of our distributions declared for the years ended December 31, 2014, 2013 and 2012 were as follows:
| December 31, | ||||||||||||
| Distribution Type |
2014 | 2013 | 2012 | |||||||||
| Taxable as ordinary income |
30.8 | % | 0.0 | % | 0.0 | % | ||||||
|
|
|
|
|
|
|
|||||||
| Taxable as capital gain |
0.0 | % | 63.8 | % | 0.0 | % | ||||||
|
|
|
|
|
|
|
|||||||
| Return of capital |
69.2 | % | 36.2 | % | 100.0 | % | ||||||
|
|
|
|
|
|
|
|||||||
No amounts distributed to stockholders for the years ended December 31, 2014, 2013 and 2012 were required to be or have been treated as return of capital for purposes of calculating the stockholders’ return on their invested capital as described in our advisory agreement.
In determining the apportionment between taxable income and a return of capital, the amounts distributed to stockholders (other than any amounts designated as capital gains dividends) in excess of current or accumulated E&P are treated as a return of capital to the stockholders. E&P is a statutory calculation, which is derived from net income and determined in accordance with the Code. It is not intended to be a measure of the REIT’s performance, nor do we consider it to be an absolute measure or indicator of our source or ability to pay distributions to stockholders. The distribution of new common shares to the recipients is non-taxable. Stock distributions may cause the interest of later investors in our stock to be diluted as a result of the stock issued to earlier investors.
Our board of directors declared a monthly cash distribution of $0.0353 and a monthly stock distribution of 0.0025 shares on each outstanding share of common stock on January 1, 2015, February 1, 2015 and March 1, 2015. In March 2015, cash distributions of approximately $13.3 million were paid and stock distributions of 0.9 million shares were distributed related to the aforementioned declared distributions.
76
Table of Contents
Common Stock Redemptions
During the year ended December 31, 2014, we received 94 redemption requests for 0.3 million shares at a redemption price of $9.24 per share of which approximately $2.2 million was paid and approximately $0.9 million was payable as of December 31, 2014. During the year ended December 31, 2013, we received 22 redemption requests for 0.08 million shares at a redemption price of $9.25 per share of which approximately $0.7 million was paid and approximately $0.1 million was payable as of December 31, 2013. During the year ended December 31, 2012, we paid approximately $0.01 million and redeemed one redemption request for 1,049 shares of common stock at a redemption price of $9.99 per share.
See Item 5. “Market for Registrant’s Common Equity, Related Stockholder Matters and Issuer Purchases of Equity Securities – Redemption Plan” for additional information related to the redemption of common stock.
Results of Operations
The following discussion and analysis should be read in conjunction with the accompanying consolidated financial statements and the notes thereto.
In understanding our operating results in the accompanying consolidated financial statements, it is important to understand how the growth in our assets has impacted our results. As of December 31, 2014, we owned 95 real estate investment properties and our portfolio consisted of 4,918 units operated under management agreements with third-party operators and approximately 3.5 million leasable square feet that was 95.3% leased to third-party tenants. The chart below illustrates our net losses and property-level NOI for the years ended December 31, 2014, 2013 and 2012 (in thousands), and the amount invested in properties as of December 31, 2014, 2013 and 2012 (in thousands):
| Years Ended December 31, | ||||||||||||
| 2014 | 2013 | 2012 | ||||||||||
| Total revenues |
$ | 181,084 | $ | 52,605 | $ | 7,385 | ||||||
| Less: |
||||||||||||
| Property operating expenses |
93,549 | 20,940 | 406 | |||||||||
| Property management fees |
8,942 | 2,642 | 404 | |||||||||
|
|
|
|
|
|
|
|||||||
| NOI |
78,593 | 29,023 | 6,575 | |||||||||
| Less: |
||||||||||||
| General and administrative expenses |
6,877 | 5,618 | 2,563 | |||||||||
| Acquisition fees and expenses |
23,931 | 18,840 | 6,585 | |||||||||
| Asset management fees |
8,481 | 3,614 | 1,369 | |||||||||
| Depreciation and amortization |
63,112 | 16,765 | 2,101 | |||||||||
| Contingent purchase price consideration adjustment |
(630 | ) | (1,824 | ) | — | |||||||
| Other expenses, net of other income |
28,972 | 4,092 | 4,694 | |||||||||
| Income tax expense (benefit) |
361 | 18 | (17 | ) | ||||||||
|
|
|
|
|
|
|
|||||||
| Net loss |
$ | (52,511 | ) | $ | (18,100 | ) | $ | (10,720 | ) | |||
|
|
|
|
|
|
|
|||||||
| Invested in operating properties, end of period |
$ | 1,865,435 | $ | 897,989 | $ | 242,200 | ||||||
|
|
|
|
|
|
|
|||||||
We anticipate using our cash on hand as of December 31, 2014, and additional borrowings, as well as additional net offering proceeds received through the close of our Initial Offering and through our Follow-On Offering to invest in additional properties. As such, we anticipate additional operating income will be generated in subsequent periods.
We are not aware of any material trends or uncertainties, favorable or unfavorable, that may be reasonably anticipated to have a material impact on either capital resources or the revenues or income to be derived from the acquisition and operation of properties, loans and other permitted investments, other than those referred to in the risk factors identified in Item 1A. “Risk Factors”.
77
Table of Contents
Fiscal year ended December 31, 2014 as compared to the fiscal year ended December 31, 2013
Rental Income from Operating Leases. Rental income from operating leases was approximately $49.3 million for the year ended December 31, 2014 as compared to $23.3 million for the year ended December 31, 2013. The increase in rental income from operating leases resulted from our acquisition of 15 medical office buildings, three post-acute care hospitals and three acute care hospitals for the year ended December 31, 2014 as well as the 16 medical office buildings and one acute care hospital during the year ended December 31, 2013 being owned for the entire period. We expect this revenue stream to increase as these investments are held in future periods and we acquire additional properties with operating leases.
Resident Fees and Services. Resident fees and services income was approximately $123.8 million for the year ended December 31, 2014 as compared to approximately $27.6 million for the year ended December 31, 2013. The increase in resident fees and services is a result of the 14 managed senior housing communities acquired for the year ended December 31, 2014 as well as 15 managed senior housing communities acquired during the year ended December 31, 2013 being owned for the entire period and HarborChase of Villages Crossing and Dogwood Forest of Acworth being placed into service in December 2013 and June 2014, respectively. We expect this revenue stream to increase as these investments are held in future periods, our value-add and completed development properties stabilize and we acquire additional managed senior housing communities.
Tenant Reimbursement Income. Tenant reimbursement income was approximately $7.5 million for the year ended December 31, 2014 as compared to $1.6 million for the year ended December 31, 2013. This amount is comprised of common area maintenance (“CAM”) revenue and the increase resulted from our acquisition of 15 medical office buildings, three post-acute care hospitals and three acute care hospitals for the year ended December 31, 2014 as well as the 16 medical office buildings and one acute care hospital during the year ended December 31, 2013 being owned for the entire period. We expect this revenue stream to increase as these investments are held in future periods and we acquire additional properties with modified operating leases.
Interest Income on Note Receivable from Related Party. Interest income on note receivable from related party was approximately $0.5 million for the year ended December 31, 2014 as compared to $0.1 million for the year ended December 31, 2013. This amount is comprised of interest income on the acquisition, development and construction loan (“ADC loan”) made to Crosland Southeast for the HCA Rutland development in June 2013. Interest income from this loan will not continue since the ADC loan was fully repaid in August 2014.
Property Operating Expenses. Property operating expenses were approximately $93.5 million for the year ended December 31, 2014 as compared to approximately $20.9 million for the year ended December 31, 2013. This increase is a result of our acquisition of 14 managed senior housing communities, 15 medical office buildings, three post-acute care hospitals and three acute care hospitals for the year ended December 31, 2014 as well as 15 managed senior housing communities, 16 medical office buildings and one acute care hospital acquired during the year ended December 31, 2013 being owned for the entire period and HarborChase of Villages Crossing and Dogwood Forest of Acworth being placed into service in December 2013 and June 2014, respectively. We expect property operating expenses to increase as these investments are held in future periods, our value-add and completed development properties stabilize and we acquire additional managed properties.
General and Administrative. General and administrative expenses for the year ended December 31, 2014 were approximately $6.9 million as compared to approximately $5.6 million for the year ended December 31, 2013. General and administrative expenses were comprised primarily of personnel expenses of affiliates of our Advisor, directors’ and officers’ insurance, franchise taxes, accounting and legal fees, and board of director fees and will continue to grow as our asset base increases. The increase in general and administrative expense was primarily attributed to increased costs as a result of the growth of our portfolio. Specifically, we incurred increased personnel expenses reimbursable to the Advisor due to increased accounting, legal and administrative activity as a result of the growth of the portfolio and related reporting. We expect increases in general and administrative expenses in the future as we purchase additional real estate properties and the properties acquired during the year ended December 31, 2014 are operational for a full period.
78
Table of Contents
Acquisition Fees and Expenses. Acquisition fees and expenses for the year ended December 31, 2014 were approximately $27.5 million of which approximately $3.6 million was capitalized as real estate under development in 2014. We incurred approximately $19.5 million for the year ended December 31, 2013 of which approximately $0.1 million was capitalized as real estate under development, approximately $0.5 million was capitalized as investment in unconsolidated entities, and approximately $0.1 million was capitalized as origination costs related to our note receivable from related party during the year ended December 31, 2013. The increase in acquisition fees and expenses resulted from the acquisition of 35 operating properties totaling approximately $905.3 million in investments, during the year ended December 31, 2014 as compared with the acquisition of 38 operating properties totaling approximately $655.4 million in investments during the year ended December 31, 2013. We expect to incur additional acquisition fees and expenses in the future as we purchase additional real estate or real estate-related assets.
Asset Management Fees. We incurred approximately $13.6 million in asset management fees payable to our Advisor during the year ended December 31, 2014 as compared to approximately $5.1 million for the year ended December 31, 2013. For years ended December 31, 2014 and 2013, approximately $4.9 million and $1.4 million, respectively, in asset management fees were forgone in accordance with the terms of the Expense Support Agreements and approximately $0.3 million and $0.1 million, respectively, were capitalized as real estate under development. As described in Item 8. “Financial Statements and Supplementary Data – Note 11. Related Party Arrangements” during the year ended December 31, 2014, asset management fees were reduced by $4.9 million because the shares of restricted stock, which will be accepted by the Advisor as payment for asset management services rendered, were valued at zero— the lowest possible value estimated at vesting since the vesting criteria had not been met. For the year ended December 31, 2013, approximately $1.4 million in asset management fees were forgone and settled with issuance of restricted stock in accordance with the Expense Support Agreements. Monthly asset management fees equal to 0.08334% of invested assets are paid to the Advisor for management of our real estate assets, including our pro rata share of our investments in unconsolidated entities, loans and other permitted investments. We expect increases in asset management fees in the future as we purchase additional real estate or real estate-related assets and the properties owned as of December 31, 2014 are operational for a full period; however, a portion of such fees may be settled in the form of forfeitable restricted stock under the Expense Support Agreements.
Property Management Fees. We incurred approximately $10.8 million in property management fees for the year ended December 31, 2014 and approximately $2.8 million for the year ended December 31, 2013. For the years ended December 31, 2014 and 2013, approximately $1.9 million and $0.2 million, respectively, were capitalized as real estate under development. Property management fees generally range from 2% to 5% of property revenues for leased properties depending on the type of property and are paid to third-party managers. However, an oversight fee equal to 1% of property revenues is paid to the Property Manager for those properties managed by a third-party. Overall property management fees increased as a result of the increases in rental income from operating leases and resident fees and services from acquisitions for the year ended December 31, 2014 as well as the properties acquired during the year ended December 31, 2013 being owned for the entire year ended December 31, 2014. Although we expect total property management fees will increase during 2015, a portion of such fees may be settled in the form of forfeitable restricted stock under the Expense Support Agreements.
Contingent purchase price consideration adjustment. During the years ended December 31, 2014 and 2013, the adjustment for contingent purchase price consideration was approximately $0.6 million and $1.8 million, respectively. The adjustment in 2014 relates primarily to two separate acquisitions. Based on lower than expected occupancy and revised projections of future net operating income, our fair value estimate for our Capital Health Yield Guaranty receivable was increased by approximately $2.2 million and we recorded a reduction to our operating loss in the accompanying consolidated statements of operations for year ended December 31, 2014. Additionally, based on exceeding certain NOI targets on one of the South Bay II communities, we have recognized $1.8 million of expense during the year ended December 31, 2014. In 2013, our fair value estimate for our Capital Health Yield Guaranty receivable was increased by approximately $1.8 million and we recorded a reduction to our operating loss in the accompanying consolidated statements of operations for year ended December 31, 2013.
Depreciation and Amortization. Depreciation and amortization expenses for the year ended December 31, 2014 were approximately $63.1 million and approximately $16.8 million for the year ended December 31, 2013. Depreciation and amortization expenses are comprised of depreciation and amortization of the buildings, equipment, land improvements and in-place leases related to our real estate portfolio. The increase in depreciation and
79
Table of Contents
amortization expense across periods resulted from our acquisition of 14 managed senior housing communities, 15 medical office buildings, three post-acute care hospitals and three acute care hospitals for the year ended December 31, 2014 as well as 15 managed senior housing communities, 16 medical office buildings and one acute care hospital acquired during the year ended December 31, 2013 being owned for the entire period and HarborChase of Villages Crossing and Dogwood Forest of Acworth being placed into service in December 2013 and June 2014, respectively. We expect depreciation and amortization expense to increase as these investments are held in future periods and we acquire additional properties.
Interest Expense and Loan Cost Amortization. Interest expense and loan cost amortization for the year ended December 31, 2014 was approximately $31.5 million of which $1.0 million was capitalized as development costs relating to our real estate under development. Interest expense and loan cost amortization for the year ended December 31, 2013 was approximately $11.5 million of which approximately $0.7 million was capitalized as development costs relating to our real estate under development. Approximately $18.8 million of the increase for the year ended December 31, 2014 was primarily the result of an increase in our average debt outstanding to approximately $798.3 million as compared to approximately $364.9 million for the year ended December 31, 2013. In addition, during the year ended December 31, 2014, we incurred approximately $0.5 million in additional loan costs amortization relating to debt obtained during the year ended December 31, 2014, as well as approximately $1.4 million relating to debt obtained on properties acquired during the year ended December 31, 2013. The increase between the years was partially offset by a write-off in 2013 of approximately $0.2 million as a loss on the early extinguishment of debt and the payment of an exit fee of approximately $0.8 million upon extinguishment of the CHTSunIV mezzanine loan prior to its maturity date during the year ended December 31, 2013.
Equity in Earnings (Loss) of Unconsolidated Entities. Our unconsolidated entities generated losses of approximately $1.4 million for the year ended December 31, 2014 relating to our investments in the Windsor Manor and Montecito joint ventures, as compared to earnings of approximately $2.1 million for the year ended December 31, 2013 relating to our investments in the CHTSunIV, Windsor Manor and Montecito joint ventures. Equity in earnings (loss) from unconsolidated entities is determined using the hypothetical liquidation method book value (“HLBV”) method of accounting, which can create significant variability in earnings or loss from the joint venture while the preferred cash distributions that we anticipate to receive from the joint venture may be more consistent as result of our distribution preferences. The change in equity in earnings (loss) of unconsolidated entities was impacted by the sale of our interest in CHTSunIV in July 2013 and our purchase of the controlling interest in the Montecito Joint Venture in August 2014, which resulted in the consolidation of this investment.
Gain on Sale of Investment in Unconsolidated Entity. During the year ended December 31, 2013, we recognized a gain of approximately $4.5 million related to the CHTSunIV Disposition. See “Sources of Liquidity and Capital Resources – Distributions from Unconsolidated Entities” for additional information. There was no sale of unconsolidated entities during the year ended December 31, 2014 nor do we currently expect future sales of investments in unconsolidated entities.
Gain from Purchase of Controlling Interest of Investment in Unconsolidated Entity. During the year ended December 31, 2014, we recognized a gain of approximately $2.8 million related to the purchase of our co-venture partner’s 10% interest in the Montecito Joint Venture for approximately $1.6 million. As a result of this transaction, we own 100% of the Montecito Joint Venture, and began consolidating all of the assets, liabilities and results of operations in our consolidated financial statements upon acquisition. Accordingly, we recorded a step up from our carrying value of the investment in the Montecito Joint Venture to the estimated fair value of the net assets acquired and liabilities assumed. Refer to Item 8. “Financial Statements and Supplementary Data – Note 3. Acquisitions – Purchase of Controlling Interest in Montecito Joint Venture” for additional information. There was no purchase of any controlling interest of unconsolidated entities during the year ended December 31, 2013 nor do we currently expect future changes in control of investments in unconsolidated entities.
Income Tax Expense. During the year ended December 31, 2014, we recognized state and federal income tax expense related to our properties of approximately $0.4 million as compared to approximately $18,000 during the year ended December 31, 2013.
80
Table of Contents
Fiscal year ended December 31, 2013 as compared to the fiscal year ended December 31, 2012
Rental Income from Operating Leases. Rental income from operating leases was approximately $23.3 million for the year ended December 31, 2013, as compared to $6.9 million for the year ended December 31, 2012. The increase in rental income from operating leases resulted from our ownership of ten senior housing communities for the full year, as compared to our ownership for a partial year in 2012. In addition, during the year ended December 31, 2013, we acquired 16 medical office buildings, one specialty hospital and six skilled nursing facilities, which further contributed to the increase in rental income from operating leases across years.
Resident Fees and Services. Resident fees and services were approximately $27.6 million for the year ended December 31, 2013, as compared to $0.5 million for the year ended December 31, 2012. The increase in resident fees and services resulted from our ownership of five managed senior housing communities for the full year, as compared to our ownership for a partial month in 2012. In addition, during the year ended December 31, 2013, we acquired 15 additional managed senior housing communities, which further contributed to the increase in resident fees and services across years.
Tenant Reimbursement Income. Tenant reimbursement income was approximately $1.6 million for the year ended December 31, 2013. There was no tenant reimbursement income for the year ended December 31, 2012. This amount is comprised of CAM revenue for the 17 medical office buildings and one specialty hospital acquired during 2013.
Interest Income on Note Receivable from Related Party. Interest income on note receivable from related party was approximately $0.1 million for the year ended December 31, 2013. There was no interest income on note receivable from related party for the year ended December 31, 2012. This amount is comprised of interest income on the ADC loan made to Crosland Southeast for the HCA Rutland development originated in June 2013.
Property Operating Expenses. Property operating expenses were approximately $20.9 million for the year ended December 31, 2013, as compared to $0.4 million for the year ended December 31, 2012. The increase in property operating expenses resulted from our ownership of five managed senior housing communities for the full year, as compared to our ownership for a partial month in 2012. In addition, during the year ended December 31, 2013, we acquired 15 additional managed senior housing communities, 16 medical office buildings and one specialty hospital, which further contributed to the increase in property operating expenses across years.
General and Administrative. General and administrative expenses were approximately $5.6 million and $2.6 million for the years ended December 31, 2013 and 2012, respectively, and were comprised primarily of reimbursable personnel expenses of affiliates of our Advisor, directors’ and officers’ insurance, accounting, legal and other professional fees, and board of director fees. The increase in general and administrative expense was primarily attributed to increased costs as a result of the growth of our portfolio. Specifically, we incurred increased personnel expenses reimbursable to the Advisor due to increased accounting, legal and administrative activity as a result of the growth of the portfolio and related reporting.
Acquisition Fees and Expenses. Acquisition fees and expenses were approximately $19.5 million and $10.6 million for the years ended December 31, 2013 and 2012, respectively, of which approximately $0.1 million and $0.7 million, respectively, were capitalized as real estate under development and approximately $0.5 million and $3.3 million, respectively, were capitalized as investment in unconsolidated entities. In addition, approximately $0.1 million was capitalized as origination costs related to our note receivable from related party during the year ended December 31, 2013.
Asset Management Fees. Asset management fees incurred were approximately $5.2 million and $1.4 million for the years ended December 31, 2013 and 2012, respectively. For the year ended December 31, 2013, approximately $0.2 million were capitalized as real estate under development and approximately $1.4 million in asset management fees were forgone in exchange for restricted stock shares under the terms of the Advisor Expense Support Agreement. Monthly asset management fees equal to 0.08334% of invested assets are paid to the Advisor for management of our real estate assets, including our pro rata share of our investments in unconsolidated entities, loans and other permitted investments.
81
Table of Contents
Property Management Fees. We incurred approximately $2.8 million and $0.5 million for the years ended December 31, 2013 and 2012, respectively. For the years ended December 31, 2013 and 2012, approximately $0.2 million and $0.1 million, respectively, were capitalized as real estate under development. Property management fees generally range from 2% to 5% of property revenues for leased properties depending on the type of property and are paid to third-party managers. However, an oversight fee equal to 1% of property revenues is paid to the Property Manager for those properties managed by a third-party. Overall property management fees increased as a result of the increases in rental income from operating leases and resident services from acquisitions for the year ended December 31, 2013.
Contingent purchase price consideration adjustment. During the year ended December 31, 2013, based on lower than expected occupancy and revised projections of future net operating income, the seller was required to perform under our Capital Health Yield Guaranty and released approximately $2.6 million of the $7 million held in escrow to us in 2014 as a guaranteed return for the year ended December 31, 2013. As a result, our fair value estimate increased by approximately $1.8 million and we recorded a reduction to our operating loss in the accompanying consolidated statements of operations.
Depreciation and Amortization. Depreciation and amortization expenses were approximately $16.8 million and $2.1 million for the years ended December 31, 2013 and 2012, respectively, and were comprised of depreciation and amortization of the buildings, equipment, land improvements and in-place leases related to our real estate portfolio. The increase in depreciation and amortization expense resulted from our ownership of 15 senior housing communities for the full year in 2013, as compared to our ownership for a partial year in 2012. In addition, during the year ended December 31, 2013, we acquired 15 senior housing communities, 16 medical office buildings and one specialty hospital, which further attributed to the increase in depreciation and amortization expense across years.
Interest Expense and Loan Cost Amortization. Interest expense and loan cost amortization were approximately $11.5 million and $6.0 million for the years ended December 31, 2013 and 2012, respectively, relating to debt outstanding on our properties, of which approximately $0.7 million and $0.1 million, respectively, were capitalized as real estate under development related to our senior housing developments. For the year ended December 31, 2013, we recorded a write-off of approximately $0.2 million as a loss on the early extinguishment of debt and paid an exit fee of $0.8 million upon the repayment of the CHTSunIV mezzanine loan prior to its maturity date. Similarly, for the year ended December 31, 2012, we recorded a write-off of approximately $0.5 million in loan costs in connection with the refinancing of the Primrose Bridge Loan. During 2013, our average debt balance increased by approximately $268.3 million and our weighted average interest rate increased by 0.33%, which both contributed to the increase in interest expense and loan cost amortization across years.
Equity in Earnings of Unconsolidated Entities. Our unconsolidated entities generated equity in earnings of approximately $2.1 million and $1.1 million for the years ended December 31, 2013 and 2012, respectively, relating to our investments in the CHTSunIV, Windsor Manor and Montecito joint ventures.
Gain on Sale of Investment in Unconsolidated Entity. During the year end December 31, 2013, we recognized a gain of approximately $4.5 million related to the CHTSunIV Disposition. See “Sources of Liquidity and Capital Resources – Distributions from Unconsolidated Entities” for additional information. There was no sale of unconsolidated entities during the year ended December 31, 2012, nor do we currently expect future sales on investments in unconsolidated entities.
Income Tax Benefit (Expense). For the year ended December 31, 2013, we recognized state and federal income tax expense related to our properties held in taxable REIT subsidiaries of approximately $18,000. In contrast, for the year ended December 31, 2012, we recognized state and federal income tax benefit related to our properties held in taxable REIT subsidiaries of approximately $17,000.
82
Table of Contents
Funds from Operations and Modified Funds from Operations
Due to certain unique operating characteristics of real estate companies, as discussed below, NAREIT promulgated a measure known as FFO, which we believe to be an appropriate supplemental measure to reflect the operating performance of a REIT. The use of FFO is recommended by the REIT industry as a supplemental performance measure. FFO is not equivalent to net income or loss as determined under GAAP.
We define FFO, a non-GAAP measure, consistent with the standards approved by the Board of Governors of NAREIT. NAREIT defines FFO as net income or loss computed in accordance with GAAP, excluding gains or losses from sales of property, real estate asset impairment write-downs, plus depreciation and amortization of real estate related assets, and after adjustments for unconsolidated partnerships and joint ventures. Our FFO calculation complies with NAREIT’s policy described above.
The historical accounting convention used for real estate assets requires straight-line depreciation of buildings and improvements, which implies that the value of real estate assets diminishes predictably over time, especially if such assets are not adequately maintained or repaired and renovated as required by relevant circumstances and/or is requested or required by lessees for operational purposes in order to maintain the value of the property. We believe that, because real estate values historically rise and fall with market conditions, including inflation, interest rates, the business cycle, unemployment and consumer spending, presentations of operating results for a REIT using historical accounting for depreciation may be less informative. Historical accounting for real estate involves the use of GAAP. Any other method of accounting for real estate such as the fair value method cannot be construed to be any more accurate or relevant than the comparable methodologies of real estate valuation found in GAAP. Nevertheless, we believe that the use of FFO, which excludes the impact of real estate related depreciation and amortization, provides a more complete understanding of our performance to investors and to management, and when compared year over year, reflects the impact on our operations from trends in occupancy rates, rental rates, operating costs, general and administrative expenses, and interest costs, which may not be immediately apparent from net income or loss. However, FFO and MFFO, as described below, should not be construed to be more relevant or accurate than the current GAAP methodology in calculating net income or loss in its applicability in evaluating operating performance. The method utilized to evaluate the value and performance of real estate under GAAP should be construed as a more relevant measure of operational performance and considered more prominently than the non-GAAP FFO and MFFO measures and the adjustments to GAAP in calculating FFO and MFFO.
Changes in the accounting and reporting promulgations under GAAP (for acquisition fees and expenses for business combinations from a capitalization/depreciation model) to an expensed-as-incurred model that were put into effect in 2009 and other changes to GAAP accounting for real estate subsequent to the establishment of NAREIT’s definition of FFO have prompted an increase in cash-settled expenses, specifically acquisition fees and expenses, as items that are expensed under GAAP and accounted for as operating expenses. Our management believes these fees and expenses do not affect our overall long-term operating performance. Publicly registered, non-listed REITs typically have a significant amount of acquisition activity and are substantially more dynamic during their initial years of investment and operation. While other start up entities may also experience significant acquisition activity during their initial years, we believe that non-listed REITs are unique in that they have a limited life with targeted exit strategies within a relatively limited time frame after its acquisition activity ceases. Due to the above factors and other unique features of publicly registered, non-listed REITs, the Investment Program Association (“IPA”), an industry trade group, has standardized a measure known as MFFO which the IPA has recommended as a supplemental measure for publicly registered non-listed REITs and which we believe to be another appropriate supplemental measure to reflect the operating performance of a non-listed REIT. MFFO is not equivalent to our net income or loss as determined under GAAP, and MFFO may not be a useful measure of the impact of long-term operating performance on value if we do not continue to operate with a limited life and targeted exit strategy, as currently intended. We believe that because MFFO excludes costs that we consider more reflective of investing activities and other non-operating items included in FFO and also excludes acquisition fees and expenses that affect our operations only in periods in which properties are acquired, MFFO can provide, on a going forward basis, an indication of the sustainability (that is, the capacity to continue to be maintained) of our operating performance after the period in which we acquired our properties and once our portfolio is in place. By providing MFFO, we believe we are presenting useful information that assists investors and analysts to better assess the sustainability of our operating performance after our properties have been acquired. We also believe that MFFO is a recognized measure of sustainable operating performance by the non-listed REIT industry.
83
Table of Contents
We define MFFO, a non-GAAP measure, consistent with the IPA’s Guideline 2010-01, Supplemental Performance Measure for Publicly Registered, Non-Listed REITs: MFFO, or the Practice Guideline, issued by the IPA in November 2010. The Practice Guideline defines MFFO as FFO further adjusted for the following items, as applicable, included in the determination of GAAP net income or loss: acquisition fees and expenses; amounts relating to deferred rent receivables and amortization of above and below market leases and liabilities (which are adjusted in order to remove the impact of GAAP straight-line adjustments from rental revenues); accretion of discounts and amortization of premiums on debt investments, mark-to-market adjustments included in net income; nonrecurring gains or losses included in net income from the extinguishment or sale of debt, hedges, foreign exchange, derivatives or securities holdings where trading of such holdings is not a fundamental attribute of the business plan, and unrealized gains or losses resulting from consolidation from, or deconsolidation to, equity accounting and after adjustments for consolidated and unconsolidated partnerships and joint ventures, with such adjustments calculated to reflect MFFO on the same basis. The accretion of discounts and amortization of premiums on debt investments, nonrecurring unrealized gains and losses on hedges, foreign exchange, derivatives or securities holdings, unrealized gains and losses resulting from consolidations, as well as other listed cash flow adjustments are adjustments made to net income in calculating the cash flows provided by operating activities and, in some cases, reflect gains or losses which are unrealized and may not ultimately be realized.
Our MFFO calculation complies with the IPA’s Practice Guideline described above. In calculating MFFO, we exclude acquisition related expenses. Under GAAP, acquisition fees and expenses are characterized as operating expenses in determining operating net income or loss. These expenses are paid in cash by us. All paid and accrued acquisition fees and expenses will have negative effects on returns to investors, the potential for future distributions, and cash flows generated by us, unless earnings from operations or net sales proceeds from the disposition of other properties are generated to cover the purchase price of the property.
Our management uses MFFO and the adjustments used to calculate it in order to evaluate our performance against other non-listed REITs which have limited lives with short and defined acquisition periods and targeted exit strategies shortly thereafter. As noted above, MFFO may not be a useful measure of the impact of long-term operating performance on value if we do not continue to operate in this manner. We believe that our use of MFFO and the adjustments used to calculate it allow us to present our performance in a manner that reflects certain characteristics that are unique to non-listed REITs, such as their limited life, limited and defined acquisition period and targeted exit strategy, and hence that the use of such measures is useful to investors. For example, acquisition costs are funded from our subscription proceeds and other financing sources and not from operations. By excluding expensed acquisition costs, the use of MFFO provides information consistent with management’s analysis of the operating performance of the properties.
Presentation of this information is intended to provide useful information to investors as they compare the operating performance of different non-listed REITs, although it should be noted that not all REITs calculate FFO and MFFO the same way and as such comparisons with other REITs may not be meaningful. Furthermore, FFO and MFFO are not necessarily indicative of cash flows available to fund cash needs and should not be considered as an alternative to net income (loss) or income (loss) from continuing operations as an indication of our performance, as an alternative to cash flows from operations as an indication of our liquidity, or indicative of funds available to fund our cash needs including our ability to make distributions to our stockholders. FFO and MFFO should be reviewed in conjunction with other GAAP measurements as an indication of our performance. MFFO has limitations as a performance measure in an offering such as ours where the price of a share of common stock is a stated value and there is no net asset value determination during the offering stage and for a period thereafter. MFFO is useful in assisting management and investors in assessing the sustainability of operating performance in future operating periods, and in particular, after the offering and acquisition stages are complete and net asset value is disclosed. FFO and MFFO are not useful measures in evaluating net asset value because impairments are taken into account in determining net asset value but not in determining FFO and MFFO.
84
Table of Contents
Neither the SEC, NAREIT nor any other regulatory body has passed judgment on the acceptability of the adjustments we use to calculate FFO or MFFO. In the future, the SEC, NAREIT or another regulatory body may decide to standardize the allowable adjustments across the non-listed REIT industry and we would have to adjust its calculation and characterization of FFO or MFFO.
The following table presents a reconciliation of net loss to FFO and MFFO for the years ended December 31, 2014, 2013 and 2012 (in thousands, except per share data):
| Years Ended December 31, | ||||||||||||
| 2014 | 2013 | 2012 | ||||||||||
| Net loss |
$ | (52,511 | ) | $ | (18,100 | ) | $ | (10,720 | ) | |||
| Adjustments: |
||||||||||||
| Depreciation and amortization |
63,112 | 16,765 | 2,101 | |||||||||
| FFO adjustments from unconsolidated entities (1) |
2,994 | 2,767 | 2,377 | |||||||||
| Gain or loss related to sale of real estate assets |
— | (4,486 | ) | — | ||||||||
| Gain from change in control of investment in unconsolidated entity |
(2,798 | ) | — | — | ||||||||
|
|
|
|
|
|
|
|||||||
| Total funds from operations |
10,797 | (3,054 | ) | (6,242 | ) | |||||||
| Acquisition fees and expenses (2) |
23,931 | 18,840 | 6,585 | |||||||||
| Straight-line adjustments for leases (3) |
(2,472 | ) | (2,023 | ) | (843 | ) | ||||||
| Amortization of above/below market intangible assets and liabilities (4) |
345 | 68 | — | |||||||||
| Loss on extinguishment of debt (5) |
— | 244 | 460 | |||||||||
| Adjustments relating to contingent purchase price consideration (6) |
(630 | ) | (1,824 | ) | — | |||||||
| MFFO adjustments from unconsolidated entities (1) |
46 | 330 | 837 | |||||||||
|
|
|
|
|
|
|
|||||||
| Modified funds from operations |
$ | 32,017 | $ | 12,581 | $ | 797 | ||||||
|
|
|
|
|
|
|
|||||||
| Weighted average number of shares of common stock outstanding (basic and diluted) (7) |
83,457 | 41,197 | 13,199 | |||||||||
|
|
|
|
|
|
|
|||||||
| Net loss per share (basic and diluted) |
$ | (0.63 | ) | $ | (0.44 | ) | $ | (0.81 | ) | |||
|
|
|
|
|
|
|
|||||||
| FFO per share (basic and diluted) |
$ | 0.13 | $ | (0.07 | ) | $ | (0.47 | ) | ||||
|
|
|
|
|
|
|
|||||||
| MFFO per share (basic and diluted) |
$ | 0.38 | $ | 0.31 | $ | 0.06 | ||||||
|
|
|
|
|
|
|
|||||||
FOOTNOTES:
| (1) | This amount represents our share of the FFO or MFFO adjustments allowable under the NAREIT or IPA definitions, respectively, calculated using the HLBV method. |
| (2) | In evaluating investments in real estate, management differentiates the costs to acquire the investment from the operations derived from the investment. By adding back acquisition expenses, management believes MFFO provides useful supplemental information of its operating performance and will also allow comparability between different real estate entities regardless of their level of acquisition activities. Acquisition expenses include payments to our Advisor or third parties. Acquisition expenses for business combinations under GAAP are considered operating expenses and as expenses included in the determination of net income (loss) and income (loss) from continuing operations, both of which are performance measures under GAAP. All paid or accrued acquisition expenses will have negative effects on returns to investors, the potential for future distributions, and cash flows generated by us, unless earnings from operations or net sales proceeds from the disposition of properties are generated to cover the purchase price of the property. |
| (3) | Under GAAP, rental receipts are allocated to periods using various methodologies. This may result in income recognition that is significantly different than underlying contract terms. By adjusting for these items (to reflect such payments from a GAAP accrual basis to a cash basis of disclosing the rent and lease payments), MFFO provides useful supplemental information on the realized economic impact of lease terms and debt investments, providing insight on the contractual cash flows of such lease terms and debt investments, and aligns results with management’s analysis of operating performance. |
85
Table of Contents
| (4) | Under GAAP, certain intangibles are accounted for at cost and reviewed at least annually for impairment, and certain intangibles are assumed to diminish predictably in value over time and are amortized, similar to depreciation and amortization of other real estate-related assets that are excluded from FFO. However, because real estate values and market lease rates historically rise or fall with market conditions, management believes that by excluding charges relating to amortization of these intangibles, MFFO provides useful supplemental information on the performance of the real estate. |
| (5) | Management believes that adjusting for the realized loss on the early extinguishment of debt is appropriate because the write-off of unamortized loan costs is a non-recurring, non-cash adjustment that is not reflective of our ongoing operating performance and aligns results with management’s analysis of operating performance. |
| (6) | Management believes that the elimination of the adjustments relating to contingent purchase price consideration included in operating income (expense) for GAAP purposes is appropriate because the adjustment is a non-recurring adjustment that is not reflective of our ongoing operating performance and aligns results with management’s analysis of operating performance. |
| (7) | For purposes of determining the weighted average number of shares of common stock outstanding, stock distributions are treated as if they were outstanding as of the beginning of the periods presented. |
Contractual Obligations
The following table presents our contractual obligations and the related payment periods as of December 31, 2014:
| Payments Due by Period | ||||||||||||||||||||
| 2015 | 2016-2017 | 2018-2019 | Thereafter | Total | ||||||||||||||||
| Mortgage and other notes payable (principal and interest) |
$ | 48,018 | $ | 191,413 | $ | 604,649 | $ | 148,291 | $ | 992,371 | ||||||||||
| Credit Facilities (principal and interest) |
4,818 | 41,038 | 179,725 | — | 225,581 | |||||||||||||||
| Development contracts on development properties (1) |
68,230 | 8,198 | — | — | 76,428 | |||||||||||||||
| Ground and air rights leases (2) |
1,347 | 2,773 | 2,881 | 102,773 | 109,774 | |||||||||||||||
|
|
|
|
|
|
|
|
|
|
|
|||||||||||
| $ | 122,413 | $ | 243,422 | $ | 787,255 | $ | 251,064 | $ | 1,404,154 | |||||||||||
|
|
|
|
|
|
|
|
|
|
|
|||||||||||
FOOTNOTES:
| (1) | The amounts presented above represent accrued development costs as of December 31, 2014 and development costs not yet incurred of the aggregate budgeted development costs, including start-up costs, in accordance with the development agreements, and the expected timing of such costs. The amounts include approximately $71.3 million of contractual obligations with third-party developers and approximately $5.1 million of additional expected development costs that have been included in the respective development budgets. |
| (2) | Ground and air rights leases are operating leases with scheduled payments over the life of the respective leases and with expirations ranging from 2053 to 2101. |
Off-Balance Sheet Arrangements
In June 2014, our Windsor Manor joint venture refinanced approximately $18.0 million of its then-current outstanding debt related to five senior housing communities in Iowa of which approximately $11.6 million related to a bridge loan maturing on June 30, 2014 and the approximate $6.4 million remaining related to the extinguishment of the joint venture’s other mortgage loans prior to the scheduled expirations. In connection therewith, the joint venture paid an exit fee of approximately $0.5 million upon extinguishment of the mortgage loans. The new loan includes a five year term with monthly principal and interest payments based upon a 25-year amortization and a variable interest rate equal to LIBOR plus 3.5%. In addition, in connection with the refinancing, our Windsor Manor joint venture received aggregate proceeds of $22.0 million, of which approximately $0.4 million were used to pay loan costs associated with the refinancing and the remaining $3.6 million were available for capital distribution to the members. Our Windsor Manor joint venture declared capital distributions of $2.2 million and $1.4 million, respectively, to us and our joint venture partner as a return of capital. These capital distributions were paid to the respective members in the third quarter of 2014.
86
Table of Contents
In August 2014, the Company acquired its co-venture partner’s 10% interest in the Montecito joint venture; refer to Item 8, “Financial Statements and Supplemental Data – Note 3. Acquisitions – Purchase of Controlling Interest in Montecito Joint Venture” for additional information.
See Item 8, “Financial Statements and Supplemental Data – Note 8. Unconsolidated Entities” in the accompanying consolidated financial statements for additional information related to these joint ventures.
Related-Party Transactions
We have entered into agreements with our Advisor and its affiliates, whereby we agree to pay certain fees to, or reimburse certain expenses of, our Advisor or its affiliates for acquisition and advisory services, organization and offering costs, selling commissions, marketing support fees, asset and property management fees and reimbursement of operating costs. See Item 8, “Financial Statements and Supplemental Data – Note 11. Related Party Arrangements” in the accompanying consolidated financial statements for additional information.
Critical Accounting Policies and Estimates
Below is a discussion of the accounting policies that management believes are critical. We consider these policies critical because they involve difficult management judgments and assumptions, require estimates about matters that are inherently uncertain and because they are important for understanding and evaluating our reported financial results. These judgments will affect the reported amounts of assets and liabilities and our disclosure of contingent assets and liabilities at the dates of the financial statements and the reported amounts of revenue and expenses during the reporting periods. With different estimates or assumptions, materially different amounts could be reported in our financial statements. Additionally, other companies may utilize different estimates that may impact the comparability of our results of operations to those of companies in similar businesses. Our most sensitive estimates will involve the allocation of the purchase price of acquired properties and evaluating our real estate-related investments for impairment.
Basis of Presentation and Consolidation. Our consolidated financial statements will include our accounts, the accounts of our wholly owned subsidiaries or subsidiaries for which we have a controlling interest, the accounts of variable interest entities (“VIEs”) in which we are the primary beneficiary, and the accounts of other subsidiaries over which we have a controlling financial interest. All material intercompany accounts and transactions will be eliminated in consolidation.
We will analyze our variable interests, including loans, leases, guarantees, and equity investments, to determine if the entity in which we have a variable interest is a variable interest entity. Our analysis includes both quantitative and qualitative reviews. We base our quantitative analysis on the forecasted cash flows of the entity, and our qualitative analysis on a review of the design of the entity, its organizational structure, including decision-making ability and financial agreements. We also use our quantitative and qualitative analyses to determine if we must consolidate a variable interest entity as the primary beneficiary.
Use of Estimates. The preparation of financial statements in conformity with GAAP requires us to make estimates and assumptions that affect the reported amounts of assets and liabilities as of the date of the consolidated financial statements, the reported amounts of revenues and expenses during the reporting periods and the disclosure of contingent liabilities. For example, significant assumptions are made in the allocation of purchase price, the analysis of real estate impairments, the analysis of residual value and economic lives for leased properties, the valuation of contingent assets and liabilities, and the valuation of restricted stock shares issued to the Advisor or Property Manager. Accordingly, actual results could differ from those estimates.
Allocation of Purchase Price for Real Estate Acquisitions. Upon acquisition of properties, we estimate the fair value of acquired tangible assets (consisting of land, building and improvements, tenant improvements and equipment), intangible assets (consisting of in-place leases and above- or below-market leases), liabilities assumed and any contingent assets or liabilities in order to allocate the purchase price. In estimating the fair value of the assets acquired and liabilities assumed, we consider information obtained about each property as a result of our due diligence and utilize various valuation methods, such as estimated cash flow projections using appropriate discount and capitalization rates, estimates of replacement costs net of depreciation and available market information.
87
Table of Contents
The fair value of the tangible assets of an acquired leased property is determined by valuing the property as if it were vacant, and the “as-if-vacant” value is then allocated to land, building and tenant improvements based on the relative fair values of these assets.
Above- and below-market lease intangibles are recorded based on the present value of the difference between the contractual amounts to be paid and management’s estimate of the fair market lease rates for each in-place lease. The purchase price is further allocated to in-place lease intangibles based on management’s evaluation of the specific characteristics of the acquired lease. Factors considered include estimates of carrying costs during hypothetical expected lease up periods, including estimates of lost rental income during the expected lease up periods, and costs to execute similar leases such as leasing commissions, legal and other related expenses and may include assumptions for lease renewals of below market leases.
We may also enter into contingent purchase price consideration arrangements in connection with acquisitions, which could result in either an asset or liability being recognized as part of the purchase price allocation. In calculating the estimated fair value of contingent purchase price consideration arrangements, we consider information obtained during the due diligence and the budget process as well as discount rates to determine the fair value. We evaluate the fair value of the arrangements at each reporting period and record any adjustments to the fair value as a component of operating income (expense) in the consolidated statement of operations.
Impairment of Real Estate Assets. Real estate assets are reviewed on an ongoing basis to determine whether there are any indicators that the value of the real estate properties (including any related amortizable intangible assets or liabilities) may be impaired. Factors that could trigger an impairment analysis include, among others: (i) significant underperformance relative to historical or projected future operating results; (ii) significant changes in the manner of use of our real estate assets or the strategy of our overall business; (iii) a significant increase in competition; (iv) a significant adverse change in legal factors or an adverse action or assessment by a regulator, which could affect the value of our real estate assets; or (v) significant negative industry or economic trends. When such events or changes in circumstances are present, we will assess potential impairment by comparing estimated future undiscounted operating cash flows expected to be generated over the life of the asset and from its eventual disposition, to the carrying amount of the asset. Generally, a property value is considered impaired if management’s estimate of current and projected cash flows (undiscounted and unleveraged) of the property over its estimated holding period is less than the net carrying value of the property. Such cash flow projections consider factors such as expected future operating income, trends and prospects, as well as the effects of demand, competition and other factors. To the extent impairment has occurred, the carrying value of the property is adjusted to an amount to reflect the estimated fair value of the property.
For real estate we indirectly own through an investment in a joint venture, tenant-in-common interest or other similar investment structure and account for under the equity method, at each reporting date, we will compare the estimated fair value of our investment to the carrying value. An impairment charge will be recorded to the extent the fair value of our investment is less than the carrying amount and the decline in value is determined to be other than a temporary decline.
Income Taxes. To qualify as a REIT, we are subject to certain organizational and operational requirements, including a requirement to distribute to stockholders at least 90% of our annual REIT taxable income (which is computed without regard to the dividends-paid deduction or net capital gain and which does not necessarily equal net income as calculated in accordance with GAAP). As a REIT, we generally will not be subject to U.S. federal income tax on income that we distribute as dividends to our stockholders. If we fail to qualify as a REIT in any taxable year, we will be subject to U.S. federal income tax on our taxable income at regular corporate income tax rates and generally will not be permitted to qualify for treatment as a REIT for federal income tax purposes for the four taxable years following the year during which qualification is lost, unless the Internal Revenue Service grants us relief under certain statutory provisions. Such an event could materially adversely affect our net income and net cash available for distribution to stockholders. However, we believe that we are organized and will operate in such a manner as to qualify for treatment as a REIT. Notwithstanding our intent to be treated as a REIT, we may be subject to U.S. federal taxes on our TRS entities and will be subject to taxes in other jurisdictions such as state, local or foreign jurisdictions.
88
Table of Contents
Shares Based Payments to Non-Employees. In connection with the Expense Support Agreements, we may issue Restricted Stock to the Advisor or the Property Manager on a quarterly basis in exchange for providing expense support in the event that cash distributions declared exceed modified funds from operations as defined by the Expense Support Agreements.
The Restricted Stock is forfeited if shareholders do not ultimately receive their original invested capital back with at least a 6% annualized return of investment upon a future liquidity or disposition event. Upon issuance of Restricted Stock, we measure the fair value at our then-current lowest aggregate fair value pursuant to the Accounting Standards Codification (“ASC”) 505-50. On the date in which the Advisor or the Property Manager satisfies the vesting criteria, we remeasure the fair value of the Restricted Stock pursuant to ASC 505-50 and record expense equal to the difference between the original fair value and that of the remeasurement date. In addition, given that performance is outside the control of the Advisor or the Property Manager and involves both market conditions and counterparty performance conditions, the shares are treated as unissued for accounting purposes and we only include the Restricted Stock in the calculation of diluted earnings per share to the extent their effect is dilutive and the vesting conditions have been satisfied as of the reporting date.
Pursuant to the Expense Support Agreements, the Advisor or the Property Manager shall be the record owner of the Restricted Stock until the shares of common stock are sold or otherwise disposed of, and shall be entitled to all of the rights of a stockholder including, without limitation, the right to vote such shares (to the extent permitted by the Articles) and receive all dividends and other distributions paid with respect to such shares. All dividends or other distributions actually paid to the Advisor or the Property Manager in connection with the Restricted Stock shall vest immediately and will not be subject to forfeiture. We recognize expense related to the dividends on the Restricted Stock shares as declared.
Revenue Recognition — Rental income from operating leases is recorded on the straight-line basis over the terms of the leases. Our leases require the tenants to pay certain additional contractual amounts that are set aside by us for replacements of fixed assets and other improvements to the properties. These amounts are and will remain our property during and after the term of the lease. The amounts are recorded as capital improvement reserve income at the time that they are earned and are included in rental income from operating leases in the accompanying consolidated statement of operations. Additional percentage rent that is due contingent upon tenant performance thresholds, such as gross revenues, is deferred until the underlying performance thresholds have been achieved.
Resident fees and services consist of monthly services, which include rent, assistance and other related services. Agreements with residents are generally for an initial term of three months and are cancelable by the residents with 30 days’ notice.
Tenant reimbursement income represents amounts tenants are required to reimburse us in accordance with the terms of the leases and are recognized in the period in which the related reimbursable expenses are incurred.
Interest income is recognized on an accrual basis when earned. Any deferred portion of contractual interest is recognized on a straight-line basis over the term of the corresponding note receivable. Loan origination fees incurred are recognized as a reduction in interest income over the term of the note receivable.
Impact of Accounting Pronouncements
See Item 8, “Financial Statements and Supplemental Data – Note 2. Significant Accounting Policies” for additional information about the impact of accounting pronouncements.
89
Table of Contents
Item 7A. Quantitative and Qualitative Disclosures about Market Risks
We may be exposed to interest rate changes primarily as a result of long-term debt used to acquire properties and to make loans and other permitted investments. Our management objectives related to interest rate risk will be to limit the impact of interest rate changes on earnings and cash flows and to lower our overall borrowing costs. To achieve our objectives, we expect to borrow primarily at fixed rates or variable rates with the lowest margins available, and in some cases, with the ability to convert variable rates to fixed rates. With regard to variable rate financing, we will assess interest rate cash flow risk by continually identifying and monitoring changes in interest rate exposures that may adversely impact expected future cash flows and by evaluating hedging opportunities.
The following is a schedule as of December 31, 2014, of our fixed and variable rate debt maturities for each of the next five years, and thereafter (principal maturities only) (in thousands):
| Expected Maturities | ||||||||||||||||||||||||||||||||
| 2015 | 2016 | 2017 | 2018 | 2019 | Thereafter | Total | Fair Value (1) | |||||||||||||||||||||||||
| Fixed rate debt |
8,666 | 9,031 | 9,439 | 203,381 | 4,060 | 136,277 | 370,854 | 382,000 | ||||||||||||||||||||||||
|
|
|
|
|
|
|
|
|
|
|
|
|
|
|
|
|
|||||||||||||||||
| Weighted average interest |
4.27 | % | 4.27 | % | 4.27 | % | 4.30 | % | 4.21 | % | 4.21 | % | 4.26 | % | ||||||||||||||||||
|
|
|
|
|
|
|
|
|
|
|
|
|
|
|
|||||||||||||||||||
| Variable rate debt |
9,169 | 90,721 | 56,084 | 93,316 | 440,035 | — | 689,325 | 693,000 | ||||||||||||||||||||||||
|
|
|
|
|
|
|
|
|
|
|
|
|
|
|
|
|
|||||||||||||||||
| Average interest rate |
LIBOR+2.49 | % | LIBOR+2.50 | % | LIBOR+2.42 | % | LIBOR+2.39 | % | LIBOR+2.35 | % | — | % | LIBOR+2.38 | % | ||||||||||||||||||
|
|
|
|
|
|
|
|
|
|
|
|
|
|
|
|||||||||||||||||||
FOOTNOTE:
| (1) | The estimated fair value of our fixed and variable rate debt was determined using discounted cash flows based on market interest rates as of December 31, 2014. We determined market rates through discussions with our existing lenders by pricing our loans with similar terms and current rates and spreads. |
Management estimates that a one-percentage point increase or decrease in LIBOR in 2015 compared to LIBOR rates as of December 31, 2014 would result in fluctuation of interest expense on our variable rate debt of approximately $6.9 million for the year ending December 31, 2015. This sensitivity analysis contains certain simplifying assumptions, and although it gives an indication of our exposure to changes in interest rates, it is not intended to predict future results and actual results will likely vary given that our sensitivity analysis on the effects of changes in LIBOR does not factor in a potential change in variable rate debt levels, any offsetting gains on interest rate swap contracts, or the impact of any LIBOR floors or caps.
As of December 31, 2014, the Company’s debt is comprised of approximately 35.0% in fixed rate debt, approximately 43.3% in variable rate debt with current or forward-starting interest rate swaps and approximately 21.7% of unhedged variable rate debt. In January 2015, we entered into a forward starting interest rate swap related to our debt on the Southeast Medical Office Properties, which is approximately 13.5% of the aforementioned unhedged variable rate debt as of December 31, 2014. The remaining unhedged variable rate debt primarily relates to our construction loans and the Revolving Credit Facility. Overall, we believe longer term fixed rate debt could be beneficial in a rising interest rate or rising inflation rate environment and as such we continue to evaluate the need for additional interest rate swaps on unhedged variable rate debt.
90
Table of Contents
Item 8. FINANCIAL STATEMENTS AND SUPPLEMENTARY DATA
INDEX TO CONSOLIDATED FINANCIAL STATEMENTS
CNL HEALTHCARE PROPERTIES, INC. AND SUBSIDIARIES
| Page | ||||
| Report of Independent Registered Certified Public Accounting Firm |
92 | |||
| 93 | ||||
| 94 | ||||
| 95 | ||||
| Consolidated Statements of Stockholders’ Equity and Redeemable Noncontrolling Interest |
96 | |||
| 98 | ||||
| 100 | ||||
91
Table of Contents
Report of Independent Registered Certified Public Accounting Firm
To the Board of Directors and Stockholders of CNL Healthcare Properties, Inc. and Subsidiaries:
In our opinion, the consolidated financial statements listed in the accompanying index present fairly, in all material respects, the financial position of CNL Healthcare Properties, Inc. and its subsidiaries at December 31, 2014 and 2013, and the results of their operations and their cash flows for each of the three years in the period ended December 31, 2014 in conformity with accounting principles generally accepted in the United States of America. In addition, in our opinion, the financial statement schedules listed in the index appearing under Item 15(a)(2) present fairly, in all material respects, the information set forth therein when read in conjunction with the related consolidated financial statements. These financial statements and financial statement schedules are the responsibility of the Company’s management. Our responsibility is to express an opinion on these financial statements and financial statement schedules based on our audits. We conducted our audits of these statements in accordance with the standards of the Public Company Accounting Oversight Board (United States). Those standards require that we plan and perform the audit to obtain reasonable assurance about whether the financial statements are free of material misstatement. An audit includes examining, on a test basis, evidence supporting the amounts and disclosures in the financial statements, assessing the accounting principles used and significant estimates made by management, and evaluating the overall financial statement presentation. We believe that our audits provide a reasonable basis for our opinion.
/s/ PricewaterhouseCoopers LLP
Orlando, Florida
March 27, 2015
92
Table of Contents
CNL HEALTHCARE PROERTIES, INC. AND SUBSIDIARIES
(in thousands, except per share data)
| December 31, | ||||||||
| 2014 | 2013 | |||||||
| ASSETS |
||||||||
| Real estate assets: |
||||||||
| Real estate investment properties, net (including VIEs $174,449 and $72,053, respectively) |
$ | 1,657,500 | $ | 848,791 | ||||
| Real estate under development, including land (including VIEs $47,153 and $16,210 respectively) |
47,153 | 17,409 | ||||||
|
|
|
|
|
|||||
| Total real estate assets, net |
1,704,653 | 866,200 | ||||||
| Intangibles, net (including VIEs $25,519 and $4,535 respectively) |
140,264 | 52,400 | ||||||
| Cash (including VIEs $6,280 and $727 respectively) |
91,355 | 44,209 | ||||||
| Loan costs, net (including VIEs $2,300 and $912 respectively) |
14,012 | 7,919 | ||||||
| Other assets (including VIEs $467 and $21 respectively) |
11,197 | 6,445 | ||||||
| Restricted cash (including VIEs $5,304 and $257 respectively) |
10,753 | 2,839 | ||||||
| Deferred rent and lease incentives (including VIEs $2,978 and $104 respectively) |
8,240 | 2,782 | ||||||
| Investments in unconsolidated entities |
7,379 | 18,438 | ||||||
| Deposits (including VIEs $44 and $0 respectively) |
1,162 | 8,892 | ||||||
| Note receivable from related party |
— | 3,949 | ||||||
|
|
|
|
|
|||||
| Total assets |
$ | 1,989,015 | $ | 1,014,073 | ||||
|
|
|
|
|
|||||
| LIABILITIES AND EQUITY |
||||||||
| Liabilities: |
||||||||
| Mortgages and other notes payable, net (including VIEs $137,754 and $52,596 respectively) |
$ | 853,561 | $ | 438,107 | ||||
| Credit facilities |
206,403 | 98,500 | ||||||
| Other liabilities (including VIEs $4,949 and $939 respectively) |
27,448 | 7,243 | ||||||
| Accounts payable and accrued expenses (including VIEs $2,317 and $309 respectively) |
18,493 | 7,887 | ||||||
| Accrued development costs (including VIEs $7,951 and $7,047 respectively) |
7,951 | 7,047 | ||||||
| Due to related parties (including VIEs $219 and $112 respectively) |
2,999 | 3,308 | ||||||
|
|
|
|
|
|||||
| Total liabilities |
1,116,855 | 562,092 | ||||||
|
|
|
|
|
|||||
| Commitments and contingencies (Note 15) |
||||||||
| Redeemable noncontrolling interest |
568 | — | ||||||
| Stockholders’ equity: |
||||||||
| Preferred stock, $0.01 par value per share, 200,000 shares authorized; none issued or outstanding |
— | — | ||||||
| Excess shares, $0.01 par value per share, 300,000 shares authorized; none issued or outstanding |
— | — | ||||||
| Common stock, $0.01 par value per share, 1,120,000 shares authorized, 116,672 and 58,308 shares issued, and 116,256 and 58,218 shares outstanding, respectively |
1,163 | 582 | ||||||
| Capital in excess of par value |
1,007,326 | 500,361 | ||||||
| Accumulated loss |
(83,091 | ) | (30,580 | ) | ||||
| Accumulated distributions |
(49,342 | ) | (17,423 | ) | ||||
| Accumulated other comprehensive loss |
(4,864 | ) | (959 | ) | ||||
|
|
|
|
|
|||||
| Total stockholders’ equity |
871,192 | 451,981 | ||||||
| Noncontrolling interest |
400 | — | ||||||
|
|
|
|
|
|||||
| Total equity |
872,160 | 451,981 | ||||||
|
|
|
|
|
|||||
| Total liabilities and equity |
$ | 1,989,015 | $ | 1,014,073 | ||||
|
|
|
|
|
|||||
The abbreviation VIEs above means variable interest entities.
See accompanying notes to consolidated financial statements.
93
Table of Contents
CNL HEALTHCARE PROPERTIES, INC. AND SUBSIDIARIES
CONSOLIDATED STATEMENTS OF OPERATIONS
(in thousands, except per share data)
| Years Ended December 31, | ||||||||||||
| 2014 | 2013 | 2012 | ||||||||||
| Revenues: |
||||||||||||
| Rental income from operating leases |
$ | 49,305 | $ | 23,297 | $ | 6,925 | ||||||
| Resident fees and services |
123,777 | 27,550 | 460 | |||||||||
| Tenant reimbursement income |
7,504 | 1,640 | — | |||||||||
| Interest income on note receivable from related party |
498 | 118 | — | |||||||||
|
|
|
|
|
|
|
|||||||
| Total revenues |
181,084 | 52,605 | 7,385 | |||||||||
|
|
|
|
|
|
|
|||||||
| Operating Expenses: |
||||||||||||
| Property operating expenses |
93,549 | 20,940 | 406 | |||||||||
| General and administrative |
6,877 | 5,618 | 2,563 | |||||||||
| Acquisition fees and expenses |
23,931 | 18,840 | 6,585 | |||||||||
| Asset management fees |
8,481 | 3,614 | 1,369 | |||||||||
| Property management fees |
8,942 | 2,642 | 404 | |||||||||
| Contingent purchase price consideration adjustment |
(630 | ) | (1,824 | ) | — | |||||||
| Depreciation and amortization |
63,112 | 16,765 | 2,101 | |||||||||
|
|
|
|
|
|
|
|||||||
| Total operating expenses |
204,262 | 66,595 | 13,428 | |||||||||
| Operating loss |
(23,178 | ) | (13,990 | ) | (6,043 | ) | ||||||
|
|
|
|
|
|
|
|||||||
| Other income (expense): |
||||||||||||
| Interest and other income |
104 | 74 | 13 | |||||||||
| Interest expense and loan cost amortization |
(30,487 | ) | (10,799 | ) | (5,850 | ) | ||||||
| Equity in earnings (loss) of unconsolidated entities |
(1,387 | ) | 2,147 | 1,143 | ||||||||
| Gain on sale of investment in unconsolidated entity |
— | 4,486 | — | |||||||||
| Gain on purchase of controlling interest of investment in unconsolidated entity |
2,798 | — | — | |||||||||
|
|
|
|
|
|
|
|||||||
| Total other expense |
(28,972 | ) | (4,092 | ) | (4,694 | ) | ||||||
|
|
|
|
|
|
|
|||||||
| Loss before income taxes |
(52,150 | ) | (18,082 | ) | (10,737 | ) | ||||||
| Income tax benefit (expense) |
(361 | ) | (18 | ) | 17 | |||||||
|
|
|
|
|
|
|
|||||||
| Net loss |
$ | (52,511 | ) | $ | (18,100 | ) | $ | (10,720 | ) | |||
|
|
|
|
|
|
|
|||||||
| Less: Net loss attributable to noncontrolling interest |
— | — | — | |||||||||
|
|
|
|
|
|
|
|||||||
| Net loss attributable to common stockholders |
(52,511 | ) | (18,100 | ) | (10,720 | ) | ||||||
|
|
|
|
|
|
|
|||||||
| Net loss per share of common stock |
$ | (0.63 | ) | $ | (0.44 | ) | $ | (0.81 | ) | |||
|
|
|
|
|
|
|
|||||||
| Weighted average number of shares of |
83,457 | 41,197 | 13,199 | |||||||||
|
|
|
|
|
|
|
|||||||
See accompanying notes to consolidated financial statements.
94
Table of Contents
CNL HEALTHCARE PROPERTIES, INC. AND SUBSIDIARIES
CONSOLIDATED STATEMENTS OF COMPREHENSIVE LOSS
(in thousands)
| Years Ended December 31, | ||||||||||||
| 2014 | 2013 | 2012 | ||||||||||
| Net loss |
$ | (52,511 | ) | $ | (18,100 | ) | $ | (10,720 | ) | |||
|
|
|
|
|
|
|
|||||||
| Other comprehensive income (loss): |
||||||||||||
| Unrealized loss on derivative financial instruments, net |
(3,915 | ) | (1,042 | ) | — | |||||||
| Unrealized gain on derivative financial instruments of equity method investments |
10 | 83 | — | |||||||||
|
|
|
|
|
|
|
|||||||
| Total other comprehensive loss |
(3,905 | ) | (959 | ) | — | |||||||
|
|
|
|
|
|
|
|||||||
| Comprehensive loss |
$ | (56,416 | ) | $ | (19,059 | ) | $ | (10,720 | ) | |||
|
|
|
|
|
|
|
|||||||
| Less: Comprehensive loss attributable to noncontrolling interest |
— | — | — | |||||||||
|
|
|
|
|
|
|
|||||||
| Comprehensive loss attributable to common stockholders |
$ | (56,416 | ) | $ | (19,059 | ) | $ | (10,720 | ) | |||
|
|
|
|
|
|
|
|||||||
See accompanying notes to consolidated financial statements.
95
Table of Contents
CNL HEALTHCARE PROPERTIES, INC. AND SUBSIDIARIES
CONSOLIDATED STATEMENTS OF STOCKHOLDERS’ EQUITY AND REDEEMABLE NONCONTROLLING INTEREST
(in thousands, except per share data)
| Accumulated | ||||||||||||||||||||||||||||||||||||||||
| Redeemable | Common Stock | Capital in | Other | Total | Non- | |||||||||||||||||||||||||||||||||||
| Noncontrolling | Number | Par | Excess of | Accumulated | Accumulated | Comprehensive | Stockholders’ | controlling | Total | |||||||||||||||||||||||||||||||
| Interest | of Shares | Value | Par Value | Loss | Distributions | Loss | Equity | Interest | Equity | |||||||||||||||||||||||||||||||
| Balance at December 31, 2011 |
$ | — | 1,357 | $ | 13 | $ | 11,505 | $ | (1,760 | ) | $ | (56 | ) | $ | — | $ | 9,702 | $ | — | $ | 9,702 | |||||||||||||||||||
| Subscriptions received for common stock through public offering and reinvestment plan |
— | 16,850 | 169 | 168,097 | — | — | — | 168,266 | — | 168,266 | ||||||||||||||||||||||||||||||
| Stock distributions |
— | 240 | 2 | (2 | ) | — | — | — | — | — | — | |||||||||||||||||||||||||||||
| Redemptions of common stock |
— | (1 | ) | — | (10 | ) | — | — | — | (10 | ) | — | (10 | ) | ||||||||||||||||||||||||||
| Stock issuance and offering costs |
— | — | — | (23,390 | ) | — | — | — | (23,390 | ) | — | (23,390 | ) | |||||||||||||||||||||||||||
| Net loss |
— | — | — | — | (10,720 | ) | — | — | (10,720 | ) | — | (10,720 | ) | |||||||||||||||||||||||||||
| Cash distributions declared and paid or reinvested ($0.39996 per share) |
— | — | — | — | — | (3,197 | ) | — | (3,197 | ) | — | (3,197 | ) | |||||||||||||||||||||||||||
|
|
|
|
|
|
|
|
|
|
|
|
|
|
|
|
|
|
|
|
|
|||||||||||||||||||||
| Balance at December 31, 2012 |
$ | — | 18,446 | $ | 184 | $ | 156,200 | $ | (12,480 | ) | $ | (3,253 | ) | $ | — | $ | 140,651 | $ | — | $ | 140,651 | |||||||||||||||||||
| Subscriptions received for common stock through public offering and reinvestment plan |
— | 38,798 | 388 | 386,975 | — | — | — | 387,363 | — | 387,363 | ||||||||||||||||||||||||||||||
| Stock distributions |
— | 1,063 | 11 | (11 | ) | — | — | — | — | — | — | |||||||||||||||||||||||||||||
| Redemptions of common stock |
— | (89 | ) | (1 | ) | (826 | ) | — | — | — | (827 | ) | — | (827 | ) | |||||||||||||||||||||||||
| Stock issuance and offering costs |
— | — | — | (41,977 | ) | — | — | — | (41,977 | ) | — | (41,977 | ) | |||||||||||||||||||||||||||
| Net loss |
— | — | — | — | (18,100 | ) | — | — | (18,100 | ) | — | (18,100 | ) | |||||||||||||||||||||||||||
| Other comprehensive loss |
— | — | — | — | — | — | (959 | ) | (959 | ) | — | (959 | ) | |||||||||||||||||||||||||||
| Cash distributions declared and paid or reinvested ($0.39996 per share) |
— | — | — | — | — | (14,170 | ) | — | (14,170 | ) | — | (14,170 | ) | |||||||||||||||||||||||||||
|
|
|
|
|
|
|
|
|
|
|
|
|
|
|
|
|
|
|
|
|
|||||||||||||||||||||
| Balance at December 31, 2013 |
$ | — | 58,218 | $ | 582 | $ | 500,361 | $ | (30,580 | ) | $ | (17,423 | ) | $ | (959 | ) | $ | 451,981 | $ | — | $ | 451,981 | ||||||||||||||||||
|
|
|
|
|
|
|
|
|
|
|
|
|
|
|
|
|
|
|
|
|
|||||||||||||||||||||
See accompanying notes to consolidated financial statements.
96
Table of Contents
CNL HEALTHCARE PROPERTIES, INC. AND SUBSIDIARIES
CONSOLIDATED STATEMENTS OF STOCKHOLDERS’ EQUITY AND REDEEMABLE NONCONTROLLING INTEREST (CONTINUED)
(in thousands, except per share data)
| Accumulated | ||||||||||||||||||||||||||||||||||||||||
| Redeemable | Common Stock | Capital in | Other | Total | Non- | |||||||||||||||||||||||||||||||||||
| Noncontrolling | Number | Par | Excess of | Accumulated | Accumulated | Comprehensive | Stockholders’ | controlling | Total | |||||||||||||||||||||||||||||||
| Interest | of Shares | Value | Par Value | Loss | Distributions | Loss | Equity | Interest | Equity | |||||||||||||||||||||||||||||||
| Balance at December 31, 2013 |
$ | — | 58,218 | $ | 582 | $ | 500,361 | $ | (30,580 | ) | $ | (17,423 | ) | $ | (959 | ) | $ | 451,981 | $ | — | $ | 451,981 | ||||||||||||||||||
| Subscriptions received for common stock through public offering and reinvestment plan |
— | 56,006 | 560 | 571,764 | — | — | — | 572,324 | — | 572,324 | ||||||||||||||||||||||||||||||
| Stock distributions |
— | 2,356 | 24 | (24 | ) | — | — | — | — | — | — | |||||||||||||||||||||||||||||
| Redemptions of common stock |
— | (324 | ) | (3 | ) | (2,993 | ) | — | — | — | (2,996 | ) | — | (2,996 | ) | |||||||||||||||||||||||||
| Stock issuance and offering costs |
— | — | — | (59,782 | ) | — | — | — | (59,782 | ) | — | (59,782 | ) | |||||||||||||||||||||||||||
| Net loss |
— | — | — | — | (52,511 | ) | — | — | (52,511 | ) | — | (52,511 | ) | |||||||||||||||||||||||||||
| Other comprehensive loss |
— | — | — | — | — | — | (3,905 | ) | (3,905 | ) | — | (3,905 | ) | |||||||||||||||||||||||||||
| Distribution to holder of promoted interest |
— | — | — | (2,000 | ) | — | — | — | (2,000 | ) | — | (2,000 | ) | |||||||||||||||||||||||||||
| Cash distributions declared and paid or reinvested |
— | — | — | — | — | (31,919 | ) | — | (31,919 | ) | — | (31,919 | ) | |||||||||||||||||||||||||||
| Contribution from noncontrolling interests |
568 | — | — | — | — | — | — | — | 400 | 968 | ||||||||||||||||||||||||||||||
|
|
|
|
|
|
|
|
|
|
|
|
|
|
|
|
|
|
|
|
|
|||||||||||||||||||||
| Balance at December 31, 2014 |
$ | 568 | 116,256 | $ | 1,163 | $ | 1,007,326 | $ | (83,091 | ) | $ | (49,342 | ) | $ | (4,864 | ) | $ | 871,192 | $ | 400 | $ | 872,160 | ||||||||||||||||||
|
|
|
|
|
|
|
|
|
|
|
|
|
|
|
|
|
|
|
|
|
|||||||||||||||||||||
See accompanying notes to consolidated financial statements.
97
Table of Contents
CNL HEALTHCARE PROPERTIES, INC. AND SUBSIDIARIES
CONSOLIDATED STATEMENTS OF CASH FLOWS
(in thousands)
| Years Ended December 31, | ||||||||||||
| 2014 | 2013 | 2012 | ||||||||||
| Operating Activities: |
||||||||||||
| Net loss |
$ | (52,511 | ) | $ | (18,100 | ) | $ | (10,720 | ) | |||
| Adjustments to reconcile net loss to net cash provided by (used in) operating activities |
||||||||||||
| Depreciation and amortization |
63,112 | 16,765 | 2,101 | |||||||||
| Amortization of loan costs |
2,921 | 1,433 | 1,161 | |||||||||
| Accretion of note origination costs |
60 | 80 | — | |||||||||
| Amortization of above and below market intangibles |
345 | 68 | — | |||||||||
| Straight-line rent adjustments |
(2,472 | ) | (2,023 | ) | (843 | ) | ||||||
| Deferred tax assets, net |
— | 31 | (31 | ) | ||||||||
| Loss on extinguishment of debt |
— | 244 | 460 | |||||||||
| Contingent purchase price consideration adjustment |
(630 | ) | (1,824 | ) | — | |||||||
| Equity in earnings of unconsolidated entities, net of distributions |
2,931 | 1,620 | 465 | |||||||||
| Gain on purchase of controlling interest in unconsolidated entity |
(2,798 | ) | — | — | ||||||||
| Gain on sale of unconsolidated entity |
— | (4,486 | ) | — | ||||||||
| Changes in operating assets and liabilities: |
||||||||||||
| Other assets |
(1,791 | ) | (740 | ) | (1,113 | ) | ||||||
| Deferred rent and lease incentives |
(1,016 | ) | — | — | ||||||||
| Due from related parties |
(155 | ) | (25 | ) | — | |||||||
| Accounts payable and accrued expenses |
7,235 | 5,450 | 1,569 | |||||||||
| Other liabilities |
5,038 | 2,907 | — | |||||||||
| Due to related parties |
(997 | ) | 1,646 | 582 | ||||||||
|
|
|
|
|
|
|
|||||||
| Net cash flows provided by (used in) operating activities |
$ | 19,272 | $ | 3,046 | $ | (6,369 | ) | |||||
|
|
|
|
|
|
|
|||||||
| Investing activities: |
||||||||||||
| Acquisition of properties |
(869,458 | ) | (655,924 | ) | (241,800 | ) | ||||||
| Development of properties |
(47,150 | ) | (23,246 | ) | (8,050 | ) | ||||||
| Issuance of note receivable to related party |
(2,065 | ) | (3,686 | ) | — | |||||||
| Collection of note receivable from related party |
5,591 | — | — | |||||||||
| Distribution from unconsolidated entities |
2,206 | 222 | — | |||||||||
| Purchase of controlling interest in unconsolidated entity |
(1,584 | ) | — | — | ||||||||
| Investment in unconsolidated entities |
(220 | ) | (12,912 | ) | (65,025 | ) | ||||||
| Proceeds from sale of unconsolidated entity |
— | 61,761 | — | |||||||||
| Changes in restricted cash |
(7,914 | ) | (2,229 | ) | (610 | ) | ||||||
| Capital expenditures |
(4,021 | ) | (347 | ) | — | |||||||
| Payment of leasing costs |
(543 | ) | (12 | ) | (17 | ) | ||||||
| Deposits on real estate |
(500 | ) | (7,419 | ) | (145 | ) | ||||||
|
|
|
|
|
|
|
|||||||
| Net cash used in investing activities |
$ | (925,658 | ) | $ | (643,792 | ) | $ | (315,647 | ) | |||
|
|
|
|
|
|
|
|||||||
98
Table of Contents
CNL HEALTHCARE PROPERTIES, INC. AND SUBSIDIARIES
CONSOLIDATED STATEMENTS OF CASH FLOWS (CONTINUED)
(in thousands)
| Years Ended December 31, | ||||||||||||
| 2014 | 2013 | 2012 | ||||||||||
| Financing activities: |
||||||||||||
| Subscriptions received for common stock through public offering |
$ | 554,608 | $ | 379,772 | $ | 166,527 | ||||||
| Payment of stock issuance and offering costs |
(58,880 | ) | (41,821 | ) | (22,917 | ) | ||||||
| Distributions to stockholders, net of distribution reinvestments |
(14,203 | ) | (6,579 | ) | (1,459 | ) | ||||||
| Distribution to holder of promoted interest |
(2,000 | ) | — | — | ||||||||
| Contribution from redeemable noncontrolling interest |
568 | — | — | |||||||||
| Contribution from noncontrolling interest |
400 | — | — | |||||||||
| Redemptions of common stock |
(2,246 | ) | (706 | ) | (10 | ) | ||||||
| Draws under revolving credit facilities |
367,223 | 98,500 | — | |||||||||
| Repayments on revolving credit facilities |
(259,320 | ) | — | — | ||||||||
| Proceeds from mortgage and other notes payable |
402,438 | 362,392 | 264,780 | |||||||||
| Principal payments on mortgage and other notes payable |
(27,012 | ) | (117,436 | ) | (71,628 | ) | ||||||
| Lender deposits |
(150 | ) | (1,110 | ) | (138 | ) | ||||||
| Payment of loan costs |
(7,894 | ) | (6,319 | ) | (4,879 | ) | ||||||
|
|
|
|
|
|
|
|||||||
| Net cash flows provided by financing activities |
953,532 | 666,693 | 330,276 | |||||||||
|
|
|
|
|
|
|
|||||||
| Net increase in cash |
47,146 | 25,947 | 8,260 | |||||||||
| Cash at beginning of period |
44,209 | 18,262 | 10,002 | |||||||||
|
|
|
|
|
|
|
|||||||
| Cash at end of period |
$ | 91,355 | $ | 44,209 | $ | 18,262 | ||||||
|
|
|
|
|
|
|
|||||||
| Supplemental disclosure of cash flow information: |
||||||||||||
| Cash paid during the period for interest, net of capitalized interest of $0.9 million, $0.5 million and $0.05 million, respectively |
$ | 26,724 | $ | 8,720 | $ | 3,377 | ||||||
|
|
|
|
|
|
|
|||||||
| Cash paid for income taxes |
$ | 545 | $ | 569 | $ | 7 | ||||||
|
|
|
|
|
|
|
|||||||
| Supplemental disclosure of non-cash investing and financing activities: |
||||||||||||
| Amounts incurred but not paid (including amounts due to related parties): |
||||||||||||
| Stock issuance and offering costs |
$ | 1,656 | $ | 752 | $ | 595 | ||||||
|
|
|
|
|
|
|
|||||||
| Loan costs |
$ | 310 | $ | 241 | $ | 136 | ||||||
|
|
|
|
|
|
|
|||||||
| Capital expenditures |
$ | 72 | $ | — | $ | — | ||||||
|
|
|
|
|
|
|
|||||||
| Accrued development costs |
$ | 7,951 | $ | 7,047 | $ | 311 | ||||||
|
|
|
|
|
|
|
|||||||
| Redemptions payable |
$ | 872 | $ | 121 | $ | — | ||||||
|
|
|
|
|
|
|
|||||||
| Contingent purchase price consideration |
$ | 268 | $ | 507 | $ | — | ||||||
|
|
|
|
|
|
|
|||||||
| Loan cost amortization capitalized on development properties |
$ | 73 | $ | 97 | $ | 56 | ||||||
|
|
|
|
|
|
|
|||||||
| Unrealized loss on derivative financial instruments, net |
$ | 4,864 | $ | 959 | $ | — | ||||||
|
|
|
|
|
|
|
|||||||
| Assumption of liabilities on acquired property |
$ | 1,000 | $ | — | $ | — | ||||||
|
|
|
|
|
|
|
|||||||
| Assumption of mortgage note payable on acquired property |
$ | 27,657 | $ | — | $ | — | ||||||
|
|
|
|
|
|
|
|||||||
See accompanying notes to consolidated financial statements.
99
Table of Contents
CNL HEALTHCARE PROPERTIES, INC. AND SUBSIDIARIES
NOTES TO CONSOLIDATED FINANCIAL STATEMENTS
YEAR ENDED DECEMBER 31, 2014
| 1. | Organization |
CNL Healthcare Properties, Inc. (the “Company”) is a Maryland corporation incorporated on June 8, 2010 that elected to be taxed as a REIT for U.S. federal income tax purposes beginning with the year ended December 31, 2012. The Company is externally advised by CNL Healthcare Corp. and its property manager is CNL Healthcare Manager Corp., each of which is a Florida corporation and a wholly owned subsidiary of CNL Financial Group, LLC, the Company’s sponsor. CNL Financial Group, LLC is an affiliate of CNL Financial Group, Inc. The Advisor is responsible for managing the Company’s affairs on a day-to-day basis and for identifying and making acquisitions and investments on behalf of the Company pursuant to an advisory agreement among the Company, the operating partnership and the Advisor. Substantially all of the Company’s acquisition, operating, administrative and certain property management services are provided by affiliates of the Advisor and the Property Manager. In addition, third-party sub-property managers have been engaged to provide certain property management services.
The Company conducts substantially all of its operations either directly or indirectly through: (1) an operating partnership, CHP Partners, LP, in which the Company is the sole limited partner and its wholly-owned subsidiary, CHP GP, LLC, is the sole general partner; (2) a wholly-owned TRS, CHP TRS Holding, Inc.; (3) property owner subsidiaries and lender subsidiaries, which are single purpose entities; and (4) investments in joint ventures.
On June 27, 2011, the Company commenced its Initial Offering, including shares being offered through its Reinvestment Plan, pursuant to a registration statement on Form S-11 under the Securities Act of 1933 with the SEC. The Company’s Follow-On Offering was declared effective by the SEC on February 2, 2015. The Company expects to sell shares of its common stock in the Follow-On Offering until the earlier of the date on which the maximum offering amount has been sold, or December 31, 2015; provided, however, that the Company will periodically evaluate the status of the Follow-On Offering, and its board of directors may extend the Follow-On Offering beyond December 31, 2015.
The Company’s investment focus is on acquiring a diversified portfolio of healthcare real estate or real estate-related assets, primarily in the United States, within the senior housing, medical office, post-acute care and acute care asset classes. The types of senior housing that the Company may acquire include active adult communities (age-restricted and age-targeted housing), independent and assisted living facilities, continuing care retirement communities, and memory care facilities. The types of medical offices that the Company may acquire include medical office buildings, specialty medical and diagnostic service facilities, surgery centers, outpatient rehabilitation facilities, and other facilities designed for clinical services. The types of post-acute care facilities that the Company may acquire include skilled nursing facilities, long-term acute care hospitals and inpatient rehabilitative hospitals. The types of acute care facilities that the Company may acquire include general acute care hospitals and specialty surgical hospitals. The Company views, manages and evaluates its portfolio homogeneously as one collection of healthcare assets with a common goal of maximizing revenues and property income regardless of the asset class or asset type.
The Company is committed to investing the proceeds of its Follow-On Offering through strategic investment types aimed to maximize stockholder value by generating sustainable cash flow growth and increasing the value of its healthcare assets. The Company expects to primarily lease its senior housing properties to wholly-owned TRS entities and engage independent third-party managers under management agreements to operate the properties under RIDEA structures; however, the Company may also lease its properties to third-party tenants under triple-net or similar lease structures, where the tenant bears all or substantially all of the costs (including cost increases, for real estate taxes, utilities, insurance and ordinary repairs). In addition, the Company expects most investments will be wholly owned, although, it has and may continue to invest through partnerships with other entities where it is believed to be appropriate and beneficial.
The Company has and may continue to invest in new property developments or properties which have not reached full stabilization. Finally, the Company also may invest in and originate mortgage, bridge or mezzanine loans or in entities that make investments similar to the foregoing investment types. The Company generally makes loans to the owners of properties to enable them to acquire land, buildings, or to develop property. In exchange, the owner generally grants the Company a first lien or collateralized interest in a participating mortgage collateralized by the property or by interests in the entity that owns the property.
100
Table of Contents
CNL HEALTHCARE PROPERTIES, INC. AND SUBSIDIARIES
NOTES TO CONSOLIDATED FINANCIAL STATEMENTS
YEAR ENDED DECEMBER 31, 2014
| 2. | Summary of Significant Accounting Policies |
Basis of Presentation and Consolidation — The accompanying consolidated financial statements include the Company’s accounts, the accounts of wholly owned subsidiaries or subsidiaries for which the Company has a controlling interest, the accounts of VIEs in which the Company is the primary beneficiary, and the accounts of other subsidiaries over which the Company has a controlling financial interest. All material intercompany accounts and transactions have been eliminated in consolidation.
In accordance with the guidance for the consolidation of VIEs, the Company analyzes its variable interests, including loans, leases, guarantees, and equity investments, to determine if the entity in which it has a variable interest is a variable interest entity (“VIE”). The Company’s analysis includes both quantitative and qualitative reviews. The Company bases its quantitative analysis on the forecasted cash flows of the entity, and its qualitative analysis on its review of the design of the entity, its organizational structure including decision-making ability and financial agreements. The Company also uses its quantitative and qualitative analyses to determine if it is the primary beneficiary of the VIE, and if such determination is made, it includes the accounts of the VIE in its consolidated financial statements.
Use of Estimates — The preparation of financial statements in conformity with U.S. GAAP requires management to make estimates and assumptions that affect the reported amounts of assets and liabilities as of the date of the consolidated financial statements, the reported amounts of revenues and expenses during the reporting periods and the disclosure of contingent liabilities. For example, significant assumptions are made in the allocation of purchase price, the analysis of real estate impairments, the valuation of contingent assets and liabilities, and the valuation of restricted stock shares issued to the Advisor or Property Manager. Accordingly, actual results could differ from those estimates.
Allocation of Purchase Price for Real Estate Acquisitions — Upon acquisition of properties, the Company estimates the fair value of acquired tangible assets (consisting of land, building and improvements, tenant improvements and equipment), intangible assets (consisting of in-place leases and above- or below-market leases), liabilities assumed and any contingent assets or liabilities in order to allocate the purchase price. In estimating the fair value of the assets acquired and liabilities assumed, the Company considers information obtained about each property as a result of its due diligence and utilizes various valuation methods, such as estimated cash flow projections using appropriate discount and capitalization rates, estimates of replacement costs net of depreciation and available market information.
The fair value of the tangible assets of an acquired leased property is determined by valuing the property as if it were vacant, and the “as-if-vacant” value is then allocated to land and building based on the relative fair values of these assets.
The purchase price is allocated to in-place lease intangibles based on management’s evaluation of the specific characteristics of the acquired lease(s). Factors considered include estimates of carrying costs during hypothetical expected lease up periods, including estimates of lost rental income during the expected lease up periods, and costs to execute similar leases such as leasing commissions, legal and other related expenses. Above- and below-market lease intangibles are recorded based on the present value of the difference between the contractual rents to be paid pursuant to the lease and management’s estimate of the fair market lease rates for each in-place lease and may include assumptions for lease renewals of below-market leases.
The Company may also enter into contingent purchase price consideration arrangements in connection with acquisitions, which could result in either an asset or liability being recognized as part of the purchase price allocation. In calculating the estimated fair value of contingent purchase price consideration arrangements, the Company considers information obtained during the due diligence and budget process as well as discount rates to determine the fair value. The Company evaluates the fair value of the arrangements at each reporting period and records any adjustments to the fair value as a component of operating income (expense) in the consolidated statement of operations. Refer to Note 9. “Contingent Purchase Price Consideration” for additional information on fair value measurements of contingent purchase price consideration arrangements.
101
Table of Contents
CNL HEALTHCARE PROPERTIES, INC. AND SUBSIDIARIES
NOTES TO CONSOLIDATED FINANCIAL STATEMENTS
YEAR ENDED DECEMBER 31, 2014
| 2. | Summary of Significant Accounting Policies (continued) |
Depreciation and Amortization — Real estate costs related to the acquisition and improvement of properties are capitalized. Repair and maintenance costs are charged to expense as incurred and significant replacements and improvements are capitalized. Repair and maintenance costs include all costs that do not extend the useful life of the real estate asset. The Company considers the period of future benefit of an asset to determine its appropriate useful life. Real estate assets are stated at cost less accumulated depreciation, which is computed using the straight-line method of accounting over the estimated useful lives of the related assets. Buildings and improvements are depreciated on the straight-line method over their estimated useful lives, which generally are the lesser of 39 and 15 years, respectively, or the remaining life of the ground lease.
Amortization of intangible assets is computed using the straight-line method of accounting over the shorter of the respective lease term or estimated useful life. If a lease were to be terminated prior to its scheduled expiration, all unamortized costs related to the lease would be written off.
Impairment of Real Estate Assets — Real estate assets are reviewed on an ongoing basis to determine whether there are any indicators, including property operating performance and general market conditions, that the value of the real estate properties (including any related amortizable intangible assets or liabilities) may be impaired. To assess if a property value is potentially impaired, management compares the estimated current and projected undiscounted cash flows, including estimated net sales proceeds, of the property over its remaining useful life to the net carrying value of the property. Such cash flow projections consider factors such as expected future operating income, trends and prospects, as well as the effects of demand, competition and other factors. In the event that the carrying value exceeds the undiscounted operating cash flows, the Company would recognize an impairment provision to adjust the carrying value of the asset group to the estimated fair value of the property.
When impairment indicators are present for real estate indirectly owned, through an investment in a joint venture or other similar investment structure accounted for under the equity method, the Company compares the estimated fair value of its investment to the carrying value. An impairment charge will be recorded to the extent fair value of the investment is less than the carrying amount and the decline in value is determined to be other than a temporary decline.
Real Estate Under Development — The Company records real estate under development at cost, including acquisition fees and closing costs incurred. The cost of the real estate under development includes direct and indirect costs of development, including interest and miscellaneous costs incurred during the development period until the project is substantially complete and available for occupancy. In addition, during active development, all operating expenses related to the project, including property expenses such as real estate taxes and insurance, are capitalized rather than expensed and incidental revenue is recorded as a reduction of capitalized development costs. Preleasing costs are expensed as incurred.
Capitalized Interest — Interest and loan cost amortization attributable to funds used to finance real estate under development is capitalized as additional costs of development. The Company capitalizes interest at the weighted average interest rate of the Company’s outstanding indebtedness and based on its weighted average expenditures for the period. Capitalization of interest on a specific project ceases when the project is substantially complete and ready for occupancy. During the years ended December 31, 2014 and 2013, the Company incurred interest expense and loan cost amortization of approximately $31.5 million and $11.5 million, respectively, of which approximately $1.0 million and $0.7 million, respectively, was capitalized according to this policy.
Cash — Cash consists of demand deposits at commercial banks. The Company also invests in cash equivalents consisting of highly liquid investments in money market funds with original maturities of three months or less during the year.
As of December 31, 2014, certain of the Company’s cash deposits exceeded federally insured amounts. However, the Company continues to monitor the third-party depository institutions that hold the Company’s cash, primarily with the goal of safeguarding principal. The Company attempts to limit cash investments to financial institutions with high credit standing; therefore, the Company believes it is not exposed to any significant credit risk on cash.
102
Table of Contents
CNL HEALTHCARE PROPERTIES, INC. AND SUBSIDIARIES
NOTES TO CONSOLIDATED FINANCIAL STATEMENTS
YEAR ENDED DECEMBER 31, 2014
| 2. | Summary of Significant Accounting Policies (continued) |
Loan Costs — Financing costs paid in connection with obtaining debt are deferred and amortized over the estimated life of the debt using the effective interest method. As of December 31, 2014 and 2013, the accumulated amortization of loan costs was approximately $4.3 million and $2.5 million, respectively.
Leasing Costs — The Company defers costs that it incurs to obtain new tenant leases or extend existing tenant leases and classifies these costs as other assets, net of accumulated amortization. The Company amortizes these costs using the straight-line method of accounting over the shorter of the respective lease term or estimated useful life. If a lease is terminated early, the Company will expense any applicable unamortized deferred leasing costs.
Restricted Cash — Certain amounts of cash are restricted to fund capital expenditures for the Company’s real estate investment properties or represent certain tenant security deposits.
Investments in Unconsolidated Entities — The Company accounts for its investments in unconsolidated joint ventures under the equity method of accounting as the Company exercises significant influence, but does not maintain a controlling financial interest over these entities. These investments are recorded initially at cost and subsequently adjusted for cash contributions, distributions and equity in earnings (loss) of the unconsolidated entities. Based on the respective venture structures and preferences the Company receives on distributions and liquidation, the Company records its equity in earnings of the unconsolidated entities under the HLBV method of accounting. Under this method, the Company recognizes income or loss in each period as if the net book value of the assets in the ventures were hypothetically liquidated at the end of each reporting period pursuant to the provisions of the joint venture agreements. In any given period, the Company could be recording more or less income than actual cash distributions received and more or less than what the Company may receive in the event of an actual liquidation. The Company’s investment in unconsolidated entities is accounted for as an asset acquisition in which acquisition fees and expenses are capitalized as part of the basis in the investment in unconsolidated entities. The acquisition fees and expenses create an outside basis difference that are allocated to the assets of the investee and, if assigned to depreciable or amortizable assets, the basis differences are then amortized as a component of equity in earnings (loss) of unconsolidated entities.
Notes Receivable — The Company evaluates impairment on its notes receivable on an individual loan basis which includes, current information and events, periodic visits and quarterly discussions on the financial results of the properties being collateralized and the financial stability of the borrowers. The Company reviews each loan to determine the risk of loss, whether the individual loan is impaired and whether an allowance is necessary. The value credit quality of the Company’s borrowers is primarily based on their payment history on an individual loan basis, as such, the Company does not assign its notes receivable to credit quality categories.
Derivative Financial Instruments — The Company and certain unconsolidated equity method investments held by the Company use derivative financial instruments to partially offset the effect of fluctuating interest rates on the cash flows associated with its variable-rate debt. Upon entry into a derivative, the Company or its unconsolidated equity method investment formally designates and documents the financial instrument as a hedge of a specific underlying exposure, as well as the risk management objectives and strategies for undertaking the hedge transaction. The Company or its unconsolidated equity method investment accounts for derivatives through the use of a fair value concept whereby the derivative positions are stated at fair value in the accompanying consolidated balance sheets. The fair value of derivatives used to hedge or modify risk fluctuates over time. As such, the fair value amounts should not be viewed in isolation, but rather in relation to the cash flows or fair value of the underlying hedged transaction and to the overall reduction in the exposure relating to adverse fluctuations in interest rates on the Company’s or its unconsolidated equity method investment’s variable-rate debt. Realized and unrealized gain (loss) on derivative financial instruments designated by either the Company or its unconsolidated equity method investment as cash flow hedges are reported as a component of other comprehensive income (loss), a component of stockholders’ equity, in the accompanying consolidated statements of comprehensive income (loss) to the extent they are effective; reclassified into earnings on the same line item associated with the hedged transaction and in the same period the hedged transaction affects earnings. Any ineffective portions of cash flow hedges are reported in the accompanying consolidated statements of operations as derivative gain (loss).
103
Table of Contents
CNL HEALTHCARE PROPERTIES, INC. AND SUBSIDIARIES
NOTES TO CONSOLIDATED FINANCIAL STATEMENTS
YEAR ENDED DECEMBER 31, 2014
| 2. | Summary of Significant Accounting Policies (continued) |
Realized and unrealized gain (loss) on derivative financial instruments designated as cash flow hedges that are entered into by the Company’s equity method investments are reported as a component of the Company’s other comprehensive income (loss) in proportion to the Company’s ownership percentage in the investment, with reclassifications and ineffective portions being included in equity in earnings (loss) of unconsolidated entities in the accompanying consolidated statements of operations.
Fair Value Measurements — Fair value assumptions are based on the framework established in the fair value accounting guidance under GAAP. The framework specifies a hierarchy of valuation inputs which was established to increase consistency, clarity and comparability in fair value measurements and related disclosures. The guidance describes the following fair value hierarchy based upon three levels of inputs that may be used to measure fair value, two of which are considered observable and one that is considered unobservable:
| • | Level 1 — Quoted prices (unadjusted) in active markets for identical assets or liabilities that the Company has the ability to access. |
| • | Level 2 — Inputs, other than quoted prices included in Level 1, that are observable for the asset or liability either directly or indirectly; such as, quoted prices for similar assets or liabilities or other inputs that can be corroborated by observable market data. |
| • | Level 3 — Unobservable inputs for the asset or liability, which are typically based on the Company’s own assumptions, as there is little, if any, related market activity. |
When market data inputs are unobservable, the Company utilizes inputs that it believes reflects the Company’s best estimate of the assumptions market participants would use in pricing the asset or liability. When inputs used to measure fair value fall within different levels of the hierarchy, the level within which the fair value measurement is categorized is based on the lowest level input that is significant to the fair value measurement.
Mortgages and Other Notes Payable — Mortgages and other notes payable are recorded at the stated principal amount and are generally collateralized by the Company’s properties. Mortgages and other notes payable assumed in connection with an acquisition are recorded at fair market value as of the date of the acquisition.
Shares Based Payments to Non-Employees — In connection with the Expense Support Agreements described in Note 11. “Related Party Arrangements,” the Company may issue Restricted Stock to the Advisor or the Property Manager on a quarterly basis in exchange for providing expense support in the event that cash distributions declared exceed modified funds from operations as defined by the Expense Support Agreements.
The Restricted Stock is forfeited if shareholders do not ultimately receive their original invested capital back with at least a 6% annualized return of investment upon a future liquidity or disposition event of the Company. Upon issuance of Restricted Stock, the Company measures the fair value at its then-current lowest aggregate fair value pursuant to Accounting Standards Concept (“ASC”) 505-50. On the date in which the Advisor or the Property Manager satisfies the vesting criteria, the Company remeasures the fair value of the Restricted Stock pursuant to ASC 505-50 and records expense equal to the difference between the original fair value and that of the remeasurement date. In addition, given that performance is outside the control of the Advisor or the Property Manager and involves both market conditions and counterparty performance conditions, the shares are treated as unissued for accounting purposes and the Company only includes the Restricted Stock in the calculation of diluted earnings per share to the extent their effect is dilutive and the vesting conditions have been satisfied as of the reporting date.
Pursuant to the Expense Support Agreements, the Advisor or the Property Manager shall be the record owner of the Restricted Stock until the shares of common stock are sold or otherwise disposed of, and shall be entitled to all of the rights of a stockholder of the Company including, without limitation, the right to vote such shares (to the extent permitted by the Articles) and receive all dividends and other distributions paid with respect to such shares. All dividends or other distributions actually paid to the Advisor or the Property Manager in connection with the Restricted Stock shall vest immediately and will not be subject to forfeiture. The Company recognizes expense related to the dividends on the Restricted Stock shares as declared.
104
Table of Contents
CNL HEALTHCARE PROPERTIES, INC. AND SUBSIDIARIES
NOTES TO CONSOLIDATED FINANCIAL STATEMENTS
YEAR ENDED DECEMBER 31, 2014
| 2. | Summary of Significant Accounting Policies (continued) |
Redeemable Noncontrolling Interest — The Company classifies redeemable equity securities in accordance with Accounting Standard Update (“ASU”) No. 2009-04, “Liabilities (Topic 480): Accounting for Redeemable Equity Instruments,” which requires that equity securities redeemable at the option of the holder be classified outside of permanent stockholders’ equity. The Company classifies redeemable equity securities as redeemable noncontrolling interest within the accompanying consolidated balance sheets and consolidated statements of stockholders’ equity and redeemable noncontrolling interest. The Company evaluates the probability that these equity securities will become redeemable at each reporting period and, if determined probable, the Company measures the redemption value and records an adjustment to the carrying value of the equity securities as a component of redeemable noncontrolling interest. As of December 31, 2014, the amount payable, if any, relating to these equity securities is not probable and is dependent on the future results of operations from real estate currently under development.
Redemptions — Under the Company’s stock redemption plan, a stockholder’s shares are deemed to have been redeemed as of the date that the Company accepts the stockholder’s request for redemption. From and after such date, the stockholder by virtue of such redemption is no longer entitled to any rights as a stockholder in the Company. Shares redeemed are retired and not available for reissue.
Promoted Interest Distributions — The Company accounts for distributions to holders of promoted interests in a manner similar to noncontrolling interests. The Company identifies the distributions to holders of promoted interests separately within the accompanying consolidated statements of equity. During the years ended December 31, 2014 and 2013, the Company made distributions of approximately $2.0 million to a holder of promoted interest related to HarborChase of Villages Crossing, which has been recorded as a reduction to capital in excess of par value in the accompanying consolidated statement of stockholders’ equity and redeemable noncontrolling interest.
Revenue Recognition — Rental income from operating leases is recorded on the straight-line basis over the terms of the leases. The Company’s leases require the tenants to pay certain additional contractual amounts that are set aside by the Company for replacements of fixed assets and other improvements to the properties. These amounts are and will remain the property of the Company during and after the term of the lease. The amounts are recorded as capital improvement reserve income at the time that they are earned and are included in rental income from operating leases in the accompanying consolidated statement of operations. Additional percentage rent that is due contingent upon tenant performance thresholds, such as gross revenues, is deferred until the underlying performance thresholds have been achieved.
Resident fees and services consist of monthly services, which include rent, assistance and other related services. Agreements with residents are generally for an initial term of three months and are cancelable by the residents with 30 days notice.
Tenant reimbursement income represents amounts tenants are required to reimburse the Company for expenses incurred on behalf of the tenants, in accordance with the terms of the leases and are recognized in the period in which the related reimbursable expenses are incurred.
Interest income is recognized on an accrual basis when earned. Any deferred portion of contractual interest is recognized on a straight-line basis over the term of the corresponding note receivable. Loan origination fees incurred are recognized as a reduction to interest income over the term of the note receivable.
Segment Information — Operating segments are components of an enterprise for which separate financial information is available and is evaluated regularly by the chief operating decision maker in deciding how to allocate resources and assess performance. The Company has determined that it operates in one operating segment, real estate ownership. The Company’s chief operating decision maker evaluates the Company’s operations from a number of different operational perspectives including, but not limited to, a property-by-property basis and by tenant or operator. The Company derives all significant revenues from a single reportable operating segment of business, healthcare real estate, regardless of the type (senior housing, medical office, etc.) or ownership structure (leased or managed). Accordingly, the Company does not report segment information; nevertheless, management periodically evaluates whether the Company continues to have one single reportable segment of business.
105
Table of Contents
CNL HEALTHCARE PROPERTIES, INC. AND SUBSIDIARIES
NOTES TO CONSOLIDATED FINANCIAL STATEMENTS
YEAR ENDED DECEMBER 31, 2014
| 2. | Summary of Significant Accounting Policies (continued) |
Acquisition Fees and Expenses — Acquisition fees, including investment services fees and expenses associated with transactions deemed to be business combinations (including investment transactions that are no longer under consideration), are expensed as incurred. Acquisition fees and expenses associated with making loans and with transactions deemed to be an asset purchase are capitalized. The following table summarizes the Company’s acquisition fees and expenses for the years ended December 31, 2014, 2013 and 2012 (in millions):
| December 31, | ||||||||||||
| Distribution Type |
2014 | 2013 | 2012 | |||||||||
| Capitalized as real estate under development |
$ | 3.4 | $ | 0.1 | $ | 0.7 | ||||||
| Capitalized as investment in unconsolidated entities |
— | 0.5 | 3.3 | |||||||||
| Capitalized as origination costs to the note receivable |
— | 0.1 | — | |||||||||
| Acquisition costs expensed |
23.9 | 18.8 | 6.6 | |||||||||
|
|
|
|
|
|
|
|||||||
| Total acquisition costs incurred |
$ | 27.3 | $ | 19.5 | $ | 10.6 | ||||||
|
|
|
|
|
|
|
|||||||
Net Loss per Share — Net loss per share is calculated based upon the weighted average number of shares of common stock outstanding during the period in which the Company was operational. For the purposes of determining the weighted average number of shares of common stock outstanding, stock distributions are treated as if they were issued and outstanding for the full periods presented. Therefore, the weighted average number of shares outstanding for the years ended December 31, 2014, 2013 and 2012 have been revised to include stock distributions declared and issued through the date of this filing as if they were outstanding as of the beginning of each period presented.
Income Taxes — The Company has elected to be taxed as a REIT under Sections 856 through 860 of the Internal Revenue Code of 1986, as amended and related regulations beginning with the year ended December 31, 2012. In order to be taxed as a REIT, the Company is subject to certain organizational and operational requirements, including the requirement to make distributions to its stockholders each year of at least 90% of its REIT taxable income (which is computed without regard to the dividends-paid deduction or net capital gain and which does not necessarily equal net income as calculated in accordance with GAAP). If the Company qualifies for taxation as a REIT, the Company generally will not be subject to U.S. federal income tax on income that the Company distributes as dividends. If the Company fails to quality as a REIT in any taxable year, the Company will be subject to U.S. federal income tax on its taxable income at regular corporate income tax rates and generally will not be permitted to qualify for treatment as a REIT for federal income tax purposes for the four taxable years following the year during which qualification is lost, unless the Internal Revenue Service grants the Company relief under certain statutory provisions. Even if the Company qualifies for taxation as a REIT, it may be subject to certain state and local taxes on its income and property, and U.S. federal income and excise taxes on its undistributed income. The Company may also be subject to foreign taxes on investments outside of the United States based on the jurisdictions in which the Company conducts business.
The Company has and will continue to form subsidiaries which may elect to be taxed as a TRS for U.S. federal income tax purposes. Under the provisions of the Internal Revenue Code and applicable state laws, a TRS will be subject to tax on its taxable income from its operations. The Company will account for federal and state income taxes with respect to a TRS using the asset and liability method. Deferred tax assets and liabilities are recognized for the future tax consequences attributable to differences between the consolidated financial statement carrying amounts of existing assets and liabilities, the respective tax bases, operating losses and/or tax-credit carryforwards.
Prior to the Company’s REIT election, it was subject to corporate federal and state income taxes. Prior to and including the year ended December 31, 2011, the Company did not have earnings. The tax years from 2010 to 2014 remain subject to examination by taxing authorities throughout the United States. The Company analyzed its material tax positions and determined that it has not taken any uncertain tax positions.
106
Table of Contents
CNL HEALTHCARE PROPERTIES, INC. AND SUBSIDIARIES
NOTES TO CONSOLIDATED FINANCIAL STATEMENTS
YEAR ENDED DECEMBER 31, 2014
| 2. | Summary of Significant Accounting Policies (continued) |
Adopted Accounting Pronouncements — In February 2013, the Financial Accounting Standards Board (“FASB”) issued “ASU” No. 2013-04, “Liabilities (Topic 405): Obligations Resulting from Joint and Several Liability Arrangements for Which the Total Amount of the Obligation is Fixed at the Reporting Date.” This update clarified the guidance in subtopic 405 and requires entities to measure obligations resulting from joint and several liability arrangements for which total obligation is fixed at the reporting date. Entities are required to measure the obligation as the amount that the reporting entity agreed to pay on the basis of its arrangement among its co-obligors plus any additional amount the reporting entity expects to pay on behalf of its co-obligors. Additionally, the guidance requires entities to disclose the nature and amount of the obligations as well as other information about those obligations. Effective January 1, 2014, the Company adopted this ASU. The adoption of this update did not have a material impact on the Company’s financial position, results of operations or cash flows.
In July 2013, the FASB issued ASU No. 2013-11, “Income Taxes (Topic 740): Presentation of an Unrecognized Tax Benefit When a Net Operating Loss Carryforward, a similar Tax Loss, or a Tax Credit Carryforward Exists.” This update clarified the guidance in subtopic 740 and requires entities to present an unrecognized tax benefit, or a portion of an unrecognized tax benefit in the financial statements as a reduction to a deferred tax asset for a net operating loss carryforward, a similar tax loss, or a tax credit carryforward to the extent one is available. Effective January 1, 2014, the Company adopted this ASU. The adoption of this update did not have a material impact on the Company’s financial position, results of operations or cash flows.
Recent Accounting Pronouncements — In April 2014, the FASB issued ASU No. 2014-08, “Presentation of Financial Statements (Topic 205) and Property, Plant, and Equipment (Topic 360): Reporting Discontinued Operations and Disclosures of Disposals of Components of an Entity.” This update changes the criteria for reporting discontinued operations where only disposals representing a strategic shift that has (or will have) a major effect on an entity’s operations and financial results, such as a major line of business or geographical area, should be presented as a discontinued operation. This ASU is effective prospectively for all disposals (or classifications as held for sale) of components of an entity that occur within annual periods beginning on or after December 15, 2014 with early adoption permitted. The Company has determined that the amendments will impact the Company’s determinations of which future property disposals, if any, qualify as discontinued operations and will require additional disclosure about discontinued operations for future property disposals, if any.
In May 2014, the FASB issued ASU No. 2014-09, “Revenue from Contracts with Customers,” as a new ASC topic (Topic 606). The core principle of this amendment is that an entity should recognize revenue to depict the transfer of promised goods or services to customers in an amount that reflects the consideration to which the entity expects to be entitled in exchange for those goods or services. The standard further provides guidance for any entity that either enters into contracts with customers to transfer goods or services or enters into contracts for the transfer of nonfinancial assets, unless those contracts are within the scope of other standards (for example, lease contracts). This ASU 2014-09 is effective for annual reporting periods beginning after December 15, 2016, including interim periods within that reporting period, with earlier adoption not permitted. ASU 2014-09 can be adopted using one of two retrospective application methods: 1) retrospectively to each prior reporting period presented or 2) as a cumulative-effect adjustment as of the date of adoption. The Company is currently evaluating the amendments of ASU 2014-09; however, these amendments could potentially have a significant effect on the Company’s consolidated financial position, results of operations or cash flows.
In February 2015, the FASB issued ASU 2015-02, “Amendments to the Consolidation Analysis,” which requires amendments to both the variable interest entity and voting models. The amendments (i) modify the identification of variable interests (fees paid to a decision maker or service provider), the VIE characteristics for a limited partnership or similar entity and primary beneficiary determination under the VIE model, and (ii) eliminate the presumption within the current voting model that a general partner controls a limited partnership or similar entity. The new guidance is effective for annual reporting periods, and interim periods within those annual periods, beginning after December 15, 2015 with early adoption permitted. The amendments may be applied using either a modified retrospective or full retrospective approach. The Company is currently evaluating the effect the guidance will have on its consolidated financial statements.
107
Table of Contents
CNL HEALTHCARE PROPERTIES, INC. AND SUBSIDIARIES
NOTES TO CONSOLIDATED FINANCIAL STATEMENTS
YEAR ENDED DECEMBER 31, 2014
| 3. | Acquisitions |
Real Estate Investment Properties — During the year ended December 31, 2014, the Company acquired the following 35 properties, which were comprised of 14 senior housing communities, 15 medical office buildings (“MOB”), three post-acute care hospitals, and three acute care hospitals:
| Name and Location |
Structure | Date Acquired |
Purchase Price (in thousands) |
|||||||
| Acute Care |
||||||||||
| Houston Orthopedic & Spine Hospital (“HOSH”) |
Triple-net Lease | 6/2/2014 | $ | 49,000 | ||||||
| Bellaire, TX (“Houston”) |
||||||||||
| Medical Portfolio II Properties |
||||||||||
| Hurst Specialty Hospital |
Modified Lease | 8/15/2014 | 29,465 | |||||||
| Hurst, TX (“Dallas/Fort Worth”) |
||||||||||
| Beaumont Specialty Hospital |
Modified Lease | 8/15/2014 | 33,600 | |||||||
| Beaumont, TX (“Houston”) |
||||||||||
| Medical Office |
||||||||||
| Chula Vista Medical Arts Center—Plaza I |
Modified Lease | 1/21/2014 | 17,863 | (1) | ||||||
| Chula Vista, CA (“San Diego”) |
||||||||||
| HOSH Medical Office Building |
Modified Lease | 6/2/2014 | 27,000 | |||||||
| Bellaire, TX (“Houston”) |
||||||||||
| Lee Hughes Medical Building |
Modified Lease | 9/29/2014 | 29,870 | (1) | ||||||
| Glendale, CA (“Los Angeles”) |
||||||||||
| Northwest Medical Park |
Modified Lease | 10/31/2014 | 10,804 | (1) | ||||||
| Margate, FL (“Fort Lauderdale”) |
||||||||||
| Newburyport Medical Center |
Modified Lease | 10/31/2014 | 18,000 | (1) | ||||||
| Newburyport, MA (“Boston”) |
||||||||||
| ProMed Medical Building I |
Modified Lease | 12/19/2014 | 11,000 | (1) | ||||||
| Yuma, AZ |
||||||||||
| Southeast Medical Office Properties |
||||||||||
| Midtown Medical Plaza |
Modified Lease | 12/22/2014 | 54,695 | |||||||
| Charlotte, NC |
||||||||||
| Presbyterian Medical Tower |
Modified Lease | 12/22/2014 | 36,333 | |||||||
| Charlotte, NC |
||||||||||
| Metroview Professional Building |
Modified Lease | 12/22/2014 | 17,262 | |||||||
| Charlotte, NC |
||||||||||
| Physicians Plaza Huntersville |
Modified Lease | 12/22/2014 | 29,964 | |||||||
| Huntersville, NC (“Charlotte”) |
||||||||||
| Matthews Medical Office Building |
Modified Lease | 12/22/2014 | 21,227 | |||||||
| Matthews, NC (“Charlotte”) |
||||||||||
| Outpatient Care Center |
Modified Lease | 12/22/2014 | 15,450 | |||||||
| Clyde, NC (“Asheville”) |
||||||||||
| 330 Physicians Center |
Modified Lease | 12/22/2014 | 30,099 | |||||||
| Rome, GA |
||||||||||
| Spivey Station Physicians Center |
Modified Lease | 12/22/2014 | 14,379 | |||||||
| Atlanta, GA |
||||||||||
| Spivey Station ASC Building |
Modified Lease | 12/22/2014 | 18,591 | |||||||
| Atlanta, GA |
||||||||||
108
Table of Contents
CNL HEALTHCARE PROPERTIES, INC. AND SUBSIDIARIES
NOTES TO CONSOLIDATED FINANCIAL STATEMENTS
YEAR ENDED DECEMBER 31, 2014
| 3. | Acquisitions (continued) |
| Name and Location |
Structure | Date Acquired |
Purchase Price (in thousands) |
|||||||
| Post-Acute Care |
||||||||||
| Medical Portfolio II Properties |
||||||||||
| Oklahoma City Inpatient Rehabilitation Hospital |
Modified Lease | 7/15/2014 | $ | 25,504 | ||||||
| Oklahoma City, OK |
||||||||||
| Las Vegas Inpatient Rehabilitation Hospital |
Modified Lease | 7/15/2014 | 22,292 | |||||||
| Las Vegas, NV |
||||||||||
| South Bend Inpatient Rehabilitation Hospital |
Modified Lease | 7/15/2014 | 20,240 | |||||||
| Mishawaka, IN (“South Bend”) |
||||||||||
| Senior Housing |
||||||||||
| Pacific Northwest II Communities |
||||||||||
| Prestige Senior Living Auburn Meadows |
Managed | 2/3/2014 | 21,930 | |||||||
| Auburn, WA (“Seattle”) |
||||||||||
| Prestige Senior Living Bridgewood |
Managed | 2/3/2014 | 22,096 | |||||||
| Vancouver, WA (“Portland”) |
||||||||||
| Prestige Senior Living Monticello Park |
Managed | 2/3/2014 | 27,360 | |||||||
| Longview, WA |
||||||||||
| Prestige Senior Living Rosemont |
Managed | 2/3/2014 | 16,877 | |||||||
| Yelm, WA |
||||||||||
| Prestige Senior Living West Hills |
Managed | 3/3/2014 | 14,986 | |||||||
| Corvallis, OR |
||||||||||
| South Bay II Communities |
||||||||||
| Isle at Cedar Ridge |
Managed | 2/28/2014 | 21,630 | |||||||
| Cedar Park, TX (“Austin”) |
||||||||||
| HarborChase of Plainfield |
Managed | 3/28/2014 | 26,500 | |||||||
| Plainfield, IL |
||||||||||
| Legacy Ranch Alzheimer’s Special Care Center |
Managed | 3/28/2014 | 11,960 | |||||||
| Midland, TX |
||||||||||
| The Springs Alzheimer’s Special Care Center |
Managed | 3/28/2014 | 10,920 | |||||||
| San Angelo, TX |
||||||||||
| Isle at Watercrest – Bryan |
Managed | 4/21/2014 | 22,050 | |||||||
| Bryan, TX |
||||||||||
| Watercrest at Bryan |
Managed | 4/21/2014 | 28,035 | |||||||
| Bryan, TX |
||||||||||
| Isle at Watercrest – Mansfield |
Managed | 5/5/2014 | 31,300 | |||||||
| Mansfield, TX (“Dallas/Fort Worth”) |
||||||||||
| Watercrest at Mansfield |
Managed | 6/30/2014 | 49,000 | |||||||
| Mansfield, TX (“Dallas/Fort Worth”) |
||||||||||
| Fairfield Village of Layton |
Managed | 11/20/2014 | 68,000 | |||||||
| Layton, UT (“Salt Lake City”) |
||||||||||
|
|
|
|||||||||
| $ | 905,282 | |||||||||
|
|
|
|||||||||
FOOTNOTE:
| (1) | This represents a single property acquisition that is not considered material to the Company and as such no pro forma financial information has been included related to this property. |
109
Table of Contents
CNL HEALTHCARE PROPERTIES, INC. AND SUBSIDIARIES
NOTES TO CONSOLIDATED FINANCIAL STATEMENTS
YEAR ENDED DECEMBER 31, 2014
| 3. | Acquisitions (continued) |
During the year ended December 31, 2013, the Company acquired the following 38 properties, which were comprised of 16 medical office buildings, 15 senior housing communities, six post-acute care facilities, and one acute care hospital:
| Name and Location |
Structure | Date Acquired |
Purchase Price (in thousands) |
|||||||||
| Acute Care |
||||||||||||
| Medical Portfolio I Properties |
||||||||||||
| Doctors Specialty Hospital |
Modified Lease | 8/16/2013 | $ | 10,003 | ||||||||
| Leawood, KS (“Kansas City”) |
||||||||||||
| Medical Office |
||||||||||||
| LaPorte Cancer Center |
Modified Lease | 6/14/2013 | 13,100 | |||||||||
| Westville, IN |
||||||||||||
| Knoxville Medical Office Properties |
||||||||||||
| Physicians Plaza A at North Knoxville Medical Center |
Modified Lease | 7/10/2013 | 18,124 | |||||||||
| Powell, TN (“Knoxville”) |
||||||||||||
| Physicians Plaza B at North Knoxville Medical Center |
Modified Lease | 7/10/2013 | 21,800 | |||||||||
| Powell, TN (“Knoxville”) |
||||||||||||
| Jefferson Medical Commons |
Modified Lease | 7/10/2013 | 11,616 | |||||||||
| Jefferson City, TN (“Knoxville”) |
||||||||||||
| Physicians Regional Medical Center—Central Wing Annex |
Modified Lease | 7/10/2013 | 5,775 | |||||||||
| Knoxville, TN |
||||||||||||
| Medical Portfolio I Properties |
||||||||||||
| John C. Lincoln Medical Office Plaza I |
Modified Lease | 8/16/2013 | 4,420 | |||||||||
| Phoenix, AZ |
||||||||||||
| John C. Lincoln Medical Office Plaza II |
Modified Lease | 8/16/2013 | 3,106 | |||||||||
| Phoenix, AZ |
||||||||||||
| North Mountain Medical Plaza |
Modified Lease | 8/16/2013 | 6,185 | |||||||||
| Phoenix, AZ |
||||||||||||
| Escondido Medical Arts Center |
Modified Lease | 8/16/2013 | 15,602 | |||||||||
| Escondido, CA (“San Diego”) |
||||||||||||
| Chestnut Commons Medical Office Building |
Modified Lease | 8/16/2013 | 20,712 | |||||||||
| Elyria, OH (“Cleveland”) |
||||||||||||
| Calvert Medical Office Properties |
||||||||||||
| Calvert Medical Office Buildings I, II, III |
Modified Lease | 8/30/2013 | 16,409 | |||||||||
| Prince Frederick, MD (“Washington D.C.”) |
||||||||||||
| Calvert Medical Arts Center |
Modified Lease | 8/30/2013 | 19,320 | |||||||||
| Prince Frederick, MD (“Washington D.C.”) |
||||||||||||
| Dunkirk Medical Center |
Modified Lease | 8/30/2013 | 4,617 | |||||||||
| Dunkirk, MD (“Washington D.C.”) |
||||||||||||
| Coral Springs Medical Office Buildings (“Coral Springs MOBs”) |
||||||||||||
| Coral Springs Medical Office Building I |
Modified Lease | 12/23/2013 | 14,900 | |||||||||
| Coral Springs, FL |
||||||||||||
| Coral Springs Medical Office Building II |
Modified Lease | 12/23/2013 | 16,100 | |||||||||
| Coral Springs, FL |
||||||||||||
| Bay Medical Plaza |
Modified Lease | 12/23/2013 | 10,700 | |||||||||
| Chula Vista, CA (“San Diego”) |
||||||||||||
110
Table of Contents
CNL HEALTHCARE PROPERTIES, INC. AND SUBSIDIARIES
NOTES TO CONSOLIDATED FINANCIAL STATEMENTS
YEAR ENDED DECEMBER 31, 2014
| 3. | Acquisitions (continued) |
| Name and Location |
Structure | Date Acquired |
Purchase Price (in thousands) |
|||||||
| Post-Acute Care |
||||||||||
| Perennial Communities |
||||||||||
| Batesville Healthcare Center |
Triple-net Lease | 5/31/2013 | $ | 6,206 | ||||||
| Batesville, AR |
||||||||||
| Broadway Healthcare Center |
Triple-net Lease | 5/31/2013 | 11,799 | |||||||
| West Memphis, AR |
||||||||||
| Jonesboro Healthcare Center |
Triple-net Lease | 5/31/2013 | 15,232 | |||||||
| Jonesboro, AR |
||||||||||
| Magnolia Healthcare Center |
Triple-net Lease | 5/31/2013 | 11,847 | |||||||
| Magnolia, AR |
||||||||||
| Mine Creek Healthcare Center |
Triple-net Lease | 5/31/2013 | 3,374 | |||||||
| Nashville, AR |
||||||||||
| Searcy Healthcare Center |
Triple-net Lease | 5/31/2013 | 7,898 | |||||||
| Searcy, AR |
||||||||||
| Senior Housing |
||||||||||
| HarborChase of Jasper |
Managed | 8/1/2013 | 7,300 | |||||||
| Jasper, AL |
||||||||||
| South Bay I Communities |
||||||||||
| Raider Ranch |
Managed | 8/29/2013 | 55,000 | |||||||
| Lubbock, TX |
||||||||||
| Town Village |
Managed | 8/29/2013 | 22,500 | |||||||
| Oklahoma City, OK |
||||||||||
| Pacific Northwest I Communities |
||||||||||
| MorningStar of Billings |
Managed | 12/2/2013 | 48,300 | |||||||
| Billings, MT |
||||||||||
| MorningStar of Boise |
Managed | 12/2/2013 | 39,964 | |||||||
| Boise, ID |
||||||||||
| MorningStar of Idaho Falls |
Managed | 12/2/2013 | 44,390 | |||||||
| Idaho Falls, ID |
||||||||||
| MorningStar of Sparks |
Managed | 12/2/2013 | 55,200 | |||||||
| Sparks, NV (“Reno”) |
||||||||||
| Prestige Senior Living Arbor Place |
Managed | 12/2/2013 | 15,840 | |||||||
| Medford, OR |
||||||||||
| Prestige Senior Living Beaverton Hills |
Managed | 12/2/2013 | 12,900 | |||||||
| Beaverton, OR |
||||||||||
| Prestige Senior Living Five Rivers |
Managed | 12/2/2013 | 16,720 | |||||||
| Tillamook, OR |
||||||||||
| Prestige Senior Living High Desert |
Managed | 12/2/2013 | 13,600 | |||||||
| Bend, OR |
||||||||||
| Prestige Senior Living Huntington Terrace |
Managed | 12/2/2013 | 15,020 | |||||||
| Gresham, OR (“Portland”) |
||||||||||
| Prestige Senior Living Orchard Heights |
Managed | 12/2/2013 | 17,775 | |||||||
| Salem, OR |
||||||||||
| Prestige Senior Living Riverwood |
Managed | 12/2/2013 | 9,700 | |||||||
| Tualatin, OR (“Portland”) |
||||||||||
| Prestige Senior Living Southern Hills |
Managed | 12/2/2013 | 12,870 | |||||||
| Salem, OR |
||||||||||
|
|
|
|||||||||
| $ | 655,924 | |||||||||
|
|
|
|||||||||
111
Table of Contents
CNL HEALTHCARE PROPERTIES, INC. AND SUBSIDIARIES
NOTES TO CONSOLIDATED FINANCIAL STATEMENTS
YEAR ENDED DECEMBER 31, 2014
| 3. | Acquisitions (continued) |
The following summarizes the purchase price allocation for the above properties, and the estimated fair values of the assets acquired and liabilities assumed (in thousands):
| December 31, | ||||||||
| 2014 | 2013 | |||||||
| Land and land improvements |
$ | 60,565 | $ | 39,834 | ||||
| Buildings and building improvements |
732,740 | 555,342 | ||||||
| Furniture, fixtures and equipment |
12,260 | 13,718 | ||||||
| Intangibles (1) |
110,325 | 50,333 | ||||||
| Other liabilities |
(12,037 | ) | (2,796 | ) | ||||
| Liabilities assumed |
(1,000 | ) | — | |||||
| Mortgage note payable assumed (2) |
(27,657 | ) | — | |||||
|
|
|
|
|
|||||
| Net assets acquired |
875,196 | 656,431 | ||||||
| Contingent purchase price consideration |
(12,395 | ) | (507 | ) | ||||
|
|
|
|
|
|||||
| Total purchase price consideration |
$ | 862,801 | $ | 655,924 | ||||
|
|
|
|
|
|||||
FOOTNOTES:
| (1) | At the acquisition date, the weighted-average amortization period on the acquired lease intangibles for the years ended December 31, 2014 and 2013 were approximately 7.7 years and 4.6 years, respectively. The acquired lease intangibles during the year ended December 31, 2014 were comprised of approximately $97.3 million and $13.0 million of in-place lease intangibles and other lease intangibles, respectively, and the acquired lease intangibles during the year ended December 31, 2013 were comprised of approximately $42.5 million and $7.2 million of in-place lease intangibles and other lease intangibles, respectively. |
| (2) | At the acquisition date, the fair value of the mortgage note payable assumed reflects an approximate $0.4 million premium on the above-market mortgage note payable assumed. |
112
Table of Contents
CNL HEALTHCARE PROPERTIES, INC. AND SUBSIDIARIES
NOTES TO CONSOLIDATED FINANCIAL STATEMENTS
YEAR ENDED DECEMBER 31, 2014
| 3. | Acquisitions (continued) |
The revenues and net loss (including deductions for acquisition fees and expenses and depreciation and amortization expense) attributable to the acquired properties included in the Company’s consolidated statements of operations were approximately $55.0 million and $24.3 million, respectively, for the year ended December 31, 2014; and approximately $19.4 million and $15.8 million, respectively, for the year ended December 31, 2013.
In February 2015, the Company acquired an additional MOB in Knoxville, Tennessee for approximately $33.7 million (“UT Cancer Institute”); see Note 19, “Subsequent Events,” for additional information.
The following table presents the unaudited pro forma results of operations for the Company as if each of the 2014 acquisitions noted above (including the UT Cancer Institute) were acquired as of January 1, 2013 and the unaudited pro forma results of operations for the Company assuming each of the 2013 acquisitions noted above were acquired as of January 1, 2012 (in thousands except per share data):
| Years ended December 31, | ||||||||||||
| 2014 | 2013 | 2012 | ||||||||||
| (Unaudited) | (Unaudited) | (Unaudited) | ||||||||||
| Revenues |
$ | 243,581 | $ | 242,415 | $ | 125,872 | ||||||
|
|
|
|
|
|
|
|||||||
| Net income (loss) (1) |
$ | (43,936 | ) | $ | (59,527 | ) | $ | (40,483 | ) | |||
|
|
|
|
|
|
|
|||||||
| Loss per share of common stock (basic and diluted) |
$ | (0.39 | ) | $ | (0.58 | ) | $ | (0.82 | ) | |||
|
|
|
|
|
|
|
|||||||
| Weighted average number of shares of common stock outstanding (basic and diluted) (2) |
113,607 | 101,826 | 49,433 | |||||||||
|
|
|
|
|
|
|
|||||||
FOOTNOTES:
| (1) | The unaudited pro forma results for the years ended December 31, 2014 and 2013 were adjusted to exclude approximately $20.5 million and $16.5 million, respectively, of acquisition related expenses directly attributable to the properties acquired during the years ended December 31, 2014 and 2013. The unaudited pro forma results for the years ended December 31, 2013 and 2012 were adjusted to include these charges as if the properties acquired on January 1, 2013 and 2012, respectively. |
| (2) | As a result of the properties being treated as operational since January 1, 2013 and 2012, the Company assumed approximately 40.8 million and 36.2 million additional shares were issued as of January 1, 2013 and 2012, respectively. Consequently, the weighted average number of shares outstanding was adjusted to reflect this amount of shares being issued as of January 1, 2013 and 2012, instead of actual dates on which the shares were issued, and such shares were treated as outstanding as of the beginning of the period presented. In addition, for purposes of determining the weighted average number of shares of common stock outstanding, stock distributions are treated as if they were outstanding as of the beginning of the periods presented. |
113
Table of Contents
CNL HEALTHCARE PROPERTIES, INC. AND SUBSIDIARIES
NOTES TO CONSOLIDATED FINANCIAL STATEMENTS
YEAR ENDED DECEMBER 31, 2014
| 3. | Acquisitions (continued) |
Real Estate Under Development — In February 2014, the Company acquired a tract of land in Tega Cay, South Carolina for $2.8 million (“Wellmore of Tega Cay”), which is a suburb of Charlotte, North Carolina. In connection with the acquisition, the Company entered into a development agreement with a third party developer for the construction and development of a continuing care retirement community with a maximum development budget of approximately $35.6 million, including the allocated purchase price of the land. The Company determined that Wellmore of Tega Cay is a VIE because it believes there is insufficient equity at risk due to the development nature of the property. The Company is the primary beneficiary while the developer or its affiliates manage the development, construction and certain day-to-day operations of the property subject to the Company’s oversight. Under a promoted interest agreement with the developer, certain net operating income targets have been established which, upon meeting such targets, result in the developer being entitled to additional payments based on enumerated percentages of the assumed net proceeds of a deemed sale, subject to achievement of an established internal rate of return on the Company’s investment in the development.
In June 2014, the Company entered into a joint venture agreement with a third party and acquired a 95% membership interest in a tract of land in Katy, Texas for $4.0 million (“Watercrest at Katy”), which is a suburb of Houston, Texas. The joint venture plans to construct and develop an independent living community with a maximum development budget of approximately $38.2 million, including the allocated purchase price of the land. The Company determined that Watercrest at Katy is a VIE because it believes there is insufficient equity at risk due to the development nature of the joint venture. The Company is the primary beneficiary and managing member while the joint venture partner or its affiliates manage the development, construction and certain day-to-day operations of the property subject to the Company’s oversight. The Company’s joint venture partner acquired a 5% noncontrolling interest that includes a put option of its membership to the Company upon the occurrence of certain events that are not solely within the control of the Company and at a price that is determinable upon exercising the option; refer to Note 13, “Equity – Redeemable Noncontrolling Interest,” for additional information. Pursuant to the joint venture agreement, distributions of operating cash flow will be distributed pro rata based on each member’s ownership interest until the members of the joint venture receive a specified minimum return on their invested capital, and thereafter, the joint venture partner will receive a disproportionately higher share of any remaining proceeds at varying levels based on the Company having received certain minimum threshold returns.
In July 2014, the Company acquired a tract of land in Shorewood, Wisconsin for $2.2 million (“HarborChase of Shorewood”), which is a suburb of Milwaukee, Wisconsin. In connection with the acquisition, the Company entered into a development agreement with a third party developer for the construction and development of an assisted living and memory care community with a maximum development budget of approximately $25.6 million, including the allocated purchase price of the land. The Company determined that HarborChase of Shorewood is a VIE because it believes there is insufficient equity at risk due to the development nature of the property. The Company is the primary beneficiary while the developer or its affiliates manage the development, construction and certain day-to-day operations of the property subject to the Company’s oversight. Under a promoted interest agreement with the developer, certain net operating income targets have been established which, upon meeting such targets, result in the developer being entitled to additional payments based on enumerated percentages of the assumed net proceeds of a deemed sale, subject to achievement of an established internal rate of return on the Company’s investment in the development.
In August 2013, the Company acquired a tract of land adjacent to the South Bay I Communities in Lubbock, Texas for $3.0 million. In connection with the acquisition, the Company entered into a development agreement with a third party developer consisting of three potential development phases. The first phase of development is comprised of a maximum development budget of approximately $16.2 million, including the allocated purchase price of the land for the first phase of approximately $1.1 million, for the construction and development of an independent living community on the Raider Ranch campus (“Raider Ranch Development”). The remaining two phases of development are at the option of the Company; however, as of December 31, 2014, no formal undertakings have commenced with regards to these additional development phases.
114
Table of Contents
CNL HEALTHCARE PROPERTIES, INC. AND SUBSIDIARIES
NOTES TO CONSOLIDATED FINANCIAL STATEMENTS
YEAR ENDED DECEMBER 31, 2014
| 3. | Acquisitions (continued) |
Purchase of Controlling Interest in Montecito Joint Venture — In January 2013, the Company acquired a 90% membership interest in a two-story MOB in Claremont, California for approximately $7.0 million in equity through a joint venture (“Montecito Joint Venture”) formed by the Company and its co-venture partner, an unrelated party, that initially held the remaining 10% interest. The Montecito Joint Venture was previously recorded under the equity method of accounting because the decisions that significantly impacted the entity were shared between the Company and its co-venture partner, but it was not determined to be a VIE.
In August 2014, the Company acquired its co-venture partner’s 10% interest in the Montecito Joint Venture for approximately $1.6 million. As a result of this transaction, the Company owns 100% of the Montecito Joint Venture, and began consolidating all of the assets, liabilities and results of operations in the Company’s consolidated financial statements upon acquisition. Accordingly, the Company recorded a step up from its carrying value of the investment in the Montecito Joint Venture to the estimated fair value of the net assets acquired and liabilities assumed. The following summarizes the allocation of the purchase price, and the estimated fair values of the assets acquired and liabilities assumed as of the acquisition date (in thousands):
| Land and land improvements |
$ | 6,324 | ||
| Buildings and building improvements |
13,533 | |||
| Intangibles (1) |
2,691 | |||
| Working capital, net |
87 | |||
| Other liabilities |
(175 | ) | ||
| Mortgage note payable assumed (2) |
(12,331 | ) | ||
|
|
|
|||
| Net assets acquired |
$ | 10,129 | ||
|
|
|
FOOTNOTES:
| (1) | At the acquisition date, the weighted-average amortization period on the acquired lease intangibles was approximately 5.1 years and was comprised of approximately $1.9 million and $0.8 million of in-place lease intangibles and other lease intangibles, respectively. |
| (2) | At the acquisition date, the fair value of the mortgage note payable assumed reflects an approximate $0.6 million discount on the below-market mortgage note payable assumed. |
The fair value of the Company’s equity interest in the Montecito Joint Venture immediately before the acquisition date was approximately $5.7 million. The Company recorded a gain of approximately $2.8 million based on the acquisition date fair value of its equity interest in the Montecito Joint Venture. The following summarizes the gain that resulted from the change of control in the equity method investment for the year ended December 31, 2014 (in thousands):
| Fair value of net assets acquired |
$ | 10,129 | ||
| Less: Previous investment in Montecito Joint Venture |
(5,747 | ) | ||
| Less: Cash paid to acquire co-venture partner’s interest |
(1,584 | ) | ||
|
|
|
|||
| Gain on purchase of controlling interest of investment in unconsolidated entity |
$ | 2,798 | ||
|
|
|
Refer to Note 8, “Unconsolidated Entities,” for additional information on the Montecito Joint Venture prior to the Company’s purchase of the controlling interest in August 2014.
115
Table of Contents
CNL HEALTHCARE PROPERTIES, INC. AND SUBSIDIARIES
NOTES TO CONSOLIDATED FINANCIAL STATEMENTS
YEAR ENDED DECEMBER 31, 2014
| 4. | Real Estate Assets, net |
The gross carrying amount and accumulated depreciation of the Company’s real estate assets as of December 31, 2014 and December 31, 2013 are as follows (in thousands):
| December 31, | ||||||||
| 2014 | 2013 | |||||||
| Land and land improvements |
$ | 128,662 | $ | 59,208 | ||||
| Building and building improvements |
1,545,614 | 783,260 | ||||||
| Furniture, fixtures and equipment |
36,319 | 20,339 | ||||||
| Less: accumulated depreciation |
(53,095 | ) | (14,016 | ) | ||||
|
|
|
|
|
|||||
| Real estate investment properties, net |
1,657,500 | 848,791 | ||||||
| Real estate under development, including land |
47,153 | 17,409 | ||||||
|
|
|
|
|
|||||
| Total real estate assets, net |
$ | 1,704,653 | $ | 866,200 | ||||
|
|
|
|
|
|||||
Depreciation expense on the Company’s real estate investment properties, net was approximately $39.1 million, $12.0 million and $2.0 million for the years ended December 31, 2014, 2013 and 2012, respectively.
In June 2014, the Company completed the construction and development of a senior housing community in Acworth, Georgia (“Dogwood Forest of Acworth”). Dogwood Forest of Acworth opened to residents in July 2014 and was considered placed into service as of June 30, 2014. In December 2013, the Company completed the construction and development of a senior housing community in Lady Lake, Florida (“HarborChase of Villages Crossing”). HarborChase of Villages Crossing opened to residents in January 2014 and was considered placed into service as of December 2013. The asset values related to Dogwood Forest of Acworth and HarborChase of Villages Crossing are included in real estate investment properties, net in the accompanying consolidated balance sheets.
As of December 31, 2014, four of the Company’s senior housing communities have real estate under development with third-party developers as follows (in thousands):
| Property Name (and Location) |
Developer |
Real Estate Development Costs Incurred (1) |
Remaining Development Budget (2) |
|||||||
| Wellmore of Tega Cay |
Maxwell Group, Inc. | $ | 22,198 | $ | 18,291 | |||||
| HarborChase of Shorewood |
Harbor Shorewood Development, LLC | 9,340 | 17,149 | |||||||
| Watercrest at Katy (3) |
South Bay Partners, Ltd | 8,613 | 30,942 | |||||||
| Raider Ranch Development |
South Bay Partners, Ltd | 7,002 | 10,045 | |||||||
|
|
|
|
|
|||||||
| $ | 47,153 | $ | 76,427 | |||||||
|
|
|
|
|
|||||||
FOOTNOTES:
| (1) | This amount represents land and total capitalized costs for GAAP purposes for the acquisition, development and construction of the senior housing community as of December 31, 2014. Amounts include investment services fees, asset management fees, interest expense and other costs capitalized during the development period. |
| (2) | This amount includes preleasing and marketing costs which will be expensed as incurred. |
| (3) | This property is owned through a joint venture in which the Company’s initial ownership interest is 95%. |
The development budgets of the senior housing developments include the cost of the land, construction costs, development fees, financing costs, start-up costs and initial operating deficits of the respective properties. An affiliate of the developer of the respective community coordinates and supervises the management and administration of the development and construction. Each developer is responsible for any cost overruns beyond the approved development budget for the applicable project pursuant to a cost overrun guarantee. These developments were deemed to be VIEs; refer to Note 7, “Variable Interest Entities,” for additional information.
116
Table of Contents
CNL HEALTHCARE PROPERTIES, INC. AND SUBSIDIARIES
NOTES TO CONSOLIDATED FINANCIAL STATEMENTS
YEAR ENDED DECEMBER 31, 2014
| 5. | Intangibles, net |
The gross carrying amount and accumulated amortization of the Company’s intangible assets and liabilities as of December 31, 2014 and December 31, 2013 are as follows (in thousands):
| December 31, | ||||||||
| 2014 | 2013 | |||||||
| In-place lease intangibles |
$ | 148,880 | $ | 49,642 | ||||
| Above-market lease intangibles |
11,320 | 3,704 | ||||||
| Below-market ground lease intangibles |
10,314 | 4,153 | ||||||
| Less: accumulated amortization |
(30,250 | ) | (5,099 | ) | ||||
|
|
|
|
|
|||||
| Intangible assets, net |
$ | 140,264 | $ | 52,400 | ||||
|
|
|
|
|
|||||
| Below-market lease intangibles |
$ | (13,243 | ) | $ | (2,987 | ) | ||
| Above-market ground lease intangibles |
(2,273 | ) | (317 | ) | ||||
| Less: accumulated amortization |
1,014 | 168 | ||||||
|
|
|
|
|
|||||
| Intangible liabilities, net (1) |
$ | (14,502 | ) | $ | (3,136 | ) | ||
|
|
|
|
|
|||||
FOOTNOTE:
| (1) | Intangible liabilities, net are included in other liabilities in the accompanying consolidated balance sheets. |
Amortization on the Company’s intangible assets was approximately $25.1 million for the year ended December 31, 2014, of which approximately $1.0 million was treated as a reduction of rental income from operating leases, approximately $0.1 million was treated as an increase of property operating expenses and approximately $24.0 million was included in depreciation and amortization. Amortization on the Company’s intangible assets was approximately $5.0 million for the year ended December 31, 2013, of which approximately $0.2 million was treated as a reduction of rental income from operating leases, approximately $0.1 million was treated as an increase of property operating expenses and $4.7 million was included in depreciation and amortization. Amortization expense on the Company’s intangible assets was approximately $0.1 million for the year ended December 31, 2012, which was all included in depreciation and amortization.
Amortization on the Company’s intangible liabilities was approximately $0.8 million for the year ended December 31, 2014, of which approximately $0.8 million was treated as an increase of rental income from operating leases and approximately eight thousand dollars was treated as a reduction of property operating expenses. For the year ended December 31, 2013, amortization on the Company’s intangible liabilities was approximately $0.2 million, which was treated as an increase of rental income from operating leases and approximately three thousand dollars was treated as a reduction of property operating expenses. There was no amortization on the Company’s intangible liabilities for the year ended December 31, 2012.
117
Table of Contents
CNL HEALTHCARE PROPERTIES, INC. AND SUBSIDIARIES
NOTES TO CONSOLIDATED FINANCIAL STATEMENTS
YEAR ENDED DECEMBER 31, 2014
| 5. | Intangibles, net (continued) |
The estimated future amortization on the Company’s intangibles for each of the next five years and thereafter, in the aggregate, as of December 31, 2014 is as follows (in thousands):
| In-place Lease Intangibles |
Above- market Leases |
Below- market Ground Leases |
Total Assets |
Below- market Leases |
Above- market Ground Leases |
Total Liabilities |
||||||||||||||||||||||
| 2015 |
$ | 36,432 | 1,826 | 264 | $ | 38,522 | $ | 1,551 | 58 | $ | 1,609 | |||||||||||||||||
| 2016 |
25,344 | 1,488 | 264 | 27,096 | 1,399 | 58 | 1,457 | |||||||||||||||||||||
| 2017 |
12,601 | 1,358 | 264 | 14,223 | 1,272 | 58 | 1,330 | |||||||||||||||||||||
| 2018 |
10,073 | 1,210 | 264 | 11,547 | 1,154 | 58 | 1,212 | |||||||||||||||||||||
| 2019 |
7,278 | 974 | 264 | 8,516 | 991 | 58 | 1,049 | |||||||||||||||||||||
| Thereafter |
28,262 | 3,273 | 8,825 | 40,360 | 5,873 | 1,972 | 7,845 | |||||||||||||||||||||
|
|
|
|
|
|
|
|
|
|
|
|
|
|
|
|||||||||||||||
| $ | 119,990 | 10,129 | 10,145 | $ | 140,264 | $ | 12,240 | 2,262 | $ | 14,502 | ||||||||||||||||||
|
|
|
|
|
|
|
|
|
|
|
|
|
|
|
|||||||||||||||
| Weighted average remaining useful life as of December 31, 2014 (in years): |
| |||||||||||||||||||||||||||
| In-place Lease Intangibles |
Above- market Leases |
Below- market Ground Leases |
Below- market Leases |
Above- market Ground Leases |
||||||||||||||||||||||||
| 5.8 | 6.3 | 38.4 | 12.7 | 38.8 | ||||||||||||||||||||||||
|
|
|
|
|
|
|
|
|
|
|
|||||||||||||||||||
118
Table of Contents
CNL HEALTHCARE PROPERTIES, INC. AND SUBSIDIARIES
NOTES TO CONSOLIDATED FINANCIAL STATEMENTS
YEAR ENDED DECEMBER 31, 2014
| 6. | Operating Leases |
As of December 31, 2014, the Company owned 55 properties that were leased to tenants on a triple-net, net or modified gross basis, and accounted for as operating leases; of which, 24 are single-tenant properties that are 100% leased under operating leases and the remaining 31 are multi-tenant properties that are leased under operating leases. The Company’s leases had a weighted average remaining lease term of 7.2 years based on annualized base rents expiring between 2015 and 2033, subject to the tenants’ options to extend the lease periods ranging from two to ten years. In addition, certain tenants hold options to extend their leases for multiple periods.
Under the terms of the Company’s triple-net lease agreements, each tenant is responsible for the payment of property taxes, general liability insurance, utilities, repairs and maintenance, including structural and roof maintenance expenses. Each tenant is expected to pay real estate taxes directly to taxing authorities. However, if the tenant does not pay, the Company will be liable. The total annualized property tax assessed on these properties is approximately $1.9 million.
Under the terms of our net, modified gross or similar lease agreements for multi-tenant properties with third-party property managers, each tenant is responsible for the payment of their proportionate share of property taxes, general liability insurance, utilities, repairs and common area maintenance. These amounts are billed monthly and recorded as tenant reimbursement income in the accompanying consolidated statements of operations.
The following are future minimum lease payments to be received under non-cancellable operating leases for the next five years and thereafter, as of December 31, 2014 (in thousands):
| 2015 |
$ | 78,625 | ||
| 2016 |
74,867 | |||
| 2017 |
71,468 | |||
| 2018 |
67,335 | |||
| 2019 |
58,484 | |||
| Thereafter |
252,174 | |||
|
|
|
|||
| $ | 602,953 | |||
|
|
|
The above future minimum lease payments to be received excludes tenant reimbursements, straight-line rent adjustments, amortization of above- and below-market lease intangibles and base rent attributable to any renewal options exercised by the tenants in the future.
119
Table of Contents
CNL HEALTHCARE PROPERTIES, INC. AND SUBSIDIARIES
NOTES TO CONSOLIDATED FINANCIAL STATEMENTS
YEAR ENDED DECEMBER 31, 2014
| 7. | Variable Interest Entities |
Consolidated VIEs — As of December 31, 2014, the Company has 16 wholly-owned subsidiaries, which are VIEs due to following factors and circumstances:
| (1) | Five of these subsidiaries are single property entities, designed to own and lease their respective properties to single tenants, for which buy-out options are held by the respective tenants that are formula based. |
| (2) | Four of these subsidiaries are single property entities, designed to own and lease their respective properties to multiple tenants, which are subject to either a ground lease or an air rights lease that include buy-out and put options held by either the tenant or landlord under the applicable lease. |
| (3) | Five of these subsidiaries are entities with real estate under development or completed developments in which the third-party developers have an opportunity to earn promoted interest payments after certain net operating income targets and internal rate of return targets have been met. |
| (4) | One of these subsidiaries is a joint venture with real estate under development in which the third-party developer has an opportunity to earn promoted interest payments after certain net operating income targets and internal rate of return targets have been met. |
| (5) | One of these subsidiaries is a joint venture with equity interest that consists of non-substantive voting rights. |
The Company determined it is the primary beneficiary and holds a controlling financial interest in each of the aforementioned property and development entities due to its power to direct the activities that most significantly impact the economic performance of the entities, as well as its obligation to absorb the losses and its right to receive benefits from these entities that could potentially be significant to these entities. As such, the transactions and accounts of these VIEs are included in the accompanying consolidated financial statements.
The aggregate carrying amount and major classifications of the consolidated assets that can be used to settle obligations of the VIEs and liabilities of the consolidated VIEs that are non-recourse to the Company as of December 31, 2014 and December 31, 2013 are as follows (in thousands):
| December 31, | ||||||||
| 2014 | 2013 | |||||||
| Assets: |
||||||||
| Real estate investment properties, net |
$ | 174,449 | $ | 72,053 | ||||
|
|
|
|
|
|||||
| Real estate under development, including land |
$ | 47,153 | $ | 16,210 | ||||
|
|
|
|
|
|||||
| Intangibles, net |
$ | 25,519 | $ | 4,535 | ||||
|
|
|
|
|
|||||
| Cash |
$ | 6,280 | $ | 727 | ||||
|
|
|
|
|
|||||
| Loan costs, net |
$ | 2,300 | $ | 912 | ||||
|
|
|
|
|
|||||
| Restricted cash |
$ | 5,304 | $ | 257 | ||||
|
|
|
|
|
|||||
| Deferred rent |
$ | 2,978 | $ | 104 | ||||
|
|
|
|
|
|||||
| Other |
$ | 511 | $ | 21 | ||||
|
|
|
|
|
|||||
| Liabilities: |
||||||||
| Mortgages and other notes payable |
$ | 137,754 | $ | 52,596 | ||||
|
|
|
|
|
|||||
| Other liabilities |
$ | 4,949 | $ | 939 | ||||
|
|
|
|
|
|||||
| Accounts payable and accrued expenses |
$ | 2,317 | $ | 309 | ||||
|
|
|
|
|
|||||
| Accrued development costs |
$ | 7,951 | $ | 7,047 | ||||
|
|
|
|
|
|||||
| Due to related parties |
$ | 219 | $ | 112 | ||||
|
|
|
|
|
|||||
The Company’s maximum exposure to loss as a result of its involvement with these VIEs is limited to its net investment in these entities which totaled approximately $110.3 million as of December 31, 2014. The Company’s exposure is limited because of the non-recourse nature of the borrowings of the VIEs.
120
Table of Contents
CNL HEALTHCARE PROPERTIES, INC. AND SUBSIDIARIES
NOTES TO CONSOLIDATED FINANCIAL STATEMENTS
YEAR ENDED DECEMBER 31, 2014
| 8. | Unconsolidated Entities |
In June 2012, the Company acquired a 55% membership interest in seven senior housing communities for approximately $56.7 million in equity through a joint venture (“CHTSunIV”) formed by the Company and its co-venture partner, an unrelated party, that held the remaining 45% interest. On July 1, 2013, pursuant to a purchase and sale agreement with Health Care REIT, Inc. (“HCN”), dated December 18, 2012, between CHTSunIV and HCN, the Company completed the sale of its joint venture membership interest for a sales price of approximately $61.8 million, net of transaction costs, which reflects an aggregate gain of approximately $4.5 million that is recorded as a gain on sale of investment in unconsolidated entity in the accompanying statement of operations for the year ended December 31, 2013.
Under the terms of the CHTSunIV joint venture agreement, the Company was entitled to receive a preferred return of 11% on its invested capital for the first seven years over its co-venture partner. The Company accounted for this investment under the equity method of accounting because the decisions that significantly impact the entity were shared between the Company and its co-venture partner.
In August 2012, the Company acquired a 75% membership interest in three senior housing properties for approximately $4.8 million in equity through a joint venture (“Windsor Manor”) formed by the Company and its co-venture partner, an unrelated party, that holds the remaining 25% interest. In April 2013, the Company, through its Windsor Manor joint venture, acquired a 75% membership interest in two additional senior housing properties for approximately $4.9 million in equity. In June 2014, the Windsor Manor joint venture refinanced approximately $18 million of its then-current outstanding debt related to the five senior housing communities; refer to “Item 7. Management’s Discussion and Analysis of Financial Condition and Results of Operations — Off-Balance Sheet Arrangements” for additional information.
Under the terms of the Windsor Manor joint venture agreement, the Company is entitled to receive a preferred return of 11% on its invested capital over its co-venture partner. The Company continues to account for this investment under the equity method of accounting because the decisions that significantly impact the entity are shared between the Company and its co-venture partner.
In January 2013, the Company acquired a 90% membership interest in a two-story MOB in Claremont, California for approximately $7.0 million in equity through a joint venture (“Montecito”) formed by the Company and its co-venture partner, an unrelated party, that held the remaining 10% interest. As noted in Note 3. “Acquisitions – Purchase of Controlling Interest in Montecito Joint Venture,” in August 2014, the Company acquired its co-venture partner’s 10% interest in the Montecito joint venture.
Under the terms of the venture agreement, operating cash flows were distributed to the Company and its co-venture partner on a pro rata basis. The Company accounted for this investment under the equity method of accounting because the decisions that significantly impact the entity were shared between the Company and its co-venture partner.
For the year ended December 31, 2014, the Company capitalized approximately $0.2 million of financing coordination fees related to the Company’s investments in the Windsor Manor joint venture. For the year ended December 31, 2013, the Company capitalized approximately $0.5 million of investment service fees and acquisition expenses related to the Company’s investments in the Montecito and Windsor Manor joint ventures. For the year ended December 31, 2012, the Company capitalized approximately $3.3 million of investment service fees and acquisition fees and expenses related to the CHTSunIV and Windsor Manor joint ventures. The aforementioned amounts create an outside basis difference that are allocated to the assets of the investee and, if assigned to depreciable or amortizable assets, the basis differences are then amortized as a component of equity in earnings (loss) of unconsolidated entities over the average useful life of the underlying assets.
121
Table of Contents
CNL HEALTHCARE PROPERTIES, INC. AND SUBSIDIARIES
NOTES TO CONSOLIDATED FINANCIAL STATEMENTS
YEAR ENDED DECEMBER 31, 2014
| 8. | Unconsolidated Entities (continued) |
The following presents financial information for each of the Company’s unconsolidated entities for the years ended December 31, 2014, 2013 and 2012 (in thousands):
| For the year ended December 31, 2014 | ||||||||||||||||
| Montecito (2) | CHTSunIV (3) | Windsor Manor |
Total | |||||||||||||
| Revenues |
$ | 1,356 | $ | — | $ | 8,565 | $ | 9,921 | ||||||||
|
|
|
|
|
|
|
|
|
|||||||||
| Operating income |
$ | 436 | $ | — | $ | 149 | $ | 585 | ||||||||
|
|
|
|
|
|
|
|
|
|||||||||
| Net income (loss) |
$ | 165 | $ | — | $ | (1,137 | ) | $ | (972 | ) | ||||||
|
|
|
|
|
|
|
|
|
|||||||||
| Income allocable to other venture partners (1) |
$ | 17 | $ | — | $ | 373 | $ | 390 | ||||||||
|
|
|
|
|
|
|
|
|
|||||||||
| Income (loss) allocable to the Company (1) |
$ | 148 | $ | — | $ | (1,510 | ) | $ | (1,362 | ) | ||||||
| Amortization of capitalized acquisition costs |
(6 | ) | — | (19 | ) | (25 | ) | |||||||||
|
|
|
|
|
|
|
|
|
|||||||||
| Equity in earnings (loss) of unconsolidated entities |
$ | 142 | $ | — | $ | (1,529 | ) | $ | (1,387 | ) | ||||||
| Distributions declared to the Company |
$ | 659 | $ | — | $ | 3,057 | $ | 3,716 | ||||||||
|
|
|
|
|
|
|
|
|
|||||||||
| Distributions received by the Company (4) |
$ | 830 | $ | — | $ | 3,232 | $ | 4,062 | ||||||||
|
|
|
|
|
|
|
|
|
|||||||||
| For the year ended December 31, 2013 | ||||||||||||||||
| Montecito (2) | CHTSunIV (3) | Windsor Manor |
Total | |||||||||||||
| Revenues |
$ | 1,700 | $ | 24,107 | $ | 7,391 | $ | 33,198 | ||||||||
|
|
|
|
|
|
|
|
|
|||||||||
| Operating income |
$ | 230 | (5) | $ | 3,603 | $ | 67 | (5) | $ | 3,900 | ||||||
|
|
|
|
|
|
|
|
|
|||||||||
| Net income (loss) |
$ | (159 | ) | $ | (46 | ) | $ | (840 | ) | $ | (1,045 | ) | ||||
|
|
|
|
|
|
|
|
|
|||||||||
| Income allocable to other venture partners (1) |
$ | (16 | ) | $ | (1,365 | ) | $ | (1,870 | ) | $ | (3,251 | ) | ||||
|
|
|
|
|
|
|
|
|
|||||||||
| Income (loss) allocable to the Company (1) |
$ | (143 | ) | $ | 1,319 | $ | 1,030 | $ | 2,206 | |||||||
| Amortization of capitalized acquisition costs |
(8 | ) | $ | (36 | ) | $ | (15 | ) | (59 | ) | ||||||
|
|
|
|
|
|
|
|
|
|||||||||
| Equity in earnings (loss) of unconsolidated entities |
$ | (151 | ) | $ | 1,283 | $ | 1,015 | $ | 2,147 | |||||||
|
|
|
|
|
|
|
|
|
|||||||||
| Distributions declared to the Company |
$ | 870 | $ | 2,990 | $ | 666 | $ | 4,526 | ||||||||
|
|
|
|
|
|
|
|
|
|||||||||
| Distributions received by the Company |
$ | 699 | $ | 4,458 | $ | 336 | $ | 5,493 | ||||||||
|
|
|
|
|
|
|
|
|
|||||||||
122
Table of Contents
CNL HEALTHCARE PROPERTIES, INC. AND SUBSIDIARIES
NOTES TO CONSOLIDATED FINANCIAL STATEMENTS
YEAR ENDED DECEMBER 31, 2014
| 8. | Unconsolidated Entities (continued) |
| For the year ended December 31, 2012 | ||||||||||||||||
| Montecito (2) | CHTSunIV (3) | Windsor Manor |
Total | |||||||||||||
| Revenues |
$ | — | $ | 23,913 | $ | 1,594 | $ | 25,507 | ||||||||
|
|
|
|
|
|
|
|
|
|||||||||
| Operating income |
$ | — | $ | 1,872 | $ | (54 | )(5) | $ | 1,818 | |||||||
|
|
|
|
|
|
|
|
|
|||||||||
| Net income (loss) |
$ | — | $ | (703 | ) | $ | (288 | ) | $ | (991 | ) | |||||
|
|
|
|
|
|
|
|
|
|||||||||
| Income allocable to other venture partners (1) |
$ | — | $ | (1,703 | ) | $ | (471 | ) | $ | (2,174 | ) | |||||
|
|
|
|
|
|
|
|
|
|||||||||
| Income (loss) allocable to the Company (1) |
$ | — | $ | 1,000 | $ | 183 | $ | 1,183 | ||||||||
| Amortization of capitalized acquisition costs |
— | $ | (36 | ) | $ | (4 | ) | (40 | ) | |||||||
|
|
|
|
|
|
|
|
|
|||||||||
| Equity in earnings (loss) of unconsolidated entities |
$ | — | $ | 964 | $ | 179 | $ | 1,143 | ||||||||
|
|
|
|
|
|
|
|
|
|||||||||
| Distributions declared to the Company |
$ | — | $ | 3,075 | $ | 49 | $ | 3,124 | ||||||||
|
|
|
|
|
|
|
|
|
|||||||||
| Distributions received by the Company |
$ | — | $ | 1,607 | $ | — | $ | 1,607 | ||||||||
|
|
|
|
|
|
|
|
|
|||||||||
FOOTNOTES:
| (1) | Income (loss) is allocated between the Company and its joint venture partner using the HLBV method of accounting. |
| (2) | In August 2014, the Company acquired its co-venture partner’s 10% interest in the Montecito joint venture; refer to Note 3, “Acquisitions – Purchase of Controlling Interest in Montecito Joint Venture,” for additional information. |
| (3) | In July 2013, the Company completed the sale of its joint venture membership interest in CHTSunIV. |
| (4) | The distributions declared to and received by the Company for the Windsor Manor joint venture for the year ended December 31, 2014 include approximately $2.2 million of capital proceeds from a debt refinancing; refer to Item 7. “Management’s Discussion and Analysis – Off-Balance Sheet Arrangements” for additional information. |
| (5) | Includes approximately $0.4 million and $0.3 million of non-recurring acquisition expenses incurred by Montecito and Windsor Manor for the year ended December 31, 2013. Includes approximately $0.03 million of non-recurring acquisition expenses incurred by Windsor Manor for the year ended December 31, 2012. |
123
Table of Contents
CNL HEALTHCARE PROPERTIES, INC. AND SUBSIDIARIES
NOTES TO CONSOLIDATED FINANCIAL STATEMENTS
YEAR ENDED DECEMBER 31, 2014
| 8. | Unconsolidated Entities (continued) |
The following presents financial information for each of the Company’s unconsolidated entities for the years ended December 31, 2014, 2013 and 2012 (in thousands):
| As of December 31, 2014 | ||||||||||||
| Montecito | Windsor Manor |
Total | ||||||||||
| Real estate assets, net |
$ | — | $ | 26,505 | $ | 26,505 | ||||||
|
|
|
|
|
|
|
|||||||
| Intangible assets, net |
$ | — | $ | 386 | $ | 386 | ||||||
|
|
|
|
|
|
|
|||||||
| Other assets |
$ | — | $ | 2,403 | $ | 2,403 | ||||||
|
|
|
|
|
|
|
|||||||
| Mortgages and other notes payable |
$ | — | $ | 21,808 | $ | 21,808 | ||||||
|
|
|
|
|
|
|
|||||||
| Other liabilities |
$ | — | $ | 1,241 | $ | 1,241 | ||||||
|
|
|
|
|
|
|
|||||||
| Partners’ capital |
$ | — | $ | 6,245 | $ | 6,245 | ||||||
|
|
|
|
|
|
|
|||||||
| Carrying amount of investment (1) |
$ | — | $ | 7,379 | $ | 7,379 | ||||||
|
|
|
|
|
|
|
|||||||
| Company’s ownership percentage (2) |
75 | % | ||||||||||
|
|
|
|||||||||||
| As of December 31, 2013 | ||||||||||||
| Montecito | Windsor Manor |
Total | ||||||||||
| Real estate assets, net |
$ | 17,271 | $ | 27,547 | $ | 44,818 | ||||||
|
|
|
|
|
|
|
|||||||
| Intangible assets, net |
$ | 1,925 | $ | 1,284 | $ | 3,209 | ||||||
|
|
|
|
|
|
|
|||||||
| Other assets |
$ | 800 | $ | 2,055 | $ | 2,855 | ||||||
|
|
|
|
|
|
|
|||||||
| Mortgages and other notes payable |
$ | 12,958 | $ | 17,508 | $ | 30,466 | ||||||
|
|
|
|
|
|
|
|||||||
| Other liabilities |
$ | 327 | $ | 1,471 | $ | 1,798 | ||||||
|
|
|
|
|
|
|
|||||||
| Partners’ capital |
$ | 6,711 | $ | 11,907 | $ | 18,618 | ||||||
|
|
|
|
|
|
|
|||||||
| Carrying amount of investment (3) |
$ | 6,526 | $ | 11,912 | $ | 18,438 | ||||||
|
|
|
|
|
|
|
|||||||
| Company’s ownership percentage |
90 | % | 75 | % | ||||||||
|
|
|
|
|
|||||||||
FOOTNOTES:
| (1) | As of December 31, 2014, the Company’s share of partners’ capital determined under HLBV pursuant to the terms of each entity’s respective partnership agreement was approximately $6.6 million. The difference between the Company’s carrying amount of the investment and the Company’s share of partners’ capital determined under HLBV was approximately $0.8 million. |
| (2) | In August 2014, the Company acquired its co-venture partner’s 10% interest in the Montecito joint venture; refer to Note 3, “Acquisitions – Purchase of Controlling Interest in Montecito Joint Venture,” for additional information. |
| (3) | As of December 31, 2013, the Company’s share of partners’ capital determined under HLBV pursuant to the terms of each entity’s respective partnership agreement was approximately $17.5 million. The difference between the Company’s carrying amount of the investment and the Company’s share of partners’ capital determined under HLBV was approximately $0.9 million. |
124
Table of Contents
CNL HEALTHCARE PROPERTIES, INC. AND SUBSIDIARIES
NOTES TO CONSOLIDATED FINANCIAL STATEMENTS
YEAR ENDED DECEMBER 31, 2014
| 9. | Contingent Purchase Price Consideration |
Capital Health Communities
During 2012, in connection with the acquisition of the Capital Health Communities, the Company required that approximately $7.0 million of the purchase price be placed in an escrow account as the seller guaranteed the Company an annual return of at least $6.9 million, $7.0 million, and $7.1 million of net operating income on the acquired properties during 2013, 2014 and 2015, respectively (“Yield Guaranty”). As of December 31, 2014, the Company determined the fair value of the Yield Guaranty to be $4.1 million, which was recorded as other assets in the accompanying consolidated balance sheets. The following table provides a roll-forward of the fair value of the contingent purchase price consideration related to the Yield Guaranty on the Capital Health Communities for the years ended December 31, 2014, 2013 and 2012 (in thousands):
| Years Ended December 31, | ||||||||||||
| 2014 | 2013 | 2012 | ||||||||||
| Beginning balance |
$ | 4,488 | $ | 2,664 | $ | — | ||||||
| Contingent consideration in connection with acquisition |
— | — | 2,664 | |||||||||
| Change in fair value |
2,191 | 1,824 | — | |||||||||
| Yield Guaranty payment received from seller |
(2,601 | ) | — | — | ||||||||
|
|
|
|
|
|
|
|||||||
| Ending balance |
$ | 4,078 | $ | 4,488 | $ | 2,664 | ||||||
|
|
|
|
|
|
|
|||||||
Medical Portfolio I
During 2013, in conjunction with the acquisition of Medical Portfolio I, the Company entered into an earn-out agreement with the seller related to Cleveland Clinic, the tenant at Chestnut Commons, whereby the tenant maintains an exercisable right to expand the leased space by an additional 10,000 square feet within 24 months of the property acquisition closing (“Earn-Out”). The Earn-Out fee will be equal to (a) the base rent due for the first full year of the lease applicable to the expansion space divided by 8% minus (b) the costs incurred by the Company in connection with the exercise by Cleveland Clinic of its option for the expansion space, including tenant improvement costs, multiplied by 50%. As of December 31, 2014, the Company determined the fair value of the Earn-Out to be approximately $0.3 million, which is recorded as other liabilities in the accompanying consolidated balance sheets. The following table provides a roll-forward of the fair value of the contingent purchase price consideration related to Earn-Out for the years ended December 31, 2014, 2013 and 2012 (in thousands):
| Years Ended December 31, | ||||||||||||
| 2014 | 2013 | 2012 | ||||||||||
| Beginning balance |
$ | (507 | ) | $ | — | $ | — | |||||
| Contingent consideration in connection with acquisition |
— | (507 | ) | — | ||||||||
| Change in fair value |
239 | — | — | |||||||||
|
|
|
|
|
|
|
|||||||
| Ending balance |
$ | (268 | ) | $ | (507 | ) | $ | — | ||||
|
|
|
|
|
|
|
|||||||
125
Table of Contents
CNL HEALTHCARE PROPERTIES, INC. AND SUBSIDIARIES
NOTES TO CONSOLIDATED FINANCIAL STATEMENTS
YEAR ENDED DECEMBER 31, 2014
| 9. | Contingent Purchase Price Consideration (continued) |
South Bay II Communities
During 2014, in conjunction with the acquisition of the South Bay II Communities, the Company entered into an agreement with the sellers whereby the purchase price is adjusted in the event that certain net operating income targets are met. The additional consideration was determined within three months of the acquisition date and is equal to (a) the baseline net operating income divided by the baseline capitalization rates (as defined in the purchase and sale agreement) less (b) the purchase price paid at closing. The following table provides a roll-forward of the fair value of the estimated contingent purchase price consideration related to the South Bay II Communities for the years ended December 31, 2014, 2013 and 2012 (in thousands):
| Years Ended December 31, | ||||||||||||
| 2014 | 2013 | 2012 | ||||||||||
| Beginning balance |
$ | — | $ | — | $ | — | ||||||
| Contingent consideration in connection with acquisition |
(12,395 | ) | — | — | ||||||||
| Change in fair value |
(1,800 | ) | — | — | ||||||||
| Contingent consideration payment |
14,195 | — | — | |||||||||
|
|
|
|
|
|
|
|||||||
| Ending balance |
$ | — | $ | — | $ | — | ||||||
|
|
|
|
|
|
|
|||||||
Fair Value Measurements
The fair value of the contingent purchase price consideration was based on a then-current income approach that is primarily determined based on the present value and probability of future cash flows using internal underwriting models. The income approach further includes estimates of risk-adjusted rate of return and capitalization rates for each property. Since this methodology includes inputs that are less observable by the public and are not necessarily reflected in active markets, the measurements of the estimated fair value related to the Company’s contingent purchase price consideration are categorized as Level 3 on the three-level fair value hierarchy.
126
Table of Contents
CNL HEALTHCARE PROPERTIES, INC. AND SUBSIDIARIES
NOTES TO CONSOLIDATED FINANCIAL STATEMENTS
YEAR ENDED DECEMBER 31, 2014
| 10. | Indebtedness |
The following table provides details of the Company’s indebtedness as of December 31, 2014 and December 31, 2013 (in thousands):
| December 31, | ||||||||
| 2014 | 2013 | |||||||
| Mortgages payable and other notes payable: |
||||||||
| Fixed rate debt |
$ | 370,854 | $ | 290,817 | ||||
| Variable rate debt (1) |
482,922 | 147,290 | ||||||
|
|
|
|
|
|||||
| Mortgages and other notes payable |
853,776 | 438,107 | ||||||
| Premium (discount), net (2) |
(215 | ) | — | |||||
|
|
|
|
|
|||||
| Total mortgages and other notes payable, net |
853,561 | 438,107 | ||||||
| Credit facilities: |
||||||||
| Term Loan Facility |
175,000 | — | ||||||
| Revolving Credit Facility |
31,403 | 98,500 | ||||||
|
|
|
|
|
|||||
| Total borrowings |
$ | 1,059,964 | $ | 536,607 | ||||
|
|
|
|
|
|||||
FOOTNOTES:
| (1) | As of December 31, 2014, the Company had entered into interest rate swaps with notional amounts of approximately $182.1 million that were settling on a monthly basis; whereas, there were no such settlements during the year ended December 31, 2013. In addition, as of December 31, 2014 and December 31, 2013, the Company had entered into forward-starting interest rate swaps for total notional amounts of approximately $269.4 million and $124.3 million, respectively, in order to hedge its exposure to variable rate debt in future periods. The remaining forward-starting interest rate swaps have a range of effective dates beginning in 2015 and continuing through the maturity date of the respective loan (ranging from 2016 through 2019). |
| (2) | Premium (discount), net is reflective of the Company recording mortgage note payables assumed at fair value on the respective acquisition date. |
In December 2014, we amended and restated the terms of our credit agreement with KeyBank, as administrative agent, by entering into a $230 million Revolving Credit Facility and a $175 million Term Loan Facility. Pursuant to the Amended Credit Agreement, we have the ability to increase the collective borrowings under the Credit Facilities to $700 million. Moreover, the Revolving Credit Facility has an initial term of 36 months plus two 12-month extension options; whereas, the Term Loan Facility has an initial term of 50 months plus one 12-month extension option. The Credit Facilities bear interest based on LIBOR and a spread that varies with our leverage ratio on the respective Credit Facilities. In addition, we are required to make interest only payments until the respective maturity dates of the Credit Facilities as well as to pay fees ranging from 0.15% to 0.25% for unused commitments on the Revolving Credit Facility. As of December 31, 2014, availability under the Revolving Credit Facility was approximately $14.0 million based on the value of the properties in the unencumbered collateral pool of assets supporting the loan. As of December 31, 2013, the Revolving Credit Facility had an outstanding principal balance of approximately $98.5 million and was collateralized by nine properties with an aggregate net book carrying value of approximately $159.5 million.
The Credit Facilities contain affirmative, negative, and financial covenants which are customary for loans of this type, including without limitation: (i) maximum leverage, (ii) minimum fixed charge coverage ratio, (iii) minimum consolidated net worth, (iv) restrictions on payments of cash distributions except if required by REIT requirements, (v) maximum secured and unsecured indebtedness, and (vi) limitations on certain types of investments and with respect to the pool of properties supporting borrowings under the Credit Facilities, minimum debt service coverage ratio, and remaining lease terms, as well as property type, MSA, operator, and asset value concentration limits. The limitations on distributions includes a limitation on the extent of allowable distributions, which are not to exceed the greater of 95% of adjusted FFO (as defined per the Credit Facilities) and the minimum amount of distributions required to maintain the Company’s REIT status.
127
Table of Contents
CNL HEALTHCARE PROPERTIES, INC. AND SUBSIDIARIES
NOTES TO CONSOLIDATED FINANCIAL STATEMENTS
YEAR ENDED DECEMBER 31, 2014
| 10. | Indebtedness (continued) |
The following table provides additional details of the Company’s mortgages and other notes payable as of December 31, 2014 and 2013 (in thousands):
| Interest Rate at | ||||||||||||||||
| December 31, | Maturity | December 31, | ||||||||||||||
| Property and Loan Type |
2014 (1) |
Payment Terms |
Date (2) | 2014 | 2013 | |||||||||||
| Pacific Northwest Communities; Mortgage Loan (3) |
4.30% per annum |
Monthly principal and interest payments based on a 25-year amortization schedule | 12/5/18 | $ | 215,904 | $ | 157,549 | |||||||||
| Capital Health Communities; Mortgage Loan |
4.25% per annum |
Monthly principal and interest payments based on a 25-year amortization schedule | 1/5/20 | 43,684 | 47,481 | |||||||||||
| Primrose II Communities; Mortgage Loan |
3.81% per annum |
Monthly principal and interest payments based on a 30-year amortization schedule | 6/1/20 | 22,913 | 23,337 | |||||||||||
| Primrose I Communities; Mortgage Loan (4) |
4.11% per annum |
Monthly principal and interest payments based on a 30-year amortization schedule | 9/1/22 | 53,060 | 54,031 | |||||||||||
| Watercrest at Mansfield; Mortgage Loan (5) |
4.68% per annum |
Monthly principal and interest payments based on a total payment of $143,330 |
6/1/23 | 27,073 | — | |||||||||||
| LaPorte Cancer Center; Mortgage Loan |
4.25% per annum (through 2020) |
Monthly principal and interest payments based on a 25-year amortization schedule | 6/14/28 | 8,220 | 8,419 | |||||||||||
|
|
|
|
|
|||||||||||||
| Total fixed rate debt | 370,854 | 290,817 | ||||||||||||||
|
|
|
|
|
|||||||||||||
| Perennial Communities; Mortgage Loan (6) |
30-day LIBOR plus 4.25% per annum |
Monthly interest only payments through April 2015; principal and interest payments thereafter based on a 25-year amortization schedule |
5/31/16 | 30,000 | 30,000 | |||||||||||
| Medical Portfolio I Properties; Mortgage Loan (7) |
30-day LIBOR plus 2.65% per annum |
Monthly principal and interest payments based on a 30-year amortization schedule | 9/5/16 | 34,720 | 35,512 | |||||||||||
| Lee Hughes Medical Building; Mortgage Loan |
30-day LIBOR plus 1.85% per annum |
Monthly principal and interest payments based on a 30-year amortization schedule | 9/5/16 | 19,162 | — | |||||||||||
| Harborchase of Villages Crossing; Construction Loan |
30-day LIBOR plus 3.20% per annum |
Monthly interest only payments through August 2015; principal and interest payments thereafter based on a 30-year amortization schedule |
9/1/17 | 16,589 | 13,130 | |||||||||||
| Raider Ranch Development; Construction Loan |
30-day LIBOR with 0.5% floor plus 3.50% |
Monthly interest only payments through October 2017; principal and interest payments thereafter based on a 25-year amortization schedule |
10/27/17 | 1 | — | |||||||||||
128
Table of Contents
CNL HEALTHCARE PROPERTIES, INC. AND SUBSIDIARIES
NOTES TO CONSOLIDATED FINANCIAL STATEMENTS
YEAR ENDED DECEMBER 31, 2014
| 10. | Indebtedness (continued) |
| Interest Rate at | ||||||||||||||||
| December 31, | Maturity | December 31, | ||||||||||||||
| Property and Loan Type |
2014 (1) |
Payment Terms |
Date (2) | 2014 | 2013 | |||||||||||
| Northwest Medical Park; Mortgage Loan (8) |
30-day LIBOR plus 2.30% per annum |
Monthly principal and interest payments based on a 25-year amortization schedule | 10/31/17 | $ | 7,129 | $ | — | |||||||||
| Dogwood Forest of Acworth; Construction Loan |
30-day LIBOR plus 3.20% per annum |
Monthly interest only payments through December 2015; principal and interest payments thereafter based on a 30-year amortization schedule | 1/1/18 | 12,038 | 3,765 | |||||||||||
| Claremont Medical Office; Mortgage Loan (9) |
30-day LIBOR plus 2.60% per annum |
Monthly principal and interest payments based on a 30-year amortization schedule | 1/15/18 | 12,958 | — | |||||||||||
| Knoxville Medical Office Properties; Mortgage Loan (10) |
30-day LIBOR plus 2.50% per annum |
Monthly interest only payments for the first 18 months; principal and interest payments thereafter based on a 30-year amortization schedule |
7/10/18 | 38,609 | 38,609 | |||||||||||
| Calvert Medical Office Properties; Mortgage Loan (11) |
30-day LIBOR plus 2.50% per annum |
Monthly interest only payments for the first 18 months; principal and interest payments thereafter based on a 30-year amortization schedule |
8/29/18 | 26,274 | 26,274 | |||||||||||
| Wellmore of Tega Cay; Construction Loan |
30-day LIBOR with 0.5% floor plus 5.4% |
Monthly interest only payments through February 2019; principal and interest payments thereafter based on a 25-year amortization schedule | 2/6/19 | 8,007 | — | |||||||||||
| HOSH and HOSH MOB; Mortgage Loan (12) |
90-day LIBOR with 0.4% floor plus 2.85% |
Monthly principal and interest payments based on a 20-year amortization schedule | 6/2/2019 | 49,624 | — | |||||||||||
| Medical Portfolio II Properties; Mortgage Loan (13) |
90-day LIBOR with 0.25% floor plus 2.35% |
Monthly principal and interest payments based on a 25-year amortization schedule | 7/14/19 | 85,127 | — | |||||||||||
| Southeast Medical Office Properties; Mortgage Loan (14) |
30-day LIBOR plus 2.0% per annum |
Monthly principal and interest payments based on a 25-year amortization schedule | 12/22/19 | 142,684 | — | |||||||||||
|
|
|
|
|
|||||||||||||
| Total variable rate debt | 482,922 | 147,290 | ||||||||||||||
|
|
|
|
|
|||||||||||||
| Total debt | $ | 853,776 | $ | 438,107 | ||||||||||||
|
|
|
|
|
|||||||||||||
129
Table of Contents
CNL HEALTHCARE PROPERTIES, INC. AND SUBSIDIARIES
NOTES TO CONSOLIDATED FINANCIAL STATEMENTS
YEAR ENDED DECEMBER 31, 2014
| 10. | Indebtedness (continued) |
FOOTNOTES:
| (1) | The 30-day and 90-day LIBOR was approximately 0.17% and 0.25%, respectively, as of December 31, 2014 and approximately 0.16% and 0.24%, respectively, as of December 31, 2013. |
| (2) | Represents the initial maturity date (or, as applicable, the maturity date as extended). The maturity date may be extended beyond the date shown subject to certain lender conditions. |
| (3) | The Pacific Northwest Loan may be prepaid, in whole or in part, with a prepayment premium equal to the greater of: (i) one percent (1%) of the principal amount being prepaid, multiplied by the quotient of the number of full months remaining until the maturity date of the loan (calculated as of the prepayment date) divided by the number of full months comprising the term of the loan; or (b) a “make-whole” payment equal to the present value of the loan less the amount of principal and accrued interest being prepaid calculated as of the prepayment date for the period between that date and the maturity date. |
| (4) | If prepaid prior to March 1, 2022, the Primrose I Communities Mortgage Loan is subject to a prepayment penalty in an amount equal to the greater of (i) 1% of the principal being repaid, or (ii) an amount calculated on the principal being repaid, multiplied by the difference between the Primrose I Communities Mortgage Loan interest rate, and a calculated yield rate tied to the rates on applicable U.S. Treasuries. If prepayment is made between March 1, 2022, and May 31, 2022, the prepayment penalty will be 1% of the outstanding principal balance of the Primrose I Communities Mortgage Loan. No prepayment fee is required if the Primrose I Communities Mortgage Loan is prepaid between June 1, 2022 and maturity. Partial prepayment of a loan is not permitted. The loan is transferable upon sale of the assets subject to lender approval. |
| (5) | The balance for this loan excludes a premium of $0.4 million related to the mortgage note payable assumed being recorded at fair value on the acquisition date. |
| (6) | The Company entered into a two-year forward interest rate swap with a notional amount of $30 million; see Note 12, “Derivative Financial Instruments” for additional information. |
| (7) | The Company entered into a two-year forward interest rate swap with a notional amount of $30 million; see Note 12, “Derivative Financial Instruments” for additional information. |
| (8) | The Company entered into a three-year interest rate swap with a notional amount of $7.1 million; see Note 12, “Derivative Financial Instruments” for additional information. |
| (9) | The balance for this loan excludes a discount of $0.6 million related to the mortgage note payable assumed being recorded at fair value on the acquisition date. In addition, the Company entered into a three-year forward interest rate swap with a notional amount of $12.4 million; see Note 12, “Derivative Financial Instruments” for additional information |
| (10) | The Company entered into a three-year forward interest rate swap with a notional amount of $38.3 million; see Note 12, “Derivative Financial Instruments” for additional information. |
| (11) | The Company entered into a three-year forward interest rate swap with a notional amount of $26.1 million; see Note 12, “Derivative Financial Instruments” for additional information. |
| (12) | The Company entered into a three-year forward interest rate swap with a notional amount of $48.4 million; see Note 12, “Derivative Financial Instruments” for additional information. |
| (13) | The Company entered into a four-year forward interest rate swap with a notional amount of $84.3 million; see Note 12, “Derivative Financial Instruments” for additional information. |
| (14) | In January 2015, the Company entered into a four-year forward interest rate swap with a notional amount of $138.7 million; see Note 16, “Subsequent Events” for further information. |
130
Table of Contents
CNL HEALTHCARE PROPERTIES, INC. AND SUBSIDIARIES
NOTES TO CONSOLIDATED FINANCIAL STATEMENTS
YEAR ENDED DECEMBER 31, 2014
| 10. | Indebtedness (continued) |
All of the Company’s mortgage and construction loans contain customary financial covenants and ratios; including (but not limited to) the following: debt service coverage ratio, minimum occupancy levels, limitations on incurrence of additional indebtedness, etc. As of December 31, 2014, the Company was in compliance with all financial covenants and ratios.
The following is a schedule of future principal payments and maturity for the Company’s borrowings as of December 31, 2014 (in thousands):
| 2015 |
$ | 17,693 | ||
| 2016 |
99,609 | |||
| 2017 |
65,380 | |||
| 2018 |
296,723 | |||
| 2019 |
444,136 | |||
| Thereafter |
136,423 | |||
|
|
|
|||
| $ | 1,059,964 | |||
|
|
|
The fair market value and carrying value of the mortgage and other notes payable was approximately $868.5 million and $853.6 million, respectively, and both the fair market value and carrying value of the Credit Facilities was $206.4 million as of December 31, 2014. The fair market value and carrying value of the mortgage and other notes payable was approximately $431.4 million and $438.1 million, respectively, and both the fair market value and carrying value of the Revolving Credit Facility was $98.5 million as of December 31, 2013. These fair market values are based on current rates and spreads the Company would expect to obtain for similar borrowings. Since this methodology includes inputs that are less observable by the public and are not necessarily reflected in active markets, the measurement of the estimated fair values related to the Company’s mortgage notes payable is categorized as Level 3 on the three-level valuation hierarchy. The estimated fair value of accounts payable and accrued expenses approximates the carrying value as of December 31, 2014 and December 31, 2013 because of the relatively short maturities of the obligations.
131
Table of Contents
CNL HEALTHCARE PROPERTIES, INC. AND SUBSIDIARIES
NOTES TO CONSOLIDATED FINANCIAL STATEMENTS
YEAR ENDED DECEMBER 31, 2014
| 11. | Related Party Arrangements |
The Company is externally advised and has no direct employees. Certain of the Company’s executive officers are executive officers of, or are on the board of managers of the Advisor. In addition, certain directors and officers hold similar positions with CNL Securities Corp., the managing dealer of the Offerings and a wholly owned subsidiary of CNL (the “Managing Dealer”).
In connection with services provided to the Company, affiliates are entitled to the following fees:
Managing Dealer — The Managing Dealer receives selling commissions and marketing support fees of up to 7% and 3%, respectively, of gross offering proceeds for shares sold, excluding shares sold pursuant to the Company’s Reinvestment Plan, all or a portion of which may be paid to participating broker dealers by the Managing Dealer.
Advisor — The Advisor and certain affiliates are entitled to receive fees and compensation in connection with the acquisition, management and sale of the Company’s assets, as well as the refinancing of debt obligations of the Company or its subsidiaries. In addition, the Advisor and its affiliates are entitled to reimbursement of actual costs incurred on behalf of the Company in connection with the Company’s organizational, offering, acquisition and operating activities. Pursuant to the advisory agreement, as amended in 2013, the Advisor receives investment services fees equal to 1.85% of the purchase price of properties (including its proportionate share of properties acquired through joint ventures) for services rendered in connection with the selection, evaluation, structure and purchase of assets. In addition, the Advisor is entitled to receive a monthly asset management fee of 0.08334% of the average real estate asset value (as defined in the advisory agreement) of the Company’s properties, including its proportionate share of properties owned through joint ventures. The Advisor will also receive a financing coordination fee for services rendered with respect to refinancing of any debt obligations of the Company or its subsidiaries equal to 1.0% of the gross amount of the refinancing.
The Company will pay the Advisor a disposition fee in an amount equal to (i) in the case of the sale of real property, the lesser of (A) one-half of a competitive real estate commission, or (B) 1% of the sales price of such property, and (ii) in the case of the sale of any asset other than real property or securities, 1% of the sales price of such asset, if the Advisor, its affiliates or related parties provide a substantial amount of services, as determined by the Company’s independent directors, in connection with the sale of one or more assets (including a sale of all of its assets or the sale of it or a portion thereof). The Company will not pay its Advisor a disposition fee in connection with the sale of investments that are securities; however, a disposition fee in the form of a usual and customary brokerage fee may be paid to an affiliate or related party of the Advisor, if such affiliate is properly licensed.
Under the advisory agreement and the Company’s articles of incorporation, the Advisor will be entitled to receive certain subordinated incentive fees upon (a) sales of assets and/or (b) a listing (which would also include the receipt by the Company’s stockholders of securities that are approved for trading on a national securities exchange in exchange for shares of the Company’s common stock as a result of a merger, share acquisition or similar transaction). However, once a listing occurs, the Advisor will not be entitled to receive an incentive fee on subsequent sales of assets. The incentive fees are calculated pursuant to formulas set forth in both the advisory agreement and the Company’s articles of incorporation. All incentive fees payable to the Advisor are subordinated to the return to investors of their invested capital plus a 6% cumulative, noncompounded annual return on their invested capital. Upon termination or non-renewal of the advisory agreement by the Advisor for good reason (as defined in the advisory agreement) or by the Company other than for cause (as defined in the advisory agreement), a listing or sale of assets after such termination or non-renewal will entitle the Advisor to receive a pro-rated portion of the applicable subordinated incentive fee.
In addition, the Advisor or its affiliates may be entitled to receive fees that are usual and customary for comparable services in connection with the financing, development, construction or renovation of a property, subject to approval of the Company’s board of directors, including a majority of its independent directors.
132
Table of Contents
CNL HEALTHCARE PROPERTIES, INC. AND SUBSIDIARIES
NOTES TO CONSOLIDATED FINANCIAL STATEMENTS
YEAR ENDED DECEMBER 31, 2014
| 11. | Related Party Arrangements (continued) |
In March 2013, the Company entered into the Advisor Expense Support Agreement pursuant to which the Advisor agreed to accept certain payments in the form of forfeitable restricted common stock of the Company in lieu of cash for asset management fees and specified expenses owed by the Company to the Advisor under the advisory agreement. The term of the Advisor Expense Support Agreement automatically renews for consecutive one year periods, subject to the right of the Advisor to terminate the Advisor Expense Support Agreement upon 30 days’ written notice to the Company.
Commencing on April 1, 2013, the Advisor has provided expense support to the Company through forgoing the payment of fees in cash and acceptance of restricted stock for services rendered and specified expenses incurred in an amount equal to the positive excess, if any, of (a) aggregate stockholder cash distributions declared for the applicable quarter, over (b) the Company’s aggregate modified funds from operations (as defined in the Advisor Expense Support Agreement). The Advisor expense support amount shall be determined for each calendar quarter, on a non-cumulative basis, on each Determination Date.
Property Manager — Pursuant to a property management agreement, as amended in 2012, the Property Manager receives property management fees of (a) 2% of annual gross rental revenues from single tenant properties, and (b) 4% of annual gross rental revenues from multi-tenant properties. In the event that the Company contracts directly with a third-party property manager, the Company may pay the Property Manager an oversight fee of up to 1% of annual gross revenues of the property managed; however, in no event will the Company pay both a property management fee and an oversight fee with respect to the same property. The Company will pay to the Property Manager a construction management fee equal to 5% of hard and soft costs associated with the initial construction or renovation of a property, or with the management and oversight of expansion projects and other capital improvements, in those cases in which the value of the construction, renovation, expansion or improvements exceeds (i) 10% of the initial purchase price of the property, and (ii) $1.0 million, which fee will be due and payable upon completion of such projects.
In August 2013, the Company entered into the Property Manager Expense Support Agreement pursuant to which the Property Manager has agreed to accept certain payments in the form of forfeitable restricted common stock of the Company in lieu of cash for property management services owed by the Company to the Property Manager under the property management and leasing agreement.
Commencing on July 1, 2013, the Property Manager is required to provide expense support to the Company through forgoing the payment of fees in cash and acceptance of restricted stock for services in an amount equal to the positive excess, if any, of (a) aggregate stockholder cash distributions declared for the applicable quarter, over (b) the Company’s aggregate modified funds from operations (as defined in the Property Manager Expense Support Agreement). The Property Manager expense support amount shall be determined, on a non-cumulative basis, after the calculation of the Advisor expense support amount pursuant to the Property Manager Expense Support Agreement on each Determination Date.
Expense Support Agreements — In exchange for services rendered and in consideration of the expense support provided, the Company shall issue, within 45 days following each Determination Date, a number of shares of restricted stock equal to the quotient of the expense support amount provided by to the Advisor and Property Manager for the preceding quarter divided by the then-current public offering price per share of common stock, on the terms and conditions and subject to the restrictions set forth in the Expense Support Agreements. Any amounts deferred, and for which restricted stock shares are issued, pursuant to the Expense Support Agreements will be permanently waived and the Company will have no obligation to pay such amounts to the Advisor or the Property Manager. The Restricted Stock is subordinated and forfeited to the extent that shareholders do not receive their original invested capital back with at least a 6% annualized return of investment upon ultimate liquidity of the Company. Refer to Note 2, “Summary of Significant Accounting Policies” for treatment of issued Restricted Stock.
133
Table of Contents
CNL HEALTHCARE PROPERTIES, INC. AND SUBSIDIARIES
NOTES TO CONSOLIDATED FINANCIAL STATEMENTS
YEAR ENDED DECEMBER 31, 2014
| 11. | Related Party Arrangements (continued) |
CNL Capital Markets Corp — CNL Capital Markets Corp., an affiliate of CNL, receives a sliding flat annual rate (payable monthly) based on the average number of investor accounts that will be open over the term of the agreement. For the years ended December 31, 2014, 2013 and 2012, the Company incurred approximately $0.4 million, $0.3 million and $0.1 million in such fees, respectively. These amounts are included in general and administrative expenses in the accompanying consolidated statements of operations.
Co-venture partners — The Company paid certain amounts on behalf of its co-venture partner, Windsor Manor, of approximately $30,000 and $0.1 million during the years ended December 31, 2014 and 2013. The Company has recorded a receivable balance as of December 31, 2014 and 2013, which is included in other assets in the accompanying consolidated balance sheet.
The Company incurs operating expenses which, in general, relate to administration of the Company on an ongoing basis. Pursuant to the advisory agreement, the Advisor shall reimburse the Company the amount by which the total operating expenses paid or incurred by the Company exceed, in any four consecutive fiscal quarters commencing with the Expense Year ending June 30, 2013, the greater of 2% of average invested assets or 25% of net income (as defined in the advisory agreement) (“Limitation”), unless a majority of the Company’s independent directors determines that such excess expenses are justified based on unusual and non-recurring factors (“Expense Cap Test”). In performing the Expense Cap Test, the Company uses operating expenses on a GAAP basis after making adjustments for the benefit of expense support under the Expense Support Agreements. For the Expense Year ended December 31, 2014, the Company did not incur operating expenses in excess of the Limitation.
The Company maintains accounts totaling approximately $0.1 million and $0.4 million as of December 31, 2014 and 2013, respectively, at a bank in which the Company’s chairman serves as a director.
In June 2013, the Company originated an ADC Loan in the amount of $6.2 million to C4 Development, LLC (“Crosland Southeast”), a related party by virtue of a family relationship between a principal of the borrower and the Company’s vice chairman who recused himself from review and approval of the investment, for the development of an MOB in Rutland, Virginia that will function as an out-patient emergency and imaging center and was leased to Hospital Corporation of America (“HCA”). As of December 31, 2014, the Company’s ADC Loan had been fully repaid. As of December 31, 2013, approximately $3.7 million of the ADC Loan commitment had been funded of which approximately $1.8 million was used for the purchase of land (“HCA Rutland”) and approximately $1.9 million was used towards the development of the MOB. The previous funding on the ADC Loan was recorded as a note receivable from related party in the accompanying consolidated balance sheet as of December 31, 2013. In addition, the Company recorded interest income for the years ended December 31, 2014 and 2013, which is included in interest income on note receivable from related party in the accompanying consolidated statements of operations.
134
Table of Contents
CNL HEALTHCARE PROPERTIES, INC. AND SUBSIDIARIES
NOTES TO CONSOLIDATED FINANCIAL STATEMENTS
YEAR ENDED DECEMBER 31, 2014
| 11. | Related Party Arrangements (continued) |
The fees incurred by and reimbursable to the Advisor in connection with the Company’s Offerings for the years ended December 31, 2014, 2013 and 2012, and related amounts unpaid as of December 31, 2014 and 2013 are as follows (in thousands):
| Unpaid amounts (1) | ||||||||||||||||||||
| Years Ended December 31, | as of December 31, | |||||||||||||||||||
| 2014 | 2013 | 2012 | 2014 | 2013 | ||||||||||||||||
| Selling commissions (2) |
$ | 18,387 | $ | 10,262 | $ | 7,070 | $ | 388 | $ | 71 | ||||||||||
| Marketing support fees (2) |
16,429 | 11,310 | 4,957 | 555 | 70 | |||||||||||||||
|
|
|
|
|
|
|
|
|
|
|
|||||||||||
| $ | 34,816 | $ | 21,572 | $ | 12,027 | $ | 943 | $ | 141 | |||||||||||
|
|
|
|
|
|
|
|
|
|
|
|||||||||||
The expenses and fees incurred by and reimbursable to the Company’s related parties for the years ended December 31, 2014, 2013 and 2012, and related amounts unpaid as of December 31, 2014 and 2013 are as follows (in thousands):
| Unpaid amounts (1) | ||||||||||||||||||||
| Years Ended December 31, | as of December 31, | |||||||||||||||||||
| 2014 | 2013 | 2012 | 2014 | 2013 | ||||||||||||||||
| Reimbursable expenses: |
||||||||||||||||||||
| Offering costs (2) |
$ | 5,151 | $ | 4,373 | $ | 6,867 | $ | 713 | $ | 612 | ||||||||||
| Operating expenses (3) |
3,206 | 2,576 | 1,506 | 479 | 915 | |||||||||||||||
| Acquisition fees and expenses |
614 | 254 | 269 | 80 | 138 | |||||||||||||||
|
|
|
|
|
|
|
|
|
|
|
|||||||||||
| 8,971 | 7,203 | 8,642 | 1,272 | 1,665 | ||||||||||||||||
| Investment services fees (4) |
18,553 | 12,892 | 7,673 | — | — | |||||||||||||||
| Disposition fee (5) |
— | 608 | — | — | — | |||||||||||||||
| Financing coordination fees (6) |
220 | — | 552 | — | — | |||||||||||||||
| Property management fees (7) |
2,982 | 1,244 | 452 | 429 | 322 | |||||||||||||||
| Asset management fees (8) |
13,612 | 5,089 | 1,380 | 355 | 894 | |||||||||||||||
| Interest reserve and other advances (9) |
— | — | — | — | 286 | |||||||||||||||
|
|
|
|
|
|
|
|
|
|
|
|||||||||||
| $ | 44,338 | $ | 27,036 | $ | 18,699 | $ | 2,056 | $ | 3,167 | |||||||||||
|
|
|
|
|
|
|
|
|
|
|
|||||||||||
135
Table of Contents
CNL HEALTHCARE PROPERTIES, INC. AND SUBSIDIARIES
NOTES TO CONSOLIDATED FINANCIAL STATEMENTS
YEAR ENDED DECEMBER 31, 2014
| 11. | Related Party Arrangements (continued) |
FOOTNOTES:
| (1) | Amounts are recorded as due to related parties in the accompanying consolidated balance sheets. |
| (2) | Amounts are recorded as stock issuance and offering costs in the accompanying consolidated statements of stockholders’ equity and redeemable noncontrolling interest. Amounts include approximately $30,000, $0.1 million and $0 of reimbursement payments to the Advisor for services provided to the Company by its executive officers for the years ended December 31, 2014, 2013 and 2012, respectively. The reimbursement payments include components of salaries, benefits and other overhead charges. |
| (3) | Amounts are recorded as general and administrative expenses in the accompanying consolidated statements of operations. Amounts include approximately $0.2 million, $0.2 million and $0.1 million of reimbursement payments to the Advisor for services provided to the Company by its executive officers for the years ended December 31, 2014, 2013 and 2012, respectively. The reimbursement payments include components of salaries, benefits and other overhead charges. |
| (4) | For the year ended December 31, 2014, the Company incurred approximately $18.6 million in investment services fees of which approximately $1.8 million, was capitalized and included in real estate under development in the accompanying consolidated balance sheets. For the year ended December 31, 2013, the Company incurred approximately $12.9 million in investment service fees of which approximately $0.5 million and $0.1 million, respectively, were capitalized and included in investments in unconsolidated entities and real estate under development. For the year ended December 31, 2012, the Company incurred approximately $7.7 million in investment services fees of which approximately $2.9 million and $0.6 million, respectively, were capitalized and included in investments in unconsolidated entities and properties held for development. Investment service fees, that are not capitalized, are recorded as acquisition fees and expenses in the accompanying consolidated statements of operations. |
| (5) | Amounts are recorded as a reduction to gain on sale of investment in unconsolidated entity in the accompanying consolidated statements of operations. |
| (6) | For the year ended December 31, 2014, the Company incurred approximately $0.2 million in financing coordination fees, which was capitalized and included in its investment in the Windsor Manor Joint Venture. There were no financing coordination fees for the year ended December 31, 2013. For the year ended December 31, 2012, the Company incurred approximately $0.5 million in financing coordination fees, which was capitalized as loan costs in the accompanying consolidated balance sheets. |
| (7) | For the years ended December 31, 2014, 2013 and 2012, the Company incurred approximately $2.9 million, $1.2 million and $0.1 million, respectively, in property and construction management fees payable to the Property Manager of which approximately $0.9 million, $0.2 million and $0.1 million, respectively, in construction management fees were capitalized and included in real estate under development in the accompanying consolidated balance sheets. |
| (8) | For the years ended December 31, 2014 and 2013, the Company incurred approximately $13.6 million and $5.1 million, respectively, in asset management fees payable to the Advisor of which approximately $4.9 million and $1.4 million, respectively, were forgone in accordance with the terms of the Advisor Expense Support Agreement and approximately $0.3 million and $0.1 million, respectively, were capitalized and included in real estate under development in the accompanying consolidated balance sheets. For the year ended December 31, 2012, the Company incurred approximately $1.4 million in asset management fees payable to the Advisor, of which approximately eleven thousand dollars was capitalized and included in real estate under development. |
| (9) | Amount primarily consists of an interest reserve account related to the ADC Loan originated in June 2013. |
136
Table of Contents
CNL HEALTHCARE PROPERTIES, INC. AND SUBSIDIARIES
NOTES TO CONSOLIDATED FINANCIAL STATEMENTS
YEAR ENDED DECEMBER 31, 2014
| 11. | Related Party Arrangements (continued) |
The following fees were foregone in connection with the Expense Support Agreements for the years ended December 31, 2014, 2013 and 2012, and cumulatively as of December 31, 2014 (in thousands, except offering price):
| Years Ended December 31, |
As of December 31, |
|||||||||||||||
| 2014 | 2013 | 2012 | 2014 | |||||||||||||
| Asset management fees (1) |
$ | 4,867 | $ | 1,402 | $ | — | $ | 6,269 | ||||||||
|
|
|
|
|
|
|
|
|
|||||||||
| Then-current offering price (2) |
$ | 10.24 | $ | 10.00 | $ | — | $ | 10.58 | ||||||||
|
|
|
|
|
|
|
|
|
|||||||||
| Restricted stock shares (3) |
478 | 140 | — | 618 | ||||||||||||
|
|
|
|
|
|
|
|
|
|||||||||
| Cash distributions on Restricted Stock (4) |
$ | 98 | $ | 5 | $ | — | $ | 103 | ||||||||
|
|
|
|
|
|
|
|
|
|||||||||
| Stock distributions on Restricted Stock (5) |
7 | — | (6) | — | 7 | |||||||||||
|
|
|
|
|
|
|
|
|
|||||||||
FOOTNOTES:
| (1) | No other amounts have been forgone in connection with the Expense Support Agreements for the years ended December 31, 2014, 2013 and 2012, and cumulatively as of December 31, 2014. |
| (2) | The then-current offering prices are based on the Company’s NAV per share at the date in which the expense support amounts were ultimately settled under the Expense Support Agreements. |
| (3) | Restricted stock shares are comprised of approximately 0.5 million issued to the Advisor and approximately 0.1 million issuable to the Advisor as of December 31, 2014. Since the vesting conditions were not met through December 31, 2014, no fair value was assigned to the restricted stock shares as the shares were valued at zero, which represents the lowest possible value estimated at vesting. In addition, the restricted stock shares were treated as unissued for financial reporting purposes because the vesting criteria had not been met as of December 31, 2014. |
| (4) | The cash distributions have been recognized as compensation expense as issued and included in general and administrative expense in the accompanying consolidated statements of operations. |
| (5) | This represents the number of shares issued to the Advisor as stock distributions on its restricted stock shares. The par value of the stock distributions has been recognized as compensation expense as issued and included in general and administrative expense in the accompanying consolidated statements of operations. |
| (6) | During the year ended December 31, 2013, the Advisor received 356 shares in the form of stock distributions under the terms of the Advisor Expense Support Agreement. |
137
Table of Contents
CNL HEALTHCARE PROPERTIES, INC. AND SUBSIDIARIES
NOTES TO CONSOLIDATED FINANCIAL STATEMENTS
YEAR ENDED DECEMBER 31, 2014
| 12. | Derivative Financial Instruments |
The following table summarizes the terms of the derivative financial instruments held by the Company or through its joint venture and the asset (liability) that has been recorded (in thousands):
| Fair value asset (liability) as of |
||||||||||||||||||||||||
| Notional Amount |
Strike (1) | Credit Spread (1) |
Trade date |
Forward date |
Maturity date |
December 31, 2014 |
December 31, 2013 |
|||||||||||||||||
| $ | 12,421 | (2) | 1.3 | % | 2.6 | % | 1/17/2013 | 1/15/2015 | 1/16/2018 | $ | (71 | ) | $ | 83 | ||||||||||
| $ | 38,255 | (2) | 2.7 | % | 2.5 | % | 9/6/2013 | 8/17/2015 | 7/10/2018 | $ | (1,228 | ) | $ | (590 | ) | |||||||||
| $ | 26,067 | (2) | 2.8 | % | 2.5 | % | 9/6/2013 | 8/17/2015 | 8/29/2018 | $ | (906 | ) | $ | (435 | ) | |||||||||
| $ | 30,000 | (2) | 1.1 | % | 2.7 | % | 10/22/2013 | 8/5/2015 | 8/19/2016 | $ | (82 | ) | $ | (10 | ) | |||||||||
| $ | 29,952 | (2) | 0.9 | % | 4.3 | % | 11/13/2013 | 5/11/2015 | 5/31/2016 | $ | (74 | ) | $ | (8 | ) | |||||||||
| $ | 11,000 | (3) | 3.0 | % | — | % | 6/27/2014 | 6/30/2014 | 6/30/2017 | $ | 10 | $ | — | |||||||||||
| $ | 48,415 | (2) | 2.4 | % | 2.9 | % | 8/15/2014 | 6/1/2016 | 6/2/2019 | $ | (270 | ) | $ | — | ||||||||||
| $ | 84,251 | (2) | 2.3 | % | 2.4 | % | 9/12/2014 | 8/1/2015 | 7/15/2019 | $ | (1,326 | ) | $ | — | ||||||||||
| $ | 7,129 | (2) | 1.2 | % | 2.3 | % | 11/12/2014 | 11/15/2014 | 10/15/2017 | $ | (35 | ) | $ | — | ||||||||||
| $ | 175,000 | (2) | 1.6 | % | 2.0 | % | 12/23/2014 | 12/19/2014 | 2/19/2019 | $ | (881 | ) | $ | — | ||||||||||
The following tables summarize the gross and net amounts of the Company’s derivative financial instruments as presented in the accompanying consolidated balance sheets as of December 31, 2014 (in thousands):
| Gross and net amounts of asset (liability) as of December 31, 2014 |
Gross amounts as of December 31, 2014 |
|||||||||||||||||||||||||
| Notional amount |
Gross amount |
Offset amount |
Net amount |
Financial Instruments |
Cash Collateral |
Net Amount |
||||||||||||||||||||
| $ | 12,421 | (2) | $ | (71 | ) | $ | — | $ | (71 | ) | $ | (71 | ) | $ | — | $ | (71 | ) | ||||||||
| $ | 38,255 | (2) | $ | (1,228 | ) | $ | — | $ | (1,228 | ) | $ | (1,228 | ) | $ | — | $ | (1,228 | ) | ||||||||
| $ | 26,067 | (2) | $ | (906 | ) | $ | — | $ | (906 | ) | $ | (906 | ) | $ | — | $ | (906 | ) | ||||||||
| $ | 30,000 | (2) | $ | (82 | ) | $ | — | $ | (82 | ) | $ | (82 | ) | $ | — | $ | (82 | ) | ||||||||
| $ | 29,952 | (2) | $ | (74 | ) | $ | — | $ | (74 | ) | $ | (74 | ) | $ | — | $ | (74 | ) | ||||||||
| $ | 11,000 | (3) | $ | 10 | $ | — | $ | 10 | $ | 10 | $ | — | $ | 10 | ||||||||||||
| $ | 48,415 | (2) | $ | (270 | ) | $ | — | $ | (270 | ) | $ | (270 | ) | $ | — | $ | (270 | ) | ||||||||
| $ | 84,251 | (2) | $ | (1,326 | ) | $ | — | $ | (1,326 | ) | $ | (1,326 | ) | $ | — | $ | (1,326 | ) | ||||||||
| $ | 7,129 | (2) | $ | (35 | ) | $ | — | $ | (35 | ) | $ | (35 | ) | $ | — | $ | (35 | ) | ||||||||
| $ | 175,000 | (2) | $ | (881 | ) | $ | — | $ | (881 | ) | $ | (881 | ) | $ | — | $ | (881 | ) | ||||||||
138
Table of Contents
CNL HEALTHCARE PROPERTIES, INC. AND SUBSIDIARIES
NOTES TO CONSOLIDATED FINANCIAL STATEMENTS
YEAR ENDED DECEMBER 31, 2014
| 12. | Derivative Financial Instruments (continued) |
The following tables summarize the gross and net amounts of the Company’s derivative financial instruments as presented in the accompanying consolidated balance sheets as of December 31, 2013 (in thousands):
| Gross and net amounts of asset (liability) as of December 31, 2013 |
Gross amounts as of December 31, 2013 |
|||||||||||||||||||||||||
| Notional amount |
Gross amount |
Offset amount |
Net amount |
Financial Instruments |
Cash Collateral |
Net Amount |
||||||||||||||||||||
| $ | 12,421 | (2) | $ | 83 | $ | — | $ | 83 | $ | 83 | $ | — | $ | 83 | ||||||||||||
| $ | 38,255 | (2) | $ | (590 | ) | $ | — | $ | (590 | ) | $ | (590 | ) | $ | — | $ | (590 | ) | ||||||||
| $ | 26,067 | (2) | $ | (435 | ) | $ | — | $ | (435 | ) | $ | (435 | ) | $ | — | $ | (435 | ) | ||||||||
| $ | 30,000 | (2) | $ | (10 | ) | $ | — | $ | (10 | ) | $ | (10 | ) | $ | — | $ | (10 | ) | ||||||||
| $ | 29,952 | (2) | $ | (8 | ) | $ | — | $ | (8 | ) | $ | (8 | ) | $ | — | $ | (8 | ) | ||||||||
| $ | 11,000 | (3) | $ | — | $ | — | $ | — | $ | — | $ | — | $ | — | ||||||||||||
| $ | 48,415 | (2) | $ | — | $ | — | $ | — | $ | — | $ | — | $ | — | ||||||||||||
| $ | 84,251 | (2) | $ | — | $ | — | $ | — | $ | — | $ | — | $ | — | ||||||||||||
| $ | 7,129 | (2) | $ | — | $ | — | $ | — | $ | — | $ | — | $ | — | ||||||||||||
| $ | 175,000 | (2) | $ | — | $ | — | $ | — | $ | — | $ | — | $ | — | ||||||||||||
FOOTNOTES:
| (1) | The all-in rates are equal to the sum of the Strike and Credit Spread detailed above. |
| (2) | Amounts related to interest rate swaps held by the Company, or its equity method investments, which are recorded at fair value and included in either other assets or other liabilities in the accompanying consolidated balance sheets. |
| (3) | Amounts related to the interest rate cap held by the Windsor Manor Joint Venture for which the proportionate amounts of fair value relative to the Company’s ownership percentage are included in investments in unconsolidated entities in the accompanying consolidated balance sheets. |
Although the Company has determined that the majority of the inputs used to value its derivative financial instruments fall within Level 2 of the fair value hierarchy, the credit valuation adjustments associated with its derivatives utilize Level 3 inputs, such as estimates of current credit spreads, to evaluate the likelihood of default by the Company and its counterparties. The Company has assessed the significance of the impact of the credit valuation adjustments on the overall valuation of its derivative financial instruments and has determined that the credit valuation adjustments on the overall valuation adjustments are not significant to the overall valuation of its derivative financial instruments. As a result, the Company determined that its derivative financial instruments valuation in its entirety is classified in Level 2 of the fair value hierarchy. Determining fair value requires management to make certain estimates and judgments. Changes in assumptions could have a positive or negative impact on the estimated fair values of such instruments which could, in turn, impact the Company’s or its joint venture’s results of operations.
139
Table of Contents
CNL HEALTHCARE PROPERTIES, INC. AND SUBSIDIARIES
NOTES TO CONSOLIDATED FINANCIAL STATEMENTS
YEAR ENDED DECEMBER 31, 2014
| 13. | Equity |
Redeemable Noncontrolling Interest:
In connection with the Watercrest at Katy joint venture described in Note 3, “Acquisitions – Real Estate Under Development,” the Company’s joint venture partner acquired a 5% noncontrolling interest that includes a put option of its membership to the Company at any time commencing on the date on which Watercrest at Katy development opens to residents and concluding on the fifth anniversary thereof, when NOI is: (a) equal to or greater than the NOI threshold established in the joint venture agreement, and (b) has been equal to or greater than the NOI threshold established in the joint venture agreement for the three calendar months immediately preceding the calendar month during which the joint venture partner exercises the put option. The put option is redeemable for cash at a price equal to the appraised market value (less certain transaction-related costs) at the time the put option is exercised (“Put Price”). The Company’s maximum exposure, as a result of these redeemable equity securities, is limited to the Put Price multiplied by the joint venture partner’s 5% membership interest.
Stockholders’ Equity:
Public Offering — As of December 31, 2014 and December 31, 2013, the Company had received aggregate offering proceeds of approximately $1.1 billion (113.0 million shares) and $568.9 million (57.0 million shares), respectively, including approximately $27.1 million (2.8 million shares) and $9.4 million (1.0 million shares), respectively, received through its Reinvestment Plan.
Stock Issuance and Offering Costs — The Company has and will continue to incur costs in connection with the Offering and issuance of shares, including selling commissions, marketing support fees, filing fees, legal, accounting, printing and due diligence expense reimbursements, which are recorded as stock issuance and offering costs and deducted from stockholders’ equity. In accordance with the Company’s articles of incorporation, the total amount of selling commissions, marketing support fees, and other organizational and offering costs to be paid by the Company may not exceed 15% of the aggregate gross offering proceeds. Offering costs are generally funded by the Advisor and subsequently reimbursed by the Company subject to this limitation. For the years ended December 31, 2014, 2013 and 2012, the Company incurred approximately $59.8 million, $42.0 million and $23.4 million, respectively, in stock issuance and other offering costs, as described in the discussion of selling commissions and marketing support fees and offering expenses in Note 11, “Related Party Arrangements.”
Distributions — On July 29, 2011, the Company’s board of directors authorized a distribution policy providing for monthly cash distributions of $0.03333 (which is equal to an annualized distribution rate of 4% on the initial $10.00 offering price) together with monthly stock distributions of 0.002500 shares of common stock (which is equal to an annualized distribution rate of 3% on each 100 shares of common stock) for a total annualized distribution of 7% payable to all common stockholders of record as of the close of business on the first business day of each month. The Company commenced operations on October 5, 2011 and declarations of distributions pursuant to this policy began on the first day of November 2011. Distributions shall be paid quarterly and will be calculated for each stockholder as of the first day of each month the stockholder has been a stockholder of record in such quarter.
In December 2013, the Company’s board of directors determined to increase the amount of monthly cash distributions to $0.03380 per share together with monthly stock distributions of 0.00250 shares of common stock payable to all common stockholders of record as of the close of business on the first business day of each month beginning January 1, 2014.
In October 2014, in connection with the determination of our estimated net asset value per share, the Company’s board of directors increased the amount of monthly cash distributions to $0.0353 per share together with monthly stock distributions of 0.0025 shares of common stock payable to all common stockholders of record as of the close of business on the first business day of each month beginning December 1, 2014. This change allows the Company to maintain its historical annual distribution rate of 4.0% in cash (based on the current $10.58 offering price) and 3% in stock (based on three shares for each 100 outstanding shares of common stock).
140
Table of Contents
CNL HEALTHCARE PROPERTIES, INC. AND SUBSIDIARIES
NOTES TO CONSOLIDATED FINANCIAL STATEMENTS
YEAR ENDED DECEMBER 31, 2014
| 13. | Equity (continued) |
For the years ended December 31, 2014, 2013 and 2012, the Company declared cash distributions of $31.9 million, $14.2 million and $3.2 million, respectively, of which $14.2 million, $6.6 million and $1.5 million, respectively, were paid in cash to stockholders and $17.7 million, $7.6 million and $1.7 million, respectively, were reinvested pursuant to the Reinvestment Plan. In addition, for the years ended December 31, 2014, 2013 and 2012, the Company declared and made stock distributions of approximately 2.4 million 1.1 million and 0.2 million shares of common stock, respectively.
The tax composition of the Company’s distributions declared for the years ended December 31, 2014, 2013 and 2012 were as follows:
| December 31, | ||||||||||||
| Distribution Type |
2014 | 2013 | 2012 | |||||||||
| Taxable as ordinary income |
30.8 | % | 0.0 | % | 0.0 | % | ||||||
|
|
|
|
|
|
|
|||||||
| Taxable as capital gain |
0.0 | % | 63.8 | % | 0.0 | % | ||||||
|
|
|
|
|
|
|
|||||||
| Return of capital |
69.2 | % | 36.2 | % | 100.0 | % | ||||||
|
|
|
|
|
|
|
|||||||
Redemptions — During the years ended December 31, 2014, 2013 and 2012, the Company received requests for the redemption of common stock of approximately 0.3 million, 0.08 million and 1,049 shares, respectively, all of which were approved for redemption at an average price of $9.24, $9.25 and $9.99, respectively, and for a total of approximately $3.0 million, $0.8 million and $10,000, respectively.
Other comprehensive loss — The following table reflects the effect of derivative financial instruments held by Company, or its equity method investments, and included in the consolidated statements of comprehensive loss for the years ended December 31, 2014 and 2013 (in thousands):
| Derivative Financial Instrument |
Gain (loss) recognized in other comprehensive loss on derivative financial instrument (Effective Portion) |
Location of gain (loss) reclassified into earnings (Effective Portion) |
Gain (loss) reclassified from AOCI into earnings (Effective Portion) |
|||||||||||||||
| Years Ended December 31, |
Years Ended December 31, |
|||||||||||||||||
| 2014 | 2013 | 2014 | 2013 | |||||||||||||||
| Interest rate swaps |
$ | (3,915 | ) | $ | (1,042 | ) | Interest expense and loan cost amortization |
$ | (98 | ) | $ | — | ||||||
| Interest rate cap held by unconsolidated joint venture |
10 | — | Not applicable | — | — | |||||||||||||
| Interest rate swap held by unconsolidated joint venture |
— | 83 | Not applicable | — | — | |||||||||||||
|
|
|
|
|
|
|
|
|
|||||||||||
| Total |
$ | (3,905 | ) | $ | (959 | ) | $ | (98 | ) | $ | — | |||||||
|
|
|
|
|
|
|
|
|
|||||||||||
141
Table of Contents
CNL HEALTHCARE PROPERTIES, INC. AND SUBSIDIARIES
NOTES TO CONSOLIDATED FINANCIAL STATEMENTS
YEAR ENDED DECEMBER 31, 2014
| 14. | Income Taxes |
As of years ended December 31, 2014, 2013 and 2012, the Company recorded net current tax expense and current deferred tax assets related to deferred income at its TRSs. The components of the income tax benefit (expense) for the years ended December 31, 2014, 2013 and 2012 were as follows (in thousands):
| Years Ended December 31, |
||||||||||||
| 2014 | 2013 | 2012 | ||||||||||
| Current: |
||||||||||||
| Federal |
$ | — | $ | 13 | $ | (13 | ) | |||||
| State |
(361 | ) | — | (1 | ) | |||||||
|
|
|
|
|
|
|
|||||||
| Total current benefit (expense) |
(361 | ) | 13 | (14 | ) | |||||||
|
|
|
|
|
|
|
|||||||
| Deferred: |
||||||||||||
| Federal |
— | (25 | ) | 25 | ||||||||
| State |
— | (6 | ) | 6 | ||||||||
|
|
|
|
|
|
|
|||||||
| Total deferred benefit (expense) |
— | (31 | ) | 31 | ||||||||
|
|
|
|
|
|
|
|||||||
| Income tax benefit (expense) |
$ | (361 | ) | $ | (18 | ) | $ | 17 | ||||
|
|
|
|
|
|
|
|||||||
Deferred income taxes reflect the tax effects of temporary differences between the carrying amounts of assets and liabilities for financial reporting purposes and the amounts used for income tax purposes. Significant components of the Company’s deferred tax assets as of years ended December 31, 2014 and 2013 are as follows:
| 2014 | 2013 | |||||||
| Carryforwards of net operating loss |
$ | 2,361 | $ | 284 | ||||
| Prepaid rent |
437 | 313 | ||||||
| Valuation allowance |
(2,798 | ) | (597 | ) | ||||
|
|
|
|
|
|||||
| Net deferred tax assets |
$ | — | $ | — | ||||
|
|
|
|
|
|||||
A reconciliation of the income tax benefit (expense) computed at the statutory federal tax rate on income before income taxes is as follows (in thousands):
| Years Ended December 31, | ||||||||||||||||||||||||
| 2014 | 2013 | 2012 | ||||||||||||||||||||||
| Tax expense computed at federal statutory rate |
$ | (18,253 | ) | (35.00 | )% | $ | (6,329 | ) | (35.00 | )% | $ | (3,758 | ) | (35.00 | )% | |||||||||
| Benefit of REIT election |
18,253 | 35.00 | % | 6,344 | 35.08 | % | 3,746 | 34.89 | % | |||||||||||||||
| State income tax expense |
361 | 0.69 | % | 3 | 0.02 | % | (5 | ) | (0.05 | )% | ||||||||||||||
|
|
|
|
|
|
|
|
|
|
|
|
|
|||||||||||||
| Income tax expense |
$ | 361 | 0.69 | % | $ | 18 | 0.10 | % | $ | (17 | ) | (0.16 | )% | |||||||||||
|
|
|
|
|
|
|
|
|
|
|
|
|
|||||||||||||
The Company’s TRS entities had net operating loss carry-forwards for federal and state purposes of approximately $12.3 million as of year ended December 31, 2014 to offset future taxable income with approximately $0.8 million and $11.5 million of the estimated net operating loss carry-forwards set to expire in 2033 and 2034, respectively.
142
Table of Contents
CNL HEALTHCARE PROPERTIES, INC. AND SUBSIDIARIES
NOTES TO CONSOLIDATED FINANCIAL STATEMENTS
YEAR ENDED DECEMBER 31, 2014
| 15. | Commitments and Contingencies |
In the ordinary course of business, the Company may become subject to litigation or claims. There are no material legal proceedings pending or known to be contemplated against the Company.
In connection with the ownership, development and operation of real estate, the Company may potentially be liable for costs and damages related to environmental matters. The Company has not been notified by any governmental authority of any non-compliance, liability or other claim, and the Company is not aware of any other environmental condition that it believes will have a material adverse effect on the consolidated results of operations.
Refer to Note 4, “Real Estate Assets, net,” for additional information on the remaining development budgets for the Company’s senior housing developments.
Refer to Note 9, “Contingent Purchase Price Consideration,” for information on potential contingent purchase price consideration related to the purchase of Medical Portfolio I.
Refer to Note 11, “Related Party Arrangements,” for information on contingent restricted stock shares due to the Company’s Advisor and Property Manager in connection with the Expense Support Agreements.
Refer to Note 16, “Ground and Air Rights Leases,” for information on commitments under its ground and air rights lease agreements.
| 16. | Ground and Air Rights Leases |
Under the terms of its ground and air rights lease agreements, the Company is responsible for the monthly rental payments. These amounts are billed monthly and recorded as property operating expenses in the accompanying consolidated statements of operations. Under the terms of certain lease agreements, the Company is able to pass through this expense to the tenant and such amounts are recorded as tenant reimbursement income in the accompanying consolidated statements of operations. The Company incurred approximately $0.5 million and $0.1 million in ground and air rights lease expense for the years ended December 31, 2014 and 2013, respectively. The Company did not hold any ground or air rights leases as of December 31, 2012 or for the year ended December 31, 2012.
The following is a schedule of future minimum lease payments to be paid under the ground and air rights leases for each of the next five years and thereafter, in the aggregate, as of December 31, 2014 (in thousands):
| 2015 |
$ | 1,347 | ||
| 2016 |
1,371 | |||
| 2017 |
1,402 | |||
| 2018 |
1,428 | |||
| 2019 |
1,453 | |||
| Thereafter |
102,773 | |||
|
|
|
|||
| $ | 109,774 | |||
|
|
|
143
Table of Contents
CNL HEALTHCARE PROPERTIES, INC. AND SUBSIDIARIES
NOTES TO CONSOLIDATED FINANCIAL STATEMENTS
YEAR ENDED DECEMBER 31, 2014
| 17. | Concentration of Credit Risk |
As of December 31, 2014 and December 31, 2013 and for the years ended December 31, 2014, 2013 and 2012 the Company had the following tenants that individually accounted for 10% or more of total revenues or assets:
| Percentage of Total Revenues (1) | Percentage of Total Assets (2) | |||||||||||||||||||
| December 31, | December 31, | |||||||||||||||||||
| 2014 | 2013 | 2012 | 2014 | 2013 | ||||||||||||||||
| TSMM Management (“TSMM”); tenant of the Primrose Communities |
7.7 | % | 26.5 | % | 93.8 | % | 7.6 | % | 15.3 | % | ||||||||||
FOOTNOTES:
| (1) | Includes contractual rental income from operating leases, capital reserve income, straight-line rent adjustments, and amortization of lease intangibles. |
| (2) | Represents net book value of real estate assets and lease intangibles associated with the property leased by the respective tenant as of the end of the period presented as a percentage of total assets. |
Failure of this tenant to pay contractual lease payments could significantly impact the Company’s results of operations and cash flow from operations which, in turn would impact its ability to pay debt service and make distributions to stockholders.
| 18. | Selected Quarterly Financial Data (Unaudited) |
The following table presents selected unaudited quarterly financial data for the years ended December 31, 2014 and 2013 (in thousands, except per share data):
| 2014 Quarters | First | Second | Third | Fourth | Full Year | |||||||||||||||
| Total revenues |
$ | 33,275 | $ | 42,464 | $ | 49,660 | $ | 55,685 | $ | 181,084 | ||||||||||
| Operating loss |
(7,375 | ) | (3,381 | ) | (6,243 | ) | (6,179 | ) | (23,178 | ) | ||||||||||
| Net loss attributable to common shareholders |
(12,523 | ) | (12,303 | ) | (12,204 | ) | (15,481 | ) | (52,511 | ) | ||||||||||
| Weighted average number of shares outstanding |
65,273 | 75,173 | 87,344 | 105,452 | 83,457 | |||||||||||||||
| Loss per share of common stock |
$ | (0.19 | ) | $ | (0.16 | ) | $ | (0.14 | ) | $ | (0.15 | ) | $ | (0.63 | ) | |||||
| 2013 Quarters | First | Second | Third | Fourth | Full Year | |||||||||||||||
| Total revenues |
$ | 7,802 | $ | 8,609 | $ | 14,772 | $ | 21,422 | $ | 52,605 | ||||||||||
| Operating loss |
(866 | ) | (2,302 | ) | (5,307 | ) | (5,515 | ) | (13,990 | ) | ||||||||||
| Net loss attributable to common shareholders |
(3,809 | ) | (2,830 | ) | (2,305 | ) | (9,156 | ) | (18,100 | ) | ||||||||||
| Weighted average number of shares outstanding |
26,604 | 34,801 | 46,130 | 56,828 | 41,197 | |||||||||||||||
| Loss per share of common stock |
$ | (0.14 | ) | $ | (0.08 | ) | $ | (0.05 | ) | $ | (0.16 | ) | $ | (0.44 | ) | |||||
FOOTNOTE:
| (1) | For the purposes of determining the weighted average number of shares of common stock outstanding, stock distributions issued are treated as if they were outstanding for all periods presented. |
144
Table of Contents
CNL HEALTHCARE PROPERTIES, INC. AND SUBSIDIARIES
NOTES TO CONSOLIDATED FINANCIAL STATEMENTS
YEAR ENDED DECEMBER 31, 2014
| 19. | Subsequent Events |
Southeast Medical Office Properties
In January 2015, the Company entered into a four-year forward starting interest rate swap with an approximate notional amount of $138.7 million on the Southeast Medical Office Properties Loan, which begins to settle in December 2015.
In February 2015, the Company acquired University of Tennessee (“UT”) Cancer Institute Building for approximately $33.7 million. The UT Cancer Institute Building is a 100,104 square foot medical office building located in Knoxville, Tennessee and physically connected to the UT medical center. This is the tenth MOB in the Southeast Medical Office Properties portfolio. Refer to Note 3, “Acquisitions,” for the pro forma impact of this acquisition as well as the nine MOBs purchased in December 2014 on the Company’s results of operations for years ended December 31, 2014 and 2013. The Company owes the Advisor an approximate $0.6 million investment service fee related to the acquisition of the Southeast Medical Office Properties.
The following summarizes the Company’s preliminary allocation of the purchase price for the above property, and the estimated fair values of the assets acquired (in thousands):
| Land and land improvements |
$ | 419 | ||
| Buildings and building improvements |
27,660 | |||
| Intangibles (1) |
6,000 | |||
| Other liabilities |
(419 | ) | ||
|
|
|
|||
| Net assets acquired |
$ | 33,660 | ||
|
|
|
FOOTNOTE:
| (1) | The acquired lease intangibles were comprised of approximately $4.5 million and $1.5 million of in-place lease intangibles and other lease intangibles, respectively. At the acquisition date, the weighted-average amortization periods on these acquired lease intangibles were approximately 11.6 years and 39.0 years, respectively. |
Equity transactions
During the period from January 1, 2014 through March 18, 2015, the Company received additional subscription proceeds of approximately $164.8 million (15.6 million shares).
The Company’s board of directors declared a monthly cash distribution of $0.0353 and a monthly stock distribution of 0.0025 shares on each outstanding share of common stock on January 1, 2015, February 1, 2015 and March 1, 2015. The cash and stock distributions were made on March 11, 2015 and March 13, 2015, respectively.
Other transactions
In February 2015, the Company entered into a purchase agreement with a related party to acquire a senior housing community for which the Company escrowed an earnest money deposit of $0.5 million. The acquisition is subject to certain contingencies, including completion of due diligence, licensing and obtaining financing satisfactory to the Company. There can be no assurance that any or all contingencies will be satisfied and that the transaction will ultimately be completed, which in either event the deposit would be applied toward the purchase price or refunded.
145
Table of Contents
| Item 9. | CHANGES IN AND DISAGREEMENTS WITH ACCOUNTANTS ON ACCOUNTING AND FINANCIAL DISCLOSURE |
There were no changes in or disagreements with our independent registered certified public accountants during the period ended December 31, 2014.
| Item 9A. | CONTROLS AND PROCEDURES |
Evaluation of Disclosure Controls and Procedures
Pursuant to Rule 13a-15(b) under the Exchange Act, under the supervision and with the participation of our management, including our principal executive officer and principal financial officer, we conducted an evaluation of the effectiveness of our disclosure controls and procedures (as defined under Rule 13a-15(e) under the Exchange Act) as of the end of the period covered by this report. Based upon that evaluation, our management, including our principal executive officer and principal financial officer, concluded that our disclosure controls and procedures are effective as of the end of the period covered by this report.
Management’s Report on Internal Control Over Financial Reporting
Management is responsible for establishing and maintaining adequate internal control over financial reporting (as defined in Rule 13a-15(f) under the Securities Exchange Act of 1934, as amended). The Company’s internal control over financial reporting is designed to provide reasonable assurance to the Company’s management and board of directors regarding the preparation and fair presentation of published financial statements.
Because of its inherent limitations, internal control over financial reporting may not prevent or detect misstatements. Also, projections of any evaluation of effectiveness to future periods are subject to the risk that controls may become inadequate because of changes in conditions, or that the degree of compliance with the policies or procedures may deteriorate.
Based on management’s assessment, the Company maintained, in all material respects, effective internal control over financial reporting as of December 31, 2014 using the criteria set forth by the Committee of Sponsoring Organizations of the Treadway Commission (COSO) in “Internal Control Integrated Framework (2013)
Pursuant to rules established by the Securities and Exchange Commission, this annual report does not include an attestation report of the Company’s independent registered public accounting firm regarding internal control over financial reporting.
Changes in Internal Control over Financial Reporting
During the most recent fiscal quarter, there was no change in our internal controls over financial reporting (as defined under Rule 13a-15(f) under the Exchange Act) that has materially affected, or is reasonably likely to materially affect, our internal controls over financial reporting.
| Item 9B. | OTHER INFORMATION |
None.
146
Table of Contents
PART III
| Item 10. | DIRECTORS, EXECUTIVE OFFICERS AND CORPORATE GOVERNANCE |
The information required by this Item is incorporated by reference to our Definitive Proxy Statement to be filed with the Commission no later than April 30, 2015.
| Item 11. | EXECUTIVE COMPENSATION |
The information required by this Item is incorporated by reference to our Definitive Proxy Statement to be filed with the Commission no later than April 30, 2015.
| Item 12. | SECURITY OWNERSHIP OF CERTAIN BENEFICIAL OWNERS AND MANAGEMENT AND RELATED STOCKHOLDER MATTERS |
The information required by this Item is incorporated by reference to our Definitive Proxy Statement to be filed with the Commission no later than April 30, 2015.
| Item 13. | CERTAIN RELATIONSHIPS AND RELATED TRANSACTIONS, AND DIRECTOR INDEPENDENCE |
The information required by this Item is incorporated by reference to our Definitive Proxy Statement to be filed with the Commission no later than April 30, 2015.
| Item 14. | PRINCIPAL ACCOUNTANT FEES AND SERVICES |
The information required by this Item is incorporated by reference to our Definitive Proxy Statement to be filed with the Commission no later than April 30, 2015.
147
Table of Contents
| Item 15. | EXHIBITS, FINANCIAL STATEMENT SCHEDULE |
| (a) | List of Documents Filed as a Part of This Report: |
| (1) | Index to Consolidated Financial Statements: |
CNL Healthcare Properties, Inc.
Report of PricewaterhouseCoopers LLP, Independent Registered Certified Public Accounting Firm
Consolidated Balance Sheets as of December 31, 2014 and 2013
Consolidated Statements of Operations for the years ended December 31, 2014, 2013 and 2012
Consolidated Statements of Stockholders’ Equity and Redeemable Noncontrolling Interest for the years ended December 31, 2014, 2013 and 2012
Consolidated Statements of Cash Flows for the years ended December 31, 2014, 2013 and 2012
Notes to Consolidated Financial Statements
| (2) | Index to Financial Statement Schedules: |
Schedule II – Valuation and Qualifying Accounts for the years ended December 31, 2014, 2013, and 2012
Schedule III – Real Estate and Accumulated Depreciation as of December 31, 2014
Schedule IV – Mortgage Loans on Real Estate for the years ended December 31, 2014, 2013, and 2012
| (3) | Index to Exhibits: |
148
Table of Contents
EXHIBIT INDEX
CNL Healthcare Properties, Inc. was formerly known as CNL Healthcare Trust, Inc., CNL Properties Trust, Inc., and CNL Diversified Lifestyle Properties, Inc.
Exhibits:
| 3.1 | Second Articles of Amendment and Restatement of CNL Healthcare Properties, Inc. (Previously filed as Exhibit 3.1 to the Current Report on Form 8-K filed July 2, 2013 and incorporated herein by reference.) | |
| 3.2 | Third Amended and Restated Bylaws of CNL Healthcare Properties, Inc., effective June 27, 2013 (Previously filed as Exhibit 3.2 to the Current Report on Form 8-K filed July 2, 2013 and incorporated herein by reference.) | |
| 4.1 | Form of Subscription Agreement (Previously filed as Appendix A to Pre-effective Amendment Two to the Registration Statement on Form S-11 (File No. 333-196108) filed January 21, 2015 and incorporated herein by reference.) | |
| 4.2 | Form of Distribution Reinvestment Plan (Previously filed as Appendix B to Pre-effective Amendment Two to the Registration Statement on Form S-11 (File No. 333-196108) filed January 21, 2015 and incorporated herein by reference.) | |
| 4.3 | Form of Amended and Restated Redemption Plan (Previously filed as Appendix C to Pre-effective Amendment Two to the Registration Statement on Form S-11 (File No. 333-196108) filed January 21, 2015 and incorporated herein by reference.) | |
| 4.4 | Statement regarding restrictions on transferability of shares of common stock (to appear on stock certificate or to be sent upon request and without charge to stockholders issued shares without certificates) (Previously filed as Exhibit 4.5 to the Pre-effective Amendment One to the Registration Statement on Form S-11 (File No. 333-168129) filed October 20, 2010 and incorporated herein by reference.) | |
| 10.1 | Amended and Restated Limited Partnership Agreement of CNL Properties Trust, LP dated June 8, 2011 (Previously filed as Exhibit 10.1 to Pre-effective Amendment Three to the Registration Statement on Form S-11 (File No. 333-168129) filed June 10, 2011 and incorporated herein by reference.) | |
| 10.2 | Advisory Agreement dated June 8, 2011, between CNL Properties Trust, Inc., CNL Properties Trust LP, and CNL Properties Corp. (Previously filed as Exhibit 10.3 to Pre-effective Amendment Three to the Registration Statement on Form S-11 (File No. 333-168129) filed June 10, 2011 and incorporated herein by reference.) | |
| 10.2.1 | First Amendment to Advisory Agreement dated October 5, 2011, by and between CNL Properties Trust, Inc., CNL Properties Corp., and CNL Properties Trust, LP (Previously filed as Exhibit 10.1 to the Current Report on Form 8-K filed October 5, 2011 and incorporated herein by reference.) | |
| 10.2.2 | Second Amendment to Advisory Agreement dated March 20, 2013, by and among CNL Healthcare Properties, Inc., CHP Partners, LP and CNL Healthcare Corp. (Previously filed as Exhibit 10.1 to the Current Report on Form 8-K filed March 26, 2013 and incorporated herein by reference.) | |
| 10.3 | First Amended and Restated Property Management and Leasing Agreement dated June 28, 2012, by and between CNL Healthcare Trust, Inc., CHT Partners, LP, its various subsidiaries and CNL Healthcare Manager Corp. (Previously filed as Exhibit 10.1 to the Current Report on Form 8-K filed July 2, 2012 and incorporated herein by reference.) | |
149
Table of Contents
| 10.3.1 | First Amendment to First Amended and Restated Property Management and Leasing Agreement dated April 1, 2013, by and between CNL Healthcare Properties, Inc. and CHT Partners, LP, and CNL Healthcare Manager Corp. (Previously filed as Exhibit 10.3.1 to Pre-effective Amendment Two to Form S-11 (File No. 333-196108) filed January 21, 2015 and incorporated herein by reference.) | |
| 10.4 | Service Agreement dated as of June 8, 2011, by and between CNL Capital Markets Corp. and CNL Properties Trust, Inc. (Previously filed as Exhibit 10.5 to Pre-effective Amendment Three to the Registration Statement on Form S-11 (File No. 333-168129) filed June 10, 2011 and incorporated herein by reference.) | |
| 10.4.1 | Second Addendum to Service Agreement dated March 20, 2013, by and between CNL Capital Markets Corp. and CNL Healthcare Properties, Inc. (Previously filed as Exhibit 10.3 to the Current Report on Form 8-K filed March 26, 2013 and incorporated herein by reference.) | |
| 10.5 | Expense Support and Restricted Stock Agreement effective April 1, 2013, by and between CNL Healthcare Properties, Inc. and CNL Healthcare Corp. (Previously filed as Exhibit 10.2 to the Current Report on Form 8-K filed March 26, 2013 and incorporated herein by reference.) | |
| 10.5.1 | First Amendment to Expense Support and Restricted Stock Agreement dated November 21, 2013, by and between CNL Healthcare Properties, Inc. and CNL Healthcare Corp. (Previously filed as Exhibit 10.1 to the Current Report on Form 8-K filed November 26, 2013 and incorporated herein by reference.) | |
| 10.5.2 | Second Amendment to Expense Support and Restricted Stock Agreement effective as of April 3, 2014, by and between CNL Healthcare Properties, Inc. and CNL Healthcare Corp. (Previously filed as Exhibit 10.4 to the Current Report on Form 8-K filed April 3, 2014 and incorporated herein by reference.) | |
| 10.6 | Expense Support and Restricted Stock Agreement effective July 1, 2013, by and among CNL Healthcare Properties, Inc. and CNL Healthcare Manager Corp. (Previously filed as Exhibit 10.1 to the Current Report on Form 8-K filed August 27, 2013 and incorporated herein by reference.) | |
| 10.6.1 | First Amendment to Expense Support and Restricted Stock Agreement dated November 21, 2013, by and between CNL Healthcare Properties, Inc. and CNL Healthcare Manager Corp. (Previously filed as Exhibit 10.2 to the Current Report on Form 8-K filed November 26, 2013 and incorporated herein by reference.) | |
| 10.6.2 | Second Amendment to Expense Support and Restricted Stock Agreement effective as of April 3, 2014, by and between CNL Healthcare Properties, Inc. and CNL Healthcare Manager Corp. (Previously filed as Exhibit 10.5 to the Current Report on Form 8-K filed April 3, 2014 and incorporated herein by reference.) | |
| 10.7 | Form of Indemnification Agreement dated April 13, 2012, between CNL Healthcare Trust, Inc. and each of James M. Seneff, Jr., Thomas K. Sittema, Bruce Douglas, Michael P. Haggerty, J. Douglas Holladay, Stephen H. Mauldin, Joseph T. Johnson, Ixchell C. Duarte and Holly J. Greer, and for J. Chandler Martin dated July 27, 2012 (Previously filed as Exhibit 99.1 to the Current Report on Form 8-K filed April 19, 2012 and incorporated herein by reference.) | |
| 10.8 | Amended and Restated Revolving Credit Agreement among CHP Partners, LP as Borrower, KeyBank National Association as Administrative Agent and certain other Lenders dated December 19, 2014 (Previously filed as Exhibit 10.1 to the Current Report on Form 8-K filed December 29, 2014 and incorporated herein by reference.) | |
| 10.8.1 | Revolving Promissory Note made by CHP Partners, LP in the principal amount of $45,592,593 in favor of KeyBank National Association, dated December 19, 2014 (Previously filed as Exhibit 10.1 to the Current Report on Form 8-K filed December 29, 2014 and incorporated herein by reference. | |
150
Table of Contents
| 10.8.2 | Term Note made by CHP Partners, LP in the principal amount of $32,407.407 in favor of KeyBank National Association, dated December 19, 2014 (Previously filed as Exhibit 10.1 to the Current Report on Form 8-K filed December 29, 2014 and incorporated herein by reference.) | |
| 10.8.3 | Guaranty Agreement among the Guarantors and the Lenders referred to in the Credit Agreement, dated December 19, 2014 (Previously filed as Exhibit 10.1 to the Current Report on Form 8-K filed December 29, 2014 and incorporated herein by reference.) | |
| 10.9 | Purchase and Sale Agreement dated as of August 21, 2013 by and between Vancouver Bridgewood, LLC, as Seller, and CHP Partners, LP, as Purchaser (Previously filed as Exhibit 10.1 to the Current Report on Form 8-K filed August 27, 2013 and incorporated herein by reference.) | |
| 10.10 | Promissory Note dated February 3, 2014, made by CHP Auburn Owner, LLC and CHP Auburn WA Tenant Corp. to The Prudential Insurance Company of America in the principal amount of $11,018,192.00 (Previously filed as Exhibit 10.4 to the Current Report on Form 8-K filed January 7, 2014 and incorporated herein by reference.) | |
| 10.11 | Deed of Trust, Security Agreement and Fixture filing (Auburn – First) dated February 3, 2014, by CHP Auburn Owner, LLC and CHP Auburn WA Tenant Corp. to First American Title Insurance Company for the benefit of The Prudential Insurance Company of America (Previously filed as Exhibit 10.5 to the Current Report on Form 8-K filed January 7, 2014 and incorporated herein by reference.) | |
| 10.12 | Deed of Trust, Security Agreement and Fixture filing (Auburn – Second) dated February 3, 2014, by CHP Auburn Owner, LLC and CHP Auburn WA Tenant Corp. to First American Title Insurance Company for the benefit of The Prudential Insurance Company of America (Previously filed as Exhibit 10.6 to the Current Report on Form 8-K filed January 7, 2014 and incorporated herein by reference.) | |
| 10.13 | Recourse Liabilities Guaranty executed February 3, 2014, by CNL Healthcare Properties, Inc. to The Prudential Insurance Company of America relating to the indebtedness of CHP Auburn Owner, LLC and CHP Auburn WA Tenant Corp. (Previously filed as Exhibit 10.7 to the Current Report on Form 8-K filed January 7, 2014 and incorporated herein by reference.) | |
| 10.14 | Supplemental Guaranty executed February 3, 2014, by CHP Auburn Owner, LLC and CHP Auburn WA Tenant Corp. to The Prudential Insurance Company of America (Previously filed as Exhibit 10.8 to the Current Report on Form 8-K filed January 7, 2014 and incorporated herein by reference.) | |
| 10.15 | Purchase and Sale Agreement dated October 7, 2013 among Midland Care Group, LP, Cedar Park AL Group, LP, Bryan AL Investors, LP, Bryan Senior Investors, LP, Mansfield AL Group, LP, Waterview at Mansfield Investors, L.P., Plainfield Care Group, LLC, San Angelo Care Group, LP and CHP Partners, LP (Previously filed as Exhibit 10.1 to the Current Report on Form 8-K filed October 11, 2013 and incorporated herein by reference.) | |
| 10.16 | First Amendment to Purchase and Sale Agreement dated November 11, 2013 but retroactively effective as of November 6, 2013, among Midland Care Group LP, Cedar Park AL Group, LP, Bryan AL Investors, LP, Bryan Senior Investors, LP, Mansfield AL Group, LP, Waterview at Mansfield Investors, L.P., Plainfield Care Group, LLC, San Angelo Care Group, LP and CHP Partners, LP (Previously filed as Exhibit 10.1 to the Current Report on Form 8-K filed November 15, 2013 and incorporated herein by reference.) | |
151
Table of Contents
| 10.17 | Second Amendment to Purchase and Sale Agreement dated as of November 21, 2013, made by and between Midland Care Group, LP, Cedar Park AL Group, LP, Bryan AL Investors, LP, Bryan Senior Investors, LP, Mansfield AL Group, LP, Waterview at Mansfield Investors, L.P., Plainfield Care Group, LLC, San Angelo Care Group, LP and CHP Partners, LP (Previously filed as Exhibit 10.2 to the Current Report on Form 8-K filed March 6, 2014 and incorporated herein by reference.) | |
| 10.18 | Assignment and Assumption of Purchase and Sale Agreement Bonaventure of Billings dated December 2, 2013, by and between CHP Partners, LP and CHP Billings MT Owner, LLC (Previously filed as Exhibit 10.1 to the Current Report on Form 8-K filed December 6, 2013 and incorporated herein by reference.) | |
| 10.19 | Management Agreement dated December 2, 2013, between MorningStar Senior Management, LLC and CHP Billings MT Tenant Corp. (Previously filed as Exhibit 10.2 to the Current Report on Form 8-K filed December 6, 2013 and incorporated herein by reference.) | |
| 10.20 | Management Services Agreement dated December 1, 2013, by and between CHP Beaverton OR Tenant Corp. and Prestige Senior Living, LLC (Previously filed as Exhibit 10.3 to the Current Report on Form 8-K filed December 6, 2013 and incorporated herein by reference.) | |
| 10.21 | Promissory Note dated December 2, 2013, made by CHP Gresham-Huntington Terrace OR Owner, LLC and CHP Gresham-Huntington Terrace OR Tenant Corp. to The Prudential Insurance Company of America in the principal amount of $10,728,555.00 (Previously filed as Exhibit 10.4 to the Current Report on Form 8-K filed December 6, 2013 and incorporated herein by reference.) | |
| 10.22 | Deed of Trust, Security Agreement and Fixture filing (Huntington Terrace – First) dated December 2, 2013, by CHP Gresham-Huntington Terrace OR Owner, LLC and CHP Gresham-Huntington Terrace OR Tenant Corp., to First American Title Insurance Company for the benefit of The Prudential Insurance Company of America (Previously filed as Exhibit 10.6 to the Current Report on Form 8-K filed December 6, 2013 and incorporated herein by reference.) | |
| 10.23 | Deed of Trust, Security Agreement and Fixture filing (Huntington Terrace – Second) dated December 2, 2013, by CHP Gresham-Huntington Terrace OR Owner, LLC and CHP Gresham-Huntington Terrace OR Tenant Corp., to First American Title Insurance Company for the benefit of The Prudential Insurance Company of America (Previously filed as Exhibit 10.7 to the Current Report on Form 8-K filed December 6, 2013 and incorporated herein by reference.) | |
| 10.24 | Recourse Liabilities Guaranty executed December 2, 2013, by CNL Healthcare Properties, Inc. to The Prudential Insurance Company of America relating to the indebtedness of CHP Gresham-Huntington Terrace OR Owner, LLC and CHP Gresham-Huntington Terrace OR Tenant Corp. (Previously filed as Exhibit 10.8 to the Current Report on Form 8-K filed December 6, 2013 and incorporated herein by reference.) | |
| 10.25 | Supplemental Guaranty executed December 2, 2013, by CHP Gresham-Huntington Terrace OR Owner, LLC and CHP Gresham-Huntington Terrace OR Tenant Corp. to The Prudential Insurance Company of America (Previously filed as Exhibit 10.9 to the Current Report on Form 8-K filed December 6, 2013 and incorporated herein by reference.) | |
| 10.26 | Assignment and Assumption of Purchase and Sale Agreement Auburn dated February 1, 2014, by and between CHP Partners, LP and CHP Auburn Owner, LLC (Previously filed as Exhibit 10.1 to the Current Report on Form 8-K filed January 7, 2014 and incorporated herein by reference.) | |
| 10.27 | Management Services Agreement dated February 1, 2014, between Prestige Senior Living, L.L.C. and CHP Auburn WA Tenant Corp. (Previously filed as Exhibit 10.2 to the Current Report on Form 8-K filed January 7, 2014 and incorporated herein by reference.) | |
152
Table of Contents
| 10.28 | Assignment of Purchase Agreement (Cedar Ridge) made as of February 27, 2014, by and among CHP Partners, LP, CHP Isle at Cedar Ridge TX Owner, LLC and CHP Isle at Cedar Ridge TX Tenant Corp. (Previously filed as Exhibit 10.3 to the Current Report on Form 8-K filed March 6, 2014 and incorporated herein by reference.) | |
| 10.29 | Deed of Trust, Assignment of Rents, Security Agreement and Fixture filing dated as of February 28, 2014, made by CHP Isle at Cedar Ridge TX Owner, LLC to Deborah Newman for the benefit of KeyBank National Association (Previously filed as Exhibit 10.6 to the Current Report on Form 8-K filed March 6, 2014 and incorporated herein by reference.) | |
| 10.30 | Guaranty Agreement dated as of February 28, 2014, made by CHP Isle at Cedar Ridge TX Owner, LLC in favor of the lenders referenced in the Credit Agreement. (Previously filed as Exhibit 10.5 to the Current Report on Form 8-K filed March 6, 2014 and incorporated herein by reference.) | |
| 10.31 | Assignment and Assumption of Purchase and Sale Agreement dated January 14, 2014, by and between CHP Partners, LP and CHP West Hills OR Owner, LLC (Previously filed as Exhibit 10.1 to the Current Report on Form 8-K filed March 7, 2014 and incorporated herein by reference.) | |
| 10.32 | Management Services Agreement dated February 28, 2014, by and between Jerry Erwin Associates, Inc. (d/b/a JEA Senior Living) and CHP Isle at Cedar Ridge TX Tenant Corp. (Previously filed as Exhibit 10.4 to the Current Report on Form 8-K filed March 6, 2014 and incorporated herein by reference.) | |
| 10.33 | Management Services Agreement dated March 1, 2014, by and between Prestige Senior Living, L.L.C. and CHP Corvallis-West Hills OR Tenant Corp. (Previously filed as Exhibit 10.2 to the Current Report on Form 8-K filed March 7, 2014 and incorporated herein by reference.) | |
| 10.34 | Second Amended and Restated Loan Agreement dated as of March 3, 2014, among CHP Gresham-Huntington Terrace OR Owner, LLC, CHP Gresham-Huntington Terrace OR Tenant Corp., CHP Tualatin-Riverwood OR Owner, LLC, CHP Tualatin-Riverwood OR Tenant Corp., CHP Beaverton OR Owner, LLC, CHP Beaverton OR Tenant Corp, CHP Salem-Orchard Heights OR Owner, LLC, CHP Salem-Orchard Heights OR Tenant Corp., CHP Salem-Southern Hills OR Owner, LLC, CHP Salem-Southern Hills OR Tenant Corp, CHP Medford-Arbor Place OR Owner, LLC, CHP Medford-Arbor Place OR Tenant Corp., CHP Bend-High Desert OR Owner, LLC, CHP Bend-High Desert OR Tenant Corp., CHP Tillamook-Five Rivers OR Owner, LLC, CHP Tillamook-Five Rivers OR Tenant Corp., CHP Billings MT Owner, LLC, CHP Billings MT Tenant Corp., CHP Idaho Falls ID Owner, LLC, CHP Idaho Falls ID Tenant Corp., CHP Boise ID Owner, LLC, CHP Boise ID Tenant Corp., CHP Sparks NV Owner, LLC, CHP Sparks NV Tenant Corp., CHP Vancouver-Bridgewood WA Owner, LLC, CHP Vancouver-Bridgewood WA Tenant Corp., CHP Auburn WA Owner, LLC, CHP Auburn WA Tenant Corp., CHP Yelm-Rosemont WA Owner, LLC, and CHP Yel-Rosemont WA Tenant Corp., CHP Longview-Monticello Park WA Owner, LLC, CHP Longview-Monticello Park WA Tenant Corp., CHP Corvallis-West Hills OR Owner, LLC, CHP Corvallis-West Hills OR Tenant Corp. and The Prudential Insurance Company of America (Previously filed as Exhibit 10.3 to the Current Report on Form 8-K filed March 7, 2014 and incorporated herein by reference.) | |
| 10.35 | Promissory Note dated March 3, 2014, made by CHP Corvallis-West Hills OR Owner, LLC and CHP Corvallis-West Hills OR Tenant Corp. to The Prudential Insurance Company of America in the principal amount of $9,187,000.00 (Previously filed as Exhibit 10.4 to the Current Report on Form 8-K filed March 7, 2014 and incorporated herein by reference.) | |
153
Table of Contents
| 10.36 | Deed of Trust, Security Agreement and Fixture filing (West Hills – First) dated March 3, 2014, by CHP Corvallis-West Hills OR Owner, LLC and CHP Corvallis-West Hills OR Tenant Corp. to First American Title Insurance Company for the benefit of The Prudential Insurance Company of America (Previously filed as Exhibit 10.5 to the Current Report on Form 8-K filed March 7, 2014 and incorporated herein by reference.) | |
| 10.37 | Deed of Trust, Security Agreement and Fixture filing (West Hills – Second) dated March 3, 2014, by CHP Corvallis-West Hills OR, LLC and CHP Corvallis-West Hills OR Tenant Corp. to First American Title Insurance Company for the benefit of The Prudential Insurance Company of America (Previously filed as Exhibit 10.6 to the Current Report on Form 8-K filed March 7, 2014 and incorporated herein by reference.) | |
| 10.38 | Recourse Liabilities Guaranty executed March 3, 2014, by CNL Healthcare Properties, Inc. to The Prudential Insurance Company of America relating to the indebtedness of CHP Corvallis-West Hills OR Owner, LLC and CHP Corvallis-West Hills OR Tenant Corp. (Previously filed as Exhibit 10.7 to the Current Report on Form 8-K filed March 7, 2014 and incorporated herein by reference.) | |
| 10.39 | Supplemental Guaranty executed March 3, 2014, by CHP Corvallis-West Hills OR Owner, LLC and CHP Corvallis-West Hills OR Tenant Corp. to The Prudential Insurance Company of America (Previously filed as Exhibit 10.8 to the Current Report on Form 8-K filed March 7, 2014 and incorporated herein by reference.) | |
| 10.40 | Management Services Agreement dated as of March 28, 2014, by and between CHP Legacy Ranch TX Tenant Corp. and Jerry Erwin Associates, Inc. (d/b/a JEA Senior Living) (Previously filed as Exhibit 10.1 to the Current Report on Form 8-K filed April 3, 2014 and incorporated herein by reference.) | |
| 10.41 | Guaranty Agreement dated as of March 28, 2014, made by CHP Legacy Ranch TX Owner, LLC, CHP Springs TX Owner, LLC and CHP Park at Plainfield IL Owner, LLC in favor of the lenders referred to in the Credit Agreement (Previously filed as Exhibit 10.2 to the Current Report on Form 8-K filed April 3, 2014 and incorporated herein by reference.) | |
| 10.42 | Deed of Trust, Assignment of Rents, Security Agreement and Fixture filing dated as of March 28, 2014, made by CHP Legacy Ranch TX Owner, LLC to Deborah Newman for the benefit of KeyBank National Association (Previously filed as Exhibit 10.3 to the Current Report on Form 8-K filed April 3, 2014 and incorporated herein by reference.) | |
| 10.43 | Management Services Agreement dated April 21, 2014, by and between CHP Watercrest at Bryan TX Tenant Corp. and RES ICD Management L.P. (Previously filed as Exhibit 10.1 to the Current Report on Form 8-K filed April 22, 2014 and incorporated herein by reference.) | |
| 10.44 | Management Services Agreement dated April 21, 2014, by and between CHP Isle at Watercrest-Bryan TX Tenant Corp. and Jerry Erwin Associates, Inc. (Previously filed as Exhibit 10.2 to the Current Report on Form 8-K filed April 22, 2014 and incorporated herein by reference.) | |
| 10.45 | Guaranty Agreement dated as of April 21, 2014, made by CHP Watercrest at Bryan TX Owner, LLC and CHP Isle at Watercrest-Bryan Owner, LLC in favor of Lenders (Previously filed as Exhibit 10.3 to the Current Report on Form 8-K filed April 22, 2014 and incorporated herein by reference.) | |
154
Table of Contents
| 10.46 | Deed of Trust, Assignment of Rents, Security Agreement and Fixture Filing dated as of April 21, 2014, made by CHP Watercrest at Bryan TX Owner, LLC in favor of Deborah Newman, for the benefit of KeyBank National Association (Previously filed as Exhibit 10.4 to the Current Report on Form 8-K filed April 22, 2014 and incorporated herein by reference.) | |
| 10.47 | Deed of Trust, Assignment of Rents, Security Agreement and Fixture Filing dated as of April 21, 2014, made by CHP Isle at Watercrest-Bryan TX Owner, LLC in favor of Deborah Newman, for the benefit of KeyBank National Association (Previously filed as Exhibit 10.5 to the Current Report on Form 8-K filed April 22, 2014 and incorporated herein by reference.) | |
| 10.48 | Management Services Agreement made as of May 5, 2014, by and between CHP Isle at Watercrest-Mansfield TX Tenant Corp. and Integrated Senior Living, LLC (Previously filed as Exhibit 10.1 to the Current Report on Form 8-K filed May 8, 2014 and incorporated herein by reference.) | |
| 10.49 | Guaranty Agreement dated as of May 5, 2014, made by CHP Isle at Watercrest-Mansfield TX Owner, LLC in favor of the Lenders (Previously filed as Exhibit 10.2 to the Current Report on Form 8-K filed May 8, 2014 and incorporated herein by reference.) | |
| 10.50 | Deed of Trust, Assignment of Rents, Security Agreement and Fixture Filing dated as of May 5, 2014, by CHP Isle at Watercrest-Mansfield TX Owner, LLC in favor of Debora Newman, for the benefit of KeyBank National Association (Previously filed as Exhibit 10.3 to the Current Report on Form 8-K filed May 8, 2014 and incorporated herein by reference.) | |
| 10.51 | Management Services Agreement dated as of June 30 2014, by and between CHP Watercrest at Mansfield TX Tenant Corp. and RES ICD Management, L.P. (Previously filed as Exhibit 10.1 to the Current Report on Form 8-K filed July 7, 2014 and incorporated herein by reference.) | |
| 10.52 | Guaranty effective as of June 30, 2014, made by CNL Healthcare Properties, Inc. for the benefit of U.S. Bank National Association, as Trustee (Previously filed as Exhibit 10.2 to the Current Report on Form 8-K filed July 7, 2014 and incorporated herein by reference.) | |
| 10.53 | Assumption Agreement effective as of June 30, 2014 by and among Waterview at Mansfield Investors, L.P., CHP Watercrest at Mansfield TX Owner, LLC and U.S. Bank National Association, as Trustee (Previously filed as Exhibit 10.3 to the Current Report on Form 8-K filed July 7, 2014 and incorporated herein by reference.) | |
| 10.54 | Amendment to Multifamily Loan and Security Agreement dated as of June 30, 2014 by and between CHP Watercrest at Mansfield TX Owner, LLC and U.S. Bank National Association, as Trustee (Previously filed as Exhibit 10.4 to the Current Report on Form 8-K filed July 7, 2014 and incorporated herein by reference.) | |
| 10.55 | Amendment to Multifamily Note dated as of June 30, 2014 by and between CHP Watercrest at Mansfield TX Owner, LLC and U.S. Bank National Association, as Trustee (Previously filed as Exhibit 10.5 to the Current Report on Form 8-K filed July 7, 2014 and incorporated herein by reference.) | |
| 10.56 | Purchase and Sale Agreement made and entered into as of September 18, 2014 by and among 330 Physicians Center LP, CHP Partners, LP and First American Title Insurance Company (Previously filed as Exhibit 10.1 to the Current Report on Form 8-K filed September 24, 2014 and incorporated herein by reference.) | |
155
Table of Contents
| 10.57 | Purchase and Sale Agreement made and entered into as of September 18, 2014 by and among MedWest Outpatient Center LP, CHP Partners, LP and First American Title Insurance Company (Previously filed as Exhibit 10.2 to the Current Report on Form 8-K filed September 24, 2014 and incorporated herein by reference.) | |
| 10.58 | Schedule of Omitted Documents (Filed herewith.) | |
| 21.1 | Subsidiaries of the Registrant (Filed herewith.) | |
| 31.1 | Certification of Chief Executive Officer of CNL Healthcare Properties, Inc., formerly known as CNL Healthcare Trust, Inc. and CNL Properties Trust, Inc., Pursuant to Rule 13a-14(a), as Adopted Pursuant to Section 302 of the Sarbanes-Oxley Act of 2002. (Filed herewith.) | |
| 31.2 | Certification of Chief Financial Officer of CNL Healthcare Properties, Inc., formerly known as CNL Healthcare Trust, Inc. and CNL Properties Trust, Inc., Pursuant to Rule 13a-14(a), as Adopted Pursuant to Section 302 of the Sarbanes-Oxley Act of 2002. (Filed herewith.) | |
| 32.1 | Certification of Chief Executive Officer and Chief Financial Officer of CNL Healthcare Properties, Inc., formerly known as CNL Healthcare Trust, Inc. and CNL Properties Trust, Inc., Pursuant to 18 U.S.C. Section 1350, as Adopted Pursuant to Section 906 of the Sarbanes-Oxley Act of 2002. (Filed herewith.) | |
| 101 | The following materials from CNL Healthcare Properties, Inc., formerly known as CNL Properties Trust, Inc., Annual Report on Form 10-K for the year ended December 31, 2014, formatted in XBRL (Extensible Business Reporting Language); (i) Consolidated Balance Sheets, Consolidated Statements of Operations, Consolidated Statements of Comprehensive Loss, Consolidated Statements of Stockholders’ Equity and Redeemable Noncontrolling Interest, Consolidated Statements of Cash Flows and (ii) Notes to the Consolidated Financial Statements. | |
156
Table of Contents
Pursuant to the requirements of the Securities Exchange Act of 1934, the registrant has duly caused this report to be signed on its behalf by the undersigned thereunto duly authorized, on the 27th day of March 2015.
| CNL HEALTHCARE PROPERTIES, INC. | ||
| By: | /s/ Stephen H. Mauldin | |
| STEPHEN H. MAULDIN | ||
| Chief Executive Officer | ||
| (Principal Executive Officer) | ||
| By: | /s/ Joseph T. Johnson | |
| JOSEPH T. JOHNSON | ||
| Senior Vice President, Chief Financial Officer and Treasurer | ||
| (Principal Financial Officer) | ||
157
Table of Contents
Pursuant to the requirements of the Securities Exchange Act of 1934, this report has been signed below by the following persons on behalf of the Registrant and in the capacities and on the dates indicated.
| Signature |
Title |
Date | ||
| /s/ James M. Seneff, Jr. |
Chairman of the Board | March 27, 2015 | ||
| JAMES M. SENEFF, JR. | ||||
| /s/ Thomas K. Sittema |
Vice Chairman of the Board | March 27, 2015 | ||
| THOMAS K. SITTEMA | ||||
| /s/ Michael P. Haggerty |
Independent Director | March 27, 2015 | ||
| MICHAEL P. HAGGERTY | ||||
| /s/ J. Douglas Holladay |
Independent Director | March 27, 2015 | ||
| J. DOUGLAS HOLLADAY | ||||
| /s/ J. Chandler Martin |
Independent Director | March 27, 2015 | ||
| J. CHANDLER MARTIN | ||||
| /s/ Stephen H. Mauldin |
Chief Executive Officer | March 27, 2015 | ||
| STEPHEN H. MAULDIN | (Principal Executive Officer) | |||
| /s/ Joseph T. Johnson |
Senior Vice President and | March 27, 2015 | ||
| JOSEPH T. JOHNSON | Chief Financial Officer (Principal Financial Officer) |
|||
| /s/ Ixchell C. Duarte |
Senior Vice President and | March 27, 2015 | ||
| IXCHELL C. DUARTE | Chief Accounting Officer (Principal Accounting Officer) |
|||
Supplemental Information to be Furnished With Reports Filed Pursuant to Section 15(d) of the Act by Registrants Which Have Not Registered Securities Pursuant to Section 12 of the Act
As of the date of this report, we have not sent any annual reports or proxy materials to our stockholders. We intend to deliver (i) our annual report to stockholders, prepared pursuant to Rule 14a-3 for the fiscal year ended December 31, 2014 (the “Annual Report”) and (ii) our Definitive Proxy Statement and related proxy materials for our 2015 Annual Meeting (collectively the “Proxy Materials”) to our stockholders subsequent to the filing of this report. We will furnish copies of the Annual Report and the Proxy Materials to the SEC when we deliver such materials to our stockholders.
158
Table of Contents
CNL HEALTHCARE PROPERTIES, INC. AND SUBSIDIARIES
SCHEDULE II – VALUATION AND QUALIFYING ACCOUNTS
YEARS ENDED DECEMBER 31, 2014, 2013 AND 2012 (in thousands)
| Year |
Description |
Balance at Beginning of Year |
Charged to Costs and Expenses |
Charged to Other Accounts |
Balance at End of Year |
|||||||||||||
| 2012 |
Deferred tax asset valuation allowance | $ | — | $ | — | $ | — | $ | — | |||||||||
|
|
|
|
|
|
|
|
|
|
||||||||||
| $ | — | $ | — | $ | — | $ | — | |||||||||||
|
|
|
|
|
|
|
|
|
|||||||||||
| 2013 |
Deferred tax asset valuation allowance | $ | — | $ | (597 | ) | $ | — | $ | (597 | ) | |||||||
|
|
|
|
|
|
|
|
|
|
||||||||||
| $ | — | $ | (597 | ) | $ | — | $ | (597 | ) | |||||||||
|
|
|
|
|
|
|
|
|
|||||||||||
| 2014 |
Deferred tax asset valuation allowance | $ | (597 | ) | $ | (2,201 | ) | $ | — | $ | (2,798 | ) | ||||||
|
|
|
|
|
|
|
|
|
|
||||||||||
| $ | (597 | ) | $ | (2,201 | ) | $ | — | $ | (2,798 | ) | ||||||||
|
|
|
|
|
|
|
|
|
|||||||||||
159
Table of Contents
CNL HEALTHCARE PROPERTIES, INC. AND SUBSIDIARIES
SCHEDULE III – REAL ESTATE AND ACCUMULATED DEPRECIATION
AS OF DECEMBER 31, 2014 (in thousands)
| Initial Costs | Costs Capitalized Subsequent to Acquisition |
Gross Amounts at which Carried at Close of Period (2) |
||||||||||||||||||||||||||||||||||||||||||||||||
| Property/Location |
Encum- brances |
Land & Land Improve- ments |
Building and Building Improve- ments |
Land & Land Improve- ments |
Building and Building Improve- ments |
Construc- tion in Process |
Land & Land Improve- ments |
Building and Building Improve- ments |
Construc- tion in Process |
Total | Accumu- lated Depreci- ation |
Date of Construction |
Date Acquired |
Life on which depreciation in latest income statement is computed | ||||||||||||||||||||||||||||||||||||
| Primrose Retirement Community of Casper |
||||||||||||||||||||||||||||||||||||||||||||||||||
| Casper, Wyoming |
$ | 12,265 | $ | 1,910 | $ | 16,310 | $ | — | $ | 9 | $ | — | $ | 1,910 | $ | 16,319 | $ | — | $ | 18,229 | $ | (1,222 | ) | 2004 | 2/16/2012 | (1) | ||||||||||||||||||||||||
| Primrose Retirement Community of Grand Island |
||||||||||||||||||||||||||||||||||||||||||||||||||
| Grand Island, Nebraska |
$ | 8,653 | $ | 719 | $ | 12,140 | $ | 25 | $ | — | $ | — | $ | 744 | $ | 12,140 | $ | — | $ | 12,884 | $ | (947 | ) | 2005 | 2/16/2012 | (1) | ||||||||||||||||||||||||
| Primrose Retirement Community of Mansfield |
||||||||||||||||||||||||||||||||||||||||||||||||||
| Mansfield, Ohio |
$ | 11,772 | $ | 650 | $ | 16,720 | $ | 11 | $ | 6 | $ | — | $ | 661 | $ | 16,726 | $ | — | $ | 17,387 | $ | (1,292 | ) | 2007 | 2/16/2012 | (1) | ||||||||||||||||||||||||
| Primrose Retirement Community of Marion |
||||||||||||||||||||||||||||||||||||||||||||||||||
| Marion, Ohio |
$ | 9,765 | $ | 889 | $ | 16,305 | $ | — | $ | — | $ | — | $ | 889 | $ | 16,305 | $ | — | $ | 17,194 | $ | (1,260 | ) | 2006 | 2/16/2012 | (1) | ||||||||||||||||||||||||
| Sweetwater Retirement Community |
||||||||||||||||||||||||||||||||||||||||||||||||||
| Billings, Montana |
$ | 10,605 | $ | 1,578 | $ | 14,205 | $ | 17 | $ | — | $ | — | $ | 1,595 | $ | 14,205 | $ | — | $ | 15,800 | $ | (1,071 | ) | 2006 | 2/16/2012 | (1) | ||||||||||||||||||||||||
| HarborChase of Villages Crossing |
||||||||||||||||||||||||||||||||||||||||||||||||||
| Lady Lake, Florida (“The Villages”) |
$ | 16,590 | $ | 2,165 | $ | — | $ | 986 | $ | 15,424 | $ | — | $ | 3,151 | $ | 15,424 | $ | — | $ | 18,575 | $ | (421 | ) | 2013 | 8/29/2012 | (1) | ||||||||||||||||||||||||
| Dogwood Forest of Acworth |
||||||||||||||||||||||||||||||||||||||||||||||||||
| Acworth, Georgia |
$ | 12,039 | $ | 1,750 | $ | — | $ | 277 | $ | 15,994 | $ | — | $ | 2,027 | $ | 15,994 | $ | — | $ | 18,021 | $ | (206 | ) | (3) | 12/18/2012 | (1) | ||||||||||||||||||||||||
| Primrose Retirement Community Cottages |
||||||||||||||||||||||||||||||||||||||||||||||||||
| Aberdeen, South Dakota |
$ | — | $ | 311 | $ | 3,794 | $ | — | $ | — | $ | — | $ | 311 | $ | 3,794 | $ | — | $ | 4,105 | $ | (210 | ) | 2005 | 12/19/2012 | (1) | ||||||||||||||||||||||||
| Primrose Retirement Community of Council Bluffs |
||||||||||||||||||||||||||||||||||||||||||||||||||
| Council Bluffs, Iowa (“Omaha”) |
$ | — | $ | 1,144 | $ | 11,117 | $ | — | $ | — | $ | — | $ | 1,144 | $ | 11,117 | $ | — | $ | 12,261 | $ | (634 | ) | 2008 | 12/19/2012 | (1) | ||||||||||||||||||||||||
| Primrose Retirement Community of Decatur |
||||||||||||||||||||||||||||||||||||||||||||||||||
| Decatur, Illinois |
$ | 10,765 | $ | 513 | $ | 16,706 | $ | — | $ | — | $ | — | $ | 513 | $ | 16,706 | $ | — | $ | 17,219 | $ | (906 | ) | 2009 | 12/19/2012 | (1) | ||||||||||||||||||||||||
| Primrose Retirement Community of Lima |
||||||||||||||||||||||||||||||||||||||||||||||||||
| Lima, Ohio |
$ | — | $ | 944 | $ | 17,115 | $ | — | $ | — | $ | — | $ | 944 | $ | 17,115 | $ | — | $ | 18,059 | $ | (931 | ) | 2006 | 12/19/2012 | (1) | ||||||||||||||||||||||||
| Primrose Retirement Community of Zanesville |
||||||||||||||||||||||||||||||||||||||||||||||||||
| Zanesville, Ohio |
$ | 12,149 | $ | 1,184 | $ | 17,292 | $ | — | $ | — | $ | — | $ | 1,184 | $ | 17,292 | $ | — | $ | 18,476 | $ | (941 | ) | 2008 | 12/19/2012 | (1) | ||||||||||||||||||||||||
| Symphony Manor |
||||||||||||||||||||||||||||||||||||||||||||||||||
| Baltimore, Maryland |
$ | 13,632 | $ | 2,319 | $ | 19,444 | $ | — | $ | — | $ | — | $ | 2,319 | $ | 19,444 | $ | — | $ | 21,763 | $ | (1,039 | ) | 2011 | 12/21/2012 | (1) | ||||||||||||||||||||||||
| Curry House Assisted Living & Memory Care |
||||||||||||||||||||||||||||||||||||||||||||||||||
| Cadillac, Michigan |
$ | 7,013 | $ | 995 | $ | 11,072 | $ | — | $ | — | $ | — | $ | 995 | $ | 11,072 | $ | — | $ | 12,067 | $ | (601 | ) | 1966 | 12/21/2012 | (1) | ||||||||||||||||||||||||
| Tranquillity at Fredericktowne |
||||||||||||||||||||||||||||||||||||||||||||||||||
| Frederick, Maryland |
$ | 7,234 | $ | 808 | $ | 14,291 | $ | — | $ | 29 | $ | — | $ | 808 | $ | 14,320 | $ | — | $ | 15,128 | $ | (764 | ) | 2000 | 12/21/2012 | (1) | ||||||||||||||||||||||||
| Brookridge Heights Assisted Living & Memory Care |
||||||||||||||||||||||||||||||||||||||||||||||||||
| Marquette, Michigan |
$ | 7,394 | $ | 595 | $ | 11,339 | $ | — | $ | — | $ | — | $ | 595 | $ | 11,339 | $ | — | $ | 11,934 | $ | (605 | ) | 1998 | 12/21/2012 | (1) | ||||||||||||||||||||||||
| Woodholme Gardens Assisted Living & Memory Care |
||||||||||||||||||||||||||||||||||||||||||||||||||
| Pikesville, Maryland (“Baltimore”) |
$ | 8,409 | $ | 1,603 | $ | 13,472 | $ | — | $ | — | $ | — | $ | 1,603 | $ | 13,472 | $ | — | $ | 15,075 | $ | (728 | ) | 2010 | 12/21/2012 | (1) | ||||||||||||||||||||||||
| Batesville Healthcare Center |
||||||||||||||||||||||||||||||||||||||||||||||||||
| Batesville, Arkansas |
$ | 3,300 | $ | 397 | $ | 5,382 | $ | — | $ | — | $ | — | $ | 397 | $ | 5,382 | $ | — | $ | 5,779 | $ | (222 | ) | 1975 | 5/31/2013 | (1) | ||||||||||||||||||||||||
| Broadway Healthcare Center |
||||||||||||||||||||||||||||||||||||||||||||||||||
| West Memphis, Arkansas |
$ | 6,300 | $ | 438 | $ | 10,560 | $ | — | $ | — | $ | — | $ | 438 | $ | 10,560 | $ | — | $ | 10,998 | $ | (436 | ) | 1994 | 5/31/2013 | (1) | ||||||||||||||||||||||||
160
Table of Contents
CNL HEALTHCARE PROPERTIES, INC. AND SUBSIDIARIES
SCHEDULE III — REAL ESTATE AND ACCUMULATED DEPRECIATION
AS OF DECEMBER 31, 2014 (in thousands)
| Initial Costs | Costs Capitalized Subsequent to Acquisition |
Gross Amounts at which Carried at Close of Period (2) |
||||||||||||||||||||||||||||||||||||||||||||||||
| Property/ |
Encum- brances |
Land & Land Improve- ments |
Building and Building Improve- ments |
Land & Land Improve- ments |
Building and Building Improve- ments |
Construc- tion in Process |
Land & Land Improve- ments |
Building and Building Improve- ments |
Construc- tion in Process |
Total | Accumu- lated Depreci- ation |
Date of Construction |
Date Acquired |
Life on which depreciation in latest income statement is computed | ||||||||||||||||||||||||||||||||||||
| Jonesboro Healthcare Center |
||||||||||||||||||||||||||||||||||||||||||||||||||
| Jonesboro, Arkansas |
$ | 8,100 | $ | 527 | $ | 13,493 | $ | — | $ | — | $ | — | $ | 527 | $ | 13,493 | $ | — | $ | 14,020 | $ | (556 | ) | 2012 | 5/31/2013 | (1) | ||||||||||||||||||||||||
| Magnolia Healthcare Center |
||||||||||||||||||||||||||||||||||||||||||||||||||
| Magnolia, Arkansas |
$ | 6,300 | $ | 421 | $ | 10,454 | $ | — | $ | — | $ | — | $ | 421 | $ | 10,454 | $ | — | $ | 10,875 | $ | (438 | ) | 2009 | 5/31/2013 | (1) | ||||||||||||||||||||||||
| Mine Creek Healthcare Center |
||||||||||||||||||||||||||||||||||||||||||||||||||
| Nashville, Arkansas |
$ | 1,800 | $ | 135 | $ | 2,942 | $ | — | $ | — | $ | — | $ | 135 | $ | 2,942 | $ | — | $ | 3,077 | $ | (127 | ) | 1978 | 5/31/2013 | (1) | ||||||||||||||||||||||||
| Searcy Healthcare Center |
||||||||||||||||||||||||||||||||||||||||||||||||||
| Searcy, Arkansas |
$ | 4,200 | $ | 648 | $ | 6,017 | $ | — | $ | — | $ | — | $ | 648 | $ | 6,017 | $ | — | $ | 6,665 | $ | (254 | ) | 1973 | 5/31/2013 | (1) | ||||||||||||||||||||||||
| LaPorte Cancer Center |
||||||||||||||||||||||||||||||||||||||||||||||||||
| Westville, Indiana |
$ | 8,221 | $ | 433 | $ | 10,846 | $ | — | $ | — | $ | — | $ | 433 | $ | 10,846 | $ | — | $ | 11,279 | $ | (460 | ) | 2010 | 6/14/2013 | (1) | ||||||||||||||||||||||||
| Jefferson Medical Commons |
||||||||||||||||||||||||||||||||||||||||||||||||||
| Jefferson City, Tennessee (“Knoxville”) |
$ | 7,825 | $ | 151 | $ | 10,236 | $ | — | $ | — | $ | — | $ | 151 | $ | 10,236 | $ | — | $ | 10,387 | $ | (409 | ) | 2001 | 7/10/2013 | (1) | ||||||||||||||||||||||||
| Physicians Plaza A at North Knoxville Medical Center |
||||||||||||||||||||||||||||||||||||||||||||||||||
| Powell, Tennessee (“Knoxville”) |
$ | 12,209 | $ | 262 | $ | 16,976 | $ | — | $ | — | $ | — | $ | 262 | $ | 16,976 | $ | — | $ | 17,238 | $ | (679 | ) | 2005 | 7/10/2013 | (1) | ||||||||||||||||||||||||
| Physicians Plaza B at North Knoxville Medical Center |
||||||||||||||||||||||||||||||||||||||||||||||||||
| Powell, Tennessee (“Knoxville”) |
$ | 14,685 | $ | 303 | $ | 18,754 | $ | — | $ | 312 | $ | — | $ | 303 | $ | 19,066 | $ | — | $ | 19,369 | $ | (753 | ) | 2008 | 7/10/2013 | (1) | ||||||||||||||||||||||||
| Physicians Regional Medical Center—Central Wing Annex |
||||||||||||||||||||||||||||||||||||||||||||||||||
| Knoxville, Tennessee |
$ | 3,890 | $ | 73 | $ | 5,285 | $ | — | $ | — | $ | — | $ | 73 | $ | 5,285 | $ | — | $ | 5,358 | $ | (210 | ) | 2004 | 7/10/2013 | (1) | ||||||||||||||||||||||||
| HarborChase of Jasper |
||||||||||||||||||||||||||||||||||||||||||||||||||
| Jasper, Alabama |
$ | — | $ | 355 | $ | 6,358 | $ | — | $ | — | $ | — | $ | 355 | $ | 6,358 | $ | — | $ | 6,713 | $ | (239 | ) | 1998 | 7/31/2013 | (1) | ||||||||||||||||||||||||
| Chestnut Commons Medical Office Building |
||||||||||||||||||||||||||||||||||||||||||||||||||
| Elyria, Ohio (“Cleveland”) |
$ | 12,503 | $ | 2,053 | $ | 15,650 | $ | — | $ | — | $ | — | $ | 2,053 | $ | 15,650 | $ | — | $ | 17,703 | $ | (615 | ) | 2008 | 8/16/2013 | (1) | ||||||||||||||||||||||||
| Doctors Specialty Hospital |
||||||||||||||||||||||||||||||||||||||||||||||||||
| Leawood, Kansas (“Kansas City”) |
$ | 4,385 | $ | 924 | $ | 5,771 | $ | 16 | $ | — | $ | — | $ | 940 | $ | 5,771 | $ | — | $ | 6,711 | $ | (220 | ) | 2001 | 8/16/2013 | (1) | ||||||||||||||||||||||||
| Escondido Medical Arts Center |
||||||||||||||||||||||||||||||||||||||||||||||||||
| Escondido, California (“San Diego”) |
$ | 9,742 | $ | 1,863 | $ | 12,199 | $ | — | $ | 23 | $ | — | $ | 1,863 | $ | 12,222 | $ | — | $ | 14,085 | $ | (430 | ) | 1994 | 8/16/2013 | (1) | ||||||||||||||||||||||||
| John C. Lincoln Medical Office Plaza I |
||||||||||||||||||||||||||||||||||||||||||||||||||
| Phoenix, Arizona |
$ | 2,794 | $ | 233 | $ | 2,779 | $ | — | $ | 13 | $ | — | $ | 233 | $ | 2,792 | $ | — | $ | 3,025 | $ | (116 | ) | 1980 | 8/16/2013 | (1) | ||||||||||||||||||||||||
| John C. Lincoln Medical Office Plaza II |
||||||||||||||||||||||||||||||||||||||||||||||||||
| Phoenix, Arizona |
$ | 1,863 | $ | 138 | $ | 1,908 | $ | — | $ | 49 | $ | — | $ | 138 | $ | 1,957 | $ | — | $ | 2,095 | $ | (77 | ) | 1984 | 8/16/2013 | (1) | ||||||||||||||||||||||||
| North Mountain Medical Plaza |
||||||||||||||||||||||||||||||||||||||||||||||||||
| Phoenix, Arizona |
$ | 3,432 | $ | 297 | $ | 4,079 | $ | — | $ | — | $ | — | $ | 297 | $ | 4,079 | $ | — | $ | 4,376 | $ | (166 | ) | 1994 | 8/16/2013 | (1) | ||||||||||||||||||||||||
| Raider Ranch |
||||||||||||||||||||||||||||||||||||||||||||||||||
| Lubbock, Texas |
$ | 1 | $ | 1,992 | $ | 48,818 | $ | — | $ | 23 | $ | — | $ | 1,992 | $ | 48,841 | $ | — | $ | 50,833 | $ | (1,714 | ) | 2009 | 8/29/2013 | (1) | ||||||||||||||||||||||||
| The Club at Raider Ranch Development |
||||||||||||||||||||||||||||||||||||||||||||||||||
| Lubbock, Texas |
$ | — | $ | 3,000 | $ | — | $ | — | $ | — | $ | 4,001 | $ | 3,000 | $ | — | $ | 4,001 | $ | 7,001 | $ | — | (3) | 8/29/2013 | (1) | |||||||||||||||||||||||||
161
Table of Contents
CNL HEALTHCARE PROPERTIES, INC. AND SUBSIDIARIES
SCHEDULE III — REAL ESTATE AND ACCUMULATED DEPRECIATION
AS OF DECEMBER 31, 2014 (in thousands)
| Initial Costs | Costs Capitalized Subsequent to Acquisition |
Gross Amounts at which Carried at Close of Period (2) |
||||||||||||||||||||||||||||||||||||||||||||||||
| Property/Location |
Encum- brances |
Land & Land Improve- ments |
Building and Building Improve- ments |
Land & Land Improve- ments |
Building and Building Improve- ments |
Construc- tion in Process |
Land & Land Improve- ments |
Building and Building Improve- ments |
Construc- tion in Process |
Total | Accumu- lated Depreci- ation |
Date of Construction |
Date Acquired |
Life on which depreciation in latest income statement is computed | ||||||||||||||||||||||||||||||||||||
| Town Village |
||||||||||||||||||||||||||||||||||||||||||||||||||
| Oklahoma City, Oklahoma |
$ | — | $ | 1,020 | $ | 19,847 | $ | — | $ | — | $ | — | $ | 1,020 | $ | 19,847 | $ | — | $ | 20,867 | $ | (689 | ) | 2004 | 8/29/2013 | (1) | ||||||||||||||||||||||||
| Calvert Medical Arts Center |
||||||||||||||||||||||||||||||||||||||||||||||||||
| Prince Frederick, Maryland (“Washington D.C.”) |
$ | 12,581 | $ | 20 | $ | 17,838 | $ | — | $ | 72 | $ | — | $ | 20 | $ | 17,910 | $ | — | $ | 17,930 | $ | (614 | ) | 2009 | 8/30/2013 | (1) | ||||||||||||||||||||||||
| Calvert Medical Office Buildings I, II & III |
||||||||||||||||||||||||||||||||||||||||||||||||||
| Prince Frederick, Maryland (“Washington D.C.”) |
$ | 10,686 | $ | 51 | $ | 14,334 | $ | — | $ | 273 | $ | — | $ | 51 | $ | 14,607 | $ | — | $ | 14,658 | $ | (502 | ) | 1991/1999/2000 | 8/30/2013 | (1) | ||||||||||||||||||||||||
| Dunkirk Medical Center |
||||||||||||||||||||||||||||||||||||||||||||||||||
| Dunkirk, Maryland (“Washington D.C.”) |
$ | 3,007 | $ | 351 | $ | 2,991 | $ | — | $ | 10 | $ | — | $ | 351 | $ | 3,001 | $ | — | $ | 3,352 | $ | (133 | ) | 1997 | 8/30/2013 | (1) | ||||||||||||||||||||||||
| Prestige Senior Living Beaverton Hills |
||||||||||||||||||||||||||||||||||||||||||||||||||
| Beaverton, Oregon (“Portland”) |
$ | 9,465 | $ | 1,387 | $ | 10,324 | $ | — | $ | — | $ | — | $ | 1,387 | $ | 10,324 | $ | — | $ | 11,711 | $ | (301 | ) | 2000 | 12/2/2013 | (1) | ||||||||||||||||||||||||
| Prestige Senior Living High Desert |
||||||||||||||||||||||||||||||||||||||||||||||||||
| Bend, Oregon |
$ | 8,188 | $ | 835 | $ | 11,252 | $ | — | $ | — | $ | — | $ | 835 | $ | 11,252 | $ | — | $ | 12,087 | $ | (341 | ) | 2003 | 12/2/2013 | (1) | ||||||||||||||||||||||||
| MorningStar of Billings |
||||||||||||||||||||||||||||||||||||||||||||||||||
| Billings, Montana |
$ | 20,164 | $ | 4,067 | $ | 41,373 | $ | 5 | $ | 2 | $ | — | $ | 4,072 | $ | 41,375 | $ | — | $ | 45,447 | $ | (1,269 | ) | 2009 | 12/2/2013 | (1) | ||||||||||||||||||||||||
| MorningStar of Boise |
||||||||||||||||||||||||||||||||||||||||||||||||||
| Boise, Idaho |
$ | 21,524 | $ | 1,663 | $ | 35,752 | $ | 12 | $ | — | $ | — | $ | 1,675 | $ | 35,752 | $ | — | $ | 37,427 | $ | (1,035 | ) | 2007 | 12/2/2013 | (1) | ||||||||||||||||||||||||
| Prestige Senior Living Huntington Terrace |
||||||||||||||||||||||||||||||||||||||||||||||||||
| Gresham, Oregon (“Portland”) |
$ | 10,484 | $ | 1,236 | $ | 12,083 | $ | — | $ | — | $ | — | $ | 1,236 | $ | 12,083 | $ | — | $ | 13,319 | $ | (358 | ) | 2000 | 12/2/2013 | (1) | ||||||||||||||||||||||||
| MorningStar of Idaho Falls |
||||||||||||||||||||||||||||||||||||||||||||||||||
| Idaho Falls, Idaho |
$ | 18,414 | $ | 2,006 | $ | 40,397 | $ | 5 | $ | — | $ | — | $ | 2,011 | $ | 40,397 | $ | — | $ | 42,408 | $ | (1,193 | ) | 2009 | 12/2/2013 | (1) | ||||||||||||||||||||||||
| Prestige Senior Living Arbor Place |
||||||||||||||||||||||||||||||||||||||||||||||||||
| Medford, Oregon |
$ | 8,429 | $ | 355 | $ | 14,083 | $ | — | $ | — | $ | — | $ | 355 | $ | 14,083 | $ | — | $ | 14,438 | $ | (407 | ) | 2003 | 12/2/2013 | (1) | ||||||||||||||||||||||||
| Prestige Senior Living Orchard Heights |
||||||||||||||||||||||||||||||||||||||||||||||||||
| Salem, Oregon |
$ | 12,659 | $ | 545 | $ | 15,544 | $ | — | $ | 8 | $ | — | $ | 545 | $ | 15,552 | $ | — | $ | 16,097 | $ | (444 | ) | 2002 | 12/2/2013 | (1) | ||||||||||||||||||||||||
| Prestige Senior Living Southern Hills |
||||||||||||||||||||||||||||||||||||||||||||||||||
| Salem, Oregon |
$ | 7,694 | $ | 653 | $ | 10,753 | $ | — | $ | — | $ | — | $ | 653 | $ | 10,753 | $ | — | $ | 11,406 | $ | (314 | ) | 2001 | 12/2/2013 | (1) | ||||||||||||||||||||||||
| MorningStar of Sparks |
||||||||||||||||||||||||||||||||||||||||||||||||||
| Sparks, Nevada (“Reno”) |
$ | 24,405 | $ | 3,986 | $ | 47,968 | $ | — | $ | — | $ | — | $ | 3,986 | $ | 47,968 | $ | — | $ | 51,954 | $ | (1,430 | ) | 2009 | 12/2/2013 | (1) | ||||||||||||||||||||||||
| Prestige Senior Living Five Rivers |
||||||||||||||||||||||||||||||||||||||||||||||||||
| Tillamook, Oregon |
$ | 7,931 | $ | 1,298 | $ | 14,064 | $ | — | $ | 48 | $ | — | $ | 1,298 | $ | 14,112 | $ | — | $ | 15,410 | $ | (434 | ) | 2002 | 12/2/2013 | (1) | ||||||||||||||||||||||||
| Prestige Senior Living Riverwood |
||||||||||||||||||||||||||||||||||||||||||||||||||
| Tualatin, Oregon (“Portland”) |
$ | 4,601 | $ | 1,028 | $ | 7,429 | $ | — | $ | 37 | $ | — | $ | 1,028 | $ | 7,466 | $ | — | $ | 8,494 | $ | (225 | ) | 1999 | 12/2/2013 | (1) | ||||||||||||||||||||||||
| Chula Vista Medical Arts Center |
||||||||||||||||||||||||||||||||||||||||||||||||||
| Chula Vista, California (“San Diego”) |
$ | — | $ | 2,462 | $ | 7,453 | $ | — | $ | 234 | $ | — | $ | 2,462 | $ | 7,687 | $ | — | $ | 10,149 | $ | (205 | ) | 1985 | 12/23/2013 | (1) | ||||||||||||||||||||||||
| Coral Springs Medical Office Building I |
||||||||||||||||||||||||||||||||||||||||||||||||||
| Coral Springs, Florida |
$ | — | $ | 2,614 | $ | 11,220 | $ | — | $ | 1 | $ | — | $ | 2,614 | $ | 11,221 | $ | — | $ | 13,835 | $ | (332 | ) | 2005 | 12/23/2013 | (1) | ||||||||||||||||||||||||
| Coral Springs Medical Office Building II |
||||||||||||||||||||||||||||||||||||||||||||||||||
| Coral Springs, Florida |
$ | — | $ | 2,614 | $ | 12,130 | $ | — | $ | — | $ | — | $ | 2,614 | $ | 12,130 | $ | — | $ | 14,744 | $ | (332 | ) | 2008 | 12/23/2013 | (1) | ||||||||||||||||||||||||
162
Table of Contents
CNL HEALTHCARE PROPERTIES, INC. AND SUBSIDIARIES
SCHEDULE III — REAL ESTATE AND ACCUMULATED DEPRECIATION
AS OF DECEMBER 31, 2014 (in thousands)
| Initial Costs | Costs Capitalized Subsequent to Acquisition |
Gross Amounts at which Carried at Close of Period (2) |
||||||||||||||||||||||||||||||||||||||||||||||||
| Property/Location |
Encum- brances |
Land & Land Improve- ments |
Building and Building Improve- ments |
Land & Land Improve- ments |
Building and Building Improve- ments |
Construc- tion in Process |
Land & Land Improve- ments |
Building and Building Improve- ments |
Construc- tion in Process |
Total | Accumu- lated Depreci- ation |
Date of Construction |
Date Acquired |
Life on which depreciation in latest income statement is computed | ||||||||||||||||||||||||||||||||||||
| Chula Vista Medical Arts Center |
||||||||||||||||||||||||||||||||||||||||||||||||||
| Chula Vista, California (“San Diego”) |
$ | — | $ | 6,130 | $ | 10,293 | $ | 3 | $ | — | $ | — | $ | 6,133 | $ | 10,293 | $ | — | $ | 16,426 | $ | (260 | ) | 1975 | 1/21/2014 | (1) | ||||||||||||||||||||||||
| Prestige Senior Living Auburn Meadows |
||||||||||||||||||||||||||||||||||||||||||||||||||
| Auburn, Washington (“Seattle”) |
$ | 10,810 | $ | 2,537 | $ | 17,261 | $ | — | $ | — | $ | — | $ | 2,537 | $ | 17,261 | $ | — | $ | 19,798 | $ | (433 | ) | 2003/2010 | 2/3/2014 | (1) | ||||||||||||||||||||||||
| Prestige Senior Living Bridgewood |
||||||||||||||||||||||||||||||||||||||||||||||||||
| Vancouver, Washington (“Portland”) |
$ | 13,514 | $ | 1,603 | $ | 18,172 | $ | — | $ | — | $ | — | $ | 1,603 | $ | 18,172 | $ | — | $ | 19,775 | $ | (452 | ) | 2001 | 2/3/2014 | (1) | ||||||||||||||||||||||||
| Prestige Senior Living Monticello Park |
||||||||||||||||||||||||||||||||||||||||||||||||||
| Longview, Washington |
$ | 18,855 | $ | 1,981 | $ | 23,056 | $ | — | $ | — | $ | — | $ | 1,981 | $ | 23,056 | $ | — | $ | 25,037 | $ | (566 | ) | 2001/2010 | 2/3/2014 | (1) | ||||||||||||||||||||||||
| Prestige Senior Living Rosemont |
||||||||||||||||||||||||||||||||||||||||||||||||||
| Yelm, Washington |
$ | 9,737 | $ | 668 | $ | 14,564 | $ | — | $ | — | $ | — | $ | 668 | $ | 14,564 | $ | — | $ | 15,232 | $ | (353 | ) | 2004 | 2/3/2014 | (1) | ||||||||||||||||||||||||
| Wellmore of Tega Cay |
||||||||||||||||||||||||||||||||||||||||||||||||||
| Tega Cay, South Carolina (“Charlotte”) |
$ | 8,008 | $ | 2,445 | $ | — | $ | — | $ | — | $ | 19,753 | $ | 2,445 | $ | — | $ | 19,753 | $ | 22,198 | $ | — | (3) | 2/7/2014 | (1) | |||||||||||||||||||||||||
| Isle at Cedar Ridge |
||||||||||||||||||||||||||||||||||||||||||||||||||
| Cedar Park, Texas (“Austin”) |
$ | — | $ | 1,525 | $ | 16,277 | $ | — | $ | — | $ | — | $ | 1,525 | $ | 16,277 | $ | — | $ | 17,802 | $ | (379 | ) | 2011 | 2/28/2014 | (1) | ||||||||||||||||||||||||
| Prestige Senior Living West Hills |
||||||||||||||||||||||||||||||||||||||||||||||||||
| Corvallis, Oregon |
$ | 9,031 | $ | 842 | $ | 12,603 | $ | — | $ | — | $ | — | $ | 842 | $ | 12,603 | $ | — | $ | 13,445 | $ | (293 | ) | 2002 | 3/3/2014 | (1) | ||||||||||||||||||||||||
| HarborChase of Plainfield |
||||||||||||||||||||||||||||||||||||||||||||||||||
| Plainfield, Illinois |
$ | — | $ | 1,596 | $ | 21,832 | $ | — | $ | — | $ | — | $ | 1,596 | $ | 21,832 | $ | — | $ | 23,428 | $ | (444 | ) | 2010 | 3/28/2014 | (1) | ||||||||||||||||||||||||
| Legacy Ranch Alzheimer’s Special Care Center |
||||||||||||||||||||||||||||||||||||||||||||||||||
| Midland, Texas |
$ | — | $ | 917 | $ | 9,982 | $ | — | $ | — | $ | — | $ | 917 | $ | 9,982 | $ | — | $ | 10,899 | $ | (207 | ) | 2012 | 3/28/2014 | (1) | ||||||||||||||||||||||||
| The Springs Alzheimer’s Special Care Center |
||||||||||||||||||||||||||||||||||||||||||||||||||
| San Angelo, Texas |
$ | — | $ | 595 | $ | 9,658 | $ | — | $ | — | $ | — | $ | 595 | $ | 9,658 | $ | — | $ | 10,253 | $ | (200 | ) | 2012 | 3/28/2014 | (1) | ||||||||||||||||||||||||
| Isle at Watercrest—Bryan |
||||||||||||||||||||||||||||||||||||||||||||||||||
| Bryan, Texas |
$ | — | $ | 714 | $ | 18,140 | $ | 4 | $ | 3 | $ | — | $ | 718 | $ | 18,143 | $ | — | $ | 18,861 | $ | (324 | ) | 2011 | 4/21/2014 | (1) | ||||||||||||||||||||||||
| Watercrest at Bryan |
||||||||||||||||||||||||||||||||||||||||||||||||||
| Bryan, Texas |
$ | — | $ | 2,509 | $ | 22,441 | $ | 4 | $ | 9 | $ | — | $ | 2,513 | $ | 22,450 | $ | — | $ | 24,963 | $ | (433 | ) | 2009 | 4/21/2014 | (1) | ||||||||||||||||||||||||
| Isle at Watercrest—Mansfield |
||||||||||||||||||||||||||||||||||||||||||||||||||
| Mansfield, Texas (“Dallas/Fort Worth”) |
$ | — | $ | 997 | $ | 24,635 | $ | — | $ | — | $ | — | $ | 997 | $ | 24,635 | $ | — | $ | 25,632 | $ | (436 | ) | 2011 | 5/5/2014 | (1) | ||||||||||||||||||||||||
| Houston Orthopedic & Spine Hospital (“HOSH”) |
||||||||||||||||||||||||||||||||||||||||||||||||||
| Bellaire, Texas (“Houston”) |
$ | 31,995 | $ | 3,867 | $ | 32,761 | $ | — | $ | — | $ | — | $ | 3,867 | $ | 32,761 | $ | — | $ | 36,628 | $ | (498 | ) | 2007 | 6/2/2014 | (1) | ||||||||||||||||||||||||
| HOSH Medical Office Building |
||||||||||||||||||||||||||||||||||||||||||||||||||
| Bellaire, Texas (“Houston”) |
$ | 17,630 | $ | 3,738 | $ | 20,525 | $ | — | $ | 63 | $ | — | $ | 3,738 | $ | 20,588 | $ | — | $ | 24,326 | $ | (315 | ) | 2007 | 6/2/2014 | (1) | ||||||||||||||||||||||||
| Watercrest at Katy |
||||||||||||||||||||||||||||||||||||||||||||||||||
| Katy, Texas (“Houston”) |
$ | — | $ | 4,000 | $ | — | $ | — | $ | — | $ | 4,614 | $ | 4,000 | $ | — | $ | 4,614 | $ | 8,614 | $ | — | (3) | 6/27/2014 | (1) | |||||||||||||||||||||||||
| Watercrest at Mansfield |
||||||||||||||||||||||||||||||||||||||||||||||||||
| Mansfield, Texas (“Dallas/Fort Worth”) |
$ | 27,423 | $ | 2,191 | $ | 42,740 | $ | — | $ | 28 | $ | — | $ | 2,191 | $ | 42,768 | $ | — | $ | 44,959 | $ | (571 | ) | 2010 | 6/30/2014 | (1) | ||||||||||||||||||||||||
163
Table of Contents
CNL HEALTHCARE PROPERTIES, INC. AND SUBSIDIARIES
SCHEDULE III — REAL ESTATE AND ACCUMULATED DEPRECIATION
AS OF DECEMBER 31, 2014 (in thousands)
| Initial Costs | Costs Capitalized Subsequent to Acquisition |
Gross Amounts at which Carried at Close of Period (2) |
||||||||||||||||||||||||||||||||||||||||||||||||
| Property/Location |
Encum- brances |
Land & Land Improve- ments |
Building and Building Improve- ments |
Land & Land Improve- ments |
Building and Building Improve- ments |
Construc- tion in Process |
Land & Land Improve- ments |
Building and Building Improve- ments |
Construc- tion in Process |
Total | Accumu- lated Depreci- ation |
Date of Construction |
Date Acquired |
Life on which depreciation in latest income statement is computed | ||||||||||||||||||||||||||||||||||||
| HarborChase of Shorewood |
||||||||||||||||||||||||||||||||||||||||||||||||||
| Shorewood, Wisconsin (“Milwaukee”) |
$ | — | $ | 2,200 | $ | — | $ | — | $ | — | $ | 7,140 | $ | 2,200 | $ | — | $ | 7,140 | $ | 9,340 | $ | — | (3) | 7/8/2014 | (1) | |||||||||||||||||||||||||
| Oklahoma City Inpatient Rehabilitation Hospital |
||||||||||||||||||||||||||||||||||||||||||||||||||
| Oklahoma City, Oklahoma |
$ | 16,560 | $ | 3,341 | $ | 19,249 | $ | — | $ | — | $ | — | $ | 3,341 | $ | 19,249 | $ | — | $ | 22,590 | $ | (271 | ) | 2012 | 7/15/2014 | (1) | ||||||||||||||||||||||||
| Las Vegas Inpatient Rehabilitation Hospital |
||||||||||||||||||||||||||||||||||||||||||||||||||
| Las Vegas, Nevada |
$ | 14,475 | $ | 2,650 | $ | 16,979 | $ | — | $ | — | $ | — | $ | 2,650 | $ | 16,979 | $ | — | $ | 19,629 | $ | (242 | ) | 2007 | 7/15/2014 | (1) | ||||||||||||||||||||||||
| South Bend Inpatient Rehabilitation Hospital |
||||||||||||||||||||||||||||||||||||||||||||||||||
| Mishawaka, Indiana (“South Bend”) |
$ | 13,142 | $ | 2,339 | $ | 16,239 | $ | — | $ | — | $ | — | $ | 2,339 | $ | 16,239 | $ | — | $ | 18,578 | $ | (234 | ) | 2009 | 7/15/2014 | (1) | ||||||||||||||||||||||||
| Beaumont Specialty Hospital |
||||||||||||||||||||||||||||||||||||||||||||||||||
| Beaumont, Texas (“Houston”) |
$ | 21,817 | $ | 2,749 | $ | 28,863 | $ | — | $ | — | $ | — | $ | 2,749 | $ | 28,863 | $ | — | $ | 31,612 | $ | (324 | ) | 2013 | 8/15/2014 | (1) | ||||||||||||||||||||||||
| Hurst Specialty Hospital |
||||||||||||||||||||||||||||||||||||||||||||||||||
| Hurst, Texas (“Dallas/Fort Worth”) |
$ | 19,132 | $ | 2,510 | $ | 24,091 | $ | — | $ | — | $ | — | $ | 2,510 | $ | 24,091 | $ | — | $ | 26,601 | $ | (271 | ) | 2004/2012 | 8/15/2014 | (1) | ||||||||||||||||||||||||
| Claremont Medical Office |
||||||||||||||||||||||||||||||||||||||||||||||||||
| Claremont, CA (“Los Angeles”) |
$ | 12,392 | $ | 6,324 | $ | 13,533 | $ | — | $ | — | $ | — | $ | 6,324 | $ | 13,533 | $ | — | $ | 19,857 | $ | (133 | ) | 2008 | 8/29/2014 | (1) | ||||||||||||||||||||||||
| Lee Hughes Medical Building |
||||||||||||||||||||||||||||||||||||||||||||||||||
| Glendale, California (“Los Angeles”) |
$ | 19,162 | $ | 69 | $ | 22,967 | $ | — | $ | — | $ | — | $ | 69 | $ | 22,967 | $ | — | $ | 23,036 | $ | (148 | ) | 2008 | 9/29/2014 | (1) | ||||||||||||||||||||||||
| Newburyport Medical Center |
||||||||||||||||||||||||||||||||||||||||||||||||||
| Newburyport, Massachusetts (“Boston”) |
$ | — | $ | 2,614 | $ | 12,135 | $ | — | $ | — | $ | — | $ | 2,614 | $ | 12,135 | $ | — | $ | 14,749 | $ | (62 | ) | 2008 | 10/31/2014 | (1) | ||||||||||||||||||||||||
| Northwest Medical Park |
||||||||||||||||||||||||||||||||||||||||||||||||||
| Margate, Florida (“Fort Lauderdale”) |
$ | 7,129 | $ | 610 | $ | 6,170 | $ | — | $ | — | $ | — | $ | 610 | $ | 6,170 | $ | — | $ | 6,780 | $ | (33 | ) | 2004 | 10/31/2014 | (1) | ||||||||||||||||||||||||
| Fairfield Village of Layton |
||||||||||||||||||||||||||||||||||||||||||||||||||
| Layton, Utah (“Salt Lake City”) |
$ | — | $ | 5,217 | $ | 54,167 | $ | — | $ | 7 | $ | — | $ | 5,217 | $ | 54,174 | $ | — | $ | 59,391 | $ | (128 | ) | 2010 | 11/20/2014 | (1) | ||||||||||||||||||||||||
| ProMed Medical Building I |
||||||||||||||||||||||||||||||||||||||||||||||||||
| Yuma, Arizona |
$ | — | $ | 2,486 | $ | 6,728 | $ | — | $ | — | $ | — | $ | 2,486 | $ | 6,728 | $ | — | $ | 9,214 | $ | — | 2006 | 12/19/2014 | (1) | |||||||||||||||||||||||||
| Midtown Medical Plaza |
||||||||||||||||||||||||||||||||||||||||||||||||||
| Charlotte, North Carolina |
$ | 30,223 | $ | 10 | $ | 51,237 | $ | — | $ | — | $ | — | $ | 10 | $ | 51,237 | $ | — | $ | 51,247 | $ | — | 1994 | 12/22/2014 | (1) | |||||||||||||||||||||||||
| Presbyterian Medical Tower |
||||||||||||||||||||||||||||||||||||||||||||||||||
| Charlotte, North Carolina |
$ | 20,089 | $ | 40 | $ | 32,345 | $ | — | $ | — | $ | — | $ | 40 | $ | 32,345 | $ | — | $ | 32,385 | $ | — | 1989 | 12/22/2014 | (1) | |||||||||||||||||||||||||
| Metroview Professional Building |
||||||||||||||||||||||||||||||||||||||||||||||||||
| Charlotte, North Carolina |
$ | 9,543 | $ | 11 | $ | 15,910 | $ | — | $ | — | $ | — | $ | 11 | $ | 15,910 | $ | — | $ | 15,921 | $ | — | 1971 | 12/22/2014 | (1) | |||||||||||||||||||||||||
| Physicians Plaza Huntersville |
||||||||||||||||||||||||||||||||||||||||||||||||||
| Huntersville, North Carolina (“Charlotte”) |
$ | 16,775 | $ | 520 | $ | 26,134 | $ | — | $ | — | $ | — | $ | 520 | $ | 26,134 | $ | — | $ | 26,654 | $ | — | 2004 | 12/22/2014 | (1) | |||||||||||||||||||||||||
| Matthews Medical Office Building |
||||||||||||||||||||||||||||||||||||||||||||||||||
| Matthews, North Carolina (“Charlotte”) |
$ | 11,770 | $ | 350 | $ | 19,624 | $ | — | $ | — | $ | — | $ | 350 | $ | 19,624 | $ | — | $ | 19,974 | $ | — | 1994 | 12/22/2014 | (1) | |||||||||||||||||||||||||
| Outpatient Care Center |
||||||||||||||||||||||||||||||||||||||||||||||||||
| Clyde, North Carolina (“Asheville”) |
$ | 10,990 | $ | 1,169 | $ | 12,079 | $ | — | $ | — | $ | — | $ | 1,169 | $ | 12,079 | $ | — | $ | 13,248 | $ | — | 2012 | 12/22/2014 | (1) | |||||||||||||||||||||||||
164
Table of Contents
CNL HEALTHCARE PROPERTIES, INC. AND SUBSIDIARIES
SCHEDULE III — REAL ESTATE AND ACCUMULATED DEPRECIATION
AS OF DECEMBER 31, 2014 (in thousands)
| Initial Costs | Costs Capitalized Subsequent to Acquisition |
Gross Amounts at which Carried at Close of Period (2) |
||||||||||||||||||||||||||||||||||||||||||||||||||||
| Property/ |
Encum- brances |
Land & Land Improve- ments |
Building and Building Improve- ments |
Land & Land Improve- ments |
Building and Building Improve- ments |
Construc- tion in Process |
Land & Land Improve- ments |
Building and Building Improve- ments |
Construc- tion in Process |
Total | Accumu- lated Depreci- ation |
Date of Construction |
Date Acquired |
Life on which depreciation in latest income statement is computed | ||||||||||||||||||||||||||||||||||||||||
| 330 Physicians Center |
||||||||||||||||||||||||||||||||||||||||||||||||||||||
| Rome, Georgia |
$ | 20,471 | $ | 12 | $ | 26,868 | $ | — | $ | — | $ | — | $ | 12 | $ | 26,868 | $ | — | $ | 26,880 | $ | — | 1987/2005 | 12/22/2014 | (1) | |||||||||||||||||||||||||||||
| Spivey Station Physicians Center |
||||||||||||||||||||||||||||||||||||||||||||||||||||||
| Atlanta, Georgia |
$ | 10,010 | $ | 1,026 | $ | 12,246 | $ | — | $ | — | $ | — | $ | 1,026 | $ | 12,246 | $ | — | $ | 13,272 | $ | — | 2007 | 12/22/2014 | (1) | |||||||||||||||||||||||||||||
| Spivey Station ASC Building |
||||||||||||||||||||||||||||||||||||||||||||||||||||||
| Atlanta, Georgia |
$ | 12,811 | $ | 929 | $ | 13,769 | $ | — | $ | — | $ | — | $ | 929 | $ | 13,769 | $ | — | $ | 14,698 | $ | — | 2009 | 12/22/2014 | (1) | |||||||||||||||||||||||||||||
|
|
|
|
|
|
|
|
|
|
|
|
|
|
|
|
|
|
|
|
|
|
|
|||||||||||||||||||||||||||||||||
| $ | 853,561 | $ | 138,942 | $ | 1,512,937 | $ | 1,365 | $ | 32,677 | $ | 35,508 | $ | 140,307 | $ | 1,545,614 | $ | 35,508 | $ | 1,721,429 | $ | (40,467 | ) | ||||||||||||||||||||||||||||||||
|
|
|
|
|
|
|
|
|
|
|
|
|
|
|
|
|
|
|
|
|
|
|
|||||||||||||||||||||||||||||||||
Transactions in real estate and accumulated depreciation as of December 31, 2014 are as follows:
| Balance December 31, 2011 |
$ | — | Balance December 31, 2011 | $ | — | |||||||
| 2012 Acquisitions |
231,398 | 2012 Depreciation | (1,702 | ) | ||||||||
|
|
|
|||||||||||
| 2012 Improvements |
4,547 | Balance December 31, 2012 | (1,702 | ) | ||||||||
|
|
|
|||||||||||
| Balance December 31, 2012 |
235,945 | 2013 Depreciation | (9,309 | ) | ||||||||
|
|
|
|||||||||||
| 2013 Acquisitions |
598,176 | Balance December 31, 2013 | (11,011 | ) | ||||||||
| 2013 Improvements |
25,756 | 2014 Depreciation | (29,456 | ) | ||||||||
|
|
|
|
|
|||||||||
| Balance December 31, 2013 |
859,877 | Balance December 31, 2014 | $ | (40,467 | ) | |||||||
|
|
|
|||||||||||
| 2014 Acquisitions |
822,305 | |||||||||||
| 2014 Improvements |
39,247 | |||||||||||
|
|
|
|||||||||||
| Balance December 31, 2014 |
$ | 1,721,429 | ||||||||||
|
|
|
FOOTNOTES:
| (1) | Buildings and building improvements are depreciated over 39 and 15 years, respectively. Tenant improvements are depreciated over the terms of their respective leases. |
| (2) | The aggregate cost for federal income tax purposes is approximately $1.9 billion. |
| (3) | Land and land improvements, initial cost, include the purchase price of land under development which is included as a component of construction in process in the consolidated balance sheets. As of December 31, 2014 these properties were under development; therefore, depreciation is not applicable. |
165
Table of Contents
CNL HEALTHCARE PROPERTIES, INC. AND SUBSIDIARIES
SCHEDULE IV – MORTGAGE LOANS ON REAL ESTATE
YEARS ENDED DECEMBER 31, 2014, 2013 AND 2012 (in thousands)
The following is a reconciliation of mortgages and other notes receivable on real estate for the years ended December 31, 2014, 2013 and 2012 (in thousands):
| 2014 | 2013 | 2012 | ||||||||||
| Balance at beginning of year |
$ | 3,949 | $ | — | $ | — | ||||||
| Additions during period: |
||||||||||||
| New mortgage loans and additional advances |
2,065 | 3,741 | — | |||||||||
| Accrued and deferred interest |
288 | 124 | — | |||||||||
| Loan origination costs, net |
— | 84 | — | |||||||||
| Deductions during period: |
||||||||||||
| Collection of principal |
(6,302 | ) | — | — | ||||||||
|
|
|
|
|
|
|
|||||||
| Balance at end of year |
$ | — | $ | 3,949 | $ | — | ||||||
|
|
|
|
|
|
|
|||||||
166