Attached files
| file | filename |
|---|---|
| EX-21 - EX-21 - CSB BANCORP INC /OH | d849998dex21.htm |
| EX-31.1 - EX-31.1 - CSB BANCORP INC /OH | d849998dex311.htm |
| EX-23.1 - EX-23.1 - CSB BANCORP INC /OH | d849998dex231.htm |
| EXCEL - IDEA: XBRL DOCUMENT - CSB BANCORP INC /OH | Financial_Report.xls |
| EX-32.2 - EX-32.2 - CSB BANCORP INC /OH | d849998dex322.htm |
| EX-31.2 - EX-31.2 - CSB BANCORP INC /OH | d849998dex312.htm |
| 10-K - FORM 10-K - CSB BANCORP INC /OH | d849998d10k.htm |
| EX-32.1 - EX-32.1 - CSB BANCORP INC /OH | d849998dex321.htm |
Table of Contents

Table of Contents

NEW LEVELS OF


Table of Contents

| FOR THE YEAR ENDED DECEMBER 31 | 2014 | 2013 | % CHANGE | |||||||||
|
|
||||||||||||
| (Dollars in thousands, except per share data) | ||||||||||||
| CONSOLIDATED RESULTS |
||||||||||||
| Net interest income |
$ | 19,927 | $ | 18,883 | 6 | % | ||||||
| Net interest income – fully taxable-equivalent (“FTE”) basis |
20,212 | 19,190 | 5 | |||||||||
| Noninterest income |
4,250 | 4,318 | -2 | |||||||||
| Provision for loan losses |
643 | 840 | -23 | |||||||||
| Noninterest expense |
15,082 | 14,848 | 2 | |||||||||
| Net income
|
|
5,884
|
|
|
5,240
|
|
|
12
|
| |||
| AT YEAR-END |
||||||||||||
| Loans, net |
$ | 406,522 | $ | 374,040 | 9 | % | ||||||
| Assets |
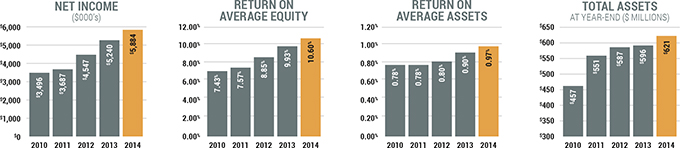
620,981 | 596,465 | 4 | |||||||||
| Deposits |
500,075 | 480,933 | 4 | |||||||||
| Shareholders’ equity |
57,450 | 52,411 | 10 | |||||||||
| Cash dividends declared |
0.74 | 0.72 | 3 | |||||||||
| Book value |
20.97 | 19.15 | 10 | |||||||||
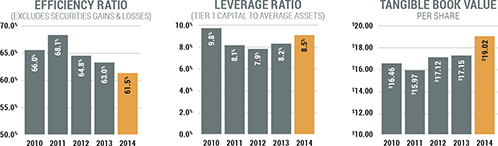
| Tangible book value |
19.02 | 17.15 | 11 | |||||||||
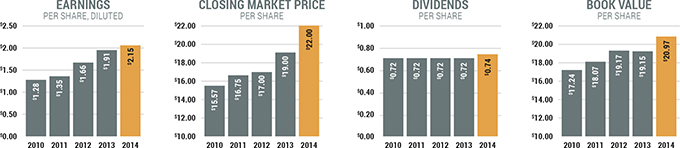
| Market price |
22.00 | 19.00 | 16 | |||||||||
| Basic and diluted earnings per share
|
|
2.15
|
|
|
1.91
|
|
|
13
|
| |||
| FINANCIAL PERFORMANCE |
||||||||||||
| Return on average assets |
0.97 | % | 0.90 | % | ||||||||
| Return on average equity |
10.60 | 9.93 | ||||||||||
| Net interest margin, FTE |
3.56 | 3.51 | ||||||||||
| Efficiency ratio
|
|
61.46
|
|
|
63.01
|
|
||||||
| CAPITAL RATIOS |
||||||||||||
| Risk-based capital: |
||||||||||||
| Tier 1 |
12.51 | % | 12.31 | % | ||||||||
| Total |
13.56 | 13.56 | ||||||||||
| Leverage |
8.51 | 8.21 | ||||||||||
2014 Report to Shareholders | CSB Bancorp, Inc. 3
Table of Contents
DEAR FELLOW SHAREHOLDER:
2014 was another year of growth, improved financial performance and progress in key strategic initiatives. We are larger than we have ever been, generating record income, and building forward momentum in our markets.
The Company’s average balance sheet size exceeded $600 million for the first time in its history. Net income of $5.9 million established a third consecutive record high. Our technology and talent development efforts continue to increase our effectiveness in the marketplace. In short, the CSB team is actively engaged in supporting our vision of building a company of enduring greatness.
CSB’s stock delivered a total return of 20% during 2014, including dividend reinvestment and price appreciation. Our dividend remains very attractive, with an average yield of 3.67% when dividing total cash dividends paid by the average 2014 daily closing stock price. The dividend yield has been above 3.5% since before the financial crisis of 2007-08 and remains substantially stronger than state and national averages for financial stocks. Dividends are one reflection of our commitment to work hard at continually enhancing shareholder value.
HOW WE DO BUSINESS
Our business model remains community centric. The rural and urban areas in which we operate are at the core of our mission and strategy. Everything we do is intended in some way to enhance the well-being of these communities. We provide products and services that help customers accomplish their financial goals. We seek, hire and grow leadership from within the local markets. We keep the interests of our shareholders, many of whom are local investors, in mind as we conduct our operations.
Our six core values continue to guide our efforts. Profit Responsibility, Customer Service, Valued Employees, Honesty and Integrity, Enjoyment of Life and the privilege to work in the communities in which we live, and Growth as part of the lifeblood of our future provide the time-tested framework for all that we do. As the industry continues to change, these core values will continue to guide our journey.
We have built a strong culture of effective risk management and compliance to sustain the safety and soundness of the Bank. We diligently focus on protecting our customers from cybersecurity threats and fraud risks, as well as conducting our operations in accordance with increasing regulatory requirements. We continually evaluate our policies and procedures, systems and technology as we work to reduce risks to our customers and protect the reputation and trust that we have established.
MARKETS
Most of our business activities are conducted in Holmes, Tuscarawas, Wayne and Stark counties of Ohio. These markets exhibit relatively stable populations, a wide range of manufacturing, distribution, service and agriculture enterprises, and solid educational and advancement opportunities for citizens.
The economy in each of these counties has been slowly expanding for several years. Business investments are increasing, and home prices and construction levels are generally improving. Unemployment rates have declined to levels below those that existed prior to the severe recession of 2007-2009, and are presently below U.S. and Ohio average rates. We are fortunate to be able to call these markets home.
OVERVIEW OF BANKING ACTIVITY
Our business model provides effective intermediary services that facilitate the flow of funds within the communities we serve. We safeguard deposit and investment monies entrusted to us, we put a significant amount of depositor funds to work by lending prudently in the broader community, and we provide access to reliable payment channels for debit and credit card processing, internet and mobile banking and check clearing.
Lending is the primary revenue generating activity in our business model, accounting for 71% of gross revenue in the past year. As a commercial bank, we provide loans to businesses and individuals alike. Average loan balances increased 8% during the year to
4 2014 Report to Shareholders | CSB Bancorp, Inc.
Table of Contents
LETTER TO SHAREHOLDERS

TRENDS IN THE INDUSTRY
The financial services sector is undergoing fairly significant changes with a number of macro factors at play. New adaptations of technology for banking and payments processing and new forms of competition are all having major impact on the banking landscape. Consumers are increasingly demonstrating a preference for direct electronic access to financial services and the omnipresent mobile device appears poised to become a primary banking channel. A complex and active regulatory climate requires significant resource utilization. Data integrity and the protection of sensitive customer information have become primary concerns and are requiring increased attention and resources.
We believe the above factors create opportunities for us to grow and strengthen our position in the marketplace. Maintaining financial strength and stability are requisite to thrive in such circumstances and we carefully steward our capital, liquidity, credit quality and expense management in order to maintain the base fitness required to respond to changing conditions and seize opportunities.
CHANNEL DELIVERY
We continue to work at enhancing our customers’ experience. We recognize the fundamental importance of providing services in ways that customers find most convenient. Some customers highly value in-person transactions at our retail locations. Other customers prefer one or more electronic channels to handle transactions, such as our website or mobile banking applications. Our commitment is to provide noticeably different service The CSB Way regardless of which delivery channel a customer prefers or uses for any particular interaction. We are working toward a consistent CSB look and feel across all channels of customer engagement, whether in person or by digital means. Our customer service call center is one example of a channel that we significantly enhanced over the past year. These CSB team members are shining stars when it comes to customer service.
2014 Report to Shareholders | CSB Bancorp, Inc. 5
Table of Contents
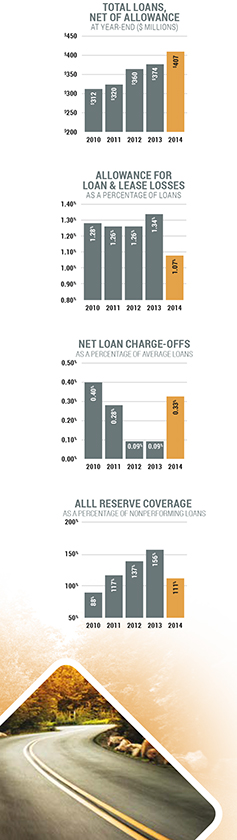


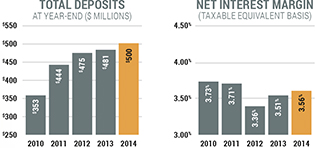
Table of Contents

| Standing, Left to Right
| ||||||||
| J. THOMAS LANG | RONALD E. HOLTMAN | EDDIE L. STEINER | ROBERT K. BAKER | JOHN R. WALTMAN | ||||
| Veterinarian, | Attorney, Of Counsel, | President, | Co-Owner and Controller, | Attorney, Of Counsel, | ||||
| Dairy Farmer, | Logee, Hostetler, | Chief Executive Officer, | Bakerwell, Inc. | Critchfield, Critchfield | ||||
| Spring Hill Farms, Inc. | Stutzman & Lehman | CSB Bancorp, Inc. | & Johnston | |||||
| Chairman, | ||||||||
| CSB Bancorp, Inc. | ||||||||
| Seated, Left to Right
| ||||||||
| DANIEL J. MILLER | JEFFERY A. ROBB, SR. | |||||||
| Retired Physician, | President, | |||||||
| East Holmes Family Care, Inc. | Robb Companies, Inc. | |||||||
| Chairman of the Board, | ||||||||
| Dutchman Hospitality Group, Inc. | ||||||||
2014 Report to Shareholders | CSB Bancorp, Inc. 7
Table of Contents
INTRODUCTION
CSB Bancorp, Inc. (the “Company” or “CSB”) was incorporated under the laws of the State of Ohio in 1991 and is a registered bank holding company. The Company’s wholly-owned subsidiaries are The Commercial and Savings Bank (the “Bank”) and CSB Investment Services, LLC which is inactive. The Bank is chartered under the laws of the State of Ohio and was organized in 1879. The Bank is a member of the Federal Reserve System, with deposits insured by the Federal Deposit Insurance Corporation, and its primary regulators are the Ohio Division of Financial Institutions and the Federal Reserve Board.
The Company, through the Bank, provides retail and commercial banking services to its customers including checking and savings accounts, time deposits, cash management, safe deposit facilities, personal loans, commercial loans, real estate mortgage loans, installment loans, IRAs, night depository facilities and trust and brokerage services. Its customers are located primarily in Holmes, Tuscarawas, Wayne, Stark and portions of surrounding counties in Ohio.
In 2014, the Company’s market area demonstrated increasing economic activity following five years of modest gains. Unemployment levels in Holmes County, reported at 2.9% in December 2014, have generally been among the lowest in the State of Ohio, while the balance of the Company’s market area reported unemployment levels below the state average for 2014 and 2013. Residential real estate property values have slowly recovered with low mortgage rates and high affordability. Auto sales also grew, helped by job growth, available financing and the near record age of existing vehicle stock. Ohio’s growth activity continues to be reported in manufacturing and energy-related industries. If oil prices were to experience a sustained decline, mining and manufacturing jobs in the oil and gas business, which had been expanding in the previous two years may decline. The Company’s market is adjacent to areas of primary shale activity.
FORWARD-LOOKING STATEMENTS
Certain statements contained in Management’s Discussion and Analysis of Financial Condition and Results of Operations are not related to historical results, but are forward-looking statements within the meaning of the Private Securities Litigation Reform Act of 1995. These statements involve a number of risks and uncertainties. Any forward-looking statements made by the Company herein and in future reports and statements are not guarantees of future performance, and actual results may differ materially from those in forward-looking statements because of various risk factors as discussed in this annual report and the Company’s Annual Report on Form 10-K. The Company does not undertake, and specifically disclaims, any obligation to publicly release the result of any revisions to any forward-looking statements to reflect the occurrence of unanticipated events or circumstances after the date of such statements.
8 2014 Report to Shareholders | CSB Bancorp, Inc.
Table of Contents
2014 FINANCIAL REVIEW
SELECTED FINANCIAL DATA
The following table sets forth certain selected consolidated financial information:
| (Dollars in thousands, except per share data)
|
2014 | 2013 | 2012 | 2011 | 2010 | |||||||||||||||
|
|
||||||||||||||||||||
| Statements of income: |
||||||||||||||||||||
| Total interest income |
$ | 21,656 | $ | 21,138 | $ | 20,584 | $ | 20,018 | $ | 20,390 | ||||||||||
| Total interest expense |
1,729 | 2,255 | 2,978 | 3,678 | 4,820 | |||||||||||||||
|
|
|
|
|
|
|
|
|
|
|
|||||||||||
| Net interest income |
19,927 | 18,883 | 17,606 | 16,340 | 15,570 | |||||||||||||||
| Provision for loan losses |
643 | 840 | 823 | 950 | 1,235 | |||||||||||||||
|
|
|
|
|
|
|
|
|
|
|
|||||||||||
| Net interest income after provision for loan losses |
19,284 | 18,043 | 16,783 | 15,390 | 14,335 | |||||||||||||||
| Noninterest income |
4,250 | 4,318 | 4,204 | 3,508 | 3,275 | |||||||||||||||
| Noninterest expense |
15,082 | 14,848 | 14,450 | 13,609 | 12,546 | |||||||||||||||
|
|
|
|
|
|
|
|
|
|
|
|||||||||||
| Income before income taxes |
8,452 | 7,513 | 6,537 | 5,289 | 5,064 | |||||||||||||||
| Income tax provision |
2,568 | 2,273 | 1,990 | 1,602 | 1,568 | |||||||||||||||
|
|
|
|
|
|
|
|
|
|
|
|||||||||||
| Net income |
$ | 5,884 | $ | 5,240 | $ | 4,547 | $ | 3,687 | $ | 3,496 | ||||||||||
|
|
|
|
|
|
|
|
|
|
|
|||||||||||
| Per share of common stock: |
||||||||||||||||||||
| Basic income per share |
$ | 2.15 | $ | 1.91 | $ | 1.66 | $ | 1.35 | $ | 1.28 | ||||||||||
| Diluted income per share |
2.15 | 1.91 | 1.66 | 1.35 | 1.28 | |||||||||||||||
| Dividends |
0.74 | 0.72 | 0.72 | 0.72 | 0.72 | |||||||||||||||
| Book value |
20.97 | 19.15 | 19.17 | 18.07 | 17.24 | |||||||||||||||
| Average basic common shares outstanding |
2,737,636 | 2,736,473 | 2,734,889 | 2,734,799 | 2,734,799 | |||||||||||||||
| Average diluted common shares outstanding |
2,739,078 | 2,738,477 | 2,735,141 | 2,734,838 | 2,734,799 | |||||||||||||||
| Year-end balances: |
||||||||||||||||||||
| Loans, net |
$ | 406,522 | $ | 374,040 | $ | 360,000 | $ | 320,100 | $ | 311,616 | ||||||||||
| Securities |
143,038 | 151,535 | 134,754 | 128,489 | 80,667 | |||||||||||||||
| Total assets |
620,981 | 596,465 | 586,900 | 551,233 | 457,056 | |||||||||||||||
| Deposits |
500,075 | 480,933 | 475,443 | 443,553 | 353,491 | |||||||||||||||
| Borrowings |
61,580 | 61,130 | 56,664 | 56,234 | 54,927 | |||||||||||||||
| Shareholders’ equity |
57,450 | 52,411 | 52,453 | 49,429 | 47,154 | |||||||||||||||
| Average balances: |
||||||||||||||||||||
| Loans, net |
$ | 400,876 | $ | 369,889 | $ | 338,441 | $ | 314,670 | $ | 309,121 | ||||||||||
| Securities |
145,065 | 138,976 | 132,567 | 93,851 | 77,967 | |||||||||||||||
| Total assets |
604,605 | 581,150 | 564,875 | 471,329 | 445,649 | |||||||||||||||
| Deposits |
479,330 | 468,395 | 453,526 | 367,865 | 334,073 | |||||||||||||||
| Borrowings |
67,657 | 57,882 | 57,735 | 52,717 | 62,951 | |||||||||||||||
| Shareholders’ equity |
55,529 | 52,787 | 51,384 | 48,674 | 47,081 | |||||||||||||||
| Select ratios: |
||||||||||||||||||||
| Net interest margin, tax equivalent basis |
3.56 | % | 3.51 | % | 3.36 | % | 3.71 | % | 3.73 | % | ||||||||||
| Return on average total assets |
0.97 | 0.90 | 0.80 | 0.78 | 0.78 | |||||||||||||||
| Return on average shareholders’ equity |
10.60 | 9.93 | 8.85 | 7.57 | 7.43 | |||||||||||||||
| Average shareholders’ equity as a percent of average total assets |
9.18 | 9.08 | 9.10 | 10.33 | 10.56 | |||||||||||||||
| Net loan charge-offs as a percent of average loans |
0.33 | 0.09 | 0.09 | 0.28 | 0.40 | |||||||||||||||
| Allowance for loan losses as a percent of loans at year-end |
1.07 | 1.34 | 1.26 | 1.26 | 1.28 | |||||||||||||||
| Shareholders’ equity as a percent of total year-end assets |
9.25 | 8.79 | 8.94 | 8.97 | 10.32 | |||||||||||||||
| Dividend payout ratio |
34.42 | 37.60 | 43.30 | 53.40 | 56.32 | |||||||||||||||
2014 Report to Shareholders | CSB Bancorp, Inc. 9
Table of Contents
2014 FINANCIAL REVIEW
RESULTS OF OPERATIONS
Net Income
CSB’s 2014 net income was $5.9 million compared to $5.2 million for 2013, representing an increase of 12%. Basic and diluted earnings per share were $2.15, up 13% from the prior year. The increased net income improved the return on average assets to 0.97% in 2014 from 0.90% in 2013 and return on average equity rose to 10.60% in 2014 from 9.93% in 2013.
Net income for 2013 was $5.2 million while basic and diluted earnings per share were $1.91, as compared to $4.5 million or $1.66 per share, for the year ended December 31, 2012. Net income increased 15% during 2013 as compared to 2012, due primarily to a $1.3 million increase in total net interest income and a $114 thousand increase in noninterest income. Partially offsetting the higher revenue were increases in noninterest expenses and federal income taxes. Return on average assets was 0.90% in 2013 compared to 0.80% in 2012, and return on average shareholders’ equity was 9.93% in 2013 as compared to 8.85% in 2012.
Net Interest Income
| (Dollars in thousands) | 2014 | 2013 | 2012 | |||||||||
|
|
||||||||||||
| Net interest income |
$ | 19,927 | $ | 18,883 | $ | 17,606 | ||||||
| Taxable equivalent1 |
285 | 307 | 290 | |||||||||
|
|
|
|
|
|
|
|||||||
| Net interest income, fully taxable equivalent |
$ | 20,212 | $ | 19,190 | $ | 17,896 | ||||||
|
|
|
|
|
|
|
|||||||
| Net interest yield |
3.51 | % | 3.46 | % | 3.31 | % | ||||||
| Taxable equivalent adjustment1 |
0.05 | 0.05 | 0.05 | |||||||||
|
|
|
|
|
|
|
|||||||
| Net interest yield-taxable equivalent |
3.56 | % | 3.51 | % | 3.36 | % | ||||||
|
|
|
|
|
|
|
|||||||
1Taxable equivalent adjustments have been computed assuming a 34% tax rate.
Net interest income is the largest source of the Company’s revenue and consists of the difference between interest income generated on earning assets and interest expense incurred on liabilities (deposits and short-term and long-term borrowings). Volumes, interest rates and composition of interest-earning assets and interest-bearing liabilities affect net interest income.
Net interest income increased $1.0 million or 6%, in 2014 compared to 2013, partially due to a 4% increase in average earning assets, and a favorable mix of increased average loan balances and decreased cash balances. Additionally, the net interest margin increased to 3.51%, from 3.46% last year. The margin improvement was primarily due to lower funding costs resulting from a 2% increase in total average deposits, with average balance increases in lower cost demand, savings and maturing time deposits repricing at lower rates. Net discount and accretion of purchase accounting adjustments for loans, time deposits and borrowings acquired decreased the net interest margin by 1 basis point in 2014 after having improved the net interest margin by 5 basis points during 2013 and 2 basis points in 2012.
Interest income increased $518 thousand or 2% in 2014 compared to 2013 due to the $31 million increase in average loan balances, partially offset by lower yields. Rates decreased on loans and tax exempt asset categories from reduced rates on new and repriced assets due to lending competition and the lower interest rate environment. Repricing of loans and lower rates to quality borrowers caused a decline in loan yields of 28 basis points in 2014 as compared to 2013. The increase in average loan volume helped mitigate the low interest rate environment. In 2014, average loan balances to average gross earning assets rose to 71%, compared to 69% in 2013. Securities yields continued to decline in 2014 with new and reinvestment cash flows being deployed at lower rates.
Interest income increased $554 thousand or 3% in 2013 compared to 2012 due to the $32 million increase in average loan balances, partially offset by lower yields. Rates decreased on all significant earning asset categories from reduced rates on new and repriced assets due to lending competition and the lower interest rate environment. Repricing of loans and lower rates to quality borrowers caused a decline in loan yields of 26 basis points in 2013 as compared to 2012. The increase in average loan volume helped mitigate the low interest rate environment. In 2013, average loan balances to average gross earning assets rose to 69%, compared to 64% in 2012.
Interest expense decreased $526 thousand or 23% in 2014 as compared to 2013 due to decreases in the cost of all categories of interest-bearing liabilities and a continued shift in the liability mix towards less expensive, noninterest-bearing demand deposits and savings accounts. Total average time deposits continue to decline with an emphasis on growing customers with multiple banking relationships, as opposed to single service time deposit customers.
Interest expense decreased $723 thousand or 24% in 2013 as compared to 2012 due to decreases in the cost of all categories of interest-bearing liabilities and a continued shift in the liability mix towards less expensive, noninterest-bearing demand deposits and savings accounts. Total average time deposits continue to decline due to an emphasis on growing customers with multiple banking relationships, as opposed to single service time deposit customers.
10 2014 Report to Shareholders | CSB Bancorp, Inc.
Table of Contents
2014 FINANCIAL REVIEW
The following table provides detailed analysis of changes in average balances, yield and net interest income:
| AVERAGE BALANCE SHEETS AND NET INTEREST MARGIN ANALYSIS | ||||||||||||||||||||||||||||||||||||||||
| 2014
|
2013
|
2012
| ||||||||||||||||||||||||||||||||||||||
|
|
| |||||||||||||||||||||||||||||||||||||||
| (Dollars in thousands)
|
Average
|
Interest
|
Average
|
Average
|
Interest
|
Average
|
Average
|
Interest
|
Average
| |||||||||||||||||||||||||||||||
|
| ||||||||||||||||||||||||||||||||||||||||
| Interest-earning assets |
||||||||||||||||||||||||||||||||||||||||
| Federal funds sold |
$ | 546 | $ | 1 | 0.22% | $ | 188 | $ | 0 | 0.16 | % | $ | 148 | $ | 0 | 0.12% | ||||||||||||||||||||||||
| Interest-earning deposits |
16,356 | 42 | 0.26 | 32,127 | 90 | 0.28 | 56,422 | 147 | 0.26 | |||||||||||||||||||||||||||||||
| Securities: |
||||||||||||||||||||||||||||||||||||||||
| Taxable |
128,973 | 2,857 | 2.22 | 122,314 | 2,572 | 2.10 | 118,867 | 2,672 | 2.25 | |||||||||||||||||||||||||||||||
| Tax exempt |
16,092 | 466 | 2.89 | 16,662 | 513 | 3.08 | 13,700 | 486 | 3.55 | |||||||||||||||||||||||||||||||
| Loans3 |
405,973 | 18,290 | 4.51 | 374,821 | 17,963 | 4.79 | 342,868 | 17,279 | 5.05 | |||||||||||||||||||||||||||||||
|
|
|
|
|
|
|
|
|
|
|
|
|
|||||||||||||||||||||||||||||
| Total interest-earning assets |
567,940 | 21,656 | 3.81% | 546,112 | 21,138 | 3.87 | % | 532,005 | 20,584 | 3.87% | ||||||||||||||||||||||||||||||
| Noninterest-earning assets |
||||||||||||||||||||||||||||||||||||||||
| Cash and due from banks |
13,663 | 12,911 | 12,399 | |||||||||||||||||||||||||||||||||||||
| Bank premises and equipment, net |
8,494 | 9,222 | 8,630 | |||||||||||||||||||||||||||||||||||||
| Other assets |
19,605 | 17,837 | 16,268 | |||||||||||||||||||||||||||||||||||||
| Allowance for loan losses |
(5,097 | ) | (4,932 | ) | (4,427 | ) | ||||||||||||||||||||||||||||||||||
|
|
|
|
|
|
|
|||||||||||||||||||||||||||||||||||
| Total assets |
$ | 604,605 | $ | 581,150 | $ | 564,875 | ||||||||||||||||||||||||||||||||||
|
|
|
|
|
|
|
|||||||||||||||||||||||||||||||||||
| Interest-bearing liabilities |
||||||||||||||||||||||||||||||||||||||||
| Demand deposits |
$ | 73,307 | 36 | 0.05% | $ | 70,648 | 42 | 0.06 | % | $ | 63,346 | 50 | 0.08% | |||||||||||||||||||||||||||
| Savings deposits |
151,822 | 130 | 0.09 | 141,638 | 144 | 0.10 | 135,035 | 230 | 0.17 | |||||||||||||||||||||||||||||||
| Time deposits |
129,676 | 1,000 | 0.77 | 149,340 | 1,534 | 1.03 | 163,997 | 2,043 | 1.25 | |||||||||||||||||||||||||||||||
| Borrowed funds |
67,657 | 563 | 0.83 | 57,882 | 535 | 0.92 | 57,735 | 655 | 1.13 | |||||||||||||||||||||||||||||||
|
|
|
|
|
|
|
|
|
|
|
|
|
|||||||||||||||||||||||||||||
| Total interest-bearing liabilities |
422,462 | 1,729 | 0.41% | 419,508 | 2,255 | 0.54 | % | 420,113 | 2,978 | 0.71% | ||||||||||||||||||||||||||||||
|
|
|
|
|
|
|
|
|
|
|
|
|
|||||||||||||||||||||||||||||
| Noninterest-bearing liabilities and shareholders’ equity |
||||||||||||||||||||||||||||||||||||||||
| Demand deposits |
124,525 | 106,769 | 91,148 | |||||||||||||||||||||||||||||||||||||
| Other liabilities |
2,089 | 2,086 | 2,230 | |||||||||||||||||||||||||||||||||||||
| Shareholders’ equity |
55,529 | 52,787 | 51,384 | |||||||||||||||||||||||||||||||||||||
|
|
|
|
|
|
|
|||||||||||||||||||||||||||||||||||
| Total liabilities and equity |
$ | 604,605 | $ | 581,150 | $ | 564,875 | ||||||||||||||||||||||||||||||||||
|
|
|
|
|
|
|
|||||||||||||||||||||||||||||||||||
| Net interest income |
$ | 19,927 | $ | 18,883 | $ | 17,606 | ||||||||||||||||||||||||||||||||||
|
|
|
|
|
|
|
|||||||||||||||||||||||||||||||||||
| Net interest margin |
3.51% | 3.46 | % | 3.31% | ||||||||||||||||||||||||||||||||||||
| Net interest spread |
3.40% | 3.33 | % | 3.16% | ||||||||||||||||||||||||||||||||||||
1Average balances have been computed on an average daily basis.
2Average rates have been computed based on the amortized cost of the corresponding asset or liability.
3Average loan balances include nonaccrual loans.
2014 Report to Shareholders | CSB Bancorp, Inc. 11
Table of Contents
2014 FINANCIAL REVIEW
The following table compares the impact of changes in average rates and changes in average volumes on net interest income:
| RATE/VOLUME ANALYSIS OF CHANGES | ||||||||||||||||||||||||||
| IN INCOME AND EXPENSE1 | ||||||||||||||||||||||||||
| 2014 v. 2013 | 2013 v. 2012 | |||||||||||||||||||||||||
| Net Increase | Net Increase | |||||||||||||||||||||||||
| (Dollars in thousands)
|
(Decrease)
|
Volume
|
Rate
|
(Decrease)
|
Volume
|
Rate
|
||||||||||||||||||||
|
|
||||||||||||||||||||||||||
| Increase (decrease) in interest income: |
||||||||||||||||||||||||||
| Federal funds |
$ | 1 | $ | 1 | $ | – | $ | – | $ | – | $ | – | ||||||||||||||
| Interest-earning deposits |
(48 | ) | (40 | ) | (8 | ) | (57 | ) | (68 | ) | 11 | |||||||||||||||
| Securities: |
||||||||||||||||||||||||||
| Taxable |
285 | 147 | 138 | (100 | ) | 72 | (172 | ) | ||||||||||||||||||
| Tax exempt |
(47 | ) | (16 | ) | (31 | ) | 27 | 91 | (64 | ) | ||||||||||||||||
| Loans |
327 | 1,403 | (1,076 | ) | 684 | 1,531 | (847 | ) | ||||||||||||||||||
|
|
|
|
|
|
|
|
|
|
|
|
|
|||||||||||||||
| Total interest income change |
518 | 1,495 | (977 | ) | 554 | 1,626 | (1,072 | ) | ||||||||||||||||||
|
|
|
|
|
|
|
|
|
|
|
|
|
|||||||||||||||
| Increase (decrease) in interest expense: |
||||||||||||||||||||||||||
| Demand deposits |
(6 | ) | 1 | (7 | ) | (8 | ) | 4 | (12 | ) | ||||||||||||||||
| Savings deposits |
(14 | ) | 9 | (23 | ) | (86 | ) | 7 | (93 | ) | ||||||||||||||||
| Time deposits |
(534 | ) | (152 | ) | (382 | ) | (509 | ) | (151 | ) | (358 | ) | ||||||||||||||
| Other borrowed funds |
28 | 81 | (53 | ) | (120 | ) | 1 | (121 | ) | |||||||||||||||||
|
|
|
|
|
|
|
|
|
|
|
|
|
|||||||||||||||
| Total interest expense change |
(526 | ) | (61 | ) | (465 | ) | (723 | ) | (139 | ) | (584 | ) | ||||||||||||||
|
|
|
|
|
|
|
|
|
|
|
|
|
|||||||||||||||
| Net interest income |
$ | 1,044 | $ | 1,556 | $ | (512 | ) | $ | 1,277 | $ | 1,765 | $ | (488 | ) | ||||||||||||
|
|
|
|
|
|
|
|
|
|
|
|
|
|||||||||||||||
1Changes attributable to both volume and rate, which cannot be segregated, have been allocated based on the absolute value of the change due to volume and the change due to rate.
Provision For Loan Losses
The provision for loan losses is determined by management as the amount required to bring the allowance for loan losses to a level considered appropriate to absorb probable future net charge-offs inherent in the loan portfolio as of period end. The provision for loan losses was $643 thousand in 2014, $840 thousand for 2013 and $823 thousand for 2012. Lower provision expense in 2014 reflects improving economic conditions which have led to a decrease in classified loans. See “Financial Condition – Allowance for Loan Losses” below for additional discussion and information relative to the provision for loan losses.
Noninterest Income
| YEAR ENDED DECEMBER 31 | ||||||||||||||||||||||||||||
| Change from 2013 | Change from 2012 | |||||||||||||||||||||||||||
| (Dollars in thousands)
|
2014
|
Amount
|
%
|
2013
|
Amount
|
%
|
2012
|
|||||||||||||||||||||
|
|
||||||||||||||||||||||||||||
| Service charges on deposit accounts |
$ | 1,269 | $ | (80 | ) | (5.9 | )% | $ | 1,349 | $ | 44 | 3.4 | % | $ | 1,305 | |||||||||||||
| Trust services |
811 | (15 | ) | (1.8 | ) | 826 | 155 | 23.1 | 671 | |||||||||||||||||||
| Debit card interchange fees |
910 | 131 | 16.8 | 779 | (18 | ) | (2.3 | ) | 797 | |||||||||||||||||||
| Securities gains |
133 | (26 | ) | (16.4 | ) | 159 | 159 | 100.0 | – | |||||||||||||||||||
| Gain on sale of loans, including MSR’s |
198 | (149 | ) | (42.9 | ) | 347 | (244 | ) | (41.3 | ) | 591 | |||||||||||||||||
| Other |
929 | 71 | 8.3 | 858 | 18 | 2.1 | 840 | |||||||||||||||||||||
|
|
|
|
|
|
|
|
|
|
|
|||||||||||||||||||
| Total noninterest income |
$ | 4,250 | $ | (68 | ) | (1.6 | )% | $ | 4,318 | $ | 114 | 2.7 | % | $ | 4,204 | |||||||||||||
|
|
|
|
|
|
|
|
|
|
|
|||||||||||||||||||
12 2014 Report to Shareholders | CSB Bancorp, Inc.
Table of Contents
2014 FINANCIAL REVIEW
Noninterest income decreased $68 thousand, or 2% in 2014 compared to the same period in 2013. Net gains on sales of mortgage loans including mortgage servicing rights (“MSRs”) decreased 43% due to the continuing slowdown in mortgage refinance activity during 2014. The Bank originated and sold $6 million in mortgage loans in 2014 as compared to the sale of $12 million of loans in 2013. Service charges on deposits which are primarily customer overdraft fees, decreased 6% in 2014, with an 11% decrease in overdraft fees due to increasing health of consumer deposit balances. Trust fees increased 11% as assets under management increased from overall market improvements and customer development initiatives. The average market value of trust assets under management in 2014 was $95 million compared to $86 million in 2013. However, brokerage fees contained within trust services decreased $80 thousand in 2014 contributing to the net decrease of 2%. With interest rates declining during 2014, available-for-sale securities with gains of $133 thousand were sold as net loan demand increased during 2014.
Noninterest income increased $114 thousand, or 3% in 2013 compared to the same period in 2012. Trust and brokerage fees increased 23% as assets under management increased from overall market improvements and customer development initiatives. The average market value of trust assets under management in 2013 was $86 million as compared to $76 million in 2012. Brokerage fees increased $86 thousand in 2013 as customers returned to stock and annuity investments to increase their returns. Service charges on deposits which are primarily customer overdraft fees, increased 3% in 2013 due to growth in deposits. Net gains on sales of mortgage loans including MSRs decreased 41% due to a significant slowdown in mortgage refinance activity during 2013. The Bank originated and sold $12 million in mortgage loans in 2013 as compared to the sale of $20 million of loans in 2012. With historical low interest rates during the first half of 2013, available-for-sale securities with gains of $159 thousand were sold as net loan demand increased.
Noninterest Expenses
| YEAR ENDED DECEMBER 31 | ||||||||||||||||||||||||||||
| Change from 2013 | Change from 2012 | |||||||||||||||||||||||||||
| (Dollars in thousands)
|
2014
|
Amount
|
%
|
2013
|
Amount
|
%
|
2012
|
|||||||||||||||||||||
|
|
||||||||||||||||||||||||||||
| Salaries and employee benefits |
$ | 8,321 | $ | 60 | 0.7 | % | $ | 8,261 | $ | 301 | 3.8 | % | $ | 7,960 | ||||||||||||||
| Occupancy expense |
1,014 | (12 | ) | (1.2 | ) | 1,026 | 1 | 0.1 | 1,025 | |||||||||||||||||||
| Equipment expense |
715 | (4 | ) | (0.6 | ) | 719 | 101 | 16.3 | 618 | |||||||||||||||||||
| Professional and director fees |
725 | 97 | 15.4 | 628 | (186 | ) | (22.9 | ) | 814 | |||||||||||||||||||
| Franchise tax expense |
361 | (220 | ) | (37.9 | ) | 581 | 39 | 7.2 | 542 | |||||||||||||||||||
| Marketing and public relations |
378 | (17 | ) | (4.3 | ) | 395 | 3 | 0.8 | 392 | |||||||||||||||||||
| Software expense |
727 | 197 | 37.2 | 530 | 139 | 35.5 | 391 | |||||||||||||||||||||
| Debit card expense |
421 | 130 | 44.7 | 291 | (40 | ) | (12.1 | ) | 331 | |||||||||||||||||||
| Amortization of intangible assets |
130 | (5 | ) | (4.4 | ) | 135 | (5 | ) | (3.6 | ) | 140 | |||||||||||||||||
| FDIC insurance |
358 | (1 | ) | (0.3 | ) | 359 | 31 | 9.5 | 328 | |||||||||||||||||||
| Branch acquisition expense |
– | – | – | – | (8 | ) | (100.0 | ) | 8 | |||||||||||||||||||
| Other real estate expenses |
– | (9 | ) | N.M. | 9 | (24 | ) | N.M. | 33 | |||||||||||||||||||
| Other |
1,932 | 18 | (0.2 | ) | 1,914 | 46 | 2.2 | 1,868 | ||||||||||||||||||||
|
|
|
|
|
|
|
|
|
|
|
|||||||||||||||||||
| Total noninterest expenses |
$ | 15,082 | $ | 234 | 1.6 | % | $ | 14,848 | $ | 398 | 2.8 | % | $ | 14,450 | ||||||||||||||
|
|
|
|
|
|
|
|
|
|
|
|||||||||||||||||||
N.M., not a meaningful value
Noninterest expense increased $234 thousand, or 2% in 2014 compared to 2013. Salaries and employee benefits increased $60 thousand due to base compensation increasing $185 thousand as a result of additional full time employees and annual adjustments. Capitalization of employee costs of loan origination and benefit decreases amounted to $125 thousand. Software expense increased $197 thousand in 2014 due to a full year increase of the cost of new core processing and loan documentation software. Equipment expense decreased $4 thousand in 2014 as compared to 2013. Franchise tax expense decreased $220 thousand in 2014, to $361 thousand, with the implementation of the new Ohio Financial Institutions Tax. Debit card expense increased $130 thousand in 2014, a result of one time charges of $40 thousand to convert to a new third party processor, $26 thousand additional fraud losses and increased customer usage. Professional and director fees increased $97 thousand, a result of the increase in legal fees surrounding loan collections of $118 thousand primarily incurred in the disposition of two commercial loan relationships.
2014 Report to Shareholders | CSB Bancorp, Inc. 13
Table of Contents
2014 FINANCIAL REVIEW
Noninterest expense increased $398 thousand, or 3% in 2013 as compared to 2012. Salaries and employee benefits increased $301 thousand due to annual adjustments to compensation of $211 thousand and benefit increases of $90 thousand due to higher payroll taxes and retirement benefits. Software expense rose $139 thousand in 2013 due to the acquisition of new core processing and loan documentation software. Equipment expense increased $101 thousand in 2013 as compared to 2012 with the acquisition of a new core processor, new telephone system and new ATMs in the branch network. Franchise tax expense increased $39 thousand in 2013 to $581 thousand but is expected to decrease in 2014.
Income Taxes
The provision for income taxes amounted to $2.6 million in 2014, $2.3 million in 2013 and $2.0 million in 2012, resulting in an effective rate of 30.4% in 2014, 30.3% in 2013 and 30.4% in 2012. The slight increase in the effective tax rate during 2014 as compared to 2013 is due primarily to increased income.
FINANCIAL CONDITION
Total assets of the Company were $621 million at December 31, 2014, compared to $596 million at December 31, 2013, representing an increase of $25 million, or 4%. Net loans increased $32 million, or 9%, while investment securities decreased $8 million, or 6% and interest-earning deposits with other banks increased $2 million. Deposits increased $19 million, or 4%, while other borrowings from the FHLB increased by $2 million, or 20%.
Securities
Total investment securities decreased $8 million, or 6% to $143 million at year-end 2014. CSB’s portfolio is primarily comprised of agency mortgage-backed securities, other government agencies’ debt, and obligations of state and political subdivisions. Restricted securities consist primarily of FHLB stock.
The Company has no exposure to government-sponsored enterprise preferred stocks, collateralized debt obligations or trust preferred securities. The Company’s municipal bond portfolio consists of both taxable and tax-exempt general obligation and revenue bonds. As of December 31, 2014, $15.9 million, or 87%, held an S&P or Moody’s investment grade rating and $2.4 million or 13% were non-rated. The municipal portfolio includes a broad spectrum of counties, towns, universities and school districts with 98% of the portfolio originating in Ohio and 2% in Pennsylvania. Total gross unrealized security losses within the portfolio were 0.3% of total available-for-sale securities at December 31, 2014, reflecting interest rate fluctuations, not credit downgrades.
During the third quarter 2013, the Company reclassified $39 million of U.S. Agency and U.S. Agency collateralized mortgage-backed obligations from available-for-sale to held-to-maturity. The Company considers the held-to-maturity classification to be more appropriate in a rising interest rate environment as other comprehensive income is no longer negatively impacted by the decline in value on specific bonds. The Company has the ability and the intent to hold the longer-term Agency debt securities and the mortgage-backed securities to maturity. On the date of transfer, the $1.9 million gross unrealized loss became a discount to the carrying value of the bonds while the net of tax unrealized loss remained in shareholders’ equity in other comprehensive income. The effect on interest income of the accretion of the discount on the bonds is basically offset by the amortization of the other comprehensive loss over the life of the bonds.
One of the primary functions of the securities portfolio is to provide a source of liquidity and it is structured such that maturities and cash flows satisfy the Company’s liquidity needs and asset/liability management requirements.
Loans
Total loans increased $32 million, or 8% during 2014. Volume increases were recognized in commercial and commercial real estate loans of $16 million, or 7%, and residential real estate loans of $10 million, or 9%. Construction loans increased $4 million, or 30%. During 2014, business expansion continued in the Company’s newly expanded markets. Aided by low interest rates, commercial and commercial real estate loans continued to increase in 2014.
As investment spreads tightened in the mortgage-backed securities market, the Company developed marketing campaigns for fifteen year, lower fee, fixed-rate, owner occupied loans which drove the $10 million increase in residential real estate loans. Attractive interest rates in the secondary market continued to drive consumer demand for longer-term 1-4 family fixed rate residential mortgages during 2014 and the Company sold $6 million of originated mortgages into the secondary market as compared to $12 million in 2013. This demand for low fixed-rate mortgages included some refinancing of the Company’s in-house mortgage portfolio. Demand for home equity loans flattened in 2014, with balances decreasing $114 thousand as many consumers rewrote their floating rate equity line and first mortgage into a lower rate fixed rate mortgage. Installment lending improved with consumer loans increasing 18% on a year-over-year basis to $7.9 million at December 31, 2014.
14 2014 Report to Shareholders | CSB Bancorp, Inc.
Table of Contents
2014 FINANCIAL REVIEW
Management anticipates the Company’s local service areas will continue to exhibit modest economic growth in line with the past three years. Commercial and commercial real estate loans comprise approximately 64% and 65% of the total loan portfolio at year-end 2014 and 2013, respectively. Residential real estate loans increased from 29% to approximately 30% between December 31, 2013 and December 31, 2014. Construction and land development loans remained stable at 4% of the total portfolio between 2013 and 2014. The Company is well within the respective regulatory guidelines for investment in construction development and investment property loans that are not owner occupied.
Most of the Company’s lending activity is with customers primarily located within Holmes, Tuscarawas, Wayne and Stark counties in Ohio. Credit concentrations, including commitments, as determined using North American Industry Classification Codes (NAICS), to the four largest industries compared to total loans at December 31, 2014 included $30 million, or 7% of total loans to lessors of non-residential buildings or dwellings; $19 million, or 5% of total loans to logging, sawmills and timber tract operations; $18 million, or 4% of total loans to lessors of residential real estate and $16 million, or 4% of total loans to borrowers in the hotel, motel and lodging business. These loans are generally secured by real property and equipment, and repayment is expected from operational cash flow. Credit evaluation is based on an evaluation of cash flow coverage of principal and interest payments and the adequacy of the collateral received.
Nonperforming Assets, Impaired Loans and Loans Past Due 90 Days or More
Nonperforming assets consist of nonaccrual loans, loans past due 90 days and still accruing and other real estate acquired through or in lieu of foreclosure. Other impaired loans include certain loans that are internally classified as substandard or doubtful. Loans are placed on nonaccrual status when they become past due 90 days or more, or when mortgage loans are past due as to principal and interest 120 days or more, unless they are both well secured and in the process of collection.
NONPERFORMING ASSETS
| DECEMBER 31 |
||||||||
| (Dollars in thousands)
|
2014
|
2013
|
||||||
|
|
||||||||
| Nonaccrual loans: |
||||||||
| Commercial |
$ | 1,071 | $ | 84 | ||||
| Commercial real estate |
1,734 | 1,108 | ||||||
| Residential real estate |
863 | 1,042 | ||||||
| Construction & land development |
– | – | ||||||
| Loans past due 90 days and still accruing: |
||||||||
| Commercial |
1 | – | ||||||
| Commercial real estate |
– | 40 | ||||||
| Residential real estate |
280 | 46 | ||||||
| Construction & land development |
– | 950 | ||||||
|
|
|
|
|
|||||
| Total nonperforming loans |
3,949 | 3,270 | ||||||
| Other real estate owned |
– | – | ||||||
|
|
|
|
|
|||||
| Total nonperforming assets |
$ | 3,949 | $ | 3,270 | ||||
|
|
|
|
|
|||||
| Nonperforming assets as a percentage of loans plus other real estate |
0.96 | % | 0.86 | % | ||||
Allowance for Loan Losses
The allowance for loan losses is maintained at a level considered by management to be adequate to cover loan losses that are currently anticipated based on past loss experience, general economic conditions, changes in mix and size of the loan portfolio, information about specific borrower situations and other factors and estimates which are subject to change over time. Management periodically reviews selected large loans, delinquent and other problem loans and selected other loans. Collectability of these loans is evaluated by considering the current financial position and performance of the borrower, estimated market value of the collateral, the Company’s collateral position in relationship to other creditors, guarantees and other potential sources of repayment. Management forms judgments, which are in part subjective, as to the probability of loss and the amount of loss on these loans as well as other loans taken together. The Company’s Allowance for Loan Losses Policy includes, among other items, provisions for classified loans and a provision for the remainder of the portfolio based on historical data, including past charge-offs.
2014 Report to Shareholders | CSB Bancorp, Inc. 15
Table of Contents
2014 FINANCIAL REVIEW
| ALLOWANCE FOR LOAN LOSSES | FOR THE YEAR ENDED | |||||||
|
(Dollars in thousands)
|
2014
|
2013
|
||||||
|
|
||||||||
|
Beginning balance of allowance for loan losses |
$ | 5,085 | $ | 4,580 | ||||
| Provision for loan losses |
643 | 840 | ||||||
| Charge-offs: |
||||||||
| Commercial |
985 | 149 | ||||||
| Commercial real estate |
379 | 108 | ||||||
| Residential real estate & home equity |
27 | 82 | ||||||
| Construction & land development |
– | – | ||||||
| Consumer |
11 | 48 | ||||||
| Deposit accounts |
20 | 35 | ||||||
| Credit cards |
– | 6 | ||||||
|
|
|
|
|
|||||
| Total charge-offs |
1,422 | 428 | ||||||
| Recoveries: |
||||||||
| Commercial |
21 | 15 | ||||||
| Commercial real estate |
8 | – | ||||||
| Residential real estate & home equity |
25 | 18 | ||||||
| Construction & land development |
– | – | ||||||
| Consumer |
14 | 50 | ||||||
| Deposit accounts |
7 | 10 | ||||||
| Credit cards |
– | – | ||||||
|
|
|
|
|
|||||
| Total recoveries |
75 | 93 | ||||||
|
|
|
|
|
|||||
| Net charge-offs |
1,347 | 335 | ||||||
|
|
|
|
|
|||||
| Ending balance of allowance for loan losses |
$ | 4,381 | $ | 5,085 | ||||
|
|
|
|
|
|||||
| Net charge-offs as a percentage of average total loans |
0.33 | % | 0.09 | % | ||||
| Allowance for loan losses as a percentage of total loans |
1.07 | 1.34 | ||||||
| Allowance for loan losses to total nonperforming loans |
1.11 | x | 1.56 | x | ||||
| Components of the allowance for loan losses: |
||||||||
| General reserves |
$ | 4,197 | $ | 4,301 | ||||
| Specific reserve allocations |
184 | 784 | ||||||
|
|
|
|
|
|||||
| Total allowance for loan losses |
$ | 4,381 | $ | 5,085 | ||||
|
|
|
|
|
|||||
The allowance for loan losses totaled $4.4 million, or 1.07%, of total loans at year-end 2014 as compared to $5.1 million, or 1.34% of total loans at year-end 2013. Net charge-offs for 2014 totaled $1.3 million as compared to net charge-offs of $335 thousand in 2013. The majority of the charge-offs were attributed to one commercial relationship which had been specifically reserved for during 2014.
The Company maintains an internal watch list on which it places loans where management’s analysis of the borrower’s operating results and financial condition indicates that the borrower’s cash flows are inadequate to meet its debt service requirements and loans where there exists an increased risk that such a shortfall may occur. Nonperforming loans, which consist of loans past due 90 days or more and nonaccrual loans aggregated $3.9 million, or 1.0% of loans at year-end 2014 as compared to $3.3 million, or 0.9% of loans at year-end 2013. Impaired loans were $9.2 million at year-end 2014 as compared to $10.7 million at year-end 2013. Impaired loans as a percentage of total loans declined from 2013 to 2014 and reflect economic stabilization in the Company’s market area with decreasing unemployment levels. Management has assigned loss allocations to absorb the estimated losses on these impaired loans, and these allocations are included in the total allowance for loan losses balance.
16 2014 Report to Shareholders | CSB Bancorp, Inc.
Table of Contents
2014 FINANCIAL REVIEW
Other Assets
Net premises and equipment decreased $404 thousand to $8.3 million at year-end 2014 primarily because depreciation expense exceeded the purchase of equipment and furniture in 2014. There was no other real estate owned at December 31, 2014 or 2013. Bank-owned life insurance of $1 million was purchased on the life of a senior management member during 2013. At December 31, 2014 the Company recognized a net deferred tax asset of $377 thousand as compared to a net deferred tax asset of $1.2 million at December 31, 2013. The change in the Company’s net deferred tax position resulted primarily from the decrease in the net deferred tax asset related to the unrealized loss on securities available for sale.
Deposits
The Company’s deposits are obtained primarily from individuals and businesses located in its market area. For deposits, the Company must compete with products offered by other financial institutions as well as alternative investment options. Demand and savings deposits increased for the year ended 2014, due to focused retail and business banking strategies to obtain more account relationships as well as customers reflecting their preference for shorter maturities.
| December 31 | Change from 2013 | |||||||||||||||
| (Dollars in thousands)
|
2014
|
2013
|
Amount
|
%
|
||||||||||||
|
|
||||||||||||||||
|
Noninterest-bearing demand |
$ | 139,251 | $ | 120,325 | $ | 18,926 | 15.7 | % | ||||||||
| Interest-bearing demand |
77,725 | 76,327 | 1,398 | 1.8 | ||||||||||||
| Traditional savings |
84,548 | 76,630 | 7,918 | 10.3 | ||||||||||||
| Money market savings |
70,788 | 73,307 | (2,519 | ) | (3.4 | ) | ||||||||||
| Time deposits in excess of $100,000 |
43,130 | 42,562 | 568 | 1.3 | ||||||||||||
| Other time deposits |
84,633 | 91,782 | (7,149 | ) | (7.8 | ) | ||||||||||
|
|
|
|
|
|
|
|||||||||||
| Total deposits |
$ | 500,075 | $ | 480,933 | $ | 19,142 | 4.0 | % | ||||||||
|
|
|
|
|
|
|
|||||||||||
Other Funding Sources
The Company obtains additional funds through securities sold under repurchase agreements, overnight borrowings from the FHLB or other financial institutions and advances from the FHLB. Short-term borrowings, which consist of securities sold under repurchase agreements, decreased $2 million; while other borrowings, which consist of FHLB advances, increased $2 million as the result of borrowing $5 million in a long-term amortizing advance to partially offset the interest rate risk of booking fifteen-year fixed-rate mortgages.
CAPITAL RESOURCES
Total shareholders’ equity increased to $57.5 million at December 31, 2014 as compared to $52.4 million at December 31, 2013. This increase was primarily due to $5.9 million of net income and $1.2 million other comprehensive income, which were offset by the payment of $2.0 million cash dividends in 2014. The Board of Directors approved a Stock Repurchase Program on July 7, 2005 that would allow the repurchase of up to 10% of the Company’s then-outstanding common shares. Repurchased shares are to be held as treasury stock and would be available for general corporate purposes. At December 31, 2014, approximately forty-one thousand shares could still be repurchased under the current authorized program. No shares were repurchased in 2014 or 2013.
In July 2013, the Federal Reserve adopted final rules effective on January 1, 2015 to implement the Basel III and regulatory capital changes required by the Dodd-Frank Act. These changes will apply to the Company and the Bank. Among other things, the rules include new minimum risk-based and leverage capital requirements for all banking organizations and removal of references to credit ratings. A new capital conservation buffer of 2.5% of risk-weighted assets is being phased-in over a transition period ending January 1, 2019. Failure to maintain the required ratios will restrict or prohibit dividends, share repurchases and discretionary bonuses. Management has evaluated the new rules and their effects on the Company and the Bank, and believes the Company and the Bank will remain “well-capitalized” under the new rules.
Banking regulations have established minimum capital ratios for banks and bank holding companies. Therefore, the Company and the Bank must meet a risk-based capital requirement, which defines two tiers of capital and compares each to the Company’s “risk-weighted assets.” The Company’s assets and certain off-balance-sheet items, such as loan commitments, are each assigned a risk factor such that assets with potentially higher credit risk will require more capital support than assets with lower risk. These regulations require the Company to have a minimum total risk-based capital ratio of 8%, at least half of which must be Tier 1 capital. The Company’s Tier 1 capital is its shareholders’ equity before any unrealized gain or loss on securities available for sale, while total risk-based capital includes Tier 1 capital and a limited amount of the allowance for loan losses. In addition, a bank or bank holding company’s leverage ratio (which for the Company equals its shareholders’ equity before any unrealized gain or loss on securities available-for-sale, divided by average assets) must be maintained at a minimum of 4%. The Company and Bank’s actual and required capital amounts are disclosed in Note 12 to the consolidated financial statements.
2014 Report to Shareholders | CSB Bancorp, Inc. 17
Table of Contents
2014 FINANCIAL REVIEW
Dividends paid by the Bank to CSB are the primary source of funds available to the Company for payment of dividends to shareholders and for other working capital needs. The payment of dividends by the Bank to the Company is subject to restrictions by regulatory authorities, which generally limit dividends to current year net income and the prior two years net retained earnings, as defined by regulation. In addition, dividend payments generally cannot reduce regulatory capital levels below the minimum regulatory guidelines discussed above.
LIQUIDITY
| December 31 | ||||||||||||||||
| (Dollars in millions)
|
2014
|
2013
|
Change
|
|||||||||||||
|
|
||||||||||||||||
|
Cash and cash equivalents |
$ | 44 | $ | 43 | $ | 1 | ||||||||||
| Unused lines of credit |
46 | 42 | 4 | |||||||||||||
| Unpledged securities at fair market value |
48 | 42 | 6 | |||||||||||||
|
|
|
|
|
|
|
|||||||||||
| $ | 138 | $ | 127 | $ | 11 | |||||||||||
|
|
|
|
|
|
|
|||||||||||
| Net deposits and short-term liabilities |
$ | 497 | $ | 473 | $ | 24 | ||||||||||
|
|
|
|
|
|
|
|||||||||||
| Liquidity ratio |
27.9 | % | 26.9 | % | ||||||||||||
| Minimum board approved liquidity ratio |
20.0 | % | 20.0 | % | ||||||||||||
Liquidity refers to the Company’s ability to generate sufficient cash to fund current loan demand, meet deposit withdrawals, pay operating expenses and meet other obligations. Liquidity is monitored by CSB’s Asset Liability Committee. The Company was within all Board-approved limits at December 31, 2014 and 2013. Additional sources of liquidity include net income, loan repayments, the availability or borrowings and adjustments of interest rates to attract deposit accounts.
As summarized in the consolidated statements of cash flows, the most significant investing activities for the Company in 2014 included net loan originations of $33 million and the maturities and repayments of securities totaling $45 million, offset by $38 million in securities purchases. The Company’s financing activities included a $19 million increase in deposits, a $2 million decrease in securities sold under agreements to repurchase and a $2 million net increase in FHLB advances.
QUANTITATIVE AND QUALITATIVE DISCLOSURES ABOUT MARKET RISK
The most significant market risk to which the Company is exposed is interest rate risk. The business of the Company and the composition of its balance sheet consist of investments in interest-earning assets (primarily loans and securities), which are funded by interest-bearing liabilities (deposits and borrowings). These financial instruments have varying levels of sensitivity to changes in the market rates of interest, resulting in market risk. None of the Company’s financial instruments are held for trading purposes.
The Board of Directors establishes policies and operating limits with respect to interest rate risk. The Company manages interest rate risk regularly through its Asset Liability Committee. The Committee meets on a monthly basis and reviews various asset and liability management information including, but not limited to, the Company’s liquidity position, projected sources and uses of funds, interest rate risk position and economic conditions.
Interest rate risk is monitored primarily through the use of an earnings simulation model. The model is highly dependent on various assumptions, which change regularly as the balance sheet and market interest rates change. The earnings simulation model projects changes in net interest income resulting from the effect of changes in interest rates. The analysis is performed quarterly over a twenty-four month horizon. The analysis includes two balance sheet models, one based on a static balance sheet and one on a dynamic balance sheet with projected growth in assets and liabilities. This analysis is performed by estimating the expected cash flows of the Company’s financial instruments using interest rates in effect at year-end 2014 and 2013. Interest rate risk policy limits are tested by measuring the anticipated change in net interest income over a two-year period. The tests assume a quarterly ramped 100, 200, 300 and 400 basis point increase and a 100 basis point decrease in 2014 in market interest rates as compared to a stable rate environment or base model.
18 2014 Report to Shareholders | CSB Bancorp, Inc.
Table of Contents
2014 FINANCIAL REVIEW
The following table reflects the change to interest income for the first twelve month period of the twenty-four month horizon.
Net Interest Income at Risk
| December 31, 2014 | ||||||||||
| (Dollars in thousands) | Change In Interest Rates (Basis Points) |
Net Interest Income |
Dollar Change |
Percentage Change |
Board Policy Limits | |||||
|
+ 400 |
$ 21,408 |
$ 1,144 |
5.6% |
± 25% | ||||||
| + 300 | 21,082 | 818 | 4.0 | ± 15 | ||||||
| + 200 | 20,766 | 502 | 2.5 | ± 10 | ||||||
| + 100 | 20,454 | 190 | 0.9 | ± 5 | ||||||
| 0 | 20,264 | – | – | |||||||
| – 100 | 20,022 | (242) | (1.1) | ± 5 | ||||||
| December 31, 2013 | ||||||||||
|
+ 400 |
$ 20,812 |
$ 962 |
4.8% |
± 25% | ||||||
| + 300 | 20,507 | 657 | 3.3 | ± 15 | ||||||
| + 200 | 20,217 | 367 | 1.8 | ± 10 | ||||||
| + 100 | 19,966 | 116 | 0.6 | ± 5 | ||||||
| 0 | 19,850 | – | – | |||||||
| – 100 | 19,644 | (206) | (1.0) | ± 5 | ||||||
Management reviews Net Interest Income at Risk with the Board on a periodic basis. The Company was within all Board-approved limits at December 31, 2014 and 2013.
Economic Value of Equity at Risk
| December 31, 2014 | ||||
| Change In Interest Rates (Basis Points) |
Percentage Change |
Board Policy Limits | ||
|
+ 400 |
17.7% |
± 35% | ||
| + 300 | 15.7 | ± 30 | ||
| + 200 | 13.0 | ± 20 | ||
| + 100 | 8.3 | ± 15 | ||
| – 100 | (8.8) | ± 15 | ||
| December 31, 2013 | ||||
|
+ 400 |
9.8% |
± 35% | ||
| + 300 | 8.8 | ± 30 | ||
| + 200 | 7.4 | ± 20 | ||
| + 100 | 4.7 | ± 15 | ||
| – 100 | (7.6) | ± 15 | ||
2014 Report to Shareholders | CSB Bancorp, Inc. 19
Table of Contents
2014 FINANCIAL REVIEW
The economic value of equity is calculated by subjecting the period-end balance sheet to changes in interest rates and measuring the impact of the changes on the values of the assets and liabilities. Hypothetical changes in interest rates are then applied to the financial instruments, and the cash flows and fair values are again estimated using these hypothetical rates. For the net interest income estimates, the hypothetical rates are applied to the financial instruments based on the assumed cash flows.
Management periodically measures and reviews the Economic Value of Equity at Risk with the Board. At December 31, 2014, the market value of equity as a percent of base in a 400 basis point rising rate environment indicates an increase of 17.7%, as compared to an increase of 9.8% as of December 31, 2013. The Company added the review of a -100 basis change in interest rates during 2013 as rates had risen at December 31, 2013 in comparison with 2012. The Company was within all Board-approved limits at December 31, 2014 and 2013.
SIGNIFICANT ASSUMPTIONS AND OTHER CONSIDERATIONS
The above analysis is based on numerous assumptions, including relative levels of market interest rates, loan prepayments and reactions of depositors to changes in interest rates, and should not be relied upon as being indicative of actual results. Furthermore, the analysis does not necessarily contemplate all actions the Company may undertake in response to changes in interest rates.
U.S. Treasury securities, obligations of U.S. Government corporations and agencies and obligations of states and political subdivisions will generally repay at their stated maturity, or if callable prior to their final maturity date. Mortgage-backed security payments increase when interest rates are low and decrease when interest rates rise. Most of the Company’s loans permit the borrower to prepay the principal balance prior to maturity without penalty. The likelihood of prepayment depends on a number of factors, including current interest rate and interest rate index (if any) on the loan, the financial ability of the borrower to refinance, the economic benefit to be obtained from refinancing, availability of refinancing at attractive terms, as well as economic and other factors in specific geographic areas which affect the sales and price levels of residential and commercial property. In a changing interest rate environment, prepayments may increase or decrease on fixed and adjustable rate loans depending on the current relative levels and expectations of future short-term and long-term interest rates. Prepayments on adjustable rate loans generally increase when long-term interest rates fall or are at historically low levels relative to short-term interest rates, thus making fixed rate loans more desirable. While savings and checking deposits generally may be withdrawn upon the customer’s request without prior notice, a continuing relationship with customers resulting in future deposits and withdrawals is generally predictable, resulting in a dependable and uninterrupted source of funds. Time deposits generally have early withdrawal penalties, which discourage customer withdrawal prior to maturity. Short-term borrowings have fixed maturities. Certain advances from the FHLB carry prepayment penalties and are expected to be repaid in accordance with their contractual terms.
FAIR VALUE MEASUREMENTS
The Company discloses the estimated fair value of its financial instruments at December 31, 2014 and 2013 in Note 15 to the consolidated financial statements.
OFF-BALANCE SHEET ARRANGEMENTS, CONTRACTUAL OBLIGATIONS, AND CONTINGENT LIABILITIES AND COMMITMENTS
The following table summarizes the Company’s loan commitments, including letters of credit, as of December 31, 2014:
| Amount of Commitment to Expire Per Period | ||||||||||||||||||||
| (Dollars in thousands) | Total | Less than | 1 to 3 | 3 to 5 | Over 5 | |||||||||||||||
| Type of Commitment
|
Amount
|
1 year
|
Years
|
Years
|
Years
|
|||||||||||||||
|
|
||||||||||||||||||||
| Commercial lines-of-credit |
$ | 77,799 | $ | 69,904 | $ | 1,750 | $ | 1,223 | $ | 4,922 | ||||||||||
| Real estate lines-of-credit |
37,580 | 2,491 | 5,101 | 5,456 | 24,532 | |||||||||||||||
| Consumer lines-of-credit |
881 | 881 | – | – | – | |||||||||||||||
| Credit cards lines-of-credit |
3,493 | 3,493 | – | – | – | |||||||||||||||
| Overdraft privilege |
6,634 | 6,634 | – | – | – | |||||||||||||||
| Commercial real estate loan commitments |
– | – | – | – | – | |||||||||||||||
| Letters of credit |
1,778 | 1,778 | – | – | – | |||||||||||||||
|
|
|
|
|
|
|
|
|
|
|
|||||||||||
| Total commitments |
$ | 128,165 | $ | 85,181 | $ | 6,851 | $ | 6,679 | $ | 29,454 | ||||||||||
|
|
|
|
|
|
|
|
|
|
|
|||||||||||
20 2014 Report to Shareholders | CSB Bancorp, Inc.
Table of Contents
2014 FINANCIAL REVIEW
As indicated in Note 10 to the consolidated financial statements, the Company had $128 million in total loan commitments at the end of 2014, with $85 million of that amount expiring within one year. All lines-of-credit represent either fee-paid or legally binding loan commitments for the loan categories noted. Letters of credit are also included in the amounts noted in the table since the Company requires that each letter of credit be supported by a loan agreement. The commercial and consumer lines represent both unsecured and secured obligations. The real estate lines are secured by mortgages on residential and nonresidential property. It is anticipated that a significant portion of these lines will expire without being drawn upon.
The following table summarizes the Company’s other contractual obligations, exclusive of interest, as of December 31, 2014:
| Payment Due by Period | ||||||||||||||||||||
| (Dollars in thousands) Contractual Obligations
|
Total
|
Less than
|
1 to 3
|
3 to 5
|
Over 5
|
|||||||||||||||
|
|
||||||||||||||||||||
|
Total time deposits |
$ |
127,763 |
|
$ | 66,964 | $ | 41,065 | $ | 19,712 | $ | 22 | |||||||||
| Short-term borrowings |
46,627 | 46,627 | – | – | – | |||||||||||||||
| Other borrowings |
14,953 | 1,488 | 11,809 | 923 | 733 | |||||||||||||||
| Operating leases |
498 | 294 | 204 | – | – | |||||||||||||||
|
|
|
|
|
|
|
|
|
|
|
|||||||||||
| Total obligations |
$ | 189,841 | $ | 115,373 | $ | 53,078 | $ | 20,635 | $ | 755 | ||||||||||
|
|
|
|
|
|
|
|
|
|
|
|||||||||||
The other borrowings noted in the preceding table represent borrowings from the FHLB of Cincinnati. The notes require payment of interest on a monthly basis with principal due in monthly installments or at maturity, depending upon the issue. The obligations bear stated fixed interest rates and stipulate a prepayment penalty if the note’s interest rate exceeds the current market rate for similar borrowings at the time of repayment. As the notes mature, the Company evaluates the liquidity and interest rate circumstances, at that time, to determine whether to pay off or renew the note. The evaluation process typically includes the strength of current and projected customer loan demand, the Company’s federal funds sold or purchased position, projected cash flows from maturing investment securities, the current and projected market interest rate environment, local and national economic conditions and customer demand for the Company’s deposit product offerings.
CRITICAL ACCOUNTING POLICIES
The Company’s consolidated financial statements are prepared in accordance with U.S. generally accepted accounting principles and follow general practices within the commercial banking industry. Application of these principles requires management to make estimates, assumptions and judgments that affect the amounts reported in the financial statements. These estimates, assumptions and judgments are based upon the information available as of the date of the financial statements.
The most significant accounting policies followed by the Company are presented in the Summary of Significant Accounting Policies. These policies, along with the other disclosures presented in the Notes to Consolidated Financial Statements and the 2014 Financial Review, provide information about how significant assets and liabilities are valued in the financial statements and how those values are determined. Management has identified the allowance for loan losses and the fair value of financial investments as the accounting areas that require the most subjective and complex estimates, assumptions and judgments and, as such, could be the most subject to revision as new information becomes available.
Securities are evaluated periodically to determine whether a decline in their value is other-than-temporary. Management utilizes criteria such as the magnitude and duration of the decline, in addition to the reasons underlying the decline, to determine whether the loss in value is other-than-temporary. The term “other-than-temporary” is not intended to indicate that the decline is permanent, but indicates that the prospect for a near-term recovery of value is not necessarily favorable, or that there is a lack of evidence to support a realizable value equal to or greater than the carrying value of the investment. Once a decline in value is determined to be other-than-temporary, the value of the security is reduced and a corresponding charge to earnings is recognized.
As previously noted in the section entitled Allowance for Loan Losses, management performs analysis to assess the adequacy of its allowance for loan losses. This analysis encompasses a variety of factors including the potential loss exposure for individually reviewed loans, the historical loss experience, the volume of nonperforming loans (i.e., loans in nonaccrual status or past due 90 days or more), the volume of loans past due, any significant changes in lending or loan review staff, an evaluation of current and future local and national economic conditions, any significant changes in the volume or mix of loans within each category, a review of the significant concentrations of credit and any legal, competitive or regulatory concerns.
2014 Report to Shareholders | CSB Bancorp, Inc. 21
Table of Contents
2014 FINANCIAL REVIEW
The Company accounts for business combinations using the acquisition method of accounting. Goodwill and intangible assets with indefinite useful lives are not amortized. Intangible assets with finite useful lives, consisting of core deposit intangibles, are amortized using accelerated methods over their estimated weighted-average useful lives, approximating ten years. Additional information is presented in Note 5, Core Deposit Intangible Assets.
IMPACT OF INFLATION AND CHANGING PRICES
The consolidated financial statements and related data presented herein have been prepared in accordance with U.S. generally accepted accounting principles, requiring measurement of financial position and results of operations primarily in terms of historical dollars without considering changes in the relative purchasing power of money over time due to inflation. Unlike most industrial companies, most assets and liabilities of the Company are monetary in nature. Therefore, interest rates have a more significant impact on the Company’s performance than the effects of general levels of inflation. Interest rates do not necessarily move in the same direction or in the same magnitude as prices of goods and services. The liquidity, maturity structure and quality of the Company’s assets and liabilities are critical to maintenance of acceptable performance levels.
COMMON STOCK AND SHAREHOLDER INFORMATION
Common shares of the Company are not traded on an established market. Shares are traded on the over-the-counter-bulletin-board through broker/dealers under the symbol “CSBB” and through private transactions. The table below represents the range of high and low prices paid for transactions known to the Company. Management does not have knowledge of prices paid on all transactions. Because of the lack of an established market, these prices may not reflect the prices at which stock would trade in an active market. These quotations reflect inter-dealer prices, without mark-up, markdown or commission and may not represent actual transactions. The table specifies cash dividends declared by the Company to its shareholders during 2014 and 2013. No assurances can be given that future dividends will be declared, or if declared, what the amount of any such dividends will be. Additional information concerning restrictions over the payment of dividends is included in Note 12 of the consolidated financial statements.
| Quarter Ended
|
High
|
Low
|
Dividends
|
Dividends
| ||||||||||||||||
|
March 31, 2014 |
$ | 20.00 | $ | 18.85 | $ | 0.18 | $ | 492,594 | ||||||||||||
| June 30, 2014 |
20.50 | 19.10 | 0.18 | 492,675 | ||||||||||||||||
| September 30, 2014 |
20.37 | 19.64 | 0.19 | 520,288 | ||||||||||||||||
| December 31, 2014 |
22.00 | 20.00 | 0.19 | 520,487 | ||||||||||||||||
| March 31, 2013 |
$ | 19.20 | $ | 17.00 | $ | 0.18 | $ | 492,594 | ||||||||||||
| June 30, 2013 |
20.85 | 19.00 | 0.18 | 492,594 | ||||||||||||||||
| September 30, 2013 |
20.80 | 18.60 | 0.18 | 492,594 | ||||||||||||||||
| December 31, 2013 |
19.60 | 18.62 | 0.18 | 492,594 | ||||||||||||||||
As of December 31, 2014, the Company had 1,269 shareholders of record and 2,739,405 outstanding shares of common stock.
22 2014 Report to Shareholders | CSB Bancorp, Inc.
Table of Contents
REPORT ON MANAGEMENT’S ASSESSMENT OF
INTERNAL CONTROL OVER FINANCIAL REPORTING
The management of CSB Bancorp, Inc. is responsible for establishing and maintaining adequate internal control over financial reporting. Management has designed our internal control over financial reporting to provide reasonable assurance that our published financial statements are fairly presented, in all material respects, in conformity with U.S. generally accepted accounting principles.
Management is required by paragraph (c) of Rule 13a-15 of the Securities Exchange Act of 1934, as amended, to assess the effectiveness of our internal control over financial reporting as of each year-end. In making this assessment, management used the Internal Control-Integrated Framework issued in May 2013 by the Committee of Sponsoring Organizations of the Treadway Commission (COSO).
Management conducted the required assessment of the effectiveness of our internal control over financial reporting as of December 31, 2014. Based upon this assessment, management believes that our internal control over financial reporting is effective as of December 31, 2014.
This annual report does not include an attestation report of the Company’s registered public accounting firm regarding internal control over financial reporting. Management’s report was not subject to attestation by the Company’s registered public accounting firm pursuant to the rules of the Securities and Exchange Commission that permit the Company to provide only management’s report in this annual report.
|
|
| |
| Eddie L. Steiner | Paula J. Meiler | |
| President, |
Senior Vice President, | |
| Chief Executive Officer |
Chief Financial Officer |


2014 Report to Shareholders | CSB Bancorp, Inc. 23
Table of Contents
REPORT OF INDEPENDENT REGISTERED PUBLIC ACCOUNTING FIRM

Board of Directors and Shareholders
CSB Bancorp, Inc.
We have audited the accompanying consolidated balance sheets of CSB Bancorp, Inc. and subsidiaries as of December 31, 2014 and 2013, and the related consolidated statements of income, comprehensive income, changes in shareholders’ equity, and cash flows for each of the three years in the period ended December 31, 2014. These consolidated financial statements are the responsibility of CSB Bancorp, Inc.’s management. Our responsibility is to express an opinion on these financial statements based on our audits.
We conducted our audits in accordance with the standards of the Public Company Accounting Oversight Board (United States). Those standards require that we plan and perform the audits to obtain reasonable assurance about whether the financial statements are free of material misstatement. CSB Bancorp, Inc. is not required to have, nor were we engaged to perform, an audit of its internal control over financial reporting. Our audit included consideration of internal control over financial reporting as a basis for designing audit procedures that are appropriate in the circumstances, but not for the purpose of expressing an opinion on the effectiveness of CSB Bancorp, Inc.’s internal control over financial reporting. Accordingly, we express no such opinion. An audit also includes examining, on a test basis, evidence supporting the amounts and disclosures in the financial statements, assessing the accounting principles used and significant estimates made by management, as well as evaluating the overall financial statement presentation. We believe that our audits provide a reasonable basis for our opinion.
In our opinion, the consolidated financial statements referred to above present fairly, in all material respects, the financial position of CSB Bancorp, Inc. and subsidiaries as of December 31, 2014 and 2013, and the consolidated results of their operations and their cash flows for each of the three years then ended, in conformity with U.S. generally accepted accounting principles.
Wexford, Pennsylvania
March 5, 2015
24 2014 Report to Shareholders | CSB Bancorp, Inc.
Table of Contents
December 31, 2014 and 2013
| (Dollars in thousands, except share data)
|
2014
|
2013
|
||||||
|
|
||||||||
| ASSETS |
||||||||
| Cash and cash equivalents |
||||||||
| Cash and due from banks |
$ | 15,310 | $ | 15,777 | ||||
| Interest-earning deposits in other banks |
28,613 | 26,822 | ||||||
|
|
|
|
|
|||||
| Total cash and cash equivalents |
43,923 | 42,599 | ||||||
|
|
|
|
|
|||||
| Securities |
||||||||
| Available-for-sale, at fair value |
100,108 | 101,722 | ||||||
| Held-to-maturity; fair value of $38,950 in 2014 and $42,643 in 2013 |
38,316 | 44,350 | ||||||
| Restricted stock, at cost |
4,614 | 5,463 | ||||||
|
|
|
|
|
|||||
| Total securities |
143,038 | 151,535 | ||||||
|
|
|
|
|
|||||
| Loans held for sale |
75 | – | ||||||
| Loans |
410,903 | 379,125 | ||||||
| Less allowance for loan losses |
4,381 | 5,085 | ||||||
|
|
|
|
|
|||||
| Net loans |
406,522 | 374,040 | ||||||
|
|
|
|
|
|||||
| Premises and equipment, net |
8,286 | 8,690 | ||||||
| Core deposit intangible |
629 | 759 | ||||||
| Goodwill |
4,728 | 4,728 | ||||||
| Bank-owned life insurance |
9,815 | 9,551 | ||||||
| Accrued interest receivable and other assets |
3,965 | 4,563 | ||||||
|
|
|
|
|
|||||
| TOTAL ASSETS |
$ | 620,981 | $ | 596,465 | ||||
|
|
|
|
|
|||||
| LIABILITIES AND SHAREHOLDERS’ EQUITY |
||||||||
| LIABILITIES |
||||||||
| Deposits |
||||||||
| Noninterest-bearing |
$ | 139,251 | $ | 120,325 | ||||
| Interest-bearing |
360,824 | 360,608 | ||||||
|
|
|
|
|
|||||
| Total deposits |
500,075 | 480,933 | ||||||
|
|
|
|
|
|||||
| Short-term borrowings |
46,627 | 48,671 | ||||||
| Other borrowings |
14,953 | 12,459 | ||||||
| Accrued interest payable and other liabilities |
1,876 | 1,991 | ||||||
|
|
|
|
|
|||||
| Total liabilities |
563,531 | 544,054 | ||||||
|
|
|
|
|
|||||
| SHAREHOLDERS’ EQUITY |
||||||||
| Common stock, $6.25 par value. Authorized 9,000,000 shares; issued 2,980,602 shares; outstanding 2,739,405 shares in 2014 and 2,736,634 in 2013 |
18,629 | 18,629 | ||||||
| Additional paid-in capital |
9,884 | 9,964 | ||||||
| Retained earnings |
34,090 | 30,232 | ||||||
| Treasury stock at cost - 241,197 shares in 2014 and 243,968 in 2013 |
(4,871 | ) | (4,958 | ) | ||||
| Accumulated other comprehensive loss |
(282 | ) | (1,456 | ) | ||||
|
|
|
|
|
|||||
| Total shareholders’ equity |
57,450 | 52,411 | ||||||
|
|
|
|
|
|||||
| TOTAL LIABILITIES AND SHAREHOLDERS’ EQUITY |
$ | 620,981 | $ | 596,465 | ||||
|
|
|
|
|
|||||
These consolidated financial statements should be read in connection with the accompanying summary of significant accounting policies and notes to the consolidated financial statements.
2014 Report to Shareholders | CSB Bancorp, Inc. 25
Table of Contents
CONSOLIDATED STATEMENTS OF INCOME
Years Ended December 31, 2014, 2013 and 2012
| (Dollars in thousands, except per share data)
|
2014
|
2013
|
2012
|
|||||||||
|
|
||||||||||||
| INTEREST AND DIVIDEND INCOME |
||||||||||||
| Loans, including fees |
$ | 18,290 | $ | 17,963 | $ | 17,279 | ||||||
| Taxable securities |
2,857 | 2,572 | 2,672 | |||||||||
| Nontaxable securities |
466 | 513 | 486 | |||||||||
| Other |
43 | 90 | 147 | |||||||||
|
|
|
|
|
|
|
|||||||
| Total interest and dividend income |
21,656 | 21,138 | 20,584 | |||||||||
|
|
|
|
|
|
|
|||||||
| INTEREST EXPENSE |
||||||||||||
| Deposits |
1,166 | 1,720 | 2,323 | |||||||||
| Short-term borrowings |
77 | 67 | 91 | |||||||||
| Other borrowings |
486 | 468 | 564 | |||||||||
|
|
|
|
|
|
|
|||||||
| Total interest expense |
1,729 | 2,255 | 2,978 | |||||||||
|
|
|
|
|
|
|
|||||||
| NET INTEREST INCOME |
19,927 | 18,883 | 17,606 | |||||||||
| PROVISION FOR LOAN LOSSES |
643 | 840 | 823 | |||||||||
|
|
|
|
|
|
|
|||||||
| Net interest income, after provision for loan losses |
19,284 | 18,043 | 16,783 | |||||||||
|
|
|
|
|
|
|
|||||||
| NONINTEREST INCOME |
||||||||||||
| Service charges on deposit accounts |
1,269 | 1,349 | 1,305 | |||||||||
| Trust services |
811 | 826 | 671 | |||||||||
| Debit card interchange fees |
910 | 779 | 797 | |||||||||
| Securities gains |
133 | 159 | – | |||||||||
| Gain on sale of loans, net |
198 | 347 | 591 | |||||||||
| Other income |
929 | 858 | 840 | |||||||||
|
|
|
|
|
|
|
|||||||
| Total noninterest income |
4,250 | 4,318 | 4,204 | |||||||||
|
|
|
|
|
|
|
|||||||
| NONINTEREST EXPENSES |
||||||||||||
| Salaries and employee benefits |
8,321 | 8,261 | 7,960 | |||||||||
| Occupancy expense |
1,014 | 1,026 | 1,025 | |||||||||
| Equipment expense |
715 | 719 | 618 | |||||||||
| Professional and director fees |
725 | 628 | 814 | |||||||||
| Franchise tax expense |
361 | 581 | 542 | |||||||||
| Marketing and public relations |
378 | 395 | 392 | |||||||||
| Software expense |
727 | 530 | 391 | |||||||||
| Debit card expense |
421 | 291 | 331 | |||||||||
| Amortization of intangible assets |
130 | 135 | 140 | |||||||||
| FDIC insurance expense |
358 | 359 | 328 | |||||||||
| Net cost of operation of other real estate |
– | 9 | 33 | |||||||||
| Other expenses |
1,932 | 1,914 | 1,876 | |||||||||
|
|
|
|
|
|
|
|||||||
| Total noninterest expenses |
15,082 | 14,848 | 14,450 | |||||||||
|
|
|
|
|
|
|
|||||||
| Income before income taxes |
8,452 | 7,513 | 6,537 | |||||||||
| FEDERAL INCOME TAX PROVISION |
2,568 | 2,273 | 1,990 | |||||||||
|
|
|
|
|
|
|
|||||||
| NET INCOME |
$ | 5,884 | $ | 5,240 | $ | 4,547 | ||||||
|
|
|
|
|
|
|
|||||||
| NET INCOME PER SHARE |
||||||||||||
| Basic |
$ | 2.15 | $ | 1.91 | $ | 1.66 | ||||||
|
|
|
|
|
|
|
|||||||
| Diluted |
$ | 2.15 | $ | 1.91 | $ | 1.66 | ||||||
|
|
|
|
|
|
|
|||||||
These consolidated financial statements should be read in connection with the accompanying summary of significant accounting policies and notes to the consolidated financial statements.
26 2014 Report to Shareholders | CSB Bancorp, Inc.
Table of Contents
CONSOLIDATED STATEMENTS OF COMPREHENSIVE INCOME
Years Ended December 31, 2014, 2013 and 2012
| (Dollars in thousands)
|
2014
|
2013
|
2012
|
|||||||||
|
|
||||||||||||
| Net income |
$ | 5,884 | $ | 5,240 | $ | 4,547 | ||||||
|
|
|
|
|
|
|
|||||||
| Other comprehensive income (loss) |
||||||||||||
| Unrealized gains (losses) arising during the period |
1,612 | (3,195 | ) | 657 | ||||||||
| Unrealized losses on held-to-maturity transfer |
– | (1,931 | ) | – | ||||||||
| Amounts reclassified from accumulated other |
301 | 255 | – | |||||||||
| Income tax effect |
(651 | ) | 1,656 | (223 | ) | |||||||
| Reclassification adjustment for gains on available for |
(133 | ) | (159 | ) | – | |||||||
| Income tax effect |
45 | 54 | – | |||||||||
|
|
|
|
|
|
|
|||||||
| Other comprehensive income (loss) |
1,174 | (3,320 | ) | 434 | ||||||||
|
|
|
|
|
|
|
|||||||
| Total comprehensive income |
$ | 7,058 | $ | 1,920 | $ | 4,981 | ||||||
|
|
|
|
|
|
|
|||||||
CONSOLIDATED STATEMENTS OF CHANGES IN SHAREHOLDERS’ EQUITY
Years Ended December 31, 2014, 2013 and 2012
| Accumulated | ||||||||||||||||||||||||
| Additional | Other | |||||||||||||||||||||||
| Common | Paid-in | Retained | Treasury | Comprehensive | ||||||||||||||||||||
| (Dollars in thousands)
|
Stock
|
Capital
|
Earnings
|
Stock
|
Income (Loss)
|
Total
|
||||||||||||||||||
|
|
||||||||||||||||||||||||
| BALANCE AT |
$ | 18,629 | $ | 9,994 | $ | 24,391 | $ | (5,015 | ) | $ | 1,430 | $ | 49,429 | |||||||||||
| Net income |
– | – | 4,547 | – | – | 4,547 | ||||||||||||||||||
| Other comprehensive income |
– | – | – | – | 434 | 434 | ||||||||||||||||||
| Stock options exercised, 1,261 shares |
– | (20 | ) | (7 | ) | 39 | – | 12 | ||||||||||||||||
| Cash dividends declared, $0.72 per share |
– | – | (1,969 | ) | – | – | (1,969 | ) | ||||||||||||||||
|
|
|
|
|
|
|
|
|
|
|
|
|
|||||||||||||
| BALANCE AT |
$ | 18,629 | $ | 9,974 | $ | 26,962 | $ | (4,976 | ) | $ | 1,864 | $ | 52,453 | |||||||||||
| Net income |
– | – | 5,240 | – | – | 5,240 | ||||||||||||||||||
| Other comprehensive loss |
– | – | – | – | (3,320 | ) | (3,320 | ) | ||||||||||||||||
| Stock options exercised, 574 shares |
– | (10 | ) | – | 18 | – | 8 | |||||||||||||||||
| Cash dividends declared, $0.72 per share |
– | – | (1,970 | ) | – | – | (1,970 | ) | ||||||||||||||||
|
|
|
|
|
|
|
|
|
|
|
|
|
|||||||||||||
| BALANCE AT |
$ | 18,629 | $ | 9,964 | $ | 30,232 | $ | (4,958 | ) | $ | (1,456 | ) | $ | 52,411 | ||||||||||
| Net income |
– | – | 5,884 | – | – | 5,884 | ||||||||||||||||||
| Other comprehensive income |
– | – | – | – | 1,174 | 1,174 | ||||||||||||||||||
| Stock options exercised, 2,771 shares |
– | (80 | ) | – | 87 | – | 7 | |||||||||||||||||
| Cash dividends declared, $0.74 per share |
– | – | (2,026 | ) | – | – | (2,026 | ) | ||||||||||||||||
|
|
|
|
|
|
|
|
|
|
|
|
|
|||||||||||||
| BALANCE AT |
$ | 18,629 | $ | 9,884 | $ | 34,090 | $ | (4,871 | ) | $ | (282 | ) | $ | 57,450 | ||||||||||
|
|
|
|
|
|
|
|
|
|
|
|
|
|||||||||||||
These consolidated financial statements should be read in connection with the accompanying summary of significant accounting policies and notes to the consolidated financial statements.
2014 Report to Shareholders | CSB Bancorp, Inc. 27
Table of Contents
CONSOLIDATED STATEMENTS OF CASH FLOWS
Years Ended December 31, 2014, 2013 and 2012
| (Dollars in thousands)
|
2014
|
2013
|
2012
|
|||||||||
|
|
||||||||||||
| CASH FLOWS FROM |
||||||||||||
| Net income |
$ | 5,884 | $ | 5,240 | $ | 4,547 | ||||||
| Adjustments to reconcile net income to net cash |
||||||||||||
| Depreciation and amortization of premises, |
928 | 779 | 644 | |||||||||
| Deferred income taxes |
175 | 77 | (50 | ) | ||||||||
| Provision for loan losses |
643 | 840 | 823 | |||||||||
| Gain on sale of loans, net |
(198 | ) | (347 | ) | (591 | ) | ||||||
| Securities gain, net |
(133 | ) | (159 | ) | – | |||||||
| Security amortization, net of accretion |
361 | 456 | 553 | |||||||||
| Secondary market loan sale proceeds |
6,506 | 12,393 | 20,873 | |||||||||
| Originations of secondary market loans held-for-sale |
(6,383 | ) | (12,106 | ) | (20,384 | ) | ||||||
| Bank-owned life insurance |
(264 | ) | (253 | ) | (230 | ) | ||||||
| Effects of changes in operating assets and liabilities: |
||||||||||||
| Net deferred loan (fees) costs |
(81 | ) | (214 | ) | 63 | |||||||
| Accrued interest receivable |
45 | (57 | ) | 32 | ||||||||
| Accrued interest payable |
(12 | ) | (39 | ) | (47 | ) | ||||||
| Other assets and liabilities |
(308 | ) | 339 | 831 | ||||||||
|
|
|
|
|
|
|
|||||||
| Net cash provided by operating activities |
$ | 7,163 | $ | 6,949 | $ | 7,064 | ||||||
|
|
|
|
|
|
|
|||||||
| CASH FLOWS FROM |
||||||||||||
| Securities: |
||||||||||||
| Proceeds from repayments, available-for-sale |
$ | 35,337 | $ | 36,200 | $ | 76,220 | ||||||
| Proceeds from repayments, held-to-maturity |
9,273 | 1,211 | – | |||||||||
| Purchases, available-for-sale |
(34,893 | ) | (55,693 | ) | (82,382 | ) | ||||||
| Purchases, held-to-maturity |
(3,000 | ) | (8,135 | ) | – | |||||||
| Proceeds from sale of securities, available-for-sale |
2,483 | 4,309 | – | |||||||||
| Proceeds from redemption of restricted stock |
849 | – | – | |||||||||
| Loan originations, net of repayments |
(33,043 | ) | (14,666 | ) | (40,842 | ) | ||||||
| Proceeds from sale of other real estate |
– | 18 | 26 | |||||||||
| Property, equipment and software acquisitions |
(427 | ) | (1,526 | ) | (953 | ) | ||||||
| Purchase of bank-owned life insurance |
– | (1,000 | ) | (5,000 | ) | |||||||
|
|
|
|
|
|
|
|||||||
| Net cash used in investing activities |
$ | (23,421 | ) | $ | (39,282 | ) | $ | (52,931 | ) | |||
|
|
|
|
|
|
|
|||||||
These consolidated financial statements should be read in connection with the accompanying summary of significant accounting policies and notes to the consolidated financial statements.
28 2014 Report to Shareholders | CSB Bancorp, Inc.
Table of Contents
CONSOLIDATED STATEMENTS OF CASH FLOWS
Years Ended December 31, 2014, 2013 and 2012
| (Dollars in thousands)
|
2014
|
2013
|
2012
|
|||||||||
|
|
||||||||||||
| CASH FLOWS FROM |
||||||||||||
| Net change in deposits |
$ | 19,151 | $ | 5,550 | $ | 32,021 | ||||||
| Net change in short-term borrowings |
(2,044 | ) | 4,679 | 6,919 | ||||||||
| Proceeds from other borrowings |
5,000 | – | – | |||||||||
| Repayment of other borrowings |
(2,506 | ) | (213 | ) | (6,489 | ) | ||||||
| Cash dividends paid |
(2,026 | ) | (1,970 | ) | (1,969 | ) | ||||||
| Proceeds from stock options exercised |
7 | 8 | 5 | |||||||||
|
|
|
|
|
|
|
|||||||
| Net cash provided by financing activities |
$ | 17,582 | $ | 8,054 | $ | 30,487 | ||||||
|
|
|
|
|
|
|
|||||||
| NET INCREASE (DECREASE) IN CASH |
1,324 | (24,279 | ) | (15,380 | ) | |||||||
| CASH AND CASH EQUIVALENTS AT |
42,599 | 66,878 | 82,258 | |||||||||
|
|
|
|
|
|
|
|||||||
| CASH AND CASH EQUIVALENTS AT |
$ | 43,923 | $ | 42,599 | $ | 66,878 | ||||||
|
|
|
|
|
|
|
|||||||
| SUPPLEMENTAL DISCLOSURES |
||||||||||||
| Cash paid during the year for: |
||||||||||||
| Interest |
$ | 1,750 | $ | 2,356 | $ | 3,155 | ||||||
| Income taxes |
2,500 | 2,335 | 1,690 | |||||||||
| Noncash investing activities: |
||||||||||||
| Transfer of loans to other real estate owned |
– | – | 56 | |||||||||
| Transfer of securities from available-for-sale |
– | 38,930 | – | |||||||||
These consolidated financial statements should be read in connection with the accompanying summary of significant accounting policies and notes to the consolidated financial statements.
2014 Report to Shareholders | CSB Bancorp, Inc. 29
Table of Contents
NOTES TO CONSOLIDATED FINANCIAL STATEMENTS
NOTE 1 – SUMMARY OF SIGNIFICANT ACCOUNTING POLICIES
CSB Bancorp, Inc. (the “Company” or “CSB”) was incorporated in 1991 in the State of Ohio, and is a registered bank holding company. The Company’s wholly-owned subsidiaries are The Commercial and Savings Bank of Millersburg, Ohio (the “Bank”) and CSB Investment Services, LLC., inactive. The Company, through its subsidiaries, operates in one industry segment; the commercial banking industry.
The Bank, an Ohio-chartered bank organized in 1879, provides financial services through its sixteen Banking Centers located in Holmes, Tuscarawas, Wayne and Stark Counties in Ohio and nearby communities. These communities are the source of substantially all deposit, loan and trust activities. The majority of the Bank’s income is derived from commercial and retail lending activities and investments in securities. Its primary deposit products are checking, savings and term certificate accounts, and its primary lending products are residential real estate, commercial real estate, commercial and installment loans. Substantially, all loans are secured by specific items of collateral including business assets, consumer assets and real estate. Commercial loans are expected to be repaid from cash flow from business operations. Real estate loans are secured by both residential and commercial real estate.
Significant accounting policies followed by the Company are presented below:
USE OF ESTIMATES IN PREPARING FINANCIAL STATEMENTS
In preparing Consolidated Financial Statements in conformity with U.S. generally accepted accounting principles, management is required to make estimates and assumptions that affect the reported amounts of assets and liabilities as of the date of the Consolidated Balance Sheets and reported amounts of revenues and expenses during each reporting period. Actual results could differ from those estimates. The most significant estimates susceptible to change in the near term relate to management’s determination of the allowance for loan losses and the fair value of financial instruments.
PRINCIPLES OF CONSOLIDATION
The Consolidated Financial Statements include the accounts of the Company and its wholly-owned subsidiaries. All significant inter-company balances and transactions have been eliminated in consolidation.
The Bank has established a trust department and the assets held by the Bank in fiduciary or agency capacities for its customers are not included in the Consolidated Balance Sheets as such items are not assets of the Bank.
CASH AND CASH EQUIVALENTS
For purposes of the Consolidated Statements of Cash Flows, cash and cash equivalents include cash on hand and amounts due from banks which mature overnight or within ninety days.
CASH RESERVE REQUIREMENTS
The Bank is required by the Federal Reserve to maintain reserves consisting of cash on hand and noninterest-earning balances on deposit with the Federal Reserve Bank. There was no required reserve balance at December 31, 2014 and 2013.
SECURITIES
At the time of purchase all securities are evaluated and designated as available-for-sale or held-to-maturity. Securities designated as available-for-sale are carried at fair value with unrealized gains and losses on such securities, net of applicable income taxes, recognized as other comprehensive income (loss). During 2013, approximately $39 million par value of U.S. Government agencies and mortgage-backed securities of government agencies were transferred from available-for-sale to held-to-maturity. At December 31, 2014, 27% of the total investment portfolio was classified as held-to-maturity. The volatility in interest rates that has occurred recently does not have as much impact on other comprehensive income as it would if the entire portfolio was included in the available-for sale category. Held-to-maturity securities are carried at their fair value on the date of transfer or at purchase value if security purchases are designated as held-to-maturity.
The amortized cost of debt securities is adjusted for amortization of premiums and accretion of discounts to maturity based on the interest method. Such amortization and accretion is included in interest and dividends on securities.
Gains and losses on sales of securities are accounted for on a trade date basis, using the specific identification method, and are included in noninterest income. Securities are periodically reviewed for other-than-temporary impairment based upon a number of factors, including, but not limited to, the length of time and extent to which the market value has been less than cost, the financial condition of the underlying issuer, the receipt of principal and interest according to the contractual terms, the ability of the issuer to meet contractual obligations, the likelihood of the security’s ability to recover any decline in its market value and management’s intent and ability to hold the security for a period of time sufficient to allow for a recovery in market value. Among the factors that are considered in determining management’s intent and ability to hold the security is a review of the Company’s capital adequacy, interest rate risk position and liquidity. The assessment of a security’s ability to recover any decline in market value, the ability of the issuer to meet contractual obligations and management’s intent and ability to hold the security requires considerable judgment. A decline in value that is considered to be other-than-temporary is recorded as a loss within noninterest income in the Consolidated Statements of Income.
30 2014 Report to Shareholders | CSB Bancorp, Inc.
Table of Contents
NOTES TO CONSOLIDATED FINANCIAL STATEMENTS
NOTE 1 – SUMMARY OF SIGNIFICANT ACCOUNTING POLICIES (CONTINUED)
Investments in Federal Home Loan Bank of Cincinnati (“FHLB”) and Federal Reserve Bank stock are classified as restricted stock, carried at cost, and evaluated for impairment. The Bank is required to maintain an investment in common stock of the FHLB and Federal Reserve Bank because the Bank is a member of the FHLB and the Federal Reserve System. We consider these stocks to be nonmarketable equity securities.
Federal Home Loan Bank of Cincinnati reported profits for 2014 and 2013, remains in compliance with regulatory capital and liquidity requirements, continues to pay dividends on the stock and redeems its stock at par value. With consideration given to these factors, management concluded that the stock was not impaired at December 31, 2014 or 2013.
LOANS
Loans that management has the intent and ability to hold for the foreseeable future, or until maturity or pay-off, generally are stated at their outstanding principal amount, adjusted for charge-offs, the allowance for loan losses and any deferred loan fees or costs on originated loans. Interest is accrued based upon the daily outstanding principal balance. Loan origination fees and certain direct origination costs are capitalized and recognized as an adjustment of the yield over the life of the related loan.
Interest income is not reported when full repayment is in doubt, typically when the loan is impaired or payments are past due over 90 days. All interest accrued but not collected for loans that are placed on nonaccrual or charged-off is reversed against interest income. The interest on these loans is accounted for on the cash-basis or cost-recovery method, until qualifying for return to accrual. Loans are returned to accrual status when all the principal and interest amounts contractually due are brought current and future payments are reasonably assured.
At origination, a determination is made whether a loan will be held in the Bank’s portfolio or is intended for sale in the secondary market. Mortgage loans held for sale are recorded at the lower of the aggregate cost or fair value. Generally these loans are held for sale for less than three days. The Bank includes gains and losses on sales of the loans held for sale when the sale is completed.
ALLOWANCE FOR LOAN LOSSES
The allowance for loan losses is established as losses are estimated to have occurred through a provision for loan losses charged to income. Loan losses are charged against the allowance when management believes the uncollectability of a loan balance is confirmed. Subsequent recoveries, if any, are credited to the allowance.
The allowance for loan losses is evaluated on a regular basis by management and is based upon management’s periodic review of the collectability of the loans in light of historical experience, the nature and volume of the loan portfolio, adverse situations that may affect borrowers’ ability to repay, estimated value of any underlying collateral and prevailing economic conditions. This evaluation is inherently subjective as it requires estimates that are susceptible to significant revision as more information becomes available.
A loan is considered impaired when, based on current information and events, it is probable that the Company will be unable to collect the scheduled payments of principal or interest when due according to the contractual terms of the loan agreement. Factors considered by management in determining impairment include payment status, collateral value and the probability of collecting scheduled principal and interest payments when due. Loans that experience insignificant payment delays and payment shortfalls generally are not classified as impaired. Management determines the significance of payment delays and payment shortfalls on a case-by-case basis, taking into consideration all of the circumstances surrounding the loan and the borrower, including the length of the delay, the reasons for the delay, the borrower’s prior payment record and the amount of the shortfall in relation to the principal and interest owed. Impairment is measured on a loan-by-loan basis for commercial, commercial real estate, construction loans and troubled debt restructurings by either the present value of expected future cash flows discounted at the loan’s effective interest rate, the loan’s obtainable market price, or the fair value of the collateral if the loan is collateral dependent.
Large groups of smaller balance homogeneous loans are collectively evaluated for impairment. Accordingly, the Company does not separately identify individual consumer loans for impairment disclosures.
OTHER REAL ESTATE OWNED
Other real estate acquired through or in lieu of foreclosure is initially recorded at fair value, less estimated costs to sell, and any loan balance in excess of fair value is charged to the allowance for loan losses. Subsequent valuations are periodically performed and write-downs are included in noninterest expenses, as are gains or losses upon sale and expenses related to maintenance of the properties. There was no other real estate owned at December 31, 2014 and 2013.
2014 Report to Shareholders | CSB Bancorp, Inc. 31
Table of Contents
NOTES TO CONSOLIDATED FINANCIAL STATEMENTS
NOTE 1 – SUMMARY OF SIGNIFICANT ACCOUNTING POLICIES (CONTINUED)
PREMISES AND EQUIPMENT
Premises and equipment is stated at cost less accumulated depreciation and amortization. Upon the sale or disposition of the assets, the difference between the depreciated cost and proceeds is charged or credited to income. Depreciation and amortization is determined based on the estimated useful lives of the individual assets (typically 20 to 40 years for buildings and 3 to 10 years for equipment) and is computed using the straight-line method. Leasehold improvements are amortized over the useful life of the asset.
GOODWILL AND CORE DEPOSIT INTANGIBLE ASSETS
Goodwill is not amortized, but is tested at least annually for impairment in the fourth quarter or more frequently if indicators of impairment are present. The evaluation for impairment involves comparing the estimated current fair value of the reporting unit to its carrying value, including goodwill. If the estimated current fair value of a reporting unit exceeds its carrying value, no additional testing is required and an impairment loss is not recorded. CSB uses market capitalization and multiples of tangible book value methods to determine the estimated current fair value of its reporting unit. Based on this analysis no impairment was recorded in 2014 or 2013.
The core deposit intangible assets are assigned useful lives, which are amortized on an accelerated basis over their weighted average lives. The Company periodically reviews the intangible asset for impairment as events or changes in circumstances indicate that the carrying amount of such assets may not be recoverable.
MORTGAGE SERVICING RIGHTS
Mortgage servicing rights (“MSRs”) represent the right to service loans for third party investors. MSRs are recognized as a separate asset upon the sale of mortgage loans to a third party investor with the servicing rights retained by CSB. Originated MSRs are recorded at allocated fair value at the time of the sale of the loans to the third party investor. MSRs are amortized in proportion to and over the estimated period of net servicing income. MSRs are carried at amortized cost, less a valuation allowance for impairment, if any. MSRs are evaluated on a discounted earnings basis to determine the present value of future earnings of the underlying serviced mortgages. All assumptions are reviewed annually or more frequently, if necessary, and adjusted to reflect current and anticipated market conditions.
BANK-OWNED LIFE INSURANCE
The cash surrender value of these policies is included as an asset on the Consolidated Balance Sheets and any increases in the cash surrender value are recorded as noninterest income on the Consolidated Statements of Income. In the event of the death of an insured individual under these policies, the Company would receive a death benefit, which would be recorded as noninterest income.
REPURCHASE AGREEMENTS
Substantially all securities sold under repurchase agreements represent amounts advanced by various customers. Securities owned by the Bank are pledged to cover those obligations. These repurchase agreements are not deposits and are not covered by federal deposit insurance.
ADVERTISING COSTS
All advertising costs are expensed as incurred. Advertising expenses amounted to $175 thousand, $190 thousand and $175 thousand for the years ended 2014, 2013 and 2012 respectively.
FEDERAL INCOME TAXES
The Company and its subsidiaries file a consolidated tax return. Deferred income taxes are provided on temporary differences between financial statement and income tax reporting. Temporary differences are differences between the amounts of assets and liabilities reported for financial statement purposes and their tax bases. Deferred tax assets are recognized for temporary differences that will be deductible in future years’ tax returns and for operating loss and tax credit carry forwards. Deferred tax assets are reduced by a valuation allowance if it is deemed more likely than not that some or all of the deferred tax assets will not be realized. Deferred tax liabilities are recognized for temporary differences that will be taxable in future years’ tax returns.
The Bank, domiciled in Ohio, is not currently subject to state and local income taxes.
32 2014 Report to Shareholders | CSB Bancorp, Inc.
Table of Contents
NOTES TO CONSOLIDATED FINANCIAL STATEMENTS
NOTE 1 – SUMMARY OF SIGNIFICANT ACCOUNTING POLICIES (CONTINUED)
STOCK-BASED COMPENSATION
The Company sponsored a stock-based compensation plan, administered by a committee. The incentive stock option plan expired in 2012. As of December 31, 2014, there was no unrecognized compensation cost related to unvested share-based compensation awards outstanding. All shares are vested. The Company recorded no stock-based compensation expense for 2014, 2013 or 2012.
The fair value of each option is amortized into compensation expense on a straight-line basis between the grant date for the option and each vesting date. CSB estimates the fair value of stock options on the date of the grant using the Black-Scholes option pricing model. The model requires the use of numerous assumptions, many of which are highly subjective in nature. There were no option grants for the years ended December 31, 2014 and 2013.
COMPREHENSIVE INCOME
The Company includes recognized revenue, expenses, gains and losses in net income. Although certain changes in assets and liabilities such as unrealized gains and losses on available-for-sale securities are reported as a separate component of the equity section of the Consolidated Balance Sheets, these items along with net income are components of comprehensive income.
TRANSFERS OF FINANCIAL ASSETS
Transfers of financial assets are accounted for as sales when control over the assets has been surrendered. Control over transferred assets is deemed to be surrendered when (1) the assets have been isolated from the Company, (2) the transferee obtains the right (free of conditions that constrain it from taking advantage of that right) to pledge or exchange the transferred assets, and (3) the Company does not maintain effective control over the transferred assets through an agreement to repurchase them before their maturity.
PER SHARE DATA
Basic net income per share is computed based on the weighted average number of shares of common stock outstanding during each year. Diluted income per common share includes the dilutive effect of additional potential common shares issuable under stock options.
The weighted average number of common shares outstanding for basic and diluted earnings per share computations was as follows:
| 2014
|
2013
|
2012
|
||||||||||
|
|
||||||||||||
|
Weighted average common shares |
2,980,602 | 2,980,602 | 2,980,602 | |||||||||
| Average treasury shares |
(242,966 | ) | (244,129 | ) | (245,713 | ) | ||||||
|
|
|
|
|
|
|
|||||||
| Total weighted average common shares outstanding (basic) |
2,737,636 | 2,736,473 | 2,734,889 | |||||||||
| Dilutive effect of assumed exercise of stock options |
1,442 | 2,004 | 252 | |||||||||
|
|
|
|
|
|
|
|||||||
| Weighted average common shares outstanding (diluted) |
2,739,078 | 2,738,477 | 2,735,141 | |||||||||
|
|
|
|
|
|
|
|||||||
Dividends per share are based on the number of shares outstanding at the declaration date.
There were no stock options that were antidilutive at December 31, 2014. Options to purchase an aggregate of 11,904 and 30,760 common shares were outstanding at December 31, 2014 and 2013.
ACCOUNTING DEVELOPMENTS
In January 2014, the FASB issued ASU 2014-04, Receivables – Troubled Debt Restructurings by Creditors (Subtopic 310-40): Reclassification of Residential Real Estate Collateralized Consumer Mortgage Loans upon Foreclosure. The amendments in this Update clarify that an in substance repossession or foreclosure occurs, and a creditor is considered to have received physical possession of residential real estate property collateralizing a consumer mortgage loan, upon either (1) the creditor obtaining legal title to the residential real estate property upon completion of a foreclosure or (2) the borrower conveying all interest in the residential real estate property to the creditor to satisfy that loan through completion of a deed in lieu of foreclosure or through a similar legal agreement. Additionally, the amendments require interim and annual disclosure of both (1) the amount of foreclosed residential real estate property held by the creditor and (2) the recorded investment in consumer mortgage loans collateralized by residential real estate property that are in the process of foreclosure according to local requirements of the applicable jurisdiction. The amendments in this Update are effective for public business entities for annual periods, and interim periods within those annual periods, beginning after December 15, 2014. An entity can elect to adopt the amendments in this Update using either a modified retrospective transition method or a prospective transition method. This Update is not expected to have a significant impact on the Company’s financial statements.
2014 Report to Shareholders | CSB Bancorp, Inc. 33
Table of Contents
NOTES TO CONSOLIDATED FINANCIAL STATEMENTS
NOTE 1 – SUMMARY OF SIGNIFICANT ACCOUNTING POLICIES (CONTINUED)
In May 2014, the FASB issued ASU 2014-09, Revenue from Contracts with Customers (a new revenue recognition standard). The Update’s core principle is that a company will recognize revenue to depict the transfer of goods or services to customers in an amount that reflects the consideration to which the entity expects to be entitled in exchange for those goods or services. In addition, this update specifies the accounting for certain costs to obtain or fulfill a contract with a customer and expands disclosure requirements for revenue recognition. This Update is effective for annual reporting periods beginning after December 15, 2016, including interim periods within that reporting period. The Company is evaluating the effect of adopting this new accounting Update.
In June 2014, the FASB issued ASU 2014-11, Transfers and Servicing (Topic 860): Repurchase-to-Maturity Transactions, Repurchase Financings, and Disclosures. The amendments in this Update change the accounting for repurchase-to-maturity transactions to secured borrowing accounting. For repurchase financing arrangements, the amendments require separate accounting for a transfer of a financial asset executed contemporaneously with a repurchase agreement with the same counterparty, which will result in secured borrowing accounting for the repurchase agreement. The amendments also require enhanced disclosures. The accounting changes in this Update are effective for the first interim or annual period beginning after December 15, 2014. An entity is required to present changes in accounting for transactions outstanding on the effective date as a cumulative-effect adjustment to retained earnings as of the beginning of the period of adoption. Earlier application is prohibited. The disclosure for certain transactions accounted for as a sale is required to be presented for interim and annual periods beginning after December 15, 2014, and the disclosure for repurchase agreements, securities lending transactions, and repurchase-to-maturity transactions accounted for as secured borrowings is required to be presented for annual periods beginning after December 15, 2014, and for interim periods beginning after March 15, 2015. The disclosures are not required to be presented for comparative periods before the effective date. This Update is not expected to have a significant impact on the Company’s financial statements.
In August 2014, the FASB issued ASU 2014-14, Receivables – Troubled Debt Restructurings by Creditors (Subtopic 310-40). The amendments in this Update require that a mortgage loan be derecognized and that a separate other receivable be recognized upon foreclosure if the following conditions are met: (1) the loan has a government guarantee that is not separable from the loan before foreclosure, (2) at the time of foreclosure, the creditor has the intent to convey the real estate property to the guarantor and make a claim on the guarantee, and the creditor has the ability to recover under that claim, and (3) at the time of foreclosure, any amount of the claim that is determined on the basis of the fair value of the real estate is fixed. Upon foreclosure, the separate other receivable should be measured based on the amount of the loan balance (principal and interest) expected to be recovered from the guarantor. The amendments in this Update are effective for public business entities for annual periods, and interim periods within those annual periods, beginning after December 15, 2014. This Update is not expected to have a significant impact on the Company’s financial statements.
In January 2015, the FASB issued ASU 2015-01, Income Statement – Extraordinary and Unusual Items, as part of its initiative to reduce complexity in accounting standards. This Update eliminates from GAAP the concept of extraordinary items. The amendments in this Update are effective for fiscal years, and interim periods within those fiscal years, beginning after December 15, 2015. A reporting entity may apply the amendments prospectively. A reporting entity also may apply the amendments retrospectively to all prior periods presented in the financial statements. Early adoption is permitted provided that the guidance is applied from the beginning of the fiscal year of adoption. This Update is not expected to have a significant impact on the Company’s financial statements.
RECLASSIFICATION OF COMPARATIVE AMOUNTS
Certain comparative amounts from the prior years have been reclassified to conform to current year classifications. Such classifications had no effect on net income or shareholders’ equity.
34 2014 Report to Shareholders | CSB Bancorp, Inc.
Table of Contents
NOTES TO CONSOLIDATED FINANCIAL STATEMENTS
NOTE 2 – SECURITIES
Securities consist of the following at December 31:
| Gross | Gross | |||||||||||||||
| Amortized | Unrealized | Unrealized | Fair | |||||||||||||
| (Dollars in thousands)
|
Cost
|
Gains | Losses | Value | ||||||||||||
|
|
||||||||||||||||
| 2014 |
||||||||||||||||
| Available-for-sale: |
||||||||||||||||
| U.S. Treasury security |
$ | 1,004 | $ | – | $ | 4 | $ | 1,000 | ||||||||
| U.S. Government agencies |
25,228 | 6 | 155 | 25,079 | ||||||||||||
| Mortgage-backed securities of government agencies |
47,696 | 730 | 79 | 48,347 | ||||||||||||
| Other mortgage-backed securities |
139 | 2 | – | 141 | ||||||||||||
| Asset-backed securities of government agencies |
2,606 | 3 | 5 | 2,604 | ||||||||||||
| State and political subdivisions |
17,878 | 433 | 44 | 18,267 | ||||||||||||
| Corporate bonds |
4,503 | 40 | 1 | 4,542 | ||||||||||||
| Equity securities |
106 | 22 | – | 128 | ||||||||||||
|
|
|
|
|
|
|
|
|
|||||||||
| Total available-for-sale |
99,160 | 1,236 | 288 | 100,108 | ||||||||||||
| Held-to-maturity securities |
||||||||||||||||
| U.S. Government agencies |
16,343 | 294 | 2 | 16,635 | ||||||||||||
| Mortgage-backed securities of government agencies |
21,973 | 398 | 56 | 22,315 | ||||||||||||
|
|
|
|
|
|
|
|
|
|||||||||
| Total held-to-maturity |
38,316 | 692 | 58 | 38,950 | ||||||||||||
| Restricted stock |
4,614 | – | – | 4,614 | ||||||||||||
|
|
|
|
|
|
|
|
|
|||||||||
| Total securities |
$ | 142,090 | $ | 1,928 | $ | 346 | $ | 143,672 | ||||||||
|
|
|
|
|
|
|
|
|
|||||||||
| 2013 |
||||||||||||||||
| Available-for-sale: |
||||||||||||||||
| U.S. Treasury security |
$ | 1,005 | $ | – | $ | 8 | $ | 997 | ||||||||
| U.S. Government agencies |
22,999 | 8 | 706 | 22,301 | ||||||||||||
| Mortgage-backed securities of government agencies |
54,455 | 536 | 691 | 54,300 | ||||||||||||
| Other mortgage-backed securities |
230 | 5 | – | 235 | ||||||||||||
| Asset-backed securities of government agencies |
2,739 | 36 | – | 2,775 | ||||||||||||
| State and political subdivisions |
16,219 | 371 | 143 | 16,447 | ||||||||||||
| Corporate bonds |
4,500 | 44 | 5 | 4,539 | ||||||||||||
| Equity securities |
106 | 23 | 1 | 128 | ||||||||||||
|
|
|
|
|
|
|
|
|
|||||||||
| Total available-for-sale |
102,253 | 1,023 | 1,554 | 101,722 | ||||||||||||
| Held-to-maturity securities |
||||||||||||||||
| U.S. Government agencies |
19,186 | – | 828 | 18,358 | ||||||||||||
| Mortgage-backed securities of government agencies |
25,164 | – | 879 | 24,285 | ||||||||||||
|
|
|
|
|
|
|
|
|
|||||||||
| Total held-to-maturity |
44,350 | – | 1,707 | 42,643 | ||||||||||||
| Restricted stock |
5,463 | – | – | 5,463 | ||||||||||||
|
|
|
|
|
|
|
|
|
|||||||||
| Total securities |
$ | 152,066 | $ | 1,023 | $ | 3,261 | $ | 149,828 | ||||||||
|
|
|
|
|
|
|
|
|
|||||||||
2014 Report to Shareholders | CSB Bancorp, Inc. 35
Table of Contents
NOTES TO CONSOLIDATED FINANCIAL STATEMENTS
NOTE 2 – SECURITIES (CONTINUED)
The amortized cost and fair value of debt securities at December 31, 2014, by contractual maturity, are shown below. Actual maturities may differ from contractual maturities because borrowers may have the right to call or prepay obligations with or without call or prepayment penalties.
| Amortized | Fair | |||||||
| (Dollars in thousands)
|
Cost
|
Value
|
||||||
|
|
||||||||
| Available-for-sale: |
||||||||
| Due in one year or less |
$ | 4,649 | $ | 4,684 | ||||
| Due after one through five years |
20,221 | 20,332 | ||||||
| Due after five through ten years |
23,289 | 23,427 | ||||||
| Due after ten years |
50,895 | 51,537 | ||||||
|
|
|
|
|
|||||
| Total debt securities available-for-sale |
$ | 99,054 | $ | 99,980 | ||||
|
|
|
|
|
|||||
| Held-to-maturity: |
||||||||
| Due in one year or less |
$ | – | $ | – | ||||
| Due after one through five years |
– | – | ||||||
| Due after five through ten years |
8,692 | 8,830 | ||||||
| Due after ten years |
29,624 | 30,120 | ||||||
|
|
|
|
|
|||||
| Total debt securities held-to-maturity |
$ | 38,316 | $ | 38,950 | ||||
|
|
|
|
|
|||||
Securities with a market value of approximately $88.4 million and $87.9 million were pledged at December 31, 2014 and 2013, respectively, to secure public deposits, as well as other deposits and borrowings as required or permitted by law.
Restricted stock primarily consists of investments in FHLB and Federal Reserve Bank stock. The Bank’s investment in FHLB stock amounted to $4.1 million and $5 million at December 31, 2014 and 2013, respectively. Federal Reserve Bank stock was $471 thousand at December 31, 2014 and 2013.
The following table shows the proceeds from sales of available-for-sale securities and the gross realized gains and losses on the sales of those securities that have been included in earnings as a result of the sales in 2014 and 2013. There were no securities sold during 2012.
| (Dollars in thousands)
|
2014
|
2013
|
||||||
|
|
||||||||
| Proceeds |
$ | 2,483 | $ | 4,309 | ||||
| Realized gains |
$ | 133 | $ | 159 | ||||
| Realized losses |
– | – | ||||||
|
|
|
|
|
|||||
| Net securities gains |
$ | 133 | $ | 159 | ||||
|
|
|
|
|
|||||
36 2014 Report to Shareholders | CSB Bancorp, Inc.
Table of Contents
NOTES TO CONSOLIDATED FINANCIAL STATEMENTS
NOTE 2 – SECURITIES (CONTINUED)
The following table presents gross unrealized losses and fair value of securities, aggregated by investment category and length of time that individual securities have been in a continuous unrealized loss position, at December 31:
| Securities in a Continuous Unrealized Loss Position | ||||||||||||||||||||||||
|
|
|
|||||||||||||||||||||||
| Less Than 12 Months | 12 Months Or More | Total | ||||||||||||||||||||||
|
|
|
|||||||||||||||||||||||
| Gross | Gross | Gross | ||||||||||||||||||||||
| Unrealized | Fair | Unrealized | Fair | Unrealized | Fair | |||||||||||||||||||
| (Dollars in thousands)
|
Losses
|
Value
|
Losses
|
Value
|
Losses
|
Value
|
||||||||||||||||||
|
|
||||||||||||||||||||||||
| 2014 |
||||||||||||||||||||||||
| Available-for-sale |
||||||||||||||||||||||||
| U.S. Treasury security |
$ | 4 | $ | 1,000 | $ | – | $ | – | $ | 4 | $ | 1,000 | ||||||||||||
| U.S. Government agencies |
12 | 5,188 | 143 | 5,856 | 155 | 11,044 | ||||||||||||||||||
| Mortgage-backed securities of government agencies |
40 | 6,348 | 39 | 4,939 | 79 | 11,287 | ||||||||||||||||||
| Asset-backed securities of government agencies |
5 | 1,603 | – | – | 5 | 1,603 | ||||||||||||||||||
| State and political subdivisions |
13 | 1,300 | 31 | 1,416 | 44 | 2,716 | ||||||||||||||||||
| Corporate bonds |
1 | 499 | – | – | 1 | 499 | ||||||||||||||||||
| Held-to-maturity |
||||||||||||||||||||||||
| U.S. Government agencies |
2 | 998 | – | – | 2 | 998 | ||||||||||||||||||
| Mortgage-backed securities of government agencies |
– | – | 56 | 9,265 | 56 | 9,265 | ||||||||||||||||||
|
|
|
|
|
|
|
|
|
|
|
|
|
|||||||||||||
| Total temporarily impaired securities |
$ | 77 | $ | 16,936 | $ | 269 | $ | 21,476 | $ | 346 | $ | 38,412 | ||||||||||||
|
|
|
|
|
|
|
|
|
|
|
|
|
|||||||||||||
| 2013 |
||||||||||||||||||||||||
| Available-for-sale |
||||||||||||||||||||||||
| U.S. Treasury security |
$ | 8 | $ | 997 | $ | – | $ | – | $ | 8 | $ | 997 | ||||||||||||
| U.S. Government agencies |
590 | 15,409 | 116 | 1,884 | 706 | 17,293 | ||||||||||||||||||
| Mortgage-backed securities of government agencies |
691 | 29,938 | – | – | 691 | 29,938 | ||||||||||||||||||
| State and political subdivisions |
122 | 3,522 | 21 | 233 | 143 | 3,755 | ||||||||||||||||||
| Corporate bonds |
4 | 1,163 | 1 | 499 | 5 | 1,662 | ||||||||||||||||||
| Equity securities |
– | – | 1 | 1 | 1 | 1 | ||||||||||||||||||
| Held-to-maturity |
||||||||||||||||||||||||
| U.S. Government agencies |
771 | 14,559 | 57 | 1,799 | 828 | 16,358 | ||||||||||||||||||
| Mortgage-backed securities of government agencies |
879 | 20,149 | – | – | 879 | 20,149 | ||||||||||||||||||
|
|
|
|
|
|
|
|
|
|
|
|
|
|||||||||||||
| Total temporarily impaired securities |
$ | 3,065 | $ | 85,737 | $ | 196 | $ | 4,416 | $ | 3,261 | $ | 90,153 | ||||||||||||
|
|
|
|
|
|
|
|
|
|
|
|
|
|||||||||||||
There were thirty-four (34) securities in an unrealized loss position at December 31, 2014, nineteen (19) of which were in a continuous loss position for twelve or more months. At least quarterly, the Company conducts a comprehensive security-level impairment assessment. The assessments are based on the nature of the securities, the extent and duration of the securities, the extent and duration of the loss, management’s intent to sell or if it is more likely than not that management will be required to sell a security before recovery of its amortized cost basis, which may be maturity. Management believes the Company will fully recover the cost of these securities and it does not intend to sell these securities and likely will not be required to sell them before the anticipated recovery of the remaining amortized cost basis, which may be maturity. As a result, management concluded that these securities were not other-than-temporarily impaired at December 31, 2014.
2014 Report to Shareholders | CSB Bancorp, Inc. 37
Table of Contents
NOTES TO CONSOLIDATED FINANCIAL STATEMENTS
NOTE 3 – LOANS
Loans consist of the following at December 31:
| (Dollars in thousands)
|
2014
|
2013
|
||||||
|
|
||||||||
| Commercial |
$ | 123,813 | $ | 117,478 | ||||
| Commercial real estate |
139,695 | 129,828 | ||||||
| Residential real estate |
121,684 | 111,445 | ||||||
| Construction & land development |
17,446 | 13,444 | ||||||
| Consumer |
7,913 | 6,687 | ||||||
|
|
|
|
|
|||||
| Total loans before deferred costs |
410,551 | 378,882 | ||||||
| Deferred loan costs |
352 | 243 | ||||||
|
|
|
|
|
|||||
| Total loans |
$ | 410,903 | $ | 379,125 | ||||
|
|
|
|
|
|||||
Loan Origination/Risk Management
The Company has certain lending policies and procedures in place that are designed to maximize loan income within an acceptable level of risk. Management reviews and approves these policies and procedures on a regular basis. A reporting system supplements the review process by providing management with frequent reports related to loan production, loan quality, concentrations of credit, loan delinquencies and nonperforming and potential problem loans. Diversification in the loan portfolio is a means of managing risk associated with fluctuations in economic conditions.
Commercial loans are underwritten after evaluating and understanding the borrower’s ability to operate profitably and prudently expand its business. Underwriting standards are designed to promote relationship banking rather than transactional banking. The Company’s management examines current and occasionally projected cash flows to determine the ability of the borrower to repay their obligations as agreed. Commercial loans are primarily made based on the identified cash flows of the borrower and secondarily on the underlying collateral provided by the borrower. However, the cash flows of borrowers may not be as expected and the collateral securing these loans may fluctuate in value. Most commercial loans are secured by the assets being financed or other business assets such as accounts receivable or inventory and may incorporate a personal guarantee; however, some short-term loans may be made on an unsecured basis. In the case of loans secured by accounts receivable, the availability of funds for the repayment of these loans may be substantially dependent on the ability of the borrower to collect amounts due from its customers.
Commercial real estate loans are subject to underwriting standards and processes similar to commercial loans, in addition to those of real estate loans. These loans are viewed primarily as cash flow loans and secondarily as loans secured by real estate. Commercial real estate lending typically involves higher loan principal amounts and the repayment of these loans is largely dependent on the successful operation of the property securing the loan or the business conducted on the property securing the loan. Commercial real estate loans may be adversely affected by conditions in the real estate markets or in the general economy. The properties securing the Company’s commercial real estate portfolio are diverse in terms of type. This diversity helps reduce the Company’s exposure to adverse economic events that affect any single industry. Management monitors and evaluates commercial real estate loans based on collateral, geography and risk grade criteria. In addition, management tracks the level of owner-occupied commercial real estate loans versus non-owner occupied loans. At December 31, 2014 and 2013, approximately 77% of the outstanding principal balance of the Company’s commercial real estate loans were secured by owner-occupied properties.
With respect to loans to developers and builders that are secured by non-owner occupied properties, the Company generally requires the borrower to have had an existing relationship with the Company and have a proven record of success. Construction and land development loans are underwritten utilizing independent appraisal reviews, sensitivity analysis of absorption and lease rates and financial analysis of the developers and property owners. Construction and land development loans are generally based upon estimates of costs and value associated with the completed project. These estimates may be inaccurate. Construction and land development loans often involve the disbursement of substantial funds with repayment substantially dependent on the success of the ultimate project. Sources of repayment for these types of loans may be pre-committed permanent loans from approved long-term lenders, sales of developed property or an interim loan commitment from the Company until permanent financing is obtained. These loans are closely monitored by on-site inspections and are considered to have higher risk than other real estate loans due to their ultimate repayment being sensitive to interest rate changes, governmental regulation of real property, general economic conditions and the availability of long-term financing.
The Company originates consumer loans utilizing a judgmental underwriting process. To monitor and manage consumer loan risk, policies and procedures are developed and modified, as needed, jointly by line and staff personnel. This activity, coupled with relatively small loan amounts that are spread across many individual borrowers, minimizes risk.
38 2014 Report to Shareholders | CSB Bancorp, Inc.
Table of Contents
NOTES TO CONSOLIDATED FINANCIAL STATEMENTS
NOTE 3 – LOANS (CONTINUED)
The Company maintains an independent loan review department that reviews and validates the credit risk program on a periodic basis. Results of these reviews are presented to management. The loan review process complements and reinforces the risk identification and assessment decisions made by lenders and credit personnel, as well as the Company’s policies and procedures.
Concentrations of Credit
Nearly all of the Company’s lending activity occurs within the State of Ohio, including the four counties of Holmes, Stark, Tuscarawas and Wayne, as well as other markets. The majority of the Company’s loan portfolio consists of commercial and industrial and commercial real estate loans. As of December 31, 2014 and 2013, there were no concentrations of loans to any single industry.
Allowance for Loan Losses
The following table details activity in the allowance for loan losses by portfolio segment for the years ended December 31, 2014, 2013 and 2012. Allocation of a portion of the allowance to one category of loans does not preclude its availability to absorb losses in other categories. During 2014, the increase in the provision for possible loan losses related to commercial loans was primarily due to the increase in the historical loss rate of loans in this category. The increase in the provision related to commercial real estate loans was affected by an increase in loan balances, offset by a decrease in impaired loans. The decrease in the provision related to residential real estate loans was affected by the decrease in the specific allocation amounts related to impaired residential real estate loans, as well as a decrease in the historical loss rates of the loans in this category. The decrease in the provision related to construction and consumer loans was due to the decrease in the historical loss rates in both of these categories.
| Construction | ||||||||||||||||||||||||||||
| Commercial | Residential | & Land | ||||||||||||||||||||||||||
| (Dollars in thousands)
|
Commercial
|
Real Estate
|
Real Estate
|
Development
|
Consumer
|
Unallocated
|
Total
|
|||||||||||||||||||||
|
|
||||||||||||||||||||||||||||
| December 31, 2014 |
||||||||||||||||||||||||||||
| Beginning balance |
$ | 1,219 | $ | 1,872 | $ | 1,205 | $ | 178 | $ | 91 | $ | 520 | $ | 5,085 | ||||||||||||||
| Provision for loan losses |
1,047 | 23 | (164 | ) | (36 | ) | (34 | ) | (193 | ) | 643 | |||||||||||||||||
| Charge-offs |
(1,005 | ) | (379 | ) | (27 | ) | – | (11 | ) | (1,422 | ) | |||||||||||||||||
| Recoveries |
28 | 8 | 25 | – | 14 | 75 | ||||||||||||||||||||||
|
|
|
|
|
|
|
|
|
|
|
|
|
|
|
|||||||||||||||
| Net charge-offs |
(977 | ) | (371 | ) | (2 | ) | – | 3 | (1,347 | ) | ||||||||||||||||||
|
|
|
|
|
|
|
|
|
|
|
|
|
|
|
|||||||||||||||
| Ending balance |
$ | 1,289 | $ | 1,524 | $ | 1,039 | $ | 142 | $ | 60 | $ | 327 | $ | 4,381 | ||||||||||||||
|
|
|
|
|
|
|
|
|
|
|
|
|
|
|
|||||||||||||||
| December 31, 2013 |
||||||||||||||||||||||||||||
| Beginning balance |
$ | 933 | $ | 1,902 | $ | 1,096 | $ | 253 | $ | 76 | $ | 320 | $ | 4,580 | ||||||||||||||
| Provision for loan losses |
451 | 78 | 173 | (75 | ) | 13 | 200 | 840 | ||||||||||||||||||||
| Charge-offs |
(190 | ) | (108 | ) | (82 | ) | – | (48 | ) | (428 | ) | |||||||||||||||||
| Recoveries |
25 | – | 18 | – | 50 | 93 | ||||||||||||||||||||||
|
|
|
|
|
|
|
|
|
|
|
|
|
|
|
|||||||||||||||
| Net charge-offs |
(165 | ) | (108 | ) | (64 | ) | – | 2 | (335 | ) | ||||||||||||||||||
|
|
|
|
|
|
|
|
|
|
|
|
|
|
|
|||||||||||||||
| Ending balance |
$ | 1,219 | $ | 1,872 | $ | 1,205 | $ | 178 | $ | 91 | $ | 520 | $ | 5,085 | ||||||||||||||
|
|
|
|
|
|
|
|
|
|
|
|
|
|
|
|||||||||||||||
| December 31, 2012 |
||||||||||||||||||||||||||||
| Beginning balance |
$ | 1,024 | $ | 1,673 | $ | 894 | $ | 180 | $ | 78 | $ | 233 | $ | 4,082 | ||||||||||||||
| Provision for loan losses |
(78 | ) | 512 | 206 | 73 | 23 | 87 | 823 | ||||||||||||||||||||
| Charge-offs |
(29 | ) | (283 | ) | (106 | ) | – | (89 | ) | (507 | ) | |||||||||||||||||
| Recoveries |
16 | – | 102 | – | 64 | 182 | ||||||||||||||||||||||
|
|
|
|
|
|
|
|
|
|
|
|
|
|
|
|||||||||||||||
| Net charge-offs |
(13 | ) | (283 | ) | (4 | ) | – | (25 | ) | (325 | ) | |||||||||||||||||
|
|
|
|
|
|
|
|
|
|
|
|
|
|
|
|||||||||||||||
| Ending balance |
$ | 933 | $ | 1,902 | $ | 1,096 | $ | 253 | $ | 76 | $ | 320 | $ | 4,580 | ||||||||||||||
|
|
|
|
|
|
|
|
|
|
|
|
|
|
|
|||||||||||||||
2014 Report to Shareholders | CSB Bancorp, Inc. 39
Table of Contents
NOTES TO CONSOLIDATED FINANCIAL STATEMENTS
NOTE 3 – LOANS (CONTINUED)
The following table presents the balance in the allowance for loan losses and the ending loan balances by portfolio segment and impairment method as of December 31:
| Construction | ||||||||||||||||||||||||||||
| Commercial | Residential | & Land | ||||||||||||||||||||||||||
| (Dollars in thousands)
|
Commercial
|
Real Estate
|
Real Estate
|
Development
|
Consumer
|
Unallocated
|
Total
|
|||||||||||||||||||||
|
|
||||||||||||||||||||||||||||
| 2014 |
||||||||||||||||||||||||||||
| Allowance for loan losses: |
||||||||||||||||||||||||||||
| Ending allowance balances attributable to loans: |
||||||||||||||||||||||||||||
| Individually evaluated for impairment |
$ | – | $ | 109 | $ | 75 | $ | – | $ | – | $ | – | $ | 184 | ||||||||||||||
| Collectively evaluated for impairment |
1,289 | 1,415 | 964 | 142 | 60 | 327 | 4,197 | |||||||||||||||||||||
|
|
|
|
|
|
|
|
|
|
|
|
|
|
|
|||||||||||||||
| Total ending allowance balance |
$ | 1,289 | $ | 1,524 | $ | 1,039 | $ | 142 | $ | 60 | $ | 327 | $ | 4,381 | ||||||||||||||
|
|
|
|
|
|
|
|
|
|
|
|
|
|
|
|||||||||||||||
| Loans: |
||||||||||||||||||||||||||||
| Loans individually evaluated for impairment |
$ | 5,922 | $ | 1,679 | $ | 1,612 | $ | – | $ | – | $ | 9,213 | ||||||||||||||||
| Loans collectively evaluated for impairment |
117,891 | 138,016 | 120,072 | 17,446 | 7,913 | 401,338 | ||||||||||||||||||||||
|
|
|
|
|
|
|
|
|
|
|
|
|
|||||||||||||||||
| Total ending loans balance |
$ | 123,813 | $ | 139,695 | $ | 121,684 | $ | 17,446 | $ | 7,913 | $ | 410,551 | ||||||||||||||||
|
|
|
|
|
|
|
|
|
|
|
|
|
|||||||||||||||||
| 2013 |
||||||||||||||||||||||||||||
| Allowance for loan losses: |
||||||||||||||||||||||||||||
| Ending allowance balances attributable to loans: |
||||||||||||||||||||||||||||
| Individually evaluated for impairment |
$ | 241 | $ | 331 | $ | 212 | $ | – | $ | – | $ | – | $ | 784 | ||||||||||||||
| Collectively evaluated for impairment |
978 | 1,541 | 993 | 178 | 91 | 520 | 4,301 | |||||||||||||||||||||
|
|
|
|
|
|
|
|
|
|
|
|
|
|
|
|||||||||||||||
| Total ending allowance balance |
$ | 1,219 | $ | 1,872 | $ | 1,205 | $ | 178 | $ | 91 | $ | 520 | $ | 5,085 | ||||||||||||||
|
|
|
|
|
|
|
|
|
|
|
|
|
|
|
|||||||||||||||
| Loans: |
||||||||||||||||||||||||||||
| Loans individually evaluated for impairment |
$ | 5,576 | $ | 3,220 | $ | 1,844 | $ | – | $ | – | $ | 10,640 | ||||||||||||||||
| Loans collectively evaluated for impairment |
111,902 | 126,608 | 109,601 | 13,444 | 6,687 | 368,242 | ||||||||||||||||||||||
|
|
|
|
|
|
|
|
|
|
|
|
|
|||||||||||||||||
| Total ending loans balance |
$ | 117,478 | $ | 129,828 | $ | 111,445 | $ | 13,444 | $ | 6,687 | $ | 378,882 | ||||||||||||||||
|
|
|
|
|
|
|
|
|
|
|
|
|
|||||||||||||||||
40 2014 Report to Shareholders | CSB Bancorp, Inc.
Table of Contents
NOTES TO CONSOLIDATED FINANCIAL STATEMENTS
NOTE 3 – LOANS (CONTINUED)
The following table presents loans individually evaluated for impairment by class of loans as of December 31:
| Recorded | ||||||||||||||||||||||||||||
| Unpaid | Investment | Recorded | Total | Average | Interest | |||||||||||||||||||||||
| Principal | With No | Investment | Recorded | Related | Recorded | Income | ||||||||||||||||||||||
| (Dollars in thousands)
|
Balance
|
Allowance
|
With Allowance
|
Investment
|
Allowance
|
Investment
|
Recognized
|
|||||||||||||||||||||
|
|
||||||||||||||||||||||||||||
| 2014 |
||||||||||||||||||||||||||||
| Commercial |
$ | 7,011 | $ | 5,889 | $ | 37 | $ | 5,926 | $ | – | $ | 6,739 | $ | 208 | ||||||||||||||
| Commercial real estate |
1,836 | 950 | 728 | 1,678 | 109 | 2,723 | 90 | |||||||||||||||||||||
| Residential real estate |
1,721 | 885 | 730 | 1,615 | 75 | 1,796 | 61 | |||||||||||||||||||||
| Construction & land development |
– | – | – | – | – | – | – | |||||||||||||||||||||
|
|
|
|
|
|
|
|
|
|
|
|
|
|
|
|||||||||||||||
| Total impaired loans |
$ | 10,568 | $ | 7,724 | $ | 1,495 | $ | 9,219 | $ | 184 | $ | 11,258 | $ | 359 | ||||||||||||||
|
|
|
|
|
|
|
|
|
|
|
|
|
|
|
|||||||||||||||
| 2013 |
||||||||||||||||||||||||||||
| Commercial |
$ | 5,595 | $ | 7 | $ | 5,580 | $ | 5,587 | $ | 241 | $ | 4,185 | $ | 182 | ||||||||||||||
| Commercial real estate |
3,540 | 563 | 2,658 | 3,221 | 331 | 3,650 | 163 | |||||||||||||||||||||
| Residential real estate |
2,001 | 337 | 1,510 | 1,847 | 212 | 1,315 | 41 | |||||||||||||||||||||
| Construction & land development |
– | – | – | – | – | 21 | 2 | |||||||||||||||||||||
|
|
|
|
|
|
|
|
|
|
|
|
|
|
|
|||||||||||||||
| Total impaired loans |
$ | 11,136 | $ | 907 | $ | 9,748 | $ | 10,655 | $ | 784 | $ | 9,171 | $ | 388 | ||||||||||||||
|
|
|
|
|
|
|
|
|
|
|
|
|
|
|
|||||||||||||||
| 2012 |
||||||||||||||||||||||||||||
| Commercial |
$ | 4,315 | $ | – | $ | 4,329 | $ | 4,329 | $ | 85 | $ | 4,123 | $ | 167 | ||||||||||||||
| Commercial real estate |
4,906 | 1,723 | 2,849 | 4,572 | 522 | 4,396 | 152 | |||||||||||||||||||||
| Residential real estate |
1,223 | 86 | 1,057 | 1,143 | 172 | 770 | 18 | |||||||||||||||||||||
| Construction & land development |
173 | 166 | – | 166 | – | 167 | – | |||||||||||||||||||||
|
|
|
|
|
|
|
|
|
|
|
|
|
|
|
|||||||||||||||
| Total impaired loans |
$ | 10,617 | $ | 1,975 | $ | 8,235 | $ | 10,210 | $ | 779 | $ | 9,456 | $ | 337 | ||||||||||||||
|
|
|
|
|
|
|
|
|
|
|
|
|
|
|
|||||||||||||||
2014 Report to Shareholders | CSB Bancorp, Inc. 41
Table of Contents
NOTES TO CONSOLIDATED FINANCIAL STATEMENTS
NOTE 3 – LOANS (CONTINUED)
The following table presents the aging of past due and nonaccrual loans by class of loans as of December 31:
| Total Past | ||||||||||||||||||||||||||||
| 30-59 Days | 60-89 Days | 90 Days + | Due and | Total | ||||||||||||||||||||||||
| (Dollars in thousands)
|
Current
|
Past Due
|
Past Due
|
Past Due
|
Nonaccrual
|
Nonaccrual
|
Loans
|
|||||||||||||||||||||
|
|
||||||||||||||||||||||||||||
| 2014 |
||||||||||||||||||||||||||||
| Commercial |
$ | 122,283 | $ | 362 | $ | 96 | $ | 1 | $ | 1,071 | $ | 1,530 | $ | 123,813 | ||||||||||||||
| Commercial real estate |
137,683 | 174 | 104 | – | 1,734 | 2,012 | 139,695 | |||||||||||||||||||||
| Residential real estate |
120,025 | 424 | 92 | 280 | 863 | 1,659 | 121,684 | |||||||||||||||||||||
| Construction & land development |
17,431 | – | 15 | – | – | 15 | 17,446 | |||||||||||||||||||||
| Consumer |
7,798 | 73 | 42 | – | – | 115 | 7,913 | |||||||||||||||||||||
|
|
|
|
|
|
|
|
|
|
|
|
|
|
|
|||||||||||||||
| Total loans |
$ | 405,220 | $ | 1,033 | $ | 349 | $ | 281 | $ | 3,668 | $ | 5,331 | $ | 410,551 | ||||||||||||||
|
|
|
|
|
|
|
|
|
|
|
|
|
|
|
|||||||||||||||
| 2013 |
||||||||||||||||||||||||||||
| Commercial |
$ | 117,342 | $ | 15 | $ | 37 | $ | – | $ | 84 | $ | 136 | $ | 117,478 | ||||||||||||||
| Commercial real estate |
128,462 | 111 | 107 | 40 | 1,108 | 1,366 | 129,828 | |||||||||||||||||||||
| Residential real estate |
109,274 | 616 | 467 | 46 | 1,042 | 2,171 | 111,445 | |||||||||||||||||||||
| Construction & land development |
12,494 | – | – | 950 | – | 950 | 13,444 | |||||||||||||||||||||
| Consumer |
6,524 | 123 | 40 | – | – | 163 | 6,687 | |||||||||||||||||||||
|
|
|
|
|
|
|
|
|
|
|
|
|
|
|
|||||||||||||||
| Total loans |
$ | 374,096 | $ | 865 | $ | 651 | $ | 1,036 | $ | 2,234 | $ | 4,786 | $ | 378,882 | ||||||||||||||
|
|
|
|
|
|
|
|
|
|
|
|
|
|
|
|||||||||||||||
Troubled Debt Restructurings
The Company had troubled debt restructurings (“TDRs”) of $6.8 million as of December 31, 2014, with $88 thousand of specific reserves allocated to customers whose loan terms have been modified in TDRs. As of December 31, 2013, the Company had TDRs of $8.6 million, with $583 thousand of specific reserves allocated. At December 31, 2014, $6.3 million of the loans classified as TDRs were performing in accordance with their modified terms. Of the remaining $518 thousand, all were in nonaccrual of interest status.
None of the loans that were restructured in 2012 or 2013 have defaulted in 2013 or 2014. All of the loan modifications include extensions of the loan maturity dates.
Loan modifications that are considered TDRs completed during the year ended December 31:
| Number Of | Pre-Modification | Post-Modification | ||||||||||
| (Dollars in thousands)
|
Loans Restructured
|
Recorded Investment
|
Recorded Investment
|
|||||||||
|
|
||||||||||||
| 2014 |
||||||||||||
| Residential real estate |
1 | $ | 84 | $ | 84 | |||||||
|
|
|
|
|
|
|
|||||||
| Total restructured loans |
1 | $ | 84 | $ | 84 | |||||||
|
|
|
|
|
|
|
|||||||
| 2013 |
||||||||||||
| Commercial real estate |
3 | $ | 83 | $ | 83 | |||||||
| Residential real estate |
3 | 264 | 264 | |||||||||
|
|
|
|
|
|
|
|||||||
| Total restructured loans |
6 | $ | 347 | $ | 347 | |||||||
|
|
|
|
|
|
|
|||||||
42 2014 Report to Shareholders | CSB Bancorp, Inc.
Table of Contents
NOTES TO CONSOLIDATED FINANCIAL STATEMENTS
NOTE 3 – LOANS (CONTINUED)
Credit Quality Indicators
The Company categorizes loans into risk categories based on relevant information about the ability of borrowers to service their debt such as: current financial information, historical payment experience, credit documentation, public information and current economic trends, among other factors. The Company analyzes commercial loans individually by classifying the loans as to credit risk. This analysis includes commercial loans with an outstanding balance greater than $275 thousand. This analysis is performed on an annual basis. The Company uses the following definitions for risk ratings:
Pass. Loans classified as pass (Acceptable, Low Acceptable or Pass Watch) may exhibit a wide array of characteristics but at a minimum represent an acceptable risk to the Bank. Borrowers in this rating may have leveraged but acceptable balance sheet positions, satisfactory asset quality, stable to favorable sales and earnings trends, acceptable liquidity and adequate cash flow. Loans are considered fully collectible and require an average amount of administration. While generally adhering to credit policy, these loans may exhibit occasional exceptions that do not result in undue risk to the Bank. Borrowers are generally capable of absorbing setbacks, financial and otherwise, without the threat of failure.
Special Mention. Loans classified as special mention have a material weakness that deserves management’s close attention. If left uncorrected, these weaknesses may result in deterioration of the repayment prospects for the loan or of the Bank’s credit position at some future date.
Substandard. Loans classified as substandard are inadequately protected by the current net worth and paying capacity of the obligor or of the collateral pledged, if any. Loans so classified have a well-defined weakness or weaknesses that jeopardize the liquidation of the debt. They are characterized by the distinct possibility that the Bank will sustain some loss if the deficiencies are not corrected.
Doubtful. Loans classified as doubtful have all the weaknesses inherent in those classified as substandard, with the added characteristic that the weaknesses make collection or liquidation in full, on the basis of currently existing facts, conditions and values, highly questionable and improbable.
Loans not meeting the criteria above that are analyzed individually as part of the above described process are considered to be pass rated loans. Loans listed as not rated are either less than $275 thousand or are included in groups of homogeneous loans. Based on the most recent analysis performed, the risk category of loans by class is as follows at December 31:
| Special | Not | |||||||||||||||||||||||
| (Dollars in thousands)
|
Pass
|
Mention
|
Substandard
|
Doubtful
|
Rated
|
Total
|
||||||||||||||||||
|
|
||||||||||||||||||||||||
| 2014 |
||||||||||||||||||||||||
| Commercial |
$ | 112,467 | $ | 3,809 | $ | 6,690 | $ | – | $ | 847 | $ | 123,813 | ||||||||||||
| Commercial real estate |
129,792 | 4,898 | 3,634 | – | 1,371 | 139,695 | ||||||||||||||||||
| Residential real estate |
209 | – | 39 | – | 121,436 | 121,684 | ||||||||||||||||||
| Construction & land development |
13,889 | 1,579 | – | – | 1,978 | 17,446 | ||||||||||||||||||
| Consumer |
– | – | – | – | 7,913 | 7,913 | ||||||||||||||||||
|
|
|
|
|
|
|
|
|
|
|
|
|
|||||||||||||
| Total |
$ | 256,357 | $ | 10,286 | $ | 10,363 | $ | – | $ | 133,545 | $ | 410,551 | ||||||||||||
|
|
|
|
|
|
|
|
|
|
|
|
|
|||||||||||||
| 2013 |
||||||||||||||||||||||||
| Commercial |
$ | 101,195 | $ | 10,352 | $ | 5,066 | $ | – | $ | 865 | $ | 117,478 | ||||||||||||
| Commercial real estate |
115,265 | 9,076 | 4,041 | – | 1,446 | 129,828 | ||||||||||||||||||
| Residential real estate |
237 | – | 47 | – | 111,161 | 111,445 | ||||||||||||||||||
| Construction & land development |
9,470 | 587 | 1,884 | – | 1,503 | 13,444 | ||||||||||||||||||
| Consumer |
– | – | – | – | 6,687 | 6,687 | ||||||||||||||||||
|
|
|
|
|
|
|
|
|
|
|
|
|
|||||||||||||
| Total |
$ | 226,167 | $ | 20,015 | $ | 11,038 | $ | – | $ | 121,662 | $ | 378,882 | ||||||||||||
|
|
|
|
|
|
|
|
|
|
|
|
|
|||||||||||||
2014 Report to Shareholders | CSB Bancorp, Inc. 43
Table of Contents
NOTES TO CONSOLIDATED FINANCIAL STATEMENTS
NOTE 3 – LOANS (CONTINUED)
Nonperforming loans include loans past due 90 days and greater and loans on nonaccrual of interest status. The following table presents loans that are not rated, by class of loans as of December 31:
| (Dollars in thousands)
|
Performing
|
Nonperforming
|
Total
|
|||||||||
|
|
||||||||||||
| 2014 |
||||||||||||
| Commercial |
$ | 847 | $ | – | $ | 847 | ||||||
| Commercial real estate |
1,371 | – | 1,371 | |||||||||
| Residential real estate |
120,332 | 1,104 | 121,436 | |||||||||
| Construction & land development |
1,978 | – | 1,978 | |||||||||
| Consumer |
7,913 | – | 7,913 | |||||||||
|
|
|
|
|
|
|
|||||||
| Total |
$ | 132,441 | $ | 1,104 | $ | 133,545 | ||||||
|
|
|
|
|
|
|
|||||||
| 2013 |
||||||||||||
| Commercial |
$ | 865 | $ | – | $ | 865 | ||||||
| Commercial real estate |
1,446 | – | 1,446 | |||||||||
| Residential real estate |
110,119 | 1,042 | 111,161 | |||||||||
| Construction & land development |
1,503 | – | 1,503 | |||||||||
| Consumer |
6,687 | – | 6,687 | |||||||||
|
|
|
|
|
|
|
|||||||
| Total |
$ | 120,620 | $ | 1,042 | $ | 121,662 | ||||||
|
|
|
|
|
|
|
|||||||
Mortgage Servicing Rights
For the years ended December 31, 2014 and 2013, the Company had outstanding mortgage servicing rights (“MSRs”) of $222 thousand and $225 thousand, respectively. No valuation allowance was recorded at December 31, 2014 or 2013 as the fair value of the MSRs exceeded their carrying value. On December 31, 2014, the Company had $55.5 million residential mortgage loans with servicing retained as compared to $56.9 million with servicing retained at December 31, 2013.
Total loans serviced for others approximated $70.6 million and $70.2 million at December 31, 2014 and 2013, respectively.
44 2014 Report to Shareholders | CSB Bancorp, Inc.
Table of Contents
NOTES TO CONSOLIDATED FINANCIAL STATEMENTS
NOTE 4 – PREMISES AND EQUIPMENT
Premises and equipment consist of the following at December 31:
| (Dollars in thousands)
|
2014
|
2013
|
||||||||||
|
| ||||||||||||
| Land and improvements |
$ | 1,489 | $ | 1,489 | ||||||||
| Buildings and improvements |
9,665 | 9,656 | ||||||||||
| Furniture and equipment |
7,567 | 7,327 | ||||||||||
| Leasehold improvements |
260 | 260 | ||||||||||
|
|
|
|
|
|||||||||
| 18,981 | 18,732 | |||||||||||
| Accumulated depreciation |
10,695 | 10,042 | ||||||||||
|
|
|
|
|
|||||||||
| Premises and equipment, net |
$ | 8,286 | $ | 8,690 | ||||||||
|
|
|
|
|
|||||||||
The Bank leases certain office locations. Total rental expense under these leases approximated $299 thousand, $299 thousand, and $298 thousand in 2014, 2013 and 2012, respectively. Depreciation expense amounted to $653 thousand, $625 thousand and $567 thousand for the years ended December 31, 2014, 2013 and 2012, respectively.
Future minimum lease payments at December 31, 2014 were as follows:
| (Dollars in thousands)
|
||||||||||
|
| ||||||||||
| 2015 |
$ | 294 | ||||||||
| 2016 |
172 | |||||||||
| 2017 |
32 | |||||||||
|
|
|
|||||||||
| Total |
$ | 498 | ||||||||
|
|
|
|||||||||
NOTE 5 – CORE DEPOSIT INTANGIBLE ASSETS
Core Deposit Intangible
No additional core deposit intangible was recorded in 2014, 2013 or 2012. The core deposit intangible asset will be amortized over an estimated life of ten years. Amortization expense related to the core deposit intangible asset totaled $130 thousand, $135 thousand and $140 thousand in 2014, 2013 and 2012, respectively. The following table shows the core deposit intangible and the related accumulated amortization as of December 31:
| (Dollars in thousands)
|
2014
|
2013
|
2012
|
|||||||||
|
|
||||||||||||
| Gross carrying amount |
$ | 1,251 | $ | 1,251 | $ | 1,251 | ||||||
| Accumulated amortization |
(622 | ) | (492 | ) | (357 | ) | ||||||
|
|
|
|
|
|
|
|||||||
| Net carrying amount |
$ | 629 | $ | 759 | $ | 894 | ||||||
|
|
|
|
|
|
|
|||||||
2014 Report to Shareholders | CSB Bancorp, Inc. 45
Table of Contents
NOTES TO CONSOLIDATED FINANCIAL STATEMENTS
NOTE 5 – CORE DEPOSIT INTANGIBLE ASSETS (CONTINUED)
The estimated aggregate future amortization expense for the core deposit assets remaining as of December 31, 2014 is as follows:
| Core Deposit | ||||||||
| (Dollars in thousands)
|
Amortization
|
|||||||
|
| ||||||||
| 2015 |
$ | 125 | ||||||
| 2016 |
121 | |||||||
| 2017 |
116 | |||||||
| 2018 |
101 | |||||||
| 2019 |
63 | |||||||
| Thereafter |
103 | |||||||
|
|
|
|||||||
| $ | 629 | |||||||
|
|
|
|||||||
NOTE 6 – INTEREST-BEARING DEPOSITS
Interest-bearing deposits at December 31 are as follows:
| (Dollars in thousands)
|
2014
|
2013
|
||||||||
|
|
||||||||||
| Demand |
$ | 77,725 | $ | 76,327 | ||||||
| Savings |
155,336 | 149,937 | ||||||||
| Time deposits: |
||||||||||
| In excess of $250,000 |
13,191 | 12,280 | ||||||||
| Other |
114,572 | 122,064 | ||||||||
|
|
|
|
|
|||||||
| Total interest-bearing deposits |
$ | 360,824 | $ | 360,608 | ||||||
|
|
|
|
|
|||||||
|
At December 31, 2014, stated maturities of time deposits were as follows:
|
| |||||||||
| (Dollars in thousands)
|
||||||||||
|
|
||||||||||
| 2015 |
$ | 66,964 | ||||||||
| 2016 |
26,155 | |||||||||
| 2017 |
14,910 | |||||||||
| 2018 |
15,323 | |||||||||
| 2019 |
4,389 | |||||||||
| 2020 and beyond |
22 | |||||||||
|
|
|
|||||||||
| Total |
$ | 127,763 | ||||||||
|
|
|
|||||||||
46 2014 Report to Shareholders | CSB Bancorp, Inc.
Table of Contents
NOTES TO CONSOLIDATED FINANCIAL STATEMENTS
NOTE 7 – BORROWINGS
Short-term borrowings
Short-term borrowings include overnight repurchase agreements, federal funds purchased and short-term advances through the FHLB. The outstanding balances and related information for short-term borrowings are summarized as follows:
| (Dollars in thousands)
|
2014
|
2013
|
||||||||
|
|
||||||||||
| Balance at year-end |
$ | 46,627 | $ | 48,671 | ||||||
| Average balance outstanding |
51,855 | 45,330 | ||||||||
| Maximum month-end balance |
63,717 | 48,671 | ||||||||
| Weighted-average rate at year-end |
0.14 | % | 0.15 | % | ||||||
| Weighted-average rate during the year |
0.15 | 0.15 | ||||||||
Average balances outstanding during the year represent daily average balances, and average interest rates represent interest expenses divided by the related average balances.
Other borrowings
The following table sets forth information concerning other borrowings:
| Weighted | ||||||||||||||||||||||||||||
| Average | Stated Interest | |||||||||||||||||||||||||||
| Maturity Range | Interest | Rate Range | At December 31, | |||||||||||||||||||||||||
| (Dollars in thousands)
|
From
|
To
|
Rate
|
From
|
To
|
2014
|
2013
|
|||||||||||||||||||||
|
|
||||||||||||||||||||||||||||
| Fixed rate |
10/2/14 | 12/21/17 | 3.61 | % | 3.48 | % | 3.73 | % | $ | 10,000 | $ | 12,000 | ||||||||||||||||
| Fixed rate amortizing |
1/1/14 | 4/1/24 | 1.42 | 1.16 | 7.15 | 4,953 | 459 | |||||||||||||||||||||
|
|
|
|
|
|||||||||||||||||||||||||
| $ | 14,953 | $ | 12,459 | |||||||||||||||||||||||||
|
|
|
|
|
|||||||||||||||||||||||||
Maturities of other borrowings at December 31, 2014, are summarized as follows for the years ended December 31:
| Weighted | ||||||||||
| Average | ||||||||||
| (Dollars in thousands)
|
Amount
|
Rate
|
||||||||
|
|
||||||||||
| 2015 |
$ | 1,488 | 1.71 | % | ||||||
| 2016 |
1,079 | 1.58 | ||||||||
| 2017 |
10,730 | 3.44 | ||||||||
| 2018 |
534 | 1.16 | ||||||||
| 2019 and beyond |
1,122 | 1.16 | ||||||||
|
|
|
|||||||||
| $ | 14,953 | 2.88 | % | |||||||
|
|
|
|||||||||
Monthly principal and interest payments, as well as 10% - 20% principal curtailments on the borrowings’ anniversary dates are due on the fixed-rate amortizing borrowings. FHLB borrowings are secured by a blanket collateral agreement. At December 31, 2014 the Company has the capacity to borrow an additional $46.1 million from the FHLB.
2014 Report to Shareholders | CSB Bancorp, Inc. 47
Table of Contents
NOTES TO CONSOLIDATED FINANCIAL STATEMENTS
NOTE 8 – INCOME TAXES
The provision for income taxes consists of the following for the years ended December 31:
| (Dollars in thousands)
|
2014
|
2013
|
2012
|
|||||||||
|
|
||||||||||||
| Current |
$ | 2,393 | $ | 2,196 | $ | 2,040 | ||||||
| Deferred |
175 | 77 | (50 | ) | ||||||||
|
|
|
|
|
|
|
|||||||
| Total income tax provision |
$ | 2,568 | $ | 2,273 | $ | 1,990 | ||||||
|
|
|
|
|
|
|
|||||||
The income tax provision attributable to income from operations differs from the amounts computed by applying the statutory federal income tax rate of 34% to income before income taxes as follows:
| (Dollars in thousands)
|
2014
|
2013
|
2012
|
|||||||||
|
|
||||||||||||
| Expected provision using statutory |
$ | 2,874 | $ | 2,554 | $ | 2,223 | ||||||
| Tax-exempt income on state and municipal |
(188 | ) | (203 | ) | (269 | ) | ||||||
| Interest expense associated with carrying certain state |
4 | 6 | 6 | |||||||||
| Tax-exempt income on bank owned life insurance |
(90 | ) | (86 | ) | (78 | ) | ||||||
| Other |
(32 | ) | 2 | 108 | ||||||||
|
|
|
|
|
|
|
|||||||
| Total income tax provision |
$ | 2,568 | $ | 2,273 | $ | 1,990 | ||||||
|
|
|
|
|
|
|
|||||||
The tax effects of temporary differences that give rise to deferred tax assets and deferred tax liabilities at December 31 are as follows:
| (Dollars in thousands) | 2014 | 2013 | ||||||||
|
| ||||||||||
| Allowance for loan losses |
$ | 1,648 | $ | 1,887 | ||||||
| Net operating loss carryforward |
341 | 470 | ||||||||
| Capital loss carryforward |
– | 35 | ||||||||
| Unrealized loss on securities available-for-sale |
145 | 750 | ||||||||
| Other |
41 | 37 | ||||||||
|
|
|
|
|
|||||||
| 2,175 | 3,179 | |||||||||
|
|
|
|
|
|||||||
| Valuation allowance on deferred tax assets |
– | (35 | ) | |||||||
|
|
|
|
|
|||||||
| Deferred tax assets |
2,175 | 3,144 | ||||||||
|
|
|
|
|
|||||||
| Premises and equipment |
(374 | ) | (443 | ) | ||||||
| Federal Home Loan Bank stock dividends |
(609 | ) | (736 | ) | ||||||
| Deferred loan fees |
(282 | ) | (226 | ) | ||||||
| Prepaid expenses |
(159 | ) | (120 | ) | ||||||
| Other |
(374 | ) | (462 | ) | ||||||
|
|
|
|
|
|||||||
| Deferred tax liabilities |
(1,798 | ) | (1,987 | ) | ||||||
|
|
|
|
|
|||||||
| Net deferred tax asset |
$ | 377 | $ | 1,157 | ||||||
|
|
|
|
|
|||||||
48 2014 Report to Shareholders | CSB Bancorp, Inc.
Table of Contents
NOTES TO CONSOLIDATED FINANCIAL STATEMENTS
NOTE 8 – INCOME TAXES (CONTINUED)
The Company has a net operating loss tax carry-forward of approximately $1 million, as of December 31, 2014. The net operating loss carryforward can be used to offset future taxable income and will begin to expire in tax year 2026.
The Company recognized the benefit of a capital loss carryforward due to expire in 2014 with the redemption of Federal Home Loan stock in 2014. The valuation allowance for the capital loss carry forward was reversed during 2014. No additional valuation allowance is deemed necessary in view of certain tax strategies, coupled with the anticipated future taxable income as evidenced by the Company’s earnings.
There is currently no liability for uncertain tax positions and no known unrecognized tax benefits. The Company recognizes, when applicable, interest and penalties related to unrecognized tax benefits in the provision for income taxes in the Consolidated Statement of Income. With few exceptions, the Company is no longer subject to U.S. federal, state, or local income tax examinations by tax authorities for years prior to 2011.
NOTE 9 – EMPLOYEE BENEFITS
The Company sponsors a contributory 401(k) profit-sharing plan (the “Plan”) covering substantially all employees who meet certain age and service requirements. The Plan permits investment in the Company’s common stock subject to various limitations and provides for discretionary profit sharing and matching contributions. The discretionary profit sharing contribution is determined annually by the Board of Directors and amounted to 2.75% of each eligible participant’s compensation in 2014 and 2013, and 2.5% of each eligible participant’s compensation for 2012, respectively. The Plan also provides for a 50% Company match of participant contributions up to a maximum of 2% of each participant’s annual compensation. Expense under the Plan amounted to approximately $269 thousand, $284 thousand and $270 thousand for 2014, 2013 and 2012, respectively.
The Company maintains a stock option plan. No stock options were granted during the three years presented.
The following summarizes stock options activity for the years ended December 31:
| 2014 | 2013 | 2012 | ||||||||||||||||||||||
| Weighted | Weighted | Weighted | ||||||||||||||||||||||
| Average | Average | Average | ||||||||||||||||||||||
| Exercise | Exercise | Exercise | ||||||||||||||||||||||
| Shares | Price | Shares | Price | Shares | Price | |||||||||||||||||||
|
|
||||||||||||||||||||||||
| Outstanding at beginning of year |
30,760 | $ | 17.90 | 31,760 | $ | 17.85 | 39,620 | $ | 17.49 | |||||||||||||||
| Granted |
– | – | – | – | – | – | ||||||||||||||||||
| Exercised |
(18,856 | ) | (17.84 | ) | (1,000 | ) | (16.10 | ) | (4,650 | ) | (16.05 | ) | ||||||||||||
| Forfeited |
– | – | (3,210 | ) | (16.06 | ) | ||||||||||||||||||
|
|
|
|
|
|
|
|||||||||||||||||||
| Outstanding at end of year |
11,904 | 18.00 | 30,760 | 17.90 | 31,760 | 17.85 | ||||||||||||||||||
|
|
|
|
|
|
|
|||||||||||||||||||
| Options exercisable at year-end |
11,904 | $ | 18.00 | 30,760 | $ | 17.90 | 31,760 | $ | 17.85 | |||||||||||||||
| Weighted-average fair value of |
N/A | N/A | N/A | |||||||||||||||||||||
Options outstanding at December 31, 2014 were as follows:
| Outstanding | ||||||||||||||||
| Weighted | ||||||||||||||||
| Average | Weighted | |||||||||||||||
| Remaining | Average | |||||||||||||||
| Exercise | Contractual | Exercise | ||||||||||||||
| Price
|
Number
|
Life (Years)
|
Number
|
Price
|
||||||||||||
|
|
||||||||||||||||
| $ 18.00 |
11,904 | 1.23 | 11,904 | $ | 18.00 | |||||||||||
2014 Report to Shareholders | CSB Bancorp, Inc. 49
Table of Contents
NOTES TO CONSOLIDATED FINANCIAL STATEMENTS
NOTE 9 – EMPLOYEE BENEFITS (CONTINUED)
The total intrinsic value of outstanding in-the-money stock options and outstanding in-the-money exercisable stock options was $48 thousand and $34 thousand at December 31, 2014 and 2013, respectively. There were no share awards vested in 2014, 2013 or 2012.
NOTE 10 – FINANCIAL INSTRUMENTS WITH OFF-BALANCE SHEET RISK
The Bank is party to financial instruments with off-balance sheet risk in the normal course of business to meet the financing needs of its customers. These financial instruments are primarily loan commitments to extend credit and letters of credit. These instruments involve, to varying degrees, elements of credit risk in excess of the amounts recognized in the Consolidated Balance Sheets. The contract amount of these instruments reflects the extent of involvement the Bank has in these financial instruments. The Bank’s exposure to credit loss in the event of the nonperformance by the other party to the financial instruments for loan commitments to extend credit and letters of credit is represented by the contractual amounts of these instruments. The Bank uses the same credit policies in making loan commitments as it does for on-balance sheet loans.
The following financial instruments whose contract amount represents credit risk were outstanding at December 31:
| (Dollars in thousands)
|
2014
|
2013
|
||||||||
|
|
||||||||||
| Commitments to extend credit |
$ | 126,387 | $ | 119,571 | ||||||
|
|
|
|
|
|||||||
|
Letters of credit |
$ |
1,778 |
|
$ |
679 |
| ||||
|
|
|
|
|
|||||||
Commitments to extend credit are agreements to lend to a customer as long as there is no violation of any condition established in the contract. Commitments generally have fixed expiration dates or other termination clauses and may require payment of a fee. Since many of the commitments are expected to expire without being drawn upon, the total commitment amount does not necessarily represent future cash requirements. The Company evaluates each customer’s credit worthiness on a case-by-case basis. The amount of collateral, obtained if deemed necessary by the Company upon extension of credit, is based on management’s credit evaluation of the customer. Collateral held varies but may include accounts receivable, recognized inventory, property, plant and equipment, and income-producing commercial properties.
Letters of credit are written conditional commitments issued by the Company to guarantee the performance of a customer to a third party and are reviewed for renewal at expiration. All letters of credit outstanding at December 31, 2014 are due on demand or expire in 2015. The credit risk involved in issuing letters of credit is essentially the same as that involved in extending loans to customers. The Company requires collateral supporting these commitments when deemed appropriate.
NOTE 11 – RELATED-PARTY TRANSACTIONS
In the ordinary course of business, loans are granted by the Company to executive officers, directors and their related business interests consistent with Federal Reserve Regulation O. The following is an analysis of activity of related-party loans for the years ended December 31:
| (Dollars in thousands) | 2014 | 2013 | ||||||||
|
|
||||||||||
| Balance at beginning of year |
$ | 5,092 | $ | 6,218 | ||||||
| New loans and advances |
72 | 315 | ||||||||
| Repayments, including loans sold |
747 | 1,441 | ||||||||
|
|
|
|
|
|||||||
| Balance at end of year |
$ | 4,417 | $ | 5,092 | ||||||
|
|
|
|
|
|||||||
Deposits from executive officers, directors and their related business interests at both December 31, 2014 and 2013 were approximately $10.4 million.
50 2014 Report to Shareholders | CSB Bancorp, Inc.
Table of Contents
NOTES TO CONSOLIDATED FINANCIAL STATEMENTS
NOTE 12 – REGULATORY MATTERS
The Company (on a consolidated basis) and Bank are subject to various regulatory capital requirements administered by the federal and state banking agencies. Failure to meet minimum capital requirements can initiate certain mandatory and possibly additional discretionary actions by regulators that, if undertaken, could have a direct material effect on the Company’s and Bank’s financial statements. Under capital adequacy guidelines and the regulatory framework for prompt corrective action, the Company and Bank must meet specific capital guidelines that involve quantitative measures of the assets, liabilities and certain off-balance-sheet items as calculated under regulatory accounting practices. The capital amounts and classification are also subject to qualitative judgments by the regulators about components, risk weightings and other factors.
Quantitative measures established by regulation to ensure capital adequacy require the Company and Bank to maintain minimum amounts and ratios (set forth in the following table) of Total and Tier 1 capital (as defined in the regulations) to risk-weighted assets (as defined), and of Tier 1 capital to average assets (as defined). Management believes, as of December 31, 2014 and 2013 that the Company and Bank met or exceeded all capital adequacy requirements to which they are subject.
As of December 31, 2014, the most recent notification from federal and state banking agencies categorized the Bank as “well capitalized” under the regulatory framework for prompt corrective action. To be categorized as “well capitalized” an institution must maintain minimum Total risk-based, Tier 1 risk-based and Tier 1 leverage ratios as set forth in the following tables. There are no known conditions or events since that notification that Management believes have changed the Bank’s category.
The actual capital amounts and ratios of the Company and Bank as of December 31 are presented in the following tables:
| Minimum | Minimum Required | |||||||||||||||||||||||
| Required For | To Be Well Capitalized | |||||||||||||||||||||||
| Capital Adequacy | Under Prompt | |||||||||||||||||||||||
| Actual | Purposes | Corrective Action | ||||||||||||||||||||||
|
|
|
|||||||||||||||||||||||
| (Dollars in thousands)
|
Amount
|
Ratio
|
Amount
|
Ratio
|
Amount
|
Ratio
|
||||||||||||||||||
|
|
||||||||||||||||||||||||
| 2014 |
||||||||||||||||||||||||
| Total capital (to risk-weighted assets) |
||||||||||||||||||||||||
| Consolidated |
$ | 56,742 | 13.6 | % | $ | 33,488 | 8.0 | % | $ | 41,861 | 10.0 | % | ||||||||||||
| Bank |
55,731 | 13.3 | 33,464 | 8.0 | 41,830 | 10.0 | ||||||||||||||||||
| Tier 1 capital (to risk-weighted assets) |
||||||||||||||||||||||||
| Consolidated |
52,353 | 12.5 | 16,744 | 4.0 | 25,116 | 6.0 | ||||||||||||||||||
| Bank |
51,342 | 12.3 | 16,732 | 4.0 | 25,098 | 6.0 | ||||||||||||||||||
| Tier 1 capital (to average assets) |
||||||||||||||||||||||||
| Consolidated |
52,353 | 8.5 | 24,602 | 4.0 | 30,753 | 5.0 | ||||||||||||||||||
| Bank |
51,342 | 8.4 | 24,597 | 4.0 | 30,746 | 5.0 | ||||||||||||||||||
| 2013 |
||||||||||||||||||||||||
| Total capital (to risk-weighted assets) |
||||||||||||||||||||||||
| Consolidated |
$ | 53,268 | 13.6 | % | $ | 31,416 | 8.0 | % | $ | 39,270 | 10.0 | % | ||||||||||||
| Bank |
52,458 | 13.4 | 31,392 | 8.0 | 39,240 | 10.0 | ||||||||||||||||||
| Tier 1 capital (to risk-weighted assets) |
||||||||||||||||||||||||
| Consolidated |
48,357 | 12.3 | 15,708 | 4.0 | 23,562 | 6.0 | ||||||||||||||||||
| Bank |
47,558 | 12.1 | 15,696 | 4.0 | 23,544 | 6.0 | ||||||||||||||||||
| Tier 1 capital (to average assets) |
||||||||||||||||||||||||
| Consolidated |
48,357 | 8.2 | 23,550 | 4.0 | 29,438 | 5.0 | ||||||||||||||||||
| Bank |
47,558 | 8.1 | 23,544 | 4.0 | 29,430 | 5.0 | ||||||||||||||||||
2014 Report to Shareholders | CSB Bancorp, Inc. 51
Table of Contents
NOTES TO CONSOLIDATED FINANCIAL STATEMENTS
NOTE 12 – REGULATORY MATTERS (CONTINUED)
The Company’s primary source of funds with which to pay dividends are dividends received from the Bank. The payment of dividends by the Bank to the Company is subject to restrictions by its regulatory agencies. These restrictions generally limit dividends to current year net income and prior two-years’ net retained earnings. Also, dividends may not reduce capital levels below the minimum regulatory requirements disclosed in the prior table. Under these provisions, at January 1, 2015, the Bank could dividend $9.5 million to the Company. The Company does not anticipate the financial need to obtain regulatory approval due to its current cash balances and ability to access the credit markets. Federal law prevents the Company from borrowing from the Bank unless loans are secured by specific obligations. Further, such secured loans are limited to an amount not exceeding ten percent of the Bank’s common stock and capital surplus.
NOTE 13 – CONDENSED PARENT COMPANY FINANCIAL INFORMATION
A summary of condensed financial information of the parent company as of December 31, 2014 and 2013 and for each of the three years in the period ended December 31, 2014 follows:
| (Dollars in thousands)
|
2014
|
2013
|
||||||||||
|
|
||||||||||||
|
CONDENSED BALANCE SHEETS
|
||||||||||||
| ASSETS
|
||||||||||||
| Cash deposited with subsidiary bank |
$ | 699 | $ | 598 | ||||||||
| Investment in subsidiary bank |
56,424 | 51,596 | ||||||||||
| Securities available-for-sale |
128 | 128 | ||||||||||
| Other assets |
199 | 192 | ||||||||||
|
|
|
|
|
|||||||||
|
TOTAL ASSETS
|
$
|
57,450
|
|
$
|
52,514
|
|
||||||
|
|
|
|
|
|||||||||
|
LIABILITIES AND SHAREHOLDERS’ EQUITY |
||||||||||||
| Total liabilities |
$ | – | $ | 103 | ||||||||
| Total shareholders’ equity |
57,450 | 52,411 | ||||||||||
|
|
|
|
|
|||||||||
| TOTAL LIABILITIES AND SHAREHOLDERS’ EQUITY |
$ | 57,450 | $ | 52,514 | ||||||||
|
|
|
|
|
|||||||||
| (Dollars in thousands)
|
2014
|
2013
|
2012
|
|||||||||
|
|
||||||||||||
| CONDENSED STATEMENTS OF INCOME |
||||||||||||
|
Interest on securities |
$ | 2 | $ | 2 | $ | 2 | ||||||
| Dividends from subsidiary |
2,400 | 2,400 | 2,000 | |||||||||
|
|
|
|
|
|
|
|||||||
| Total income |
2,402 | 2,402 | 2,002 | |||||||||
| Operating expenses |
312 | 356 | 354 | |||||||||
|
|
|
|
|
|
|
|||||||
| Income before taxes and undistributed equity income of subsidiary |
2,090 | 2,046 | 1,648 | |||||||||
| Income tax benefit |
(141 | ) | (121 | ) | (120 | ) | ||||||
| Equity earnings in subsidiary, net of dividends |
3,653 | 3,073 | 2,779 | |||||||||
|
|
|
|
|
|
|
|||||||
| NET INCOME |
$ | 5,884 | $ | 5,240 | $ | 4,547 | ||||||
|
|
|
|
|
|
|
|||||||
| COMPREHENSIVE INCOME |
$ | 7,058 | $ | 1,920 | $ | 4,981 | ||||||
|
|
|
|
|
|
|
|||||||
52 2014 Report to Shareholders | CSB Bancorp, Inc.
Table of Contents
NOTES TO CONSOLIDATED FINANCIAL STATEMENTS
NOTE 13 – CONDENSED PARENT COMPANY FINANCIAL INFORMATION (CONTINUED)
| (Dollars in thousands)
|
2014
|
2013
|
2012
|
|||||||||
|
|
||||||||||||
| CONDENSED STATEMENTS OF CASH FLOWS |
||||||||||||
| Cash flows from operating activities: |
||||||||||||
| Net income |
$ | 5,884 | $ | 5,240 | $ | 4,547 | ||||||
| Adjustments to reconcile net income to cash provided by operations: |
||||||||||||
| Equity earnings in subsidiary, net of dividends |
(3,653 | ) | (3,073 | ) | (2,779 | ) | ||||||
| Change in other assets, liabilities |
(111 | ) | 42 | 49 | ||||||||
|
|
|
|
|
|
|
|||||||
| Net cash provided by operating activities |
2,120 | 2,209 | 1,817 | |||||||||
|
|
|
|
|
|
|
|||||||
| Cash flows from investing activities: |
||||||||||||
| Purchase of investment securities |
– | (37 | ) | – | ||||||||
|
|
|
|
|
|
|
|||||||
| Net cash used in investing activities |
– | (37 | ) | – | ||||||||
|
|
|
|
|
|
|
|||||||
| Cash flows from financing activities: |
||||||||||||
| Cash dividends paid |
(2,026 | ) | (1,970 | ) | (1,969 | ) | ||||||
| Cash received from exercise of stock options |
7 | 8 | 5 | |||||||||
|
|
|
|
|
|
|
|||||||
| Net cash used in financing activities |
(2,019 | ) | (1,962 | ) | (1,964 | ) | ||||||
|
|
|
|
|
|
|
|||||||
| Increase (decrease) in cash |
101 | 210 | (147 | ) | ||||||||
| Cash at beginning of year |
598 | 388 | 535 | |||||||||
|
|
|
|
|
|
|
|||||||
| Cash at end of year |
$ | 699 | $ | 598 | $ | 388 | ||||||
|
|
|
|
|
|
|
|||||||
NOTE 14 – FAIR VALUE MEASUREMENTS
The Company provides disclosures about assets and liabilities carried at fair value. The framework provides a fair value hierarchy that prioritizes the inputs to valuation techniques used to measure fair value. The hierarchy gives the highest priority to unadjusted quoted prices in active markets for identical assets or liabilities and lowest priority to unobservable inputs. The three broad levels of the fair value hierarchy are described below:
| Level I: |
Inputs to the valuation methodology are unadjusted quoted prices for identical assets or liabilities in active markets that the Company has the ability to access. | |
| Level II: |
Inputs to the valuation methodology include quoted prices for similar assets or liabilities in active markets; quoted prices for identical or similar assets or liabilities in inactive markets; inputs other than quoted prices that are observable for the asset or liability; inputs that are derived principally from or corroborated by observable market data by or other means including certified appraisals. If the asset or liability has a specified (contractual) term, the Level II input must be observable for substantially the full term of the asset or liability. | |
| Level III: |
Inputs to the valuation methodology are unobservable and significant to the fair value measurement. |
2014 Report to Shareholders | CSB Bancorp, Inc. 53
Table of Contents
NOTES TO CONSOLIDATED FINANCIAL STATEMENTS
NOTE 14 – FAIR VALUE MEASUREMENTS (CONTINUED)
The following table presents the assets reported on the consolidated statements of financial condition at their fair value as of December 31, 2014 and December 31, 2013, by level within the fair value hierarchy. No liabilities are carried at fair value. As required by the accounting standards, financial assets and liabilities are classified in their entirety based on the lowest level of input that is significant to the fair value measurement. Equity securities and U.S. Treasury Notes are valued at the closing price reported on the active market on which the individual securities are traded. Obligations of U.S. government corporations and agencies, mortgage-backed securities, asset-backed securities and obligations of states and political subdivisions are valued at observable market data for similar assets.
| (Dollars in thousands)
|
Level I
|
Level II
|
Level III
|
Total
|
||||||||||||
|
|
||||||||||||||||
| Assets: |
December 31, 2014 | |||||||||||||||
|
|
|
|||||||||||||||
| Securities available-for-sale |
||||||||||||||||
| U.S. Treasury security |
$ | 1,000 | $ | – | $ | – | $ | 1,000 | ||||||||
| U.S. Government agencies |
– | 25,079 | – | 25,079 | ||||||||||||
| Mortgage-backed securities of government agencies |
– | 48,347 | – | 48,347 | ||||||||||||
| Other mortgage-backed securities |
– | 141 | – | 141 | ||||||||||||
| Asset-backed securities of government agencies |
– | 2,604 | – | 2,604 | ||||||||||||
| State and political subdivisions |
– | 18,267 | – | 18,267 | ||||||||||||
| Corporate bonds |
– | 4,542 | – | 4,542 | ||||||||||||
|
|
|
|
|
|
|
|
|
|||||||||
| Total debt securities |
1,000 | 98,980 | – | 99,980 | ||||||||||||
| Equity securities |
128 | – | – | 128 | ||||||||||||
|
|
|
|
|
|
|
|
|
|||||||||
| Total available-for-sale securities |
$ | 1,128 | $ | 98,980 | $ | – | $ | 100,108 | ||||||||
|
|
|
|
|
|
|
|
|
|||||||||
| Assets: |
December 31, 2013 | |||||||||||||||
|
|
|
|||||||||||||||
| Securities available-for-sale |
||||||||||||||||
| U.S. Treasury security |
$ | 997 | $ | – | $ | – | $ | 997 | ||||||||
| U.S. Government agencies |
– | 22,301 | – | 22,301 | ||||||||||||
| Mortgage-backed securities of government agencies |
– | 54,300 | – | 54,300 | ||||||||||||
| Other mortgage-backed securities |
– | 235 | – | 235 | ||||||||||||
| Asset-backed securities of government agencies |
– | 2,775 | – | 2,775 | ||||||||||||
| State and political subdivisions |
– | 16,447 | – | 16,447 | ||||||||||||
| Corporate bonds |
– | 4,539 | – | 4,539 | ||||||||||||
|
|
|
|
|
|
|
|
|
|||||||||
| Total debt securities |
997 | 100,597 | – | 101,594 | ||||||||||||
| Equity securities |
128 | – | – | 128 | ||||||||||||
|
|
|
|
|
|
|
|
|
|||||||||
| Total available-for-sale securities |
$ | 1,125 | $ | 100,597 | $ | – | $ | 101,722 | ||||||||
|
|
|
|
|
|
|
|
|
|||||||||
54 2014 Report to Shareholders | CSB Bancorp, Inc.
Table of Contents
NOTES TO CONSOLIDATED FINANCIAL STATEMENTS
NOTE 14 – FAIR VALUE MEASUREMENTS (CONTINUED)
The following table presents the assets measured on a nonrecurring basis on the consolidated balance sheets at their fair value as of December 31, 2014 and December 31, 2013, by level within the fair value hierarchy. Impaired loans and other real estate that are collateral dependent are written down to fair value through the establishment of specific reserves. Techniques used to value the collateral securing the impaired loans include: quoted market prices for identical assets classified as Level I inputs; observable inputs, employed by certified appraisers, for similar assets classified as Level II inputs. In cases where valuation techniques included inputs that are unobservable and are based on estimates and assumptions developed by management based on the best information available under each circumstance, the asset valuation is classified as Level III inputs.
| (Dollars in thousands)
|
Level I
|
Level II
|
Level III
|
Total
|
||||||||||||||||
|
|
||||||||||||||||||||
| Assets measured on a nonrecurring basis: |
December 31, 2014 | |||||||||||||||||||
|
|
|
|||||||||||||||||||
| Impaired loans |
$ | – | $ | – | $ | 9,029 | $ | 9,029 | ||||||||||||
| Assets measured on a nonrecurring basis: |
December 31, 2013 | |||||||||||||||||||
|
|
|
|||||||||||||||||||
| Impaired loans |
$ | – | $ | – | $ | 9,856 | $ | 9,856 | ||||||||||||
The following table presents additional quantitative information about assets measured at fair value on a nonrecurring basis and for which the Company has utilized Level III inputs to determine fair value:
| Quantitative Information about Level III Fair Value Measurements | ||||||||||||||
| Fair Value | Valuation | Unobservable | Range | |||||||||||
| (Dollars in thousands)
|
Estimate
|
Techniques
|
Input
|
(Weighted Average)
| ||||||||||
|
| ||||||||||||||
| December 31, 2014 | ||||||||||||||
|
|
||||||||||||||
| Discounted | Remaining term | 2 mos to 28 yrs / (62 mos) | ||||||||||||
| Impaired loans |
$ | 6,539 | cash flow | Discount rate | 3.1% to 8.3% / (4.6%) | |||||||||
| Appraisal of | Appraisal adjustments2 | –20% to –25% (–24%) | ||||||||||||
| 2,490 | collateral1,3 | Liquidation expense2 | –10% | |||||||||||
| December 31, 2013 | ||||||||||||||
|
|
||||||||||||||
| Discounted | Remaining term | 3 mos to 29 yrs / (62 mos) | ||||||||||||
| Impaired loans |
$ | 8,663 | cash flow | Discount rate | 7.1% to 12% / (7.5%) | |||||||||
| Appraisal of | Appraisal adjustments2 | –20% to –25% (–24%) | ||||||||||||
| 1,193 | collateral1,3 | Liquidation expense2 | –10% | |||||||||||
1Fair value is generally determined through independent appraisals of the underlying collateral, which generally include various inputs which are not identifiable.
2Appraisals may be adjusted by management for qualitative factors such as estimated liquidation expenses. The range of liquidation expenses and other appraisal adjustments are presented as a percent of the appraisal.
3Includes qualitative adjustments by management and estimated liquidation expenses.
2014 Report to Shareholders | CSB Bancorp, Inc. 55
Table of Contents
NOTES TO CONSOLIDATED FINANCIAL STATEMENTS
NOTE 15 – FAIR VALUES OF FINANCIAL INSTRUMENTS
The estimated fair values of recognized financial instruments as of December 31 are as follows:
| 2014 | ||||||||||||||||||||
| (Dollars in thousands)
|
Carrying
|
Level I
|
Level II
|
Level III
|
Total Fair
|
|||||||||||||||
| Financial assets: |
||||||||||||||||||||
| Cash and cash equivalents |
$ | 43,923 | $ | 43,923 | $ | – | $ | – | $ | 43,923 | ||||||||||
| Securities available-for-sale |
100,108 | 1,128 | 98,980 | – | 100,108 | |||||||||||||||
| Securities held-to-maturity |
38,316 | – | 38,950 | – | 38,950 | |||||||||||||||
| Restricted stock |
4,614 | 4,614 | – | – | 4,614 | |||||||||||||||
| Loans held for sale |
75 | 75 | – | – | 75 | |||||||||||||||
| Net loans |
406,522 | – | – | 411,168 | 411,168 | |||||||||||||||
| Bank-owned life insurance |
9,815 | 9,815 | – | – | 9,815 | |||||||||||||||
| Accrued interest receivable |
1,329 | 1,329 | – | – | 1,329 | |||||||||||||||
| Mortgage servicing rights |
222 | – | – | 222 | 222 | |||||||||||||||
| Financial liabilities: |
||||||||||||||||||||
| Deposits |
$ | 500,075 | $ | 372,312 | $ | – | $ | 128,445 | $ | 500,757 | ||||||||||
| Short-term borrowings |
46,627 | 46,627 | – | – | 46,627 | |||||||||||||||
| Other borrowings |
14,953 | – | – | 15,348 | 15,348 | |||||||||||||||
| Accrued interest payable |
84 | 84 | – | – | 84 | |||||||||||||||
| 2013 | ||||||||||||||||||||
| (Dollars in thousands)
|
Carrying
|
Level I
|
Level II
|
Level III
|
Total Fair
|
|||||||||||||||
| Financial assets: |
||||||||||||||||||||
| Cash and cash equivalents |
$ | 42,599 | $ | 42,599 | $ | – | $ | – | $ | 42,599 | ||||||||||
| Securities available-for-sale |
101,722 | 1,125 | 100,597 | – | 101,722 | |||||||||||||||
| Securities held-to-maturity |
44,350 | – | 42,643 | – | 42,643 | |||||||||||||||
| Restricted stock |
5,463 | 5,463 | – | – | 5,463 | |||||||||||||||
| Net loans |
374,040 | – | – | 375,055 | 375,055 | |||||||||||||||
| Bank-owned life insurance |
9,551 | 9,551 | – | – | 9,551 | |||||||||||||||
| Accrued interest receivable |
1,374 | 1,374 | – | – | 1,374 | |||||||||||||||
| Mortgage servicing rights |
225 | – | – | 225 | 225 | |||||||||||||||
| Financial liabilities: |
||||||||||||||||||||
| Deposits |
$ | 480,933 | $ | 346,589 | $ | – | $ | 135,106 | $ | 481,695 | ||||||||||
| Short-term borrowings |
48,671 | 48,671 | – | – | 48,671 | |||||||||||||||
| Other borrowings |
12,459 | – | – | 12,559 | 12,559 | |||||||||||||||
| Accrued interest payable |
96 | 96 | – | – | 96 | |||||||||||||||
56 2014 Report to Shareholders | CSB Bancorp, Inc.
Table of Contents
NOTES TO CONSOLIDATED FINANCIAL STATEMENTS
NOTE 15 – FAIR VALUES OF FINANCIAL INSTRUMENTS (CONTINUED)
For purposes of the above disclosures of estimated fair value, the following assumptions are used:
Cash and cash equivalents; Loans held for sale; Accrued interest receivable; Mortgage servicing rights; Short-term borrowings, and Accrued interest payable
The fair value of the above instruments is considered to be carrying value.
Securities
The fair value of securities available-for-sale and securities held-to-maturity which are measured on a recurring basis are determined primarily by obtaining quoted prices on nationally recognized securities exchanges or matrix pricing, which is a mathematical technique used widely in the industry to value debt securities without relying exclusively on quoted prices for the specific securities but rather by relying on securities’ relationship to other similar securities. Classified as Level I or Level II in the fair value hierarchy.
Net loans
The fair value for loans is estimated by discounting future cash flows using current market inputs at which loans with similar terms and qualities would be made to borrowers of similar credit quality. Where quoted market prices were available, primarily for certain residential mortgage loans, such market rates were utilized as estimates for fair value. Fair value of nonaccrual loans is based on carrying value, classified as Level III.
Bank-owned life insurance
The carrying amount of bank-owned life insurance is based on the cash surrender value of the policies and is a reasonable estimate of fair value, classified as Level I.
Restricted stock
Restricted stock includes FHLB Stock and Federal Reserve Bank Stock. It is not practicable to determine the fair value of regulatory equity securities due to restrictions placed on their transferability. Fair value is based on carrying value, classified as Level II.
Deposits
The fair value of certificates of deposit is based on the discounted value of contractual cash flows. The discount rates are estimated using market rates currently offered for similar instruments with similar remaining maturities, resulting in a Level III classification. Demand, savings, and money market deposit accounts are valued at the amount payable on demand as of quarter end, resulting in a Level I classification.
Other borrowings
The fair value of FHLB advances are estimated using a discounted cash flow analysis based on the current borrowing rates for similar types of borrowings, resulting in a Level III classification.
The Company also has unrecognized financial instruments at December 31, 2014 and 2013. These financial instruments relate to commitments to extend credit and letters of credit. The aggregated contract amount of such financial instruments was approximately $128.2 million at December 31, 2014 and $120.3 million at December 31, 2013. Such amounts are also considered to be the estimated fair values.
The fair value estimates of financial instruments are made at a specific point in time based on relevant market information. These estimates do not reflect any premium or discount that could result from offering for sale at one time the entire holdings of a particular financial instrument over the value of anticipated future business and the value of assets and liabilities that are not considered financial instruments. Since no ready market exists for a significant portion of the financial instruments, fair value estimates are largely based on judgments after considering such factors as future expected credit losses, current economic conditions, risk characteristics of various financial instruments, and other factors. These estimates are subjective in nature and involve uncertainties and matters of significant judgment and therefore, cannot be determined with precision. Changes in assumptions could significantly affect these estimates.
2014 Report to Shareholders | CSB Bancorp, Inc. 57
Table of Contents
NOTES TO CONSOLIDATED FINANCIAL STATEMENTS
NOTE 16 – ACCUMULATED OTHER COMPREHENSIVE INCOME
The following table presents the changes in accumulated other comprehensive (loss) income by component net of tax for the years ended December 31, 2014 and 2013.
| (Dollars in thousands)
|
Pretax
|
Tax Effect
|
After-tax
|
Affected Line
| ||||||||||
|
| ||||||||||||||
| Balance as of December 31, 2013 |
$ (2,207) | $ 751 | $ (1,456) | |||||||||||
| Unrealized holding gain on available-for-sale |
1,612 | (549 | ) | 1,063 | ||||||||||
| Amount reclassified for net gains included |
(133 | ) | 45 | (88 | ) | (a) (b) | ||||||||
| Amortization of held-to-maturity discount |
301 | (102 | ) | 199 | ||||||||||
|
|
|
|
|
|
|
|||||||||
| Total other comprehensive loss |
1,780 | (606 | ) | 1,174 | ||||||||||
|
|
|
|
|
|
|
|||||||||
| BALANCE AS OF |
$ (427) | $ 145 | $ (282) | |||||||||||
|
|
|
|
|
|
|
|||||||||
| Balance as of December 31, 2012 |
$ 2,823 | $ (959) | $ 1,864 | |||||||||||
| Unrealized holding loss on available-for-sale |
(3,195 | ) | 1,086 | (2,109 | ) | |||||||||
| Amount reclassified for net gains included |
(159 | ) | 54 | (105 | ) | (a) (b) | ||||||||
| Unrealized loss on securities transferred from |
(1,931 | ) | 657 | (1,274 | ) | |||||||||
|
|
|
|
|
|
|
|||||||||
| Amortization of held-to-maturity discount |
255 | (87 | ) | 168 | ||||||||||
|
|
|
|
|
|
|
|||||||||
| Total other comprehensive loss |
(5,030 | ) | 1,710 | (3,320 | ) | |||||||||
|
|
|
|
|
|
|
|||||||||
| BALANCE AS OF |
$ (2,207) | $ 751 | $ (1,456) | |||||||||||
|
|
|
|
|
|
|
|||||||||
(a) Securities gain, net.
(b) Federal income tax provision.
58 2014 Report to Shareholders | CSB Bancorp, Inc.
Table of Contents
NOTES TO CONSOLIDATED FINANCIAL STATEMENTS
NOTE 17 – CONTINGENT LIABILITIES
In the normal course of business, the Company is subject to pending and threatened legal actions. Although, the Company is not able to predict the outcome of such actions, after reviewing pending and threatened actions, management believes that the outcome of any or all such actions will not have a material adverse effect on the results of operations or shareholders’ equity of the Company.
The Company has an employment agreement with an officer. Upon the occurrence of certain types of termination of employment, the Company may be required to make specified severance payments if termination occurs within a specified period of time, generally two years from the date of the agreement, or pursuant to certain change in control transactions.
NOTE 18 – QUARTERLY FINANCIAL DATA (UNAUDITED)
The following is a summary of selected quarterly financial data (unaudited) for the years ended December 31:
| (Dollars in thousands, except per share data)
|
Interest
|
Net Interest
|
Net
|
Basic
|
Diluted
|
|||||||||||||||
|
|
||||||||||||||||||||
| 2014 |
` | |||||||||||||||||||
| First quarter |
$ 5,336 | $ 4,898 | $ 1,416 | $ 0.52 | $ 0.52 | |||||||||||||||
| Second quarter |
5,484 | 5,045 | 1,522 | 0.55 | 0.55 | |||||||||||||||
| Third quarter |
5,435 | 4,997 | 1,507 | 0.55 | 0.55 | |||||||||||||||
| Fourth quarter |
5,401 | 4,987 | 1,439 | 0.53 | 0.53 | |||||||||||||||
| 2013 |
||||||||||||||||||||
| First quarter |
$ 5,300 | $ 4,692 | $ 1,362 | $ 0.50 | $ 0.50 | |||||||||||||||
| Second quarter |
5,173 | 4,592 | 1,247 | 0.45 | 0.45 | |||||||||||||||
| Third quarter |
5,235 | 4,677 | 1,407 | 0.51 | 0.51 | |||||||||||||||
| Fourth quarter |
5,430 | 4,922 | 1,224 | 0.45 | 0.45 | |||||||||||||||
2014 Report to Shareholders | CSB Bancorp, Inc. 59
Table of Contents
OFFICERS OF THE COMMERCIAL AND SAVINGS BANK
| STEVEN R. BAILEY | PAULA S. FOY | PAULA J. MEILER | EDDIE L. STEINER | |||
| Executive Vice President, | Vice President, | Senior Vice President, | Chairman, | |||
| Chief Operations Officer, | Compliance Officer/BSA Officer | Chief Financial Officer | President, | |||
| Chief Information Officer | Chief Executive Officer | |||||
| LORI S. FRANTZ | A. LEE MILLER | |||||
| PAMELA S. BASINGER | Assistant Vice President, | Vice President, | STEVEN J. STIFFLER | |||
| Vice President, | Banking Center Manager | Cash Management & Special | Vice President, | |||
| Financial Officer | Projects, CRA Officer | Commercial Banker | ||||
| BRETT A. GALLION | ||||||
| DEBORAH S. BERNER | Vice President, | EDWARD J. MILLER | ERIC D. STROUSE | |||
| Vice President, | Senior Information Officer | Vice President, | Vice President, | |||
| Retail Services Manager, | Operation Services Manager, | Commercial Banker | ||||
| Marketing & Public Relations | CARRIE A. GERBER | Security | ||||
| Credit Officer | ELAINE A. TEDROW | |||||
| PAMELA L. BROMUND | MOLLY M. MOHR | Assistant Vice President, | ||||
| Assistant Vice President, | ERIC S. GERBER | Assistant Vice President, | Banking Center Manager | |||
| Loan Operations Supervisor | Assistant Vice President, | Banking Center Manager | ||||
| Commercial Banker | JENNIFER M. THORPE | |||||
| WENDY D. BROWN | DANIEL L. MUSE | Assistant Vice President, | ||||
| Assistant Vice President, | KENDRA E. GUNDRUM | Operations Officer | Senior Credit Analyst | |||
| Bank Operations Manager | Officer, | |||||
| Banking Center Manager | TODD R. NICOLAS | WILLIAM R. TINLIN | ||||
| C. DAWN BUTLER | Vice President, | Vice President, | ||||
| Vice President, | MARC R. HARVEY | Commercial Banker | Recovery, Right to Financial | |||
| Regional Bank Manager | Assistant Vice President, | Privacy Officer | ||||
| Training Manager | SHAWN E. OSWALD | |||||
| BEVERLY A. CARR | Vice President, | BRIAN D. TROYER | ||||
| Operations Officer, | BENJAMIN J. HERSHBERGER | Information Technology | Vice President, | |||
| Bank Operations | Officer, | Director,OFAC Officer | Trust Officer | |||
| Banking Center Manager | ||||||
| COLBY CHAMBERLIN | AMY R. PATTERSON | ALICIA R. WALLACE | ||||
| Vice President, | JASON B. HUMMEL | Assistant Vice President, | Vice President, | |||
| Commercial Banker | Vice President, | Loan Officer | Commercial Banker | |||
| Commercial Banker | ||||||
| DALE J. CLINTON | MELANIE S. RABER | JANE C. WHITMER | ||||
| Vice President, | JULIE A. JONES | Officer, | Officer, | |||
| Internal Auditor | Vice President, | Commercial Loan | Assistant Banking Center | |||
| Director of Human Resources | Documentation Supervisor | Manager | ||||
| PEGGY L. CONN | ||||||
| Corporate Secretary | STEPHEN K. KILPATRICK | THOMAS S. RUMBAUGH | MICHAEL D. WORKMAN | |||
| First Vice President, | Vice President, | Vice President, | ||||
| MARIANNE DAVIS | Senior Credit Officer | Trust Officer | Mortgage Loan Officer, | |||
| Assistant Vice President, | Small Business Lender | |||||
| Banking Center Manager | KEVIN J. MCALLISTER | LISA M. SCHONAUER | ||||
| Vice President, | Assistant Vice President, | ANTHONY YODER | ||||
| CHRISTOPHER J. DELATORE | Trust Officer | Banking Center Manager | Officer, | |||
| Vice President, | Banking Center Manager | |||||
| Commercial Banker | ROBYN E. MCCLINTOCK | REBECCA J. SHULTZ | ||||
| Vice President, | Assistant Vice President, | CRYSTAL R. YODER | ||||
| DAVID J. DOLAN | Regional Bank Manager | Loan Officer | Operations Officer | |||
| Vice President, | ||||||
| Retail Lending Manager | JASON R. MCCULLOCH | BUD STEBBINS | ||||
| Vice President, | First Vice President, | |||||
| CYNTHIA A. FERRY | Brokerage Manager | Senior Loan Officer | ||||
| Assistant Vice President, | ||||||
| Banking Center Manager | SHERRY A. MCROBIE | |||||
| Assistant Vice President, | ||||||
| Banking Center Manager |
60 2014 Report to Shareholders | CSB Bancorp, Inc.
Table of Contents
SHAREHOLDERS AND GENERAL INQUIRIES
Stock Listing Common Symbol: CSBB
CORPORATE OFFICE
| 91 North Clay Street, Millersburg, Ohio |
330-674-9015 or 800-654-9015 |
|
|
honoring “DOC”DAN MILLER 36 YEARS OF DEDICATED SERVICE
Dr. Daniel J. Miller will retire from the Board of Directors of CSB Bancorp, Inc., effective at our April 22, 2015 shareholders’ meeting. “Doc” as he is commonly known, joined our Board in 1979 and has been instrumental in the continued growth and success of our Company.
When Doc joined the Board, the assets of the Bank stood at $40 million and we had a total of four Banking Centers, two in Millersburg, one in Walnut Creek and one in Winesburg. As Doc retires, CSB now stands at $620 million in assets, 16 Banking Centers in four counties, an Operations Center and Trust and Financial Services offices located in Millersburg and Wooster.
We graciously thank Doc for his dedication and years of service to our Company. We wish him the very best as he and his wife Mary continue on their journey. |

2014 Report to Shareholders | CSB Bancorp, Inc. 61
Table of Contents


| THE COMMERCIAL & SAVINGS BANK | ||
| INFORMATION & CUSTOMER SERVICE |
330-674-9015 or 1-800-654-9015 | |
| 24 HOUR PHONE BANKING |
330-674-2720 or 1-888-438-2720 | |
| 24 HOUR ONLINE BANKING, BILLPAY & MOBILE |
www.csb1.com | |
| LOAN SERVICES 91 North Clay Street, Millersburg |
330-674-9015 or 1-800-654-9015 | |
| OPERATIONS CENTER 91 North Clay Street, Millersburg |
330-674-9015 | |
| INVESTMENT SERVICES 91 South Clay Street, Millersburg |
330-674-2397 | |
| TRUST SERVICES 91 North Clay Street, Millersburg |
Holmes, Stark & Tuscarawas Counties 330-674-2397 | |
| TRUST SERVICES 305 West Liberty Street, Wooster |
Wayne County 330-263-1955 | |
| CSB BANKING CENTERS |
||
| HOLMES REGION |
||
| BERLIN BANKING CENTER 4587 S.R. 39, Berlin (Drive-Up ATM) |
330-893-3565 | |
| CHARM BANKING CENTER 4440 C.R. 70, Charm (Walk-Up ATM) |
330-893-3323 | |
| MILLERSBURG CLINTON COMMONS BANKING CENTER 2102 Glen Drive, Millersburg (Drive-Up ATM) |
330-674-2265 | |
| MILLERSBURG SOUTH CLAY BANKING CENTER 91 South Clay Street, Millersburg (Drive-Up ATM) |
330-674-0687 | |
| WALNUT CREEK BANKING CENTER 4980 Olde Pump Street, Walnut Creek (Walk-Up ATM) |
330-893-2961 | |
| WINESBURG BANKING CENTER 2225 U.S. 62, Winesburg (Drive-Up ATM) |
330-359-5543 | |
| TUSCARAWAS & STARK REGION |
||
| GNADENHUTTEN BANKING CENTER 100 South Walnut Street, Gnadenhutten (Drive-Up ATM) |
740-254-4313 | |
| NEW PHILADELPHIA BANKING CENTER 635 West High Avenue, New Philadelphia (Drive-Up ATM) |
330-308-4867 | |
| NORTH CANTON BANKING CENTER 1210 North Main Street, North Canton (Drive-Up ATM) |
330-497-0839 | |
| SUGARCREEK BANKING CENTER 127 South Broadway, Sugarcreek (Drive-Up ATM) |
330-852-4444 | |
| WAYNE REGION |
||
| ORRVILLE AREA BANKING CENTER 461 Wadsworth Road, Orrville (Drive-Up ATM) |
330-682-8000 | |
| ORRVILLE HIGH STREET BANKING CENTER 330 West High Street, Orrville (Drive-Up ATM) |
330-682-8001 | |
| SHREVE BANKING CENTER 333 West South Street, Shreve (Drive-Up ATM) |
330-567-2226 | |
| WOOSTER DOWNTOWN BANKING CENTER 305 West Liberty Street, Wooster (Drive-Up ATM) |
330-263-1955 | |
| WOOSTER MILLTOWN BANKING CENTER 3562 Commerce Parkway, Wooster (Drive-Up ATM) |
330-345-2031 | |
62 2014 Report to Shareholders | CSB Bancorp, Inc.
Table of Contents

Table of Contents