Attached files
| file | filename |
|---|---|
| EX-1.1 - EX-1.1 - Axalta Coating Systems Ltd. | d889853dex11.htm |
| EX-5.1 - EX-5.1 - Axalta Coating Systems Ltd. | d889853dex51.htm |
| EX-23.2 - EX-23.2 - Axalta Coating Systems Ltd. | d889853dex232.htm |
Table of Contents
As filed with the Securities and Exchange Commission on March 23, 2015
Registration No. 333-202812
UNITED STATES
SECURITIES AND EXCHANGE COMMISSION
Washington, D.C. 20549
AMENDMENT NO. 1
TO
FORM S-1
REGISTRATION STATEMENT
UNDER
THE SECURITIES ACT OF 1933
AXALTA COATING SYSTEMS LTD.
(Exact name of registrant as specified in its charter)
| Bermuda | 2851 | 98-1073028 | ||
| (State or other jurisdiction of incorporation or organization) |
(Primary Standard Industrial Classification Code Number) |
(I.R.S. Employer Identification No.) |
Two Commerce Square
2001 Market Street
Suite 3600
Philadelphia, Pennsylvania 19103
(855) 547-1461
(Address, including zip code, and telephone number, including area code, of the registrant’s principal executive offices)
Michael F. Finn
Senior Vice President, General Counsel and Corporate Secretary
Axalta Coating Systems Ltd.
Two Commerce Square
2001 Market Street
Suite 3600
Philadelphia, Pennsylvania 19103
(855) 547-1461
(Name, address, including zip code, and telephone number, including area code, of agent for service)
Copies to:
| Patrick H. Shannon Jason M. Licht Latham & Watkins LLP 555 Eleventh Street, NW Washington, D.C. 20004 (202) 637-2200 |
Craig F. Arcella Cravath, Swaine & Moore LLP 825 Eighth Avenue New York, NY 10019 (212) 474-1000 |
Approximate date of commencement of proposed sale to the public: As soon as practicable after the effective date of this registration statement.
If any of the securities being registered on this form are to be offered on a delayed or continuous basis pursuant to Rule 415 under the Securities Act of 1933, check the following box. ¨
If this form is filed to register additional securities for an offering pursuant to Rule 462(b) under the Securities Act, check the following box and list the Securities Act registration statement number of the earlier effective registration statement for the same offering. ¨
If this form is a post-effective amendment filed pursuant to Rule 462(c) under the Securities Act, check the following box and list the Securities Act registration statement number of the earlier effective registration statement for the same offering. ¨
If this form is a post-effective amendment filed pursuant to Rule 462(d) under the Securities Act, check the following box and list the Securities Act registration statement number of the earlier effective registration statement for the same offering. ¨
Indicate by check mark whether the registrant is a large accelerated filer, an accelerated filer, a non-accelerated filer, or a smaller reporting company. See definitions of “large accelerated filer,” “accelerated filer,” and “smaller reporting company” in Rule 12b-2 of the Exchange Act. (Check one):
| ¨ Large accelerated filer | ¨ Accelerated filer | x Non-accelerated filer | ¨ Smaller reporting company |
The registrant hereby amends this registration statement on such date or dates as may be necessary to delay its effective date until the registrant shall file a further amendment that specifically states that this registration statement shall thereafter become effective in accordance with Section 8(a) of the Securities Act of 1933 or until this registration statement shall become effective on such date as the Commission, acting pursuant to said Section 8(a), may determine.
Table of Contents
The information in this preliminary prospectus is not complete and may be changed. The selling shareholders may not sell these securities until the registration statement filed with the Securities and Exchange Commission is effective. This preliminary prospectus is not an offer to sell these securities and it is not soliciting an offer to buy these securities in any state where the offer or sale is not permitted.
Subject to Completion
Preliminary Prospectus dated March 23, 2015
PROSPECTUS
35,000,000 Shares

Axalta Coating Systems Ltd.
Common Shares
The selling shareholders named in this prospectus, including affiliates of The Carlyle Group (“Carlyle”), are selling 35,000,000 common shares in this offering. We will not receive any proceeds from the sale of our common shares by the selling shareholders, including from any exercise by the underwriters of their option to purchase additional common shares described below.
Our common shares are listed on the New York Stock Exchange (the “NYSE”) under the symbol “AXTA”. On March 20, 2015, the closing sale price of our common shares as reported on the NYSE was $28.14 per share.
Investing in the common shares involves risks that are described in the “Risk Factors” section beginning on page 20 of this prospectus.
| Per Share | Total | |||||||
| Public offering price |
$ | $ | ||||||
| Underwriting discount(1) |
$ | $ | ||||||
| Proceeds, before expenses, to the selling shareholders |
$ | $ | ||||||
| (1) | We have agreed to reimburse the underwriters for certain expenses in connection with this offering. |
The underwriters may also purchase up to an additional 5,250,000 common shares from the selling shareholders, at the public offering price, less the underwriting discount, within 30 days from the date of this prospectus.
Neither the Securities and Exchange Commission nor any state securities commission has approved or disapproved of these securities or determined if this prospectus is truthful or complete. Any representation to the contrary is a criminal offense.
The common shares will be ready for delivery on or about , 2015.
| Citigroup | Goldman, Sachs & Co. | Deutsche Bank Securities | J.P. Morgan | |||||||
| BofA Merrill Lynch | Barclays | Jefferies | ||
| Morgan Stanley | UBS Investment Bank | BB&T Capital Markets | Nomura | SMBC Nikko | ||||
The date of this prospectus is , 2015.
Table of Contents

Table of Contents
| Page | ||||
| 1 | ||||
| 20 | ||||
| 41 | ||||
| 43 | ||||
| 44 | ||||
| 45 | ||||
| 46 | ||||
| 48 | ||||
| Unaudited Pro Forma Consolidated and Combined Financial Information |
51 | |||
| Management’s Discussion and Analysis of Financial Condition and Results of Operations |
57 | |||
| 101 | ||||
| 103 | ||||
| 122 | ||||
| 129 | ||||
| 146 | ||||
| 149 | ||||
| 151 | ||||
| 158 | ||||
| 160 | ||||
| 166 | ||||
| 170 | ||||
| 177 | ||||
| 177 | ||||
| 177 | ||||
| 178 | ||||
| F-1 | ||||
We are responsible only for the information contained in this prospectus and in any related free-writing prospectus we prepare or authorize. We and the selling shareholders have not, and the underwriters have not, authorized anyone to give you any other information and take no responsibility for any other information that others may give you. The selling shareholders are offering to sell, and seeking offers to buy, the common shares only in jurisdictions where offers and sales are permitted.
Consent under the Exchange Control Act 1972 (and its related regulations) has been obtained from the Bermuda Monetary Authority for the issue and transfer of the common shares to and between residents and non-residents of Bermuda for exchange control purposes provided our common shares remain listed on an appointed stock exchange, which includes the NYSE. In granting such consent, neither the Bermuda Monetary Authority nor the Registrar of Companies in Bermuda accepts any responsibility for our financial soundness or the correctness of any of the statements made or opinions expressed in this prospectus.
i
Table of Contents
MARKET, INDUSTRY AND OTHER DATA
This prospectus includes estimates regarding market and industry data and forecasts, which are based on publicly available information, industry publications and surveys, reports from government agencies, reports by market research firms or other independent sources such as Orr & Boss, Inc. (“Orr & Boss”) and LMC Automotive (“LMC Automotive”), and our own estimates based on our management’s knowledge of and experience in the market sectors in which we compete. Although we believe them to be accurate, we have not independently verified market and industry data from third-party sources. This information cannot always be verified with complete certainty due to the limits on the availability and reliability of raw data, the voluntary nature of the data gathering process, and other limitations and uncertainties inherent in industry research and surveys of market size.
References to market share are based on sales generated in the relevant market. Except as otherwise noted, market position data is derived from Orr & Boss and/or management estimates.
References to EMEA refer to Europe, the Middle East and Africa. References to Latin America include Mexico and references to North America exclude Mexico.
References to emerging markets refer collectively to Latin America (including Mexico) and Asia (excluding Japan).
Certain monetary amounts, percentages and other figures included in this prospectus have been subject to rounding adjustments. Accordingly, figures shown as totals in certain tables or charts may not be the arithmetic aggregation of the figures that precede them, and figures expressed as percentages in the text may not total 100% or, as applicable, when aggregated may not be the arithmetic aggregation of the percentages that precede them.
TRADEMARKS
We own or otherwise have rights to the trademarks, service marks, copyrights and trade names, including those mentioned in this prospectus, used in conjunction with the marketing and sale of our products and services. This prospectus includes trademarks, such as Alesta®, Abcite®, AquaEC™, Centari®, Chemophan™, Corlar®, Cromax®, Cromax Mosaic™, Imron Elite™, Imron ExcelPro™, Lutophen™, Nap-Gard®, Nason®, Rival™, Spies Hecker®, Stollaquid™, Syntopal™, Voltatex®, Eco-Concept, 3-Wet™ and 2-Wet Monocoat™, which are protected under applicable intellectual property laws and are our property and the property of our subsidiaries. This prospectus also contains trademarks, service marks, copyrights and trade names of other companies, which are the property of their respective owners. We do not intend our use or display of other companies’ trademarks, service marks, copyrights or trade names to imply a relationship with, or endorsement or sponsorship of us by, any other companies. Solely for convenience, our trademarks, service marks and trade names referred to in this prospectus may appear without the ® or ™ symbols, but such references are not intended to indicate, in any way, that we will not assert, to the fullest extent under applicable law, our rights or the right of the applicable licensor to these trademarks and trade names.
OUR INITIAL PUBLIC OFFERING
In November 2014, Carlyle sold 57,500,000 of our common shares at a price of $19.50 per share in our initial public offering (our “IPO”). Upon the completion of the IPO, our common shares were listed on the NYSE under the symbol “AXTA”.
ii
Table of Contents
This summary highlights information contained elsewhere in this prospectus. Because this is only a summary, it does not contain all of the information that may be important to you. You should read this entire prospectus and should consider, among other things, the matters set forth under “Risk Factors,” “Selected Historical Financial Information” and “Management’s Discussion and Analysis of Financial Condition and Results of Operations,” and our financial statements and related notes thereto appearing elsewhere in this prospectus before making your investment decision. On February 1, 2013, Axalta Coating Systems Ltd. (“ACS”) acquired from E. I. du Pont de Nemours and Company (“DuPont”) all of the capital stock, other equity interests and assets of certain entities that, together with their subsidiaries, comprised the DuPont Performance Coatings business (“DPC”), which is referred to herein as the “Acquisition.” Following the Acquisition, we renamed our business Axalta Coating Systems (“Axalta”). References herein to the “Company,” “we,” “us,” “our” and “our company” refer to ACS and its consolidated subsidiaries. References herein to “fiscal year” refer to our fiscal years, which end on December 31. References herein to the financial measures “EBITDA” and “Adjusted EBITDA” refer to financial measures that do not comply with generally accepted accounting principles in the United States (“U.S. GAAP”). For information about how we calculate EBITDA and Adjusted EBITDA, see footnote 4 to the table under the heading “—Summary Historical and Pro Forma Financial Information.”
Our Company
We are a leading global manufacturer, marketer and distributor of high performance coatings systems. We generate approximately 90% of our revenue in markets where we hold the #1 or #2 global market position, including the #1 position in our core automotive refinish end-market with approximately a 25% global market share. We have a nearly 150-year heritage in the coatings industry and are known for manufacturing high-quality products with well-recognized brands supported by market-leading technology and customer service. Over the course of our history we have remained at the forefront of our industry by continually developing innovative coatings technologies designed to enhance the performance and appearance of our customers’ products, while improving their productivity and profitability.
Our diverse global footprint of 35 manufacturing facilities, 7 technology centers, 45 customer training centers and approximately 12,600 employees allows us to meet the needs of customers in over 130 countries. We serve our customer base through an extensive sales force and technical support organization, as well as through over 4,000 independent, locally-based distributors. Our scale and strong local presence are critical to our success, allowing us to leverage our technology portfolio and customer relationships globally while meeting customer demands locally.
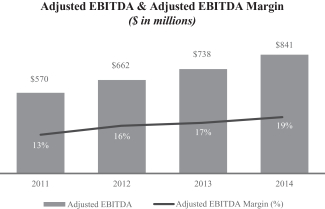
For the year ended December 31, 2014, our net sales were $4,362 million, Adjusted EBITDA was $841 million, or 19.3% of net sales, and net income was $35 million. We have renewed the organization’s focus on profitable growth, achieving year-over-year Adjusted EBITDA growth for each of the seven full quarters following the Acquisition. Additionally, we have undertaken several transformational initiatives that we believe have laid the foundation for future growth, resulting in significant new business wins, many of which we expect to contribute to sales beginning in 2015. We have also begun implementing several EBITDA enhancement initiatives that we believe will drive meaningful earnings growth over the next several years. As of December 31, 2014, we had cash and cash equivalents of $382 million and outstanding indebtedness of $3,696 million, which may limit the availability of financial resources to pursue our growth initiatives.
1
Table of Contents
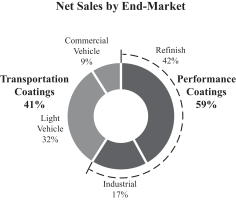
Our business is organized into two segments, Performance Coatings and Transportation Coatings, serving four end-markets globally as highlighted below:
|
|
Performance Coatings
Through our Performance Coatings segment, we provide high-quality liquid and powder coatings solutions to a fragmented and local customer base. We are one of only a few suppliers with the technology to provide precise color matching and highly durable coatings systems. The end-markets within this segment are refinish and industrial as described below.
Refinish End-Market (#1 global market position): We provide waterborne and solventborne coatings to approximately 80,000 independent body shops, dealers and multi-shop operators (“MSOs”) to facilitate high-quality, efficient automotive collision repairs. Our advanced color matching technology and library of over four million color variations comprise an advanced color system that enables body shops to refinish vehicles regardless of vehicle brand, color, age, or original paint supplier.
Industrial End-Market: We provide a wide range of liquid and powder coatings to customers who use them in diverse applications, including industrial machinery, electrical insulation, automotive components, architectural cladding and fittings, appliances, outdoor furniture and oil & gas pipelines. Our coatings are often used under severe operating conditions and require high performance such as high mechanical resistance, corrosion protection, elasticity and colorfastness.
Transportation Coatings
Through our Transportation Coatings segment, we provide advanced coatings technologies to original equipment manufacturers (“OEMs”) of light and commercial vehicles. These increasingly global customers require a high level of technical support coupled with cost-effective, environmentally responsible coatings systems that can be applied with a high degree of precision, consistency and speed.
Light Vehicle End-Market (#2 global market position): We provide light vehicle OEMs and Tier 1 component suppliers a full range of waterborne and solventborne coatings systems that are a critical, integrated step in the vehicle assembly process. We compete and win new business on the basis of our quality, service and proprietary products that generate significant energy and cost savings for our customers while enhancing productivity and
2
Table of Contents
first pass quality. Our global capabilities and focus on technology enable us to provide our global customers with next-generation offerings to enhance appearance, durability and corrosion protection and comply with increasingly strict environmental regulations.
Commercial Vehicle End-Market: We provide liquid coatings to commercial vehicle OEMs, including those in the heavy duty truck (“HDT”), bus, rail and agricultural and construction equipment (“ACE”) markets, as well as related markets such as trailers, recreational vehicles and personal sport vehicles. As the #1 global supplier in both the HDT and bus markets, we meet the demands of our customers with an extensive offering of over 70,000 colors.
Transformational Initiatives
Since the Acquisition, we have migrated from a business segment of DuPont to an independent global company exclusively focused on coatings. We have completed the separation from DuPont and implemented several initiatives designed to unlock our business’s full potential, including:
| • | Enhanced Senior Leadership Team: We have augmented our management team with world-class talent and significant end-market expertise, with 13 of our 17 most senior managers joining since the Acquisition, including our CEO and CFO. We have also recruited key regional and local managers with both operational and commercial leadership experience. |
| • | Implemented New Customer Strategies: We have realigned our resources to more effectively meet the varying demands of our customers. In end-markets characterized by large global customers such as light and commercial vehicle OEMs, we transitioned from a regional to a global management and sales model. In the refinish end-market, we have reorganized our sales force to target and meet the needs of additional customers in high-growth areas of the market. |
| • | Aligned Incentives: We have implemented a performance-based compensation structure that closely aligns the interests of our global leadership team with those of our shareholders. We have also transitioned to a more incentive-based compensation structure for our global sales force designed to increase their focus on profitable growth. |
| • | Investing for Growth: As an independent company, we are able to focus our time and capital exclusively on coatings. As a result, we are pursuing investments with attractive returns such as low-risk capacity expansion projects in China, Germany, Mexico and Brazil that will position us to grow with our customers. We are also investing in operational improvement initiatives such as the realignment of our European manufacturing operations, a global commercial and comprehensive cost improvement initiative, as well as growing our sales force in emerging markets and end-markets where we are currently underrepresented. |
Our Industry
In 2013, we were the fourth largest supplier in the $127 billion global coatings industry as measured by sales, according to Orr & Boss. The global coatings industry is characterized by multiple end-markets and applications. Market participants include a few global coatings suppliers and many smaller, regionally focused suppliers that maintain a presence in select product categories and local markets.
3
Table of Contents
Within the broad global coatings market, we focus on the automotive refinish, light vehicle, commercial vehicle and industrial end-markets, which Orr & Boss estimates to collectively represent $37 billion of annual sales. The chart below illustrates the composition of the global coatings industry by application and indicates the end-markets in which we participate:
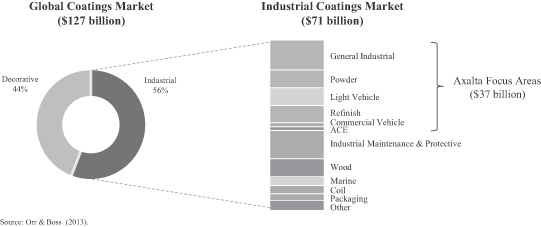
We operate in attractive end-markets, with the top four suppliers collectively holding an estimated 67% market share in the automotive refinish end-market and 74% market share in the light vehicle end-market. This structure is a result of few suppliers having the technological capabilities, global manufacturing footprint, efficient supply chain and overall scale to meet customer needs. These characteristics allow global coatings providers to serve customers locally while continuing to leverage global innovation, product platforms, relationships and best practices.
The refinish, industrial, light vehicle and commercial vehicle end-markets are collectively expected to grow at a compound annual growth rate (“CAGR”) of 5.8%, or $12.2 billion, from 2013 to 2018, according to Orr & Boss. This growth is due to specific end-market drivers as well as key industry trends, which favor large multi-national suppliers, including:
| • | Increasingly stringent environmental regulations: Evolving regulations in all major geographies have placed limits on the emission of volatile organic compounds (“VOCs”) and hazardous air pollutants (“HAPs”). As a result, customers are shifting toward regulation-compliant, low-VOC solventborne and waterborne coatings. Few coatings suppliers have the technology and products to meet these increasingly stringent requirements. |
| • | Global procurement model: Multi-national light vehicle OEMs are increasingly utilizing global procurement teams to stipulate product specifications and color standardization requirements, which are implemented at the local level. These customers select coatings providers on the basis of their ability to consistently deliver advanced technological solutions on a global basis. |
| • | Increased efficiency: Customers are encouraging coatings manufacturers to invest in new product offerings that require fewer application steps, resulting in lower capital and energy costs. |
| • | Vehicle light-weighting: With more stringent vehicle emissions and fuel consumption regulations, light vehicle OEMs are focused on reducing vehicle weight to improve fuel economy. This is driving the need for new, and frequently multiple, substrates on the exterior of the vehicle. Historically, OEMs have manufactured vehicles primarily with steel components but are now increasingly incorporating other materials, including aluminum, carbon fiber and plastics. These materials often require specialized primers and low-temperature curing formulations to achieve uniform appearance, color and finish. |
4
Table of Contents
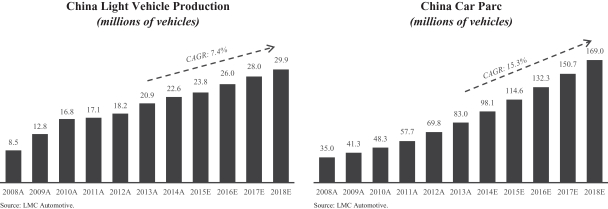
| • | Emerging market growth: Emerging market demand in our end-markets is expected to grow at a CAGR of approximately 8.4% from 2013 to 2018, according to Orr & Boss. This is primarily due to increased government infrastructure spending and increased middle class consumption, which will increase the car parc (the number of vehicles in use). As per-capita wealth expands, consumers are also demanding higher-quality products, driving demand for more advanced coatings systems in these markets. |
Performance Coatings
Refinish
The refinish end-market represented an estimated $7.3 billion in 2013 global sales, according to Orr & Boss. Sales in this end-market are driven by the number of vehicle collisions and owners’ propensity to repair their vehicles. The number of vehicle collisions in a given market is primarily determined by the size of the car parc and the aggregate number of miles driven in that market. The global automotive refinish end-market is expected to grow at a CAGR of approximately 4.3% from 2013 to 2018, with emerging markets expected to grow at a CAGR of approximately 7.7% over the same period, according to Orr & Boss.
Refinish products are critical to vehicle appearance and customer satisfaction but typically represent a small percentage of the overall cost of repair. As a result, body repair shop operators are most focused on coatings brands with a strong track record of performance and reliability. Such brands offer exact color matching technologies, productivity enhancements, regulatory compliance, consistent quality and ongoing technical support in order to facilitate timely repairs that restore a damaged vehicle’s appearance to its original condition.
Industrial
The industrial end-market represented an estimated $19.7 billion in 2013 global sales and is forecasted to grow at a CAGR of approximately 6.8% from 2013 to 2018, according to Orr & Boss. This end-market is comprised of liquid and powder coatings with demand driven by a wide variety of macroeconomic factors, such as growth in GDP and industrial production. Customers select industrial coatings based on protection, durability and appearance.
Transportation Coatings
Light Vehicle
The light vehicle end-market represented an estimated $7.3 billion in 2013 global sales and is expected to grow at a CAGR of approximately 4.9% from 2013 to 2018, according to Orr & Boss. Sales in this end-market are driven by new vehicle production, which is expected to grow in both the developed markets and the emerging markets. Light vehicle production growth is expected to be highest in emerging markets where OEMs plan to open 68 new assembly plants between 2014 and 2017.
Light vehicle OEMs select coatings providers on the basis of their global ability to deliver advanced technological solutions that improve exterior appearance and durability and provide long-term corrosion protection. Customers also look for suppliers that can enhance process efficiency to reduce overall manufacturing costs and provide on-site technical support. Rigorous environmental and durability testing as well as engineering approvals are also key criteria used by global light vehicle OEMs when selecting coatings providers.
Commercial Vehicle
The commercial vehicle end-market represented an estimated $3.3 billion in 2013 global sales and is expected to grow at a CAGR of approximately 4.8% from 2013 to 2018, according to Orr & Boss. Sales in this end-market
5
Table of Contents
are generated from a variety of applications including non-automotive transportation (e.g., HDT, bus and rail) and ACE as well as related markets such as trailers, recreational vehicles and personal sport vehicles. This end-market is primarily driven by global commercial vehicle production, which is influenced by overall economic activity, government infrastructure spending, equipment replacement cycles and evolving environmental standards.
Commercial vehicle OEMs select coatings providers on the basis of their ability to consistently deliver advanced technological solutions that improve exterior appearance, protection and durability and provide extensive color libraries and matching capabilities at the lowest total cost-in-use, while meeting stringent environmental requirements.
Our Competitive Strengths
Leading positions in attractive end-markets
We are a global leader in manufacturing, marketing and distributing advanced coatings systems with approximately 90% of our revenue generated in markets where we hold the #1 or #2 global market position. We are one of only a small number of global coatings suppliers in each of our end-markets, which positions us favorably in an industry where global scale is a competitive advantage.
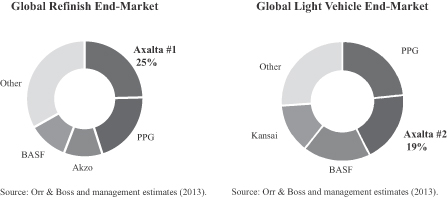
Market-leading refinish business driven by recurring aftermarket sales: We are the leading coatings supplier to the global automotive refinish end-market where we hold an estimated 25% share and the top four global suppliers hold an estimated 67% share. This end-market has consistently grown across economic cycles as the overall rate of collisions and repairs are not highly cyclical. Our refinish products offer quality, durability and superior color technology supported by a large color formula library that enables customers to precisely match colors. We supply our fragmented customer base of approximately 80,000 body shops through a global network of over 4,000 independent local distributors. Furthermore, body shops utilize our color matching system, inventory replacement process and training capabilities, which foster brand loyalty and have historically resulted in a high customer retention rate.
Well positioned in light vehicle end-market poised for growth: We are the second largest coatings provider to the global light vehicle end-market, which is expected to grow at a CAGR of approximately 4.9% from 2013 to 2018, according to Orr & Boss. In this end-market, the top four suppliers hold an estimated 74% share. We have developed a full complement of unique consolidated coating systems. These integrated solutions include our “Eco-Concept,” “3-Wet” and “2-Wet Monocoat” products that provide our customers with advanced, environmentally responsible systems that eliminate either a coatings layer or steps in the coatings process, thereby increasing productivity and reducing energy costs. In addition, we offer our customers on-site technical
6
Table of Contents
services as well as “just-in-time” product delivery. We are an integrated part of our customers’ assembly lines, which allows our technical support teams to improve operating efficiency and provide real-time performance feedback to our formulating chemists and manufacturing teams. We have been awarded new business in over 30 OEM plants globally since the beginning of 2013, demonstrating the strength of our competitive positioning. We expect to recognize sales from the majority of these new contracts in 2015, although we cannot provide any assurance regarding the amount of revenue or profit our new business awards will generate in the future.
Sustainable competitive advantages driven by global scale, established brands and technology
We believe we are one of only a few coatings providers that have the scale, manufacturing capabilities, brand reputation and technology to meet the purchasing criteria that are most critical to our customers on a global basis.
Our extensive manufacturing and distribution networks as well as our high-caliber technical capabilities enable us to meet customers’ volume and service requirements without interruption. Our global footprint also enables us to react quickly to changing local dynamics while leveraging our overall scale to cost-effectively develop and deliver leading edge technologies and solutions. In refinish, our scale gives us the ability to convert a large number of body shops to our systems in a short period of time, which has been a key competitive advantage in the growing North American MSO segment. Additionally, our scale and technical abilities enable us to meet the needs of our multi-national light vehicle customers, who increasingly require dedicated global account teams and high-quality, advanced coatings systems that can be applied consistently to global vehicle platforms.
Branding is another key factor that customers consider when choosing a coatings provider. Customers typically look to established brands when making their purchase decisions in our refinish, industrial and commercial vehicle end-markets. We have an extensive portfolio of established brands that leverage our advanced technology and a nearly 150-year heritage including our flagship global brand families of Cromax, Standox, Spies Hecker and Imron liquid products, our Alesta and Nap-Gard powder products and our Voltatex electrical insulation coatings.
Our technology is also a key competitive advantage. Our technology portfolio includes over 1,700 patents issued or pending and includes key assets such as our extensive color database and color matching technology, advanced multi-substrate formulations, process technology and VOC-compliant products. We also benefit from technology synergies across our end-markets. The colors, coatings properties and multi-substrate formulations we develop as a light vehicle coatings manufacturer help us sustain our leading refinish market position as we leverage insights from new light vehicle coatings to help develop innovative refinish coatings in the future.
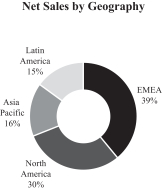
Diverse revenue base
We generate our revenue from diverse end-markets, customers and geographies, which has historically reduced the financial impact of any single end-market, customer or region and limited the impact of economic cycles. Net sales in our end-markets of refinish, light vehicle, industrial and commercial vehicle represented 42%, 32%, 17% and 9% of net sales during the year ended December 31, 2014, respectively. We also serve a globally diverse and highly fragmented customer base, with no single customer representing more than 7.7% of our net sales and our top ten customers representing approximately 32% of our net sales during the year ended December 31, 2014. The percentage of our net sales generated by our top customers, however, may increase as we grow our sales to the light vehicle end-market. Additionally, we generated approximately 39% of our net sales in EMEA, 30% in North America, 16% in Asia Pacific and 15% in Latin America during the year ended December 31, 2014.
Strong financial performance and cash flow characteristics
We have an attractive financial profile with gross margins of 34.3% and Adjusted EBITDA margins of 19.3% for the year ended December 31, 2014.
7
Table of Contents
The refinish end-market serves as the foundation of our financial profile, representing 42% of our consolidated net sales for the year ended December 31, 2014. Our track record of consistent price increases driving strong Adjusted EBITDA performance and low levels of maintenance capital expenditures has allowed us to consistently generate strong cash flows that we are re-investing in the business to position us for future earnings growth.
We have generated year-over-year Adjusted EBITDA growth for each of the seven full quarters since the Acquisition, driven in part by the initial impact of our transformational growth initiatives. In addition, we have implemented numerous initiatives intended to reduce our fixed and variable costs and improve working capital productivity. We believe that these initiatives will continue to generate significant cost savings in the future, although we cannot provide any assurance regarding the amount of cost savings these initiatives will generate. Many are in their early stages of implementation and have only recently begun to contribute to our financial results.
Experienced management team
We have augmented our management team with world-class talent and meaningful end-market expertise, with 13 of our 17 most senior managers joining since the Acquisition. This team has added new and diverse perspectives to the business from a range of industries. Our management team is led by our CEO, Charlie Shaver, who has over 34 years of chemical and global operating experience, including most recently President and CEO of TPC Group. He is supported by a senior management team comprised of global, regional and country focused leaders with diverse backgrounds and skill sets. The management team has extensive international experience with a strong track record of improving operations and executing strategic growth initiatives, including mergers and acquisitions.
Our Business Strategy
Pursue and execute new business wins in high-growth areas of our end-markets
We have aligned our resources to better serve the high-growth areas of our refinish and light vehicle end-markets. In the North American refinish end-market, we have created dedicated sales, conversion and service teams to serve MSOs, which are gaining share in the North American collision repair market by reducing insurance company costs and providing consistently high customer satisfaction. Through new business wins with MSO customers, we have become a leading coatings provider to the North American MSO market, which we expect to grow from 14% of the North American collision repair market in 2012 to 24% by 2017. We are
8
Table of Contents
targeting growth opportunities with both existing MSO and new MSO accounts and believe that we are well positioned to gain additional market share as a result of our dedicated account teams, high productivity offerings and broad distribution network.
We have been awarded new business in over 30 OEM plants globally since the beginning of 2013, with 16 of these plants located in China, where OEMs are rapidly expanding production to meet increasing demand for new vehicles. We expect that many of these new contracts will begin generating sales in 2015. Our success in this end-market has been driven by a new leadership team that has restructured our organization to mirror the increasingly global focus of OEMs. We will continue to pursue new business by leveraging our proprietary manufacturing processes, our broad range of VOC-compliant coatings and our substantial sales and technical support organizations.
Accelerate growth in emerging markets
We have a strong presence in emerging markets, which generated 25% of our sales during the year ended December 31, 2014. These markets are characterized by increasing levels of vehicle production, a growing car parc, an expanding middle class and GDP growth above the global average, all of which drive greater demand for coatings. We believe that we are well positioned to capitalize on this increasing demand with local manufacturing facilities and extensive sales and technical service teams dedicated to these markets. In China, where we have operated a wholly owned business for 30 years, we are expanding our sales force and have invested in new plant capacity, including a $50 million waterborne capacity expansion at our Jiading facility, which came on line in March 2015. We are also in the process of expanding our production capacity in Mexico and Brazil to drive future earnings growth.
Globalize existing product lines
Since the Acquisition, we have identified significant opportunities to leverage our existing products across geographies. For example, we are the market leader in the North American HDT market, but only recently began serving the Chinese market, which produces nearly four times the number of heavy duty trucks produced in the United States. This initiative has generated early positive results; for example, in 2014 we began serving Foton Daimler, one of the largest truck manufacturers in the region, with our high performance waterborne coatings. In refinish, we are leveraging legacy formulations from developed markets to satisfy growing mainstream demand in emerging markets. We also intend to pursue similar geographic opportunities with several of our other industrial and commercial vehicle product offerings.
9
Table of Contents
Invest in high-return projects to drive earnings growth
We are in the early stages of implementing several initiatives that we believe will continue to generate significant earnings growth, including establishing a global procurement organization, executing improvement programs we have named “Fit-For Growth” and “The Axalta Way” and investing capital in growth projects with high expected returns. Since the Acquisition, we have built a global procurement organization, which is executing several programs to reduce costs by streamlining inputs, reducing the number of sole-sourced raw materials and partnering with new, high-quality suppliers to meet our purchasing needs. These purchasing programs are in their early stages and we believe they will continue to generate significant earnings growth over the next several years. Our Fit-For-Growth improvement initiative is focused in Europe, where we are investing to upgrade, automate and re-align disparate manufacturing operations to bring the region’s cost structure in line with the rest of the world and better position us to meet increasing local demand. We believe that Fit-For-Growth, which we began in 2014, will generate approximately $100 million of incremental Adjusted EBITDA by 2017 on a run-rate basis, of which we have already realized approximately $37 million. Our recently announced Axalta Way program, which will commence in 2015, is a global initiative focused on commercial alignment and cost reduction that we believe will generate an incremental $100 million of Adjusted EBITDA by the end of 2017 on a run-rate basis. Finally, we believe we have significant opportunities to pursue high return projects identified since the Acquisition. These include capacity expansion projects in China, Germany, Mexico and Brazil and productivity initiatives from which we expect to benefit over the next several years.
Maintain and further develop technology leadership
We will continue to build on our nearly 150-year heritage of developing market-leading technology. We leverage our intimate customer relationships and network of customer training centers to align product innovation with customer needs. For example, in the North American refinish end-market we have recently launched Cromax Mosaic, a new VOC-compliant solventborne coatings line, to complement our broad waterborne coatings portfolio. Body shops have embraced this product, which enables them to meet environmental regulations while using existing application equipment and techniques. We have a robust pipeline of over 100 new product innovations, the majority of which we intend to launch over the next two years, including several products focused on emerging markets. Similarly in the light vehicle end-market, our proprietary 3-Wet, Eco-Concept, 2-Wet monocoat systems and high throw electrocoat products have generated new customer wins as OEMs seek to increase efficiency and reduce costs. We believe this commitment to new product development will help us maintain our technology leadership and strong market position.
Risks Related to Our Business
Investing in our common shares involves substantial risk. You should carefully consider all of the information in this prospectus prior to investing in our common shares. There are several risks related to our business and our ability to leverage our strengths described elsewhere in this prospectus that are described under “Risk Factors” elsewhere in this prospectus. Among these important risks are the following:
| • | adverse developments in economic conditions and, particularly, in conditions in the automotive and transportation industries and our other end-markets; |
| • | risks of losing any of our significant customers or the consolidation of MSOs, distributors and/or body shops; |
| • | our ability to successfully execute our growth strategy and leverage our strengths; |
| • | risks associated with our non-U.S. operations and global scale; |
| • | currency-related risks; |
| • | increased competition; |
| • | price increases or interruptions in our supply of raw materials; |
| • | failure to develop and market new products and manage product life cycles; |
10
Table of Contents
| • | litigation and other commitments and contingencies; |
| • | our substantial indebtedness; |
| • | Carlyle’s ability to control our common shares; and |
| • | other risks and uncertainties, including those listed under the caption “Risk Factors.” |
Our Principal Shareholders
Our principal shareholders are certain investment funds affiliated with Carlyle.
Founded in 1987, Carlyle is a global alternative asset manager and one of the world’s largest global private equity firms with approximately $194 billion of assets under management across 128 funds and 142 fund of funds vehicles as of December 31, 2014. Carlyle invests across four segments—Corporate Private Equity, Real Assets, Global Market Strategies and Fund of Funds Solutions—in Africa, Asia, Australia, Europe, the Middle East, North America and South America. In addition to the industrials & transportation industry, Carlyle has expertise in various industries, including aerospace, defense & government services, consumer & retail, energy, financial services, healthcare, technology & business services and telecommunications & media. Carlyle employs more than 1,650 employees, including more than 700 investment professionals, in 40 offices across six continents.
Company Information
Axalta Coating Systems Ltd. was incorporated pursuant to the laws of Bermuda on August 24, 2012. Our principal executive offices are located at Two Commerce Square, 2001 Market Street, Suite 3600, Philadelphia, Pennsylvania 19103, and our telephone number is (855) 547-1461. Our website address is www.axaltacoatingsystems.com. Information on, or accessible through, our website is not part of this prospectus, nor is such content incorporated by reference herein.
We maintain a registered office in Bermuda at Clarendon House, 2 Church Street, Hamilton HM 11, Bermuda. The telephone number of our registered office is (441) 295-5950.
11
Table of Contents
The Offering
| Common shares offered by the selling shareholders |
35,000,000 common shares. |
| Selling shareholders |
The selling shareholders identified in “Principal and Selling Shareholders.” |
| Common shares outstanding after this offering |
229,779,626 common shares. |
| Option to purchase additional shares |
The selling shareholders have granted the underwriters a 30-day option from the date of this prospectus to purchase up to 5,250,000 additional common shares at the initial public offering price, less underwriting discounts and commissions. |
| Use of proceeds |
We will not receive any net proceeds from the sale of common shares by the selling shareholders, including from any exercise by the underwriters of their option to purchase additional common shares. See “Use of Proceeds” for additional information. |
| Dividend policy |
We do not currently pay and do not currently anticipate paying dividends on our common shares following this offering. Any declaration and payment of future dividends to holders of our common shares may be limited by restrictive covenants in our debt agreements, and will be at the sole discretion of the board of directors of Axalta Coating Systems Ltd. (our “Board of Directors”), and will depend on many factors, including our financial condition, earnings, capital requirements, level of indebtedness, statutory and contractual restrictions applying to the payment of dividends and other considerations that our Board of Directors deems relevant. See “Dividend Policy,” “Management’s Discussion and Analysis of Financial Condition and Results of Operations—Liquidity and Capital Resources—Indebtedness” and “Description of Share Capital.” |
| NYSE symbol |
“AXTA”. |
| Risk factors |
See “Risk Factors” beginning on page 20 of this prospectus for a discussion of factors you should carefully consider before deciding to invest in our common shares. |
Unless we specifically state otherwise, throughout this prospectus the number of our common shares to be outstanding after completion of this offering is based on common shares outstanding as of December 31, 2014, which includes 35,000,000 common shares to be sold by the selling shareholders and excludes:
| • | 4,732 common shares issued pursuant to the exercise of options subsequent to December 31, 2014; |
| • | 17,097,036 common shares issuable upon the exercise of options outstanding at a weighted average exercise price of $9.38 per share; and |
| • | 11,874,631 common shares reserved for issuance under our 2014 Incentive Plan (the “2014 Plan”). |
Unless we specifically state otherwise, all information in this prospectus assumes no exercise of the option to purchase additional common shares by the underwriters.
12
Table of Contents
Summary Historical and Pro Forma Financial Information
The following table sets forth summary historical and pro forma financial information of Axalta. As a result of the Acquisition, we applied acquisition accounting whereby the purchase price paid was allocated to the acquired assets and liabilities at fair value. The financial reporting periods presented are as follows:
| • | The period from January 1, 2013 through January 31, 2013 and the year ended December 31, 2012 (“Predecessor” periods) reflect the combined results of operations of the DPC business. |
| • | The years ended December 31, 2014 and 2013 (“Successor” periods) reflect the consolidated results of operations of Axalta, which include the effects of acquisition accounting commencing on the acquisition date of February 1, 2013 and the effects of the financing of the Acquisition commencing on February 1, 2013. |
| • | The pro forma year ended December 31, 2013 reflects the combined historical results of operations of the DPC business for the period from January 1, 2013 through January 31, 2013 and Axalta for the year ended December 31, 2013, as adjusted for the pro forma effects of certain transactions as described in “Unaudited Pro Forma Consolidated and Combined Financial Information.” |
The historical results of operations and cash flow data for the years ended December 31, 2014 and 2013 and the historical balance sheet data as of December 31, 2014 and 2013 presented below were derived from our Successor audited financial statements and the related notes thereto included elsewhere in this prospectus. As of and for the Successor period of August 24, 2012 (inception date) through December 31, 2012, the Successor had no operations or activity, other than merger and acquisition costs of $29.0 million, which consisted primarily of investment banking, legal and other professional advisory services costs. The historical combined financial data for the year ended December 31, 2012 and the period January 1, 2013 through January 31, 2013 and the historical balance sheet data as of December 31, 2012 presented below have been derived from the Predecessor audited combined financial statements and the related notes thereto for the DPC business included elsewhere in this prospectus.
Our historical financial data and that of the DPC business are not necessarily indicative of our future performance, nor does such data reflect what our financial position and results of operations would have been had we operated as an independent publicly traded company during the periods shown. The unaudited pro forma financial data presented below was derived from our audited financial statements for the year ended December 31, 2013 and the related notes thereto and the audited financial statements of the DPC business for the period from January 1, 2013 through January 31, 2013 and the related notes thereto, each of which are included elsewhere in this prospectus.
The pro forma results for the year ended December 31, 2013 represent the addition of the Predecessor period January 1, 2013 through January 31, 2013 and the Successor year ended December 31, 2013 as well as the pro forma adjustments to reflect the Acquisition and the related financing as if they had occurred on January 1, 2013. This pro forma information has been prepared in a form consistent with Article 11 of Regulation S-X and is included in “Unaudited Pro Forma Consolidated and Combined Financial Information.” The pro forma results do not reflect the actual results we would have achieved had the Acquisition been completed as of January 1, 2013 and are not indicative of our future results of operations.
The unaudited pro forma information set forth below is based upon available information and assumptions that we believe are reasonable. The unaudited pro forma information is for illustrative and informational purposes only and is not intended to represent or be indicative of what our financial condition or results of operations would have been had the above transactions occurred on the dates indicated. The unaudited pro forma information also should not be considered representative of our future financial condition or results of operations. You should read the information contained in this table in conjunction with “Selected Historical Financial
13
Table of Contents
Information,” “Unaudited Pro Forma Consolidated and Combined Financial Information,” “Capitalization,” “Management’s Discussion and Analysis of Financial Condition and Results of Operations” and the historical audited and unaudited financial statements and the related notes thereto included elsewhere in this prospectus.
| Successor | Pro forma | Successor | Predecessor | |||||||||||||||||||
| Year Ended December 31, |
Year Ended December 31, |
Year Ended December 31, |
January 1 through January 31, |
Year Ended December 31, |
||||||||||||||||||
| (dollars and shares in millions, except per share data) |
2014 | 2013 | 2013 | 2013 | 2012 | |||||||||||||||||
| Statement of operations data: |
||||||||||||||||||||||
| Net sales |
$ | 4,361.7 | $ | 4,277.3 | $ | 3,951.1 | $ | 326.2 | $ | 4,219.4 | ||||||||||||
| Other revenue |
29.8 | 36.8 | 35.7 | 1.1 | 37.4 | |||||||||||||||||
|
|
|
|
|
|
|
|
|
|
|
|||||||||||||
| Total revenue |
4,391.5 | 4,314.1 | 3,986.8 | 327.3 | 4,256.8 | |||||||||||||||||
| Cost of goods sold(1) |
2,897.2 | 2,909.0 | 2,772.8 | 232.2 | 2,932.6 | |||||||||||||||||
| Selling, general and administrative expenses(2) |
991.5 | 1,113.6 | 1,040.6 | 70.8 | 873.4 | |||||||||||||||||
| Research and development expenses |
49.5 | 44.2 | 40.5 | 3.7 | 41.5 | |||||||||||||||||
| Amortization of acquired intangibles |
83.8 | 86.5 | 79.9 | — | — | |||||||||||||||||
| Merger and acquisition related expenses |
— | — | 28.1 | — | — | |||||||||||||||||
|
|
|
|
|
|
|
|
|
|
|
|||||||||||||
| Operating income (loss) |
369.5 | 160.8 | 24.9 | 20.6 | 409.3 | |||||||||||||||||
| Interest expense, net(3) |
217.7 | 234.8 | 215.1 | — | — | |||||||||||||||||
| Bridge financing commitment fees |
— | — | 25.0 | — | — | |||||||||||||||||
| Other expense (income), net |
115.0 | 34.1 | 48.5 | 5.0 | 16.3 | |||||||||||||||||
|
|
|
|
|
|
|
|
|
|
|
|||||||||||||
| Income (loss) before income taxes |
36.8 | (108.1 | ) | (263.7 | ) | 15.6 | 393.0 | |||||||||||||||
| Provision (benefit) for income taxes |
2.1 | (1.3 | ) | (44.8 | ) | 7.1 | 145.2 | |||||||||||||||
|
|
|
|
|
|
|
|
|
|
|
|||||||||||||
| Net income (loss) |
34.7 | (106.8 | ) | (218.9 | ) | 8.5 | 247.8 | |||||||||||||||
| Less: Net income attributable to noncontrolling interests |
7.3 | 6.6 | 6.0 | 0.6 | 4.5 | |||||||||||||||||
|
|
|
|
|
|
|
|
|
|
|
|||||||||||||
| Net income (loss) attributable to controlling interests |
$ | 27.4 | $ | (113.4 | ) | $ | (224.9 | ) | $ | 7.9 | $ | 243.3 | ||||||||||
|
|
|
|
|
|
|
|
|
|
|
|||||||||||||
| Per share data: |
||||||||||||||||||||||
| Earnings (loss) per share: |
||||||||||||||||||||||
| Basic |
$ | 0.12 | $ | (0.50 | ) | $ | (0.97 | ) | ||||||||||||||
| Diluted |
$ | 0.12 | $ | (0.50 | ) | $ | (0.97 | ) | ||||||||||||||
| Weighted average shares outstanding: |
||||||||||||||||||||||
| Basic |
229.3 | 228.3 | 228.3 | |||||||||||||||||||
| Diluted |
230.3 | 228.3 | 228.3 | |||||||||||||||||||
| Other financial data: |
||||||||||||||||||||||
| Cash flows from: |
||||||||||||||||||||||
| Operating activities |
$ | 251.4 | $ | 376.8 | $ | (37.7 | ) | $ | 388.8 | |||||||||||||
| Investing activities |
(178.5 | ) | (5,011.2 | ) | (8.3 | ) | (88.2 | ) | ||||||||||||||
| Financing activities |
(123.2 | ) | 5,098.1 | 43.0 | (290.6 | ) | ||||||||||||||||
| Depreciation and amortization |
308.7 | 327.3 | 300.7 | 9.9 | 110.7 | |||||||||||||||||
| Capital expenditures |
(188.4 | ) | (109.7 | ) | (107.3 | ) | (2.4 | ) | (73.2 | ) | ||||||||||||
| Adjusted EBITDA(4) |
840.5 | 737.6 | 699.0 | 38.4 | 661.8 | |||||||||||||||||
14
Table of Contents
| Successor | Pro Forma | Successor | Predecessor | |||||||||||||||||||
| Year Ended December 31, |
Year Ended December 31, |
Year Ended December 31, |
Period from January 1 through January 31, |
December 31, | ||||||||||||||||||
| (in millions) |
2014 | 2013 | 2013 | 2013 | 2012 | |||||||||||||||||
| Selected annual financial data: |
||||||||||||||||||||||
| Net sales |
$ | 4,361.7 | $ | 4,277.3 | $ | 3,951.1 | $ | 326.2 | $ | 4,219.4 | ||||||||||||
| Net income (loss) |
$ | 34.7 | $ | (106.8 | ) | $ | (218.9 | ) | $ | 8.5 | $ | 247.8 | ||||||||||
| Adjusted EBITDA(4) |
$ | 840.5 | $ | 737.6 | $ | 699.0 | $ | 38.4 | $ | 661.8 | ||||||||||||
| Successor | Successor | Predecessor | ||||||||||||
| December 31, | December 31, | December 31, | ||||||||||||
| (in millions) |
2014 | 2013 | 2012 | |||||||||||
| Balance sheet data (at end of period): |
||||||||||||||
| Cash and cash equivalents |
$ | 382.1 | $ | 459.3 | $ | 28.7 | ||||||||
| Working capital(5) |
926.2 | 952.2 | 605.2 | |||||||||||
| Total assets |
6,252.8 | 6,737.1 | 2,878.6 | |||||||||||
| Debt, net of discount |
3,696.4 | 3,920.9 | 0.2 | |||||||||||
| Net debt(6) |
3,314.3 | 3,461.6 | (28.5 | ) | ||||||||||
| Total liabilities |
5,140.8 | 5,525.3 | 1,181.6 | |||||||||||
| Total shareholders’ equity/combined equity |
1,112.0 | 1,211.8 | 1,697.0 | |||||||||||
| (1) | In the Successor year ended December 31, 2013, cost of goods sold included the impact of $103.7 million attributable to the increase in inventory value resulting from the fair value adjustment associated with our acquisition accounting for inventories. |
| (2) | Selling, general and administrative expense included transition-related expenses of $127.1 million and $231.5 million for the Successor years ended December 31, 2014 and 2013, respectively. Additionally, during the Predecessor period ended December 31, 2012, $0.7 million in employee separation and asset related costs were recorded. |
| (3) | In February 2014, we refinanced our borrowings under the term loan facilities of our Senior Secured Credit Facilities (as defined under “Capitalization”). If the refinancing was reflected in the pro forma results for the year ended December 31, 2013, pro forma interest expense would have been reduced by $24.0 million, or $210.8 million. |
| (4) | To supplement our financial information presented in accordance with U.S. GAAP, we use the following additional non-GAAP financial measures to clarify and enhance an understanding of past performance: EBITDA and Adjusted EBITDA. We believe that the presentation of these financial measures enhances an investor’s understanding of our financial performance. We further believe that these financial measures are useful financial metrics to assess our operating performance from period-to-period by excluding certain items that we believe are not representative of our core business. We use certain of these financial measures for business planning purposes and in measuring our performance relative to that of our competitors. We utilize Adjusted EBITDA as the primary measure of segment performance. |
EBITDA consists of net income (loss) before interest, taxes, depreciation and amortization. Adjusted EBITDA consists of EBITDA adjusted for (i) non-operating income or expense, (ii) the impact of certain non-cash, nonrecurring or other items that are included in net income and EBITDA that we do not consider indicative of our ongoing operating performance and (iii) certain unusual or nonrecurring items impacting results in a particular period. In addition, for the Predecessor periods, Adjusted EBITDA gives pro forma effect to the difference between the Predecessor allocated costs and the estimated standalone costs. We believe that making such adjustments provides investors meaningful information to understand our operating results and ability to analyze financial and business trends on a period-to-period basis.
15
Table of Contents
We believe these financial measures are commonly used by investors to evaluate our performance and that of our competitors. However, our use of the terms EBITDA and Adjusted EBITDA may vary from that of others in our industry. These financial measures should not be considered as alternatives to operating income (loss), net income (loss), earnings per share or any other performance measures derived in accordance with U.S. GAAP as measures of operating performance.
EBITDA and Adjusted EBITDA have important limitations as analytical tools and you should not consider them in isolation or as substitutes for analysis of our results as reported under U.S. GAAP. Some of these limitations are:
| • | EBITDA and Adjusted EBITDA: |
| • | do not reflect the significant interest expense on our debt, including the Senior Secured Credit Facilities and the Senior Notes (as defined under “Capitalization”); |
| • | eliminate the impact of income taxes on our results of operations; and |
| • | contain certain estimates for periods prior to the Acquisition of standalone costs; |
| • | although depreciation and amortization are non-cash charges, the assets being depreciated and amortized will often have to be replaced in the future, and EBITDA and Adjusted EBITDA do not reflect any expenditures for such replacements; and |
| • | other companies in our industry may calculate EBITDA and Adjusted EBITDA differently than we do, limiting their usefulness as comparative measures. |
In particular, Adjusted EBITDA for Predecessor periods contains an adjustment to our net income (loss) for estimates of our standalone costs versus the allocated corporate costs from DuPont reflected in our historical financial statements. These estimates may not be reflective of our actual standalone costs during such period had we been a standalone business.
We compensate for these limitations by using EBITDA and Adjusted EBITDA along with other comparative tools, together with U.S. GAAP measurements, to assist in the evaluation of operating performance. Such U.S. GAAP measurements include operating income (loss), net income (loss), earnings per share and other performance measures.
In evaluating these financial measures, you should be aware that in the future we may incur expenses similar to those eliminated in this presentation. Our presentation of EBITDA and Adjusted EBITDA should not be construed as an inference that our future results will be unaffected by unusual or nonrecurring items.
16
Table of Contents
The following table reconciles net income (loss) to EBITDA and Adjusted EBITDA for the periods presented:
| Successor | Pro forma | Successor | Predecessor | |||||||||||||||||||
| Year Ended December 31, |
Year Ended December 31, |
Year Ended December 31, |
Period from January 1 through January 31, |
Year Ended December 31, |
||||||||||||||||||
| (in millions) |
2014 | 2013 | 2013 | 2013 | 2012 | |||||||||||||||||
| Net income (loss) |
$ | 34.7 | $ | (106.8 | ) | $ | (218.9 | ) | $ | 8.5 | $ | 247.8 | ||||||||||
| Interest expense, net(a) |
217.7 | 234.8 | 215.1 | — | — | |||||||||||||||||
| Provision (benefit) for income taxes |
2.1 | (1.3 | ) | (44.8 | ) | 7.1 | 145.2 | |||||||||||||||
| Depreciation and amortization |
308.7 | 327.3 | 300.7 | 9.9 | 110.7 | |||||||||||||||||
|
|
|
|
|
|
|
|
|
|
|
|||||||||||||
| EBITDA |
563.2 | 454.0 | 252.1 | 25.5 | 503.7 | |||||||||||||||||
| Inventory step-up(b) |
— | — | 103.7 | — | — | |||||||||||||||||
| Merger and acquisition related costs(c) |
— | — | 28.1 | — | — | |||||||||||||||||
| Financing fees(d) |
6.1 | — | 25.0 | — | — | |||||||||||||||||
| Foreign exchange remeasurement losses(e) |
81.2 | 34.0 | 48.9 | 4.5 | 17.7 | |||||||||||||||||
| Long-term employee benefit plan adjustments(f) |
(0.6 | ) | 11.8 | 9.5 | 2.3 | 36.9 | ||||||||||||||||
| Termination benefits and other employee related costs(g) |
18.4 | 147.8 | 147.5 | 0.3 | 8.6 | |||||||||||||||||
| Consulting and advisory fees(h) |
36.3 | 54.7 | 54.7 | — | — | |||||||||||||||||
| Transition-related costs(i) |
101.8 | 29.3 | 29.3 | — | — | |||||||||||||||||
| IPO-related costs(j) |
22.3 | — | — | — | — | |||||||||||||||||
| Other adjustments(k) |
10.8 | 2.4 | 2.3 | 0.1 | 12.6 | |||||||||||||||||
| Dividends in respect of noncontrolling interest(l) |
(2.2 | ) | (5.2 | ) | (5.2 | ) | — | (1.9 | ) | |||||||||||||
| Management fee expense(m) |
3.2 | 3.1 | 3.1 | — | — | |||||||||||||||||
| Allocated corporate and standalone costs, net(n) |
— | 5.7 | — | 5.7 | 84.2 | |||||||||||||||||
|
|
|
|
|
|
|
|
|
|
|
|||||||||||||
| Adjusted EBITDA |
$ | 840.5 | $ | 737.6 | $ | 699.0 | $ | 38.4 | $ | 661.8 | ||||||||||||
|
|
|
|
|
|
|
|
|
|
|
|||||||||||||
| (a) | In February 2014, we refinanced our borrowings under the term loan facilities of our Senior Secured Credit Facilities. If the refinancing was reflected in the pro forma results for the year ended December 31, 2013, pro forma interest expense would have been reduced by $24.0 million, or $210.8 million. |
| (b) | During the Successor year ended December 31, 2013, we recorded a non-cash fair value adjustment associated with our acquisition accounting for inventories. These amounts increased cost of goods sold by $103.7 million. |
| (c) | In connection with the Acquisition, we incurred $28.1 million of merger and acquisition costs during the Successor year ended December 31, 2013. These costs consisted primarily of investment banking, legal and other professional advisory services costs. |
| (d) | On August 30, 2012, we signed a debt commitment letter, which included an interim credit facility (the “Bridge Facility”). Upon the issuance of the Senior Notes and the entry into the Senior Secured Credit Facilities, the commitments under the Bridge Facility terminated. Commitment fees related to the Bridge Facility of $21.0 million and associated fees of $4.0 million were expensed upon the termination of the |
17
Table of Contents
| Bridge Facility. In connection with the amendment to the Senior Secured Credit Facilities in February 2014, we recognized $3.1 million of costs during the year ended December 31, 2014. In addition to the credit facility amendment, we also incurred a $3.0 million loss on extinguishment of debt recognized during the Successor year ended December 31, 2014, which resulted directly from the pro-rata write off of unamortized deferred financing costs and original issue discounts associated with the pay-down of $100.0 million of principal on the New Dollar Term Loan (discussed further in Note 22 to our Audited Consolidated and Combined financial statements included elsewhere in this prospectus). |
| (e) | Eliminates foreign exchange gains and losses resulting from the remeasurement of assets and liabilities denominated in foreign currencies, including a $19.4 million loss related to the Acquisition date settlement of a foreign currency contract used to hedge the variability of Euro-based financing. |
| (f) | For the Successor periods ended December 31, 2014 and 2013, eliminates the non-service cost components of employee benefit costs. Additionally, we deducted a pension curtailment gain of $7.3 million recorded during the Successor year ended December 31, 2014. For the Predecessor period January 1, 2013 through January 31, 2013 and the Predecessor year ended December 31, 2012, eliminates (1) all U.S. pension and other long-term employee benefit costs that were not assumed as part of the Acquisition and (2) the non-service cost component of the pension and other long-term employee benefit costs. |
| (g) | Represents expenses primarily related to employee termination benefits, including our initiative to improve the overall cost structure within the European region, and other employee-related costs. Termination benefits include the costs associated with our headcount initiatives for establishment of new roles and elimination of old roles and other costs associated with cost saving opportunities that were related to our transition to a standalone entity. |
| (h) | Represents fees paid to consultants, advisors, and other third-party professional organizations for professional services rendered in conjunction with the transition from DuPont to a standalone entity. |
| (i) | Represents charges associated with the transition from DuPont to a standalone entity, including branding and marketing, information technology related costs, and facility transition costs. |
| (j) | Represents costs associated with the IPO, including a $13.4 million pre-tax charge associated with the termination of the management agreement with Carlyle Investment Management, L.L.C., an affiliate of Carlyle, upon the completion of the IPO. See note (l) below. |
| (k) | Represents costs for certain unusual or non-operational (gains) and losses and the non-cash impact of natural gas and currency hedge losses allocated to DPC by DuPont, stock-based compensation, asset impairments, equity investee dividends, indemnity (income) losses associated with the Acquisition, gains resulting from amendments to long-term benefit plans and loss (gain) on sale and disposal of property, plant and equipment. |
| (l) | Represents the payment of dividends to our joint venture partners by our consolidated entities that are not wholly owned. |
| (m) | Pursuant to Axalta’s management agreement with Carlyle Investment Management, L.L.C., for management and financial advisory services and oversight provided to Axalta and its subsidiaries, Axalta was required to pay an annual management fee of $3.0 million and out-of-pocket expenses. This agreement terminated upon completion of the IPO. |
18
Table of Contents
| (n) | Represents (1) the add-back of corporate allocations from DuPont to DPC for the usage of DuPont’s facilities, functions and services; costs for administrative functions and services performed on behalf of DPC by centralized staff groups within DuPont; a portion of DuPont’s general corporate expenses; and certain pension and other long-term employee benefit costs, in each case because we believe these costs are not indicative of costs we would have incurred as a standalone company net, of (2) estimated standalone costs based on a corporate function resource analysis that included a standalone executive office, the costs associated with supporting a standalone information technology infrastructure, corporate functions such as legal, finance, treasury, procurement and human resources and certain costs related to facilities management. This resource analysis included anticipated headcount and the associated overhead costs of running these functions effectively as a standalone company of our size and complexity. This estimate is provided for additional information and analysis only, as we believe that it facilitates enhanced comparability between Predecessor and Successor periods. It represents the difference between the costs that were allocated to our predecessor by its parent and the costs that we believe would be incurred if it operated as a standalone entity. This estimate is not intended to represent a pro forma adjustment presented within the guidance of Article 11 of Regulation S-X. Although we believe this estimate is reasonable, actual results may have differed from this estimate, and any difference may be material. See “Forward-Looking Statements” and “Risk Factors—Risks Related to our Business.” |
| Predecessor Period from January 1, 2013 through January 31, 2013 |
Predecessor Year Ended December 31, 2012 |
|||||||
| Allocated corporate costs |
$ | 25.4 | $ | 333.3 | ||||
| Standalone costs |
(19.7 | ) | (249.1 | ) | ||||
|
|
|
|
|
|||||
| Total |
$ | 5.7 | $ | 84.2 | ||||
|
|
|
|
|
|||||
| (5) | Working capital is defined as current assets less current liabilities. |
| (6) | Net debt is defined as debt, net of discount, less cash and cash equivalents. |
19
Table of Contents
An investment in our common shares involves a high degree of risk. You should consider carefully the following risks, together with the other information contained in this prospectus, before you decide whether to buy our common shares. If any of the events contemplated by the following discussion of risks should occur, our business, results of operations, financial condition and cash flows could suffer significantly. As a result, the market price of our common shares could decline, and you may lose all or part of the money you paid to buy our common shares. The following is a summary of all the material risks known to us.
Risks Related to our Business
Risks Related to Execution of our Strategic and Operating Plans
Our business performance is impacted by economic conditions and, particularly, by conditions in the light and commercial vehicle end-markets. Adverse developments in the global economy, in regional economies or in the light and commercial vehicle end-markets could adversely affect our business, financial condition and results of operations.
The growth of our business and demand for our products is affected by changes in the health of the overall global economy, regional economies and, in particular, of the light and commercial vehicle end-markets. Our business is adversely affected by decreases in the general level of global economic activity, such as decreases in business and consumer spending, construction activity and industrial manufacturing. Economic developments affect businesses such as ours in a number of ways. A tightening of credit in financial markets could adversely affect the ability of our customers and suppliers to obtain financing for significant purchases and operations, could result in a decrease in or cancellation of orders for our products and services and could impact the ability of our customers to make payments owed to us. Similarly, a tightening of credit in financial markets could adversely affect our supplier base and increase the potential for one or more of our suppliers to experience financial distress or bankruptcy.
Our financial position, results of operations and cash flows could be materially adversely affected by difficult economic conditions and/or significant volatility in the capital, credit and commodities markets.
Several of the end-markets we serve are cyclical, and macroeconomic and other factors beyond our control could reduce demand from these end-markets for our products, materially adversely affecting our business, financial condition and results of operations. Weak economic conditions could depress new car sales and/or production, reducing demand for our light vehicle OEM coatings and limit the growth of the car parc. These factors could, in turn, cause a related decline in demand for our automotive refinish coatings because, as the age of a vehicle increases, the general propensity of car owners to pay for cosmetic repairs decreases. Also, during difficult economic times, car owners may refrain from seeking repairs for their damaged vehicles. Similarly, periods of reduced global economic activity could hinder global industrial output, which could decrease demand for our industrial and commercial coating products.
Our global business is adversely affected by decreases in the general level of economic activity, such as decreases in business and consumer spending, construction activity and industrial manufacturing. Disruptions in the United States, Europe or in other economies, or weakening of emerging markets, such as Brazil, could adversely affect our sales, profitability and/or liquidity.
We may be unable to successfully execute on our growth initiatives, business strategies or operating plans.
We are executing on a number of growth initiatives, strategies and operating plans designed to enhance our business. For example, we are undertaking certain operational improvement initiatives with respect to realigning our manufacturing facilities in Europe and are growing our sales force in emerging markets and end-markets
20
Table of Contents
where we are underrepresented. The anticipated benefits from these efforts are based on several assumptions that may prove to be inaccurate. Moreover, we may not be able to successfully complete these growth initiatives, strategies and operating plans and realize all of the benefits, including growth targets and cost savings, we expect to achieve or it may be more costly to do so than we anticipate. A variety of risks could cause us not to realize some or all of the expected benefits. These risks include, among others, delays in the anticipated timing of activities related to such growth initiatives, strategies and operating plans; increased difficulty and cost in implementing these efforts; and the incurrence of other unexpected costs associated with operating the business. Moreover, our continued implementation of these programs may disrupt our operations and performance. As a result, we cannot assure you that we will realize these benefits. If, for any reason, the benefits we realize are less than our estimates or the implementation of these growth initiatives, strategies and operating plans adversely affect our operations or cost more or take longer to effectuate than we expect, or if our assumptions prove inaccurate, our results of operations may be materially adversely affected.
Increased competition may adversely affect our business, financial condition and results of operations.
We face substantial competition from many international, national, regional and local competitors of various sizes in the manufacturing, distribution and sale of our coatings and related products. Some of our competitors are larger than us and have greater financial resources than we do. Other competitors are smaller and may be able to offer more specialized products. We believe that technology, product quality, product innovation, breadth of product line, technical expertise, distribution, service, local presence and price are the key competitive factors for our business. Competition in any of these areas may reduce our net sales and adversely affect our earnings or cash flow by resulting in decreased sales volumes, reduced prices and increased costs of manufacturing, distributing and selling our products.
Weather conditions may reduce the demand for some of our products and could have a negative effect on our business, financial condition and results of operations.
From time to time, weather conditions have an adverse effect on our sales of coatings and related products. For example, unusually mild weather during winter months may lead to fewer vehicle collisions, reducing market demand for our refinish coatings. Conversely, harsh weather conditions can force our customers to reduce or suspend operations, thereby reducing the amount of products they purchase from us. Any such reductions in customer purchases could have a material adverse effect on our business, financial condition and results of operations.
Improved safety features on vehicles and insurance company influence may reduce the demand for some of our products and could have a negative effect on our business, financial condition and results of operations.
Vehicle manufacturers continue to develop new safety features such as collision avoidance technology and self-driving vehicles that may reduce vehicle collisions in the future, potentially negatively impacting demand for our refinish coatings. In addition, insurance companies may influence vehicle owners to use body shops that do not use our products, which could also potentially negatively impact demand for our refinish coatings. Any resulting reduction in demand for our refinish coatings could have a material adverse effect on our business, financial condition and results of operations.
The loss of any of our largest customers or the consolidation of MSOs, distributors and/or body shops could adversely affect our business, financial condition and results of operations.
We have some customers that purchase a large amount of products from us and we are also reliant on distributors to assist us in selling our products. Our largest single customer accounted for approximately 7.7% of our 2014 net sales, and our largest distributor accounted for approximately 2.8% of our 2014 net sales. Consolidation of any of our customers, including MSOs, distributors and body shops, could decrease our customer base and impact our results of operations if the resulting business chooses to use one of our competitors for the consolidated business. The loss of any of our large customers or distributors, as a result of consolidation or otherwise, could have a material adverse effect on our business, financial condition and results of operations.
21
Table of Contents
We rely on our distributor network and third-party delivery services for the distribution and export of certain of our products. A significant disruption in these services or significant increases in prices for those services may disrupt our ability to export material or increase our costs.
We ship a significant portion of our products to our customers through our distributor network as well as independent third-party delivery companies. If any of our key distributors or third-party delivery providers experiences a significant disruption such that our products cannot be delivered in a timely fashion or such that we incur additional shipping costs that we could not pass on to our customers, our costs may increase and our relationships with certain of our customers may be adversely affected. In addition, if our distributors or third-party delivery providers increase prices and we are not able to pass along these increases to customers, find comparable alternatives or adjust our delivery network, our business, financial condition and results of operations could be adversely affected.
We take on credit risk exposure from our customers in the ordinary course of our business.
We routinely offer customers pre-bates, loans and other financial incentives to purchase our products. These arrangements generally obligate the customer to purchase products from us and/or repay us for products over time. In the event that a customer is unwilling or unable to fulfill its obligations under these arrangements, we may incur a financial loss. In addition, in the ordinary course of our business, we guarantee certain of our customers’ obligations to third parties. Any default by our customers on their obligations could force us to make payments to the applicable creditor. It is possible that customer defaults on obligations owed to us and on third-party obligations that we have guaranteed could be significant, which could have a material adverse effect on our business, financial condition and results of operations.
Price increases or interruptions in the supply of raw materials could have a significant impact on our ability to grow or sustain earnings.
Our manufacturing processes consume significant amounts of raw materials, the costs of which are subject to worldwide supply and demand as well as other factors beyond our control. We use a significant amount of raw materials derived from crude oil and natural gas. As a result, volatile oil and gas prices can cause significant variations in our raw materials costs, affecting our operating results. Depending on our contractual arrangements and economic conditions, we may be unable to pass increased raw materials costs to our customers. If we are not able to fully offset the effects of higher raw materials costs, our financial results could deteriorate. In addition to the risks associated with raw materials price increases, supplier capacity constraints, supplier production disruptions or the unavailability of certain raw materials could result in supply imbalances that may have a material adverse effect on our business, financial condition and results of operations.
Failure to develop and market new products and manage product life cycles could impact our competitive position and have a material adverse effect on our business, financial condition and results of operations.
Our operating results are largely dependent on our development and management of our portfolio of current, new and developing products and services as well as our ability to bring those products and services to market. We plan to grow our business by focusing on developing and marketing our solutions to meet increasing demand for productivity. Our ability to execute this strategy and our other growth plans successfully could be adversely affected by difficulties or delays in product development, such as the inability to identify viable new products, successfully complete research and development, obtain relevant regulatory approvals, effectively manage our manufacturing process or costs, obtain intellectual property protection, or gain market acceptance of new products and services. Because of the lengthy and costly development process, technological challenges and intense competition, we cannot assure you that any of the products we are currently developing, or that we may develop in the future, will achieve substantial commercial success. For example, in addition to developing technologically advanced products, commercial success of those products will depend on customer acceptance and implementation of those products. A failure to develop commercially successful products or to develop
22
Table of Contents
additional uses for existing products could materially adversely affect our business, financial results or results of operations. Further, sales of our new products could replace sales of some of our current products, offsetting the benefit of even a successful product introduction.
Our business, financial condition and results of operations could be adversely impacted by business disruptions, security threats and security breaches.
Business disruptions, including supply disruptions, increasing costs for energy, temporary plant and/or power outages and information technology system and network disruptions, could harm our operations as well as the operations of our customers, distributors or suppliers. We face security threats and risks of security breaches to our facilities, data and information technology infrastructure. Although it is impossible to predict the occurrence or consequences of business disruptions, security threats or security breaches, they could harm our reputation, subject us to material liabilities, result in reduced demand for our products, make it difficult or impossible for us to deliver products to our customers or distributors or to receive raw materials from suppliers, and create delays and inefficiencies in our supply chain. Further, while we have designed and implemented controls to restrict access to our data and information technology infrastructure, it is still vulnerable to unauthorized access through cyber-attacks, theft and other security breaches.
Our efforts to minimize business disruptions and security breaches may fail. Such business disruptions and security breaches could significantly increase our cost of doing business, damage our reputation and/or have a material adverse effect on our business, financial condition and results of operations.
Our ability to conduct our business might be negatively impacted if we experience difficulties with outsourcing and similar third-party relationships.
We outsource certain business and administrative functions and rely on third parties to perform certain services on our behalf. We may do so increasingly in the future. If we fail to develop and implement our outsourcing strategies, such strategies prove to be ineffective or fail to provide expected cost savings, or our third party providers fail to perform as anticipated, we may experience operational difficulties, increased costs, reputational damage and a loss of business that may have a material adverse effect on our business, financial condition and results of operations. By utilizing third parties to perform certain business and administrative functions, we may be exposed to greater risk of data security breaches. Any breach of data security could damage our reputation and/or result in monetary damages, which, in turn could have a material adverse effect on our business, financial condition and results of operations.
Risks Related to our Global Operations
As a global business, we are subject to risks associated with our non-U.S. operations that are not present in the United States.
We conduct our business on a global basis, with approximately 73% of our 2014 net sales occurring outside the United States. We anticipate that international sales will continue to represent a substantial portion of our net sales and that our strategy for continued growth and profitability will entail further international expansion, particularly in emerging markets. Changes in local and regional economic conditions could affect product demand in our non-U.S. operations. Specifically, our financial results could be affected by changes in trade, monetary and fiscal policies, laws and regulations, or other activities of U.S. and non-U.S. governments, agencies and similar organizations. These conditions include, but are not limited to, changes in a country’s or region’s social, economic or political conditions, trade regulations affecting production, pricing and marketing of products, local labor conditions and regulations, reduced protection of intellectual property rights in some countries, changes in the regulatory or legal environment, restrictions on currency exchange activities, burdensome taxes and tariffs and other trade barriers, as well as the imposition of economic or other trade sanctions, each of which could impact our ability to do business in certain jurisdictions or with certain persons. Our international operations also present risks associated with terrorism, political hostilities, war and other civil disturbances, the occurrence of which could lead to reduced net sales and profitability. Our international sales and operations are also sensitive to changes in foreign national priorities, including government budgets.
23
Table of Contents
Our day-to-day operations outside the United States are subject to cultural and language barriers and the need to adopt different business practices in different geographic areas. In addition, we are required to create compensation programs, employment policies and other administrative programs that comply with the laws of multiple countries. We also must communicate and monitor standards and directives across our global operations. Our failure to successfully manage our geographically diverse operations could impair our ability to react quickly to changing business and market conditions and to enforce compliance with non-U.S. standards and procedures.
Any payment of distributions, loans or advances to and from our subsidiaries could be subject to restrictions on or taxation of, dividends or repatriation of earnings under applicable local law, monetary transfer restrictions, foreign currency exchange regulations in the jurisdictions in which our subsidiaries operate or other restrictions imposed by current or future agreements, including debt instruments, to which our non-U.S. subsidiaries may be a party. In particular, our operations in Brazil, China, India and Venezuela where we maintain local currency cash balances are subject to import authorization or pricing controls. Our results of operations and/or financial condition could be adversely impacted, possibly materially, if we are unable to successfully manage these and other risks of international operations in a volatile environment.
Currency risk may adversely affect our financial condition and cash flows.
We derive a significant portion of our net sales from outside the United States and conduct our business and incur costs in the local currency of most countries in which we operate. Because our financial statements are presented in U.S. dollars, we must translate our financial results as well as assets and liabilities into U.S. dollars for financial statement reporting purposes at exchange rates in effect during or at the end of each reporting period, as applicable. Therefore, increases or decreases in the value of the U.S. dollar against other currencies in countries where we operate will affect our results of operations and the value of balance sheet items denominated in foreign currencies. In particular, we are exposed to the Euro, the Brazilian real, the Chinese yuan and the Venezuelan bolívar. For example, unfavorable movement in the Euro negatively impacted our results of operations in the second half of 2014, and the further decline of the Euro in recent months could affect future periods. Furthermore, many of our local businesses import or buy raw materials in a currency other than their functional currency, which can impact the operating results for these operations if we are unable to mitigate the impact of the currency exchange fluctuations. We cannot accurately predict the effects of exchange rate fluctuations upon our future operating results because of the number of currencies involved, the variability of currency exposures and the potential volatility of currency exchange rates. Accordingly, fluctuations in foreign exchange rates may have an adverse effect on our financial condition and cash flows.
Terrorist acts, conflicts, wars and natural disasters may materially adversely affect our business, financial condition and results of operations.
As a multinational company with a large international footprint, we are subject to increased risk of damage or disruption to us, our employees, facilities, partners, suppliers, distributors, resellers or customers due to terrorist acts, conflicts, wars, adverse weather conditions, natural disasters, power outages, pandemics or other public health crises and environmental incidents, wherever located around the world. The potential for future terrorist attacks and natural disasters, the national and international responses to terrorist attacks and natural disasters or perceived threats to national security and other actual or potential conflicts or wars may create economic and political uncertainties. In addition, as a multinational company with headquarters and significant operations located in the United States, actions against or by the United States could result in a decrease in demand for our products, make it difficult or impossible to deliver products to our customers or to receive components from our suppliers, create delays and inefficiencies in our supply chain and pose risks to our employees, resulting in the need to impose travel restrictions. A catastrophic loss of the use of all or a portion of one of our key manufacturing facilities due to accident, labor issues, weather conditions, acts of war, political unrest, geopolitical risk, terrorist activity, natural disaster or otherwise, whether short- or long-term, and any interruption in production capability could require us to make substantial capital expenditures to remedy the situation, which could negatively affect our business, financial condition and results of operations.
24
Table of Contents
Risks Related to Legal and Regulatory Compliance and Litigation
Our failure to comply with the anti-corruption laws of the United States and various international jurisdictions could negatively impact our reputation and results of operations.
Doing business on a global basis requires us to comply with the laws and regulations of the U.S. government and those of various international and sub-national jurisdictions, and our failure to successfully comply with these rules and regulations may expose us to liabilities. These laws and regulations apply to companies, individual directors, officers, employees and agents, and may restrict our operations, trade practices, investment decisions and partnering activities. In particular, our international operations are subject to U.S. and foreign anti-corruption laws and regulations, such as the U.S. Foreign Corrupt Practices Act (the “FCPA”), the United Kingdom Bribery Act 2010 (the “Bribery Act”) as well as anti-corruption laws of the various jurisdictions in which we operate. The FCPA, the Bribery Act and other laws prohibit us and our officers, directors, employees and agents acting on our behalf from corruptly offering, promising, authorizing or providing anything of value to foreign officials for the purposes of influencing official decisions or obtaining or retaining business or otherwise obtaining favorable treatment. As part of our business, we deal with state-owned business enterprises, the employees and representatives of which may be considered foreign officials for purposes of the FCPA or the Bribery Act. We are subject to the jurisdiction of various governments and regulatory agencies outside of the United States, which may bring our personnel into contact with foreign officials responsible for issuing or renewing permits, licenses or approvals or for enforcing other governmental regulations. In addition, some of the international locations in which we operate lack a developed legal system and have elevated levels of corruption. Our global operations expose us to the risk of violating, or being accused of violating, the foregoing or other anti-corruption laws. Such violations could be punishable by criminal fines, imprisonment, civil penalties, disgorgement of profits, injunctions and exclusion from government contracts, as well as other remedial measures. Investigations of alleged violations can be very expensive, disruptive and damaging to our reputation. Although we have implemented anti-corruption policies and procedures and introduced training since becoming an independent company, there can be no guarantee that these policies, procedures and training will effectively prevent violations by our employees or representatives in the future. Additionally, we face a risk that our distributors and other business partners may violate the FCPA, the Bribery Act or similar laws or regulations. Such violations could expose us to FCPA and Bribery Act liability and/or our reputation may potentially be harmed by their violations and resulting sanctions and fines.
Our international operations require us to comply with anti-terrorism laws and regulations and applicable trade embargoes.
We are subject to trade and economic sanctions laws and other restrictions on international trade. The U.S. and other governments and their agencies impose sanctions and embargoes on certain countries, their governments and designated parties. In the United States, the economic and trade sanctions programs are principally administered and enforced by the U.S. Treasury Department’s Office of Foreign Assets Control. If we fail to comply with these laws, we could be subject to civil or criminal penalties, other remedial measures and legal expenses, which could adversely affect our business, financial condition and results of operations. Although we have implemented trade-related policies and procedures and introduced training since becoming an independent company, we cannot assure you that such policies, procedures and training will effectively prevent violations in the future, particularly as the scope of certain laws may be unclear and may be subject to changing interpretations.
We cannot predict the nature, scope or effect of future regulatory requirements to which our international sales and manufacturing operations might be subject or the manner in which existing laws might be administered or interpreted. Future regulations could limit the countries in which some of our products may be manufactured or sold, or could restrict our access to, or increase the cost of obtaining, products from foreign sources. The occurrence of any of the foregoing could have a material adverse effect on our business, financial condition and results of operations.
25
Table of Contents
We are subject to complex and evolving data privacy laws.
Our business is subject to complex and evolving U.S. and foreign laws and regulations regarding privacy, data protection and other matters. We could be liable for loss or misuse of our customers’ personal information and/or our employee’s personally-identifiable information if we fail to prevent or mitigate such misuse or breach. Although we have developed systems and processes that are designed to protect customer and employee information and prevent misuse of such information and other security breaches, failure to prevent or mitigate such misuse or breaches may affect our reputation and operating results negatively and may require significant management time and attention.
As a result of our current and past operations and/or products, including operations and/or products related to our businesses prior to the Acquisition, we could incur significant environmental liabilities and costs.
We are subject to various laws and regulations around the world governing the protection of environment and health and safety, including the discharge of pollutants to air and water and the management and disposal of hazardous substances. These laws and regulations not only govern our current operations and products, but also impose potential liability on us for our or our predecessors’ past operations. We could incur fines, penalties and other sanctions as a result of violations of such laws and regulations. In addition, as a result of our operations and/or products, including our past operations and/or products related to our businesses prior to the Acquisition, we could incur substantial costs, including costs relating to remediation and restoration activities and third-party claims for property damage or personal injury. The ultimate costs under environmental laws and the timing of these costs are difficult to accurately predict. Our accruals for costs and liabilities at sites where contamination is being investigated or remediated may not be adequate because the estimates on which the accruals are based depend on a number of factors including the nature of the matter, the complexity of the site, site geology, the nature and extent of contamination, the type of remedy, the outcome of discussions with regulatory agencies and, at multi-party sites, other Potentially Responsible Parties (“PRPs”) and the number and financial viability of other PRPs. Additional contamination may also be identified, and/or additional cleanup obligations may be incurred, at these or other sites in the future. For example, periodic monitoring or investigation activities are ongoing at a number of our sites where contaminants have been detected or are suspected, and we may incur additional costs if more active or extensive remediation is required. In addition, in connection with the Acquisition, DuPont has, subject to certain exceptions and exclusions, agreed to indemnify us for certain liabilities relating to environmental remediation obligations and certain claims relating to the exposure to hazardous substances and products manufactured prior to our separation from DuPont. We could incur material additional costs if DuPont fails to meet its obligations, if the indemnification proves insufficient or if we otherwise are unable to recover costs associated with such liabilities. The costs of our current operations complying with complex environmental laws and regulations, as well as internal voluntary programs, are significant and will continue to be so for the foreseeable future as environmental regulations become more stringent. These laws and regulations also change frequently, and we may incur additional costs complying with stricter environmental requirements that are promulgated in the future. Concerns over global climate change as well as more frequent and severe weather events have also promoted a number of legal and regulatory measures as well as social initiatives intended to reduce greenhouse gas and other carbon emissions. We cannot predict the impact that changing climate conditions or more frequent and severe weather events, if any, will have on our business, results of operations or financial condition. Moreover, we cannot predict how legal, regulatory and social responses to concerns about global climate change will impact our business.
As a producer of coatings, we transport certain materials that are inherently hazardous due to their toxic nature.
In our business, we handle and transport hazardous materials. If mishandled or released into the environment, these materials could cause substantial property damage or personal injuries resulting in significant legal claims against us. In addition, evolving regulations concerning the handling and transportation of certain materials could result in increased future capital or operating costs.
26
Table of Contents
Our results of operations could be adversely affected by litigation.
We face risks arising from various litigation matters that have been asserted against us or that may be asserted against us in the future, including, but not limited to, claims for product liability, patent and trademark infringement, antitrust, warranty, contract and claims for third party property damage or personal injury. For instance, we have noted a nationwide trend in purported class actions against chemical manufacturers generally seeking relief such as medical monitoring, property damages, off-site remediation and punitive damages arising from alleged environmental torts without claiming present personal injuries. We have also noted a trend in public and private nuisance suits being filed on behalf of states, counties, cities and utilities alleging harm to the general public. In addition, various factors or developments can lead to changes in current estimates of liabilities such as a final adverse judgment, significant settlement or changes in applicable law. A future adverse ruling or unfavorable development could result in future charges that could have a material adverse effect on us. An adverse outcome in any one or more of these matters could be material to our business, financial condition and results of operations. In particular, product liability claims, regardless of their merits, could be costly, divert management’s attention and adversely affect our reputation and demand for our products.
Risks Related to Human Resources
We may not be able to recruit and retain the experienced and skilled personnel we need to compete.
Our future success depends on our ability to attract, retain, develop and motivate highly skilled personnel. We must have talented personnel to succeed and competition for senior management in our industry is intense. Our ability to meet our performance goals depends upon the personal efforts and abilities of the principal members of our senior management who provide strategic direction, develop our business, manage our operations and maintain a cohesive and stable work environment. We cannot assure you that we will retain or successfully recruit senior executives, or that their services will remain available to us.
We rely on qualified managers and skilled employees, such as scientists, with technical and manufacturing industry experience in order to operate our business successfully. From time to time, there may be a shortage of skilled labor, which may make it more difficult and expensive for us to attract and retain qualified employees. If we are unable to attract and retain sufficient numbers of qualified individuals or our costs to do so increase significantly, our operations could be materially adversely affected.
If we are required to make unexpected payments to any pension plans applicable to our employees, our financial condition may be adversely affected.
We have defined benefit pension plans in which many of our current and former employees outside the United States participate or have participated. Many of these plans are underfunded or unfunded and the liabilities in relation to these plans will need to be satisfied as they mature from our operating reserves. In jurisdictions where the defined benefit pension plans are intended to be funded with assets in a trust or other funding vehicle, the liabilities exceed the corresponding assets in many of the plans. Various factors, such as changes in actuarial estimates and assumptions (including as to life expectancy, discount rates and rate of return on assets) as well as actual return on assets, can increase the expenses and liabilities of the defined benefit pension plans. The assets and liabilities of the plans must be valued from time to time under applicable funding rules and as a result we may be required to increase the cash payments we make in relation to these defined benefit pension plans.
Our financial condition and results of operations may be adversely affected to the extent that we are required to make any additional payments to any relevant defined benefit pension plans in excess of the amounts assumed in our current projections and assumptions or report higher pension plan expenses under relevant accounting rules.
We are subject to work stoppages, union negotiations, labor disputes and other matters associated with our labor force, which may adversely impact our operations and cause us to incur incremental costs.
Many of our employees globally are in unions or otherwise covered by labor agreements, including works councils. As of December 31, 2014, approximately 0.5% of our U.S. workforce was unionized and approximately
27
Table of Contents
64% of our workforce outside the United States was unionized or otherwise covered by labor agreements. Consequently, we may be subject to potential union campaigns, work stoppages, union negotiations and other potential labor disputes. Additionally, negotiations with unions or works councils in connection with existing labor agreements may result in significant increases in our cost of labor, divert management’s attention away from operating our business or break down and result in the disruption of our operations. The occurrence of any of the preceding outcomes could impair our ability to manufacture our products and result in increased costs and/or decreased operating results. Further, we may be impacted by work stoppages at our suppliers or customers that are beyond our control.
Risks Related to Intellectual Property
Our inability to protect and enforce our intellectual property rights could adversely affect our financial results.
Intellectual property rights both in the United States and in foreign countries, including patents, trade secrets, confidential information, trademarks and trade names are important to our business and will be critical to our ability to grow and succeed in the future. We make strategic decisions on whether to apply for intellectual property protection and what kind of protection to pursue based on a cost benefit analysis. While we endeavor to protect our intellectual property rights in certain jurisdictions in which our products are produced or used and in jurisdictions into which our products are imported, the decision to file for intellectual property protection is made on a case-by-case basis. Because of the differences in foreign trademark, patent and other laws concerning proprietary rights, our intellectual property rights may not receive the same degree of protection in foreign countries as they would in the United States. Our failure to obtain or maintain adequate protection of our intellectual property rights for any reason could have a material adverse effect on our business, financial condition and results of operations.
We have applied for patent protection relating to certain existing and proposed products, processes and services in certain jurisdictions. While we generally consider applying for patents in those countries where we intend to make, have made, use, or sell patented products, we may not accurately assess all of the countries where patent protection will ultimately be desirable. If we fail to timely file a patent application in any such country, we may be precluded from doing so at a later date. Furthermore, we cannot assure you that our pending patent applications will not be challenged by third parties or that such applications will eventually be issued by the applicable patent offices as patents. We also cannot assure that the patents issued as a result of our foreign patent applications will have the same scope of coverage as our U.S. patents. It is possible that only a limited number of the pending patent applications will result in issued patents, which may have a materially adverse effect on our business and results of operations.
The patents we own could be challenged, invalidated or circumvented by others and may not be of sufficient scope or strength to provide us with any meaningful protection or commercial advantage. Furthermore, our existing patents are subject to challenges from third parties that may result in invalidations and will all eventually expire, after which we will not be able to prevent our competitors from using our previously patented technologies, which could materially adversely affect our competitive advantage stemming from those products and technologies. We also cannot assure that competitors will not infringe our patents, or that we will have adequate resources to enforce our patents.
We also rely on unpatented proprietary technology. It is possible that others will independently develop the same or similar technology or otherwise obtain access to our unpatented technology. To protect our trade secrets and other proprietary information, we require certain employees, consultants, advisors and collaborators to enter into confidentiality agreements as we deem appropriate. We cannot assure you that we will be able to enter into these confidentiality agreements or that these agreements will provide meaningful protection for our trade secrets, know-how or other proprietary information in the event of any unauthorized use, misappropriation or disclosure of such trade secrets, know-how or other proprietary information. If we are unable to maintain the proprietary nature of our technologies, we could be materially adversely affected.
28
Table of Contents
We rely on our trademarks, trade names and brand names to distinguish our products from the products of our competitors, and have registered or applied to register many of these trademarks. We cannot assure you that our trademark applications will be approved. Third parties may also oppose our trademark applications, or otherwise challenge our use of the trademarks. In the event that our trademarks are successfully challenged, we could be forced to rebrand our products, which could result in loss of brand recognition, and could require us to devote resources to advertising and marketing new brands. Further, we cannot assure you that competitors will not infringe our trademarks, or that we will have adequate resources to enforce our trademarks. We also license third parties to use our trademarks. In an effort to preserve our trademark rights, we enter into license agreements with these third parties that govern the use of our trademarks and contain limitations on their use. Although we make efforts to police the use of our trademarks by our licensees, we cannot assure you that these efforts will be sufficient to ensure that our licensees abide by the terms of their licenses. In the event that our licensees fail to do so, our trademark rights could be diluted.
If we are sued for infringing intellectual property rights of third parties, it may be costly and time consuming, and an unfavorable outcome in any litigation could harm our business.
We cannot assure you that our activities will not, unintentionally or otherwise, infringe on the patents, trademarks or other intellectual property rights owned by others. We may spend significant time and effort and incur significant litigation costs if we are required to defend ourselves against intellectual property rights claims brought against us, regardless of whether the claims have merit. If we are found to have infringed on the patents, trademarks or other intellectual property rights of others, we may be subject to substantial claims for damages, which could materially impact our cash flow, business, financial condition and results of operations. We may also be required to cease development, use or sale of the relevant products or processes, or we may be required to obtain a license on the disputed rights, which may not be available on commercially reasonable terms, if at all.
Risks Related to Other Aspects of our Business
We may engage in acquisitions and divestitures, and may encounter difficulties integrating acquired businesses with, or disposing of divested businesses from, our current operations and, as a result, we may not realize the anticipated benefits of these acquisitions and divestitures.
We may seek to grow through strategic acquisitions, joint ventures or other arrangements. Our due diligence reviews in these transactions may not identify all of the material issues necessary to accurately estimate the cost or potential loss contingencies with respect to a particular transaction, including potential exposure to regulatory sanctions resulting from a counterparty’s previous activities. We may incur unanticipated costs or expenses, including post-closing asset impairment charges, expenses associated with eliminating duplicate facilities, litigation and other liabilities. We may also face regulatory scrutiny as a result of perceived concentration in certain markets, which could cause additional delay or prevent us from completing certain acquisitions that would be beneficial to our business. We may also encounter difficulties in integrating acquisitions with our operations, applying our internal controls processes to these acquisitions or in managing strategic investments. Additionally, we may not achieve the benefits we anticipate when we first enter into a transaction in the amount or timeframe anticipated. Any of the foregoing could adversely affect our business and results of operations. In addition, accounting requirements relating to business combinations, including the requirement to expense certain acquisition costs as incurred, may cause us to experience greater earnings volatility and generally lower earnings during periods in which we acquire new businesses. Furthermore, we may make strategic divestitures from time to time. These divestitures may result in continued financial involvement in the divested businesses, such as through indemnities, guarantees or other financial arrangements. These arrangements could result in financial obligations imposed upon us and could affect our future financial condition and results of operations.
Our joint ventures may not operate according to our business strategy if our joint venture partners fail to fulfill their obligations.
As part of our business, we have entered into certain joint venture arrangements, and may enter into additional joint venture arrangements in the future. The nature of a joint venture requires us to share control over significant
29
Table of Contents
decisions with unaffiliated third parties. Since we may not exercise control over our current or future joint ventures, we may not be able to require our joint ventures to take actions that we believe are necessary to implement our business strategy. Additionally, differences in views among joint venture participants may result in delayed decisions or failures to agree on major issues. If these differences cause the joint ventures to deviate from our business strategy, our results of operations could be materially adversely affected.
The insurance we maintain may not fully cover all potential exposures.
Our product liability, property, business interruption and casualty insurance coverages may not cover all risks associated with the operation of our business and may not be sufficient to offset the costs of any losses, lost sales or increased costs experienced during business interruptions. For some risks, we elect not to obtain insurance. As a result of market conditions, premiums and deductibles for certain insurance policies can increase substantially and, in some instances, certain insurance policies may become unavailable or available only for reduced amounts of coverage. As a result, we may not be able to renew our insurance policies or procure other desirable insurance on commercially reasonable terms, if at all. Losses and liabilities from uninsured or underinsured events and delay in the payment of insurance proceeds could have a material adverse effect on our business, financial condition and results of operations.
We may need to recognize impairment charges related to goodwill, identifiable intangible assets and fixed assets.
Under the acquisition method of accounting, the net assets acquired were recorded at fair value as of the date of the Acquisition, with any excess purchase price allocated to goodwill. The Acquisition resulted in significant balances of goodwill and identifiable intangible assets. We are required to test goodwill and any other intangible asset with an indefinite life for possible impairment on the same date each year, unless conditions exist that would require a more frequent evaluation. We are also required to evaluate amortizable intangible assets and fixed assets for impairment if there are indicators of a possible impairment.
There is significant judgment required in the analysis of a potential impairment of goodwill, identified intangible assets and fixed assets. If, as a result of a general economic slowdown, deterioration in one or more of the markets in which we operate or impairment in our financial performance and/or future outlook, the estimated fair value of our long-lived assets decreases, we may determine that one or more of our long-lived assets is impaired. An impairment charge would be determined based on the estimated fair value of the assets and any such impairment charge could have a material adverse effect on our results of operations and financial position.
We recently completed the transition of our IT systems. If we experience any issues related to the recent transition, it may have a material adverse effect on our results of operations.
We recently completed the transition of IT systems from DuPont to our own platform, including the establishment of a global IT support team. There are inherent risks associated with transitioning and changing these types of systems, and while we completed the transition in October 2014, if there are any issues surrounding this recent transition, it could result in a potential disruption of our business and substantial unplanned costs, which could have a material adverse effect on our business, financial condition or results of operations.
Our Predecessor financial information may not be comparable to the Successor financial information.
Our Predecessor financial information may not reflect what our results of operations and cash flows would have been had we been a separate, standalone entity during those periods and may not be indicative of what our results of operations and cash flows will be in the future. As a result, you have limited information on which to evaluate our business. This is primarily because:
| • | Our Predecessor combined financial information has been derived from the financial statements and accounting records of DuPont and reflects assumptions made by DuPont. Those assumptions and allocations may be different from the comparable expenses we would have incurred as a standalone company; |
30
Table of Contents
| • | Certain general corporate expenses were historically allocated to the Predecessor period by DuPont that, while reasonable, may not be indicative of the actual expenses that would have been incurred had we been operating as a standalone company, nor are they indicative of the costs that will be incurred in the future as a standalone company; |
| • | Our working capital requirements historically were satisfied as part of DuPont’s corporate-wide cash management policies. Since becoming a standalone company, we no longer rely on DuPont for working capital. In connection with the Acquisition, we incurred a large amount of indebtedness and will therefore assume significant debt service costs. As a result, our cost of debt and capitalization is significantly different from that reflected in the Predecessor financial information; and |
| • | Following the Acquisition, we have experienced increases in our costs, including the cost to establish an appropriate accounting and reporting system, debt service obligations, providing healthcare and other costs of being a standalone company. |
See “Management’s Discussion and Analysis of Financial Condition and Results of Operations” and Note 8 to our Audited Consolidated and Combined Financial Statements contained elsewhere in this prospectus.
DuPont’s potential breach of its obligations in connection with the Acquisition, including failure to comply with its indemnification obligations, may materially affect our business and operating results.
Although the Acquisition closed on February 1, 2013, DuPont still has performance obligations to us, such as transferring pension assets and fulfilling indemnification requirements. We could incur material additional costs if DuPont fails to meet its obligations or if we otherwise are unable to recover costs associated with such liabilities.
If we are treated as a financial institution under FATCA, withholding tax may be imposed on payments on our common shares.
Sections 1471 through 1474 of the U.S. Internal Revenue Code of 1986, as amended (the “Code”), and applicable Treasury Regulations commonly referred to as “FATCA” generally impose 30% withholding on certain “withholdable payments” and, in the future, may impose such withholding on “foreign passthru payments” made by a “foreign financial institution” (each as defined in the Code) that has entered into an agreement with the U.S. Internal Revenue Service to perform certain diligence and reporting obligations with respect to the foreign financial institution’s U.S.-owned accounts. The applicable Treasury Regulations treat an entity as a “financial institution” if it is a holding company formed in connection with or availed of by a private equity fund or other similar investment vehicle established with an investment strategy of investing, reinvesting, or trading in financial assets. The United States has entered into an intergovernmental agreement (an “IGA”) with Bermuda, which modifies the FATCA withholding regime described above, although the U.S. Internal Revenue Service and Bermuda tax authorities have not yet provided final guidance regarding compliance with the Bermuda IGA. It is not clear whether we would be treated as a financial institution subject to the diligence, reporting and withholding obligations under FATCA or the Bermuda IGA. Furthermore, it is not yet clear how the Bermuda IGA will address foreign passthru payments. Prospective investors should consult their tax advisors regarding the potential impact of FATCA, the Bermudan IGA and any non-U.S. legislation implementing FATCA, on their investment in our common shares.
We may be classified as a passive foreign investment company, which could result in adverse U.S. federal income tax consequences to U.S. Holders of our common shares.
Based on the anticipated market price of our common shares in this offering and expected price of our common shares following this offering, and the composition of our income, assets and operations, we do not expect to be treated as a passive foreign investment company (“PFIC”) for U.S. federal income tax purposes for the current taxable year or in the foreseeable future. However, the application of the PFIC rules is subject to uncertainty in
31
Table of Contents
several respects, and we cannot assure you the U.S. Internal Revenue Service will not take a contrary position. Furthermore, this is a factual determination that must be made annually after the close of each taxable year. If we are a PFIC for any taxable year during which a U.S. person holds our common shares, certain adverse U.S. federal income tax consequences could apply to such U.S. person. See “Taxation—U.S. Federal Income Tax Considerations—Passive Foreign Investment Company.”
Risks Related to our Indebtedness
Our substantial indebtedness could adversely affect our ability to raise additional capital to fund our operations, limit our ability to react to changes in the economy and our industry, expose us to interest rate risk to the extent of our variable rate debt and prevent us from meeting our obligations with respect to our indebtedness.
As of December 31, 2014, we had approximately $3.7 billion of indebtedness on a consolidated basis, including $750.0 million of our Dollar Senior Notes, $305.3 million of our Euro Senior Notes, $2,165.5 million of the Dollar Term Loan Facility (as defined herein) and $481.0 million of the Euro Term Loan Facility (as defined herein). In addition, we had no outstanding borrowings under our Revolving Credit Facility (as defined herein) and approximately $384.5 million in borrowing capacity available under our Revolving Credit Facility, after giving effect to $15.5 million of outstanding letters of credit. As of December 31, 2014, we were in compliance with all of the covenants under our outstanding debt instruments.
Our substantial indebtedness could have important consequences to you. For example, it could:
| • | limit our ability to obtain additional financing to fund future working capital, capital expenditures, acquisitions, general corporate purposes or other purposes; |
| • | require us to devote a substantial portion of our annual cash flow to the payment of interest on our indebtedness; |
| • | expose us to the risk of increased interest rates as, over the term of our debt, the interest cost on a significant portion of our indebtedness is subject to changes in interest rates; |
| • | hinder our ability to adjust rapidly to changing market conditions; |
| • | limit our ability to secure adequate bank financing in the future with reasonable terms and conditions or at all; and |
| • | increase our vulnerability to and limit our flexibility in planning for, or reacting to, a potential downturn in general economic conditions or in one or more of our businesses. |
We are more leveraged than some of our competitors, which could adversely affect our business plans. A relatively greater portion of our cash flow is used to service debt and other financial obligations. This reduces the funds we have available for working capital, capital expenditures, acquisitions and other purposes and, given current credit constriction, may make it more difficult for us to make borrowings in the future. Similarly, our relatively greater leverage increases our vulnerability to, and limits our flexibility in planning for, adverse economic and industry conditions and creates other competitive disadvantages compared with other companies with relatively less leverage.
In addition, the indentures governing the Senior Notes and the agreements governing our Senior Secured Credit Facilities contain affirmative and negative covenants that limit our and certain of our subsidiaries’ ability to engage in activities that may be in our long-term best interests. Our failure to comply with those covenants could result in an event of default that, if not cured or waived, could result in the acceleration of all of our debts.
32
Table of Contents
To service all of our indebtedness, we will require a significant amount of cash and our ability to generate cash depends on many factors beyond our control.
Our operations are conducted through our subsidiaries and our ability to make cash payments on our indebtedness will depend on the earnings and the distribution of funds from our subsidiaries. None of our subsidiaries, however, is obligated to make funds available to us for payment on our indebtedness. Further, the terms of the instruments governing our indebtedness significantly restrict our subsidiaries from paying dividends and otherwise transferring assets to us. Our ability to make cash payments on and refinance our debt obligations, to fund planned capital expenditures and to meet other cash requirements will depend on our financial condition and operating performance, which are subject to prevailing economic and competitive conditions and to financial, business, legislative, regulatory and other factors beyond our control. We might not be able to maintain a level of cash flows from operating activities sufficient to permit us to pay the principal, premium, if any, and interest on our indebtedness.
Our business may not generate sufficient cash flow from operations and future borrowings may not be available under our Senior Secured Credit Facilities in an amount sufficient to enable us to pay our indebtedness, or to fund our other liquidity needs, including planned capital expenditures. In such circumstances, we may need to refinance all or a portion of our indebtedness on or before maturity. We may not be able to refinance any of our indebtedness on commercially reasonable terms or at all. If we cannot service our indebtedness, we may have to take actions such as selling assets, seeking additional equity or reducing or delaying capital expenditures, strategic acquisitions, investments and alliances. Such actions, if necessary, may not be effected on commercially reasonable terms or at all. The instruments governing our indebtedness restrict our ability to sell assets and our use of the proceeds from such sales, and we may not be able to consummate those dispositions or to obtain proceeds in an amount sufficient to meet any debt service obligations then due.
If we are unable to generate sufficient cash flow or are otherwise unable to obtain funds necessary to meet required payments of principal, premium, if any, and interest on our indebtedness, or if we otherwise fail to comply with the various covenants in the instruments governing our indebtedness, we could be in default under the terms of the agreements governing such indebtedness. In the event of such default, the holders of such indebtedness could elect to declare all the funds borrowed thereunder to be due and payable, together with accrued and unpaid interest, the lenders under our Revolving Credit Facility could elect to terminate their commitments thereunder, cease making further loans and institute foreclosure proceedings against our assets, and we could be forced into bankruptcy or liquidation. If our operating performance declines, we may in the future need to obtain waivers from the required lenders under the credit agreement governing our Senior Secured Credit Facilities to avoid being in default. If we breach our covenants under our Senior Secured Credit Facilities or we are in default thereunder and seek a waiver, we may not be able to obtain a waiver from the required lenders. If this occurs, we would be in default under the credit agreement governing our Senior Secured Credit Facilities, the lenders could exercise their rights, as described above, and we could be forced into bankruptcy or liquidation.
Despite our current level of indebtedness and restrictive covenants, we and our subsidiaries may incur additional indebtedness or we may pay dividends in the future. This could further exacerbate the risks associated with our substantial financial leverage.
We and our subsidiaries may incur significant additional indebtedness under the agreements governing our indebtedness. Although the indentures governing the Senior Notes and the credit agreement governing our Senior Secured Credit Facilities contain restrictions on the incurrence of additional indebtedness, these restrictions are subject to a number of thresholds, qualifications and exceptions, and the additional indebtedness incurred in compliance with these restrictions could be substantial. Additionally, these restrictions also will not prevent us from incurring obligations that, although preferential to our common shares in terms of payment, do not constitute indebtedness. As of December 31, 2014, we had $384.5 million of additional borrowing capacity under our Revolving Credit Facility, after giving effect to $15.5 million of outstanding letters of credit.
In addition, if new debt is added to our and/or our subsidiaries’ debt levels, the related risks that we now face as a result of our leverage would intensify. See “Management’s Discussion and Analysis of Financial Condition and Results of Operations—Liquidity and Capital Resources—Indebtedness.”
33
Table of Contents
We are dependent upon our lenders for financing to execute our business strategy and meet our liquidity needs. If our lenders are unable or unwilling to fund borrowings under their credit commitments or we are unable to borrow, it could negatively impact our business.
We are dependent upon our lenders for financing to execute our business strategy and meet our liquidity needs. If our lenders are unable to fund borrowings under their credit commitments or we are unable to borrow from them for any reason, our business could be negatively impacted. During periods of volatile credit markets, there is risk that any lenders, even those with strong balance sheets and sound lending practices, could fail or refuse to honor their legal commitments and obligations under existing credit commitments, including, but not limited to, extending credit up to the maximum permitted by a credit facility, allowing access to additional credit features and otherwise accessing capital and/or honoring loan commitments. If our lenders are unable or unwilling to fund borrowings under their revolving credit commitments or we are unable to borrow from them, it could be difficult in such environments to obtain sufficient liquidity to meet our operational needs.
Our ability to obtain additional capital on commercially reasonable terms may be limited.
Although we believe our cash and cash equivalents, together with cash we expect to generate from operations and unused capacity available under our Revolving Credit Facility, provide adequate resources to fund ongoing operating requirements, we may need to seek additional financing to compete effectively.
If we are unable to obtain capital on commercially reasonable terms, it could:
| • | reduce funds available to us for purposes such as working capital, capital expenditures, research and development, strategic acquisitions and other general corporate purposes; |
| • | restrict our ability to introduce new products or exploit business opportunities; |
| • | increase our vulnerability to economic downturns and competitive pressures in the markets in which we operate; and |
| • | place us at a competitive disadvantage. |
Difficult and volatile conditions in the capital, credit and commodities markets and in the overall economy could have a material adverse effect on our financial position, results of operations and cash flows.
Difficult global economic conditions, including concerns about sovereign debt and significant volatility in the capital, credit and commodities markets, could have a material adverse effect on our financial position, results of operations and cash flows. These global economic factors, combined with low levels of business and consumer confidence and high levels of unemployment, have precipitated a slow recovery from the global recession and concern about a return to recessionary conditions. The difficult conditions in these markets and the overall economy affect our business in a number of ways. For example:
| • | as a result of the volatility in commodity prices, we may encounter difficulty in achieving sustained market acceptance of past or future price increases, which could have a material adverse effect on our financial position, results of operations and cash flows; |
| • | under difficult market conditions there can be no assurance that borrowings under our Revolving Credit Facility would be available or sufficient, and in such a case, we may not be able to successfully obtain additional financing on reasonable terms, or at all; |
| • | in order to respond to market conditions, we may need to seek waivers from various provisions in the credit agreement governing our Senior Secured Credit Facilities, and in such case, there can be no assurance that we can obtain such waivers at a reasonable cost, if at all; |
| • | market conditions could cause the counterparties to the derivative financial instruments we may use to hedge our exposure to interest rate, commodity or currency fluctuations to experience financial difficulties and, as a result, our efforts to hedge these exposures could prove unsuccessful and, furthermore, our ability to engage in additional hedging activities may decrease or become more costly; and |
34
Table of Contents
| • | market conditions could result in our key customers experiencing financial difficulties and/or electing to limit spending, which in turn could result in decreased sales and earnings for us. |
In general, downturns in economic conditions can cause fluctuations in demand for our and our customers’ products, product prices, volumes and margins. Future economic conditions may not be favorable to our industry and future growth in demand for our products, if any, may not be sufficient to alleviate any existing or future conditions of excess industry capacity. A decline in the demand for our products or a shift to lower-margin products due to deteriorating economic conditions could have a material adverse effect on our financial condition and results of operations and could also result in impairments of certain of our assets. We do not know if market conditions or the state of the overall economy will continue to improve in the near future. We cannot provide assurance that a continuation of current economic conditions or a further economic downturn in one or more of the geographic regions in which we sell our products would not have a material adverse effect on our business, financial condition and results of operations.
Our debt obligations may limit our flexibility in managing our business.
The indentures governing our Senior Notes and the credit agreement governing our Senior Secured Credit Facilities require us to comply with a number of customary financial and other covenants, such as maintaining leverage ratios in certain situations and maintaining insurance coverage. See “Management’s Discussion and Analysis of Financial Condition and Results of Operations—Liquidity and Capital Resources—Indebtedness.” These covenants may limit our flexibility in our operations, and breaches of these covenants could result in defaults under the instruments governing the applicable indebtedness even if we had satisfied our payment obligations. If we were to default on the indentures governing our Senior Notes, the credit agreement governing our Senior Secured Credit Facilities or other debt instruments, our financial condition and liquidity would be adversely affected.
Risks Related to this Offering and Ownership of our Common Shares
Axalta Coating Systems Ltd. is a holding company with no operations of its own. Because our operations are conducted almost entirely through our subsidiaries and joint ventures, we are largely dependent on our receipt of distributions and dividends or other payments from our subsidiaries and joint ventures for cash to fund all of our operations and expenses, including to make future dividend payments, if any.
Our operations are conducted almost entirely through our subsidiaries and our ability to generate cash to meet our debt service obligations or to make future dividend payments, if any, is highly dependent on the earnings and the receipt of funds from our subsidiaries in the form of dividends, loans or advances and through repayment of loans or advances from us. Payments to us by our subsidiaries and joint ventures will be contingent upon our subsidiaries’ or joint ventures’ earnings and other business considerations and may be subject to statutory or contractual restrictions. We do not currently expect to declare or pay dividends on our common shares for the foreseeable future; however, to the extent that we determine in the future to pay dividends on our common shares, the credit agreement governing our Senior Secured Credit Facilities and the indentures governing the Senior Notes significantly restrict the ability of our subsidiaries to pay dividends or otherwise transfer assets to us. In addition, Bermuda law imposes requirements that may restrict our ability to pay dividends to holders of our common shares. In addition, there may be significant tax and other legal restrictions on the ability of foreign subsidiaries or joint ventures to remit money to us.
The price of our common shares may fluctuate significantly, and you could lose all or part of your investment.
Volatility in the market price of our common shares may prevent you from being able to sell your common shares at or above the price you paid for your common shares. The market price of our common shares could fluctuate significantly for various reasons, including:
| • | our operating and financial performance and prospects; |
35
Table of Contents
| • | our quarterly or annual earnings or those of other companies in our industry; |
| • | the public’s reaction to our press releases, our other public announcements and our filings with the SEC; |
| • | changes in, or failure to meet, earnings estimates or recommendations by research analysts who track our common shares or the stock of other companies in our industry; |
| • | the failure of research analysts to cover our common shares; |
| • | strategic actions by us, our customers or our competitors, such as acquisitions or restructurings; |
| • | new laws or regulations or new interpretations of existing laws or regulations applicable to our business; |
| • | changes in accounting standards, policies, guidance, interpretations or principles; |
| • | the impact on our profitability temporarily caused by the time lag between when we experience cost increases until these increases flow through cost of sales because of our method of accounting for inventory, or the impact from our inability to pass on such price increases to our customers; |
| • | material litigations or government investigations; |
| • | changes in general conditions in the United States and global economies or financial markets, including those resulting from war, incidents of terrorism or responses to such events; |
| • | changes in key personnel; |
| • | sales of common shares by us, Carlyle or members of our management team; |
| • | termination or expiration of lock-up agreements with our management team and principal shareholders; |
| • | the granting of restricted common shares, stock options and other equity awards; |
| • | volume of trading in our common shares; and |
| • | the realization of any risks described under this “Risk Factors” section. |
In addition, over the past several years, the stock markets have experienced significant price and volume fluctuations. This volatility has had a significant impact on the market price of securities issued by many companies, including companies in our industry. The changes frequently appear to occur without regard to the operating performance of the affected companies. Hence, the price of our common shares could fluctuate based upon factors that have little or nothing to do with our company, and these fluctuations could materially reduce our share price and cause you to lose all or part of your investment. Further, in the past, market fluctuations and price declines in a company’s stock have led to securities class action litigations. If such a suit were to arise, it could have a substantial cost and divert our resources regardless of the outcome.
If we fail to maintain proper and effective internal controls over financial reporting, our ability to produce accurate and timely financial statements could be impaired and investors’ views of us could be harmed.
The Sarbanes-Oxley Act of 2002 (the “Sarbanes-Oxley Act”) requires, among other things, that we maintain effective internal control over financial reporting and disclosure controls and procedures. One key aspect of the Sarbanes-Oxley Act is that we must perform system and process evaluation and testing of our internal control over financial reporting to allow management and our independent registered public accounting firm to report on the effectiveness of our internal control over financial reporting, as required by Section 404 of the Sarbanes-Oxley Act, with auditor attestation of the effectiveness of our internal controls, beginning with our annual report on Form 10-K for the fiscal year ending December 31, 2015. If we are not able to comply with the requirements of Section 404 in a timely manner, or if we or our independent registered public accounting firm identify deficiencies in our internal control over financial reporting that are deemed to be material weaknesses, the market price of our common shares could decline and we could be subject to sanctions or investigations by the NYSE, the SEC or other regulatory authorities, which would require additional financial and management resources.
36
Table of Contents
Our ability to successfully implement our business plan and comply with the Sarbanes-Oxley Act requires us to be able to prepare timely and accurate financial statements, among other requirements. Any delay in the implementation of, or disruption in the transition to, new or enhanced systems, procedures or controls, may cause our operations to suffer and we may be unable to conclude that our internal control over financial reporting is effective and to obtain an unqualified report on internal controls from our auditors. Moreover, we cannot be certain that these measures would ensure that we implement and maintain adequate controls over our financial processes and reporting in the future. Even if we were to conclude, and our independent registered public accounting firm were to concur, that our internal control over financial reporting provided reasonable assurance regarding the reliability of financial reporting and the preparation of financial statements for external purposes in accordance with U.S. GAAP, because of its inherent limitations, internal control over financial reporting may not prevent or detect fraud or misstatements. This, in turn, could have an adverse impact on the market price for our common shares, and could adversely affect our ability to access the capital markets.
We have incurred and will continue to incur increased costs as a result of operating as a publicly traded company, and our management will be required to devote substantial time to new compliance initiatives.
As a publicly traded company, we have incurred and will continue to incur additional legal, accounting and other expenses that we did not previously incur. In addition, the Sarbanes-Oxley Act, the Dodd-Frank Wall Street Reform and Consumer Protection Act and the rules of the SEC and the NYSE impose various requirements on public companies. Our management and other personnel devote a substantial amount of time to these compliance initiatives as well as investor relations. Moreover, these rules and regulations have increased our legal and financial compliance costs and have made some activities more time-consuming and costly. For example, these rules and regulations make it more difficult and more expensive for us to obtain director and officer liability insurance, and we have incurred additional costs to maintain such coverage. Furthermore, if we are not able to comply with these requirements in a timely manner, the market price of our common shares could decline and we could be subject to potential delisting by the NYSE and review by the NYSE, the SEC, or other regulatory authorities, which would require the expenditure by us of additional financial and management resources and could harm our business and the market price of our common shares.
We are controlled by Carlyle, whose interests in our business may be different than yours.
As of December 31, 2014, Carlyle owned 74.1% of our common shares and is able to control our affairs in all cases. Following this offering, Carlyle will continue to own a majority of our common shares and control our affairs in all cases. Pursuant to a principal stockholders agreement, a majority of our Board of Directors has been designated by Carlyle. See “Certain Relationships and Related Person Transactions.” As a result, Carlyle or its respective designees to our Board of Directors have the ability to control the appointment of our management, the entering into of mergers, sales of substantially all or all of our assets and other extraordinary transactions and influence amendments to our memorandum of association and bye-laws. So long as Carlyle continues to own a majority of our common shares, they will have the ability to control the vote in any election of directors and will have the ability to prevent any transaction that requires shareholder approval regardless of whether other shareholders believe the transaction is in our best interests. Additionally, pursuant to our principal stockholders agreement, Carlyle will continue to have the ability to designate a majority of our directors until it owns less than 25% of the outstanding common shares. In any of these matters, the interests of Carlyle may differ from or conflict with your interests. Moreover, this concentration of share ownership may also adversely affect the trading price for our common shares to the extent investors perceive disadvantages in owning shares of a company with a controlling shareholder.
In addition, Carlyle is in the business of making investments in companies and may, from time to time, acquire interests in businesses that directly or indirectly compete with our business, as well as businesses that are our significant existing or potential suppliers or customers. Carlyle may acquire or seek to acquire assets that we seek to acquire and, as a result, those acquisition opportunities may not be available to us or may be more expensive for us to pursue.
37
Table of Contents
We do not intend to pay dividends on our common shares and, consequently, your ability to achieve a return on your investment will depend on appreciation in the price of our common shares.
We do not intend to declare and pay dividends on our common shares for the foreseeable future. We currently intend to invest our future earnings, if any, to fund our growth and potentially reduce our indebtedness. Therefore, you are not likely to receive any dividends on your common shares for the foreseeable future and the success of an investment in our common shares will depend upon any future appreciation in their value. There is no guarantee that our common shares will appreciate in value or even maintain the price at which our shareholders have purchased their shares. The payment of future dividends, however, will be at the discretion of our Board of Directors and will depend on, among other things, our earnings, financial condition, capital requirements, level of indebtedness, statutory and contractual restrictions applying to the payment of dividends and other considerations that our Board of Directors deems relevant. The credit agreement governing our Senior Secured Credit Facilities and the indentures governing the Senior Notes also effectively limit our ability to pay dividends. As a consequence of these limitations and restrictions, we may not be able to make, or may have to reduce or eliminate, the payment of dividends on our common shares.
Future sales of our common shares in the public market could lower our share price, and any additional capital raised by us through the sale of equity or convertible debt securities may dilute your ownership in us and may adversely affect the market price of our common shares.
We and our shareholders may sell additional common shares in subsequent offerings. We may also issue additional common shares or convertible debt securities. As of December 31, 2014, we had 1,000,000,000 common shares authorized and 229,779,626 common shares outstanding. This number includes 35,000,000 common shares that the selling shareholders are selling in this offering (or 40,250,000 common shares if the underwriters exercise their option to purchase additional shares in full), which may be resold immediately in the public market. Of the remaining common shares, 136,452,380, or 59.4% of our total outstanding common shares (or 131,202,380 shares (or 57.1% of our total outstanding common shares) if the underwriters exercise their option to purchase additional shares in full), are restricted from immediate resale under the lock-up agreements between our executive officers, directors and certain of our current shareholders and the underwriters described in “Underwriting,” but may be sold into the market in the near future. These shares will become available for sale following the expiration of the lock-up agreements entered into in connection with this offering, which, without the prior consent of the representatives of the underwriters, expire 90 days after the date of this prospectus (subject to certain exceptions and automatic extensions in certain circumstances), subject to compliance with the applicable requirements under Rule 144 of the Securities Act of 1933, as amended (the “Securities Act”).
We cannot predict the size of future issuances or sales of our common shares or the effect, if any, that future issuances and sales of our common shares will have on the market price of our common shares. Sales of substantial amounts of our common shares (including sales that may occur pursuant to Carlyle’s registration rights, sales by members of management and shares that may be issued in connection with an acquisition), or the perception that such sales could occur, may adversely affect prevailing market prices for our common shares. See “Certain Relationships and Related Person Transactions” and “Shares Eligible for Future Sale.”
We are a “controlled company” within the meaning of the rules of the NYSE and, as a result, qualify for, and rely on, exemptions from certain corporate governance requirements. Our shareholders do not have the same protections afforded to shareholders of companies that are subject to such requirements.
Following the consummation of this offering, Carlyle will collectively continue to own a majority in voting power of our outstanding common shares. As a result, we will continue to be a “controlled company” within the meaning of the corporate governance standards of the NYSE. Under these rules, a company of which more than 50% of the voting power is held by an individual, group or another company is a “controlled company” and may elect not to comply with certain corporate governance requirements, including:
| • | the requirement that a majority of such company’s board of directors consist of independent directors; |
38
Table of Contents
| • | the requirement that such company have a nominating and corporate governance committee that is composed entirely of independent directors with a written charter addressing the committee’s purpose and responsibilities; |
| • | the requirement that such company have a compensation committee that is composed entirely of independent directors with a written charter addressing the committee’s purpose and responsibilities; and |
| • | the requirement for an annual performance evaluation of such company’s nominating and corporate governance committee and compensation committee. |
We currently utilize, and intend to continue to utilize, these exemptions for so long as we continue to qualify as a “controlled company.” For so long as we utilize these exemptions, we will not have a majority of independent directors and our nominating and corporate governance and compensation committees will not consist entirely of independent directors and such committees will not be subject to annual performance evaluations. Accordingly, our shareholders do not have the same protections afforded to shareholders of companies that are subject to all of the corporate governance requirements of the NYSE.
Upon the sale of a sufficient number of shares by Carlyle, we will no longer be a controlled company, and we may have difficulties complying with NYSE rules relating to the composition of our board of directors listed above. We intend to comply with these NYSE rules if we cease to be a controlled company. However, there can be no assurance that we will be able to attract and retain the number of independent directors needed to comply with NYSE rules during the phase-in period for compliance.
We are a Bermuda company and it may be difficult for you to enforce judgments against us or our directors and executive officers.
We are a Bermuda exempted company. As a result, the rights of our shareholders are governed by Bermuda law and our memorandum of association and bye-laws. The rights of shareholders under Bermuda law may differ from the rights of shareholders of companies incorporated in another jurisdiction, and a substantial portion of our assets are located outside the United States. As a result, it may be difficult for investors to effect service of process on those persons in the United States or to enforce in the United States judgments obtained in U.S. courts against us or those persons based on the civil liability provisions of the U.S. securities laws. It is doubtful whether courts in Bermuda will enforce judgments obtained in other jurisdictions, including the United States, against us or our directors or officers under the securities laws of those jurisdictions or entertain actions in Bermuda against us or our directors or officers under the securities laws of other jurisdictions.
Bermuda law differs from the laws in effect in the United States and may afford less protection to our shareholders.
We are organized under the laws of Bermuda. As a result, our corporate affairs are governed by the Companies Act 1981 (the “Companies Act”), which differs in some material respects from laws typically applicable to U.S. corporations and shareholders, including the provisions relating to interested directors, amalgamations, mergers and acquisitions, takeovers, shareholder lawsuits and indemnification of directors. Generally, the duties of directors and officers of a Bermuda company are owed to the company only. Shareholders of Bermuda companies typically do not have rights to take action against directors or officers of the company and may only do so in limited circumstances. Shareholder class actions are not available under Bermuda law. The circumstances in which shareholder derivative actions may be available under Bermuda law are substantially more proscribed and less clear than they would be to shareholders of U.S. corporations. The Bermuda courts, however, would ordinarily be expected to permit a shareholder to commence an action in the name of a company to remedy a wrong to the company where the act complained of is alleged to be beyond the corporate power of the company or illegal, or would result in the violation of the company’s memorandum of association or bye-laws. Furthermore, consideration would be given by a Bermuda court to acts that are alleged to constitute a fraud against the minority shareholders or, for instance, where an act requires the approval of a greater percentage of the company’s shareholders than those who actually approved it.
39
Table of Contents
When the affairs of a company are being conducted in a manner that is oppressive or prejudicial to the interests of some shareholders, one or more shareholders may apply to the Supreme Court of Bermuda, which may make such order as it sees fit, including an order regulating the conduct of the company’s affairs in the future or ordering the purchase of the shares of any shareholders by other shareholders or by the company. Additionally, under our bye-laws and as permitted by Bermuda law, each shareholder has waived any claim or right of action against our directors or officers for any action taken by directors or officers in the performance of their duties, except for actions involving fraud or dishonesty. In addition, the rights of our shareholders and the fiduciary responsibilities of our directors under Bermuda law are not as clearly established as under statutes or judicial precedent in existence in jurisdictions in the United States, particularly the State of Delaware. Therefore, our shareholders may have more difficulty protecting their interests than would shareholders of a corporation incorporated in a jurisdiction within the United States.
We have anti-takeover provisions in our bye-laws that may discourage a change of control.
Our bye-laws contain provisions that could make it more difficult for a third party to acquire us without the consent of our Board of Directors. These provisions provide for:
| • | a classified Board of Directors with staggered three-year terms; |
| • | directors only to be removed for cause once the number of common shares owned by Carlyle ceases to be more than 50%; |
| • | restrictions on the time period in which directors may be nominated; and |
| • | our Board of Directors to determine the powers, preferences and rights of our preference shares and to issue the preference shares without shareholder approval. |
These anti-takeover defenses could discourage, delay or prevent a transaction involving a change in control of our company and may prevent our shareholders from receiving the benefit from any premium to the market price of our common shares offered by a bidder in a takeover context. Even in the absence of a takeover attempt, the existence of these provisions may adversely affect the prevailing market price of our common shares if the provisions are viewed as discouraging takeover attempts in the future. These provisions could also discourage proxy contests, make it more difficult for you and other shareholders to elect directors of your choosing and cause us to take corporate actions other than those you desire. See “Description of Share Capital.”
40
Table of Contents
Many statements made in this prospectus that are not statements of historical fact, including statements about our beliefs and expectations, are “forward-looking statements” within the meaning of Section 27A of the Securities Act and should be evaluated as such. Forward-looking statements include information concerning possible or assumed future results of operations, including descriptions of our business plan and strategies. These statements often include words such as “anticipate,” “expect,” “suggests,” “plan,” “believe,” “intend,” “estimates,” “targets,” “projects,” “should,” “could,” “would,” “may,” “will,” “forecast,” and other similar expressions. These forward-looking statements are contained throughout this prospectus, including the sections entitled “Prospectus Summary,” “Risk Factors,” “Capitalization,” “Management’s Discussion and Analysis of Financial Condition and Results of Operations” and “Business.” We base these forward-looking statements or projections on our current expectations, plans and assumptions that we have made in light of our experience in the industry, as well as our perceptions of historical trends, current conditions, expected future developments and other factors we believe are appropriate under the circumstances and at such time. As you read and consider this prospectus, you should understand that these statements are not guarantees of performance or results. The forward-looking statements and projections are subject to and involve risks, uncertainties and assumptions and you should not place undue reliance on these forward-looking statements or projections. Although we believe that these forward-looking statements and projections are based on reasonable assumptions at the time they are made, you should be aware that many factors could affect our actual financial results or results of operations and could cause actual results to differ materially from those expressed in the forward-looking statements and projections. Factors that may materially affect such forward-looking statements and projections include:
| • | adverse developments in economic conditions and, particularly, in conditions in the automotive and transportation industries; |
| • | our inability to successfully execute on our growth strategy; |
| • | risks associated with our non-U.S. operations; |
| • | currency-related risks; |
| • | increased competition; |
| • | risks of the loss of any of our significant customers or the consolidation of MSOs, distributors and/or body shops; |
| • | price increases or interruptions in our supply of raw materials; |
| • | failure to develop and market new products and manage product life cycles; |
| • | litigation and other commitments and contingencies; |
| • | significant environmental liabilities and costs as a result of our current and past operations or products, including operations or products related to our business prior to the Acquisition; |
| • | unexpected liabilities under any pension plans applicable to our employees; |
| • | risk that the insurance we maintain may not fully cover all potential exposures; |
| • | failure to comply with the anti-corruption laws of the United States and various international jurisdictions; |
| • | failure to comply with anti-terrorism laws and regulations and applicable trade embargoes; |
| • | business disruptions, security threats and security breaches; |
| • | our ability to protect and enforce intellectual property rights; |
| • | intellectual property infringement suits against us by third parties; |
| • | our substantial indebtedness; |
41
Table of Contents
| • | our ability to obtain additional capital on commercially reasonable terms may be limited; |
| • | our ability to realize the anticipated benefits of any acquisitions and divestitures; |
| • | our joint ventures’ ability to operate according to our business strategy should our joint venture partners fail to fulfill their obligations; |
| • | ability to recruit and retain the experienced and skilled personnel we need to compete; |
| • | work stoppages, union negotiations, labor disputes and other matters associated with our labor force; |
| • | terrorist acts, conflicts, wars and natural disasters that may materially adversely affect our business, financial condition and results of operations; |
| • | transporting certain materials that are inherently hazardous due to their toxic nature; |
| • | weather conditions that may temporarily reduce the demand for some of our products; |
| • | reduced demand for some of our products as a result of improved safety features on vehicles and insurance company influence; |
| • | the amount of the costs, fees, expenses and charges related to this offering and the costs of being a public company; |
| • | any statements of belief and any statements of assumptions underlying any of the foregoing; |
| • | Carlyle’s ability to control our common shares; |
| • | other factors disclosed in this prospectus; and |
| • | other factors beyond our control. |
These cautionary statements should not be construed by you to be exhaustive and are made only as of the date of this prospectus. We undertake no obligation to update or revise any forward-looking statements, whether as a result of new information, future events or otherwise.
42
Table of Contents
MARKET PRICE OF OUR COMMON SHARES
Our common shares have been listed on the NYSE under the symbol “AXTA” since November 12, 2014. Prior to that time, there was no public market for our common shares. The following table sets forth for the periods indicated the high and low sale prices of our common shares on the NYSE.
| High | Low | |||||||
| 2014 |
||||||||
| Fourth Quarter (beginning November 12, 2014) |
$ | 27.50 | $ | 19.50 | ||||
| 2015 |
||||||||
| First Quarter (through March 20, 2015) |
$ | 29.64 | $ | 24.74 | ||||
A recent reported closing price for our common shares is set forth on the cover page of this prospectus. American Stock Transfer & Trust Company, LLC is the transfer agent and registrar for our common shares. On December 31, 2014, we had approximately 30 holders of record of our common shares. The actual number of holders of common shares is greater than this number of record holders and includes shareholders who are beneficial owners, but whose shares are held in street name by brokers and nominees. The number of holders of record also does not include shareholders whose shares may be held in trust by other entities.
43
Table of Contents
All of the common shares offered by this prospectus are being sold by the selling shareholders. We will not receive any of the proceeds from the sale of shares by the selling shareholders in this offering, including from any exercise by the underwriters of their overallotment option. For more information about the selling shareholders, see “Principal and Selling Shareholders.”
44
Table of Contents
We have not paid dividends in the past and we do not intend to pay any cash dividends for the foreseeable future. We intend to retain earnings, if any, for the future operation and expansion of our business and the repayment of debt. Any determination to pay dividends in the future will be at the discretion of our Board of Directors and will depend upon our results of operations, cash requirements, financial condition, contractual restrictions, restrictions imposed by applicable laws and other factors that our Board of Directors may deem relevant. Specifically, we are subject to Bermuda legal constraints that may affect our ability to pay dividends on our common shares and make other payments. Under Bermuda law, a company may not declare or pay dividends if there are reasonable grounds for believing that: (i) the company is, or would after the payment be, unable to pay its liabilities as they become due or (ii) the realizable value of its assets would thereby be less than its liabilities. Our ability to pay dividends to holders of our common shares is also dependent upon our subsidiaries’ ability to make distributions to us, which is limited by the terms of the agreements governing the terms of their indebtedness. Additionally, the negative covenants in the agreements governing our indebtedness limit our ability to pay dividends and make distributions to our shareholders. For additional information on these limitations, see “Management’s Discussion and Analysis of Financial Condition and Results of Operations—Liquidity and Capital Resources—Indebtedness.”
45
Table of Contents
The following table sets forth our consolidated cash and cash equivalents and capitalization as of December 31, 2014.
The information in this table should be read in conjunction with “Selected Historical Financial Information,” “Management’s Discussion and Analysis of Financial Condition and Results of Operations” and our financial statements and related notes thereto included elsewhere in this prospectus.
| As of December 31, 2014 |
||||
| (in millions, except per share data) | ||||
| Cash and cash equivalents |
$ | 382.1 | ||
|
|
|
|||
| Debt: |
||||
| Senior Secured Credit Facilities, consisting of the following(1): |
||||
| Revolving Credit Facility |
— | |||
| Dollar Term Loan, net of discount |
2,149.0 | |||
| Euro Term Loan, net of discount |
479.2 | |||
| Dollar Senior Notes(2) |
750.0 | |||
| Euro Senior Notes(3) |
305.3 | |||
| Other indebtedness(4) |
12.9 | |||
|
|
|
|||
| Total debt |
3,696.4 | |||
|
|
|
|||
| Total stockholders’ equity: |
||||
| Common Shares, $1.00 par value per share: 1,000,000,000 shares authorized; 229,779,626 shares issued and outstanding |
229.8 | |||
| Capital in excess of par |
1,144.7 | |||
| Accumulated deficit |
(226.5 | ) | ||
| Accumulated other comprehensive loss |
(103.3 | ) | ||
|
|
|
|||
| Total stockholders’ equity |
1,044.7 | |||
| Noncontrolling interests |
67.3 | |||
|
|
|
|||
| Total stockholders’ equity and noncontrolling interests |
$ | 1,112.0 | ||
|
|
|
|||
| Total capitalization |
$ | 4,808.4 | ||
|
|
|
|||
| (1) | The senior secured credit facilities consist of (a) a $400.0 million revolving credit facility that matures in 2018 (the “Revolving Credit Facility”), (b) a $2,300.0 million term loan facility that matures in 2020 (the “Dollar Term Loan Facility”) and (c) a €400.0 million term loan facility that matures in 2020 (our “Euro Term Loan Facility” and, together with the Revolving Credit Facility and the Dollar Term Loan Facility, the “Senior Secured Credit Facilities”). As of December 31, 2014, we had $2,165.5 million of outstanding borrowings under the Dollar Term Loan Facility, $481.0 million of outstanding borrowings under the Euro Term Loan Facility and no outstanding borrowings under the Revolving Credit Facility. As of December 31, 2014, we had approximately $384.5 million in additional borrowing capacity available under our Revolving Credit Facility, after giving effect to $15.5 million of outstanding letters of credit. See Note 22 to our Audited Consolidated and Combined Financial Statements included elsewhere in this prospectus and “Management’s Discussion and Analysis of Financial Condition and Results of Operations—Liquidity and Capital Resources—Indebtedness.” |
| (2) | Consists of $750.0 million in aggregate principal amount of 7.375% senior unsecured notes due 2021 (the “Dollar Senior Notes”). |
| (3) | Consists of €250.0 million in aggregate principal amount of 5.750% senior secured notes due 2021 (the “Euro Senior Notes” and, together with the Dollar Senior Notes, the “Senior Notes”). |
| (4) | Includes indebtedness to fund short-term operational requirements. |
46
Table of Contents
The table set forth above is based on the number of common shares outstanding as of December 31, 2014. The table does not reflect:
| • | 4,732 common shares issued pursuant to the exercise of options subsequent to December 31, 2014; |
| • | 17,097,036 common shares issuable upon the exercise of options outstanding at a weighted average exercise price of $9.38 per share; and |
| • | 11,874,631 common shares reserved for issuance under our 2014 Plan. |
47
Table of Contents
SELECTED HISTORICAL FINANCIAL INFORMATION
The following table sets forth selected historical consolidated and combined financial data and other information of Axalta. As a result of the Acquisition, we applied acquisition accounting whereby the purchase price paid was allocated to the acquired assets and liabilities at fair value. The financial reporting periods presented are as follows:
| • | The period from January 1, 2013 through January 31, 2013 and the years ended December 31, 2012, 2011 and 2010 (“Predecessor” periods) reflect the combined results of operations of the DPC business. |
| • | The years ended December 31, 2014 and 2013 (“Successor” periods) reflect the consolidated results of operations of Axalta, which include the effects of acquisition accounting commencing on the acquisition date of February 1, 2013 and the effects of the Financing. |
The historical results of operations and cash flow data for the years ended December 31, 2014 and 2013 and the historical balance sheet data as of December 31, 2014 and 2013 presented below were derived from our Successor audited financial statements and the related notes thereto included elsewhere in this prospectus. As of and for the Successor period of August 24, 2012 (inception date) through December 31, 2012, the Successor had no operations or activity prior to the Acquisition, other than merger and acquisition costs of $29.0 million, which consisted primarily of investment banking, legal and other professional advisory services costs. The historical combined financial data for the years ended December 31, 2012, 2011 and 2010 as well as the period January 1, 2013 through January 31, 2013 have been derived from the Predecessor audited combined financial statements and the related notes thereto for the DPC business.
Our historical financial data and that of the DPC business are not necessarily indicative of our future performance, nor does such data reflect what our financial position and results of operations would have been had we operated as an independent company during the periods shown.
48
Table of Contents
| Successor | Predecessor | |||||||||||||||||||||||
| Year Ended December 31, |
Period from January 1 through January 31, |
Year Ended December 31, | ||||||||||||||||||||||
| (in millions, except per share data) |
2014 | 2013 | 2013 | 2012 | 2011 | 2010 | ||||||||||||||||||
| Statement of Operations Data: |
||||||||||||||||||||||||
| Net sales |
$ | 4,361.7 | $ | 3,951.1 | $ | 326.2 | $ | 4,219.4 | $ | 4,281.5 | $ | 3,802.0 | ||||||||||||
| Other revenue |
29.8 | 35.7 | 1.1 | 37.4 | 34.3 | 27.8 | ||||||||||||||||||
|
|
|
|
|
|
|
|
|
|
|
|
|
|||||||||||||
| Total revenue |
4,391.5 | 3,986.8 | 327.3 | 4,256.8 | 4,315.8 | 3,829.8 | ||||||||||||||||||
| Cost of goods sold(1) |
2,897.2 | 2,772.8 | 232.2 | 2,932.6 | 3,074.5 | 2,676.0 | ||||||||||||||||||
| Selling, general and administrative expenses(2) |
991.5 | 1,040.6 | 70.8 | 873.4 | 869.1 | 827.6 | ||||||||||||||||||
| Research and development expenses |
49.5 | 40.5 | 3.7 | 41.5 | 49.6 | 52.4 | ||||||||||||||||||
| Amortization of acquired intangibles |
83.8 | 79.9 | — | — | — | — | ||||||||||||||||||
| Merger and acquisition related expenses |
— | 28.1 | — | — | — | — | ||||||||||||||||||
|
|
|
|
|
|
|
|
|
|
|
|
|
|||||||||||||
| Operating income |
369.5 | 24.9 | 20.6 | 409.3 | 322.6 | 273.8 | ||||||||||||||||||
| Interest expense, net |
217.7 | 215.1 | — | — | 0.2 | 1.1 | ||||||||||||||||||
| Bridge financing commitment fees |
— | 25.0 | — | — | — | — | ||||||||||||||||||
| Other expense, net |
115.0 | 48.5 | 5.0 | 16.3 | 20.2 | 0.6 | ||||||||||||||||||
|
|
|
|
|
|
|
|
|
|
|
|
|
|||||||||||||
| Income (loss) before taxes |
36.8 | (263.7 | ) | 15.6 | 393.0 | 302.2 | 272.1 | |||||||||||||||||
| Provision (benefit) for income taxes |
2.1 | (44.8 | ) | 7.1 | 145.2 | 120.7 | 99.1 | |||||||||||||||||
|
|
|
|
|
|
|
|
|
|
|
|
|
|||||||||||||
| Net income (loss) |
34.7 | (218.9 | ) | 8.5 | 247.8 | 181.5 | 173.0 | |||||||||||||||||
| Less: Net income attributable to noncontrolling interests |
7.3 | 6.0 | 0.6 | 4.5 | 2.1 | 4.9 | ||||||||||||||||||
|
|
|
|
|
|
|
|
|
|
|
|
|
|||||||||||||
| Net income (loss) attributable to controlling interests |
$ | 27.4 | $ | (224.9 | ) | $ | 7.9 | $ | 243.3 | $ | 179.4 | $ | 168.1 | |||||||||||
|
|
|
|
|
|
|
|
|
|
|
|
|
|||||||||||||
| Per share data: |
||||||||||||||||||||||||
| Net Income (loss) per share: |
||||||||||||||||||||||||
| Basic |
$ | 0.12 | $ | (0.97 | ) | |||||||||||||||||||
| Diluted |
$ | 0.12 | $ | (0.97 | ) | |||||||||||||||||||
| Basic weighted average shares outstanding |
229.3 | 228.3 | ||||||||||||||||||||||
| Diluted weighted average shares outstanding |
230.3 | 228.3 | ||||||||||||||||||||||
| Other Financial Data: |
||||||||||||||||||||||||
| Cash flows from: |
||||||||||||||||||||||||
| Operating activities |
$ | 251.4 | $ | 376.8 | $ | (37.7 | ) | $ | 388.8 | $ | 236.2 | $ | 203.2 | |||||||||||
| Investing activities |
(178.5 | ) | (5,011.2 | ) | (8.3 | ) | (88.2 | ) | (116.6 | ) | (77.3 | ) | ||||||||||||
| Financing activities |
(123.2 | ) | 5,098.1 | 43.0 | (290.6 | ) | (125.1 | ) | (125.0 | ) | ||||||||||||||
| Depreciation and amortization |
308.7 | 300.7 | 9.9 | 110.7 | 108.7 | 111.2 | ||||||||||||||||||
| Capital expenditures |
(188.4 | ) | (107.3 | ) | (2.4 | ) | (73.2 | ) | (82.7 | ) | (80.2 | ) | ||||||||||||
49
Table of Contents
| Successor | Predecessor | |||||||||||||||||||
| Year Ended December 31, |
Year Ended December 31, | |||||||||||||||||||
| (in millions) |
2014 | 2013 | 2012 | 2011 | 2010 | |||||||||||||||
| Balance sheet data: |
||||||||||||||||||||
| Cash and cash equivalents |
$ | 382.1 | $ | 459.3 | $ | 28.7 | $ | 18.8 | $ | 21.9 | ||||||||||
| Working capital(3) |
926.2 | 952.2 | 605.2 | 640.0 | 604.4 | |||||||||||||||
| Total assets |
6,252.8 | 6,737.1 | 2,878.6 | 2,833.6 | 2,823.8 | |||||||||||||||
| Debt, net of discount |
3,696.4 | 3,920.9 | 0.2 | 0.9 | 0.8 | |||||||||||||||
| Total liabilities |
5,140.8 | 5,525.3 | 1,181.6 | 1,028.5 | 1,059.1 | |||||||||||||||
| Total shareholders’ equity/combined equity |
1,112.0 | 1,211.8 | 1,697.0 | 1,805.1 | 1,764.7 | |||||||||||||||
| (1) | In the Successor year ended December 31, 2013, cost of goods sold included the impact of $103.7 million attributable to the increase in inventory value resulting from the fair value adjustment associated with our acquisition accounting for inventories. |
| (2) | Selling, general and administrative expense included transition-related expenses of $127.1 million and $231.5 million for the Successor years ended December 31, 2014 and 2013, respectively. Additionally, during the Predecessor period ended December 31, 2012, $0.7 million in employee separation and asset related costs were recorded. |
| (3) | Working capital is defined as current assets less current liabilities. |
50
Table of Contents
UNAUDITED PRO FORMA CONSOLIDATED AND COMBINED FINANCIAL INFORMATION
The unaudited pro forma consolidated and combined financial information for the year ended December 31, 2013 presented below was derived from our audited financial statements for the year ended December 31, 2013 and the related notes thereto and the audited financial statements for the DPC business for the period from January 1, 2013 through January 31, 2013 and the related notes thereto, each of which are included elsewhere in this prospectus.
On February 1, 2013, we consummated the Acquisition and acquired the DPC business from DuPont for $4,907.3 million plus transaction expenses. The purchase price paid was allocated to the acquired assets and liabilities at fair value. The purchase price for the Acquisition was funded by (i) an equity contribution of $1,350.0 million, (ii) proceeds from a $2,300.0 million Dollar Term Loan facility and a €400.0 million Euro Term Loan facility and (iii) proceeds from the issuance of $750.0 million in senior unsecured notes and €250.0 million in senior secured notes.
The financing to fund the purchase price for the Acquisition is referred to herein as the “Financing.”
The pro forma results for the year ended December 31, 2013 represent the addition of the Predecessor period January 1, 2013 through January 31, 2013 and the Successor year ended December 31, 2013 as well as the pro forma adjustments to reflect the Acquisition and the related financing as if they had occurred on January 1, 2013. This pro forma information has been prepared in a form consistent with Article 11 of Regulation S-X.
As the Acquisition and the Financing transactions are reflected in the Company’s historical consolidated balance sheet at December 31, 2013 included elsewhere in this prospectus, our unaudited pro forma consolidated and combined statements of operations only reflect the Acquisition and Financing transactions in the pro forma consolidated and combined statements of operations for the year ended December 31, 2013. Historically, the DPC businesses were managed and operated in the normal course of business with other affiliates of DuPont. Accordingly, certain shared costs were allocated to DPC and reflected as expenses in the standalone Predecessor combined financial statements. DuPont had historically provided various services to the DPC business, including cash management, utilities and facilities management, information technology, finance/accounting, tax, legal, human resources, site services, data processing, security, payroll, employee benefit administration, insurance administration and telecommunications. The cost of these services were allocated to the Predecessor in the combined financial statements using various allocation methods. See Note 8 to our Audited Consolidated and Combined Financial Statements included elsewhere in this prospectus for information regarding the historical allocations for the period from January 1, 2013 through January 31, 2013.
The unaudited pro forma information set forth below is based upon available information and assumptions that we believe are reasonable. The unaudited pro forma information is for illustrative and informational purposes only and is not intended to represent or be indicative of what our financial condition or results of operations would have been had the above transactions occurred on the dates indicated. The unaudited pro forma information also should not be considered representative of our future financial condition or results of operations. We believe that the unaudited pro forma information provides investors with meaningful information to understand our operating results and ability to analyze financial and business trends on a period-to-period basis. This unaudited pro forma information should be read in conjunction with, and not as an alternative to, our financial information prepared in accordance with U. S. GAAP.
You should read the information contained in this table in conjunction with “Selected Historical Financial Information,” “Capitalization,” “Management’s Discussion and Analysis of Financial Condition and Results of Operations” and the historical audited financial statements and the related notes thereto included elsewhere in this prospectus.
51
Table of Contents
Unaudited Pro Forma Consolidated and Combined Statement Of Operations
For the Year Ended December 31, 2013
(In millions, except per share data)
| Successor | Predecessor | |||||||||||||||||||||||||||||
| Year Ended December 31, 2013 |
Period from January 1 through January 31, 2013 |
Adjustments for Acquisition |
Adjustments for Financing |
Pro forma | ||||||||||||||||||||||||||
| Net sales |
$ | 3,951.1 | $ | 326.2 | $ | — | $ | — | $ | 4,277.3 | ||||||||||||||||||||
| Other revenue |
35.7 | 1.1 | — | — | 36.8 | |||||||||||||||||||||||||
|
|
|
|
|
|
|
|
|
|
|
|||||||||||||||||||||
| Total revenue |
3,986.8 | 327.3 | — | — | 4,314.1 | |||||||||||||||||||||||||
| Cost of goods sold |
2,772.8 | 232.2 | (96.0 | ) | (a | ) | — | 2,909.0 | ||||||||||||||||||||||
| Selling, general and administrative expenses |
1,040.6 | 70.8 | 2.2 | (a | ) | — | 1,113.6 | |||||||||||||||||||||||
| Research and development expenses |
40.5 | 3.7 | — | — | 44.2 | |||||||||||||||||||||||||
| Amortization of acquired intangibles |
79.9 | — | 6.6 | (b | ) | — | 86.5 | |||||||||||||||||||||||
| Merger and acquisition related expenses |
28.1 | — | (28.1 | ) | (c | ) | — | — | ||||||||||||||||||||||
|
|
|
|
|
|
|
|
|
|
|
|||||||||||||||||||||
| Income from operations |
24.9 | 20.6 | 115.3 | — | 160.8 | |||||||||||||||||||||||||
| Interest expense, net |
215.1 | — | — | 19.7 | (e | ) | 234.8 | |||||||||||||||||||||||
| Bridge financing commitment fees |
25.0 | — | — | (25.0 | ) | (f | ) | — | ||||||||||||||||||||||
| Other expense, net(h) |
48.5 | 5.0 | (19.4 | ) | (d | ) | — | 34.1 | ||||||||||||||||||||||
|
|
|
|
|
|
|
|
|
|
|
|||||||||||||||||||||
| Income (loss) before income taxes |
(263.7 | ) | 15.6 | 134.7 | 5.3 | (108.1 | ) | |||||||||||||||||||||||
| Provision (benefit) for income taxes |
(44.8 | ) | 7.1 | 36.3 | (g | ) | 0.1 | (g | ) | (1.3 | ) | |||||||||||||||||||
|
|
|
|
|
|
|
|
|
|
|
|||||||||||||||||||||
| Net income (loss) |
(218.9 | ) | 8.5 | 98.4 | 5.2 | (106.8 | ) | |||||||||||||||||||||||
| Less: Net income attributable to noncontrolling interests |
6.0 | 0.6 | — | — | 6.6 | |||||||||||||||||||||||||
|
|
|
|
|
|
|
|
|
|
|
|||||||||||||||||||||
| Net income (loss) attributable to controlling interests |
$ | (224.9 | ) | $ | 7.9 | $ | 98.4 | $ | 5.2 | $ | (113.4 | ) | ||||||||||||||||||
|
|
|
|
|
|
|
|
|
|
|
|||||||||||||||||||||
| Per share data: |
||||||||||||||||||||||||||||||
| Earnings (loss) per share: |
||||||||||||||||||||||||||||||
| Basic and diluted |
$ | (0.97 | ) | $ | (0.50 | ) | ||||||||||||||||||||||||
| Weighted average shares outstanding: |
||||||||||||||||||||||||||||||
| Basic and diluted |
228.3 | 228.3 | ||||||||||||||||||||||||||||
52
Table of Contents
Notes to Unaudited Pro Forma Consolidated and Combined Statement of Operations
The Acquisition
| (a) | Represents the net pro forma adjustment to cost of sales resulting from the application of acquisition accounting (in millions): |
| Year ended December 31, 2013 |
||||
| Total increase in depreciation(1) |
$ | 7.9 | ||
| Impact to cost of sales for conforming Predecessor periods to weighted average cost flow assumption(2) |
(0.2 | ) | ||
| Impact to cost of sales for inventory step-up related to the Acquisition(3) |
(103.7 | ) | ||
|
|
|
|||
| Decrease applicable to cost of goods sold |
$ | (96.0 | ) | |
|
|
|
|||
| (1) | Represents incremental depreciation applicable to purchase price allocation to tangible assets. The allocation of incremental depreciation expense is based on Axalta’s historical classification. |
Assumed allocation of purchase price to fair value of property, plant and equipment (in millions):
| Estimated annual depreciation and amortization |
||||||||||||
| Acquisition Date Fair Value |
Estimated useful life |
Year ended December 31, 2013 |
||||||||||
| Description: |
||||||||||||
| Property, plant and equipment |
$ | 1,705.9 | Various | $ | 208.2 | |||||||
| Less: Aggregated historical depreciation |
(198.1 | ) | ||||||||||
|
|
|
|||||||||||
| $ | 10.1 | |||||||||||
|
|
|
|||||||||||
| Reflected in: |
||||||||||||
| Cost of goods sold |
$ | 7.9 | ||||||||||
| Selling, general and administrative expenses |
2.2 | |||||||||||
|
|
|
|||||||||||
| $ | 10.1 | |||||||||||
|
|
|
|||||||||||
| (2) | Represents the effect of reversing the impact of the LIFO cost flow assumption on the Predecessor periods to conform with Successor’s weighted average cost flow assumption |
| (3) | Represents the effect of the increase in inventory stepped-up to fair value as a result of the application of acquisition accounting. |
| (b) | Represents incremental amortization applicable to purchase price allocation to intangible assets. The allocation of incremental amortization expense is based on Axalta’s historical classification. |
53
Table of Contents
Assumed allocation of purchase price to fair value of amortizable intangibles (in millions):
| DuPont Performance Coatings Acquisition |
Weighted average estimated useful life(years) |
Estimated annual depreciation and amortization Year ended December 31, 2013 |
||||||||||
| Description: |
||||||||||||
| Technology |
$ | 403.0 | 10 | $ | 40.3 | |||||||
| Trademarks |
41.7 | 14.8 | 2.8 | |||||||||
| Customer relationships |
764.3 | 19.4 | 39.8 | |||||||||
| Non-compete |
1.5 | 4 | 0.4 | |||||||||
| Less: Aggregated historical amortization(1) |
(76.7 | ) | ||||||||||
|
|
|
|||||||||||
| $ | 6.6 | |||||||||||
|
|
|
|||||||||||
| (1) | Exclusive of the $3.2 million associated with abandoned acquired in process research and development projects. |
| (c) | Represents the net adjustment to remove one-time non-recurring expenses related to the Acquisition (in millions): |
| Year ended December 31, 2013 |
||||
| Decrease in acquisition-related transaction expenses |
$ | (28.1 | ) | |
|
|
|
|||
| (d) | Represents the adjustment to remove the non-recurring loss on foreign currency contract directly related to the Acquisition (in millions): |
| Year ended December 31, 2013 |
||||
| Acquisition related loss on foreign currency contract to hedge Euro denominated financing |
$ | (19.4 | ) | |
|
|
|
|||
The Financing
| (e) | Represents the pro forma adjustments to interest expense applicable to the Financing, as follows (in millions): |
| Year ended December 31, 2013 |
||||
| Borrowings under Term Loans(1) |
$ | 11.4 | ||
| Borrowings under Senior Notes(2) |
6.3 | |||
| Revolver unused availability fee(3) |
0.2 | |||
| Amortization of deferred financing fees and original issue discount(4) |
1.8 | |||
|
|
|
|||
| Total pro forma interest expense(5) |
$ | 19.7 | ||
|
|
|
|||
| Less: Aggregated historical interest expense |
— | |||
|
|
|
|||
| $ | 19.7 | |||
|
|
|
|||
| (1) | Based on the terms of the Financing at the Acquisition date, reflects pro forma interest expense based on $2.3 billion of borrowings under Dollar Term Loans at an assumed minimal base rate of |
54
Table of Contents
| 1.25% plus an applicable margin of 3.50% and €400 million of borrowings under Euro Term Loans at an assumed minimal base rate of 1.25% plus an applicable margin of 4.00%. A 0.125% increase or decrease in the interest rate on the Term Loan facility would increase or decrease our annual interest expense by $0.3 million. |
| (2) | Reflects pro forma interest expense based on $750 million Dollar Senior Notes at 7.375% and €250 million Euro Senior Notes (approximately $331.9 million) at 5.75%. |
| (3) | Based on unused availability of $400.0 million under the Revolving Credit Facility with an unused facility charge of 0.5% per annum. |
| (4) | Reflects the non-cash amortization of deferred financing fees and original issue discount related to the Financing over the term of the related facility. |
| (5) | In February 2014, the Company refinanced the borrowings under the Term Loans. If the refinancing was reflected in the pro forma result for the year ended December 31, 2013, the pro forma interest expense would have been reduced by $24.0 million, or $210.8 million. |
| (f) | Represents pro forma adjustment to remove bridge loan commitment fees. |
| Year ended December 31, 2013 |
||||
| Removal of bridge loan commitment fee |
$ | (25.0 | ) | |
The Transactions
| (g) | Represents pro forma adjustments to the tax provision as a result of the Acquisition and the Financing (in millions) |
| Year ended December 31, 2013 |
Pro forma adjustment |
Weighted average statutory income tax rate |
Year ended December 31, 2013 |
|||||||||
| The Acquisition |
||||||||||||
| Pro forma adjustment (a), depreciation |
$ | 10.1 | 33.0 | %(3) | $ | (3.3 | ) | |||||
| Pro forma adjustment (a), LIFO to weighted average |
(0.2 | ) | 33.2 | %(3) | 0.1 | |||||||
| Pro forma adjustment (a), inventory step-up |
(103.7 | ) | 33.2 | %(3) | 34.5 | |||||||
| Pro forma adjustment (b), amortization of intangibles |
6.6 | 23.4 | %(1) | (1.5 | ) | |||||||
| Pro forma adjustment (c), acquisition related expenses |
(28.1 | ) | 23.1 | %(1) | 6.5 | |||||||
| Pro forma adjustment (d), foreign currency contract |
(19.4 | ) | — | %(4) | — | |||||||
|
|
|
|||||||||||
| Pro forma adjustment to income tax provision |
$ | 36.3 | ||||||||||
|
|
|
|||||||||||
| The Financing |
||||||||||||
| Pro forma adjustment (e), interest expense |
$ | 19.7 | 15.3 | %(2) | $ | (3.0 | ) | |||||
| Pro forma adjustment (f), bridge loan commitment fees |
(25.0 | ) | 12.4 | %(2) | 3.1 | |||||||
|
|
|
|||||||||||
| Pro forma adjustment to income tax provision |
$ | 0.1 | ||||||||||
|
|
|
|||||||||||
| (1) | Reflects our weighted average statutory tax rate consisting primarily of the following jurisdictions and related rates: |
| Jurisdiction |
Statutory Rate | |||
| United States |
38.5 | % | ||
| Luxembourg(a) |
— | % | ||
| Germany |
32.5 | % | ||
55
Table of Contents
| (a) | Represents our effective tax rate due to prior and expected continued net operating losses. |
| (2) | Reflects our weighted average statutory tax rate consisting primarily of the following jurisdictions and related rates: |
| Jurisdiction |
Statutory Rate | |||
| United States |
38.5 | % | ||
| Netherlands(a) |
— | % | ||
| (a) | Represents our effective tax rate due to prior and expected continued net operating losses. |
| (3) | Reflects our weighted average statutory tax rate consisting primarily of the following jurisdictions and related rates: |
| Jurisdiction |
Statutory Rate | |||
| United States |
38.5 | % | ||
| Brazil |
34.0 | % | ||
| Germany |
32.5 | % | ||
| (4) | Reflects our Netherlands effective tax rate due to prior and expected continued net operating losses. |
| (h) | As a result of the IPO, the Carlyle Group Consulting Services Agreement was terminated in exchange for a one-time fee. Had these amounts been adjusted to remove the historical management fees to the pro forma results, Other expense, net would have benefited by $3.1 million. |
56
Table of Contents
MANAGEMENT’S DISCUSSION AND ANALYSIS OF FINANCIAL CONDITION AND RESULTS OF OPERATIONS
The following discussion summarizes the significant factors affecting the operating results, financial condition, liquidity and cash flows of our company as of and for the periods presented below. The following discussion and analysis should be read in conjunction with “Prospectus Summary—Summary Historical and Pro Forma Financial Information,” “Selected Historical Financial Information” and the financial statements and the related notes thereto included elsewhere in this prospectus. The statements in this discussion regarding industry outlook, our expectations regarding our future performance, liquidity and capital resources and all other non-historical statements in this discussion are forward-looking statements and are based on the beliefs of our management, as well as assumptions made by, and information currently available to, our management. Actual results could differ materially from those discussed in or implied by forward-looking statements as a result of various factors, including those discussed below and elsewhere in this prospectus, particularly in the section entitled “Risk Factors.”
Overview
We are a leading global manufacturer, marketer and distributor of high performance coatings systems. We have a nearly 150-year heritage in the coatings industry and are known for manufacturing high-quality products with well-recognized brands supported by market-leading technology and customer service. Our diverse global footprint of 35 manufacturing facilities, 7 technology centers, 45 customer training centers and approximately 12,600 employees allows us to meet the needs of customers in over 130 countries. We serve our customer base through an extensive sales force and technical support organization, as well as through over 4,000 independent, locally based distributors.
We operate our business in two segments, Performance Coatings and Transportation Coatings. Our segments are based on the type and concentration of customers served, service requirements, methods of distribution and major product lines.
Through our Performance Coatings segment, we provide high-quality liquid and powder coatings solutions to a fragmented and local customer base. We are one of only a few suppliers with the technology to provide precise color matching and highly durable coatings systems. The end-markets within this segment are refinish and industrial.
Through our Transportation Coatings segment, we provide advanced coating technologies to OEMs of light and commercial vehicles. These increasingly global customers require a high level of technical support coupled with cost-effective, environmentally responsible coatings systems that can be applied with a high degree of precision, consistency and speed. The end-markets within this segment are light vehicle and commercial vehicle.
On November 11, 2014, we priced our IPO, in which certain selling shareholders affiliated with Carlyle sold 57,500,000 common shares at a price of $19.50 per share. We received no proceeds from the IPO.
Business Highlights and Trends
From 2012 to 2014, we managed the transition of ownership and operational separation resulting from the planned divestiture of our business by DuPont and ultimately the Acquisition, including significant changes to our senior leadership team. During this time period, our Adjusted EBITDA grew at a 21% CAGR primarily as the result of several strategic initiatives focused on margin improvement. In addition to regular price increases in our refinish end-market, these initiatives included selective price increases in other end-markets, reducing sales with lower margin customers and productivity improvements, which collectively drove Adjusted EBITDA growth in both of our segments.
57
Table of Contents
From 2012 to 2014, our net sales grew at a 2% CAGR with net sales growth in both our Transportation Coatings segment and in our Performance Coatings segment. Net sales in our Transportation Coatings segment grew at a 1% CAGR, driven by consistent net sales in our light vehicle end-market and increasing sales in our commercial vehicle end-market, primarily as a result of increased vehicle production in North America and Asia Pacific and improvements in average selling price, driven by new product and color introductions. Net sales in our Performance Coatings segment increased at a 2% CAGR over the same period as a result of higher average selling prices, partially offset by lower volumes in both our refinish and industrial end-markets in developed markets as well as unfavorable impacts of currency exchange. In EMEA, volumes declined as a result of a difficult economic environment. In North America, our lack of participation in the MSO market prior to the Acquisition had a negative impact on our volumes as MSO body shops increased the number of vehicles serviced at the expense of independent body shop customers. These factors in developed markets were partially offset by continued refinish net sales growth in the emerging markets.
With 13 of our 17 most senior managers joining our company since the Acquisition, 2014 was the first full fiscal year of results under our current senior management team. Our net sales increased 2% for the year ended December 31, 2014 compared to the pro forma year ended December 31, 2013 (see “Unaudited Pro Forma Consolidated and Combined Financial Information”), driven by 3% growth in our Performance Coatings segment and 1% growth in our Transportation Coatings segment, with growth in both segments across all regions except Latin America. Excluding Latin America, where difficult economic conditions contributed to weaker demand and unfavorable currency translation, our net sales grew 3% for the year ended December 31, 2014 compared to the pro forma year ended December 31, 2013. The following trends impacted our segment and end-market sales performance in 2014:
| • | Performance Coatings: Improving economic conditions in Europe, our recent wins with growing MSO customers in North America and continued growth in Asia Pacific drove higher volumes. |
| • | Transportation Coatings: Significant growth in Asia Pacific driven by increases in light vehicle production combined with increased North American commercial truck production builds were largely offset by significantly lower light vehicle volumes in Latin America. |
While we expect to generate Adjusted EBITDA growth for the full year 2015 driven by favorable industry trends and our specific growth initiatives, our performance during any particular quarter may be impacted by a number of factors. For example, we expect that the first quarter of 2015 will contribute proportionally less to our fiscal 2015 results than the first quarter of 2014 did to our fiscal 2014 results due to (1) foreign currency exchange rates, (2) light vehicle customers returning to full production schedules later in the first quarter of 2015 compared to 2014, (3) the timing of new light vehicle business coming on-line in the second half of 2015, (4) lower refinish demand in the first quarter of 2015 attributable to a relatively mild winter in North America and Europe and (5) the impact of pre-start up activities related to new plant capacity in our Jiading, China facility.
Since the Acquisition, we have implemented numerous initiatives to reduce our fixed and variable costs that improved our Adjusted EBITDA margin in 2014 compared to the pro forma prior year. Examples include transitioning our IT systems to more cost-effective solutions that better meet our needs as an independent company, developing a global procurement organization to reduce procurement costs and investing in a European manufacturing re-alignment to position the region for profitable growth. These initiatives are contributing to our financial results and we believe they will continue to drive profitability improvements over the next several years.
58
Table of Contents
Our business serves four end-markets globally as follows:
| (in millions) |
Successor | Pro Forma | Predecessor | |||||||||||||||||
| Year Ended December 31, | 2014 vs 2013 | 2013 vs 2012 | ||||||||||||||||||
| 2014 | 2013 | 2012 | % change | % change | ||||||||||||||||
| Performance Coatings |
||||||||||||||||||||
| Refinish |
$ | 1,850.8 | $ | 1,799.4 | $ | 1,759.3 | 2.9 | % | 2.3 | % | ||||||||||
| Industrial |
734.2 | 712.7 | 720.2 | 3.0 | % | (1.0 | )% | |||||||||||||
|
|
|
|
|
|
|
|
|
|
|
|||||||||||
| Total Net sales Performance Coatings |
2,585.0 | 2,512.1 | 2,479.5 | 2.9 | % | 1.3 | % | |||||||||||||
|
|
|
|
|
|
|
|
|
|
|
|||||||||||
| Transportation Coatings |
||||||||||||||||||||
| Light Vehicle |
1,384.5 | 1,403.1 | 1,390.6 | (1.3 | )% | 0.9 | % | |||||||||||||
| Commercial Vehicle |
392.2 | 362.1 | 349.3 | 8.3 | % | 3.7 | % | |||||||||||||
|
|
|
|
|
|
|
|
|
|
|
|||||||||||
| Total Net sales Transportation Coatings |
1,776.7 | 1,765.2 | 1,739.9 | 0.7 | % | 1.5 | % | |||||||||||||
|
|
|
|
|
|
|
|
|
|
|
|||||||||||
| Total Net sales |
$ | 4,361.7 | $ | 4,277.3 | $ | 4,219.4 | 2.0 | % | 1.4 | % | ||||||||||
|
|
|
|
|
|
|
|
|
|
|
|||||||||||
Basis of Presentation
Axalta Coating Systems Ltd. (formerly known as Flash Bermuda Co., Ltd. or Axalta Coating Systems Bermuda Co., Ltd.) (“Axalta” or the “Company”), a Bermuda exempted company limited by shares formed at the direction of affiliates of Carlyle, was incorporated on August 24, 2012 for the purpose of consummating the Acquisition.
The purchase price for the Acquisition was funded by (i) an equity contribution of $1,350.0 million into the Company by affiliates of Carlyle (the “Equity Contribution”), (ii) proceeds from borrowings under our Senior Secured Credit Facilities, consisting of a $2,300.0 million Dollar Term Loan facility and a €400.0 million Euro Term Loan facility, both of which mature on February 1, 2020 and (iii) proceeds from the issuance of $750.0 million aggregate principal amount of 7.375% Dollar Senior Notes and the issuance of €250.0 million aggregate principal amount of 5.750% Euro Senior Notes. The Senior Secured Credit Facilities and the Senior Notes are more fully described in Note 22 to the annual audited financial statements for the year ended December 31, 2014 included elsewhere in this prospectus. Subsequent to the closing, we received approximately $18.6 million in closing date working capital and pension adjustments resulting in a final purchase price of $4,907.3 million. In February 2014, we entered into an amendment to the credit agreement governing the Senior Secured Credit Facilities to reprice our existing first lien term loan facilities (the “Refinancing”).
Axalta’s consolidated financial statements as of December 31, 2014 and 2013, and for the years ended December 31, 2014 and 2013 and the period from August 24, 2012 through December 31, 2012, included elsewhere in this prospectus, represent those of the Successor. The consolidated financial statements of Axalta were prepared using the acquisition method of accounting. Under the acquisition method of accounting, tangible and identifiable intangible assets acquired and liabilities assumed are recorded at their respective fair market values as of the date of the acquisition, with any purchase price in excess of the net assets acquired recorded as goodwill. Because Axalta was formed on August 24, 2012 for the purpose of consummating the Acquisition, it has no financial statements as of or for periods ended prior to that date. Prior to the Acquisition, Axalta generated no revenue and only incurred merger and acquisition related costs and debt financing costs in anticipation of the Acquisition.
The combined financial statements of DPC for the period from January 1, 2013 through January 31, 2013 and for the year ended December 31, 2012, included elsewhere in this prospectus, represent those of the Predecessor. As a result of the application of acquisition accounting as of the date of the Acquisition, the financial statements for the Successor periods and the Predecessor periods are presented on a different basis and, therefore, may not be comparable.
59
Table of Contents
During the Predecessor periods, DPC operated either as a reportable segment or part of a reportable segment within DuPont, consequently, standalone financial statements were not historically prepared for DPC. The accompanying combined financial statements of DPC have been prepared from DuPont’s historical accounting records and are presented on a standalone basis as if the operations had been conducted independently from DuPont. In this context, prior to pre-acquisition structuring that occurred in 2012, no direct ownership relationship existed among all of the various legal entities comprising DPC.
Accordingly, DuPont and its subsidiaries’ net investment in these operations is shown in lieu of shareholders’ equity in the Predecessor combined financial statements. The Predecessor combined financial statements include the historical operations and assets and liabilities of the legal entities that are considered to comprise the DPC business. For more information on the financial statements for our Successor period and Predecessor period, see Note 5 to our Audited Consolidated and Combined Financial Statements included elsewhere in this prospectus for further discussion on the Acquisition.
In addition to the historical analysis of results of operations, we have prepared unaudited supplemental pro forma results of operations for the year ended December 31, 2013 as if the Acquisition and related financing had occurred on January 1, 2013. The pro forma analysis is prepared and presented to aid in explaining the results of operations. The pro forma discussion follows the historical analysis of results of operations.
The pro forma results for the year ended December 31, 2013 represent the addition of the Predecessor period January 1, 2013 through January 31, 2013 and the Successor year ended December 31, 2013 as well as the pro forma adjustments to reflect the Acquisition and the related financing as if they had occurred on January 1, 2013. This pro forma information has been prepared in a form consistent with Article 11 of Regulation S-X and is included in “Unaudited Pro Forma Consolidated and Combined Financial Information.” The pro forma results do not reflect the actual results we would have achieved had the Acquisition been completed as of January 1, 2013 and are not indicative of our future results of operations.
Acquisition Accounting
We allocated the purchase price paid to acquire DPC to the acquired assets and liabilities assumed based on their respective estimated fair value as of the acquisition date. The application of acquisition accounting resulted in an increase in amortization and depreciation expense relating to our acquired intangible assets and property, plant and equipment. In addition to the increase in the net carrying value of property, plant and equipment, we revised the remaining depreciable lives of property, plant and equipment to reflect the estimated remaining useful lives for purposes of calculating periodic depreciation expense. We adjusted the carrying values of the joint ventures to reflect their estimated fair values at the date of purchase. We adjusted the value of inventory to its estimated fair value, which increased the costs recognized upon the sale of this acquired inventory. We also provided for deferred income taxes for the future tax consequences of acquisition date basis differences between the carrying amounts of assets and liabilities utilized for financial reporting purposes and the respective amounts used for income tax purposes. The excess of the purchase price over the estimated fair value of assets and liabilities was assigned to goodwill, which is not amortized for accounting purposes but is subject to testing for impairment at least annually. See Note 5 to our Audited Consolidated and Combined Financial Statements included elsewhere in this prospectus for further discussion on the Acquisition.
60
Table of Contents
Factors Affecting Our Operating Results
The following discussion sets forth certain components of our statements of operations as well as factors that impact those items.
Net sales
We generate revenue from the sale of our products across all major geographic areas. Our net sales include total sales less estimates for returns and price allowances. Price allowances include discounts for prompt payment as well as volume-based incentives. Our overall net sales are generally impacted by the following factors:
| • | fluctuations in overall economic activity within the geographic markets in which we operate; |
| • | underlying growth in one or more of our end-markets, either worldwide or in particular geographies in which we operate; |
| • | the type of products used within existing customer applications, or the development of new applications requiring products similar to ours; |
| • | changes in product sales prices (including volume discounts and cash discounts for prompt payment); |
| • | changes in the level of competition faced by our products, including price competition and the launch of new products by competitors; |
| • | our ability to successfully develop and launch new products and applications; and |
| • | fluctuations in foreign exchange rates. |
While the factors described above impact net sales in each of our operating segments, the impact of these factors on our operating segments can differ, as described below. For more information about risks relating to our business, see “Risk Factors—Risks Related to our Business.”
Other revenue
Other revenue consists primarily of consulting and other service revenue and royalty income.
Cost of goods sold (“cost of sales”)
Our cost of sales consists principally of the following:
| • | Production Materials Costs. We purchase a significant amount of the materials used in production on a global lowest-cost basis. |
| • | Employee Costs. These include the compensation and benefit costs for employees involved in our manufacturing operations. These costs generally increase on an aggregate basis as production volumes increase and may decline as a percent of net sales as a result of economies of scale associated with higher production volumes. |
| • | Depreciation Expense. Property, plant and equipment are stated at cost and depreciated or amortized on a straight-line basis over their estimated useful lives. Property, plant and equipment acquired through the Acquisition were recorded at their estimated fair value on the acquisition date resulting in a new cost basis for accounting purposes. |
| • | Other. Our remaining cost of sales consists of freight costs, warehousing expenses, purchasing costs, costs associated with closing or idling of production facilities, functional costs supporting manufacturing, product claims and other general manufacturing expenses, such as expenses for utilities and energy consumption. |
61
Table of Contents
The main factors that influence our cost of goods sold as a percentage of net sales include:
| • | changes in the price of raw materials; |
| • | production volumes; |
| • | the implementation of cost control measures aimed at improving productivity, including reduction of fixed production costs, refinements in inventory management and the coordination of purchasing within each subsidiary and at the business level; and |
| • | fluctuations in foreign exchange rates. |
Selling, general and administrative expenses
Our selling, general and administrative expense consists of all expenditures incurred in connection with the sales and marketing of our products, as well as administrative overhead costs, including:
| • | compensation and benefit costs for management, sales personnel and administrative staff, including share-based compensation expense. Expenses relating to our sales personnel increase or decrease principally with changes in sales volume due to the need to increase or decrease sales personnel to meet changes in demand. Expenses relating to administrative personnel generally do not increase or decrease directly with changes in sales volume; and |
| • | depreciation, advertising and other selling expenses, such as expenses incurred in connection with travel and communications. |
Changes in selling, general and administrative expense as a percentage of net sales have historically been impacted by a number of factors, including:
| • | changes in sales volume, as higher volumes enable us to spread the fixed portion of our administrative expense over higher sales; |
| • | changes in our customer base, as new customers may require different levels of sales and marketing attention; |
| • | new product launches in existing and new markets, as these launches typically involve a more intense sales activity before they are integrated into customer applications; |
| • | customer credit issues requiring increases to the allowance for doubtful accounts; and |
| • | fluctuations in foreign exchange rates. |
Research and development expenses
Research and development expense represents costs incurred to develop new products, services, processes and technologies or to generate improvements to existing products or processes.
Interest expense, net
Interest expense, net consists primarily of interest expense on institutional borrowings and other financing obligations and changes in fair value of interest rate derivative instruments, net of capitalized interest expense. Interest expense, net also includes the amortization of debt issuance costs and debt discounts associated with our Senior Secured Credit Facilities and Senior Notes. See Note 22 to our Audited Consolidated and Combined Financial Statements included elsewhere in this prospectus.
62
Table of Contents
Other expense, net
Other expense, net represents costs incurred, net of income, on various non-operational items including management expenses to Carlyle as well as foreign exchange gains and losses.
Provision for income taxes
We and our subsidiaries are subject to income tax in the various jurisdictions in which we operate. While the extent of our future tax liability is uncertain, the impact of acquisition accounting for the Acquisition and for future acquisitions, changes to the debt and equity capitalization of our subsidiaries, and the realignment of the functions performed and risks assumed by the various subsidiaries are among the factors that will determine the future book and taxable income of the respective subsidiary and the Company as a whole. For the Predecessor periods, DPC did not file separate tax returns in the majority of its jurisdictions as it was included in the tax returns of DuPont entities within the respective tax jurisdictions. The income tax provision for the Predecessor periods was calculated using a separate return basis as if DPC was a separate taxpayer.
63
Table of Contents
Results of Operations
The following discussion should be read in conjunction with the information contained in the accompanying financial statements and related notes included elsewhere in this prospectus. Our historical results of operations set forth below may not necessarily reflect what would have occurred if we had been a separate standalone entity prior to the Acquisition or what will occur in the future.
Successor year ended December 31, 2014 compared to Successor year ended December 31, 2013, Predecessor period January 1, 2013 through January 31, 2013, and the Pro Forma year ended December 31, 2013
The following table was derived from the Successor’s consolidated statements of operations for the years ended December 31, 2014 and 2013 and from the Predecessor’s combined statement of operations for the period from January 1, 2013 through January 31, 2013 included elsewhere in this prospectus. It should be noted that the results of operations for the Successor year ended December 31, 2013 only include the results of DPC from the date of the Acquisition. Prior to the Acquisition, Axalta generated no revenue and only incurred merger and acquisition related costs and debt financing costs in anticipation of the Acquisition. We have also presented pro forma financial results for the year ended December 31, 2013 as if the Acquisition and the related Financing had occurred on January 1, 2013. We believe this information, and the related comparisons, provide a more meaningful comparison for the years presented.
| Successor | Predecessor | Pro Forma | ||||||||||||||||
| Year Ended December 31, |
Period from January 1, 2013 through January 31, |
Year Ended December 31, |
||||||||||||||||
| (in millions) |
2014 | 2013 | 2013 | 2013 | ||||||||||||||
| Net sales |
$ | 4,361.7 | $ | 3,951.1 | $ | 326.2 | $ | 4,277.3 | ||||||||||
| Other revenue |
29.8 | 35.7 | 1.1 | 36.8 | ||||||||||||||
|
|
|
|
|
|
|
|
|
|||||||||||
| Total revenue |
4,391.5 | 3,986.8 | 327.3 | 4,314.1 | ||||||||||||||
| Cost of goods sold |
2,897.2 | 2,772.8 | 232.2 | 2,909.0 | ||||||||||||||
| Selling, general and administrative expenses |
991.5 | 1,040.6 | 70.8 | 1,113.6 | ||||||||||||||
| Research and development expenses |
49.5 | 40.5 | 3.7 | 44.2 | ||||||||||||||
| Amortization of acquired intangibles |
83.8 | 79.9 | — | 86.5 | ||||||||||||||
| Merger and acquisition related expenses |
— | 28.1 | — | — | ||||||||||||||
|
|
|
|
|
|
|
|
|
|||||||||||
| Income from operations |
369.5 | 24.9 | 20.6 | 160.8 | ||||||||||||||
|
|
|
|
|
|
|
|
|
|||||||||||
| Interest expense, net |
217.7 | 215.1 | — | 234.8 | ||||||||||||||
| Bridge financing commitment fees |
— | 25.0 | — | — | ||||||||||||||
| Other expense, net |
115.0 | 48.5 | 5.0 | 34.1 | ||||||||||||||
|
|
|
|
|
|
|
|
|
|||||||||||
| Income (loss) before income taxes |
36.8 | (263.7 | ) | 15.6 | (108.1 | ) | ||||||||||||
| Provision (benefit) for income taxes |
2.1 | (44.8 | ) | 7.1 | (1.3 | ) | ||||||||||||
|
|
|
|
|
|
|
|
|
|||||||||||
| Net income (loss) |
34.7 | (218.9 | ) | 8.5 | (106.8 | ) | ||||||||||||
| Less: Net income attributable to noncontrolling interests |
7.3 | 6.0 | 0.6 | 6.6 | ||||||||||||||
|
|
|
|
|
|
|
|
|
|||||||||||
| Net income (loss) attributable to controlling interests |
$ | 27.4 | $ | (224.9 | ) | $ | 7.9 | $ | (113.4 | ) | ||||||||
|
|
|
|
|
|
|
|
|
|||||||||||
Net sales
Historical: Net sales were $4,361.7 million for the Successor year ended December 31, 2014 compared to net sales of $3,951.1 million for the Successor year ended December 31, 2013 and $326.2 million for the Predecessor period January 1, 2013 through January 31, 2013. Our net sales growth in the Successor year ended December 31, 2014 compared to the Successor year ended December 31, 2013 and Predecessor period January 1,
64
Table of Contents
2013 through January 31, 2013 was primarily driven by higher average selling prices in all regions, which contributed to net sales growth of 2.8%. In addition, volumes contributed 1.2% to net sales growth on stronger performance within North America and Asia, offset slightly by continued weakness in Latin America. This net sales growth was partially offset by the unfavorable impacts of currency exchange, which contributed to an approximately 2.0% reduction in net sales due to the impact of weakening currencies in certain jurisdictions within Latin America, Asia, and North America.
Pro Forma: Net sales increased $84.4 million, or 2.0%, to $4,361.7 million for the Successor year ended December 31, 2014, as compared to net sales of $4,277.3 million for the Pro Forma year ended December 31, 2013. Our net sales growth in the Successor year ended December 31, 2014 was primarily driven by higher average selling prices in all regions, which contributed to net sales growth of 2.8%. In addition, volumes contributed 1.2% to net sales growth on stronger performance within North America and Asia, offset slightly by continued weakness in Latin America. This net sales growth was partially offset by the unfavorable impacts of currency exchange, which contributed to an approximately 2.0% reduction in net sales due to the impact of weakening currencies in certain jurisdictions within Latin America, Asia, and North America.
Other revenue
Historical: Other revenue was $29.8 million for the Successor year ended December 31, 2014 as compared to $35.7 million for the Successor year ended December 31, 2013 and $1.1 million for the Predecessor period January 1, 2013 through January 31, 2013. The decrease primarily related to a decrease in service revenue within our light vehicle end-market. The impacts of currency exchange did not have a material impact on the comparable periods.
Pro Forma: Other revenue was $29.8 million for the Successor year ended December 31, 2014 as compared to $36.8 million for the Pro Forma year ended December 31, 2013. The decrease primarily related to a decrease in service revenue within our light vehicle end-market. The impacts of currency exchange did not have a material impact on the comparable periods.
Cost of sales
Historical: Cost of sales was $2,897.2 million for the Successor year ended December 31, 2014 compared to $2,772.8 million for the Successor year ended December 31, 2013 and $232.2 million for the Predecessor period January 1, 2013 through January 31, 2013. Cost of sales was lower during the Successor year ended December 31, 2013 compared to the Successor year ended December 31, 2014 but higher when combined with the Predecessor period January 1, 2013 through January 31, 2013, primarily as a result of increased costs of goods of $103.7 million related to fair value adjustments to inventory in conjunction with the Acquisition. Offsetting the increased costs in 2013 related to fair value adjustments to inventory is the absence of $7.9 million of incremental depreciation resulting from the fair value adjustments to property, plant and equipment in conjunction with the Acquisition, which did not impact historical depreciation for the Predecessor period from January 1, 2013 through January 31, 2013. The remaining change in cost of sales in 2014 was driven by lower raw material costs offset by higher volumes. The favorable impact of raw material prices across both our Performance Coatings and Transportation Coatings segments contributed to an approximately 2.0% impact on cost of sales as a percentage of net sales. Favorable impacts of currency exchange contributed to an additional 1.0% decrease in cost of sales as a percentage of net sales, primarily due to the impact of weakening currencies in certain jurisdictions within Latin America, Asia, and North America compared to the U.S. dollar.
Pro Forma: Cost of sales decreased $11.8 million, or 0.4%, to $2,897.2 million for the Successor year ended December 31, 2014 as compared to $2,909.0 million for the Pro Forma year ended December 31, 2013. The Pro Forma year ended December 31, 2013 is adjusted to reflect increased depreciation and the exclusion of increased costs of goods, each related to the Acquisition. As a percentage of net sales, cost of sales decreased from 68.0% to 66.4%. This decrease was driven by lower raw material costs, partially resulting from our purchasing
65
Table of Contents
initiatives, as well as product mix. The favorable impact of raw material prices impacted both our Performance Coatings and Transportation Coatings segments. Favorable impacts of currency exchange contributed to an additional 1.0% decrease in cost of sales as a percentage of net sales, primarily due to the impact of weakening currencies in certain jurisdictions within Latin America, Asia and North America compared to the U.S. dollar.
Selling, general and administrative expenses
Historical: Selling, general and administrative expenses were $991.5 million for the Successor year ended December 31, 2014 compared to $1,040.6 million for the Successor year ended December 31, 2013 and $70.8 million for the Predecessor period January 1, 2013 through January 31, 2013. During the Successor year ended December 31, 2014, we incurred $127.1 million of transition-related expenses, primarily related to our transition to a standalone company, compared to $231.5 million of transition-related expenses for the Successor year ended December 31, 2013. This resulted in a $104.4 million decrease over the comparable periods. These decreases were offset slightly by increased selling and administrative costs, as we focused on opportunities to expand our market presence. In addition, the favorable impacts of currency exchange during the Successor year ended December 31, 2014 contributed to a 1.1% decrease in selling, general and administrative expenses, primarily due to the impact of weakening currencies in certain jurisdictions within Latin America, Asia, and North America compared to the U.S. dollar.
Pro Forma: Selling, general and administrative expenses decreased $122.1 million, or 11.0%, to $991.5 million for the Successor year ended December 31, 2014, as compared to $1,113.6 million for the Pro Forma year ended December 31, 2013. During the Successor year ended December 31, 2014, we incurred $127.1 million of transition-related expenses, primarily related to our transition to a standalone company, compared to $231.8 million of transition-related expenses for the Pro Forma year ended December 31, 2013. This resulted in a $104.7 million decrease over the comparable period. Contributing to the decrease in comparable periods was a reduction in U.S. pension expense and lower actual costs for our operating structure as a standalone entity during the Successor year ended December 31, 2014. These decreases were offset slightly by increased selling and administrative costs, as we focused on opportunities to expand our market presence. In addition, the favorable impacts of currency exchange during the Successor year ended December 31, 2014 contributed to a 1.1% decrease in selling, general and administrative expenses, primarily due to the impact of weakening currencies in certain jurisdictions within Latin America, Asia, and North America compared to the U.S. dollar.
Research and development expenses
Historical: Research and development expenses were $49.5 million for the Successor year ended December 31, 2014 compared to $40.5 million for the Successor year ended December 31, 2013 and $3.7 million for the Predecessor period January 1, 2013 through January 31, 2013. These increases were driven by additional spend as we focus on developing new and existing products in the market. The impacts of currency exchange did not have a material impact on the comparable periods.
Pro Forma: Research and development expenses increased by $5.3 million, or 12.0%, to $49.5 million for the Successor year ended December 31, 2014 compared to $44.2 million for the Pro Forma year ended December 31, 2013. These increases were driven by additional spend as we focus on developing new and existing products in the market. The impacts of currency exchange did not have a material impact on the comparable periods.
Amortization of acquired intangibles
Historical: Amortization of acquired intangibles was $83.8 million for the Successor year ended December 31, 2014 compared to $79.9 million for the Successor year ended December 31, 2013 and $0.0 million for the Predecessor period January 1, 2013 through January 31, 2013. Amortization of acquired intangibles for the Successor year ended December 31, 2013 included a loss of $3.2 million associated with abandoned in-process research and development projects, all of which were recorded at fair value as part of the Acquisition. There was
66
Table of Contents
$0.1 million of comparable costs recorded during the year ended December 31, 2014. Excluding the impact of the $3.2 million loss, the increase during the Successor year ended December 31, 2014 included the impact of twelve months of amortization expense associated with purchase accounting while the Successor year ended December 31, 2013 included eleven months due to the timing of the Acquisition. The impacts of currency exchange did not have a material impact on the comparable periods.
Pro Forma: Amortization of acquired intangibles for the Successor year ended December 31, 2014 was $83.8 million and $86.5 million for the Pro Forma year ended December 31, 2013. Amortization of acquired intangibles for the Pro Forma year ended December 31, 2013 included a loss of $3.2 million associated with abandoned in-process research and development projects, all of which were recorded at fair value as part of the Acquisition. There was $0.1 million of comparable costs recorded during the year ended December 31, 2014. The impacts of currency exchange did not have a material impact on the comparable periods.
Merger and acquisition related expenses
Historical: In connection with the Acquisition, we incurred $28.1 million of merger and acquisition costs during the Successor year ended December 31, 2013. These costs consisted primarily of investment banking, legal and other professional advisory services costs. There were no comparable costs for the Successor year ended December 31, 2014.
Pro Forma: The Pro Forma year ended December 31, 2013 has been adjusted to remove the impact of these Acquisition related costs. There were no costs for the Successor year ended December 31, 2014.
Interest expense, net
Historical: Interest expense, net for the Successor year ended December 31, 2014 of $217.7 million represented a full twelve months of interest costs, including the Refinancing of our Term Loans in February of 2014. Interest expense, net for the Successor year ended December 31, 2013 of $215.1 million represented interest expense incurred during the period associated with our original debt financing for the Acquisition. The increase in 2014 primarily relates to the Successor year ended December 31, 2014 including twelve months of interest expense while the comparable 2013 periods included eleven months due to the timing of the Acquisition. Further contributing to the increase in interest expense were losses incurred on interest rate derivatives for $10.2 million during the Successor year ended December 31, 2014, compared to gains of $0.2 million during the comparable period. These increases were offset by the reduction in interest rates due to the Refinancing in February 2014 of our Senior Credit Facility combined with an additional step-down in interest rates on our term loans in August 2014. Further offsetting the increases were slight increases in capitalized interest during the Successor year ended December 31, 2014. The impacts of currency exchange did not have a material impact on the comparable periods.
Pro Forma: Interest expense, net was $217.7 million for the Successor year ended December 31, 2014 and $234.8 million for the Pro Forma year ended December 31, 2013. The Pro Forma amounts reflect the effects of the Financing as if the transaction had occurred on January 1, 2013, which resulted in an additional $19.7 million in interest for the Pro Forma year ended December 31, 2013. The decrease in the Successor year ended December 31, 2014 compared to the Pro Forma year ended December 31, 2013 primarily relates to the reduction in interest rates due to the Refinancing in February 2014 of our Senior Credit Facility combined with an additional step-down in interest rates on our term loans in August 2014. Further contributing to the decrease in comparable periods was an increase in capitalized interest during the Successor year ended December 31, 2014. Offsetting these decreases were losses incurred on interest rate derivative instruments of $10.2 million for the Successor year ended December 31, 2014 compared with gains of $0.2 million during the Pro Forma year ended December 31, 2013. The impacts of currency exchange did not have a material impact on the comparable periods.
67
Table of Contents
Bridge financing commitment fees
Historical: On August 30, 2012, we signed a debt commitment letter, which was subsequently amended and restated, that included a bridge facility comprised of $1,100.0 million of unsecured U.S. bridge loans and the Euro equivalent of $300.0 million of secured Euro bridge loans (the “Bridge Facility”), which was to be utilized to partially fund the Acquisition in the event that permanent financing was not obtained. Upon the issuance of the Senior Notes and the entry into the Senior Secured Credit Facilities, the commitments under the Bridge Facility terminated. Commitment fees related to the Bridge Facility of $21.0 million and associated legal and other professional advisory services costs of $4.0 million were expensed upon the termination during the Successor year ended December 31, 2013. There were no such costs incurred for the Successor year ended December 31, 2014.
Pro Forma: The Pro Forma year ended December 31, 2013 has been adjusted to remove the impact of these fees. There were no costs for the Successor year ended December 31, 2014.
Other expense, net
Historical: Other expense, net was $115.0 million for the Successor year ended December 31, 2014 compared to $48.5 million for the Successor year ended December 31, 2013 and $5.0 million of expense for the Predecessor period January 1, 2013 through January 31, 2013. Foreign exchange losses, net, were $81.2 million during the Successor year ended December 31, 2014 as compared to foreign exchange losses of $48.9 million and $4.5 million for the year ended December 31, 2013 and the predecessor period ended January 31, 2013, respectively. Net foreign exchange losses for the year ended December 31, 2014 consisted of $202.1 million in remeasurement losses primarily related to intercompany transactions denominated in currencies different from the functional currency of the relevant subsidiary, partially offset by $103.9 million in gains on our Euro borrowings and $17.0 million in gains related to our Venezuelan operations.
During 2014, we changed the exchange rate we use for remeasuring our Venezuelan subsidiaries’ non-U.S. Dollar denominated monetary assets and liabilities to the rate determined by an auction process conducted by Venezuela’s Complementary System of Foreign Currency Administration (SICAD I), which increased to 12.0 to 1 compared to the historical indexed rate of 6.3 to 1 at December 31, 2013. The devaluation resulted in net gains of $17.0 million for the Successor year ended December 31, 2014 due to our Venezuelan operations being in a net monetary liability position.
Contributing to expense in the Successor year ended December 31, 2013 was the adverse impact of $19.4 million of expense incurred related to the Acquisition date settlement of a foreign currency hedge contract used to hedge the variability of the U.S. dollar equivalent of the original borrowings under the Euro Term Loan and Euro Senior Notes.
Excluding the impact of the $19.4 million expense at the Acquisition date, foreign exchange losses of $29.5 million for the Successor year ended December 31, 2013 were attributable to $9.4 million in remeasurement losses primarily related to intercompany transactions denominated in currencies different from the functional currency of the relevant subsidiary and $14.6 million in remeasurement losses from the remeasurement of the Euro Senior Notes and Euro Term Loan into U.S. Dollars.
Further contributing to the increase in other expense for the Successor year ended December 31, 2014 were $16.6 million in management fees, which included a $13.4 million fee associated with the Carlyle management agreement which terminated with the effectiveness of the IPO. Additionally, during the Successor year ended December 31, 2014, we incurred debt modification fees and losses on extinguishment of debt of $3.1 million and $3.0 million, respectively. Lastly, the Successor year ended December 31, 2014 was impacted by the release of an indemnity receivable that had been recorded in conjunction with our tax indemnities from the Acquisition. This resulted in $17.8 million of expense during the Successor year ended December 31, 2014, relating to an uncertain tax position that was reversed during the Successor year ended December 31, 2014.
68
Table of Contents
Pro Forma: Other expense, net was $115.0 million for the Successor year ended December 31, 2014 as compared to $34.1 million for the Pro Forma year ended December 31, 2013, representing a change of $80.9 million, or 237.2%. The Pro Forma year ended December 31, 2013 excludes the impact of $19.4 million of costs incurred related to the Acquisition date settlement of a foreign currency hedge contract used to hedge the variability of the U.S. dollar equivalent of the original borrowings under the Euro Term Loan and Euro Senior Notes. Net foreign exchange losses of $81.2 million were recorded for the Successor year ended December 31, 2014, as compared to exchange losses of $34.0 million for the Pro Forma year ended December 31, 2013. Net foreign exchange losses for the year ended December 31, 2014 consisted of $202.1 million in translation losses primarily related to intercompany transactions denominated in currencies different from the functional currency of the relevant subsidiary, partially offset by $103.9 million in gains on our Euro borrowings and $17.0 million in gains related to our Venezuelan operations.
During 2014, we changed the exchange rate we use for remeasuring our Venezuelan subsidiaries’ non-U.S. Dollar denominated monetary assets and liabilities to the rate determined by an auction process conducted by Venezuela’s Complementary System of Foreign Currency Administration (SICAD I), which increased to 12.0 to 1 compared to the historical indexed rate of 6.3 to 1 at December 31, 2013. The devaluation resulted in net gains of $17.0 million for the Successor year ended December 31, 2014 due to our Venezuelan operations being in a net monetary liability position.
Further contributing to the increase in other expense for the Successor year ended December 31, 2014 were $16.6 million in management fees, which included a $13.4 million fee associated with the Carlyle management agreement which terminated with the effectiveness of the IPO. Additionally, during the Successor year ended December 31, 2014 we incurred debt modification fees and losses on extinguishment of debt of $3.1 million and $3.0 million, respectively. Lastly, the Successor year ended December 31, 2014 was impacted by the release of an indemnity receivable that had been recorded in conjunction with our tax indemnities from the Acquisition. This resulted in $17.8 million of expense during the Successor year ended December 31, 2014, relating to an uncertain tax position that was reversed during the Successor year ended December 31, 2014.
Provision (benefit) for income taxes
Historical: We recorded a provision for income taxes of $2.1 million for the Successor year ended December 31, 2014, which represents a 5.7% effective tax rate in relation to the income before income taxes of $36.8 million. The effective tax rate for the Successor year ended December 31, 2014 differs from the U.S. Federal statutory rate by 29.3%, which is the result of various items that impacted the rate both favorably and unfavorably. We recorded favorable adjustments for earnings in jurisdictions where the statutory rate is lower than the U.S. Federal rate of $46.7 million and unrecognized tax benefit adjustments primarily related to acquisition tax matters of $44.0 million. These adjustments were partially offset by the impact of pre-tax losses attributable to jurisdictions where a tax benefit is not expected to be realized of $44.4 million and non-deductible expenses and interest of $29.6 million.
We recorded a benefit for income taxes of $44.8 million for the Successor year ended December 31, 2013, which represents a 17.0% effective tax rate in relation to the loss before income taxes of $263.7 million. The effective tax rate for the Successor year ended December 31, 2013 differs from the U.S. Federal statutory rate by 18.0%. This difference is primarily due to unfavorable adjustments for the impact of pre-tax losses attributable to jurisdictions where a tax benefit is not expected to be realized of $55.0 million, unrecognized tax benefits primarily related to acquisition tax matters of $35.1 million and non-deductible expenses of $25.8 million. These adjustments were partially offset by the benefit of earnings in jurisdictions where the statutory tax rate was lower than the U.S. Federal statutory rate of $36.6 million and capital losses of $46.7 million.
We recorded a provision for income taxes of $7.1 million for the Predecessor period ended January 31, 2013 which represents a 45.6% effective tax rate in relation to the income before taxes of $15.6 million.
69
Table of Contents
Pro Forma: We recorded a benefit for income taxes of $1.3 million for the Pro Forma year ended December 31, 2013, which represents a 1.2% effective tax rate in relation to the pro forma loss before income taxes of $108.1 million. The variance in the pro forma effective tax rate from the historical effective tax rate, described in the corresponding historical discussion above, was primarily due to the application of statutory income tax rates to the cumulative pro forma adjustments.
Successor year ended December 31, 2013, Pro Forma year ended December 31, 2013 and Predecessor period January 1, 2013 through January 31, 2013 compared to Successor period August 24, 2012 through December 31, 2012 and the Predecessor year ended December 31, 2012
| Successor | Predecessor | Pro Forma | ||||||||||||||||||||
| Year Ended December 31, |
Period from August 24 through December 31, |
Period from January 1 through January 31, |
Year Ended December 31, |
Year Ended December 31, |
||||||||||||||||||
| (in millions) |
2013 | 2012 | 2013 | 2012 | 2013 | |||||||||||||||||
| Net sales |
$ | 3,951.1 | $ | — | $ | 326.2 | $ | 4,219.4 | $ | 4,277.3 | ||||||||||||
| Other revenue |
35.7 | — | 1.1 | 37.4 | 36.8 | |||||||||||||||||
|
|
|
|
|
|
|
|
|
|
|
|||||||||||||
| Total revenue |
3,986.8 | — | 327.3 | 4,256.8 | 4,314.1 | |||||||||||||||||
| Cost of goods sold |
2,772.8 | — | 232.2 | 2,932.6 | 2,909.0 | |||||||||||||||||
| Selling, general and administrative expenses |
1,040.6 | — | 70.8 | 873.4 | 1,113.6 | |||||||||||||||||
| Research and development expenses |
40.5 | — | 3.7 | 41.5 | 44.2 | |||||||||||||||||
| Amortization of acquired intangibles |
79.9 | — | — | — | 86.5 | |||||||||||||||||
| Merger and acquisition related expenses |
28.1 | 29.0 | — | — | — | |||||||||||||||||
|
|
|
|
|
|
|
|
|
|
|
|||||||||||||
| Income (loss) from operations |
24.9 | (29.0 | ) | 20.6 | 409.3 | 160.8 | ||||||||||||||||
|
|
|
|
|
|
|
|
|
|
|
|||||||||||||
| Interest expense, net |
215.1 | — | — | — | 234.8 | |||||||||||||||||
| Bridge financing commitment fees |
25.0 | — | — | — | — | |||||||||||||||||
| Other expense, net |
48.5 | — | 5.0 | 16.3 | 34.1 | |||||||||||||||||
|
|
|
|
|
|
|
|
|
|
|
|||||||||||||
| Income (loss) before income taxes |
(263.7 | ) | (29.0 | ) | 15.6 | 393.0 | (108.1 | ) | ||||||||||||||
| Provision (benefit) for income taxes |
(44.8 | ) | — | 7.1 | 145.2 | (1.3 | ) | |||||||||||||||
|
|
|
|
|
|
|
|
|
|
|
|||||||||||||
| Net income (loss) |
(218.9 | ) | (29.0 | ) | 8.5 | 247.8 | (106.8 | ) | ||||||||||||||
| Less: Net income attributable to noncontrolling interests |
6.0 | — | 0.6 | 4.5 | 6.6 | |||||||||||||||||
|
|
|
|
|
|
|
|
|
|
|
|||||||||||||
| Net income (loss) attributable to controlling interests |
$ | (224.9 | ) | $ | (29.0 | ) | $ | 7.9 | $ | 243.3 | $ | (113.4 | ) | |||||||||
|
|
|
|
|
|
|
|
|
|
|
|||||||||||||
Net sales
Historical: Net sales were $3,951.1 million and $326.2 million for the Successor year ended December 31, 2013 and the Predecessor period January 1, 2013 through January 31, 2013, respectively, as compared to net sales of $4,219.4 million for the Predecessor year ended December 31, 2012. Higher average selling prices across all regions contributed to net sales growth of 6.3% in the Successor year ended December 31, 2013. This growth was partially offset by volume declines during the period, which reduced net sales by 3.5%, primarily as a result of a weak economic environment in Latin America. Additionally, the unfavorable impacts of currency exchange contributed to a 1.4% reduction in net sales, primarily due to the weakening of foreign currency exchange rates within the Latin America region compared to the U.S. dollar.
Pro Forma: Net sales increased $57.9 million, or 1.4%, to $4,277.3 million for the Pro Forma year ended December 31, 2013, as compared to net sales of $4,219.4 million for the Predecessor year ended December 31, 2012. Higher average selling prices contributed to net sales growth of 6.3%. This growth was partially offset by
70
Table of Contents
volume declines during the period, which reduced net sales by 3.5%, primarily as a result of a weak economic environment in Latin America. Additionally, the unfavorable impacts of currency exchange contributed to a 1.4% reduction in net sales, primarily due to the weakening of foreign currency exchange rates within the Latin America region compared to the U.S. dollar.
Other revenue
Historical: Other revenue was $35.7 million and $1.1 million for the Successor year ended December 31, 2013 and the Predecessor period January 1, 2013 through January 31, 2013, respectively, as compared to other revenue of $37.4 million for the Predecessor year ended December 31, 2012. The impacts of currency exchange did not have a material impact on the comparable periods.
Pro Forma: Other revenue remained largely consistent at $36.8 million for the Pro Forma year ended December 31, 2013, as compared to other revenue of $37.4 million for the Predecessor year ended December 31, 2012. The impacts of currency exchange did not have a material impact on the comparable periods.
Cost of sales
Historical: Cost of sales was $2,772.8 million and $232.2 million for the Successor year ended December 31, 2013 and the Predecessor period January 1, 2013 through January 31, 2013, respectively, as compared to cost of sales of $2,932.6 million for the Predecessor year ended December 31, 2012. Cost of sales for the Successor year ended December 31, 2013 reflected increased depreciation expense of $73.4 million resulting from the fair value adjustments to property, plant and equipment in conjunction with the Acquisition. Cost of sales was also negatively impacted in 2013 by increased costs of goods of $103.7 million resulting from the fair value adjustments to inventory in conjunction with the Acquisition. Included in the Predecessor year ended December 31, 2012 was a $19.1 million benefit due to the last-in-first-out “LIFO” method of inventory accounting. In addition to the impacts from purchase accounting, cost of sales was also favorably impacted by the reduction in costs incurred in the Successor period operating structure versus those previously allocated by DuPont during the Predecessor year ended December 31, 2012. This includes the impacts of the defined benefit pension obligations for U.S. employees in connection with the Acquisition, which resulted in a net reduction in U.S. employee fringe costs compared to the Predecessor year ended December 31, 2012. The remaining decrease was primarily due to lower raw material costs across most regions and product lines as well as impacts from foreign currency exchange rates. The favorable impact of raw material prices across both our Performance Coatings and Transportation Coatings segments contributed to an approximately 0.3% impact on cost of sales as a percentage of net sales. Favorable impacts of currency exchange contributed to a 0.4% decrease in cost of goods sold, primarily due to the weakening of foreign currency exchange rates within the Latin America region compared to the U.S. dollar.
Pro Forma: Cost of sales decreased $23.6 million, or 0.8%, to $2,909.0 million for the Pro Forma year ended December 31, 2013 as compared to $2,932.6 million for the Predecessor year ended December 31, 2012. The Pro Forma year ended December 31, 2013 was adjusted to include the impact of $7.9 million of increased depreciation for the Predecessor period January 1, 2013 through January 31, 2013 and to exclude $103.7 million of increased costs of goods related to the Acquisition. As a percentage of net sales, cost of sales decreased from 69.5% to 68.0%. This decrease was primarily due to lower raw material costs across most regions and product lines. The favorable impact of raw material prices across both our Performance Coatings and Transportation Coatings segments contributed to an approximately 0.3% impact on cost of sales as a percentage of net sales. Cost of sales was also favorably impacted by the reduction in costs incurred in our current operating structure versus those previously allocated by DuPont during the Predecessor year ended December 31, 2012. Further, we did not assume defined benefit pension obligations for U.S. employees in connection with the Acquisition, which resulted in a net reduction in U.S. employee fringe costs compared to the Predecessor year ended December 31, 2012. These decreases were slightly offset by the $19.1 million benefit included in the Predecessor year ended December 31, 2012 due to the LIFO method of inventory accounting, as well as the impact in the Successor year
71
Table of Contents
ended December 31, 2013 of increased depreciation expense of $81.3 million resulting from the fair value adjustments to property, plant and equipment in conjunction with the Acquisition. Favorable impacts of currency exchange contributed to a 0.4% decrease in cost of goods sold, primarily due to the weakening of foreign currency exchange rates within the Latin America region compared to the U.S. dollar.
Selling, general and administrative expenses
Historical: Selling, general and administrative expenses were $1,040.6 million and $70.8 million for the Successor year ended December 31, 2013 and the Predecessor period January 1, 2013 through January 31, 2013, respectively, as compared to selling, general and administrative expenses of $873.4 million for the Predecessor year ended December 31, 2012. The increase in 2013 was primarily the result of $231.5 million of transition-related expenses we incurred during the Successor year ended December 31, 2013, primarily due to 2013 termination benefits and other employee related costs of $147.5 million and consulting and advisory costs of $54.7 million related to our initial separation and transition to a standalone company. Selling, general and administrative expenses were also adversely impacted by increased depreciation expense of approximately $23.1 million resulting from the fair value adjustments to non-manufacturing assets in conjunction with the Acquisition. Favorable impacts of currency exchange, primarily due to the weakening of foreign currency exchange rates within the Latin America region compared to the U.S. dollar, contributed to an approximately 1.0% decrease in selling, general and administrative expenses. These increases were offset slightly by a reduction in U.S. pension expense and lower actual costs for our operating structure as a standalone entity.
Pro Forma: Selling, general and administrative expenses increased $240.2 million, or 27.5%, to $1,113.6 million for the Pro Forma year ended December 31, 2013, as compared to $873.4 million for the Predecessor year ended December 31, 2012. The Pro Forma year ended December 31, 2013 is adjusted to reflect the increased depreciation expense resulting from the fair value adjustments to non-manufacturing assets in conjunction with the Acquisition. This increase was primarily driven by the $231.8 million of transition-related costs incurred during the Pro Forma year ended December 31, 2013, primarily due to 2013 termination benefits and other employee related costs of $147.8 million, and consulting and advisory costs of $54.7 million related to our transition to a standalone company. Additionally, we incurred $25.3 million in additional depreciation expense associated with fair value adjustments to non-manufacturing assets in conjunction with the Acquisition. Favorable impacts of currency exchange, primarily due to the weakening of foreign currency exchange rates within the Latin America region compared to the U.S. dollar, contributed to an approximately 1.0% decrease in selling, general and administrative expenses. These increases were offset slightly by approximately $16.9 million reduction in U.S. pension expense and lower actual costs for our operating structure as a standalone entity.
Research and development expenses
Historical: Research and development expense was $40.5 million and $3.7 million for the Successor year ended December 31, 2013 and the Predecessor period January 1, 2013 through January 31, 2013, respectively, as compared to research and development expense of $41.5 million for the Predecessor year ended December 31, 2012. Research and development expense compared to the Predecessor year ended December 31, 2012 increased due to focused spending on growth projects. This increase was partially offset by a decrease in allocations of costs of $2.1 million for the Successor year ended December 31, 2013 compared to the Predecessor year ended December 31, 2012, representing costs associated with the DuPont Corporate research and development activities in 2012. In addition, favorable impacts of currency exchange contributed to a 0.7% decrease in research and development expense, primarily due to the weakening of foreign currency exchange rates within the Latin America region compared to the U.S. dollar.
Pro Forma: Research and development expense increased $2.7 million, or 6.5%, for the Pro Forma year ended December 31, 2013 to $44.2 million compared to $41.5 million for the Predecessor year ended December 31, 2012. Research and development expense for the Pro Forma year ended December 31, 2013 increased due to focused spending on growth projects. This increase was partially offset by a decrease in allocations of costs of
72
Table of Contents
$2.1 million for the Pro Forma year ended December 31, 2013 compared to the Predecessor year ended December 31, 2012 representing costs associated with the DuPont Corporate research and development activities in 2012. Favorable impacts of currency exchange contributed to a 0.7% decrease in research and development expense, primarily due to the weakening of foreign currency exchange rates within the Latin America region compared to the U.S. dollar.
Amortization of acquired intangibles
Historical: Amortization of acquired intangibles was $79.9 million for the Successor year ended December 31, 2013. Amortization of acquired intangibles in the Successor year ended December 31, 2013 includes a loss of $3.2 million associated with abandoned acquired in-process research and development projects, all of which was related to the Acquisition. There were no comparable costs recorded in the Predecessor period January 1, 2013 through January 31, 2013 and the Predecessor year ended December 31, 2012.
Pro Forma: Amortization of acquired intangibles was $86.5 million for the Pro Forma year ended December 31, 2013. Amortization expense for the Pro Forma year ended December 31, 2013 has been adjusted to reflect amortization expense for January 2013. There were no comparable costs recorded in the Predecessor year ended December 31, 2012. The impacts of currency exchange did not have a material impact on the comparable periods.
Merger and acquisition related costs
Historical: In connection with the Acquisition, we incurred $28.1 million and $29.0 million of merger and acquisition costs during the Successor year ended December 31, 2013 and the Successor period August 24, 2012 through December 31, 2012, respectively. These costs consisted primarily of investment banking, legal and other professional advisory services costs. There were no such costs associated with the Predecessor period January 1, 2013 through January 31, 2013 or the Predecessor year ended December 31, 2012. The impacts of currency exchange did not have a material impact on the comparable periods.
Pro Forma: The Pro Forma year ended December 31, 2013 has been adjusted to remove the impact of these Acquisition related costs. There were no comparable costs recorded in the Predecessor year ended December 31, 2012.
Interest expense, net
Historical: Interest expense, net was $215.1 million for the Successor year ended December 31, 2013. There was no interest expense for the Predecessor year ended December 31, 2012 or the Predecessor period January 1, 2013 through January 31, 2013. The increase in interest expense, net was due to interest costs associated with the debt financing for the Acquisition and the liquidity requirements of a standalone entity.
Pro Forma: Interest expense, net for the Pro Forma year ended December 31, 2013 of $234.8 million has been adjusted to reflect interest expense for January 2013, which resulted in an additional $19.7 million in interest for the Pro Forma year ended December 31, 2013. There was no interest expense for the Predecessor year ended December 31, 2012.
Bridge financing commitment fees
Historical: Commitment fees related to the Bridge Facility of $21.0 million and associated legal and other professional advisory services costs of $4.0 million were expensed upon termination of the Bridge Facility during the Successor period ended December 31, 2013. There were no such costs associated with the Predecessor period January 1, 2013 through January 31, 2013 and the Predecessor year ended December 31, 2012.
73
Table of Contents
Pro Forma: The Pro Forma year ended December 31, 2013 has been adjusted to remove the impact of these fees. There were no comparable costs recorded in the Predecessor year ended December 31, 2012.
Other expense, net
Historical: Other expense, net was $48.5 million and $5.0 million for the Successor year ended December 31, 2013 and for the Predecessor period January 1, 2013 through January 31, 2013, respectively, as compared to $16.3 million for the Predecessor year ended December 31, 2012. Other expense, net during the Successor year ended December 31, 2013 primarily consists of net foreign exchange losses from intercompany transactions denominated in currencies different from the functional currency of the subsidiary involved in the transaction. In addition, the increase partially resulted from a $19.4 million loss related to the Acquisition date settlement of a foreign currency hedge contract used to hedge the variability of the U.S. dollar equivalent of the original borrowings under the Euro Term Loan and Euro Senior Notes, and the impact of the strengthening Euro against our Euro Borrowings.
Pro Forma: Other expense, net increased $17.8 million, or 109.2%, for the Pro Forma year ended December 31, 2013 to $34.1 million compared to $16.3 million for the Predecessor year ended December 31, 2012. The Pro Forma year ended December 31, 2013 excludes the impact of $19.4 million of a loss related to the Acquisition date settlement of a foreign currency hedge contract used to hedge the variability of the U.S. dollar equivalent of the original borrowings under the Euro Term Loan and Euro Senior Notes. Net foreign exchange losses of $34.0 million were recorded for the Pro Forma year ended December 31, 2013, as compared to a loss of $17.7 million for the Predecessor year ended December 31, 2012.
During the Pro Forma year ended December 31, 2013, we incurred net unrealized foreign exchange losses of $9.4 million on the remeasurement of intercompany loans. In addition, we incurred unrealized foreign exchange losses of $14.6 million related to the remeasurement of the Euro Senior Notes and Euro Term Loan into U.S. dollars. The remaining foreign exchange losses primarily related to the remeasurement of other assets and liabilities denominated in currencies other than the functional currency of the affected subsidiaries.
Provision (benefit) for income taxes
Historical: We recorded a benefit for income taxes of $44.8 million for the Successor year ended December 31, 2013, which represents a 17.0% effective tax rate in relation to the loss before income taxes of $263.7 million. The effective tax rate for the Successor year ended December 31, 2013 differs from the U.S. Federal statutory rate by 18.0%. This difference is primarily due to unfavorable adjustments for the impact of pre-tax losses attributable to jurisdictions where a tax benefit is not expected to be realized of $55.0 million, unrecognized tax benefits primarily related to acquisition tax matters of $35.1 million and non-deductible expenses of $25.8 million. These adjustments were partially offset by the benefit of earnings in jurisdictions where the statutory tax rate was lower than the U.S. Federal statutory rate of $36.6 million and capital losses of $46.7 million.
We recorded a provision for income taxes of $145.2 million for the Predecessor year ended December 31, 2012 which represents a 37.0% effective tax rate in relation to the income before taxes of $393.0 million. The effective tax rate for the Predecessor year ended December 31, 2012 differs from the U.S. federal statutory rate by 2.0%. This difference is primarily due to the unfavorable impact of pre-tax losses attributable to jurisdictions where a tax benefit is not expected to be realized of $9.8 million, as well as a $4.7 million impact related to non-deductible net foreign exchange losses. This is offset by the benefit of earnings in jurisdictions where the statutory tax rate was lower than the U.S. Federal statutory rate of $10.9 million.
Pro Forma: We recorded a benefit for income taxes of $1.3 million for the Pro Forma year ended December 31, 2013, which represents a 1.2% effective tax rate in relation to the pro forma loss before income taxes of $108.1 million. The variance in the pro forma effective tax rate from the historical effective tax rate, described in the
74
Table of Contents
corresponding historical discussion above, was primarily due to the application of statutory income tax rates to the cumulative pro forma adjustments.
Selected Segment Information
Successor year ended December 31, 2014 compared to the Successor year ended December 31, 2013 and Predecessor period January 1, 2013 through January 31, 2013, and Successor year ended December 31, 2014 compared to the Pro Forma year ended December 31, 2013
The following table presents net sales by segment and segment Adjusted EBITDA for the following periods:
| Successor | Predecessor | Pro Forma | ||||||||||||||||
| Year Ended December 31, |
Period from January 1 through January 31, |
Year Ended December 31, |
||||||||||||||||
| (in millions) |
2014 | 2013 | 2013 | 2013 | ||||||||||||||
| Net Sales |
||||||||||||||||||
| Performance Coatings |
$ | 2,585.0 | $ | 2,325.3 | $ | 186.8 | $ | 2,512.1 | ||||||||||
| Transportation Coatings |
1,776.7 | 1,625.8 | 139.4 | 1,765.2 | ||||||||||||||
|
|
|
|
|
|
|
|
|
|||||||||||
| Total |
$ | 4,361.7 | $ | 3,951.1 | $ | 326.2 | $ | 4,277.3 | ||||||||||
|
|
|
|
|
|
|
|
|
|||||||||||
| Segment Adjusted EBITDA(1)(2) |
||||||||||||||||||
| Performance Coatings |
$ | 547.6 | $ | 500.2 | $ | 15.0 | $ | 518.7 | ||||||||||
| Transportation Coatings |
292.9 | 198.8 | 17.7 | 218.9 | ||||||||||||||
|
|
|
|
|
|
|
|
|
|||||||||||
| Total |
$ | 840.5 | $ | 699.0 | $ | 32.7 | $ | 737.6 | ||||||||||
|
|
|
|
|
|
|
|
|
|||||||||||
| (1) | For additional information regarding Segment Adjusted EBITDA, see Note 25 to our Audited Consolidated and Combined Financial Statements appearing elsewhere in this prospectus. |
| (2) | For information about Adjusted EBITDA, including the manner in which it is calculated and a reconciliation from our net income (loss) to Adjusted EBITDA see “Prospectus Summary—Summary Historical and Pro Forma Financial Information.” The Segment Adjusted EBITDA information for the Pro Forma year ended December 31, 2013 includes (a) the add-back of corporate allocations from DuPont to DPC for the usage of DuPont’s facilities, functions and services; costs for administrative functions and services performed on behalf of DPC by centralized staff groups within DuPont; a portion of DuPont’s general corporate expenses; and certain pension and other long-term employee benefit costs net of (b) estimated standalone costs based on a corporate function resource analysis that included a standalone executive office, the costs associated with supporting a standalone information technology infrastructure, corporate functions such as legal, finance, treasury, procurement and human resources and certain costs related to facilities management. This resource analysis included anticipated headcount and the associated overhead costs of running these functions effectively as a standalone company of our size and complexity. This resulted in a net benefit of $5.7 million for the Predecessor period January 1, 2013 through January 31, 2013. |
Performance Coatings Segment
Historical: Net sales were $2,585.0 million for the Successor year ended December 31, 2014 compared to net sales of $2,325.3 million for the Successor year ended December 31, 2013 and $186.8 million for the Predecessor period January 1, 2013 through January 31, 2013. The increase in net sales in the Successor year ended December 31, 2014 was primarily driven by volume growth, which contributed to a net sales increase of 3.1%, as well as higher average selling prices, which contributed to a net sales increase of 1.9%. Net sales growth was partially offset by the unfavorable impacts of currency exchange, which contributed to an approximately 2.1% reduction in net sales resulting primarily from the impacts of weakening currencies in certain jurisdictions within Latin America and Asia.
75
Table of Contents
Adjusted EBITDA was $547.6 million for the Successor year ended December 31, 2014 compared to Adjusted EBITDA of $500.2 million for the Successor year ended December 31, 2013 and $15.0 million for the Predecessor period January 1, 2013 through January 31, 2013. The increase in Adjusted EBITDA in the Successor year ended December 31, 2014 was driven by higher volumes and higher average selling price as well as lower raw material input costs slightly offset by higher operating costs. In addition, the absence of the Predecessor corporate allocated costs in January 2013 contributed an approximate $3.4 million benefit.
Pro Forma: Net sales increased $72.9 million, or 2.9%, to $2,585.0 million for the Successor year ended December 31, 2014, as compared to net sales of $2,512.1 million for the Pro Forma year ended December 31, 2013. The increase in net sales in the Successor year ended December 31, 2014 was primarily driven by volume growth, which contributed to a net sales increase of 3.1%, as well as higher average selling prices, which contributed to a net sales increase of 1.9%. Net sales growth was partially offset by the unfavorable impacts of currency exchange, which contributed to an approximately 2.1% reduction in net sales resulting primarily from the impacts of weakening currencies in certain jurisdictions within Latin America and Asia.
Adjusted EBITDA increased $28.9 million, or 5.6%, to $547.6 million for the Successor year ended December 31, 2014 as compared to $518.7 million for the Pro Forma year ended December 31, 2013. As a percentage of net sales, Adjusted EBITDA increased to 21.2% from 20.6%. The increase was driven by higher volumes and higher average selling price as well as lower raw material input costs offset slightly by higher operating costs.
Transportation Coatings Segment
Historical: Net sales were $1,776.7 million for the Successor year ended December 31, 2014 compared to net sales of $1,625.8 million for the Successor year ended December 31, 2013 and $139.4 million for the Predecessor period January 1, 2013 through January 31, 2013. The increase in net sales in the Successor year ended December 31, 2014 was primarily driven by higher average selling prices, which contributed to net sales growth of 4.0%. This increase was partially offset by volume declines, primarily concentrated in the Latin America region, which contributed to a net sales decline of 1.4%. Unfavorable currency exchange rates also contributed to a reduction to net sales of 1.9% resulting primarily from the impacts of weakening currencies in certain jurisdictions primarily within Latin America.
Adjusted EBITDA was $292.9 million for the Successor year ended December 31, 2014 compared to Adjusted EBITDA of $198.8 million for the Successor year ended December 31, 2013 and $17.7 million for the Predecessor period January 1, 2013 through January 31, 2013. The increase in Adjusted EBITDA in the Successor year ended December 31, 2014 was driven by higher average selling prices as well as lower fixed manufacturing costs, partially resulting from our operational improvement initiatives. In addition, the absence of the Predecessor corporate allocated costs contributed an approximate $2.3 million benefit.
Pro Forma: Net sales increased $11.5 million, or 0.7%, to $1,776.7 million for the year ended December 31, 2014, as compared to net sales of $1,765.2 million for the Pro Forma year ended December 31, 2013. The increase in net sales for the year ended December 31, 2014 as compared to the Pro Forma year ended December 31, 2013 was primarily driven by higher average selling prices, which contributed to net sales growth of 4.0%. This increase was partially offset by declining volumes primarily concentrated in the Latin America region, which contributed to a net sales decline of 1.4%. Unfavorable currency exchange rates also contributed to a reduction to net sales of 1.9% resulting primarily from the impacts of weakening currencies in certain jurisdictions primarily within Latin America.
Adjusted EBITDA increased $74.0 million, or 33.8%, to $292.9 million for the year ended December 31, 2014 as compared to $218.9 million for the Pro Forma year ended December 31, 2013. As a percentage of net sales, Adjusted EBITDA increased to 16.5% from 12.4%. This increase was driven by higher average selling prices as well as lower fixed manufacturing costs, partially resulting from our operational improvement initiatives.
76
Table of Contents
Successor year ended December 31, 2013, Pro Forma year ended December 31, 2013 and Predecessor period January 1, 2013 through January 31, 2013 compared to the Predecessor year ended December 31, 2012
The following table presents net sales by segment and segment Adjusted EBITDA for the following periods:
| Successor | Predecessor | Pro Forma | ||||||||||||||||
| Year Ended December 31, |
Period from January 1 through January 31, |
Year Ended December 31, |
Year Ended December 31, |
|||||||||||||||
| (in millions) |
2013 | 2013 | 2012 | 2013 | ||||||||||||||
| Net Sales |
||||||||||||||||||
| Performance Coatings |
$ | 2,325.3 | $ | 186.8 | $ | 2,479.5 | $ | 2,512.1 | ||||||||||
| Transportation Coatings |
1,625.8 | 139.4 | 1,739.9 | 1,765.2 | ||||||||||||||
|
|
|
|
|
|
|
|
|
|||||||||||
| Total |
$ | 3,951.1 | $ | 326.2 | $ | 4,219.4 | $ | 4,277.3 | ||||||||||
|
|
|
|
|
|
|
|
|
|||||||||||
| Segment Adjusted EBITDA(1)(2) |
||||||||||||||||||
| Performance Coatings |
$ | 500.2 | $ | 15.0 | $ | 426.0 | $ | 518.7 | ||||||||||
| Transportation Coatings |
198.8 | 17.7 | 151.6 | 218.9 | ||||||||||||||
|
|
|
|
|
|
|
|
|
|||||||||||
| Total |
$ | 699.0 | $ | 32.7 | $ | 577.6 | $ | 737.6 | ||||||||||
|
|
|
|
|
|
|
|
|
|||||||||||
| (1) | For additional information regarding Segment Adjusted EBITDA, see Note 25 to our Audited Consolidated and Combined Financial Statements appearing elsewhere in this prospectus. |
| (2) | For information about Adjusted EBITDA, including the manner in which it is calculated and a reconciliation from our net income (loss) to Adjusted EBITDA see “Prospectus Summary—Summary Historical and Pro Forma Financial Information.” The Segment Adjusted EBITDA information for the Pro Forma year ended December 31, 2013 includes (a) the add-back of corporate allocations from DuPont to DPC for the usage of DuPont’s facilities, functions and services; costs for administrative functions and services performed on behalf of DPC by centralized staff groups within DuPont; a portion of DuPont’s general corporate expenses; and certain pension and other long-term employee benefit costs net of (b) estimated standalone costs based on a corporate function resource analysis that included a standalone executive office, the costs associated with supporting a standalone information technology infrastructure, corporate functions such as legal, finance, treasury, procurement and human resources and certain costs related to facilities management. This resource analysis included anticipated headcount and the associated overhead costs of running these functions effectively as a standalone company of our size and complexity. This resulted in a net benefit of $5.7 million for the Predecessor period January 1, 2013 through January 31, 2013. The Predecessor year ended December 31, 2012 does not include $84.2 million in net benefits related to these costs. |
Performance Coatings Segment
Historical: Net sales were $2,325.3 million and $186.8 million for the Successor year ended December 31, 2013 and the Predecessor period January 1, 2013 through January 31, 2013, respectively, as compared to net sales of $2,479.5 million for the Predecessor year ended December 31, 2012. Net sales growth for the Predecessor period January 1, 2013 through January 31, 2013 and the Successor year ended December 31, 2013 was primarily driven by higher average selling prices, which contributed to net sales growth of 5.9%. These increases were offset by lower volumes, which decreased net sales by 3.4%. Weakening foreign currency exchange rates compared to the U.S. dollar primarily related to certain currencies within the Latin America region also had a negative impact on sales of 1.2%.
Adjusted EBITDA was $500.2 million and $15.0 million for the Successor year ended December 31, 2013 and the Predecessor period January 1, 2013 through January 31, 2013, respectively, compared to Adjusted EBITDA
77
Table of Contents
of $426.0 million for the Predecessor year ended December 31, 2012. This increase was driven primarily by the absence of $77.6 million in the Predecessor year ended December 31, 2012 related to the add-back of corporate allocations from DuPont to DPC for estimated standalone entity benefits. The remaining increase was driven by lower raw material input costs and fixed manufacturing costs, partially resulting from our purchasing and operational improvement initiatives and price increases. These factors were slightly offset by the negative impact of weakening foreign currency exchange rates compared to the U.S. dollar, which were primarily related to certain currencies within the Latin America region, and contributed to a reduction in Adjusted EBITDA.
Pro Forma: Net sales increased $32.6 million, or 1.3%, to $2,512.1 million for the Pro Forma year ended December 31, 2013, as compared to net sales of $2,479.5 million for the Predecessor year ended December 31, 2012. Net sales growth was primarily driven by higher average selling prices, which contributed to net sales growth of 5.9%. These increases were offset by lower volumes, which decreased net sales by 3.4%. Weakening foreign currency exchange rates compared to the U.S. dollar primarily related to certain currencies within the Latin America region also had a negative impact on sales of 1.2%.
Adjusted EBITDA increased $92.7 million, or 21.8%, to $518.7 million for the Pro Forma year ended December 31, 2013 as compared to $426.0 million for the Predecessor year ended December 31, 2012. As a percentage of net sales, Adjusted EBITDA increased to 20.6% from 17.2%. This increase was driven by lower raw material input costs and fixed manufacturing costs, partially resulting from our purchasing and operational improvement initiatives and price increases. These factors were slightly offset by the negative impact of weakening foreign currency exchange rates compared to the U.S. dollar, which were primarily related to certain currencies within the Latin America region, and contributed to a reduction in Adjusted EBITDA.
Transportation Coatings Segment
Historical: Net sales were $1,625.8 million and $139.4 million for the Successor year ended December 31, 2013 and the Predecessor period January 1, 2013 through January 31, 2013, respectively, as compared to net sales of $1,739.9 million for the Predecessor year ended December 31, 2012. Net sales growth for the Predecessor period January 1, 2013 through January 31, 2013 and the Successor year ended December 31, 2013 was primarily driven by higher average selling prices, which contributed to a 6.8% net sales growth. Lower sales volumes contributed to a net sales decline of 3.7%, and the negative currency impact from weakening foreign currency exchange rates compared to the U.S. dollar primarily related to certain currencies within the Latin America region contributed to a net sales decline of 1.6%.
Adjusted EBITDA was $198.8 million and $17.7 million for the Successor year ended December 31, 2013 and the Predecessor period January 1, 2013 through January 31, 2013, respectively, compared to Adjusted EBITDA of $151.6 million for the Predecessor year ended December 31, 2012. The increase in Adjusted EBITDA from the Predecessor year ended December 31, 2012 was primarily driven by selective price increases as well as the absence of $6.6 million related to the add-back of corporate allocations from DuPont to DPC for estimated standalone entity benefits. Additionally, unfavorable currency exchange rates, which were primarily concentrated in the Latin America region, slightly offset these increases, and contributed to a reduction in Adjusted EBITDA.
Pro Forma: Net sales increased $25.3 million, or 1.5%, to $1,765.2 million for the Pro Forma year ended December 31, 2013, as compared to net sales of $1,739.9 million for the Predecessor year ended December 31, 2012. Net sales growth was primarily driven by higher average selling prices, which contributed to a 6.8% net sales growth. Lower sales volumes contributed to a net sales decline of 3.7%, and the negative currency impact from weakening foreign currency exchange rates compared to the U.S. dollar primarily related to certain currencies within the Latin America region contributed to a net sales decline of 1.6%.
Pro Forma: Adjusted EBITDA increased $67.3 million, or 44.4%, to $218.9 million for the Pro Forma year ended December 31, 2013 as compared to $151.6 million for the Predecessor year ended December 31, 2012. As a percentage of net sales, Adjusted EBITDA increased to 12.4% from 8.7%, driven primarily by selective price
78
Table of Contents
increases. Unfavorable currency exchange rates, which were primarily concentrated in the Latin America region, slightly offset these increases, and contributed to a reduction in Adjusted EBITDA.
Liquidity and Capital Resources
February 2013 DPC Acquisition and Related Financing
On August 30, 2012, Axalta Bermuda entered into a purchase agreement (the “Acquisition Agreement”) with DuPont pursuant to which Axalta Bermuda and certain of its indirect subsidiaries acquired DPC, including certain assets of DPC and all of the capital stock and other equity interests of certain entities engaged in the DPC business, from DuPont for a purchase price of $4,925.9 million plus or minus a working capital and pension adjustment. On February 1, 2013, Axalta Bermuda completed the acquisition of DPC. The Company and DuPont finalized the working capital and pension adjustments to the purchase price during the year ended December 31, 2013, which resulted in a reduction to the purchase price of $18.6 million to $4,907.3 million.
The purchase price was funded by (i) the Equity Contribution, (ii) proceeds from Senior Secured Credit Facilities consisting of a $2,300.0 million Dollar Term Loan facility and a €400.0 million Euro Term Loan facility and (iii) proceeds from the issuance of $750.0 million aggregate principal amount of Dollar Senior Notes and the issuance of €250.0 million Euro Senior Notes.
At December 31, 2014, availability under the Revolving Credit Facility was $384.5 million, which reflects $15.5 million of issued letters of credit that reduce availability. All such availability may be utilized without violating any covenants under the credit agreement governing such facility or the indentures governing the Dollar Senior Notes and the Euro Senior Notes. At December 31, 2014, our available borrowing capacity under other lines of credit in certain non-U.S. jurisdictions totaled $20.0 million.
79
Table of Contents
Cash Flows
Successor years ended December 31, 2014 and 2013 as well as the Successor period from August 24 through December 31, 2012 and Predecessor year ended December 31, 2012 and Predecessor period from January 1 through January 31, 2013
| Successor | Predecessor | |||||||||||||||||||
| (in millions) |
Year Ended December 31, |
Period from August 24 through December 31, |
Period from January 1 through January 31, |
Year Ended December 31, |
||||||||||||||||
| 2014 | 2013 | 2012 | 2013 | 2012 | ||||||||||||||||
| Net cash provided by (used in): |
||||||||||||||||||||
| Operating activities: |
||||||||||||||||||||
| Net income (loss) |
$ | 34.7 | $ | (218.9 | ) | $ | (29.0 | ) | $ | 8.5 | $ | 247.8 | ||||||||
| Depreciation and amortization |
308.7 | 300.7 | — | 9.9 | 110.7 | |||||||||||||||
| Deferred income taxes |
(38.2 | ) | (120.8 | ) | — | 9.1 | 9.1 | |||||||||||||
| Amortization of financing costs and original issue discount |
21.0 | 18.4 | — | — | — | |||||||||||||||
| Fair value of acquired inventory sold |
— | 103.7 | — | — | — | |||||||||||||||
| Foreign exchange losses |
75.1 | 48.9 | — | 4.5 | — | |||||||||||||||
| Bridge financing commitment fees |
— | 25.0 | — | — | — | |||||||||||||||
| Other non-cash items |
(11.2 | ) | 20.6 | — | (3.9 | ) | 7.6 | |||||||||||||
|
|
|
|
|
|
|
|
|
|
|
|||||||||||
| Net income (loss) adjusted for non-cash items |
390.1 | 177.6 | (29.0 | ) | 28.1 | 375.2 | ||||||||||||||
| Changes in operating assets and liabilities |
(138.7 | ) | 199.2 | 29.0 | (65.8 | ) | 13.6 | |||||||||||||
|
|
|
|
|
|
|
|
|
|
|
|||||||||||
| Operating activities |
251.4 | 376.8 | — | (37.7 | ) | 388.8 | ||||||||||||||
| Investing activities |
(178.5 | ) | (5,011.2 | ) | — | (8.3 | ) | (88.2 | ) | |||||||||||
| Financing activities |
(123.2 | ) | 5,098.1 | — | 43.0 | (290.6 | ) | |||||||||||||
| Effect of exchange rate changes on cash |
(26.9 | ) | (4.4 | ) | — | — | (0.1 | ) | ||||||||||||
|
|
|
|
|
|
|
|
|
|
|
|||||||||||
| Net increase (decrease) in cash and cash equivalents |
$ | (77.2 | ) | $ | 459.3 | $ | — | $ | (3.0 | ) | $ | 9.9 | ||||||||
|
|
|
|
|
|
|
|
|
|
|
|||||||||||
Year ended December 31, 2014 (Successor)
Net Cash Provided by Operating Activities
Net cash provided by operating activities for the year ended December 31, 2014 was $251.4 million. Net income before deducting depreciation, amortization and other non-cash items generated cash of $390.1 million. This was partially offset by net increases in working capital of $138.7 million. The most significant drivers in working capital were increases in receivables, inventory and other assets of $119.0 million due primarily to increased net sales and inventory builds to support ongoing operational demands compared to the year ended December 31, 2013, as well as, reductions of other accrued liabilities of $54.8 million primarily related to the payment of nonrecurring transition-related costs, including restructuring costs, partially offset by a $53.6 million increase in accounts payable.
Net Cash Used for Investing Activities
Net cash used for investing activities for the year ended December 31, 2014 was $178.5 million. This use was driven primarily by purchases of property, plant and equipment of $188.4 million, the purchase of increased ownership in a majority owned joint venture of $6.5 million and an increase of $4.7 million in restricted cash, partially offset by $21.3 million of proceeds from sales of assets. Purchases of property, plant and equipment includes approximately $74.8 million associated with our transition-related capital projects including our information technology systems and finalization of our transition of our global office relocations.
80
Table of Contents
Net Cash Used for Financing Activities
Net cash used for financing activities for the year ended December 31, 2014 was $123.2 million. The change was primarily driven by repayments of term loans of $121.1 million. These payments were comprised of a $100.0 million prepayment on our Dollar Term Loan made during the year ended December 31, 2014, along with $21.1 million of quarterly principal repayments as required under the Credit Agreement. In addition, we repaid short-term borrowings of $33.8 million partially offset by proceeds received from short-term borrowing during the period of $30.7 million. During the year ended December 31, 2014, we paid $3.0 million in fees related to the amendment of the Senior Secured Credit Facilities.
We received $2.5 million through the sale of common shares during the year ended December 31, 2014. We also received $3.0 million related to the exercise of stock options.
Dividends paid to noncontrolling interests totaled $2.2 million for the year ended December 31, 2014.
Year ended December 31, 2013 (Successor)
Net Cash Provided by Operating Activities
Cash provided by operating activities was $376.8 million for the Successor year ended December 31, 2013. The cash flow from operations was the result of cash flows generated by operating earnings and reductions in net working capital, partially offset by merger and acquisition related costs and transition costs associated with our separation from DuPont. An increase in trade and notes receivable was due largely to higher sales levels during the Successor year ended December 31, 2013 resulted in an outflow of cash of $6.4 million. A decrease in inventories resulted in a generation of cash of $33.9 million. The decrease in inventories was primarily the result of the continued focus on working capital levels relative to demand and lower raw material costs. An increase in accounts payable favorably impacted cash flow from operations by $67.1 million. The increase in accounts payable was due in part to the separation from DuPont in February 2013, which resulted in the establishment of new credit terms with our new vendors as a standalone company, including certain raw materials contracts with DuPont, which were historically related party purchases in the Predecessor period. Prior to the Acquisition, transactions between DuPont and DPC were deemed to be settled immediately through the parent company net investment. Further contributing to the cash flows provided by operating activities was an increase in accrued liabilities of $193.1 million related to the timing of cash payments for annual employee performance related benefits, which were paid by DuPont for the 2012 performance period. The remaining increases in accrued liabilities had no impact on cash flows from operations, including severance-related liabilities and transition-related expenses, which had been accrued as of December 31, 2013 and had an offsetting impact within Net income (loss). Offsetting this operating activity was cash used in operating activities related to the restructuring activities during the year ended December 31, 2013, for which $23.7 million of payments were made.
Net Cash Used for Investing Activities
During the Successor year ended December 31, 2013, we acquired DPC for a purchase price of $4,907.3 million. Cash acquired was $79.7 million, which resulted in a net cash outflow of $4,827.6 million to acquire DPC.
During the Successor year ended December 31, 2013, we entered into a foreign currency contract to hedge the variability of the U.S. dollar equivalent of the original borrowings under the Euro Term Loan and the proceeds from the issuance of Euro Senior Notes. Net cash used to settle the derivative instrument was $19.4 million. Additionally, we purchased a €300.0 million 1.5% interest rate cap on our Euro Term Loan for a premium of $3.1 million.
Purchases of property, plant and equipment during the Successor year ending December 31, 2013, were $107.3 million, which included transition costs related to our transition to a standalone entity, which included costs to transition off of the DuPont information technology systems. In addition to the transition costs, we
81
Table of Contents
incurred costs for several growth and improvement initiatives including the waterborne projects in Jiading, China and Front Royal, Virginia.
During the Successor year ended December 31, 2013, we also invested $54.5 million for a real estate property.
Net Cash Provided by Financing Activities
As part of the Acquisition, on February 1, 2013 Carlyle made the Equity Contribution of $1,350.0 million. Further, there were additional equity contributions of $5.4 million during the Successor year ended December 31, 2013.
Borrowings during the Successor year ended December 31, 2013 included $2,817.3 million of proceeds from borrowings under our Senior Secured Credit Facilities, net of original issue discount of $25.7 million, and the issuance of our Senior Notes in the amount of $1,089.4 million. We paid $126.0 million of deferred financing costs associated with issuing the Dollar Senior Notes and Euro Senior Notes and entering into the Senior Secured Credit Facilities and $25.0 million of commitment fees related to the Bridge Facility. Other borrowings during the Successor year ended December 31, 2013 also included short-term borrowings of $38.8 million.
During the Successor year ended December 31, 2013, we made our required quarterly amortization payments on the Dollar Term Loan and Euro Term Loan totaling $21.3 million, as well as payments of $25.3 million on short-term borrowings.
During the Successor year ended December 31, 2013, dividends paid to noncontrolling interests totaled $5.2 million.
January 1, 2013 through January 31, 2013 (Predecessor)
Net Cash Used for Operating Activities
Net cash used for operating activities for the Predecessor period from January 1, 2013 through January 31, 2013 was $37.7 million. Net income, before deducting depreciation and amortization and other non-cash items, generated cash of $28.1 million.
An increase in inventories resulted in a use of cash of $19.3 million. Decreases in other accrued liabilities and accounts payable resulted in a use of cash of $43.8 million and $29.9 million, respectively. The decrease in other current liabilities was primarily due to reductions in compensation and other employee-related cost liabilities related to payment of annual incentive compensation, a reduction in the liabilities for discounts, rebates and warranties related to payments under annual rebate programs and a reduction in our foreign currency contracts derivatives liability. The reduction in accounts payable was primarily related to timing of vendor payments. Partially offsetting these items was a decrease in trade accounts and notes receivable which provided cash of $25.8 million. All other operating assets and liabilities netted to a $1.4 million generation of cash.
Net Cash Used for Investing Activities
During the Predecessor period from January 1, 2013 through January 31, 2013, net cash used for investing activities was $8.3 million. Purchases of property, plant and equipment and intangible assets were $2.4 million and $6.3 million, respectively, during the Predecessor period January 1, 2013 through January 31, 2013.
Net Cash Provided by Financing Activities
During the Predecessor period from January 1, 2013 through January 31, 2013, net cash provided by financing activities was $43.0 million which mainly represents the net cash used by operating activities and net cash used in investing activities discussed above as a result of DuPont’s centralized cash management system.
82
Table of Contents
Year ended December 31, 2012 (Predecessor)
Net Cash Provided by Operating Activities
Cash provided by operating activities was $388.8 million for the Predecessor year ended December 31, 2012. Cash provided by net income adjusted for other non-cash income statement items totaled $375.2 million for the Predecessor year ended December 31, 2012. Cash provided by operating assets and liabilities totaled $13.6 million for the year ended December 31, 2012. Increases in accounts payable and other current liabilities, of $54.9 million and $36.4 million, respectively, primarily related to increased employee incentive compensation and transition related liabilities, were partially offset by increases in trade accounts and notes receivable of $58.9 million and decreases in other liabilities of $25.9 million.
Net Cash Used for Investing Activities
Cash used for investing activities for the Predecessor year ended December 31, 2012 was $88.2 million. This was primarily driven by $73.2 million in purchases of property, plant and equipment and $21.6 million in purchases of intangibles.
Net Cash Used for Financing Activities
Cash used for financing activities for the Predecessor year ended December 31, 2012 was $290.6 million which mainly represents the net cash provided by operating activities less net cash used in investing activities discussed above as a result of DuPont’s centralized cash management system, as well as DuPont incurring costs on behalf of DPC.
Indebtedness
Our liquidity requirements are significant due to the highly leveraged nature of our company as well as our working capital requirements. At December 31, 2014, there were no borrowings under the Revolving Credit Facility with total availability under the Revolving Credit Facility of $384.5 million, all of which may be borrowed by us without violating any covenants under the credit agreement governing such facility or the indentures governing the Dollar Senior Notes and the Euro Senior Notes. As of December 31, 2014, we had $3,969.4 million in outstanding indebtedness and $926.2 million in working capital including $382.1 million in cash and cash equivalents.
The following table details our borrowings outstanding at the periods indicated:
| Year Ended December 31, | ||||||||
| (in millions) |
2014 | 2013 | ||||||
| Dollar Term Loan |
$ | 2,165.5 | $ | 2,282.8 | ||||
| Euro Term Loan |
481.0 | 547.7 | ||||||
| Dollar Senior Notes |
750.0 | 750.0 | ||||||
| Euro Senior Notes |
305.3 | 344.9 | ||||||
| Short-term borrowings |
12.2 | 18.2 | ||||||
| Other |
0.7 | — | ||||||
| Unamortized original issue discount |
(18.3 | ) | (22.7 | ) | ||||
|
|
|
|
|
|||||
| 3,696.4 | 3,920.9 | |||||||
| Less: |
||||||||
| Short term borrowings |
12.2 | 18.2 | ||||||
| Current portion of long-term borrowings |
27.9 | 28.5 | ||||||
|
|
|
|
|
|||||
| Long-term debt |
$ | 3,656.3 | $ | 3,874.2 | ||||
|
|
|
|
|
|||||
83
Table of Contents
The following table details our borrowings outstanding and the associated interest expense, including amortization of debt issuance costs and debt discounts, and average effective interest rates for such borrowings for the years ended December 31, 2014 and 2013:
| Year Ended December 31, 2014 | ||||||||||||
| (in millions) |
Principal | Average Effective Interest Rate |
Interest Expense |
|||||||||
| Term Loans |
$ | 2,628.2 | 4.7 | % | $ | 127.6 | ||||||
| Revolving Credit Facility |
— | N/A | 4.7 | |||||||||
| Senior Notes |
1,055.3 | 7.3 | % | 78.6 | ||||||||
| Short-term and Other borrowings |
12.9 | Various | 1.4 | |||||||||
|
|
|
|
|
|||||||||
| Total |
$ | 3,696.4 | $ | 212.3 | ||||||||
|
|
|
|
|
|||||||||
| Year Ended December 31, 2013 | ||||||||||||
| (in millions) |
Principal | Average Effective Interest Rate |
Interest Expense |
|||||||||
| Term Loans |
$ | 2,807.8 | 5.6 | % | $ | 139.0 | ||||||
| Revolving Credit Facility |
— | N/A | 4.5 | |||||||||
| Senior Notes |
1,094.9 | 7.5 | % | 71.8 | ||||||||
| Short-term borrowings |
18.2 | Various | 1.4 | |||||||||
|
|
|
|
|
|||||||||
| Total |
$ | 3,920.9 | $ | 216.7 | ||||||||
|
|
|
|
|
|||||||||
Senior Secured Credit Facilities
On February 1, 2013, we entered into the Senior Secured Credit Facilities. Costs of $92.9 million related to the issuance of the Senior Secured Credit Facilities are recorded within “Deferred financing costs, net” and are being amortized as interest expense over the life of the Senior Secured Credit Facilities. At December 31, 2014, the remaining unamortized balance of such costs was $65.7 million. Original issue discount of $25.7 million related to the Senior Secured Credit Facilities is recorded as a reduction of the principal amount of the borrowings and is amortized as interest expense over the life of the Senior Secured Credit Facilities. At December 31, 2014, the remaining unamortized original issue discount was $19.1 million. At December 31, 2014, there were no borrowings under the Revolving Credit Facility. At December 31, 2014, letters of credit issued under the Revolving Credit Facility totaled $15.5 million, which reduced the availability under the Revolving Credit Facility. Availability under the Revolving Credit Facility was $384.5 million at December 31, 2014.
On February 3, 2014, we executed the second amendment to the Senior Secured Credit Facilities. The amendment (i) converted all of the outstanding Dollar Term Loans ($2,282.8 million) into a new class of term loans (the “New Dollar Term Loans”) and (ii) converted all of the outstanding Euro Term Loans (€397.0 million) into a new class of term loans (the “New Euro Term Loans”). The New Dollar Term Loans are subject to an Adjusted Eurocurrency Rate or Base Rate (each as defined in the credit agreement governing the Senior Secured Credit Facilities) floor of 1.00% and 2.00%, respectively (the “Interest Rate Floor”), plus an applicable rate. The applicable rate for such New Dollar Term Loans is 3.00% per annum for Eurocurrency Rate Loans (as defined in the credit agreement governing the Senior Secured Credit Facilities) and 2.00% per annum for Base Rate Loans (as defined in the credit agreement governing the Senior Secured Credit Facilities). The applicable rate for both Eurocurrency Rate Loans as well as Base Rate Loans is subject to a further 25 basis point reduction if the Total Net Leverage Ratio (as defined in the credit agreement governing the Senior Secured Credit Facilities) is less than or equal to 4.50:1.00. The New Euro Term Loans are also subject to the Interest Rate Floor, plus an applicable rate. The applicable rate for such New Euro Term Loans is 3.25% per annum for Eurocurrency Rate Loans. The New Euro Term Loans may not be Base Rate Loans. The applicable rate is subject to a further 25 basis point reduction if the Total Net Leverage Ratio is less than or equal to 4.50:1.00.
84
Table of Contents
The credit agreement governing the Senior Secured Credit Facilities requires us to comply with certain affirmative and negative covenants. As of December 31, 2014, we were in compliance with all such covenants. All obligations under the Term Loans and Revolving Facility are guaranteed and collateralized by substantially all the tangible and intangible assets of the Company and its subsidiaries.
Senior Notes
On February 1, 2013, Axalta Coating Systems U.S. Holdings, Inc. (f/k/a U.S. Coatings Acquisition Inc.) and Axalta Coating Systems Dutch Holding B B.V. (f/k/a Flash Dutch 2 B.V.), our indirect wholly owned subsidiaries (the “Issuers”), offered and sold $750.0 million aggregate principal amount of 7.375% senior unsecured notes due 2021 (the “Dollar Senior Notes”) and related guarantees thereof. Additionally, the Issuers offered and sold €250.0 million aggregate principal amount of 5.750% senior secured notes due 2021 (the “Euro Senior Notes”) and related guarantees thereof. Cash fees related to the issuance of the Senior Notes were $33.1 million, are recorded as “Deferred financing costs” and are amortized as interest expense over the life of the Notes. At December 31, 2014, the remaining unamortized balance of such costs was $25.3 million. The Senior Notes are unconditionally guaranteed on a senior basis by certain of the Issuers’ subsidiaries. The indentures governing the Senior Notes contain covenants that restrict the ability of the Issuers and their subsidiaries to, among other things, incur additional debt, make certain payments including payment of dividends or repurchases of equity interest of the Issuers, make loans or acquisitions or capital contributions and certain investments, incur certain liens, sell assets, merge or consolidate or liquidate other entities and enter into transactions with affiliates.
The Euro Senior Notes were sold at par and are due February 1, 2021. The Euro Senior Notes bear interest at 5.750% payable semi-annually on February 1 and August 1. Cash fees related to the issuance of the Euro Senior Notes were $10.2 million, are recorded within “Deferred financing costs, net” and are amortized as interest expense over the life of the Senior Notes. At December 31, 2014, the remaining unamortized balance is $7.7 million.
On or after February 1, 2016, we have the option to redeem all or part of the Euro Senior Notes at the following redemption prices (expressed as percentages of principal amount):
| Period |
Euro Senior Notes Percentage | |||
| 2016 |
104.313 | % | ||
| 2017 |
102.875 | % | ||
| 2018 |
101.438 | % | ||
| 2019 and thereafter |
100.000 | % | ||
Notwithstanding the foregoing, at any time and from time to time prior to February 1, 2016, we may at our option redeem in the aggregate up to 40% of the original aggregate principal amount of the Euro Senior Notes with the net cash proceeds of one or more Equity Offerings (as defined in the indenture governing the Euro Senior Notes), at a redemption price of 105.750% plus accrued and unpaid interest, if any, to the redemption date. In addition, we have the option to redeem up to 10% of the Euro Senior Notes during any 12-month period from their issue date until February 1, 2016 at a redemption price of 103.0%, plus accrued and unpaid interest, if any, to the redemption date. Upon the occurrence of certain events constituting a change of control, holders of the Euro Senior Notes have the right to require us to repurchase all or any part of the Euro Senior Notes at a purchase price equal to 101% of the principal amount plus accrued and unpaid interest, if any, to the repurchase date.
The indebtedness evidenced by the Euro Senior Notes and related guarantees is secured on a first-lien basis by the same assets that secure the obligations under the Senior Secured Credit Facilities, subject to permitted liens and applicable local law limitations, is senior in right of payment to all future subordinated indebtedness of the Issuers, is equal in right of payment to all existing and future senior indebtedness of the Issuers and is effectively senior to any unsecured indebtedness of the Issuers, including the Dollar Senior Notes, to the extent of the value securing the Euro Senior Notes.
85
Table of Contents
The Dollar Senior Notes were sold at par and are due May 1, 2021. The Dollar Senior Notes bear interest at 7.375% payable semi-annually on February 1 and August 1. Cash fees related to the issuance of the Dollar Senior Notes were $22.9 million, are recorded within “Deferred financing costs, net” and are amortized as interest expense over the life of the Senior Notes. At December 31, 2014, the remaining unamortized balance of such fees was $17.6 million.
On or after February 1, 2016, we have the option to redeem all or part of the Dollar Senior Notes at the following redemption prices (expressed as percentages of principal amount)
| Period |
Dollar Senior Notes Percentage | |||
| 2016 |
105.531 | % | ||
| 2017 |
103.688 | % | ||
| 2018 |
101.844 | % | ||
| 2019 and thereafter |
100.000 | % | ||
Notwithstanding the foregoing, at any time and from time to time prior to February 1, 2016, we may at our option redeem in the aggregate up to 40% of the original aggregate principal amount of the Dollar Senior Notes with the net cash proceeds of one or more Equity Offerings (as defined in the indenture governing the Dollar Senior Notes), at a redemption price of 107.375% plus accrued and unpaid interest, if any, to the redemption date. Upon the occurrence of certain events constituting a change of control, holders of the Dollar Senior Notes have the right to require us to repurchase all or any part of the Dollar Senior Notes at a purchase price equal to 101% of the principal amount plus accrued and unpaid interest, if any, to the repurchase date.
The indebtedness evidenced by the Dollar Senior Notes is senior unsecured indebtedness of the Issuers, is senior in right of payment to all future subordinated indebtedness of the Issuers and is equal in right of payment to all existing and future senior indebtedness of the Issuers. The Dollar Senior Notes are effectively subordinated to any secured indebtedness of the Issuers (including indebtedness of the Issuers outstanding under the Senior Secured Credit Facilities and the Euro Senior Notes) to the extent of the value of the assets securing such indebtedness.
Other short-term borrowings had an outstanding balance of $12.2 million at December 31, 2014.
Capital Resources
We had cash and cash equivalents at December 31, 2014 and 2013 of $382.1 million and $459.3 million, respectively. Of these balances, $264.2 million and $385.2 million were maintained in non-U.S. jurisdictions as of December 31, 2014 and 2013, respectively. We believe our organizational structure allows us the necessary flexibility to move funds throughout our subsidiaries to meet our operational working capital needs.
Our primary sources of liquidity are cash on hand, cash flow from operations and available borrowing capacity under our Revolving Credit Facility. Based on our forecasts, we believe that cash flow from operations, available cash on hand and available borrowing capacity under our Senior Secured Credit Facilities and existing lines of credit will be adequate to service debt, fund the transition-related costs, meet liquidity needs and fund necessary capital expenditures for the next twelve months.
Our ability to make scheduled payments of principal or interest on, or to refinance, our indebtedness or to fund working capital requirements, capital expenditures and other current obligations will depend on our ability to generate cash from operations. Such cash generation is subject to general economic, financial, competitive, legislative, regulatory and other factors that are beyond our control.
If required, our ability to raise additional financing and our borrowing costs may be impacted by short and long-term debt ratings assigned by independent rating agencies, which are based, in significant part, on our
86
Table of Contents
performance as measured by certain credit metrics such as interest coverage and leverage ratios. Our highly leveraged nature may limit our ability to procure additional financing in the future.
Capital expenditures for 2015 are expected to be approximately $150 million, of which approximately $60 million will be related to maintenance capital expenditures and the remainder consists of growth and transition-related capital expenditures. The key growth projects include the following:
| • | In May 2013, we announced that we will expand our existing facility in Jiading, China to manufacture and supply paint to automobile manufacturers that are expanding into south and central China. We began expansion of the facility with production having begun earlier this year. |
| • | In February 2014, we began the next phase of construction to significantly expand our waterborne production capacity in Guarulhos, Brazil. The additional facility will more than double capacity, which will help meet the growing demands of the OEMs in South America where increases in the car parcs are forecast to continue. The additional production is expected to come on line in 2015. |
| • | In February 2014, we announced a commitment to build a next-generation facility that will expand capacity to provide waterborne industrial coatings within Wuppertal, Germany. Production at the new operations center is expected to begin in the third quarter of 2015. |
For years ending December 31, 2014, 2013 and 2012, our maintenance capital expenditures were approximately $60 million and our growth-related capital expenditures have ranged from approximately $10 million to $55 million. Capital expenditures during the 2014 fiscal year totaled approximately $188 million, which included approximately $75 million of transition-related capital expenditures.
Recent Accounting Guidance
In April 2014, the Financial Accounting Standards Board (“FASB”) issued Accounting Standard Update (“ASU”) 2014-08, “Reporting Discontinued Operations and Disclosures of Disposals of Components of an Entity,” which amended the guidance for reporting discontinued operations and disposals of components of an entity. The amended guidance requires that a disposal representing a strategic shift that has (or will have) a major effect on an entity’s financial results or a business activity classified as held for sale should be reported as discontinued operations. The amendments also expand the disclosure requirements for discontinued operations and add new disclosures for individually significant dispositions that do not qualify as discontinued operations. The amendments are effective prospectively for fiscal years, and interim reporting periods within those years, beginning after December 15, 2014 and early adoption is permitted. We have adopted this guidance as of December 31, 2014.
In February 2013, the FASB issued ASU 2013-02, “Comprehensive Income (Topic 220): Reporting of Amounts Reclassified Out of Accumulated Other Comprehensive Income,” issuing changes to the reporting of amounts reclassified out of accumulated other comprehensive income. These changes require an entity to report the effect of significant reclassifications out of accumulated other comprehensive income on the respective line items in net income if the amount being reclassified is required to be reclassified in its entirety to net income. For other amounts that are not required to be reclassified in their entirety to net income in the same reporting period, an entity is required to cross-reference other disclosures that provide additional detail about those amounts. These requirements are to be applied to each component of accumulated other comprehensive income. This guidance is effective prospectively for annual reporting periods beginning on or after January 1, 2014, and the interim periods within those annual periods.
Quantitative And Qualitative Disclosures About Market Risk
We are exposed to changes in interest rates and foreign currency exchange rates because we finance certain operations through fixed and variable rate debt instruments and denominate our transactions in a variety of foreign currencies. We are also exposed to changes in the prices of certain commodities that we use in production. Changes in these rates and commodity prices may have an impact on future cash flow and earnings.
87
Table of Contents
We manage these risks through normal operating and financing activities and, when deemed appropriate, through the use of derivative financial instruments. We do not enter into derivative financial instruments for trading or speculative purposes.
By using derivative instruments, we are subject to credit and market risk. The fair market value of the derivative instruments is determined by using valuation models whose inputs are derived using market observable inputs, including interest rate yield curves, as well as foreign exchange and commodity spot and forward rates, and reflects the asset or liability position as of the end of each reporting period. When the fair value of a derivative contract is positive, the counterparty owes us, thus creating a receivable risk for us. We are exposed to counterparty credit risk in the event of non-performance by counterparties to our derivative agreements. We minimize counterparty credit (or repayment) risk by entering into transactions with major financial institutions of investment grade credit rating.
Our exposure to market risk is not hedged in a manner that completely eliminates the effects of changing market conditions on earnings or cash flow.
Interest rate risk
We are subject to interest rate market risk in connection with our borrowings. A one-eighth percent change in the applicable interest rate for borrowings under the Senior Secured Credit Facilities (assuming the Revolving Credit Facility is undrawn and to the extent that the Eurocurrency Rate (as defined in the credit agreement governing the Senior Secured Credit Facilities) is in excess of the floor rate of the Senior Secured Credit Facilities) would have an annual impact of a benefit of approximately $3.0 million on cash interest expense considering the impact of our hedging positions currently in place.
We selectively use derivative instruments to reduce market risk associated with changes in interest rates. The use of derivatives is intended for hedging purposes only and we do not enter into derivative instruments for speculative purposes.
During the Successor year ended December 31, 2013, we entered into five interest rate swaps with notional amounts totaling $1,173.0 million to hedge interest rate exposures related to our variable rate borrowings under the Senior Secured Credit Facilities. The interest rate swaps qualified and were designated as cash flow hedges. The interest rate swaps are in place through September 2017. In addition to interest rate swaps, we purchased a €300.0 million 1.5% interest rate cap on our Euro Term Loan that matures on September 29, 2017. The interest rate cap is not designated as a hedging instrument. As such, the changes in fair value of the interest rate cap are recorded in interest expense in the current period.
As discussed in Note 22 to our Audited Consolidated and Combined Financial Statements included elsewhere in this prospectus, we took additional measures to reduce our cost of borrowing by entering into an amendment to the Senior Secured Credit Facilities as of February 3, 2014. The re-pricing enacted pursuant to the amendment reduces the margin applicable to our cost of borrowing on our Dollar Term Loan from 3.5% to 3.0% for Eurocurrency Rate Loans and from 2.5% to 2.0% for Base Rate Loans and our cost of borrowing under the Euro Term Loan facility from 4.0% to 3.25%. The amendment provides for an additional reduction of these rates by 25 basis points if the Total Net Leverage Ratio is less than or equal to 4.50:1.00. In addition, the LIBOR floor on each term loan was reduced from 1.25% to 1.00% and the base rate floor on the Dollar Term Loan facility was reduced from 2.25% to 2.0%.
Foreign exchange rates risk
We are exposed to foreign currency risk by virtue of our international operations. The majority of our net sales for the Successor years ended December 31, 2014 and 2013, the Predecessor year ended December 31, 2012 and the Predecessor period from January 1, 2013 to January 31, 2013 were from operations/sales outside the United States.
88
Table of Contents
In the majority of our jurisdictions, we earn revenue and incur costs in the local currency of such jurisdiction. We earn significant revenues and incur significant costs in foreign currencies including the Euro, Mexican peso, Brazilian real, the Chinese yuan/renminbi and the Venezuelan bolívar. As a result, movements in exchange rates could cause our revenues and expenses to materially fluctuate, impacting our future profitability and cash flows. Our purchases of raw materials in Latin America, EMEA and Asia Pacific and future business operations and opportunities, including the continued expansion of our business outside North America, may further increase the risk that cash flows resulting from these activities may be adversely affected by changes in currency exchange rates. If and when appropriate, we intend to manage these risks through foreign currency hedges and/or by utilizing local currency funding of these expansions. We do not intend to hold financial instruments for trading or speculative purposes.
Our Euro Senior Notes and the Euro Term Loan are denominated in Euro. As a result, movements in the Euro exchange rate in relation to the U.S. dollar could cause the amount of Euro Senior Notes and Euro Term Loan borrowings to fluctuate, impacting our future profitability and cash flows.
Additionally, in order to fund the purchase price for certain assets of DPC and the capital stock and other equity interests of certain non-U.S. entities, a combination of equity contributions and intercompany loans were utilized to capitalize certain non-U.S. subsidiaries. In certain instances, the intercompany loans are denominated in currencies other than the functional currency of the affected subsidiaries. Where intercompany loans are not a component of permanently invested capital of the affected subsidiaries, increases or decreases in the value of the subsidiaries’ functional currency against other currencies will affect our results of operations.
Commodity price risk
We are subject to changes in our cost of sales caused by movements in underlying commodity prices (primarily oil and natural gas). Approximately 50% of our cost of sales is represented by raw materials. A substantial portion of the purchased raw materials include monomers, pigments, resins and solvents. Our price fluctuations generally follow industry indices. We historically have not entered into long-term purchase contracts related to the purchase of raw materials. If and when appropriate, we intend to manage these risks using purchase contracts with our suppliers.
Treasury policy
Our treasury policy seeks to ensure that adequate financial resources are available for the development of our businesses while managing our currency and interest rate risks. Our policy is to not engage in speculative transactions. Our policies with respect to the major areas of our treasury activity are set forth above.
89
Table of Contents
Contractual Obligations
The following table summarizes our contractual obligations at December 31, 2014:
| Contractual Obligations Due In: | ||||||||||||||||||||
| (in millions) | Total | 2015 | 2016-2017 | 2018-2019 | Thereafter | |||||||||||||||
| Debt, including current portion(1) |
||||||||||||||||||||
| Senior Secured Credit Facilities, consisting of the following: |
||||||||||||||||||||
| Term Loan Facilities: |
||||||||||||||||||||
| Dollar Term Loan |
$ | 2,165.5 | $ | 23.0 | $ | 46.0 | $ | 46.0 | $ | 2,050.5 | ||||||||||
| Euro Term Loan |
481.0 | 4.9 | 9.8 | 9.8 | 456.5 | |||||||||||||||
| Senior Notes, consisting of the following: |
||||||||||||||||||||
| Dollar Senior Notes |
750.0 | — | — | — | 750.0 | |||||||||||||||
| Euro Senior Notes |
305.3 | — | — | — | 305.3 | |||||||||||||||
| Other borrowings |
12.9 | 12.2 | — | 0.7 | — | |||||||||||||||
| Interest payments(1) |
998.6 | 176.3 | 349.7 | 341.3 | 131.3 | |||||||||||||||
| Operating Leases |
208.6 | 50.6 | 63.1 | 47.2 | 47.7 | |||||||||||||||
| Pension contributions(2) |
16.5 | 16.5 | — | — | — | |||||||||||||||
| Purchase obligations |
36.9 | 11.7 | 18.5 | 6.7 | — | |||||||||||||||
| Uncertain tax positions, including interest and penalties(3) |
— | — | — | — | — | |||||||||||||||
|
|
|
|
|
|
|
|
|
|
|
|||||||||||
| Total |
$ | 4,975.3 | $ | 295.2 | $ | 487.1 | $ | 451.7 | $ | 3,741.3 | ||||||||||
|
|
|
|
|
|
|
|
|
|
|
|||||||||||
| (1) | Amounts assume that the Senior Secured Credit Facilities and Senior Notes are repaid upon maturity, and the Revolving Credit Facility remains undrawn, which may or may not reflect future events. Future interest payments include commitment fees on the unused portion of the Revolving Credit Facility, and reflect the interest payments on our Dollar Term Loan, Euro Term Loan and the Senior Notes. Future interest payments assume December 31, 2014 interest rates will prevail throughout all future periods. Actual interest payments and repayment amounts may change. |
| (2) | We expect to make contributions to our defined benefit pension plans beyond 2015; however, the amount of any contributions is dependent on the future economic environment and investment returns, and we are unable to reasonably estimate the pension contributions beyond 2015. |
| (3) | As of December 31, 2014, we had approximately $5.6 million of uncertain tax positions, including interest and penalties, that could result in potential payments. Due to the high degree of uncertainty regarding future timing of cash flows associated with these liabilities, we are unable to estimate the years in which settlement will occur with the respective taxing authorities. |
Scheduled Maturities
Below is a schedule of required future repayments of all borrowings outstanding at December 31, 2014 (Successor).
| (in millions) | ||||
| 2015 |
$ | 40.1 | ||
| 2016 |
27.9 | |||
| 2017 |
27.9 | |||
| 2018 |
28.6 | |||
| 2019 |
27.9 | |||
| Thereafter |
3,562.3 | |||
|
|
|
|||
| Total |
$ | 3,714.7 | ||
|
|
|
|||
90
Table of Contents
Off Balance Sheet Arrangements
In connection with the Acquisition, we assumed certain obligations under which we directly guarantee various debt obligations under agreements with third parties related to equity affiliates, customers and suppliers. At December 31, 2014 and 2013 (Successor) we had directly guaranteed $2.2 million and $1.6 million of such obligations, respectively. These represent the maximum potential amount of future (undiscounted) payments that we could be required to make under the guarantees in the event of default by the guaranteed parties. No amounts were accrued at December 31, 2014 and 2013.
No other off balance sheet arrangements existed as of December 31, 2014 or 2013.
Critical Accounting Policies and Estimates
Our discussion and analysis of results of operations and financial condition are based upon our financial statements. These financial statements have been prepared in accordance with U.S. GAAP unless otherwise noted. The preparation of these financial statements requires us to make estimates and judgments that affect the amounts reported in the financial statements. We base our estimates and judgments on historical experiences and assumptions believed to be reasonable under the circumstances and re-evaluate them on an ongoing basis. Actual results could differ from our estimates under different assumptions or conditions. Our significant accounting policies, which may be affected by our estimates and assumptions, are more fully described in Note 3 to our audited financial statements that appear elsewhere in this prospectus.
An accounting policy is deemed to be critical if it requires an accounting estimate to be made based on assumptions about matters that are highly uncertain at the time the estimate is made, and if different estimates that reasonably could have been used, or changes in the accounting estimates that are reasonably likely to occur periodically, could materially impact the financial statements. Management believes the following critical accounting policies reflect its most significant estimates and assumptions used in the preparation of the financial statements.
Accounting for Business Combinations
We account for business combinations under the acquisition method of accounting. This method requires the recording of acquired assets, including separately identifiable intangible assets, and assumed liabilities at their acquisition date fair values. The excess of the purchase price over the fair value of assets acquired and liabilities assumed is recorded as goodwill. Determining the fair value of assets acquired and liabilities assumed requires management’s judgment and often involves the use of significant estimates and assumptions, including assumptions with respect to future cash inflows and outflows, discount rates, royalty rates, asset lives and market multiples, among other items.
The fair values of intangible assets were estimated using an income approach, either the excess earnings method (customer relationships) or the relief from royalty method (technology and trademarks). Under the excess earnings method, an intangible asset’s fair value is equal to the present value of the incremental after-tax cash flows attributable solely to the intangible asset over its remaining useful life. Under the relief from royalty method, fair value is measured by estimating future revenue associated with the intangible asset over its useful life and applying a royalty rate to the revenue estimate. These intangible assets enable us to secure markets for our products, develop new products to meet the evolving business needs and competitively produce our existing products.
The fair value of real properties acquired was based on the consideration of their highest and best use in the market. The fair values of property, plant, and equipment, other than real properties, were based on the consideration that unless otherwise identified, they will continue to be used “as is” and as part of the ongoing business. In contemplation of the in-use premise and the nature of the assets, the fair value was developed primarily using a cost approach. The determination of the fair value of assets acquired and liabilities assumed
91
Table of Contents
involves assessing factors such as the expected future cash flows associated with individual assets and liabilities and appropriate discount rates at the date of the acquisition.
The fair value of the noncontrolling interests, related to acquired joint ventures, were estimated by applying an income approach. This fair value measurement is based on significant inputs that are not observable in the market and thus represents a fair value measurement categorized within Level 3 of the fair value hierarchy. Key assumptions included a discount rate, a terminal value based on a range of long-term sustainable growth rates and adjustments because of the lack of control that market participants would consider when measuring the fair value of the noncontrolling interests.
The results of operations for businesses acquired are included in the financial statements from the date of the acquisition.
See Note 5 to our Audited Consolidated and Combined Financial Statements for further detail on the Acquisition and related accounting.
Asset Impairments
Factors that could result in future impairment charges, among others, include changes in worldwide economic conditions, changes in technology, changes in competitive conditions and customer preferences, and fluctuations in foreign currency exchange rates. These risk factors are discussed in “Risk Factors,” included elsewhere in this prospectus.
Goodwill
We test goodwill and identifiable intangible assets with indefinite lives for impairment at least annually. Intangibles are tested for impairment using a quantitative impairment model. We test goodwill for impairment by either performing a qualitative evaluation or a two-step quantitative test. The qualitative evaluation is an assessment of factors, including reporting unit specific operating results and cost factors, as well as industry, market and general economic conditions, to determine whether it is more likely than not that the fair values of a reporting unit is less than its carrying amount, including goodwill. We may elect to bypass this qualitative assessment for some or all of our reporting units and perform a two-step quantitative test. Fair values under the quantitative test are estimated using a combination of discounted projected future earnings or cash flow methods and multiples of earnings in estimating a reporting unit’s fair value.
For the 2014 impairment tests, we utilized both the qualitative and quantitative methods to assess impairment. None of our goodwill was impaired based on the results of the testing.
The inputs utilized in the analyses are classified as Level 3 inputs within the fair value hierarchy as defined in ASC 820, Fair Value Measurement. The process of evaluating the potential impairment of goodwill is subjective because it requires the use of estimates and assumptions as to our future cash flows, discount rates commensurate with the risks involved in the assets, future economic and market conditions, as well as other key assumptions. We believe that the amounts recorded in the financial statements related to goodwill are based on the best estimates and judgments of the appropriate Axalta management, although actual outcomes could differ from our estimates.
Goodwill is allocated to, and evaluated for impairment at, the reporting unit level, which is defined as an operating segment or one level below an operating segment. We have two operating segments—Performance Coatings and Transportation Coatings—that also serve as our reportable segments. We have goodwill allocated to eight reporting units. At December 31, 2014, our $1,001.1 million in total goodwill is allocated to reportable segments as follows: $933.6 million in Performance Coatings and $67.5 million in Transportation Coatings.
92
Table of Contents
Other intangible assets
We conducted our 2014 annual indefinite-lived intangible assets impairment assessment as of October 1, 2014 and plan to update this assessment annually each October, unless conditions arise that would require a more frequent evaluation. In assessing the recoverability of indefinite-lived intangible assets, projections regarding estimated discounted future cash flows and other factors are made to determine if impairment has occurred. If we conclude that there has been impairment, we will write down the carrying value of the asset to its fair value. Each year, we evaluate those intangible assets with indefinite lives to determine whether events and circumstances continue to support the indefinite useful lives. When testing indefinite-lived intangible assets for impairment, we have the option to first assess qualitative factors to determine whether the existence of events or circumstances leads to a determination that it is more likely than not (more than 50%) that the fair value of an indefinite-lived intangible asset is less than its carrying amount. Such qualitative factors may include the following:
| • | macroeconomic conditions; |
| • | industry and market considerations; |
| • | cost factors; |
| • | overall financial performance; and |
| • | other relevant entity-specific events. |
Based on the results of our annual impairment review conducted in October 2014, management concluded that the fair value exceeded carrying value and no impairments existed.
Definite-lived intangible assets, such as technology, trademarks, customer relationships and non-compete agreements are amortized over their estimated useful lives, generally for periods ranging from 4 to 20 years. The reasonableness of the useful lives of these assets is continually evaluated. Once these assets are fully amortized, they are removed from the balance sheet.
The in-process research and development projects we acquired are considered indefinite-lived intangible assets until the abandonment or completion of the associated research and development efforts. Upon completion of the research and development process, the carrying values of acquired in process research and development projects are reclassified as definite-lived assets and are amortized over their useful lives. If the project is abandoned, we record the write-off as a loss in the statement of operations. During the years ended December 31, 2014 and 2013, we abandoned certain projects with carrying amounts of $0.1 million and $3.2 million, respectively, and recorded losses associated with these projects, which are included as components of amortization of acquired intangibles in the consolidated statements of operations.
Long-Lived Assets
Long-lived assets, which includes property, plant and equipment, and definite-lived intangible assets, are assessed for impairment whenever events or changes in circumstances indicate the carrying amount of the asset may not be recoverable. The impairment testing involves comparing the carrying amount of the asset to the forecasted undiscounted future cash flows generated by that asset. In the event the carrying amount of the asset exceeds the undiscounted future cash flows generated by that asset and the carrying amount is not considered recoverable, an impairment exists. An impairment loss is measured as the excess of the asset’s carrying amount over its fair value. An impairment loss is recognized in the statement of operations in the period that the impairment occurs.
Stock-Based Compensation
Successor periods
During 2013, we granted approximately 4.1 million, 5.7 million and 6.4 million non-qualified service-based stock options to certain employees with strike prices of $5.92, $8.88 and $11.84 (per share), respectively.
93
Table of Contents
During 2014, we granted 1.6 million non-qualified service-based stock options to certain employees with strike prices of $5.92, $7.21, $8.88 and $11.84 per share. Options generally vest over a 5-year period, and vesting of a portion of the options could accelerate in the event of a change in control or certain other events. Option life cannot exceed ten years.
For the years ended December 31, 2014 and 2013, we recorded compensation expense of $8.0 million and $7.4 million, respectively. Compensation expense related to service-based non-qualified stock options is equivalent to the grant-date fair value of the awards determined under the Black-Scholes option pricing model and is being recognized as compensation expense over the service period utilizing graded vesting. At the grant date, we estimated a forfeiture rate of zero due to the limited history and expectations of forfeitures.
The fair value of options granted in 2013 ranged from $0.95 per share to $2.01 per share. The fair value of options granted in 2014 ranged from $1.51 per share to $3.01 per share. Principal weighted average assumptions used in applying the Black-Scholes model were as follows:
| Key Assumptions |
2014 Grants | 2013 Grants | ||||||
| Expected Term |
7.81 years | 7.81 years | ||||||
| Volatility |
28.28 | % | 28.61 | % | ||||
| Dividend Yield |
— | % | — | % | ||||
| Discount Rate |
2.21 | % | 2.13 | % | ||||
To estimate the expected stock option term for the $5.92 and $7.21 stock options referred to above, we used the simplified method, as the options were granted at fair value and we were a privately-held company at the grant date and had no exercise history. Based upon this simplified method, the $5.92 and $7.21 per share stock options have an expected term of 6.5 years. The strike price for the $8.88 and $11.84 per share tranches of options exceeded the fair value at the grant date, which required the use of an estimate of an implicitly longer holding period, resulting in the term of 8.25 years.
Because we were a privately-held company with no trading history at the time of these grants, expected volatility was estimated using trading data derived from publicly held peer group companies over the expected term of the options. We do not anticipate paying cash dividends in the foreseeable future and, therefore, use an expected dividend yield of zero. The discount rate was derived from the U.S. Treasury yield curve.
During 2013, we sold 1.3 million common shares to certain employees at fair value for $7.4 million in proceeds. Because we were not publicly traded on the grant date, the market value of the shares for the 2013 share awards was estimated based upon the Acquisition price as there were no significant changes in operations since the closing date of February 1, 2013. During 2014, we sold 0.3 million common shares to certain officers and directors at fair value for $2.5 million in proceeds.
For the 2014 share awards, we estimated the per share fair value of our common shares using a contemporaneous valuation consistent with the American Institute of Certified Public Accountants Practice Aid, “Valuation of Privately-Held Company Equity Securities Issued as Compensation” (the “Practice Aid”). In conducting this valuation, we considered all objective and subjective factors that we believed to be relevant, including our best estimate of our business condition, prospects and operating performance. Within this contemporaneous valuation, a range of factors, assumptions and methodologies were used. The significant factors included:
| • | the fact that we were a private company with illiquid securities; |
| • | our historical operating results; |
| • | our discounted future cash flows, based on our projected operating results; |
| • | valuations of comparable public companies; and |
| • | the risk involved in the investment, as related to earnings stability, capital structure, competition and market potential. |
94
Table of Contents
For the contemporaneous valuation of our common shares, management estimated, as of the issuance date, our enterprise value on a continuing operations basis, using the income and market approaches, as described in the Practice Aid. The income approach utilized the discounted cash flow (“DCF”) methodology based on our financial forecasts and projections, as detailed below. The market approach utilized the Guideline Public Company and Guideline Transactions methods, as detailed below.
For the DCF methodology, we prepared annual projections of future cash flows through 2018. Beyond 2018, projected cash flows through the terminal year were projected at long-term sustainable growth rates consistent with long-term inflationary and industry expectations. Our projections of future cash flows were based on our estimated net debt-free cash flows and were discounted to the valuation date using a weighted-average cost of capital estimated based on market participant assumptions.
For the Guideline Public Company and Guideline Transactions methods, we identified a group of comparable public companies and recent transactions within the chemicals industry. For the comparable companies, we estimated market multiples based on trading prices and trailing 12 months EBITDA. These multiples were then applied to our trailing 12 months EBITDA. When selecting comparable companies, consideration was given to industry similarity, their specific products offered, financial data availability and capital structure.
For the comparable transactions, we estimated market multiples based on prices paid for the related transactions and trailing 12 months EBITDA. These multiples were then applied to our trailing 12 months EBITDA. The results of the market approaches corroborated the fair value determined using the income approach.
Awards issued subsequent to our IPO have been, and will continue to be, valued based on the market price of the shares on the date of the grant.
See Note 11 to our Audited Consolidated and Combined Financial Statements included elsewhere in this prospectus for further detail on stock based compensation.
Predecessor periods
DuPont maintained certain stock-based compensation plans for the benefit of certain of its officers, directors and employees, including, prior to the Acquisition, certain DPC employees. DPC recognized stock-based compensation within the consolidated and combined statement of operations based upon fair values. Total stock-based compensation expense included in the consolidated and combined statement of operations was $0.1 million and $0.5 million for the Predecessor period January 1, 2013 through January 31, 2013 and the Predecessor year ended December 31, 2012, respectively.
Retirement Benefits
Successor periods
In connection with the Acquisition, we assumed certain defined benefit pension plan and other long-term employee benefit plan obligations and acquired certain related plan assets for both current and former employees of our subsidiaries.
The defined benefit pension plans for our subsidiaries represent single-employer plans. ASC 805, Business Combinations, requires recognition of a pension asset or liability of a single-employer defined benefit pension plan in connection with recording assets and liabilities of a business combination accounted for as a purchase. A pension liability is recorded for the excess of the projected benefit obligation over the fair value of the plan assets. The projected benefit obligation and the fair value of plan assets were remeasured at the acquisition date using current discount rates and assumptions. The amount recorded for the pension asset or liability in a purchase transaction essentially represents a “fresh start” approach. Accordingly, our subsequent net periodic pension cost does not include amortization of any prior service cost/credit, net gain or loss, or transition amount that existed prior to the date of the Acquisition.
95
Table of Contents
The defined benefit obligations for remaining current employees of non-U.S. subsidiaries assumed by us were carved out of defined benefit pension plans retained by DuPont. We have created new defined benefit pension plans and are in the process of finalizing the creation of new defined benefit pension plans for all affected participants. The Acquisition Agreement requires DuPont to transfer assets generally in the form of cash, insurance contracts or marketable securities from DuPont’s defined benefit pension plans to our defined benefit pension plans. As of December 31, 2014, DuPont had completed the asset transfers for all plans except the plan covering the Company’s Canadian employees. The Canadian plan assets continue to be invested and managed by DuPont until the required regulatory approvals are received at which time the assets will be transferred to a newly created trust.
For multiemployer plans, ASC 805, Business Combinations, requires an obligation to the plan for a portion of its unfunded benefit obligations to be established at the acquisition date when withdrawal from the multiemployer plan is probable. As withdrawal from the DuPont defined benefit pension plan and related transfer of plan assets were required pursuant to the Acquisition Agreement with DuPont, an estimate of the unfunded benefit obligations was recorded as of the closing date of the Acquisition for certain foreign benefit plans. The plan assets have been or will be directly transferred to the pension trust. Accordingly, assumed defined benefit obligations were presented net of the estimate of the plan assets to be transferred by DuPont.
The amounts recognized in the audited financial statements related to pension and other long-term employee benefits are determined from actuarial valuations. Inherent in these valuations are assumptions including expected return on plan assets, discount rates at which liabilities could have been settled, rate of increase in future compensations levels, mortality rates and health care costs trend rates. These assumptions are updated annually and are disclosed in Note 10 to our Audited Consolidated and Combined Financial Statements included elsewhere in this prospectus. In accordance with U.S. GAAP, actual results that differed from the assumptions are accumulated and amortized over future periods and therefore, affect expense recognized and obligations recorded in future periods.
The discount rate is determined as of each measurement date based on a review of yield rates associated with long-term, high-quality corporate bonds. The calculation separately discounts benefit payments using the spot rates from a long-term, high-quality corporate bond yield curve.
The estimated impact of a 100 basis point increase of the discount rate to the net periodic benefit cost for 2015 would result in an increase of $0.4 million, while the impact of a 100 basis point decrease of the discount rate would result in an increase of approximately $0.9 million. The estimated impact of a 100 basis point increase of the expected return on asset assumption on the net periodic benefit cost for 2015 would result in a decrease of approximately $2.1 million, while the impact of a 100 basis point decrease would result in an increase of $2.1 million.
Predecessor periods
Certain of DPC’s employees participated in defined benefit pension and other long-term employee benefit plans accounted for in accordance with the guidance for defined benefit pension and other long-term employee benefit plans in accordance with ASC 715, Compensation—Retirement Benefits. Certain DPC employees were previously covered under DuPont and DuPont subsidiaries’ sponsored plans, which were accounted for in accordance with accounting guidance in ASC 715. The majority of pension and other long-term employee benefit expenses during the Predecessor periods were specifically identified by employee. In addition, a portion of expense was allocated in shared entities and reported with cost of goods sold, selling, general and administrative expenses and research and development expenses in the Predecessor consolidated and combined statements of operations. For the U.S. pension plan and other defined benefit plans (the U.S. plans), DuPont considered DPC employees to be part of a multiemployer plan of DuPont. The expense related to the current and former employees of DPC is included in the Predecessor consolidated and combined financial statements. Non U.S. pensions and other long-term employee benefit plans (the non-U.S. plans) were accounted for as single employer plans where DPC recorded assets, liabilities and expenses related to the current DPC workforce.
96
Table of Contents
Income taxes
Successor periods
The provision for income taxes was determined using the asset and liability approach of accounting for income taxes. Under this approach, deferred taxes represent the future tax consequences expected to occur when the reported amounts of assets and liabilities are recovered or paid. The provision for income taxes represents income taxes paid or payable for the current year plus the change in deferred taxes during the period. Deferred taxes result from differences between the financial and tax basis of our assets and liabilities and are adjusted for changes in tax rates and tax laws when changes are enacted. Valuation allowances are recorded to reduce deferred tax assets when it is more likely than not that a tax benefit will not be realized. Deferred tax assets and liabilities are measured using enacted tax rates applicable in the years in which they are expected to be recovered or settled. The effect on deferred tax assets and liabilities of a change in tax law is recognized in income in the period that includes the enactment date.
At December 31, 2014, we had a net deferred tax asset balance of $99.0 million, after valuation allowances of $101.9 million. At December 31, 2013, we had a net deferred tax asset balance of $16.0 million, after valuation allowances of $63.4 million. In evaluating the ability to realize deferred tax assets, the Company relies on, in order of increasing subjectivity, taxable income in prior carryback years, the future reversals of existing taxable temporary differences, tax planning strategies and forecasted taxable income using historical and projected future operating results.
We provide for income and foreign withholding taxes, where applicable, on unremitted earnings of all subsidiaries and related companies to the extent that such earnings are not deemed to be permanently invested. At December 31, 2014 and 2013 deferred income taxes of approximately $8.5 million and $15.9 million have been provided on such subsidiary earnings, respectively.
The breadth of our operations and the global complexity of tax regulations require assessments of uncertainties and judgments in estimating taxes we will ultimately pay. The final taxes paid are dependent upon many factors, including negotiations with taxing authorities in various jurisdictions, outcomes of tax litigation and resolution of disputes arising from federal, state and international tax audits in the normal course of business. A liability for unrecognized tax benefits is recorded when management concludes that the likelihood of sustaining such positions upon examination by taxing authorities is less than “more likely than not.” Interest and penalties accrued related to unrecognized tax benefits are included in the provision for income taxes. At December 31, 2014 and 2013, the Company had gross unrecognized tax benefits for both domestic and foreign operations of $5.3 million and $38.9 million, respectively.
See Note 14 to our Audited Consolidated and Combined Financial Statements included elsewhere in this prospectus for further detail on our accounting for income taxes.
Predecessor periods
During the Predecessor periods, we attributed current and deferred income taxes of DuPont to the DPC standalone financial statements in a manner that is systematic, rational and consistent with the asset and liability method prescribed by ASC 740, Income Taxes. Accordingly, our income tax provision was prepared following the “Separate Return Method.” The separate return method applies ASC 740 to the standalone financial statements of each member of the consolidated group as if the group member were a separate taxpayer and a standalone enterprise. As a result, we may not have included in the separate consolidated and combined financial statements of the Predecessor actual tax transactions included in the consolidated financial statements of DuPont. Similarly, the tax treatment of certain items reflected in the separate Predecessor consolidated and combined financial statements may not be reflected in the consolidated financial statements and tax returns of DuPont; therefore, such items as alternative minimum tax, net operating losses, credit carryforwards and valuation allowances may exist in the standalone financial statements that may or may not exist in DuPont’s consolidated financial statements.
97
Table of Contents
The provision for income taxes was determined using the asset and liability approach of accounting for income taxes. Under this approach, deferred taxes represent the future tax consequences expected to occur when the reported amounts of assets and liabilities are recovered or paid. The provision for income taxes represents income taxes paid or payable for the current year plus the change in deferred taxes during the period. Deferred taxes result from differences between the financial and tax basis of our assets and liabilities and are adjusted for changes in tax rates and tax laws when changes are enacted. Valuation allowances are recorded to reduce deferred tax assets when it is more likely than not that a tax benefit will not be realized. Income tax related penalties are included in the provision for income taxes.
In general, the taxable income (loss) of our various entities was included in DuPont’s consolidated tax returns, where applicable in jurisdictions around the world. As such, we have not historically prepared separate income tax returns for many of our entities. Consequently, income taxes currently payable for these entities are deemed to have been remitted to DuPont, in cash, in the period the liability arose and income taxes currently receivable are deemed to have been received from DuPont in the period that we would have recognized a refund had we been a separate taxpayer.
Prior to the presale structuring that occurred in the latter part of 2012, no direct ownership relationships existed among all our various legal entities. Consequently, no provision has been made for income taxes on unremitted earnings of subsidiaries and affiliates. Four new Dutch holding companies were created in 2012 to hold a significant portion of the DPC operations in Latin America, EMEA and Asia. No provision was made for income taxes on unremitted earnings of subsidiaries and affiliates due to the indirect ownership structure (for entities not owned by the new Dutch holding companies) and because earnings of the direct subsidiaries of the new Dutch holding companies were deemed to be indefinitely invested.
Derivatives and Hedging
For derivatives designated as cash flow hedges, if any, we measure hedge effectiveness by formally assessing, at least quarterly, the probable high correlation of the expected future cash flows of the hedged item and the derivative hedging instrument. The ineffective portions of the hedges are recorded in the consolidated statement of operations in the current period. If the hedging relationship ceases to be highly effective or it becomes probable that an expected transaction will no longer occur, future gains or losses on the derivative instrument are recorded in the statement of operations.
We account for interest rate swaps related to our existing long-term borrowings as cash flow hedges. The fair values of the derivatives are classified as current and noncurrent in the balance sheet based upon the maturity of the underlying derivative. As of December 31, 2014 and 2013, theses balances are classified as noncurrent in the consolidated balance sheet. The effective portions of the changes in the fair values of these derivatives are recorded in other comprehensive income and are reclassified to interest expense in the period in which earnings are impacted by the hedged items or in the period that the transaction no longer qualifies as a cash flow hedge. The ineffective portions of the changes in fair values of the derivatives are recorded in interest expense in the period ineffectiveness is determined.
If no hedging relationship is designated, derivatives are marked to market through the statement of operations. Cash flows from derivatives are recognized in the statement of cash flows in a manner consistent with the underlying transactions.
See Note 24 to our Audited Consolidated and Combined Financial Statements included elsewhere in this prospectus for further detail on our derivatives and hedging instruments.
98
Table of Contents
Foreign Currency Translation
Successor periods
Our reporting currency is the U.S. dollar. As a result of the Acquisition, we reevaluated our functional currency accounting conclusions. Due primarily to our new legal entity organization structure, global cash management and raw material sourcing strategies, we determined that the functional currency of certain subsidiaries operating outside of the United States is the local currency of the respective subsidiaries. Assets and liabilities of these operations are translated into U.S. dollars at end-of-period exchange rates; income and expenses are translated using the average exchange rates for the reporting period. Resulting cumulative translation adjustments are recorded as a component of shareholders’ equity in the consolidated balance sheet.
Gains and losses from transactions denominated in foreign currencies other than an entities’ functional currency are included in the consolidated statement of operations in Other expense, net.
Predecessor periods
For the Predecessor period, our reporting currency was the U.S. dollar. DuPont management determined that the U.S. dollar was the functional currency of DPC’s legal entities and this functional currency was appropriate for the DPC organizational legal entity structure and the economic environment in which DPC operated during the period covered by the Predecessor combined financial statements. For these legal entities, foreign currency denominated asset and liability amounts were remeasured into U.S. dollars at the end-of-period exchange rates. Nonmonetary assets, such as inventories, prepaid expenses, fixed assets and intangible assets were remeasured in U.S. dollars at historical exchange rates. Foreign currency denominated income and expense elements were remeasured into U.S. dollars at average exchange rates in effect during the year, except for expenses related to nonmonetary assets, which were remeasured at historical exchange rates.
Gains and losses from transactions denominated in foreign currencies other than an entities’ functional currency are included in the combined statement of operations in Other expense, net.
Allowance for doubtful accounts
We maintain an allowance for doubtful accounts that reduces receivables to amounts that are expected to be collected. In estimating the allowance, management considers factors such as current overall geographic and industry-specific economic conditions, statutory requirements, accounts receivable turnover, historical and anticipated customer performance, historical experience with write-offs as a standalone company and the level of past-due amounts. Changes in these conditions may result in additional allowances. After all attempts to collect a receivable have failed and local legal requirements are met, the receivable is written off against the allowance.
Contingencies
Contingencies, by their nature, relate to uncertainties that require management to exercise judgment both in assessing the likelihood that a liability has been incurred as well as in estimating the amount of potential loss. The most important contingencies impacting our financial statements are those related to environmental remediation, pending or threatened litigation against the Company and the resolution of matters related to open tax years.
Environmental remediation costs are accrued when it is probable that a liability has been incurred and the amount can be reasonably estimated. Estimates of environmental reserves require evaluating government regulation, available technology, site-specific information and remediation alternatives. We accrue an amount equal to our best estimate of the costs to remediate based upon the available information. The extent of environmental impacts may not be fully known and the processes and costs of remediation may change as new information is obtained or technology for remediation is improved. Our process for estimating the expected cost for remediation
99
Table of Contents
considers the information available, technology that can be utilized and estimates of the extent of environmental damage. Adjustments to our estimates are made periodically as remediation progresses and additional information is received.
We are subject to legal proceedings and claims arising out of our business operations. We routinely assess the likelihood of any adverse outcomes to these matters, as well as ranges of probable losses. A determination of the amount of the reserves required, if any, for these contingencies is made after analysis of each known claim. We have an active risk management program consisting of numerous insurance policies secured from many carriers. These policies often provide coverage that is intended to minimize the financial impact, if any, of the legal proceedings. The required reserves may change in the future due to new developments in each matter.
For more information on these matters, see Note 9 and Note 14 to our Audited Consolidated and Combined Financial Statements included elsewhere in this prospectus.
100
Table of Contents
In 2013, we were the fourth largest supplier in the $127 billion global coatings industry as measured by sales, according to Orr & Boss. The global coatings industry is characterized by multiple end-markets and applications. Market participants include a few global coatings suppliers and many smaller, regionally focused suppliers that maintain a presence in select product categories and local markets.
Within the broad global coatings market, we focus on automotive refinish, light vehicle, commercial vehicle and industrial end-markets, which Orr & Boss estimates to collectively represent $37 billion of annual sales. The chart below illustrates the composition of the global coatings industry by application and indicates the end-markets in which we participate:
We operate in attractive end-markets, with the top four suppliers collectively holding an estimated 67% market share in the automotive refinish end-market and 74% market share in the light vehicle end-market. This structure is a result of few suppliers having the technological capabilities, global manufacturing footprint, efficient supply chain, and overall scale to meet customer needs. These characteristics allow global coatings providers to serve customers locally while continuing to leverage global innovation, product platforms, relationships and best practices.
The refinish, industrial, light vehicle and commercial vehicle end-markets are collectively expected to grow at a CAGR of 5.8%, or $12.2 billion, from 2013 to 2018, according to Orr & Boss. This growth is due to specific end-market drivers as well as key industry trends, which favor large multi-national suppliers, including:
| • | Increasingly stringent environmental regulations: Evolving regulations in all major geographies have placed limits on the emission of VOCs and HAPs. As a result, customers are shifting toward regulation-compliant, low-VOC solventborne and waterborne coatings. Few coatings suppliers have the technology and products to meet these increasingly stringent requirements. |
| • | Global procurement model: Multi-national light vehicle OEMs are increasingly utilizing global procurement teams to stipulate product specifications and color standardization requirements, which are implemented at the local level. These customers select coatings providers on the basis of their ability to consistently deliver advanced technological solutions on a global basis. |
| • | Increased efficiency: Customers are encouraging coatings manufacturers to invest in new product offerings that require fewer application steps, resulting in lower capital and energy costs. |
| • | Vehicle light-weighting: With more stringent vehicle emissions and fuel consumption regulations, light vehicle OEMs are focused on reducing vehicle weight to improve fuel economy. This is driving the |
101
Table of Contents
| need for new, and frequently multiple, substrates on the exterior of the vehicle. Historically, OEMs have manufactured vehicles primarily with steel components but are now increasingly incorporating other materials, including aluminum, carbon fiber and plastics. These materials often require specialized primers and low-temperature curing formulations to achieve uniform appearance, color and finish. |
| • | Emerging market growth: Emerging market demand in our end-markets is expected to grow at a CAGR of approximately 8.4% from 2013 to 2018, according to Orr & Boss. This is primarily due to increased government infrastructure spending and increased middle class consumption, which will increase the car parc. As per-capita wealth expands, consumers are also demanding higher-quality products, driving demand for more advanced coatings systems in these markets. |
102
Table of Contents
We are a leading global manufacturer, marketer and distributor of high performance coatings systems. We generate approximately 90% of our revenue in markets where we hold the #1 or #2 global market position, including the #1 position in our core automotive refinish end-market with approximately a 25% global market share. We have a nearly 150-year heritage in the coatings industry and are known for manufacturing high-quality products with well-recognized brands supported by market-leading technology and customer service. Over the course of our history we have remained at the forefront of our industry by continually developing innovative coatings technologies designed to enhance the performance and appearance of our customers’ products, while improving their productivity and profitability.
Our diverse global footprint of 35 manufacturing facilities, 7 technology centers, 45 customer training centers and approximately 12,600 employees allows us to meet the needs of customers in over 130 countries. We serve our customer base through an extensive sales force and technical support organization, as well as through over 4,000 independent, locally-based distributors. Our scale and strong local presence are critical to our success, allowing us to leverage our technology portfolio and customer relationships globally while meeting customer demands locally.
For the year ended December 31, 2014, our net sales were $4,362 million, Adjusted EBITDA was $841 million, or 19.3% of net sales, and net income was $35 million. We have renewed the organization’s focus on profitable growth, achieving year-over-year Adjusted EBITDA growth for each of the seven full quarters following the Acquisition. Additionally, we have undertaken several transformational initiatives that we believe have laid the foundation for future growth, resulting in significant new business wins, many of which we expect to contribute to sales beginning in 2015. We have also begun implementing several EBITDA enhancement initiatives that we believe will drive meaningful earnings growth over the next several years. As of December 31, 2014, we had cash and cash equivalents of $382 million and outstanding indebtedness of $3,696 million, which may limit the availability of financial resources to pursue our growth initiatives.
Our business is organized into two segments, Performance Coatings and Transportation Coatings, serving four end-markets globally as highlighted below:
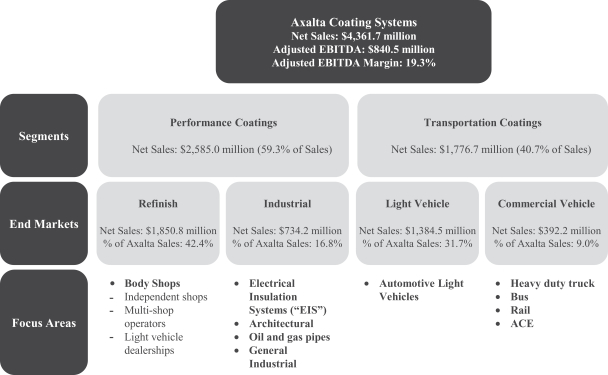
Note: Financial results presented reflect results for the year ended December 31, 2014.
103
Table of Contents
Segment Overview
Performance Coatings
Through our Performance Coatings segment, we provide high-quality liquid and powder coatings solutions to a fragmented and local customer base. We are one of only a few suppliers with the technology to provide precise color matching and highly durable coatings systems. The end-markets within this segment are refinish and industrial.
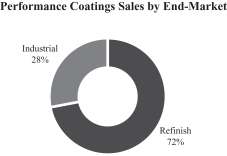
|
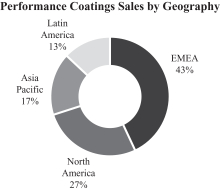
|
Performance Coatings End-Markets
Refinish
The refinish end-market represented an estimated $7.3 billion in 2013 global sales according to Orr & Boss. We hold the #1 global market position in this end-market with an estimated 25% share, based on our 2013 net sales of $1.8 billion. The global automotive refinish end-market grew at a CAGR of approximately 2.3% from 2008 to 2013 and is expected to grow at a CAGR of approximately 4.3% from 2013 to 2018, according to Orr & Boss.
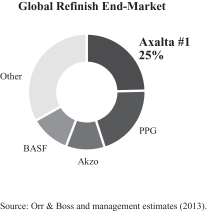
|
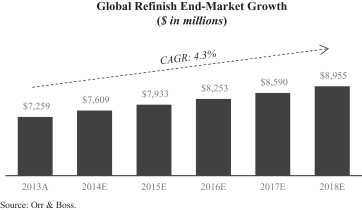
|
Sales in the refinish end-market are driven by the number of vehicle collisions and owners’ propensity to repair their vehicles. The number of vehicle collisions in a given market is primarily determined by the size of the car parc and the aggregate number of miles driven in that market. The refinish end-market is expected to grow annually at 3.2% and 2.5% from 2013 to 2018 in EMEA and North America, respectively. In emerging markets, rising per capita income and a growing middle class are expected to drive continued increases in vehicle sales and size of the car parc, resulting in a projected market CAGR of 7.7% from 2013 to 2018.
104
Table of Contents
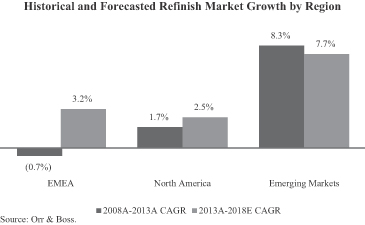
Although refinish coatings typically represent only a small portion of the overall vehicle repair cost, they are critical to the vehicle owner’s satisfaction given their impact on appearance. As a result, body shop operators are most focused on coatings brands with a strong track record of performance and reliability. Body shops look for suppliers and brands with productivity enhancements, regulatory compliance, consistent quality, the presence of ongoing technical support and exact color match technologies. Color matching is a critical component of coatings supplier selection, since inexact matching adversely impacts vehicle appearance and can significantly impact the speed and volume of repairs at a given shop.
We develop, market and supply a complete portfolio of innovative coatings systems and color matching technologies to facilitate faster automotive collision repairs relative to competing technologies. Our color matching technology provides Axalta-specific formulations that enable body shops to accurately match thousands of vehicle colors, regardless of vehicle brand, color, age or supplier of the original paint during production. It would be time consuming and costly for a new entrant to create such an extensive color inventory. We believe that our global footprint, strong customer value proposition and portfolio of advanced coatings technologies position us to maintain and grow our market-leading position in refinish.
Industrial
The industrial end-market represented an estimated $19.7 billion in 2013 global sales, growing at a CAGR of approximately 5.6% from 2008 to 2013, and is forecasted to grow at a CAGR of approximately 6.8% from 2013 to 2018, according to Orr & Boss.
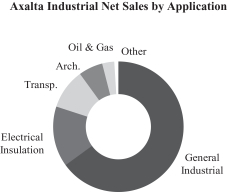
|
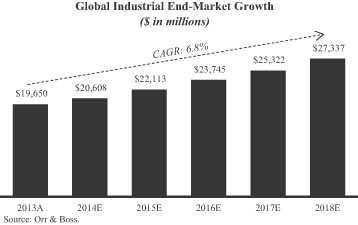
|
105
Table of Contents
The industrial end-market is comprised of liquid and powder coatings used in a broad array of end-market applications. Within the industrial end-market, we focus on the following:
| • | General Industrial: coatings for a wide and diverse array of applications, including HVAC, shelving, appliances and electrical storage components, as well as specialized coatings used for coating the interior of metal drums and packaging. |
| • | Electrical Insulation: coatings to insulate copper wire used in motors and transformers and coatings to insulate sheets forming magnetic circuits of motors and transformers. |
| • | Architectural: exterior powder coatings typically used in the construction of commercial structures, residential windows and doors, as well as liquid interior and exterior house paint. |
| • | Transportation: coatings for automotive components, chassis and wheels to protect against corrosion, provide increased durability and impart appropriate aesthetics. |
| • | Oil & Gas: powder products to coat tanks, pipelines, valves and fittings protecting against chemicals, corrosion and extreme temperatures in the oil & gas industry. |
Demand in this end-market is driven by a wide variety of macroeconomic factors, such as growth in GDP and industrial production. There has also been an increase in demand for products that enhance environmental sustainability, corrosion resistance and productivity. These global trends are bolstered by regional and industry specific trends. Customers select industrial coatings based on protection, durability and appearance.
Performance Coatings Products and Brands
We offer a comprehensive range of specially-formulated waterborne and solventborne products and systems used by the global automotive repair industry to refinish damaged vehicles. Our refinish products and systems include a range of coatings layers required to match the vehicle’s color and appearance, producing an indistinguishable repair. These layers include:
| • | Primer: designed to inhibit corrosion while providing a smooth sub-surface for the basecoat. |
| • | Basecoat: contains colored, metallic and effect pigments to match the vehicle’s color and aesthetics. |
| • | Clearcoat: final coat that protects the colored basecoat from the environment and provides a glossy finish. |
| • | Thinners & Reducers: used in all stages of the process for managing rheology, flow and drying rates. |
We provide a system that allows body shops to match 180,000 active color variations in the global market. Our color science is manifested in our tints, one of the most technologically advanced parts of the refinish coatings system, which makes up the majority of our products in a body shop. We have a large color library composed of over 4.2 million colors and a number of well-known, long-standing brands, including Cromax, Standox and Spies Hecker. Spies Hecker and Standox are two of our oldest brands, first introduced in 1882 and 1955, respectively.
Our color matching and retrieval systems allow customers to quickly match any color, preventing body shop technicians from having to repeat the color matching process multiple times, saving time and materials. The color matching process begins with a technician scanning a damaged vehicle with one of our advanced color matching tools, such as our AcquireRx hand-held spectrophotometer. AcquireRx will determine the unique flake and color characteristics for the specific vehicle. These characteristics may vary significantly, even for vehicles of the same make, model and original color, based on a variety of factors, including a vehicle’s age, plant at which it was assembled, weather conditions and operating history. AcquireRx electronically connects with our ColorNet database, which indicates to the technician the precise mix of tints and colors needed to recreate that specific color instance. In addition to AcquireRx, we offer our customers several other color matching tools, including our VINdicator database, which identifies vehicle color based on its vehicle identification number, and traditional color matching wheels.
106
Table of Contents
We are also a leading global developer, manufacturer and supplier of functional and decorative liquid and powder coatings for a large number of diversified applications in the industrial end-market. We provide a full portfolio of products for applications including architectural cladding and fittings, automotive coatings, general industrial, job coaters, electrical insulation coatings, HVAC, appliances, rebar and oil & gas pipelines. Our liquid systems are used to provide insulation and corrosion protection for electrical conductors and components, provide chemical resistance for the interiors of metal packaging drums, protect automotive parts and serve as basecoats for alloy and steel wheels. Powder coatings products, where we hold the #2 global market position, are often an environmentally responsible, lower cost alternative to liquid coatings. These coatings are typically electrostatically sprayed using a specialized spray gun and cured to create a uniform, high-quality finish. In the oil & gas industry our powder products are used to protect components from corrosion and severe conditions such as extreme temperatures.
Our industrial brands include Voltatex, AquaEC, Chemophan, Lutophen, Stollaquid and Syntopal for liquid coatings and Alesta, Nap-Gard and Abcite for powder.
Performance Coatings Sales, Marketing and Distribution
We leverage a large global refinish sales and technical support team to effectively serve our broad refinish customer base of approximately 80,000 body shops. The majority of our products are supplied by our network of over 4,000 independent local distributors. In select regions, such as in parts of Europe, we also sell directly to customers. Distributors maintain an inventory of our products to fill orders from body shops in their market and assume credit risk and responsibility for logistics, delivery and billing. In certain countries, we utilize importers that buy directly from us and actively market our products to body shops. Our relationships with our top ten distributors are longstanding, with an average relationship length of over 30 years.
Our large sales force manages relationships directly with our customers to drive demand for our products, which in turn are purchased through our distributor network. Due to the local nature of the refinish industry, our sales force operates on a regional/country basis to provide clients with responsive customer service and local insight. As part of their coverage efforts, salespeople introduce new products to body shops and provide technical support and ongoing training. We have established 45 customer training centers, which helps to deepen our customer relationships.
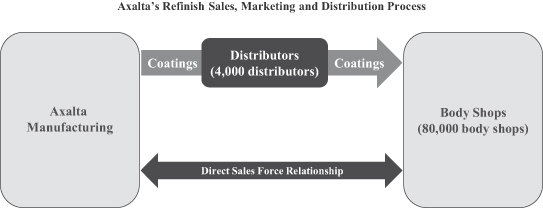
Our sales force also helps to drive shop productivity improvements and to install or upgrade body shop color matching and mixing equipment to improve shop profitability. Once a coating and color system is installed, a body shop almost exclusively uses its specific supplier’s products. The proprietary nature of a coatings supplier’s color systems, the substantial inventory needed to support a body shop and the body shop’s familiarity with an established brand lead to high levels of customer retention. Historically, our customer retention rate has been around 95%.
107
Table of Contents
To effectively reach our customers in the industrial end-market we generally ship directly and leverage a dedicated sales force and technical service team that operates on a regional basis. We are one of only three truly global powder coatings producers that can satisfy the needs and specifications of a customer in multiple regions of the world, while maximizing productivity from the broad scale and scope of our operations.
Performance Coatings Customers
Within our Performance Coatings segment, we sell coatings to customers in more than 130 countries. No single customer represented more than 5% of our Performance Coatings net sales and our top ten customers accounted for less than 15% of our Performance Coatings net sales during the year ended December 31, 2014.
We serve a broad, fragmented customer base of approximately 80,000 body shops, including:
| • | Independent Body Shops: Single location body shops that utilize premium, mainstream, or economy brands based on the local market. |
| • | Multi-Shop Operators: Body shops with more than one location focused on providing premium paint jobs with industry leading efficiency. MSOs use premium/mainstream coatings and state-of-the-art painting technology to increase shop productivity, allowing them to repair more vehicles faster. |
| • | OEM Dealership Body Shops: High-productivity body shops, located in OEM car dealerships, that operate like MSOs and provide premium services to customers using premium/mainstream coatings. |
Within North America, we believe MSOs are the fastest growing customer segment, gaining influence and share relative to other body shop segments. Underlying this trend is the MSOs’ ability to reduce repair costs for insurers, while also increasing operational consistency. As a result of this productivity and consistency, insurers have used Direct Repair Programs (DRPs) to direct traffic to MSOs, increasing their growth. We believe, based on management estimates, that we hold the #1 market position with MSOs in North America and are well positioned to grow with these customers in the future.
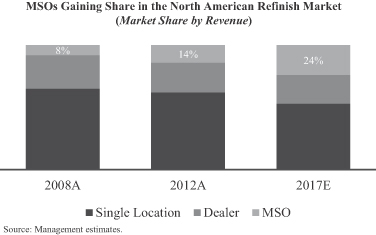
Performance Coatings Competition
Our primary competitors in the refinish end-market include PPG, BASF and Akzo Nobel, but we also compete against regional players in local markets. Similarly, in industrial coatings, we compete against multi-national suppliers, such as Akzo Nobel, PPG, Valspar and BASF, and regional players in local markets. We are one of the few performance coatings companies that can provide the customer service, technology, color design capability and product performance necessary to deliver exceptional value to our customers.
108
Table of Contents
Transportation Coatings
Through our Transportation Coatings segment, we provide advanced coating technologies to OEMs of light and commercial vehicles. These increasingly global customers require a high level of technical support coupled with cost-effective, environmentally responsible coatings systems that can be applied with a high degree of precision, consistency and speed.
|
|
| |
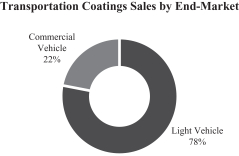
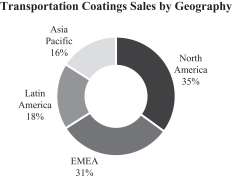
Transportation Coatings End-Markets
Light Vehicle
The light vehicle end-market represented an estimated $7.3 billion in 2013 global sales, according to Orr & Boss. We hold the #2 global market position in this end-market with an estimated 19% share, based on our 2013 net sales of $1.4 billion. Sales in this end-market are driven by new vehicle production. The global light vehicle end-market grew at a CAGR of approximately 4.6% from 2008 to 2013 and is expected to grow at a CAGR of approximately 4.9% from 2013 to 2018, according to Orr & Boss, as new vehicle production is expected to grow at a CAGR of approximately 3.8% from 2013 to 2018, according to LMC Automotive.
|
|
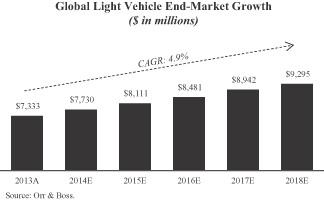
|
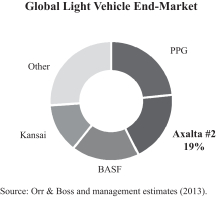
109
Table of Contents
Demand for light vehicle products is driven by the production of light vehicles in a particular region. Light vehicle production growth is expected to be highest in emerging markets where OEMs plan to open 68 new plants between 2014 and 2017, resulting in a light vehicle coatings CAGR of approximately 7.4% from 2013 to 2018, according to Orr & Boss.
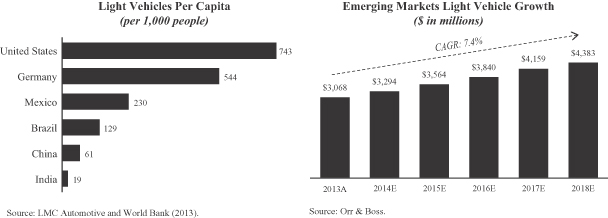
Light vehicle OEMs select coatings providers on the basis of their global ability to deliver advanced technological solutions that improve exterior appearance and durability and provide long-term corrosion protection. Customers also look for suppliers that can enhance process efficiency to reduce overall manufacturing costs and provide on-site technical support. Rigorous environmental and durability testing as well as obtaining engineering approvals are also key criteria used by global light vehicle OEMs when selecting coatings providers. Globally integrated suppliers are important because they offer products with consistent standards across regions and are able to deliver high-quality products in sufficient quantity while meeting OEM service requirements. Our global scale, differentiated technology platform and customer focus, including on-site support, position us to be a global partner and solutions provider to the most discerning and demanding light vehicle OEMs. We are one of the few coatings producers that can provide OEMs with global product specifications, standardized color development, compatibility with an ever-increasing number of substrates, increasingly complex colors and environmentally responsible coatings while continuing to simplify and reduce steps in the coatings application process.
Commercial Vehicle
The commercial vehicle end-market represented an estimated $3.3 billion in 2013 global sales, according to Orr & Boss. The commercial vehicle end-market grew at a CAGR of approximately 1.5% from 2008 to 2013 and is expected to grow at a CAGR of approximately 4.8% from 2013 to 2018, according to Orr & Boss.
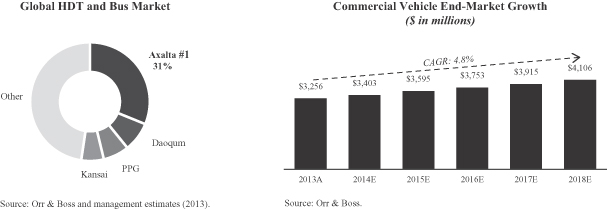
110
Table of Contents
Sales in the commercial vehicle end-market are generated from a variety of applications including non-automotive transportation (e.g., HDT, bus and rail) and ACE, as well as related markets such as trailers, recreational vehicles and personal sport vehicles. This end-market is primarily driven by global commercial vehicle production, which is influenced by overall economic activity, government infrastructure spending, equipment replacement cycles and evolving environmental standards.
We hold the #1 market position in the global HDT and bus market with a 31% share. We have a particularly strong presence in the North American HDT market as a result of our leading Imron brand, extensive color library and dedication to service. Since the Acquisition, we have increased our focus on globalizing our HDT business, particularly in China where commercial vehicle OEMs produce nearly four times the number of trucks produced in North America. In 2014, we began serving Foton Daimler, one of the largest truck manufacturers in the region with our high-performance waterborne coatings. We believe our broad portfolio of products, advanced technology and significant manufacturing capabilities will enable us to build upon this success and further penetrate the market.
Commercial vehicle OEMs select coatings providers on the basis of their ability to consistently deliver advanced technological solutions that improve exterior appearance, protection and durability and provide extensive color libraries and matching capabilities at the lowest total cost-in-use, while meeting stringent environmental requirements. Particularly for HDT applications, truck owners demand a greater variety of custom colors and advanced product technologies to enable custom designs. Our strong market position and growth are driven by our ability to provide customers with our market-leading brand, Imron, as well as leveraging our global product lines, regional knowledge and service. Additionally, to capture further growth we are launching a new suite of products to meet our customers’ evolving needs.
Transportation Coatings Products and Brands
We develop and supply a complete coatings product line for light vehicle OEMs for the original coating of new vehicles. Products are designed to enhance the styling and appearance of a vehicle’s exterior while providing protection from the elements, extending the life of the vehicle. Widely recognized in the industry for our advanced and patented technologies, our products not only increase productivity and profitability for OEMs but also produce attractive and durable finishes. Our light vehicle coatings portfolio is one of the broadest in the industry.
The coatings operation is a critical component of the vehicle assembly process, requiring a high degree of precision and speed. The paint shop process typically includes a dip process, three application zones and three high-temperature ovens that cure each coating layer at temperatures ranging from 320°F to 400°F (i.e., “high bake”). Our key products consist of the four main coatings layers:
| • | Electrocoat: We offer a complete line of electrocoats including lead-, tin- and HAP-free and high throw-power coatings systems. |
| • | Primer: We manufacture advanced technology primers to meet any OEM requirement including high solids solventborne, waterborne and wet-on-wet consolidated process primers. |
| • | Basecoat: We are a global leader in wet-on-wet applications for consolidated processes in both solventborne and waterborne basecoats and offer a complete color palette in solventborne and waterborne basecoats in both conventional and consolidated processes. |
| • | Clearcoat: We provide a full line of clearcoat technology that can be specifically adapted to OEM requirements and plant application conditions. We pioneered silane-based, one-component etch resistant clearcoats and superior appearance and durability two-component urethane clearcoats. |
111
Table of Contents
The coatings process accounts for a majority of the total energy consumed during the vehicle manufacturing process. As a result, we have developed consolidated systems that help our OEM customers lower costs by reducing energy consumption while increasing productivity. For example, our Eco-Concept and 3-Wet systems eliminate an energy-intensive baking step in the coating process, as shown in the graphic below.
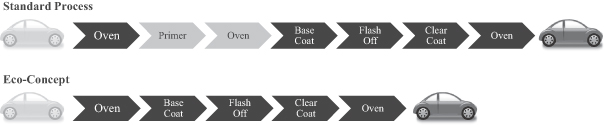
OEMs are also increasingly looking to reduce the weight of vehicles in response to increasing vehicle emissions and fuel consumption regulations. As a result, OEMs are constructing vehicle platforms using a variety of new materials in addition to steel and plastic, including aluminum, carbon fiber and other substrates, each of which requires specialized coatings formulations to create a uniform color and finish. We continue to innovate with our OEM customers in driving this trend, as evidenced by use of our coatings on their flagship vehicle platforms.
We also develop and supply a wide array of coatings systems for a broad range of commercial applications including HDT, bus, rail and ACE. These products simultaneously enhance aesthetic appearance and provide protection from the elements. We meet the demands of commercial vehicle customers with our extensive offering of over 70,000 different colors. In the HDT market, because the metal and composite components are painted simultaneously in an automatic process, most truck OEMs use low bake coatings to ensure that the plastic composite parts on a truck’s exterior do not deform during the process. Truck owners demand a wide variety of custom colors that are formulated using a combination of on-site mixing machines at the OEM or direct shipments of premixed high volume colors from us. Our commercial vehicle brands include Imron, Imron ExcelPro, Imron Elite, Centari, Rival, Corlar epoxy undercoats and AquaEC.
Transportation Coatings Sales, Marketing and Distribution
We have full-time technical representatives stationed at OEM facilities around the world. These on-site representatives provide customer support, monitor the painting process and track paint demand at each assembly plant. Monitoring OEM line performance in real-time allows our technical support teams to help improve paint department operating efficiency and provide performance feedback to our formulating chemists and paint manufacturing teams. Our customer technical support representatives also help OEMs manage their physical inventory by forecasting facility coatings demand based on the customer’s build schedule.
We sell and ship products directly to light vehicle OEM customers in each of our four regions coordinated via a global point of contact for each customer, and assist OEMs with on-site customer support. Located in 12 countries, our manufacturing facilities provide a local presence that enables us to cultivate strong relationships, gain intimate customer knowledge, provide superior technical support to our key customers and maintain “just-in-time” product delivery capabilities critical to OEMs. Our local presence also allows us to quickly react to changing local dynamics, offer high-quality products and provide excellent customer service.
Since the Acquisition, we have re-aligned our light vehicle organization to better reflect the global nature of our customer base. This realignment has included recruiting a global head of light vehicle with extensive automotive experience as well as the development of global account teams to serve as primary points of contact for our OEM customers. These changes have had a significant impact on our business, contributing to new business awards in over 30 OEM plants globally since the beginning of 2013.
112
Table of Contents
In the commercial vehicle end-market, we employ a dedicated sales and technical service team to support our diverse customer base, including a direct sales force supporting the HDT market. We ship our coatings directly to commercial vehicle OEMs and provide on-site technical service representatives that play an important role by helping optimize the painting process and by providing responsive customer support.
Transportation Coatings Customers
We provide our products to light and commercial vehicle customers at over 200 assembly plants worldwide, including nine of the top ten global automotive manufacturers. We have a stable customer base with several relationships dating back approximately 90 years and believe we are well positioned with the fastest growing OEMs in both the developed and emerging markets.
Within our Transportation Coatings segment, we sell coatings to approximately 1,900 customers in more than 60 countries. No single customer represented more than 19% of our Transportation Coatings net sales, and our top ten customers accounted for 73% of our Transportation Coatings net sales during the year ended December 31, 2014.
Transportation Coatings Competition
We primarily compete against large multi-national suppliers such as PPG and BASF in the light and commercial vehicle end-markets. Additionally, we compete against certain regional players in Asia Pacific. With our state-of-the-art coatings solutions and local presence in key OEM markets, we are one of the few competitors in the industry that offers global manufacturers the combination of high-quality products, personalized, top-rate technical service and short lead-times for product delivery.
Our Competitive Strengths
Leading positions in attractive end-markets
We are a global leader in manufacturing, marketing and distributing advanced coatings systems with approximately 90% of our revenue generated in markets where we hold the #1 or #2 global market position. We are one of only a small number of global coatings suppliers in each of our end-markets, which positions us favorably in an industry where global scale is a competitive advantage.
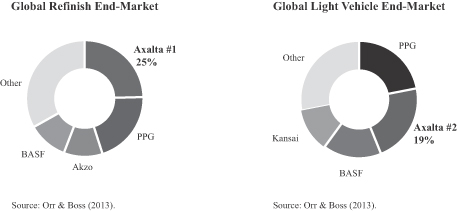
Market-leading refinish business driven by recurring aftermarket sales: We are the leading coatings supplier to the global automotive refinish end-market where we hold an estimated 25% share and the top four global suppliers hold an estimated 67% share. This end-market has consistently grown across economic cycles as the
113
Table of Contents
overall rate of collisions and repairs are not highly cyclical. Our refinish products offer quality, durability and superior color technology supported by a large color formula library that enables customers to precisely match colors. We supply our fragmented customer base of approximately 80,000 body shops through a global network of over 4,000 independent local distributors. Furthermore, body shops utilize our color matching system, inventory replacement process and training capabilities, which foster brand loyalty and have historically resulted in a high customer retention rate.
Well positioned in light vehicle end-market poised for growth: We are the second largest coatings provider to the global light vehicle end-market, which is expected to grow at a CAGR of approximately 4.9% from 2013 to 2018, according to Orr & Boss. In this end-market, the top four suppliers hold an estimated 74% share. We have developed a full complement of unique consolidated coating systems. These integrated solutions include our “Eco-Concept,” “3-Wet” and “2-Wet Monocoat” products that provide our customers with advanced, environmentally responsible systems that eliminate either a coatings layer or steps in the coatings process, thereby increasing productivity and reducing energy costs. In addition, we offer our customers on-site technical services as well as “just-in-time” product delivery. We are an integrated part of our customers’ assembly lines, which allows our technical support teams to improve operating efficiency and provide real-time performance feedback to our formulating chemists and manufacturing teams. We have been awarded new business in over 30 OEM plants globally since the beginning of 2013, demonstrating the strength of our competitive positioning. We expect to recognize sales from the majority of these new contracts in 2015.
Sustainable competitive advantages driven by global scale, established brands and technology
We believe that we are one of only a few coatings providers that have the scale, manufacturing capabilities, brand reputation and technology to meet the purchasing criteria that are most critical to our customers on a global basis.
Our extensive manufacturing and distribution networks as well as our high-caliber technical capabilities enable us to meet customers’ volume and service requirements without interruption. Our global footprint also enables us to react quickly to changing local dynamics while leveraging our overall scale to cost-effectively develop and deliver leading edge technologies and solutions. In refinish, our scale gives us the ability to convert a large number of body shops to our systems in a short period of time, which has been a key competitive advantage in the growing North American MSO segment. Additionally, our scale and technical abilities enable us to meet the needs of our multi-national light vehicle customers, who increasingly require dedicated global account teams and high-quality, advanced coatings systems that can be applied consistently to global vehicle platforms.
Branding is another key factor that customers consider when choosing a coatings provider. Customers typically look to established brands when making their purchase decisions in our refinish, industrial and commercial vehicle end-markets. We have an extensive portfolio of established brands that leverage our advanced technology and a nearly 150 year heritage including our flagship global brand families of Cromax, Standox, Spies Hecker and Imron liquid products, our Alesta and Nap-Gard powder products and our Voltatex electrical insulation coatings.
Our technology is also a key competitive advantage. Our technology portfolio includes over 1,700 patents issued or pending and includes key assets such as our extensive color database and color matching technology, advanced multi-substrate formulations, process technology and VOC-compliant products. Our technology is developed and supported by our extensive research, development and technical resources, including over 1,300 employees. In addition to developing new and innovative products, we also provide significant technical assistance to our customers in the initial integration of our systems and technologies into their operations as well as ongoing assistance to support their operations. We also benefit from technology synergies across our end-markets. The colors, coatings properties and multi-substrate formulations we develop as a light vehicle coatings manufacturer help us sustain our leading refinish market position as we leverage insights from new light vehicle coatings to help develop innovative refinish coatings in the future.
114
Table of Contents
Diverse revenue base
We generate our revenue from diverse end-markets, customers and geographies, which has historically reduced the financial impact of any single end-market, customer or region and limited the impact of economic cycles. Net sales in our end-markets of refinish, light vehicle, industrial and commercial vehicle represented 42%, 32%, 17% and 9% of net sales during the year ended December 31, 2014, respectively. We also serve a globally diverse and highly fragmented customer base, with no single customer representing more than 7.7% of our net sales, and our top ten customers representing approximately 32% of our net sales during the year ended December 31, 2014. Additionally, we generated approximately 39% of our net sales in EMEA, 30% in North America, 16% in Asia Pacific and 15% in Latin America during the year ended December 31, 2014. Our global reach positions us to benefit from emerging market growth in Asia, Latin America and Eastern Europe as well as the continued economic recovery in Western Europe and economic strength of the United States.
Strong financial performance and cash flow characteristics
We have an attractive financial profile with gross margins of 34.3% and Adjusted EBITDA margins of 19.3% for the year ended December 31, 2014.
The refinish end-market serves as the foundation of our financial profile, representing 42% of our consolidated net sales for the year ended December 31, 2014. Our track record of consistent price increases driving strong Adjusted EBITDA performance and low levels of maintenance capital expenditures has allowed us to consistently generate strong cash flows that we are re-investing in the business to position us for future earnings growth.

We have generated year-over-year Adjusted EBITDA growth for each of the seven full quarters since the Acquisition, driven in part by the initial impact of our transformational growth initiatives. In addition, we have implemented numerous initiatives intended to reduce our fixed and variable costs and improve working capital productivity. Examples include transitioning our IT systems to more cost-effective solutions that better meet our needs as an independent company, developing a global procurement team to reduce procurement costs, and investing in a European manufacturing re-alignment to position the region for profitable growth. We believe that these initiatives will continue to generate significant cost savings in the future. Many are in their early stages of implementation and have only recently begun to contribute to our financial results.
Experienced management team
We have augmented our management team with world-class talent and meaningful end-market expertise, with 13 of our 17 most senior managers joining since the Acquisition. We have also recruited key regional and local managers with both operational and commercial leadership experience. This team has added new and diverse
115
Table of Contents
perspectives to the business from a range of industries. Our management team is led by our CEO, Charlie Shaver, who has over 34 years of chemical and global operating experience, including most recently President and CEO of TPC Group. He is supported by a senior management team comprised of global, regional and country focused leaders with diverse backgrounds and skill sets. The management team has extensive international experience with a strong track record of improving operations and executing strategic growth initiatives, including mergers and acquisitions.
Our Business Strategy
Pursue and execute new business wins in high-growth areas of our end-markets
We have aligned our resources to better serve the high-growth areas of our refinish and light vehicle end-markets. In the North American refinish end-market, we have created dedicated sales, conversion and service teams to serve MSOs, which are gaining share in the North American collision repair market by reducing insurance company costs and providing consistently high customer satisfaction. Through new business wins with MSO customers, we have become a leading coatings provider to the North American MSO market, which we expect to grow from 14% of the North American collision repair market in 2012 to 24% by 2017. We are targeting growth opportunities with both existing MSO and new MSO accounts and believe that we are well positioned to gain additional share as result of our dedicated account teams, high productivity offerings and broad distribution network.
We have been awarded new business in over 30 OEM plants globally since the beginning of 2013, with 16 of these plants located in China, where OEMs are rapidly expanding production to meet increasing demand for new vehicles. We expect that many of these new contracts will begin generating sales in 2015. Our success in this end-market has been driven by a new leadership team that has restructured our organization to mirror the increasingly global focus of OEMs. We will continue to pursue business in new plants in emerging markets such as China, Mexico and Eastern Europe, by leveraging our proprietary manufacturing processes, our broad range of VOC-compliant coatings and our substantial sales and technical support organizations.
Accelerate growth in emerging markets
We have a strong presence in emerging markets, which generated 25% of our sales during the year ended December 31, 2014. These markets are characterized by increasing levels of vehicle production, a growing car parc, an expanding middle class and GDP growth above the global average, all of which drive greater demand for coatings. We believe that we are well positioned to capitalize on this increasing demand with local manufacturing facilities and extensive sales and technical service teams dedicated to these markets. In China, where we have operated a wholly owned business for 30 years, we are expanding our sales force and have invested in new plant capacity, including a $50 million waterborne capacity expansion at our Jiading facility, which came on line in March 2015. We are also in the process of expanding our production capacity in Mexico and Brazil to drive future earnings growth.
Globalize existing product lines
Since the Acquisition, we have identified significant opportunities to leverage our existing products across geographies. For example, we are the market leader in the North American HDT market, but only recently began serving the Chinese market, which produces nearly four times the number of heavy duty trucks produced in the United States. This initiative has generated early positive results; for example, in 2014 we began serving Foton Daimler, one of the largest truck manufacturers in the region, with our high performance waterborne coatings. As government regulations in China will require more environmentally responsible products in new production lines, we are well positioned to capture growth in the HDT end-market. In refinish, we are leveraging legacy formulations from developed markets to satisfy growing mainstream demand in emerging markets. We also intend to pursue similar geographic opportunities with several of our other industrial and commercial product offerings.
116
Table of Contents
Invest in high-return projects to drive earnings growth
We are in the early stages of implementing several initiatives that we believe will continue to generate significant earnings growth, including establishing a global procurement organization, executing improvement programs we have named “Fit-For Growth” and “The Axalta Way” and investing capital in growth projects with high expected returns. Since the Acquisition, we have built a global procurement organization, which is executing several programs to reduce costs by streamlining inputs, reducing the number of sole-sourced raw materials and partnering with new, high-quality suppliers to meet our purchasing needs. These purchasing programs are in their early stages and we believe they will continue to generate significant earnings growth over the next several years. Our Fit-For-Growth improvement initiative is focused in Europe, where we are investing to upgrade, automate and re-align disparate manufacturing operations to bring the region’s cost structure in line with the rest of the world and better position us to meet increasing local demand. We believe that Fit-For-Growth, which we began in 2014, will generate approximately $100 million of incremental Adjusted EBITDA by 2017 on a run-rate basis, of which we have already realized approximately $37 million. Our recently announced Axalta Way program, which will commence in 2015, is a global initiative focused on commercial alignment and cost reduction that we believe will generate an incremental $100 million of Adjusted EBITDA by the end of 2017 on a run-rate basis. Finally, we believe we have significant opportunities to pursue high return projects identified since the Acquisition. These include capacity expansion projects in China, Germany, Mexico and Brazil and productivity initiatives from which we expect to benefit over the next several years.
Maintain and further develop technology leadership
We will continue to build on our nearly 150-year heritage of developing market-leading technology. We leverage our intimate customer relationships and network of customer training centers to align product innovation with customer needs. For example, in the North American refinish end-market we have recently launched Cromax Mosaic, a new VOC-compliant solventborne coatings line, to complement our broad waterborne coatings portfolio. Body shops have embraced this product, which enables them to meet environmental regulations while using existing application equipment and techniques. We have a robust pipeline of over 100 new product innovations, the majority of which we intend to launch over the next two years, including several products focused on emerging markets. Similarly in the light vehicle end-market, our proprietary 3-Wet, Eco-Concept, 2-Wet monocoat systems and high throw electrocoat systems have generated new customer wins as OEMs seek to increase efficiency and reduce costs. We believe this commitment to new product development will help us maintain our technology leadership and strong market position.
Research and Development
Our focus on technology has allowed us to proactively provide customers with next-generation offerings that enhance productivity and satisfy increasingly strict environmental regulations. Since our entry into the coatings industry nearly 150 years ago, we believe we have consistently been at the forefront of coatings technology innovation. These innovations have played a fundamental role in our ability to maintain and grow our global market share as well as deliver substantial financial returns.
We believe that we are a technology leader well positioned to benefit from a continued industry shift to more productive, environmentally responsible products. Our technology development is led by a highly experienced and educated workforce that is focused on new product development, color development, technical customer support and improving our manufacturing processes. As such, our technology development covers two critical interrelated aspects for us, Research & Development as well as Technical Support & Development. In total, as of December 31, 2014, we have more than 1,300 employees dedicated to technology development. For the years ended December 31, 2014 and 2013, our research and development expenses were $49.5 million and $40.5 million, respectively. We operate seven technology centers throughout the world where we develop and align our technology investments with regional business needs.
117
Table of Contents
Intellectual Property
Our technology innovation efforts and industry expertise have built a strong intellectual property base of patents and trademarks. As of December 31, 2014, we had a portfolio of 1,200 issued patents and over 500 pending patent applications, as well as more than 250 trademarks, and we actively apply for patents and trademarks on new products and process innovations. In addition to protecting our technology with patents, we have a rich portfolio of proprietary technical knowledge, giving us a valuable competitive advantage in the industry.
Raw Materials
We use thousands of different raw materials, which fall into five broad categories: resins, pigments, solvents, monomers and additives. For the year ended December 31, 2014, our total raw material spend was approximately $1.4 billion, representing approximately 48% of our cost of sales. Approximately 80% of the raw materials we procure are derived from crude oil and natural gas. While prices for these raw materials fluctuate with energy prices, such fluctuations are mitigated by the fact that the majority of our raw materials are fourth to sixth generation derivatives of crude oil and natural gas. As a result, changes in the prices of our raw materials typically lag behind fluctuations in crude oil prices. Moreover, the dynamics of supply and demand play as important a role in our cost of raw materials as does the price of crude oil. Finally, non-petrochemical based inputs such as minerals that are used to manufacture coating pigments are not significantly affected by volatility in crude oil prices.
Since the Acquisition, we have created a global procurement department to help us control raw material spend. We have strong, long-standing relationships with our top suppliers and maintain multiple supplier relationships for most major raw materials in order to protect against potential work stoppages and/or significant price increases. However, we have also been focused on locating and qualifying new suppliers in developing countries to help with cost savings and localized supply, as well as to limit the number of sole sourced inputs. We purchase from a diverse group of suppliers of raw materials, with our top ten suppliers representing approximately 39% of our 2014 spending on raw materials.
Historically, to manage raw material volatility, we have used a combination of price increases to customers and, in limited circumstances, contractual raw material recovery mechanisms. Furthermore, since 2001, despite significant increases and unprecedented volatility in oil prices, our legacy company’s variable cost of sales have remained stable between 38% and 42% of net sales. Additionally, since the economic downturn, we have worked with our light vehicle customers to better manage fluctuations in raw material prices through the addition to agreements of “opener” clauses that stipulate the renegotiation of pricing if raw material costs fluctuate significantly above or below expectations.
118
Table of Contents
Real Property
Our extensive geographic footprint is comprised of 35 manufacturing facilities (including nine manufacturing sites operated by our joint ventures), 7 major technology centers and 45 customer training centers supporting our global operations. The table below presents summary information regarding our facilities as of December 31, 2014.
| Type of Facility/Country |
Location |
Segment | ||
| Manufacturing Facilities |
||||
| North America |
||||
| Canada |
Ajax | Transportation | ||
| United States of America |
Front Royal, VA | Performance; Transportation | ||
| Ft. Madison, IA | Performance; Transportation | |||
| Houston, TX | Performance | |||
| Hilliard, OH | Performance | |||
| Mt. Clemens, MI | Performance; Transportation | |||
| Toledo, OH | Performance; Transportation | |||
| Latin America |
||||
| Brazil |
Guarulhos | Performance; Transportation | ||
| Mexico |
Monterrey | Performance | ||
| Ocoyoacac | Performance; Transportation | |||
| Tlalnepantla | Performance; Transportation | |||
| Venezuela |
Valencia | Performance; Transportation | ||
| EMEA |
||||
| Austria |
Guntramsdorf | Performance; Transportation | ||
| Belgium |
Mechelen | Performance; Transportation | ||
| France |
Montbrison | Performance | ||
| Germany |
Wuppertal | Performance; Transportation | ||
| Landshut | Performance | |||
| Sweden |
Vastervik | Performance | ||
| Switzerland |
Bulle | Performance | ||
| Turkey |
Gebze | Performance; Transportation | ||
| United Kingdom |
Darlington | Performance | ||
| Asia Pacific |
||||
| Australia |
Riverstone | Performance; Transportation | ||
| China |
Changchun | Performance; Transportation | ||
| Jiading | Performance; Transportation | |||
| India |
Savli | Performance; Transportation | ||
| Malaysia |
Kuala Lumpur | Performance | ||
| Joint Venture Owned Manufacturing Facilities | ||||
| China |
Chengdu | Performance | ||
| Dongguan | Performance | |||
| Huangshan | Performance | |||
| Qingpu | Performance | |||
| Shangdong | Performance | |||
| Colombia |
Cartagena de Indias | Performance | ||
| Indonesia |
Cikarang | Performance | ||
| Taiwan |
Taipei | Transportation | ||
| Guatemala |
Amatitlan | Performance | ||
119
Table of Contents
| Type of Facility/Country |
Location |
Segment | ||
| Joint Venture Partner-Owned Manufacturing Facilities | ||||
| China |
Wuhan | Performance | ||
| Japan |
Amagasaki | Transportation | ||
| Chiba | Transportation | |||
| South Africa |
Durban | Transportation | ||
| Port Elizabeth | Transportation | |||
| Russia |
Moscow | Transportation | ||
| Technology Centers |
||||
| Belgium |
Mechelen | Performance; Transportation | ||
| China |
Shanghai | Performance; Transportation | ||
| France |
Montbrison | Performance | ||
| Germany |
Wuppertal | Performance; Transportation | ||
| Mexico |
Mexico City | Performance; Transportation | ||
| United States of America |
Mt. Clemens, MI | Performance; Transportation | ||
| Wilmington, DE | Performance; Transportation | |||
| Customer Training Centers |
Location by Region | Number of Facilities | ||
| North America | 10 | |||
| Latin America | 7 | |||
| EMEA | 15 | |||
| Asia Pacific | 13 | |||
Joint Ventures
We are party to 10 joint ventures, five of which are focused on the industrial end-market. We are the majority shareholder in, exercise control over and fully consolidate all but three of our joint ventures. Our fully consolidated joint venture-related net sales were $218.4 million and $221.9 million for the years ended December 31, 2014 and 2013, respectively. See “Risk Factors—Risks Related to our Business—Risks Related to Other Aspects of our Business—Our joint ventures may not operate according to our business strategy if our joint venture partners fail to fulfill their obligations.”
Employees
As of December 31, 2014, we had approximately 12,600 employees located throughout the world consisting of sales, technical, manufacturing operations, supply chain and customer service personnel. This figure does not include joint venture employees and contractors.
As of December 31, 2014, approximately 64% of our employees globally were covered by organized labor agreements, including works councils, with fewer than 50 employees in the United States covered by organized labor agreements. We consider our employee relations to be excellent.
Health, Safety and Environmental
We are subject to various laws and regulations around the world governing the protection of the environment and health and safety, including the discharge of pollutants to air and water and the management and disposal of hazardous substances. We have an excellent safety record. Our enhanced focus on health, safety and environmental improvements has resulted in a 54% reduction in our Total Recordable Safety Incident rate from
120
Table of Contents
year-end 2003 to year-end 2014, which is seven times better than the 2012 U.S. coatings industry average (0.35 versus a U.S. industry average of 2.44). Furthermore, all of our manufacturing facilities are ISO14001 certified.
We believe that all of our manufacturing and distribution facilities are operated in compliance in all material respects, with existing environmental requirements, including the operating permits required thereunder at our facilities. From time to time, we may be subject to notices of violation from environmental regulatory agencies or other claims regarding our compliance with environmental requirements. For example, in April 2014, the U.S. Environmental Protection Agency (the “EPA”) issued a notice of violation regarding certain hazardous waste management requirements relating to our Front Royal, Virginia facility, and has proposed a penalty of $0.6 million in connection with such notice. We have responded to the EPA, disputed the basis upon which the EPA has alleged a violation and continue to discuss the resolution of this matter with the EPA. In addition, the EPA has informed us that it may issue a notice of violation in connection with the alleged failure by our Front Royal facility prior to the Acquisition to report certain chemical emissions data in 2009, 2010 and 2011 required to be reported to the EPA under federal law. We believe that we are currently in compliance with such reporting requirements and will work with the EPA to resolve any alleged past violations. We do not expect that either of these compliance issues will have a material impact on us.
In addition, many of our manufacturing sites have a long history of industrial operations, and cleanup is or may be required at a number of these locations. Although we are indemnified by DuPont for certain environmental liabilities and we do not expect outstanding cleanup obligations to have a material impact on our financial position, the ultimate cost of cleanup is subject to a number of variables and difficult to accurately predict. We may also incur significant additional costs as a result of contamination that is discovered and/or cleanup obligations that are imposed at these or other properties in the future.
Legal Proceedings
We are from time to time party to legal proceedings that arise in the ordinary course of business. We are not involved in any litigation other than that which has arisen in the ordinary course of business. We do not expect that any currently pending lawsuits will have a material effect on us. See “Risk Factors—Risks Related to our Business—Risks Related to Legal and Regulatory Compliance and Litigation—Our results of operations could be adversely affected by litigation” and “Risk Factors—Risks Related to our Business—Risks Related to Other Aspects of our Business—DuPont’s breach of its obligations in connection with the Acquisition, including failure to comply with its indemnification obligations, may materially affect our business and operating results.”
121
Table of Contents
The following table provides information regarding our executive officers and our Board of Directors:
| Name |
Age | Position | ||
| Charles W. Shaver |
56 | Chairman and Chief Executive Officer | ||
| Robert W. Bryant |
46 | Executive Vice President and Chief Financial Officer | ||
| Steven R. Markevich |
55 | Senior Vice President and President, OEM | ||
| Joseph F. McDougall |
44 | Senior Vice President and Chief Human Resources Officer | ||
| Michael F. Finn |
48 | Senior Vice President, General Counsel and Corporate Secretary | ||
| Michael A. Cash |
53 | Senior Vice President and President, Industrial Coatings | ||
| Orlando A. Bustos |
51 | Director | ||
| Robert M. McLaughlin |
57 | Director | ||
| Andreas C. Kramvis |
62 | Director | ||
| Gregory S. Ledford |
57 | Director | ||
| Martin W. Sumner |
41 | Director | ||
| Wesley T. Bieligk |
35 | Director | ||
| Gregor P. Böhm |
50 | Director | ||
| Allan M. Holt |
62 | Director |
Charles W. Shaver
Mr. Shaver has been our Chairman of the Board and Chief Executive Officer since February 2013. With over 34 years of leadership roles in the global petrochemical, oil and gas industry, he was most recently the Chief Executive Officer and President of the TPC Group from 2004 to April 2011. Mr. Shaver also served as Vice President and General Manager for General Chemical, a division of Gentek, from 2001 through 2004 and as a Vice President and General Manager for Arch Chemicals from 1999 through 2001. Mr. Shaver began his career with The Dow Chemical Company serving in a series of operational, engineering and business positions from 1980 through 1996. He has an extensive background of leadership roles in a variety of industry organizations, including serving on the American Chemistry Council Board of Directors, the American Chemistry Council Finance Committee and the National Petrochemical and Refiners Association Board and Executive Committee. Mr. Shaver currently serves as Chairman of the Board of Directors for U.S. Silica and formerly served on the board of directors of Taminco, Inc. from 2012 to 2014. Mr. Shaver earned his B.S. in Chemical Engineering from Texas A&M University. The Board of Directors has concluded that Mr. Shaver should serve as a director because of his leadership role with our company, his experience in the chemical industry and his significant directorship experience.
Robert W. Bryant
Mr. Bryant became our Executive Vice President and Chief Financial Officer in February 2013. Previously, Mr. Bryant served as the Senior Vice President and Chief Financial Officer of Roll Global LLC. Before joining Roll Global in 2007, he was the Executive Vice President of Strategy, New Business Development, and Information Technology at Grupo Industrial Saltillo, S.A.B. de C.V. Prior to joining Grupo Industrial Saltillo in 2004, Mr. Bryant was President of Bryant & Company, which he founded in 2001. Prior positions included serving as Managing Principal with Texas Pacific Group’s Newbridge Latin America, L.P., a Senior Associate with Booz Allen & Hamilton Inc. and an Assistant Investment Officer with the International Finance Corporation (IFC). Mr. Bryant began his career at Credit Suisse First Boston. Mr. Bryant graduated summa cum laude and Phi Beta Kappa with a B.A. in Economics from the University of Florida and received his M.B.A. from the Harvard Business School.
Steven R. Markevich
Mr. Markevich became our Senior Vice President and President, OEM in June 2013. Previously, Mr. Markevich was Chief Executive Officer of GKN Driveline. Prior to that role, from July 2010 to August 2012, he was
122
Table of Contents
President, GKN Sinter Metals, responsible for global operations. From October 2007 to July 2010, Mr. Markevich was President, North American Operations for GKN Sinter Metals, and began his tenure with GKN in 2007 as Vice President, Sales & Marketing. At Siegel-Robert Automotive, he led the company’s commercial strategy, sales, account and program management initiatives. While at Guardian Automotive, Mr. Markevich served in numerous leadership roles and was responsible for all senior level customer relationships. His career began at Deloitte & Touche consulting and the National Steel Corporation. Mr. Markevich holds a finance degree from University of Michigan’s Ross School of Business and is a Certified Public Accountant as well as being certified in Production & Inventory Management (CPIM). He has completed the Global Senior Leadership Program at UCLA and holds memberships in the Society of Automotive Engineers (SAE), Original Equipment Suppliers Association (OESA) and American Powder Metallurgy Institute International (APMI).
Joseph F. McDougall
Mr. McDougall became our Senior Vice President and Chief Human Resources Officer in May 2013. Previously, Mr. McDougall was Vice President, Human Resources, Communications and Six Sigma for Honeywell Performance Materials and Technologies. He served in a number of positions in Honeywell prior to this most recent position including Vice President, Human Resources for their Air Transport Division, Director of Human Resources for Honeywell Corporate from 2004-2007, Director of Compensation, Benefits and HRIS for Honeywell’s Specialty Materials Group from 2003-2004. Prior to joining Honeywell, Mr. McDougall served in human resources leadership roles at the Goodson Newspaper Group and Robert Wood Johnson University Hospital at Hamilton. He started his career as a human resources and benefits consultant. Mr. McDougall holds a B.A. from Rider University and graduated Beta Gamma Sigma with an M.B.A. from The Pennsylvania State University.
Michael F. Finn
Mr. Finn became our Senior Vice President and General Counsel as well as Chief Compliance Officer in April 2013. Mr. Finn is also Axalta’s Corporate Secretary. Previously, Mr. Finn was Vice President and General Counsel of General Dynamics’ Advanced Information Systems subsidiary. Before that, he was Vice President, General Counsel and Director of Ethics and Export Compliance at General Dynamics United Kingdom. From 2002 to 2005, Mr. Finn served as Senior Counsel for General Dynamics Corporation. Between 1999 and 2002 he was General Counsel and Vice President at Sideware Inc. and Associate General Counsel and Senior Director of Business Affairs at Teligent Inc. Prior to those roles, Mr. Finn worked in several positions most notably as an Associate at Willkie, Farr & Gallagher and as an Attorney at the Office of the General Counsel at the FCC. Mr. Finn graduated from Indiana University with a degree in Finance and graduated cum laude from New York University’s School of Law.
Michael A. Cash
Mr. Cash became our Senior Vice President and President, Industrial Coatings in August 2013. Prior to joining Axalta, Mr. Cash was Managing Director, Powder Coatings—Asia Pacific Region at AkzoNobel Coatings from 2011 to 2013 and previously in charge of AkzoNobel’s powder business throughout the Americas from 2005 to 2011. Mr. Cash also held a number of positions at The Sherwin-Williams Company including Vice President, Automotive International, Vice President of Automotive Marketing and Vice President and Chief Financial Officer of its joint venture with Herberts GmbH, which was then a Hoechst company. Earlier in his career, Mr. Cash was Vice President and Chief Financial Officer of Carstar Automotive, a U.S. autobody repair franchise. Mr. Cash received his B.A. in Business Administration from Miami University (Ohio).
Orlando A. Bustos
Mr. Bustos became a member of our Board of Directors following the Acquisition and has over 25 years of experience in the automotive industry and has held numerous senior executive positions. Mr. Bustos has
123
Table of Contents
extensive experience managing global operations, executing complex restructurings and forging new business development in emerging markets, with specific emphasis on China. He is the Chairman and Chief Executive Officer of OHorizons Global, an international management consulting firm focused on the automotive and industrial sectors. Mr. Bustos previously served as Business Leader for Electronics and Controls, OE Powertrain, Hybrid Systems, and Driveline at General Motors Global Powertrain Group and was the Executive Director of Global Purchasing. During his tenure at General Motors, his responsibilities included leading corporate wide initiatives in the areas of globalization, powertrain, operations, and global purchasing and supply chain throughout Europe, South America and Asia. Mr. Bustos is currently on the Board of Directors of the Michigan Science Center, and serves on its executive committee, and of the OHorizons Foundation. Previously, he has been on the Board of Directors of Cooper-Standard, and served on its compensation committee, GMI Diesel Engineering in Japan, Isuzu Motors Polska in Poland, and DMAX in the United States. Mr. Bustos earned a B.S. in Electrical Engineering from the Georgia Institute of Technology and an M.B.A. as a Sloan Fellow from the Massachusetts Institute of Technology. The Board of Directors has concluded that Mr. Bustos should serve as a director because he has significant directorship experience and has significant core business skills, including financial and strategic planning.
Robert M. McLaughlin
Mr. McLaughlin became a member of our Board of Directors in April 2014. Mr. McLaughlin is Senior Vice President and Chief Financial Officer of Airgas, Inc. and a member of the company’s Management Committee. Airgas is a leading U.S. supplier of industrial, medical and specialty gases, and hardgoods, such as personal protective equipment, welding equipment and other related products. Prior to assuming his current position on October 3, 2006, Mr. McLaughlin served as Vice President and Controller since joining Airgas in 2001. From 1999 to 2001 he served as Vice President of Finance for Asbury Automotive Group. From 1992 to 1999, Mr. McLaughlin was Vice President of Finance and held other senior financial positions at Unisource Worldwide, Inc. He began his career at Ernst & Young in 1979. He was a Certified Public Accountant and earned his Bachelor’s degree in accounting from the University of Dayton. The Board of Directors has concluded that Mr. McLaughlin should serve as a director because he has significant and diverse business experience and has significant experience on all aspects of financial management and strategic planning in a public company environment.
Andreas C. Kramvis
Mr. Kramvis became a member of our Board of Directors in July 2014. Mr. Kramvis is Vice Chairman of Honeywell International focused on critical aspects for the achievement of the company’s Five Year Plan. Prior to this role, Mr. Kramvis served as the President and Chief Executive Officer of Honeywell Performance Materials and Technologies, a global leader in process technology for the oil and gas industries as well as the development and production of high-purity, high-quality performance chemicals and materials. Mr. Kramvis has also served as the President and CEO of Honeywell’s Environmental and Combustion Controls business. Intimately familiar with key markets and economies around the world, Mr. Kramvis has managed companies with global scope across five different industries. Mr. Kramvis is a Director of AptarGroup, a past Chairman of the Society of Chemical Industry and a Board Member and Executive Committee Member of the American Chemistry Council. He is the author of a book titled “Transforming the Corporation: Running a Business in the 21st Century,” which demonstrates how to systematically transform a business for high performance. Mr. Kramvis is a graduate of Cambridge University, where he studied engineering specializing in electronics and he holds an M.B.A. from Manchester Business School. The Board of Directors has concluded that Mr. Kramvis should serve as a director because he brings extensive experience regarding the management of public and private companies.
Gregory S. Ledford
Mr. Ledford became a member of our Board of Directors following the Acquisition. Mr. Ledford is a Managing Director at Carlyle and is focused on the industrial and transportation sectors. He joined Carlyle in 1988 and,
124
Table of Contents
prior to his appointment as Managing Director, held the positions of Vice President and Principal, responsible for leading Carlyle’s Investments in numerous companies. From 1991 to 1997, he was Chairman and CEO of the Reilly Corp., a former Carlyle portfolio company. In addition, he was Director of Capital Leasing for MCI Telecommunications. Mr. Ledford is a member of the Board of Directors of Allison Transmission, Greater China Intermodal and HD Supply. Mr. Ledford is a graduate of the University of Virginia’s McIntire School of Commerce. He received an M.B.A. from Loyola College. The Board of Directors has concluded that Mr. Ledford should serve as a director because he brings extensive experience regarding the management of public and private companies, and the financial services industry.
Martin W. Sumner
Mr. Sumner became a member of our Board of Directors in August 2012. Mr. Sumner is a Managing Director at Carlyle focused on U.S. buyout opportunities in the industrial and transportation sectors. Mr. Sumner has led, or been a key contributor in, Carlyle’s investments in Allison Transmission and Veyance Technologies where he served on the Board and was chairman of the audit committee. Additionally, he previously served on the Board of AxleTech International Holdings prior to its sale to General Dynamics and the Board of United Components prior to its sale to the Rank Group. Mr. Sumner received his M.B.A. from Stanford University, where he was an Arjay Miller Scholar. He received a B.S. in economics, magna cum laude, from the Wharton School of the University of Pennsylvania. The Board of Directors has concluded that Mr. Sumner should serve as a director because he has significant directorship experience and has significant core business skills, including financial and strategic planning.
Wesley T. Bieligk
Mr. Bieligk became a member of our Board of Directors following the Acquisition. Mr. Bieligk is a Principal at Carlyle focused on buyout opportunities in the industrial and transportation sectors. Mr. Bieligk is a member of the Board of Directors of Signode Industrial Group and Greater China Intermodal. In addition, he has been actively involved in Carlyle’s investments in Allison Transmission and the Hertz Corporation. Mr. Bieligk received an M.B.A. with honors from The Wharton School at the University of Pennsylvania and a B.S. in commerce with distinction from The McIntire School of Commerce at the University of Virginia. The Board of Directors has concluded that Mr. Bieligk should serve as a director because he has significant directorship experience and has significant core business skills, including financial and strategic planning.
Gregor P. Böhm
Mr. Böhm became a member of our Board of Directors following the Acquisition. Mr. Böhm is a Managing Director at Carlyle and Co-head of the firm’s Europe Buyout group. He is based in London. Mr. Böhm is a member of the Board of HC Starck, Puccini, Ameos and Alloheim. He has previously served on the Boards of Andritz, Messer Cutting and Welding, Beru, Honsel Edscha, and HT Troplast. Prior to joining Carlyle, Mr. Böhm was a Manager at I.M.M., one of Germany’s leading buyout groups. Prior to that he was an Analyst with Morgan Stanley’s Mergers and Acquisitions department in London. Mr. Böhm is a graduate of Cologne University and earned his M.B.A. from Harvard Business School. The Board of Directors has concluded that Mr. Böhm should serve as a director because he has significant directorship experience and has significant core business skills, including financial and strategic planning.
Allan M. Holt
Mr. Holt became a member of our Board of Directors following the Acquisition. Mr. Holt is a Managing Director at Carlyle and is co-head of the firm’s U.S. Buyout group. He previously was head of Carlyle’s Global Aerospace, Defense, Technology and Business/Government Services team where he led many of Carlyle’s most successful investments. Mr. Holt joined Carlyle in 1992, initially with primary responsibilities as Senior Vice President and Chief Financial Officer of one of Carlyle’s portfolio companies, where he was involved in the
125
Table of Contents
negotiation and sale of the business. Mr. Holt is a member of the Boards of Directors of Booz Allen Hamilton Holding Corp., HCR ManorCare Inc., NBTY, Inc., Ortho-Clinical Diagnostics Bermuda Co. Ltd. and SS&C Technologies, Inc. Mr. Holt is a graduate of Rutgers University and received his M.B.A. from the University of California, Berkeley. The Board of Directors has concluded that Mr. Holt should serve as a director because he brings extensive experience regarding the management of public and private companies, and the financial services industry.
Controlled Company
For purposes of the rules of the NYSE, we are and upon consummation of this offering expect to continue to be a “controlled company.” Under NYSE rules, controlled companies are companies of which more than 50% of the voting power for the election of directors is held by an individual, a group or another company. Carlyle controls, and after the completion of this offering we expect will continue to control, more than 50% of the combined voting power of our common shares, with the right to designate a majority of the members of our Board of Directors for nomination for election and the voting power to elect such directors. Accordingly, we currently take advantage of certain exemptions from corporate governance requirements provided in the rules of the NYSE, and we intend to continue to take advantage of these exemptions from corporate governance requirements for so long as we continue to be a controlled company. Specifically, as a controlled company we are not required to have (i) a majority of independent directors, (ii) a nominating and corporate governance committee composed entirely of independent directors or (iii) a compensation committee composed entirely of independent directors. Therefore, we do not have a majority of independent directors, and our nominating and corporate governance and compensation committees do not consist entirely of independent directors. Accordingly, our shareholders do not have the same protections afforded to shareholders of companies that are subject to all of the NYSE rules. The controlled company exemption does not modify the independence requirements for the Audit Committee, and we are in compliance with the requirements of the Sarbanes-Oxley Act and the NYSE rules, which require that our Audit Committee be composed of at least three members, one of whom was independent upon the effective date of the registration statement that was filed in connection with the IPO and a majority of whom were independent within 90 days of the effective date of the registration statement that was filed in connection with the IPO. We intend to comply with the requirements of the Sarbanes-Oxley Act and the NYSE rules, which require that each member of our Audit Committee be independent within one year of the date of the registration statement that was filed in connection with the IPO.
Board of Directors Composition
Our Board of Directors currently consists of nine members. Mr. Shaver is our Chairman of the Board of Directors. The number of members on our Board of Directors may be modified from time to time by the Board of Directors and the Board of Directors may fill any vacancies subject to the terms of our principal stockholders agreement. Our Board of Directors is divided into three classes whose members serve three-year terms expiring in successive years. Directors hold office until their successors have been duly elected and qualified or until the earlier of their respective death, resignation or removal.
At each annual meeting of shareholders, the successors to the directors whose terms will then expire will be elected to serve from the time of election and qualification until the third annual meeting of shareholders following such election. Any additional directorships resulting from an increase in the number of directors will be distributed among the three classes so that, as nearly as possible, each class will consist of one-third of the directors.
In connection with the Acquisition, on February 1, 2013, we entered into a stockholders agreement, which we amended and restated on July 31, 2013 and to which Carlyle and members of management who hold common shares are party. Upon the effectiveness of the registration statement that was filed in connection with the IPO, we also entered into a new principal stockholders agreement. See “Certain Relationships and Related Person Transactions—Principal Stockholders Agreement.”
126
Table of Contents
When considering whether directors and nominees have the experience, qualifications, attributes or skills, taken as a whole, to enable the Board of Directors to satisfy their oversight responsibilities effectively in light of our business and structure, the Board of Directors focused primarily on each person’s background and experience as reflected in the information discussed in each of the directors’ individual biographies set forth immediately above. We believe that our directors provide an appropriate diversity of experience and skills relevant to the size and nature of our business.
Board of Directors Committees
Our Board of Directors directs the management of our business and affairs and conducts its business through meetings of the Board of Directors and four standing committees: the Executive Committee, the Audit Committee, the Compensation Committee and the Nominating and Corporate Governance Committee. In addition, from time to time, other committees may be established under the direction of our Board of Directors when necessary or advisable to address specific issues.
Each of the Executive Committee, the Audit Committee, the Compensation Committee and the Nominating and Corporate Governance Committee operates under a charter that has been approved by our Board of Directors. A copy of each of the Audit Committee, Compensation Committee and Nominating and Corporate Governance Committee charters is available at www.axaltacs.com. Information on, or accessible through, our website is not part of this prospectus, nor is such content incorporated by reference herein.
In addition, the principal stockholders agreement provides that each committee of the Board of Directors will include a proportional number of directors designated by Carlyle that is no less than the proportion of directors designated by Carlyle then serving on our Board of Directors, subject to Company’s obligation to comply with any applicable independence requirements.
Executive Committee
Our Executive Committee, which consists of Messrs. Shaver (Chairman), Ledford and Böhm, is responsible for, among its other duties and responsibilities, assisting the board in its decision-marking processes, reviewing certain transactions consummated by the Company or any of its subsidiaries and considering matters concerning the Company that may arise from time to time.
Audit Committee
Our Audit Committee, which consists of Messrs. McLaughlin (Chairman), Kramvis and Sumner, is responsible for, among its other duties and responsibilities, assisting our Board of Directors in overseeing: our accounting and financial reporting processes and other internal control processes, the audits and integrity of our financial statements, our compliance with legal and regulatory requirements, the qualifications and independence of our independent registered public accounting firm, our Code of Business Conduct and Ethics and the performance of our internal audit function and independent registered public accounting firm. Our Audit Committee is directly responsible for the appointment, compensation, retention and oversight of our independent registered public accounting firm.
Our Board of Directors has determined that Messrs. McLaughlin, Kramvis and Sumner are each an “audit committee financial expert” as such term is defined under the applicable regulations of the SEC and have the requisite accounting or related financial management expertise and financial sophistication under the applicable rules and regulations of the NYSE. Our Board of Directors has also determined that Messrs. McLaughlin and Kramvis are independent under Rule 10A-3 under the Securities Exchange Act of 1934, as amended (the “Exchange Act”), and the NYSE standard, for purposes of the audit committee. Rule 10A-3 under the Exchange Act requires that all members of the Audit Committee be independent (within the meaning of Rule 10A-3 under the Exchange Act and the NYSE standard) within one year of the effectiveness of the registration statement that
127
Table of Contents
was filed in connection with the IPO. We intend to comply with this independence requirement. All members of our Audit Committee are able to read and understand fundamental financial statements, are familiar with finance and accounting practices and principles and are financially literate.
In 2014, the Audit Committee met ten times.
Compensation Committee
Our compensation committee, which consists of Messrs. Sumner (Chairman), Ledford and Bustos, is responsible for, among its other duties and responsibilities, reviewing and approving the compensation philosophy for our Chief Executive Officer, reviewing and approving all forms of compensation and benefits to be provided to our other executive officers and reviewing and overseeing the administration of our equity incentive plans. The Compensation Committee’s processes for fulfilling its responsibilities and duties with respect to executive compensation and the role of executive officers and management in the compensation process are each described under “Compensation Discussion and Analysis—Determination of Compensation Awards.”
In 2014, the Compensation Committee met four times.
Nominating and Corporate Governance Committee
Our Nominating and Corporate Governance Committee, which consists of Messrs. Sumner (Chairman) and Ledford, is, subject to our principal stockholders agreement, responsible for, among its other duties and responsibilities, identifying and recommending candidates to our Board of Directors for election to our Board of Directors, reviewing the composition of members of our Board of Directors and its committees, developing and recommending to the Board of Directors corporate governance guidelines that are applicable to us, and overseeing our Board of Directors and its committees evaluations. For more information regarding the principal stockholders agreement, see “Certain Relationships and Related Person Transactions—Principal Stockholders Agreement.”
The Nominating Committee was formed effective as of November 12, 2014 in connection with the IPO and did not meet in 2014.
Compensation Committee Interlocks and Insider Participation
During the year ended December 31, 2014, our compensation committee consisted of Messrs. Sumner (Chairman), Ledford and Bustos. None of the members of our compensation committee is currently one of our officers or employees. Messrs. Bieligk, Böhm, Holt, Ledford and Sumner are employed by Carlyle. Carlyle is a party to both our stockholders agreement and our principal stockholders agreement. See “Certain Relationships and Related Person Transactions.” In addition, during the year ended December 31, 2014, we paid Carlyle fees of $16.6 million under a consulting agreement between us and Carlyle (approximately $13.4 million of which was to terminate the consulting agreement). See “Certain Relationships and Related Person Transactions—Consulting Agreement.” During the year ended December 31, 2014, none of our executive officers served as a member of the Board of Directors or compensation committee, or other committee serving an equivalent function, of any entity that has one or more executive officers who serve as members of our Board of Directors or our compensation committee.
Code of Business Conduct and Ethics
We have adopted a Code of Business Conduct and Ethics that applies to all of our directors and employees, including our executive officers. A copy of the Code of Business Conduct and Ethics is available on our website and will also be provided to any person without charge. Requests should be made in writing to the Senior Vice President and General Counsel at Axalta Coating Systems Ltd., Two Commerce Square, 2001 Market Street, Suite 3600, Philadelphia, PA, 19103 or by telephone at (855) 547-1461.
128
Table of Contents
COMPENSATION DISCUSSION AND ANALYSIS
Executive Summary
This Compensation Discussion and Analysis provides an overview and analysis of: (i) the elements of our compensation program for our named executive officers identified below; (ii) the material compensation decisions made under that program and reflected in the executive compensation tables that follow this Compensation Discussion and Analysis; and (iii) the material factors considered in making those decisions. As a company dedicated to a pay-for-performance culture, we intend to provide our named executive officers with compensation that is significantly performance-based. Our executive compensation program is designed to: align executive pay with our performance on both short- and long-term bases; link executive pay to specific, measurable results intended to create value for shareholders; and utilize compensation as a tool to assist us in attracting and retaining the high-caliber executives that we believe are critical to our long-term success.
Compensation for our named executive officers consists primarily of the elements, and their corresponding objectives, identified in the following table.
| Compensation Element |
Primary Objective | |
| Base salary |
To recognize performance of job responsibilities and to attract and retain individuals with superior talent. | |
| Axalta Bonus Plan (annual non-equity incentive compensation, “ABP”) |
To promote our near-term performance objectives across our workforce and reward individual contributions to the achievement of those objectives. ABP awards for 2014 are shown in the Summary Compensation Table below under the heading “Non-Equity Incentive Plan Compensation.” | |
| Discretionary long-term equity incentive awards |
To emphasize our long-term performance objectives, encourage the maximization of shareholder value and retain key executives by providing an opportunity to participate in the ownership of our common shares. | |
| Retirement savings (401(k)) and nonqualified deferred compensation |
To provide an opportunity for tax-efficient savings and long-term financial security. | |
| Severance and change in control benefits |
To encourage the continued attention and dedication of key individuals when considering strategic alternatives. | |
| Other elements of compensation and perquisites |
To attract and retain talented executives in a cost-efficient manner by providing benefits with high perceived values at relatively low cost to us. | |
To serve the foregoing objectives, our overall compensation program is generally designed to be adaptive rather than purely formulaic. Our Compensation Committee has primary authority to determine and approve compensation decisions with respect to our named executive officers. For 2014, compensation for our named executive officers reflected the dynamics of the markets in which we compete for executive talent, as each of our named executive officers commenced service with us upon, or in some cases shortly following, the Acquisition in 2013. As a result, the 2014 compensation of our named executive officers (“NEOs”) was largely a function of recent arm’s-length negotiations with each NEO prior to his commencement of service with us.
For the year ended December 31, 2014, our NEOs are:
| • | Charles W. Shaver, Chairman and Chief Executive Officer; |
| • | Robert W. Bryant, Executive Vice President and Chief Financial Officer; |
| • | Steven R. Markevich, Senior Vice President and President, OEM; |
129
Table of Contents
| • | Joseph F. McDougall, Senior Vice President and Chief Human Resources Officer; and |
| • | Michael F. Finn, Senior Vice President, General Counsel and Corporate Secretary. |
Our compensation decisions for the NEOs in 2014 are discussed below in relation to each of the above-described elements of our compensation program. The below discussion is intended to be read in conjunction with the executive compensation tables and related disclosures that follow this Compensation Discussion and Analysis.
Compensation Overview
Our overall compensation program is structured to attract, motivate and retain highly qualified executives by paying them competitively, consistent with our success and their contribution to that success. We believe compensation should be structured to ensure that a portion of an executive’s compensation opportunity will be related to factors that directly and indirectly influence shareholder value. Accordingly, we set goals designed to link each NEO’s compensation to our performance and the NEO’s own performance. Consistent with our performance-based philosophy, we pay our NEOs a compensation package which is predominantly performance based, including variable ABP awards based on our financial and operational performance and premium priced stock option awards. This performance-based compensation is intended to align our NEOs’ interests with our long-term performance and the interests of our shareholders.
Total compensation for our NEOs has been allocated between cash and equity compensation, taking into consideration the balance between providing short-term incentives and long-term investment in our financial performance, to align the interests of management with the interests of shareholders. The variable ABP awards and the equity awards are designed to ensure that total compensation reflects our overall success or failure and to motivate the NEOs to meet appropriate performance measures tied to maximizing total shareholder returns.
Determination of Compensation Awards
The Compensation Committee is provided with the primary authority to determine and approve the compensation paid to our NEOs. The Compensation Committee is charged with, among other things, reviewing compensation policies and practices to ensure: (i) adherence to our compensation philosophies; and (ii) that the total compensation paid to our NEOs is fair, reasonable and competitive, taking into account our position within our industry, including our comparative performance, and our NEOs’ level of expertise and experience in their respective positions. In furtherance of the considerations described above, the Compensation Committee is primarily responsible for: (i) determining any future adjustments to base salary and target ABP levels (representing the non-equity incentive compensation that may be awarded expressed as a percentage of base salary or as a dollar amount for the year); (ii) assessing the performance of the Chief Executive Officer and other NEOs for each applicable performance period; and (iii) determining the awards to be paid to our Chief Executive Officer and other NEOs under the ABP for each year. To aid the Compensation Committee in making its determinations, the Chief Executive Officer provides recommendations to the Compensation Committee regarding the compensation of all NEOs, excluding himself. The Compensation Committee annually reviews the performance and compensation of our senior executive management team.
In determining compensation levels for our NEOs, the Compensation Committee considers each NEO’s particular position and responsibility and relied upon the judgment and industry experience of the members of our board of directors, including their knowledge of competitive compensation levels in our industry. We believe that base salaries should be competitive with salaries for executive officers in similar positions and with similar responsibilities in our marketplace. However, in making compensation determinations for 2014, we did not rely on benchmarking or compensation consultants, did not directly compare compensation levels with any other companies, and did not refer to any specific compensation survey or other data. Rather, in alignment with the considerations described above, we determined the total amount of compensation for our NEOs, and the allocation of total compensation among each of our three main components of compensation, in reliance upon the
130
Table of Contents
judgment and general industry knowledge of the members of our board of directors obtained through years of service with comparably-sized companies in our industry and other similar industries to ensure we attract, develop and retain superior talent.
Stock Ownership Requirements
To directly align the interests of our NEOs with us and our shareholders, our Compensation Committee has adopted stock ownership guidelines. The guidelines require that, within five years after our initial public offering, the Chief Executive Officer must directly or indirectly own an amount of our common shares equal to five times the Chief Executive Officer’s base salary, and the Chief Executive Officer’s executive and senior vice president direct reports must directly or indirectly own an amount of our common shares equal to two times their respective base salaries. If an executive is out of compliance with the ownership requirement, he or she must retain 50% of our common shares acquired upon stock option exercises and 75% of our common shares issued upon the vesting of restricted stock, restricted stock unit and performance share grants, in each case, net of applicable taxes until the executive satisfies the ownership requirement. The Compensation Committee will annually review each NEO’s compliance with the stock ownership guidelines based on the NEO’s current base salary and the price of our common shares as of the end of the prior year.
Base Compensation
Base Salaries
We set base salaries for our NEOs generally at a level we deem necessary to attract and retain individuals with superior talent. Each year, the Compensation Committee will determine base salary adjustments, if any, after evaluating the job responsibilities and demonstrated proficiency of the NEOs as assessed by the Compensation Committee, and for NEOs other than the Chief Executive Officer, in conjunction with recommendations to be made by the Chief Executive Officer. No formulaic base salary increases are provided to the NEOs, and no NEOs have received base salary increases since their commencement of service through December 31, 2014.
Sign-on and Retention Bonuses
Pursuant to our negotiations to retain the services of Messrs. Bryant, Markevich and McDougall in 2013, we agreed to pay each of them a retention and sign-on bonus. These payments were also intended to induce Messrs. Bryant, Markevich and McDougall to accept our offers of employment and to compensate them for relinquishing unvested equity compensation or other incentive opportunities from their prior employers. Under the terms of Mr. Markevich’s employment agreement, we paid the second and final installment of his retention bonus April 15, 2014 in the amount of $300,000. We do not presently have any intent to provide our NEOs with any new rights to payments of this type.
Annual Performance-Based Compensation
We structure our compensation programs to reward NEOs based on our performance and the individual executive’s relative contribution to that performance. This allows NEOs to receive ABP awards in the event certain specified corporate performance measures are achieved. The annual ABP pool is determined by the Compensation Committee based upon a pre-established formula with reference to the extent of achievement of corporate-level and segment-level performance goals established annually by the Compensation Committee. The ABP is designed to reward NEOs for contributions made to help us meet our annual performance goals. The amount actually received by NEOs will depend on our performance and individual performance during the year. The Compensation Committee may make discretionary adjustments to the formulaic ABP awards to reflect its subjective determination of an individual’s impact and contribution to overall corporate or segment performance, as discussed below.
131
Table of Contents
Under the terms of the ABP, the NEOs’ formulaic ABP awards are based on a percentage of their base salaries and currently range from 60% to 100% for target-level performance achievement. Maximum formulaic ABP awards vary according to each executive and are set at levels that the Compensation Committee determines are necessary to maintain competitive compensation practices and properly motivate our NEOs by rewarding them for our short-term performance and their contributions to that performance.
Once the extent of achievement of corporate and segment ABP performance targets and the formulaic ABP calculations have been determined, the Compensation Committee may adjust the amount of ABP awards paid upward or downward based upon its overall assessment of each NEO’s performance, business impact, contributions, leadership and attainment of individual objectives established periodically throughout the year, as well as other related factors. In addition, ABP funding amounts may be adjusted by the Compensation Committee to account for unusual events such as significant foreign currency exchange rate fluctuations, extraordinary transactions, asset dispositions and purchases, and mergers and acquisitions if, and to the extent, the Compensation Committee does not consider the effect of such events indicative of our performance.
The following chart sets forth the formulaic ABP awards for threshold, target-level and maximum ABP awards for our NEOs:
| Name and Principal Position |
Formulaic ABP at threshold performance (% of base salary) |
Formulaic ABP at target-level performance (% of base salary) |
Maximum ABP award (% of base salary) |
|||||||||
| Charles W. Shaver |
50 | % | 100 | % | 200 | % | ||||||
| Chairman and Chief Executive Officer |
||||||||||||
| Robert W. Bryant |
37.5 | % | 75 | % | 150 | % | ||||||
| Executive Vice President and Chief Financial Officer |
||||||||||||
| Steven R. Markevich |
37.5 | % | 75 | % | 150 | % | ||||||
| Senior Vice President and President, OEM |
||||||||||||
| Joseph F. McDougall |
30 | % | 60 | % | 120 | % | ||||||
| Senior Vice President and Chief Human Resources Officer |
||||||||||||
| Michael F. Finn |
30 | % | 60 | % | 120 | % | ||||||
| Senior Vice President, General Counsel and Corporate Secretary |
||||||||||||
For the year ended December 31, 2014, ABP performance goals were based upon Adjusted EBITDA (as defined below), Gross Adjusted Free Cash Flow (as defined below), Adjusted Revenue (as defined below), and individual performance metrics. For this purpose, “Adjusted EBITDA” was defined as our consolidated earnings before interest expense or income, income tax expense or income, depreciation, amortization and other adjustments as defined in the credit agreement governing our Senior Secured Credit Facilities. “Adjusted Free Cash Flow” was defined as cash flows from operations less cash flows from investing activities adjusted for certain items which the Company believed due to discrete events not contemplated in our incentive compensation targets. “Adjusted Revenue” was defined as Net Sales assuming consistent translation rates as those assumed in our 2014 budgeting process. Individual performance is generally based on personal contributions, as described in more detail below.
For each performance year, the Compensation Committee assigns a target, threshold and maximum value to each performance metric. ABP award amounts for performance between the threshold and maximum levels are determined at the beginning of the applicable performance period and depend on the level of achievement for each metric relative to its assigned performance target, in accordance with a predetermined payout matrix. The minimum ABP award under the payout matrix (i.e., 50% of the target ABP award) is payable only upon achievement of the threshold performance goals for each performance metric (i.e., 93% of EBITDA, 75% of Adjusted Free Cash Flow and 96% of Adjusted Revenue). The maximum ABP award under the payout matrix (i.e., 200% of the target ABP award) is payable only upon achievement of maximum-level performance goals for
132
Table of Contents
each performance metric (i.e., 128% of EBITDA, 133% of Adjusted Free Cash Flow and 126% of Adjusted Revenue). ABP award amounts increase linearly between threshold and target-level performance and linearly between target and maximum-level performance. The following chart sets forth the weighting of each performance metric, the threshold, target and maximum performance goals, and the actual performance achieved under our ABP program for the year ended December 31, 2014:
The performance metrics for the NEO’s 2014 ABP and the results achieved with respect to those metrics are as follows:
| Performance Metric |
Weighting (%) |
Threshold ($ MM) |
Target ($ MM) |
Maximum ($ MM) |
Achieved ($ MM) |
|||||||||||||||
| Corporate Adjusted EBITDA(1) |
40 | 768 | 828 | 1,060 | 841 | |||||||||||||||
| Corporate Adjusted Free Cash Flow |
20 | 133 | 177 | 236 | 187 | (2) | ||||||||||||||
| Corporate Adjusted Revenue(3) |
20 | 4,275 | 4,471 | 5,646 | 4,378 | |||||||||||||||
| Individual Performance(4) |
20 | — | — | — | — | |||||||||||||||
| (1) | Excluding one-time costs and transition expenses related to the Acquisition. The performance component of Mr. Markevich’s ABP also reflects the contributions of the OEM business to the overall Corporate Adjusted EBITDA. |
| (2) | As a result of the impact of certain Acquisition-related matters on our free cash flow for 2014, the Compensation Committee made certain adjustments to our 2014 Adjusted Free Cash Flow targets. This resulted in an achievement level at 5.4% above target and a resulting payout level for this component of 116%. |
| (3) | The performance component of Mr. Markevich’s ABP also reflects the contributions of the OEM business to the overall Corporate Adjusted Revenue. |
| (4) | Individual performance payouts vary by participant, as described below. |
For the individual performance component of the ABP, the Compensation Committee provides each NEO with an ABP individual performance factor reflecting the Compensation Committee’s assessment of each NEO’s performance, business impact, contributions and leadership, among other factors. For 2014, the Compensation Committee considered the following key achievements in determining the ABP individual performance component for each of our NEOs:
| • | Mr. Shaver’s individual performance factor reflected several elements, including his overall leadership of the Company. Under Mr. Shaver’s leadership, we continued to have financial performance that met or exceeded our board of directors’ expectations. In addition, Mr. Shaver led the company through the initial public offering process and was instrumental with the investment community. Mr. Shaver continues to personally recruit board members and senior executives to the Company who have contributed to our performance. |
| • | Mr. Bryant’s individual performance factor reflected his leadership of the overall finance function, the filing of our S-1 registration statement and the subsequent initial public offering. Mr. Bryant was instrumental in establishing a rigorous budget setting process and developing the necessary supporting finance processes. |
| • | Mr. Markevich’s individual performance factor reflected his development of the strategy for, and resulting performance of, our light vehicle OEM business. Mr. Markevich was also instrumental in recruiting key executives to the company and winning important business accounts. We believe that Mr. Markevich has established our light vehicle coatings business as a customer-centric, global business. |
| • | Mr. McDougall’s individual performance factor reflected his leadership and transformation of the human resources and communications function. Mr. McDougall has developed a strategy that recruits top talent to the Company and retains key internal talent. In addition, Mr. McDougall has built a strategy for the Company’s corporate communication effort that enhances the Axalta brand worldwide. |
133
Table of Contents
| • | Mr. Finn’s individual performance factor reflected his overall leadership of the legal and compliance functions and his significant contribution to the initial public offering process. Mr. Finn was instrumental in helping the Company to navigate through the S-1 filing and IPO processes and in establishing its corporate governance practices. Mr. Finn also led the successful development and implementation of the Company’s compliance program, with a full suite of employee-facing compliance policies, a robust ethics training program and appropriate procedures for mitigating compliance risks. |
Based on the considerations described above and our level of performance in relation to the corporate and segment ABP performance targets, the ABP awards earned by Messrs. Shaver, Bryant, McDougall, and Finn equaled 125%, 94%, 75%, and 75% of their respective base salaries (or 125% of their respective target ABP awards). The total ABP award for Mr. Markevich equaled 100% of his base salary (or 133% of his target ABP award).
Discretionary Long-Term Equity Incentive Awards
Our NEOs, along with other key employees, were granted stock options to purchase our common shares in connection with the commencement of their employment with us, and are eligible to receive additional awards of stock options or other equity or equity-based awards under our equity incentive plan at the discretion of the Compensation Committee. However, we have not historically made annual or regular equity grants to our NEOs or other key employees, although Mr. Shaver received an incremental stock option award in 2014 that was intended to supplement his initial award received in 2013 in connection with his commencement of service with us, as described below.
Our Equity award grants, which largely consist of premium priced stock options, are designed to motivate and retain the recipients by providing an opportunity for the recipients to share in the value of increases in our common shares subject to a risk of forfeiture should the recipient’s employment terminate prior to the option vesting date. The equity award grants to members of the senior management team also promote our long-term compensation objectives by aligning the interests of the executives with the interests of our shareholders.
Generally, stock options granted under our equity incentive plan have vesting schedules that are designed to encourage an optionee’s continued employment and exercise prices that are designed to reward an optionee for our performance. Stock options generally expire ten years from the date of the grant and vest in five equal annual installments, subject to the optionee’s continued employment on each applicable vesting date. For stock options awarded to our NEOs in 2013, the first 20% of their options vested on January 1, 2014, and the remaining shares vest in 20% allotments on each anniversary of January 1, 2014. The stock options are also subject to vesting acceleration in certain circumstances. For more information about vesting acceleration of the stock options, see the discussion below under the heading “—Potential Payments Upon Termination or Change-in-Control.”
We have historically granted to key employees options with staggered exercise prices, such that the exercise price of a portion of the option is substantially greater than (generally in increments of 1.5 times and 2 times) the fair market value of the shares underlying the option on the date of grant, thereby creating incentives for our NEOs and other key employees to seek to increase shareholder value.
The number of the stock options awarded to our NEOs during the years ending December 31, 2013 and 2014 are listed below.
| Name |
Number of Options Granted 2013 |
Number of Options Granted 2014 |
||||||
| Charles W. Shaver |
4,463,805 | 496,015 | ||||||
| Robert W. Bryant |
1,517,692 | — | ||||||
| Steven R. Markevich |
1,031,635 | — | ||||||
| Joseph F. McDougall |
545,575 | — | ||||||
| Michael F. Finn |
495,977 | — | ||||||
134
Table of Contents
These stock option awards were subject to individual negotiations between each NEO and us in connection with his commencement of employment. As part of these negotiations, we considered the NEO’s relative level of responsibility and authority within our organizational structure and his anticipated contributions to our success in driving stockholder value over the long term. In May 2014, Mr. Shaver received a supplemental option grant in recognition of his successful leadership through our transition to a stand-alone company throughout 2013 following the Acquisition.
Defined Contribution Plans
401(k) Plan
We maintain a defined contribution plan that is tax-qualified under Section 401(a) of the Code (the “401(k) Plan”). The 401(k) Plan permits our eligible employees to defer receipt of portions of their eligible compensation, subject to certain limitations imposed by the Code. Employees may make pre-tax contributions, Roth contributions, catch-up contributions and after-tax contributions to the 401(k) Plan. The 401(k) Plan provides matching contributions in an amount equal to 100% of each participant’s pre-tax contributions and/or Roth contributions up to a maximum of 4% of the participant’s annual eligible compensation, subject to certain other limits, and a discretionary company contribution of up to 2% of the participant’s annual eligible compensation. Participants are 100% vested in all contributions, including company contributions. The 401(k) Plan is offered on a nondiscriminatory basis to all of our salaried employees, including NEOs.
Deferred Compensation Plans
In addition to the 401(k) Plan, in 2014 we maintained two nonqualified deferred compensation plans for a select group of highly compensated, senior management employees, including NEOs.
The Axalta Coating Systems LLC Retirement Savings Restoration Plan (the “Restoration Plan”), which is now frozen to new participants, permitted participants to defer their base compensation in excess of the Code compensation limits (up to a maximum of 6%). The Restoration Plan provides matching contributions to Restoration Plan participants in an amount equal to 100% of the participant’s contributions. In addition, the Restoration Plan provides a nonelective contribution equal to 3% of the participant’s compensation that is in excess of the annual limit under section 401(a)(17) of the Code. A participant’s elective deferrals are always 100% fully vested. Company matching contributions and nonelective contributions vest after three years of service with the Company.
The Axalta Coating Systems, LLC Nonqualified Deferred Compensation Plan became effective June 1, 2014. A select group of highly compensated, senior management employees are eligible to defer base salary in excess of the annual limits under the Code to this plan in 2015, provided that these individuals first maximize their elective deferrals to the 401(k) Plan. This plan provides for a discretionary matching contribution, a discretionary nonelective contribution and a true discretionary contribution by the company. Employee deferrals and employer contributions to this plan did not occur in 2014.
The discretionary matching contribution amount, if granted, will generally be equivalent to the employer match that the participant would have received under the 401(k) Plan, if not for the annual contribution limits of the Code. The Board or its designee shall determine the maximum allowable matching contribution, as a percentage of compensation, annually.
The discretionary nonelective contribution, if granted, may be equivalent to the employer nonelective contribution that participant would have received under the 401(k) Plan if not for the annual contribution limits of the Code.
Any discretionary contribution amount, if granted, may be any amount determined by the Compensation Committee of the Board and is not subject to further limitations.
135
Table of Contents
The Compensation Committee believes that matching and company contributions assist us in attracting and retaining talented employees and executives. The 401(k) Plan and the nonqualified deferred compensation plans provide an opportunity for participants to save money for retirement and to achieve financial security.
Employment and Severance Arrangements
The Compensation Committee considers the maintenance of a sound management team to be essential to protecting and enhancing our best interests. To that end, we recognize that the uncertainty that may exist among management with respect to their “at-will” employment with us may result in the departure or distraction of management personnel to our detriment. Accordingly, the Compensation Committee has determined that severance arrangements are appropriate to encourage the continued attention and dedication of certain members of our management and to allow them to focus on the value to shareholders of strategic alternatives without concern for the impact on their continued employment. Each of the NEOs has an employment agreement that provides for severance benefits upon termination of employment.
Mr. Shaver’s employment agreement has a term beginning on the date of the completion of the Acquisition, which was February 1, 2013, and ending on the third anniversary thereof. The agreement is extended automatically for successive 18 month periods thereafter unless either party delivers notice of non-renewal to the other no later than 45 days before the end of the applicable term. Upon our termination of Mr. Shaver’s employment without cause (which includes our non-extension of the term) or by Mr. Shaver for good reason, subject to his timely execution of a general release of claims against us, Mr. Shaver would be entitled to receive a payment equal to 3.0 times his annual base salary, payable in regular installments over an 18-month period in accordance with our regular payroll practices, and his ABP award earned in the year preceding his termination to the extent unpaid. In addition, if such a termination occurs within one year following a change in control, subject to Mr. Shaver’s timely execution of a general release of claims against us, Mr. Shaver would be entitled to receive a lump-sum payment equal to 4.0 times his annual base salary, instead of installment payments equal to 3.0 times his annual base salary, and an additional lump-sum payment of $60,000. During his employment and for 18 months following termination (or for 24 months following termination if he is entitled to change-in-control payments), Mr. Shaver’s employment agreement prohibits him from competing with our business and from soliciting our employees, customers or distributors to terminate their employment or arrangements with us. “Cause” is defined in Mr. Shaver’s employment agreement to mean: (i) his failure to substantially perform his duties (other than a failure resulting from disability) or materially comply with any of our policies; (ii) a determination by our board of directors that he has failed to carry out or comply with any lawful and reasonable directive of our board of directors; (iii) his breach of a material provision of his employment agreement; (iv) his conviction, plea of no contest, or imposition of unadjudicated probation for any felony or crime involving moral turpitude; (v) his unlawful use (including being under the influence) or possession of illegal drugs on our premises or while performing his duties and responsibilities; or (vi) his commission of an act of fraud, embezzlement, misappropriation, willful misconduct or breach of fiduciary duty against us. “Good reason” is defined in Mr. Shaver’s employment agreement to mean: (i) a decrease in Mr. Shaver’s annual base salary, other than a decrease of less than 10% in connection with a contemporaneous decrease in annual base salaries for other senior executives; (ii) a material reduction in authority or responsibilities; or (iii) a relocation of Mr. Shaver’s primary office by more than 35 miles from our headquarters.
Mr. Bryant’s employment agreement has a term beginning on the date of completion of the Acquisition, which was February 1, 2013, and ending on the third anniversary thereof. The agreement is extended automatically for successive 18 month periods thereafter unless either party delivers notice of non-renewal to the other no later than 45 days before the end of the applicable term. Upon our termination of Mr. Bryant’s employment without cause (which includes our non-extension of the term) or by Mr. Bryant for good reason, subject to his timely execution of a general release of claims against us, Mr. Bryant would be entitled to receive: (i) a payment equal to 1.0 times his annual base salary, payable in regular installments over a 12-month period in accordance with our regular payroll practices, (ii) his ABP award earned in the year preceding his termination to the extent unpaid and (iii) a prorated portion of his ABP award for the year in which termination occurs with the amount of the
136
Table of Contents
award based on actual performance, as determined by our board of directors. In addition, if such a termination occurs within one year following a change in control, subject to Mr. Bryant’s timely execution of a general release of claims against us, Mr. Bryant would be entitled to receive a payment equal to 2.0 times his annual base salary, instead of 1.0 times, payable over a 24-month period, instead of a 12-month period. During his employment and for 12 months following termination (or for 18 months following termination if he is entitled to change-in-control payments), Mr. Bryant’s employment agreement prohibits him from competing with our business and from soliciting our employees, customers or distributors to terminate their employment or arrangements with us. “Cause” is defined in Mr. Bryant’s employment agreement to mean: (i) his substantial, repeated and willful failure to perform duties as reasonably directed by our board of directors; (ii) his material failure to carry out or comply with any lawful and reasonable directive of our board of directors or Chief Executive Officer that is not inconsistent with his employment agreement; (iii) his breach of a material provision of his employment agreement or material company policy; (iv) his conviction, plea of no contest or imposition of unadjudicated probation for any felony or crime involving moral turpitude; (v) his unlawful use (including being under the influence) or possession of illegal drugs on our premises or while performing his duties and responsibilities; (vi) his willful or prolonged and unexcused absence from work (other than by reason of disability due to physical or mental illness); or (vii) his commission of an act of fraud, embezzlement, misappropriation, willful misconduct or material breach of fiduciary duty against us. For purposes of Mr. Bryant’s employment agreement, “good reason” has the same meaning as in Mr. Shaver’s employment agreement.
Mr. Markevich’s employment agreement has a term beginning on May 2, 2013 and ending on the third anniversary thereof. The agreement is extended automatically for successive 12 month periods thereafter unless either party delivers notice of non-renewal to the other no later than 60 days before the end of the applicable term. Upon our termination of Mr. Markevich’s employment without cause (which includes our non-extension of the term) or by Mr. Markevich for good reason, subject to his timely execution of a general release of claims against us, Mr. Markevich would be entitled to receive: (i) a payment equal to 1.5 times his annual base salary, payable in regular installments over an 18-month period in accordance with our regular payroll practices; (ii) his sign-on or retention bonus payments to the extent unpaid; and (iii) his ABP award earned in the year preceding his termination to the extent unpaid. In addition, if such a termination occurs within 60 days prior to or one year following a change in control, subject to Mr. Markevich’s timely execution of a general release of claims against us, Mr. Markevich would be entitled to receive a payment equal to 2.0 times his annual base salary, instead of 1.5 times, payable over a 24-month period, instead of an 18-month period. During his employment and for 12 months following termination, Mr. Markevich’s employment agreement prohibits him from competing with our business and, for 18 months following termination, from soliciting our employees, customers or distributors to terminate their employment or arrangements with us. For purposes of Mr. Markevich’s employment agreement, “cause” and “good reason” have the same meanings as in Mr. Shaver’s employment agreement.
Mr. McDougall’s employment agreement has a term beginning on May 1, 2013 and ending on the third anniversary thereof. The agreement is extended automatically for successive 12 month periods thereafter unless either party delivers a notice of non-renewal to the other no later than 60 days before the end of the applicable term. Upon our termination of Mr. McDougall’s employment without cause (which includes our non-extension of the term) or by Mr. McDougall for good reason, subject to his timely execution of a general release of claims against us, Mr. McDougall would be entitled to receive: (i) a payment equal to 1.0 times his annual base salary, payable in regular installments over a 12-month period in accordance with our regular payroll practices; and (ii) his ABP award earned in the year preceding his termination to the extent unpaid. In addition, if such termination occurs within one year following a change in control, subject to Mr. McDougall’s timely execution of a general release of claims against us, Mr. McDougall would be entitled to receive a payment equal to 2.0 times his annual base salary, instead of 1.0 times, payable over a 24-month period, instead of an 12-month period. During his employment and for 12 months following termination, Mr. McDougall’s employment agreement prohibits him from competing with our business and, for 18 months following termination, from soliciting our employees, customers or distributors to terminate their employment or arrangements with us. For purposes of Mr. McDougall’s employment agreement, “cause” has substantially the same meaning as in
137
Table of Contents
Mr. Shaver’s employment agreement, except that failing to substantially perform his duty or materially comply with our policies does not constitute “cause;” instead, “cause” includes the board of directors’ determination of gross of willful misconduct and mismanagement by Mr. McDougall that is injurious to us or that results in his inability to substantially perform his duties. “Good reason” has the same meaning as in Mr. Shaver’s employment agreement.
Mr. Finn’s employment agreement has a term beginning on March 26, 2013 and ending on the second anniversary thereof. The agreement is extended automatically for successive 12 month periods thereafter unless either party delivers a notice of non-renewal to the other no later than 60 days before the end of the applicable term. Upon our termination of Mr. Finn’s employment without cause (which includes our non-extension of the term) or by Mr. Finn for good reason, subject to his timely execution of a general release of claims against us, Mr. Finn would be entitled to receive: (i) a payment equal to 1.0 times his annual base salary, payable in regular installments over a 12-month period in accordance with our regular payroll practices; (ii) a prorated portion of his ABP award for the year in which termination occurs in a sum no less than his target percentage; and (iii) his ABP award earned in the year preceding his termination, to the extent unpaid, in a sum no less than his target percentage (except, if members of senior management generally receive less than target bonus payouts for the applicable year, then Mr. Finn is entitled to receive the average bonus payout levels provided generally to members of senior management). In addition, if such termination occurs within one year following a change in control, subject to Mr. Finn’s timely execution of a general release of claims against us, Mr. Finn would be entitled to receive payments equal to 2.0 times his target ABP award (instead of a prorated portion of his target ABP award), and payments equal to 2.0 times his annual base salary payable over a 24-month period (instead of 1.0 times his annual base salary payable over a 12-month period). During his employment and for 12 months following termination, Mr. Finn’s employment agreement prohibits him from competing with our business and, for 18 months following termination, from soliciting our employees, customers or distributors to terminate their employment or arrangements with us. For purposes of Mr. Finn’s employment agreement, “cause” and “good reason” have the same meanings as in Mr. Shaver’s employment agreement.
“Change in control” is defined in all of our NEOs’ employment agreements to mean: (i) the sale, in one transaction or a series of related transactions (including one or more stock sales, mergers, business combinations, recapitalizations, consolidations, reorganizations, restructurings or similar transactions) of all or substantially all of our consolidated assets to any person (other than Carlyle); or (ii) any transaction or series of related transactions resulting in any person (other than Carlyle) acquiring at least 50% of the aggregate voting power of all of our outstanding voting securities.
Other Elements of Compensation and Perquisites
We provide NEOs with certain relatively low-cost, personal benefits and perquisites, which we do not consider to be a significant component of executive compensation but which are an important factor in attracting and retaining talented executives. NEOs are eligible under the same plans as all other employees for medical, dental, vision and short-term disability insurance, and may participate to the same extent as all other employees in our tuition reimbursement program. To induce the NEOs to join the Company, we agreed to reimburse them for certain relocation and temporary living and commuting expenses. All of our NEOs’ employment agreements stipulate that these were one-time reimbursements for expenses incurred in connection with their commencing employment with us. In addition, beginning in 2014, we have determined to provide the following additional perquisites to our NEOs and certain other senior management personnel: executive physical, umbrella liability insurance, global travel insurance and parking benefits. The value of personal benefits and perquisites we provided to each of our NEOs is set forth below in our Summary Compensation Table.
138
Table of Contents
Summary Compensation Table
The following table sets forth certain information with respect to the compensation paid to our NEOs for the year ending December 31, 2013 and 2014.
| Name and Principal Position |
Year | Salary ($) |
Bonus(1) ($) |
Option Awards(2) ($) |
Non-Equity Incentive Plan Compensation(3) ($) |
All Other Compensation(4) ($) |
Total ($) |
|||||||||||||||||||||
| Charles W. Shaver |
2014 | 750,000 | — | 986,042 | 937,500 | 213,418 | 2,886,960 | |||||||||||||||||||||
| Chairman and Chief Executive Officer |
2013 | 687,500 | — | 6,163,263 | 1,024,500 | 124,863 | 8,000,126 | |||||||||||||||||||||
| Robert W. Bryant |
2014 | 525,000 | — | — | 492,188 | 19,427 | 1,036,615 | |||||||||||||||||||||
| Executive Vice President and Chief Financial Officer |
2013 | 481,250 | 221,000 | 2,095,508 | 537,800 | 204,859 | 3,540,417 | |||||||||||||||||||||
| Steven R. Markevich |
2014 | 500,000 | 300,000 | — | 498,750 | 36,904 | 1,335,654 | |||||||||||||||||||||
| Senior Vice President and President, OEM |
2013 | 260,417 | 250,000 | 1,424,399 | 456,000 | 15,712 | 2,406,528 | |||||||||||||||||||||
| Joseph F. McDougall |
2014 | 385,000 | — | — | 288,750 | 39,610 | 713,360 | |||||||||||||||||||||
| Senior Vice President and Chief Human Resources Officer |
2013 | 252,482 | 460,000 | 753,288 | 315,500 | 19,836 | 1,801,106 | |||||||||||||||||||||
| Michael F. Finn |
2014 | 350,000 | — | — | 262,500 | 31,892 | 644,392 | |||||||||||||||||||||
| Senior Vice President, General Counsel and Corporate Secretary |
2013 | 235,985 | — | 684,807 | 287,200 | 257,989 | 1,465,582 | |||||||||||||||||||||
| (1) | Amounts represent the sign-on and retention bonuses paid to our NEOs in connection with their commencement of service with us in 2013 and 2014. For additional information, see “—Base Compensation for 2014—Sign-on and Retention Bonuses.” |
| (2) | Amounts represent the aggregate grant date fair value of stock option awards determined in accordance with FASB ASC Topic 718. Refer to Note 11 to our Audited Consolidated and Combined Financial Statements contained elsewhere in this prospectus for information regarding the assumptions used to value these awards. |
| (3) | Amount represents awards earned under our ABP. For additional information, see “—Annual Performance-Based Compensation for 2014.” |
| (4) | Other compensation includes the value of relocation and temporary commuting expenses and other perquisites as well as our contributions to the NEOs’ 401(k) and deferred compensation plan accounts as set forth in the following table. |
| Name |
Year | Memberships ($) |
Parking ($) |
Executive Physical ($) |
Relocation ($) |
Employer Contribution to 401(k) ($) |
Employer Contribution to Restoration Plan ($) |
Total ($) |
||||||||||||||||||||||||
| Charles W. Shaver |
2014 | — | 5,400 | 3,000 | 191,314 | 13,704 | — | 213,418 | ||||||||||||||||||||||||
| Robert W. Bryant |
2014 | — | 4,500 | 3,000 | — | 11,927 | — | 19,427 | ||||||||||||||||||||||||
| Steven R. Markevich |
2014 | — | — | 3,000 | — | 15,385 | 18,519 | 36,904 | ||||||||||||||||||||||||
| Joseph F. McDougall |
2014 | 9,060 | 3,649 | 3,000 | — | 6,128 | 17,773 | 39,610 | ||||||||||||||||||||||||
| Michael F. Finn |
2014 | — | 3,649 | 3,000 | — | 12,279 | 12,963 | 31,892 | ||||||||||||||||||||||||
139
Table of Contents
Grants of Plan-Based Awards
| Name |
Grant Date | Estimated Future Payouts Under Non- Equity Incentive Plan Awards |
All Other Option Awards: Number of Securities Underlying Options (#) |
Exercise or Base Price of Option Awards ($/sh) |
Grant Date Fair Value of Option Awards ($)(7) |
|||||||||||||||||||||||
| Thres- hold ($) |
Target ($) |
Maxi- mum ($) |
||||||||||||||||||||||||||
| Charles W. Shaver |
||||||||||||||||||||||||||||
| 2014 ABP |
375,000 | 750,000 | (1) | 1,500,000 | ||||||||||||||||||||||||
| 2014 Stock options(6) |
5/22/2014 | 198,406 | 11.84 | 302,468 | ||||||||||||||||||||||||
| 173,605 | 8.88 | 379,639 | ||||||||||||||||||||||||||
| 124,004 | 7.21 | 303,935 | ||||||||||||||||||||||||||
| Robert W. Bryant |
||||||||||||||||||||||||||||
| 2014 ABP |
196,875 | 393,750 | (2) | 787,500 | ||||||||||||||||||||||||
| Steven R. Markevich |
||||||||||||||||||||||||||||
| 2014 ABP |
187,500 | 375,000 | (3) | 750,000 | ||||||||||||||||||||||||
| Joseph F. McDougall |
||||||||||||||||||||||||||||
| 2014 ABP |
115,500 | 231,000 | (4) | 462,000 | ||||||||||||||||||||||||
| Michael F. Finn |
||||||||||||||||||||||||||||
| 2014 ABP |
105,000 | 210,000 | (5) | 420,000 | ||||||||||||||||||||||||
| (1) | Actual award earned under our annual ABP program for 2014 was $937,500. See “—Annual Performance-Based Compensation” above for a discussion of the calculation of this amount. |
| (2) | Actual award earned under our annual ABP program for 2014 was $492,188. See “—Annual Performance-Based Compensation” above for a discussion of the calculation of this amount. |
| (3) | Actual award earned under our annual ABP program for 2014 was $498,750. See “—Annual Performance-Based Compensation” above for a discussion of the calculation of this amount. |
| (4) | Actual award earned under our annual ABP program for 2014 was $288,750. See “—Annual Performance-Based Compensation” above for a discussion of the calculation of this amount. |
| (5) | Actual award earned under our annual ABP program for 2014 was $262,500. See “—Annual Performance-Based Compensation” above for a discussion of the calculation of this amount. |
| (6) | These options will become exercisable with respect to 20% of the underlying shares on each of May 22, 2015, May 22, 2016, May 22, 2017, May 22, 2018 and May 22, 2019 provided that the NEO remains employed by us through the applicable vesting date. |
| (7) | Amounts represent the aggregate grant date fair value of stock option awards determined in accordance with FASB ASC Topic 718. Refer to Note 11 to our Audited Consolidated and Combined Financial Statements contained elsewhere in this prospectus for information regarding the assumptions used to value these awards. |
140
Table of Contents
Outstanding Equity Awards
The following table provides information regarding the stock options held by the NEOs as of December 31, 2014.
| Name |
Number of Securities Underlying Unexercised Options (#) Exercisable (1) |
Number of Securities Underlying Unexercised Options (#) Unexercisable |
Equity Incentive Plan Awards: Number of Securities Underlying Unexercised Unearned Options (#) |
Option Exercise Price ($) |
Option Expiration Date |
|||||||||||||||
| Charles W. Shaver |
— | 198,406 | (3) | — | 11.84 | 5/22/2024 | ||||||||||||||
| — | 173,605 | (3) | — | 8.88 | 5/22/2024 | |||||||||||||||
| — | 124,004 | (3) | — | 7.21 | 5/22/2024 | |||||||||||||||
| 357,105 | 1,428,417 | (2) | — | 11.84 | 7/30/2023 | |||||||||||||||
| 312,467 | 1,249,865 | (2) | — | 8.88 | 7/30/2023 | |||||||||||||||
| 223,191 | 892,760 | (2) | — | 5.92 | 7/30/2023 | |||||||||||||||
| Robert W. Bryant |
121,416 | 485,660 | (2) | — | 11.84 | 7/30/2023 | ||||||||||||||
| 106,239 | 424,953 | (2) | — | 8.88 | 7/30/2023 | |||||||||||||||
| 75,885 | 303,539 | (2) | — | 5.92 | 7/30/2023 | |||||||||||||||
| Steven R. Markevich |
82,531 | 330,123 | (2) | — | 11.84 | 7/30/2023 | ||||||||||||||
| 72,215 | 288,856 | (2) | — | 8.88 | 7/30/2023 | |||||||||||||||
| 51,582 | 206,328 | (2) | — | 5.92 | 7/30/2023 | |||||||||||||||
| Joseph F. McDougall |
43,646 | 174,583 | (2) | — | 11.84 | 7/30/2023 | ||||||||||||||
| 38,191 | 152,760 | (2) | — | 8.88 | 7/30/2023 | |||||||||||||||
| 27,279 | 109,116 | (2) | — | 5.92 | 7/30/2023 | |||||||||||||||
| Michael F. Finn |
39,678 | 158,712 | (2) | — | 11.84 | 7/30/2023 | ||||||||||||||
| 34,719 | 138,872 | (2) | — | 8.88 | 7/30/2023 | |||||||||||||||
| 24,800 | 99,196 | (2) | — | 5.92 | 7/30/2023 | |||||||||||||||
| (1) | These options became exercisable on January 1, 2014. |
| (2) | These options became or will become exercisable with respect to 20% of the underlying shares on each of January 1, 2015, January 1, 2016, January 1, 2017 and January 1, 2018. |
| (3) | These options will become exercisable with respect to 20% of the underlying shares on each of May 22, 2015, May 22, 2016, May 22, 2017, May 22, 2018 and May 22, 2019. |
141
Table of Contents
Options Exercised and Shares Vested
Our NEOs became vested with respect to 20% of their stock options granted in 2013 on January 1, 2014. Messrs. Markevich and Finn exercised portions of their vested stock options in August 2014. The value of these option exercises are set forth in the table below:
| Name |
Number of Shares Acquired on Exercise (#) |
Value Realized on Exercise ($)(1) |
Number of Shares Acquired on Vesting (#) |
Value Realized on Vesting ($) |
||||||||||||
| Charles W. Shaver |
— | — | — | — | ||||||||||||
| Robert W. Bryant |
— | — | — | — | ||||||||||||
| Steven R. Markevich |
51,582 | 66,233 | — | — | ||||||||||||
| Joseph F. McDougall |
— | — | — | — | ||||||||||||
| Michael F. Finn |
42,158 | 31,843 | — | — | ||||||||||||
| (1) | The value realized on exercise is equal to the difference between the option exercise price and the value of the shares on the exercise date, multiplied by the number of shares subject to the option, without taking into account any taxes that may be payable in connection with the transaction. As the option exercises occurred prior to our initial public offering, the market values shown reflect, as of the date of exercise, the fair market value of the shares as most recently determined by our board of directors. |
Pension Benefits for 2014
Our NEOs do not participate in any pension plans and received no pension benefits during the year ended December 31, 2014.
Nonqualified Deferred Compensation
Our NEOs participate in a nonqualified deferred compensation plan and received nonqualified deferred compensation during the years ending December 31, 2013 and 2014 to the extent their eligible compensation exceeded the limit established by the IRS for tax-qualified defined contribution plans. For additional information, see the discussion above under the heading “—Defined Contribution Plans—Deferred Compensation Plans.”
| Name |
Year | Executive Contributions in Last FY ($) |
Company Contributions in Last FY ($) |
Aggregate Earnings in Last FY ($) |
Aggregate Withdrawals/ Distributions ($) |
Aggregate Balance at Last FYE ($) |
||||||||||||||||||
| Charles W. Shaver |
2014 | — | — | 3,764 | — | 71,162 | ||||||||||||||||||
| Robert W. Bryant |
2014 | — | — | 2 | — | 33,941 | ||||||||||||||||||
| Steven R. Markevich |
2014 | 12,346 | 18,519 | 1,197 | — | 32,875 | ||||||||||||||||||
| Joseph F. McDougall |
2014 | 11,849 | 17,773 | 363 | — | 29,985 | ||||||||||||||||||
| Michael F. Finn |
2014 | 8,642 | 12,963 | 133 | — | 21,739 | ||||||||||||||||||
142
Table of Contents
Potential Payments Upon Termination or Change-in-Control
Each of our NEOs has an employment agreement that provides for severance benefits upon termination of employment. See “—Employment and Severance Arrangements” above for a description of the employment and severance arrangements with our NEOs. Assuming a termination of employment effective as of December 31, 2014 (i) by us without cause, (ii) by the executive for good reason or (iii) by us without cause or the executive for good reason within one year following a change in control (or, for Mr. Markevich, within 60 days prior to or one year following a change in control), each of our NEOs would have received the following severance payments and benefits:
| Name |
Payment Type |
Termination Without Cause (Including Non-Extension of Term) ($) |
Resignation for Good Reason ($) |
Termination Without Cause or Resignation for Good Reason Following a Change in Control ($) |
||||||||||
| Charles W. Shaver |
Salary | 2,250,000 | 2,250,000 | 3,000,000 | ||||||||||
| Other(1) | 60,000 | |||||||||||||
| Total | 2,250,000 | 2,250,000 | 3,060,000 | |||||||||||
| Robert W. Bryant |
Salary | 525,000 | 525,000 | 1,050,000 | ||||||||||
| Bonus(2) | ||||||||||||||
| Total | 525,000 | 525,000 | 1,050,000 | |||||||||||
| Steven R. Markevich |
Salary | 750,000 | 750,000 | 1,000,000 | ||||||||||
| Total | 750,000 | 750,000 | 1,000,000 | |||||||||||
| Joseph F. McDougall |
Salary | 385,000 | 385,000 | 770,000 | ||||||||||
| Total | 385,000 | 385,000 | 770,000 | |||||||||||
| Michael F. Finn |
Salary | 350,000 | 350,000 | 700,000 | ||||||||||
| Bonus(3) | 210,000 | 210,000 | 420,000 | |||||||||||
| Total | 560,000 | 560,000 | 1,120,000 | |||||||||||
| (1) | Mr. Shaver would have been eligible to receive a payment of $60,000 to be used for medical and other expenses. |
| (2) | Mr. Bryant would have remained eligible to receive his 2014 ABP award, in an amount determined in the discretion of the Compensation Committee based on performance. The amount actually paid to Mr. Bryant with respect to his 2014 ABP award is set forth in the Summary Compensation Table above under the heading “Non-Equity Incentive Plan Compensation.” |
| (3) | Mr. Finn would have remained eligible to receive his 2014 ABP award in an amount no less than his target ABP amount of $210,000, or, if within one year following a change in control, 2.0 times that amount. The amount actually paid to Mr. Finn with respect to his 2014 ABP award is set forth in the Summary Compensation Table above under the heading “Non-Equity Incentive Plan Compensation.” |
In addition, pursuant to our NEOs’ stock option agreements, their stock options are subject to vesting acceleration in the following circumstances.
| • | Liquidity Event. A liquidity event generally would occur if Carlyle sold at least 50% of its equity investment in us, or if we sold substantially all of our assets (other than to Carlyle). A liquidity event could include a change in control, which is described below. Each NEO’s options vest and become exercisable immediately prior to a liquidity event if the NEO remains continuously employed from the option grant date through the liquidity event, or if the NEO is terminated by us without cause or by the NEO for good reason within six months prior to the liquidity event. |
| • | Change in Control. A change in control generally would occur if Carlyle sold at least 50% of our voting securities, or we sold substantially all of our assets (other than to Carlyle). The options vest and |
143
Table of Contents
| become exercisable immediately prior to a change in control if the options do not remain outstanding, or if the successor entity does not assume the options or substitute an equivalent award. The options also vest and become exercisable if the NEO is terminated by us without cause or by the NEO for good reason in connection with a change in control. If such termination occurs within six months prior to a change in control, then the options vest and become exercisable immediately prior to the change in control. If such termination occurs following a change in control (and the options remain outstanding, or the successor entity assumes the options or substitutes an equivalent award), then the options vest and become exercisable immediately prior to the NEO’s termination. |
| • | Exchange of Shares. An exchange of shares generally would occur if our shares are exchanged for securities listed on a national securities exchange (other than in connection with an initial public offering). The options vest and become exercisable upon the earliest of: (i) six months after such transaction’s effective date; (ii) the date the NEO is terminated by us without cause or due to disability, or by the NEO for good reason, following such transaction or (iii) the date of the NEO’s death following such transaction. |
In the event a full acceleration event, such as a liquidity event as described above, had occurred with respect to our NEOs’ stock options on December 31, 2014, our NEOs would have realized the following amounts with respect to the accelerated vesting of their options, which amounts represent the number of unvested shares subject to unvested options as of such date multiplied by the closing price of our common stock on December 31, 2014 minus the aggregate exercise price of all such options: Mr. Shaver: $67,743,617; Mr. Bryant: $20,271,487; Mr. Markevich: $13,779,329; Mr. McDougall: $7,287,125; and Mr. Finn: $6,624,642.
Compensation Risk
The Compensation Committee has analyzed the potential risks arising from our compensation policies and practices, and it has determined that there are no such risks that are reasonably likely to have a material adverse effect on us.
Director Compensation
Directors employed by Carlyle or us receive no additional compensation for serving on our board of directors or its committees. Pursuant to our director compensation program as in effect prior to our initial public offering, we pay each of our other directors, whom we refer to as our non-employee directors, $75,000 per year in cash for service on our board of directors, payable quarterly in arrears. Our non-employee directors are also eligible to receive awards under our equity incentive plans to the same extent as other service providers, except with regard to incentive stock options. Messrs. McLaughlin and Kramvis each received an option award to purchase up to 55,048 of our common shares in 2014. The option awards were intended as one-time grants tied to the commencement of the director’s service with us. They were granted with an exercise price not less than fair market value on the date of grant and have escalating exercise prices similar to the options granted to our NEOs. The options vest in annual installments over five years beginning on the date of grant, except that for Mr. Bustos, the options were 20% vested as of the date of grant in recognition of his service with us during 2013.
Messrs. Bustos, McLaughlin and Kramvis were our only non-employee directors in 2014. In the year ending December 31, 2014, we provided the following compensation to Messrs. Bustos, McLaughlin and Kramvis:
| Name |
Year | Fees Earned or Paid in Cash ($)(1) |
Option Awards ($)(2) |
Total ($) |
||||||||||||
| Orlando Bustos |
2014 | 75,000 | 109,433 | 184,433 | ||||||||||||
| Robert M. McLaughlin |
2014 | 45,000 | (3) | 109,433 | 154,433 | |||||||||||
| Andreas C. Kramvis |
2014 | 18,750 | 108,450 | 127,200 | ||||||||||||
| (1) | Director stipends are paid quarterly in arrears and pro-rated for a partial year of service. |
144
Table of Contents
| (2) | As of December 31, 2014, each of Messrs. McLaughlin and Kramvis held outstanding option awards to purchase up to 55,048 common shares and no outstanding stock awards. As of December 31, 2014, Mr. Bustos, through OHorizons Global, held outstanding option awards to purchase up to 407,191 common shares and no outstanding stock awards. |
| (3) | Mr. McLaughlin receives an additional quarterly payment of $3,750 for his service as chair of the audit committee. |
Equity Compensation Plan Information
The following table provides information as of December 31, 2014, with respect to the shares of our common stock that may be issued under our existing equity compensation plans:
| Plan Category |
Number of Securities to be Issued Upon Exercise of Outstanding Options, Warrants and Rights (a) |
Weighted- Average Exercise Price of Outstanding Options, Warrants and Rights (b) |
Number of Securities Remaining Available for Future Issuance Under Equity Compensation Plans (Excluding Securities Reflected in Column(a)) (c) |
|||||||||
| Equity compensation plans approved by security holders |
17,097,036 | $ | 9.38 | 11,874,631 | ||||||||
| Equity compensation plans not approved by security holders |
— | — | — | |||||||||
|
|
|
|
|
|
|
|||||||
| Total |
17,097,036 | $ | 9.38 | 11,874,631 | ||||||||
145
Table of Contents
CERTAIN RELATIONSHIPS AND RELATED PERSON TRANSACTIONS
Our Board has adopted a written statement of policy for the evaluation of and the approval, disapproval and monitoring of transactions involving us and “related persons.” For the purposes of the policy, “related persons” will include our executive officers, directors and director nominees and their immediate family members, and shareholders owning five percent or more of our outstanding common shares and their immediate family members.
The policy covers any transaction, arrangement or relationship, or any series of similar transactions, arrangements or relationships, in which we were or are to be a participant, the amount involved exceeds $100,000 and a related person had or will have a direct or indirect material interest. Pursuant to this policy, our management will present to our Audit Committee each proposed related person transaction, including all relevant facts and circumstances relating thereto. Our Audit Committee will then:
| • | review the relevant facts and circumstances of each related person transaction, including the financial terms of such transaction, the benefits to us, the availability of other sources for comparable products or services, if the transaction is on terms no less favorable to us than those that could be obtained in arm’s-length dealings with an unrelated third party or employees generally and the extent of the related person’s interest in the transaction; and |
| • | take into account the impact on the independence of any independent director and the actual or apparent conflicts of interest. |
All related person transactions may only be consummated if our Audit Committee has approved or ratified such transaction in accordance with the guidelines set forth in the policy. Certain types of transactions have been pre-approved by our Audit Committee under the policy. These pre-approved transactions include:
| • | the purchase of the Company’s products on an arm’s length basis in the ordinary course of business and on terms and conditions generally available to other similarly situated customers; |
| • | resolution of warranty claims and associated activities relating to the Company’s products, provided such claims and activities are administered on an arm’s length basis in the ordinary course of business and consistent with the administration of the claims of other similar situated customers; |
| • | any related person transaction within the scope of a related person’s ordinary business duties to the Company or the Company’s ordinary course of business when the interest of the related person arises solely from the ownership of a class of equity securities of the Company and all holders of such class of equity securities of the Company will receive the same benefit on a pro rata basis; |
| • | receipt of compensation and benefits (subject to necessary Compensation Committee approvals) by an executive officer or director of the Company if the compensation is required to be reported in the Company’s proxy statement pursuant to Item 402 of Regulation S-K or to an executive officer of the Company, if such compensation would have been required to be reported under Item 402 of Regulation S-K as compensation earned for services to the Company if the executive was a “named executive officer” in the proxy statement and such compensation has been approved, or recommended to the Company’s Board for approval, by the Compensation Committee of the Board of Directors of the Company; |
| • | the Company’s payment or reimbursement of a related person’s expenses incurred in performing his or her Company-related responsibilities in accordance with the Company’s policies and procedures; |
| • | any related person transaction in which the related person’s interest arises only: (i) from the related person’s position as a director of another corporation or organization that is a party to the related person transaction; (ii) from the direct or indirect ownership by the related person and all other related persons, in the aggregate, of less than a ten percent equity interest in another person (other than a partnership) which is a party to the related person transaction; or (iii) from both such position and ownership; |
146
Table of Contents
| • | any related person transaction in which the related person’s interest arises only from the related person’s position as a limited partner in a partnership in which the related person and all other related persons have an interest of less than ten percent and the person is not a general partner of and does not have another position in the partnership; and |
| • | any related person transaction in which the related person is providing investment advisory, investment management, participant record-keeping, securities brokerage, clearing services or any similar services as part of an employee benefit plan or similar plan offered by the Company to its executive officers, directors or employees where (i) the related person was not a related person at the time the Company first engaged the related person for such services; (ii) the related person became a related person solely through the acquisition of five percent or more of the Company’s common shares; and (iii) the related person is eligible to, and does, report share holdings on Schedule 13G; |
No director may participate in the approval of a related person transaction for which he or she, or his or her immediate family members, is a party to the transaction.
Consulting Agreement
On February 1, 2013, in connection with the Acquisition, we entered into a consulting agreement with Carlyle, pursuant to which we paid Carlyle a fee for consulting and oversight services provided to us and our subsidiaries. Pursuant to this agreement, subject to certain conditions, we paid an annual management fee to Carlyle of $3.0 million plus expenses. Further, under this agreement, Carlyle was entitled to additional reasonable fees and compensation agreed upon by the parties for advisory and other services provided by Carlyle to us from time to time, including additional advisory and other services associated with acquisitions and divestitures or sales of equity or debt instruments. We paid Carlyle a fee of approximately $13.4 million to terminate the consulting agreement in connection with the consummation of the IPO.
Principal Stockholders Agreement
In connection with the Acquisition, we entered into a stockholders agreement, which we amended and restated on July 31, 2013, and to which Carlyle, members of management who hold our common shares and certain other of our shareholders are party. Certain provisions of this agreement terminated automatically upon the consummation of our IPO and were replaced by a new stockholders agreement with Carlyle (the “principal stockholders agreement”). Our board of directors currently consists of nine members. Pursuant to the principal stockholders agreement, Carlyle has designated all of our board members, except one member shall be the senior ranking executive officer of the Company, who currently, and for so long as he is the Company’s Chief Executive Officer, is Mr. Shaver. The number of board members that Carlyle (or such permitted transferee or affiliate) is entitled to designate is subject to maintaining certain ownership thresholds. If Carlyle (or such permitted transferee or affiliate) loses its right to designate any directors pursuant to the terms of the principal stockholders agreement, these positions will be filled by our members in accordance with our memorandum of association and our Bye-Laws. In addition, the principal stockholders agreement provides that each committee of the board of directors will include a proportional number of directors designated by Carlyle (or such permitted transferee or affiliate) that is no less than the proportion of directors designated by Carlyle then serving on our board of directors, subject to Company’s obligation to comply with any applicable independence requirements.
The principal stockholders agreement also includes provisions pursuant to which we granted Carlyle (or such permitted transferee or affiliate) the right to cause us, in certain instances, at our expense, to file registration statements under the Securities Act covering resales of our common shares held by Carlyle (or such permitted transferee or affiliate) or to piggyback on such registration statements in certain circumstances. These shares will represent approximately 58.9% of our common shares after this offering, or 56.6% if the underwriters exercise their option to purchase additional shares in full. These shares also may be sold under Rule 144 under the Securities Act, depending on their holding period and subject to restrictions in the case of shares held by persons deemed to be our affiliates. The principal stockholders agreement also requires us to indemnify Carlyle (or such permitted transferee or affiliate) and its affiliates in connection with any registrations of our securities.
147
Table of Contents
Indemnification Agreements
In connection with our IPO, we entered into indemnification agreements with each of our directors and certain of our officers. These indemnification agreements provide the directors and officers with contractual rights to indemnification and expense advancement that are, in some cases, broader than the specific indemnification provisions contained under Bermuda law. We believe that these indemnification agreements are, in form and substance, substantially similar to those commonly entered into in transactions of like size and complexity sponsored by private equity firms.
Employment Agreements
See “Compensation Discussion and Analysis—Employment and Severance Arrangements” for information regarding the employment agreements that we have entered into with certain of our executive officers.
OHorizons Global Consulting Agreement
In connection with the Acquisition, we paid consulting fees and expenses to OHorizons Global, an international management consulting network, of approximately $2.1 million, of which $2.0 million was incurred in 2012 and $0.1 million was incurred in 2013. One of our directors, Orlando Bustos, is the Chairman and Chief Executive Officer of OHorizons Global. As part of the compensation for the consulting services, we granted OHorizons Global an option award to purchase up to 352,143 of our common shares that had a fair value of approximately $0.5 million.
Service King Collision Repair
Service King Collision Repair, a former affiliate of Carlyle, has purchased products from our distributors in the past and may continue to do so in the future. In August 2013, we entered into a new long-term sales agreement with Service King to be their exclusive provider of coatings. In July 2014, Carlyle sold a majority stake in Service King to an unaffiliated third party. Related person sales prior to this transaction were approximately $4.0 million in 2014.
Common Share Purchases by Officers and Directors
During 2014, certain of our employees, former employees and directors purchased an aggregate of 1,629,630 of our common shares at fair market value with an aggregate purchase price of approximately $10.9 million.
148
Table of Contents
PRINCIPAL AND SELLING SHAREHOLDERS
We had 229,779,626 common shares outstanding as of December 31, 2014. As of December 31, 2014, certain investment funds affiliated with Carlyle owned approximately 74.1% of our common shares.
The following table sets forth information with respect to the beneficial ownership of our common shares as of December 31, 2014, and as adjusted to reflect the common shares offered hereby, by:
| • | each person known to own beneficially more than 5% of the capital stock, including each of our selling shareholders; |
| • | each of our directors; |
| • | each of our named executive officers; and |
| • | all of our directors and executive officers as a group. |
The amounts and percentages of shares beneficially owned are reported on the basis of SEC regulations governing the determination of beneficial ownership of securities. Under SEC rules, a person is deemed to be a “beneficial” owner of a security if that person has or shares voting power or investment power, which includes the power to dispose of or to direct the disposition of such security. A person is also deemed to be a beneficial owner of any securities of which that person has a right to acquire beneficial ownership within 60 days. Securities that can be so acquired are not deemed to be outstanding for purposes of computing any other person’s percentage. Under these rules, more than one person may be deemed to be a beneficial owner of securities as to which such person has no economic interest.
Except as otherwise indicated in these footnotes, each of the beneficial owners listed has, to our knowledge, sole voting and investment power with respect to the shares of capital stock and the business address of each such beneficial owner is c/o Axalta Coating Systems Ltd., Two Commerce Square, 2001 Market Street, Suite 3600, Philadelphia, Pennsylvania 19103.
| Shares Beneficially Owned After the Offering |
||||||||||||||||||||||||
| Shares Beneficially Owned Prior to the Offering |
Excluding Exercise of Option to Purchase Additional Shares |
Including Exercise of Option to Purchase Additional Shares |
||||||||||||||||||||||
| Name of Beneficial Owner |
Number | Percent | Number | Percent | Number | Percent | ||||||||||||||||||
| Principal Shareholders |
||||||||||||||||||||||||
| Investments funds affiliated with The Carlyle Group(1) |
170,311,996 | 74.12 | % | 135,311,996 | 58.89 | % | 130,061,996 | 56.60 | % | |||||||||||||||
| Executive Officers and Directors |
||||||||||||||||||||||||
| Charles W. Shaver(2) |
2,222,728 | * | 2,222,728 | * | 2,222,728 | * | ||||||||||||||||||
| Robert W. Bryant(3) |
691,579 | * | 691,579 | * | 691,579 | * | ||||||||||||||||||
| Stephen K. Markevich(4) |
505,605 | * | 505,605 | * | 505,605 | * | ||||||||||||||||||
| Joseph F. McDougall(5) |
256,256 | * | 256,256 | * | 256,256 | * | ||||||||||||||||||
| Michael F. Finn(6) |
265,992 | * | 265,992 | * | 265,992 | * | ||||||||||||||||||
| Orlando A. Bustos(7) |
162,879 | * | 162,879 | * | 162,879 | * | ||||||||||||||||||
| Robert M. McLaughlin(8) |
80,301 | * | 80,301 | * | 80,301 | * | ||||||||||||||||||
| Andreas C. Kramvis |
277,732 | * | 277,732 | * | 277,732 | * | ||||||||||||||||||
| Martin W. Sumner |
— | — | — | — | — | — | ||||||||||||||||||
| Wesley T. Bieligk |
— | — | — | — | — | — | ||||||||||||||||||
| Gregor P. Böhm |
— | — | — | — | — | — | ||||||||||||||||||
| Allan M. Holt |
— | — | — | — | — | — | ||||||||||||||||||
| Gregory S. Ledford |
— | — | — | — | — | — | ||||||||||||||||||
| All executive officers and directors as a group (14 persons) |
4,640,229 | 2.02 | % | 4,640,229 | 2.02 | % | 4,640,229 | 2.02 | % | |||||||||||||||
149
Table of Contents
| * | Denotes less than 1.0% of beneficial ownership. |
| (1) | Includes 36,241,700 shares held by Carlyle Partners V SA1 Cayman, L.P. (“CPV SA1”), 32,674,647 shares held by Carlyle Partners V SA2 Cayman, L.P. (“CPV SA2”), 33,533,083 shares held by Carlyle Partners V SA3 Cayman, L.P. (“CPV SA3”), 2,100,891 shares held by Carlyle Partners V-A Cayman, L.P. (“CPV-A”), 3,980,455 shares held by CP V Coinvestment A Cayman, L.P. (“CPV Coinvest A”), 477,868 shares held by CP V Coinvestment B Cayman, L.P. (“CPV Coinvest B”), 21,657,681 shares held by Carlyle Coatings Partners, L.P. (“CCP” and, together with CPV SA1, CPV SA2, CPV SA3, CPV-A, CPV Coinvest A and CPV Coinvest B, the “Carlyle Cayman Shareholders”) and 39,645,671 shares held by CEP III Participations, S.à r.l. SICAR (“CEP III” and, together with the Carlyle Cayman Shareholders, the “Carlyle Shareholders”). |
Carlyle Group Management L.L.C. is the general partner of The Carlyle Group L.P., which is a publicly traded entity listed on NASDAQ. The Carlyle Group L.P. is the managing member of Carlyle Holdings II GP L.L.C., which is the general partner of Carlyle Holdings II L.P., which is the general partner of TC Group Cayman Investment Holdings, L.P., which is the general partner of TC Group Cayman Investment Holdings Sub L.P., which is the sole member of CP V General Partner, L.L.C. and the sole shareholder of CEP III Managing GP Holdings, Ltd. CP V General Partner, L.L.C. is the general partner of TC Group V Cayman, L.P., which is the general partner of each of the Carlyle Cayman Shareholders. CEP III Managing GP Holdings, Ltd. is the general partner of CEP III Managing GP, L.P., which is the general partner of Carlyle Europe Partners III, L.P., which is the sole shareholder of CEP III.
Voting and investment determinations with respect to the shares held by the Carlyle Cayman Shareholders are made by an investment committee of TC Group V, L.P. comprised of Daniel D’Aniello, William Conway, David Rubenstein, Louis Gerstner, Allan Holt, Peter Clare, Gregor Böhm, Kewsong Lee and Thomas Mayrhofer. Voting and investment determinations with respect to the shares held by the CEP III are made by an investment committee of CEP III Managing GP, L.P. comprised of Daniel D’Aniello, William Conway, David Rubenstein, Louis Gerstner, Allan Holt, Kewsong Lee and Thomas Mayrhofer. Each member of the investment committees disclaims beneficial ownership of such shares.
The address for each of TC Group Cayman Investment Holdings, L.P., TC Group Cayman Investment Holdings Sub L.P., TC Group V Cayman, L.P. and the Carlyle Cayman Shareholders is c/o Intertrust Corporate Services, 190 Elgin Avenue, George Town, Grand Cayman, E9 KY1-9005, Cayman Islands. The address for CEP III is c/o The Carlyle Group, 2, avenue Charles de Gaulle, L -1653 Luxembourg, Luxembourg. The address of each of the other persons or entities named in this footnote is c/o The Carlyle Group, 1001 Pennsylvania Ave. NW, Suite 220 South, Washington, D.C. 20004-2505.
| (2) | Includes 338,000 common shares and 1,884,728 common shares which may be acquired upon the exercise of stock options which have vested or will vest within 60 days of the filing of this prospectus. |
| (3) | Includes 84,500 common shares and 607,079 common shares which may be acquired upon the exercise of stock options which have vested or will vest within 60 days of the filing of this prospectus. |
| (4) | Includes 144,532 common shares and 361,073 common shares which may be acquired upon the exercise of stock options which have vested or will vest within 60 days of the filing of this prospectus. |
| (5) | Includes 38,025 common shares and 218,231 common shares which may be acquired upon the exercise of stock options which have vested or will vest within 60 days of the filing of this prospectus. |
| (6) | Includes 109,758 common shares and 156,234 common shares which may be acquired upon the exercise of stock options which have vested or will vest within 60 days of the filing of this prospectus. |
| (7) | Includes 162,879 common shares which may be acquired upon the exercise of stock options which have vested or will vest within 60 days of the filing of this prospectus held through OHorizons Global, a firm of which Mr. Bustos is the Chairman and Chief Executive Officer. |
| (8) | Includes 69,290 common shares and 11,011 common shares which may be acquired upon the exercise of stock options which have vested or will vest within 60 days of the filing of this prospectus. |
150
Table of Contents
The following description of our share capital summarizes certain provisions of our amended memorandum of association and our amended and restated bye-laws. Such summaries do not purport to be complete and are subject to, and are qualified in their entirety by reference to, all of the provisions of our amended memorandum of association and amended and restated bye-laws, copies of which have been incorporated by reference as exhibits to the registration statement of which this prospectus forms a part. Prospective investors are urged to read the exhibits for a complete understanding of our amended memorandum of association and amended and restated bye-laws.
General
We are an exempted company incorporated under the laws of Bermuda. We are registered with the Registrar of Companies in Bermuda under registration number 46832. We were incorporated on August 24, 2012 under the name Flash Bermuda Co. Ltd. Our registered office is located at Clarendon House, 2 Church Street, Hamilton HM 11, Bermuda.
The objects of our business are unrestricted, and the Company has the capacity of a natural person. We can therefore undertake activities without restriction on our capacity.
Since our incorporation, other than (i) an increase in our authorized share capital to 1,000,000,000 shares on October 16, 2013 and (ii) the completion of a bonus issue of 0.69 of a share for every common share in issue as at October 28, 2014, rounded down to the nearest whole share, which was effectuated on October 28, 2014 in connection with the IPO, there have been no material changes to our share capital, mergers, amalgamations or consolidations of us or any of our subsidiaries, no material changes in the mode of conducting our business, no material changes in the types of products produced or services rendered. On May 9, 2013, we changed our name from Flash Bermuda Co. Ltd. to Axalta Coating Systems Bermuda Co., Ltd., and on August 8, 2014, we changed our name from Axalta Coating Systems Bermuda Co., Ltd. to Axalta Coating Systems Ltd. There have been no bankruptcy, receivership or similar proceedings with respect to us or our subsidiaries.
There have been no public takeover offers by third parties for our shares nor any public takeover offers by us for the shares of another company that have occurred during the last or current financial years.
Our common shares are listed on the NYSE under the symbol “AXTA”.
Initial settlement of our common shares will take place on the closing date of this offering through The Depository Trust Company (“DTC”) in accordance with its customary settlement procedures for equity securities registered through DTC’s book-entry transfer system. Each person beneficially owning common shares registered through DTC must rely on the procedures thereof and on institutions that have accounts therewith to exercise any rights of a holder of the common shares.
Share Capital
Our authorized share capital consists of issued common shares, par value $1.00 per share, and undesignated shares, par value $1.00 per share that our Board of Directors is authorized to designate from time to time as common shares or as preference shares. As of December 31, 2014, there are 229,779,626 common shares issued and outstanding, excluding 2,878,469 common shares issuable upon exercise of options granted as of December 31, 2014, and no preference shares issued and outstanding. All of our issued and outstanding common shares are fully paid.
Pursuant to our amended and restated bye-laws, subject to the requirements of the NYSE and to any resolution of the shareholders to the contrary, our Board of Directors is authorized to issue any of our authorized but unissued shares. There are no limitations on the right of non-Bermudians or non-residents of Bermuda to hold or vote our shares.
151
Table of Contents
Common Shares
Holders of common shares have no pre-emptive, redemption, conversion or sinking fund rights. Holders of common shares are entitled to one vote per share on all matters submitted to a vote of holders of common shares. Unless a different majority is required by law or by our amended and restated bye-laws, resolutions to be approved by holders of common shares require approval by a simple majority of votes cast at a meeting at which a quorum is present.
In the event of our liquidation, dissolution or winding up, the holders of common shares are entitled to share equally and ratably in our assets, if any, remaining after the payment of all of our debts and liabilities, subject to any liquidation preference on any issued and outstanding preference shares.
Preference Shares
Pursuant to Bermuda law and our amended and restated bye-laws, our Board of Directors may, by resolution, establish one or more series of preference shares having such number of shares, designations, dividend rates, relative voting rights, conversion or exchange rights, redemption rights, liquidation rights and other relative participation, optional or other special rights, qualifications, limitations or restrictions as may be fixed by the Board of Directors without any further shareholder approval. Such rights, preferences, powers and limitations, as may be established, could have the effect of discouraging an attempt to obtain control of the company.
Dividend Rights
Under Bermuda law, a company may not declare or pay dividends if there are reasonable grounds for believing that: (i) the company is, or would after the payment be, unable to pay its liabilities as they become due; or (ii) that the realizable value of its assets would thereby be less than its liabilities. Under our amended and restated bye-laws, each common share is entitled to dividends if, as and when dividends are declared by our Board of Directors, subject to any preferred dividend right of the holders of any preference shares.
Any cash dividends payable to holders of our common shares listed on the NYSE will be paid to American Stock Transfer & Trust Company, LLC, our paying agent in the United States for disbursement to those holders.
Variation of Rights
If at any time we have more than one class of shares, the rights attaching to any class, unless otherwise provided for by the terms of issue of the relevant class, may be varied either: (i) with the consent in writing of the holders of 75% of the issued shares of that class; or (ii) with the sanction of a resolution passed by a majority of the votes cast at a general meeting of the relevant class of shareholders at which a quorum consisting of at least two persons holding or representing one-third of the issued shares of the relevant class is present. Our amended and restated bye-laws specify that the creation or issue of shares ranking equally with existing shares will not, unless expressly provided by the terms of issue of existing shares, vary the rights attached to existing shares. In addition, the creation or issue of preference shares ranking prior to common shares will not be deemed to vary the rights attached to common shares or, subject to the terms of any other class or series of preference shares, to vary the rights attached to any other class or series of preference shares.
Transfer of Shares
Our Board of Directors may, in its absolute discretion and without assigning any reason, refuse to register the transfer of a share on the basis that it is not fully paid. Our Board of Directors may also refuse to recognize an instrument of transfer of a share unless it is accompanied by the relevant share certificate and such other evidence of the transferor’s right to make the transfer as our Board of Directors shall reasonably require. Subject to these restrictions, a holder of common shares may transfer the title to all or any of his common shares by completing a form of transfer in the form set out in our amended and restated bye-laws (or as near thereto as circumstances
152
Table of Contents
admit) or in such other common form as our Board of Directors may accept. The instrument of transfer must be signed by the transferor and transferee, although in the case of a fully paid share our Board of Directors may accept the instrument signed only by the transferor.
Where our shares are listed or admitted to trading on any appointed stock exchange, such as the NYSE, they will be transferred in accordance with the rules and regulations of such exchange.
Meetings of Shareholders
Under Bermuda law, a company is required to convene at least one general meeting of shareholders each calendar year, which we refer to as the annual general meeting. However, the shareholders may by resolution waive this requirement, either for a specific year or period of time, or indefinitely. When the requirement has been so waived, any shareholder may, on notice to the company, terminate the waiver, in which case an annual general meeting must be called. We have chosen not to waive the convening of an annual general meeting.
Bermuda law provides that a special general meeting of shareholders may be called by the Board of Directors of a company and must be called upon the request of shareholders holding not less than 10% of the paid-up capital of the company carrying the right to vote at general meetings. Bermuda law also requires that shareholders be given at least five days’ advance notice of a general meeting, but the accidental omission to give notice to any person does not invalidate the proceedings at a meeting. Our amended and restated bye-laws provide that our Board of Directors may convene an annual general meeting and the chairman or a majority of our directors then in office may convene a special general meeting. Under our amended and restated bye-laws, at least 14 days’ notice of an annual general meeting or ten days’ notice of a special general meeting must be given to each shareholder entitled to vote at such meeting. This notice requirement is subject to the ability to hold such meetings on shorter notice if such notice is agreed: (i) in the case of an annual general meeting by all of the shareholders entitled to attend and vote at such meeting; or (ii) in the case of a special general meeting by a majority in number of the shareholders entitled to attend and vote at the meeting holding not less than 95% in nominal value of the shares entitled to vote at such meeting. Subject to the rules of the NYSE, the quorum required for a general meeting of shareholders is two or more persons present in person at the start of the meeting and representing in person or by proxy in excess of 50% of all issued and outstanding common shares.
Access to Books and Records and Dissemination of Information
Members of the general public have a right to inspect the public documents of a company available at the office of the Registrar of Companies in Bermuda. These documents include a company’s amended and restated memorandum of association, including its objects and powers, and certain alterations to the amended and restated memorandum of association. The shareholders have the additional right to inspect the bye-laws of the company, minutes of general meetings and the company’s audited financial statements, which must be presented in the annual general meeting. The register of members of a company is also open to inspection by shareholders and by members of the general public without charge. The register of members is required to be open for inspection for not less than two hours in any business day (subject to the ability of a company to close the register of members for not more than thirty days in a year). A company is required to maintain its share register in Bermuda but may, subject to the provisions of the Companies Act establish a branch register outside of Bermuda. A company is required to keep at its registered office a register of directors and officers that is open for inspection for not less than two hours in any business day by members of the public without charge. Bermuda law does not, however, provide a general right for shareholders to inspect or obtain copies of any other corporate records.
Election and Removal of Directors
Our amended and restated bye-laws provide that our Board of Directors shall consist of such number of directors as the Board of Directors may determine. Our Board of Directors currently consists of nine directors. Our Board of Directors is divided into three classes that are, as nearly as possible, of equal size. Each class of directors is
153
Table of Contents
elected for a three-year term of office, but the terms are staggered so that the term of only one class of directors expires at each annual general meeting. The initial terms of the Class I, Class II and Class III directors will expire in 2015, 2016 and 2017, respectively. At each succeeding annual general meeting, successors to the class of directors whose term expires at the annual general meeting will be elected for a three-year term.
A shareholder holding not less than 10% in nominal value of the common shares in issue may propose for election as a director someone who is not an existing director or is not proposed by our Board of Directors. Where a Director is to be elected at an annual general meeting, notice of any such proposal for election must be given not less than 90 days nor more than 120 days before the anniversary of the last annual general meeting prior to the giving of the notice or, in the event the annual general meeting is called for a date that is not less than 30 days before or after such anniversary the notice must be given not later than ten days following the earlier of the date on which notice of the annual general meeting was posted to shareholders or the date on which public disclosure of the date of the annual general meeting was made. Where a Director is to be elected at a special general meeting, that notice must be given not later than 7 days following the earlier of the date on which notice of the special general meeting was posted to shareholders or the date on which public disclosure of the date of the special general meeting was made.
For so long as investment funds affiliated with Carlyle own more than 50% of the common shares in issue, a director may be removed with or without cause by the shareholders, provided notice of the shareholders meeting convened to remove the director is given to the director. The notice must contain a statement of the intention to remove the director and a summary of the facts justifying the removal and must be served on the director not less than 14 days before the meeting. The director is entitled to attend the meeting and be heard on the motion for his removal.
Once investment funds affiliated with Carlyle cease to own more than 50% of the common shares in issue, a director may be removed, only with cause, by the shareholders, provided notice of the shareholders meeting convened to remove the director is given to the director. The notice must contain a statement of the intention to remove the director and a summary of the facts justifying the removal and must be served on the director not less than 14 days before the meeting. The director is entitled to attend the meeting and be heard on the motion for his removal.
Proceedings of Board of Directors
Our amended and restated bye-laws provide that our business is to be managed and conducted by our Board of Directors. Bermuda law permits individual and corporate directors and there is no requirement in our bye-laws or Bermuda law that directors hold any of our shares. There is also no requirement in our amended and restated bye-laws or Bermuda law that our directors must retire at a certain age.
The compensation of our directors is determined by the Board of Directors, and there is no requirement that a specified number or percentage of “independent” directors must approve any such determination. Our directors may also be paid all travel, hotel and other reasonable out-of-pocket expenses properly incurred by them in connection with our business or their duties as directors.
A director who discloses a direct or indirect interest in any contract or arrangement with us as required by Bermuda law is not entitled to vote in respect of any such contract or arrangement in which he or she is interested unless the chairman of the relevant meeting of the Board of Directors determines that such director is not disqualified from voting.
Indemnification of Directors and Officers
Section 98 of the Companies Act provides generally that a Bermuda company may indemnify its directors, officers and auditors against any liability which by virtue of any rule of law would otherwise be imposed on them
154
Table of Contents
in respect of any negligence, default, breach of duty or breach of trust, except in cases where such liability arises from fraud or dishonesty of which such director, officer or auditor may be guilty in relation to the company. Section 98 further provides that a Bermuda company may indemnify its directors, officers and auditors against any liability incurred by them in defending any proceedings, whether civil or criminal, in which judgment is awarded in their favor or in which they are acquitted or granted relief by the Supreme Court of Bermuda pursuant to Section 281 of the Companies Act.
Our amended and restated bye-laws provide that we shall indemnify our officers and directors in respect of their actions and omissions, except in respect of their fraud or dishonesty, and that we shall advance funds to our officers and directors for expenses incurred in their defense upon receipt of an undertaking to repay the funds if any allegation of fraud or dishonesty is proved. Our amended and restated bye-laws provide that the shareholders waive all claims or rights of action that they might have, individually or in right of the company, against any of the company’s directors or officers for any act or failure to act in the performance of such director’s or officer’s duties, except in respect of any fraud or dishonesty of such director or officer. Section 98A of the Companies Act permits us to purchase and maintain insurance for the benefit of any officer or director in respect of any loss or liability attaching to him in respect of any negligence, default, breach of duty or breach of trust, whether or not we may otherwise indemnify such officer or director. We have purchased and maintain a directors’ and officers’ liability policy for such purpose.
Amendment of Memorandum of Association and Bye-laws
Bermuda law provides that the memorandum of association of a company may be amended by a resolution passed at a general meeting of shareholders. Our amended and restated bye-laws provide that no bye-law shall be rescinded, altered or amended, and no new bye-law shall be made, unless it shall have been approved by a resolution of our Board of Directors and by a resolution of our shareholders including the affirmative vote of a majority of all votes entitled to be cast on the resolution.
Under Bermuda law, the holders of an aggregate of not less than 20% in par value of a company’s issued share capital or any class thereof have the right to apply to the Supreme Court of Bermuda for an annulment of any amendment of the memorandum of association adopted by shareholders at any general meeting, other than an amendment that alters or reduces a company’s share capital as provided in the Companies Act. Where such an application is made, the amendment becomes effective only to the extent that it is confirmed by the Supreme Court of Bermuda. An application for an annulment of an amendment of the memorandum of association must be made within 21 days after the date on which the resolution altering the company’s memorandum of association is passed and may be made on behalf of persons entitled to make the application by one or more of their number as they may appoint in writing for the purpose. No application may be made by shareholders voting in favor of the amendment.
Amalgamations and Mergers
The amalgamation or merger of a Bermuda company with another company or corporation (other than certain affiliated companies) requires the amalgamation or merger agreement to be approved by the company’s Board of Directors and by its shareholders. Unless the company’s bye-laws provide otherwise, the approval of 75% of the shareholders voting at such meeting is required to approve the amalgamation or merger agreement, and the quorum for such meeting must be two or more persons holding or representing more than one-third of the issued shares of the company.
Under Bermuda law, in the event of an amalgamation or merger of a Bermuda company with another company or corporation, a shareholder of the Bermuda company who did not vote in favor of the amalgamation or merger and who is not satisfied that fair value has been offered for such shareholder’s shares may, within one month of notice of the shareholders meeting, apply to the Supreme Court of Bermuda to appraise the fair value of those shares.
155
Table of Contents
Shareholder Suits
Class actions and derivative actions are generally not available to shareholders under Bermuda law. The Bermuda courts, however, would ordinarily be expected to permit a shareholder to commence an action in the name of a company to remedy a wrong to the company where the act complained of is alleged to be beyond the corporate power of the company or illegal, or would result in the violation of the company’s memorandum of association or bye-laws. Furthermore, consideration would be given by a Bermuda court to acts that are alleged to constitute a fraud against the minority shareholders or, for instance, where an act requires the approval of a greater percentage of the company’s shareholders than that which actually approved it.
When the affairs of a company are being conducted in a manner that is oppressive or prejudicial to the interests of some part of the shareholders, one or more shareholders may apply to the Supreme Court of Bermuda, which may make such order as it sees fit, including an order regulating the conduct of the company’s affairs in the future or ordering the purchase of the shares of any shareholders by other shareholders or by the company.
Our amended and restated bye-laws contain a provision by virtue of which our shareholders waive any claim or right of action that they have, both individually and on our behalf, against any director or officer in relation to any action or failure to take action by such director or officer, except in respect of any fraud or dishonesty of such director or officer. We have been advised by the SEC that in the opinion of the SEC, the operation of this provision as a waiver of the right to sue for violations of federal securities laws would likely be unenforceable in U.S. courts.
Capitalization of Profits and Reserves
Pursuant to our amended and restated bye-laws, our Board of Directors may (i) capitalize any part of the amount of our share premium or other reserve accounts or any amount credited to our profit and loss account or otherwise available for distribution by applying such sum in paying up unissued shares to be allotted as fully paid bonus shares pro rata (except in connection with the conversion of shares) to the shareholders; or (ii) capitalize any sum standing to the credit of a reserve account or sums otherwise available for dividend or distribution by paying up in full, partly paid or nil paid shares of those shareholders who would have been entitled to such sums if they were distributed by way of dividend or distribution.
Registrar or Transfer Agent
A register of holders of the common shares is maintained by Codan Services Limited in Bermuda, and a branch register is maintained in the United States by American Stock Transfer & Trust Company, LLC, which serves as branch registrar and transfer agent.
Untraced Shareholders
Our amended and restated bye-laws provide that our Board of Directors may forfeit any dividend or other monies payable in respect of any shares that remain unclaimed for six years from the date when such monies became due for payment. In addition, we are entitled to cease sending dividend warrants and checks by post or otherwise to a shareholder if such instruments have been returned undelivered to, or left uncashed by, such shareholder on at least two consecutive occasions or, following one such occasion, reasonable enquires have failed to establish the shareholder’s new address. This entitlement ceases if the shareholder claims a dividend or cashes a dividend check or a warrant.
Certain Provisions of Bermuda Law
We have been designated by the Bermuda Monetary Authority as a non-resident for Bermuda exchange control purposes. This designation allows us to engage in transactions in currencies other than the Bermuda dollar, and there are no restrictions on our ability to transfer funds (other than funds denominated in Bermuda dollars) in and out of Bermuda or to pay dividends to U.S. residents who are holders of our common shares.
156
Table of Contents
The Bermuda Monetary Authority has given its consent for the issue and free transferability of all of the common shares that are the subject of this offering to and between residents and non-residents of Bermuda for exchange control purposes, provided our shares remain listed on an appointed stock exchange, which includes the NYSE. Approvals or permissions given by the Bermuda Monetary Authority do not constitute a guarantee by the Bermuda Monetary Authority as to our performance or our creditworthiness. Accordingly, in giving such consent or permissions, neither the Bermuda Monetary Authority nor the Registrar of Companies in Bermuda shall be liable for the financial soundness, performance or default of our business or for the correctness of any opinions or statements expressed in this prospectus. Certain issues and transfers of common shares involving persons deemed resident in Bermuda for exchange control purposes require the specific consent of the Bermuda Monetary Authority.
In accordance with Bermuda law, share certificates are only issued in the names of companies, partnerships or individuals. In the case of a shareholder acting in a special capacity (for example as a trustee), certificates may, at the request of the shareholder, record the capacity in which the shareholder is acting. Notwithstanding such recording of any special capacity, we are not bound to investigate or see to the execution of any such trust.
157
Table of Contents
SHARES ELIGIBLE FOR FUTURE SALE
As of December 31, 2014, we had 229,779,626 outstanding common shares. Of these shares, 58,327,246 common shares will be freely transferable without restriction or further registration under the Securities Act by persons other than “affiliates,” as that term is defined in Rule 144 under the Securities Act. Generally, the balance of our outstanding common shares are “restricted securities” within the meaning of Rule 144 under the Securities Act, subject to the limitations and restrictions that are described below. Common shares purchased by our affiliates will be “restricted securities” under Rule 144. Restricted securities may be sold in the public market only if registered or if they qualify for an exemption from registration under Rules 144 or 701 promulgated under the Securities Act.
Lock-Up Agreements
In connection with this offering, we, our executive officers and directors and Carlyle have agreed, subject to certain exceptions, not to sell or transfer any common shares or securities convertible into, exchangeable for, exercisable for, or repayable with our common shares, for 90 days after the date of this prospectus without first obtaining the written consent of the representatives of the underwriters. Requests for the consent of the representatives of the underwriters to the sale of shares by us, our executive officers or our directors or by Carlyle prior to the expiration of these lock-up agreements will be considered on a case-by-case basis by the representatives. When determining whether or not to grant their consent, the representatives may consider, among other factors, the reasons given by us or the relevant shareholder, as applicable, for requesting the consent, the number of shares for which the consent is being requested and market conditions at such time. See “Underwriting.”
Rule 144
In general, under Rule 144 as in effect on the date of this prospectus, beginning 90 days after the consummation of our IPO, a person (or persons whose common shares are required to be aggregated) who is an affiliate and who has beneficially owned our common shares for at least six months is entitled to sell in any three-month period a number of shares that does not exceed the greater of:
| • | 1% of the number of shares then outstanding, which would equal approximately 2.3 million shares based on 229,779,626 common shares outstanding as of December 31, 2014; or |
| • | the average weekly trading volume in our shares on the NYSE during the four calendar weeks preceding the filing of a notice on Form 144 with respect to such a sale. |
Sales by our affiliates under Rule 144 are also subject to manner of sale provisions and notice requirements and to the availability of current public information about us. An “affiliate” is a person that directly, or indirectly through one or more intermediaries, controls or is controlled by, or is under common control with an issuer.
Under Rule 144, a person (or persons whose shares are aggregated) who is not deemed to have been an affiliate of ours at any time during the 90 days preceding a sale, and who has beneficially owned the shares proposed to be sold for at least six months (including the holding period of any prior owner other than an affiliate), would be entitled to sell those shares subject only to availability of current public information about us, and after beneficially owning such shares for at least 12 months (including the holding period of any prior owner other than an affiliate), would be entitled to sell an unlimited number of shares without restriction. To the extent that our affiliates sell their common shares, other than pursuant to Rule 144 or a registration statement, the purchaser’s holding period for the purpose of effecting a sale under Rule 144 commences on the date of transfer from the affiliate.
Rule 701
In general, under Rule 701 as in effect on the date of this prospectus, any of our employees, directors, officers, consultants or advisors who purchased shares from us in reliance on Rule 701 in connection with a compensatory
158
Table of Contents
stock or option plan or other written agreement before the effective date of our IPO, or who purchased shares from us after that date upon the exercise of options granted before that date, are eligible to resell such shares 90 days after the effective date of our IPO in reliance upon Rule 144. If such person is not an affiliate, such sale may be made subject only to the manner of sale provisions of Rule 144. If such a person is an affiliate, such sale may be made under Rule 144 without compliance with the holding period requirement, but subject to the other Rule 144 restrictions described above.
Registration Rights
Pursuant to the principal stockholders agreement, we have granted Carlyle (or such permitted transferee or affiliate) the right to cause us, in certain instances, at our expense, to file registration statements under the Securities Act covering resales of our common shares held by Carlyle (or such permitted transferee or affiliate) or to piggyback on such registration statements in certain circumstances. These shares will represent approximately 58.9% of our common shares after this offering, or 56.6% if the underwriters exercise their option to purchase additional shares in full. These shares also may be sold under Rule 144 under the Securities Act, depending on their holding period and subject to restrictions in the case of shares held by persons deemed to be our affiliates. The principal stockholders agreement also requires us to indemnify certain of our shareholders and their affiliates in connection with any registrations of our securities. The principal stockholders agreement does not contain any prescribed cash penalties or additional penalties as a result of delays in registering our common shares.
159
Table of Contents
BERMUDA COMPANY CONSIDERATIONS
Our corporate affairs are governed by our memorandum of association and bye-laws and by the corporate law of Bermuda. The provisions of the Companies Act, which applies to us, differ in certain material respects from laws generally applicable to U.S. companies incorporated in the State of Delaware and their stockholders. The following is a summary of significant differences between the Companies Act (including modifications adopted pursuant to our bye-laws) and Bermuda common law applicable to us and our shareholders and the provisions of the General Corporation Law of the State of Delaware applicable to U.S. companies organized under the laws of Delaware and their stockholders.
| Bermuda |
Delaware | |
| Shareholder meetings | ||
| – May be called by the board of directors and must be called upon the request of shareholders holding not less than 10% of the paid-up capital of the company carrying the right to vote at general meetings. |
– May be held at such time or place as designated in the certificate of incorporation or the bylaws, or if not so designated, as determined by the board of directors. | |
| – May be held in or outside Bermuda. |
– May be held in or outside of Delaware. | |
| – Notice: |
– Notice: | |
| – Shareholders must be given at least five days’ advance notice of a general meeting, but the unintentional failure to give notice to any person does not invalidate the proceedings at a meeting. |
– Written notice shall be given not less than ten nor more than 60 days before the meeting. | |
| – Notice of general meetings must specify the place, the day and hour of the meeting and in the case of special general meetings, the general nature of the business to be considered. |
– Whenever stockholders are required to take any action at a meeting, a written notice of the meeting shall be given which shall state the place, if any, date and hour of the meeting, and the means of remote communication, if any. | |
| Shareholder’s voting rights | ||
| – Shareholders may act by written consent to elect directors. Shareholders may not act by written consent to remove a director or auditor. |
– With limited exceptions, stockholders may act by written consent to elect directors unless prohibited by the certificate of incorporation. | |
| – Generally, except as otherwise provided in the bye-laws, or the Companies Act, any action or resolution requiring approval of the shareholders may be passed by a simple majority of votes cast. Any person authorized to vote may authorize another person or persons to act for him or her by proxy. |
– Any person authorized to vote may authorize another person or persons to act for him or her by proxy. | |
| – The voting rights of shareholders are regulated by a company’s bye-laws and, in certain circumstances, by the Companies Act. The bye-laws may specify the number to constitute a quorum and if the bye-laws permit, a general meeting of the shareholders of a company may be held with only one individual present if the requirement for a quorum is satisfied. |
– For stock corporations, the certificate of incorporation or bylaws may specify the number to constitute a quorum, but in no event shall a quorum consist of less than one-third of shares entitled to vote at a meeting. In the absence of such specifications, a majority of shares entitled to vote shall constitute a quorum. | |
160
Table of Contents
| Bermuda |
Delaware | |
| – Our bye-laws provide that when a quorum is once present in general meeting it is not broken by the subsequent withdrawal of any shareholders. |
– When a quorum is once present to organize a meeting, it is not broken by the subsequent withdrawal of any stockholders. | |
| – The bye-laws may provide for cumulative voting, although our bye-laws do not. |
– The certificate of incorporation may provide for cumulative voting. | |
| – The amalgamation or merger of a Bermuda company with another company or corporation (other than certain affiliated companies) requires the amalgamation or merger agreement to be approved by the company’s board of directors and by its shareholders. Unless the company’s bye-laws provide otherwise, the approval of 75% of the shareholders voting at such meeting is required to approve the amalgamation or merger agreement, and the quorum for such meeting must be two or more persons holding or representing more than one-third of the issued shares of the company. |
– Any two or more corporations existing under the laws of the state may merge into a single corporation pursuant to a board resolution and upon the majority vote by stockholders of each constituent corporation at an annual or special meeting. | |
| – Every company may at any meeting of its board of directors sell, lease or exchange all or substantially all of its property and assets as its board of directors deems expedient and in the best interests of the company to do so when authorized by a resolution adopted by the holders of a majority of issued and outstanding shares of a company entitled to vote. |
– Every corporation may at any meeting of the board sell, lease or exchange all or substantially all of its property and assets as its board deems expedient and for the best interests of the corporation when so authorized by a resolution adopted by the holders of a majority of the outstanding stock of a corporation entitled to vote. | |
| – Any company that is the wholly owned subsidiary of a holding company, or one or more companies which are wholly owned subsidiaries of the same holding company, may amalgamate or merge without the vote or consent of shareholders provided that the approval of the board of directors is obtained and that a director or officer of each such company signs a statutory solvency declaration in respect of the relevant company. |
– Any corporation owning at least 90% of the outstanding shares of each class of another corporation may merge the other corporation into itself and assume all of its obligations without the vote or consent of stockholders; however, in case the parent corporation is not the surviving corporation, the proposed merger shall be approved by a majority of the outstanding stock of the parent corporation entitled to vote at a duly called stockholder meeting. | |
| – Any mortgage, charge or pledge of a company’s property and assets may be authorized without the consent of shareholders subject to any restrictions under the bye-laws. |
– Any mortgage or pledge of a corporation’s property and assets may be authorized without the vote or consent of stockholders, except to the extent that the certificate of incorporation otherwise provides. | |
161
Table of Contents
| Bermuda |
Delaware | |
| Directors | ||
| – The board of directors must consist of at least one director.
– The number of directors is fixed by the bye-laws, and any changes to such number must be approved by the board of directors and/or the shareholders in accordance with the company’s bye-laws.
– Removal:
– Under our bye-laws, as long as investment funds affiliated with Carlyle hold a majority of the common shares in issue, any or all directors may be removed, with or without cause by the holders of a majority of the shares entitled to vote at a special meeting convened and held in accordance with the bye-laws for the purpose of such removal. Once investment funds affiliated with Carlyle cease to own a majority of our common shares in issue, any or all directors may be removed only with cause by the holders of a majority of the shares entitled to vote at a special meeting convened and held in accordance with the bye-laws for the purpose of such removal. |
– The board of directors must consist of at least one member.
– Number of board members shall be fixed by the bylaws, unless the certificate of incorporation fixes the number of directors, in which case a change in the number shall be made only by amendment of the certificate of incorporation.
– Removal:
– Any or all of the directors may be removed, with or without cause, by the holders of a majority of the shares entitled to vote unless the certificate of incorporation otherwise provides.
– In the case of a classified board, stockholders may effect removal of any or all directors only for cause.
| |
| Duties of directors | ||
| – The Companies Act authorizes the directors of a company, subject to its bye-laws, to exercise all powers of the company except those that are required by the Companies Act or the company’s bye-laws to be exercised by the shareholders of the company. Our bye-laws provide that our business is to be managed and conducted by our Board of Directors. At common law, members of a board of directors owe a fiduciary duty to the company to act in good faith in their dealings with or on behalf of the company and exercise their powers and fulfill the duties of their office honestly. This duty includes the following essential elements:
– a duty to act in good faith in the best interests of the company;
– a duty not to make a personal profit from opportunities that arise from the office of director;
– a duty to avoid conflicts of interest; and
– a duty to exercise powers for the purpose for which such powers were intended. |
– Under Delaware law, the business and affairs of a corporation are managed by or under the direction of its board of directors. In exercising their powers, directors are charged with a fiduciary duty of care to protect the interests of the corporation and a fiduciary duty of loyalty to act in the best interests of its stockholders. The duty of care requires that a director act in good faith, with the care that an ordinarily prudent person would exercise under similar circumstances. Under this duty, a director must inform himself of, and disclose to stockholders, all material information reasonably available regarding a significant transaction. The duty of loyalty requires that a director act in a manner he reasonably believes to be in the best interests of the corporation. He must not use his corporate position for personal gain or advantage. This duty prohibits self-dealing by a director and mandates that the best interest of the corporation and its stockholders take precedence over any interest possessed by a director, officer or controlling shareholder and not shared by the stockholders generally. | |
162
Table of Contents
| Bermuda |
Delaware | |
| – The Companies Act imposes a duty on directors and officers of a Bermuda company:
– to act honestly and in good faith with a view to the best interests of the company; and
– to exercise the care, diligence and skill that a reasonably prudent person would exercise in comparable circumstances.
– The Companies Act also imposes various duties on directors and officers of a company with respect to certain matters of management and administration of the company. Under Bermuda law, directors and officers generally owe fiduciary duties to the company itself, not to the company’s individual shareholders, creditors or any class thereof. Our shareholders may not have a direct cause of action against our directors.
|
– In general, actions of a director are presumed to have been made on an informed basis, in good faith and in the honest belief that the action taken was in the best interests of the corporation. However, this presumption may be rebutted by evidence of a breach of one of the fiduciary duties. Should such evidence be presented concerning a transaction by a director, a director must prove the procedural fairness of the transaction, and that the transaction was of fair value to the corporation. | |
| Takeovers | ||
| – An acquiring party is generally able to acquire compulsorily the common shares of minority holders of a company in the following ways:
– By a procedure under the Companies Act known as a “scheme of arrangement.” A scheme of arrangement could be effected by obtaining the agreement of the company and of holders of common shares, representing in the aggregate a majority in number and at least 75% in value of the common shareholders present and voting at a court ordered meeting held to consider the scheme of arrangement. The scheme of arrangement must then be sanctioned by the Bermuda Supreme Court. If a scheme of arrangement receives all necessary agreements and sanctions, upon the filing of the court order with the Registrar of Companies in Bermuda, all holders of common shares could be compelled to sell their shares under the terms of the scheme of arrangement.
– By acquiring pursuant to a tender offer 90% of the shares or class of shares not already owned by, or by a nominee for, the acquiring party (the offeror), or any of its subsidiaries. If an offeror has, within four months after the making of an offer for all the shares or class of shares not owned by, or by a nominee for, the offeror, or any of its subsidiaries, obtained the approval of the holders of 90% or more of all the shares to which the offer relates, the |
– Delaware law provides that a parent corporation, by resolution of its board of directors and without any stockholder vote, may merge with any subsidiary of which it owns at least 90% of each class of its capital stock. Upon any such merger, and in the event the parent corporate does not own all of the stock of the subsidiary, dissenting stockholders of the subsidiary are entitled to certain appraisal rights.
– Delaware law also provides, subject to certain exceptions, that if a person acquires 15% of voting stock of a company, the person is an “interested stockholder” and may not engage in “business combinations” with the company for a period of three years from the time the person acquired 15% or more of voting stock. | |
163
Table of Contents
| Bermuda |
Delaware | |
| offeror may, at any time within two months beginning with the date on which the approval was obtained, by notice compulsorily acquire the shares of any nontendering shareholder on the same terms as the original offer unless the Supreme Court of Bermuda (on application made within a one-month period from the date of the offeror’s notice of its intention to acquire such shares) orders otherwise.
– Where the acquiring party or parties hold not less than 95% of the shares or a class of shares of the company, by acquiring, pursuant to a notice given to the remaining shareholders or class of shareholders, the shares of such remaining shareholders or class of shareholders. When this notice is given, the acquiring party is entitled and bound to acquire the shares of the remaining shareholders on the terms set out in the notice, unless a remaining shareholder, within one month of receiving such notice, applies to the Supreme Court of Bermuda for an appraisal of the value of their shares. This provision only applies where the acquiring party offers the same terms to all holders of shares whose shares are being acquired. |
||
| Dissenter’s rights of appraisal | ||
| – A dissenting shareholder (that did not vote in favor of the amalgamation or merger) of a Bermuda exempted company is entitled to be paid the fair value of his or her shares in an amalgamation or merger. |
– With limited exceptions, appraisal rights shall be available for the shares of any class or series of stock of a corporation in a merger or consolidation.
– The certificate of incorporation may provide that appraisal rights are available for shares as a result of an amendment to the certificate of incorporation, any merger or consolidation or the sale of all or substantially all of the assets. | |
| Dissolution | ||
| – Under Bermuda law, a solvent company may be wound up by way of a shareholders’ voluntary liquidation. Prior to the company entering liquidation, a majority of the directors shall each make a statutory declaration, which states that the directors have made a full enquiry into the affairs of the company and have formed the opinion that the company will be able to pay its debts within a period of 12 months of the commencement of the winding up and must file the statutory declaration with the Registrar of Companies in Bermuda. The |
– Under Delaware law, a corporation may voluntarily dissolve (i) if a majority of the board of directors adopts a resolution to that effect and the holders of a majority of the issued and outstanding shares entitled to vote thereon vote for such dissolution; or (ii) if all stockholders entitled to vote thereon consent in writing to such dissolution. | |
164
Table of Contents
| Bermuda |
Delaware | |
| general meeting will be convened primarily for the purposes of passing a resolution that the company be wound up voluntarily and appointing a liquidator. The winding up of the company is deemed to commence at the time of the passing of the resolution. |
||
| Shareholder’s derivative actions | ||
| – Class actions and derivative actions are generally not available to shareholders under Bermuda law. Bermuda courts, however, would ordinarily be expected to permit a shareholder to commence an action in the name of a company to remedy a wrong to the company where the act complained of is alleged to be beyond the corporate power of the company or illegal, or would result in the violation of the company’s memorandum of association or bye-laws. Furthermore, consideration would be given by a Bermuda court to acts that are alleged to constitute a fraud against the minority shareholders or, for instance, where an act requires the approval of a greater percentage of the company’s shareholders than that which actually approved it. |
– In any derivative suit instituted by a stockholder of a corporation, it shall be averred in the complaint that the plaintiff was a stockholder of the corporation at the time of the transaction of which he complains or that such stockholder’s stock thereafter devolved upon such stockholder by operation of law. | |
165
Table of Contents
The following sets forth material Bermuda and U.S. federal income tax consequences of an investment in our common shares. It is based upon laws and relevant interpretations thereof as of the date of this prospectus, all of which are subject to change. This discussion does not address all possible tax consequences relating to an investment in our common shares, such as the tax consequences under U.S. state, local and other tax laws.
Bermuda Tax Considerations
At the present time, there is no Bermuda income or profits tax, withholding tax, capital gains tax, capital transfer tax, estate duty or inheritance tax payable by us or by our shareholders in respect of our shares. We have obtained an assurance from the Minister of Finance of Bermuda under the Exempted Undertakings Tax Protection Act 1966 that, in the event that any legislation is enacted in Bermuda imposing any tax computed on profits or income, or computed on any capital asset, gain or appreciation or any tax in the nature of estate duty or inheritance tax, such tax shall not, until March 31, 2035, be applicable to us or to any of our operations or to our shares, debentures or other obligations except insofar as such tax applies to persons ordinarily resident in Bermuda or is payable by us in respect of real property owned or leased by us in Bermuda.
U.S. Federal Income Tax Considerations
The following discussion describes the material U.S. federal income tax consequences to U.S. Holders (defined below) (and solely to the extent described below under “—FATCA,” to non-U.S. persons) under present law of an investment in our common shares. The discussion below applies only to U.S. Holders that acquire our common shares in this offering, hold our common shares as capital assets and that have the U.S. dollar as their functional currency. The discussion below is based on the Code, existing and, in some cases, proposed U.S. Treasury regulations, as well as judicial and administrative interpretations thereof, all as of date of this prospectus. All of the foregoing authorities are subject to change or differing interpretation, which change or differing interpretation could apply retroactively and could affect the tax consequences described below. There can be no assurance that the U.S. Internal Revenue Service will not assert a different position concerning any of the tax consequences discussed below or that any such position would not be sustained by a court. This summary does not address any estate or gift tax consequences or any state, local, or non-U.S. tax consequences, nor does it address the Medicare contribution tax on net investment income.
The following discussion does not deal with the tax consequences to any particular investor and does not describe all of the tax consequences to persons in special tax situations such as:
| • | banks; |
| • | certain financial institutions; |
| • | regulated investment companies; |
| • | insurance companies; |
| • | broker dealers; |
| • | traders that elect to mark to market; |
| • | tax-exempt entities; |
| • | persons liable for alternative minimum tax; |
| • | certain U.S. expatriates; |
| • | persons holding our common shares as part of a straddle, hedging, constructive sale, conversion or integrated transaction; |
| • | persons that actually or constructively own 10% or more of the company’s voting stock; |
166
Table of Contents
| • | persons that are resident or ordinarily resident in or have a permanent establishment in a jurisdiction outside the United States; |
| • | persons who acquired our common shares pursuant to the exercise of any employee share option or otherwise as compensation; or |
| • | persons holding our common shares through partnerships or other pass-through entities. |
PROSPECTIVE PURCHASERS ARE URGED TO CONSULT THEIR TAX ADVISORS ABOUT THE APPLICATION OF THE U.S. FEDERAL TAX RULES TO THEIR PARTICULAR CIRCUMSTANCES AS WELL AS THE STATE, LOCAL AND NON-U.S. TAX CONSEQUENCES TO THEM OF THE PURCHASE, OWNERSHIP AND DISPOSITION OF OUR ORDINARY SHARES.
The discussion below of the U.S. federal income tax consequences to “U.S. Holders” applies to a holder that is a beneficial owner of our common shares and is, for U.S. federal income tax purposes,
| • | an individual who is a citizen or resident of the United States; |
| • | a corporation (or other entity taxable as a corporation) organized under the laws of the United States, any State or the District of Columbia; |
| • | an estate whose income is subject to U.S. federal income taxation regardless of its source; or |
| • | a trust that (1) is subject to the supervision of a court within the United States and the control of one or more U.S. persons or (2) has a valid election in effect under applicable U.S. Treasury regulations to be treated as a U.S. person. |
The tax treatment of an entity taxable as a partnership for U.S. federal income tax purposes that holds our common shares generally will depend on such partner’s status and the activities of the partnership.
Dividends
Subject to the passive foreign investment company rules discussed below, the gross amount of distributions made by the Company with respect to our common shares (including the amount of any non-U.S. taxes withheld therefrom, if any) generally will be includable in a U.S. Holder’s gross income in the year received as dividend income, but only to the extent that such distributions are paid out of the Company’s current or accumulated earnings and profits as determined under U.S. federal income tax principles. The Company does not currently maintain calculations of its earnings and profits under U.S. federal income tax principles because the Company currently has no intentions of making distributions to its shareholders. Nevertheless, the Company may compute and maintain calculations of its earnings and profits under U.S. federal income tax principles if and when the Company’s decision on distributions changes. Absent a calculation by the Company of its earnings and profits under U.S. federal income tax principles, a U.S. Holder should expect to treat all cash distributions as dividends for such purposes. The dividends will not be eligible for the dividends-received deduction allowed to corporations in respect of dividends received from other U.S. corporations. With respect to certain non-corporate U.S. Holders (including individuals), dividends may be taxed at the lower capital gains rate applicable to “qualified dividend income,” provided that (1) our common shares are readily tradable on an established securities market in the United States, (2) the Company is neither a PFIC (as defined below) nor treated as such with respect to the U.S. Holder for the taxable year in which the dividend is paid and the preceding taxable year and (3) certain holding period requirements are met. Under U.S. Internal Revenue Service authority, common or ordinary shares generally are considered, for purposes of clause (1) above to be readily tradable on an established securities market in the United States if they are listed on the NYSE, as our common shares are.
The dividends will generally be foreign source and considered “passive category” income, and non-U.S. taxes withheld therefrom, if any, may be creditable against the U.S. Holder’s U.S. federal income tax liability, subject to applicable limitations. If the Company is a “United States-owned foreign corporation,” however, a portion of
167
Table of Contents
the dividends allocable to the Company’s U.S. source earnings and profits may be re-characterized as U.S. source. A “United States-owned foreign corporation” is any foreign corporation in which U.S. persons own, directly or indirectly, 50% or more (by vote or by value) of the stock. In general, United States-owned foreign corporations with less than 10% of earnings and profits attributable to sources within the United States are excepted from these rules. The rules governing the treatment of foreign taxes and foreign tax credits are complex, and U.S. Holders should consult their tax advisors about the impact of these rules in their particular situations.
Sale or Other Disposition of Common Shares
Subject to the passive foreign investment company rules discussed below, upon a sale or other disposition of our common shares, a U.S. Holder will recognize a capital gain or loss for U.S. federal income tax purposes in an amount equal to the difference between the amount realized and the U.S. Holder’s tax basis in such common shares. Any such gain or loss generally will be U.S. source gain or loss and will be treated as long-term capital gain or loss if the U.S. Holder’s holding period in our common shares exceeds one year. Non-corporate U.S. Holders (including individuals) generally will be subject to U.S. federal income tax on long-term capital gain at preferential rates. The deductibility of capital losses is subject to significant limitations.
Passive Foreign Investment Company
We would be classified as a passive foreign investment company (a “PFIC”), for any taxable year if either: (a) at least 75% of our gross income is “passive income” for purposes of the PFIC rules or (b) at least 50% of the value of our assets (determined on the basis of a quarterly average) produce or are held for the production of passive income. For this purpose, we will be treated as owning our proportionate share of the assets and earning our proportionate share of the income of any other corporation in which we own, directly or indirectly, 25% or more (by value) of the stock. Under the PFIC rules, if we were considered a PFIC at any time that a U.S. Holder holds our common shares, we would continue to be treated as a PFIC with respect to such holder’s investment unless (i) we cease to be a PFIC and (ii) the U.S. Holder has made a “deemed sale” election under the PFIC rules.
Based on the anticipated market price of our common shares in this offering and expected price of our common shares following this offering, and the composition of our income and assets as well as current and expected operations, we do not expect to be treated as a PFIC for U.S. federal income tax purposes for the current taxable year or in the foreseeable future. This is a factual determination, however, that must be made annually after the close of each taxable year. Therefore, there can be no assurance that we will not be classified as a PFIC for the current taxable year or for any future taxable year.
If we are considered a PFIC at any time that a U.S. Holder holds our common shares, any gain recognized by the U.S. Holder on a sale or other disposition of our common shares, as well as the amount of any “excess distribution” (defined below) received by the U.S. Holder, would be allocated ratably over the U.S. Holder’s holding period for our common shares. The amounts allocated to the taxable year of the sale or other disposition (or the taxable year of receipt, in the case of an excess distribution) and to any year before we became a PFIC would be taxed as ordinary income. The amount allocated to each other taxable year would be subject to tax at the highest rate in effect for individuals or corporations, as appropriate, for that taxable year, and an interest charge would be imposed. For the purposes of these rules, an excess distribution is the amount by which any distribution received by a U.S. Holder on its ordinary shares exceeds 125% of the average of the annual distributions on our common shares received during the preceding three years or the U.S. Holder’s holding period, whichever is shorter. Certain elections may be available that would result in alternative treatments (such as mark-to-market treatment) of our common shares.
If we are treated as a PFIC with respect to a U.S. Holder for any taxable year, the U.S. Holder will be deemed to own shares in any of our subsidiaries that are also PFICs and generally be subject to the treatment described above with respect to any distribution on or disposition of such shares. An election for mark-to-market treatment, however, would likely not be available with respect to any such subsidiaries. If we are considered a PFIC, a U.S. Holder will also be subject to information reporting requirements on an annual basis. U.S. Holders should consult their own tax advisors about the potential application of the PFIC rules to an investment in our common shares.
168
Table of Contents
U.S. Information Reporting and Backup Withholding
Dividend payments with respect to our common shares and proceeds from the sale, exchange or redemption of our common shares may be subject to information reporting to the U.S. Internal Revenue Service and possible U.S. backup withholding. Backup withholding will not apply, however, to a U.S. Holder who furnishes a correct taxpayer identification number and makes any other required certification or who is otherwise exempt from backup withholding. U.S. Holders who are required to establish their exempt status may be required to provide such certification on U.S. Internal Revenue Service Form W-9. U.S. Holders should consult their tax advisors regarding the application of the U.S. information reporting and backup withholding rules.
Backup withholding is not an additional tax. Amounts withheld as backup withholding may be credited against a U.S. Holder’s U.S. federal income tax liability, and such holder may obtain a refund of any excess amounts withheld under the backup withholding rules by timely filing the appropriate claim for refund with the U.S. Internal Revenue Service and furnishing any required information.
Information With Respect to Foreign Financial Assets
Certain U.S. Holders who are individuals and certain entities may be required to report information relating to our common shares, subject to certain exceptions (including an exception for common shares held in accounts maintained by certain U.S. financial institutions). U.S. Holders should consult their tax advisors regarding their reporting obligations with respect to their ownership and disposition of our common shares.
FATCA
Provisions under Sections 1471 through 1474 of the Code and applicable Treasury Regulations commonly referred to as “FATCA” generally impose 30% withholding on certain “withholdable payments” and, in the future, may impose such withholding on “foreign passthru payments” made by a “foreign financial institution” (each as defined in the Code) that has entered into an agreement with the U.S. Internal Revenue Service to perform certain diligence and reporting obligations with respect to the foreign financial institution’s U.S.-owned accounts. The applicable Treasury Regulations treat an entity as a “financial institution” if it is a holding company formed in connection with or availed of by a private equity fund or other similar investment vehicle established with an investment strategy of investing, reinvesting, or trading in financial assets. The United States has entered into an IGA with Bermuda, which modifies the FATCA withholding regime described above, although the U.S. Internal Revenue Service and Bermuda tax authorities have not yet provided final guidance regarding compliance with the Bermuda IGA. It is not clear whether we would be treated as a financial institution subject to the diligence, reporting and withholding obligations under FATCA or the Bermuda IGA. Furthermore, it is not yet clear how the Bermuda IGA will address foreign passthru payments. Prospective investors should consult their tax advisors regarding the potential impact of FATCA, the Bermuda IGA and any non-U.S. legislation implementing FATCA, on their investment in our common shares.
169
Table of Contents
Citigroup Global Markets Inc., Goldman, Sachs & Co., Deutsche Bank Securities Inc. and J.P. Morgan Securities LLC are acting as representatives of each of the underwriters named below. Subject to the terms and conditions set forth in an underwriting agreement among us, the selling shareholders and the underwriters, the selling shareholders have agreed to sell to the underwriters, and each of the underwriters has agreed, severally and not jointly, to purchase from the selling shareholders, the number of our common shares set forth opposite its name below.
| Underwriter |
Number of Shares |
|||
| Citigroup Global Markets Inc. |
||||
| Goldman, Sachs & Co. |
||||
| Deutsche Bank Securities Inc. |
||||
| J.P. Morgan Securities LLC |
||||
| Merrill Lynch, Pierce, Fenner & Smith Incorporated |
||||
| Barclays Capital Inc. |
||||
| Jefferies LLC |
||||
| Morgan Stanley & Co. LLC |
||||
| UBS Securities LLC |
||||
| BB&T Capital Markets, a division of BB&T Securities, LLC |
||||
| Nomura Securities International, Inc. |
||||
| SMBC Nikko Securities America, Inc. |
||||
|
|
|
|||
| Total |
35,000,000 | |||
|
|
|
|||
Subject to the terms and conditions set forth in the underwriting agreement, the underwriters have agreed, severally and not jointly, to purchase all of the shares sold under the underwriting agreement if any of these shares are purchased. If an underwriter defaults, the underwriting agreement provides that the purchase commitments of the nondefaulting underwriters may be increased or the underwriting agreement may be terminated.
We and the selling shareholders have agreed to indemnify the several underwriters against certain liabilities, including liabilities under the Securities Act, or to contribute to payments the underwriters may be required to make in respect of those liabilities.
The underwriters are offering the shares, subject to prior sale, when, as and if issued to and accepted by them, subject to approval of legal matters by their counsel, including the validity of the shares, and other conditions contained in the underwriting agreement, such as the receipt by the underwriters of officers’ certificates and legal opinions. The underwriters reserve the right to withdraw, cancel or modify offers to the public and to reject orders in whole or in part.
The representatives have advised us and the selling shareholders that the underwriters propose initially to offer the shares to the public at the public offering price set forth on the cover page of this prospectus and to dealers at that price less a concession not in excess of $ per share. After the initial offering, the public offering price, concession or any other term of the offering may be changed. Sales of shares made outside of the United States may be made by affiliates of the underwriters.
170
Table of Contents
The following table shows the public offering price and underwriting discount that the selling shareholders are to pay to the underwriters in connection with this offering. The information assumes either no exercise or full exercise by the underwriters of their option to purchase additional shares.
| Paid by the Selling Shareholder | ||||||||
| No Exercise | Full Exercise | |||||||
| Per Share |
$ | $ | ||||||
| Total |
$ | $ | ||||||
The expenses of the offering, including expenses incurred by the selling shareholders but not including the underwriting discount, are estimated at $1,510,000, and are payable by us. We have agreed to reimburse the underwriters for certain expenses relating to clearing this offering with the Financial Industry Regulatory Authority, Inc. in an amount up to $20,000.
The underwriters have agreed to reimburse us for certain expenses incurred by us in connection with this offering upon closing of the offering.
The selling shareholders have granted an option to the underwriters to purchase up to 5,250,000 additional common shares at the public offering price, less the underwriting discount. The underwriters may exercise this option within 30 days of the date of this prospectus. If the underwriters exercise this option, each will be obligated, subject to conditions contained in the underwriting agreement, to purchase a number of additional common shares proportionate to that underwriter’s initial amount reflected in the above table.
We, our executive officers and directors and the selling shareholders have agreed, subject to certain exceptions, not to sell or transfer any common shares or securities convertible into, exchangeable for, exercisable for, or repayable with common shares, for 90 days after the date of this prospectus without first obtaining the written consent of the representatives of the underwriters. Specifically, we and these other persons have agreed, with certain limited exceptions, not to directly or indirectly:
| • | offer, pledge, sell or contract to sell any common shares; |
| • | sell any option or contract to purchase any common shares; |
| • | purchase any option or contract to sell any common shares; |
| • | grant any option, right or warrant for the sale of any common shares; |
| • | otherwise dispose of or transfer any common shares; |
| • | request or demand that we file a registration statement related to the common shares; or |
| • | enter into any swap or other agreement that transfers, in whole or in part, the economic consequence of ownership of any common shares whether any such swap or transaction is to be settled by delivery of shares or other securities, in cash or otherwise. |
This lock-up provision applies to common shares and to securities convertible into or exchangeable or exercisable for or repayable with common shares. It also applies to common shares owned now or acquired later by the person executing the agreement or for which the person executing the agreement later acquires the power of disposition. Requests for the consent of the representatives of the underwriters to the sale of shares by us, our executive officers or our directors or by Carlyle prior to the expiration of these lock-up agreements will be considered on a case-by-case basis by the representatives. When determining whether or not to grant their consent, the representatives may consider, among other factors, the reasons given by us or the relevant shareholder, as applicable, for requesting the consent, the number of shares for which the consent is being requested and market conditions at such time.
In the event that either (x) during the last 17 days of the lock-up period referred to above, we issue an earnings release or material news or a material event relating to us occurs or (y) prior to the expiration of the lock-up
171
Table of Contents
period, we announce that we will release earnings results or become aware that material news or a material event will occur during the 16-day period beginning on the last day of the lock-up period, we have agreed to extend the restrictions described above until the expiration of the 18-day period beginning on the issuance of the earnings release or the occurrence of the material news or material event.
Our common shares are listed on the NYSE under the symbol “AXTA”.
In connection with this offering, underwriters and selling group members may engage in passive market making transactions in the common shares on the NYSE in accordance with Rule 103 of Regulation M under the Exchange Act during a period before the commencement of offers or sales of common shares and extending through the completion of distribution. A passive market maker must display its bid at a price not in excess of the highest independent bid of that security. However, if all independent bids are lowered below the passive market maker’s bid, that bid must then be lowered when specified purchase limits are exceeded. Passive market making may cause the price of our common shares to be higher than the price that otherwise would exist in the open market in the absence of those transactions. The underwriters and dealers are not required to engage in passive market making and may end passive market making activities at any time.
Until the distribution of the shares is completed, SEC rules may limit underwriters and selling group members from bidding for and purchasing our common shares. However, the representatives may engage in transactions that stabilize the price of the common shares, such as bids or purchases to peg, fix or maintain that price.
In connection with the offering, the underwriters may purchase and sell our common shares in the open market. These transactions may include short sales, purchases on the open market to cover positions created by short sales and stabilizing transactions. Short sales involve the sale by the underwriters of a greater number of shares than they are required to purchase in the offering. “Covered” short sales are sales made in an amount not greater than the underwriters’ option to purchase additional shares described above. The underwriters may close out any covered short position by either exercising their option to purchase additional shares or purchasing shares in the open market. In determining the source of shares to close out the covered short position, the underwriters will consider, among other things, the price of shares available for purchase in the open market as compared to the price at which they may purchase shares through the option to purchase additional shares. “Naked” short sales are sales in excess of the option to purchase additional shares. The underwriters must close out any naked short position by purchasing shares in the open market. A naked short position is more likely to be created if the underwriters are concerned that there may be downward pressure on the price of our common shares in the open market after pricing that could adversely affect investors who purchase in the offering. Stabilizing transactions consist of various bids for or purchases of shares of common shares made by the underwriters in the open market prior to the completion of the offering.
The underwriters may also impose a penalty bid. This occurs when a particular underwriter repays to the underwriters a portion of the underwriting discount received by it because the representatives have repurchased shares sold by or for the account of such underwriter in stabilizing or short covering transactions.
Similar to other purchase transactions, the underwriters’ purchases to cover the syndicate short sales may have the effect of raising or maintaining the market price of our common shares or preventing or retarding a decline in the market price of our common shares. As a result, the price of our common shares may be higher than the price that might otherwise exist in the open market. The underwriters may conduct these transactions on the exchange on which our common shares will be listed, in the over-the-counter market or otherwise.
None of us, the selling shareholders or any of the underwriters make any representation or prediction as to the direction or magnitude of any effect that the transactions described above may have on the price of our common
172
Table of Contents
shares. In addition, none of us, the selling shareholders or any of the underwriters make any representation that the representatives will engage in these transactions or that these transactions, once commenced, will not be discontinued without notice.
In connection with the offering, certain of the underwriters or securities dealers may distribute prospectuses by electronic means, such as e-mail. In addition, the representatives may facilitate Internet distribution for this offering to certain of its Internet subscription customers. The representatives may allocate a limited number of common shares for sale to its online brokerage customers. An electronic prospectus is available on Internet web sites maintained by the representatives. Other than the prospectus in electronic format, the information on the web sites of the representatives is not part of this prospectus.
The underwriters and their respective affiliates are full service financial institutions engaged in various activities, which may include securities trading, commercial and investment banking, financial advisory, investment management, investment research, principal investment, hedging, financing and brokerage activities. Certain of the underwriters and their respective affiliates have, from time to time, performed, and may in the future perform, various financial advisory, investment banking, commercial banking and other services for us for which they received or will receive customary fees and expenses. Furthermore, certain of the underwriters and their respective affiliates may, from time to time, enter into arm’s-length transactions with us in the ordinary course of their business.
In the ordinary course of their various business activities, the underwriters and their respective affiliates may make or hold a broad array of investments and actively trade debt and equity securities (or related derivative securities) and financial instruments (including bank loans) for their own account and for the accounts of their customers, and such investment and securities activities may involve securities and/or instruments of ours or of the selling shareholders. The underwriters and their respective affiliates may also make investment recommendations and/or publish or express independent research views in respect of such securities or instruments and may at any time hold, or recommend to clients that they acquire, long and/or short positions in such securities and instruments.
Barclays Capital Inc., Citigroup Global Markets Inc., Deutsche Bank Securities Inc., Jefferies & Company, Inc., Morgan Stanley & Co. LLC, SMBC Nikko Capital Market Limited and UBS Securities LLC were initial purchasers in connection with our offering of the Senior Notes.
Affiliates of Barclays Capital Inc., Citigroup Global Markets Inc., Deutsche Bank Securities Inc., Goldman, Sachs & Co., Jefferies LLC, J.P. Morgan Securities LLC, Morgan Stanley & Co. LLC, SMBC Nikko Securities America, Inc. and UBS Securities LLC are lenders and/or agents under the Senior Secured Credit Facilities.
Other than in the United States, no action has been taken by us, the selling shareholders or the underwriters that would permit a public offering of the securities offered by this prospectus in any jurisdiction where action for that purpose is required. The securities offered by this prospectus may not be offered or sold, directly or indirectly, nor may this prospectus or any other offering material or advertisements in connection with the offer and sale of any such securities be distributed or published in any jurisdiction, except under circumstances that will result in compliance with the applicable rules and regulations of that jurisdiction. Persons into whose possession this prospectus comes are advised to inform themselves about and to observe any restrictions relating to the offering and the distribution of this prospectus. This prospectus does not constitute an offer to sell or a solicitation of an offer to buy any securities offered by this prospectus in any jurisdiction in which such an offer or a solicitation is unlawful.
173
Table of Contents
Notice to Prospective Investors in the European Economic Area
In relation to each Member State of the European Economic Area that has implemented the Prospectus Directive (each, a “Relevant Member State”), no offer of shares may be made to the public in that Relevant Member State other than:
A. to any legal entity which is a qualified investor as defined in the Prospectus Directive;
B. to fewer than 100 or, if the Relevant Member State has implemented the relevant provision of the 2010 PD Amending Directive, 150, natural or legal persons (other than qualified investors as defined in the Prospectus Directive), as permitted under the Prospectus Directive, subject to obtaining the prior consent of the representatives; or
C. in any other circumstances falling within Article 3(2) of the Prospectus Directive,
provided that no such offer of shares shall require us or the representatives to publish a prospectus pursuant to Article 3 of the Prospectus Directive or supplement a prospectus pursuant to Article 16 of the Prospectus Directive.
Each person in a Relevant Member State who initially acquires any shares or to whom any offer is made will be deemed to have represented, acknowledged and agreed that it is a “qualified investor” within the meaning of the law in that Relevant Member State implementing Article 2(1)(e) of the Prospectus Directive. In the case of any shares being offered to a financial intermediary as that term is used in Article 3(2) of the Prospectus Directive, each such financial intermediary will be deemed to have represented, acknowledged and agreed that the shares acquired by it in the offer have not been acquired on a non-discretionary basis on behalf of, nor have they been acquired with a view to their offer or resale to, persons in circumstances which may give rise to an offer of any shares to the public other than their offer or resale in a Relevant Member State to qualified investors as so defined or in circumstances in which the prior consent of the representatives has been obtained to each such proposed offer or resale.
We, the representatives and their affiliates will rely upon the truth and accuracy of the foregoing representations, acknowledgements and agreements.
This prospectus has been prepared on the basis that any offer of shares in any Relevant Member State will be made pursuant to an exemption under the Prospectus Directive from the requirement to publish a prospectus for offers of shares. Accordingly any person making or intending to make an offer in that Relevant Member State of shares which are the subject of the offering contemplated in this prospectus may only do so in circumstances in which no obligation arises for us or any of the underwriters to publish a prospectus pursuant to Article 3 of the Prospectus Directive in relation to such offer. Neither we nor the underwriters have authorized, nor do they authorize, the making of any offer of shares in circumstances in which an obligation arises for us or the underwriters to publish a prospectus for such offer.
For the purpose of the above provisions, the expression “an offer to the public” in relation to any shares in any Relevant Member State means the communication in any form and by any means of sufficient information on the terms of the offer and the shares to be offered so as to enable an investor to decide to purchase or subscribe the shares, as the same may be varied in the Relevant Member State by any measure implementing the Prospectus Directive in the Relevant Member State and the expression “Prospectus Directive” means Directive 2003/71/EC (including the 2010 PD Amending Directive, to the extent implemented in the Relevant Member States) and includes any relevant implementing measure in the Relevant Member State and the expression “2010 PD Amending Directive” means Directive 2010/73/EU.
Notice to Prospective Investors in the United Kingdom
In addition, in the United Kingdom, this document is being distributed only to, and is directed only at, and any offer subsequently made may only be directed at persons who are “qualified investors” (as defined in the
174
Table of Contents
Prospectus Directive) (i) who have professional experience in matters relating to investments falling within Article 19 (5) of the Financial Services and Markets Act 2000 (Financial Promotion) Order 2005, as amended (the “Order”) and/or (ii) who are high net worth companies (or persons to whom it may otherwise be lawfully communicated) falling within Article 49(2)(a) to (d) of the Order (all such persons together being referred to as “relevant persons”). This document must not be acted on or relied on in the United Kingdom by persons who are not relevant persons. In the United Kingdom, any investment or investment activity to which this document relates is only available to, and will be engaged in with, relevant persons.
Notice to Prospective Investors in Switzerland
The shares may not be publicly offered in Switzerland and will not be listed on the SIX Swiss Exchange (“SIX”) or on any other stock exchange or regulated trading facility in Switzerland. This document has been prepared without regard to the disclosure standards for issuance prospectuses under art. 652a or art. 1156 of the Swiss Code of Obligations or the disclosure standards for listing prospectuses under art. 27 ff. of the SIX Listing Rules or the listing rules of any other stock exchange or regulated trading facility in Switzerland. Neither this document nor any other offering or marketing material relating to the shares or the offering may be publicly distributed or otherwise made publicly available in Switzerland.
Neither this document nor any other offering or marketing material relating to the offering, us, the shares have been or will be filed with or approved by any Swiss regulatory authority. In particular, this document will not be filed with, and the offer of shares will not be supervised by, the Swiss Financial Market Supervisory Authority FINMA (“FINMA”), and the offer of shares has not been and will not be authorized under the Swiss Federal Act on Collective Investment Schemes (“CISA”). The investor protection afforded to acquirers of interests in collective investment schemes under the CISA does not extend to acquirers of shares.
Notice to Prospective Investors in Hong Kong
This prospectus has not been approved by or registered with the Securities and Futures Commission of Hong Kong or the Registrar of Companies of Hong Kong. The shares may not be offered or sold in Hong Kong by means of any document other than (i) in circumstances which do not constitute an offer to the public within the meaning of the Companies Ordinance (Cap. 32, Laws of Hong Kong), or (ii) to “professional investors” as defined in the meaning of the Securities and Futures Ordinance (Cap. 571, Laws of Hong Kong) and any rules made thereunder, or (iii) in other circumstances which do not result in the document being a “prospectus” within the meaning of the Companies Ordinance (Cap. 32, Laws of Hong Kong) and no advertisement, invitation or document relating to the shares may be issued or may be in the possession of any person for the purpose of issue (in each case whether in Hong Kong or elsewhere), which is directed at, or the contents of which are likely to be accessed or read by, the public in Hong Kong (except if permitted to do so under the laws of Hong Kong) other than with respect to shares which are or are intended to be disposed of only to persons outside Hong Kong or only to “professional investors” within the meaning of the Securities and Futures Ordinance (Cap. 571, Laws of Hong Kong) and any rules made thereunder.
Notice to Prospective Investors in Singapore
This prospectus has not been registered as a prospectus with the Monetary Authority of Singapore. Accordingly, this prospectus and any other document or material in connection with the offer or sale, or invitation for subscription or purchase, of the shares may not be circulated or distributed, nor may the shares be offered or sold, or be made the subject of an invitation for subscription or purchase, whether directly or indirectly, to persons in Singapore other than (i) to an institutional investor under Section 274 of the Securities and Futures Act, Chapter 289 of Singapore (the “SFA”), (ii) to a relevant person pursuant to Section 275(1), or any person pursuant to Section 275(1A), and in accordance with the conditions specified in Section 275 of the SFA or (iii) otherwise pursuant to, and in accordance with the conditions of, any other applicable provision of the SFA, in each case subject to compliance with conditions set forth in the SFA.
175
Table of Contents
Where the shares are subscribed or purchased under Section 275 of the SFA by a relevant person which is: (a) a corporation (which is not an accredited investor (as defined in Section 4A of the SFA)) the sole business of which is to hold investments and the entire share capital of which is owned by one or more individuals, each of whom is an accredited investor; or (b) a trust (where the trustee is not an accredited investor) whose sole purpose is to hold investments and each beneficiary of the trust is an individual who is an accredited investor, shares, debentures and units of shares and debentures of that corporation or the beneficiaries’ rights and interest (howsoever described) in that trust shall not be transferred within six months after that corporation or that trust has acquired the shares pursuant to an offer made under Section 275 of the SFA except: (i) to an institutional investor (for corporations, under Section 274 of the SFA) or to a relevant person defined in Section 275(2) of the SFA, or to any person pursuant to an offer that is made on terms that such shares, debentures and units of shares and debentures of that corporation or such rights and interest in that trust are acquired at a consideration of not less than S$200,000 (or its equivalent in a foreign currency) for each transaction, whether such amount is to be paid for in cash or by exchange of securities or other assets, and further for corporations, in accordance with the conditions specified in Section 275 of the SFA; (ii) where no consideration is or will be given for the transfer; or (iii) where the transfer is by operation of law.
176
Table of Contents
The validity of the common shares and certain other matters of Bermuda law will be passed upon for us by Conyers Dill & Pearman Pte. Ltd., our special Bermuda counsel. Certain matters of U.S. federal and New York State law will be passed upon for us by Latham & Watkins LLP, Washington, District of Columbia. The underwriters in this offering were represented by Cravath, Swaine & Moore LLP, New York, New York.
The consolidated financial statements of Axalta Coating Systems Ltd. as of December 31, 2014 and 2013 and for the years ended December 31, 2014 and 2013 and for the period August 24, 2012 to December 31, 2012, and the combined financial statements of the Predecessor, DuPont Performance Coatings, a business formerly owned by E. I. du Pont de Nemours and Company for the period January 1, 2013 to January 31, 2013 and for the year ended December 31, 2012, included in this Prospectus have been so included in reliance on the reports of PricewaterhouseCoopers LLP, an independent registered public accounting firm, given on the authority of said firm as experts in auditing and accounting.
WHERE YOU CAN FIND MORE INFORMATION
We have filed with the SEC a registration statement on Form S-1 pursuant to the Securities Act. This prospectus, which constitutes part of the registration statement, does not contain all the information set forth in the registration statement. For further information, we refer you to the registration statement and the exhibits and schedules filed as a part of the registration statement. Statements contained in this prospectus as to the contents of any contract or other document filed as an exhibit to the registration statement are not necessarily complete. If a contract or document has been filed as an exhibit to the registration statement, we refer you to the copy of the contract or document that has been filed.
You may inspect a copy of the registration statement and the exhibits and schedules to the registration statement without charge at the Public Reference Room of the SEC at 100 F Street, NE, Washington, DC 20549. You may obtain information on the operation of the Public Reference Room by calling the SEC at 1-800-SEC-0330. You can receive copies of these documents upon payment of a duplicating fee by writing to the SEC. The SEC maintains a web site at www.sec.gov that contains reports, proxy and information statements and other information regarding registrants that file electronically with the SEC. You can also inspect our registration statement on this web site.
We are subject to the reporting requirements of the Exchange Act. These periodic reports and other information are available for inspection and copying at the public reference room and website of the SEC referred to above. You may access our reports and amendments to those reports filed or furnished pursuant to Section 13 (a) or 15 (d) of the Exchange Act with the SEC free of charge on the SEC’s website at www.sec.gov and on our website at www.axaltacs.com as soon as reasonably practicable after such information is electronically filed with, or furnished to, the SEC. Our website and the information contained therein or connected thereto and our filings with the SEC (other than those exhibits specifically incorporated by reference into the registration statement of which this prospectus forms a part) are not a part of this prospectus or the registration statement of which it forms a part.
You may obtain a copy of any of our filings, at no cost, by writing or telephoning us at:
Axalta Coating Systems Ltd.
Two Commerce Square
2001 Market Street, Suite 3600
Philadelphia, Pennsylvania 19103
(855) 547-1461
177
Table of Contents
We are a Bermuda exempted company. As a result, the rights of holders of our common shares are governed by Bermuda law and our memorandum of association and bye-laws. The rights of shareholders under Bermuda law may differ from the rights of shareholders of companies incorporated in other jurisdictions. A number of our directors and some of the named experts referred to in this prospectus are not residents of the United States, and a substantial portion of our assets are located outside the United States. As a result, it may be difficult for investors to effect service of process on those persons in the United States or to enforce in the United States judgments obtained in U.S. courts against us or those persons based on the civil liability provisions of the U.S. securities laws. It is doubtful whether courts in Bermuda will enforce judgments obtained in other jurisdictions, including the United States, against us or our directors or officers under the securities laws of those jurisdictions or entertain actions in Bermuda against us or our directors or officers under the securities laws of other jurisdictions. Our registered address in Bermuda is Clarendon House, 2 Church Street, Hamilton HM 11, Bermuda.
178
Table of Contents
INDEX TO CONSOLIDATED FINANCIAL STATEMENTS
| Page(s) | ||||
| Audited Consolidated Financial Statements: |
||||
| F-2 | ||||
| F-4 | ||||
| F-5 | ||||
| F-6 | ||||
| F-7 | ||||
| F-9 | ||||
| Notes to the Consolidated (Successor) and Combined (Predecessor) Audited Financial Statements |
F-10 | |||
| Schedule II - Valuation and Qualifying Accounts |
F-67 | |||
F-1
Table of Contents
Report of Independent Registered Public Accounting Firm
To the Board of Directors and Shareholders of Axalta Coating Systems Ltd.
In our opinion, the accompanying consolidated balance sheets and the related consolidated statements of operations, of comprehensive income (loss), of changes in shareholders’ equity and of cash flows present fairly, in all material respects, the financial position of Axalta Coating Systems Ltd. and its subsidiaries (Successor) at December 31, 2014 and 2013, and the results of their operations and their cash flows for the years ended December 31, 2014 and 2013 and for the period from August 24, 2012 to December 31, 2012 in conformity with accounting principles generally accepted in the United States of America. In addition, in our opinion, the accompanying financial statement schedule presents fairly, in all material respects, the information set forth therein when read in conjunction with the related consolidated financial statements. These financial statements and financial statement schedule are the responsibility of the Company’s management. Our responsibility is to express an opinion on these financial statements and financial statement schedule based on our audits. We conducted our audits in accordance with the standards of the Public Company Accounting Oversight Board (United States). Those standards require that we plan and perform the audit to obtain reasonable assurance about whether the financial statements are free of material misstatement. An audit includes examining, on a test basis, evidence supporting the amounts and disclosures in the financial statements, assessing the accounting principles used and significant estimates made by management, and evaluating the overall financial statement presentation. We believe that our audits provide a reasonable basis for our opinion.
/s/ PricewaterhouseCoopers LLP
Philadelphia, PA
March 13, 2015
F-2
Table of Contents
Report of Independent Registered Public Accounting Firm
To the Board of Directors and Shareholders of Axalta Coating Systems Ltd.
In our opinion, the accompanying combined statements of operations, of comprehensive income (loss), of changes in DuPont’s net investment in DuPont Performance Coatings and of cash flows present fairly, in all material respects, the results of operations and of cash flows of DuPont Performance Coatings (Predecessor), a business formerly owned by E. I. du Pont de Nemours and Company, for the period from January 1, 2013 through January 31, 2013, and for the year ended December 31, 2012 in conformity with accounting principles generally accepted in the United States of America. In addition, in our opinion, the accompanying financial statement schedule presents fairly, in all material respects, the information set forth therein when read in conjunction with the related consolidated financial statements. These financial statements and financial statement schedule are the responsibility of the Company’s management. Our responsibility is to express an opinion on these financial statements and financial statement schedule based on our audits. We conducted our audits in accordance with the standards of the Public Company Accounting Oversight Board (United States). Those standards require that we plan and perform the audit to obtain reasonable assurance about whether the financial statements are free of material misstatement. An audit includes examining, on a test basis, evidence supporting the amounts and disclosures in the financial statements, assessing the accounting principles used and significant estimates made by management, and evaluating the overall financial statement presentation. We believe that our audits provide a reasonable basis for our opinion.
/s/ PricewaterhouseCoopers LLP
Philadelphia, PA
March 31, 2014, except for Note 25 to the combined financial statements, as to which the date is August 20, 2014
F-3
Table of Contents
Consolidated (Successor) and DuPont Performance Coatings Combined (Predecessor)
Statements of Operations
(In millions, except per share data)
| Successor | Predecessor | |||||||||||||||||||||||
| Year Ended December 31, |
Period from August 24, 2012 through December 31, |
Period from January 1, 2013 through January 31, |
Year Ended December 31, |
|||||||||||||||||||||
| 2014 | 2013 | 2012 | 2013 | 2012 | ||||||||||||||||||||
| Net sales |
$ | 4,361.7 | $ | 3,951.1 | $ | — | $ | 326.2 | $ | 4,219.4 | ||||||||||||||
| Other revenue |
29.8 | 35.7 | — | 1.1 | 37.4 | |||||||||||||||||||
|
|
|
|
|
|
|
|
|
|
|
|||||||||||||||
| Total revenue |
4,391.5 | 3,986.8 | — | 327.3 | 4,256.8 | |||||||||||||||||||
| Cost of goods sold |
2,897.2 | 2,772.8 | — | 232.2 | 2,932.6 | |||||||||||||||||||
| Selling, general and administrative expenses |
991.5 | 1,040.6 | — | 70.8 | 873.4 | |||||||||||||||||||
| Research and development expenses |
49.5 | 40.5 | — | 3.7 | 41.5 | |||||||||||||||||||
| Amortization of acquired intangibles |
83.8 | 79.9 | — | — | — | |||||||||||||||||||
| Merger and acquisition related expenses |
— | 28.1 | 29.0 | — | — | |||||||||||||||||||
|
|
|
|
|
|
|
|
|
|
|
|||||||||||||||
| Income (loss) from operations |
369.5 | 24.9 | (29.0 | ) | 20.6 | 409.3 | ||||||||||||||||||
|
|
|
|
|
|
|
|
|
|
|
|||||||||||||||
| Interest expense, net |
217.7 | 215.1 | — | — | — | |||||||||||||||||||
| Bridge financing commitment fees |
— | 25.0 | — | — | — | |||||||||||||||||||
| Other expense, net |
115.0 | 48.5 | — | 5.0 | 16.3 | |||||||||||||||||||
|
|
|
|
|
|
|
|
|
|
|
|||||||||||||||
| Income (loss) before income taxes |
36.8 | (263.7 | ) | (29.0 | ) | 15.6 | 393.0 | |||||||||||||||||
| Provision (benefit) for income taxes |
2.1 | (44.8 | ) | — | 7.1 | 145.2 | ||||||||||||||||||
|
|
|
|
|
|
|
|
|
|
|
|||||||||||||||
| Net income (loss) |
34.7 | (218.9 | ) | (29.0 | ) | 8.5 | 247.8 | |||||||||||||||||
| Less: Net income attributable to noncontrolling interests |
7.3 | 6.0 | — | 0.6 | 4.5 | |||||||||||||||||||
|
|
|
|
|
|
|
|
|
|
|
|||||||||||||||
| Net income (loss) attributable to controlling interests |
$ | 27.4 | $ | (224.9 | ) | $ | (29.0 | ) | $ | 7.9 | $ | 243.3 | ||||||||||||
|
|
|
|
|
|
|
|
|
|
|
|||||||||||||||
| Basic net income (loss) per share |
$ | 0.12 | $ | (0.97 | ) | $ | — | |||||||||||||||||
| Diluted net income (loss) per share |
$ | 0.12 | $ | (0.97 | ) | $ | — | |||||||||||||||||
| Basic weighted average shares outstanding |
229.3 | 228.3 | — | |||||||||||||||||||||
| Diluted weighted average shares outstanding |
230.3 | 228.3 | — | |||||||||||||||||||||
The accompanying notes are an integral part of these financial statements.
F-4
Table of Contents
Consolidated (Successor) and DuPont Performance Coatings Combined (Predecessor)
Statements of Comprehensive Income (Loss)
(In millions)
| Successor | Predecessor | |||||||||||||||||||||||
| Year Ended December 31, |
Period from August 24, 2012 through December 31, |
Period from January 1, 2013 through January 31, |
Year Ended December 31, |
|||||||||||||||||||||
| 2014 | 2013 | 2012 | 2013 | 2012 | ||||||||||||||||||||
| Net income (loss) |
$ | 34.7 | $ | (218.9 | ) | $ | (29.0 | ) | $ | 8.5 | $ | 247.8 | ||||||||||||
| Other comprehensive income (loss), before tax: |
||||||||||||||||||||||||
| Foreign currency translation adjustments |
(101.1 | ) | 24.3 | — | — | — | ||||||||||||||||||
| Unrealized gain (loss) on securities |
0.7 | (0.9 | ) | — | 0.2 | 0.3 | ||||||||||||||||||
| Unrealized gain (loss) on derivatives |
(4.6 | ) | 5.0 | — | — | — | ||||||||||||||||||
| Unrealized gain (loss) on pension and other benefit plan obligations |
(55.6 | ) | 11.0 | — | 1.1 | (99.6 | ) | |||||||||||||||||
|
|
|
|
|
|
|
|
|
|
|
|||||||||||||||
| Other comprehensive income (loss), before tax |
(160.6 | ) | 39.4 | — | 1.3 | (99.3 | ) | |||||||||||||||||
|
|
|
|
|
|
|
|
|
|
|
|||||||||||||||
| Income tax benefit (provision) related to items of other comprehensive income |
18.6 | (5.4 | ) | — | (0.4 | ) | 34.7 | |||||||||||||||||
|
|
|
|
|
|
|
|
|
|
|
|||||||||||||||
| Other comprehensive income (loss), net of tax |
(142.0 | ) | 34.0 | — | 0.9 | (64.6 | ) | |||||||||||||||||
|
|
|
|
|
|
|
|
|
|
|
|||||||||||||||
| Comprehensive income (loss) |
(107.3 | ) | (184.9 | ) | (29.0 | ) | 9.4 | 183.2 | ||||||||||||||||
|
|
|
|
|
|
|
|
|
|
|
|||||||||||||||
| Less: Comprehensive income attributable to noncontrolling interests |
2.6 | 6.0 | — | 0.6 | 4.5 | |||||||||||||||||||
|
|
|
|
|
|
|
|
|
|
|
|||||||||||||||
| Comprehensive income (loss) attributable to controlling interests |
$ | (109.9 | ) | $ | (190.9 | ) | $ | (29.0 | ) | $ | 8.8 | $ | 178.7 | |||||||||||
|
|
|
|
|
|
|
|
|
|
|
|||||||||||||||
The accompanying notes are an integral part of these financial statements.
F-5
Table of Contents
Consolidated Balance Sheets
(In millions, except per share data)
| Successor | ||||||||
| December 31, | ||||||||
| 2014 | 2013 | |||||||
| Assets |
||||||||
| Current assets: |
||||||||
| Cash and cash equivalents |
$ | 382.1 | $ | 459.3 | ||||
| Restricted cash |
4.7 | — | ||||||
| Accounts and notes receivable, net |
820.4 | 865.9 | ||||||
| Inventories |
538.3 | 550.2 | ||||||
| Prepaid expenses and other |
62.9 | 50.2 | ||||||
| Deferred income taxes |
64.5 | 30.0 | ||||||
|
|
|
|
|
|||||
| Total current assets |
1,872.9 | 1,955.6 | ||||||
|
|
|
|
|
|||||
| Property, plant and equipment, net |
1,514.1 | 1,622.6 | ||||||
| Goodwill |
1,001.1 | 1,113.6 | ||||||
| Identifiable intangibles, net |
1,300.0 | 1,439.6 | ||||||
| Deferred financing costs, net |
91.0 | 110.6 | ||||||
| Other assets |
473.7 | 495.1 | ||||||
|
|
|
|
|
|||||
| Total assets |
$ | 6,252.8 | $ | 6,737.1 | ||||
|
|
|
|
|
|||||
| Liabilities, Shareholders’ Equity |
||||||||
| Current liabilities: |
||||||||
| Accounts payable |
$ | 494.5 | $ | 478.5 | ||||
| Current portion of borrowings |
40.1 | 46.7 | ||||||
| Deferred income taxes |
7.3 | 5.5 | ||||||
| Other accrued liabilities |
404.8 | 472.7 | ||||||
|
|
|
|
|
|||||
| Total current liabilities |
946.7 | 1,003.4 | ||||||
|
|
|
|
|
|||||
| Long-term borrowings |
3,656.3 | 3,874.2 | ||||||
| Accrued pensions and other long-term employee benefits |
306.4 | 313.2 | ||||||
| Deferred income taxes |
208.2 | 280.4 | ||||||
| Other liabilities |
23.2 | 54.1 | ||||||
|
|
|
|
|
|||||
| Total liabilities |
5,140.8 | 5,525.3 | ||||||
|
|
|
|
|
|||||
| Commitments and contingent liabilities (Note 9) |
||||||||
| Shareholders’ equity |
||||||||
| Common shares, $1.00 par, 1,000.0 shares authorized, 229.8 shares issued and outstanding at December 31, 2014; 1,000.0 shares authorized, 229.1 shares issued and outstanding at December 31, 2013 |
229.8 | 229.1 | ||||||
| Capital in excess of par |
1,144.7 | 1,133.7 | ||||||
| Accumulated deficit |
(226.5 | ) | (253.9 | ) | ||||
| Accumulated other comprehensive income (loss) |
(103.3 | ) | 34.0 | |||||
|
|
|
|
|
|||||
| Total Axalta shareholders’ equity |
1,044.7 | 1,142.9 | ||||||
| Noncontrolling interests |
67.3 | 68.9 | ||||||
|
|
|
|
|
|||||
| Total shareholders’ equity |
1,112.0 | 1,211.8 | ||||||
|
|
|
|
|
|||||
| Total liabilities and shareholders’ equity |
$ | 6,252.8 | $ | 6,737.1 | ||||
|
|
|
|
|
|||||
The accompanying notes are an integral part of these financial statements.
F-6
Table of Contents
Consolidated Statement of Changes in Shareholders’ Equity (Successor) and Combined Statement of Changes in DuPont’s Net Investment in DuPont Performance Coatings (Predecessor)
(In millions)
| DuPont’s Net Investment in DuPont Performance Coatings |
Accumulated Other Comprehensive Income (Loss) |
Noncontrolling Interests |
Total | |||||||||||||
| Predecessor |
||||||||||||||||
| Balance January 1, 2012 |
$ | 1,846.7 | $ | (76.3 | ) | $ | 34.8 | $ | 1,805.2 | |||||||
| Comprehensive income: |
||||||||||||||||
| Net income |
243.3 | — | 4.5 | 247.8 | ||||||||||||
| Net unrealized gain on securities, net of tax of $0.1 |
— | 0.2 | — | 0.2 | ||||||||||||
| Long-term employee benefit plans, net of tax of $34.8 |
— | (64.8 | ) | — | (64.8 | ) | ||||||||||
|
|
|
|
|
|
|
|
|
|||||||||
| Total comprehensive income (loss) |
243.3 | (64.6 | ) | 4.5 | 183.2 | |||||||||||
| Net transfers to DuPont |
(283.8 | ) | — | (3.9 | ) | (287.7 | ) | |||||||||
| Deconsolidation of joint venture |
(1.9 | ) | — | (1.8 | ) | (3.7 | ) | |||||||||
|
|
|
|
|
|
|
|
|
|||||||||
| Balance December 31, 2012 |
$ | 1,804.3 | $ | (140.9 | ) | $ | 33.6 | $ | 1,697.0 | |||||||
|
|
|
|
|
|
|
|
|
|||||||||
| Comprehensive income: |
||||||||||||||||
| Net income |
7.9 | — | 0.6 | 8.5 | ||||||||||||
| Net unrealized gain on securities, net of tax of $0.0 |
— | 0.2 | — | 0.2 | ||||||||||||
| Long-term employee benefit plans, net of tax of $0.4 |
— | 0.7 | — | 0.7 | ||||||||||||
|
|
|
|
|
|
|
|
|
|||||||||
| Total comprehensive income |
7.9 | 0.9 | 0.6 | 9.4 | ||||||||||||
| Net transfers from DuPont |
43.0 | — | — | 43.0 | ||||||||||||
| Dividends declared to noncontrolling interests |
— | — | (1.5 | ) | (1.5 | ) | ||||||||||
|
|
|
|
|
|
|
|
|
|||||||||
| Balance January 31, 2013 |
$ | 1,855.2 | $ | (140.0 | ) | $ | 32.7 | $ | 1,747.9 | |||||||
|
|
|
|
|
|
|
|
|
|||||||||
The accompanying notes are an integral part of these financial statements.
F-7
Table of Contents
AXALTA COATING SYSTEMS LTD.
Consolidated Statement of Changes in Shareholders’ Equity (Successor) and Combined Statement of Changes in DuPont’s Net Investment in DuPont Performance Coatings (Predecessor)
(In millions)
| Successor | ||||||||||||||||||||||||
| Common Shares |
Capital In Excess Of Par |
Accumulated Deficit |
Accumulated Other Comprehensive Income |
Noncontrolling Interests |
Total | |||||||||||||||||||
| Successor |
||||||||||||||||||||||||
| Balance August 24, 2012 |
$ | — | $ | — | $ | — | $ | — | $ | — | $ | — | ||||||||||||
| Comprehensive income (loss): |
||||||||||||||||||||||||
| Net income (loss) |
— | — | (29.0 | ) | — | — | (29.0 | ) | ||||||||||||||||
|
|
|
|
|
|
|
|
|
|
|
|
|
|||||||||||||
| Total comprehensive loss |
— | — | (29.0 | ) | — | — | (29.0 | ) | ||||||||||||||||
|
|
|
|
|
|
|
|
|
|
|
|
|
|||||||||||||
| Balance December 31, 2012 |
$ | — | $ | — | $ | (29.0 | ) | $ | — | $ | — | $ | (29.0 | ) | ||||||||||
|
|
|
|
|
|
|
|
|
|
|
|
|
|||||||||||||
| Comprehensive income (loss): |
||||||||||||||||||||||||
| Net income (loss) |
— | — | (224.9 | ) | — | 6.0 | (218.9 | ) | ||||||||||||||||
| Net unrealized loss on securities, net of tax of $0.0 |
— | — | — | (0.9 | ) | — | (0.9 | ) | ||||||||||||||||
| Net realized and unrealized gain on derivatives, net of tax of $1.9 |
— | — | — | 3.1 | — | 3.1 | ||||||||||||||||||
| Long-term employee benefit plans, net of tax of $3.5 |
— | — | — | 7.5 | — | 7.5 | ||||||||||||||||||
| Foreign currency translation |
— | — | — | 24.3 | — | 24.3 | ||||||||||||||||||
|
|
|
|
|
|
|
|
|
|
|
|
|
|||||||||||||
| Total comprehensive income (loss) |
— | — | (224.9 | ) | 34.0 | 6.0 | (184.9 | ) | ||||||||||||||||
| Equity contributions |
0.1 | 1,355.3 | — | — | — | 1,355.4 | ||||||||||||||||||
| Recognition of stock-based compensation |
— | 7.4 | — | — | — | 7.4 | ||||||||||||||||||
| Capitalization of capital in excess of par |
229.0 | (229.0 | ) | — | — | — | — | |||||||||||||||||
| Noncontrolling interests of acquired subsidiaries |
— | — | — | — | 66.7 | 66.7 | ||||||||||||||||||
| Dividends declared to noncontrolling interests |
— | — | — | — | (3.8 | ) | (3.8 | ) | ||||||||||||||||
|
|
|
|
|
|
|
|
|
|
|
|
|
|||||||||||||
| Balance December 31, 2013 |
$ | 229.1 | $ | 1,133.7 | $ | (253.9 | ) | $ | 34.0 | $ | 68.9 | $ | 1,211.8 | |||||||||||
|
|
|
|
|
|
|
|
|
|
|
|
|
|||||||||||||
| Comprehensive income (loss): |
||||||||||||||||||||||||
| Net income |
— | — | 27.4 | — | 7.3 | 34.7 | ||||||||||||||||||
| Net unrealized gain on securities, net of tax of $0.0 |
— | — | — | 0.7 | — | 0.7 | ||||||||||||||||||
| Net realized and unrealized loss on derivatives, net of tax of $1.7 |
— | — | — | (2.9 | ) | — | (2.9 | ) | ||||||||||||||||
| Long-term employee benefit plans, net of tax of $16.9 |
— | — | — | (38.7 | ) | — | (38.7 | ) | ||||||||||||||||
| Foreign currency translation |
— | — | — | (96.4 | ) | (4.7 | ) | (101.1 | ) | |||||||||||||||
|
|
|
|
|
|
|
|
|
|
|
|
|
|||||||||||||
| Total comprehensive income (loss) |
— | — | 27.4 | (137.3 | ) | 2.6 | (107.3 | ) | ||||||||||||||||
| Equity contributions |
0.3 | 2.2 | — | — | — | 2.5 | ||||||||||||||||||
| Recognition of stock-based compensation |
— | 8.0 | — | — | — | 8.0 | ||||||||||||||||||
| Exercises of stock options |
0.4 | 2.6 | — | — | — | 3.0 | ||||||||||||||||||
| Noncontrolling interests of acquired subsidiaries |
— | (1.8 | ) | — | — | (2.0 | ) | (3.8 | ) | |||||||||||||||
| Dividends declared to noncontrolling interests |
— | — | — | — | (2.2 | ) | (2.2 | ) | ||||||||||||||||
|
|
|
|
|
|
|
|
|
|
|
|
|
|||||||||||||
| Balance December 31, 2014 |
$ | 229.8 | $ | 1,144.7 | $ | (226.5 | ) | $ | (103.3 | ) | $ | 67.3 | $ | 1,112.0 | ||||||||||
|
|
|
|
|
|
|
|
|
|
|
|
|
|||||||||||||
The accompanying notes are an integral part of these financial statements.
F-8
Table of Contents
Consolidated (Successor) and DuPont Performance Coatings Combined (Predecessor) Statements of Cash Flows
(In millions)
| Successor | Predecessor | |||||||||||||||||||||||
| Year Ended December 31, |
Period from August 24, 2012 through December 31, |
Period from January 1, 2013 through January 31, |
Year Ended December 31, |
|||||||||||||||||||||
| 2014 | 2013 | 2012 | 2013 | 2012 | ||||||||||||||||||||
| Operating activities: |
||||||||||||||||||||||||
| Net income (loss) |
$ | 34.7 | $ | (218.9 | ) | $ | (29.0 | ) | $ | 8.5 | $ | 247.8 | ||||||||||||
| Adjustment to reconcile net income (loss) to cash provided by operating activities: |
||||||||||||||||||||||||
| Depreciation and amortization |
308.7 | 300.7 | — | 9.9 | 110.7 | |||||||||||||||||||
| Amortization of financing costs and original issue discount |
21.0 | 18.4 | — | — | — | |||||||||||||||||||
| Loss on extinguishment and modification of debt |
6.1 | — | — | — | — | |||||||||||||||||||
| Fair value step up of acquired inventory sold |
— | 103.7 | — | — | — | |||||||||||||||||||
| Bridge financing commitment fees |
— | 25.0 | — | — | — | |||||||||||||||||||
| Deferred income taxes |
(38.2 | ) | (120.8 | ) | — | 9.1 | 9.1 | |||||||||||||||||
| Realized and unrealized foreign exchange losses, net |
75.1 | 48.9 | — | 4.5 | — | |||||||||||||||||||
| Stock-based compensation |
8.0 | 7.4 | — | — | — | |||||||||||||||||||
| Other non-cash, net |
(25.3 | ) | 13.2 | — | (3.9 | ) | 7.6 | |||||||||||||||||
| Decrease (increase) in operating assets and liabilities: |
||||||||||||||||||||||||
| Trade accounts and notes receivable |
(40.2 | ) | (6.4 | ) | — | 25.8 | (58.9 | ) | ||||||||||||||||
| Inventories |
(24.7 | ) | 33.9 | — | (19.3 | ) | 5.7 | |||||||||||||||||
| Prepaid expenses and other assets |
(54.1 | ) | (90.9 | ) | — | 3.1 | 1.4 | |||||||||||||||||
| Accounts payable |
53.6 | 67.1 | — | (29.9 | ) | 54.9 | ||||||||||||||||||
| Other accrued liabilities |
(54.8 | ) | 193.1 | 29.0 | (43.8 | ) | 36.4 | |||||||||||||||||
| Other liabilities |
(18.5 | ) | 2.4 | — | (1.7 | ) | (25.9 | ) | ||||||||||||||||
|
|
|
|
|
|
|
|
|
|
|
|||||||||||||||
| Cash provided by (used for) operating activities |
251.4 | 376.8 | — | (37.7 | ) | 388.8 | ||||||||||||||||||
|
|
|
|
|
|
|
|
|
|
|
|||||||||||||||
| Investing activities: |
||||||||||||||||||||||||
| Acquisition of DuPont Performance Coatings (net of cash acquired) |
— | (4,827.6 | ) | — | — | — | ||||||||||||||||||
| Purchase of property, plant and equipment |
(188.4 | ) | (107.3 | ) | — | (2.4 | ) | (73.2 | ) | |||||||||||||||
| Investment in real estate property |
— | (54.5 | ) | — | — | — | ||||||||||||||||||
| Purchase of interest rate cap |
— | (3.1 | ) | — | — | — | ||||||||||||||||||
| Settlement of foreign currency contract |
— | (19.4 | ) | — | — | — | ||||||||||||||||||
| Restricted cash |
(4.7 | ) | — | — | — | — | ||||||||||||||||||
| Purchase of intangibles |
(0.2 | ) | — | — | (6.3 | ) | (21.6 | ) | ||||||||||||||||
| Purchase of investment in affiliate |
(6.5 | ) | — | — | (1.2 | ) | 0.1 | |||||||||||||||||
| Proceeds from sale of assets |
21.3 | 0.7 | — | 1.6 | 6.5 | |||||||||||||||||||
|
|
|
|
|
|
|
|
|
|
|
|||||||||||||||
| Cash used for investing activities |
(178.5 | ) | (5,011.2 | ) | — | (8.3 | ) | (88.2 | ) | |||||||||||||||
|
|
|
|
|
|
|
|
|
|
|
|||||||||||||||
| Financing activities: |
||||||||||||||||||||||||
| Proceeds from long-term borrowings |
0.7 | 3,906.7 | — | — | — | |||||||||||||||||||
| Proceeds from short-term borrowings |
30.7 | 38.8 | — | — | — | |||||||||||||||||||
| Payments on short-term borrowings |
(33.8 | ) | (25.3 | ) | — | — | (0.7 | ) | ||||||||||||||||
| Payments on long-term debt |
(121.1 | ) | (21.3 | ) | — | — | — | |||||||||||||||||
| Payments of deferred financing costs |
— | (126.0 | ) | — | — | — | ||||||||||||||||||
| Bridge financing commitment fees |
— | (25.0 | ) | — | — | — | ||||||||||||||||||
| Dividends paid to noncontrolling interests |
(2.2 | ) | (5.2 | ) | — | — | — | |||||||||||||||||
| Debt modification fees |
(3.0 | ) | — | — | — | — | ||||||||||||||||||
| Equity contribution |
2.5 | 1,355.4 | — | — | — | |||||||||||||||||||
| Cash received from exercises of stock options |
3.0 | — | — | — | — | |||||||||||||||||||
| Net transfer (to) from DuPont |
— | — | — | 43.0 | (289.9 | ) | ||||||||||||||||||
|
|
|
|
|
|
|
|
|
|
|
|||||||||||||||
| Cash provided by (used for) financing activities |
(123.2 | ) | 5,098.1 | — | 43.0 | (290.6 | ) | |||||||||||||||||
|
|
|
|
|
|
|
|
|
|
|
|||||||||||||||
| Increase (decrease) in cash and cash equivalents |
(50.3 | ) | 463.7 | — | (3.0 | ) | 10.0 | |||||||||||||||||
| Effect of exchange rate changes on cash |
(26.9 | ) | (4.4 | ) | — | — | (0.1 | ) | ||||||||||||||||
| Cash and cash equivalents at beginning of period |
459.3 | — | — | 28.7 | 18.8 | |||||||||||||||||||
|
|
|
|
|
|
|
|
|
|
|
|||||||||||||||
| Cash and cash equivalents at end of period |
$ | 382.1 | $ | 459.3 | $ | — | $ | 25.7 | $ | 28.7 | ||||||||||||||
|
|
|
|
|
|
|
|
|
|
|
|||||||||||||||
| Supplemental cash flow information |
||||||||||||||||||||||||
| Cash paid during the year for: |
||||||||||||||||||||||||
| Interest, net of amounts capitalized |
$ | 192.0 | $ | 171.9 | $ | — | $ | — | $ | — | ||||||||||||||
| Income taxes, net of refunds |
$ | 57.0 | $ | 83.1 | $ | — | $ | 13.3 | $ | 15.9 | ||||||||||||||
The accompanying notes are an integral part of these financial statements.
F-9
Table of Contents
Notes to Consolidated (Successor) and Combined (Predecessor)
Financial Statements
(In millions, unless otherwise noted)
| (1) | GENERAL AND DESCRIPTION OF THE BUSINESS |
Axalta Coating Systems Ltd. (“Axalta,” the “Company,” “we,” “our” and “us”), a Bermuda exempted company limited by shares formed at the direction of The Carlyle Group L.P. (“Carlyle”), was incorporated on August 24, 2012 for the purpose of consummating the acquisition of DuPont Performance Coatings (“DPC”), a business formerly owned by E. I. du Pont de Nemours and Company (“DuPont”), including certain assets of DPC and all of the capital stock and other equity interests of certain entities engaged in the DPC business (the “Acquisition”). Axalta, through its wholly-owned indirect subsidiaries, acquired DPC on February 1, 2013.
The Acquisition
Axalta is a holding company with no business operations or assets other than cash, cash equivalents, certain indemnity receivables from DuPont and 100% of the ownership interest of Axalta Coating Systems Dutch Co. Top Coöperatief U.A., which itself is a holding company with no operations or assets other than 100% of the capital stock of Axalta Coating Systems Dutch Holdings A B.V. (“Dutch A B.V.”), which itself is a holding company with no operations or assets other than 100% of the capital stock of Axalta Coating Systems Dutch Holdings B B.V. (“Dutch B B.V.”). Dutch B B.V., together with its indirect wholly-owned subsidiary, Axalta Coating Systems U.S. Holdings, Inc. (“Axalta US Holdings”), are co-borrowers under the Senior Secured Credit Facilities and co-issuers of the Senior Notes (each as defined below). Our global operations are conducted by indirect wholly-owned subsidiaries and indirect majority-owned subsidiaries.
The purchase price for the Acquisition was funded by (i) an equity contribution of $1,350.0 million into the Company by affiliates of Carlyle (the “Equity Contribution”), (ii) proceeds from borrowings under senior secured credit facilities (the “Senior Secured Credit Facilities”) consisting of a $2,300.0 million Dollar Term Loan facility and a €400.0 million Euro Term Loan facility both of which are due February 1, 2020 and (iii) proceeds from the issuance of $750.0 million aggregate principal amount of 7.375% senior unsecured notes due 2021 and the issuance of €250.0 million aggregate principal amount of 5.750% senior secured notes due 2021 (collectively the “Senior Notes”). The Senior Secured Credit Facilities and the Senior Notes are more fully described in Note 22.
Initial Public Offering
On November 14, 2014, the Company completed its initial public offering (“IPO”). In the IPO, certain of the Company’s shareholders sold an aggregate of 50,000,000 common shares at a public offering price of $19.50 per share. The underwriters also exercised their over-allotment option and purchased an additional 7,500,000 common shares. The Company did not receive any proceeds from the sale of common shares in the IPO.
The Business
Axalta is a leading global manufacturer, marketer and distributor of innovative high performance coatings products primarily serving the transportation industry. Products are offered in four key end-markets including the refinish automotive aftermarket, industrial, light vehicle or automotive original equipment manufacturers (“OEM”) market, and commercial vehicle market. These products include high performance liquid and powder coatings for motor vehicles OEMs, the motor vehicle aftermarket, and general industrial applications, such as coatings for heavy equipment, pipes, appliances and electrical insulation. Aftermarket coatings products are marketed using the Standox, Spies Hecker, Cromax and Nason brand names. Standox, Spies Hecker and Cromax are focused on the high-end motor vehicle aftermarkets, while Nason is primarily focused on economy coating applications.
F-10
Table of Contents
Notes to Consolidated (Successor) and Combined (Predecessor)
Financial Statements
(In millions, unless otherwise noted)
Axalta is globally operated with manufacturing facilities, sales centers, administrative offices and warehouses located throughout the world. Axalta’s operations are primarily located in the United States, Canada, Brazil, Mexico, Austria, Belgium, Germany, France, the United Kingdom and China.
| (2) | BASIS OF PRESENTATION OF THE CONSOLIDATED AND COMBINED FINANCIAL STATEMENTS |
The accompanying consolidated balance sheets of Axalta at December 31, 2014 and 2013 and the related consolidated statements of operations, consolidated statements of comprehensive income, consolidated statements of cash flows and of changes in shareholders’ equity for the years ended December 31, 2014 and 2013 and for the period from August 24, 2012 through December 31, 2012 are labeled as “Successor”. The Successor financial statements as of and for the years ended December 31, 2014 and 2013 were prepared reflecting acquisition accounting resulting from the Acquisition. The consolidated financial statements for the Successor include the accounts of Axalta and its subsidiaries, and entities in which a controlling interest is maintained.
The accompanying combined balance sheet of DPC as of December 31, 2012 and the related combined statements of operations and statements of comprehensive income for the period from January 1, 2013 through January 31, 2013 and for the year ended December 31, 2012 and consolidated statements of cash flows and of changes in parent company net investment for the period from January 1, 2013 through January 31, 2013 and for the year ended December 31, 2012 do not include adjustments or transactions attributable to the Acquisition, and are labeled as “Predecessor”. As a result of the application of acquisition accounting as of the closing date of the Acquisition, the financial statements for the Successor periods and the Predecessor periods are presented on a different basis and are, therefore, not comparable.
During the Predecessor periods, DPC operated either as a reportable segment or part of a reportable segment within DuPont; consequently, standalone financial statements were not historically prepared for DPC. The accompanying combined financial statements of DPC have been prepared from DuPont’s historical accounting records and are presented on a standalone basis as if the operations had been conducted independently from DuPont. In this context, prior to presale structuring activities occurring in the latter part of 2012, no direct ownership relationship existed among all of the various legal entities comprising DPC. Accordingly, DuPont and its subsidiaries’ net investment in these operations is shown in lieu of shareholders’ equity in the Predecessor combined financial statements. The Predecessor combined financial statements include the historical operations, assets and liabilities of the legal entities that are considered to comprise the DPC business.
DPC comprised certain standalone legal entities for which discrete financial information was available, as well as portions of legal entities for which discrete financial information was not available (shared entities). Discrete financial information was not available for DPC within shared entities as DuPont did not record every transaction at the DPC level, but rather at the DuPont corporate level. For shared entities for which discrete financial information was not available, allocation methodologies were applied to certain accounts to allocate amounts to DPC as discussed in Note 8.
The Predecessor combined statements of operations include all revenues and costs directly attributable to DPC, including costs for facilities, functions and services used by DPC. Costs for certain functions and services performed by centralized DuPont organizations were directly charged to DPC based on usage or other allocations methods. The results of operations also include allocations of (i) costs for administrative functions and services performed on behalf of DPC by centralized staff groups within DuPont, (ii) DuPont’s general corporate expenses, and (iii) certain pension and other postretirement benefit costs. As more fully described in Note 14 current and deferred income taxes and related tax expense were determined on the standalone results of the DPC operations in each country as if it were a separate taxpayer (i.e., following the separate return methodology).
F-11
Table of Contents
Notes to Consolidated (Successor) and Combined (Predecessor)
Financial Statements
(In millions, unless otherwise noted)
All charges and allocations of cost for facilities, functions and services performed by DuPont organizations were deemed paid by DPC to DuPont, in cash, in the period in which the costs were recorded in the Predecessor combined statement of operations. Allocations to DPC of current income taxes payable were deemed to have been remitted, in cash, to DuPont in the period the related tax expense was recorded. Allocations of current income taxes receivable were deemed to have been remitted to DPC, in cash, by DuPont in the period in which the receivable applies only to the extent that a refund of such taxes could have been recognized by DPC on a standalone basis under the law of the relevant taxing jurisdiction.
DuPont used a centralized approach to cash management and financing its operations. Accordingly, cash, cash equivalents, debt and interest expense were not allocated to DPC in the Predecessor combined financial statements. Transactions between DPC and DuPont were accounted for through the parent company net investment. DPC purchased materials and services from, and sold materials and services to, DuPont operations not included in the defined scope of DPC. Transactions between DuPont and DPC were deemed to be settled immediately through the parent company net investment. Cash, cash equivalents, debt and interest expense in the Predecessor combined balance sheet and statement of operations represent cash, cash equivalents, debt and interest expense held locally by certain of DPC’s majority owned joint ventures. DuPont’s current and long-term debt was not pushed down to the Predecessor combined financial statements because it was not specifically identifiable to DPC.
All of the allocations and estimates in the Predecessor combined financial statements were based on assumptions that management of DuPont and DPC believed were reasonable. However, the Predecessor combined financial statements included herein may not be indicative of the financial position, results of operations and cash flows of the Company in the future or if DPC had been a separate, standalone entity during the Predecessor periods presented.
Certain of our joint ventures are accounted for on a one-month lag basis, the effect of which is not material.
| (3) | SUMMARY OF SIGNIFICANT ACCOUNTING POLICIES |
The consolidated financial statements of Axalta and its subsidiaries and the combined financial statements of DPC have been prepared in accordance with accounting principles generally accepted in the United States of America (“GAAP”). In the opinion of management, all adjustments (consisting of normal recurring adjustments) considered necessary for a fair presentation of the financial statements have been included.
Use of Estimates
The preparation of financial statements in conformity with GAAP requires us to make estimates and assumptions that affect the reported amounts of assets and liabilities at the closing date of the Acquisition and the date of the financial statements and the reported amounts of sales and expenses during the period. The estimates and assumptions include, but are not limited to, receivable and inventory valuations, fixed asset valuations, valuations of goodwill and identifiable intangible assets, including analysis of impairment, valuations of long-term employee benefit obligations, income taxes, environmental matters, litigation, stock-based compensation, restructuring, and allocations of costs. Our estimates are based on historical experience, facts and circumstances available at the time and various other assumptions that are believed to be reasonable. Actual results could differ materially from those estimates.
Accounting for Business Combinations
We account for business combinations under the acquisition method of accounting. This method requires the recording of acquired assets, including separately identifiable intangible assets and assumed liabilities at their acquisition date fair values. The method records any excess purchase price over the fair value of acquired net assets as goodwill.
F-12
Table of Contents
Notes to Consolidated (Successor) and Combined (Predecessor)
Financial Statements
(In millions, unless otherwise noted)
The determination of the fair value of assets acquired, liabilities assumed, and noncontrolling interests involves assessments of factors such as the expected future cash flows associated with individual assets and liabilities and appropriate discount rates at the closing date of the Acquisition. When necessary, we consult with external advisors to help determine fair value. For non-observable market values, we determine fair value using acceptable valuation principles (e.g., multiple excess earnings, relief from royalty and cost methods).
We included the results of operations from the acquisition date in the financial statements for all businesses acquired.
Principles of Consolidation and Combination
The consolidated financial statements of the Successor (“the Successor statements”) include the accounts of Axalta and its subsidiaries, and entities in which a controlling interest is maintained. For those consolidated subsidiaries in which the Company’s ownership is less than 100%, the outside shareholders’ interests are shown as noncontrolling interests. Investments in companies in which Axalta, directly or indirectly, owns 20% to 50% of the voting stock and has the ability to exercise significant influence over operating and financial policies of the investee are accounted for using the equity method of accounting. As a result, Axalta’s share of the earnings or losses of such equity affiliates is included in the accompanying consolidated statement of operations and our share of these companies’ stockholders’ equity is included in the accompanying consolidated balance sheet.
The combined financial statements for the Predecessor (“the Predecessor statements”) include the combined assets, liabilities, revenues, and expenses of DPC.
We eliminated all intercompany accounts and transactions in the preparation of the accompanying consolidated and combined financial statements.
On September 4, 2012, the three partners of the DPC majority-owned DuPont Powder Coatings Saudi Company Ltd. (“DPC Saudi”), a non-US joint venture, signed a new shareholder resolution agreement requiring all partners to unanimously agree to all financial decisions and payments of the business. As a result, DPC concluded that consolidating DPC Saudi was no longer appropriate due to a lack of financial control in the operations of the business. Consequently, DPC deconsolidated the joint venture, and accounted for it under the equity method of accounting in the Predecessor statements. This joint venture investment in DPC Saudi was not an asset acquired from DuPont in the Acquisition. The deconsolidation of DPC Saudi resulted in a loss of $1.0 million for the year ended December 31, 2012, which was recorded in Selling, general and administrative expenses in the combined statement of operations.
Revenue Recognition
We recognize revenue after completing the earnings process. We recognize revenue for product sales when we ship products to the customer in accordance with the terms of the agreement, when there is persuasive evidence of the arrangement, title and risk of loss have been transferred, collectability is reasonably assured and pricing is fixed or determinable.
For a majority of our product sales, title transfers at the shipping point and delivery is considered complete. For certain OEM customers, revenue is recognized at the time the customer applies our coatings to its vehicles, as this represents the point in time that risk of loss has been transferred and delivery is considered complete.
We accrue for sales returns and other allowances based on our historical experience.
F-13
Table of Contents
Notes to Consolidated (Successor) and Combined (Predecessor)
Financial Statements
(In millions, unless otherwise noted)
We incur up-front costs in order to obtain contracts with certain customers. During the Successor periods, we capitalized these up-front costs as a component of Other assets. During the Predecessor periods, we capitalized costs as a component of Identifiable intangibles, net. We amortize the related amounts over the estimated life of the contract as a reduction of net sales.
We include the amounts billed to customers for shipping and handling fees in net sales and costs incurred for the delivery of goods as cost of goods sold in the statement of operations.
Recognition for licensing and royalty income occurs in accordance with agreed upon terms, when performance obligations are satisfied, the amount is fixed or determinable, and collectability is reasonably assured.
Other Revenue
Other revenue includes various elements of income resulting from the normal operation of our business. Other revenue includes, but is not limited to, income for services provided to customers and royalty income.
Cash and Cash Equivalents
Cash equivalents represent highly liquid investments with maturities of three months or less from time of purchase. They are carried at cost plus accrued interest, which approximates fair value because of the short-term maturity of these instruments. Cash balances may exceed government insured limits in certain jurisdictions.
Fair Value Measurements
GAAP defines a fair value hierarchy that prioritizes the inputs to valuation techniques used to measure fair value. The hierarchy gives the highest priority to unadjusted quoted prices in active markets for identical assets or liabilities (Level 1 measurements) and the lowest priority to unobservable inputs (Level 3 measurements). A financial instrument’s level within the fair value hierarchy is based on the lowest level of any input that is significant to the fair value measurement.
The following valuation techniques are used to measure fair value for assets and liabilities:
Level 1—Quoted market prices in active markets for identical assets or liabilities;
Level 2—Significant other observable inputs (e.g., quoted prices for similar items in active markets, quoted prices for identical or similar items in markets that are not active, inputs other than quoted prices that are observable such as interest rate and yield curves, and market-corroborated inputs); and
Level 3—Unobservable inputs for the asset or liability, which are valued based on management’s estimates of assumptions that market participants would use in pricing the asset or liability.
Derivatives and Hedging
The Company from time to time utilizes derivatives to manage exposures to currency exchange rates and interest rate risk. The fair values of all derivatives are recognized as assets or liabilities at the balance sheet date. Changes in the fair value of these instruments are reported in income or Accumulated other comprehensive income (“AOCI”), depending on the use of the derivative and whether it qualifies for hedge accounting treatment and is designated as such.
Gains and losses on derivatives that qualify and are designated as cash flow hedging instruments are recorded in AOCI, to the extent the hedges are effective, until the underlying transactions are recognized in income.
F-14
Table of Contents
Notes to Consolidated (Successor) and Combined (Predecessor)
Financial Statements
(In millions, unless otherwise noted)
Gains and losses on derivatives qualifying and designated as fair value hedging instruments, as well as the offsetting losses and gains on the hedged items, are reported in income in the same accounting period. Derivatives not designated as hedging instruments are marked-to-market at the end of each accounting period with the results included in income.
Cash flows from derivatives are recognized in the consolidated and combined statements of cash flows in a manner consistent with the underlying transactions.
Receivables and Allowance for Doubtful Accounts
Receivables are recognized net of an allowance for doubtful accounts receivable. The allowance for doubtful accounts receivable reflects the best estimate of losses inherent in the accounts receivable portfolio determined on the basis of historical experience, specific allowances for known troubled accounts and other available evidence. Accounts receivable are written down or off when a portion or all of such account receivable is determined to be uncollectible.
Inventories
Inventories of the Successor are valued at the lower of cost or market with cost being determined on the weighted average cost method. Elements of cost in inventories include:
| • | raw materials, |
| • | direct labor, and |
| • | manufacturing overhead |
Stores and supplies are valued at the lower of cost or market; cost is generally determined by the weighted average cost method. Inventories deemed to have costs greater than their respective market values are reduced to net realizable value with a loss recorded in income in the period recognized.
Inventories of the Predecessor were valued at the lower of cost or market with cost determined by the last-in, first-out (“LIFO”) method.
Property, Plant and Equipment
Successor periods
Property, plant and equipment of the Successor acquired in the Acquisition were recorded at fair value as of the acquisition date and are depreciated using the straight-line method. Subsequent additions to property, plant and equipment, including the fair value of any asset retirement obligations upon initial recognition of the liability, are recorded at cost and are depreciated using the straight-line method.
Software included in property, plant and equipment represents the costs of software developed or obtained for internal use. Software costs are amortized on a straight-line basis over their estimated useful lives. Upgrades and enhancements are capitalized if they result in added functionality, which enables the software to perform tasks it was previously incapable of performing. Software maintenance and training costs are expensed in the period in which they are incurred.
Property, plant and equipment acquired in the Acquisition are depreciated over their estimated remaining useful lives. The weighted average estimated remaining useful lives of property, plant and equipment acquired in connection with the Acquisition was approximately 11 years. Subsequent additions are either amortized or depreciated on a straight-line basis over a range of estimated useful lives. See Note 18 for a range of estimated useful lives used for each property, plant and equipment class.
F-15
Table of Contents
Notes to Consolidated (Successor) and Combined (Predecessor)
Financial Statements
(In millions, unless otherwise noted)
Predecessor periods
Property, plant and equipment of the Predecessor were carried at cost and were depreciated using the straight-line method. Property, plant and equipment placed in service prior to 1995 were depreciated using the sum-of-the-years’ digits method or other substantially similar methods. Substantially all Predecessor buildings and equipment were depreciated over useful lives ranging from 15 to 25 years.
Goodwill and Other Identifiable Intangible Assets
Goodwill represents the excess of purchase price over the fair values of underlying net assets acquired in an acquisition. Goodwill and indefinite-lived intangible assets are tested for impairment on an annual basis as of October 1; however, these tests are performed more frequently if events or changes in circumstances indicate that the asset may be impaired. The fair value methodology is based on prices of similar assets or other valuation methodologies including discounted cash flow techniques.
When testing goodwill and indefinite-lived intangible assets for impairment, we first have an option to assess qualitative factors to determine whether the existence of events or circumstances leads to a determination that it is more likely than not (more than 50%) that an impairment exists. Such qualitative factors may include the following: macroeconomic conditions; industry and market considerations; cost factors; overall financial performance; and other relevant entity-specific events. In the event the qualitative assessment indicates that an impairment is more likely than not, we would be required to perform a quantitative impairment test, otherwise no further analysis is required.
Under the quantitative goodwill impairment test, the evaluation of impairment involves comparing the current fair value of each reporting unit to its carrying value, including goodwill. If the carrying amount of a reporting unit, including goodwill, exceeds the estimated fair value, then individual assets (including identifiable intangible assets) and liabilities of the reporting unit are estimated at fair value. The excess of the estimated fair value of the reporting unit over the estimated fair value of its net assets would establish the implied value of goodwill. The excess of the recorded amount of goodwill over the implied value is then charged to earnings as an impairment loss.
Definite-lived intangible assets, such as technology, trademarks, customer relationships and non-compete agreements are amortized over their estimated useful lives, generally for periods ranging from four to 20 years. The reasonableness of the useful lives of these assets is regularly evaluated. Once these assets are fully amortized, they are removed from the balance sheet. We evaluate these assets for impairment whenever events or changes in circumstances indicate that the carrying amount of these assets might not be recoverable.
Impairment of Long-Lived Assets
The carrying value of long-lived assets to be held and used is evaluated when events or changes in circumstances indicate the carrying value may not be recoverable. The carrying value of a long-lived asset is considered impaired when the total projected undiscounted cash flows from the asset are less than its carrying value. In that event, a loss is recognized based on the amount by which the carrying value exceeds the fair value of the long-lived asset. The fair value methodology used is an estimate of fair market value and is based on prices of similar assets or other valuation methodologies including present value techniques. Long-lived assets to be disposed of other than by sale are classified as held for use until their disposal. Long-lived assets to be disposed of by sale are classified as held for sale and are reported at the lower of carrying amount or fair market value less cost to sell. Depreciation is discontinued for long-lived assets classified as held for sale.
F-16
Table of Contents
Notes to Consolidated (Successor) and Combined (Predecessor)
Financial Statements
(In millions, unless otherwise noted)
Research and Development
Research and development costs incurred in the normal course of business consist primarily of employee-related costs and are expensed as incurred. In process research and development projects acquired in a business combination are recorded as intangible assets at their fair value as of the acquisition date. Subsequent costs related to acquired in process research and development projects are expensed as incurred. Research and development intangible assets are considered indefinite-lived until the abandonment or completion of the associated research and development efforts. These indefinite-lived intangible assets are tested for impairment consistent with the impairment testing performed on other indefinite-lived intangible assets discussed above. Upon completion of the research and development process, the carrying value of acquired in process research and development projects is reclassified as a finite-lived asset and is amortized over its useful life.
Environmental Liabilities and Expenditures
Accruals for environmental matters are recorded when it is probable that a liability has been incurred and the amount of the liability can be reasonably estimated. Accrued environmental liabilities are not discounted. Claims for recovery from third parties, if any, are reflected separately as an asset. We record recoveries at the earlier of when the gain is probable or realized. For the periods ending December 31, 2014, 2013 and 2012, and January 1, 2013 through January 31, 2013, we have not recognized any assets or income associated with recoveries from third parties.
Costs related to environmental remediation are charged to expense in the period incurred. Other environmental costs are also charged to expense in the period incurred, unless they increase the value of the property or reduce or prevent contamination from future operations, in which case, they are capitalized and depreciated.
Litigation
We accrue for liabilities related to litigation matters when available information indicates that the liability is probable and the amount can be reasonably estimated. Legal costs such as outside counsel fees and expenses are charged to expense in the period incurred.
Income Taxes
Successor periods
Deferred tax assets and liabilities are recognized for the future tax consequences attributable to differences between the financial statement carrying amounts of assets and liabilities and their respective tax basis. Deferred tax assets are also recognized for operating losses and tax credit carry forwards. Valuation allowances are recorded to reduce deferred tax assets when it is more likely than not that a tax benefit will not be realized. Deferred tax assets and liabilities are measured using enacted tax rates applicable in the years in which they are expected to be recovered or settled. The effect on deferred tax assets and liabilities of a change in tax law is recognized in income in the period that includes the enactment date.
Where we do not intend to indefinitely reinvest earnings of our foreign subsidiaries, we provide for income taxes and foreign withholding taxes, where applicable, on undistributed earnings. We do not provide for income taxes on undistributed earnings of our foreign subsidiaries that are intended to be indefinitely reinvested.
F-17
Table of Contents
Notes to Consolidated (Successor) and Combined (Predecessor)
Financial Statements
(In millions, unless otherwise noted)
We recognize the benefit of an income tax position only if it is “more likely than not” that the tax position will be sustained. The tax benefits recognized are measured based on the largest benefit that has a greater than 50% likelihood of being realized. Additionally, we recognize interest and penalties accrued related to unrecognized tax benefits as a component of provision for income taxes. The current portion of unrecognized tax benefits is included in “Income taxes payable” and the long-term portion is included in the long-term income tax payable in the consolidated balance sheets.
Predecessor periods
For all Predecessor periods presented, although DPC was included in the consolidated income tax return of DuPont, DPC’s income taxes are computed and reported under the “separate return method.” Use of the separate return method may result in differences when the sum of the amounts allocated to standalone tax provisions are compared with amounts presented in combined financial statements. In that event, related deferred tax assets and liabilities could be significantly different from those presented herein for the Predecessor periods. Certain tax attributes, e.g., net operating loss carryforwards, which were reflected in the DuPont consolidated financial statements may or may not exist at the standalone DPC level.
Foreign Currency Translation
Successor periods
The reporting currency is the U.S. dollar. In most cases, our non-U.S. based subsidiaries use their local currency as the functional currency for their respective business operations. Assets and liabilities of these operations are translated into U.S. dollars at end-of-period exchange rates; income and expenses are translated using the average exchange rates for the reporting period. Resulting cumulative translation adjustments are recorded as a component of shareholders’ equity in the consolidated balance sheet in Accumulated other comprehensive income (loss).
Gains and losses from transactions denominated in currencies other than the functional currencies are included in the consolidated statement of operations in Other expense, net.
Predecessor periods
The reporting currency is the U.S. dollar. For the Predecessor period, DuPont management determined that the U.S. dollar was the functional currency of DPC’s legal entities and this functional currency was appropriate for the economic environment in which DPC operated during the period covered by the Predecessor combined financial statements. For these legal entities, foreign currency denominated asset and liability amounts were remeasured into U.S. dollars at the end-of-period exchange rates. Nonmonetary assets, such as inventories, prepaid expenses, fixed assets and intangible assets were remeasured into U.S. dollars at historical exchange rates. Foreign currency denominated income and expense elements were remeasured into U.S. dollars at average exchange rates in effect during the year, except for expenses related to nonmonetary assets, which were remeasured at historical exchange rates.
Employee Benefits
Successor periods
In connection with the Acquisition, we assumed certain defined benefit plan obligations and related plan assets for current employees of non-U.S. subsidiaries and certain defined benefit plan obligations and plan assets of former employees of subsidiaries. All defined pension plan obligations for current and former employees in the United States were retained by DuPont.
F-18
Table of Contents
Notes to Consolidated (Successor) and Combined (Predecessor)
Financial Statements
(In millions, unless otherwise noted)
Defined benefit plans specify an amount of pension benefit that an employee will receive upon retirement, usually dependent on factors such as age, years of service and compensation. The net obligation in respect of defined benefit plans is calculated separately for each plan by estimating the amount of the future benefits that employees have earned in return for their service in the current and prior periods. These benefits are then discounted to determine the present value of the obligations and are then adjusted for the impact of any unamortized prior service costs. As required by ASC 805, Business Combinations, all unamortized prior service costs and actuarial gains (losses) existing at the closing date of the Acquisition were eliminated in the determination of the fair value of the pension funded status at acquisition. The net obligation is then determined with reference to the fair value of the plan assets (if any). The discount rate used is the yield on bonds that are denominated in the currency in which the benefits will be paid and that have maturity dates approximating the terms of the obligations. The calculations are performed by qualified actuaries using the projected unit credit method.
Predecessor periods
Certain of DPC’s employees participated in defined benefit pension and other long-term employee benefit plans (the Plans) accounted for in accordance with ASC 715, Compensation—Retirement Benefits. Certain DPC employees were previously covered under DuPont and DuPont subsidiaries’ sponsored plans which were accounted for in accordance with accounting guidance in ASC 715. The majority of pension and other long-term employee expenses during the Predecessor periods were specifically identified by employee. In addition, a portion of expenses was allocated in shared entities and reported within costs of goods sold, selling, general and administrative and research and development expenses in the combined statements of operations. For the U.S. pension plan and other long-term employee benefit plans (the U.S. plans), DuPont considered DPC employees to be part of a multiemployer plan of DuPont. The expense related to the current and former employees of DPC is included in the Predecessor combined financial statements. Non-U.S. pensions and other long-term employee benefit plans (the non-U.S. plans) were accounted for as single employer plans where DPC recorded assets, liabilities and expenses related to the current DPC workforce.
Stock-Based Compensation
Successor periods
Our stock-based compensation for the Successor period, comprised of Axalta stock options, is measured at fair value on the grant date or date of modification, as applicable. We recognize compensation expense on a graded-vesting attribution basis over the requisite service period.
Predecessor periods
DuPont maintained certain stock compensation plans for the benefit of certain of its officers, directors and employees, including DPC’s employees in the Predecessor periods. DPC accounted for all share-based payments to employees, including grants of stock options, based upon their fair values.
For additional information on our stock-based compensation plan, see Note 11.
Earnings per Common Share
Basic earnings per common share is computed by dividing net income attributable to Axalta’s common shareholders by the weighted average number of shares outstanding during the period. Diluted earnings per common share is computed by dividing net income attributable to Axalta’s common shareholders by the
F-19
Table of Contents
Notes to Consolidated (Successor) and Combined (Predecessor)
Financial Statements
(In millions, unless otherwise noted)
weighted average number of shares outstanding during the period increased by the number of additional shares that would have been outstanding related to potentially dilutive securities; anti-dilutive securities are excluded from the calculation. These potentially dilutive securities are calculated under the treasury stock method and consist of stock options.
| (4) | RECENT ACCOUNTING GUIDANCE |
Recently Adopted Accounting Guidance
In April 2014, the Financial Accounting Standards Board (“FASB”) issued Accounting Standard Update (“ASU”) 2014-08, “Reporting Discontinued Operations and Disclosures of Disposals of Components of an Entity”, which amended the guidance for reporting discontinued operations and disposals of components of an entity. The amended guidance requires that a disposal representing a strategic shift that has (or will have) a major effect on an entity’s financial results or a business activity classified as held for sale should be reported as discontinued operations. The amendments also expand the disclosure requirements for discontinued operations and add new disclosures for individually significant dispositions that do not qualify as discontinued operations. The amendments are effective prospectively for fiscal years, and interim reporting periods within those years, beginning after December 15, 2014 and early adoption is permitted. We have adopted this guidance as of December 31, 2014.
In February 2013, the FASB issued ASU 2013-02, “Comprehensive Income (Topic 220): Reporting of Amounts Reclassified Out of Accumulated Other Comprehensive Income,” issuing changes to the reporting of amounts reclassified out of accumulated other comprehensive income. These changes require an entity to report the effect of significant reclassifications out of accumulated other comprehensive income on the respective line items in net income if the amount being reclassified is required to be reclassified in its entirety to net income. For other amounts that are not required to be reclassified in their entirety to net income in the same reporting period, an entity is required to cross-reference other disclosures that provide additional detail about those amounts. These requirements are to be applied to each component of accumulated other comprehensive income. This guidance is effective prospectively for annual reporting periods beginning on or after January 1, 2014, and the interim periods within those annual periods. We have included the additional disclosures requirements within Note 26.
Accounting Guidance Issued But Not Yet Adopted
In May 2014, the FASB issued ASU 2014-09 (Accounting Standard Codification 606), “Revenue from Contracts with Customers”, which sets forth the guidance that an entity should use related to revenue recognition. This ASU is effective for fiscal years beginning after December 15, 2016, and interim periods within those fiscal years. Early adoption is not permitted. We are in the process of assessing the impact the adoption of this ASU will have on our financial position, results of operations and cash flows.
| (5) | ACQUISITIONS AND DIVESTITURES |
Acquisition of DuPont Performance Coatings
On August 30, 2012, we entered into a purchase agreement with DuPont whereby, Axalta acquired from DuPont and its affiliates certain assets of DPC and all of the capital stock and other equity interests of certain entities engaged in the DPC business (the “Acquisition Agreement”) pursuant to which we acquired the assets and legal entities of DPC from DuPont for a purchase price of $4,925.9 million plus or minus a
F-20
Table of Contents
Notes to Consolidated (Successor) and Combined (Predecessor)
Financial Statements
(In millions, unless otherwise noted)
working capital adjustment and pension adjustment. Axalta and DuPont finalized the working capital and pension adjustments to the purchase price which resulted in a reduction to the purchase price of $18.6 million to $4,907.3 million.
We accounted for the Acquisition as a business combination in accordance with ASC 805, Business Combinations, using the acquisition method of accounting. At December 31, 2013, the amounts presented for the Acquisition were finalized.
The following table summarizes the fair values of the net assets acquired as of the February 1, 2013 Acquisition date adjusted for measurement period adjustments:
| February 1, 2013 (As Initially Reported) |
Measurement Period Adjustments |
February 1, 2013 (As Adjusted) |
||||||||||
| Cash and cash equivalents |
$ | 79.7 | $ | — | $ | 79.7 | ||||||
| Accounts and notes receivable—trade |
855.8 | 22.7 | 878.5 | |||||||||
| Inventories |
673.0 | 3.0 | 676.0 | |||||||||
| Prepaid expenses and other |
8.2 | (1.3 | ) | 6.9 | ||||||||
| Property, plant and equipment |
1,707.7 | (1.8 | ) | 1,705.9 | ||||||||
| Identifiable intangibles |
1,539.3 | (19.0 | ) | 1,520.3 | ||||||||
| Other assets—noncurrent |
98.8 | 19.1 | 117.9 | |||||||||
| Accounts payable |
(409.1 | ) | (6.9 | ) | (416.0 | ) | ||||||
| Other accrued liabilities |
(232.0 | ) | 7.5 | (224.5 | ) | |||||||
| Other liabilities |
(331.1 | ) | (35.3 | ) | (366.4 | ) | ||||||
| Deferred income taxes |
(312.9 | ) | 223.2 | (89.7 | ) | |||||||
| Noncontrolling interests |
(66.7 | ) | — | (66.7 | ) | |||||||
|
|
|
|
|
|
|
|||||||
| Net assets acquired before goodwill on acquisition |
3,610.7 | 211.2 | 3,821.9 | |||||||||
| Goodwill on acquisition |
1,315.2 | (229.8 | ) | 1,085.4 | ||||||||
|
|
|
|
|
|
|
|||||||
| Net assets acquired |
$ | 4,925.9 | $ | (18.6 | ) | $ | 4,907.3 | |||||
|
|
|
|
|
|
|
|||||||
The measurement period adjustments reflect new information obtained about facts and circumstances that existed at the closing date of the Acquisition, primarily related to indemnification assets, inventories, other miscellaneous current assets and liabilities, property, plant and equipment, intangible assets, and the related deferred income taxes. No measurement period adjustments had a material impact on the statement of operations or cash flows requiring retrospective application.
Goodwill was recognized for the Acquisition as the excess of the purchase price over the net identifiable assets recognized. The Goodwill is primarily attributed to our assembled workforce, corporate and operational synergies and the going concern value of the anticipated future economic benefits associated with DPC being operated as a standalone entity. The goodwill recognized at December 31, 2014 that is expected to be deductible for income tax purposes is $708.0 million.
The fair values of intangible assets were estimated using either the income approach, the excess earnings method (customer relationships) or the relief from royalty method (technology and trademarks). Under the excess earnings method, an intangible asset’s fair value is equal to the present value of the incremental after-tax cash flows attributable solely to the intangible asset over its remaining useful life. Under the relief from royalty method, fair value is measured by estimating future revenue associated with the intangible asset over its useful life and applying a royalty rate to the revenue estimate. These intangible assets enable us to develop new products to meet the evolving business needs as well as competitively produce our existing products.
F-21
Table of Contents
Notes to Consolidated (Successor) and Combined (Predecessor)
Financial Statements
(In millions, unless otherwise noted)
The fair value of real properties acquired was based on the consideration of their highest and best use in the market. The fair values of property, plant, and equipment, other than real properties, were based on the consideration that unless otherwise identified, they will continue to be used “as is” and as part of the ongoing business. In contemplation of the in-use premise and the nature of the assets, the fair value was developed primarily using a cost approach. The determination of the fair value of assets acquired and liabilities assumed involves assessing factors such as the expected future cash flows associated with individual assets and liabilities and appropriate discount rates at the date of the acquisition.
The fair value of the noncontrolling interests, related to acquired joint ventures, were estimated by applying an income approach. This fair value measurement is based on significant inputs that are not observable in the market and thus represents a fair value measurement categorized within Level 3 of the fair value hierarchy. Key assumptions included a discount rate, a terminal value based on a range of long-term sustainable growth rates and adjustments because of the lack of control that market participants would consider when measuring the fair value of the noncontrolling interests.
The Company was formed on August 24, 2012 for the purpose of consummating the Acquisition of DPC and, consequently has no financial statements as of and for periods prior to that date. Prior to the Acquisition, we generated no revenue and incurred no expenses other than merger and acquisition costs and debt financing costs in anticipation of the Acquisition. We incurred merger and acquisition related costs of $29.0 million which were expensed during the Successor period August 24, 2012 through December 31, 2012 and incurred debt financing costs of $4.6 million which were recorded as Other assets and Other accrued liabilities as of December 31, 2012 (Successor). The $33.6 million of merger and acquisition related costs and debt financing costs incurred were accrued as a component of Other accrued liabilities at December 31, 2012 (Successor). The amounts were paid at closing of the Acquisition with proceeds from the borrowings under the Senior Secured Credit Facilities.
The following unaudited supplemental pro forma information presents the financial results as if the acquisition of DPC had occurred at January 1, 2012. This supplemental pro forma information has been prepared for comparative purposes and does not purport to be indicative of what would have occurred had the acquisition been made at January 1, 2012, nor is it indicative of any future results.
| Year Ended December 31, | ||||||||
| (in millions, except per share data) |
2013 | 2012 | ||||||
| Net sales |
$ | 4,277.3 | $ | 4,219.4 | ||||
| Net loss |
$ | (87.1 | ) | $ | (270.1 | ) | ||
| Net loss attributable to controlling interests |
$ | (93.7 | ) | $ | (274.6 | ) | ||
| Earnings per share (Basic and Diluted) |
$ | (0.41 | ) | $ | — | |||
The 2013 supplemental pro forma net loss was adjusted to exclude $53.1 million ($43.5 million, net of pro forma income tax impact) of acquisition-related costs incurred in 2013 and $123.1 million ($88.6 million, net of pro forma income tax impact) of non-recurring expense consisting primarily of $103.7 million related to the fair market value adjustment to acquisition-date inventory. The 2012 supplemental pro forma net loss was adjusted to include these charges.
Dispositions
In September 2014, we completed the sale of a business within the Performance Coatings reportable segment, which primarily included technology that had been developed as an integrated software solution for the collision repair supply chain market.
F-22
Table of Contents
Notes to Consolidated (Successor) and Combined (Predecessor)
Financial Statements
(In millions, unless otherwise noted)
The sale resulted in the receipt of $17.5 million during the year ended December 31, 2014. As a result, we recognized a pre-tax gain on sale of $1.2 million ($0.7 million after tax) recorded within Other expense, net for the year ended December 31, 2014.
| (6) | GOODWILL AND IDENTIFIABLE INTANGIBLE ASSETS |
Goodwill
The following table shows changes in the carrying amount of goodwill for the Successor years ended December 31, 2014 and 2013 by reportable segment:
| Performance Coatings |
Transportation Coatings |
Total | ||||||||||
| At January 1, 2013 |
$ | — | $ | — | $ | — | ||||||
| Goodwill resulting from Acquisition |
1,012.5 | 72.9 | 1,085.4 | |||||||||
| Foreign currency translation |
26.3 | 1.9 | 28.2 | |||||||||
|
|
|
|
|
|
|
|||||||
| At December 31, 2013 |
$ | 1,038.8 | $ | 74.8 | $ | 1,113.6 | ||||||
| Purchase accounting adjustments |
5.7 | 0.4 | 6.1 | |||||||||
| Divestitures |
(4.7 | ) | — | (4.7 | ) | |||||||
| Foreign currency translation |
(106.2 | ) | (7.7 | ) | (113.9 | ) | ||||||
|
|
|
|
|
|
|
|||||||
| December 31, 2014 |
$ | 933.6 | $ | 67.5 | $ | 1,001.1 | ||||||
|
|
|
|
|
|
|
|||||||
During the Successor year ended December 31, 2014, we identified and recorded purchase accounting adjustments of $6.1 million related to corrections subsequent to the end of the purchase accounting measurement period.
The following table shows changes in the carrying amount of goodwill for the Predecessor year ended December 31, 2012 and the Predecessor period from January 1, 2013 to January 31, 2013 by reportable segment:
| Performance Coatings |
Transportation Coatings |
Total | ||||||||||
| At January 1, 2012 |
$ | 517.9 | $ | 70.9 | $ | 588.8 | ||||||
| Foreign currency translation |
— | — | — | |||||||||
|
|
|
|
|
|
|
|||||||
| December 31, 2012 |
$ | 517.9 | $ | 70.9 | $ | 588.8 | ||||||
| Foreign currency translation |
— | — | — | |||||||||
|
|
|
|
|
|
|
|||||||
| January 31, 2013 |
$ | 517.9 | $ | 70.9 | $ | 588.8 | ||||||
|
|
|
|
|
|
|
|||||||
Identifiable Intangible Assets
The following table summarizes the gross carrying amounts and accumulated amortization of identifiable intangible assets by major class:
| December 31, 2014 |
Gross Carrying Amount |
Accumulated Amortization |
Net Book Value |
Weighted average amortization periods (years) |
||||||||||||
| Technology |
$ | 411.8 | $ | (76.3 | ) | $ | 335.5 | 10.0 | ||||||||
| Trademarks—indefinite-lived |
284.4 | — | 284.4 | Indefinite | ||||||||||||
| Trademarks—definite-lived |
41.8 | (5.5 | ) | 36.3 | 14.8 | |||||||||||
| Customer relationships |
713.9 | (71.3 | ) | 642.6 | 19.4 | |||||||||||
| Non-compete agreements |
2.0 | (0.8 | ) | 1.2 | 4.6 | |||||||||||
|
|
|
|
|
|
|
|||||||||||
| Total |
$ | 1,453.9 | $ | (153.9 | ) | $ | 1,300.0 | |||||||||
|
|
|
|
|
|
|
|||||||||||
F-23
Table of Contents
Notes to Consolidated (Successor) and Combined (Predecessor)
Financial Statements
(In millions, unless otherwise noted)
| December 31, 2013 |
Gross Carrying Amount |
Accumulated Amortization |
Net Book Value |
Weighted average amortization periods (years) |
||||||||||||
| Technology |
$ | 425.2 | $ | (37.3 | ) | $ | 387.9 | 10.0 | ||||||||
| Trademarks—indefinite-lived |
284.4 | — | 284.4 | Indefinite | ||||||||||||
| Trademarks—definite-lived |
41.7 | (2.6 | ) | 39.1 | 14.8 | |||||||||||
| Customer relationships |
761.9 | (34.9 | ) | 727.0 | 19.4 | |||||||||||
| Non-compete agreements |
1.5 | (0.3 | ) | 1.2 | 4.0 | |||||||||||
|
|
|
|
|
|
|
|||||||||||
| Total |
$ | 1,514.7 | $ | (75.1 | ) | $ | 1,439.6 | |||||||||
|
|
|
|
|
|
|
|||||||||||
Activity related to in process research and development projects for the successor years ended December 31, 2013 and 2014:
| In Process Research and Development |
Activity | |||
| Balance at February 1, 2013 |
$ | 25.4 | ||
| Completed |
(6.5 | ) | ||
| Abandoned |
(3.2 | ) | ||
|
|
|
|||
| Balance at December 31, 2013 |
$ | 15.7 | ||
| Completed |
(10.4 | ) | ||
| Abandoned |
(0.1 | ) | ||
|
|
|
|||
| Balance at December 31, 2014 |
$ | 5.2 | ||
|
|
|
|||
In the Successor years ended December 31, 2014 and 2013, amortization expense for acquired intangibles was $83.8 million and $79.9 million, respectively. Amortization expense for the years ended December 31, 2014 and 2013 included losses of $0.1 million and $3.2 million, respectively, associated with abandoned acquired in process research and development projects, all of which was related to the Acquisition.
Amortization expense for the Predecessor period from January 1, 2013 through January 31, 2013 and the Predecessor year ended December 31, 2012 was $2.6 million and $25.7 million, respectively, which were primarily reported as a reduction in net sales.
The estimated amortization expense related to the fair value of acquired intangible assets for each of the succeeding five years is:
| 2015 |
$ | 81.6 | ||
| 2016 |
$ | 81.6 | ||
| 2017 |
$ | 81.1 | ||
| 2018 |
$ | 81.0 | ||
| 2019 |
$ | 81.0 |
| (7) | RESTRUCTURING |
Successor Periods
In accordance with the applicable guidance for Nonretirement Postemployment Benefits, we accounted for termination benefits and recognized liabilities when the loss was considered probable that employees were entitled to benefits and the amounts could be reasonably estimated.
Since the Acquisition date, we have incurred costs associated with involuntary termination benefits associated with corporate-related initiatives associated with our transition and cost-saving opportunities related to the separation from DuPont. During the Successor years ended December 31, 2014 and 2013 we
F-24
Table of Contents
Notes to Consolidated (Successor) and Combined (Predecessor)
Financial Statements
(In millions, unless otherwise noted)
incurred restructuring costs of $8.5 million and $120.7 million, respectively. These amounts are recorded within selling, general, and administrative expenses in the consolidated statements of operations. The payments associated with these actions are expected to be completed by December 2015.
The following tables summarize the activities related to the restructuring reserves, recorded within other accrued liabilities, and expenses for the Successor years ended December 31, 2013 and 2014:
| 2013 Activity | ||||
| Balance at February 1, 2013 (At acquisition date) |
$ | 0.5 | ||
| Expense recorded |
120.7 | |||
| Payments |
(23.7 | ) | ||
| Foreign currency translation |
0.9 | |||
|
|
|
|||
| Balance at December 31, 2013 |
$ | 98.4 | ||
|
|
|
|||
| 2014 Activity | ||||
| Balance at December 31, 2013 |
$ | 98.4 | ||
| Expense Recorded |
8.5 | |||
| Payments Made |
(51.6 | ) | ||
| Foreign Currency Changes |
(6.8 | ) | ||
|
|
|
|||
| Balance at December 31, 2014 |
$ | 48.5 | ||
|
|
|
|||
Predecessor Periods
There was no expense recorded during the Predecessor periods January 1, 2013 through January 31, 2013 associated with restructuring. At December 31, 2012 of the Predecessor period, total liabilities relating to restructuring activities were $2.1 million. For the Predecessor year ended December 31, 2012 there were reductions in expense resulting from changes in estimates of $0.3 million.
| (8) | RELATIONSHIP WITH DUPONT |
Predecessor Periods
Historically, the DPC businesses were managed and operated in the normal course of business with other affiliates of DuPont. Accordingly, certain shared costs were allocated to DPC and reflected as expenses in the standalone Predecessor combined financial statements. Management of DuPont considered the allocation methodologies used to be reasonable and appropriate reflections of the historical DuPont expenses attributable to DPC for purposes of the standalone combined financial statements of DPC; however, the expenses reflected in the Predecessor combined financial statements may not be indicative of the actual expenses that would have been incurred during the periods presented if DPC had operated as a separate, standalone entity. In addition, the expenses reflected in the Predecessor combined financial statements may not be indicative of related expenses that will be incurred in the future by us.
Cash Management and Financing
Except for its joint ventures, DPC participated in DuPont’s centralized cash management and financing programs. Disbursements were made through centralized accounts payable systems which were operated by DuPont, while cash receipts were transferred to centralized accounts maintained by DuPont. As cash was
F-25
Table of Contents
Notes to Consolidated (Successor) and Combined (Predecessor)
Financial Statements
(In millions, unless otherwise noted)
disbursed and received by DuPont, it was accounted for by DPC through the parent company net investment. All short and long-term debt requirements of the DPC business were financed by DuPont and financing decisions for wholly owned subsidiaries and majority owned joint ventures were determined by DuPont’s central treasury operations.
Allocated Corporate Costs
The Predecessor combined financial statements include significant transactions with DuPont involving leveraged functional services (such as information systems, accounting, other financial services, purchasing and legal) and general corporate expenses that were provided to DPC by centralized DuPont organizations. Throughout the Predecessor periods covered by the combined financial statements of DPC, the costs of these leveraged functions and services were directly charged or allocated to DPC using methods management believes were reasonable. The methods for directly charging specifically identifiable functions and services to DPC included negotiated usage rates and dedicated employee assignments. The method for allocating shared leveraged functional services to DPC was based on proportionate formulas involving controllable fixed costs and in certain instances was allocated to DPC based on demand. Controllable fixed costs are fixed costs less depreciation and amortization and nonrecurring transactions. The methods for allocating general corporate expenses to DPC were based on revenue. However, the expenses reflected in the Predecessor combined financial statements may not be indicative of the actual expenses that would have been incurred during the periods presented if DPC had operated as a separate, standalone entity.
The allocated leveraged functional service expenses and general corporate expenses included in cost of goods sold, selling, general, and administrative expenses and research and development expenses in the Predecessor combined statement of operations were as follows:
| Predecessor | ||||||||
| Period from January 1, 2013 through January 31, 2013 |
Year Ended December 31, 2012 |
|||||||
| Cost of goods sold |
$ | 14.2 | $ | 224.7 | ||||
| Selling, general, and administrative expenses |
1.4 | 21.6 | ||||||
| Research and development expenses |
0.1 | 2.2 | ||||||
|
|
|
|
|
|||||
| Total |
$ | 15.7 | $ | 248.5 | ||||
|
|
|
|
|
|||||
Allocated leveraged functional service expenses and general corporate expenses are recorded in the Predecessor combined statement of operations as follows:
| Predecessor | ||||||||
| Period from January 1, 2013 through January 31, 2013 |
Year Ended December 31, 2012 |
|||||||
| Leveraged functional services |
$ | 14.2 | $ | 226.4 | ||||
| General corporate expenses |
1.5 | 22.1 | ||||||
|
|
|
|
|
|||||
| Total |
$ | 15.7 | $ | 248.5 | ||||
|
|
|
|
|
|||||
F-26
Table of Contents
Notes to Consolidated (Successor) and Combined (Predecessor)
Financial Statements
(In millions, unless otherwise noted)
Shared Sites
DPC conducted manufacturing operations at 35 plant sites globally. DPC shared three of these plant sites with other non-DPC DuPont manufacturing operations. Additionally, DPC shared warehouse, sales centers, office space, and research and development facilities with other DuPont businesses. In general, the property, plant, and equipment primarily or exclusively used by DPC for these shared locations are included in the Predecessor combined balance sheet.
The full historical cost, accumulated depreciation and depreciation expense for assets at shared manufacturing plant sites and other facilities where DPC was the primary or exclusive user of the assets have been included in the Predecessor combined balance sheet and statement of operations. Accordingly, when the use of a DPC primary asset was shared with a non-DPC DuPont business (manufacturing or otherwise), the cost for the non-DPC usage was deemed to have been charged to the non-DPC business. The amounts credited to cost of goods sold in the Predecessor combined statement of operations for the use of a DPC primary asset by non-DPC businesses, were less than $0.3 million for the Predecessor period from January 1, 2013 through January 31, 2013 and $1.0 million for the Predecessor year ended December 31, 2012.
At shared manufacturing plant sites and other facilities where DPC was not the primary or exclusive user of the assets, the assets were excluded from the Predecessor combined balance sheet. Accordingly, where DPC used these shared assets, DPC was deemed to have been charged a cost for its usage of these shared assets by the other DuPont businesses. The amounts charged to the cost of goods sold in the Predecessor combined statement of operations for the DPC usage of the shared assets were less than $0.2 million for the Predecessor period from January 1, 2013 through January 31, 2013 and $0.4 million for the Predecessor year ended December 31, 2012.
Purchases from and Sales to Other DuPont Businesses
Throughout the Predecessor periods covered by the Predecessor combined financial statements, DPC purchased materials (Titanium Dioxide and DuPont Sontara® maintenance wipes) from DuPont and its non-DPC businesses.
Purchases include the following amounts:
| Predecessor | ||||||||
| Period from January 1, 2013 through January 31, 2013 |
Year Ended December 31, 2012 |
|||||||
| DPC purchases of products from other DuPont businesses |
$ | 7.9 | $ | 91.7 | ||||
There were no material sales to other DuPont businesses during the periods covered by the Predecessor combined financial statements.
| (9) | COMMITMENTS AND CONTINGENCIES |
Guarantees
In connection with the Acquisition, we assumed certain guarantee obligations which directly guarantee various debt obligations under agreements with third parties related to the following: equity affiliates, customers, suppliers and other affiliated companies.
F-27
Table of Contents
Notes to Consolidated (Successor) and Combined (Predecessor)
Financial Statements
(In millions, unless otherwise noted)
At December 31, 2014 and 2013, we had directly guaranteed $2.2 million and $1.6 million of such obligations, respectively. These guarantees represent the maximum potential amount of future (undiscounted) payments that we could be required to make under the guarantees in the event of default by the guaranteed parties. No amounts were accrued at December 31, 2014 and 2013.
Product Warranty
We warrant that our products meet standard specifications. Our product warranty liability at December 31, 2014 and 2013 was $0.5 million and $0.6 million, respectively. Estimates for warranty costs are based on historical claims experience.
Operating Lease Commitments
We use various leased facilities and equipment in our operations. The terms for these leased assets vary depending on the lease agreement. Net rental expense under operating leases were $61.6 million and $50.0 million for the Successor years ended December 31, 2014 and 2013, respectively. Net rental expense under operating leases was $4.6 million and $43.6 million for the Predecessor period from January 1, 2013 through January 31, 2013 and the Predecessor year ended December 31, 2012, respectively.
At December 31, 2014, future minimum payments under non-cancelable operating leases were as follows over each of the next five years and thereafter:
| Operating Leases |
||||
| 2015 |
$ | 50.6 | ||
| 2016 |
35.5 | |||
| 2017 |
27.6 | |||
| 2018 |
24.5 | |||
| 2019 |
22.7 | |||
| Thereafter |
47.7 | |||
|
|
|
|||
| Total minimum payments |
$ | 208.6 | ||
|
|
|
|||
Other
We are subject to various pending lawsuits and other claims including civil, regulatory, and environmental matters. Certain of these lawsuits and other claims may impact us. These litigation matters may involve indemnification obligations by third parties and/or insurance coverage covering all or part of any potential damage awards against DuPont and/or us. All of the above matters are subject to many uncertainties and, accordingly, we cannot determine the ultimate outcome of the lawsuits at this time.
The potential effects, if any, on the consolidated financial statements of Axalta will be recorded in the period in which these matters are probable and estimable, and such effects, could be material.
In addition to the aforementioned matters, we are party to various legal proceedings in the ordinary course of business. Although the ultimate resolution of these various proceedings cannot be determined at this time, management does not believe that such proceedings, individually or in the aggregate, will have a material adverse effect on the consolidated financial statements of Axalta.
F-28
Table of Contents
Notes to Consolidated (Successor) and Combined (Predecessor)
Financial Statements
(In millions, unless otherwise noted)
| (10) | LONG-TERM EMPLOYEE BENEFITS |
Defined Benefit Pension and Other Long-Term Employee Benefits Plans
Successor period
Defined Benefit Pensions
In connection with the Acquisition, we assumed certain defined benefit plan obligations for both current and former employees of our non-U.S. subsidiaries. All defined benefit pension plan obligations for current and former employees in the U.S. were retained by DuPont.
The defined benefit obligations for remaining current employees of non-U.S. subsidiaries assumed by Axalta were carved out of defined benefit pension plans retained by DuPont, where required. We have created new defined benefit pension plans for all effected participants. The Acquisition Agreement required DuPont to transfer assets generally in the form of cash, insurance contracts or marketable securities from DuPont’s funded defined benefit pension plans to our defined benefit pension plans within 180 days of the closing date of the Acquisition. The determination of asset transfers has been completed at December 31, 2014 for all plans except the plan covering our Canadian employees.
During the Predecessor period, DuPont had accounted for the benefit obligations of all the defined benefit plans as though the employees were participants in a multiemployer plan in the Predecessor period. For multiemployer plans, ASC 805, Business Combinations, requires an obligation to the plan for a portion of its unfunded benefit obligations to be established at the acquisition date when withdrawal from the multiemployer plan is probable. As withdrawal from the DuPont defined benefit pension plan and related transfer of plan assets was required pursuant to the Acquisition Agreement, an estimate of the unfunded benefit obligations was recorded as of the Acquisition date. The plan assets have been or will be directly transferred to the pension trust. Accordingly, assumed defined benefit obligations are presented net of the plan assets transferred, or to be transferred in the case of Canada, by DuPont.
Other Long-Term Employee Benefits
We also assumed in connection with the Acquisition certain long-term employee health care and life insurance benefits for certain eligible employees in Canada and Brazil. These programs require retiree contributions based on retiree-selected coverage levels for certain retirees.
Predecessor period
DuPont offered various long-term benefits to its employees. DuPont offered U.S. plans that were shared amongst its businesses. In these cases, the costs, assets, and liabilities of participating employees in these plans are reflected in the Predecessor combined financial statements as though DPC participated in a multiemployer plan. The total cost of the plan was determined by actuarial valuation and the business received an allocation of the cost of the plan based upon several factors, including a percentage of salaries, headcount and fixed costs.
For the non-U.S. plans, the Predecessor combined financial statements have been prepared as though the DPC employees who participated in the non-U.S. plans were considered separate plans. As such a portion of DuPont’s liabilities, assets and expenses are included in the Predecessor combined financial statements. Pension asset allocation for funded plans outside of the U.S. was based on either predominant local country calculation, or in other cases, by relative benefit obligation of the standalone DPC plan.
F-29
Table of Contents
Notes to Consolidated (Successor) and Combined (Predecessor)
Financial Statements
(In millions, unless otherwise noted)
Defined Benefit Pensions
DuPont had both funded and unfunded noncontributory defined benefit pension plans covering a majority of the U.S. employees hired before January 1, 2007, including U.S. employees of DPC. The benefits under these plans were based primarily on years of service and employees’ pay near retirement. DuPont’s funding policy was consistent with the funding requirements of federal laws and regulations.
Pension coverage for employees of DuPont’s non-U.S. subsidiaries was provided, to the extent deemed appropriate, through separate plans. Obligations under such plans were funded by depositing funds with trustees, covered by insurance contracts, or were unfunded.
Other Long-Term Employee Benefits
DuPont and its Canadian and Brazilian subsidiaries provided medical, dental and life insurance benefits to pensioners and survivors, and disability and life insurance protection to employees. The associated plans for retiree benefits were unfunded and the cost of the approved claims was paid from DuPont funds. Essentially all of the cost and liabilities for these retiree benefit plans were attributable to DuPont’s U.S. plans. The retiree medical plan was contributory with pensioners and survivors’ contributions adjusted annually to achieve a 50/50 target sharing of cost increases between DuPont and pensioners and survivors. In addition, limits were applied to DuPont’s portion of the retiree medical cost coverage. U.S. employees hired after December 31, 2006 were not eligible to participate in the postretirement medical, dental and life insurance plans.
Employee life insurance and disability benefit plans were insured in many countries. However, primarily in the U.S., such plans were generally self-insured or were fully experience rated. Expenses for self-insured and fully experience rated plans are reflected in the Predecessor combined financial statements.
Participation in the U.S. Plans
DPC participated in DuPont’s U.S. plans as though they were participants in a multiemployer plan with the other businesses of DuPont. The following table presents pension expense allocated by DuPont to DPC for DuPont’s significant plans in which DPC participated.
| Predecessor | ||||||||||||
| Plan Name |
EIN/ Pension Number |
January 1, 2013 through January 31, 2013 |
Year Ended December 31, 2012 |
|||||||||
| DuPont Pension and Retirement Plan |
51-0014090/001 | $ | 4.2 | $ | 40.6 | |||||||
| All Other Plans |
$ | 0.7 | $ | 16.7 | ||||||||
F-30
Table of Contents
Notes to Consolidated (Successor) and Combined (Predecessor)
Financial Statements
(In millions, unless otherwise noted)
Obligations and Funded Status
The measurement date used to determine defined benefit and other long-term employee benefit obligations was December 31. The following table sets forth the changes to the projected benefit obligations (“PBO”) and plan assets for the Successor year ended December 31, 2014 and 2013 and the funded status and amounts recognized in the accompanying consolidated balance sheets at December 31, 2014 and 2013 for the Company’s defined benefit pension and other long-term benefit plans:
| Defined Benefits | Other Long-Term Employee Benefits |
|||||||||||||||
| Successor | Successor | |||||||||||||||
| Year Ended December 31, | Year Ended December 31, | |||||||||||||||
| Obligations and Funded Status |
2014 | 2013 | 2014 | 2013 | ||||||||||||
| Change in benefit obligation: |
||||||||||||||||
| Projected benefit obligation at beginning of year |
$ | 603.0 | $ | — | $ | 4.6 | $ | — | ||||||||
| Fair value of assumed obligation at Acquisition date |
— | 579.5 | — | 5.2 | ||||||||||||
| Service cost |
15.4 | 17.0 | 0.1 | 0.2 | ||||||||||||
| Interest cost |
22.9 | 21.2 | 0.1 | 0.2 | ||||||||||||
| Participant contributions |
1.0 | 1.0 | — | — | ||||||||||||
| Actuarial losses (gains)—net |
85.8 | (5.8 | ) | 1.1 | (0.7 | ) | ||||||||||
| Plan curtailments and settlements |
(16.3 | ) | (1.4 | ) | — | — | ||||||||||
| Benefits paid |
(30.1 | ) | (20.7 | ) | — | — | ||||||||||
| Amendments |
(4.3 | ) | (0.4 | ) | (5.7 | ) | — | |||||||||
| Currency translation adjustment |
(64.3 | ) | 12.6 | (0.1 | ) | (0.3 | ) | |||||||||
|
|
|
|
|
|
|
|
|
|||||||||
| Projected benefit obligation at end of year |
613.1 | 603.0 | 0.1 | 4.6 | ||||||||||||
|
|
|
|
|
|
|
|
|
|||||||||
| Change in plan assets: |
||||||||||||||||
| Fair value of plan assets at beginning of year |
281.3 | — | — | — | ||||||||||||
| Fair value of plan assets at Acquisition date |
— | 250.7 | — | — | ||||||||||||
| Actual return on plan assets |
26.5 | 16.0 | — | — | ||||||||||||
| Employer contributions |
40.9 | 28.6 | — | — | ||||||||||||
| Participant contributions |
1.0 | 1.0 | — | — | ||||||||||||
| Benefits paid |
(30.1 | ) | (20.7 | ) | — | — | ||||||||||
| Settlements |
(2.7 | ) | (0.6 | ) | — | — | ||||||||||
| Currency translation adjustment |
(22.4 | ) | 6.3 | — | — | |||||||||||
|
|
|
|
|
|
|
|
|
|||||||||
| Fair value of plan assets at end of year |
294.5 | 281.3 | — | — | ||||||||||||
|
|
|
|
|
|
|
|
|
|||||||||
| Funded status, net |
$ | (318.6 | ) | $ | (321.7 | ) | $ | (0.1 | ) | $ | (4.6 | ) | ||||
|
|
|
|
|
|
|
|
|
|||||||||
| Amounts recognized in the consolidated balance sheets consist of: |
||||||||||||||||
| Other assets |
$ | 0.1 | $ | 0.2 | $ | — | $ | — | ||||||||
| Other accrued liabilities |
(12.4 | ) | (13.3 | ) | — | — | ||||||||||
| Accrued pension and other long-term employee benefits |
(306.3 | ) | (308.6 | ) | (0.1 | ) | (4.6 | ) | ||||||||
|
|
|
|
|
|
|
|
|
|||||||||
| Net amount recognized |
$ | (318.6 | ) | $ | (321.7 | ) | $ | (0.1 | ) | $ | (4.6 | ) | ||||
|
|
|
|
|
|
|
|
|
|||||||||
F-31
Table of Contents
Notes to Consolidated (Successor) and Combined (Predecessor)
Financial Statements
(In millions, unless otherwise noted)
The PBO is the actuarial present value of benefits attributable to employee service rendered to date, including the effects of estimated future pay increases. The accumulated benefit obligation (“ABO”) is the actuarial present value of benefits attributable to employee service rendered to date, but does not include the effects of estimated future pay increases.
The following table reflects the ABO for all defined benefit pension plans as of December 31, 2014 and 2013. Further, the table reflects the aggregate PBO, ABO and fair value of plan assets for pension plans with PBO in excess of plan assets and for pension plans with ABO in excess of plan assets.
| Successor | ||||||||
| Year Ended December 31, | ||||||||
| 2014 | 2013 | |||||||
| ABO |
$ | 559.4 | $ | 541.5 | ||||
| Plans with PBO in excess of plan assets: |
||||||||
| PBO |
$ | 606.2 | $ | 595.7 | ||||
| ABO |
$ | 553.2 | $ | 534.9 | ||||
| Fair value plan assets |
$ | 287.5 | $ | 273.8 | ||||
| Plans with ABO in excess of plan assets: |
||||||||
| PBO |
$ | 602.0 | $ | 537.8 | ||||
| ABO |
$ | 550.9 | $ | 488.9 | ||||
| Fair value plan assets |
$ | 285.1 | $ | 227.2 | ||||
The pretax amounts not yet reflected in net periodic benefit cost and included in Accumulated other comprehensive income (loss) include the following:
| Defined Benefits: | Successor | |||||||
| Year Ended December 31, | ||||||||
| 2014 | 2013 | |||||||
| Accumulated net actuarial gains (losses) |
$ | (52.6 | ) | $ | 10.0 | |||
| Accumulated prior service (cost) credit |
4.3 | 0.4 | ||||||
|
|
|
|
|
|||||
| Total |
$ | (48.3 | ) | $ | 10.4 | |||
|
|
|
|
|
|||||
| Other Long-Term Employee Benefits: | Successor | |||||||
| Year Ended December 31, | ||||||||
| 2014 | 2013 | |||||||
| Accumulated net actuarial gains (losses) |
$ | (0.4 | ) | $ | 0.6 | |||
| Accumulated prior service (cost) credit |
4.1 | — | ||||||
|
|
|
|
|
|||||
| Total |
$ | 3.7 | $ | 0.6 | ||||
|
|
|
|
|
|||||
The accumulated actuarial gains (losses), net for pensions and other long-term employee benefits relate primarily to differences between the actual net periodic expense and the expected net periodic expense resulting from differences in the significant assumptions, including primarily return on assets, discount rates and healthcare trends, used in these estimates.
F-32
Table of Contents
Notes to Consolidated (Successor) and Combined (Predecessor)
Financial Statements
(In millions, unless otherwise noted)
The estimated pre-tax amounts that are expected to be amortized from Accumulated other comprehensive income (loss) into net periodic benefit cost during 2015 for the defined benefit plans and other long-term employee benefit plans is as follows:
| 2015 | ||||||||
| Defined Benefits | Other Long-Term Employee Benefits |
|||||||
| Amortization of net actuarial gains (losses) |
$ | (1.1 | ) | $ | — | |||
| Amortization of prior service (cost) credit |
0.3 | 4.1 | ||||||
|
|
|
|
|
|||||
| Total |
$ | (0.8 | ) | $ | 4.1 | |||
|
|
|
|
|
|||||
F-33
Table of Contents
Notes to Consolidated (Successor) and Combined (Predecessor)
Financial Statements
(In millions, unless otherwise noted)
Components of Net Periodic Benefit Cost
The following table sets forth the components of net periodic benefit costs for the Successor years ended December 31, 2014 and 2013 and the Predecessor year ended December 31, 2012.
| Pension Benefits | ||||||||||||||||||||||
| Successor | Predecessor | |||||||||||||||||||||
| Year Ended December 31, |
Period from August 24, 2012 through December 31, |
Period from January 1, 2013 through January 31, |
Year Ended December 31, |
|||||||||||||||||||
| 2014 | 2013 | 2012 | 2013 | 2012 | ||||||||||||||||||
| Components of net periodic benefit cost and amounts recognized in other comprehensive (income) loss: |
||||||||||||||||||||||
| Net periodic benefit (credit) cost: |
||||||||||||||||||||||
| Service cost |
$ | 15.4 | $ | 17.0 | $ | — | $ | 1.6 | $ | 14.8 | ||||||||||||
| Interest cost |
22.9 | 21.2 | — | 1.8 | 22.0 | |||||||||||||||||
| Expected return on plan assets |
(14.8 | ) | (11.9 | ) | — | (1.9 | ) | (18.4 | ) | |||||||||||||
| Amortization of actuarial (gain) loss, net |
(0.3 | ) | — | — | 1.1 | 5.2 | ||||||||||||||||
| Amortization of prior service cost |
— | — | — | — | 0.2 | |||||||||||||||||
| Curtailment gain |
(7.3 | ) | — | — | — | — | ||||||||||||||||
| Settlement loss |
0.1 | — | — | — | 3.9 | |||||||||||||||||
|
|
|
|
|
|
|
|
|
|
|
|||||||||||||
| Net periodic benefit cost |
16.0 | 26.3 | — | 2.6 | 27.7 | |||||||||||||||||
|
|
|
|
|
|
|
|
|
|
|
|||||||||||||
| Changes in plan assets and benefit obligations recognized in other comprehensive (income) loss: |
||||||||||||||||||||||
| Net actuarial (gain) loss, net |
60.6 | (10.6 | ) | — | — | 112.7 | ||||||||||||||||
| Amortization of actuarial gain (loss), net |
0.3 | — | — | (1.1 | ) | (5.2 | ) | |||||||||||||||
| Prior service benefit |
(4.3 | ) | (0.4 | ) | — | — | (0.3 | ) | ||||||||||||||
| Amortization of prior service cost |
— | — | — | — | (0.2 | ) | ||||||||||||||||
| Curtailment gain |
7.3 | — | — | — | — | |||||||||||||||||
| Settlement loss |
(0.1 | ) | — | — | — | (3.9 | ) | |||||||||||||||
| Net translation adjustment |
(4.9 | ) | 0.6 | — | — | — | ||||||||||||||||
|
|
|
|
|
|
|
|
|
|
|
|||||||||||||
| Total (gain) loss recognized in other comprehensive income |
58.9 | (10.4 | ) | — | (1.1 | ) | 103.1 | |||||||||||||||
|
|
|
|
|
|
|
|
|
|
|
|||||||||||||
| Total recognized in net periodic benefit cost and other comprehensive (income) loss |
$ | 74.9 | $ | 15.9 | $ | — | $ | 1.5 | $ | 130.8 | ||||||||||||
|
|
|
|
|
|
|
|
|
|
|
|||||||||||||
F-34
Table of Contents
Notes to Consolidated (Successor) and Combined (Predecessor)
Financial Statements
(In millions, unless otherwise noted)
| Other Long-Term Employee Benefits | ||||||||||||||||||||
| Successor | Predecessor | |||||||||||||||||||
| Year Ended December 31, |
Period from August 24, 2012 through December 31, |
Period from January 1, 2013 through January 31, |
Year Ended December 31, |
|||||||||||||||||
| 2014 | 2013 | 2012 | 2013 | 2012 | ||||||||||||||||
| Components of net periodic benefit cost and amounts recognized in other comprehensive (income) loss: |
||||||||||||||||||||
| Net periodic benefit credit cost: |
||||||||||||||||||||
| Service cost |
$ | 0.1 | $ | 0.2 | $ | — | $ | — | $ | 0.3 | ||||||||||
| Interest cost |
0.1 | 0.2 | — | — | 0.5 | |||||||||||||||
| Amortization of actuarial loss, net |
0.1 | — | — | — | — | |||||||||||||||
| Amortization of prior service cost (benefit) |
(1.4 | ) | — | — | — | 0.2 | ||||||||||||||
|
|
|
|
|
|
|
|
|
|
|
|||||||||||
| Net periodic benefit cost |
(1.1 | ) | 0.4 | — | — | 1.0 | ||||||||||||||
|
|
|
|
|
|
|
|
|
|
|
|||||||||||
| Changes in plan assets and benefit obligations recognized in other comprehensive (income) loss: |
||||||||||||||||||||
| Net actuarial (gain) loss |
(4.6 | ) | (0.7 | ) | — | — | 2.7 | |||||||||||||
| Amortization of actuarial gain (loss) |
(0.1 | ) | — | — | — | — | ||||||||||||||
| Prior service benefit |
— | — | — | — | (5.9 | ) | ||||||||||||||
| Amortization of prior service benefit (cost) |
1.4 | — | — | — | (0.2 | ) | ||||||||||||||
| Net translation adjustment |
— | 0.1 | — | — | — | |||||||||||||||
|
|
|
|
|
|
|
|
|
|
|
|||||||||||
| Total (gain) loss recognized in other comprehensive income |
(3.3 | ) | (0.6 | ) | — | — | (3.4 | ) | ||||||||||||
|
|
|
|
|
|
|
|
|
|
|
|||||||||||
| Total recognized in net periodic benefit cost and other comprehensive income |
$ | (4.4 | ) | $ | (0.2 | ) | $ | — | $ | — | $ | (2.4 | ) | |||||||
|
|
|
|
|
|
|
|
|
|
|
|||||||||||
Significant Events
During the Successor year ended December 31, 2014, we recorded a curtailment gain of $7.3 million within Selling, general and administrative expenses due to an amendment to one of our pension plans. In addition, amendments to our long-term employee benefit plans resulted in increases to Accumulated other comprehensive income of $12.0 million at December 31, 2014. These amounts will continue to be recognized in earnings over the remaining future service periods of active participants.
Assumptions
We used the following assumptions in determining the benefit obligations and net periodic benefit cost:
| Successor | Predecessor | |||||||||||||
| 2014 | 2013 | 2012 | ||||||||||||
| Defined benefits |
||||||||||||||
| Weighted-average assumptions: |
||||||||||||||
| Discount rate to determine benefit obligations |
3.23 | % | 4.11 | % | 3.38 | % | ||||||||
| Discount rate to determine net cost |
4.11 | % | 4.15 | % | 4.73 | % | ||||||||
| Rate of future compensation increases to determine benefit obligation |
3.57 | % | 3.52 | % | 3.16 | % | ||||||||
| Rate of future compensation increases to determine net cost |
3.52 | % | 3.69 | % | 3.33 | % | ||||||||
| Rate of return on plan assets to determine net cost |
5.23 | % | 5.22 | % | 7.71 | % | ||||||||
F-35
Table of Contents
Notes to Consolidated (Successor) and Combined (Predecessor)
Financial Statements
(In millions, unless otherwise noted)
| Successor | Predecessor | |||||||||||||
| 2014 | 2013 | 2012 | ||||||||||||
| Other Long-Term Employee benefits |
||||||||||||||
| Weighted-average assumptions: |
||||||||||||||
| Discount rate to determine benefit obligations |
1.50 | % | 4.80 | % | 4.86 | % | ||||||||
| Discount rate to determine net cost |
4.80 | % | 4.20 | % | 7.28 | % | ||||||||
| Rate of future compensation increases to determine benefit obligations |
— | — | 3.00 | % | ||||||||||
| Rate of future compensation increases to determine net cost |
— | — | 4.00 | % | ||||||||||
The discount rates used reflect the expected future cash flow based on plan provisions, participant data as of the closing date of the Acquisition and the currencies in which the expected future cash flows will occur. For the majority of our defined benefit pension obligations, we utilize prevailing long-term high quality corporate bond indices applicable to the respective country at the measurement date. In countries where established corporate bond markets do not exist, we utilize other index movement and duration analysis to determine discount rates. The long-term rate of return on plan assets assumptions reflect economic assumptions applicable to each country and assumptions related to the preliminary assessments regarding the type of investments to be held by the respective plans.
Estimated future benefit payments
The following reflects the total benefit payments expected to be paid for defined benefits:
| Year ended December 31, |
Benefits | |||
| 2015 |
$ | 34.8 | ||
| 2016 |
$ | 27.1 | ||
| 2017 |
$ | 29.8 | ||
| 2018 |
$ | 31.0 | ||
| 2019 |
$ | 37.6 | ||
| 2020—2024 |
$ | 180.3 | ||
The following reflects the total benefit payments expected to be paid for other long-term employee benefits:
| Year ended December 31, |
Benefits | |||
| 2015 |
$ | — | ||
| 2016 |
$ | 0.1 | ||
| 2017 |
$ | — | ||
| 2018 |
$ | — | ||
| 2019 |
$ | — | ||
| 2020—2024 |
$ | — | ||
Plan Assets
As discussed above, the defined benefit pension plans for the subsidiaries in Austria, the United Kingdom and Germany represent single-employer plans and the related plan assets are invested within separate trusts. The defined benefit plan obligations for remaining current employees of non-U.S. subsidiaries assumed by us were carved out of the defined benefit pension plans retained by DuPont. At December 31, 2014, DuPont had completed the asset transfers for all funded plans except the plan covering our Canadian employees. The Canadian plan assets continue to be invested and managed by DuPont until the required regulatory approvals are received at which time the assets will be transferred to a newly created trust.
F-36
Table of Contents
Notes to Consolidated (Successor) and Combined (Predecessor)
Financial Statements
(In millions, unless otherwise noted)
Equity securities include varying market capitalization levels. U.S. equity investments are primarily large-cap companies. Fixed income investments include corporate issued, government issued and asset backed securities. Corporate debt investments include a range of credit risk and industry diversification. Other investments include real estate and private market securities such as insurance contracts, interests in private equity, and venture capital partnerships.
Fair value calculations may not be indicative of net realizable value or reflective of future fair values. Furthermore, although we believe the valuation methods are appropriate and consistent with other market participants, the use of different methodologies or assumptions to determine the fair value of certain financial instruments could result in a different fair value measurement at the reporting date.
The Company’s investment strategy in pension plan assets is to generate earnings over an extended time to help fund the cost of benefits while maintaining an adequate level of diversification for a prudent level of risk. The table below summarizes the weighted average target pension plan asset allocation at December 31 for all Axalta defined benefit plans.
| Asset Category |
2014 | 2013 | Target Allocation | |||||||||
| Equity securities |
35-40 | % | 35-40 | % | 35-40 | % | ||||||
| Debt securities |
35-40 | % | 35-40 | % | 35-40 | % | ||||||
| Real estate |
0-1 | % | 0-1 | % | 0-1 | % | ||||||
| Other |
20-25 | % | 20-25 | % | 20-25 | % | ||||||
The table below presents the fair values of the defined benefit pension plan assets by level within the fair value hierarchy, as described in Note 3, at December 31, 2014 and 2013, respectively.
| Fair value measurements at December 31, 2014 |
||||||||||||||||
| Total | Level 1 | Level 2 | Level 3 | |||||||||||||
| Asset Category: |
||||||||||||||||
| Cash and cash equivalents |
$ | 4.4 | $ | 4.4 | $ | — | $ | — | ||||||||
| U.S. equity securities |
16.1 | 16.1 | — | — | ||||||||||||
| Non-U.S. equity securities |
79.2 | 78.7 | 0.4 | 0.1 | ||||||||||||
| Debt—government issued |
36.9 | 36.3 | 0.6 | — | ||||||||||||
| Debt—corporate issued |
55.3 | 53.0 | — | 2.3 | ||||||||||||
| Hedge Funds |
0.2 | 0.1 | 0.1 | — | ||||||||||||
| Private market securities |
63.2 | 0.1 | 0.1 | 63.0 | ||||||||||||
| Real estate |
0.4 | — | — | 0.4 | ||||||||||||
|
|
|
|
|
|
|
|
|
|||||||||
| 255.7 | $ | 188.7 | $ | 1.2 | $ | 65.8 | ||||||||||
|
|
|
|
|
|
|
|||||||||||
| Pension trust receivables |
38.8 | |||||||||||||||
|
|
|
|||||||||||||||
| Total |
$ | 294.5 | ||||||||||||||
|
|
|
|||||||||||||||
F-37
Table of Contents
Notes to Consolidated (Successor) and Combined (Predecessor)
Financial Statements
(In millions, unless otherwise noted)
| Fair value measurements at December 31, 2013 |
||||||||||||||||
| Total | Level 1 | Level 2 | Level 3 | |||||||||||||
| Asset Category: |
||||||||||||||||
| Cash and cash equivalents |
$ | 6.7 | $ | 6.7 | $ | — | $ | — | ||||||||
| U.S. equity securities |
13.6 | 13.2 | 0.4 | — | ||||||||||||
| Non-U.S. equity securities |
71.3 | 70.8 | 0.5 | — | ||||||||||||
| Debt—government issued |
34.4 | 34.4 | — | — | ||||||||||||
| Debt—corporate issued |
52.2 | 49.3 | 2.9 | — | ||||||||||||
| Hedge Funds |
0.4 | 0.2 | 0.2 | — | ||||||||||||
| Private market securities |
59.5 | — | 0.2 | 59.3 | ||||||||||||
| Real estate |
0.3 | — | — | 0.3 | ||||||||||||
|
|
|
|
|
|
|
|
|
|||||||||
| 238.4 | $ | 174.6 | $ | 4.2 | $ | 59.6 | ||||||||||
|
|
|
|
|
|
|
|||||||||||
| Pension trust receivables |
42.9 | |||||||||||||||
|
|
|
|||||||||||||||
| Total |
$ | 281.3 | ||||||||||||||
|
|
|
|||||||||||||||
Level 3 assets are primarily insurance contracts pledged on behalf of employees with benefits in certain countries, ownership interests in investment partnerships, trusts that own private market securities, and real estate. The tables below present a roll forward of activity for these assets for the years ended December 31, 2014 and 2013.
| Level 3 assets | ||||||||||||||||
| Total | Private market securities |
Debt and Equity |
Real estate |
|||||||||||||
| Ending balance at December 31, 2012 |
$ | 12.2 | $ | 10.5 | $ | — | $ | 1.7 | ||||||||
| Realized (loss) |
(0.1 | ) | — | — | (0.1 | ) | ||||||||||
| Change in unrealized gain |
0.2 | 0.2 | — | — | ||||||||||||
| Purchases, sales, issues and settlements |
45.6 | 46.9 | — | (1.3 | ) | |||||||||||
| Transfers in/(out) of Level 3 |
1.7 | 1.7 | — | — | ||||||||||||
|
|
|
|
|
|
|
|
|
|||||||||
| Ending balance at December 31, 2013 |
$ | 59.6 | $ | 59.3 | $ | — | $ | 0.3 | ||||||||
| Realized (loss) |
— | — | — | — | ||||||||||||
| Change in unrealized gain |
0.2 | — | — | 0.2 | ||||||||||||
| Purchases, sales, issues and settlements |
6.0 | 3.7 | 2.4 | (0.1 | ) | |||||||||||
| Transfers in/(out) of Level 3 |
— | — | — | — | ||||||||||||
|
|
|
|
|
|
|
|
|
|||||||||
| Ending balance at December 31, 2014 |
$ | 65.8 | $ | 63.0 | $ | 2.4 | $ | 0.4 | ||||||||
|
|
|
|
|
|
|
|
|
|||||||||
Assumptions and Sensitivities
The discount rate is determined as of each measurement date, based on a review of yield rates associated with long-term, high-quality corporate bonds. The calculation separately discounts benefit payments using the spot rates from a long-term, high-quality corporate bond yield curve.
The long-term rate of return assumption represents the expected average rate of earnings on the funds invested to provide for the benefits included in the benefit obligations. The long-term rate of return assumption is determined based on a number of factors, including historical market index returns, the anticipated long-term asset allocation of the plans, historical plan return data, plan expenses and the potential to outperform market index returns. The expected long-term rate of return on assets was 5.23% for 2014. For 2015, the expected long-term rate of return is 5.21%.
F-38
Table of Contents
Notes to Consolidated (Successor) and Combined (Predecessor)
Financial Statements
(In millions, unless otherwise noted)
A significant factor used in estimating future per capita cost of covered healthcare benefits for our retirees and us is the healthcare cost trend rate assumption. The rate used at December 31, 2014 was 5.00% and is assumed to remain at that level thereafter. Increasing the assumed healthcare cost trend rates by one percentage point would result in additional annual costs of approximately $0.1 million. Decreasing the assumed health care cost trend rates by one percentage point would result in a decrease of approximately $0.1 million in annual costs. There is no effect on other long-term employee benefit obligations at December 31, 2014 of a one percentage point increase or decrease in assumed health care cost trend rates.
Anticipated Contributions to Defined Benefit Plan
For funded pension plans, our funding policy is to fund amounts for pension plans sufficient to meet minimum requirements set forth in applicable benefit laws and local tax laws. Based on the same assumptions used to measure our benefit obligations at December 31, 2014 we expect to contribute $16.5 million to our defined benefit plans during 2015. No contributions to our other long-term employee benefit plans are expected during 2015. No plan assets are expected to be returned to the Company in 2015.
Defined Contribution Plans
The Company sponsors defined contribution plans in both its US and non-US subsidiaries, under which salaried and certain hourly employees may defer a portion of their compensation. Eligible participants may contribute to the plan up to the allowable amount as determined by the plan of their regular compensation before taxes. All contributions and Company matches are invested at the direction of the employee. Company matching contributions vest immediately and aggregated $35.9 million for the Successor year ended December 31, 2014.
| (11) | STOCK-BASED COMPENSATION |
Successor period
During the years ended December 31, 2014 and 2013, we recognized $8.0 million and $7.4 million, respectively, in stock-based compensation expense which was allocated to costs of goods sold, selling, general and administrative expenses, and research and development expenses. We, with respect to stock-based compensation, recognized a tax benefit of $2.8 million and $2.6 million for the years ended December 31, 2014 and 2013, respectively.
Description of Equity Incentive Plan
In 2013, Axalta’s Board of Directors approved the Axalta Coating Systems Bermuda Co., Ltd. 2013 Equity Incentive Plan (the “2013 Plan”) which reserved an aggregate of 19,839,143 common shares of the Company for issuance to employees, directors and consultants. The 2013 Plan provides for the issuance of stock options, restricted stock or other stock-based awards. Options and restricted shares granted pursuant to the equity incentive plan must be authorized by the Board of Directors of Axalta or a designated committee thereof.
In 2014, Axalta’s Board of Directors approved the Axalta Coating Systems Ltd. 2014 Incentive Award Plan (the “2014” Plan) which reserved an aggregate 11,830,000 shares of common stock of the Company for issuance to employees, directors and consultants. The 2014 Plan provides for the issuance of stock options, restricted stock or other stock-based awards. Options and restricted shares granted pursuant to the equity incentive plan must be authorized by the Board of Directors of Axalta or a designated committee thereof. No awards have been granted under the 2014 Plan.
F-39
Table of Contents
Notes to Consolidated (Successor) and Combined (Predecessor)
Financial Statements
(In millions, unless otherwise noted)
The terms of the options may vary with each grant and are determined by the Compensation Committee within the guidelines of the equity incentive plan. Options currently vest over 4.4 to 5 years, and vesting of a portion of the options could accelerate in the event of certain changes in control. Option life cannot exceed ten years. In 2013, we granted approximately 4.1 million, 5.7 million and 6.4 million in non-qualified stock options to certain employees with strike prices of $5.92, $8.88 and $11.84 (per share), respectively. During 2014, we granted 1.6 million non-qualified service-based stock options to certain employees and directors with strike prices of $5.92, $7.21, $8.88 and $11.84 per share.
Stock Options
The Black-Scholes option pricing model was used to estimate fair values of the options as of the date of the grant. The weighted average fair value of options granted in 2014 and 2013 was $1.92 and $1.38 per share, respectively. Principal weighted average assumptions used in applying the Black-Scholes model were as follows:
| 2014 Grants | 2013 Grants | |||||||
| Expected Term |
7.81 years | 7.81 years | ||||||
| Volatility |
28.28 | % | 28.61 | % | ||||
| Dividend Yield |
— | — | ||||||
| Discount Rate |
2.21 | % | 2.13 | % | ||||
For the 2014 stock awards, we estimated the per share fair value of our common stock using a contemporaneous valuation consistent with the American Institute of Certified Public Accountants Practice Aid, “Valuation of Privately-Held Company Equity Securities Issued as Compensation” (the “Practice Aid”). In conducting this valuation, we considered all objective and subjective factors that we believed to be relevant, including our best estimate of our business condition, prospects and operating performance. Within this contemporaneous valuation, a range of factors, assumptions and methodologies were used. The significant factors included:
| • | the fact that we were a private company with illiquid securities; |
| • | our historical operating results; |
| • | our discounted future cash flows, based on our projected operating results; |
| • | valuations of comparable public companies; and |
| • | the risk involved in the investment, as related to earnings stability, capital structure, competition and market potential. |
For the contemporaneous valuation of our common stock, management estimated, as of the issuance date, our enterprise value on a continuing operations basis, using the income and market approaches, as described in the Practice Aid. The income approach utilized the discounted cash flow (“DCF”) methodology based on our financial forecasts and projections, as detailed below. The market approach utilized the Guideline Public Company and Guideline Transactions methods, as detailed below.
For the DCF methodology, we prepared annual projections of future cash flows through 2018. Beyond 2018, projected cash flows through the terminal year were projected at long-term sustainable growth rates consistent with long-term inflationary and industry expectations. Our projections of future cash flows were based on our estimated net debt-free cash flows and were discounted to the valuation date using a weighted-average cost of capital estimated based on market participant assumptions.
For the Guideline Public Company and Guideline Transactions methods, we identified a group of comparable public companies and recent transactions within the chemicals industry. For the comparable
F-40
Table of Contents
Notes to Consolidated (Successor) and Combined (Predecessor)
Financial Statements
(In millions, unless otherwise noted)
companies, we estimated market multiples based on trading prices and trailing 12 months EBITDA. These multiples were then applied to our trailing 12 months EBITDA. When selecting comparable companies, consideration was given to industry similarity, their specific products offered, financial data availability and capital structure.
For the comparable transactions, we estimated market multiples based on prices paid for the related transactions and trailing 12 months EBITDA. These multiples were then applied to our trailing 12 months EBITDA. The results of the market approaches corroborated the fair value determined using the income approach.
For the 2013 grants, the market value of the stock was estimated based upon the Acquisition transaction since the Company was not publicly traded at that time and there had been no significant changes in operations since the closing date of February 1, 2013.
To estimate the expected stock option term for the $5.92 and $7.21 stock options referred to above, we used the simplified method as the options were granted at fair value and Axalta, a privately-held company, had no exercise history. Based upon this simplified method the $5.92 and $7.21 per share stock options have an expected term of 6.5 years. The strike price for the $8.88 per share and $11.84 per share tranches of options exceeded fair value at the grant date which required the use of an estimate of an implicitly longer holding period, resulting in the term of 8.25 years.
We do not anticipate paying cash dividends in the foreseeable future and, therefore, use an expected dividend yield of zero. Volatility for outstanding grants is based upon the peer group since the Company was privately-held at the date of grant. The discount rate was derived from the U.S. Treasury yield curve.
The exercise price and market value per share amounts presented above were as of the date the stock options were granted.
A summary of stock option award activity as of December 31, 2014 and changes during the year then ended, is presented below:
| Awards (millions) |
Weighted- Average Exercise Price |
Aggregate Intrinsic Value (millions) |
Weighted Average Remaining Contractual Life (years) |
|||||||||||||
| Outstanding at January 1, 2014 |
16.2 | $ | 9.32 | |||||||||||||
| Granted |
1.6 | $ | 9.62 | |||||||||||||
| Exercised |
(0.4 | ) | $ | 8.03 | ||||||||||||
| Forfeited |
(0.3 | ) | $ | 9.32 | ||||||||||||
|
|
|
|||||||||||||||
| Outstanding at December 31, 2014 |
17.1 | $ | 9.38 | |||||||||||||
|
|
|
|||||||||||||||
| Vested and expected to vest at December 31, 2014 |
17.1 | $ | 9.38 | $ | 284.5 | 8.58 | ||||||||||
| Exercisable at December 31, 2014 |
2.9 | $ | 9.49 | $ | 47.6 | 8.44 | ||||||||||
Cash received by the company upon exercise of options in 2014 was $3.0 million. The tax benefit related to these exercises is immaterial. The Company may settle option exercises by issuing new shares, treasury shares or shares purchased on the open market. The intrinsic value of options exercised in 2014 was not material.
The fair value of shares vested during 2014 and 2013 was $4.5 million and $0.0 million, respectively.
Compensation cost is recorded net of forfeitures. The forfeiture rate assumption is the estimated annual rate at which unvested awards are expected to be forfeited during the vesting period. Periodically, management
F-41
Table of Contents
Notes to Consolidated (Successor) and Combined (Predecessor)
Financial Statements
(In millions, unless otherwise noted)
will assess whether it is necessary to adjust the estimated rate to reflect changes in actual forfeitures or changes in expectations. At December 31, 2014 and 2013, the Company has estimated its annual forfeiture rate at 0% due to its limited history and expectations of forfeitures.
At December 31, 2014, there was $9.7 million of unrecognized compensation cost relating to outstanding unvested stock options expected to be recognized over the weighted average period of 3.4 years. Compensation expense is recognized for the fair values of the stock options over the requisite service period of the awards using the graded-vesting attribution method.
Predecessor periods
DuPont maintained certain stock-based compensation plans for the benefit of certain of its officers, directors’ and employees, including, prior to the Acquisition, certain DPC employees. DPC recognized stock-based compensation within the combined statement of operations based upon fair values. The fair value of awards granted totaled $2.0 million for the Predecessor year ended December 31, 2012.
Total stock-based compensation expense included in the combined statement of operations was $0.1 million and $0.5 million for the Predecessor period from January 1, 2013 through January 31, 2013 and the Predecessor year ended December 31, 2012, respectively.
| (12) | RELATED PARTY TRANSACTIONS |
Carlyle Group L.P. and its affiliates (“Carlyle”)
We entered into a consulting agreement with Carlyle Investment Management L.L.C. (“Carlyle Investment”), an affiliate of Carlyle pursuant to which Carlyle Investment provides certain consulting services to Axalta. Under this agreement, subject to certain conditions, we were required to pay an annual consulting fee to Carlyle Investment of $3.0 million payable in equal quarterly installments and reimburse Carlyle Investment for out-pocket expenses incurred in providing the consulting services. During the Successor year ended December 31, 2014, we recorded expense of $3.2 million in regular monthly management fees and out of pocket costs as well as a $13.4 million pre-tax charge related to the termination of the agreement upon completion of the IPO.
During the Successor year ended December 31, 2013, we recorded expense of $3.1 million related to this consulting agreement. In addition, Carlyle Investment received a one-time fee of $35.0 million upon effectiveness of the Acquisition for services rendered in connection with the Acquisition and related acquisition financing. Of this amount, $21.0 million was recorded as merger and acquisition expenses in the Successor year ended December 31, 2013, and $14.0 million was recorded as a component of deferred financing costs, which is amortized to interest expense.
Service King Collision Repair
Service King Collision Repair, a portfolio company of funds affiliated with Carlyle, has purchased products from our distributors in the past and may continue to do so in the future. During the third quarter 2014, Carlyle sold their majority interest in Service King Collision Repair, thus making the entity no longer a related party. Related party sales prior to this transaction were $4.0 million and $2.0 million for the Successor years ended December 31, 2014 and 2013, respectively. During the Predecessor period from January 1, 2013 through January 31, 2013 sales to Service King Collision Repair were immaterial.
F-42
Table of Contents
Notes to Consolidated (Successor) and Combined (Predecessor)
Financial Statements
(In millions, unless otherwise noted)
Other
A director of the Company is the Chairman and Chief Executive Officer of an international management consulting firm focused on the automotive and industrial sectors. In connection with the Acquisition, we incurred consulting fees and expenses from the consulting firm of approximately $2.1 million, of which $0.1 million was incurred in the Successor year ended December 31, 2013 and the remainder was incurred in the Successor period from August 24, 2012 through December 31, 2012. As part of the compensation for the consulting services, we granted the consulting firm a stock option award to purchase up to 352,143 of our common shares which had a fair value of approximately $0.5 million.
| (13) | OTHER EXPENSE, NET |
| Successor | Predecessor | |||||||||||||||||||||
| Year Ended December 31, |
Period from August 24, 2012 through December 31, |
Period from January 1, 2013 through January 31, |
Year Ended December 31, |
|||||||||||||||||||
| 2014 | 2013 | 2012 | 2013 | 2012 | ||||||||||||||||||
| Exchange losses, net |
$ | 81.2 | $ | 48.9 | $ | — | $ | 4.5 | $ | 17.7 | ||||||||||||
| Management fees and expenses |
16.6 | 3.1 | — | — | — | |||||||||||||||||
| Other |
17.2 | (3.5 | ) | — | 0.5 | (1.4 | ) | |||||||||||||||
|
|
|
|
|
|
|
|
|
|
|
|||||||||||||
| Total |
$ | 115.0 | $ | 48.5 | $ | — | $ | 5.0 | $ | 16.3 | ||||||||||||
|
|
|
|
|
|
|
|
|
|
|
|||||||||||||
Our net foreign exchange losses for the year ended December 31, 2014 and 2013 consisted of remeasurement losses primarily related to intercompany transactions denominated in currencies different from the functional currency of the relevant subsidiary partially offset by gains on our Euro borrowings and our Venezuela operations, as discussed below.
Based on changes to the Venezuelan currency exchange rate mechanisms in 2014 and our participation in Venezuela’s Complementary System of Foreign Currency Administration (SICAD I) auction process during the year ended December 31, 2014, we changed the exchange rate we used to remeasure our Venezuelan subsidiary’s financial statements into U.S. dollars. The exchange rate was determined by such auction process, which was 12.0 to 1 as of December 31, 2014 compared to the historical indexed rate of 6.3 to 1. We determined that the exchange rate of 12.0 to 1 was appropriate given trends in the SICAD 1 auction process. Further, we also believe the equity of our Venezuelan subsidiary would be realized through a dividend utilizing the auction process through SICAD I. The devaluations of the exchange rates resulted in net gains of $17.0 million for the year ended December 31, 2014 primarily due to our Venezuelan operations being in a net monetary liability position.
In February 2015, the Venezuelan government enacted additional changes to its foreign exchange regime. The changes maintain a three-tiered system, including the Official Rate determined by CENCOEX, which remains at 6.3 to 1, and the SICAD I auction market which continued to trade at 12.0 to 1. The SICAD II market has been eliminated and a new, alternative currency market, the Marginal Foreign Exchange System (“SIMADI”), has been created with a floating exchange rate generally based on supply and demand. An initial exchange rate for the SIMADI market was established at approximately 170.0 to 1.
At December 31, 2014, our Venezuelan subsidiary was in a net monetary liability position of $9.1 million and had non-U.S. Dollar denominated net non-monetary assets of $150.9 million. We continue to assess the impact, if any, of these changes as the government of Venezuela issues regulations to implement them, but at this time it is unclear based on the current governmental policies, when considered with the foreign exchange process and other circumstances in Venezuela, whether these events will have any financial impact on the operations of our Venezuelan subsidiary.
F-43
Table of Contents
Notes to Consolidated (Successor) and Combined (Predecessor)
Financial Statements
(In millions, unless otherwise noted)
| (14) | INCOME TAXES |
Domestic and Foreign Components of Income (Loss) Before Income Taxes
| Successor | Predecessor | |||||||||||||||||||||
| Year Ended December 31, |
Period from August 24, 2012 through December 31, |
Period from January 1, 2013 through January 31, |
Year Ended December 31, |
|||||||||||||||||||
| 2014 | 2013 | 2012 | 2013 | 2012 | ||||||||||||||||||
| Domestic |
$ | (8.8 | ) | $ | (153.8 | ) | $ | — | $ | (1.5 | ) | $ | 82.8 | |||||||||
| Foreign |
45.6 | (109.9 | ) | (29.0 | ) | 17.1 | 310.2 | |||||||||||||||
|
|
|
|
|
|
|
|
|
|
|
|||||||||||||
| Total |
$ | 36.8 | $ | (263.7 | ) | $ | (29.0 | ) | $ | 15.6 | $ | 393.0 | ||||||||||
|
|
|
|
|
|
|
|
|
|
|
|||||||||||||
Provision (Benefit) for Income Taxes
| Successor | ||||||||||||||||||||||||||||||||||||
| Year Ended December 31, 2014 |
Year Ended December 31, 2013 |
Period from August 24, 2012 through December 31, 2012 |
||||||||||||||||||||||||||||||||||
| Current | Deferred | Total | Current | Deferred | Total | Current | Deferred | Total | ||||||||||||||||||||||||||||
| U.S. Federal |
$ | — | $ | (2.1 | ) | $ | (2.1 | ) | $ | — | $ | (43.7 | ) | $ | (43.7 | ) | $ | — | $ | — | $ | — | ||||||||||||||
| State |
2.0 | (2.9 | ) | (0.9 | ) | 2.3 | (2.5 | ) | (0.2 | ) | — | — | — | |||||||||||||||||||||||
| Foreign |
38.3 | (33.2 | ) | 5.1 | 73.7 | (74.6 | ) | (0.9 | ) | — | — | — | ||||||||||||||||||||||||
|
|
|
|
|
|
|
|
|
|
|
|
|
|
|
|
|
|
|
|||||||||||||||||||
| Total |
$ | 40.3 | $ | (38.2 | ) | $ | 2.1 | $ | 76.0 | $ | (120.8 | ) | $ | (44.8 | ) | $ | — | $ | — | $ | — | |||||||||||||||
|
|
|
|
|
|
|
|
|
|
|
|
|
|
|
|
|
|
|
|||||||||||||||||||
| Predecessor | ||||||||||||||||||||||||
| Period from January 1, 2013 through January 31, 2013 |
Year Ended December 31, 2012 | |||||||||||||||||||||||
| Current | Deferred | Total | Current | Deferred | Total | |||||||||||||||||||
| U.S. Federal |
$ | (8.8 | ) | $ | 7.0 | $ | (1.8 | ) | $ | 30.9 | $ | (4.5 | ) | $ | 26.4 | |||||||||
| State |
0.1 | (0.2 | ) | (0.1 | ) | 6.6 | (0.4 | ) | 6.2 | |||||||||||||||
| Foreign |
6.7 | 2.3 | 9.0 | 98.6 | 14.0 | 112.6 | ||||||||||||||||||
|
|
|
|
|
|
|
|
|
|
|
|
|
|||||||||||||
| Total |
$ | (2.0 | ) | $ | 9.1 | $ | 7.1 | $ | 136.1 | $ | 9.1 | $ | 145.2 | |||||||||||
|
|
|
|
|
|
|
|
|
|
|
|
|
|||||||||||||
F-44
Table of Contents
Notes to Consolidated (Successor) and Combined (Predecessor)
Financial Statements
(In millions, unless otherwise noted)
Reconciliation to US Statutory Rate
| Successor | Predecessor | |||||||||||||||||||||||||||||||||||||||||
| Year Ended December 31, 2014 |
Year Ended December 31, 2013 |
Period from August 24, 2012 through December 31, 2012 |
Period from January 1 2013 through January 31, 2013 |
Year Ended December 31, 2012 |
||||||||||||||||||||||||||||||||||||||
| Statutory U.S. federal income tax / rate(1) |
$ | 12.9 | 35.0 | % | $ | (92.3 | ) | 35.0 | % | $ | (10.1 | ) | 35.0 | % | $ | 5.5 | 35.0 | % | $ | 137.6 | 35.0 | % | ||||||||||||||||||||
| Foreign income taxed at rates other than 35% |
(46.7 | ) | (127.0 | ) | (36.6 | ) | 13.9 | 10.1 | (35.0 | ) | 1.0 | 6.6 | (10.9 | ) | (2.8 | ) | ||||||||||||||||||||||||||
| Changes in valuation allowances |
44.4 | 120.9 | 55.0 | (20.9 | ) | — | — | 1.4 | 8.9 | 9.8 | 2.5 | |||||||||||||||||||||||||||||||
| Foreign exchange (gain) loss |
8.7 | 23.7 | 8.7 | (3.3 | ) | — | — | 0.5 | 3.1 | 4.7 | 1.2 | |||||||||||||||||||||||||||||||
| Unrecognized tax benefits(2) |
(44.0 | ) | (119.7 | ) | 35.1 | (13.2 | ) | — | — | — | — | — | — | |||||||||||||||||||||||||||||
| Withholding taxes, net |
(0.3 | ) | (0.8 | ) | 8.3 | (3.2 | ) | — | — | — | — | — | — | |||||||||||||||||||||||||||||
| Non-deductible interest |
15.4 | 41.9 | 6.4 | (2.4 | ) | — | — | — | — | — | — | |||||||||||||||||||||||||||||||
| Non-deductible expenses |
14.2 | 38.6 | 19.4 | (7.4 | ) | — | — | — | — | — | — | |||||||||||||||||||||||||||||||
| Tax credits |
(3.6 | ) | (9.8 | ) | (1.0 | ) | 0.4 | — | — | — | — | — | — | |||||||||||||||||||||||||||||
| Capital loss(3) |
— | — | (46.7 | ) | 17.7 | — | — | — | — | — | — | |||||||||||||||||||||||||||||||
| Other—net |
1.1 | 2.9 | (1.1 | ) | 0.4 | — | — | (1.3 | ) | (8.0 | ) | 4.0 | 1.1 | |||||||||||||||||||||||||||||
|
|
|
|
|
|
|
|
|
|
|
|
|
|
|
|
|
|
|
|
|
|||||||||||||||||||||||
| Total income tax (benefit)/ effective tax rate |
$ | 2.1 | 5.7 | % | $ | (44.8 | ) | 17.0 | % | $ | — | — | $ | 7.1 | 45.6 | % | $ | 145.2 | 37.0 | % | ||||||||||||||||||||||
|
|
|
|
|
|
|
|
|
|
|
|
|
|
|
|
|
|
|
|
|
|||||||||||||||||||||||
| (1) | The U.S. statutory rate has been used as management believes it is more meaningful to the Company. |
| (2) | Within this amount, the Company released and recorded an unrecognized tax benefit of $21.1 million related to non-deductible interest and debt acquisition costs in 2014 and 2013. These adjustments were fully offset by changes in the valuation allowance. |
| (3) | In 2013, the Company recognized a tax benefit of $46.7 million related to a capital loss, which is fully offset by a $46.7 million increase to the valuation allowance. |
F-45
Table of Contents
Notes to Consolidated (Successor) and Combined (Predecessor)
Financial Statements
(In millions, unless otherwise noted)
Deferred Tax Balances
| Successor | ||||||||
| Year Ended December 31, |
||||||||
| 2014 | 2013 | |||||||
| Deferred tax asset |
||||||||
| Tax loss and credit carryforwards |
$ | 185.6 | $ | 111.7 | ||||
| Goodwill and intangibles |
90.8 | 89.4 | ||||||
| Compensation & employee benefits |
92.4 | 79.1 | ||||||
| Accruals & other reserves |
58.0 | 40.5 | ||||||
| Interest expense |
13.4 | 8.6 | ||||||
| Total deferred tax assets |
440.2 | 329.3 | ||||||
| Less: Valuation allowance |
(101.9 | ) | (63.4 | ) | ||||
|
|
|
|
|
|||||
| Net, deferred tax assets |
338.3 | 265.9 | ||||||
| Deferred tax liabilities |
||||||||
| Inventory |
(3.0 | ) | (1.3 | ) | ||||
| Property, Plant & Equipment |
(215.0 | ) | (218.5 | ) | ||||
| Accounts Receivable & Other Assets |
(2.5 | ) | (8.4 | ) | ||||
| Equity Investment & Other Securities |
(2.2 | ) | (5.8 | ) | ||||
| Unremitted earnings |
(8.5 | ) | (15.9 | ) | ||||
| Long-Term Debt |
(8.1 | ) | — | |||||
|
|
|
|
|
|||||
| Total deferred tax liabilities |
(239.3 | ) | (249.9 | ) | ||||
|
|
|
|
|
|||||
| Net deferred tax asset/(liability) |
$ | 99.0 | $ | 16.0 | ||||
| Current asset |
$ | 64.5 | $ | 30.0 | ||||
| Current liability |
(7.3 | ) | (5.5 | ) | ||||
| Non-current assets |
250.0 | 271.9 | ||||||
| Non-current liability |
(208.2 | ) | (280.4 | ) | ||||
|
|
|
|
|
|||||
| Net deferred tax asset |
$ | 99.0 | $ | 16.0 | ||||
|
|
|
|
|
|||||
At December 31, 2014, the Company had $118.3 million of net operating and capital loss carryforwards (tax effected) in certain non-U.S. jurisdictions, net of uncertain tax positions. Of these, $78.2 million have indefinite carryforward periods, and the remaining $40.1 million are subject to expiration between the years 2019 through 2026. In the U.S., there were approximately $53.2 million of federal net operating loss carryforwards (tax effected) subject to expiration in years beyond 2032, and $2.5 million of state net operating loss carryforwards (tax effected) subject to expiration between the years 2018 and 2034. Tax credit carryforwards at December 31, 2014 amounted to $11.6 million, of which $0.6 million is subject to expiration in 2016. The remaining tax credit carryforwards expire between the years 2018 and 2034.
At December 31, 2013, the Company had $83.1 million of net operating and capital loss carryforwards (tax effected) in certain non-U.S. jurisdictions, net of uncertain tax positions. Of these, $53.2 million have indefinite carryforward periods, and the remaining $29.9 million are subject to expiration between the years 2018 through 2023. In the U.S., there were approximately $24.3 million of federal net operating loss carryforwards (tax effected) subject to expirations in years beyond 2032, and $0.6 million of state net operating loss carryforwards (tax effected) subject to expiration between the years 2019 and 2034. Tax credit carryforwards at December 31, 2013, amounted to $3.7 million, which are subject to expiration between the years 2023 through 2033.
F-46
Table of Contents
Notes to Consolidated (Successor) and Combined (Predecessor)
Financial Statements
(In millions, unless otherwise noted)
The Company had valuation allowances that primarily related to the realization of recorded tax benefits on tax loss carryforwards from operations in Austria, Luxembourg, Netherlands and the United Kingdom at December 31, 2014 and 2013 of $101.9 million and $63.4 million, respectively.
The Company has determined that the unremitted earnings of our subsidiaries will not be permanently reinvested, and accordingly, has provided a deferred tax liability at December 31, 2014 and 2013 of $8.5 million and $15.9 million, respectively. The Company has included in the current income tax provision a total benefit of $4.7 million, of which $1.5 million relates to subsidiary earnings and $3.2 million relates to the benefit of reduced withholding tax rates on prior year earnings.
Total Gross Unrecognized Tax Benefits
| Successor | Predecessor | |||||||||||||||||||||
| Year Ended December 31, |
Period from January 1 2013 through January 31, |
Period from January 1 2013 through January 31, |
Year Ended December 31, |
|||||||||||||||||||
| 2014 | 2013 | 2013 | 2013 | 2012 | ||||||||||||||||||
| Balance at January 1 |
$ | 38.9 | $ | — | $ | — | $ | — | $ | — | ||||||||||||
| Increases related to acquisition |
— | 11.3 | — | — | — | |||||||||||||||||
| Increases related to positions taken on items from prior years |
— | — | — | — | — | |||||||||||||||||
| Decreases related to positions taken on items from prior years |
(33.6 | ) | — | — | — | — | ||||||||||||||||
| Increases related to positions taken in the current year |
— | 27.6 | — | — | — | |||||||||||||||||
| Settlement of uncertain tax positions with tax authorities |
— | — | — | — | — | |||||||||||||||||
| Decreases due to expiration of statutes of limitations |
— | — | — | — | — | |||||||||||||||||
|
|
|
|
|
|
|
|
|
|
|
|||||||||||||
| Balance at December 31 |
$ | 5.3 | $ | 38.9 | $ | — | $ | — | $ | — | ||||||||||||
|
|
|
|
|
|
|
|
|
|
|
|||||||||||||
At December 31, 2014, the total amount of gross unrecognized tax benefits was $5.3 million ($38.9 million at December 31, 2013), of which $5.3 million would impact the effective tax rate, if recognized ($17.8 million at December 31, 2013).
Interest and penalties associated with gross unrecognized tax benefits are included as components of the “Provision (benefit) for income taxes,” and totaled $6.8 million in 2014 and a charge of $7.4 million in 2013. Accrued interest and penalties are included within the related tax liability line in the balance sheet. The Company’s accrual for interest and penalties at December 31, 2014 and 2013 was $0.3 million and $7.1 million, respectively.
During 2014, resolution on two separate tax matters resulted in the adjustment of gross unrecognized tax benefits. In April 2014, documentation was secured to support tax deductions related to pre-acquisition activities. Additionally, in December 2014, the Company received affirmative guidance with respect to the treatment of certain 2013 charges. As a result, the Company believes it is more likely than not to sustain the position and adjusted the unrecognized tax benefits related to these matters, resulting in a tax benefit of $31.0 million (offset by an unfavorable change in the valuation allowance of $21.1 million).
The Company is subject to income tax in approximately 40 jurisdictions outside the U.S. The Company’s significant operations outside the U.S. are located in Belgium, China, Germany, Mexico, and United
F-47
Table of Contents
Notes to Consolidated (Successor) and Combined (Predecessor)
Financial Statements
(In millions, unless otherwise noted)
Kingdom. The statute of limitations varies by jurisdiction with 2006 being the oldest tax year still open in the material jurisdictions. The Company is currently under audit in certain jurisdictions for tax years under responsibility of the predecessor, as well as tax periods under the Company’s ownership. Pursuant to the acquisition agreement, all tax liabilities related to tax years prior to 2013 acquisition will be indemnified by DuPont.
As of December 31, 2014 and 2013, we had gross unrecognized tax benefits of $5.6 million and $46.1 million, respectively, including interest and penalties. Due to the high degree of uncertainty regarding future timing of cash flows associated with these liabilities, we are unable to estimate the years in which settlement will occur with the respective taxing authorities.
| (15) | EARNINGS PER COMMON SHARE |
Basic earnings per common share excludes the dilutive impact of potentially dilutive securities and is computed by dividing net income by the weighted average number of common shares outstanding for the period. Diluted earnings per common share includes the effect of potential dilution from the exercise of outstanding stock options. Potentially dilutive securities have been excluded in the weighted average number of common shares used for the calculation of earnings per share in periods of net loss because the effect of such securities would be anti-dilutive. A reconciliation of the Company’s basic and diluted earnings per common share is as follows (in millions, except earnings per share):
| Successor | ||||||||||||
| Year Ended December 31, |
Period from August 24, 2012 through December 31, 2012 |
|||||||||||
| (In millions, except per share data) | 2014 | 2013 | 2012 | |||||||||
| Net income (loss) attributable to Axalta |
$ | 27.4 | $ | (224.9 | ) | $ | (29.0 | ) | ||||
| Pre-Acquisition net loss attributable to Axalta |
— | (3.9 | ) | (29.0 | ) | |||||||
|
|
|
|
|
|
|
|||||||
| Net income (loss) to common shareholders(1) |
$ | 27.4 | $ | (221.0 | ) | $ | — | |||||
| Basic and diluted weighted average shares outstanding(1) |
229.3 | 228.3 | — | |||||||||
| Diluted weighted average shares outstanding |
230.3 | 228.3 | — | |||||||||
| Earnings per Common Share: |
||||||||||||
| Basic net income (loss) per share |
$ | 0.12 | $ | (0.97 | ) | $ | — | |||||
| Diluted net income (loss) per share |
$ | 0.12 | $ | (0.97 | ) | $ | — | |||||
| (1) | As of February 1, 2013, the date of the Acquisition, the Company received the initial Equity Contribution of $1,350.0 million. Accordingly, the net loss to common shareholders and the weighted average shares outstanding calculation is based on the period from February 1, 2013 to December 31, 2013. |
The number of anti-dilutive shares (stock options) that have been excluded in the computation of diluted earnings per share for the Successor years ended December 31, 2014 and 2013 were 7.2 million and 16.3 million, respectively. There were no anti-dilutive shares for the Successor period ending December 31, 2012.
Basic and diluted weighted average shares outstanding have been adjusted to reflect the Company’s 100,000 for 1 stock split which occurred in July 2013, and the Company’s 1.69 for 1 stock split which occurred in October 2014.
F-48
Table of Contents
Notes to Consolidated (Successor) and Combined (Predecessor)
Financial Statements
(In millions, unless otherwise noted)
| (16) | ACCOUNTS AND NOTES RECEIVABLE, NET |
| Successor | ||||||||
| Year Ended December 31, |
||||||||
| 2014 | 2013 | |||||||
| Accounts receivable—trade, net |
$ | 638.3 | $ | 637.5 | ||||
| Notes receivable |
45.5 | 44.7 | ||||||
| Other |
136.6 | 183.7 | ||||||
|
|
|
|
|
|||||
| Total |
$ | 820.4 | $ | 865.9 | ||||
|
|
|
|
|
|||||
Accounts and notes receivable are carried at amounts that approximate fair value. Accounts receivable—trade, net are net of allowances of $9.9 million and $6.5 million at December 31, 2014 and 2013, respectively. Bad debt expense was $5.1 million and $5.4 million for the Successor years ended December 31, 2014 and 2013, respectively, $0.2 million for the Predecessor period from January 1, 2013 through January 31, 2013 and $5.0 million for the Predecessor year ended December 31, 2012.
| (17) | INVENTORIES |
| Successor | ||||||||
| Year Ended December 31, |
||||||||
| 2014 | 2013 | |||||||
| Finished products |
$ | 323.7 | $ | 329.3 | ||||
| Semi-finished products |
81.3 | 90.2 | ||||||
| Raw materials and supplies |
133.3 | 130.7 | ||||||
|
|
|
|
|
|||||
| Total |
$ | 538.3 | $ | 550.2 | ||||
|
|
|
|
|
|||||
Stores and supplies inventories of $20.9 million and $21.2 million at December 31, 2014 and December 31, 2013 were valued under the weighted average cost method.
F-49
Table of Contents
Notes to Consolidated (Successor) and Combined (Predecessor)
Financial Statements
(In millions, unless otherwise noted)
| (18) | PROPERTY, PLANT AND EQUIPMENT, NET |
Depreciation expense amounted to $176.6 million and $174.3 million for the Successor years ended December 31, 2014 and 2013, respectively. Depreciation expense amounted to $7.2 million for the Predecessor period from January 1, 2013 through January 31, 2013 and $82.9 million for the Predecessor year ended December 31, 2012.
| Successor | ||||||||||
| Year Ended December 31, |
||||||||||
| Useful Lives (years) | 2014 | 2013 | ||||||||
| Land |
$ | 90.5 | $ | 99.9 | ||||||
| Buildings and improvements |
5 -25 | 418.4 | 430.7 | |||||||
| Machinery and equipment |
3 -25 | 1,060.1 | 1,087.0 | |||||||
| Software |
5 - 7 | 122.1 | 42.4 | |||||||
| Other |
3 -20 | 29.1 | 26.3 | |||||||
| Construction in progress |
138.0 | 119.9 | ||||||||
|
|
|
|
|
|||||||
| Total |
1,858.2 | 1,806.2 | ||||||||
|
|
|
|
|
|||||||
| Accumulated depreciation |
(344.1 | ) | (183.6 | ) | ||||||
|
|
|
|
|
|||||||
| Property, plant, and equipment, net |
$ | 1,514.1 | $ | 1,622.6 | ||||||
|
|
|
|
|
|||||||
| (19) | OTHER ASSETS |
| Successor | ||||||||
| Year Ended December 31, |
||||||||
| 2014 | 2013 | |||||||
| Available for sale securities |
$ | 4.5 | $ | 4.9 | ||||
| Deferred income taxes—non-current |
250.0 | 271.9 | ||||||
| Other |
219.2 | 218.3 | ||||||
|
|
|
|
|
|||||
| Total |
$ | 473.7 | $ | 495.1 | ||||
|
|
|
|
|
|||||
| (20) | ACCOUNTS PAYABLE |
| Successor | ||||||||
| Year Ended December 31, |
||||||||
| 2014 | 2013 | |||||||
| Trade payables |
$ | 463.6 | $ | 428.8 | ||||
| Non-income taxes |
21.4 | 40.5 | ||||||
| Other |
9.5 | 9.2 | ||||||
|
|
|
|
|
|||||
| Total |
$ | 494.5 | $ | 478.5 | ||||
|
|
|
|
|
|||||
F-50
Table of Contents
Notes to Consolidated (Successor) and Combined (Predecessor)
Financial Statements
(In millions, unless otherwise noted)
| (21) | OTHER ACCRUED LIABILITIES |
| Successor | ||||||||
| Year Ended December 31, |
||||||||
| 2014 | 2013 | |||||||
| Compensation and other employee-related costs |
$ | 153.0 | $ | 168.0 | ||||
| Current portion of long-term employee benefit plans |
12.4 | 13.3 | ||||||
| Restructuring |
48.5 | 98.4 | ||||||
| Discounts, rebates, and warranties |
68.6 | 65.0 | ||||||
| Income taxes payable |
20.8 | 25.1 | ||||||
| Derivative liabilities |
1.5 | 1.2 | ||||||
| Other |
100.0 | 101.7 | ||||||
|
|
|
|
|
|||||
| Total |
$ | 404.8 | $ | 472.7 | ||||
|
|
|
|
|
|||||
| (22) | BORROWINGS |
Borrowings are summarized as follows:
| Successor | ||||||||
| Year Ended December 31, |
||||||||
| 2014 | 2013 | |||||||
| Dollar Term Loan |
$ | 2,165.5 | $ | 2,282.8 | ||||
| Euro Term Loan |
481.0 | 547.7 | ||||||
| Dollar Senior Notes |
750.0 | 750.0 | ||||||
| Euro Senior Notes |
305.3 | 344.9 | ||||||
| Short-term borrowings |
12.2 | 18.2 | ||||||
| Other borrowings |
0.7 | — | ||||||
| Unamortized original issue discount |
(18.3 | ) | (22.7 | ) | ||||
|
|
|
|
|
|||||
| $ | 3,696.4 | $ | 3,920.9 | |||||
| Less: |
||||||||
| Short term borrowings |
$ | 12.2 | $ | 18.2 | ||||
| Current portion of long-term borrowings |
27.9 | 28.5 | ||||||
|
|
|
|
|
|||||
| Long-term debt |
$ | 3,656.3 | $ | 3,874.2 | ||||
|
|
|
|
|
|||||
| (a) | Senior Secured Credit Facilities, as amended |
On February 3, 2014, Axalta Coating Systems Dutch B B.V. (“Dutch B B.V.”), as “Dutch Borrower”, and its indirect wholly-owned subsidiary, Axalta Coating Systems U.S. Holdings Inc. (“Axalta US Holdings”), as “US Borrower”, executed the second amendment to the Senior Secured Credit Facilities (the “Amendment”). The Amendment (i) converted all of the outstanding Dollar Term Loans ($2,282.8 million) into a new class of term loans (the “New Dollar Term Loans”), and (ii) converted all of the outstanding Euro Term Loans (€397.0 million) into a new class of term loans (the “New Euro Term Loans”). The New Dollar Term Loans are subject to a floor of 1.00%, plus an applicable rate after the Amendment Effective Date. The applicable rate for such New Dollar Term Loans is 3.00% per annum for Eurocurrency Rate Loans as defined in the credit agreement governing the Senior Secured Credit
F-51
Table of Contents
Notes to Consolidated (Successor) and Combined (Predecessor)
Financial Statements
(In millions, unless otherwise noted)
Facilities and 2.00% per annum for Base Rate Loans as defined in the credit agreement governing the Senior Secured Credit Facilities. The applicable rate for both Eurocurrency Rate Loans as well as Base Rate Loans is subject to a further 25 basis point reduction if the Total Net Leverage Ratio as defined in the credit agreement governing the Senior Secured Credit Facilities is less than or equal to 4.50:1.00. The New Euro Term Loans are also subject to a floor of 1.00%, plus an applicable rate after the Amendment Effective Date. The applicable rate for such New Euro Term Loans is 3.25% per annum for Eurocurrency Rate Loans. New Euro Term Loans may not be Base Rate Loans. The applicable rate is subject to a further 25 basis point reduction if the Total Net Leverage Ratio is less than or equal to 4.50:1.00. During the third quarter 2014, our Total Net Leverage Ratio was confirmed to be less than 4.50:1.00. Concurrently, the applicable rates were changed to 2.75% for the New Dollar Term Loans and 3.00% for the New Euro Term Loans through December 31, 2014.
The Senior Secured Credit Facilities are secured by substantially all assets of Axalta Coating Systems Dutch A B. V. (“Dutch A B.V.”) and the guarantors. The Dollar Term Loan and Euro Term Loan mature on February 1, 2020 and the Revolving Credit Facility matures on February 1, 2018. Principal is paid quarterly on both the Dollar Term Loan and the Euro Term Loan based on 1% per annum of the original principal amount with the unpaid balance due at maturity.
Interest is payable quarterly on both the New Dollar Term Loan and the New Euro Term Loan. Prior to the Amendment, interest on the Dollar Term Loan was subject to a floor of 1.25% for Eurocurrency Rate Loans plus an applicable rate of 3.50%. For Base Rate Loans, the interest was subject to a floor of the greater of the federal funds rate plus 0.50%, the Prime Lending Rate, an Adjusted Eurocurrency Rate, or 2.25% plus an applicable rate of 2.50%. Interest on the Euro Term Loan, a Eurocurrency Loan, was subject to a floor of 1.25% plus an applicable rate of 4.00%.
Under the Senior Secured Credit Facilities, interest on any outstanding borrowings under the Revolving Credit Facility is subject to a floor of 1.00% for Eurocurrency Rate Loans plus an applicable rate of 3.50% (subject to an additional step-down to 3.25%). For Base Rate Loans, the interest is subject to a floor of the greater of the federal funds rate plus 0.50%, the Prime Lending Rate, an Adjusted Eurocurrency Rate, or 2.00% plus an applicable rate of 2.50% (subject to an additional step-down to 2.25%).
Under circumstances described in the Credit Agreement, the Company may increase available revolving or term facility borrowings up to $400.0 million plus an additional amount subject to the Company not exceeding a maximum first lien leverage ratio described in the Credit Agreement.
Any indebtedness under the Senior Secured Credit Facilities may be voluntarily prepaid in whole or in part, in minimum amounts, subject to the make-whole provisions set forth in the Credit Agreement. Such indebtedness is subject to mandatory prepayments amounting to the proceeds of asset sales over $25.0 million annually, proceeds from certain debt issuances not otherwise permitted under the Credit Agreement and 50% (subject to a step-down to 25.0% or 0% if the First Lien Leverage Ratio falls below 4.25:1 or 3.50:1, respectively) of Excess Cash Flow.
During the year ended December 31, 2014, we voluntarily repaid $100.0 million of the outstanding New Dollar Term Loan. Concurrent with this action, we recorded a pre-tax loss on extinguishment of $3.0 million, consisting of the write-off of $2.2 million and $0.8 million of unamortized deferred financing costs and original issue discounts, respectively.
We are subject to customary negative covenants as well as a financial covenant which is a maximum First Lien Leverage Ratio. This financial covenant is applicable only when greater than 25% of the Revolving Credit Facility (including letters of credit not cash collateralized to at least 103%) is outstanding at the end of the fiscal quarter.
F-52
Table of Contents
Notes to Consolidated (Successor) and Combined (Predecessor)
Financial Statements
(In millions, unless otherwise noted)
Deferred financing costs of $92.9 million and original issue discounts of $25.7 million were incurred at the inception of the Senior Secured Credit Facilities. These amounts are amortized as interest expense over the life of the Senior Secured Credit Facilities.
Amortization expense related to deferred financing costs, net for years ended December 31, 2014 and 2013 were $13.3 million and $11.7 million, respectively.
Amortization expense related to original issue discounts for the years ended December 31, 2014 and 2013 were $3.6 million and $3.0 million, respectively.
At December 31, 2014 and 2013 there were no borrowings under the Revolving Credit Facility. At December 31, 2014 and 2013, letters of credit issued under the Revolving Credit Facility totaled $15.5 million and $20.7 million, respectively, which reduced the availability under the Revolving Credit Facility. Availability under the Revolving Credit Facility was $384.5 million and $379.3 million at December 31, 2014 and 2013, respectively.
| (b) | Significant Terms of the Senior Notes |
On February 1, 2013, Dutch B B.V., as “Dutch Issuer”, and Axalta US Holdings, as “US Issuer”, (collectively the “Issuers”) issued $750.0 million aggregate principal amount of 7.375% senior unsecured notes due 2021 (the “Dollar Senior Notes”) and related guarantees thereof. Additionally, Dutch B B.V. issued €250.0 million aggregate principal amount of 5.750% senior secured notes due 2021 (the “Euro Senior Notes”) and related guarantees thereof. Cash fees related to the issuance of the Senior Notes were $33.1 million, are recorded within deferred financing costs, net and are amortized as interest expense over the life of the Notes. At December 31, 2014 and 2013, the remaining unamortized balances were $25.3 million and $29.4 million, respectively. The expense related to the amortization of the deferred financing costs for the Successor year ended December 31, 2014 and 2013, were $4.1 million and $3.7 million, respectively.
The Senior Notes are unconditionally guaranteed on a senior basis by certain of the Issuers’ subsidiaries.
The indentures governing the Senior Notes contain covenants that restrict the ability of the Issuers and their subsidiaries to, among other things, incur additional debt, make certain payments including payment of dividends or repurchase equity interest of the Issuers, make loans or acquisitions or capital contributions and certain investments, incur certain liens, sell assets, merge or consolidate or liquidate other entities, and enter into transactions with affiliates.
(i) Euro Senior Notes
The Euro Senior Notes were sold at par and are due February 1, 2021. The Euro Senior Notes bear interest at 5.750% payable semi-annually on February 1 and August 1. Cash fees related to the issuance of the Euro Senior Notes were $10.2 million, and are recorded within “Deferred financing costs, net” and are amortized into interest expense over the life of the Senior Notes. At December 31, 2014 and 2013, the remaining unamortized balances were $7.7 million and $9.0 million, respectively.
F-53
Table of Contents
Notes to Consolidated (Successor) and Combined (Predecessor)
Financial Statements
(In millions, unless otherwise noted)
On or after February 1, 2016, we have the option to redeem all or part of the Euro Senior Notes at the following redemption prices (expressed as percentages of principal amount):
| Period |
Euro Notes Percentage | |||
| 2016 |
104.313 | % | ||
| 2017 |
102.875 | % | ||
| 2018 |
101.438 | % | ||
| 2019 |
100.000 | % | ||
| 2020 and thereafter |
100.000 | % | ||
Notwithstanding the foregoing, at any time and from time to time prior to February 1, 2016, we may at our option redeem in the aggregate up to 40% of the original aggregate principal amount of the Euro Senior Notes with the net cash proceeds of one or more Equity Offerings (as defined in the indenture governing the Euro Senior Notes), at a redemption price of 105.750% plus accrued and unpaid interest, if any, to the redemption date.
In addition, we have the option to redeem up to 10% of the Euro Senior Notes during any 12-month period from issue date until February 1, 2016 at a redemption price of 103.0%, plus accrued and unpaid interest, if any, to the redemption date.
Upon the occurrence of certain events constituting a change of control, holders of the Euro Senior Notes have the right to require us to repurchase all or any part of the Euro Senior Notes at a purchase price equal to 101% of the principal amount plus accrued and unpaid interest, if any, to the repurchase date.
The indebtedness evidenced by the Euro Senior Notes and related guarantees is secured on a first-lien basis by the same assets that secure the obligations under the Senior Secured Credit Facilities, subject to permitted liens and applicable local law limitations, is senior in right of payment to all future subordinated indebtedness of the Issuers, is equal in right of payment to all existing and future senior indebtedness of the Issuers and is effectively senior to any unsecured indebtedness of the Issuers, including the Dollar Senior Notes, to the extent of the value securing the Euro Senior Notes.
(ii) Dollar Senior Notes
The Dollar Senior Notes were sold at par and are due May 1, 2021. The Dollar Senior Notes bear interest at 7.375% payable semi-annually on February 1 and August 1. Cash fees related to the issuance of the Dollar Senior Notes were $22.9 million, are recorded within “Deferred financing costs, net” and are amortized as interest expense over the life of the Senior Notes. At December 31, 2014 and 2013, the remaining unamortized balances were $17.6 million and $20.4 million, respectively.
On or after February 1, 2016, we have the option to redeem all or part of the Dollar Senior Notes at the following redemption prices (expressed as percentages of principal amount)
| Period |
Dollar Notes Percentage | |||
| 2016 |
105.531 | % | ||
| 2017 |
103.688 | % | ||
| 2018 |
101.844 | % | ||
| 2019 |
100.000 | % | ||
| 2020 and thereafter |
100.000 | % | ||
F-54
Table of Contents
Notes to Consolidated (Successor) and Combined (Predecessor)
Financial Statements
(In millions, unless otherwise noted)
Notwithstanding the foregoing, at any time and from time to time prior to February 1, 2016, we may at our option redeem in the aggregate up to 40% of the original aggregate principal amount of the Dollar Senior Notes with the net cash proceeds of one or more Equity Offerings (as defined in the indenture governing the Dollar Senior Notes), at a redemption price of 107.375% plus accrued and unpaid interest, if any, to the redemption date.
Upon the occurrence of certain events constituting a change of control, holders of the Dollar Senior Notes have the right to require us to repurchase all or any part of the Dollar Senior Notes at a purchase price equal to 101% of the principal amount plus accrued and unpaid interest, if any, to the repurchase date.
The indebtedness evidenced by the Dollar Senior Notes is senior unsecured indebtedness of the Issuers, is senior in right of payment to all future subordinated indebtedness of the Issuers and is equal in right of payment to all existing and future senior indebtedness of the Issuers. The Dollar Senior Notes are effectively subordinated to any secured indebtedness of the Issuers (including indebtedness of the Issuers outstanding under the Senior Secured Credit Facilities and the Euro Senior Notes) to the extent of the value of the assets securing such indebtedness.
| (c) | Short-term borrowings |
On September 12, 2013, we entered into short-term borrowings in the amount of $27.8 million to partially fund the acquisition of a real estate investment property which closed in October 2013. The short-term borrowings associated with this acquisition were paid in full upon reaching maturity during the three months ended September 30, 2014. Other miscellaneous short-term borrowings had outstanding balances of $12.2 million and $0.4 million at December 31, 2014 and 2013, respectively.
| (d) | Bridge financing commitment fees |
On August 30, 2012, we signed a debt commitment letter, which was subsequently amended and restated, that included a bridge facility comprised of $1,100.0 million of unsecured U.S. bridge loans and a $300.0 million of secured bridge loans (the “Bridge Facility”), which was to be utilized to partially fund the Acquisition in the event that permanent financing was not obtained. Drawings under the Bridge Facility were subject to certain conditions. Upon the issuance of the Senior Notes and the entry into the Senior Secured Credit Facilities, the commitments under the Bridge Facility terminated. Commitment fees related to the Bridge Facility of $21.0 million and associated fees of $4.0 million were expensed upon the termination of the Bridge Facility during the year ended December 31, 2013.
| (e) | Future repayments |
Below is a schedule of required future repayments of all borrowings outstanding at December 31, 2014.
| 2015 |
$ | 40.1 | ||
| 2016 |
27.9 | |||
| 2017 |
27.9 | |||
| 2018 |
28.6 | |||
| 2019 |
27.9 | |||
| Thereafter |
3,562.3 | |||
|
|
|
|||
| $ | 3,714.7 | |||
|
|
|
F-55
Table of Contents
Notes to Consolidated (Successor) and Combined (Predecessor)
Financial Statements
(In millions, unless otherwise noted)
| (23) | FAIR VALUE ACCOUNTING |
| (a) | Assets measured at fair value on a nonrecurring basis |
During the Successor years ended December 31, 2014 and December 31, 2013 we recorded impairment losses of $0.1 million and $3.2 million, respectively, associated with the abandonment of certain in process research and development projects acquired in the Acquisition. During the Predecessor period from January 1, 2013 through January 31, 2013 no assets were adjusted to their fair values on a nonrecurring basis. See Note 3 for further discussion of recording the fair values of the indefinite-lived in-process research and development intangible assets acquired in the Acquisition, and the subsequent testing of these assets for impairment.
| (b) | Fair value of financial instruments |
Available for sale securities—The fair values of available for sale securities at December 31, 2014 and 2013 were $4.5 million and $4.9 million, respectively. The fair value was based upon either Level 1 inputs when the securities are actively traded with quoted market prices or Level 2 when the securities are not frequently traded.
Long-term borrowings—The fair values of the Dollar Senior Notes and Euro Senior Notes at December 31, 2014 were $795.0 million and $320.5 million, respectively. The fair values at December 31, 2013 were $798.8 million and $362.1 million, respectively. The estimated fair values of these notes are based on recent trades, as reported by a third party pricing service. Due to the infrequency of trades of the Dollar Senior Notes and the Euro Senior Notes, these inputs are considered to be Level 2 inputs.
The fair values of the Dollar Term Loan and the Euro Term Loan at December 31, 2014 were $2,100.5 million and $478.0 million, respectively. The fair values at December 31, 2013 were $2,297.1 million and $552.5 million, respectively. The estimated fair values of the Dollar Term Loan and the Euro Term Loan are based on recent trades, as reported by a third party pricing service. Due to the infrequency of trades of the Dollar Term Loan and the Euro Term Loan, these inputs are considered to be Level 2 inputs.
| (24) | DERIVATIVE FINANCIAL INSTRUMENTS |
We selectively use derivative instruments to reduce market risk associated with changes in foreign currency exchange rates and interest rates. The use of derivatives is intended for hedging purposes only and we do not enter into derivative instruments for speculative purposes. A description of each type of derivative used to manage risk is included in the following paragraphs.
During the Successor year ended December 31, 2013, we entered into a foreign currency contract to hedge the variability of the US dollar equivalent of the original borrowings under the Euro Term Loan and the proceeds from the issuance of the Euro Senior Notes. Changes in the fair value of this instrument were recorded in current period earnings and were presented in Other expense, net as a component of Exchange (gains) losses. Losses related to the settlement of this contract recognized during the Successor year ended December 31, 2013 totaled $19.4 million. Cash flows resulting from the settlement of the derivative instrument on February 1, 2013 are reported as investing activities.
F-56
Table of Contents
Notes to Consolidated (Successor) and Combined (Predecessor)
Financial Statements
(In millions, unless otherwise noted)
During the Successor year ended December 31, 2013, we entered into five interest rate swaps with notional amounts totaling $1,173.0 million to hedge interest rate exposures related to variable rate borrowings under the Senior Secured Credit Facilities. The interest rate swaps are in place until September 29, 2017. The interest rate swaps qualify and are designated as effective cash flow hedges.
The following table presents the location and fair values using Level 2 inputs of derivative instruments that qualify and have been designated as cash flow hedges included in our consolidated and combined balance sheet:
| Successor | ||||||||
| Year Ended December 31, | ||||||||
| 2014 | 2013 | |||||||
| Foreign currency contracts |
$ | — | $ | — | ||||
| Other assets: |
||||||||
| Interest rate swaps |
5.9 | 10.5 | ||||||
|
|
|
|
|
|||||
| Total assets |
$ | 5.9 | $ | 10.5 | ||||
|
|
|
|
|
|||||
| Other liabilities: |
||||||||
| Interest rate swaps |
$ | 1.5 | $ | 1.2 | ||||
|
|
|
|
|
|||||
| Total liabilities |
$ | 1.5 | $ | 1.2 | ||||
|
|
|
|
|
|||||
The following table presents the location and fair values using Level 2 inputs of derivative instruments that have not been designated as hedges included in our consolidated and combined balance sheet:
| Successor | ||||||||
| Year Ended December 31, | ||||||||
| 2014 | 2013 | |||||||
| Foreign currency contracts |
$ | — | $ | — | ||||
| Other assets: |
||||||||
| Interest rate cap |
0.1 | 3.4 | ||||||
|
|
|
|
|
|||||
| Total assets |
$ | 0.1 | $ | 3.4 | ||||
|
|
|
|
|
|||||
| Other liabilities: |
||||||||
| Foreign currency contracts |
$ | — | $ | — | ||||
|
|
|
|
|
|||||
| Total liabilities |
$ | — | $ | — | ||||
|
|
|
|
|
|||||
For derivative instruments that qualify and are designated as cash flow hedges, the effective portion of the gain or loss on the derivative is reported as a component of “Accumulated other comprehensive loss” and reclassified into earnings in the same period or periods during which the hedged transaction affects earnings. Gains and losses on the derivative representing either hedge ineffectiveness or hedge components excluded from the assessment of effectiveness are recognized in current earnings.
F-57
Table of Contents
Notes to Consolidated (Successor) and Combined (Predecessor)
Financial Statements
(In millions, unless otherwise noted)
The following table sets forth the locations and amounts recognized during the Successor years ended December 31, 2014 and 2013, respectively, for these cash flow hedges.
| Derivatives in Cash Flow Hedging Relationships in 2014: |
Amount of (Gain) Loss Recognized in OCI on Derivatives (Effective Portion) |
Location of (Gain) Loss Reclassified from Accumulated OCI into Income (Effective Portion) |
Amount of (Gain) Loss Reclassified from Accumulated OCI to Income (Effective Portion) |
Location of (Gains) Losses Recognized in Income on Derivatives (Ineffective Portion) |
Amount
of (Gain) Loss Recognized in Income on Derivatives (Ineffective Portion) |
|||||||||||
| Interest rate contracts |
$ | 4.6 | Interest expense, net | $ | 6.5 | Interest expense, net | $ | 0.3 | ||||||||
| Derivatives in Cash Flow Hedging Relationships in 2013: |
Amount of (Gain) Loss Recognized in OCI on Derivatives (Effective Portion) |
Location of (Gain) Loss Reclassified from Accumulated OCI into Income (Effective Portion) |
Amount of (Gain) Loss Reclassified from Accumulated OCI to Income (Effective Portion) |
Location of (Gains) Losses Recognized in Income on Derivatives (Ineffective Portion) |
Amount
of (Gain) Loss Recognized in Income on Derivatives (Ineffective Portion) |
|||||||||||
| Interest rate contracts |
$ | (5.0 | ) | Interest expense, net | $ | 4.4 | Interest expense, net | $ | (4.3 | ) | ||||||
Also during the Successor year ended December 31, 2013, we purchased a €300.0 million 1.5% interest rate cap on our Euro Term Loan that is in place until September 29, 2017. We paid a premium of $3.1 million for the interest rate cap. The interest rate cap was not designated as a hedge and the changes in the fair value of the derivative instrument are recorded in current period earnings and are included in interest expense.
DPC, through DuPont, entered into contractual arrangements (derivatives) to reduce its exposure to foreign currency risk. The foreign currency derivative program was utilized for financial risk management and consisted of forward contracts. The derivative instruments were not designated as hedging instruments. Changes in the fair value of the derivative instruments were recorded in current period earnings and were presented in Other expense, net as a component of exchange (gains) losses.
Fair value gains and losses of derivative contracts, as determined using Level 2 inputs, that do not qualify for hedge accounting treatment are recorded in income as follows:
| Successor | Predecessor | |||||||||||||||||||
| Derivatives Not Designated as ASC 815 |
Location of (Gain) Loss Recognized in Income on Derivatives |
Year Ended December 31, 2014 |
Year Ended December 31, 2013 |
Period from January 1, 2013 through January 31, 2013 |
Year Ended December 31, 2012 |
|||||||||||||||
| Foreign currency forward contract |
Other expense, net as a component of Exchange (gains) losses | $ | 1.4 | $ | 20.9 | $ | 2.0 | $ | 3.9 | |||||||||||
| Interest rate cap |
Interest expense, net | 3.4 | (0.3 | ) | — | — | ||||||||||||||
|
|
|
|
|
|
|
|
|
|
||||||||||||
| $ | 4.8 | $ | 20.6 | $ | 2.0 | $ | 3.9 | |||||||||||||
|
|
|
|
|
|
|
|
|
|||||||||||||
| (25) | SEGMENTS |
The Company identifies an operating segment as a component: (i) that engages in business activities from which it may earn revenues and incur expenses; (ii) whose operating results are regularly reviewed by the Chief Operating Decision Maker (CODM) to make decisions about resources to be allocated to the segment and assess its performance; and (iii) that has available discrete financial information.
F-58
Table of Contents
Notes to Consolidated (Successor) and Combined (Predecessor)
Financial Statements
(In millions, unless otherwise noted)
We have two operating segments: Performance Coatings and Transportation Coatings. The CODM reviews financial information at the operating segment level to allocate resources and to assess the operating results and financial performance for each operating segment. Our CODM is identified as the Chief Executive Officer because he has final authority over performance assessment and resource allocation decisions. Our segments are based on the type and concentration of customers served, service requirements, methods of distribution and major product lines.
Through our Performance Coatings segment we provide high-quality liquid and powder coatings solutions to a fragmented and local customer base. We are one of only a few suppliers with the technology to provide precise color matching and highly durable coatings systems. The end-markets within this segment are refinish and industrial.
Through our Transportation Coatings segment we provide advanced coating technologies to OEMs of light and commercial vehicles. These increasingly global customers require a high level of technical support coupled with cost-effective, environmentally responsible coatings systems that can be applied with a high degree of precision, consistency and speed.
Our business serves four end-markets globally as follows:
| Successor | Predecessor | |||||||||||||||||
| Year Ended December 31, |
January 1 through January 31, |
Year Ended December 31, |
||||||||||||||||
| 2014 | 2013 | 2013 | 2012 | |||||||||||||||
| Performance Coatings |
||||||||||||||||||
| Refinish |
$ | 1,850.8 | $ | 1,670.0 | $ | 129.4 | $ | 1,759.3 | ||||||||||
| Industrial |
734.2 | 655.3 | 57.4 | 720.2 | ||||||||||||||
|
|
|
|
|
|
|
|
|
|||||||||||
| Total Net sales Performance Coatings |
2,585.0 | 2,325.3 | 186.8 | 2,479.5 | ||||||||||||||
| Transportation Coatings |
||||||||||||||||||
| Light Vehicle |
1,384.5 | 1,291.5 | 111.6 | 1,390.6 | ||||||||||||||
| Commercial Vehicle |
392.2 | 334.3 | 27.8 | 349.3 | ||||||||||||||
|
|
|
|
|
|
|
|
|
|||||||||||
| Total Net sales Transportation Coatings |
1,776.7 | 1,625.8 | 139.4 | 1,739.9 | ||||||||||||||
|
|
|
|
|
|
|
|
|
|||||||||||
| Total Net sales |
$ | 4,361.7 | $ | 3,951.1 | $ | 326.2 | $ | 4,219.4 | ||||||||||
|
|
|
|
|
|
|
|
|
|||||||||||
Segment information for the Predecessor period has been recast to conform to the Successor segment presentation.
Asset information is not reviewed or included with our internal management reporting. Therefore, the Company has not disclosed asset information for each reportable segment.
| Successor | ||||||||||||
| Performance Coatings |
Transportation Coatings |
Total | ||||||||||
| For the Year ended December 31, 2014 |
||||||||||||
| Net sales(1) |
$ | 2,585.0 | $ | 1,776.7 | $ | 4,361.7 | ||||||
| Equity in earnings in unconsolidated affiliates |
(1.2 | ) | (0.2 | ) | (1.4 | ) | ||||||
| Adjusted EBITDA(2) |
547.6 | 292.9 | 840.5 | |||||||||
| Investment in unconsolidated affiliates |
7.2 | 7.1 | 14.3 | |||||||||
F-59
Table of Contents
Notes to Consolidated (Successor) and Combined (Predecessor)
Financial Statements
(In millions, unless otherwise noted)
| Successor | ||||||||||||
| Performance Coatings |
Transportation Coatings |
Total | ||||||||||
| For the Year ended December 31, 2013 |
||||||||||||
| Net sales(1) |
$ | 2,325.3 | $ | 1,625.8 | $ | 3,951.1 | ||||||
| Equity in earnings in unconsolidated affiliates |
1.8 | 0.3 | 2.1 | |||||||||
| Adjusted EBITDA(2) |
500.2 | 198.8 | 699.0 | |||||||||
| Investment in unconsolidated affiliates |
7.7 | 8.1 | 15.8 | |||||||||
| Predecessor | ||||||||||||
| Performance Coatings |
Transportation Coatings |
Total | ||||||||||
| January 1 through January 31, 2013 |
||||||||||||
| Net sales(1) |
$ | 186.8 | $ | 139.4 | $ | 326.2 | ||||||
| Equity in earnings (losses) in unconsolidated affiliates |
— | (0.3 | ) | (0.3 | ) | |||||||
| Adjusted EBITDA(2) |
15.0 | 17.7 | 32.7 | |||||||||
| Investment in unconsolidated affiliates |
2.0 | 6.7 | 8.7 | |||||||||
| Predecessor | ||||||||||||
| Performance Coatings |
Transportation Coatings |
Total | ||||||||||
| For the Year ended December 31, 2012 |
||||||||||||
| Net sales(1) |
$ | 2,479.5 | $ | 1,739.9 | $ | 4,219.4 | ||||||
| Equity in earnings in unconsolidated affiliates |
— | 0.6 | 0.6 | |||||||||
| Adjusted EBITDA(2) |
426.0 | 151.6 | 577.6 | |||||||||
| Investment in unconsolidated affiliates |
0.8 | 7.1 | 7.9 | |||||||||
| (1) | The Company has no intercompany sales. |
F-60
Table of Contents
Notes to Consolidated (Successor) and Combined (Predecessor)
Financial Statements
(In millions, unless otherwise noted)
| (2) | The primary measure of segment operating performance is Adjusted EBITDA, which is defined as net income (loss) before interest, taxes, depreciation and amortization and other unusual items impacting operating results. Adjusted EBITDA is a key metric that is used by management to evaluate business performance in comparison to budgets, forecasts, and prior year financial results, providing a measure that management believes reflects the Company’s core operating performance. Reconciliation of Adjusted EBITDA to income (loss) before income taxes follows: |
| Successor | Predecessor | |||||||||||||||||||||
| Year Ended December 31, |
August 24 through December 31, |
January 1 through January 31, |
Year ended December 31, |
|||||||||||||||||||
| 2014 | 2013 | 2012 | 2013 | 2012 | ||||||||||||||||||
| Adjusted EBITDA |
$ | 840.5 | $ | 699.0 | $ | — | $ | 32.7 | $ | 577.6 | ||||||||||||
| Inventory step-up(a) |
— | (103.7 | ) | — | — | — | ||||||||||||||||
| Merger and acquisition related costs(b) |
— | (28.1 | ) | (29.0 | ) | — | — | |||||||||||||||
| Financing fees(c) |
(6.1 | ) | (25.0 | ) | — | — | — | |||||||||||||||
| Foreign exchange remeasurement losses(d) |
(81.2 | ) | (48.9 | ) | — | (4.5 | ) | (17.7 | ) | |||||||||||||
| Long-term employee benefit plan adjustments(e) |
0.6 | (9.5 | ) | — | (2.3 | ) | (36.9 | ) | ||||||||||||||
| Termination benefits and other employee related costs(f) |
(18.4 | ) | (147.5 | ) | — | (0.3 | ) | (8.6 | ) | |||||||||||||
| Consulting and advisory fees(g) |
(36.3 | ) | (54.7 | ) | — | — | — | |||||||||||||||
| Transition-related costs(h) |
(101.8 | ) | (29.3 | ) | — | — | — | |||||||||||||||
| IPO-related costs(i) |
(22.3 | ) | — | — | — | — | ||||||||||||||||
| Other adjustments(j) |
(10.8 | ) | (2.3 | ) | — | (0.1 | ) | (12.6 | ) | |||||||||||||
| Dividends in respect of noncontrolling interest(k) |
2.2 | 5.2 | — | — | 1.9 | |||||||||||||||||
| Management fee expense(l) |
(3.2 | ) | (3.1 | ) | — | — | — | |||||||||||||||
|
|
|
|
|
|
|
|
|
|
|
|||||||||||||
| EBITDA |
563.2 | 252.1 | (29.0 | ) | 25.5 | 503.7 | ||||||||||||||||
| Interest expense, net |
217.7 | 215.1 | — | — | — | |||||||||||||||||
| Depreciation and amortization |
308.7 | 300.7 | — | 9.9 | 110.7 | |||||||||||||||||
|
|
|
|
|
|
|
|
|
|
|
|||||||||||||
| Income before income taxes |
$ | 36.8 | $ | (263.7 | ) | $ | (29.0 | ) | $ | 15.6 | $ | 393.0 | ||||||||||
|
|
|
|
|
|
|
|
|
|
|
|||||||||||||
| (a) | During the Successor year ended December 31, 2013, we recorded a non-cash fair value adjustment associated with our acquisition accounting for inventories. These amounts increased cost of goods sold by $103.7 million. |
| (b) | In connection with the Acquisition, we incurred $28.1 million and $29.0 million of merger and acquisition costs during the Successor years ended December 31, 2013 and December 31, 2012, respectively. These costs consisted primarily of investment banking, legal and other professional advisory services costs. |
| (c) | On August 30, 2012, we signed a debt commitment letter, which included the Bridge Facility. Upon the issuance of the Senior Notes and the entry into the Senior Secured Credit Facilities, the commitments under the Bridge Facility terminated. Commitment fees related to the Bridge Facility of $21.0 million and associated fees of $4.0 million were expensed upon the payment and termination of the Bridge Facility. In connection with the amendment to the Senior Secured Credit Facilities in February 2014, we recognized $3.1 million of costs during the Successor year ended December 31, 2014. In addition to the credit facility amendment, we also incurred a $3.0 million loss on extinguishment of debt recognized during the Successor year ended December 31, 2014, which resulted directly from the pro-rata write off of unamortized deferred financing costs and original issue discounts associated with the pay-down of $100.0 million of principal on the New Dollar Term Loan (discussed further at Note 22 to the consolidated and combined financial statements. |
F-61
Table of Contents
Notes to Consolidated (Successor) and Combined (Predecessor)
Financial Statements
(In millions, unless otherwise noted)
| (d) | Eliminates foreign exchange gains and losses resulting from the remeasurement of assets and liabilities denominated in foreign currencies, including a $19.4 million loss related to the acquisition date settlement of a foreign currency contract used to hedge the variability of Euro-based financing. |
| (e) | For the Successor years ended December 31, 2014 and 2013, eliminates the non-service cost components of employee benefit costs. Additionally, we deducted a pension curtailment gain of $7.3 million recorded during the Successor year ended December 31, 2014. For the Predecessor period January 1, 2013 through January 31, 2013 and the Predecessor year ended December 31, 2012 eliminates (1) all U.S. pension and other long-term employee benefit costs that were not assumed as part of the Acquisition and (2) the non-service cost component of the pension and other long-term employee benefit costs for the foreign pension plans that were assumed as part of the Acquisition. |
| (f) | Represents expenses primarily related to employee termination benefits, including our initiative to improve the overall cost structure within the European region, and other employee-related costs. Termination benefits include the costs associated with our headcount initiatives for establishment of new roles and elimination of old roles and other costs associated with cost saving opportunities that were related to our transition to a standalone entity. |
| (g) | Represents fees paid to consultants, advisors, and other third-party professional organizations for professional services rendered in conjunction with the transition from DuPont to a standalone entity. |
| (h) | Represents charges associated with the transition from DuPont to a standalone entity, including branding and marketing, information technology related costs, and facility transition costs. |
| (i) | Represents costs associated with the IPO, including a $13.4 million pre-tax charge associated with the termination of the management agreement with Carlyle Investment Management, L.L.C., an affiliate of Carlyle, upon the completion of the IPO. |
| (j) | Represent costs for certain unusual or non-operational losses and the non-cash impact of natural gas and currency hedge losses allocated to DPC by DuPont, stock-based compensation, asset impairments, equity investee dividends, indemnity income associated with the Transaction, and loss (gain) on sale and disposal of property, plant and equipment. |
| (k) | Represents the payment of dividends to our joint venture partners by our consolidated entities that are not wholly owned. |
| (l) | Pursuant to Axalta’s management agreement with Carlyle Investment Management, L.L.C., for management and financial advisory services and oversight provided to Axalta and its subsidiaries, Axalta was required to pay an annual management fee of $3.0 million and out-of-pocket expenses. |
Segment information for the Predecessor periods has been recast to conform to the Successor segment presentation.
Geographic Area Information:
The information within the following tables provides disaggregated information related to our net sales and long-lived assets.
F-62
Table of Contents
Notes to Consolidated (Successor) and Combined (Predecessor)
Financial Statements
(In millions, unless otherwise noted)
Net sales by region were as follows:
| Successor |
|
Predecessor | ||||||||||||||||||||
| Year Ended December 31, |
Year Ended December 31, |
Period from August 24 through December 31, |
Period from January 1 through January 31, |
Year Ended December 31, |
||||||||||||||||||
| 2014 | 2013 | 2012 | 2013 | 2012 | ||||||||||||||||||
| North America |
$ | 1,307.8 | $ | 1,165.4 | $ | — | $ | 81.6 | $ | 1,238.6 | ||||||||||||
| EMEA |
1,672.0 | 1,540.4 | — | 141.0 | 1,675.4 | |||||||||||||||||
| Asia Pacific |
715.0 | 593.7 | — | 51.7 | 595.0 | |||||||||||||||||
| Latin America |
666.9 | 651.6 | — | 51.9 | 710.4 | |||||||||||||||||
|
|
|
|
|
|
|
|
|
|
|
|||||||||||||
| Total(a) |
$ | 4,361.7 | $ | 3,951.1 | $ | — | $ | 326.2 | $ | 4,219.4 | ||||||||||||
|
|
|
|
|
|
|
|
|
|
|
|||||||||||||
Net long-lived assets by region were as follows:
| Successor | ||||||||
| December 31, 2014 |
December 31, 2013 |
|||||||
| North America |
$ | 481.4 | $ | 483.8 | ||||
| EMEA |
542.0 | 623.5 | ||||||
| Asia Pacific |
234.3 | 218.1 | ||||||
| Latin America |
256.4 | 297.2 | ||||||
|
|
|
|
|
|||||
| Total(b) |
$ | 1,514.1 | $ | 1,622.6 | ||||
|
|
|
|
|
|||||
| (a) | Net Sales are attributed to countries based on location of the customer. Sales to external customers in China represented approximately 11% and 10% of the total for the Successor years ended December 31, 2014 and 2013, respectively, as well as 11% for the Predecessor period ended January 31, 2013 and 8% in the Predecessor year ended December 31, 2012. Sales to external customers in Germany represented approximately 10% and 10% of the total for the Successor years ended December 31, 2014 and 2013, respectively, as well as 11% for the Predecessor period ended January 31, 2013 and 16% in the Predecessor year ended December 31, 2012. Canada, which is included in the North America region, represents approximately 3% of total sales in all periods. |
| (b) | Long-lived assets consist of property, plant and equipment, net. Germany long-lived assets amounted to approximately $302.8 million and $348.1 million in the years ended December 31, 2014 and 2013, respectively. China long-lived assets amounted to $189.4 million and $167.5 million in the years ended December 31, 2014 and 2013, respectively. |
F-63
Table of Contents
Notes to Consolidated (Successor) and Combined (Predecessor)
Financial Statements
(In millions, unless otherwise noted)
| (26) | ACCUMULATED OTHER COMPREHENSIVE INCOME (LOSS) |
| Unrealized Currency Translation Adjustments |
Pension and Other Long-term Employee Benefit Adjustments |
Unrealized Gain (Loss) on Securities |
Unrealized Gain (Losses) on Derivatives |
Accumulated Other Comprehensive Income |
||||||||||||||||
| Successor Balance, December 31, 2013 |
$ | 24.3 | $ | 7.5 | $ | (0.9 | ) | $ | 3.1 | $ | 34.0 | |||||||||
| Current year deferrals to AOCI |
(96.4 | ) | (29.7 | ) | 0.7 | 3.6 | (121.8 | ) | ||||||||||||
| Reclassifications from AOCI to Net income |
— | (9.0 | ) | — | (6.5 | ) | (15.5 | ) | ||||||||||||
|
|
|
|
|
|
|
|
|
|
|
|||||||||||
| Net Change |
(96.4 | ) | (38.7 | ) | 0.7 | (2.9 | ) | (137.3 | ) | |||||||||||
|
|
|
|
|
|
|
|
|
|
|
|||||||||||
| Successor Balance, December 31, 2014 |
$ | (72.1 | ) | $ | (31.2 | ) | $ | (0.2 | ) | $ | 0.2 | $ | (103.3 | ) | ||||||
|
|
|
|
|
|
|
|
|
|
|
|||||||||||
Included within reclassifications from AOCI to Net income for the Successor year ended December 31, 2014 was $7.3 million of curtailment gains related to an amendment to one of our pension plans.
The income tax related to the changes in pension and other long-term employee benefits for the year ended December 31, 2014 was $16.9 million. The cumulative income tax impact related to the adjustments for pension and other long-term employee benefits at December 31, 2014 was a benefit of $13.4 million compared to the cumulative income tax expense at December 31, 2013 of $3.5 million. The income tax related to the change in the unrealized gain on derivatives for the year ended December 31, 2014 was $1.7 million. The cumulative income tax expense related to the adjustments for unrealized gain on derivatives at December 31, 2014 and 2013 were $0.2 million and $1.9 million, respectively.
| Unrealized Currency Translation Adjustments |
Pension and Other Long-term Employee Benefit Adjustments |
Unrealized Loss on Securities |
Unrealized Gain (Loss) on Derivatives |
Accumulated Other Comprehensive Income |
||||||||||||||||
| Successor Balance, December 31, 2012 |
$ | — | $ | — | $ | — | $ | — | $ | — | ||||||||||
| Current year deferrals to AOCI |
24.3 | 7.5 | (0.9 | ) | 7.5 | 38.4 | ||||||||||||||
| Reclassifications from AOCI to Net income |
— | — | — | (4.4 | ) | (4.4 | ) | |||||||||||||
|
|
|
|
|
|
|
|
|
|
|
|||||||||||
| Net Change |
24.3 | 7.5 | (0.9 | ) | 3.1 | 34.0 | ||||||||||||||
|
|
|
|
|
|
|
|
|
|
|
|||||||||||
| Successor Balance, December 31, 2013 |
$ | 24.3 | $ | 7.5 | $ | (0.9 | ) | $ | 3.1 | $ | 34.0 | |||||||||
|
|
|
|
|
|
|
|
|
|
|
|||||||||||
F-64
Table of Contents
Notes to Consolidated (Successor) and Combined (Predecessor)
Financial Statements
(In millions, unless otherwise noted)
The income tax related to the changes in pension and other long-term employee benefits for the Successor year ended December 31, 2013 was $3.5 million. The cumulative income tax expense related to the adjustment for pension and other long-term employee benefits at December 31, 2013 was $3.5 million. The income tax related to the change in the unrealized gain on derivatives for the Successor year ended December 31, 2013 was $1.9 million. The cumulative income tax expense related to the adjustment for unrealized gain on derivatives at December 31, 2013 was $1.9 million.
| Unrealized Currency Translation Adjustments |
Pension and Other Long-term Employee Benefit Adjustments |
Unrealized loss on securities |
Unrealized Gain (Loss) on Derivatives |
Accumulated Other Comprehensive Income |
||||||||||||||||
| Predecessor Balance, December 31, 2012 |
$ | — | $ | (142.3 | ) | $ | 1.4 | $ | — | $ | (140.9 | ) | ||||||||
| Current year deferrals to AOCI |
— | 0.7 | 0.2 | — | 0.9 | |||||||||||||||
| Reclassifications from AOCI to Net income |
— | — | — | — | — | |||||||||||||||
|
|
|
|
|
|
|
|
|
|
|
|||||||||||
| Net Change |
— | 0.7 | 0.2 | — | 0.9 | |||||||||||||||
|
|
|
|
|
|
|
|
|
|
|
|||||||||||
| Predecessor Balance, January 31, 2013 |
$ | — | $ | (141.6 | ) | $ | 1.6 | $ | — | $ | (140.0 | ) | ||||||||
|
|
|
|
|
|
|
|
|
|
|
|||||||||||
The income tax related to the changes in pension and other long-term employee benefits for the Predecessor one month ended January 31, 2013 was $0.4 million. The cumulative income tax benefit related to the adjustment for pension and other long-term employee benefits at January 31, 2013 was $76.3 million. The income tax related to the change in the unrealized gain on derivatives for the Predecessor one month ended January 31, 2013 was $0.0 million. The cumulative income tax expense related to the adjustment for unrealized gain on derivatives at January 31, 2013 was $0.0 million. The income tax related to the change in the unrealized loss on securities for the Predecessor one month ended January 31, 2013 was $0.0 million. The cumulative income tax expense related to the adjustment for unrealized loss on securities at January 31, 2013 was $0.9 million.
| (27) | QUARTERLY FINANCIAL INFORMATION (UNAUDITED) |
The following is a summary of the quarterly results of operations for the Successor years ended December 31, 2014 and 2013, respectively (in millions, except per share data):
| 2014 |
March 31 | June 30(b) | September 30(b) | December 31(c) | Full Year | |||||||||||||||
| Total revenue |
$ | 1,054.4 | $ | 1,134.3 | $ | 1,115.8 | $ | 1,087.0 | $ | 4,391.5 | ||||||||||
| Cost of goods sold |
703.5 | 742.5 | 728.1 | 723.1 | 2,897.2 | |||||||||||||||
| Net income (loss) |
(3.7 | ) | 55.8 | (18.3 | ) | 0.9 | 34.7 | |||||||||||||
| Net income (loss) attributable to controlling interests |
(4.3 | ) | 53.8 | (19.9 | ) | (2.2 | ) | 27.4 | ||||||||||||
| Basic net income (loss) per share |
(0.02 | ) | 0.23 | (0.09 | ) | (0.01 | ) | 0.12 | ||||||||||||
| Diluted net income (loss) per share |
(0.02 | ) | 0.23 | (0.09 | ) | (0.01 | ) | 0.12 | ||||||||||||
F-65
Table of Contents
Notes to Consolidated (Successor) and Combined (Predecessor)
Financial Statements
(In millions, unless otherwise noted)
| 2013 |
March 31(a) | June 30(a) | September 30 | December 31 | Full Year | |||||||||||||||
| Total revenue |
$ | 675.1 | $ | 1,122.2 | $ | 1,082.8 | $ | 1,106.7 | $ | 3,986.8 | ||||||||||
| Cost of goods sold |
539.1 | 788.5 | 739.1 | 706.1 | 2,772.8 | |||||||||||||||
| Net income (loss) |
(156.5 | ) | (21.8 | ) | 6.4 | (47.0 | ) | (218.9 | ) | |||||||||||
| Net income (loss) attributable to controlling interests |
(157.8 | ) | (22.8 | ) | 5.0 | (49.3 | ) | (224.9 | ) | |||||||||||
| Basic net income (loss) per share |
(0.67 | ) | (0.10 | ) | 0.02 | (0.22 | ) | (0.97 | ) | |||||||||||
| Diluted net income (loss) per share |
(0.67 | ) | (0.10 | ) | 0.02 | (0.22 | ) | (0.97 | ) | |||||||||||
| (a) | The Company recorded $72.6 million and $31.1 million of non-cash inventory adjustments associated with the fair value adjustment associated with our acquisition during the three months ended March 31, 2013 and June 30, 2013, respectively. |
| (b) | The Company recorded gains of $7.7 million and $7.3 million related to amendments to benefit plans during the three months ended June 30, 2014 and September 30, 2014, respectively. |
| (c) | During the three-months ended December 31, 2014, the Company recorded a $13.4 million pre-tax charge associated with the termination of the management agreement with Carlyle Investment Management, L.L.C., upon the completion of the IPO and a cumulative net benefit of $3.8 million ($0.4 million for the full year) associated with the correction of an error originating in prior periods. The Company concluded the error was not material to the current or previously reported periods. |
Reclassification and revisions
During the quarter ended September 30, 2014, the Company identified errors in the determination of the effective interest rate amortization for the Deferred Financing Costs and Original Issue Discounts that were incurred in 2013. The correction of these items impacted the consolidated balance sheet at December 31, 2013, and the consolidated statements of operations, and statements of comprehensive income (loss) for the year ended December 31, 2013. The Company assessed the applicable guidance and concluded that these errors were not material to the Company’s consolidated financial statements for the aforementioned prior periods; however, the Company did conclude that correcting these prior misstatements would be significant to the three and nine-month periods ended September 30, 2014 consolidated statement of operations. The correction had an impact of $3.0 million, $5.1 million, $1.4 million and $2.0 million on Net income (loss) and Net income (loss) attributable to controlling interests in the first, second, third and fourth quarter of 2013, respectively. The correction had an impact of $2.8 million and $2.5 million on Net income (loss) and Net income (loss) attributable to controlling interests in the first and second quarters of 2014, respectively.
F-66
Table of Contents
SCHEDULE II - VALUATION AND QUALIFYING ACCOUNTS
Allowance for Doubtful Accounts for the Successor and Predecessor years ended December 31, 2014 and 2013 and the Predecessor period from January 1, 2013 to January 31, 2013:
| (in millions) | Balance at Beginning of Year |
Charged to Expenses |
Deductions(1) | Balance at End of Year |
||||||||||||
| Successor |
||||||||||||||||
| 2014 |
$ | 6.5 | $ | 5.1 | $ | 1.7 | $ | 9.9 | ||||||||
| 2013 |
— | 5.4 | (1.1 | ) | 6.5 | |||||||||||
| Predecessor |
||||||||||||||||
| January 1 through January 31, 2013 |
$ | 29.6 | $ | 0.2 | $ | (1.1 | ) | $ | 30.9 | |||||||
| 2012 |
31.4 | 5.0 | 6.8 | 29.6 | ||||||||||||
| (1) | Deductions include uncollectible accounts written off and foreign currency translation impact. |
F-67
Table of Contents
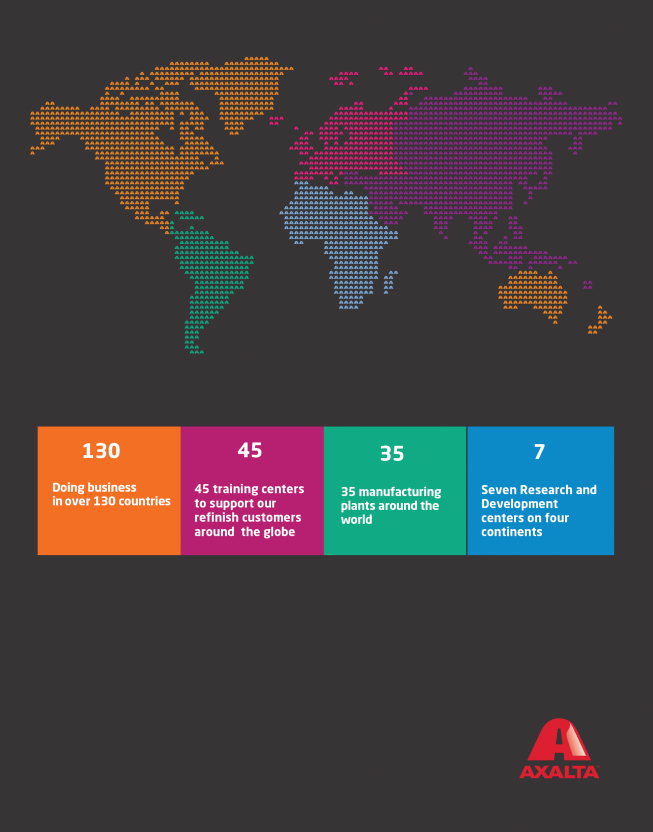
Table of Contents
35,000,000 Shares
Axalta Coating Systems Ltd.
Common Shares
PROSPECTUS
| Citigroup | Goldman, Sachs & Co. | Deutsche Bank Securities | J.P. Morgan | |||
| BofA Merrill Lynch | Barclays | Jefferies | ||
| Morgan Stanley | UBS Investment Bank | BB&T Capital Markets | Nomura | SMBC Nikko | ||||
, 2015
Table of Contents
PART II
INFORMATION NOT REQUIRED IN PROSPECTUS
| Item 13. | Other Expenses of Issuance and Distribution. |
The actual and estimated expenses in connection with this offering, all of which will be borne by us, are as follows:
| SEC Registration Fee |
$ | 128,993 | ||
| FINRA Filing Fee |
167,014 | |||
| Printing and Engraving Expense |
400,000 | |||
| Legal Fees |
500,000 | |||
| Accounting Fees |
300,000 | |||
| Transfer Agent Fee |
8,000 | |||
| Miscellaneous |
5,993 | |||
|
|
|
|||
| Total |
$ | 1,510,000 | ||
|
|
|
| Item 14. | Indemnification of Directors and Officers |
Section 98 of the Companies Act provides generally that a Bermuda company may indemnify its directors, officers and auditors against any liability which by virtue of any rule of law would otherwise be imposed on them in respect of any negligence, default, breach of duty or breach of trust, except in cases where such liability arises from fraud or dishonesty of which such director, officer or auditor may be guilty in relation to the company. Section 98 further provides that a Bermuda company may indemnify its directors, officers and auditors against any liability incurred by them in defending any proceedings, whether civil or criminal, in which judgment is awarded in their favor or in which they are acquitted or granted relief by the Supreme Court of Bermuda pursuant to section 281 of the Companies Act.
We have adopted provisions in our bye-laws that provide that we shall indemnify our officers and directors in respect of their actions and omissions, except in respect of their fraud or dishonesty. Our bye-laws provide that the shareholders waive all claims or rights of action that they might have, individually or in right of the company, against any of the company’s directors or officers for any act or failure to act in the performance of such director’s or officer’s duties, except in respect of any fraud or dishonesty of such director or officer. Section 98A of the Companies Act permits us to purchase and maintain insurance for the benefit of any officer or director in respect of any loss or liability attaching to him in respect of any negligence, default, breach of duty or breach of trust, whether or not we may otherwise indemnify such officer or director. We have purchased and maintain a directors’ and officers’ liability policy for such a purpose.
| Item 15. | Recent Sales of Unregistered Securities. |
Since August 24, 2012, we have granted to our officers and employees options to purchase an aggregate of 17,143,043 of our common shares with per share exercise prices equal to $5.92, $7.21, $8.88 and $11.84 under our equity incentive plan, which we refer to as the existing equity incentive plan.
Since August 24, 2012, certain of our officers and employees have exercised options to purchase a total of 363,248 of our common shares under our existing equity incentive plan or our predecessor equity incentive plan for an aggregate purchase price of approximately $3.0 million. Since August 24, 2012, certain of our officers and directors have purchased an aggregate of 1,604,382 of our common shares at an aggregate purchase price of approximately $10 million.
II-1
Table of Contents
We registered the common shares that would be issuable upon the exercise of such options (including in accordance with the anti-dilution provisions of the existing equity incentive plan) on Form S-8, which was filed with the Securities and Exchange Commission on November 14, 2014.
Unless otherwise stated, the sales of the above securities were deemed to be exempt from registration under the Securities Act in reliance upon Section 4(2) of the Securities Act or Regulation D promulgated thereunder, or Rule 701 promulgated under Section 3(b) of the Securities Act as transactions by an issuer not involving any public offering or pursuant to benefit plans and contracts relating to compensation as provided under Rule 701. Individuals who purchased stock as described above represented their intention to acquire the stock for investment only and not with a view to or for sale in connection with any distribution thereof, and appropriate legends were affixed to the share certificates issued in such transactions.
The information presented in this Item 15 gives effect to the completion of a bonus issue of 0.69 of a share for every common share in issue at October 28, 2014, rounded down to the nearest whole share, which was effectuated on October 28, 2014.
| Item 16. | Exhibits and Financial Statement Schedules. |
| (A) | Exhibits |
| EXHIBIT NO. |
DESCRIPTION OF EXHIBIT | |
| 1.1 | Form of Underwriting Agreement | |
| 2.1 | Purchase Agreement, dated as of August 30, 2012, by and between E. I. du Pont de Nemours and Company and Flash Bermuda Co. Ltd. (n/k/a Axalta Coating Systems Ltd.) (incorporated by reference to Exhibit 2.1 to the Registrant’s Registration Statement on Form S-1 (File No. 333-198271), originally filed with the SEC on August 20, 2014) | |
| 2.2 | Amendment to Purchase Agreement, dated as of January 31, 2013, by and between E. I. du Pont de Nemours and Company and Flash Bermuda Co. Ltd. (n/k/a Axalta Coating Systems Ltd.) (incorporated by reference to Exhibit 2.2 to the Registrant’s Registration Statement on Form S-1 (File No. 333-198271), originally filed with the SEC on August 20, 2014) | |
| 3.1 | Amended Memorandum of Association of Axalta Coating Systems Ltd. (incorporated by reference to Exhibit 3.1 of Amendment No. 2 to the Registrant’s Registration Statement on Form S-1 (File No. 333-198271), filed with the SEC on October 14, 2014) | |
| 3.2 | Amended and Restated Bye-laws of Axalta Coating Systems Ltd. (incorporated by reference to Exhibit 3.1 to the Registrant’s Quarterly Report on Form 10-Q (File No. 001-36733), filed with the SEC on November 11, 2014) | |
| 4.1 | Indenture governing the 7.375% Senior Notes due 2021, dated February 1, 2013 (the “Dollar Senior Notes Indenture”), among U.S. Coatings Acquisition Inc. (n/k/a Axalta Coating Systems U.S. Holdings, Inc.) and Flash Dutch 2 B.V. (n/k/a Axalta Coating Systems Dutch Holding B B.V.) as Issuers, the Guarantors named therein and Wilmington Trust, National Association, as Trustee (incorporated by reference to Exhibit 4.1 to the Registrant’s Registration Statement on Form S-1 (File No. 333-198271), originally filed with the SEC on August 20, 2014) | |
| 4.2 | Form of 7.375% Senior Note due 2021 (incorporated by reference to Exhibit 4.2 to the Registrant’s Registration Statement on Form S-1 (File No. 333-198271), originally filed with the SEC on August 20, 2014) | |
| 4.3 | First Supplemental Indenture to the Dollar Senior Notes Indenture, dated April 26, 2013, among U.S. Coatings Acquisition Inc. (n/k/a Axalta Coating Systems U.S. Holdings, Inc.) and Flash Dutch 2 B.V. (n/k/a Axalta Coating Systems Dutch Holding B B.V.), as Issuers, the Guarantors named therein and Wilmington Trust, National Association, as Trustee (incorporated by reference to Exhibit 4.3 to the Registrant’s Registration Statement on Form S-1 (File No. 333-198271), originally filed with the SEC on August 20, 2014) | |
II-2
Table of Contents
| EXHIBIT NO. |
DESCRIPTION OF EXHIBIT | |
| 4.4 | First Supplemental Indenture to the Dollar Senior Notes Indenture, dated May 10, 2013, among U.S. Coatings Acquisition Inc. (n/k/a Axalta Coating Systems U.S. Holdings, Inc.) and Flash Dutch 2 B.V. (n/k/a Axalta Coating Systems Dutch Holding B B.V.), as Issuers, the Guarantors named therein and Wilmington Trust, National Association, as Trustee (incorporated by reference to Exhibit 4.4 to the Registrant’s Registration Statement on Form S-1 (File No. 333-198271), originally filed with the SEC on August 20, 2014) | |
| 4.5 | Third Supplemental Indenture to the Dollar Senior Notes Indenture, dated July 18, 2013, among U.S. Coatings Acquisition Inc. (n/k/a Axalta Coating Systems U.S. Holdings, Inc.) and Flash Dutch 2 B.V. (n/k/a Axalta Coating Systems Dutch Holding B B.V.), as Issuers, the Guarantors named therein and Wilmington Trust, National Association, as Trustee (incorporated by reference to Exhibit 4.5 to the Registrant’s Registration Statement on Form S-1 (File No. 333-198271), originally filed with the SEC on August 20, 2014) | |
| 4.6 | Fourth Supplemental Indenture to the Dollar Senior Notes Indenture, dated July 29, 2013, among U.S. Coatings Acquisition Inc. (n/k/a Axalta Coating Systems U.S. Holdings, Inc.) and Flash Dutch 2 B.V. (n/k/a Axalta Coating Systems Dutch Holding B B.V.), as Issuers, the Guarantors named therein and Wilmington Trust, National Association, as Trustee (incorporated by reference to Exhibit 4.6 to the Registrant’s Registration Statement on Form S-1 (File No. 333-198271), originally filed with the SEC on August 20, 2014) | |
| 4.7 | Fifth Supplemental Indenture to the Dollar Senior Notes Indenture, dated September 17, 2013, among U.S. Coatings Acquisition Inc. (n/k/a Axalta Coating Systems U.S. Holdings, Inc.) and Flash Dutch 2 B.V. (n/k/a Axalta Coating Systems Dutch Holding B B.V.), as Issuers, the Guarantors named therein and Wilmington Trust, National Association, as Trustee (incorporated by reference to Exhibit 4.7 to the Registrant’s Registration Statement on Form S-1 (File No. 333-198271), originally filed with the SEC on August 20, 2014) | |
| 4.8 | Sixth Supplemental Indenture to the Dollar Senior Notes Indenture dated September 18, 2013, among U.S. Coatings Acquisition Inc. (n/k/a Axalta Coating Systems U.S. Holdings, Inc.) and Flash Dutch 2 B.V. (n/k/a Axalta Coating Systems Dutch Holding B B.V.), as Issuers, the Guarantors named therein and Wilmington Trust, National Association, as Trustee (incorporated by reference to Exhibit 4.8 to the Registrant’s Registration Statement on Form S-1 (File No. 333-198271), originally filed with the SEC on August 20, 2014) | |
| 4.9 | Seventh Supplemental Indenture to the Dollar Senior Notes Indenture, dated December 27, 2013, among U.S. Coatings Acquisition Inc. (n/k/a Axalta Coating Systems U.S. Holdings, Inc.) and Flash Dutch 2 B.V. (n/k/a Axalta Coating Systems Dutch Holding B B.V.), as Issuers, the Guarantors named therein and Wilmington Trust, National Association, as Trustee (incorporated by reference to Exhibit 4.9 to the Registrant’s Registration Statement on Form S-1 (File No. 333-198271), originally filed with the SEC on August 20, 2014) | |
| 4.10 | Eighth Supplemental Indenture to the Dollar Senior Notes Indenture, dated July 1, 2014, among U.S. Coatings Acquisition Inc. (n/k/a Axalta Coating Systems U.S. Holdings, Inc.) and Flash Dutch 2 B.V. (n/k/a Axalta Coating Systems Dutch Holding B B.V.), as Issuers, the Guarantors named therein and Wilmington Trust, National Association, as Trustee (incorporated by reference to Exhibit 4.10 to the Registrant’s Registration Statement on Form S-1 (File No. 333-198271), originally filed with the SEC on August 20, 2014) | |
II-3
Table of Contents
| EXHIBIT NO. |
DESCRIPTION OF EXHIBIT | |
| 4.11 | Indenture governing the 5.750% Senior Secured Notes due 2021, dated February 1, 2013 (the “Euro Senior Notes Indenture”), among U.S. Coatings Acquisition Inc. (n/k/a Axalta Coating Systems U.S. Holdings, Inc.) and Flash Dutch 2 B.V. (n/k/a Axalta Coating Systems Dutch Holding B B.V.) as Issuers, the Guarantors named therein, Wilmington Trust, National Association, as Trustee and Collateral Agent, Citigroup Global Markets Deutschland AG, as registrar, and Citibank B.A. London Branch, as Paying Agent and Authenticating Agent (incorporated by reference to Exhibit 4.11 to the Registrant’s Registration Statement on Form S-1 (File No. 333-198271), originally filed with the SEC on August 20, 2014) | |
| 4.12 | Form of 5.750% Senior Secured Note due 2021 (incorporated by reference to Exhibit 4.11 to the Registrant’s Registration Statement on Form S-1 (File No. 333-198271), originally filed with the SEC on August 20, 2014) | |
| 4.13 | First Supplemental Indenture to the Euro Senior Notes Indenture, dated April 26, 2013, among U.S. Coatings Acquisition Inc. (n/k/a Axalta Coating Systems U.S. Holdings, Inc.) and Flash Dutch 2 B.V. (n/k/a Axalta Coating Systems Dutch Holding B B.V.), as Issuers, the Guarantors named therein and Wilmington Trust, National Association, as Trustee and Collateral Agent (incorporated by reference to Exhibit 4.13 to the Registrant’s Registration Statement on Form S-1 (File No. 333-198271), originally filed with the SEC on August 20, 2014) | |
| 4.14 | First Supplemental Indenture to the Euro Senior Notes Indenture, dated May 10, 2013, among U.S. Coatings Acquisition Inc. (n/k/a Axalta Coating Systems U.S. Holdings, Inc.) and Flash Dutch 2 B.V. (n/k/a Axalta Coating Systems Dutch Holding B B.V.), as Issuers, the Guarantors named therein and Wilmington Trust, National Association, as Trustee and Collateral Agent (incorporated by reference to Exhibit 4.14 to the Registrant’s Registration Statement on Form S-1 (File No. 333-198271), originally filed with the SEC on August 20, 2014) | |
| 4.15 | Third Supplemental Indenture to the Euro Senior Notes Indenture, dated July 18, 2013, among U.S. Coatings Acquisition Inc. (n/k/a Axalta Coating Systems U.S. Holdings, Inc.) and Flash Dutch 2 B.V. (n/k/a Axalta Coating Systems Dutch Holding B B.V.), as Issuers, the Guarantors named therein and Wilmington Trust, National Association, as Trustee and Collateral Agent (incorporated by reference to Exhibit 4.15 to the Registrant’s Registration Statement on Form S-1 (File No. 333-198271), originally filed with the SEC on August 20, 2014) | |
| 4.16 | Fourth Supplemental Indenture to the Euro Senior Notes Indenture, dated July 29, 2013, among U.S. Coatings Acquisition Inc. (n/k/a Axalta Coating Systems U.S. Holdings, Inc.) and Flash Dutch 2 B.V. (n/k/a Axalta Coating Systems Dutch Holding B B.V.), as Issuers, the Guarantors named therein and Wilmington Trust, National Association, as Trustee and Collateral Agent (incorporated by reference to Exhibit 4.16 to the Registrant’s Registration Statement on Form S-1 (File No. 333-198271), originally filed with the SEC on August 20, 2014) | |
| 4.17 | Fifth Supplemental Indenture to the Euro Senior Notes Indenture, dated September 17, 2013, among U.S. Coatings Acquisition Inc. (n/k/a Axalta Coating Systems U.S. Holdings, Inc.) and Flash Dutch 2 B.V. (n/k/a Axalta Coating Systems Dutch Holding B B.V.), as Issuers, the Guarantors named therein and Wilmington Trust, National Association, as Trustee and Collateral Agent (incorporated by reference to Exhibit 4.17 to the Registrant’s Registration Statement on Form S-1 (File No. 333-198271), originally filed with the SEC on August 20, 2014) | |
| 4.18 | Sixth Supplemental Indenture to the Euro Senior Notes Indenture, dated September 18, 2013, among U.S. Coatings Acquisition Inc. (n/k/a Axalta Coating Systems U.S. Holdings, Inc.) and Flash Dutch 2 B.V. (n/k/a Axalta Coating Systems Dutch Holding B B.V.), as Issuers, the Guarantors named therein and Wilmington Trust, National Association, as Trustee and Collateral Agent (incorporated by reference to Exhibit 4.18 to the Registrant’s Registration Statement on Form S-1 (File No. 333-198271), originally filed with the SEC on August 20, 2014) | |
II-4
Table of Contents
| EXHIBIT NO. |
DESCRIPTION OF EXHIBIT | |
| 4.19 | Seventh Supplemental Indenture to the Euro Senior Notes Indenture, dated December 27, 2013, among U.S. Coatings Acquisition Inc. (n/k/a Axalta Coating Systems U.S. Holdings, Inc.) and Flash Dutch 2 B.V. (n/k/a Axalta Coating Systems Dutch Holding B B.V.), as Issuers, the Guarantors named therein and Wilmington Trust, National Association, as Trustee and Collateral Agent (incorporated by reference to Exhibit 4.19 to the Registrant’s Registration Statement on Form S-1 (File No. 333-198271), originally filed with the SEC on August 20, 2014) | |
| 4.20 | Eighth Supplemental Indenture to the Euro Senior Notes Indenture, dated July 1, 2014, among U.S. Coatings Acquisition Inc. (n/k/a Axalta Coating Systems U.S. Holdings, Inc.) and Flash Dutch 2 B.V. (n/k/a Axalta Coating Systems Dutch Holding B B.V.), as Issuers, the Guarantors named therein and Wilmington Trust, National Association, as Trustee and Collateral Agent (incorporated by reference to Exhibit 4.20 to the Registrant’s Registration Statement on Form S-1 (File No. 333-198271), originally filed with the SEC on August 20, 2014) | |
| 4.21 | Specimen Common Share Certificate (incorporated by reference to Exhibit 4.21 of Amendment No. 3 to the Registrant’s Registration Statement on Form S-1 (File No. 333-198271), filed with the SEC on October 30, 2014) | |
| 5.1 | Opinion of Conyers Dill & Pearman Pte. Ltd. | |
| 10.1 | Credit Agreement, dated as of February 1, 2013 (the “Credit Agreement”), among Flash Dutch 2 B.V. (n/k/a Axalta Coating Systems Dutch Holding B B.V.) and U.S. Coatings Acquisition Inc. (n/k/a Axalta Coating Systems U.S. Holdings, Inc.), as Borrowers, Flash Dutch 1 B.V. (n/k/a Axalta Coating Systems Dutch Holding A B.V.) as Holdings, Coatings Co. U.S. Inc. (n/k/a Axalta Coating Systems U.S., Inc.), as U.S. Holdings, Barclays Bank PLC as Administrative Agent, Collateral Agent, Swing Line Lender and L/C Issuer, and the other Lenders party thereto (incorporated by reference to Exhibit 10.1 to the Registrant’s Registration Statement on Form S-1 (File No. 333-198271), originally filed with the SEC on August 20, 2014) | |
| 10.2 | Amendment No. 1 Agreement, to the Credit Agreement, dated as of May 24, 2013, among Flash Dutch 2 B.V. (n/k/a Axalta Coating Systems Dutch Holding B B.V.) as Dutch Borrower, Axalta Coating Systems U.S. Holdings, Inc. as U.S. Borrower and Barclays Bank PLC, as Administrative Agent (incorporated by reference to Exhibit 10.2 to the Registrant’s Registration Statement on Form S-1 (File No. 333-198271), originally filed with the SEC on August 20, 2014) | |
| 10.3 | Second Amendment to Credit Agreement, dated as of February 3, 2014, by and among Axalta Coating Systems Dutch Holding B B.V. (the “Dutch Borrower”), and Axalta Coating Systems U.S. Holdings, Inc. (the “U.S. Borrower” and together with the Dutch Borrower, collectively, the “Borrowers”), Axalta Coating Systems U.S., Inc. (f/k/a Coatings Co. U.S. Inc.) (“U.S. Holdings”), Axalta Coating Systems Dutch Holding A B.V. (“Holdings”), and Barclays Bank PLC, as administrative agent (in such capacity, the “Administrative Agent”), as collateral agent (in such capacity, the “Collateral Agent”), and as designated 2014 Specified Refinancing Term Lender (in such capacity, the “Designated 2014 Specified Refinancing Term Lender”) (incorporated by reference to Exhibit 10.3 to the Registrant’s Registration Statement on Form S-1 (File No. 333-198271), originally filed with the SEC on August 20, 2014) | |
| 10.4 | Security Agreement, dated February 1, 2013, among the Grantors referred to therein and Barclays Bank PLC, as Collateral Agent (incorporated by reference to Exhibit 10.4 to the Registrant’s Registration Statement on Form S-1 (File No. 333-198271), originally filed with the SEC on August 20, 2014) | |
II-5
Table of Contents
| EXHIBIT NO. |
DESCRIPTION OF EXHIBIT | |
| 10.5 | Security Agreement, dated February 1, 2013, among the Grantors referred to therein and Wilmington Trust, National Association, as Collateral Agent (incorporated by reference to Exhibit 10.5 to the Registrant’s Registration Statement on Form S-1 (File No. 333-198271), originally filed with the SEC on August 20, 2014) | |
| 10.6 | Intellectual Property Security Agreement, dated February 1, 2013, between U.S. Coatings IP Co. LLC (n/k/a Axalta Coating Systems USA IP Co. LLC) and Barclays Bank PLC, as collateral agent (incorporated by reference to Exhibit 10.6 to the Registrant’s Registration Statement on Form S-1 (File No. 333-198271), originally filed with the SEC on August 20, 2014) | |
| 10.7 | Intellectual Property Security Agreement, dated February 1, 2013, between the U.S. Coatings IP Co. LLC (n/k/a Axalta Coating Systems USA IP Co. LLC) and Wilmington Trust, National Association, as collateral agent (incorporated by reference to Exhibit 10.7 to the Registrant’s Registration Statement on Form S-1 (File No. 333-198271), originally filed with the SEC on August 20, 2014) | |
| 10.8 | Subsidiary Guaranty, dated as of February 1, 2013, among the Guarantors named therein, the Additional Guarantors referred to therein and Barclays bank PLC as Administrative Agent (incorporated by reference to Exhibit 10.8 to the Registrant’s Registration Statement on Form S-1 (File No. 333-198271), originally filed with the SEC on August 20, 2014) | |
| 10.9 | Holdings Guaranty, dated as of February 1, 2013, between Flash Dutch 1 B.V. (n/k/a Axalta Coating Systems Dutch Holding A B.V.) and Barclays Bank PLC as Administrative Agent (incorporated by reference to Exhibit 10.9 to the Registrant’s Registration Statement on Form S-1 (File No. 333-198271), originally filed with the SEC on August 20, 2014) | |
| 10.10 | First Lien Intercreditor Agreement, dated as of February 1, 2013, among Barclays Bank PLC as Bank Collateral Agent under the Credit Agreement, and as Notes Foreign Collateral Agent under the Indenture, Wilmington Trust, National Association, as Notes Collateral Agent under the Indenture, each Grantor party thereto and each Additional Agent from time to time party thereto (incorporated by reference to Exhibit 10.10 to the Registrant’s Registration Statement on Form S-1 (File No. 333-198271), originally filed with the SEC on August 20, 2014) | |
| 10.11 | Share Pledge Agreement in respect of shares in DuPont Performance Coatings Belgium BVBA (n/k/a Axalta Coating Systems Belgium BVBA), dated 1 February 2013, between Coatings Co (UK) Limited (n/k/a Axalta Coating Systems UK Holding Limited), Teodur B.V. and Barclays Bank PLC, as collateral agent (incorporated by reference to Exhibit 10.11 to the Registrant’s Registration Statement on Form S-1 (File No. 333-198271), originally filed with the SEC on August 20, 2014) | |
| 10.12 | Share Pledge Agreement in respect of shares in DuPont Performance Coatings Belgium BVBA (n/k/a Axalta Coating Systems Belgium BVBA), dated 1 February 2013, between Coatings Co (UK) Limited (n/k/a Axalta Coating Systems UK Holding Limited), Teodur B.V. and Wilmington Trust, National Association, as collateral agent (incorporated by reference to Exhibit 10.12 to the Registrant’s Registration Statement on Form S-1 (File No. 333-198271), originally filed with the SEC on August 20, 2014) | |
| 10.13 | Bank Accounts Pledge Agreement, entered into September 17, 2013, among Axalta Coating Systems Brasil Ltda., Wilmington Trust, National Association, as Notes Collateral Agent, and Barclays Bank PLC, as Collateral Agent (incorporated by reference to Exhibit 10.13 to the Registrant’s Registration Statement on Form S-1 (File No. 333-198271), originally filed with the SEC on August 20, 2014) | |
II-6
Table of Contents
| EXHIBIT NO. |
DESCRIPTION OF EXHIBIT | |
| 10.14 | Quota Pledge Agreement, entered into September 17, 2013, among Brazil Coatings Co. Participações Ltda., Axalta Coating Systems Dutch Holding 2 B.V., Barclays Bank PLC, as Collateral Agent, and Wilmington Trust, National Association, as Notes Collateral Agent (incorporated by reference to Exhibit 10.14 to the Registrant’s Registration Statement on Form S-1 (File No. 333-198271), originally filed with the SEC on August 20, 2014) | |
| 10.15 | Security Agreement, dated as of May 10, 2013, between Axalta Coating Systems Canada Company (f/k/a DuPont Performance Coatings Canada Company), Flash Lux Co S.à r.l. (n/k/a Axalta Coating Systems Luxembourg Holding S.à r.l.), the additional grantors from time to time party thereto, and Barclays Bank PLC, as collateral agent for the secured parties (incorporated by reference to Exhibit 10.15 to the Registrant’s Registration Statement on Form S-1 (File No. 333-198271), originally filed with the SEC on August 20, 2014) | |
| 10.16 | Security Agreement, dated as of May 10, 2013, between Axalta Coating Systems Canada Company (f/k/a DuPont Performance Coatings Canada Company), Flash Lux Co S.à r.l. (n/k/a Axalta Coating Systems Luxembourg Holding S.à r.l.), the additional grantors from time to time party thereto, and Wilmington Trust, National Association, as collateral agent for the secured parties (incorporated by reference to Exhibit 10.16 to the Registrant’s Registration Statement on Form S-1 (File No. 333-198271), originally filed with the SEC on August 20, 2014) | |
| 10.17 | Securities Account Pledge Agreement in relation to the shares issued by France Coatings Co. (n/k/a Axalta Coating Systems France Holding SAS), dated 26 April 2013, between Flash Lux Co S.à r.l. (n/k/a Axalta Coating Systems Luxembourg Holding S.à r.l.), Barclays Bank PLC, as notes foreign collateral agent, and France Coatings Co. (n/k/a Axalta Coating Systems France Holding SAS) (incorporated by reference to Exhibit 10.17 to the Registrant’s Registration Statement on Form S-1 (File No. 333-198271), originally filed with the SEC on August 20, 2014) | |
| 10.18 | Pledge of Receivables Agreement, dated 26 April 2013, between Lux FinCo Coatings S.à r.l. (n/k /a Axalta Coating Systems Finance 1 S.à r.l.) and Barclays Bank PLC, as notes foreign collateral agent (incorporated by reference to Exhibit 10.18 to the Registrant’s Registration Statement on Form S-1 (File No. 333-198271), originally filed with the SEC on August 20, 2014) | |
| 10.19 | Securities Account Pledge Agreement in relation to the shares issued by DuPont Performance Coatings France SAS (n/k/a Axalta Coating Systems France SAS), dated 26 April 2013, between France Coatings Co. (n/k/a Axalta Coating Systems France Holding SAS), Barclays Bank PLC, as notes foreign collateral agent, and DuPont Performance Coatings France SAS (n/k/a Axalta Coating Systems France SAS) (incorporated by reference to Exhibit 10.19 to the Registrant’s Registration Statement on Form S-1 (File No. 333-198271), originally filed with the SEC on August 20, 2014) | |
| 10.20 | Account Pledge Agreement, made on 29 July 2013, between Axalta Coating Systems Verwaltungs GmbH (f/k/a Flash German Co. GmbH), Axalta Coating Systems Deutschland Holding GmbH & Co. KG (f/k/a Germany Coatings GmbH & Co. KG), Axalta Coating Systems Beteiligungs GmbH (f/k/a Germany Coatings Co GmbH), Standox GmbH, Spies Hecker GmbH, Axalta Coating Systems Germany GmbH (f/k/a DuPont Performance Coatings GmbH), Barclays Bank PLC, as collateral agent under the Credit Agreement, and Wilmington Trust, National Association, as notes collateral agent under the EUR Notes Indenture (incorporated by reference to Exhibit 10.20 to the Registrant’s Registration Statement on Form S-1 (File No. 333-198271), originally filed with the SEC on August 20, 2014) | |
II-7
Table of Contents
| EXHIBIT NO. |
DESCRIPTION OF EXHIBIT | |
| 10.21 | Global Assignment Agreement, made on 29 July 2013, between Axalta Coating Systems Deutschland Holding GmbH & Co. KG (f/k/a Germany Coatings GmbH & Co. KG) and Barclays Bank PLC, as collateral agent and collateral sub-agent (incorporated by reference to Exhibit 10.21 to the Registrant’s Registration Statement on Form S-1 (File No. 333-198271), originally filed with the SEC on August 20, 2014) | |
| 10.22 | Global Assignment Agreement, made on 29 July 2013, between Axalta Coating Systems Beteiligungs GmbH (f/k/a Germany Coatings Co GmbH) and Barclays Bank PLC, as collateral agent and collateral sub-agent (incorporated by reference to Exhibit 10.22 to the Registrant’s Registration Statement on Form S-1 (File No. 333-198271), originally filed with the SEC on August 20, 2014) | |
| 10.23 | Global Assignment Agreement, made on 29 July 2013, between Axalta Coating Systems Germany GmbH (f/k/a DuPont Performance Coatings GmbH) and Barclays Bank PLC, as collateral agent and collateral sub-agent (incorporated by reference to Exhibit 10.23 to the Registrant’s Registration Statement on Form S-1 (File No. 333-198271), originally filed with the SEC on August 20, 2014) | |
| 10.24 | Global Assignment Agreement, made on 29 July 2013, between Spies Hecker GmbH and Barclays Bank PLC, as collateral agent and collateral sub-agent (incorporated by reference to Exhibit 10.24 to the Registrant’s Registration Statement on Form S-1 (File No. 333-198271), originally filed with the SEC on August 20, 2014) | |
| 10.25 | Global Assignment Agreement, made on 29 July 2013, between Standox GmbH and Barclays Bank PLC, as collateral agent and collateral sub-agent (incorporated by reference to Exhibit 10.25 to the Registrant’s Registration Statement on Form S-1 (File No. 333-198271), originally filed with the SEC on August 20, 2014) | |
| 10.26 | Partnership Interest Pledge Agreement, made on 29 July 2013, between Axalta Coating Systems Luxembourg Holding 2 S.à r.l. (f/k/a Luxembourg Coatings S.à r.l.), Axalta Coating Systems Verwaltungs GmbH (f/k/a Flash German Co. GmbH), Barclays Bank PLC, as collateral agent under the Credit Agreement, and Wilmington Trust, National Association, as notes collateral agent under the EUR Notes Indenture (incorporated by reference to Exhibit 10.26 to the Registrant’s Registration Statement on Form S-1 (File No. 333-198271), originally filed with the SEC on August 20, 2014) | |
| 10.27 | Share Pledge Agreement, made on 24 July 2013, between Axalta Coating Systems Beteiligungs GmbH (f/k/a Germany Coatings Co GmbH), Barclays Bank PLC, as collateral agent under the Credit Agreement, and Wilmington Trust, National Association, as notes collateral agent under the EUR Notes Indenture (incorporated by reference to Exhibit 10.27 to the Registrant’s Registration Statement on Form S-1 (File No. 333-198271), originally filed with the SEC on August 20, 2014) | |
| 10.28 | Security Purpose Agreement, made on 29 July 2013, between Axalta Coating Systems Germany GmbH (f/k/a DuPont Performance Coatings GmbH) and Barclays Bank PLC, as collateral agent and collateral sub-agent (incorporated by reference to Exhibit 10.28 to the Registrant’s Registration Statement on Form S-1 (File No. 333-198271), originally filed with the SEC on August 20, 2014) | |
| 10.29 | Security Transfer Agreement, made on 29 July 2013, between Axalta Coating Systems Germany GmbH (f/k/a DuPont Performance Coatings GmbH) and Barclays Bank PLC, as collateral agent and collateral sub-agent (incorporated by reference to Exhibit 10.29 to the Registrant’s Registration Statement on Form S-1 (File No. 333-198271), originally filed with the SEC on August 20, 2014) | |
II-8
Table of Contents
| EXHIBIT NO. |
DESCRIPTION OF EXHIBIT | |
| 10.30 | Global Assignment Agreement, made on 1 July 2014, between Axalta Coating Systems Logistik Germany GmbH & Co. KG and Barclays Bank PLC, as collateral agent and collateral sub-agent (incorporated by reference to Exhibit 10.30 to the Registrant’s Registration Statement on Form S-1 (File No. 333-198271), originally filed with the SEC on August 20, 2014) | |
| 10.31 | Partnership Interest Pledge Agreement, made on 1 July 2014, between Axalta Coating Systems Germany GmbH, Axalta Coating Systems Verwaltungs GmbH (f/k/a Flash German Co. GmbH), Barclays Bank PLC, as collateral agent under the Credit Agreement, and Wilmington Trust, National Association as collateral agent under the EUR Note Indenture (incorporated by reference to Exhibit 10.31 to the Registrant’s Registration Statement on Form S-1 (File No. 333-198271), originally filed with the SEC on August 20, 2014) | |
| 10.32 | Account Pledge Agreement, made on 1 July 2014, between Axalta Coating Systems Logistik Germany GmbH & Co. KG, Barclays Bank PLC, as collateral agent under the Credit Agreement, and Wilmington Trust, National Association, as collateral agent under the EUR Notes Indenture (incorporated by reference to Exhibit 10.32 to the Registrant’s Registration Statement on Form S-1 (File No. 333-198271), originally filed with the SEC on August 20, 2014) | |
| 10.33 | Security Transfer Agreement, made on 1 July 2014, between Axalta Coating Systems Logistik Germany GmbH & Co. KG and Barclays Bank PLC, as collateral agent and collateral sub-agent (incorporated by reference to Exhibit 10.33 to the Registrant’s Registration Statement on Form S-1 (File No. 333-198271), originally filed with the SEC on August 20, 2014) | |
| 10.34 | Pledge Agreement without Transfer of Possession, dated September 18, 2013, between Axalta Coating Systems México, S. de R.L. de C.V. (f/k/a/ DuPont Performance Coatings México, S. de R.L. de C.V.) and Barclays Bank PLC, as collateral agent (incorporated by reference to Exhibit 10.34 to the Registrant’s Registration Statement on Form S-1 (File No. 333-198271), originally filed with the SEC on August 20, 2014) | |
| 10.35 | Pledge Agreement without Transfer of Possession, dated September 18, 2013, between Axalta Coating Systems Servicios México, S. de R.L. de C.V. (f/k/a/ DuPont Performance Coatings Servicios México, S. de R.L. de C.V.) and Barclays Bank PLC, as collateral agent (incorporated by reference to Exhibit 10.35 to the Registrant’s Registration Statement on Form S-1 (File No. 333-198271), originally filed with the SEC on August 20, 2014) | |
| 10.36 | Equity Interest Pledge Agreement, dated September 18, 2013, among Axalta Coating Systems LA Holding II B.V. (f/k/a DuPont Performance Coatings LA Holding II B.V.), Axalta Coating Systems México, S. de R.L. de C.V. (f/k/a/ DuPont Performance Coatings México, S. de R.L. de C.V.), Axalta Coating Systems Servicios México, S. de R.L. de C.V. (f/k/a/ DuPont Performance Coatings Servicios México, S. de R.L. de C.V.) and Barclays Bank PLC, as collateral agent (incorporated by reference to Exhibit 10.36 to the Registrant’s Registration Statement on Form S-1 (File No. 333-198271), originally filed with the SEC on August 20, 2014) | |
| 10.37 | Equity Interest Pledge Agreement, dated September 18, 2013, among Axalta Coating Systems LA Holding II B.V. (f/k/a DuPont Performance Coatings LA Holding II B.V.), Axalta Coating Systems Servicios México, S. de R.L. de C.V. (f/k/a/ DuPont Performance Coatings Servicios México, S. de R.L. de C.V.), Axalta Coating Systems México, S. de R.L. de C.V. (f/k/a/ DuPont Performance Coatings México, S. de R.L. de C.V.) and Barclays Bank PLC, as collateral agent (incorporated by reference to Exhibit 10.37 to the Registrant’s Registration Statement on Form S-1 (File No. 333-198271), originally filed with the SEC on August 20, 2014) | |
II-9
Table of Contents
| EXHIBIT NO. |
DESCRIPTION OF EXHIBIT | |
| 10.38 | Share Pledge Agreement, dated September 18, 2013, between Axalta Powder Coating Systems USA, Inc. (f/k/a DuPont Powder Coatings USA, Inc.), Axalta Powder Coating Systems México, S.A. de C.V. (f/k/a DuPont Powder Coatings de México, S.A. de C.V.) and Barclays Bank PLC, as collateral agent (incorporated by reference to Exhibit 10.38 to the Registrant’s Registration Statement on Form S-1 (File No. 333-198271), originally filed with the SEC on August 20, 2014) | |
| 10.39 | Debenture, dated 1 February 2013, by Coatings Co (UK) Limited (n/k/a Axalta Coating Systems UK Holding Limited), DuPont Performance Coatings (U.K.) Limited (n/k/a Axalta Coating Systems UK Limited), and DuPont Powder Coatings UK Limited (n/k/a Axalta Powder Coating Systems UK Limited), in favour of Wilmington Trust, National Association, as collateral agent appointed pursuant to the Secured Notes Indenture (incorporated by reference to Exhibit 10.39 to the Registrant’s Registration Statement on Form S-1 (File No. 333-198271), originally filed with the SEC on August 20, 2014) | |
| 10.40 | Debenture, dated 1 February 2013, by Coatings Co (UK) Limited (n/k/a Axalta Coating Systems UK Holding Limited), DuPont Performance Coatings (U.K.) Limited (n/k/a Axalta Coating Systems UK Limited), and DuPont Powder Coatings UK Limited (n/k/a Axalta Powder Coating Systems UK Limited), in favour of Barclays Bank PLC, as collateral agent appointed pursuant to the Credit Agreement (incorporated by reference to Exhibit 10.40 to the Registrant’s Registration Statement on Form S-1 (File No. 333-198271), originally filed with the SEC on August 20, 2014) | |
| 10.41 | Security Over Shares Agreement, dated 1 February 2013, between Flash Lux Co S.à r.l. (n/k/a Axalta Coating Systems Luxembourg Holding S.à r.l.) and Wilmington Trust, National Association, as collateral agent appointed pursuant to the Secured Notes Indenture (incorporated by reference to Exhibit 10.41 to the Registrant’s Registration Statement on Form S-1 (File No. 333-198271), originally filed with the SEC on August 20, 2014) | |
| 10.42 | Security Over Shares Agreement, dated 1 February 2013, between Flash Lux Co S.à r.l. (n/k/a Axalta Coating Systems Luxembourg Holding S.à r.l.) and Barclays Bank PLC, as collateral agent appointed pursuant to the Credit Agreement (incorporated by reference to Exhibit 10.42 to the Registrant’s Registration Statement on Form S-1 (File No. 333-198271), originally filed with the SEC on August 20, 2014) | |
| 10.43 | Debenture, dated 25 March 2014, by Axalta Coating Systems U.K. (2) Limited in favour of Wilmington Trust, National Association, as collateral agent under the Secured Notes Indenture (incorporated by reference to Exhibit 10.43 to the Registrant’s Registration Statement on Form S-1 (File No. 333-198271), originally filed with the SEC on August 20, 2014) | |
| 10.44 | Debenture, dated 25 March 2014, by Axalta Coating Systems U.K. (2) Limited in favour of Barclays Bank PLC, as collateral agent appointed pursuant to the Credit Agreement (incorporated by reference to Exhibit 10.44 to the Registrant’s Registration Statement on Form S-1 (File No. 333-198271), originally filed with the SEC on August 20, 2014) | |
| 10.45 | Security Over Shares Agreement, dated 25 March 2014, between Axalta Coating Systems Belgium BVBA and Wilmington Trust, National Association, as collateral agent appointed pursuant to the Secured Notes Indenture (incorporated by reference to Exhibit 10.45 to the Registrant’s Registration Statement on Form S-1 (File No. 333-198271), originally filed with the SEC on August 20, 2014) | |
| 10.46 | Security Over Shares Agreement, dated 25 March 2014, between Axalta Coating Systems Belgium BVBA and Barclays Bank PLC, as collateral agent appointed pursuant to the Credit Agreement (incorporated by reference to Exhibit 10.46 to the Registrant’s Registration Statement on Form S-1 (File No. 333-198271), originally filed with the SEC on August 20, 2014) | |
II-10
Table of Contents
| EXHIBIT NO. |
DESCRIPTION OF EXHIBIT | |
| 10.47 | Amended and Restated Stockholders Agreement, dated July 31, 2013, among Axalta Coating Systems Bermuda Co., Ltd. (n/k/a Axalta Coating Systems Ltd.), the Initial Carlyle Stockholders and the Management Stockholders party thereto (incorporated by reference to Exhibit 10.47 of Amendment No. 2 to the Registrant’s Registration Statement on Form S-1 (File No. 333-198271), filed with the SEC on October 14, 2014) | |
| 10.48 | Form of Indemnification Agreement (incorporated by reference to Exhibit 10.48 of Amendment No. 3 to the Registrant’s Registration Statement on Form S-1 (File No. 333-198271), filed with the SEC on October 30, 2014) | |
| 10.49 | Employment Agreement between Charles W. Shaver and Coatings Co. U.S. Inc., dated October 26, 2012 (incorporated by reference to Exhibit 10.49 of Amendment No. 2 to the Registrant’s Registration Statement on Form S-1 (File No. 333-198271), filed with the SEC on October 14, 2014) | |
| 10.50 | Employment Agreement between Robert W. Bryant and Coatings Co. U.S. Inc., dated January 12, 2013 (incorporated by reference to Exhibit 10.50 of Amendment No. 2 to the Registrant’s Registration Statement on Form S-1 (File No. 333-198271), filed with the SEC on October 14, 2014) | |
| 10.51 | Employment Agreement between Steven R. Markevich and Coatings Co. U.S. Inc., dated May 2, 2013 (incorporated by reference to Exhibit 10.51 of Amendment No. 2 to the Registrant’s Registration Statement on Form S-1 (File No. 333-198271), filed with the SEC on October 14, 2014) | |
| 10.52 | Employment Agreement between Joseph F. McDougall and Coatings Co. U.S. Inc., dated May 1, 2013 (incorporated by reference to Exhibit 10.52 of Amendment No. 2 to the Registrant’s Registration Statement on Form S-1 (File No. 333-198271), filed with the SEC on October 14, 2014) | |
| 10.53 | Employment Agreement between Michael Finn and Coatings Co. U.S. Inc., dated March 26, 2013 (incorporated by reference to Exhibit 10.53 of Amendment No. 2 to the Registrant’s Registration Statement on Form S-1 (File No. 333-198271), filed with the SEC on October 14, 2014) | |
| 10.54 | Axalta Coating Systems Bermuda Co., Ltd. 2013 Equity Incentive Plan (incorporated by reference to Exhibit 10.54 of Amendment No. 2 to the Registrant’s Registration Statement on Form S-1 (File No. 333-198271), filed with the SEC on October 14, 2014) | |
| 10.55 | Form of Stock Option Agreement under the Axalta Coating Systems Bermuda Co., Ltd. 2013 Equity Incentive Plan (incorporated by reference to Exhibit 10.55 of Amendment No. 2 to the Registrant’s Registration Statement on Form S-1 (File No. 333-198271), filed with the SEC on October 14, 2014) | |
| 10.56 | Axalta Coating Systems Ltd. 2014 Equity Incentive Plan (incorporated by reference to Exhibit 10.56 of Amendment No. 3 to the Registrant’s Registration Statement on Form S-1 (File No. 333-198271), filed with the SEC on October 30, 2014) | |
| 10.57 | Form of Stock Option Agreement under the Axalta Coating Systems Ltd. 2014 Equity Incentive Plan (incorporated by reference to Exhibit 10.57 of Amendment No. 3 to the Registrant’s Registration Statement on Form S-1 (File No. 333-198271), filed with the SEC on October 30, 2014) | |
II-11
Table of Contents
| EXHIBIT NO. |
DESCRIPTION OF EXHIBIT | |
| 10.58 | Form of Restricted Stock Agreement under the Axalta Coating Systems Ltd. 2014 Equity Incentive Plan (incorporated by reference to Exhibit 10.58 of Amendment No. 3 to the Registrant’s Registration Statement on Form S-1 (File No. 333-198271), filed with the SEC on October 30, 2014) | |
| 10.59 | Form of Restricted Stock Unit Agreement under the Axalta Coating Systems Ltd. 2014 Equity Incentive Plan (incorporated by reference to Exhibit 10.59 of Amendment No. 3 to the Registrant’s Registration Statement on Form S-1 (File No. 333-198271), filed with the SEC on October 30, 2014) | |
| 10.60 | Axalta Coating Systems LLC Retirement Savings Restoration Plan (incorporated by reference to Exhibit 10.60 of Amendment No. 2 to the Registrant’s Registration Statement on Form S-1 (File No. 333-198271), filed with the SEC on October 14, 2014) | |
| 10.61 | Axalta Coating Systems, LLC Nonqualified Deferred Compensation Plan (incorporated by reference to Exhibit 10.61 of Amendment No. 2 to the Registrant’s Registration Statement on Form S-1 (File No. 333-198271), filed with the SEC on October 14, 2014) | |
| 10.62 | Principal Stockholders Agreement, by and among Axalta Coating Systems Ltd. and the Carlyle Stockholders, dated November 14, 2014 (incorporated by reference to Exhibit 10.62 to the Company’s Annual Report on Form 10-K, file No. 001-36733, as filed on March 13, 2015) | |
| 21.1 | List of Subsidiaries (incorporated by reference to Exhibit 21.1 to the Company’s Annual Report on Form 10-K, file No. 001-36733, as filed on March 13, 2015) | |
| 23.1 | Consent of Conyers Dill & Pearman Pte. Ltd. (included in Exhibit 5.1) | |
| 23.2 | Consent of PricewaterhouseCoopers LLP | |
| 23.3* | Consent of Orr & Boss, Inc. | |
| 24.1* | Powers of Attorney (included in the signature pages to this registration statement) | |
| 101.INS †* | XBRL Instance Document, furnished herewith | |
| 101.SCH †* | XBRL Schema Document, furnished herewith | |
| 101.CAL †* | XBRL Taxonomy Extension Calculation Linkbase Document | |
| 101.INS †* | XBRL Taxonomy Extension Label Linkbase Document | |
| 101.INS †* | XBRL Taxonomy Extension Presentation Linkbase Document | |
| 101.INS †* | XBRL Taxonomy Extension Definition Linkbase Document | |
| * | Previously filed |
| † | In accordance with Rule 406T of Regulation S-T, the information in these exhibits is furnished and deemed not filed or part of a registration statement or prospectus for purposes of sections 11 or 12 of the Securities Act of 1933, is deemed not filed for purposes of section 18 of the Exchange Act of 1934, and otherwise is not subject to liability under these sections. |
| (B) | Financial Statement Schedules |
Schedule II—Valuation and Qualifying Accounts
Certain information required in Schedule II, Valuation and Qualifying Accounts, is set forth in the financial statements included in this Registration Statement.
Other financial statement schedules have been omitted because they either are not required, are immaterial or are not applicable.
II-12
Table of Contents
| Item 17. | Undertakings |
The undersigned registrant hereby undertakes to provide to the underwriters at the closing specified in the underwriting agreement certificates in such denominations and registered in such names as required by the underwriters to permit prompt delivery to each purchaser.
Insofar as indemnification for liabilities arising under the Securities Act may be permitted to our directors, officers, and controlling persons pursuant to the foregoing provisions, or otherwise, we have been advised that in the opinion of the SEC such indemnification is against public policy as expressed in the Securities Act and is, therefore, unenforceable. In the event that a claim for indemnification against such liabilities (other than the payment by us of expenses incurred or paid by a director, officer, or controlling person of us in the successful defense of any action, suit, or proceeding) is asserted by such director, officer, or controlling person in connection with the securities being registered, we will, unless in the opinion of counsel the matter has been settled by controlling precedent, submit to a court of appropriate jurisdiction the question whether such indemnification by us is against public policy as expressed in the Securities Act and will be governed by the final adjudication of such issue.
We hereby undertake that:
| (i) | for purposes of determining any liability under the Securities Act, the information omitted from the form of prospectus filed as part of this registration statement in reliance upon Rule 430A and contained in a form of prospectus filed by the registrant pursuant to Rule 424(b)(1) or (4) or 497(h) under the Securities Act shall be deemed to be part of this registration statement as of the time it was declared effective. |
| (ii) | for purposes of determining any liability under the Securities Act, each post-effective amendment that contains a form of prospectus shall be deemed to be a new registration statement relating to the securities offered therein, and the offering of such securities at that time shall be deemed to be the initial bona fide offering thereof. |
II-13
Table of Contents
SIGNATURES
Pursuant to the requirements of the Securities Act of 1933 the registrant has duly caused this registration statement to be signed on its behalf by the undersigned, thereunto duly authorized, in the city of Philadelphia, state of Pennsylvania, on March 23, 2015.
| AXALTA COATING SYSTEMS LTD. | ||
| By: | /s/ Charles W. Shaver | |
| Charles W. Shaver Chairman of the Board and Chief Executive Officer | ||
Pursuant to the requirements of the Securities Act of 1933, this registration statement has been signed by the following persons in the capacities and as of the dates indicated.
| Signature |
Title |
Date | ||
| /s/ Charles W. Shaver Charles W. Shaver |
Chairman of the Board and Chief Executive Officer (Principal Executive Officer) | March 23, 2015 | ||
| /s/ Robert W. Bryant Robert W. Bryant |
Executive Vice President and Chief Financial Officer (Principal Financial Officer) |
March 23, 2015 | ||
| /s/ Sean M. Lannon Sean M. Lannon |
Vice President and Global Controller (Principal Accounting Officer) | March 23, 2015 | ||
| * Orlando A. Bustos |
Director | March 23, 2015 | ||
| * Robert M. McLaughlin |
Director | March 23, 2015 | ||
| * Andreas C. Kramvis |
Director | March 23, 2015 | ||
| * Martin W. Sumner |
Director | March 23, 2015 | ||
| * Wesley T. Bieligk |
Director | March 23, 2015 | ||
| * Gregor P. Böhm |
Director | March 23, 2015 | ||
II-14
Table of Contents
| Signature |
Title |
Date | ||
| * Allan M. Holt |
Director | March 23, 2015 | ||
| * Gregory S. Ledford |
Director | March 23, 2015 | ||
| *By: | /s/ Robert W. Bryant | |||
| Name: | Robert W. Bryant | |||
| Title: | Executive Vice President and Chief Financial Officer | |||
II-15
Table of Contents
EXHIBIT INDEX
| EXHIBIT NO. |
DESCRIPTION OF EXHIBIT | |
| 1.1 | Form of Underwriting Agreement | |
| 2.1 | Purchase Agreement, dated as of August 30, 2012, by and between E. I. du Pont de Nemours and Company and Flash Bermuda Co. Ltd. (n/k/a Axalta Coating Systems Ltd.) (incorporated by reference to Exhibit 2.1 to the Registrant’s Registration Statement on Form S-1 (File No. 333-198271), originally filed with the SEC on August 20, 2014) | |
| 2.2 | Amendment to Purchase Agreement, dated as of January 31, 2013, by and between E. I. du Pont de Nemours and Company and Flash Bermuda Co. Ltd. (n/k/a Axalta Coating Systems Ltd.) (incorporated by reference to Exhibit 2.2 to the Registrant’s Registration Statement on Form S-1 (File No. 333-198271), originally filed with the SEC on August 20, 2014) | |
| 3.1 | Amended Memorandum of Association of Axalta Coating Systems Ltd. (incorporated by reference to Exhibit 3.1 of Amendment No. 2 to the Registrant’s Registration Statement on Form S-1 (File No. 333-198271), filed with the SEC on October 14, 2014) | |
| 3.2 | Amended and Restated Bye-laws of Axalta Coating Systems Ltd. (incorporated by reference to Exhibit 3.1 to the Registrant’s Quarterly Report on Form 10-Q (File No. 001-36733), filed with the SEC on November 11, 2014) | |
| 4.1 | Indenture governing the 7.375% Senior Notes due 2021, dated February 1, 2013 (the “Dollar Senior Notes Indenture”), among U.S. Coatings Acquisition Inc. (n/k/a Axalta Coating Systems U.S. Holdings, Inc.) and Flash Dutch 2 B.V. (n/k/a Axalta Coating Systems Dutch Holding B B.V.) as Issuers, the Guarantors named therein and Wilmington Trust, National Association, as Trustee (incorporated by reference to Exhibit 4.1 to the Registrant’s Registration Statement on Form S-1 (File No. 333-198271), originally filed with the SEC on August 20, 2014) | |
| 4.2 | Form of 7.375% Senior Note due 2021 (incorporated by reference to Exhibit 4.2 to the Registrant’s Registration Statement on Form S-1 (File No. 333-198271), originally filed with the SEC on August 20, 2014) | |
| 4.3 | First Supplemental Indenture to the Dollar Senior Notes Indenture, dated April 26, 2013, among U.S. Coatings Acquisition Inc. (n/k/a Axalta Coating Systems U.S. Holdings, Inc.) and Flash Dutch 2 B.V. (n/k/a Axalta Coating Systems Dutch Holding B B.V.), as Issuers, the Guarantors named therein and Wilmington Trust, National Association, as Trustee (incorporated by reference to Exhibit 4.3 to the Registrant’s Registration Statement on Form S-1 (File No. 333-198271), originally filed with the SEC on August 20, 2014) | |
| 4.4 | First Supplemental Indenture to the Dollar Senior Notes Indenture, dated May 10, 2013, among U.S. Coatings Acquisition Inc. (n/k/a Axalta Coating Systems U.S. Holdings, Inc.) and Flash Dutch 2 B.V. (n/k/a Axalta Coating Systems Dutch Holding B B.V.), as Issuers, the Guarantors named therein and Wilmington Trust, National Association, as Trustee (incorporated by reference to Exhibit 4.4 to the Registrant’s Registration Statement on Form S-1 (File No. 333-198271), originally filed with the SEC on August 20, 2014) | |
| 4.5 | Third Supplemental Indenture to the Dollar Senior Notes Indenture, dated July 18, 2013, among U.S. Coatings Acquisition Inc. (n/k/a Axalta Coating Systems U.S. Holdings, Inc.) and Flash Dutch 2 B.V. (n/k/a Axalta Coating Systems Dutch Holding B B.V.), as Issuers, the Guarantors named therein and Wilmington Trust, National Association, as Trustee (incorporated by reference to Exhibit 4.5 to the Registrant’s Registration Statement on Form S-1 (File No. 333-198271), originally filed with the SEC on August 20, 2014) | |
Table of Contents
| EXHIBIT NO. |
DESCRIPTION OF EXHIBIT | |
| 4.6 | Fourth Supplemental Indenture to the Dollar Senior Notes Indenture, dated July 29, 2013, among U.S. Coatings Acquisition Inc. (n/k/a Axalta Coating Systems U.S. Holdings, Inc.) and Flash Dutch 2 B.V. (n/k/a Axalta Coating Systems Dutch Holding B B.V.), as Issuers, the Guarantors named therein and Wilmington Trust, National Association, as Trustee (incorporated by reference to Exhibit 4.6 to the Registrant’s Registration Statement on Form S-1 (File No. 333-198271), originally filed with the SEC on August 20, 2014) | |
| 4.7 | Fifth Supplemental Indenture to the Dollar Senior Notes Indenture, dated September 17, 2013, among U.S. Coatings Acquisition Inc. (n/k/a Axalta Coating Systems U.S. Holdings, Inc.) and Flash Dutch 2 B.V. (n/k/a Axalta Coating Systems Dutch Holding B B.V.), as Issuers, the Guarantors named therein and Wilmington Trust, National Association, as Trustee (incorporated by reference to Exhibit 4.7 to the Registrant’s Registration Statement on Form S-1 (File No. 333-198271), originally filed with the SEC on August 20, 2014) | |
| 4.8 | Sixth Supplemental Indenture to the Dollar Senior Notes Indenture dated September 18, 2013, among U.S. Coatings Acquisition Inc. (n/k/a Axalta Coating Systems U.S. Holdings, Inc.) and Flash Dutch 2 B.V. (n/k/a Axalta Coating Systems Dutch Holding B B.V.), as Issuers, the Guarantors named therein and Wilmington Trust, National Association, as Trustee (incorporated by reference to Exhibit 4.8 to the Registrant’s Registration Statement on Form S-1 (File No. 333-198271), originally filed with the SEC on August 20, 2014) | |
| 4.9 | Seventh Supplemental Indenture to the Dollar Senior Notes Indenture, dated December 27, 2013, among U.S. Coatings Acquisition Inc. (n/k/a Axalta Coating Systems U.S. Holdings, Inc.) and Flash Dutch 2 B.V. (n/k/a Axalta Coating Systems Dutch Holding B B.V.), as Issuers, the Guarantors named therein and Wilmington Trust, National Association, as Trustee (incorporated by reference to Exhibit 4.9 to the Registrant’s Registration Statement on Form S-1 (File No. 333-198271), originally filed with the SEC on August 20, 2014) | |
| 4.10 | Eighth Supplemental Indenture to the Dollar Senior Notes Indenture, dated July 1, 2014, among U.S. Coatings Acquisition Inc. (n/k/a Axalta Coating Systems U.S. Holdings, Inc.) and Flash Dutch 2 B.V. (n/k/a Axalta Coating Systems Dutch Holding B B.V.), as Issuers, the Guarantors named therein and Wilmington Trust, National Association, as Trustee (incorporated by reference to Exhibit 4.10 to the Registrant’s Registration Statement on Form S-1 (File No. 333-198271), originally filed with the SEC on August 20, 2014) | |
| 4.11 | Indenture governing the 5.750% Senior Secured Notes due 2021, dated February 1, 2013 (the “Euro Senior Notes Indenture”), among U.S. Coatings Acquisition Inc. (n/k/a Axalta Coating Systems U.S. Holdings, Inc.) and Flash Dutch 2 B.V. (n/k/a Axalta Coating Systems Dutch Holding B B.V.) as Issuers, the Guarantors named therein, Wilmington Trust, National Association, as Trustee and Collateral Agent, Citigroup Global Markets Deutschland AG, as registrar, and Citibank B.A. London Branch, as Paying Agent and Authenticating Agent (incorporated by reference to Exhibit 4.11 to the Registrant’s Registration Statement on Form S-1 (File No. 333-198271), originally filed with the SEC on August 20, 2014) | |
| 4.12 | Form of 5.750% Senior Secured Note due 2021 (incorporated by reference to Exhibit 4.11 to the Registrant’s Registration Statement on Form S-1 (File No. 333-198271), originally filed with the SEC on August 20, 2014) | |
| 4.13 | First Supplemental Indenture to the Euro Senior Notes Indenture, dated April 26, 2013, among U.S. Coatings Acquisition Inc. (n/k/a Axalta Coating Systems U.S. Holdings, Inc.) and Flash Dutch 2 B.V. (n/k/a Axalta Coating Systems Dutch Holding B B.V.), as Issuers, the Guarantors named therein and Wilmington Trust, National Association, as Trustee and Collateral Agent (incorporated by reference to Exhibit 4.13 to the Registrant’s Registration Statement on Form S-1 (File No. 333-198271), originally filed with the SEC on August 20, 2014) | |
Table of Contents
| EXHIBIT NO. |
DESCRIPTION OF EXHIBIT | |
| 4.14 | First Supplemental Indenture to the Euro Senior Notes Indenture, dated May 10, 2013, among U.S. Coatings Acquisition Inc. (n/k/a Axalta Coating Systems U.S. Holdings, Inc.) and Flash Dutch 2 B.V. (n/k/a Axalta Coating Systems Dutch Holding B B.V.), as Issuers, the Guarantors named therein and Wilmington Trust, National Association, as Trustee and Collateral Agent (incorporated by reference to Exhibit 4.14 to the Registrant’s Registration Statement on Form S-1 (File No. 333-198271), originally filed with the SEC on August 20, 2014) | |
| 4.15 | Third Supplemental Indenture to the Euro Senior Notes Indenture, dated July 18, 2013, among U.S. Coatings Acquisition Inc. (n/k/a Axalta Coating Systems U.S. Holdings, Inc.) and Flash Dutch 2 B.V. (n/k/a Axalta Coating Systems Dutch Holding B B.V.), as Issuers, the Guarantors named therein and Wilmington Trust, National Association, as Trustee and Collateral Agent (incorporated by reference to Exhibit 4.15 to the Registrant’s Registration Statement on Form S-1 (File No. 333-198271), originally filed with the SEC on August 20, 2014) | |
| 4.16 | Fourth Supplemental Indenture to the Euro Senior Notes Indenture, dated July 29, 2013, among U.S. Coatings Acquisition Inc. (n/k/a Axalta Coating Systems U.S. Holdings, Inc.) and Flash Dutch 2 B.V. (n/k/a Axalta Coating Systems Dutch Holding B B.V.), as Issuers, the Guarantors named therein and Wilmington Trust, National Association, as Trustee and Collateral Agent (incorporated by reference to Exhibit 4.16 to the Registrant’s Registration Statement on Form S-1 (File No. 333-198271), originally filed with the SEC on August 20, 2014) | |
| 4.17 | Fifth Supplemental Indenture to the Euro Senior Notes Indenture, dated September 17, 2013, among U.S. Coatings Acquisition Inc. (n/k/a Axalta Coating Systems U.S. Holdings, Inc.) and Flash Dutch 2 B.V. (n/k/a Axalta Coating Systems Dutch Holding B B.V.), as Issuers, the Guarantors named therein and Wilmington Trust, National Association, as Trustee and Collateral Agent (incorporated by reference to Exhibit 4.17 to the Registrant’s Registration Statement on Form S-1 (File No. 333-198271), originally filed with the SEC on August 20, 2014) | |
| 4.18 | Sixth Supplemental Indenture to the Euro Senior Notes Indenture, dated September 18, 2013, among U.S. Coatings Acquisition Inc. (n/k/a Axalta Coating Systems U.S. Holdings, Inc.) and Flash Dutch 2 B.V. (n/k/a Axalta Coating Systems Dutch Holding B B.V.), as Issuers, the Guarantors named therein and Wilmington Trust, National Association, as Trustee and Collateral Agent (incorporated by reference to Exhibit 4.18 to the Registrant’s Registration Statement on Form S-1 (File No. 333-198271), originally filed with the SEC on August 20, 2014) | |
| 4.19 | Seventh Supplemental Indenture to the Euro Senior Notes Indenture, dated December 27, 2013, among U.S. Coatings Acquisition Inc. (n/k/a Axalta Coating Systems U.S. Holdings, Inc.) and Flash Dutch 2 B.V. (n/k/a Axalta Coating Systems Dutch Holding B B.V.), as Issuers, the Guarantors named therein and Wilmington Trust, National Association, as Trustee and Collateral Agent (incorporated by reference to Exhibit 4.19 to the Registrant’s Registration Statement on Form S-1 (File No. 333-198271), originally filed with the SEC on August 20, 2014) | |
| 4.20 | Eighth Supplemental Indenture to the Euro Senior Notes Indenture, dated July 1, 2014, among U.S. Coatings Acquisition Inc. (n/k/a Axalta Coating Systems U.S. Holdings, Inc.) and Flash Dutch 2 B.V. (n/k/a Axalta Coating Systems Dutch Holding B B.V.), as Issuers, the Guarantors named therein and Wilmington Trust, National Association, as Trustee and Collateral Agent (incorporated by reference to Exhibit 4.20 to the Registrant’s Registration Statement on Form S-1 (File No. 333-198271), originally filed with the SEC on August 20, 2014) | |
| 4.21 | Specimen Common Share Certificate (incorporated by reference to Exhibit 4.21 of Amendment No. 3 to the Registrant’s Registration Statement on Form S-1 (File No. 333-198271), filed with the SEC on October 30, 2014) | |
| 5.1 | Opinion of Conyers Dill & Pearman Pte. Ltd. | |
Table of Contents
| EXHIBIT NO. |
DESCRIPTION OF EXHIBIT | |
| 10.1 | Credit Agreement, dated as of February 1, 2013 (the “Credit Agreement”), among Flash Dutch 2 B.V. (n/k/a Axalta Coating Systems Dutch Holding B B.V.) and U.S. Coatings Acquisition Inc. (n/k/a Axalta Coating Systems U.S. Holdings, Inc.), as Borrowers, Flash Dutch 1 B.V. (n/k/a Axalta Coating Systems Dutch Holding A B.V.) as Holdings, Coatings Co. U.S. Inc. (n/k/a Axalta Coating Systems U.S., Inc.), as U.S. Holdings, Barclays Bank PLC as Administrative Agent, Collateral Agent, Swing Line Lender and L/C Issuer, and the other Lenders party thereto (incorporated by reference to Exhibit 10.1 to the Registrant’s Registration Statement on Form S-1 (File No. 333-198271), originally filed with the SEC on August 20, 2014) | |
| 10.2 | Amendment No. 1 Agreement, to the Credit Agreement, dated as of May 24, 2013, among Flash Dutch 2 B.V. (n/k/a Axalta Coating Systems Dutch Holding B B.V.) as Dutch Borrower, Axalta Coating Systems U.S. Holdings, Inc. as U.S. Borrower and Barclays Bank PLC, as Administrative Agent (incorporated by reference to Exhibit 10.2 to the Registrant’s Registration Statement on Form S-1 (File No. 333-198271), originally filed with the SEC on August 20, 2014) | |
| 10.3 | Second Amendment to Credit Agreement, dated as of February 3, 2014, by and among Axalta Coating Systems Dutch Holding B B.V. (the “Dutch Borrower”), and Axalta Coating Systems U.S. Holdings, Inc. (the “U.S. Borrower” and together with the Dutch Borrower, collectively, the “Borrowers”), Axalta Coating Systems U.S., Inc. (f/k/a Coatings Co. U.S. Inc.) (“U.S. Holdings”), Axalta Coating Systems Dutch Holding A B.V. (“Holdings”), and Barclays Bank PLC, as administrative agent (in such capacity, the “Administrative Agent”), as collateral agent (in such capacity, the “Collateral Agent”), and as designated 2014 Specified Refinancing Term Lender (in such capacity, the “Designated 2014 Specified Refinancing Term Lender”) (incorporated by reference to Exhibit 10.3 to the Registrant’s Registration Statement on Form S-1 (File No. 333-198271), originally filed with the SEC on August 20, 2014) | |
| 10.4 | Security Agreement, dated February 1, 2013, among the Grantors referred to therein and Barclays Bank PLC, as Collateral Agent (incorporated by reference to Exhibit 10.4 to the Registrant’s Registration Statement on Form S-1 (File No. 333-198271), originally filed with the SEC on August 20, 2014) | |
| 10.5 | Security Agreement, dated February 1, 2013, among the Grantors referred to therein and Wilmington Trust, National Association, as Collateral Agent (incorporated by reference to Exhibit 10.5 to the Registrant’s Registration Statement on Form S-1 (File No. 333-198271), originally filed with the SEC on August 20, 2014) | |
| 10.6 | Intellectual Property Security Agreement, dated February 1, 2013, between U.S. Coatings IP Co. LLC (n/k/a Axalta Coating Systems USA IP Co. LLC) and Barclays Bank PLC, as collateral agent (incorporated by reference to Exhibit 10.6 to the Registrant’s Registration Statement on Form S-1 (File No. 333-198271), originally filed with the SEC on August 20, 2014) | |
| 10.7 | Intellectual Property Security Agreement, dated February 1, 2013, between the U.S. Coatings IP Co. LLC (n/k/a Axalta Coating Systems USA IP Co. LLC) and Wilmington Trust, National Association, as collateral agent (incorporated by reference to Exhibit 10.7 to the Registrant’s Registration Statement on Form S-1 (File No. 333-198271), originally filed with the SEC on August 20, 2014) | |
| 10.8 | Subsidiary Guaranty, dated as of February 1, 2013, among the Guarantors named therein, the Additional Guarantors referred to therein and Barclays bank PLC as Administrative Agent (incorporated by reference to Exhibit 10.8 to the Registrant’s Registration Statement on Form S-1 (File No. 333-198271), originally filed with the SEC on August 20, 2014) | |
| 10.9 | Holdings Guaranty, dated as of February 1, 2013, between Flash Dutch 1 B.V. (n/k/a Axalta Coating Systems Dutch Holding A B.V.) and Barclays Bank PLC as Administrative Agent (incorporated by reference to Exhibit 10.9 to the Registrant’s Registration Statement on Form S-1 (File No. 333-198271), originally filed with the SEC on August 20, 2014) | |
Table of Contents
| EXHIBIT NO. |
DESCRIPTION OF EXHIBIT | |
| 10.10 | First Lien Intercreditor Agreement, dated as of February 1, 2013, among Barclays Bank PLC as Bank Collateral Agent under the Credit Agreement, and as Notes Foreign Collateral Agent under the Indenture, Wilmington Trust, National Association, as Notes Collateral Agent under the Indenture, each Grantor party thereto and each Additional Agent from time to time party thereto (incorporated by reference to Exhibit 10.10 to the Registrant’s Registration Statement on Form S-1 (File No. 333-198271), originally filed with the SEC on August 20, 2014) | |
| 10.11 | Share Pledge Agreement in respect of shares in DuPont Performance Coatings Belgium BVBA (n/k/a Axalta Coating Systems Belgium BVBA), dated 1 February 2013, between Coatings Co (UK) Limited (n/k/a Axalta Coating Systems UK Holding Limited), Teodur B.V. and Barclays Bank PLC, as collateral agent (incorporated by reference to Exhibit 10.11 to the Registrant’s Registration Statement on Form S-1 (File No. 333-198271), originally filed with the SEC on August 20, 2014) | |
| 10.12 | Share Pledge Agreement in respect of shares in DuPont Performance Coatings Belgium BVBA (n/k/a Axalta Coating Systems Belgium BVBA), dated 1 February 2013, between Coatings Co (UK) Limited (n/k/a Axalta Coating Systems UK Holding Limited), Teodur B.V. and Wilmington Trust, National Association, as collateral agent (incorporated by reference to Exhibit 10.12 to the Registrant’s Registration Statement on Form S-1 (File No. 333-198271), originally filed with the SEC on August 20, 2014) | |
| 10.13 | Bank Accounts Pledge Agreement, entered into September 17, 2013, among Axalta Coating Systems Brasil Ltda., Wilmington Trust, National Association, as Notes Collateral Agent, and Barclays Bank PLC, as Collateral Agent (incorporated by reference to Exhibit 10.13 to the Registrant’s Registration Statement on Form S-1 (File No. 333-198271), originally filed with the SEC on August 20, 2014) | |
| 10.14 | Quota Pledge Agreement, entered into September 17, 2013, among Brazil Coatings Co. Participações Ltda., Axalta Coating Systems Dutch Holding 2 B.V., Barclays Bank PLC, as Collateral Agent, and Wilmington Trust, National Association, as Notes Collateral Agent (incorporated by reference to Exhibit 10.14 to the Registrant’s Registration Statement on Form S-1 (File No. 333-198271), originally filed with the SEC on August 20, 2014) | |
| 10.15 | Security Agreement, dated as of May 10, 2013, between Axalta Coating Systems Canada Company (f/k/a DuPont Performance Coatings Canada Company), Flash Lux Co S.à r.l. (n/k/a Axalta Coating Systems Luxembourg Holding S.à r.l.), the additional grantors from time to time party thereto, and Barclays Bank PLC, as collateral agent for the secured parties (incorporated by reference to Exhibit 10.15 to the Registrant’s Registration Statement on Form S-1 (File No. 333-198271), originally filed with the SEC on August 20, 2014) | |
| 10.16 | Security Agreement, dated as of May 10, 2013, between Axalta Coating Systems Canada Company (f/k/a DuPont Performance Coatings Canada Company), Flash Lux Co S.à r.l. (n/k/a Axalta Coating Systems Luxembourg Holding S.à r.l.), the additional grantors from time to time party thereto, and Wilmington Trust, National Association, as collateral agent for the secured parties (incorporated by reference to Exhibit 10.16 to the Registrant’s Registration Statement on Form S-1 (File No. 333-198271), originally filed with the SEC on August 20, 2014) | |
| 10.17 | Securities Account Pledge Agreement in relation to the shares issued by France Coatings Co. (n/k/a Axalta Coating Systems France Holding SAS), dated 26 April 2013, between Flash Lux Co S.à r.l. (n/k/a Axalta Coating Systems Luxembourg Holding S.à r.l.), Barclays Bank PLC, as notes foreign collateral agent, and France Coatings Co. (n/k/a Axalta Coating Systems France Holding SAS) (incorporated by reference to Exhibit 10.17 to the Registrant’s Registration Statement on Form S-1 (File No. 333-198271), originally filed with the SEC on August 20, 2014) | |
Table of Contents
| EXHIBIT NO. |
DESCRIPTION OF EXHIBIT | |
| 10.18 | Pledge of Receivables Agreement, dated 26 April 2013, between Lux FinCo Coatings S.à r.l. (n/k /a Axalta Coating Systems Finance 1 S.à r.l.) and Barclays Bank PLC, as notes foreign collateral agent (incorporated by reference to Exhibit 10.18 to the Registrant’s Registration Statement on Form S-1 (File No. 333-198271), originally filed with the SEC on August 20, 2014) | |
| 10.19 | Securities Account Pledge Agreement in relation to the shares issued by DuPont Performance Coatings France SAS (n/k/a Axalta Coating Systems France SAS), dated 26 April 2013, between France Coatings Co. (n/k/a Axalta Coating Systems France Holding SAS), Barclays Bank PLC, as notes foreign collateral agent, and DuPont Performance Coatings France SAS (n/k/a Axalta Coating Systems France SAS) (incorporated by reference to Exhibit 10.19 to the Registrant’s Registration Statement on Form S-1 (File No. 333-198271), originally filed with the SEC on August 20, 2014) | |
| 10.20 | Account Pledge Agreement, made on 29 July 2013, between Axalta Coating Systems Verwaltungs GmbH (f/k/a Flash German Co. GmbH), Axalta Coating Systems Deutschland Holding GmbH & Co. KG (f/k/a Germany Coatings GmbH & Co. KG), Axalta Coating Systems Beteiligungs GmbH (f/k/a Germany Coatings Co GmbH), Standox GmbH, Spies Hecker GmbH, Axalta Coating Systems Germany GmbH (f/k/a DuPont Performance Coatings GmbH), Barclays Bank PLC, as collateral agent under the Credit Agreement, and Wilmington Trust, National Association, as notes collateral agent under the EUR Notes Indenture (incorporated by reference to Exhibit 10.20 to the Registrant’s Registration Statement on Form S-1 (File No. 333-198271), originally filed with the SEC on August 20, 2014) | |
| 10.21 | Global Assignment Agreement, made on 29 July 2013, between Axalta Coating Systems Deutschland Holding GmbH & Co. KG (f/k/a Germany Coatings GmbH & Co. KG) and Barclays Bank PLC, as collateral agent and collateral sub-agent (incorporated by reference to Exhibit 10.21 to the Registrant’s Registration Statement on Form S-1 (File No. 333-198271), originally filed with the SEC on August 20, 2014) | |
| 10.22 | Global Assignment Agreement, made on 29 July 2013, between Axalta Coating Systems Beteiligungs GmbH (f/k/a Germany Coatings Co GmbH) and Barclays Bank PLC, as collateral agent and collateral sub-agent (incorporated by reference to Exhibit 10.22 to the Registrant’s Registration Statement on Form S-1 (File No. 333-198271), originally filed with the SEC on August 20, 2014) | |
| 10.23 | Global Assignment Agreement, made on 29 July 2013, between Axalta Coating Systems Germany GmbH (f/k/a DuPont Performance Coatings GmbH) and Barclays Bank PLC, as collateral agent and collateral sub-agent (incorporated by reference to Exhibit 10.23 to the Registrant’s Registration Statement on Form S-1 (File No. 333-198271), originally filed with the SEC on August 20, 2014) | |
| 10.24 | Global Assignment Agreement, made on 29 July 2013, between Spies Hecker GmbH and Barclays Bank PLC, as collateral agent and collateral sub-agent (incorporated by reference to Exhibit 10.24 to the Registrant’s Registration Statement on Form S-1 (File No. 333-198271), originally filed with the SEC on August 20, 2014) | |
| 10.25 | Global Assignment Agreement, made on 29 July 2013, between Standox GmbH and Barclays Bank PLC, as collateral agent and collateral sub-agent (incorporated by reference to Exhibit 10.25 to the Registrant’s Registration Statement on Form S-1 (File No. 333-198271), originally filed with the SEC on August 20, 2014) | |
| 10.26 | Partnership Interest Pledge Agreement, made on 29 July 2013, between Axalta Coating Systems Luxembourg Holding 2 S.à r.l. (f/k/a Luxembourg Coatings S.à r.l.), Axalta Coating Systems Verwaltungs GmbH (f/k/a Flash German Co. GmbH), Barclays Bank PLC, as collateral agent under the Credit Agreement, and Wilmington Trust, National Association, as notes collateral agent under the EUR Notes Indenture (incorporated by reference to Exhibit 10.26 to the Registrant’s Registration Statement on Form S-1 (File No. 333-198271), originally filed with the SEC on August 20, 2014) | |
Table of Contents
| EXHIBIT NO. |
DESCRIPTION OF EXHIBIT | |
| 10.27 | Share Pledge Agreement, made on 24 July 2013, between Axalta Coating Systems Beteiligungs GmbH (f/k/a Germany Coatings Co GmbH), Barclays Bank PLC, as collateral agent under the Credit Agreement, and Wilmington Trust, National Association, as notes collateral agent under the EUR Notes Indenture (incorporated by reference to Exhibit 10.27 to the Registrant’s Registration Statement on Form S-1 (File No. 333-198271), originally filed with the SEC on August 20, 2014) | |
| 10.28 | Security Purpose Agreement, made on 29 July 2013, between Axalta Coating Systems Germany GmbH (f/k/a DuPont Performance Coatings GmbH) and Barclays Bank PLC, as collateral agent and collateral sub-agent (incorporated by reference to Exhibit 10.28 to the Registrant’s Registration Statement on Form S-1 (File No. 333-198271), originally filed with the SEC on August 20, 2014) | |
| 10.29 | Security Transfer Agreement, made on 29 July 2013, between Axalta Coating Systems Germany GmbH (f/k/a DuPont Performance Coatings GmbH) and Barclays Bank PLC, as collateral agent and collateral sub-agent (incorporated by reference to Exhibit 10.29 to the Registrant’s Registration Statement on Form S-1 (File No. 333-198271), originally filed with the SEC on August 20, 2014) | |
| 10.30 | Global Assignment Agreement, made on 1 July 2014, between Axalta Coating Systems Logistik Germany GmbH & Co. KG and Barclays Bank PLC, as collateral agent and collateral sub-agent (incorporated by reference to Exhibit 10.30 to the Registrant’s Registration Statement on Form S-1 (File No. 333-198271), originally filed with the SEC on August 20, 2014) | |
| 10.31 | Partnership Interest Pledge Agreement, made on 1 July 2014, between Axalta Coating Systems Germany GmbH, Axalta Coating Systems Verwaltungs GmbH (f/k/a Flash German Co. GmbH), Barclays Bank PLC, as collateral agent under the Credit Agreement, and Wilmington Trust, National Association as collateral agent under the EUR Note Indenture (incorporated by reference to Exhibit 10.31 to the Registrant’s Registration Statement on Form S-1 (File No. 333-198271), originally filed with the SEC on August 20, 2014) | |
| 10.32 | Account Pledge Agreement, made on 1 July 2014, between Axalta Coating Systems Logistik Germany GmbH & Co. KG, Barclays Bank PLC, as collateral agent under the Credit Agreement, and Wilmington Trust, National Association, as collateral agent under the EUR Notes Indenture (incorporated by reference to Exhibit 10.32 to the Registrant’s Registration Statement on Form S-1 (File No. 333-198271), originally filed with the SEC on August 20, 2014) | |
| 10.33 | Security Transfer Agreement, made on 1 July 2014, between Axalta Coating Systems Logistik Germany GmbH & Co. KG and Barclays Bank PLC, as collateral agent and collateral sub-agent (incorporated by reference to Exhibit 10.33 to the Registrant’s Registration Statement on Form S-1 (File No. 333-198271), originally filed with the SEC on August 20, 2014) | |
| 10.34 | Pledge Agreement without Transfer of Possession, dated September 18, 2013, between Axalta Coating Systems México, S. de R.L. de C.V. (f/k/a/ DuPont Performance Coatings México, S. de R.L. de C.V.) and Barclays Bank PLC, as collateral agent (incorporated by reference to Exhibit 10.34 to the Registrant’s Registration Statement on Form S-1 (File No. 333-198271), originally filed with the SEC on August 20, 2014) | |
| 10.35 | Pledge Agreement without Transfer of Possession, dated September 18, 2013, between Axalta Coating Systems Servicios México, S. de R.L. de C.V. (f/k/a/ DuPont Performance Coatings Servicios México, S. de R.L. de C.V.) and Barclays Bank PLC, as collateral agent (incorporated by reference to Exhibit 10.35 to the Registrant’s Registration Statement on Form S-1 (File No. 333-198271), originally filed with the SEC on August 20, 2014) | |
Table of Contents
| EXHIBIT NO. |
DESCRIPTION OF EXHIBIT | |
| 10.36 | Equity Interest Pledge Agreement, dated September 18, 2013, among Axalta Coating Systems LA Holding II B.V. (f/k/a DuPont Performance Coatings LA Holding II B.V.), Axalta Coating Systems México, S. de R.L. de C.V. (f/k/a/ DuPont Performance Coatings México, S. de R.L. de C.V.), Axalta Coating Systems Servicios México, S. de R.L. de C.V. (f/k/a/ DuPont Performance Coatings Servicios México, S. de R.L. de C.V.) and Barclays Bank PLC, as collateral agent (incorporated by reference to Exhibit 10.36 to the Registrant’s Registration Statement on Form S-1 (File No. 333-198271), originally filed with the SEC on August 20, 2014) | |
| 10.37 | Equity Interest Pledge Agreement, dated September 18, 2013, among Axalta Coating Systems LA Holding II B.V. (f/k/a DuPont Performance Coatings LA Holding II B.V.), Axalta Coating Systems Servicios México, S. de R.L. de C.V. (f/k/a/ DuPont Performance Coatings Servicios México, S. de R.L. de C.V.), Axalta Coating Systems México, S. de R.L. de C.V. (f/k/a/ DuPont Performance Coatings México, S. de R.L. de C.V.) and Barclays Bank PLC, as collateral agent (incorporated by reference to Exhibit 10.37 to the Registrant’s Registration Statement on Form S-1 (File No. 333-198271), originally filed with the SEC on August 20, 2014) | |
| 10.38 | Share Pledge Agreement, dated September 18, 2013, between Axalta Powder Coating Systems USA, Inc. (f/k/a DuPont Powder Coatings USA, Inc.), Axalta Powder Coating Systems México, S.A. de C.V. (f/k/a DuPont Powder Coatings de México, S.A. de C.V.) and Barclays Bank PLC, as collateral agent (incorporated by reference to Exhibit 10.38 to the Registrant’s Registration Statement on Form S-1 (File No. 333-198271), originally filed with the SEC on August 20, 2014) | |
| 10.39 | Debenture, dated 1 February 2013, by Coatings Co (UK) Limited (n/k/a Axalta Coating Systems UK Holding Limited), DuPont Performance Coatings (U.K.) Limited (n/k/a Axalta Coating Systems UK Limited), and DuPont Powder Coatings UK Limited (n/k/a Axalta Powder Coating Systems UK Limited), in favour of Wilmington Trust, National Association, as collateral agent appointed pursuant to the Secured Notes Indenture (incorporated by reference to Exhibit 10.39 to the Registrant’s Registration Statement on Form S-1 (File No. 333-198271), originally filed with the SEC on August 20, 2014) | |
| 10.40 | Debenture, dated 1 February 2013, by Coatings Co (UK) Limited (n/k/a Axalta Coating Systems UK Holding Limited), DuPont Performance Coatings (U.K.) Limited (n/k/a Axalta Coating Systems UK Limited), and DuPont Powder Coatings UK Limited (n/k/a Axalta Powder Coating Systems UK Limited), in favour of Barclays Bank PLC, as collateral agent appointed pursuant to the Credit Agreement (incorporated by reference to Exhibit 10.40 to the Registrant’s Registration Statement on Form S-1 (File No. 333-198271), originally filed with the SEC on August 20, 2014) | |
| 10.41 | Security Over Shares Agreement, dated 1 February 2013, between Flash Lux Co S.à r.l. (n/k/a Axalta Coating Systems Luxembourg Holding S.à r.l.) and Wilmington Trust, National Association, as collateral agent appointed pursuant to the Secured Notes Indenture (incorporated by reference to Exhibit 10.41 to the Registrant’s Registration Statement on Form S-1 (File No. 333-198271), originally filed with the SEC on August 20, 2014) | |
| 10.42 | Security Over Shares Agreement, dated 1 February 2013, between Flash Lux Co S.à r.l. (n/k/a Axalta Coating Systems Luxembourg Holding S.à r.l.) and Barclays Bank PLC, as collateral agent appointed pursuant to the Credit Agreement (incorporated by reference to Exhibit 10.42 to the Registrant’s Registration Statement on Form S-1 (File No. 333-198271), originally filed with the SEC on August 20, 2014) | |
| 10.43 | Debenture, dated 25 March 2014, by Axalta Coating Systems U.K. (2) Limited in favour of Wilmington Trust, National Association, as collateral agent under the Secured Notes Indenture (incorporated by reference to Exhibit 10.43 to the Registrant’s Registration Statement on Form S-1 (File No. 333-198271), originally filed with the SEC on August 20, 2014) | |
Table of Contents
| EXHIBIT NO. |
DESCRIPTION OF EXHIBIT | |
| 10.44 | Debenture, dated 25 March 2014, by Axalta Coating Systems U.K. (2) Limited in favour of Barclays Bank PLC, as collateral agent appointed pursuant to the Credit Agreement (incorporated by reference to Exhibit 10.44 to the Registrant’s Registration Statement on Form S-1 (File No. 333-198271), originally filed with the SEC on August 20, 2014) | |
| 10.45 | Security Over Shares Agreement, dated 25 March 2014, between Axalta Coating Systems Belgium BVBA and Wilmington Trust, National Association, as collateral agent appointed pursuant to the Secured Notes Indenture (incorporated by reference to Exhibit 10.45 to the Registrant’s Registration Statement on Form S-1 (File No. 333-198271), originally filed with the SEC on August 20, 2014) | |
| 10.46 | Security Over Shares Agreement, dated 25 March 2014, between Axalta Coating Systems Belgium BVBA and Barclays Bank PLC, as collateral agent appointed pursuant to the Credit Agreement (incorporated by reference to Exhibit 10.46 to the Registrant’s Registration Statement on Form S-1 (File No. 333-198271), originally filed with the SEC on August 20, 2014) | |
| 10.47 | Amended and Restated Stockholders Agreement, dated July 31, 2013, among Axalta Coating Systems Bermuda Co., Ltd. (n/k/a Axalta Coating Systems Ltd.), the Initial Carlyle Stockholders and the Management Stockholders party thereto (incorporated by reference to Exhibit 10.47 of Amendment No. 2 to the Registrant’s Registration Statement on Form S-1 (File No. 333-198271), filed with the SEC on October 14, 2014) | |
| 10.48 | Form of Indemnification Agreement (incorporated by reference to Exhibit 10.48 of Amendment No. 3 to the Registrant’s Registration Statement on Form S-1 (File No. 333-198271), filed with the SEC on October 30, 2014) | |
| 10.49 | Employment Agreement between Charles W. Shaver and Coatings Co. U.S. Inc., dated October 26, 2012 (incorporated by reference to Exhibit 10.49 of Amendment No. 2 to the Registrant’s Registration Statement on Form S-1 (File No. 333-198271), filed with the SEC on October 14, 2014) | |
| 10.50 | Employment Agreement between Robert W. Bryant and Coatings Co. U.S. Inc., dated January 12, 2013 (incorporated by reference to Exhibit 10.50 of Amendment No. 2 to the Registrant’s Registration Statement on Form S-1 (File No. 333-198271), filed with the SEC on October 14, 2014) | |
| 10.51 | Employment Agreement between Steven R. Markevich and Coatings Co. U.S. Inc., dated May 2, 2013 (incorporated by reference to Exhibit 10.51 of Amendment No. 2 to the Registrant’s Registration Statement on Form S-1 (File No. 333-198271), filed with the SEC on October 14, 2014) | |
| 10.52 | Employment Agreement between Joseph F. McDougall and Coatings Co. U.S. Inc., dated May 1, 2013 (incorporated by reference to Exhibit 10.52 of Amendment No. 2 to the Registrant’s Registration Statement on Form S-1 (File No. 333-198271), filed with the SEC on October 14, 2014) | |
| 10.53 | Employment Agreement between Michael Finn and Coatings Co. U.S. Inc., dated March 26, 2013 (incorporated by reference to Exhibit 10.53 of Amendment No. 2 to the Registrant’s Registration Statement on Form S-1 (File No. 333-198271), filed with the SEC on October 14, 2014) | |
| 10.54 | Axalta Coating Systems Bermuda Co., Ltd. 2013 Equity Incentive Plan (incorporated by reference to Exhibit 10.54 of Amendment No. 2 to the Registrant’s Registration Statement on Form S-1 (File No. 333-198271), filed with the SEC on October 14, 2014) | |
| 10.55 | Form of Stock Option Agreement under the Axalta Coating Systems Bermuda Co., Ltd. 2013 Equity Incentive Plan (incorporated by reference to Exhibit 10.55 of Amendment No. 2 to the Registrant’s Registration Statement on Form S-1 (File No. 333-198271), filed with the SEC on October 14, 2014) | |
Table of Contents
| EXHIBIT NO. |
DESCRIPTION OF EXHIBIT | |
| 10.56 | Axalta Coating Systems Ltd. 2014 Equity Incentive Plan (incorporated by reference to Exhibit 10.56 of Amendment No. 3 to the Registrant’s Registration Statement on Form S-1 (File No. 333-198271), filed with the SEC on October 30, 2014) | |
| 10.57 | Form of Stock Option Agreement under the Axalta Coating Systems Ltd. 2014 Equity Incentive Plan (incorporated by reference to Exhibit 10.57 of Amendment No. 3 to the Registrant’s Registration Statement on Form S-1 (File No. 333-198271), filed with the SEC on October 30, 2014) | |
| 10.58 | Form of Restricted Stock Agreement under the Axalta Coating Systems Ltd. 2014 Equity Incentive Plan (incorporated by reference to Exhibit 10.58 of Amendment No. 3 to the Registrant’s Registration Statement on Form S-1 (File No. 333-198271), filed with the SEC on October 30, 2014) | |
| 10.59 | Form of Restricted Stock Unit Agreement under the Axalta Coating Systems Ltd. 2014 Equity Incentive Plan (incorporated by reference to Exhibit 10.59 of Amendment No. 3 to the Registrant’s Registration Statement on Form S-1 (File No. 333-198271), filed with the SEC on October 30, 2014) | |
| 10.60 | Axalta Coating Systems LLC Retirement Savings Restoration Plan (incorporated by reference to Exhibit 10.60 of Amendment No. 2 to the Registrant’s Registration Statement on Form S-1 (File No. 333-198271), filed with the SEC on October 14, 2014) | |
| 10.61 | Axalta Coating Systems, LLC Nonqualified Deferred Compensation Plan (incorporated by reference to Exhibit 10.61 of Amendment No. 2 to the Registrant’s Registration Statement on Form S-1 (File No. 333-198271), filed with the SEC on October 14, 2014) | |
| 10.62 | Principal Stockholders Agreement, by and among Axalta Coating Systems Ltd. and the Carlyle Stockholders, dated November 14, 2014 (incorporated by reference to Exhibit 10.62 to the Company’s Annual Report on Form 10-K, file No. 001-36733, as filed on March 13, 2015) | |
| 21.1 | List of Subsidiaries (incorporated by reference to Exhibit 21.1 to the Company’s Annual Report on Form 10-K, file No. 001-36733, as filed on March 13, 2015) | |
| 23.1 | Consent of Conyers Dill & Pearman Pte. Ltd. (included in Exhibit 5.1) | |
| 23.2 | Consent of PricewaterhouseCoopers LLP | |
| 23.3* | Consent of Orr & Boss, Inc. | |
| 24.1* | Powers of Attorney (included in the signature pages to this registration statement) | |
| 101.INS †* | XBRL Instance Document, furnished herewith | |
| 101.SCH †* | XBRL Schema Document, furnished herewith | |
| 101.CAL †* | XBRL Taxonomy Extension Calculation Linkbase Document | |
| 101.INS †* | XBRL Taxonomy Extension Label Linkbase Document | |
| 101.INS †* | XBRL Taxonomy Extension Presentation Linkbase Document | |
| 101.INS †* | XBRL Taxonomy Extension Definition Linkbase Document | |
| * | Previously filed |
| † | In accordance with Rule 406T of Regulation S-T, the information in these exhibits is furnished and deemed not filed or part of a registration statement or prospectus for purposes of sections 11 or 12 of the Securities Act of 1933, is deemed not filed for purposes of section 18 of the Exchange Act of 1934, and otherwise is not subject to liability under these sections. |