Attached files
| file | filename |
|---|---|
| EX-99.1 - EX-99.1 - State National Companies, Inc. | a15-7072_1ex99d1.htm |
| 8-K - CURRENT REPORT OF MATERIAL EVENTS OR CORPORATE CHANGES - State National Companies, Inc. | a15-7072_18k.htm |
Exhibit 99.2
|
|
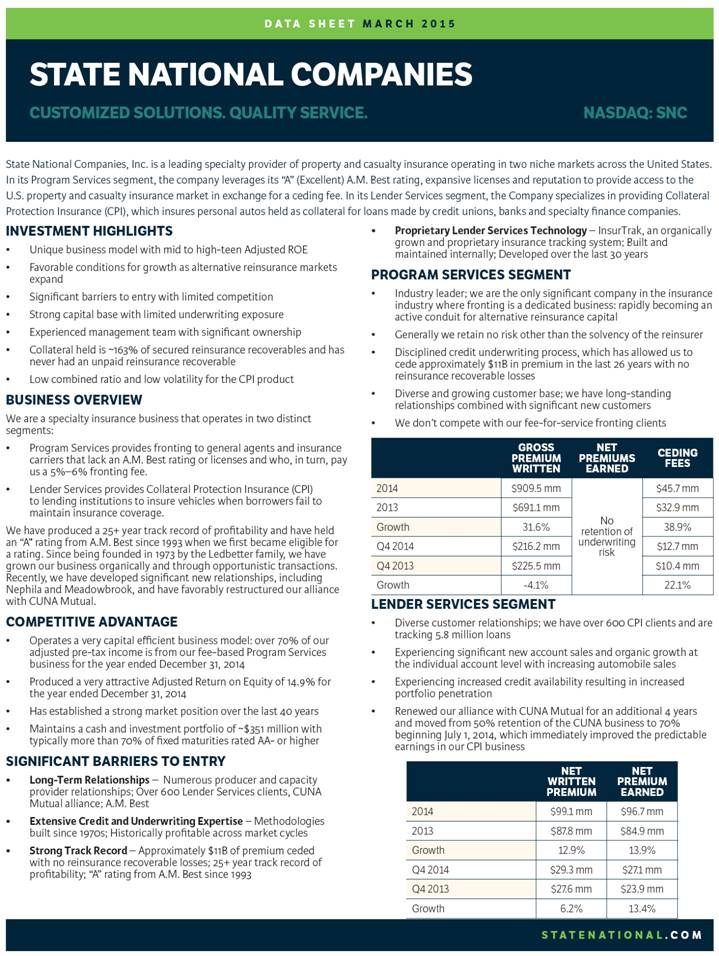
DATA SHEET MARCH 2015 STATE NATIONAL COMPANIES CUSTOMIZED SOLUTIONS. QUALITY SERVICE. NASDAQ: SNC State National Companies, Inc. is a leading specialty provider of property and casualty insurance operating in two niche markets across the United States. In its Program Services segment, the company leverages its “A” (Excellent) A.M. Best rating, expansive licenses and reputation to provide access to the U.S. property and casualty insurance market in exchange for a ceding fee. In its Lender Services segment, the Company specializes in providing Collateral Protection Insurance (CPI), which insures personal autos held as collateral for loans made by credit unions, banks and specialty finance companies. INVESTMENT HIGHLIGHTS • Unique business model with mid to high-teen Adjusted ROE • Favorable conditions for growth as alternative reinsurance markets expand • Significant barriers to entry with limited competition • Strong capital base with limited underwriting exposure • Experienced management team with significant ownership • Collateral held is ~163% of secured reinsurance recoverables and has never had an unpaid reinsurance recoverable • Low combined ratio and low volatility for the CPI product BUSINESS OVERVIEW We are a specialty insurance business that operates in two distinct segments: • Program Services provides fronting to general agents and insurance carriers that lack an A.M. Best rating or licenses and who, in turn, pay us a 5%–6% fronting fee. • Lender Services provides Collateral Protection Insurance (CPI) to lending institutions to insure vehicles when borrowers fail to maintain insurance coverage. We have produced a 25+ year track record of profitability and have held an “A” rating from A.M. Best since 1993 when we first became eligible for a rating. Since being founded in 1973 by the Ledbetter family, we have grown our business organically and through opportunistic transactions. Recently, we have developed significant new relationships, including Nephila and Meadowbrook, and have favorably restructured our alliance with CUNA Mutual. COMPETITIVE ADVANTAGE • Operates a very capital efficient business model: over 70% of our adjusted pre-tax income is from our fee-based Program Services business for the year ended December 31, 2014 • Produced a very attractive Adjusted Return on Equity of 14.9% for the year ended December 31, 2014 • Has established a strong market position over the last 40 years • Maintains a cash and investment portfolio of ~$351 million with typically more than 70% of fixed maturities rated AA- or higher SIGNIFICANT BARRIERS TO ENTRY • Long-Term Relationships – Numerous producer and capacity provider relationships; Over 600 Lender Services clients, CUNA Mutual alliance; A.M. Best • Extensive Credit and Underwriting Expertise – Methodologies built since 1970s; Historically profitable across market cycles • Strong Track Record – Approximately $11B of premium ceded with no reinsurance recoverable losses; 25+ year track record of profitability; “A” rating from A.M. Best since 1993 • Proprietary Lender Services Technology – InsurTrak, an organically grown and proprietary insurance tracking system; Built and maintained internally; Developed over the last 30 years PROGRAM SERVICES SEGMENT • Industry leader; we are the only significant company in the insurance industry where fronting is a dedicated business: rapidly becoming an active conduit for alternative reinsurance capital • Generally we retain no risk other than the solvency of the reinsurer • Disciplined credit underwriting process, which has allowed us to cede approximately $11B in premium in the last 26 years with no reinsurance recoverable losses • Diverse and growing customer base; we have long-standing relationships combined with significant new customers • We don’t compete with our fee-for-service fronting clients GROSS PREMIUM WRITTEN NET PREMIUMS EARNED CEDING FEES 2014 $909.5 mm No retention of underwriting risk $45.7 mm 2013 $691.1 mm $32.9 mm Growth 31.6% 38.9% Q4 2014 $216.2 mm $12.7 mm Q4 2013 $225.5 mm $10.4 mm Growth -4.1% 22.1% LENDER SERVICES SEGMENT • Diverse customer relationships; we have over 600 CPI clients and are tracking 5.8 million loans • Experiencing significant new account sales and organic growth at the individual account level with increasing automobile sales • Experiencing increased credit availability resulting in increased portfolio penetration • Renewed our alliance with CUNA Mutual for an additional 4 years and moved from 50% retention of the CUNA business to 70% beginning July 1, 2014, which immediately improved the predictable earnings in our CPI business NET WRITTEN PREMIUM NET PREMIUM EARNED 2014 $99.1 mm $96.7 mm 2013 $87.8 mm $84.9 mm Growth 12.9% 13.9% Q4 2014 $29.3 mm $27.1 mm Q4 2013 $27.6 mm $23.9 mm Growth 6.2% 13.4% STATENATIONAL.COM |
|
|
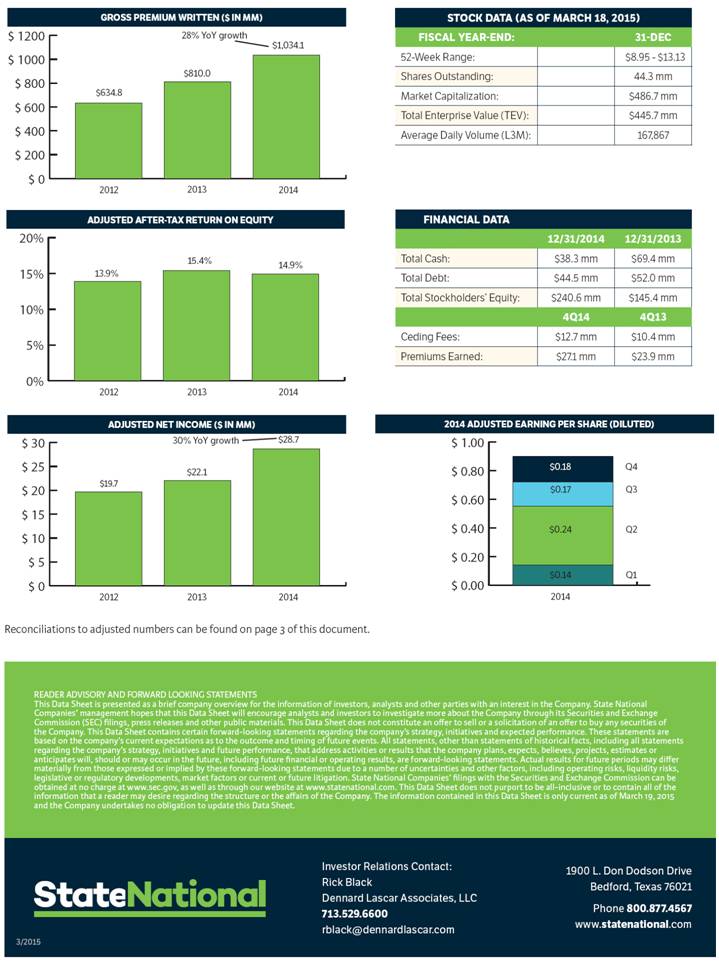
STOCK DATA (AS OF MARCH 18, 2015) FISCAL YEAR-END: 31-DEC 52-Week Range: $8.95 - $13.13 Shares Outstanding: 44.3 mm Market Capitalization: $486.7 mm Total Enterprise Value (TEV): $445.7 mm Average Daily Volume (L3M): 167,867 FINANCIAL DATA 12/31/2014 12/31/2013 Total Cash: $38.3 mm $69.4 mm Total Debt: $44.5 mm $52.0 mm Total Stockholders’ Equity: $240.6 mm $145.4 mm 4Q14 4Q13 Ceding Fees: $12.7 mm $10.4 mm Premiums Earned: $27.1 mm $23.9 mm $ 0$ 5% 10% 15% 20% 20122013201413.9% 15.4%14.9% ADJUSTED AFTER-TAX RETURN ON EQUITY$ 0$ 5$ 10$ 15$ 20$ 25$ 30$19.7$22.1$28.7ADJUSTED NET INCOME ($ IN MM) $ 0.00$ 0.20$ 0.40$ 0.60$ 0.80$ 1.002014$0.18$0.24$0.14$0.622014 ADJUSTED EARNING PER SHARE (DILUTED) 30% YoY growth201220132014$0.17Q4Q2Q1Q3 $ 0$ 5% 10% 15% 20% 20122013201413.9% 15.4%14.9% ADJUSTED AFTER-TAX RETURN ON EQUITY$ 0$ 5$ 10$ 15$ 20$ 25$ 30$19.7$22.1$28.7ADJUSTED NET INCOME ($ IN MM) $ 0.00$ 0.20$ 0.40$ 0.60$ 0.80$ 1.002014$0.18$0.24$0.14$0.622014 ADJUSTED EARNING PER SHARE (DILUTED) 30% YoY growth201220132014$0.17Q4Q2Q1Q3 $ 0$ 200$ 400$ 600$ 800$ 1000$ 1200201220132014$634.8$810.0$1,034.1GROSS PREMIUM WRITTEN ($ IN MM) 28% YoY growth0% 5% 10% 15% 20% 20122013201413.9% 15.4%14.9% ADJUSTED AFTER-TAX RETURN ON EQUITY$ 0$ 5$ 10$ 15$ 20$ 25$ 30$19.7$22.1$28.7ADJUSTED NET INCOME ($ IN MM) $ 0.00$ 0.20$ 0.40$ 0.60$ 0.80$ 1.002014$0.18$0.24$0.14$0.622014 ADJUSTED EARNING PER SHARE (DILUTED) 30% YoY growth201220132014$0.17Q4Q2Q1Q3 Reconciliations to adjusted numbers can be found on page 3 of this document. READER ADVISORY AND FORWARD LOOKING STATEMENTS This Data Sheet is presented as a brief company overview for the information of investors, analysts and other parties with an interest in the Company. State National Companies’ management hopes that this Data Sheet will encourage analysts and investors to investigate more about the Company through its Securities and Exchange Commission (SEC) filings, press releases and other public materials. This Data Sheet does not constitute an offer to sell or a solicitation of an offer to buy any securities of the Company. This Data Sheet contains certain forward-looking statements regarding the company’s strategy, initiatives and expected performance. These statements are based on the company’s current expectations as to the outcome and timing of future events. All statements, other than statements of historical facts, including all statements regarding the company’s strategy, initiatives and future performance, that address activities or results that the company plans, expects, believes, projects, estimates or anticipates will, should or may occur in the future, including future financial or operating results, are forward-looking statements. Actual results for future periods may differ materially from those expressed or implied by these forward-looking statements due to a number of uncertainties and other factors, including operating risks, liquidity risks, legislative or regulatory developments, market factors or current or future litigation. State National Companies’ filings with the Securities and Exchange Commission can be obtained at no charge at www.sec.gov, as well as through our website at www.statenational.com. This Data Sheet does not purport to be all-inclusive or to contain all of the information that a reader may desire regarding the structure or the affairs of the Company. The information contained in this Data Sheet is only current as of March 19, 2015 and the Company undertakes no obligation to update this Data Sheet. 1900 L. Don Dodson Drive Bedford, Texas 76021 Phone 800.877.4567 www.statenational.com Investor Relations Contact: Rick Black Dennard Lascar Associates, LLC 713.529.6600 rblack@dennardlascar.com 3/2015 |
|
|
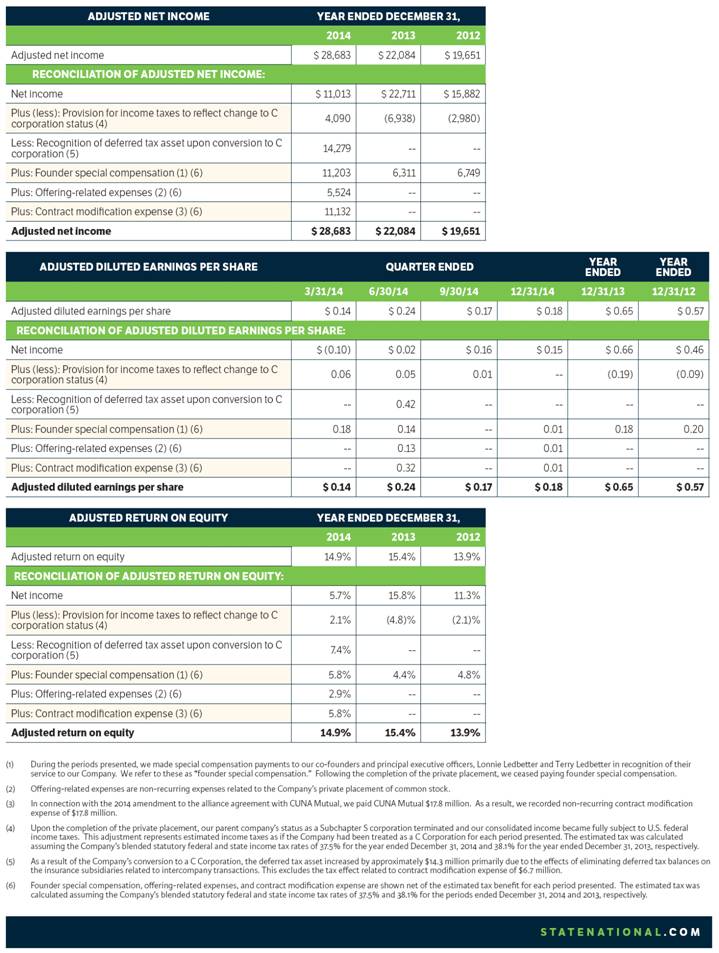
ADJUSTED NET INCOME YEAR ENDED DECEMBER 31, 2014 2013 2012 Adjusted net income $ 28,683 $ 22,084 $ 19,651 RECONCILIATION OF ADJUSTED NET INCOME: Net income $ 11,013 $ 22,711 $ 15,882 Plus (less): Provision for income taxes to reflect change to C corporation status (4) 4,090 (6,938) (2,980) Less: Recognition of deferred tax asset upon conversion to C corporation (5) 14,279 -- -- Plus: Founder special compensation (1) (6) 11,203 6,311 6,749 Plus: Offering-related expenses (2) (6) 5,524 -- -- Plus: Contract modification expense (3) (6) 11,132 -- -- Adjusted net income $ 28,683 $ 22,084 $ 19,651 ADJUSTED DILUTED EARNINGS PER SHARE QUARTER ENDED YEAR ENDED YEAR ENDED 3/31/14 6/30/14 9/30/14 12/31/14 12/31/13 12/31/12 Adjusted diluted earnings per share $ 0.14 $ 0.24 $ 0.17 $ 0.18 $ 0.65 $ 0.57 RECONCILIATION OF ADJUSTED DILUTED EARNINGS PER SHARE: Net income $ (0.10) $ 0.02 $ 0.16 $ 0.15 $ 0.66 $ 0.46 Plus (less): Provision for income taxes to reflect change to C corporation status (4) 0.06 0.05 0.01 -- (0.19) (0.09) Less: Recognition of deferred tax asset upon conversion to C corporation (5) -- 0.42 -- -- -- -- Plus: Founder special compensation (1) (6) 0.18 0.14 -- 0.01 0.18 0.20 Plus: Offering-related expenses (2) (6) -- 0.13 -- 0.01 -- -- Plus: Contract modification expense (3) (6) -- 0.32 -- 0.01 -- -- Adjusted diluted earnings per share $ 0.14 $ 0.24 $ 0.17 $ 0.18 $ 0.65 $ 0.57 ADJUSTED RETURN ON EQUITY YEAR ENDED DECEMBER 31, 2014 2013 2012 Adjusted return on equity 14.9% 15.4% 13.9% RECONCILIATION OF ADJUSTED RETURN ON EQUITY: Net income 5.7% 15.8% 11.3% Plus (less): Provision for income taxes to reflect change to C corporation status (4) 2.1% (4.8)% (2.1)% Less: Recognition of deferred tax asset upon conversion to C corporation (5) 7.4% -- -- Plus: Founder special compensation (1) (6) 5.8% 4.4% 4.8% Plus: Offering-related expenses (2) (6) 2.9% -- -- Plus: Contract modification expense (3) (6) 5.8% -- -- Adjusted return on equity 14.9% 15.4% 13.9% (1) During the periods presented, we made special compensation payments to our co-founders and principal executive officers, Lonnie Ledbetter and Terry Ledbetter in recognition of their service to our Company. We refer to these as “founder special compensation.” Following the completion of the private placement, we ceased paying founder special compensation. (2) Offering-related expenses are non-recurring expenses related to the Company’s private placement of common stock. (3) In connection with the 2014 amendment to the alliance agreement with CUNA Mutual, we paid CUNA Mutual $17.8 million. As a result, we recorded non-recurring contract modification expense of $17.8 million. (4) Upon the completion of the private placement, our parent company’s status as a Subchapter S corporation terminated and our consolidated income became fully subject to U.S. federal income taxes. This adjustment represents estimated income taxes as if the Company had been treated as a C Corporation for each period presented. The estimated tax was calculated assuming the Company’s blended statutory federal and state income tax rates of 37.5% for the year ended December 31, 2014 and 38.1% for the year ended December 31, 2013, respectively. (5) As a result of the Company’s conversion to a C Corporation, the deferred tax asset increased by approximately $14.3 million primarily due to the effects of eliminating deferred tax balances on the insurance subsidiaries related to intercompany transactions. This excludes the tax effect related to contract modification expense of $6.7 million. (6) Founder special compensation, offering-related expenses, and contract modification expense are shown net of the estimated tax benefit for each period presented. The estimated tax was calculated assuming the Company’s blended statutory federal and state income tax rates of 37.5% and 38.1% for the periods ended December 31, 2014 and 2013, respectively. STATENATIONAL.COM |