Attached files
| file | filename |
|---|---|
| 8-K - CURRENT REPORT OF MATERIAL EVENTS OR CORPORATE CHANGES - Hilltop Holdings Inc. | a15-7266_18k.htm |
Exhibit 99.1
|
|
Hilltop Holdings Inc. Corporate Presentation March 2015 |

|
|
Preface 2 200 Crescent Court, Suite 1330 Dallas, TX 75201 Phone: (214) 855-2177 Fax: (817) 887-1687 www.hilltop-holdings.com Please contact: Isabell Novakov Phone: (214) 252-4029 Email: inovakov@plainscapital.com FORWARD-LOOKING STATEMENTS This presentation and statements made by representatives of Hilltop Holdings Inc. (“Hilltop” or the “Company”) during the course of this presentation include “forward-looking statements” within the meaning of the Private Securities Litigation Reform Act of 1995. These forward-looking statements involve known and unknown risks, uncertainties and other factors that may cause the Company’s actual results, performance or achievements to be materially different from any future results, performance or achievements anticipated in such statements. Forward-looking statements speak only as of the date they are made and, except as required by law, the Company does not assume any duty to update forward-looking statements. Such forward-looking statements include, but are not limited to, statements concerning acquisitions, including the Company’s recent acquisition of SWS Group, Inc. (“SWS”) and integration thereof, mortgage loan origination volume, market trends, organic growth, commitment utilization, exposure management in our insurance operations, loan performance, the Company’s other plans, objectives, strategies, expectations and intentions and other statements that are not statements of historical fact, and may be identified by words such as “anticipates,” “believes,” “could,” “estimates,” “expects,” “forecasts,” “goal,” “intends,” “may,” “might,” “pro forma,” “probable,” “projects,” “seeks,” “should,” “view,” or “would” or the negative of these words and phrases or similar words or phrases. The following factors, among others, could cause actual results to differ from those set forth in the forward-looking statements: (i) risks associated with merger and acquisition integration, including the diversion of management time on acquisition-related issues and our ability to promptly and effectively integrate our businesses with those of FNB and SWS and achieve the synergies and value creation contemplated by the acquisitions; (ii) the Company’s ability to estimate loan losses; (iii) changes in the default rate of the Company’s loans; (iv) risks associated with concentration in real estate related loans; (v) the Company’s ability to obtain reimbursements for losses on acquired loans under loss-share agreements with the FDIC; (vi) changes in general economic, market and business conditions in areas or markets where the Company competes; (vii) severe catastrophic events in the Company’s geographic area; (viii) changes in the interest rate environment; (ix) cost and availability of capital; (x) changes in state and federal laws, regulations or policies affecting one or more of Hilltop’s business segments, including changes in regulatory fees, deposit insurance premiums, capital requirements and the Dodd-Frank Wall Street Reform and Consumer Protection Act; (xi) the Company’s ability to use net operating loss carry forwards to reduce future tax payments; (xii) approval of new, or changes in, accounting policies and practices; (xiii) changes in key management; (xiv) competition in the Company’s banking, broker-dealer, mortgage origination, and insurance segments from other banks and financial institutions, as well as insurance companies, mortgage bankers, investment banking and financial advisory firms, asset-based non-bank lenders and government agencies; (xv) failure of the Company’s insurance segment reinsurers to pay obligations under reinsurance contracts; and (xvi) the Company’s ability to use excess cash in an effective manner, including the execution of successful acquisitions. For further discussion of such factors, see the risk factors described in the Hilltop Annual Report on Form 10-K for the year ended December 31, 2014 and other reports filed with the Securities and Exchange Commission. All forward-looking statements are qualified in their entirety by this cautionary statement. Corporate Headquarters Additional Information |
|
|
Hilltop Holdings Overview 3 |

|
|
4 Hilltop Holdings – Overview • Hilltop Holdings is a Dallas, Texas-based diversified financial holding company with a complementary set of operating companies • Hilltop provides banking, broker-dealer, mortgage origination, and insurance through its wholly-owned subsidiaries PlainsCapital Bank, Hilltop Securities Holdings, PrimeLending, and National Lloyds Corporation, respectively • PlainsCapital Bank is the 5th largest1 Texas-based bank with 78 branches at 12/31/14 located in all major Texas markets • Hilltop Securities Holdings is the parent of First Southwest, the #1 financial advisor to municipalities2, and Southwest Securities, the largest full-service brokerage firm based in the Southwest3 • PrimeLending is the 6th largest4 mortgage originator in the U.S. by purchase units and has over 250 locations in 42 states • National Lloyds Corporation provides primarily fire and homeowners insurance for low value dwellings in Texas and other southern states • Hilltop’s operating subsidiaries are well positioned in their respective markets and collectively generate strong earnings and capital Organizational Structure 2014 Pre-Tax Income by Segment ($M) Hilltop Holdings $139.1 $178.2 $6.9 $12.4 $25.7 ($5.9) Banking Broker-Dealer Mortgage Origination Insurance Corporate & Other Hilltop Notes: (1) Per SNL Financial; deposit data as of 6/30/14 and pro forma for acquisitions Notes: (2) Per Ipreo MuniAnalytics; based on number of bond and note issues over the last five years Notes: (3) Based on number of retail financial advisors Notes: (4) Per Marketrac; based on 2014 data |
|
|
5 Hilltop Holdings – History 2004 Operated as Affordable Residential Communities (“ARC”) and completed IPO on NYSE 2005 Gerald J. Ford invested in ARC and joined the Board of Directors 2006 Announced the acquisition of National Lloyds Corporation (completed in 2007) 2007 Company sold all assets of manufactured home communities business for $1.8B, resulting in net cash balance of $550M 2007 Changed name to Hilltop Holdings and began pursuit of bank acquisitions, including five FDIC failures 2011 Hilltop made a $50M investment in SWS Group, Inc. 2012 Acquired PlainsCapital Corporation for ~$700M 2013 Completed purchase and assumption transaction of First National Bank, Edinburg, Texas from FDIC, as receiver 2015 Completed acquisition of SWS Group, Inc. for ~$350M Key Statistics1 ($M) Total Assets $12,377 Total Stockholders’ Equity $1,738 Employees 5,300 Locations 450 Note: (1) As of 12/31/14 and pro forma for SWS transaction • After selling ARC’s assets in 2007, Hilltop had net cash of $550M and pursued several bank acquisitions • In November 2012, Hilltop made the transformational acquisition of PlainsCapital Corporation, while maintaining its leadership and structure • In September 2013, Hilltop expanded its Texas banking footprint via the FDIC-assisted transaction of First National Bank • On January 1, 2015, Hilltop completed the complementary acquisition of SWS Group, creating the leading Texas-based broker-dealer • With assets of $12.4B and well capitalized subsidiaries, Hilltop seeks to build a premier Texas-based bank and diversified financial services holding company |

|
|
Gerald J. Ford Chairman of the Board and Largest Shareholder • Company Tenure: 10 years • Financial Services Experience: 40 years Jeremy B. Ford President and CEO • Company Tenure: 5 years • Financial Services Experience: 15 years Darren E. Parmenter Principal Financial Officer • Company Tenure: 15 years • Financial Services Experience: 8 years Corey G. Prestidge General Counsel • Company Tenure: 7 years • Financial Services Experience: 12 years 6 Hilltop Holdings – Experienced Leadership Jerry L. Schaffner President & CEO PlainsCapital Bank • Company Tenure: 27 years • Financial Services Experience: 33 years Todd Salmans Chairman & CEO PrimeLending • Company Tenure: 9 years • Financial Services Experience: 41 years Hill A. Feinberg Chairman & CEO First Southwest • Company Tenure: 23 years • Financial Services Experience: 40 years Robert Otis CEO National Lloyds • Hired April 2014 • Financial Services Experience: 25 years Alan B. White Vice Chairman, HTH; Chairman & CEO, PCC • Company Tenure: 27 years • Financial Services Experience: 45 years James R. Huffines President and COO • Company Tenure: 14 years • Financial Services Experience: 38 years John A. Martin CFO • Company Tenure: 4 years • Financial Services Experience: 44 years • Hilltop Holdings (HTH) • PlainsCapital Corporation (PCC) • Subsidiary CEOs • Gerald J. Ford, Hilltop’s Chairman and largest shareholder, has successfully acquired and sold banks and other financial institutions for 40 years • Alan B. White, Hilltop’s Vice Chairman, PlainsCapital’s founder and significant shareholder, has consistently grown earnings and assets over the past 27 years through a culture of building long-term relationships and customer responsiveness • Our senior management teams have complementary expertise in operational and capital management |
|
|
$0 $1,000 $2,000 $3,000 $4,000 $5,000 '90 '92 '94 '96 '98 '00 '02 '04 '06 '08 '10 '12 '14 7 Hilltop Holdings – Core Banking Franchise Organic Loans ($M) Recession1 Source: SNL Financial; Data represents PlainsCapital Bank Notes: 2013 bank results include FNB bargain purchase gain; Organic growth represents total loans less acquired loans (1) U.S. recessions as declared by the National Bureau of Economic Research • Since its founding 27 years ago, PlainsCapital Bank has demonstrated consistent loan growth while maintaining quality earnings • Hilltop’s strategy is to continue to build on its core banking franchise, augmented by the diversification of assets and income from non-bank subsidiaries • Organic Loan Growth • Bank Segment Pre-Tax Income and ROAA 172,057 139,109 - 20,000 40,000 60,000 80,000 100,000 120,000 140,000 160,000 180,000 200,000 2013 2014 Pre-Tax Income ($000) ROAA: 1.78% ROAA: 1.20% |

|
|
8 Hilltop Holdings – SWS Transaction Rationale Overview • Significant opportunity to bolster market share and scale of complementary brokerdealer businesses • Fortifies strong presence in Texas, while adding complementary offices throughout the United States • Larger, diversified organization benefits from synergies and more efficient operating platform • Combined bank has a larger, more scalable deposit base given ability to source additional deposits from broker-dealer customers Broker-Dealer Businesses SWS FSW Taxable Fixed Income, Retail Public Finance, Capital Markets, Clearing, Stock Loan Housing, Asset Mgmt Financial Advisor Number of Tax-Exempt Issues: ’10-’14 Source: Tax-Exempt Issues based on Ipreo MuniAnalytics data– financial advisor issuances from 1/1/2010 to 12/31/2014 1,653 1,923 2,221 3,761 4,860 Ehlers Capital Markets Adv Fiscal Adv & Mkt Public Fin Mgmt Pro Forma FSW/SWS |

|
|
9 Hilltop Holdings – SWS Acquisition Update • Acquisition closed on January 1st, 2015 Broker-Dealer • Formed Hilltop Securities Holdings, a new holding company • First Southwest and Southwest Securities will run as parallel entities under Hilltop Securities Holdings until final systems conversion • Broker-dealer led by Hill Feinberg (Chairman/CEO), Jim Ross (Vice Chairman), Bob Peterson (President/COO), John Muschalek (Chief Admin. Officer), Mike Edge (CFO) and Allen Tubb (General Counsel) • Various work streams to integrate broker-dealers and realize efficiencies (real estate, regulatory, IT, employee, finance) Bank • Immediately following the SWS transaction, SWS’s banking subsidiary merged into PlainsCapital Bank and brought four new branches, strong core funding (from sweep deposits) and key personnel to PlainsCapital Bank’s franchise • PlainsCapital Bank to close seven of SWS bank locations (including loan production offices) • Closed branches include Albuquerque, Ruidoso, Fort Worth, and El Paso • Have already reduced SWS bank balance sheet size significantly through securities sales • Bank conversion expected to be completed in Q2 2015 |
|
|
Hilltop Holdings – Pro Forma Summary Balance Sheet 10 • Pro forma for SWS transaction is as of Dec. 31, 2014 and includes mark to market and transaction adjustments • Merger consideration of $349.0 million, includes issuance of 10.0 million shares of Hilltop stock, $78.2 million of cash and $70.3 million existing Hilltop investment in SWS • Mark on loans of approximately $42 million, expected loan accretion of approximately $8.4 million in Year 1 • Bargain purchase gain currently estimated at approximately $80 million • Actual 12/31/2014 Hilltop Consolidated Tier 1 Leverage Ratio of 14.2% and Total Risk- Based Capital Ratio of 19.7% expected to be over 12% and 17%, respectively, pro forma for the transaction Source: Hilltop Holdings 8-K/A filed 2/26/15 Note: Because of (i) the short time period since the acquisition date and (ii) the work of third party specialists engaged to assist in valuing certain assets and liabilities, along with management’s review and approval, not being complete, Hilltop used significant estimates and assumptions to value certain identifiable assets acquired and liabilities assumed in the SWS transaction Pro Forma Pro Forma Hilltop SWS Adjustments Combined Assets: Cash and fed funds 813,075 $ 163,279 $ (83,086) $ 893,268 $ Assets segregated for regulatory purposes - 181,610 - 181,610 Total securities 1,109,461 707,233 243 1,816,937 Loans held for sale 1,309,693 - - 1,309,693 Loans, net 4,521,464 889,635 (34,857) 5,376,242 Broker-dealer and clearing organization receivables 167,884 1,261,022 - 1,428,906 Premises and equipment, net 206,991 14,170 (3,000) 218,161 Other assets 802,257 54,388 (30,078) 826,567 Goodwill and other intangible assets, net 311,591 7,552 6,448 325,591 Total assets 9,242,416 $ 3,278,889 $ (144,330) $ 12,376,975 $ Liabilities: Deposits 6,369,892 $ 1,287,394 $ - $ 7,657,286 $ Broker-dealer and clearing organization payables 179,042 1,113,075 - 1,292,117 Short-term borrowings 387,696 164,240 - 551,936 Advances from Federal Home Loan Bank 375,000 73,418 3,225 451,643 Notes payable 56,684 11,297 (11,297) 56,684 Junior subordinated debentures 67,012 - - 67,012 Other liabilities 345,851 218,844 (2,433) 562,262 Total liabilities 7,781,177 2,868,268 (10,505) 10,638,940 Stockholders' Equity: Preferred equity 114,068 - - 114,068 Common equity 1,346,384 410,621 (133,825) 1,623,180 Total stockholders' equity 1,460,452 410,621 (133,825) 1,737,248 Noncontrolling interest 787 - - 787 Total liabilities and stockholders' equity 9,242,416 $ 3,278,889 $ (144,330) $ 12,376,975 $ Historical |
|
|
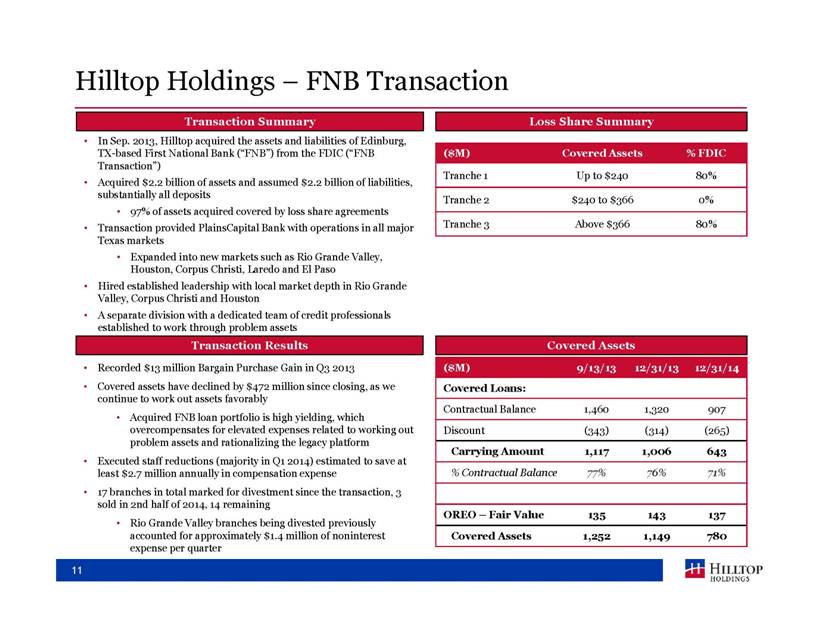
Hilltop Holdings – FNB Transaction Transaction SummaryLoss Share Summary •In Sep. 2013, Hilltop acquired the assets and liabilities of Edinburg, TX-based First National Bank (“FNB”) from the FDIC (“FNB ($M) Covered Assets% FDIC Transaction”) Tranche 1Up to $24080% •Acquired $2.2 billion of assets and assumed $2.2 billion of liabilities, substantially all deposits Tranche 2$240 to $3660% •97% of assets acquired covered by loss share agreements •Transaction provided PlainsCapital Bank with operations in all major Tranche 3Above $36680% Texas markets •Expanded into new markets such as Rio Grande Valley, Houston, Corpus Christi, Laredo and El Paso •Hired established leadership with local market depth in Rio Grande Valley, Corpus Christi and Houston •A separate division with a dedicated team of credit professionals established to work through problem assets Transaction ResultsCovered Assets •Recorded $13 million Bargain Purchase Gain in Q3 2013($M)9/13/13 12/31/13 12/31/14 •Covered assets have declined by $472 million since closing, as we Covered Loans: continue to work out assets favorably Contractual Balance1,4601,320907 •Acquired FNB loan portfolio is high yielding, which overcompensates for elevated expenses related to working out Discount(343)(314)(265) problem assets and rationalizing the legacy platform Carrying Amount1,1171,006643 •Executed staff reductions (majority in Q1 2014) estimated to save at least $2.7 million annually in compensation expense% Contractual Balance77%76%71% •17 branches in total marked for divestment since the transaction, 3 sold in 2nd half of 2014, 14 remaining OREO –Fair Value135143137 •Rio Grande Valley branches being divested previously accounted for approximately $1.4 million of noninterest Covered Assets1,2521,149780 expense per quarter 11 |
|
|
12 Hilltop Holdings – 2014 Financial Summary Selected Items Q1 2014 Q2 2014 Q3 2014 Q4 2014 FY 2014 Net Income to Common ($000) $23,760 $27,085 $23,386 $31,716 $105,947 EPS - Diluted ($) $0.26 $0.30 $0.26 $0.35 $1.17 ROAA (%) 1.14% 1.24% 1.03% 1.42% 1.26% ROAE (%) 7.65% 7.99% 6.51% 8.55% 8.01% Book Value Per Share ($) $13.76 $14.22 $14.51 $14.93 $14.93 NIM (taxable equivalent) 4.62% 5.18% 4.38% 4.72% 4.74% Assets ($000) 9,033,432 9,396,448 9,180,402 9,242,416 9,242,416 Loans, Gross ($000) 4,559,394 4,559,850 4,520,118 4,563,116 4,563,116 Deposits ($000) 6,663,176 6,155,310 6,236,282 6,369,892 6,369,892 Hilltop Stockholders’ Equity ($000) 1,354,497 1,396,442 1,422,975 1,460,452 1,460,452 NPLs/Total Loans 1 0.51% 0.43% 0.48% 0.42% 0.42% NPAs/Total Assets1 0.32% 0.30% 0.29% 0.25% 0.25% Tier 1 Leverage Ratio2 13.12% 13.51% 13.63% 14.17% 14.17% Total Risk Based Capital Ratio 19.32% 18.79% 19.28% 19.69% 19.69% Notes: (1) NPLs, NPAs and Total Loans exclude covered loans and covered OREO (2) Based on the end of period Tier 1 capital divided by total average assets during the quarter, excluding goodwill and intangible assets |
|
|
13 Hilltop Holdings – Operational Updates PlainsCapital Bank • PlainsCapital Bank continues to prudently grow legacy platform, while managing expenses at former FNB franchise that are exceeded by gains from working out covered assets • Favorable loan pipeline with $1.43 billion in unfunded commitments versus $1.36 billion at Q3 2014 • Adding branches in desirable markets in Aledo, Victoria, Alice, Corpus Christi and Houston • 78 operating branches as of 12/31/14; continuing to divest unprofitable branches acquired in the FNB Transaction • Solid core deposit base with low cost of funds of 25 basis points for 2014 • Legacy PCB’s credit quality remains strong – non-covered NPAs to total consolidated assets decreased to 0.25% • Relatively little energy exposure – represents 6.5% of loan portfolio PrimeLending • PrimeLending had unprofitable quarter driven by seasonally lower volume and losses resulting from MSR fair value changes, partially offset by improved servicing income • Gain on sale margins flat between Q4 2014 and Q3 2014 • Ongoing efforts to improve platform’s efficiency, as volume increased 16% compared with Q4 2013, even with lower loan officer headcount (currently 1,229) • PrimeLending experienced market share gains (FY 2014 market share increased to 0.96% from 0.68% during FY 2013) and continues to focus on purchase volume (made up 80% of FY 2014 volume vs. 69% in FY 2013) • Opportunistically adding MSR to boost servicing income First Southwest • First Southwest had a favorable quarter due to improvement in most business lines, but primarily driven by its U.S. Agency to-be-announced (“TBA”) business and public finance businesses that have benefited from clients capitalizing on the low interest rate environment • On 1/1/15, moved from a subsidiary of PlainsCapital Bank to a subsidiary of Hilltop Securities Holdings National Lloyds Corporation • National Lloyds Corporation had a strong quarter with a 77% combined ratio as a result of improved loss experience and seasonally favorable weather • Recorded best annual results since the company was founded |
|
|
Hilltop Holdings – Existing Long Term Obligations 14 SBLF TruPS Insurance Company Debt Entity Held At • Hilltop Holdings (Parent Company) • PlainsCapital Corporation (Parent Company) • National Lloyds Corporation and insurance subsidiaries Description • Small Business Loan Fund – Govt Program • Series B • Non-cumulative • Coupon step up to 9% on 3/26/16 • 4 series issued from ‘01 – ’08 • 30 year term • 100% Floating debt • $27.5mm Surplus Notes • $20mm National Lloyds Holding Company • 96% Maturing in approx. 20 years • Floating Rate Outstanding ($000s) $114,068 $67,012 $47,500 Rate/Spread 5.00% Fixed +3.22% avg spread to 3mo LIBOR +3.79% wtd avg spread to 3mo LIBOR Capital Credit Tier 1 Tier 1 None Prepayment Ability At any time at 100% of par At any time at 100% of par At any time at 100% of par • SBLF step up in March 2016 to 9.00% dividend • TruPS provide long-term Tier 1 Capital and are currently relatively inexpensive, though floating rate • National Lloyds debt provides long-term capital to subsidiary insurance companies • Hilltop and PlainsCapital were recently issued BBB ratings by Fitch Note: Does not include First Southwest non-recourse notes of $4.2 million, due January 2035 |

|
|
Subsidiaries Financial Review 15 |
|
|
C&I 39% Real Estate 49% C&D 10% Consumer 1% 16 • Pre-tax income increased to $41.1 million in Q4 2014 versus $24.6 million in Q3 2014 primarily due to OREO write-down in Q3 2014 and an increase in loan interest income related to accretion and higher yields in Q4 2014 • Provision for Loan Losses of $4.1 million largely relates to PCI loans and was $1.9 million greater than the fourth quarter of 2013 provision of $2.2 million • PrimeLending funds originations through a $1.5 billion warehouse line from PlainsCapital Bank; $1.2 billion was drawn at December 31st, 2014 • Tier 1 Leverage Ratio1 increased to 10.31%, up from 9.95% in Q3 2014 Summary Results ($000) Q1 2014 Q2 2014 Q3 2014 Q4 2014 FY 2014 Net Interest Income 79,572 90,828 78,285 85,692 334,377 Provision for Loan Losses (3,228) (5,516) (4,049) (4,123) (16,916) Noninterest Income 16,228 16,392 17,638 17,180 67,438 Noninterest Expense (60,677) (60,240) (67,236) (57,637) (245,790) Income Before Taxes 31,895 41,464 24,638 41,112 139,109 Notes: (1) Based on the end of period Tier 1 capital divided by total average assets during the respective quarter , excluding goodwill and intangible assets Notes: (2) Loans HFI mix represents consolidated balances at Hilltop and, therefore, eliminate intercompany loans ROAA (%) 1.04% 1.36% 0.77% 1.42% 1.20% NIM (%) 4.80% 5.52% 4.62% 5.08% 5.00% Assets ($B) $8.0 $8.2 $8.0 $8.0 $8.0 Tier 1 Leverage Ratio1 (%) 9.53% 9.97% 9.95% 10.31% 10.31% Loans HFI Mix 4Q14 Loan Growth Total Loans2: $4.6 billion PlainsCapital Bank – Q4 2014 Highlights 0 500 1,000 1,500 2,000 2,500 3,000 3,500 4,000 4,500 5,000 Q3 '13 Q4 '13 Q1 '14 Q2 '14 Q3 '14 Q4 '14 Balance ($000) Non-Covered Loans Covered Loans Total Loans |

|
|
PlainsCapital Bank – Loan Portfolio by Classification 17 Note: PCI stands for Purchased Credit Impaired loans. Loan classification mix represents consolidated balances at Hilltop and, therefore, eliminate intercompany loans. Amounts above equal carrying value, after deductions for discount Covered PCI Loans Covered Non-PCI Loans Non-Covered PCI Loans Non-Covered Non-PCI Loans Q4 2014 Total: $48.9 million Q4 2014 Total: $3,871.6 million Q4 2014 Total: $435.4 million Q4 2014 Total: $207.3 million C&I 5% Real Estate 85% C&D 11% C&I 5% Real Estate 89% C&D 6% C&I 27% Real Estate 49% C&D 19% Consumer 4% C&I 45% Real Estate 43% C&D 10% Consumer 1% |
|
|
PlainsCapital Bank – PCI Loans at Dec. 31, 2014 18 ($000) Covered PCI Non-Covered PCI Total PCI Outstanding Balance 685,393 67,740 753,133 (Discount) (250,005) (18,831) (268,836) Carrying Amount 435,388 48,909 484,297 Allowance for Loan Loss 4,534 5,319 9,853 Total PCI Loans, Net of Allowance 430,854 43,590 474,444 Carrying Amount (Net of Allowance) / Outstanding Balance 62.9% 64.3% 63.0% Note: Outstanding balance represents unpaid principal balance net of charge-offs and interest applied to principal • Purchased Credit Impaired (“PCI”) loans are loans with evidence of credit quality deterioration, for which it is probable that not all contractually required payments will be collected • PCI loans include covered and non-covered loans • PCI loans had a total discount of $268.8 million • $250.0 million of the discount was related to covered loans • Increase in accretable yield due to increased expected cash flows in Q4 2014 of $22.9 million for covered PCI loans and $1.3 million for non-covered PCI loans • Weighted average expected loss on PCI loans associated with each of the PlainsCapital Merger and FNB Transaction was 24% |

|
|
PlainsCapital Bank – Non-PCI Loans at Dec. 31, 2014 19 ($000) Covered Non-PCI Non-Covered Non-PCI Total Non-PCI Outstanding Balance 222,105 3,896,773 4,118,878 (Discount) (14,853) (25,206) (40,059) Carrying Amount 207,252 3,871,567 4,078,819 Allowance for Loan Loss 77 31,722 31,799 Total Non-PCI Loans, Net of Allowance 207,175 3,839,845 4,047,020 Carrying Amount (Net of Allowance) / Outstanding Balance 93.3% 98.5% 98.3% Note: Outstanding balance represents unpaid principal balance net of charge-offs and interest applied to principal • Non-PCI loans include newly originated loans, acquired loans without credit impairment at acquisition, and acquired loans that have renewed • Non-PCI loans include covered loans and non-covered loans • Portfolio on balance sheet at 98.3% unpaid principal balance with a total discount of $40.1 million • $25.2 million discount was related to non-covered loans, while covered loans had a $14.9 million discount |
|
|
0.0% 0.5% 1.0% 1.5% 2.0% 2.5% 3.0% 3.5% 4.0% 4.5% 5.0% '90 '92 '94 '96 '98 '00 '02 '04 '06 '08 '10 '12 '14 20 PlainsCapital Bank – Asset Quality Trends PlainsCapital Recession1 U.S. Average2 Source: SNL Financial, Company Filings Notes: (1) U.S. recessions as declared by the National Bureau of Economic Research Notes: (2) U.S. average based on all banks with $5B - $20B of assets for each year • PlainsCapital Bank has maintained strong credit quality that has consistently outperformed U.S. averages, even during recessions • 2013 and 2014 NPLs affected by loans from FNB Transaction that are covered under loss-share agreements • Non-covered NPAs, largely from legacy PCB franchise, have continued to decline and remain at very low levels • Covered and Non-Covered NPLs to Loans 2014 uptick driven by covered loans from FNB Transaction • Non-Covered NPAs 0.00% 0.05% 0.10% 0.15% 0.20% 0.25% 0.30% 0.35% 0.40% 0.45% 0.50% - 5,000 10,000 15,000 20,000 25,000 30,000 35,000 Q2 '13 Q3 '13 Q4 '13 Q1 '14 Q2 '14 Q3 '14 Q4 '14 Non-Covered, Non-Performing Assets ($000) Non-Covered, Non-Performing Assets/Total Assets (%) |

|
|
Non Int. Bearing Demand 33% NOW 19% Money Market 15% Demand 2% Savings 5% Time 26% 21 PlainsCapital Bank – Markets and Deposits • PCB is now in all major Texas markets with seasoned lenders and core deposits • Founded in Lubbock with #1 market share • Legacy PCB has strong positions in Dallas, Ft. Worth, Austin and San Antonio • With the FNB Transaction, expanded into new markets such as Rio Grande Valley, Houston, Corpus Christi, Laredo and El Paso • 17 branches in total marked for divestment since the FNB Transaction, 3 sold in 2nd half of 2014, 14 remaining • Adding branches in desirable markets in Aledo, Victoria, Alice, Corpus Christi and Houston • The SWS Transaction brought four new branches, strong core funding (from sweep deposits) and key personnel to PlainsCapital Bank’s franchise Branch Map (78 Branches) Rank Texas Headquartered Banks & Thrifts Branches Deposits ($mm) Market Share (%) 1 Cullen/Frost Bankers Inc. 132 22,594 3.58 2 Prosperity Bancshares Inc. 258 14,415 2.28 3 Texas Capital Bancshares Inc. 13 10,549 1.67 4 Comerica Inc. 137 10,347 1.64 5 PlainsCapital Bank 78 7,142 1.13 Source: SNL Financial; Map includes new branches since 12/31/14 as well as branches to be closed (including New Mexico) Notes: (1) Deposit market share data as of June 30, 2014 and pro forma for acquisitions; Includes banks & thrifts headquartered in Texas (2) Deposit mix represents consolidated balances at Hilltop and, therefore, eliminate intercompany deposits Texas Deposit Market Share1 Deposit Mix 4Q14 Total Deposits2: $6.4 billion |
|
|
22 PlainsCapital Bank – Liquidity and Securities • The securities portfolio is a conservative mix with predominantly Agency Step-Up bonds • The securities portfolio is a source of liquidity and diversity; managed to have minimal credit risk • During the 4th quarter of 2014, the Bank’s investment portfolio decreased by $148 million, while the unrealized loss decreased by $15 million Investment Portfolio Source: Securities portfolio based on PlainsCapital Bank 12/31/14 Call Report; includes Securities HFS and HTM Note: Liquid unencumbered assets represents cash plus liquid unpledged securities Q4 2014 Investment Portfolio Mix • Total cash balance available of $536 million, mostly held at Federal Reserve Bank • Available borrowings of $6.1 billion, predominantly FHLB and brokered money markets/CDs • Additional untapped core deposits of $1.5 billion from FSW and SWS broker-dealer sweep accounts Liquidity ($M) Cash Balance Available $536 Additional Borrowing Availability $6,073 Total Available Liquidity $6,609 Liquid Unencumbered Assets / Total Assets (%) 7.0% Available Liquidity / Total Assets (%) 82.4% Q4 2014 Balance: $895.7 million Available Source of Liquidity Treasury HTM, 3% Agency AFS, 56% CMO AFS, 10% CMO HTM, 6% MBS AFS, 6% MBS HTM, 3% Municipals AFS, 15% Municipals HTM, 1% |

|
|
23 PlainsCapital Bank – Interest Rate Sensitivity Change in Interest Rates (bps) -50 +100 +200 +300 Q4 2013 - % 1.51% (3.84%) (3.23%) 1.41% Q4 2013 - $ 3,979 (10,155) (8,538) 3,732 Q4 2014 - % 0.17% (1.12%) 1.65% 6.16% Q4 2014 - $ 414 (2,762) 4,087 15,201 Changes in Net Interest Income • FNB Transaction was a significant driver of the historical negative gap balance (liability sensitive) • The Bank has taken various measures to improve the gap and interest shock scenarios • Combination of (i) employment of one year term FHLB advances, (ii) retention of maturing higher cost customer CD’s through a lower cost term issuance of customer CD’s, and (iii) substitution of FHLB LOC’s for matured or called securities used for securing public fund deposits • With interest rates remaining low for such an extended period of time, loan pricing pressures occurred. This was positively offset by the lowering of loan floor levels • Resulted in the Bank decreasing the liability sensitivity by over $97 million in 2014 (when looking at terms up to 1 year) • As SWS Bank was liability sensitive which would increase the gap, we sold approximately $400 million of SWS Bank securities after transaction closing Reported Gap Historical Balances ($000) Terms Up to 1 Year Q4 2013 (168,441) Q4 2014 (71,180) |
|
|
24 PrimeLending – Overview • Headquartered in Dallas, Texas, PrimeLending has grown from a staff of 20 producing $80 million in annual closed loan volume to a staff of more than 2,500 producing approximately $10.4 billion in 2014 • PrimeLending focuses on the purchase mortgage business, which represented 80% of volume in 2014 versus the US industry average of 57% during the same period • Ranked #2 in Texas in Purchase Units by Market Trac (#6 in the Nation and #1 in Dallas in 2014 by Market Trac) • Generates noninterest income by selling substantially all mortgage loans it originates to various investors in the secondary market (majority servicing released) • Texas and California represented 39% of 2014 origination volume • Loan products include 30-year and 15-year fixed rate conventional mortgages, adjustable rate mortgages, jumbo loans, FHA and VA loans, permanent construction financing, relocation programs and refinancing options (no sub-prime loans) 2014 Originations By Geography 2014 Originations By Mortgage Type Total Mortgage Originations: $10.4 billion Texas, 23.7% California, 15.0% Florida, 4.9% North Carolina, 4.1% Ohio, 3.9% Arizona, 3.3% Virginia, 3.1% South Carolina, 3.0% Washington, 2.9% Conventional, 62.6% Government, 26.4% Jumbo, 8.3% Other, 2.7% Source: Industry data per Mortgage Bankers Association Mortgage Finance Forecast as of Feb. 20, 2015; Rankings per Market Trac |
|
|
25 PrimeLending – Q4 2014 Highlights Summary Results ($000) Q1 2014 Q2 2014 Q3 2014 Q4 2014 FY 2014 Net Interest Income (4,139) (2,389) (3,197) (2,866) (12,591) Provision for Loan Losses – – – – – Noninterest Income 91,763 122,820 128,989 113,204 456,776 Noninterest Expense (90,632) (111,224) (114,690) (115,274) (431,820) Income Before Taxes (3,008) 9,207 11,102 (4,936) 12,365 Volume - % Purchase 78.7% 84.4% 81.8% 74.5% 80.0% • Pre-tax loss narrowed to $4.9 million in Q4 2014 versus $7.6 million in Q4 2013 due to lower net interest expense and higher origination volumes • Origination volume of $2.7 billion in Q4 2014 • Purchase volume decreased to 74.5% in Q4 2014 from 78.8% in Q4 2013 • Refinance volume increased $193.9 million, or 39.0%, from Q4 2013 to $690.9 million in Q4 2014 due to a drop in interest rates • Noninterest income increased $15.0 million, or 15.2%, from Q4 2013 to $113.2 million in Q4 2014 due to higher origination volume and servicing income • Noninterest expense increased $14.6 million, or 14.5%, from Q4 2013 to $115.3 million in Q4 2014 due to higher variable compensation associated with higher origination volume • MSR asset value of $36.2 million at Q4 2014 • Fair value of net MSR declined $5.0 million during the quarter Mortgage Origination Volume ($M) 1,469 2,396 2,409 2,022 8,296 397 443 537 691 2,068 $1,866 $2,839 $2,946 $2,713 $10,364 $0 $3,000 $6,000 $9,000 $12,000 Q1 2014 Q2 2014 Q3 2014 Q4 2014 FY 2014 Home Purchases Refinancings |

|
|
Public Finance, 47% Capital Markets, 14% Correspondent Clearing, 15% Housing and Structured Finance, 15% Asset Management, 5% Other, 5% 26 First Southwest – Overview and Q4 2014 Highlights Summary Results ($000) Q1 2014 Q2 2014 Q3 2014 Q4 2014 FY 2014 Net Interest Income 2,629 3,178 3,269 3,068 12,144 Provision for Loan Losses (14) (17) 16 (2) (17) Noninterest Income 24,597 25,838 29,726 39,290 119,451 Noninterest Expense (27,365) (28,359) (31,782) (37,209) (124,715) Income Before Taxes (153) 640 1,229 5,147 6,863 • Formed in Dallas in 1946 and acquired by PlainsCapital in 2008 • Diversified investment banking firm and a registered broker-dealer • Five primary lines of business: (1) Public Finance, (2) Capital Markets, (3) Correspondent Clearing, (4) Housing and Structured Finance and (5) Asset Management • Public Finance is the largest department and constantly ranked among the top financial advisors in the nation • Provides core deposits to PlainsCapital Bank through sweep accounts • Pre-tax income grew to $5.1 million in Q4 2014 versus $1.2 million in Q3 2014 primarily due to increase in fees resulting from advising public finance clients on debt offerings • The U.S. Agency to-be-announced, or TBA, business, which provides interest rate protection for housing authorities, had fair value changes on derivatives that provided a net gain of $4.8 million for Q4 2014 • Noninterest expense increased $5.4 million, or 17.1%, from Q3 2014 to $37.2 million in Q4 2014 primarily due to increases in compensation that varies with revenue • Established a $1.9 million deferred tax asset valuation allowance during Q4 2014 related to capital losses on certain investments Overview Q4 2014 Highlights 2014 Net Revenue By Department |
|
|
27 National Lloyds Corp. – Overview and Q4 2014 Highlights Summary Results ($000) Q1 2014 Q2 2014 Q3 2014 Q4 2014 FY 2014 Net Interest Income 980 838 808 1,046 3,672 Provision for Loan Losses – – – – – Noninterest Income 42,773 43,123 44,014 43,667 173,577 Noninterest Expense (32,341) (49,420) (36,636) (33,144) (151,541) Income Before Taxes 11,412 (5,459) 8,186 11,569 25,708 • For over 40 years, specializes in low-value homeowners and mobile home products • A.M. Best “A” (Excellent) Rated • Strong pre-tax income of $11.6 million in Q4 2014 primarily driven by seasonally lower losses, though declined from $17.5 million in Q4 2013 as prior year included a gain resulting from the redemption of Hilltop’s Senior Exchangeable Notes • As a result of exposure management initiatives, policies in force decreased by 5.0% in 2014, however higher rates more than offset this decline, as noninterest income grew 4.5% from $166.2 million in FY 2013 to $173.6 million in FY 2014 Combined Ratio Homeowners 44% Fire 32% Mobile Home 22% Commercial 2% Q4 2014 Direct Premiums Written Total: $38.1 million 40.4% 43.7% 70.3% 57.4% 31.3% 33.1% 32.3% 31.9% 71.7% 76.8% 102.6% 89.3% 0.0% 20.0% 40.0% 60.0% 80.0% 100.0% 120.0% Q4 2013 Q4 2014 FY 2013 FY 2014 Loss & LAE Ratio Underwriting Expense Ratio |
|
|
Hilltop Holdings Financial Review 28 |

|
|
29 Hilltop Holdings – 2014 Summary Income Statement ($000) Q1 2014 Q2 2014 Q3 2014 Q4 2014 FY 2014 Interest income 91,828 104,408 93,217 99,316 388,769 Interest expense 6,407 5,962 7,457 7,802 27,628 Net interest income 85,421 98,446 85,760 91,514 361,141 Provision for loan losses 3,242 5,533 4,033 4,125 16,933 Net interest income after provision for loan losses 82,179 92,913 81,727 87,389 344,208 Noninterest income 170,100 203,281 212,135 213,795 799,311 Noninterest expense 212,629 251,212 254,744 246,768 965,353 Income before income taxes 39,650 44,982 39,118 54,416 178,166 Income tax expense 14,354 16,294 14,010 20,950 65,608 Net income 25,296 28,688 25,108 33,466 112,558 Less: Net income attributable to noncontrolling interest 110 177 296 325 908 Income attributable to Hilltop 25,186 28,511 24,812 33,141 111,650 Dividends on preferred stock 1,426 1,426 1,426 1,425 5,703 Income applicable to Hilltop common stockholders 23,760 27,085 23,386 31,716 105,947 |
|
|
30 Hilltop Holdings – Net Interest Income & Margin • NIM increased by 34 bps in Q4 2014 to 4.72% compared with 4.38% in Q3 2014 due to higher yields on gross loans, partially offset by higher costs of interest bearing deposits • Yield on earning assets of 5.09% driven by increase in gross loan balance • Increase in cost of interest-bearing deposits due to run-off of time deposit premium • For Q4 2014, the tax equivalent NIM for Hilltop was 119 bps greater due to purchase accounting • Accretion of discount on loans of $21.6 million • Amortization of premium on acquired securities of $1.2 million • Amortization of premium on acquired time deposits of $0.1 million Annual Yields and Rates (%) Q1 2014 Q2 2014 Q3 2014 Q4 2014 FY 2014 Interest Earning Assets Loans, Gross 6.29 6.63 5.65 6.25 6.21 Investment Securities, Taxable 2.71 2.66 2.63 2.49 2.72 Investment Securities, Non-Taxable 4.06 3.82 3.74 3.73 3.84 Fed Funds Sold and Securities to Resell 0.29 0.28 0.29 0.31 0.29 Interest Earning Deposits 0.25 0.22 0.21 0.22 0.23 Other 5.67 5.62 5.13 4.27 5.16 Total Int. Earning Assets 4.90 5.44 4.74 5.09 5.08 Interest Bearing Liabilities Interest Bearing Deposits 0.31 0.27 0.38 0.45 0.35 Notes Payable and Borrowings 1.60 1.18 1.12 1.28 1.27 Total Int. Bearing Liabilities 0.46 0.43 0.54 0.60 0.51 Net Interest Margin (Stated) 4.62 5.18 4.38 4.72 4.74 Net Interest Margin (Pre-PAA) 3.67 3.78 3.51 3.53 3.49 Net Interest Spread 4.44 5.01 4.20 4.49 4.57 |

|
|
31 Hilltop Holdings – Noninterest Income • Noninterest income was $213.8 million in Q4 2014, up 17.2% from Q4 2013 • Net gains from the sale of loans, other mortgage production income and mortgage loan origination fees increased $14.5 million, or 14.8%, from Q4 2013 to $112.7 million in Q4 2014, representing 53% of noninterest income for the quarter • Net insurance premiums earned was $41.6 million in Q4 2014, representing 19% of noninterest income for the quarter • Financial advisory fees and commissions increased $11.4 million, or 50.0%, from Q4 2013 to $34.2 million in Q4 2014, representing 16% of noninterest income for the quarter • Fair value changes of SWS investment during Q4 2014 resulted in a net gain of $6.0 million (included in Other Noninterest Income) 82.1 79.1 106.1 108.6 96.6 16.1 12.3 17.0 17.6 16.1 41.5 40.3 40.8 41.8 41.6 22.8 21.3 22.3 24.1 34.2 20.0 17.0 17.2 20.0 25.3 $182.5 $170.1 $203.3 $212.1 $213.8 $0.0 $50.0 $100.0 $150.0 $200.0 $250.0 $300.0 Q4 2013 Q1 2014 Q2 2014 Q3 2014 Q4 2014 Noninterest Income ($M) Gains on Sale And Other Mortgage Income Mortgage Origination Fees Net Insurance Premium Earned Investment Advisory Fees & Commissions Other |
|
|
32 Hilltop Holdings – Noninterest Expense • Noninterest expense was $246.8 million in Q4 2014, up 12.3% from Q4 2013 • Compensation increased $21.0 million, or 18.7%, from Q4 2013 to $133.4 million in Q4 2014, representing 54% of noninterest expense for the quarter • Occupancy and equipment expense decreased $1.5 million, or 5.7%, from Q4 2013 to $24.3 million in Q4 2014, representing 10% of noninterest expense for the quarter • Loss and LAE and policy acquisition and other underwriting expense were $30.2 million in Q4 2014, representing 12% of noninterest expense for the quarter • Other expenses increased $6.2 million, or 11.7%, from Q4 2013 to $58.9 million in Q4 2014 • Amortization of identifiable intangibles from purchase accounting was $2.5 million in Q4 2014 • Transaction expenses related to the SWS transaction were $1.4 million for FY 2014 112.4 106.4 124.4 126.4 133.4 16.8 18.3 35.3 22.6 18.2 12.1 11.7 11.7 11.6 12.0 25.7 26.3 25.8 25.3 24.3 52.7 49.8 54.1 68.8 58.9 $219.8 $212.6 $251.2 $254.7 $246.8 $0.0 $50.0 $100.0 $150.0 $200.0 $250.0 $300.0 Q4 2013 Q1 2014 Q2 2014 Q3 2014 Q4 2014 Noninterest Expense ($M) Comp. and Benefits Loss and LAE Policy Acquisition and Other Underwriting Expense Occupancy and Equipment, net Other |
|
|
Hilltop Holdings – Balance Sheet • Balance sheet grew in Q4 2014, as decline in borrowings were more than offset by growth in deposits, and growth in noncovered loans outpaced workout of covered loans • Gross non-covered loans HFI increased $151.6 million, or 4.0%, from Q3 2014 to $3.9 billion at Q4 2014 • Gross covered loans decreased $108.6 million, or 14.5%, from Q3 2014 to $642.6 million at Q4 2014 due to successful ongoing efforts to resolve troubled loans acquired with FNB Transaction in Q3 2013 • $363.7 million, or 36.1%, decrease versus Q4 2013 • Covered OREO increased by $10.1 million versus Q3 2014, as covered loans defaulted and transferred to OREO • $5.9 million, or 4.1%, decrease versus Q4 2013 • Gross loans HFI (covered and non-covered) to deposits ratio declined to 71.6% at Q4 2014, down from 72.5% at Q3 2014 • Total deposits increased $133.6 million, or 2.1%, from Q3 2014 to $6.37 billion at Q4 2014 • Non-interest bearing deposits made up 66.1% the growth from Q3 2014 to Q4 2014 • Common equity increased $37.5 million, or 2.9%, from Q3 2014 to $1.35 billion at Q4 2014 due to earnings and AOCI 33 ($000s) Q4 2013 Q3 2014 Q4 2014 Assets Cash & Federal Funds 746,023 647,588 813,075 Securities 1,261,989 1,332,342 1,109,461 Loans Held for Sale 1,089,039 1,272,813 1,309,693 Non-Covered Loans HFI, Gross 3,514,646 3,768,843 3,920,476 Allowance for Non-Covered Loan Losses (33,241) (39,027) (37,041) Non-Covered Loans HFI, Net 3,481,405 3,729,816 3,883,435 Covered Loans, Net of Allowance 1,005,308 747,514 638,029 Covered OREO 142,833 126,798 136,945 FDIC Indemnification Asset 188,291 149,788 130,437 Goodwill & Other Intangibles 322,729 314,317 311,591 Other Assets 666,505 859,426 909,750 Total Assets 8,904,122 9,180,402 9,242,416 Liabilities and Stockholders Equity Non-Int. Bearing Deposits 1,773,749 1,988,066 2,076,385 Int. Bearing Deposits 4,949,169 4,248,216 4,293,507 Total Deposits 6,722,918 6,236,282 6,369,892 Short Term Borrowings 342,087 845,984 762,696 Notes Payable 56,327 55,684 56,684 Junior Subordinated Debentures 67,012 67,012 67,012 Other Liabilities 403,856 551,696 524,893 Total Liabilities 7,592,200 7,756,658 7,781,177 SBLF Preferred Stock 114,068 114,068 114,068 Common Equity 1,197,073 1,308,907 1,346,384 Total Hilltop Equity 1,311,141 1,422,975 1,460,452 Minority Interest 781 769 787 Total Liabilities & Equity 8,904,122 9,180,402 9,242,416 |