Attached files
| file | filename |
|---|---|
| EXCEL - IDEA: XBRL DOCUMENT - EVOLVING SYSTEMS INC | Financial_Report.xls |
| EX-32.1 - EX-32.1 - EVOLVING SYSTEMS INC | a15-1803_1ex32d1.htm |
| EX-31.1 - EX-31.1 - EVOLVING SYSTEMS INC | a15-1803_1ex31d1.htm |
| EX-21.(A) - EX-21.(A) - EVOLVING SYSTEMS INC | a15-1803_1ex21da.htm |
| EX-31.2 - EX-31.2 - EVOLVING SYSTEMS INC | a15-1803_1ex31d2.htm |
| EX-32.2 - EX-32.2 - EVOLVING SYSTEMS INC | a15-1803_1ex32d2.htm |
| EX-23.1 - EX-23.1 - EVOLVING SYSTEMS INC | a15-1803_1ex23d1.htm |
UNITED STATES
SECURITIES AND EXCHANGE COMMISSION
Washington, D.C. 20549
FORM 10-K
|
x |
Annual Report Pursuant to Section 13 or 15(d) of the Securities Exchange Act of 1934 |
For the fiscal year ended December 31, 2014
OR
|
o |
Transition Report Pursuant to Section 13 or 15(d) of the Securities Exchange Act of 1934 |
For the transition period from to
Commission File Number: 001-34261
EVOLVING SYSTEMS, INC.
(Exact name of registrant as specified in its charter)
|
Delaware |
|
84-1010843 |
|
(State or other jurisdiction of incorporation or organization) |
|
(I.R.S. Employer Identification Number) |
|
|
|
|
|
9777 Pyramid Court, Suite 100, Englewood, Colorado |
|
80112 |
|
(Address of principal executive offices) |
|
(Zip Code) |
(303) 802-1000
(Registrant’s telephone number, including area code)
Securities registered under Section 12(b) of the Act:
|
Common Stock, Par Value $0.001 Per Share |
|
The Nasdaq Capital Market |
|
(Title of Class) |
|
(Name of exchange on which registered) |
Securities registered under Section 12(g) of the Act: None
Indicate by check mark if the registrant is a well-known seasoned issuer, as defined in Rule 405 of the Securities Act. Yes o No x
Indicate by check mark if the registrant is not required to file reports pursuant to Section 13 or Section 15(d) of the Exchange Act. Yes o No x
Indicate by check mark whether the registrant (1) has filed all reports required to be filed by Section 13 or 15(d) of the Securities Exchange Act of 1934 during the preceding 12 months (or for such shorter period that the registrant was required to file such reports), and (2) has been subject to such filing requirements for the past 90 days. Yes x No o
Indicate by check mark whether the registrant has submitted electronically and posted on its corporate Web site, if any, every Interactive Data File required to be submitted and posted pursuant to Rule 405 of Regulation S-T (§232.405 of this chapter) during the preceding 12 months (or for such shorter period that the registrant was required to submit and post such files). Yes x No o
Indicate by check mark if disclosure of delinquent filers pursuant to Item 405 of Regulation S-K is not contained herein, and will not be contained, to the best of registrant’s knowledge, in definitive proxy or information statements incorporated by reference in Part III of this Form 10-K or any amendment to this Form 10-K. x
Indicate by check mark whether the registrant is a large accelerated filer, an accelerated filer, or a non-accelerated filer, or a smaller reporting company. See definition of “large accelerated filer”, “accelerated filer” and “smaller reporting company” in Rule 12b-2 of the Exchange Act.
|
Large accelerated filer o |
|
Accelerated filer o |
|
|
|
|
|
Non-accelerated filer o |
|
Smaller reporting company x |
Indicate by check mark whether the registrant is a shell company (as defined in Rule 12b-2 of the Exchange Act). Yes o No x
The aggregate market value of the Common Stock held by non-affiliates of the registrant, based upon the last sale price of the Common Stock reported on the Nasdaq Capital Market, was approximately $65.9 million as of June 30, 2014.
The number of shares of Common Stock outstanding was 11,666,405 as of March 12, 2015.
DOCUMENTS INCORPORATED BY REFERENCE
The information required by Part III (Items 10, 11, 12, 13 and 14) is incorporated by reference to portions of the registrant’s definitive proxy statement for the 2015 Annual Meeting of Stockholders, which will be filed with the Securities and Exchange Commission within 120 days after the close of the 2014 year. Except as expressly incorporated by reference, the Proxy Statement shall not be deemed to be a part of this report on Form 10-K.
EVOLVING SYSTEMS, INC.
Annual Report on Form 10-K
For the year ended December 31, 2014
|
|
|
Page |
|
|
|
|
|
|
| |
|
1 | ||
|
7 | ||
|
16 | ||
|
16 | ||
|
16 | ||
|
16 | ||
|
|
|
|
|
|
| |
|
17 | ||
|
19 | ||
|
Management’s Discussion and Analysis of Financial Condition and Results of Operations |
20 | |
|
30 | ||
|
32 | ||
|
|
32 | |
|
|
33 | |
|
|
34 | |
|
|
35 | |
|
|
36 | |
|
|
37 | |
|
|
38 | |
|
Changes in and Disagreements with Accountants on Accounting and Financial Disclosure |
58 | |
|
58 | ||
|
58 | ||
|
|
|
|
|
|
| |
|
59 | ||
|
59 | ||
|
Security Ownership of Certain Beneficial Owners and Management and Related Stockholder Matters |
59 | |
|
Certain Relationships and Related Transactions, and Director Independence |
59 | |
|
59 | ||
|
|
|
|
|
|
| |
|
59 | ||
|
|
62 |
FORWARD-LOOKING STATEMENTS
Except for the historical information contained in this document, this report contains forward-looking statements that have been made pursuant to the provisions of the Private Securities Litigation Reform Act of 1995, including estimates, projections, statements relating to our business plans, objectives and expected operating results and assumptions. These forward-looking statements generally are identified by the words “believes,” “goals,” “projects,” “expects,” “anticipates,” “estimates,” “intends,” “strategy,” “plan,” variations of these words and similar expressions. Forward-looking statements are based on current expectations, estimates, projections and assumptions regarding product, services, and customer support revenue; our expectations associated with Evolving Systems Labs, Evolving Systems India and Evolving Systems U.K., and short- and long-term cash needs, and are subject to risks and uncertainties which may cause our actual results to differ materially from those discussed here. Factors that could cause or contribute to such differences include, but are not limited to those discussed in the sections entitled “Business,” “Management’s Discussion and Analysis of Financial Condition and Results of Operations” and “Risk Factors.” We undertake no obligation to update or revise publicly any forward-looking statements, whether as a result of new information, future events or otherwise.
INTRODUCTION
Evolving Systems is a provider of software solutions for service enablement, on-device activation and management of services for connected devices for network operators around the world. Our customers rely on us to develop, deploy, integrate, enhance and maintain software solutions supporting their traditional and next generation network technologies, convergent service offerings, and advanced wireless and other broadband networks. We maintain long-standing relationships with many major carriers worldwide. Included among our more than 60 network operator customers are many tier-1 wireless carriers.
We offer software products and solutions in five core areas:
· Service activation solutions used to activate complex bundles of voice, video and data services for traditional and next generation wireless, wireline and cable networks;
· SIM (Subscriber Identity Module) card activation and management solutions that improve the end user experience and dynamically allocate and assign resources to a wireless device when it is first used;
· Connected device solutions used to manage and activate machine-to-machine or M2M devices, such as e-readers, smart meters, gaming consoles, as well as other SIM-based industry specific devices;
· Cloud-based (SaaS) service activation, self—service mobile applications and data enablement solutions to wireless carriers and Mobile Virtual Network Operators (MVNOs);
· Number inventory and management solutions, used by telecoms operators to manage the receipt of number ranges from regulatory bodies, efficient allocation of numbers to subscribers, and rapid recycling of disused numbers.
We generate revenue by licensing, and supporting our software products to customers in either a traditional premise-based implementation or through a SaaS, cloud-based solution. We report the operations of our business as two operating segments based on revenue type: license and services revenue, which includes our SaaS revenue, and customer support revenue. We report geographic information based upon revenue and long-lived assets in the United States, United Kingdom and all other foreign countries as a group. Further information regarding our operating segments and geographical information is contained in Note 13 to our Consolidated Financial Statements included in Item 8 of this Annual Report on Form 10-K.
COMPANY BACKGROUND
Evolving Systems was founded in 1985 to provide software and services to the U.S. telecommunications industry. During our early years our product focus was on solutions that supported number management and number porting. In November 2004, we expanded our product set and geographical reach with the acquisition of Tertio Telecoms Ltd. (“Evolving Systems U.K.”), a supplier of Operations Support Systems (“OSS”) software solutions for service activation and mediation to communication carriers throughout Europe, the Middle East, Africa and Asia. With this acquisition we not only expanded our markets beyond North America, we also added service activation and billing mediation solutions to our product portfolio. The acquisition significantly expanded our product
and service capabilities, allowing us to address a larger portion of our customers’ OSS application needs with a balanced mix of products as well as services. Our strategic focus is primarily on the wireless markets in the areas of subscriber activation, SIM card management and activation, self—service mobile applications, data enablement solutions, connected device activation and management of services.
On July 1, 2011, we sold our numbering solutions business to NeuStar, Inc. for $39.4 million in cash and the assumption of certain liabilities (the “Asset Sale”). As a result of the Asset Sale we no longer sell local number portability or number management solution products in North America.
On October 24, 2013 we acquired privately held Telespree Communications (“Telespree”), now known as Evolving Systems Labs, Inc. (“Evolving Systems Labs”), for an initial payment of approximately $1.6 million, comprised of approximately $0.8 million in cash and approximately $0.8 million in stock. There is an earn-out provision whereby we may potentially make additional payments in cash on the achievement of certain financial targets for the period from October 25, 2013 through October 24, 2016. In addition, there is a final payment of $0.5 million to be made subject to reduction for certain claims. The acquisition included technology used in the delivery and management of mobile data services and a portfolio of SaaS based solutions.
INDUSTRY DYNAMICS
The market for communications activation and provisioning solutions is constantly changing. Several key factors are driving carrier demand for next generation solutions, supporting growth for specific products within the sector:
· Rapid adoption of smart phones and network-attached tablets is driving increased usage of mobile data;
· On-going network investment to provide vastly improved delivery speeds and capacity (Long Term Evolution, or “LTE”/4G);
· Pricing pressure within the telecom industry driven by relatively flat subscriber growth, network upgrade costs, subscriber churn, and increased competition from traditional and new market entrants such as Over-the-Top (OTT) services both in the developed and emerging markets; and
· The onset of the connected device and M2M markets.
Today carriers are compelled to offer a growing array of services to deliver personalized and differentiated user experiences, reduce subscriber churn and maintain or grow market share. In addition, these value-added services have to be delivered to the market in ever shorter windows as competitive pressure has increased the velocity at which carriers deliver new products and services. To achieve these objectives, operators are increasingly reliant on flexible service enablement solutions that offer a myriad of options for their subscribers.
As network migrations to 4G/LTE accelerate and pre- and post-pay subscribers continue to drive growth in mobility, the SIM card has emerged as a vital link in the telecom value chain. Capability such as Evolving Systems’ solution for dynamically activating and managing the SIM card is becoming an important component in the operators’ infrastructure, both to reduce operating costs associated with the provisioning of SIM cards, as well as to improve the end-user experience.
We are a pioneer and leader in this market and believe we are well-positioned to maintain our leadership role in this emerging growth segment. To date our Dynamic SIM Allocation (“DSA”) solution has activated well over 300 million SIM cards, and in 2014 alone we activated in excess of 120 million SIM cards, providing enhanced functionality and significant operator savings.
PRODUCT PORTFOLIO
Dynamic SIM Allocation™
We introduced our Dynamic SIM Allocation™ solution, or “DSA,” in 2007. DSA offers carriers a dramatically improved alternative to the inefficient traditional SIM distribution and activation practices.
The SIM card is central to the provision of wireless access and services for most networks used today by wireless operators world-wide, as well as next generation 4G LTE technologies. Typically, SIM cards are pre-provisioned before they are distributed to the retail environment. Pre-provisioning SIM cards requires that network resources (e.g., mobile numbers) be allocated well in
advance of the wireless device becoming available for sale. This leads to poor utilization of numbers and other network resources, increases unnecessary network costs, and delivers a poor user experience.
DSA’s core technological innovation, on which we have a US patent, enables new SIM cards that have not been pre-provisioned to be detected on first use, triggering an efficient, dynamic provisioning process and eliminating the need for pre-provisioning. The SIM activation occurs only when a SIM card is first used.
During the activation process, the solution enables an on-device interaction with the end-user, delivering a differentiated user-experience which helps with reducing customer churn, lowering costs, and boosting revenue for the carrier.
The DSA solution offers a number of benefits including:
· Increased revenue and market share: Our DSA solution supports the search, selection and payment for “vanity numbers” and allows a carrier the opportunity to monetize these numbers where, for example, each number can have a different price. Allowing number selection by any new subscriber is a market differentiator that will attract more subscribers. In addition, subscribers who select their own number are more likely to keep the number, which may result in greater subscriber lifespan and reduced churn.
· Improved user experience at lower cost: Carriers have various customer care processes, like those for mobile number portability, or replacing lost or stolen SIM cards. These processes can be inefficient and have high operational costs. Our DSA solution helps carriers provide more customer self-care for an improved user experience at lower costs.
· Choice and Personalization on the device: Prepaid subscribers have traditionally been offered few choices at time of activation. With our solution, prepaid subscribers have an on-device language choice, a choice of product, package or tariff, the ability to select a number from a database of available numbers, including vanity number search and free or chargeable numbers, and the ability to select from a carrier’s promotions and value added services. In addition, on-device personalization is not limited to the point of first use. Using our DSA solution, subscribers can make changes to their service at any time.
· Improved efficiency and utilization: SIM cards that are never activated for a revenue-generating subscriber result in increased costs and wastage. Activating SIM cards dynamically on first use makes the SIM distribution process more efficient and flexible. SIM cards are not linked with any product or region until they are first used, allowing SIM stock to be moved freely to meet demand. The number of SIM types a carrier has to support is greatly reduced, resulting in less packaging cost and waste. Finally, by removing the need for SIM cards to be pre-provisioned, costly resources, such as numbers and network database capacity, are used only when needed.
· Availability to meet demand: Carriers can find it difficult to effectively and reliably manage their SIM inventory, especially when multiple SIM card variants and profiles are needed. Our DSA solution helps carriers to ensure new SIM cards and numbers are always available to meet demand.
DSA is an integrated solution comprised of several components:
· First Use Register (FUR) is responsible for the integration with the network, via SS7/SIGTRAN for 3G networks and DIAMETER for LTE. It detects the first use of a SIM card, enabling the update of the card, and facilitating any optional dialogue with the subscriber in a highly secure manner. It triggers the provisioning process, including the allocation of a definitive International Mobile Subscriber Identity, or “IMSI,” and the Mobile Subscriber Integrated Services Digital Network-Number, or “MSISDN”. The IMSI identifies the SIM, while the MSISDN is used for routing calls to the subscriber.
· Task Management is a module that controls the process flow of tasks involved with completing the subscriber’s activation process. The module orchestrates the overall process, providing robust capabilities for processing high volume, low latency, and mission critical transactions.
· Resource Management is a component that records and controls the management and assignment of specific inventory elements and resources. The component allocates the resources used by the DSA solution, including IMSI and MSISDN values.
· Menu Server is a module that defines and controls the menu dialogue with a subscriber. The Menu Server provides carriers with the ability to customize the end user experience on the device. Working with a SIM applet, Menu Server allows the wireless carrier to quickly and easily customize the end user screens on their phones or other devices.
· Mobile Broadband Module allows DSA to support activation processes through a rich browser-based dialogue, as well as a dialogue through menus on a phone screen. With the Mobile Broadband Module, carriers can offer a customized experience for subscribers who are activating mobile broadband features for smart phones and/or a wide variety of connected devices. As part of this experience, DSA can promote smartphone apps on behalf of the network operator or third parties, offering a new way to acquire app users in markets where SIM-only sales are dominant.
· Promotions Engine enables DSA to offer dynamic promotions to end users as part of the on-device activation experience. Dynamic promotions are those which are selected as relevant to a specific user based on their device type, location, the time/date they activate their SIM, and other choices they make during the activation process.
· In-Life Interaction Engine enables many of the personalization options such as number and tariff choice, or promotions, to be offered to users via their device after first use, as well as during the first use period.
· Operational Dashboard is a module that assists operators in the administration, operation, and maintenance of the DSA platform. Operational Dashboard offers carriers a powerful reporting tool and a flexible, easy-to-use tool that provides visibility into the performance of DSA.
· Direct Authentication is an extension module to the First Use Register which can generate Global System for Mobile Communication, or “GSM” SIM and Universal Mobile Telecommunications System, or “UMTS” SIM authentication. This removes the need to dedicate an Authentication Center (“AUC”) to perform this function for the First Use Register.
· SIM Reservation Portal™ extends the personalization capabilities of DSA to more of an operator’s customers. Working alongside DSA’s on-device personalization, it offers personalization in advance of SIM purchase, through a web portal that can be deployed on the public internet, or in a store kiosk.
Tertio Service Activation
Our service activation solution, Tertio™, is used by carriers to activate a new subscriber or to add a new service to an existing subscriber. Our Tertio product provides a flexible operating environment for carriers to manage their voice, data, and content service needs for both their traditional and broadband IP networks. Our solution is deployed as the service activation engine for over 50 networks around the world including two of the world’s largest wireless carriers.
Tertio is an integrated solution comprised of several components:
· Tertio Service Composer is a modeling tool that simplifies the creation of new services.
· Tertio Content Connector is a tool used for activation of next-generation services.
· Tertio Activation Designer is a tool designed to speed network feature activation.
· Tertio Service Activation is the platform that provides scalability and performance, flexibility and a graphical interface.
· Tertio Service Verification is a module that allows carriers to verify that the services implemented in the network match those that were in the original service order. By providing this capability, carriers can continually check the accuracy of their order/activation processes.
Our Tertio solution addresses the entire service lifecycle, allowing carriers to introduce new network technologies and easing the burden of integration with existing devices and systems. Service providers who use our Tertio solution can better plan, manage and execute the introduction of new services.
Mobile Data Enablement
Our Mobile Data Enablement (“MDE”) solution is the primary solution added to our portfolio through the acquisition of Telespree.
MDE is a hosted solution that integrates with a mobile carrier’s network and OSS/BSS systems. It was purpose-built for mobile data, and provides the key components a carrier needs in order to launch and grow innovative mobile data services, especially via wholesale channels and using service provider partners. Our solution is aligned with the market dynamic that sees most growth coming from mobile data services, and enables shared and sponsored data plans with differential charging and app-specific control, ideally suited to enterprise or family group users.
MDE is an integrated solution comprised of the following capabilities:
· Active Session Monitoring provides end-to-end accounting of service types to enable enforcement (authentication, authorization, hot-lining) based on data or time thresholds, policy or quota.
· Real-time rating allows for network or device-based real-time metering of time and data usage via Diameter credit control Messages, RADIUS accounting records or device based policy agents.
· Online Charging (“OCS”) enables real time, on-line charging and control of service usage via Diameter (Gy) interface. Functionality includes plan catalog, account and balance management, flexible service type, device and bundle management, and hotline/un-hotline function.
· Policy Management provides differentiated QoS-based or access-based services including white listed/blacklisted sites and quality/throttling.
· Reporting/Analytics provides consolidated reporting for device, channel, and transaction status, such as usage, event, rate plan, trends, customer behavior, marketing and loyalty program analysis.
· On-device user experience delivers personalization, usage monitoring and account control to end-users on their mobile devices, using web portals, mobile applications (Android and iOS), and push-notification mechanisms.
Number Inventory and Management
Our number inventory solution, Total Number Management™ (TNM), is a scalable and fully automated solution that enables operators to reliably and efficiently manage their telephone numbers (i.e. SIMs, MSISDNs, IMSIs, ICCIDs, IPs) as well as other communication identifiers such as URLs and email addresses. TNM focuses on the automation of all number resource management processes, allowing operators to adhere to regulatory requirements and effectively manage the lifecycle of telephone numbers, as well as benefit from time savings and reduced costs.
The major components of TNM are:
· Number management: TNM maintains a clean number resource inventory, ensuring accurate status information and avoiding number conflicts.
· Vanity/Golden number support: TNM provides the capability to mark numbers as ‘Golden’ or ‘Vanity’ numbers based on user defined criteria. Golden numbers are then protected from the general assignment rules and may only be allocated when specifically requested.
· SIM management: TNM provides full lifecycle SIM management to include a standardized SIM card profile and templates, as well as an automated interface to the SIM manufacturer’s system, which reduces cumbersome processes associated with sending orders.
M2M Platform
Evolving Systems offers its Intelligent M2M Controller (“IMC”) solution which virtualizes M2M device connections and optimizes specific use cases frequently seen in typical M2M deployments. The IMC solution provides a database of subscriber information which enables temporary sessions which greatly improves the efficiency of numbers used by connected devices. As number plan constraints and number reclamation issues become a more pressing problem for regulators and operators, our IMC solution offers a way to dramatically improve the utilization of numbers and other critical network resources that are increasingly being consumed by the proliferation of M2M and connected devices.
PROFESSIONAL AND INTEGRATION SERVICES
Our Professional and Integration Services team provides expert consulting services and advice for the customization, integration and deployment of our products. The team works closely with our Product Development and Engineering teams to ensure that our deployed products meet our customers’ requirements and that our products continue to evolve to meet future requirements. Our services cover all aspects of the project lifecycle, including system architecture, design, software development and customization, system integration, testing, live deployment and production support, program and project level management, post-implementation maintenance and domain and product expertise. Our teams work closely with customers and integration partners and have established long-term relationships with operators in the Americas, Europe, the Middle East, Africa and Asia Pacific regions.
CLOUD IMPLEMENTATIONS
We offer some of our products and solutions as a cloud-based software-as-a-service, or SaaS. This enables our customers to get into production quickly and realize the benefits of our solution sooner.
PRODUCT DEVELOPMENT
We develop most of our products and services internally, conducting research to identify specific industry and customer business needs as well as market requirements and we use that information to determine our investment in product development (“PD”). We evaluate the market for new products and we leverage our existing product capabilities with enhancements of existing products. Our product “roadmap” helps us identify which modifications and enhancements are most important and when they should be implemented. We build investment plans for our principal product areas and we make other investments in tools and product extensions to accelerate the development, implementation and integration process for customer solutions.
PD is expensed as incurred. For the years ended December 31, 2014, 2013 and 2012, we expensed $3.6 million, $3.0 million and $3.1 million, respectively, in PD costs. The majority of PD investments in 2014 have gone into the further development and enhancement of our DSA solution.
SALES AND MARKETING
Our sales force is primarily a field organization structured to focus on specific geographical territories around the world: The Americas (North, Central and South), Europe, Middle East and Africa, the Commonwealth of Independent States (comprised of Russia and other former Soviet Republics) and Asia Pacific. Our sales activities cover both direct sales to carrier customers as well as sales through partners such as Gemalto and Oberthur, who include our products as part of their wider SIM-based solution offerings, and systems integrators such as Accenture and IBM who license our technology to customers as part of their delivery engagements.
Our solutions and our customers’ infrastructures are complex, and require a high degree of consultative selling which often results in a long sales cycle in excess of twelve months. In addition, our business relies on incremental revenue from existing customers, which requires regular interaction with customers to discuss enhancements to our existing solutions as well as the introduction of new value propositions. The sales team is also responsible for the generation of proactive proposals to prospects, as well as the management and delivery of responses to competitive tenders. This complex, highly involved approach creates a long sales cycle, requiring us to invest a considerable amount of time to developing business opportunities without guaranteed results.
Our marketing organization supports our sales activities by identifying markets for our products and establishing an awareness of our offerings in those markets through a combination of direct marketing, web marketing, and participation in shows, conferences, and industry bodies. The marketing organization is responsible for maintaining our web site and creating electronic and print-based sales collateral to support our sales activities.
COMPETITION
The market for telecommunications OSS products is competitive and is subject to rapid technological change, changing industry standards, regulatory developments and consolidation. We face increasing demand for improved product performance, enhanced functionality, rapid integration capabilities coupled with pricing pressures. Our existing and potential competitors include many large domestic and international companies that often have substantially greater financial, technological, marketing, distribution and other resources, larger installed customer bases and longer-standing relationships with telecommunications customers. The market for telecommunications OSS software and services is extremely large and we currently hold only a small portion of total market share. We believe our increased focus on activation, as well as our work to establish the dynamic SIM allocation market, has resulted in our achieving a measurable and reasonable market share in those areas.
Our principal competitors for our Tertio Service Activation solution are Comptel, Amdocs and Oracle (as a result of its acquisition of Metasolv). In the area of dynamic SIM allocation, we believe we hold a significant leadership position; however, we see occasional competition from Giesecke & Devrient GmbH (as a result of their acquisition of SmartTrust) and HP, as well as a few other smaller regional competitors. In addition, some of the network equipment manufacturers’ next generation solutions address some of the benefits provided by our DSA solution. Competition for our MDE solution comes from a variety of startups such as ItsOn. For our TNM solution competition comes from a variety of billing vendors and vendors such as Telcordia/Ericsson. Due to the nascent nature of the M2M market competition for our IMC Platform comes from M2M platform providers such as Jasper Wireless.
For all of our products, our ability to compete successfully depends on a wide range of factors. We deliver value by offering competitively priced quality solutions, tailored specifically to our customers’ network topography. After a customer implements our products, we often receive subsequent orders for enhancements to add functionality or increase capacity. The growth of our solution, and the fact that it would be expensive and time consuming to replace our software, provides us with an incumbent advantage. Furthermore, many of our customer relationships span five years or more. We believe all of these factors give us a competitive advantage and can be a barrier to entry for potential competitors.
SIGNIFICANT CUSTOMERS
For the year ended December 31, 2014, two significant customers (defined as contributing at least 10%) accounted for 24% (13% and 11%) of revenue from continuing operations. These customers are large telecommunications operators in Europe and Mexico. For the year ended December 31, 2013 one significant customer accounted for 12% of revenue from continuing operations. This customer is a large telecommunications operator in Europe. For the year ended December 31, 2012 three significant customers accounted for 39% (15%, 14% and 10%) of revenue from continuing operations. These customers are large telecommunications operators in Europe, the Commonwealth of Independent States and Mexico.
INTELLECTUAL PROPERTY
We rely on a combination of patents, copyright, trademark and trade secret laws, as well as confidentiality agreements and licensing arrangements, to establish and protect our proprietary rights. We have 16 patents in the U.S. on elements of our DSA and mobile broadband enablement products and patents pending in other countries on elements of our DSA and IMC products.
BACKLOG
We define backlog as sales orders that are anticipated to be delivered and recognized in revenue over the next twelve months. As of December 31, 2014 and 2013, our backlog was approximately $10.6 million and $12.2 million, respectively. Our backlog at December 31, 2014 was comprised of license fees and services of $5.6 million and customer support of $5.0 million compared to license fees and services of $7.1 million and customer support of $5.1 million at December 31, 2013.
EMPLOYEES
As of December 31, 2014, we employed 194 people including 15 in the United States, 61 in the United Kingdom and 118 in Bangalore, India. Of our worldwide staff, 83% are involved in product delivery, development, support and professional services, 11% in sales and marketing, and 6% in general administration.
AVAILABLE INFORMATION
You can find out more information about us at our Internet website located at www.evolving.com. The information on or accessible through our website is not incorporated into this Annual Report on Form 10-K. Our Annual Reports on Form 10-K, our Quarterly Reports on Form 10-Q, and our Current Reports on Form 8-K and any amendments to those reports are available free of charge on our Internet website as soon as reasonably practicable after we electronically file or furnish such material with the SEC. Additionally, these reports are available at the SEC’s Public Reference Room at 100 F Street, N.E., Washington, D.C. 20549 or on the SEC’s website at www.sec.gov. Information on the operation of the Public Reference Room can be obtained by calling the SEC at 1-800-SEC-0330.
General Risk Statement
Our operations and financial results are subject to various risks and uncertainties, including those described below, that could adversely affect our business, financial condition, results of operations, cash flows, and the trading price of our common stock.
An investment in our common stock involves a high degree of risk. The risks that we have highlighted here represent the material risks known to us, but they are not the only ones that we face. If any of the risks actually occur, our business, financial condition or results of operation could be negatively affected. In that case, the trading price of our stock could decline and our stockholders may lose part or all of their investment.
Risks Related to Our Business and Industry
We operate a global business that exposes us to currency, economic, regulatory and tax risks.
A significant part of our revenue comes from international sales and emerging markets are a significant focus of our international growth strategy. Our success delivering solutions internationally and competing in international markets is subject to our ability to manage various risks and difficulties, including, but not limited to:
· our ability to effectively staff and manage foreign operations;
· fluctuations in currency exchange rates;
· trade restrictions, political instability, disruptions in financial markets, and deterioration of economic conditions;
· compliance with the U.S. Foreign Corrupt Practices Act, the U.K. Bribery Act and other anti-bribery laws and regulations;
· variations and changes in laws applicable to our operations in different jurisdictions, including enforceability of intellectual property and contract rights ;
· compliance with export regulations, tariffs and other barriers;
· timely collecting of accounts receivable from customers located outside of the U.S.;
· our ability to provide sufficient levels of technical support in different locations; and
· potentially adverse tax consequences in connection with repatriating funds.
Approximately forty percent of our revenue is transacted in non-U.S. Dollar denominated currencies (e.g. British Pound Sterling, Swiss Franc and Euro). As a result, when the U.S. Dollar strengthens, our revenue, when converted to U.S. Dollars, is reduced. At the same time, approximately 80% of our operating expenses originate overseas, the strengthening dollar conversely lowers expenses outside of the U.S. Although this has provided some defense against currency fluctuations for our bottom line results, we may not be able to maintain this ratio of revenue to expense in the future. In addition, we may not be able to sustain or increase our international revenue or repatriate cash without incurring substantial risks involving floating currency exchange rates, our ability to recover or apply withholding taxes remitted to foreign governments, and income tax expenses. Any of the foregoing factors may have a material adverse impact on our international operations and, therefore, our business, financial condition and results of operations. In addition, there have been proposals to change U.S. tax laws that would significantly impact how U.S. multinational corporations are taxed on foreign earnings. Although we cannot predict whether or in what form any proposed legislation may pass, if enacted it could have a material adverse impact on our tax expense and cash flow.
Our revenue, earnings and profitability are affected by the length of our sales cycle, and a longer sales cycle could adversely affect our results of operations and financial condition.
Our business is impacted by the length of our sales cycles. Our customers have relatively complex businesses and the purchase of large communications solutions used for enterprise-wide, mission-critical purposes, involve significant capital expenditures and lengthy implementation plans. Prospective customers often take a long period of time to evaluate our products and services and require us to spend substantial time, effort and money educating them about our solutions. The purchase of the types of products and services we offer typically also requires coordination and agreement across many departments within a potential customer’s organization. This process often results in a lengthy sales cycle, typically ranging between three and twelve months. The lengthening of our sales cycle could reduce growth in our revenue and contribute to an increased cost of sales, thereby reducing our profitability.
Mergers and acquisitions of large communications companies, as well as the formation of new alliances, have resulted in a constantly changing marketplace for our products and services. Purchasing delays and pricing pressures associated with these changes are common. In addition, many of the companies in the communications industry have kept capital expenditures at historically low
levels in response to changes in the communications marketplace; some companies have declared bankruptcy, cancelled contracts, delayed payments to their suppliers or delayed additional purchases.
A single order can have a significant impact on our quarterly or annual results.
Customers’ budgetary constraints and internal acceptance reviews may cause potential customers to delay or forego a purchase, making it difficult for us to forecast the timing and size of our contracts. In addition, our sales opportunities in any given quarter and year typically include a few high value opportunities. The delay or failure to close one or more large orders could have a material adverse effect on our results of operations and financial condition and cause our results to vary significantly from quarter to quarter and year to year.
Our products are complex and have a lengthy implementation process; unanticipated difficulties or delays in the customer acceptance process could result in higher costs and delayed payments.
Implementing our solutions can be a relatively complex and lengthy process since we typically customize these solutions for each customer’s unique environment. Often our customers also require rapid deployment of our software solutions, resulting in pressure on us to meet demanding delivery and implementation schedules. Inability to meet these demanding schedules, or quality issues resulting from accelerated delivery schedules, may result in customer dissatisfaction and/or damage our reputation, which could materially harm our business.
The majority of our existing contracts provide for acceptance testing by the customer, which can be a lengthy process. Unanticipated difficulties or delays in the customer acceptance process could result in higher costs, delayed payments, and deferral of revenue recognition. In addition, if our software contains defects or we otherwise fail to satisfy acceptance criteria within prescribed times, the customer may be entitled to liquidated damages or to cancel its contract and receive a refund of all or a portion of amounts paid or other amounts as damages, which could exceed related contract revenue and which could result in a future charge to earnings. Any failure or delay in achieving final acceptance of our software and services could harm our business, financial condition, results of operations and cash flows.
The success of our business depends on continued growth in the wireless services industry and growth in demand for connected devices.
The future success of our business depends upon continued new subscriber growth and growth in demand for connected devices. While we believe new subscriber growth in the global market will continue and the demand for connected devices will also continue to grow for the foreseeable future, we cannot accurately predict the extent of the increase, if at all. If there is a slowdown in subscriber growth in the wireless services industry or the demand for connected devices were to stabilize or decline, our business and results of operations may be adversely affected.
We are a relatively small company with a limited number of products and staff. Sales fluctuations and employee turnover may adversely affect our business.
We are a relatively small company. Consequently, compared to larger companies, sales fluctuations could have a greater impact on our revenue and profitability on a quarter-to-quarter and year-to-year basis and a delayed contract could cause our operating results to vary significantly from quarter to quarter and year-to-year. In addition, as a small company we have limited staff and are heavily reliant on certain key personnel to operate our business. If a key employee were to leave the company it could have a material impact on our business and results of operations as we might not have sufficient depth in our staffing to fill the role that was previously being performed. A delay in filling the vacated position could put a strain on existing personnel or result in a failure to satisfy our contractual obligations or to effectively implement our internal controls, and materially harm our business.
Because our quarterly and annual operating results are difficult to predict and may fluctuate, the market price for our stock may be volatile.
Our operating results have fluctuated significantly in the past and may continue to fluctuate significantly in the future. Fluctuations in operating results may result in volatility of the price of our common stock. These quarterly and annual fluctuations may result from a number of factors, including:
· the size of new contracts and when we are able to recognize the related revenue;
· our rate of progress under our contracts;
· foreign exchange fluctuations;
· budgeting cycles of our customers;
· changes in the terms and rates related to the renewal of support agreements;
· the mix of products and services sold;
· the timing of third-party contractors’ delivery of software and hardware;
· level and timing of expenses for product development and sales, general and administrative expenses;
· changes in our strategy;
· general economic conditions.
We base our operating expenses and capital investment budgets on expected sales and revenue and many of our expenses, such as lease expenses and personnel costs, are relatively fixed in the short term. Variations in the rate and timing of conversion of our sales prospects into actual revenue could cause us to plan or budget inaccurately and we may be unable to adjust spending in a timely manner to compensate for any unexpected shortfall in revenue. Any significant shortfall from anticipated levels of demand for our products and services could adversely affect our business, financial condition, results of operations and cash flows.
Based on these factors, we believe our future quarterly and annual operating results may vary significantly from quarter-to-quarter and year-to-year. As a result, quarter-to-quarter and year-to-year comparisons of operating results are not necessarily meaningful nor do they indicate what our future performance will be. Furthermore, we believe that in future reporting periods if our operating results fall below the expectations of public market analysts or investors, it is possible that the market price of our common stock could decrease.
Our results of operations could be negatively impacted if we are unable to manage our liquidity.
Our cash forecast indicates that we will have sufficient liquidity to cover anticipated operating costs and expected dividend payments for at least the next twelve months, but this could be negatively impacted to the extent we are unable to invoice and collect from our customers in a timely manner, or an unexpected adverse event, or combination of events occurs. If the timing of cash generated from operations is insufficient to satisfy our liquidity requirements, we may require access to additional funds to support our business objectives through a credit facility or possibly the issuance of additional equity. Additional financing may not be available at all or, if available, may not be obtainable on terms that are favorable to us and not dilutive.
The market for our service activation products is mature and the market for our DSA product is evolving. The industry in which we compete is subject to rapid technological change and if we do not adapt to rapid technological change, we could lose customers or market share.
The market for our service activation product is mature. Customer demand for our DSA product and enhancements to our DSA product is evolving. Our industry is characterized by rapid technological change, evolving industry standards, changes in carrier requirements and preferences and frequent new service offerings. The introduction of products that incorporate new technologies and the emergence of new industry standards can make existing products obsolete and unmarketable. To compete successfully, we must continue to design, develop and sell enhancements to existing products and new products that provide higher levels of performance and reliability in a timely manner, take advantage of technological advancements and changes in industry standards and respond to new customer requirements. Developing new technologies is complex and time-consuming. It can require long development and testing periods. Significant delays in new releases or significant problems in creating new products or services could adversely affect our revenue.
Our cloud strategy, or Software as a Service (SaaS), may not be successful.
We offer some of our products as a SaaS implementation and we intend to offer more of our solutions as a cloud offering in the future. Our cloud strategy will continue to evolve and we may not be able to compete effectively, generate significant revenues or maintain profitability. Whether we are successful in our cloud strategy depends on our execution in a number of areas, which may or may not be within our control, including continuing to innovate and bring to market compelling cloud-based offerings, continued growth and demand for cloud-based offerings and ensuring that our cloud-based services meet the reliability expectations of our customers and maintain the security of their data. Our cloud strategy also may fail to achieve success if other companies offering cloud-based services experience data loss, security breaches or service reliability issues that cause consumers to become less willing to
accept cloud-based services in general. Additionally, sales may be limited in certain countries that require or may require the carrier’s data to physically reside within that county’s national boundaries.
If we are unable to properly supervise our software development staff in India, or if political or other uncertainties interfere, we may be unable to satisfactorily perform our customer contracts.
In 2004, we formed Evolving Systems India, a wholly owned subsidiary of Evolving Systems, Inc. We have experienced a high level of turnover with our Indian development staff as a result of strong competition for technology-based personnel in India. In addition, salary levels in India are steadily increasing, reducing the competitive advantages associated with offshore labor. If we are unable to effectively manage the Evolving Systems India development staff and/or we continue to experience high levels of staff turnover, we may fail to provide quality software in a timely fashion, which could negatively affect our ability to satisfy our customer contracts. Furthermore, political changes and uncertainties in India could negatively impact the business climate there. As a result, we may be unable to satisfactorily perform our customer contracts and our business, financial condition and results of operations could be materially harmed.
Changes or challenges to the regulations of the communication industry could hurt the market for our products and services.
Our customers may require, or we may find it necessary or advisable, to modify our products or services to address actual or anticipated changes in regulations affecting our customers. This could materially harm our business, financial condition, results of operations, and cash flows. We are also subject to numerous regulatory requirements of foreign jurisdictions. Any compliance failures or changes in such regulations could, likewise, materially harm our business, financial condition, results of operations and cash flows.
Consolidation in the communications industry may impact our financial performance.
The global communications industry has experienced and continues to experience significant consolidation. These consolidations have caused us to lose customers and may result in fewer potential customers requiring OSS solutions in the future. In addition, combining companies may re-evaluate their OSS solutions and their capital expenditures and may choose a competitive OSS solution used by one of the combining companies. As our customers become larger, they generally have stronger purchasing power, which can result in reduced prices for our products, lower margins on our products and longer sales cycles. All of these factors can have a negative impact on our financial performance, particularly in any fiscal quarter.
We depend on a limited number of significant customers for a substantial portion of our revenue, and the loss of one or more of these customers could adversely affect our business.
We earn a significant portion of our revenue from a small number of customers in the communications industry. The loss of any significant customer, delays in delivery or acceptance of any of our products by a customer, delays in the performance of services for a customer, or delays in collection of customer receivables could harm our business and operating results to a greater degree than other companies with a broader customer base.
Many of our products and services are sold on a fixed-price basis. If we incur budget overruns this may reduce our profitability.
Currently, a large portion of our revenue is from fixed-price contracts and we expect this will continue. These contracts specify certain obligations and deliverables we must meet regardless of the actual costs we incur. Projects done on a fixed-price basis are subject to budget overruns. On occasion, we have experienced budget overruns, resulting in lower than anticipated margins. We may incur similar budget overruns in the future, including overruns that result in losses on these contracts. If we incur budget overruns, our margins may be harmed, thereby affecting our overall profitability.
Percentage-of-completion accounting used for most of our projects can result in overstated or understated profits or losses.
The revenue for most of our contracts is accounted for on the percentage-of-completion method of accounting. This method of accounting requires us to calculate revenue and profits to be recognized in each reporting period for each project based on our predictions of future outcomes, including our estimates of the total cost to complete the project, project schedule and completion date, the percentage of the project that is completed and the amounts of any probable unapproved change orders. Our failure to accurately estimate these often subjective factors could result in reduced profits or losses for certain contracts.
The communications industry is highly competitive and if our products do not satisfy customer demand for performance or price, our customers could purchase products and services from our competitors.
Our primary markets are intensely competitive and we face continuous demand for improved product performance, new product features and reduced prices, as well as intense pressure to accelerate the release of new products and product enhancements. Our existing and potential competitors include many large domestic and international companies, including some competitors that have substantially greater resources, larger installed customer bases and longer-standing relationships with customers than we do. In addition, some network equipment manufacturers’ next generation solutions address some of the benefits provided by our DSA solution.
Customers also may offer competitive products or services in the future since customers who have purchased solutions from us are not precluded from competing with us. Many telecommunications companies have large internal development organizations, which develop software solutions and provide services similar to the products and services we provide.
We believe that our ability to compete successfully depends on numerous factors, including the quality and price competitiveness of our products and services compared to those of our competitors, the emergence of new industry standards and technical innovations and our ability to respond to those changes. Some of these factors are within our control, and others are not. A variety of potential actions by our competitors, including a reduction of product prices or increased marketing and promotion, accelerated introduction of new or enhanced products, or cooperative relationships among competitors and their strategic partners, could negatively impact the sales of our products and we may have to reduce the prices we charge for our products. Revenue and operating margins may consequently decline. We may not be able to compete successfully with existing or new competitors or to properly identify and address the demands of new markets. This is particularly true in new markets where standards are not yet established. Our failure to adapt to emerging market demands, respond to regulatory and technological changes or compete successfully with existing and new competitors would materially harm our business, financial condition, results of operations and cash flows.
Our business depends largely on our ability to attract and retain talented employees.
Our business is based on successfully attracting and retaining talented employees and the market for skilled workers in our industry is very competitive. We may not be able to retain personnel or to hire additional personnel on a timely basis, if at all. Because of the complexity of our software solutions, a significant time lag exists between the hiring date of technical and sales personnel and the time when they become fully productive. We have at times experienced high employee turnover and difficulty in recruiting and retaining technical personnel. Our failure to retain personnel or to hire qualified personnel on a timely basis could adversely affect our business by impacting our ability to develop new products, to complete our projects and secure new contracts.
Our products are complex and may have errors that are not detected until deployment. Resolving warranty and product liability claims could be expensive and could negatively affect our reputation and profitability.
The provisions of our agreements with our customers are designed to limit our exposure to potential liability for damages arising out of the use of, or defects in, our products, which vary from customer to customer. It is possible that the nature of the damages is not subject to limitations or that these limitations of liability provisions are not effective. Although we carry errors and omissions insurance, to the extent that any successful product liability claim is not covered by our errors and omissions insurance or exceeds the coverage under our policy, we may be required to pay for a claim. This could be expensive, particularly since our software products may be used in critical business applications. As we may subcontract the development of deliverables under customer contracts, we could also be required to indemnify customers for work performed by our subcontractors. We may be able to recover from a subcontractor the amounts we are required to pay to customers due to the subcontractor’s failure to perform but there is no guarantee that we will be able to do so. Defending against a product liability claim, regardless of its merits, could be expensive and require the time and attention of key management personnel, either of which could materially harm our business, financial condition and results of operations. In addition, our business reputation could be harmed by product liability claims, regardless of their merit or the eventual outcome of these claims.
Compromises to our privacy safeguards or disclosure of confidential information could impact our business.
During the course of providing our products and services we may collect names, addresses, telephone numbers, credit card data and other personal identification information, or “PII”. Our treatment of such information is subject to contractual restrictions and federal, state, and foreign data privacy laws and regulations. We strive to limit the amount of PII we collect and/or store and we have implemented steps designed to protect against unauthorized access to such information but because of the inherent risks and complexities involved in protecting this information, particularly if we store such information in a cloud implementation, the steps we have taken may not be sufficient to prevent the misappropriation or improper disclosure of such PII. In addition, third party vendors that we engage to perform services for us may unintentionally release PII or otherwise fail to comply with applicable laws and regulations. If misappropriation or disclosure of PII were to occur, our business could be harmed through reputational injury, litigation and possible damages claimed by the affected end customers or potential fines from regulatory authorities. Our insurance may not
cover potential claims of this type or may not be adequate to cover all costs incurred in defense of potential claims or to indemnify us for all liability that may be imposed. The occurrence of any of these events could have an adverse effect on our business, financial position, and results of operations.
Our measures to protect our intellectual property may not be adequate.
Our success and ability to compete are dependent to a significant degree on our proprietary technology. Protecting our global intellectual property rights is difficult. We rely on a combination of patent, copyright, trademark and trade secret laws, as well as confidentiality agreements and licensing arrangements, to establish and protect our proprietary rights. We have 16 patents in the U.S. on elements of our DSA and mobile broadband enablement products and patents pending in other countries on elements of our DSA and IMC products. In addition, we have registered or filed for registration of certain of our trademarks. Our patent portfolio is relatively small and given the cost of obtaining patent protection, we may choose not to patent certain inventions that later become important. There is also the possibility that our means of protecting our proprietary rights may not be adequate; a third party may copy or otherwise obtain and use our products or technology without authorization or may develop similar technology independently or design around our patents. In addition, the laws of some foreign countries may not adequately protect our proprietary rights.
We may not be able to protect our source code from copying if there is an unauthorized disclosure of source code. Source code, the detailed program commands for our software programs, is critical to our business. If a significant portion of our source code leaks, we might lose future trade secret protection for that source code. It may become easier for third parties to compete with our products by copying functionality.
If our intellectual property protection proves inadequate, we may lose our competitive advantage and our future financial results may suffer.
Third parties may claim we are infringing their intellectual property rights, or that we have not complied with their license requirements and we may incur significant expenses in resolving these claims.
It is possible that our business activities may infringe upon the proprietary rights of others, or that other parties may assert infringement claims against us. Those claims may involve patent holding companies or other adverse patent owners who have no relevant product revenue of their own, and against whom our own patents may provide little or no deterrence. We could incur substantial costs in defending against any infringement claim and we could be required to develop non-infringing technology, obtain licenses, or to cease selling the applications that contain the infringing intellectual property. Adverse publicity related to any intellectual property litigation also could harm the sale of our products and damage our competitive position.
Certain software developed or used by Evolving Systems may include so called “open source” software made available under a license which may impose obligations on us in the event we distribute derivative works based on the open source software. Certain licenses impose obligations that could require us to make source code for a derivative work available to the public or license the derivative work under a particular type of open source software license, rather than the license terms we customarily use to protect our software.
There is little or no legal precedent for interpreting the terms of certain of these open source licenses, including the terms addressing the extent to which software incorporating open source software may be considered a derivative work subject to these licenses. We believe we have complied with our obligations under the various applicable open source licenses. However, if the owner of any open source software were to successfully establish that we had not complied with the terms of an open source license for a particular product that includes such open source software, we may be forced to release the source code for that derivative work to the public or cease distribution of that work.
Cyber-attacks and security vulnerabilities could lead to reduced revenue, increased costs, liability claims, or harm to our competitive position.
Increased sophistication and activities of perpetrators of cyber-attacks have resulted in an increase in information security risks in recent years. Hackers develop and deploy viruses, worms, and other malicious software programs that attack products and services and gain access to networks and data centers. A substantial portion of our software development and customer support is provided out of our India facility, which may be subject to increased risk of power loss, telecommunications failure, terrorist attacks and similar events. If we were to experience difficulties maintaining existing systems or implementing new systems, we could incur significant losses due to disruptions in our operations. Additionally, these systems contain valuable proprietary and confidential information and may contain personal data of our customer’s subscribers and a security breach could result in disruptions of our internal systems and business applications, impairment of our ability to provide services to our customers, product development delays, harm to our competitive position from the compromise of confidential business information, or subject us to liability under
laws that protect personal data. Although we believe that we have robust information security procedures and other safeguards in place, many of our services do not have fully redundant systems or a formal disaster recovery plan, and we may not have adequate business interruption insurance to compensate us for losses that occur from a system outage. As cyber threats continue to evolve, we may be required to expend additional resources to continue to enhance our information security measures and/or to investigate and remediate any information security vulnerabilities. Any of these consequences would adversely affect our revenue and margins.
Disruptions from terrorist activities, geopolitical conditions or military actions may disrupt our business.
The continued threat of terrorism within the U.S. and throughout the world and acts of war may cause significant disruption to commerce throughout the world. Abrupt political changes and armed conflict pose a risk of economic disruption in affected countries, which may increase our operating costs and add uncertainty to the timing and budget for technology investment decisions by our customers. Our business and results of operations could be materially and adversely affected to the extent that such disruptions result in delays or cancellations of customer orders, delays in collecting cash, a general decrease in corporate spending on information technology, or our inability to effectively market, manufacture or ship our products. We are unable to predict whether war, political unrest and the threat of terrorism will result in any long-term commercial disruptions or if such activities will have any long-term material adverse effect on our business, results of operations, financial condition or cash flows.
We face risks associated with doing business through local partners.
In some countries, because of local customs and regulations or for language reasons, we do business with our customers through local partners who resell our products and services, with or without value-added services. This can cause delays in closing contracts because of the increased complexity of having another party involved in negotiations. In addition, where the local partner provides additional software, hardware and/or services to the end-user customer, our products and services may only be a small portion of the total solution. As a result, payments made to us, as well as conditions surrounding acceptance, may be impacted by factors that are out of our control. There may also be delays in getting payments made by the end-user customer through the reseller. We have experienced delays in closing contracts through partners and collecting from resellers and this situation may arise again in the future, negatively impacting our cash flows. Doing business through local partners may also increase our risks under anti-bribery regulations, discussed below.
Our international operations subject us to potential liability under anti-corruption laws and regulations.
Our international business operations are subject to the Foreign Corrupt Practices Act (“FCPA”), which generally prohibits U.S. companies and their intermediaries from paying or offering anything of value to foreign government officials for the purpose of obtaining or keeping business, or otherwise receiving discretionary favorable treatment of any kind. To the extent we do business through Evolving Systems UK, we are also subject to the U.K. Bribery Act of 2010. In addition, many countries in which we do business have their own anti-bribery rules and regulations. Under these regulations, we may be held liable for actions taken by our local partners and agents, even if such parties act without our knowledge. Any determination that we have violated the FCPA or the Bribery Act of 2010 (whether directly or through acts of others, intentionally or through inadvertence) or other anti-bribery legislation could result in sanctions that could have a material adverse effect on our business. While we have procedures and controls in place to monitor compliance, situations outside of our control may arise that could potentially put us in violation of anti-bribery legislation inadvertently and thus negatively impact our business.
Acquisitions and strategic alliances may have an adverse effect on our business.
We have made, and we expect to continue making acquisitions or entering into strategic alliances as part of our long-term business strategy. We cannot be sure that these transactions will ultimately enhance our products or strengthen our competitive position. These transactions involve significant challenges and risks, including that the transaction does not advance our business strategy, that we get no satisfactory return on our investment, that we have difficulty integrating operations, new technologies, products or employees, or that the transaction distracts management and employees from our other businesses. The success of these transactions will depend in part on our ability to leverage them to enhance our existing products and services or develop compelling new ones. It may take longer than expected to realize the full benefits from these transactions, such as increased revenue, enhanced efficiencies, or increased market share, or the benefits may ultimately be smaller than we expected. In addition, future acquisitions could result in potentially dilutive issuances of equity securities, the reduction of cash available for operations and the incurrence of debt. These events could adversely affect our operating results or financial condition.
Sales of large blocks of our stock may result in the reduction in the market price of our stock and make it more difficult to raise funds in the future.
If our stockholders sell substantial amounts of our common stock in the public market, the market price of our common stock could fall. The perception among investors that such sales will occur could also produce this effect. We currently have several stockholders who own large percentages of our stock. To the extent we continue to have one or more stockholders who own a large percentage of our stock and those stockholders chose to liquidate their holdings, it may have a dramatic impact on the market price of our stock. These factors also could make it more difficult to raise funds through future offerings of common stock.
As a result of operating as a smaller public company, we may experience challenges in complying with rules and regulations of federal, state and financial market exchange entities, and our management is required to devote substantial time to comply with new and ongoing regulatory initiatives.
Because our common stock is publicly traded, we are subject to certain rules and regulations of federal, state and financial market exchange entities charged with the protection of investors and the oversight of companies whose securities are publicly traded. These entities, including the Public Company Accounting Oversight Board, the SEC and NASDAQ, have issued requirements and regulations and are currently developing additional regulations and requirements in response to laws enacted by Congress, most notably the Sarbanes-Oxley Act of 2002 and the Dodd-Frank Wall Street Reform and Consumer Protection Act of 2011. Establishment of effective internal controls is further complicated because we are a relatively small company with global operations, and multiple locations and IT systems. Our management and other personnel have, and will continue to devote a substantial amount of time to these compliance initiatives.
Changes in, or interpretations of, accounting principles or tax rules and regulations, could adversely affect our results of operations.
We prepare our consolidated financial statements in conformity with U.S. generally accepted accounting principles (“GAAP”). It is possible that future requirements could change our current application of U.S. GAAP, resulting in a material adverse impact on our financial positions or results of operation. In addition, our future effective tax rates could be unfavorably affected by changes in tax laws or the interpretation of tax laws or by changes in the valuation of our deferred tax assets and liabilities. We regularly assess our implementation of applicable accounting principles and the adequacy of our provision for income taxes, but we are a relatively small company and our business is complex; the final determination of any tax authority, upon examination of our income tax returns, could have an adverse effect on our operating results and financial position.
Certain provisions of our charter documents, employment arrangements and Delaware law may discourage, delay or prevent an acquisition of us, even if an acquisition would be beneficial to our stockholders, and may prevent attempts by our stockholders to replace or remove our current management.
Provisions of our amended and restated certificate of incorporation and bylaws, as well as provisions of Delaware law, could continue to make it difficult for a third party to acquire us, even if doing so would benefit our stockholders. In addition, these provisions may frustrate or prevent any attempts by our stockholders to replace or remove our current management by making it more difficult for stockholders to replace members of our board of directors. Because our board of directors is responsible for appointing the members of our management team, these provisions could in turn affect any attempt by our stockholders to replace current members of our management team. These provisions include the following:
· our stockholders cannot take action by written consent; and
· we have advance notice requirements for nominations for election to the Board of Directors or for proposing matters that can be acted upon at stockholder meetings.
In addition, we are subject to the anti-takeover provisions of Section 203 of Delaware General Corporation Law, which prohibit us from engaging in a “business combination” with an “interested stockholder” for a period of three years after the date of the transaction in which the person became an interested stockholder, unless the business combination is approved in the prescribed manner. The application of Section 203 and certain provisions of our restated certificate of incorporation may have the effect of delaying or preventing changes in control of our management, which could adversely affect the market price of our common stock by discouraging or preventing takeover attempts that might result in the payment of a premium price to our stockholders.
Our named executive officers have entered into agreements with us that contain a change in control provision. These agreements generally provide for acceleration on vesting of options, 50% upon a change in control (as defined in such agreement) if the executive officer remains employed with the new entity, or 100% in the event the executive officer’s employment is terminated. The acceleration of vesting of options upon a change in control may be viewed as an anti-takeover measure and may have the effect of discouraging a merger proposal, tender offer or other attempt to gain control of us.
Our Amended and Restated Stock Option Plan provides for acceleration of vesting under certain circumstances. Upon certain changes in control of us, vesting on some options awarded to directors may be accelerated. In addition, the successor corporation may assume outstanding stock awards or substitute equivalent stock awards. If the successor corporation refuses to do so, such stock awards will become fully vested and exercisable for a period of 15 days after notice from us but the options will terminate if not exercised during that period. As noted above, the acceleration on vesting of options upon a change in control may be viewed as an anti-takeover measure.
Adverse economic or market conditions may harm our business.
Unsettled financial markets, higher interest rates, inflation, levels of unemployment and worsening economic conditions could adversely affect demand for our products and services as consumers and businesses may postpone spending in response to these conditions. Challenging economic and market conditions may also result in:
· difficulty forecasting, budgeting and planning due to limited visibility into the spending plans of current or prospective customers;
· pricing pressure that may adversely affect revenue and gross margin;
· lengthening sales cycles and slowing deployments;
· increased competition for fewer projects and sales opportunities;
· increased risk of charges relating to write off of goodwill and other intangible assets; and
· customer and reseller financial difficulty and greater difficulty collecting accounts receivable.
ITEM 1B. UNRESOLVED STAFF COMMENTS
None.
We lease office space at various locations which are shown below.
|
Location |
|
Square |
|
Lease |
|
|
Englewood, Colorado (Headquarters) |
|
5,092 |
|
11/30/17 |
|
|
Bath, England |
|
5,100 |
|
9/26/15 |
|
|
London, England |
|
2,765 |
|
3/24/15 |
|
|
Bangalore, India |
|
12,300 |
|
8/18/15 |
|
|
Kuala Lumpur, Malaysia |
|
1,042 |
|
7/14/15 |
|
We believe that our facilities are adequate for our current and near-term needs, and that we will be able to locate additional facilities as needed. Our London, England office lease terminates on March 24, 2015. We have entered into a new lease effective March 3, 2015 at a new location in London, England. Refer to Note 17 — Subsequent Events of this Annual Report on Form 10-K.
From time to time, we are involved in various legal matters arising in the normal course of business. We do not believe that any such matters, either individually or in the aggregate, will have a material impact on our results of operations and financial position.
ITEM 4. MINE SAFETY DISCLOSURES
Not applicable.
ITEM 5. MARKET FOR REGISTRANT’S COMMON EQUITY, RELATED STOCKHOLDER MATTERS AND ISSUER PURCHASES OF EQUITY SECURITIES
Our common stock is traded on the Nasdaq Capital Market under the symbol “EVOL.” The following table sets forth the high and low sale prices of our common stock for the periods indicated.
|
|
|
For the Years Ended December 31, |
| ||||||||||
|
|
|
2014 |
|
2013 |
| ||||||||
|
|
|
High |
|
Low |
|
High |
|
Low |
| ||||
|
First Quarter |
|
$ |
11.11 |
|
$ |
8.42 |
|
$ |
7.28 |
|
$ |
5.90 |
|
|
Second Quarter |
|
$ |
9.28 |
|
$ |
7.78 |
|
$ |
6.66 |
|
$ |
5.57 |
|
|
Third Quarter |
|
$ |
10.50 |
|
$ |
8.99 |
|
$ |
9.75 |
|
$ |
6.72 |
|
|
Fourth Quarter |
|
$ |
11.38 |
|
$ |
8.94 |
|
$ |
11.19 |
|
$ |
9.34 |
|
As of March 12, 2015, there were approximately 70 holders of record of our common stock.
Dividends
Our Board of Directors declared a cash dividend of $0.10 per share during the first and second quarters of 2014 and a cash dividend of $0.11 per share during the third and fourth quarters of 2014. During the first and second quarters of 2013, our Board of Directors declared a cash dividend of $0.08 per share and a $0.10 per share cash dividend during the third and fourth quarters of 2013. There can be no guarantee that we will continue to pay dividends. The decision to declare dividends in the future will depend on general business conditions, the impact of such payment on our financial condition and other factors our Board of Directors may consider to be relevant. In addition, our revolving credit facility limits our ability to pay dividends by establishing a maximum amount that can be paid per quarter and prohibiting payment of dividends when an event of default has occurred. Payment of future dividends can also affect our business as this could reduce our cash reserves to levels that may be inadequate to fund expansions to our business plan or unanticipated contingent liabilities.
Stock Performance Graph
The following graph compares the cumulative 5-year total return provided to shareholders on Evolving Systems, Inc.’s common stock relative to the cumulative total returns of the NASDAQ Composite index, the RDG Software Composite index and the DJ US MicroCap Total Stock Market Software index. An investment of $100 (with reinvestment of all dividends) is assumed to have been made in our common stock and in each index on 12/31/2009 and its relative performance is tracked through 12/31/2014.
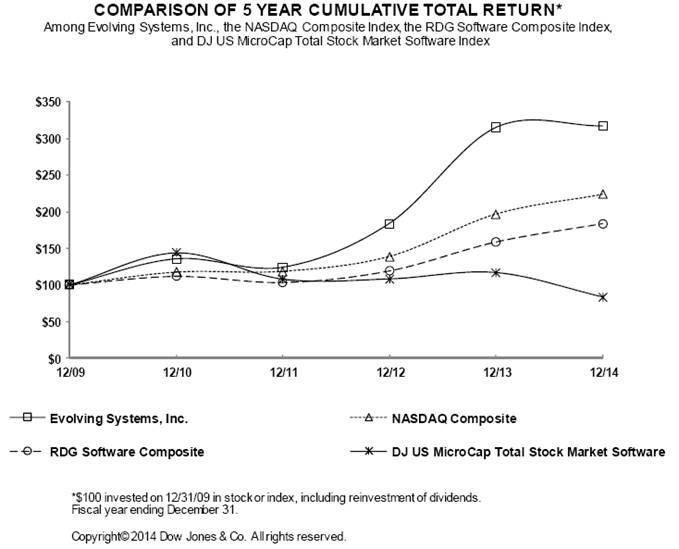
ITEM 6. SELECTED FINANCIAL DATA
The selected financial data set forth below for each of the years in the five-year period ended December 31, 2014, has been derived from our consolidated financial statements. The following selected financial data should be read in conjunction with “Item 7 - Management’s Discussion and Analysis of Financial Condition and Results of Operations”, the consolidated financial statements and the notes thereto and other financial information included elsewhere in this Annual Report on Form 10-K.
|
|
|
For the Years Ended December 31, |
| |||||||||||||
|
|
|
2014 |
|
2013 |
|
2012 |
|
2011 |
|
2010 |
| |||||
|
|
|
|
|
(in thousands, except per share amounts) |
| |||||||||||
|
|
|
|
|
|
|
|
|
|
|
|
| |||||
|
Revenue |
|
$ |
29,680 |
|
$ |
25,093 |
|
$ |
26,247 |
|
$ |
19,023 |
|
$ |
22,816 |
|
|
Costs of Revenue and Operating Expenses: |
|
|
|
|
|
|
|
|
|
|
| |||||
|
Cost of revenue, excluding depreciation and amortization |
|
7,648 |
|
7,164 |
|
8,236 |
|
7,419 |
|
8,616 |
| |||||
|
Sales and marketing |
|
5,734 |
|
5,364 |
|
5,070 |
|
6,238 |
|
6,410 |
| |||||
|
General and administrative |
|
3,638 |
|
3,644 |
|
3,613 |
|
3,650 |
|
4,465 |
| |||||
|
Product development |
|
3,643 |
|
2,956 |
|
3,069 |
|
2,484 |
|
2,486 |
| |||||
|
Depreciation |
|
246 |
|
155 |
|
268 |
|
342 |
|
347 |
| |||||
|
Amortization |
|
95 |
|
211 |
|
400 |
|
560 |
|
688 |
| |||||
|
Restructuring and other expense |
|
237 |
|
558 |
|
— |
|
1,100 |
|
— |
| |||||
|
Income (loss) from operations |
|
8,439 |
|
5,041 |
|
5,591 |
|
(2,770 |
) |
(196 |
) | |||||
|
Interest and other income (expense), net |
|
(34 |
) |
39 |
|
842 |
|
791 |
|
(210 |
) | |||||
|
Interest and other income, related parties, net |
|
— |
|
— |
|
532 |
|
619 |
|
— |
| |||||
|
Income tax expense (benefit) |
|
2,797 |
|
1,274 |
|
1,401 |
|
(405 |
) |
(422 |
) | |||||
|
Income (loss) from continuing operations |
|
5,608 |
|
3,806 |
|
5,564 |
|
(955 |
) |
16 |
| |||||
|
Income from discontinued operations, net of tax (1) |
|
— |
|
— |
|
— |
|
33,264 |
|
5,337 |
| |||||
|
Net income |
|
$ |
5,608 |
|
$ |
3,806 |
|
$ |
5,564 |
|
$ |
32,309 |
|
$ |
5,353 |
|
|
|
|
|
|
|
|
|
|
|
|
|
| |||||
|
Basic income per common share - net income |
|
$ |
0.48 |
|
$ |
0.33 |
|
$ |
0.49 |
|
$ |
2.97 |
|
$ |
0.53 |
|
|
Diluted income per common share - net income |
|
$ |
0.47 |
|
$ |
0.32 |
|
$ |
0.48 |
|
$ |
2.88 |
|
$ |
0.49 |
|
|
Weighted average basic shares outstanding |
|
11,642 |
|
11,459 |
|
11,278 |
|
10,871 |
|
10,174 |
| |||||
|
Weighted average diluted shares outstanding |
|
11,926 |
|
11,756 |
|
11,529 |
|
11,202 |
|
10,815 |
| |||||
|
Cash dividend declared per common share (2) (3) |
|
$ |
0.42 |
|
$ |
0.36 |
|
$ |
2.00 |
|
$ |
2.15 |
|
$ |
0.15 |
|
|
|
|
|
|
|
|
|
|
|
|
|
| |||||
|
Working capital |
|
$ |
15,794 |
|
$ |
14,699 |
|
$ |
13,894 |
|
$ |
11,672 |
|
$ |
11,812 |
|
|
Total assets |
|
44,232 |
|
43,184 |
|
36,593 |
|
75,042 |
|
50,451 |
| |||||
|
Stockholders’ equity |
|
$ |
34,052 |
|
$ |
32,735 |
|
$ |
30,836 |
|
$ |
44,712 |
|
$ |
35,757 |
|
(1) On July 1, 2011, we completed the Asset Sale of our Numbering Solutions Business for $39.4 million in cash and the assumption of certain liabilities to the buyer. The Asset Sale qualified for treatment as discontinued operations during the second quarter of 2011 upon receipt of shareholder approval at a special meeting of shareholders on June 23, 2011. This divested business is reflected in these consolidated financial statements as discontinued operations and historical information related to the divested business has been reclassified accordingly.
(2) On November 10, 2011, our Board of Directors declared a special cash dividend of $2.00 per share or approximately $22.3 million in total, net of treasury stock, payable on January 3, 2012, to stockholders of record December 12, 2011. The dividend was accrued as of December 31, 2011 for $22.3 million and paid on January 3, 2012. During 2011, our Board of Directors declared and paid a first, second and third quarter cash dividend of $.05 per share each.
(3) During 2012, our Board of Directors declared and paid a first, third and fourth quarter cash dividend of $0.05 per share each and a second and fourth quarter special cash dividend of $1.70 and $0.15 per share, respectively. There were no accrued dividends as of December 31, 2012. In addition, the special cash dividend declared in the fourth quarter 2011 of $2.00 per share was paid in January 2012.
ITEM 7. MANAGEMENT’S DISCUSSION AND ANALYSIS OF FINANCIAL CONDITION AND RESULTS OF OPERATIONS
FORWARD-LOOKING STATEMENTS
This Management’s Discussion and Analysis of Financial Condition and Results of Operations contains forward-looking statements that have been made pursuant to the provisions of the Private Securities Litigation Reform Act of 1995. These forward-looking statements are based on current expectations, estimates, and projections about Evolving Systems’ industry, management’s beliefs, and certain assumptions made by management. Forward-looking statements include our expectations regarding product, services, and customer support revenue; our expectations associated with Evolving Systems India and Evolving Systems U.K., and short- and long-term cash needs. In some cases, words such as “anticipates”, “expects”, “intends”, “plans”, “believes”, “estimates”, variations of these words, and similar expressions are intended to identify forward-looking statements. The following discussion should be read in conjunction with, and is qualified in its entirety by, the consolidated financial statements and the notes thereto included elsewhere in this Annual Report on Form 10-K. Our actual results could differ materially from those anticipated in these forward-looking statements as a result of certain factors, including those set forth in this section and in “Item 1A - Risk Factors.”
OVERVIEW
Evolving Systems, Inc. is a leading provider of software solutions and services to the wireless, wireline and cable markets. We maintain long-standing relationships with many of the largest wireline, wireless and cable companies worldwide. Our customers rely on us to develop, deploy, enhance, maintain and integrate complex, reliable software solutions for a range of Operations Support Systems (“OSS”). Our activation solution is the leading packaged solution for activation in the wireless industry.
We recognize revenue in accordance with the prescribed accounting standards for software revenue recognition under generally accepted accounting principles. As a result, our license fees and services revenue fluctuate from period to period as a result of the timing of revenue recognition on existing projects.
RECENT DEVELOPMENTS
We reported net income of $5.6 million, $3.8 million and $5.6 million for the years ended December 31, 2014, 2013 and 2012, respectively. Our ending backlog at December 31, 2014 was $10.6 million, consisting of $5.6 million of license and services and $5.0 million of customer support compared to total backlog of $12.2 million at December 31, 2013.
On October 24, 2013 we acquired privately held Telespree, now known as Evolving Systems Labs, for an initial payment of approximately $1.6 million comprised, of approximately $0.8 million in cash and approximately $0.8 million in stock We also agreed to make a subsequent payment of $0.5 million, subject to reduction for certain claims which has not been made to date. We will potentially make additional payments in cash on the achievement of certain financial targets for the period from October 25, 2013 through October 24, 2016. Evolving Systems Labs’ SaaS services revenue is included as a component of our DSA license fees and services revenue.
We declared and paid a $0.10 cash dividend per share in the first and second quarters of 2014 and a $0.11 cash dividend per share in the third and fourth quarters of 2014.
We have operations in foreign countries where the local currency is used to prepare the financial statements which are translated into our reporting currency, U.S. Dollars. Changes in the exchange rates between these currencies and our reporting currency are partially responsible for some of the changes from period to period in our financial statement amounts. The majority of the changes in 2014 and 2013 are a result of the U.S. Dollar weakening on average versus the British Pound Sterling. The chart below summarizes what the effects on our revenue and expenses would be on a constant currency basis. The constant currency basis assumes that the exchange rate was constant for the periods presented (in thousands).
|
|
|
For the Years ended December 31, |
| ||||
|
|
|
2014 vs. 2013 |
|
2013 vs. 2012 |
| ||
|
Revenue |
|
$ |
404 |
|
$ |
(17 |
) |
|
Costs of revenue and operating expenses |
|
460 |
|
(443 |
) | ||
|
Operating (loss) gain |
|
$ |
(56 |
) |
$ |
426 |
|
The net effect of our foreign currency translations for the year ended December 31, 2014 was a $0.4 million increase in revenue and a $0.5 million increase in operating expenses versus the year ended December 31, 2013. The net effect of our foreign currency translations for the year ended December 31, 2013 was a $17,000 decrease in revenue and a $0.4 million decrease in operating expenses versus the year ended December 31, 2012.
RESULTS OF OPERATIONS
The following table presents our consolidated statements of operations in comparative format.
|
|
|
For the Years Ended December 31, |
|
For the Years Ended December 31, |
| ||||||||||||||
|
|
|
2014 |
|
2013 |
|
Change |
|
2013 |
|
2012 |
|
Change |
| ||||||
|
REVENUE |
|
|
|
|
|
|
|
|
|
|
|
|
| ||||||
|
License fees and services |
|
$ |
19,738 |
|
$ |
15,998 |
|
$ |
3,740 |
|
$ |
15,998 |
|
$ |
17,622 |
|
$ |
(1,624 |
) |
|
Customer support |
|
9,942 |
|
9,095 |
|
847 |
|
9,095 |
|
8,625 |
|
470 |
| ||||||
|
Total revenue |
|
29,680 |
|
25,093 |
|
4,587 |
|
25,093 |
|
26,247 |
|
(1,154 |
) | ||||||
|
|
|
|
|
|
|
|
|
|
|
|
|
|
| ||||||
|
COSTS OF REVENUE AND OPERATING EXPENSES |
|
|
|
|
|
|
|
|
|
|
|
|
| ||||||
|
Costs of license fees and services, excluding depreciation and amortization |
|
5,782 |
|
5,565 |
|
217 |
|
5,565 |
|
6,734 |
|
(1,169 |
) | ||||||
|
Costs of customer support, excluding depreciation and amortization |
|
1,866 |
|
1,599 |
|
267 |
|
1,599 |
|
1,502 |
|
97 |
| ||||||
|
Sales and marketing |
|
5,734 |
|
5,364 |
|
370 |
|
5,364 |
|
5,070 |
|
294 |
| ||||||
|
General and administrative |
|
3,638 |
|
3,644 |
|
(6 |
) |
3,644 |
|
3,613 |
|
31 |
| ||||||
|
Product development |
|
3,643 |
|
2,956 |
|
687 |
|
2,956 |
|
3,069 |
|
(113 |
) | ||||||
|
Depreciation |
|
246 |
|
155 |
|
91 |
|
155 |
|
268 |
|
(113 |
) | ||||||
|
Amortization |
|
95 |
|
211 |
|
(116 |
) |
211 |
|
400 |
|
(189 |
) | ||||||
|
Restructuring and other recovery |
|
237 |
|
558 |
|
(321 |
) |
558 |
|
— |
|
558 |
| ||||||
|
Total costs of revenue and operating expenses |
|
21,241 |
|
20,052 |
|
1,189 |
|
20,052 |
|
20,656 |
|
(604 |
) | ||||||
|
Income (loss) from operations |
|
8,439 |
|
5,041 |
|
3,398 |
|
5,041 |
|
5,591 |
|
(550 |
) | ||||||
|
|
|
|
|
|
|
|
|
|
|
|
|
|
| ||||||
|
Interest income |
|
19 |
|
11 |
|
8 |
|
11 |
|
60 |
|
(49 |
) | ||||||
|
Interest income, related party |
|
— |
|
— |
|
— |
|
— |
|
532 |
|
(532 |
) | ||||||
|
Interest expense |
|
(17 |
) |
(20 |
) |
3 |
|
(20 |
) |
(3 |
) |
(17 |
) | ||||||
|
Other income |
|
(27 |
) |
87 |
|
(114 |
) |
87 |
|
— |
|
87 |
| ||||||
|
Gain on sale of investments |
|
— |
|
— |
|
— |
|
— |
|
891 |
|
(891 |
) | ||||||
|
Foreign currency exchange gain (loss) |
|
(9 |
) |
(39 |
) |
30 |
|
(39 |
) |
(106 |
) |
67 |
| ||||||
|
Other income (expense), net |
|
(34 |
) |
39 |
|
(73 |
) |
39 |
|
1,374 |
|
(1,335 |
) | ||||||
|
|
|
|
|
|
|
|
|
|
|
|
|
|
| ||||||
|
Income before income taxes |
|
8,405 |
|
5,080 |
|
3,325 |
|
5,080 |
|
6,965 |
|
(1,885 |
) | ||||||
|
Income tax expense |
|
2,797 |
|
1,274 |
|
1,523 |
|
1,274 |
|
1,401 |
|
(127 |
) | ||||||
|
Net income |
|
$ |
5,608 |
|
$ |
3,806 |
|
$ |
1,802 |
|
$ |
3,806 |
|
$ |
5,564 |
|
$ |
(1,758 |
) |
The following table presents our consolidated statements of operations reflected as a percentage of total revenue.
|
|
|
For the Years Ended December 31, |
| ||||
|
|
|
2014 |
|
2013 |
|
2012 |
|
|
REVENUE |
|
|
|
|
|
|
|
|
License fees and services |
|
67 |
% |
64 |
% |
67 |
% |
|
Customer support |
|
33 |
% |
36 |
% |
33 |
% |
|
Total revenue |
|
100 |
% |
100 |
% |
100 |
% |
|
|
|
|
|
|
|
|
|
|
COSTS OF REVENUE AND OPERATING EXPENSES |
|
|
|
|
|
|
|
|
Costs of license fees and services, excluding depreciation and amortization |
|
19 |
% |
22 |
% |
25 |
% |
|
Costs of customer support, excluding depreciation and amortization |
|
6 |
% |
6 |
% |
6 |
% |
|
Sales and marketing |
|
19 |
% |
21 |
% |
19 |
% |
|
General and administrative |
|
12 |
% |
15 |
% |
14 |
% |
|
Product development |
|
12 |
% |
12 |
% |
12 |
% |
|
Depreciation |
|
1 |
% |
1 |
% |
1 |
% |
|
Amortization |
|
0 |
% |
1 |
% |
2 |
% |
|
Restructuring and other recovery |
|
1 |
% |
2 |
% |
— |
% |
|
Total costs of revenue and operating expenses |
|
70 |
% |
80 |
% |
79 |
% |
|
|
|
|
|
|
|
|
|
|
Income (loss) from operations |
|
30 |
% |
20 |
% |
21 |
% |
|
|
|
|
|
|
|
|
|
|
Other income (expense) |
|
|
|
|
|
|
|
|
Interest income |
|
0 |
% |
0 |
% |
0 |
% |
|
Interest income, related party |
|
— |
% |
— |
% |
2 |
% |
|
Interest expense |
|
(0 |
)% |
(0 |
)% |
(0 |
)% |
|
Other income |
|
(1 |
)% |
0 |
% |
— |
% |
|
Gain on sale of investments |
|
— |
% |
— |
% |
3 |
% |
|
Foreign currency exchange gain (loss) |
|
(0 |
)% |
(0 |
)% |
(0 |
)% |
|
Other income (expense), net |
|
(1 |
)% |
0 |
% |
5 |
% |
|
|
|
|
|
|
|
|
|
|
Income before income taxes |
|
29 |
% |
20 |
% |
26 |
% |
|
Income tax expense |
|
10 |
% |
5 |
% |
5 |
% |
|
Net income |
|
19 |
% |
15 |
% |
21 |
% |
Revenue
Revenue is comprised of license fees and services and customer support. License fees and services revenue represent the fees we receive from the licensing of our software products and those services directly related to the delivery of the licensed product as well as integration services, SaaS services and time and materials work. Customer support revenue includes annual support fees, recurring maintenance fees, minor product upgrades and warranty fees. Warranty fees are typically bundled with a license sale and the related revenue, based on Vendor Specific Objective Evidence (“VSOE”), is deferred and recognized ratably over the warranty period.
License Fees and Services
License fees and services revenue increased 23%, or $3.7 million to $19.7 million for the year ended December 31, 2014 compared to $16.0 million for the year ended December 31, 2013. The increase in license fee and services revenue is due to an increase in DSA revenue primarily related to increased First User Activations (“FUAs”) and revenue generated from Evolving Systems Labs, which we acquired in October 2013.
License fees and services revenue decreased 9%, or $1.6 million to $16.0 million for the year ended December 31, 2013 compared to $17.6 million for the year ended December 31, 2012. The decrease in license fee and services revenue is due to a decline in DSA and Tertio Service Activation (“TSA”) revenues of $1.1 million and $0.5 million, respectively.
Customer Support
Customer support revenue increased 9%, or $0.8 million, to $9.9 million for the year ended December 31, 2014 from $9.1 million for the year ended December 31, 2013. The increase in customer support revenue is primarily due to an increase in our installed customer base for DSA.
Customer support revenue increased 5%, or $0.5 million, to $9.1 million for the year ended December 31, 2013 from $8.6 million for the year ended December 31, 2012. The increase in customer support revenue is primarily due to an increase in our installed customer base for DSA offset by a decline in our installed customer base for TSA.
Costs of Revenue, excluding depreciation and amortization
Costs of revenue consist primarily of personnel costs, facilities costs, the costs of third-party software and all other direct costs associated with these personnel. Costs of revenue, excluding depreciation and amortization were $7.6 million, $7.2 million and $8.2 million for the years ended December 31, 2014, 2013 and 2012, respectively.
Costs of License Fees and Services, excluding depreciation and amortization
Costs of revenue for license fees and services increased 4%, or $0.2 million, to $5.8 million for the year ended December 31, 2014 from $5.6 million for the year ended December 31, 2013. The increase in costs was primarily the result of increases in travel, subcontractor and incentive compensation, all of which resulted from revenue growth. As a percentage of license fees and services revenue, costs of license fees and services, excluding depreciation and amortization, decreased to 29% for the year ended December 31, 2014 from 35% for the year ended December 31, 2013. The decrease in costs as a percentage of licenses fees and services revenue is primarily related to the increased revenue during the period.
Costs of revenue for license fees and services decreased 17%, or $1.1 million, to $5.6 million for the year ended December 31, 2013 from $6.7 million for the year ended December 31, 2012. The decrease in costs was primarily the result of reductions in third party software expense, partner fees, employee costs and subcontractors, all a result of lower revenue. As a percentage of license fees and services revenue, costs of license fees and services, excluding depreciation and amortization, decreased to 35% for the year ended December 31, 2013 from 38% for the year ended December 31, 2012. The decrease in costs as a percentage of licenses fees and services revenue is primarily related to aforementioned decrease in expense during the period.
Costs of Customer Support, excluding depreciation and amortization
Costs of revenue for customer support increased 17%, or $0.3 million, to $1.9 million for the year ended December 31, 2014 from $1.6 million for the year ended December 31, 2013. The increase in costs is related to embedded software maintenance and subcontracted support services. As a percentage of customer support revenue, costs of customer support revenue, excluding depreciation and amortization, increased slightly to 19% for the year ended December 31, 2014 from 18% for the year ended December 31, 2013. The increase in costs as a percentage of customer support revenue is due primarily to the aforementioned increase in costs during the period.
Costs of revenue for customer support increased 6%, or $0.1 million, to $1.6 million for the year ended December 31, 2013 from $1.5 million for the year ended December 31, 2012. The increase in costs is related to embedded software maintenance, partner fees and travel. As a percentage of customer support revenue, costs of customer support revenue, excluding depreciation and amortization, increased slightly to 18% for the year ended December 31, 2013 from 17% for the year ended December 31, 2012. The increase in costs as a percentage of customer support revenue is due primarily to the aforementioned increase in costs during the period.
Sales and Marketing
Sales and marketing expenses primarily consist of compensation costs, including incentive compensation and commissions, other employee related costs, travel expenses, advertising and occupancy expenses. Sales and marketing expenses increased 7%, or $0.3 million, to $5.7 million for the year ended December 31, 2014 from $5.4 million for the year ended December 31, 2013. The increase in costs is primarily related to increased headcount and travel expenses. As a percentage of total revenue, sales and marketing expenses for the year ended December 31, 2014 decreased to 19% from 21% for the year ended December 31, 2013. The decrease as a percentage of revenue is due to increased revenue.
Sales and marketing expenses increased 6%, or $0.3 million, to $5.4 million for the year ended December 31, 2013 from $5.1 million for the year ended December 31, 2012. The increase in costs is primarily related to increased subcontractor costs and travel expenses. As a percentage of total revenue, sales and marketing expenses for the year ended December 31, 2013 increased to 21% from 19% for the year ended December 31, 2012. The increase as a percentage of revenue is due to decreased revenue and the aforementioned increase in costs during the period.
General and Administrative
General and administrative expenses consist principally of employee related costs, professional fees and occupancy costs for the following departments: facilities, finance, legal, human resources and executive management. General and administrative expenses for each of the years ended December 31, 2014 and 2013, was $3.6 million. Expenses for the year ended December 31, 2014 were affected primarily by higher incentive compensation but were offset by decreased professional fees. As a percentage of total revenue, general and administrative expenses decreased to 12% for the year ended December 31, 2014 from 15% for the year ended December 31, 2013. The decrease in expenses as a percentage of revenue is related to the increased revenue during the period.
General and administrative expenses for each of the years ended December 31, 2013 and 2012, was $3.6 million. As a percentage of total revenue, general and administrative expenses increased to 15% for the year ended December 31, 2013 from 14%
for the year ended December 31, 2012. The increase in expenses as a percentage of revenue is primarily related to the decreased revenue during the period.
Product Development
Product development expenses consist primarily of employee-related costs for product development. Product development expenses increased 23%, or $0.6 million, to $3.6 million for the year ended December 31, 2014 from $3.0 million for the year ended December 31, 2013. The increase in costs was related to additional hours spent on research and development projects and higher incentive compensation. As a percentage of total revenue, product development expenses were 12% for the years ended December 31, 2014 and 2013.
Product development expenses decreased 4%, or $0.1 million, to $3.0 million for the year ended December 31, 2013 from $3.1 million for the year ended December 31, 2012. The decrease in costs was primarily the result of decreased hours spent on research and development projects offset by higher travel expense. As a percentage of total revenue, product development expenses were 12% for the years ended December 31, 2013 and 2012.
Depreciation
Depreciation expense consists of depreciation of long-lived property and equipment. Depreciation expenses were $0.2 million for the years ended December 31, 2014 and 2013. As a percentage of revenue, depreciation expense remained at 1% for the years ended December 31, 2014 and 2013.
Depreciation expenses decreased 42%, or $0.1 million, to $0.2 million for the year ended December 31, 2013 from $0.3 million for the year ended December 31, 2012. As a percentage of revenue, depreciation expense remained at 1% for the years ended December 31, 2013 and 2012.
Amortization
Amortization expense consists of amortization of identifiable intangibles related to our acquisitions of Evolving Systems U.K. and Evolving Systems Labs. Amortization expense decreased 55%, to $0.1 million for the year ended December 31, 2014 from $0.2 million for the year ended December 31, 2013. The decrease in amortization expense was due to intangible assets relating to the acquisition of Evolving Systems U.K. becoming fully amortized as of June 30, 2013. As a percentage of revenue, amortization expense decreased to less than 1% for the year ended December 31, 2014 from 1% for the year ended December 31, 2013. The decrease of amortization expense as a percentage of total revenue is due increased revenue and to the aforementioned decrease of expense.
Amortization expense decreased 47%, to $0.2 million for the year ended December 31, 2013 from $0.4 million for the year ended December 31, 2012. The decrease in amortization expense was due to intangible assets relating to the acquisition of Evolving Systems U.K. becoming fully amortized as of June 30, 2013. As a percentage of revenue, amortization expense decreased to 1% for the year ended December 31, 2013 from 2% for the year ended December 31, 2012. The decrease of amortization expense as a percentage of total revenue is due to the aforementioned decrease of expense. Evolving Systems Labs’ amortization may be effected in future periods as the purchase allocation is finalized.
Restructuring
Restructuring expense includes the costs associated with a reduction in workforce involving the termination of employees. Restructuring decreased to $0.2 million for the year ended December 31, 2014 from $0.6 million for the year ended December 31, 2013. Restructuring expense for both years was a result of the acquisition of Telespree. As a percentage of revenue, restructuring expense decreased to 1% for the year ended December 31, 2014 from 2% for the year ended December 31, 2013. The decrease of amortization expense as a percentage of total revenue is due increased revenue and to the aforementioned decrease of expense.
Restructuring increased to $0.6 million for the year ended December 31, 2013 from $0 for the year ended December 31, 2012. The increase in restructuring expense was a result of the acquisition of Telespree. As a percentage of revenue, restructuring expense increased to 2% for the year ended December 31, 2013 from 0% for the year ended December 31, 2012.
Interest Income
Interest income includes interest income earned on cash, cash equivalents and long-term investments. Interest income increased 73%, or $8,000, to $19,000 for the year ended December 31, 2014 from $11,000 for the year ended December 31, 2013.
Interest income decreased 98%, or $0.6 million, to $11,000 for the year ended December 31, 2013 from $0.6 million for the year ended December 31, 2012. The decrease was primarily due to the sale of our long-term investments in the second quarter of 2012.
Interest Expense
Interest expense includes interest expense on our long-term debt and capital lease obligations as well as amortization of debt issuance costs. Interest expense for the year ended December 31, 2014 decreased 15%, or $3,000, to $17,000 as compared to $20,000 for the year ended December 31, 2013. This decrease was primarily due to the amortized costs related to our Loan and Security Agreement and interest expense from our capital leases. Refer to Note 6, Long-Term Debt, of our Consolidated Financial Statements included elsewhere in this Annual Report on Form 10-K for more information regarding the Loan and Security Agreement.
Interest expense for the year ended December 31, 2013 increased 567%, or $17,000, to $20,000 as compared to $3,000 for the year ended December 31, 2012. This increase was primarily due to the amortized costs related to our Loan and Security Agreement and interest expense from our capital leases.
Gain on Sale of Investments
Gain on the sale of investments for the year ended December 31, 2012 of $0.9 million is a result of the sale of long-term investments in the second quarter of 2012. There were no gains recorded in the years ended December 31, 2014 and 2013.
Gain (Loss) on Foreign Exchange Transactions
Gain (loss) on foreign exchange transactions consists of realized and unrealized foreign currency transaction gains and losses. Foreign currency transaction gains and losses result from transactions denominated in a currency other than the functional currency of the respective subsidiary. The foreign currency transaction loss of $9,000 for the year ended December 31, 2014 compared to a $39,000 loss for the year ended December 31, 2013 resulted in a year over year gain of 77% or $30,000. The net loss was generated through the re-measurement of certain non-functional currency denominated financial assets and liabilities of our Evolving Systems U.K. and India subsidiaries.
The foreign currency transaction loss of $39,000 for the year ended December 31, 2013 compared to a $0.1 million loss for the year ended December 31, 2012 resulted in a year over year gain of 63% or $0.1 million. The net loss was generated through the re-measurement of certain non-functional currency denominated financial assets and liabilities of our Evolving Systems U.K. and India subsidiaries.
Income Tax Expense
We recorded income tax expense of $2.8 million, $1.3 million and $1.4 million for the years ended December 31, 2014, 2013 and 2012, respectively. The net expense during year ended December 31, 2014 consisted of current income tax expense of $3.1 million and a net deferred tax benefit of ($0.3) million. The current tax expense consists primarily of income tax from our U.S., U.K. and India based operations, Alternative Minimum Tax (“AMT”) and unrecoverable foreign withholding tax in the U.S. U.S. income taxes payable of $1.4 million were offset due to realization of Net Operating Losses (“NOL”) comprised of windfall tax benefits related to stock-based compensation. Unused windfall tax benefits may not be recorded as an asset on our Consolidated Balance Sheets but are recorded as a reduction to our taxes payable when realized, with a corresponding credit to additional paid in capital. The deferred tax benefit was related primarily to the increase of certain net deferred tax assets in the U.S. In addition, we had a deferred tax expense from our U.K.-based operations and Evolving Systems Labs related to a decrease in net deferred tax assets including intangible assets.
The net expense during year ended December 31, 2013 consisted of current income tax expense of $1.6 million and a net deferred tax benefit of ($0.3) million. The current tax expense consists primarily of income tax from our U.S., U.K. and India based operations, Alternative Minimum Tax (“AMT”) and unrecoverable foreign withholding tax in the U.S. and U.K. U.S. income taxes payable of $0.4 million were offset due to realization of Net Operating Losses (“NOL”) comprised of windfall tax benefits related to stock-based compensation. Unused windfall tax benefits may not be recorded as an asset on our Consolidated Balance Sheets but are recorded as a reduction to our taxes payable when realized, with a corresponding credit to additional paid in capital. The foreign withholding taxes are typically used to offset our income tax liability, but we did not have enough taxable income to utilize the foreign withholding taxes during the year. The deferred tax benefit was related primarily to the increase of certain net deferred tax assets in the U.S. and the utilization of Minimum Alternative Tax (“MAT”) assets in India. In addition, we had a tax benefit related to intangible assets from our U.K.-based operations and Evolving Systems Labs.
The net expense during the year ended December 31, 2012 consisted of current income tax expense of $1.7 million and a net deferred tax benefit of ($0.3) million. The current tax expense consists primarily of income tax from our U.S., U.K. and India based
operations, AMT and unrecoverable foreign withholding tax in the U.S. and U.K. U.S. income taxes payable of $1.0 million were offset due to realization of NOL comprised of windfall tax benefits related to stock-based compensation. Unused windfall tax benefits may not be recorded as an asset on our Consolidated Balance Sheets but are recorded as a reduction to our taxes payable when realized, with a corresponding credit to additional paid in capital. The foreign withholding taxes are typically used to offset our income tax liability, but we did not have enough taxable income to utilize the foreign withholding taxes during the year. The deferred tax benefit was related primarily to a reduction to our foreign deferred tax liability on unremitted foreign earnings related to our Indian operations offset by the utilization of certain deferred tax assets in the U.S., the monetization of the U.K. NOL and the utilization of MAT assets in India.
Our effective tax rates for the years ended December 31, 2014, 2013 and 2012 were 33%, 25% and 20%, respectively. The effective tax rate increases during 2013 and 2014 are primarily attributable to the higher profits from our U.K. subsidiary.
In conjunction with the acquisition of Evolving Systems Labs in October 2013, we recorded certain identifiable intangible assets of $0.7 million. These assets are amortizable for both book and tax purposes.
The Company has the intent and current ability to indefinitely reinvest profits of Evolving Systems India for the year ended December 31, 2014. Undistributed foreign earnings for the year ended December 31, 2014 are approximately $0.5 million. Repatriation to the U.S. in the form of dividend distributions from the India controlled foreign subsidiary would give rise to taxation.
We use a recognition threshold and a measurement attribute for the financial statement recognition and measurement of tax positions taken or expected to be taken in a tax return. For those benefits to be recognized, a tax position must be more-likely-than-not to be sustained upon examination by taxing authorities. As of December 31, 2014 and 2013, we had no liability for unrecognized tax benefits. We do not believe there will be any material changes to our unrecognized tax positions over the next twelve months.
FINANCIAL CONDITION
Our working capital position of $15.8 million at December 31, 2014 reflects an increase of $1.1 million from our working capital position of $14.7 million at December 31, 2013. The increase is primarily related to an increase in our accounts receivable and unbilled work-in-progress offset by a decrease in deferred revenue and partially offset by an increase in tax liabilities.
LIQUIDITY AND CAPITAL RESOURCES
We have historically financed operations through cash flows from operations as well as debt and equity transactions. At December 31, 2014, our principal sources of liquidity were $9.8 million in cash and cash equivalents, $9.2 million in contract receivables, net of allowances and $5.0 million of unused availability under our revolving credit facility. Refer to Note 6, Long-Term Debt, of our Consolidated Financial Statements included elsewhere in this Annual Report on Form 10-K for more information regarding our revolving credit facility.
Net cash provided by (used in) operating activities for the year ended December 31, 2014, 2013 and 2012 was ($0.4) million, $8.6 million and ($0.2) million, respectively. The decrease in cash provided by operating activities for the year ended December 31, 2014 was primarily due to a decrease in unearned revenue and an increase unbilled work-in-progress and contract receivables.
The increase in cash provided by operating activities for the year ended December 31, 2013 compared to 2012 was due to an increase in unearned revenue, a decrease in unbilled work-in-progress offset by an increase in contract receivables and in accounts payable and accrued liabilities.
Net cash provided by (used in) investing activities was ($0.6) million, ($0.6) million and $17.8 million for the years ended December 31, 2014, 2013 and 2012, respectively. Cash used in investing activities for the year ended December 31, 2014 was related the purchase of property and equipment. During 2014, 2013 and 2012, we purchased $0.6 million, $0.3 million and $0.1 million in property and equipment to support operations, respectively. Historically, capital expenditures have been financed by cash from operating activities. Refer to Note 3, Acquisition, of our Consolidated Financial Statements included in this Annual Report on Form 10-K for more information regarding the acquisition.
Net cash used in investing activities for the year ended December 31, 2013 was ($0.6) million compared to net cash provided for the year ended December 31, 2012 of $17.8 million. The 2013 use of cash related to the acquisition of Evolving Systems Labs and increased purchase of property and equipment. An initial payment of $0.4 million, net of cash received was paid in 2013 for the acquisition of Evolving Systems Labs. Cash provided by in 2012 was primarily related to the sale of marketable securities.
Net cash used in financing activities was ($3.2) million, ($3.2) million and ($43.2) million for the years ended December 31, 2014, 2013 and 2012, respectively. The net cash used in financing activities is due primarily to payments of $4.9 million in dividends offset by a $1.4 million in windfall tax benefits from stock-based compensation and $0.3 million in proceeds from the exercise of
stock options. The net cash used in financing activities during 2013 is due to payments of $4.1 million in dividends offset by a $0.4 million in windfall tax benefits from stock-based compensation and $0.5 million in proceeds from the exercise of stock options. The net cash used in financing activities during 2012 is primarily due to payments of $44.8 million for common stock dividends, partially offset by $1.0 million of windfall tax benefits related to stock-based compensation and $0.6 million of proceeds from the exercise of stock options.
We believe that our current cash and cash equivalents, together with anticipated cash flow from operations will be sufficient to meet our working capital and capital expenditure requirements for at least the next twelve months. In making this assessment, we considered the following:
· Our cash and cash equivalents balance at December 31, 2014 of $9.8 million;
· Our working capital balance of $15.8 million;
· Our $5.0 million of unused availability under our revolving credit facility;
· Our ability to historically generate positive operating cash flows;
· The declaration of our quarterly cash dividends of $0.10 per share for the first and second quarters and $0.11 per share in the third and fourth quarters of 2014 and the possibility of future dividends;
· Our backlog of approximately $10.6 million, including $5.6 million in license fees and services and $5.0 million in customer support at December 31, 2014; and
· Our planned capital expenditures of less than $1.0 million during 2015.
We are exposed to foreign currency rate risks which impact the carrying amount of our foreign subsidiaries and our consolidated equity, as well as our consolidated cash position due to translation adjustments. For the years ended December 31, 2014, 2013 and 2012, the effect of exchange rate changes resulted in a $0.2 million increase to consolidated cash, respectively. We do not currently hedge our foreign currency exposure, but we closely monitor the rate changes and may hedge our exposures in the future.
Off-Balance Sheet Arrangements
We have no off-balance sheet arrangements that have a material current effect, or that are reasonably likely to have a material future effect, on our financial condition, changes in financial condition, revenue or expenses, results of operations, liquidity, capital expenditures, or capital resources.
Contractual Obligations and Commercial Commitments
The following summarizes our significant contractual obligations as of December 31, 2014, which are comprised of a capital lease and operating leases (in thousands).
|
|
|
Payments due by period |
| |||||||||||||
|
|
|
Total |
|
2015 |
|
2016 |
|
2017 |
|
2018 and |
| |||||
|
Capital lease |
|
$ |
13 |
|
$ |
6 |
|
$ |
6 |
|
$ |
1 |
|
$ |
— |
|
|
Operating leases |
|
532 |
|
327 |
|
106 |
|
99 |
|
— |
| |||||
|
Total commitments |
|
$ |
545 |
|
$ |
333 |
|
$ |
112 |
|
$ |
100 |
|
$ |
— |
|
CRITICAL ACCOUNTING POLICIES
Our significant accounting policies are disclosed in Note 1 of our Consolidated Financial Statements included elsewhere in this Annual Report on Form 10-K. The following discussion addresses our most critical accounting policies, which are those that are both important to the portrayal of our financial condition and results of operations and that require significant judgment or use of complex estimates.
Revenue Recognition
We recognize revenue when an agreement is signed, the fee is fixed or determinable and collectability is reasonably assured. We recognize revenue from two primary sources: license fees and services, and customer support. The majority of our license fees and services revenue is generated from fixed-price contracts, which provide for licenses to our software products and services to customize such software to meet our customers’ use. When the customization services are determined to be essential to the functionality of the delivered software, we recognize revenue using the percentage-of-completion method of accounting. In these types of arrangements, we do not typically have vendor specific objective evidence (“VSOE”) of fair value on the license fee/services portion (services are related to customizing the software) of the arrangement due to the large amount of customization required by our customers; however, we do have VSOE for the warranty/maintenance services based on the renewal rate of the first year of maintenance in the arrangement. The license/services portion is recognized using the percentage-of-completion method of accounting and the warranty/maintenance services are separated based on the renewal rate in the contract and recognized ratably over the warranty or maintenance period. We estimate the percentage-of-completion for each contract based on the ratio of direct labor hours incurred to total estimated direct labor hours and recognize revenue based on the percent complete multiplied by the contract amount allocated to the license fee/services. Since estimated direct labor hours, and changes thereto, can have a significant impact on revenue recognition, these estimates are critical and we review them regularly. If the arrangement includes a customer acceptance provision, the hours to complete the acceptance testing are included in the total estimated direct labor hours; therefore, the related revenue is recognized as the acceptance testing is performed. Revenue is not recognized in full until the customer has provided proof of acceptance on the arrangement. Generally, our contracts are accounted for individually. However, when certain criteria are met, it may be necessary to account for two or more contracts as one to reflect the substance of the group of contracts. We record amounts billed in advance of services being performed as unearned revenue. Unbilled work-in-progress represents revenue earned but not yet billable under the terms of the fixed-price contracts. All such amounts are expected to be billed and collected within 12 months.
We may encounter budget and schedule overruns on fixed-price contracts caused by increased labor or overhead costs. We make adjustments to cost estimates in the period in which the facts requiring such revisions become known. We record estimated losses, if any, in the period in which current estimates of total contract revenue and contract costs indicate a loss. If revisions to cost estimates are obtained after the balance sheet date but before the issuance of the interim or annual financial statements, we make adjustments to the interim or annual financial statements accordingly.
In arrangements where the services are not essential to the functionality of the delivered software, we recognize license revenue when a license agreement has been signed, delivery and acceptance have occurred, the fee is fixed or determinable and collectability is reasonably assured. Where applicable, we unbundle and record as revenue fees from multiple element arrangements as the elements are delivered to the extent that VSOE of fair value of the undelivered elements exist. If VSOE for the undelivered elements does not exist, we defer fees from such arrangements until the earlier of the date that VSOE does exist on the undelivered elements or all of the elements have been delivered.
We recognize revenue from fixed-price service contracts using the proportional performance method of accounting, which is similar to the percentage-of-completion method described above. We recognize revenue from professional services provided pursuant to time-and-materials based contracts and training services as the services are performed, as that is when our obligation to our customers under such arrangements is fulfilled.
We recognize revenue from our Mobile Data Enablement (“MDE”) contracts based on the number of transactions per month multiplied by a factor based on a unique table for transaction volumes relating to each account at a rate for the particular Tier level attained.
We recognize customer support, including maintenance revenue, ratably over the service contract period. When maintenance is bundled with the original license fee arrangement, its fair value, based upon VSOE, is deferred and recognized during the periods when services are provided.
Allowance for Doubtful Accounts
We make judgments related to our ability to collect outstanding accounts receivable and unbilled work-in-progress. We provide allowances for receivables when their collection becomes doubtful by recording an expense. We determine the allowance based on our assessment of the realization of receivables using historical information and current economic trends, including assessing the probability of collection from customers. If the financial condition of our customers were to deteriorate, resulting in an impairment of their ability to make payments owed to us, an increase in the allowance for doubtful accounts would be required. We evaluate the adequacy of the allowance regularly and make adjustments accordingly. Adjustments to the allowance for doubtful accounts could materially affect our results of operations.
Income Taxes
Significant judgment is required in determining our provision for income taxes. We assess the likelihood that our deferred tax asset will be recovered from future taxable income, and to the extent we believe that recovery is not likely, we establish a valuation allowance. We consider future taxable income projections, historical results and ongoing tax planning strategies in assessing the recoverability of deferred tax assets. However, adjustments could be required in the future if we determine that the amount to be realized is less or greater than the amount that we recorded. Such adjustments, if any, could have a material impact on our results of our operations.
We use a recognition threshold and a measurement attribute for the financial statement recognition and measurement of tax positions taken or expected to be taken in a tax return. For those benefits to be recognized, a tax position must be more-likely-than-not to be sustained upon examination by taxing authorities. The Company uses the incremental approach to recognizing excess tax benefits associated with equity compensation.
Goodwill
Goodwill is the excess of acquisition cost of an acquired entity over the fair value of the identifiable net assets acquired. Goodwill is not amortized, but tested for impairment annually or whenever indicators of impairment exist. These indicators may include a significant change in the business climate, legal factors, operating performance indicators, competition, sale or disposition of a significant portion of the business or other factors. Application of the goodwill impairment test requires judgment, including the identification of reporting units, assignment of assets and liabilities to reporting units, assignment of goodwill to reporting units, and determination of the fair value of each reporting unit.
We performed our annual goodwill impairment test as of July 31, 2014, at which time we had $18.4 million of goodwill included in the following reporting units, License and Services (“L&S”) — U.S. of $1.1 million, U.K. of $7.8 million and Customer Support (“CS”) — U.K. of $9.5 million. The fair value of each reporting unit was estimated using both market and income based approaches. Specifically, we incorporated observed market multiple data from selected guideline public companies and values arrived at through the application of discounted cash flow analyses which in turn were based upon our financial projections as of the valuation date. We believe that a market participant would weigh both possibilities without a bias to one or the other. Consequently, we gave equal consideration to both. This analysis requires significant judgments, including estimation of future cash flows, which is dependent on internal forecasts, estimation of the long-term rate of growth for our business, estimation of the useful life over which cash flows will occur, and determination of our weighted average cost of capital. Changes in these estimates and assumptions could materially affect the determination of fair value and goodwill impairment for each reporting unit. If the carrying value of a reporting unit were to exceed its fair value, we would then compare the fair value of the reporting unit’s goodwill to its carrying amount, and any excess of the carrying amount over the fair value would be charged to operations as an impairment loss. If the projected future performance of either of our segments as estimated in the income valuation approach is adjusted downward or is lower than expected in the future, we could be required to record a goodwill impairment charge. As a result of the first step of the 2014 goodwill impairment analysis, the fair value of each reporting unit exceeded its carrying value. Therefore the second step was not necessary.
Intangible Assets
Amortizable intangible assets consist primarily of purchased software and licenses, customer contracts and relationships, trademarks and tradenames, and business partnerships acquired in conjunction with our acquisition of Evolving Systems U.K. and Evolving Systems Labs, Inc. These definite life assets are amortized using the straight-line method over their estimated lives.
We assess the impairment of identifiable intangibles if events or changes in circumstances indicate that the carrying value of the asset may not be recoverable.
If we determine that the carrying value of intangibles and/or long-lived assets may not be recoverable, we compare the estimated undiscounted cash flows expected to result from the use of the asset and its eventual disposition to the asset’s carrying amount. If an amortizable intangible or long-lived asset is not deemed to be recoverable, we recognize an impairment loss representing the excess of the asset’s carrying value over its estimated fair value.
Capitalization of Internal Software Development Costs
We expend amounts on product development, particularly for new products and/or for enhancements of existing products. For internal development of software products that are to be licensed by us, we expense the cost of developing software prior to establishing technological feasibility and those costs are capitalized once technological feasibility has been established. Capitalization ceases upon general release of the software. The determination of whether internal software development costs are subject to capitalization is, by its nature, highly subjective and involves significant judgments. This decision could significantly affect earnings during the development period. Further, once capitalized, the software costs are generally amortized on a straight-line basis over the
estimated economic life of the product. The determination of the expected useful life of a product is highly judgmental. Finally, capitalized software costs must be assessed for impairment if facts and circumstances warrant such a review.
We did not capitalize any internal software development costs during the years ended December 31, 2014, 2013, or 2012. In addition, we did not have any capitalized internal software development costs included in our December 31, 2014 and 2013 Consolidated Balance Sheets. We believe that during these periods no material internal software development costs were required to be capitalized. Our conclusion is primarily based on the fact that the feature-rich, pre-integrated, and highly-scalable nature of our products requires that our development efforts include complex design, coding and testing methodologies, which include next generation software languages and development tools. Development projects of this nature carry a high degree of development risk.
Substantially all of our internal software development efforts are of this nature, and therefore, we believe the period between achieving technological feasibility and the general release of the software to operations is so short that any costs incurred during this period are not material.
Stock-based Compensation
We account for stock-based compensation by applying a fair-value-based measurement method to account for share-based payment transactions with employees and directors and record compensation cost for all stock awards granted after January 1, 2006 and awards modified, repurchased, or cancelled after that date. We record compensation costs associated with the vesting of unvested options on a straight-line basis over the vesting period. Stock-based compensation is a non-cash expense because we settle these obligations by issuing shares of our common stock instead of settling such obligations with cash payments. We use the Black-Scholes model to estimate the fair value of each option grant on the date of grant. This model requires the use of estimates for expected term of the options and expected volatility of the price of our common stock.
ITEM 7A. QUANTITATIVE AND QUALITATIVE DISCLOSURES ABOUT MARKET RISK
In the ordinary course of business, we are exposed to certain market risks, including changes in foreign currency exchange rates and interest rates. Uncertainties that are either non-financial or non-quantifiable such as political, economic, tax, other regulatory, or credit risks are not included in the following assessment of market risks.
Interest Rate Risks
Our cash balances are subject to interest rate fluctuations and as a result, interest income amounts may fluctuate from current levels. Although we currently have no borrowings outstanding under our revolving credit facility, any amounts borrowed under the facility would bear interest at variable rates.
Foreign Currency Risk
We are exposed to fluctuations of the U.S. dollar (our functional currency) against the currencies of our operating subsidiaries. Any increase (decrease) in the value of the U.S. dollar against any foreign currency that is the functional currency of one of our operating subsidiaries will cause the parent company to experience unrealized foreign currency translation losses (gains) with respect to amounts already invested in such foreign currencies. In addition, we and our operating subsidiaries are exposed to foreign currency risk to the extent that we enter into transactions denominated in currencies other than our respective functional currencies, such as revenue and related accounts receivable (including intercompany amounts) that are denominated in a currency other than their own functional currency. Changes in exchange rates with respect to these items will result in unrealized (based upon period-end exchange rates) or realized foreign currency transaction gains and losses upon settlement of the transactions. In addition, we are exposed to foreign exchange rate fluctuations related to our operating subsidiaries’ monetary assets and liabilities and the financial results of foreign subsidiaries and affiliates when their respective financial statements are translated into U.S. dollars for inclusion in our consolidated financial statements. We record cumulative translation adjustments in accumulated other comprehensive income (loss) as a separate component of equity. As a result of foreign currency risk, we may experience economic loss and a negative impact on earnings and equity with respect to our holdings solely as a result of foreign currency exchange rate fluctuations.
The relationship between the British Pound Sterling, Indian rupee and the U.S. dollar, which is our functional currency, is shown below, per one U.S. dollar:
|
|
|
December 31, |
|
December 31, |
|
|
Spot rates: |
|
2014 |
|
2013 |
|
|
British pound sterling |
|
0.64169 |
|
0.60638 |
|
|
Indian rupee |
|
63.13131 |
|
61.91951 |
|
|
|
|
For the Years Ended December 31, |
| ||||
|
Average rates: |
|
2014 |
|
2013 |
|
2012 |
|
|
British pound sterling |
|
0.60724 |
|
0.63921 |
|
0.63009 |
|
|
Indian rupee |
|
61.14301 |
|
58.62059 |
|
53.84249 |
|
At the present time, we do not hedge our foreign currency exposure or use derivative financial instruments that are designed to reduce our long-term exposure to foreign currency exchange risk. We continually monitor our foreign currency exchange risk and we may consider various options to reduce this risk in the future.
ITEM 8. FINANCIAL STATEMENTS AND SUPPLEMENTARY DATA
REPORT OF INDEPENDENT REGISTERED PUBLIC ACCOUNTING FIRM
Board of Directors and Stockholders
Evolving Systems, Inc.
We have audited the accompanying consolidated balance sheets of Evolving Systems, Inc. (a Delaware corporation, the “Company”) as of December 31, 2014 and 2013, and the related consolidated statements of income, comprehensive income, changes in stockholders’ equity, and cash flows for each of the three years in the period ended December 31, 2014. Evolving Systems, Inc.’s management is responsible for these financial statements. Our responsibility is to express an opinion on these financial statements based on our audits.
We conducted our audits in accordance with the standards of the Public Company Accounting Oversight Board (United States). Those standards require that we plan and perform the audit to obtain reasonable assurance about whether the financial statements are free of material misstatement. The company is not required to have, nor were we engaged to perform, an audit of its internal control over financial reporting. Our audits included consideration of internal control over financial reporting as a basis for designing audit procedures that are appropriate in the circumstances, but not for the purpose of expressing an opinion on the effectiveness of the company’s internal control over financial reporting. Accordingly, we express no such opinion. An audit also includes examining, on a test basis, evidence supporting the amounts and disclosures in the financial statements, assessing the accounting principles used and significant estimates made by management, as well as evaluating the overall financial statement presentation. We believe that our audits provide a reasonable basis for our opinion.
In our opinion, the financial statements referred to above present fairly, in all material respects, the financial position of Evolving Systems, Inc. as of December 31, 2014, and 2013, and the results of its operations and its cash flows for each of the three years in the period ended December 31, 2014 in conformity with accounting principles generally accepted in the United States of America.
/s/ FRIEDMAN LLP
East Hanover, New Jersey
March 17, 2015
EVOLVING SYSTEMS, INC.
(in thousands except share data)
|
|
|
December 31, |
|
December 31, |
| ||
|
|
|
2014 |
|
2013 |
| ||
|
ASSETS |
|
|
|
|
| ||
|
|
|
|
|
|
| ||
|
Current assets: |
|
|
|
|
| ||
|
Cash and cash equivalents |
|
$ |
9,781 |
|
$ |
13,785 |
|
|
Contract receivables, net of allowance for doubtful accounts of $43 and $73 at December 31, 2014 and December 31, 2013, respectively |
|
9,182 |
|
6,420 |
| ||
|
Unbilled work-in-progress, net of allowance of $306 and $317 at December 31, 2014 and December 31, 2013, respectively |
|
4,995 |
|
2,423 |
| ||
|
Prepaid and other current assets |
|
1,331 |
|
1,173 |
| ||
|
Deferred income taxes |
|
80 |
|
131 |
| ||
|
Total current assets |
|
25,369 |
|
23,932 |
| ||
|
Property and equipment, net |
|
659 |
|
342 |
| ||
|
Amortizable intangible assets, net |
|
608 |
|
702 |
| ||
|
Goodwill |
|
17,010 |
|
17,936 |
| ||
|
Long-term restricted cash |
|
— |
|
24 |
| ||
|
Long-term deferred income taxes |
|
586 |
|
248 |
| ||
|
Total assets |
|
$ |
44,232 |
|
$ |
43,184 |
|
|
|
|
|
|
|
| ||
|
LIABILITIES AND STOCKHOLDERS’ EQUITY |
|
|
|
|
| ||
|
Current liabilities: |
|
|
|
|
| ||
|
Current portion of capital lease obligations |
|
$ |
5 |
|
$ |
8 |
|
|
Accounts payable and accrued liabilities |
|
4,460 |
|
4,479 |
| ||
|
Income taxes payable |
|
1,227 |
|
459 |
| ||
|
Unearned revenue |
|
3,883 |
|
4,287 |
| ||
|
Total current liabilities |
|
9,575 |
|
9,233 |
| ||
|
Long-term liabilities: |
|
|
|
|
| ||
|
Capital lease obligations, net of current portion |
|
7 |
|
11 |
| ||
|
Contingent earn-out obligation |
|
178 |
|
178 |
| ||
|
Unearned revenue - Long term |
|
420 |
|
1,027 |
| ||
|
Total liabilities |
|
10,180 |
|
10,449 |
| ||
|
|
|
|
|
|
| ||
|
Commitments and contingencies |
|
|
|
|
| ||
|
Stockholders’ equity: |
|
|
|
|
| ||
|
Preferred stock, $0.001 par value; 2,000,000 shares authorized; no shares issued and outstanding as of December 31, 2014 and December 31, 2013 |
|
— |
|
— |
| ||
|
Common stock, $0.001 par value; 40,000,000 shares authorized; 11,843,564 shares issued and 11,664,675 outstanding as of December 31, 2014 and 11,779,507 shares issued and 11,600,618 outstanding as of December 31, 2013 |
|
12 |
|
12 |
| ||
|
Additional paid-in capital |
|
96,005 |
|
93,895 |
| ||
|
Treasury stock 178,889 shares, at December 31, 2014 and December 31, 2013, at cost |
|
(1,253 |
) |
(1,253 |
) | ||
|
Accumulated other comprehensive loss |
|
(4,534 |
) |
(3,016 |
) | ||
|
Accumulated deficit |
|
(56,178 |
) |
(56,903 |
) | ||
|
Total stockholders’ equity |
|
34,052 |
|
32,735 |
| ||
|
Total liabilities and stockholders’ equity |
|
$ |
44,232 |
|
$ |
43,184 |
|
The accompanying notes are an integral part of these consolidated financial statements.
EVOLVING SYSTEMS, INC.
CONSOLIDATED STATEMENTS OF INCOME
(in thousands except per share data)
|
|
|
For the Years Ended December 31, |
| |||||||
|
|
|
2014 |
|
2013 |
|
2012 |
| |||
|
REVENUE |
|
|
|
|
|
|
| |||
|
License fees and services |
|
$ |
19,738 |
|
$ |
15,998 |
|
$ |
17,622 |
|
|
Customer support |
|
9,942 |
|
9,095 |
|
8,625 |
| |||
|
Total revenue |
|
29,680 |
|
25,093 |
|
26,247 |
| |||
|
|
|
|
|
|
|
|
| |||
|
COSTS OF REVENUE AND OPERATING EXPENSES |
|
|
|
|
|
|
| |||
|
Costs of license fees and services, excluding depreciation and amortization |
|
5,782 |
|
5,565 |
|
6,734 |
| |||
|
Costs of customer support, excluding depreciation and amortization |
|
1,866 |
|
1,599 |
|
1,502 |
| |||
|
Sales and marketing |
|
5,734 |
|
5,364 |
|
5,070 |
| |||
|
General and administrative |
|
3,638 |
|
3,644 |
|
3,613 |
| |||
|
Product development |
|
3,643 |
|
2,956 |
|
3,069 |
| |||
|
Depreciation |
|
246 |
|
155 |
|
268 |
| |||
|
Amortization |
|
95 |
|
211 |
|
400 |
| |||
|
Restructuring and other recovery |
|
237 |
|
558 |
|
— |
| |||
|
Total costs of revenue and operating expenses |
|
21,241 |
|
20,052 |
|
20,656 |
| |||
|
|
|
|
|
|
|
|
| |||
|
Income from operations |
|
8,439 |
|
5,041 |
|
5,591 |
| |||
|
|
|
|
|
|
|
|
| |||
|
Other income (expense) |
|
|
|
|
|
|
| |||
|
Interest income |
|
19 |
|
11 |
|
60 |
| |||
|
Interest income, related party |
|
— |
|
— |
|
532 |
| |||
|
Interest expense |
|
(17 |
) |
(20 |
) |
(3 |
) | |||
|
Other income (expense) |
|
(27 |
) |
87 |
|
— |
| |||
|
Gain on sale of investments |
|
— |
|
— |
|
891 |
| |||
|
Foreign currency exchange loss |
|
(9 |
) |
(39 |
) |
(106 |
) | |||
|
Other income (expense), net |
|
(34 |
) |
39 |
|
1,374 |
| |||
|
|
|
|
|
|
|
|
| |||
|
Income before income taxes |
|
8,405 |
|
5,080 |
|
6,965 |
| |||
|
Income tax expense |
|
2,797 |
|
1,274 |
|
1,401 |
| |||
|
Net income |
|
$ |
5,608 |
|
$ |
3,806 |
|
$ |
5,564 |
|
|
|
|
|
|
|
|
|
| |||
|
Basic income per common share - net income |
|
$ |
0.48 |
|
$ |
0.33 |
|
$ |
0.49 |
|
|
|
|
|
|
|
|
|
| |||
|
Diluted income per common share - net income |
|
$ |
0.47 |
|
$ |
0.32 |
|
$ |
0.48 |
|
|
|
|
|
|
|
|
|
| |||
|
Cash dividends declared per common share |
|
$ |
0.42 |
|
$ |
0.36 |
|
$ |
2.00 |
|
|
|
|
|
|
|
|
|
| |||
|
Weighted average basic shares outstanding |
|
11,642 |
|
11,459 |
|
11,278 |
| |||
|
Weighted average diluted shares outstanding |
|
11,926 |
|
11,756 |
|
11,529 |
| |||
The accompanying notes are an integral part of these consolidated financial statements.
EVOLVING SYSTEMS, INC.
CONSOLIDATED STATEMENTS OF COMPREHENSIVE INCOME
(in thousands)
|
|
|
For the Years Ended December 31, |
| |||||||
|
|
|
2014 |
|
2013 |
|
2012 |
| |||
|
|
|
|
|
|
|
|
| |||
|
Net income |
|
$ |
5,608 |
|
$ |
3,806 |
|
$ |
5,564 |
|
|
|
|
|
|
|
|
|
| |||
|
Other comprehensive income: |
|
|
|
|
|
|
| |||
|
Foreign currency translation gain (loss) |
|
(1,518 |
) |
281 |
|
950 |
| |||
|
Unrealized gains on available-for-sale securities |
|
|
|
|
|
|
| |||
|
Unrealized holding gain arising during the year |
|
— |
|
— |
|
452 |
| |||
|
Other comprehensive income (loss), before tax |
|
(1,518 |
) |
281 |
|
1,402 |
| |||
|
Income tax expense related to components of other comprehensive income |
|
— |
|
— |
|
(168 |
) | |||
|
Other comprehensive income (loss), net of tax |
|
(1,518 |
) |
281 |
|
1,234 |
| |||
|
|
|
|
|
|
|
|
| |||
|
Comprehensive income |
|
$ |
4,090 |
|
$ |
4,087 |
|
$ |
6,798 |
|
The accompanying notes are an integral part of these consolidated financial statements.
EVOLVING SYSTEMS, INC.
CONSOLIDATED STATEMENTS OF CHANGES IN STOCKHOLDERS’ EQUITY
(in thousands, except share data)
|
|
|
|
|
|
|
|
|
|
|
Accumulated |
|
|
|
|
| ||||||
|
|
|
|
|
|
|
Additional |
|
|
|
Other |
|
|
|
Total |
| ||||||
|
|
|
Common Stock |
|
Paid-in |
|
Treasury |
|
Comprehensive |
|
Accumulated |
|
Stockholders’ |
| ||||||||
|
|
|
Shares |
|
Amount |
|
Capital |
|
Stock |
|
Income (Loss) |
|
(Deficit) |
|
Equity |
| ||||||
|
Balance at December 31, 2011 |
|
11,135,604 |
|
$ |
11 |
|
$ |
90,062 |
|
$ |
(1,253 |
) |
$ |
(4,531 |
) |
$ |
(39,577 |
) |
$ |
44,712 |
|
|
Stock option exercises |
|
238,077 |
|
— |
|
622 |
|
— |
|
— |
|
— |
|
622 |
| ||||||
|
Common Stock issued pursuant to the Employee Stock Purchase Plan |
|
1,413 |
|
— |
|
7 |
|
— |
|
— |
|
— |
|
7 |
| ||||||
|
Stock-based compensation expense |
|
— |
|
— |
|
264 |
|
— |
|
— |
|
— |
|
264 |
| ||||||
|
Excess tax benefits from stock-based compensation |
|
— |
|
— |
|
1,002 |
|
— |
|
— |
|
— |
|
1,002 |
| ||||||
|
Restricted stock issuance, net of cancellations |
|
12,126 |
|
— |
|
— |
|
— |
|
— |
|
— |
|
— |
| ||||||
|
Common stock cash dividends |
|
— |
|
— |
|
— |
|
— |
|
— |
|
(22,569 |
) |
(22,569 |
) | ||||||
|
Net income |
|
— |
|
— |
|
— |
|
— |
|
— |
|
5,564 |
|
5,564 |
| ||||||
|
Net unrealized losses on investments, related party, net of tax |
|
— |
|
— |
|
— |
|
— |
|
284 |
|
— |
|
284 |
| ||||||
|
Foreign currency translation adjustment |
|
— |
|
— |
|
— |
|
— |
|
950 |
|
— |
|
950 |
| ||||||
|
Balance at December 31, 2012 |
|
11,387,220 |
|
$ |
11 |
|
$ |
91,957 |
|
$ |
(1,253 |
) |
$ |
(3,297 |
) |
$ |
(56,582 |
) |
$ |
30,836 |
|
|
Stock option exercises |
|
123,179 |
|
1 |
|
487 |
|
— |
|
— |
|
— |
|
488 |
| ||||||
|
Common Stock issued pursuant to the Employee Stock Purchase Plan |
|
1,582 |
|
— |
|
6 |
|
— |
|
— |
|
— |
|
6 |
| ||||||
|
Stock-based compensation expense |
|
— |
|
— |
|
288 |
|
— |
|
— |
|
— |
|
288 |
| ||||||
|
Issuance of common stock related to acquisition |
|
71,387 |
|
— |
|
741 |
|
— |
|
— |
|
— |
|
741 |
| ||||||
|
Excess tax benefits from stock-based compensation |
|
— |
|
— |
|
416 |
|
— |
|
— |
|
— |
|
416 |
| ||||||
|
Restricted stock issuance, net of cancellations |
|
17,250 |
|
— |
|
— |
|
— |
|
— |
|
— |
|
— |
| ||||||
|
Common stock cash dividends |
|
— |
|
— |
|
— |
|
— |
|
— |
|
(4,127 |
) |
(4,127 |
) | ||||||
|
Net income |
|
— |
|
— |
|
— |
|
— |
|
— |
|
3,806 |
|
3,806 |
| ||||||
|
Foreign currency translation adjustment |
|
— |
|
— |
|
— |
|
— |
|
281 |
|
— |
|
281 |
| ||||||
|
Balance at December 31, 2013 |
|
11,600,618 |
|
$ |
12 |
|
$ |
93,895 |
|
$ |
(1,253 |
) |
$ |
(3,016 |
) |
$ |
(56,903 |
) |
$ |
32,735 |
|
|
Stock option exercises |
|
56,186 |
|
— |
|
245 |
|
— |
|
— |
|
— |
|
245 |
| ||||||
|
Common Stock issued pursuant to the Employee Stock Purchase Plan |
|
7,352 |
|
— |
|
55 |
|
— |
|
— |
|
— |
|
55 |
| ||||||
|
Stock-based compensation expense |
|
— |
|
— |
|
401 |
|
— |
|
— |
|
— |
|
401 |
| ||||||
|
Issuance of common stock related to acquisition |
|
1,832 |
|
— |
|
19 |
|
— |
|
— |
|
— |
|
19 |
| ||||||
|
Excess tax benefits from stock-based compensation |
|
— |
|
— |
|
1,390 |
|
— |
|
— |
|
— |
|
1,390 |
| ||||||
|
Restricted stock cancellations |
|
(1,313 |
) |
— |
|
— |
|
— |
|
— |
|
— |
|
— |
| ||||||
|
Treasury stock |
|
— |
|
— |
|
— |
|
— |
|
— |
|
— |
|
— |
| ||||||
|
Common stock cash dividends |
|
— |
|
— |
|
— |
|
— |
|
— |
|
(4,883 |
) |
(4,883 |
) | ||||||
|
Net income |
|
— |
|
— |
|
— |
|
— |
|
— |
|
5,608 |
|
5,608 |
| ||||||
|
Foreign currency translation adjustment |
|
— |
|
— |
|
— |
|
— |
|
(1,518 |
) |
— |
|
(1,518 |
) | ||||||
|
Balance at December 31, 2014 |
|
11,664,675 |
|
$ |
12 |
|
$ |
96,005 |
|
$ |
(1,253 |
) |
$ |
(4,534 |
) |
$ |
(56,178 |
) |
$ |
34,052 |
|
The accompanying notes are an integral part of these consolidated financial statements.
EVOLVING SYSTEMS, INC.
CONSOLIDATED STATEMENTS OF CASH FLOWS
(in thousands)
|
|
|
For the Years Ended December 31, |
| |||||||
|
|
|
2014 |
|
2013 |
|
2012 |
| |||
|
CASH FLOWS FROM OPERATING ACTIVITIES: |
|
|
|
|
|
|
| |||
|
Net income |
|
$ |
5,608 |
|
$ |
3,806 |
|
$ |
5,564 |
|
|
Adjustments to reconcile net income to net cash provided by (used in) operating activities: |
|
|
|
|
|
|
| |||
|
Depreciation |
|
246 |
|
155 |
|
268 |
| |||
|
Amortization of intangible assets |
|
95 |
|
211 |
|
400 |
| |||
|
Amortization of debt issuance costs |
|
15 |
|
18 |
|
1 |
| |||
|
Stock based compensation |
|
401 |
|
288 |
|
264 |
| |||
|
Accretion of discount on marketable securities |
|
— |
|
— |
|
(6 |
) | |||
|
Gain on sale of marketable securities |
|
— |
|
— |
|
(891 |
) | |||
|
Unrealized foreign currency transaction (gains) and losses, net |
|
9 |
|
39 |
|
106 |
| |||
|
Provision for doubtful accounts |
|
— |
|
— |
|
27 |
| |||
|
Provision for unbilled work-in-progress allowance |
|
— |
|
114 |
|
288 |
| |||
|
Expense from deferred income taxes |
|
(282 |
) |
(257 |
) |
(340 |
) | |||
|
Change in operating assets and liabilities: |
|
|
|
|
|
|
| |||
|
Contract receivables |
|
(3,398 |
) |
(1,514 |
) |
(310 |
) | |||
|
Unbilled work-in-progress |
|
(2,977 |
) |
2,444 |
|
(3,652 |
) | |||
|
Prepaid and other assets |
|
(214 |
) |
(28 |
) |
468 |
| |||
|
Accounts payable and accrued liabilities |
|
985 |
|
(204 |
) |
(461 |
) | |||
|
Unearned revenue |
|
(888 |
) |
3,543 |
|
(1,894 |
) | |||
|
Net cash provided by (used in) operating activities |
|
(400 |
) |
8,615 |
|
(168 |
) | |||
|
|
|
|
|
|
|
|
| |||
|
CASH FLOWS FROM INVESTING ACTIVITIES: |
|
|
|
|
|
|
| |||
|
Purchase of property and equipment |
|
(588 |
) |
(270 |
) |
(79 |
) | |||
|
Business combinations, net of cash |
|
— |
|
(412 |
) |
— |
| |||
|
Proceeds from sale of marketable securities, related party |
|
— |
|
— |
|
17,831 |
| |||
|
Restricted cash |
|
24 |
|
53 |
|
— |
| |||
|
Net cash provided by (used in) investing activities |
|
(564 |
) |
(629 |
) |
17,752 |
| |||
|
|
|
|
|
|
|
|
| |||
|
CASH FLOWS FROM FINANCING ACTIVITIES: |
|
|
|
|
|
|
| |||
|
Capital lease payments |
|
(8 |
) |
(5 |
) |
(12 |
) | |||
|
Common stock cash dividends |
|
(4,883 |
) |
(4,127 |
) |
(44,841 |
) | |||
|
Excess tax benefits from stock-based compensation |
|
1,390 |
|
416 |
|
1,000 |
| |||
|
Proceeds from the issuance of stock |
|
300 |
|
494 |
|
630 |
| |||
|
Net cash used in financing activities |
|
(3,201 |
) |
(3,222 |
) |
(43,223 |
) | |||
|
|
|
|
|
|
|
|
| |||
|
Effect of exchange rate changes on cash |
|
161 |
|
177 |
|
193 |
| |||
|
|
|
|
|
|
|
|
| |||
|
Net (decrease) increase in cash and cash equivalents |
|
(4,004 |
) |
4,941 |
|
(25,446 |
) | |||
|
Cash and cash equivalents at beginning of year |
|
13,785 |
|
8,844 |
|
34,290 |
| |||
|
Cash and cash equivalents at end of year |
|
$ |
9,781 |
|
$ |
13,785 |
|
$ |
8,844 |
|
|
|
|
|
|
|
|
|
| |||
|
Supplemental disclosure of cash and non-cash investing and financing transactions: |
|
|
|
|
|
|
| |||
|
Interest paid |
|
$ |
1 |
|
$ |
2 |
|
$ |
3 |
|
|
Income taxes paid |
|
182 |
|
69 |
|
712 |
| |||
|
Common stock dividends declared |
|
4,966 |
|
4,191 |
|
22,569 |
| |||
|
Property and equipment purchased and included in accounts payable |
|
191 |
|
— |
|
1 |
| |||
|
Final cash payment related to acquisition |
|
— |
|
494 |
|
— |
| |||
|
Issuance of common stock related to acquisition |
|
19 |
|
761 |
|
— |
| |||
|
Contingent consideration related to acquisition |
|
— |
|
178 |
|
— |
| |||
The accompanying notes are an integral part of these consolidated financial statements.
EVOLVING SYSTEMS, INC.
NOTES TO CONSOLIDATED FINANCIAL STATEMENTS
NOTE 1 — ORGANIZATION AND SUMMARY OF SIGNIFICANT ACCOUNTING POLICIES
Organization — We are a provider of software solutions and services to the wireless, wireline and cable markets. We maintain long-standing relationships with many of the largest wireless, wireline and cable companies worldwide. Our customers rely on us to develop, deploy, enhance, maintain and integrate complex, highly reliable software solutions for a range of Operations Support Systems (“OSS”). We offer software products and solutions focused on activation and provisioning: our service activation solution, TertioTM (“TSA”) used to activate complex bundles of voice, video and data services for traditional and next generation wireless and wireline networks; our SIM card activation solution, Dynamic SIM Allocation TM (“DSA”) used to dynamically allocate and assign resources to wireless devices that rely on SIM cards; our cloud-based (SaaS) service activation, self—service mobile applications and data enablement solutions to wireless carriers and Mobile Virtual Network Operators (MVNOs); our connected devices activation solution, Intelligent M2M Controller that supports the activation of M2M devices with intermittent or infrequent usage patterns; and our number inventory solution, Total Number Management™, (TNM) a scalable and fully automated solution that enables operators to reliably and efficiently manage their telephone numbers (i.e. SIMs, MSISDNs, IMSIs, ICCIDs, IPs) as well as other communication identifiers such as URLs and email addresses.
Reclassifications - Certain reclassifications have been made to the 2013 financial statements to conform to the consolidated 2014 financial statement presentation. These reclassifications had no effect on net earnings or cash flows as previously reported.
Business Combination — On October 24, 2013 we acquired privately held Telespree, now known as Evolving Systems Labs, for an initial payment of approximately $1.6 million comprised of approximately $0.8 million in cash and approximately $0.8 million in stock. We also agreed to make a subsequent payment of $0.5 million, subject to reduction for certain claims, which has not been paid to date. We will potentially make additional payments in cash on the achievement of certain financial targets for the period from October 25, 2013 through October 24, 2016. This business combination is reflected in these consolidated financial statements since the acquisition date. Refer to Note 3, Acquisition, for more information regarding the acquisition.
We account for business combinations in accordance with the acquisition method. The acquisition method of accounting requires that assets acquired and liabilities assumed be recorded at their fair values on the date of a business acquisition. The excess of the purchase price over the fair value of assets acquired is recognized as goodwill. Certain adjustments to the assessed fair values of the assets and liabilities made subsequent to the acquisition date, but within the measurement period, which is up to one year, are recorded as adjustments to goodwill. Any adjustments subsequent to the measurement period are recorded in income. Our consolidated financial statements and results of operations reflect an acquired business from the completion date of an acquisition.
The judgments that we make in determining the estimated fair value assigned to each class of assets acquired and liabilities assumed, as well as asset lives, can materially impact net income in periods following a business combination. We generally use either the income, cost or market approach to aid in our conclusions of such fair values and asset lives. The income approach presumes that the value of an asset can be estimated by the net economic benefit to be received over the life of the asset, discounted to present value. The cost approach presumes that an investor would pay no more for an asset than its replacement or reproduction cost. The market approach estimates value based on what other participants in the market have paid for reasonably similar assets. Although each valuation approach is considered in valuing the assets acquired, the approach ultimately selected is based on the characteristics of the asset and the availability of information.
We record contingent consideration resulting from a business combination at its fair value on the acquisition date. Each reporting period thereafter, we revalue these obligations and record increases or decreases in their fair value as an adjustment to net change in contingent consideration obligation within the consolidated statement of income. Changes in the fair value of the contingent consideration obligation can result from updates in the achievement of financial targets and changes to the weighted probability of achieving those future financial targets. Significant judgment is employed in determining the appropriateness of these assumptions as of the acquisition date and for each subsequent period. Accordingly, any change in the assumptions described above, could have a material impact on the amount of the net change in contingent consideration obligation that we record in any given period.
Principles of Consolidation — The consolidated financial statements include the accounts of Evolving Systems, Inc. and subsidiaries, all of which are wholly owned. All significant intercompany transactions and balances have been eliminated in consolidation.
Use of Estimates — The preparation of financial statements in conformity with accounting principles generally accepted in the U.S. requires us to make estimates and assumptions that affect the reported amounts of assets and liabilities and disclosure of contingent assets and liabilities, at the date of the financial statements, as well as the reported amounts of revenue and expenses during the reporting period. We made estimates with respect to revenue recognition for estimated hours to complete projects accounted for using the percentage-of-completion method, allowance for doubtful accounts, income tax valuation allowance, fair values of long-lived assets, valuation of intangible assets and goodwill, useful lives for property, equipment and intangible assets, business combinations, capitalization of internal software development costs and fair value of stock-based compensation amounts. Actual results could differ from these estimates.
Foreign Currency — Our functional currency is the U.S. dollar. The functional currency of our foreign operations, generally, is the respective local currency for each foreign subsidiary. Assets and liabilities of foreign operations denominated in local currencies are translated at the spot rate in effect at the applicable reporting date. Our consolidated balance sheets are translated at the spot rate of exchange during the applicable period. Our consolidated statements of operations are translated at the weighted average rate of exchange during the applicable period. The resulting unrealized cumulative translation adjustment is recorded as a component of accumulated other comprehensive income (loss) in stockholders’ equity. Realized and unrealized transaction gains and losses generated by transactions denominated in a currency different from the functional currency of the applicable entity are recorded in other income (loss) in the period in which they occur.
Goodwill - Goodwill is the excess of acquisition cost of an acquired entity over the fair value of the identifiable net assets acquired. Goodwill is not amortized, but tested for impairment annually or whenever indicators of impairment exist. These indicators may include a significant change in the business climate, legal factors, operating performance indicators, competition, sale or disposition of a significant portion of the business or other factors. For purposes of the goodwill evaluation, we compare the fair value of each of our reporting units to its respective carrying amount. If the carrying value of a reporting unit were to exceed its fair value, we would then compare the fair value of the reporting unit’s goodwill to its carrying amount, and any excess of the carrying amount over the fair value would be charged to operations as an impairment loss.
Intangible Assets - Amortizable intangible assets consist primarily of purchased software and licenses, customer contracts and relationships, trademarks and tradenames, and business partnerships acquired in conjunction with our purchase of Evolving Systems U.K. and Evolving Systems Labs. These assets are amortized using the straight-line method over their estimated lives.
We assess the impairment of identifiable intangibles if events or changes in circumstances indicate that the carrying value of the asset may not be recoverable.
If we determine that the carrying value of intangibles and/or long-lived assets may not be recoverable, we compare the estimated undiscounted cash flows expected to result from the use of the asset and its eventual disposition to the asset’s carrying amount. If an amortizable intangible or long-lived asset is not deemed to be recoverable, we recognize an impairment loss representing the excess of the asset’s carrying value over its estimated fair value.
Fair Value Measurements - Fair value is the price that would be received from selling an asset or paid to transfer a liability in an orderly transaction between market participants at the measurement date. Fair value is estimated by applying the following hierarchy, which prioritizes the inputs used to measure fair value into three levels and bases the categorization within the hierarchy upon the lowest level of input that is available and significant to the fair value measurement:
Level 1 — Quoted prices in active markets for identical assets or liabilities.
Level 2 — Observable inputs other than quoted prices in active markets for identical assets and liabilities, quoted prices for identical or similar assets or liabilities in inactive markets, or other inputs that are observable or can be corroborated by observable market data for substantially the full term of the assets or liabilities.
Level 3 — Inputs that are generally unobservable and typically reflect management’s estimate of assumptions that market participants would use in pricing the asset or liability.
The valuation techniques used to measure our marketable debt securities were derived from quoted prices in active markets for identical assets or liabilities. Refer to Note 2, Investments, for more information.
Cash and Cash Equivalents - All highly liquid investments with maturities of three months or less at the date of purchase are classified as cash equivalents.
Revenue Recognition - We recognize revenue when an agreement is signed, the fee is fixed or determinable and collectability is reasonably assured. We recognize revenue from two primary sources: license fees and services, and customer support. The majority of our license fees and services revenue is generated from fixed-price contracts, which provide for licenses to our software products and services to customize such software to meet our customers’ use. When the customization services are determined to be essential to the functionality of the delivered software, we recognize revenue using the percentage-of-completion method of accounting. In these types of arrangements, we do not typically have vendor specific objective evidence (“VSOE”) of fair value on the license fee/services portion (services are related to customizing the software) of the arrangement due to the large amount of customization required by our customers; however, we do have VSOE for the warranty/maintenance services based on the renewal rate of the first year of maintenance in the arrangement. The license/services portion is recognized using the percentage-of-completion method of accounting and the warranty/maintenance services are separated based on the renewal rate in the contract and recognized ratably over the warranty or maintenance period. We estimate the percentage-of-completion for each contract based on the ratio of direct labor hours incurred to total estimated direct labor hours and recognize revenue based on the percent complete multiplied by the contract amount allocated to the license fee/services. Since estimated direct labor hours, and changes thereto, can have a significant impact on revenue recognition, these estimates are critical and we review them regularly. If the arrangement includes a customer acceptance provision, the hours to complete the acceptance testing are included in the total estimated direct labor hours; therefore, the related revenue is recognized as the acceptance testing is performed. Revenue is not recognized in full until the customer has provided proof of acceptance on the arrangement. Generally, our contracts are accounted for individually. However, when certain criteria are met, it may be necessary to account for two or more contracts as one to reflect the substance of the group of contracts. We record amounts billed in advance of services being performed as unearned revenue. Unbilled work-in-progress represents revenue earned but not yet billable under the terms of the fixed-price contracts. All such amounts are expected to be billed and collected within 12 months.
We may encounter budget and schedule overruns on fixed-price contracts caused by increased labor or overhead costs. We make adjustments to cost estimates in the period in which the facts requiring such revisions become known. We record estimated losses, if any, in the period in which current estimates of total contract revenue and contract costs indicate a loss. If revisions to cost estimates are obtained after the balance sheet date but before the issuance of the interim or annual financial statements, we make adjustments to the interim or annual financial statements accordingly.
In arrangements where the services are not essential to the functionality of the delivered software, we recognize license revenue when a license agreement has been signed, delivery and acceptance have occurred, the fee is fixed or determinable and collectability is reasonably assured. Where applicable, we unbundle and record as revenue fees from multiple element arrangements as the elements are delivered to the extent that VSOE of fair value of the undelivered elements exist. If VSOE for the undelivered elements does not exist, we defer fees from such arrangements until the earlier of the date that VSOE does exist on the undelivered elements or all of the elements have been delivered.
We recognize revenue from fixed-price service contracts using the proportional performance method of accounting, which is similar to the percentage-of-completion method described above. We recognize revenue from professional services provided pursuant to time-and-materials based contracts and training services as the services are performed, as that is when our obligation to our customers under such arrangements is fulfilled.
We recognize revenue from our MDE contracts based on the number of transactions per month multiplied by a factor based on a unique table for transaction volumes relating to each account.
We recognize customer support, including maintenance revenue, ratably over the service contract period. When maintenance is bundled with the original license fee arrangement, its fair value, based upon VSOE, is deferred and recognized during the periods when services are provided.
Stock-based Compensation - We account for stock-based compensation by applying a fair-value-based measurement method to account for share-based payment transactions with employees and directors. We record compensation costs associated with the vesting of unvested options on a straight-line basis over the vesting period. Stock-based compensation is a non-cash expense because we settle these obligations by issuing shares of our common stock instead of settling such obligations with cash payments. We use the Black-Scholes model to estimate the fair value of each option grant on the date of grant. This model requires the use of estimates for expected term of the options and expected volatility of the price of our common stock.
Comprehensive Income - Comprehensive income consists of two components, net income and other comprehensive income. Other comprehensive income refers to revenue, expenses, gains, and losses that under GAAP are recorded as an element of shareholders’ equity but are excluded from net income. Other comprehensive income consists of foreign currency translation
adjustments from those subsidiaries not using the U.S. dollar as their functional currency and unrealized gains and losses on marketable securities categorized as available-for-sale.
Restricted Cash — As of December 31, 2014 we no longer had restricted cash. As of December 31, 2013, we had $24,000 of restricted cash related to securing a letter of credit for our San Francisco, California lease that has since expired.
Contract Receivables, Unbilled Work-in-Progress and Allowance for Doubtful Accounts — Contract receivables are recorded at the invoiced amount and do not bear interest. Credit is extended based on the evaluation of a customer’s financial condition and collateral is not required. Unbilled work in progress is revenue which has been earned but not invoiced. An allowance is placed against accounts receivable or unbilled work in progress for our best estimate of the amount of probable credit losses. We determine the allowance based on historical write-off experience and information received during collection efforts. We review our allowances monthly and past due balances over 90 days are reviewed individually for collectability. Account balances are charged against the allowance after all means of collection have been exhausted and the potential for recovery is considered remote. We do not have any off-balance-sheet credit exposure related to our customers.
The following table reflects the activity in the allowance for doubtful accounts:
|
|
|
|
|
Balance at |
|
Bad Debt |
|
Write-Offs |
|
Effects of |
|
Balance at |
| |||||
|
Fiscal |
|
|
|
Beginning |
|
Expense/ |
|
to |
|
Exchange |
|
End of |
| |||||
|
Year |
|
Description |
|
of Period |
|
(Recovery) |
|
Allowance |
|
Rates |
|
Period |
| |||||
|
2014 |
|
Allowance for doubtful accounts |
|
$ |
73 |
|
$ |
— |
|
$ |
(25 |
) |
$ |
(5 |
) |
$ |
43 |
|
|
2013 |
|
Allowance for doubtful accounts |
|
$ |
70 |
|
$ |
— |
|
$ |
— |
|
$ |
3 |
|
$ |
73 |
|
|
2012 |
|
Allowance for doubtful accounts |
|
$ |
52 |
|
$ |
27 |
|
$ |
— |
|
$ |
(9 |
) |
$ |
70 |
|
The following table reflects the activity in the allowance for unbilled work-in-progress:
|
|
|
|
|
Balance at |
|
Unbilled |
|
Write-Offs |
|
Effects of |
|
Balance at |
| |||||
|
Fiscal |
|
|
|
Beginning |
|
Allowance/ |
|
to |
|
Exchange |
|
End of |
| |||||
|
Year |
|
Description |
|
of Period |
|
(Recovery) |
|
Allowance |
|
Rates |
|
Period |
| |||||
|
2014 |
|
Allowance for unbilled work-in-progress |
|
$ |
317 |
|
$ |
— |
|
$ |
— |
|
$ |
(11 |
) |
$ |
306 |
|
|
2013 |
|
Allowance for unbilled work-in-progress |
|
$ |
295 |
|
$ |
114 |
|
$ |
(114 |
) |
$ |
22 |
|
$ |
317 |
|
|
2012 |
|
Allowance for unbilled work-in-progress |
|
$ |
— |
|
$ |
288 |
|
$ |
— |
|
$ |
7 |
|
$ |
295 |
|
Long Term Deferred Revenue — Long term deferred revenue are amounts which revenue will not be recognized within twelve months of the balance sheet date. As of December 31, 2014 and 2013, we had $0.4 million and $1.0 million, respectively, reported in the accompanying consolidated balance sheets.
Concentration of Credit Risk — Financial instruments that potentially subject us to concentrations of credit risk consist primarily of contract receivables and unbilled work-in-progress. We perform on-going evaluations of customers’ financial condition and, generally, require no collateral from customers.
A substantial portion of our revenue is from a limited number of customers, all in the telecommunications industry.
For the year ended December 31, 2014, two significant customers (defined as contributing at least 10%) accounted for 24% (13% and 11%) of revenue from continuing operations. These customers are large telecommunications operators in Europe and Mexico. For the year ended December 31, 2013 one significant customer accounted for 12% of revenue from continuing operations.
This customer is a large telecommunications operator in Europe. For the year ended December 31, 2012 three significant customers accounted for 39% (15%, 14% and 10%) of revenue from continuing operations. These customers are large telecommunications operators in Europe, the Commonwealth of Independent States and Mexico.
As of December 31, 2014, three significant customers accounted for approximately 55% (26%, 16% and 13%) of contract receivables and unbilled work-in-progress. These customers are large telecommunications operators in Africa, Mexico and Europe. At December 31, 2013, four significant customers accounted for approximately 56% (18%, 15%, 12% and 11%) of contract receivables and unbilled work-in-progress. These customers are large telecommunications operators in Africa, Europe, Brazil and Europe.
We are subject to concentration of credit risk with respect to our cash and cash equivalents, which we attempt to minimize by maintaining our cash and cash equivalents with institutions of sound financial quality. At times, cash balances may exceed limits federally insured by the Federal Deposit Insurance Corporation (“FDIC”).
Our funds not under any FDIC program were $9.3 million and $13.5 million as of December 31, 2014 and December 31, 2013, respectively.
Sales, Use and Other Value Added Tax — Revenue is recorded net of applicable state, use and other value added taxes.
Advertising and Promotion Costs — Advertising and promotion costs are expensed as incurred. Advertising costs totaled approximately $0.2 million for the years ended December 31, 2014, 2013 and 2012.
Capitalization of Internal Software Development Costs — We expend amounts on product development, particularly for new products and/or for enhancements of existing products. For internal development of software products that are to be licensed by us, we expense the cost of developing software prior to establishing technological feasibility and those costs are capitalized once technological feasibility has been established. Capitalization ceases upon general release of the software. The determination of whether internal software development costs are subject to capitalization is, by its nature, highly subjective and involves significant judgments. This decision could significantly affect earnings during the development period. Further, once capitalized, the software costs are generally amortized on a straight-line basis over the estimated economic life of the product. The determination of the expected useful life of a product is highly judgmental. Finally, capitalized software costs must be assessed for impairment if facts and circumstances warrant such a review. We did not capitalize any internal software development costs during the years ended December 31, 2014, 2013, or 2012. In addition, we did not have any capitalized internal software development costs included in our December 31, 2014 and 2013 Consolidated Balance Sheets. We believe that during these periods no material internal software development costs were required to be capitalized. Our conclusion is primarily based on the fact that the feature-rich, pre-integrated, and highly-scalable nature of our products requires that our development efforts include complex design, coding and testing methodologies, which include next generation software languages and development tools. Development projects of this nature carry a high degree of development risk. Substantially all of our internal software development efforts are of this nature, and therefore, we believe the period between achieving technological feasibility and the general release of the software to operations is so short that any costs incurred during this period are not material.
Property and Equipment and Long-Lived Assets — Property and equipment are stated at cost or estimated fair value if acquired in an acquisition, less accumulated depreciation, and are depreciated over their estimated useful lives, or the lease term, if shorter, using the straight-line method. Leasehold improvements are stated at cost, less accumulated amortization, and are amortized over the shorter of the lease term or estimated useful life of the asset. Maintenance and repair costs are expensed as incurred.
We review our long-lived assets, such as property and equipment and purchased intangible assets subject to amortization, for impairment whenever events or changes in circumstances indicate that the carrying amount of an asset or asset group may not be recoverable. We evaluate the recoverability of an asset or asset group by comparing its carrying amount to the estimated undiscounted future cash flows expected to be generated by the asset or asset group. If the carrying amount of an asset or asset group exceeds its estimated future cash flows, we recognize an impairment charge as the amount by which the carrying amount of the asset exceeds the estimated fair value of the asset.
Income Taxes — We record deferred tax assets and liabilities for the estimated future tax effects of temporary differences between the tax bases of assets and liabilities and amounts reported in the accompanying consolidated balance sheets, as well as operating loss and tax credit carry-forwards. We measure deferred tax assets and liabilities using enacted tax rates expected to be applied to taxable income in the years in which those temporary differences are expected to be recovered or settled. We reduce deferred tax assets by a valuation allowance if, based on available evidence, it is more likely than not that these benefits will not be realized.
We use a recognition threshold and a measurement attribute for the financial statement recognition and measurement of tax positions taken or expected to be taken in a tax return. For those benefits to be recognized, a tax position must be more likely than not to be sustained upon examination by taxing authorities.
Recent Accounting Pronouncements — In July 2013, the FASB issued ASU 2013-11 regarding ASC Topic 740 “Income Tax.” This ASU clarifies the guidance on the presentation of an unrecognized tax benefit, or a portion of an unrecognized tax benefit, in the financial statements as a reduction to a deferred tax asset for a net operating loss carryforward, a similar tax loss, or a tax credit carryforward. This ASU became effective for our fiscal year beginning January 1, 2014. We adopted this pronouncement as of January 1, 2014. The adoption of this standard had no material effect on our financial position or results of operations.
In May 2014, the Financial Accounting Standards Board (“FASB”) issued Accounting Standards Update (“ASU”) No. 2014-09, “Revenue from Contracts with Customers,” Topic 606. This Update affects any entity that either enters into contracts with customers to transfer goods or services or enters into contracts for the transfer of nonfinancial assets, unless those contracts are within the scope of other standards. The guidance in this Update supersedes the revenue recognition requirements in Topic 605, Revenue Recognition and most industry-specific guidance. The core principle of the guidance is that an entity should recognize revenue to illustrate the transfer of promised goods or services to customers in an amount that reflects the consideration to which the entity expects to be entitled in exchange for those goods or services. The new guidance also includes a cohesive set of disclosure requirements that will provide users of financial statements with comprehensive information about the nature, amount, timing, and uncertainty of revenue and cash flows arising from a reporting organization’s contracts with customers. This ASU is effective retrospectively for fiscal years, and interim periods within those years beginning after December 15, 2016 for public companies and 2017 for non-public entities. We do not expect the adoption of this standard to have a significant impact on the Company’s financial position and results of operations.
NOTE 2 — INVESTMENTS
As of April 23, 2012 all investments in marketable securities were sold for approximately $17.8 million and we realized a gain on sale of approximately $0.9 million. We had no interest receivable as of December 31, 2014 and 2013.
NOTE 3 — ACQUISITION
On October 24, 2013 we acquired privately held Telespree, now known as Evolving Systems Labs, Inc., for an initial payment of approximately $1.6 million, comprised of approximately $0.8 million in cash and approximately $0.8 million in stock. We also agreed to make a subsequent payment of $0.5 million, subject to reduction for certain claims which has not been made to date. We will potentially make additional payments in cash on the achievement of certain financial targets for the period from October 25, 2013 through October 24, 2016.
We accounted for this business combination by applying the acquisition method, and accordingly, the purchase price was allocated to the assets and liabilities assumed based upon their fair values at the acquisition date. The excess of the purchase price over the net assets and liabilities, approximately $1.1 million, was recorded as goodwill. The results of Telespree’s operations have been included in the consolidated financial statements since the acquisition date.
We believe this acquisition complements our activation and SIM management products, adding technology used in the delivery and management of mobile data services to end-users.
Total purchase price is summarized as follows:
|
|
|
October 24, 2013 |
| |
|
Cash Consideration |
|
$ |
794 |
|
|
Final Cash Payment |
|
494 |
| |
|
Stock Consideration (73,281 shares) |
|
761 |
| |
|
Estimated Contingent Consideration |
|
178 |
| |
|
Total purchase price |
|
$ |
2,227 |
|
The fair value of the 73,281 common shares issued was determined based on the closing market price of our common shares on the acquisition date.
The estimated contingent consideration arrangement requires us to pay $0.2 million of additional consideration to Evolving Systems Labs, Inc.’s former shareholders if we meet certain performance metrics over the three years following the acquisition date. In each of the years, the former shareholders are entitled to a deferred payment equal to 34 percent of all qualifying revenue in excess of the qualifying revenue threshold for such deferred payment period. The initial qualifying revenue threshold is $2.3 million, but shall be increased in subsequent years if the qualified revenue falls under the qualifying revenue threshold in the previous period.
The contingent consideration was valued using the Income Approach-Probability Weighted Expected Payment. Multiple forecasted scenarios were evaluated which include (i) an upside case, (ii) a base case and (iii) a downside case. We determined the potential Deferred Payment cash flows of Evolving Systems Labs, Inc. based on each scenario. The cash flow payments were converted to a present value using a discount rate of 5 percent based on the cost of debt. Finally, we probability weighted each scenario.
The following table summarizes the estimated fair values of the assets and liabilities assumed at the acquisition date:
|
|
|
October 24, 2013 |
| |
|
Cash and cash equivalents |
|
$ |
382 |
|
|
Contract receivables |
|
210 |
| |
|
Unbilled work-in-progress |
|
150 |
| |
|
Intangible assets |
|
718 |
| |
|
Prepaid and other current assets |
|
37 |
| |
|
Deferred tax asset |
|
98 |
| |
|
Other assets, non-current |
|
43 |
| |
|
Total identifiable assets acquired |
|
$ |
1,638 |
|
|
|
|
|
| |
|
Accounts payable and accrued liabilities |
|
$ |
504 |
|
|
Assumed liabilities |
|
4 |
| |
|
Total identifiable assets acquired |
|
$ |
508 |
|
|
|
|
|
| |
|
Net identifiable assets acquired |
|
1,130 |
| |
|
|
|
|
| |
|
Goodwill |
|
1,097 |
| |
|
Net assets acquired |
|
$ |
2,227 |
|
The $1.1 million of goodwill was assigned to the license and service segment. The goodwill recognized is attributed primarily to expected synergies and the assembled workforce of Evolving Systems Labs, Inc. As of December 31, 2014 there were no changes in the recognized amounts of goodwill resulting from the acquisition of Evolving Systems Labs, Inc.
We recorded $0.7 million in intangible assets as of the acquisition date with a weighted-average amortization period of five to eight years and are amortizing the value of the trade name, technology, and customer relationships over an estimated useful life of 3.8, 4.6 and 4.6 years, respectively. Amortization expense related to the acquired intangible assets resulting from the acquisition, which is included in amortization expense, was approximately $0.1 million and $16,000 for the year ended December 31, 2014 and 2013, respectively.
Intangible assets related to the Evolving Systems Labs, Inc. acquisition as of December 31, 2014 were as follows (in thousands):
|
|
|
December 31, 2014 |
| |||||||||
|
|
|
Gross Amount |
|
Accumulated |
|
Net Carrying |
|
Weighted-Average |
| |||
|
Purchased software |
|
$ |
439 |
|
$ |
64 |
|
$ |
375 |
|
4.6 yrs |
|
|
Trademarks and tradenames |
|
63 |
|
15 |
|
48 |
|
3.8 yrs |
| |||
|
Customer relationships |
|
216 |
|
31 |
|
185 |
|
4.6 yrs |
| |||
|
|
|
$ |
718 |
|
$ |
110 |
|
$ |
608 |
|
4.54 yrs |
|
NOTE 4 — GOODWILL AND INTANGIBLE ASSETS
Changes in the carrying amount of goodwill by reporting unit were as follows (in thousands):
|
|
|
License and Services |
|
Customer Support |
|
Total |
| ||||||
|
|
|
U.S. |
|
UK |
|
UK |
|
Goodwill |
| ||||
|
Balance as of December 31, 2012 |
|
$ |
— |
|
$ |
7,385 |
|
$ |
9,125 |
|
$ |
16,510 |
|
|
Goodwill acquired during the year |
|
1,097 |
|
— |
|
— |
|
1,097 |
| ||||
|
Effects of changes in foreign currency exchange rates |
|
— |
|
147 |
|
182 |
|
329 |
| ||||
|
Balance as of December 31, 2013 |
|
$ |
1,097 |
|
$ |
7,532 |
|
$ |
9,307 |
|
$ |
17,936 |
|
|
Effects of changes in foreign currency exchange rates |
|
— |
|
(414 |
) |
(512 |
) |
(926 |
) | ||||
|
Balance as of December 31, 2014 |
|
$ |
1,097 |
|
$ |
7,118 |
|
$ |
8,795 |
|
$ |
17,010 |
|
We conducted our annual goodwill impairment test as of July 31, 2014, and we determined that goodwill was not impaired as of the test date. From July 31, 2014 through December 31, 2014, we believe no events have occurred that may have impaired goodwill.
Evolving Systems Labs identifiable intangible assets are amortized on a straight-line basis over estimated lives ranging from five to eight years. As of December 31, 2014 Evolving Systems Labs’ identifiable intangibles were as follows (in thousands):
Evolving Systems Labs
|
|
|
December 31, 2014 |
|
December 31, 2013 |
|
Weighted- |
| ||||||||||||||
|
|
|
Gross |
|
Accumulated |
|
Net |
|
Gross |
|
Accumulated |
|
Net |
|
Average |
| ||||||
|
Purchased software |
|
$ |
439 |
|
$ |
64 |
|
$ |
375 |
|
$ |
439 |
|
$ |
9 |
|
$ |
430 |
|
4.6 yrs |
|
|
Trademarks and tradenames |
|
63 |
|
15 |
|
48 |
|
63 |
|
2 |
|
61 |
|
3.8 yrs |
| ||||||
|
Customer relationships |
|
216 |
|
31 |
|
185 |
|
216 |
|
5 |
|
211 |
|
4.6 yrs |
| ||||||
|
|
|
$ |
718 |
|
$ |
110 |
|
$ |
608 |
|
$ |
718 |
|
$ |
16 |
|
$ |
702 |
|
4.54 yrs |
|
Amortization expense of identifiable intangible assets was $0.1 million, $0.2 million and $0.4 million for the years ended December 31, 2014, 2013 and 2012, respectively. Expected future amortization expense related to identifiable intangibles based on our carrying amount as of December 31, 2014 was as follows (in thousands):
|
Year ending December 31, |
|
|
| |
|
2015 |
|
$ |
94 |
|
|
2016 |
|
94 |
| |
|
2017 |
|
94 |
| |
|
2018 |
|
94 |
| |
|
2019 |
|
82 |
| |
|
Thereafter |
|
150 |
| |
|
|
|
$ |
608 |
|
NOTE 5 — BALANCE SHEET COMPONENTS
The components of certain balance sheet line items are as follows (in thousands):
|
|
|
December 31, |
| ||||
|
|
|
2014 |
|
2013 |
| ||
|
Property and equipment: |
|
|
|
|
| ||
|
Computer equipment and purchased software |
|
$ |
4,796 |
|
$ |
4,361 |
|
|
Furniture, fixtures and leasehold improvements |
|
1,078 |
|
1,094 |
| ||
|
|
|
5,874 |
|
5,455 |
| ||
|
Less accumulated depreciation |
|
(5,215 |
) |
(5,113 |
) | ||
|
|
|
$ |
659 |
|
$ |
342 |
|
|
|
|
December 31, |
| ||||
|
|
|
2014 |
|
2013 |
| ||
|
Assets acquired under capital lease: |
|
|
|
|
| ||
|
Original book value |
|
$ |
24 |
|
$ |
24 |
|
|
Accumulated amortization |
|
(13 |
) |
(8 |
) | ||
|
Net book value |
|
$ |
11 |
|
$ |
16 |
|
Depreciation expense was $0.2 million, $0.2 million and $0.3 million for each of the years ended December 31, 2014, 2013 and 2012, respectively.
Included in computer equipment and purchased software at December 31, 2014 and 2013 are assets under capital lease. Depreciation expense related to assets under capital leases was $5,000, $4,000 and $4,000 for the years ended December 31, 2014, 2013 and 2012, respectively.
|
|
|
December 31, |
| ||||
|
|
|
2014 |
|
2013 |
| ||
|
Accounts payable and accrued liabilities: |
|
|
|
|
| ||
|
Accounts payable |
|
$ |
729 |
|
$ |
729 |
|
|
Accrued liabilities |
|
2,366 |
|
2,129 |
| ||
|
Accrued compensation and related expenses |
|
1,365 |
|
1,621 |
| ||
|
|
|
$ |
4,460 |
|
$ |
4,479 |
|
NOTE 6 — LONG-TERM DEBT
On October 31, 2014, we entered into an amendment to the $5.0 million Loan and Security Agreement (the “Revolving Facility”). The $5.0 million Revolving Facility bears interest at the greater of 2.75% or the U.S.A. Prime Rate minus one half of one percent (0.5%). Prime Rate was 3.25% as of December 31, 2014. The Revolving Facility is secured by all assets of Evolving Systems, including a pledge, subject to certain limitations with respect to stock of foreign subsidiaries, of the stock of the existing and future direct subsidiaries of Evolving Systems. There is no mandated borrowing required against the Revolving Facility. To take an advance under the Revolving Facility, we must have a balance of $3.0 million in cash on deposit and have quarterly net income and a specified ratio of current assets to current liabilities, as defined in the Revolving Facility. The Revolving Facility requires us to pay an annual credit facility fee of $10,000. All accrued interest on outstanding borrowings under the Revolving Facility is paid monthly, with any outstanding balance due with a final maturity of October 22, 2016. As of the date of this report, there was no borrowing outstanding under this Revolving Facility.
NOTE 7 - INCOME TAXES
The pre-tax income (loss) from continuing operations on which the provision for income taxes was computed is as follows (in thousands):
|
|
|
For the Years Ended December 31, |
| |||||||
|
|
|
2014 |
|
2013 |
|
2012 |
| |||
|
|
|
|
|
|
|
|
| |||
|
Domestic |
|
$ |
(1,274 |
) |
$ |
(1,347 |
) |
$ |
2,568 |
|
|
Foreign |
|
9,679 |
|
6,427 |
|
4,397 |
| |||
|
Total |
|
$ |
8,405 |
|
$ |
5,080 |
|
$ |
6,965 |
|
The expense (benefit) from continuing operations for income taxes consists of the following (in thousands):
|
|
|
For the Years Ended December 31, |
| |||||||
|
|
|
2014 |
|
2013 |
|
2012 |
| |||
|
Current: |
|
|
|
|
|
|
| |||
|
Federal |
|
$ |
1,468 |
|
$ |
441 |
|
$ |
1,061 |
|
|
Foreign |
|
1,637 |
|
1,015 |
|
541 |
| |||
|
State |
|
(26 |
) |
70 |
|
139 |
| |||
|
Total current |
|
3,079 |
|
1,526 |
|
1,741 |
| |||
|
Deferred: |
|
|
|
|
|
|
| |||
|
Federal |
|
(301 |
) |
(66 |
) |
(732 |
) | |||
|
Foreign |
|
19 |
|
(178 |
) |
459 |
| |||
|
State |
|
0 |
|
(8 |
) |
(67 |
) | |||
|
Total deferred |
|
(282 |
) |
(252 |
) |
(340 |
) | |||
|
Total |
|
$ |
2,797 |
|
$ |
1,274 |
|
$ |
1,401 |
|
As of December 31, 2014, we had federal Net Operating Loss (“NOL”) carryforwards of approximately $2.3 million related to U.S. federal and state jurisdictions. The federal net operating loss carryforwards expire at various times beginning in 2022 and ending in 2033. As of December 31, 2014 and 2013, we had state NOL’s of approximately $27.9 million and $31.3 million, respectively. The state NOL carryforwards expire at various times beginning in 2018 and ending in 2033. In addition, we have research and experimentation credit carryforwards of approximately $0.3 million which may expire in 2018. The Company uses the incremental approach to recognizing excess tax benefits associated with equity compensation. Our $2.3 million of federal NOL’s are primarily windfall excess tax benefit related to stock compensation expense, the benefit of which, if realized, will be an increase to Additional Paid-in Capital (“APIC”) as opposed to a reduction in tax expense. During the year 2014, $1.4 million of the federal NOL was realized and increased additional paid-in capital. Also in 2014, Evolving Systems was subject to alternative minimum tax in the amount of $0.1 million. A deferred tax asset in this amount has been established but has a full valuation allowance as of December 31, 2014. The Internal Revenue Code places certain limitations on the annual amount of NOL’s which can be utilized if certain changes in ownership occur. Changes in our ownership have not occurred, and our NOL’s are not limited as of December 31, 2014.
|
|
|
Excess Tax Benefits |
|
Tax |
| ||
|
|
|
if realized will be |
|
Net Operating |
| ||
|
Year |
|
credited to APIC |
|
Losses |
| ||
|
2006 |
|
$ |
1,089 |
|
$ |
1,089 |
|
|
2007 |
|
1,199 |
|
1,199 |
| ||
|
|
|
$ |
2,288 |
|
$ |
2,288 |
|
|
|
|
|
|
|
| ||
|
Unrecognized Tax Benefit on Equity Compensation |
|
|
|
$ |
(2,288 |
) | |
|
Reduced NOL for Financial Statement Presentation |
|
|
|
$ |
0 |
| |
Deferred tax assets and liabilities reflect the net tax effects of temporary differences between the carrying amount of assets and liabilities for financial reporting purposes and the amounts used for income tax purposes. Significant components of our deferred tax assets and liabilities are as follows (in thousands):
|
|
|
As of December 31, |
| ||||
|
|
|
2014 |
|
2013 |
| ||
|
Deferred tax assets: |
|
|
|
|
| ||
|
Net operating loss carryforwards |
|
$ |
555 |
|
$ |
2,565 |
|
|
Research and development credits |
|
303 |
|
303 |
| ||
|
Equity compensation |
|
661 |
|
616 |
| ||
|
AMT/MAT credit |
|
942 |
|
996 |
| ||
|
Depreciable assets |
|
107 |
|
178 |
| ||
|
Intangibles |
|
203 |
|
91 |
| ||
|
Accrued liabilities and reserves |
|
607 |
|
180 |
| ||
|
Total deferred tax assets |
|
3,378 |
|
4,929 |
| ||
|
|
|
|
|
|
| ||
|
Deferred tax liabilities: |
|
|
|
|
| ||
|
Undistributed foreign earnings |
|
(897 |
) |
(777 |
) | ||
|
Accrued liabilities and reserves |
|
(16 |
) |
(42 |
) | ||
|
Total deferred tax liability |
|
(913 |
) |
(819 |
) | ||
|
|
|
|
|
|
| ||
|
Net deferred tax assets, before valuation allowance |
|
2,465 |
|
4,110 |
| ||
|
Valuation allowance |
|
(1,799 |
) |
(3,731 |
) | ||
|
Net deferred tax asset |
|
$ |
666 |
|
$ |
379 |
|
|
|
|
|
|
|
| ||
|
Financial statement classification: |
|
|
|
|
| ||
|
Current deferred tax asset |
|
$ |
80 |
|
$ |
131 |
|
|
Long-term tax asset |
|
586 |
|
248 |
| ||
|
|
|
$ |
666 |
|
$ |
379 |
|
In conjunction with the acquisition of Evolving Systems Labs in October 2013, we recorded certain identifiable intangible assets. We established a deferred tax asset of $0.1 million at the acquisition date for the expected difference between what would be expensed for financial reporting purposes and what would be deductible for income tax purposes. As of December 31, 2014 and 2013, this deferred tax asset was $0.1 million and $0.2 million, respectively. This deferred tax asset will be recognized as the identifiable intangibles are amortized.
We continue to maintain a full valuation allowance on the domestic net deferred tax asset as we have determined it is more likely than not that we will not realize our domestic deferred tax assets. Such assets primarily consist of certain net state operating loss carryforwards, AMT credits and research and development credits. We assessed the realizability of our domestic deferred tax assets using all available evidence. In particular, we considered both historical results and projections of profitability for the reasonably foreseeable future periods. We are required to reassess our conclusions regarding the realization of our deferred tax assets at each financial reporting date. A future evaluation could result in a conclusion that all or a portion of the valuation allowance is no longer necessary which could have a material impact on our results of operations and financial position.
The benefit for income taxes differs from the amount computed by applying the U.S. federal income tax rate of 34% to income before income taxes as follows (in thousands):
|
|
|
For the Years Ended December 31, |
| |||||||
|
|
|
2014 |
|
2013 |
|
2012 |
| |||
|
|
|
|
|
|
|
|
| |||
|
U.S. federal income tax expense at statutory rates |
|
$ |
4,595 |
|
$ |
2,143 |
|
$ |
3,368 |
|
|
State income tax expense, net of federal impact |
|
542 |
|
46 |
|
139 |
| |||
|
Foreign rate differential |
|
(1,452 |
) |
(332 |
) |
(96 |
) | |||
|
Foreign deemed dividends |
|
1,783 |
|
871 |
|
452 |
| |||
|
Undistributed foreign earnings |
|
— |
|
— |
|
158 |
| |||
|
Change in valuation allowance |
|
(1,971 |
) |
(492 |
) |
(1,986 |
) | |||
|
Research and development expenses |
|
(867 |
) |
(859 |
) |
(976 |
) | |||
|
Foreign taxes |
|
53 |
|
93 |
|
288 |
| |||
|
Undistributed foreign earnings assertion |
|
0 |
|
— |
|
(856 |
) | |||
|
Permanent differences and other, net |
|
114 |
|
(196 |
) |
910 |
| |||
|
Total tax expense |
|
$ |
2,797 |
|
$ |
1,274 |
|
$ |
1,401 |
|
The Company recognizes the tax benefit from an uncertain tax position when it determines that it is more likely than not that the position would be sustained upon examination by taxing authorities.
As of December 31, 2014 and 2013, we had no liability for unrecognized tax benefits. We do not believe there will be any material changes to our unrecognized tax positions over the next twelve months. Interest and penalties related to income tax liabilities are included as a component of income tax expense (benefit) in the accompanying statements of operations.
Our income taxes payable have been reduced by the AMT tax benefits from employee stock plan awards. We had no net excess tax benefits from employee stock plan awards for the years ended December 31, 2014 and 2013, which was reflected as an increase to additional paid-in capital.
We conduct business globally and, as a result, Evolving Systems Inc. or one or more of our subsidiaries file income tax returns in the U.S. federal jurisdiction and various state and foreign jurisdictions. In the normal course of business, we are subject to examination by taxing authorities throughout the world, namely the United Kingdom, Germany and India. Although carryovers can always be subject to review by taxing authorities, we are no longer subject to U.S. federal, state and local, or non-U.S. income tax examinations for years before 2011. During 2004, we formed Evolving Systems India, a wholly owned subsidiary of Evolving Systems which is used primarily for product development.
Management is considering applying an indirect foreign tax credit for the foreign taxes paid to the United Kingdom in the years ended December 31, 2014, December 31, 2013, and December 31, 2012. To quantify the availability of the foreign tax credit for these three years and to fully analyze the related advantages and disadvantages requires substantial quantitative and qualitative analysis that Management currently plans to perform during 2015. As such, the Company has not recorded a deferred tax asset for future foreign tax credit benefits.
The Company has the intent and current ability to indefinitely reinvest profits of Evolving Systems India for the year ended December 31, 2014. Undistributed foreign earnings for the year ended December 31, 2014 are approximately $0.5 million. Repatriation to the U.S. in the form of dividend distributions from the India controlled foreign subsidiary would give rise to taxation.
NOTE 8 - STOCKHOLDERS’ EQUITY
Common Stock Dividends
Our Board of Directors declared a cash dividend of $0.10 per share during the first and second quarters of 2014 and a cash dividend of $0.11 per share during the third and fourth quarters of 2014. There were no accrued dividends as of December 31, 2014.
Any determination to declare a future quarterly dividend, as well as the amount of any cash dividend which may be declared, will be based on our financial position, earnings, earnings outlook and other relevant factors at that time, including applicable limits under our revolving credit facility or any other credit facility then in effect.
Treasury Stock
Beginning on May 20, 2011, and continuing through December 31, 2013, we had the ability through our stock purchase program to re-purchase our common stock at prevailing market prices either in the open market or through privately negotiated transactions up to $5.0 million. The size and timing of such purchases, if any, was based on market and business conditions as well as other factors. We were not obligated to purchase any shares. The re-purchase program expired on December 31, 2013.
From the inception of the plan through December 31, 2013, we purchased 178,889 shares of our common stock for $1.3 million or an average price of $6.97 per share.
Certain Anti-Takeover Provisions/Agreements with Stockholders
Our restated certificate of incorporation allows the board of directors to issue up to 2,000,000 shares of preferred stock and to determine the price, rights, preferences and privileges of those shares without any further vote or action by our stockholders. The rights of the holders of our common stock will be subject to, and may be adversely affected by, the rights of the holders of any preferred stock that may be issued in the future. Issuance of preferred stock, while providing desired flexibility in connection with possible acquisitions and other corporate purposes could make it more difficult for a third party to acquire a majority of our outstanding voting stock. As of December 31, 2014 and December 31, 2013, no shares of preferred stock were outstanding.
In addition, we are subject to the anti-takeover provisions of Section 203 of Delaware General Corporation Law which prohibit us from engaging in a “business combination” with an “interested stockholder” for a period of three years after the date of the transaction in which the person became an interested stockholder, unless the business combination is approved in the prescribed manner. The application of Section 203 may have the effect of delaying or preventing changes in control of our management, which
could adversely affect the market price of our common stock by discouraging or preventing takeover attempts that might result in the payment of a premium price to our stockholders.
NOTE 9 — SHARE-BASED COMPENSATION
We account for stock-based compensation by applying a fair-value-based measurement method to account for share-based payment transactions with employees and directors, and record compensation cost for all stock awards granted after January 1, 2006 and awards modified, repurchased, or cancelled after that date, using the modified prospective method. We record compensation costs associated with the vesting of unvested options on a straight-line basis over the vesting period. We recognized $0.4 million, $0.3 million and $0.3 million for the years ended December 31, 2014, 2013 and 2012, respectively, of compensation expense in the consolidated statements of operations, with respect to our stock-based compensation plans. The following table summarizes stock-based compensation expenses recorded in the statement of operations (in thousands):
|
|
|
For the Years Ended December 31, |
| |||||||
|
|
|
2014 |
|
2013 |
|
2012 |
| |||
|
Cost of license fees and services, excluding depreciation and amortization |
|
$ |
73 |
|
$ |
29 |
|
$ |
18 |
|
|
Cost of customer support, excluding depreciation and amortization |
|
8 |
|
4 |
|
4 |
| |||
|
Sales and marketing |
|
31 |
|
24 |
|
23 |
| |||
|
General and administrative |
|
181 |
|
207 |
|
200 |
| |||
|
Product development |
|
108 |
|
24 |
|
19 |
| |||
|
Total share based compensation |
|
$ |
401 |
|
$ |
288 |
|
$ |
264 |
|
Stock Option/Incentive Plans
In January 1996, our stockholders approved an Amended and Restated Stock Option Plan (the “Option Plan”). Under the Option Plan, as amended, 4,175,000 shares were reserved for issuance. Options issued under the Option Plan were at the discretion of the Board of Directors, including the vesting provisions of each stock option granted. Options were granted with an exercise price equal to the closing price of our common stock on the date of grant, generally vest over four years and expire no more than ten years from the date of grant. The Option Plan terminated on January 18, 2006; options granted before that date were not affected by the plan termination. At December 31, 2014 and 2013, 0.1 million and 0.2 million options remained outstanding under the Option Plan, respectively.
In June 2007, our stockholders approved the 2007 Stock Incentive Plan (the “2007 Stock Plan”) with a maximum of 1,000,000 shares reserved for issuance. In June 2010, our stockholders approved an amendment to the 2007 Stock Plan which increased the maximum shares that may be awarded under the plan to 1,250,000. In June 2013, our stockholders approved an amendment to the 2007 Stock Plan which increased the maximum shares that may be awarded under the plan to 1,502,209. Awards permitted under the 2007 Stock Plan include: Stock Options, Stock Appreciation Rights, Restricted Stock, Restricted Stock Units, Performance Awards and Other Stock-Based Awards. Awards issued under the 2007 Stock Plan are at the discretion of the Board of Directors. As applicable, awards are granted with an exercise price equal to the closing price of our common stock on the date of grant, generally vest over four years for employees and one year for directors and, with respect to stock option grants expire no more than ten years from the date of grant. At December 31, 2014 and 2013, there were approximately 0.1 million and 0.2 million shares, respectively, available for grant under the 2007 Stock Plan, which amounts reflect adjustments made in 2012 as a result of our special dividends (see details below). At December 31, 2014 and 2013, 0.6 million and 0.5 million options were issued and outstanding under the 2007 Stock Plan, respectively.
During the year ended December 31, 2013 we awarded a total of 18,500 shares of restricted stock to members of our Board of Directors and senior management. No shares of restricted stock were awarded during the year ended December 31, 2014. During the years ended December 31, 2014 and 2013, approximately 8,000 and 25,000 shares of restricted stock vested, respectively. There were forfeitures of approximately 1,000 shares of restricted stock during years ended December 31, 2014 and 2013. The fair market value for stock-based compensation expense is equal to the closing price of our common stock on the date of grant. The restrictions on the stock award are released generally over four years for senior management and over one year for board members. Stock-based compensation expense includes $0.1 million, $0.2 million and $0.1 million for the years ended December 31, 2014, 2013 and 2012, respectively for restricted stock.
As described above, on November 10, 2011, we declared a special cash dividend of $2.00 per share on all of our issued and outstanding common stock, or an aggregate of approximately $22.3 million, which was paid on January 3, 2012. In connection with the special dividend, the Compensation Committee of the Board of Directors of the Company approved anti-dilution adjustments to outstanding stock option awards pursuant to the Company’s equity-based compensation plans to take into account the payment of the special cash dividend. Outstanding stock option awards were adjusted on January 3, 2012 (the ex-dividend date), by reducing the exercise price and increasing the number of shares issuable upon the exercise of each option, in accordance with safe harbor provisions of Section 409A of the Internal Revenue Code, such that the aggregate difference between the market price and exercise price times the number of shares issuable upon exercise was substantially the same immediately before and after the payment of the special dividend. The antidilution modification made with respect to such options resulted in a decrease in the weighted average exercise price from $7.46 to $5.80 and an increase in the aggregate number of shares issuable upon exercise of such options by 45,749. Since our Stock Plan permits, but does not require, antidilution modifications, (ASC) 718, Compensation — Stock Compensation requires a comparison of the fair value of each award immediately prior to and after the date of modification, assuming the value immediately prior to modification contains no antidilution protection, and the value immediately after modification contains full antidilution protection. This comparison resulted in no aggregate difference or additional compensation expense in the twelve months ended December 31, 2012.
On May 8, 2012, we declared a special cash dividend of $1.70 per share on all of the issued and outstanding common stock, or an aggregate of approximately $19.5 million, which was paid on May 29, 2012. In connection with the special dividend, the Compensation Committee of the Board of Directors of the Company approved anti-dilution adjustments to outstanding stock option awards pursuant to the Company’s equity-based compensation plans to take into account the payment of the special cash dividend. Outstanding stock option awards were adjusted on May 18, 2012 (the ex-dividend date), by reducing the exercise price and increasing the number of shares issuable upon the exercise of each option, in accordance with safe harbor provisions of Section 409A of the Internal Revenue Code, such that the aggregate difference between the market price and exercise price times the number of shares issuable upon exercise was substantially the same immediately before and after the payment of the special dividend. The antidilution modification made with respect to such options resulted in a decrease in the weighted average exercise price from $5.80 to $4.53 and an increase in the aggregate number of shares issuable upon exercise of such options by 64,069. Since our Stock Plan permits, but does not require, antidilution modifications, (ASC) 718, Compensation — Stock Compensation requires a comparison of the fair value of each award immediately prior to and after the date of modification, assuming the value immediately prior to modification contains no antidilution protection, and the value immediately after modification contains full antidilution protection. This comparison resulted in no aggregate difference or additional compensation expense in the twelve months ended December 31, 2012. The fair value of each option grant is estimated on the date of grant using the Black-Scholes model. The Black-Scholes model uses four assumptions to calculate the fair value of each option grant. The expected term of share options granted is derived using the simplified method, which we adopted in January 2008. The risk-free interest rate is based upon the rate currently available on zero-coupon U.S. Treasury instruments with a remaining term equal to the expected term of the stock options. The expected volatility is based upon historical volatility of our common stock over a period equal to the expected term of the stock options. The expected dividend yield is based upon historical and anticipated payment of dividends. The weighted-average assumptions used in the fair value calculations are as follows:
|
|
|
For the Years Ended December 31, |
| ||||
|
|
|
2014 |
|
2013 |
|
2012 |
|
|
Expected term (years) |
|
5.9 |
|
6.1 |
|
5.7 |
|
|
Risk-free interest rate |
|
1.69 |
% |
1.31 |
% |
0.84 |
% |
|
Expected volatility |
|
55.88 |
% |
59.17 |
% |
65.23 |
% |
|
Expected dividend yield |
|
4.0 |
% |
4.1 |
% |
3.5 |
% |
The following is a summary of stock option activity under the stock option plans for the years ended December 31, 2014 and 2013:
|
|
|
|
|
|
|
Weighted- |
|
|
| ||
|
|
|
|
|
|
|
Average |
|
|
| ||
|
|
|
[1] |
|
Weighted- |
|
Remaining |
|
Aggregate |
| ||
|
|
|
Number of |
|
Average |
|
Contractual |
|
Intrinsic |
| ||
|
|
|
Shares |
|
Exercise |
|
Term |
|
Value |
| ||
|
|
|
(in thousands) |
|
Price |
|
(Years) |
|
(in thousands) |
| ||
|
Options outstanding at December 31, 2012 |
|
704 |
|
$ |
4.86 |
|
4.60 |
|
$ |
1,757 |
|
|
Options granted |
|
123 |
|
$ |
8.21 |
|
|
|
|
| |
|
Less options forfeited |
|
(28 |
) |
$ |
17.30 |
|
|
|
|
| |
|
Less options exercised |
|
(123 |
) |
$ |
3.99 |
|
|
|
|
| |
|
Options outstanding at December 31, 2013 |
|
676 |
|
$ |
5.11 |
|
4.76 |
|
$ |
3,491 |
|
|
Options granted |
|
168 |
|
$ |
10.15 |
|
|
|
|
| |
|
Less options forfeited |
|
(132 |
) |
$ |
12.20 |
|
|
|
|
| |
|
Less options exercised |
|
(82 |
) |
$ |
5.31 |
|
|
|
|
| |
|
Options outstanding at December 31, 2014 |
|
630 |
|
$ |
4.94 |
|
5.69 |
|
$ |
2,959 |
|
|
|
|
|
|
|
|
|
|
|
| ||
|
Options exercisable at December 31, 2014 |
|
461 |
|
$ |
3.33 |
|
4.53 |
|
$ |
2,833 |
|
[1] In 2012, the balance of options outstanding was increased by 109,818 options due to the aforementioned anti-dilution adjustments to outstanding stock option awards.
The following is a summary of stock options outstanding under the plans as of December 31, 2014:
|
|
|
|
|
|
|
|
|
Stock Options |
| ||||||||
|
Stock Options Outstanding |
|
Exercisable |
| ||||||||||||||
|
|
|
|
|
Weighted Avg. |
|
|
|
|
|
|
| ||||||
|
|
|
Number of |
|
Remaining |
|
Weighted Avg. |
|
Number of |
|
Weighted Avg. |
| ||||||
|
Range of |
|
Shares |
|
Contractual Life |
|
Exercise |
|
Shares |
|
Exercise |
| ||||||
|
Exercise Prices |
|
(in thousands) |
|
(years) |
|
Price |
|
(in thousands) |
|
Price |
| ||||||
|
$ |
0.01 |
- |
$ |
3.42 |
|
269 |
|
2.87 |
|
$ |
1.52 |
|
269 |
|
$ |
1.52 |
|
|
$ |
3.43 |
- |
$ |
6.85 |
|
169 |
|
6.33 |
|
$ |
4.58 |
|
142 |
|
$ |
4.36 |
|
|
$ |
6.86 |
- |
$ |
10.28 |
|
81 |
|
9.11 |
|
$ |
8.90 |
|
18 |
|
$ |
8.66 |
|
|
$ |
10.29 |
- |
$ |
13.70 |
|
111 |
|
9.05 |
|
$ |
10.89 |
|
32 |
|
$ |
10.89 |
|
|
|
|
630 |
|
5.69 |
|
$ |
4.94 |
|
461 |
|
$ |
3.33 |
| ||||
The weighted-average grant-date fair value of stock options granted during the years ended December 31, 2014, 2013 and 2012 was $3.80, $3.16 and $2.45 respectively.
As of December 31, 2014, there were approximately $0.5 million of total unrecognized compensation costs related to unvested stock options and restricted stock. These costs are expected to be recognized over a weighted average period of 2.7 years.
The total intrinsic value of stock option exercises for the years ended December 31, 2014, 2013 and 2012 was $0.4 million, $0.6 million and $0.8 million, respectively. The total fair value of stock awards vested during the years ended December 31, 2014, 2013 and 2012 was $0.3 million, $0.1 million and $0.2 million, respectively.
The deferred income tax benefits from stock options expense related to Evolving Systems U.K. totaled approximately $15,000, $15,000 and $14,000 for the years ended December 31, 2014, 2013 and 2012, respectively.
Cash received from stock option exercises was $0.2 million, $0.5 million and $0.6 million for the years ended December 31, 2014, 2013 and 2012, respectively.
During the year ended December 31, 2014, we had net settlement exercises of stock options, whereby the optionee did not pay cash for the options but instead received the number of shares equal to the difference between the exercise price and the market
price on the date of exercise. Net settlement exercises during the year ended December 31, 2014, resulted in approximately 7,094 shares issued and 26,376 options cancelled in settlement of shares issued. There were no net settlement exercises during the years ended December 31, 2013 or 2012.
Employee Stock Purchase Plan
Under the Employee Stock Purchase Plan (“ESPP”), we are authorized to issue up to 550,000 shares of our common stock to full-time employees, nearly all of whom are eligible to participate. Under the terms of the ESPP, employees may elect to have up to 15% of their gross compensation withheld through payroll deduction to purchase our common stock, capped at $25,000 annually and no more than 10,000 shares per offering period. The purchase price of the stock is 85% of the lower of the market price at the beginning or end of each three-month participation period. As of December 31, 2014, there were approximately 61,000 shares available for purchase. For the years ended December 31, 2014, 2013 and 2012, we recorded compensation expense of $17,000, $2,000 and $2,000, respectively, associated with grants under the ESPP which includes the fair value of the look-back feature of each grant as well as the 15% discount on the purchase price. This expense fluctuates each period primarily based on the level of employee participation.
|
|
|
For the Years Ended December 31, |
| ||||
|
|
|
2014 |
|
2013 |
|
2012 |
|
|
Expected term (years) |
|
0.25 |
|
0.25 |
|
0.25 |
|
|
Risk-free interest rate |
|
0.03 |
% |
0.05 |
% |
0.08 |
% |
|
Expected volatility |
|
40.92 |
% |
44.36 |
% |
49.54 |
% |
|
Expected dividend yield |
|
4.5 |
% |
4.0 |
% |
3.4 |
% |
Cash received from employee stock plan purchases was approximately $68,000, $8,000 and $7,000 for the years ended December 31, 2014, 2013 and 2012, respectively. We issued shares related to the ESPP of approximately 9,000, 1,000 and 2,000 for the years ended December 31, 2014, 2013 and 2012, respectively.
NOTE 10 — BENEFIT PLANS
We have established a defined contribution retirement plan for our employees under section 401(k) of the Internal Revenue Code (the “401(k) Plan”) that is available to all U.S. employees 21 years of age or older with a month of service. Beginning in 2012, we adopted a Safe Harbor 401(k) requiring us to contribute 3% of the employee’s compensation for each eligible employee, regardless of whether the employee chooses to participate in the plan. All employee contributions are fully vested immediately and employer contributions vest over a period of three years. Evolving Systems U.K. has established a defined contribution pension scheme that is available to all employees in their first full month of employment. Employees may contribute a percentage of their earnings, the amount of which is dependent upon the age of the employee, not to exceed the maximum statutory contribution amount. We match 5% of employee contributions. All contributions are immediately vested in their entirety.
During 2014, 2013 and 2012, we recorded a consolidated expense of $0.4 million, $0.3 million and $0.3 million, under the aforementioned plans, respectively.
NOTE 11 — EARNINGS PER SHARE
Basic earnings per share (“EPS”) is computed by dividing net income or loss available to common stockholders by the weighted average number of shares of common stock outstanding during the period. Diluted EPS is computed using the weighted average number of shares of common stock outstanding, plus all potentially dilutive common stock equivalents using the treasury stock method. Common stock equivalents consist of stock options. The following is the reconciliation of the numerators and denominators of the basic and diluted EPS computations (in thousands except per share data):
|
|
|
For the Years Ended December, 31 |
| |||||||
|
|
|
2014 |
|
2013 |
|
2012 |
| |||
|
Basic income (loss) per share: |
|
|
|
|
|
|
| |||
|
Net income |
|
$ |
5,608 |
|
$ |
3,806 |
|
$ |
5,564 |
|
|
|
|
|
|
|
|
|
| |||
|
Basic weighted average shares outstanding |
|
11,642 |
|
11,459 |
|
11,278 |
| |||
|
|
|
|
|
|
|
|
| |||
|
Basic income (loss) per share: |
|
|
|
|
|
|
| |||
|
Net Income |
|
$ |
0.48 |
|
$ |
0.33 |
|
$ |
0.49 |
|
|
|
|
|
|
|
|
|
| |||
|
Diluted income (loss) per share: |
|
|
|
|
|
|
| |||
|
Net income |
|
$ |
5,608 |
|
$ |
3,806 |
|
$ |
5,564 |
|
|
|
|
|
|
|
|
|
| |||
|
Weighted average shares outstanding |
|
11,642 |
|
11,459 |
|
11,278 |
| |||
|
Effect of dilutive securities - options |
|
284 |
|
297 |
|
251 |
| |||
|
Diluted weighted average shares outstanding |
|
11,926 |
|
11,756 |
|
11,529 |
| |||
|
|
|
|
|
|
|
|
| |||
|
Diluted income (loss) per share: |
|
|
|
|
|
|
| |||
|
Net Income |
|
$ |
0.47 |
|
$ |
0.32 |
|
$ |
0.48 |
|
Weighted average options to purchase approximately 0.1 million, 0.1 million and 0.2 million shares of common stock equivalents were excluded from the computation of diluted weighted average shares outstanding for the years ended December 31, 2014, 2013 and 2012, respectively, because the effect would have been anti-dilutive since their exercise prices were greater than the average market value of our common stock for the period.
NOTE 12 — COMMITMENTS AND CONTINGENCIES
(a) Lease Commitments
We lease office and operating facilities and equipment under non-cancelable operating leases. Current facility leases include our headquarters in Englewood, Colorado, London and Bath, England, Bangalore, India, and Kuala Lumpur, Malaysia. Rent expense was $0.6 million, $0.4 million and $0.5 million for the years ended December 31, 2014, 2013 and 2012, respectively. Rent expense is net of sublease rental income totaling $0.3 million for the year ended December 31, 2012. There were was no sublease rental income for the years ended December 31, 2014 and 2013.
We amended our headquarters facility lease and extended the term three years. The lease contains a clause that adjusts the lease rate every year. The lease rate increases annually as of December 1. Our Bath, England facility contains a clause that adjusted the lease rate one time over the five year term on September 27, 2012. We account for the effect of such escalating lease payments as if the lease rate were consistent over the lease term. Future minimum commitments under non-cancelable operating leases and capital leases gross of sublease payments as of December 31, 2014 are as follows (in thousands):
|
|
|
Operating Leases |
|
Capital Leases |
| ||
|
2015 |
|
$ |
327 |
|
$ |
6 |
|
|
2016 |
|
106 |
|
6 |
| ||
|
2017 |
|
99 |
|
1 |
| ||
|
2018 |
|
— |
|
— |
| ||
|
Total minimum lease payments |
|
$ |
532 |
|
13 |
| |
|
Less: Amount representing interest |
|
|
|
(1 |
) | ||
|
Principal balance of capital lease obligations |
|
|
|
12 |
| ||
|
Less: Current portion of capital lease obligations |
|
|
|
(5 |
) | ||
|
Long-term portion of capital lease obligations |
|
|
|
$ |
7 |
| |
(b) Other Commitments
As permitted under Delaware law, we have agreements with officers and directors under which we agree to indemnify them for certain events or occurrences while the officer or director is, or was, serving at our request in this capacity. The term of the indemnification period is indefinite. There is no limit on the amount of future payments we could be required to make under these indemnification agreements; however, we maintain Director and Officer insurance policies, as well as an Employment Practices Liability Insurance Policy, that may enable us to recover a portion of any amounts paid. Accordingly, we did not record any liabilities for these agreements as of December 31, 2014 and 2013.
We enter into standard indemnification terms with customers and suppliers, as discussed below, in the ordinary course of business. As we may subcontract the development of deliverables under customer contracts, we could be required to indemnify customers for work performed by subcontractors. Depending upon the nature of the customer indemnification, the potential amount of
future payments we could be required to make under these indemnification agreements may be unlimited. We may be able to recover damages from a subcontractor if the indemnification to customers results from the subcontractor’s failure to perform. To the extent we are unable to recover damages from a subcontractor, we could be required to reimburse the indemnified party for the full amount. We have never incurred costs to defend lawsuits or settle claims relating to indemnification arising out of subcontractors’ failure to perform. We did not record any liabilities for these agreements as of December 31, 2014 and 2013.
Our standard license agreements contain product warranties that the software will be free of material defects and will operate in accordance with the stated requirements for a limited period of time. The product warranty provisions require us to cure any defects through any reasonable means. We believe the estimated fair value of the product warranty provisions in the license agreements in place with our customers is minimal. Accordingly, we did not record any liabilities for these product warranty provisions as of December 31, 2014 and 2013.
Our software arrangements generally include a product indemnification provision whereby we will indemnify and defend a customer in actions brought against the customer for claims that our products infringe upon a copyright, trade secret, or valid patent. We have not historically incurred any significant costs related to product indemnification claims. Accordingly, we did not record any liabilities for these indemnification provisions as of December 31, 2014 and 2013.
In connection with our acquisition of Telespree on October 24, 2013, we agreed to make a cash payment of $0.5 million on the one year anniversary of the closing. This payment was subject to reduction for certain claims which has not been paid to date.
(c) Litigation
From time to time, we are involved in various legal matters arising in the normal course of business. We do not expect the outcome of such proceedings, either individually or in the aggregate, to have a material effect on our financial position, cash flows or results of operations.
NOTE 13 — SEGMENT INFORMATION
We define operating segments as components of our enterprise for which separate financial information is reviewed regularly by the chief operating decision-makers to evaluate performance and to make operating decisions. We have identified our Chief Executive Officer and Vice President of Finance as our chief operating decision-makers (“CODM”). These chief operating decision makers review revenue by segment and review overall results of operations.
We currently operate our business as two operating segments based on revenue type: license fees and services revenue and customer support revenue (as shown on the consolidated statements of operations). License fees and services (“L&S”) revenue represents the fees received from the license of software products and those services directly related to the delivery of the licensed products, such as fees for custom development, integration services and SaaS service. Customer support (“CS”) revenue includes annual support fees, recurring maintenance fees, fees for maintenance upgrades and warranty services. Warranty services that are similar to software maintenance services are typically bundled with a license sale. Total assets by segment have not been disclosed as the information is not available to the chief operating decision-makers.
Revenue information by segments was as follows (in thousands):
|
|
|
For the Years Ended December 31, |
| |||||||
|
|
|
2014 |
|
2013 |
|
2012 |
| |||
|
Revenue |
|
|
|
|
|
|
| |||
|
License fees and services |
|
$ |
19,738 |
|
$ |
15,998 |
|
$ |
17,622 |
|
|
Customer support |
|
9,942 |
|
9,095 |
|
8,625 |
| |||
|
Total revenue |
|
29,680 |
|
25,093 |
|
26,247 |
| |||
|
|
|
|
|
|
|
|
| |||
|
Revenue less costs of revenue, excluding depreciation and amortization |
|
|
|
|
|
|
| |||
|
License fees and services |
|
13,956 |
|
10,433 |
|
10,888 |
| |||
|
Customer support |
|
8,076 |
|
7,496 |
|
7,123 |
| |||
|
|
|
22,032 |
|
17,929 |
|
18,011 |
| |||
|
Unallocated Costs |
|
|
|
|
|
|
| |||
|
Other operating expenses |
|
13,015 |
|
11,964 |
|
11,752 |
| |||
|
Depreciation and amortization |
|
341 |
|
366 |
|
668 |
| |||
|
Restructuring and other recovery |
|
237 |
|
558 |
|
— |
| |||
|
Interest income |
|
(19 |
) |
(11 |
) |
(60 |
) | |||
|
Interest income, related party |
|
— |
|
— |
|
(532 |
) | |||
|
Interest expense |
|
17 |
|
20 |
|
3 |
| |||
|
Other income (expense) |
|
27 |
|
(87 |
) |
— |
| |||
|
Gain on sale of investments |
|
— |
|
— |
|
(891 |
) | |||
|
Foreign currency exchange (gain) loss |
|
9 |
|
39 |
|
106 |
| |||
|
|
|
|
|
|
|
|
| |||
|
Income from operations before income taxes |
|
$ |
8,405 |
|
$ |
5,080 |
|
$ |
6,965 |
|
Geographic Regions
We are headquartered in Englewood, a suburb of Denver, Colorado. We use customer locations as the basis for attributing revenue to individual countries. We provide products and services on a global basis through our office in Colorado and U.K.-based Evolving Systems U.K. subsidiary. Additionally, personnel in Bangalore, India, provide software development services to our global operations. Financial information relating to operations by geographic region is as follows (in thousands):
|
|
|
For the Year Ended December 31, 2014 |
| |||||||
|
|
|
L&S |
|
CS |
|
Total |
| |||
|
Revenue |
|
|
|
|
|
|
| |||
|
United Kingdom |
|
$ |
3,551 |
|
$ |
2,017 |
|
$ |
5,568 |
|
|
Nigeria |
|
2,954 |
|
473 |
|
3,427 |
| |||
|
Mexico |
|
2,478 |
|
722 |
|
3,200 |
| |||
|
Other |
|
10,755 |
|
6,730 |
|
17,485 |
| |||
|
Total revenues |
|
$ |
19,738 |
|
$ |
9,942 |
|
$ |
29,680 |
|
|
|
|
For the Year Ended December 31, 2013 |
| |||||||
|
|
|
L&S |
|
CS |
|
Total |
| |||
|
Revenue |
|
|
|
|
|
|
| |||
|
United Kingdom |
|
$ |
3,018 |
|
$ |
1,903 |
|
$ |
4,921 |
|
|
Other |
|
12,980 |
|
7,192 |
|
20,172 |
| |||
|
Total revenues |
|
$ |
15,998 |
|
$ |
9,095 |
|
$ |
25,093 |
|
|
|
|
For the Year Ended December 31, 2012 |
| |||||||
|
|
|
L&S |
|
CS |
|
Total |
| |||
|
Revenue |
|
|
|
|
|
|
| |||
|
United Kingdom |
|
$ |
3,938 |
|
$ |
1,999 |
|
$ |
5,937 |
|
|
Commonwealth of Independent States |
|
3,548 |
|
— |
|
3,548 |
| |||
|
Mexico |
|
2,187 |
|
340 |
|
2,527 |
| |||
|
Other |
|
7,949 |
|
6,286 |
|
14,235 |
| |||
|
Total revenues |
|
$ |
17,622 |
|
$ |
8,625 |
|
$ |
26,247 |
|
|
|
|
December 31, |
|
December 31, |
| ||
|
|
|
2014 |
|
2013 |
| ||
|
Long-lived assets, net |
|
|
|
|
| ||
|
United States |
|
$ |
1,998 |
|
$ |
1,840 |
|
|
United Kingdom |
|
16,091 |
|
16,985 |
| ||
|
Other |
|
188 |
|
155 |
| ||
|
|
|
$ |
18,277 |
|
$ |
18,980 |
|
NOTE 14 — RESTRUCTURING
During the first quarter of 2014, we undertook a reduction in workforce involving the termination of employees resulting in an expense of $0.2 million primarily related to severance for the affected employees. The reduction in workforce was related to the consolidation of duplicative functions and alignment of staff with ongoing business activity as a result of the acquisition of Evolving
Systems Labs, Inc. in the fourth quarter of 2013. Subsequently, an additional expense of $26,000 was incurred in the second quarter relating to the first quarter 2014 reduction in force. Restructuring expense of $0.6 million was recorded for the year ending December 31, 2013 primarily related to severance for a reduction in workforce. The reduction in workforce was related to the acquisition of Evolving Systems Labs, Inc.
As of December 31, 2014, $0.6 million has been paid. The restructuring liability was $0 and $0.4 million as of December 31, 2014 and 2013, respectively.
There was no restructuring expense during the year ended December 31, 2012.
NOTE 15 — QUARTERLY FINANCIAL INFORMATION (UNAUDITED)
Quarterly financial information is as follows (in thousands, except per share data):
|
|
|
First |
|
Second |
|
Third |
|
Fourth |
| ||||
|
|
|
Quarter |
|
Quarter |
|
Quarter |
|
Quarter |
| ||||
|
Year Ended December 31, 2014 |
|
|
|
|
|
|
|
|
| ||||
|
Total revenue |
|
$ |
6,582 |
|
$ |
7,939 |
|
$ |
7,560 |
|
$ |
7,599 |
|
|
Less: cost of revenue and operating expenses |
|
5,555 |
|
5,322 |
|
5,241 |
|
5,123 |
| ||||
|
Income from operations |
|
1,027 |
|
2,617 |
|
2,319 |
|
2,476 |
| ||||
|
Income before income taxes |
|
929 |
|
2,514 |
|
2,506 |
|
2,456 |
| ||||
|
Net income |
|
$ |
651 |
|
$ |
1,676 |
|
$ |
1,679 |
|
$ |
1,602 |
|
|
Net income per common share: |
|
|
|
|
|
|
|
|
| ||||
|
Basic income per common share - net income |
|
$ |
0.06 |
|
$ |
0.14 |
|
$ |
0.14 |
|
$ |
0.14 |
|
|
Diluted income per common share - net income |
|
$ |
0.05 |
|
$ |
0.14 |
|
$ |
0.14 |
|
$ |
0.13 |
|
|
|
|
|
|
|
|
|
|
|
| ||||
|
Year Ended December 31, 2013 |
|
|
|
|
|
|
|
|
| ||||
|
Total revenue |
|
$ |
6,669 |
|
$ |
5,785 |
|
$ |
6,069 |
|
$ |
6,570 |
|
|
Less: cost of revenue and operating expenses |
|
4,888 |
|
4,533 |
|
4,604 |
|
6,027 |
| ||||
|
Income from operations |
|
1,781 |
|
1,252 |
|
1,465 |
|
543 |
| ||||
|
Income before income taxes |
|
1,735 |
|
1,438 |
|
1,356 |
|
551 |
| ||||
|
Net income |
|
$ |
1,173 |
|
$ |
909 |
|
$ |
920 |
|
$ |
804 |
|
|
Net income per common share: |
|
|
|
|
|
|
|
|
| ||||
|
Basic income per common share - net income |
|
$ |
0.10 |
|
$ |
0.08 |
|
$ |
0.08 |
|
$ |
0.07 |
|
|
Diluted income per common share - net income |
|
$ |
0.10 |
|
$ |
0.08 |
|
$ |
0.08 |
|
$ |
0.07 |
|
NOTE 16 — RELATED PARTY TRANSACTIONS
During the year ended December 31, 2011, we purchased $16.9 million of Primus Telecommunications Group, Inc. (“PTGI”) senior secured notes, net of purchase discounts, on the open market through a registered broker dealer. The Singer Family Trust, our largest shareholder, owned approximately 22% of our outstanding common shares and approximately 14% of the outstanding shares of PTGI. Richard Ramlall, then Senior Vice President of Corporate Development and Chief Communications Officer of PTGI, serves on our board of directors but is not on our Investment Committee of the Board and as such is not involved in any of our investment decisions nor is Mr. Ramlall involved with any oversight of the financial operations of PTGI. Mr. Ramlall’s employment with PTGI ended in September 2013.
During the years ended December 31, 2012 we recorded interest income of $0.5 million in our Consolidated Statements of Operations related to the PTGI senior secured notes. As of April 23, 2012 the investments were sold for approximately $17.8 million and we realized a gain on sale of approximately $0.9 million.
NOTE 17 — SUBSEQUENT EVENTS
On March 17, 2015, our Board of Directors declared a first quarter cash dividend of $0.11 per share, payable March 31, 2015, to stockholders of record on March 24, 2015.
We entered into a new facility lease for our London, England office. It has a three month rent free period at the beginning of its lease starting March 3, 2015 and is a ten year term with a break clause after five years.
ITEM 9. CHANGES IN AND DISAGREEMENTS WITH ACCOUNTANTS ON ACCOUNTING AND FINANCIAL DISCLOSURE
None.
ITEM 9A. CONTROLS AND PROCEDURES
Evaluation of disclosure controls and procedures. We maintain “disclosure controls and procedures,” as such term is defined in Rule 13a-15(e) and 15d-15(f) under the Securities Exchange Act of 1934 (the “Exchange Act”), that are designed to provide reasonable assurance that information required to be disclosed by us in reports that we file or submit under the Exchange Act is recorded, processed, summarized and reported within the time periods specified in Securities and Exchange Commission rules and forms, and that such information is accumulated and communicated to our management, including our Chief Executive Officer and Vice President, Finance & Administration, as appropriate, to allow timely decisions regarding required disclosure.
Our management, with the participation of the Chief Executive Officer and Vice President, Finance & Administration, has evaluated the effectiveness of our disclosure controls and procedures as of the end of the period covered by this Annual Report on Form 10-K. Based on that evaluation, our Chief Executive Officer and Vice President, Finance & Administration have concluded that our disclosure controls and procedures were effective as of the end of such period.
In designing and evaluating our disclosure controls and procedures, management recognized that disclosure controls and procedures, no matter how well conceived and operated, can provide only reasonable, not absolute, assurance that the objectives of the disclosure controls and procedures are met. Additionally, in designing disclosure controls and procedures, we are required to apply judgment in evaluating the cost-benefit relationship of possible disclosure controls and procedures. The design of any disclosure controls and procedures also is based in part upon certain assumptions about the likelihood of future events, and there can be no assurance that any design will succeed in achieving its stated goals under all potential future conditions.
Management’s report on internal control over financial reporting. Our management is responsible for establishing and maintaining adequate internal control over financial reporting, as such term is defined in Exchange Act Rules 13a-15(f). All internal control systems, no matter how well designed, have inherent limitations. Therefore, even those systems determined to be effective can provide only reasonable assurance with respect to financial statement preparation and presentation. Under the supervision and with the participation of our management, including our Chief Executive Officer and Vice President, Finance & Administration, we conducted an evaluation of the effectiveness of our internal control over financial reporting based on the 2013 framework set forth in the report entitled Internal Control — Integrated Framework issued by the Committee of Sponsoring Organizations of the Treadway Commission (“COSO”). The COSO framework summarizes each of the components of a company’s internal control system, including (i) the control environment, (ii) risk assessment, (iii) control activities, (iv) information and communication, and (v) monitoring.
Based on our evaluation under the framework in Internal Control — Integrated Framework, our management concluded that our internal control over financial reporting was effective as of December 31, 2014.
This Annual Report on Form 10-K does not include an attestation report of our independent registered public accounting firm regarding internal control over financial reporting. Management’s report was not subject to attestation by our independent registered public accounting firm pursuant to rules of the Securities and Exchange Commission that permit us to provide only management’s report in this Annual Report on Form 10-K.
Changes in internal control over financial reporting. During the quarter ended December 31, 2014, there was no change in our internal control over financial reporting or in other factors that has materially affected, or is reasonably likely to materially affect, our internal control over financial reporting.
None.
ITEM 10. DIRECTORS, EXECUTIVE OFFICERS AND CORPORATE GOVERNANCE
Incorporated by reference to the sections of Evolving Systems, Inc. 2015 Proxy Statement, anticipated to be filed within 120 days of December 31, 2014, entitled “Proposal No. 1-Election of Directors,” “Management” and “Information Regarding the Board and Its Committees.”
ITEM 11. EXECUTIVE COMPENSATION
Incorporated by reference to the section of Evolving Systems, Inc. 2015 Proxy Statement, anticipated to be filed within 120 days of December 31, 2014, entitled “Executive Compensation.”
ITEM 12. SECURITY OWNERSHIP OF CERTAIN BENEFICIAL OWNERS AND MANAGEMENT AND RELATED STOCKHOLDER MATTERS
Incorporated by reference to the section of the Evolving Systems, Inc. 2015 Proxy Statement, anticipated to be filed within 120 days of December 31, 2014, entitled “Information Regarding Beneficial Ownership of Principal Stockholders, Directors, and Management.”
ITEM 13. CERTAIN RELATIONSHIPS AND RELATED TRANSACTIONS, AND DIRECTOR INDEPENDENCE
Incorporated by reference to the sections of the Evolving Systems, Inc. 2015 Proxy Statement, anticipated to be filed within 120 days of December 31, 2014, entitled “Certain Relationships and Related Transactions” and “Information Regarding the Board and Its Committees.”
ITEM 14. PRINCIPAL ACCOUNTING FEES AND SERVICES
Incorporated by reference to the section of the Evolving Systems, Inc. 2015 Proxy Statement, anticipated to be filed within 120 days of December 31, 2014, entitled “Proposal No. 3-Ratification of Selection of Independent Registered Public Accounting Firm.”
ITEM 15. EXHIBITS AND FINANCIAL STATEMENT SCHEDULES
(a) The following documents are filed as part of this Annual Report on Form 10-K:
Consolidated Financial Statements.
Consolidated Financial Statement Schedules have been omitted because the required information is not present, or not present in amounts sufficient to require submission of the schedules or because the required information is provided in the Consolidated Financial Statements or Notes thereto.
|
Exhibit No. |
|
Description of Document |
|
2.1 |
|
Asset Purchase Agreement, dated as of April 21, 2011, by and between Evolving Systems, Inc. and NeuStar, Inc., as filed as Exhibit 2.1 to the Registrant’s Form 8-K filed on April 21, 2011 and incorporated herein by reference. |
|
2.2 |
|
Agreement and Plan of Merger by and among Evolving Systems, Inc., Topaz Merger Sub, Inc., Telespree Communications and Gill Cogan as the exclusive representative of the Effective Time Shareholders and Change in Control Payment Recipients, as filed as Exhibit 2.1 to the Registrant’s Form 8-K filed on October 25, 2013 and incorporated herein by reference. |
|
3.1† |
|
Restated Certificate of Incorporation. |
|
3.1(a) |
|
Certificate of Designation for the Series B Convertible Preferred Stock, as filed as Exhibit 3.1 to the Registrant’s Form 8-K filed November 11, 2004 and incorporated herein by reference. |
|
3.1(b) |
|
Certificate of Amendment to Certificate of Designation of Series B Convertible Preferred Stock filed as Exhibit 3.1(c) to the Registrant’s Form 8-K filed November 17, 2005 and incorporated herein by reference. |
|
3.1(c) |
|
Certificate of Amendment to Certificate of Designation of Series B Convertible Preferred Stock filed as Exhibit 3.01 to the Registrant’s Form 8-K filed May 4, 2007 and incorporated herein by reference. |
|
3.1(d) |
|
Certificate of Amendment to the Restated Certificate of Incorporation of Evolving Systems, Inc., as filed as Exhibit 3.1 to the Registrant’s Form 8-K filed on July 21, 2010 and incorporated herein by reference. |
|
3.1(e) |
|
Certificate of Amendment to Amended and Restated Certificate of Incorporation of Evolving Systems, Inc. as filed as |
|
|
|
Exhibit 3(i) to the Registrant’s Form 8-K filed on June 16, 2011 and incorporated herein by reference. |
|
3.2† |
|
Amended and Restated Bylaws. |
|
3(ii)(1) |
|
Amended and Restated Bylaws of Evolving Systems, Inc., as filed as Exhibit 3(ii) to the Registrant’s Form 8-K filed on July 31, 2014 and incorporated herein by reference. |
|
4.1† |
|
Reference is made to Exhibits 3.1 and 3.2. |
|
4.1 (a)* |
|
James E. King Equity Incentive Plan, as filed as Exhibit 4.1 to the Registrant’s Form S-8 filed March 22, 2007 and incorporated herein by reference. |
|
4.1 (b) |
|
Evolving Systems, Inc. Amended and Restated 2007 Stock Incentive Plan, as filed as Exhibit 4.3 to the Registrant’s Form S-8 filed September 6, 2013 and incorporated herein by reference. |
|
4.2† |
|
Specimen stock certificate representing shares of Common Stock. |
|
10.1 * |
|
Form of Indemnification Agreement, entered into by the Registrant and each of its directors and executive officers, as filed as Exhibit 10.2 to the Registrant’s Form 8-K filed on July 31, 2014 and incorporated herein by reference. |
|
10.2† * |
|
Amended and Restated Stock Option Plan. |
|
10.2 (a) |
|
Standstill Agreement between Evolving Systems, Inc. and Karen Singer, Trustee of the Singer Children’s Management Trust, as filed as Exhibit 10.2 to the Registrant’s Form 8-K filed February 27, 2008 and incorporated herein by reference. |
|
10.3† * |
|
Employee Stock Purchase Plan. |
|
10.4 |
|
Form of Change in Control Agreement, as filed as Exhibit 10.3 to the Registrant’s Form 8-K filed January 3, 2008 and incorporated herein by reference. |
|
10.5 |
|
Letter from Singer Children’s Management Trust, as filed as Exhibit 10.1 to the Registrant’s Form 8-K filed December 14, 2010 and incorporated herein by reference. |
|
10.6† |
|
Software Development Agreement, by and between the Registrant and American Telephone and Telegraph Company, dated as of May 1, 1993. (The division of American Telephone & Telegraph Company responsible for this Agreement has split off from AT&T and is now known as Lucent Technologies, Inc.). |
|
10.7* |
|
Amendment to Management Change in Control Agreement — Thaddeus Dupper, as filed as Exhibit 10.20(a) to the Registrant’s Form 10-Q filed May 11, 2007 and incorporated herein by reference. |
|
10.8 |
|
Fifth Amendment to Office Building Lease Agreement as filed as Exhibit 10.21 to the Registrant’s Form 10-Q filed May 11, 2007 and incorporated herein by reference. |
|
10.9 |
|
Agreement entered into with Singer Children’s Management Trust, as filed as Exhibit 10.1 to the Company’s Form 8-K filed April 20, 2011 and incorporated herein by reference. |
|
10.10* |
|
Employment Agreement entered into between Evolving Systems, Inc. and Thaddeus Dupper, as filed as Exhibit 99.1 to the Registrant’s Form 8-K filed on May 19, 2011 and incorporated herein by reference. |
|
10.11* |
|
Consulting Agreement between Evolving Systems, Inc. and Anita T. Moseley, as filed as Exhibit 99.1 to the Registrant’s Form 8-K filed on July 1, 2011 and incorporated herein by reference. |
|
10.12 |
|
Loan and Security Agreement between Evolving Systems, Inc. and East West Bank, as filed as Exhibit 10.1(a) to the Registrant’s Form 8-K filed on October 25, 2012 and incorporated herein by reference. |
|
10.13 |
|
Amendment to Loan and Security Agreement between Evolving Systems, Inc. and East West Bank, as filed as Exhibit 10.1 to the Registrant’s Form 8-K filed on November 6, 2014 and incorporated herein by reference. |
|
21(a) |
|
Subsidiaries of the Registrant (filed herewith). |
|
23.1 |
|
Consent of Friedman LLP, Independent Registered Public Accounting Firm related to Registration Statements on Forms S-8 (filed herewith). |
|
24.1 |
|
Power of Attorney (included on signature page) |
|
31.1 |
|
Certification of Chief Executive Officer pursuant to Section 302 of the Sarbanes-Oxley Act of 2002 (filed herewith). |
|
31.2 |
|
Certification of Chief Financial Officer pursuant to Section 302 of the Sarbanes-Oxley Act of 2002 (filed herewith). |
|
32.1 |
|
Certification of Chief Executive Officer pursuant to 18 U.S.C. Section 1350, as adopted pursuant to Section 906 of the Sarbanes-Oxley Act of 2002 (furnished herewith). |
|
32.2 |
|
Certification of Chief Financial Officer pursuant to 18 U.S.C. Section 1350, as adopted pursuant to Section 906 of the Sarbanes-Oxley Act of 2002 (furnished herewith). |
|
Exhibit 101 |
|
The following financial information from the annual report on Form 10-K of Evolving Systems, Inc. for the year ended December 31, 2014, formatted in XBRL (eXtensible Business Reporting Language): (i) Consolidated Balance Sheets as of December 31, 2014 and 2013 (ii) Consolidated Statements of Operations for the years ended December 31, 2014, 2013 and 2012 (iii) Consolidated Statements of Other Comprehensive Income for the years ended December 31, 2014, 2013 and 2012 (iv) Consolidated Statements of Changes in Stockholders’ Equity for the years ended December 31, 2014, 2013 and 2012 (v) Consolidated Statements of Cash Flows for the years ended December 31, 2014, 2013 and 2012 and (vi) Notes to the Consolidated Financial Statements. |
† Incorporated by reference to the Registrant’s Registration Statement on Form S-1 No. 333-43973.
Pursuant to the requirements of Section 13 or 15(d) of the Securities Exchange Act of 1934, the registrant has duly caused this report to be signed on its behalf by the undersigned, thereunto duly authorized.
EVOLVING SYSTEMS, INC.
|
By: |
/s/ THADDEUS DUPPER |
|
Chief Executive Officer, President and Director |
|
March 17, 2015 |
|
|
Thaddeus Dupper |
|
|
|
|
POWER OF ATTORNEY
KNOW ALL MEN BY THESE PRESENTS, that each person whose signature appears below constitutes and appoints Thaddeus Dupper, his attorney-in-fact, each with the power of substitution, for him in any and all capacities, to sign any amendments to this Report, and to file the same, with exhibits thereto and other documents in connections therewith, with the Securities and Exchange Commission, hereby ratifying and confirming all that each of said attorneys-in-fact, or his or her substitute or substitutes, may do or cause to be done by virtue hereof.
Pursuant to the requirements of the Securities Exchange Act of 1934, this report has been signed below by the following persons on behalf of the registrant and in the capacities and on the dates indicated.
|
Signature |
|
Title |
|
Date | |
|
|
|
|
|
| |
|
By: |
/s/ THADDEUS DUPPER |
|
Chairman and Chief Executive Officer |
|
March 17, 2015 |
|
|
Thaddeus Dupper |
|
(Principal Executive Officer) |
|
|
|
|
|
|
|
|
|
|
By: |
/s/ DANIEL J. MOORHEAD |
|
Vice President, Finance & Administration |
|
March 17, 2015 |
|
|
Daniel J. Moorhead |
|
(Principal Financial and Accounting Officer) |
|
|
|
|
|
|
|
|
|
|
By: |
/s/ DAVID J. NICOL |
|
Director |
|
March 17, 2015 |
|
|
David J. Nicol |
|
|
|
|
|
|
|
|
|
|
|
|
By: |
/s/ RICHARD R. RAMLALL |
|
Director |
|
March 17, 2015 |
|
|
Richard R. Ramlall |
|
|
|
|
|
|
|
|
|
|
|
|
By: |
/s/ DAVID S. OROS |
|
Director |
|
March 17, 2015 |
|
|
David S. Oros |
|
|
|
|
|
|
|
|
|
|
|
|
By: |
/s/ JOHN B. SPIRTOS |
|
Director |
|
March 17, 2015 |
|
|
John B. Spirtos |
|
|
|
|