Attached files
| file | filename |
|---|---|
| EX-23.2 - EX-23.2 - UNIVERSAL LOGISTICS HOLDINGS, INC. | d859727dex232.htm |
| EX-10.7 - EX-10.7 - UNIVERSAL LOGISTICS HOLDINGS, INC. | d859727dex107.htm |
| EX-32.1 - EX-32.1 - UNIVERSAL LOGISTICS HOLDINGS, INC. | d859727dex321.htm |
| EX-23.1 - EX-23.1 - UNIVERSAL LOGISTICS HOLDINGS, INC. | d859727dex231.htm |
| EX-31.2 - EX-31.2 - UNIVERSAL LOGISTICS HOLDINGS, INC. | d859727dex312.htm |
| EX-10.3 - EX-10.3 - UNIVERSAL LOGISTICS HOLDINGS, INC. | d859727dex103.htm |
| EX-31.1 - EX-31.1 - UNIVERSAL LOGISTICS HOLDINGS, INC. | d859727dex311.htm |
| EXCEL - IDEA: XBRL DOCUMENT - UNIVERSAL LOGISTICS HOLDINGS, INC. | Financial_Report.xls |
| EX-21.1 - EX-21.1 - UNIVERSAL LOGISTICS HOLDINGS, INC. | d859727dex211.htm |
Table of Contents
UNITED STATES
SECURITIES AND EXCHANGE COMMISSION
WASHINGTON, D.C. 20549
FORM 10-K
(Mark One)
| x | ANNUAL REPORT PURSUANT TO SECTION 13 OR 15(d) OF THE SECURITIES EXCHANGE ACT OF 1934 |
For the fiscal year ended December 31, 2014
OR
| ¨ | TRANSITION REPORT PURSUANT TO SECTION 13 OR 15(d) OF THE SECURITIES EXCHANGE ACT OF 1934 |
For the transition period from to .
Commission File Number: 0-51142
UNIVERSAL TRUCKLOAD SERVICES, INC.
(Exact Name of Registrant as Specified in Its Charter)
| Michigan | 38-3640097 | |
| (State or Other Jurisdiction of Incorporation or Organization) |
(I.R.S. Employer Identification No.) |
12755 E. Nine Mile Road
Warren, Michigan 48089
(Address, including Zip Code of Principal Executive Offices)
(586) 920-0100
(Registrant’s telephone number, including area code)
Securities registered pursuant to section 12(b) of the Act:
Common Stock, no par value
(TITLE OF CLASS)
Indicate by check mark if the registrant is a well-known seasoned issuer, as defined in Rule 405 of the Securities Act. Yes ¨ No x
Indicate by check mark if the registrant is not required to file reports pursuant to Section 13 or Section 15(d) of the Act. Yes ¨ No x
Indicate by check mark whether the registrant (1) has filed all reports required to be filed by Section 13 or 15(d) of the Securities Exchange Act of 1934 during the preceding 12 months (or for such shorter period that the registrant was required to file such reports), and (2) has been subject to such filing requirements for the past 90 days. Yes x No ¨
Indicate by checkmark whether the registrant has submitted electronically and posted on its corporate Website, if any, every Interactive Data File required to be submitted and posted pursuant to Rule 405 of Regulation S-T during the preceding 12 months (or for a shorter period that the registrant was required to submit and post such files). Yes x No ¨
Indicate by check mark if disclosure of delinquent filers pursuant to item 405 of Regulation S-K is not contained herein, and will not be contained, to the best of registrant’s knowledge, in definitive proxy or information statements incorporated by reference in Part III of this Form 10-K or any amendment to this Form 10-K. x
Indicate by check mark whether the registrant is a large accelerated filer, an accelerated filer, or a non-accelerated filer, or a smaller reporting company. See the definitions of “large accelerated filer”, “accelerated filer”, and “smaller reporting company” in Rule 12b-2 of the Exchange Act.
| Large Accelerated filer ¨ | Accelerated filer x | |
| Non-accelerated filer ¨ (Do not check if a smaller reporting company) | Smaller reporting company ¨ |
Indicate by check mark whether the registrant is a shell company (as defined in Exchange Act Rule 12b-2). Yes ¨ No x
As of June 28, 2014, the last business day of the registrant’s most recently completed second quarter, the aggregate market value of the registrant’s common stock held by non-affiliates of the registrant, based upon the closing sale price of the common stock on June 27, 2014, as reported by The Nasdaq Stock Market, was approximately $199.7 million (assuming, but not admitting for any purpose, that all directors and executive officers of the registrant are affiliates).
The number of shares of common stock, no par value, outstanding as of March 2, 2015, was 29,997,784.
DOCUMENTS INCORPORATED BY REFERENCE
Portions of the following document when filed, to the extent specified in this report, are incorporated by reference in Part III of this report:
| Document | Incorporated by reference in: | |
| Proxy Statement for 2015 Annual Meeting of Shareholders | Part III, Items 10 - 14 |
Table of Contents
UNIVERSAL TRUCKLOAD SERVICES, INC.
2014 ANNUAL REPORT ON FORM 10-K
Table of Contents
| EX-101.INS XBRL Instance Document |
||||
| EX-101.SCH XBRL Schema Document |
||||
| EX-101.CAL XBRL Calculation Linkbase Document |
||||
| EX-101.DEF XBRL Definition Linkbase Document |
||||
| EX-101.LAB XBRL Labels Linkbase Document |
||||
| EX-101.PRE XBRLPresentation Linkbase Document |
||||
Table of Contents
DISCLOSURE REGARDING FORWARD-LOOKING STATEMENTS
Some of the statements and assumptions in this Form 10-K are forward-looking statements. These statements identify prospective information. Important factors could cause actual results to differ, possibly materially, from those in the forward-looking statements. In some cases you can identify forward-looking statements by words such as “anticipate,” “believe,” “could,” “estimate,” “plan,” “intend,” “may,” “should,” “will” and “would” or other similar words. You should read statements that contain these words carefully because they discuss our future expectations, contain projections of our future results of operations or of our financial position, or state other “forward-looking” information. Forward-looking statements should not be read as a guarantee of future performance or results, and will not necessarily be accurate indications of the times at, or by which, such performance or results will be achieved. Forward-looking information is based on information available at the time and/or management’s good faith belief with respect to future events, and is subject to risks and uncertainties that could cause actual performance or results to differ materially from those expressed in the statements. The factors listed in the section captioned “Risk Factors” in Item 1A in this Form 10-K, as well as any other cautionary language contained in this Form 10-K, provide examples of risks, uncertainties and events that may cause our actual results to differ materially from the expectations we describe in our forward-looking statements.
Forward-looking statements speak only as of the date the statements are made. We assume no obligation to update forward-looking statements to reflect actual results, changes in assumptions or changes in other factors affecting forward-looking information except to the extent required by applicable securities laws. If we do update one or more forward-looking statements, no inference should be drawn that we will make additional updates with respect thereto or with respect to other forward-looking statements.
Unless the context indicates otherwise, “we,” “our”, “us” and “Universal” refers to Universal Truckload Services, Inc. and its subsidiaries.
Overview
Universal is a leading asset-light provider of customized transportation and logistics solutions throughout the United States, Mexico, Canada, and Colombia. We provide our customers with supply chain solutions that can be scaled to meet their changing demands and volumes. We offer our customers a broad array of services across their entire supply chain, including transportation, value-added, and intermodal services. Our customized solutions and flexible business model are designed to provide us with a highly variable cost structure.
Our transportation services include dry van, flatbed, heavy haul, dedicated, refrigerated, shuttle and switching operations as well as full service domestic and international freight forwarding, customs brokerage, final mile and ground expedite. We offer our customers brokerage transportation for greater service options and additional capacity. Our value-added services, which are typically dedicated to individual customer requirements, include material handling, consolidation, sequencing, sub-assembly, cross-dock services, kitting, repacking, warehousing and returnable container management. Intermodal operations include rail-truck, steamship-truck and support services.
Effective on December 31, 2014, we executed a plan to reduce the number of our subsidiaries, re-naming and re-branding our principal surviving operating subsidiaries to emphasize the first word in the Company’s name, Universal. The organizational streamlining plan included the statutory merger of certain subsidiaries, along with the transfer of certain business units between subsidiaries. The plan was undertaken to enhance marketing and customer attraction efforts, while reducing legal entity accounting, tax and regulatory compliance requirements and enhancing internal administrative effectiveness.
3
Table of Contents
In October 2012, we acquired LINC Logistics Company (“LINC”) whereby each outstanding share of LINC common stock was converted into the right to receive consideration consisting of 0.700 of a share of common stock of Universal and cash in lieu of fractional shares. This resulted in the issuance of 14,527,332 shares of Universal’s common stock and borrowings of approximately $149.1 million to repay LINC’s outstanding indebtedness and dividends payable. Universal and LINC were under common control, and as such, the financial statements of Universal have been retrospectively revised to reflect the accounts of LINC as if they had been consolidated for all previous periods. The acquisition significantly enhanced the company’s position as a leading provider of third party transportation, value-added and intermodal services.
In December 2013, we acquired Westport USA Holding, LLC (“Westport”) for $123.0 million in cash, subject to a working capital adjustment after closing. Pursuant to the terms of the Unit Purchase Agreement, Westport was acquired on a cash-free, debt-free basis. Based in Louisville, Kentucky, Westport provides value-added warehousing and component distribution services to U.S. manufacturers of Class 4-8 trucks, RVs and super-duty trucks. Westport also machines and distributes steering knuckles and axle components for the automotive industry.
We provide a comprehensive suite of transportation and logistics solutions that allow our customers and clients to reduce costs and manage their global supply chains more efficiently. We market our services through a direct sales and marketing network focused on selling our portfolio of transportation logistic services to large customers in specific industry sectors, through a network of agents who solicit freight business directly from shippers, and through company-managed facilities and full service freight forwarding and customs house brokerage offices. At December 31, 2014, we had an agent network totaling approximately 388 agents, and we operated 53 company-managed terminal locations and provided services at 45 logistics locations throughout the United States, Mexico and Canada.
We generate substantially all of our revenues through fees charged to customers for the transportation of freight and for the customized logistics services we provide. We also derive revenue from fuel surcharges, where separately identifiable, loading and unloading activities, equipment detention, container management and storage and other related services. Operations aggregated in our transportation segment are associated with individual freight shipments coordinated by our agents, company-managed terminals and specialized services operations. In contrast, operations aggregated in our logistics segment deliver value-added services and transportation services to specific customers on a dedicated basis, generally pursuant to contract terms of one year or longer. Our segments are distinguished by the amount of forward visibility we have in regards to pricing and volumes, and also by the extent to which we dedicate resources and company-owned equipment. For more information on our segment reporting, see Part II, Item 8: Note 17 to the Consolidated Financial Statements.
We were incorporated in Michigan on December 11, 2001. Our common stock began trading on the NASDAQ Global Select Market under the symbol “UACL” on February 11, 2005, the date of our initial public offering. Our principal executive offices are located at 12755 E. Nine Mile Road, Warren, Michigan 48089. Our website address is www.goutsi.com. The information contained on, or accessible through, our website is not a part of this Form 10-K.
Industry
The transportation and logistics services industry involves the management and transportation of materials and inventory throughout the supply chain. The logistics industry is an integral part of the global economy. Global logistics costs in 2013 totaled $8.6 trillion, or 11.6% of global GDP, according to estimates by Armstrong & Associates.
According to the American Trucking Associations, or ATA, revenue in the trucking industry in 2013 was estimated at approximately $681.7 billion and accounted for more than 81% of domestic spending on freight transportation. The trucking industry is highly competitive on the basis of service and price and is integral to
4
Table of Contents
many industries operating in the United States. Customers generally choose truck transportation over other surface transportation modes due to the industry’s higher levels of reliability, shipment integrity and speed.
As supply chains have become more complex, many companies have outsourced logistics functions to third-party logistics (3PL) providers. U.S. 3PL revenues in 2013 totaled $146.4 billion, according to Armstrong & Associates. Through outsourcing, companies can realize the following benefits: reduced supply chain costs, minimization of investment in non-core assets, increased operational flexibility, access to greater visibility in the supply chain and improved customer service. We believe that increased globalization of trade, security and regulatory concerns, demand for greater supply chain integration and visibility, and ongoing competitive pressures to reduce costs and improve customer service will continue to drive outsourcing decisions.
3PL providers deliver a number of services such as transportation, warehousing, supply chain management, inbound and outbound freight management, customs brokerage and distribution. In addition, 3PLs can provide other value-added services, ranging from packing and labeling to sequencing and sub-assembly, freight tracking and delivery, and ultimately, to fully embedded systems linked to customer enterprise resource planning suites that facilitate supply chain management. These services are aimed at improving supply chain efficiency and visibility, and differentiate 3PLs from transportation companies and basic warehousing operations.
We believe outsourcing of transportation and logistics services will continue to grow, including common outsourced logistics activities such as transportation, customs clearance, warehousing, shipment consolidation and freight forwarding. We also believe that companies will increasingly seek outsourced solutions for additional value-added logistics activities such as sub-assembly, sequencing, packaging, consolidation and deconsolidation and line-side inventory functions, creating attractive growth opportunities. As a result, we believe that larger, better-capitalized companies will have greater opportunities to gain market share and increase profit margins.
Our Operations
We broadly group our services into the following three service categories: transportation, value-added and intermodal support.
| • | Transportation. Transportation services represented approximately $769.3 million, or 64.6%, of our operating revenues in 2014. We transport a wide variety of general commodities, including automotive parts, machinery, building materials, paper, food, consumer goods, furniture, steel and other metals on behalf of customers in various industries. We use a variety of general use and specialized trailer types. Our transportation services are provided through a network of both union and non-union employee drivers, owner-operators, contract drivers, and third-party transportation providers. We broker freight to third party transportation providers to complement our available capacity. Our transportation services also include full service international freight forwarding, customs house brokerage services, and final mile and ground expedite services, which we refer to collectively as specialized services. |
| • | Value-added. Value-added services represented approximately $284.5 million, or 23.9%, of our operating revenues in 2014. We operate, manage or provide transportation services at 45 logistics locations in the United States, Mexico and Canada. Our facilities and services are often directly integrated into the production processes of our customers and represent a critical piece of their supply chains. Fifteen facilities are located inside customer plants or distribution operations; the other facilities are generally located close to our customers’ plants to optimize the efficiency of their component supply chains and production process. Our proprietary information technology platform is integrated with our customers’ and their vendors’ information technology networks, allowing real-time, end-to-end supply chain visibility. As a result of our close integration with our customers, most of our value-added services are contracted for the duration of our customers’ production programs, which typically last three to five years. |
5
Table of Contents
| • | Intermodal support. Intermodal support services represented $137.7 million, or 11.6%, of our operating revenues in 2014. Our intermodal support services are primarily short-to-medium distance delivery of rail and steamship containers between the railhead or port and the customer and drayage services. |
Our agreements with customers typically follow one of two patterns: transactional or contractual. Transactional agreements are associated with individual freight shipments coordinated by our agents, company-managed terminals and specialized services operations. For the years ended December 31, 2014 and 2013, transactional arrangements generated 66.2% and 68.3%, respectively, of total revenues. Contractual agreements comprise the balance of our revenues and are for the delivery of value-added services or transportation services that are on an exclusive basis. The pricing structure of value-added services contracts, which often are three to five years in duration, compensate for the physical resources and labor that support material handling, sequencing, sub-assembly and various other value-added processes, including both variable-cost and fixed-price components. Contract-based transportation services relate to dedicated truckload services and typically have a contract term of one year. Contracts are priced as if we are paid on a round-trip basis, eliminating the need for us to acquire customers with freight moving in opposing lanes in order to maintain utilization of our equipment. Transportation and intermodal services revenue is primarily derived from fees charged based on miles, but also includes billing for fuel surcharges, loading and unloading activities, container management and other related services. Fuel surcharges, where separately identifiable, comprise $119.7 million and $118.6 million of our total operating revenues in 2014 and 2013, respectively. Fees charged to customers by our full service international freight forwarding and customs house brokerage are based on the specific means of forwarding or delivering freight on a shipment-by-shipment basis.
Asset Light Strategy
We employ an asset-light business model that lowers our capital expenditure requirements and which we believe improves investment returns and cash flow generation. In general, our facilities used in our value-added services are leased on terms that are either substantially matched to our customers’ contracts or are month-to-month or are provided to us by our customers. We also utilize owner-operators and third-party carriers to provide a significant portion of our transportation and specialized services. Approximately 80% of the tractors and 38% of the trailers used in our business are provided by our owner-operators. In addition, our use of agents reduces our need for sizable terminals. The primary physical assets we provide include a portion of our trailer fleet, our intermodal depot facilities, subassembly and warehousing equipment, our headquarters facility and our management information systems.
We believe our asset-light business model is highly scalable and will continue to support our growth with comparatively modest capital expenditure requirements. Our asset-light model, combined with a disciplined approach to contract structuring and pricing, creates a highly flexible cost structure that allows us to expand and contract quickly in response to changes in demand from our customers. We believe that our business model offers the following advantages compared with primarily asset-based companies that own significant facilities and tractor fleets and use fixed employee sales and work forces:
| • | Variable cost structure. We pay our agents and owner-operators a percentage of the revenue they generate, which gives us flexibility to quickly adjust to increases or decreases in customer demand. Substantially all of our operating facilities are either provided to us by customers, leased by us on a month-to-month basis, or leased by us on terms that match the related customer contracts to the greatest extent possible. This approach reduces our investment in fixed assets and enhances our operating flexibility. Additionally, our balanced labor structure, including union, non-union, and contract labor pools, allows us to provide customized and cost-effective solutions that accommodate our customers’ labor strategies. Having a high proportion of variable costs reduces our risks of making fixed payments on under-utilized facilities, equipment and personnel and minimizes our exposure to fluctuating equipment values. |
6
Table of Contents
| • | Targeted capital expenditures. Limiting our investment in facilities, tractors and trailers or, alternatively, recovering investment costs through customer contracts, reduces our capital needs and allows us to grow organically with relatively modest capital investment. This allows us to devote our financial resources to fund our expansion strategy, including acquisitions. As a percentage of operating revenues, our capital expenditures were 5.0%, 1.6% and 2.9%, during each of the years ending December 31, 2014, 2013 and 2012, respectively. |
| • | Higher financial returns. Given similar operating performance, we believe that our low fixed costs and modest capital expenditure requirements will generate returns on investment that equal or exceed many of our asset-based competitors. We manage our business with a view toward enhancing these returns. |
| • | Entrepreneurial spirit. Our agents and owner-operators are business owners who are compensated based on the revenue they produce. We believe this portion of our model gives our agents a strong incentive to seek new revenue opportunities. |
Although we believe our asset-light business model can generate above-average financial performance, there are certain disadvantages. Our significant use of owner-operators limits the pool of potential drivers and could constrain our growth. In addition, our variable cost structure does not allow us to take advantage of freight cycles to the extent possible with fixed investments in capacity. Thus, in times of high economic activity and increasing freight rates, our profitability may not expand as much as that of an asset-based carrier. Overall, however, we believe our extensive experience with this business model and our growth, profitability, and financial returns demonstrate that we have adequately managed these risks.
Growth Strategy
We believe that our flexible business model offers substantial opportunities to grow. By continuing to implement our strategy, we believe that we can continue to increase our revenues and profitability, while generating a higher return on assets than many of our asset-based competitors. The key elements of our strategy are as follows:
| • | Expand our network of agents and owner-operators. Increasing the number of agents and owner-operators has been a driver of our historical growth in transactional transportation services. We intend to continue to recruit qualified agents and owner-operators in order to penetrate new markets and expand our operations in existing markets. Our agents typically focus on a small number of shippers in a particular market and are attuned to the specific transportation needs of that core group of shippers, while remaining alert to growth opportunities. With their detailed knowledge of local trucking markets, our agents serve as a platform for recruiting additional owner-operators. In addition, we believe that the current environment of increasing costs and industry consolidation has created substantial uncertainty for agents, owner-operators and shippers. This uncertainty has led to a desire within these constituencies to associate themselves with a stable company that has an established market presence, and we have successfully converted small independent trucking companies into agents and owner-operators. In addition, we intend to supplement our growth through the expansion of company managed terminals. |
| • | Continue to capitalize on strong industry fundamentals and outsourcing trends in the U.S. 3PL market. According to Armstrong & Associates, gross revenue for the U.S. 3PL market grew at a compound annual rate of 9.6% since 1996 to $146.4 billion in 2013. We believe long-term industry growth will be supported by manufacturers seeking to outsource non-core logistics functions to cost-effective third-party providers that can efficiently manage increasingly complex global supply chains. We intend to leverage our integrated suite of transportation and logistics services, our network of facilities in the United States, Mexico and Canada, our long-term customer relationships, and our reputation for operational excellence to capitalize on favorable industry fundamentals and growth expectations. |
| • | Target further penetration of key customers in the North American automotive industry. The automotive industry is one of the largest users of global outsourced logistics services, providing us growth opportunities with both existing and new customers. In 2014, this sector comprised |
7
Table of Contents
| approximately 28% of our operating revenues. We intend to capitalize on anticipated continued growth in outsourcing of higher value logistics services in the automotive sector such as sub-assembly and sequencing, which link directly into production lines and require specialized capabilities, technological expertise and strict quality controls. We believe we are well positioned to capitalize on this increased outsourcing activity as a result of our extensive experience and enduring customer relationships. We regularly pursue opportunities to further penetrate our core automotive customer base by leveraging our position in the supply chains of our Original Equipment Manufacturer (OEM) customers to extend our services to their suppliers and by cross-selling a wide range of transportation and specialized services to existing customers. For instance, these opportunities occur where we provide sequencing services from our facility to an OEM. Typically, our facility is located within five miles of the OEM’s plant. If the OEM requires its suppliers, which are often hundreds of miles away, to keep inventory near the plant and deliver small quantities of materials or goods several times a day, the suppliers may engage us to perform those services. This cross-selling of services has led to multiple vendor managed inventory contracts with the OEM’s suppliers. We are also targeting and expect to increase delivery of services to Tier I automotive component suppliers and foreign-owned automotive manufacturers operating in North America. We also expect to capitalize on opportunities to cross-sell additional logistics services to existing customers. |
| • | Continue to expand penetration in other vertical markets. We have provided highly complex value-added logistics services to automotive and other industrial customers for more than 20 years. We have developed standardized, modular systems for material handling processes and have extensive experience in rapid implementation and workforce training. These capabilities and our broad portfolio of logistics services are transferable across vertical markets. In recent years, we have successfully targeted other end-markets where we believe we can leverage the expertise we initially developed in the automotive sector. In addition to automotive, our targeted industries include aerospace, energy, government services, healthcare, industrial retail, consumer goods, and steel and metals. We believe our ability to provide a broad range of services in key markets in the U.S. and internationally provides us with additional growth platforms and cross-selling opportunities. |
| • | Expand our logistics services capabilities and geographical reach. We intend to continue to expand our portfolio of services in response to customer demands for greater innovation and responsiveness from their logistics providers. We will also continue to pursue high growth sectors within our specialized transportation services, such as expedited ground transportation and international freight forwarding. In addition, we intend to increase penetration of our services into other regions of the United States and in international markets, primarily in Mexico. |
| • | Expand our intermodal support services. We intend to continue to grow our intermodal support services by expanding our service offerings, acquiring or renting additional intermodal facilities and expanding our network of intermodal agents. We will evaluate future intermodal facility sites based on regional and international shipping volumes and market saturation. We currently operate 11 full service container yards located in the mid-western and south-western United States and own over 1,800 chassis and containers. Our facilities provide container and chassis inventory systems, full service repair facilities, and overhead lift capabilities. We believe that providing container and chassis management as well as bonded customs services will allow us the opportunity to provide additional services for our customers. |
| • | Continue to invest in technological advances to meet customer requirements. With continued outsourcing of supply chain activities, customers are requiring greater advances in information technology to support increasingly complex logistics solutions. We intend to continue to improve our proprietary IT system and expand the technology component of our service portfolio through a combination of internally and externally developed software. We believe that these ongoing technology investments will enhance the differentiation of our services relative to competing providers. |
| • | Grow our brokerage operations. We encourage our agents to generate shipping contracts above the levels that can be accommodated by our owner-operators and provide the training and management |
8
Table of Contents
| information systems that enable our agents to broker these contracts to third party carriers. We intend to continue to grow our brokerage business both through our agent network and through our company managed brokerage operations. |
| • | Make strategic acquisitions. The transportation and logistics industry is highly fragmented, with hundreds of small and mid-sized competitors that are either specialized in specific vertical markets, specific service offerings, or limited to local and regional coverage. In the near term we expect to focus on organic growth; however, we will continue to selectively evaluate and pursue acquisitions that will enhance our service capabilities, expand our geographic network and/or diversify our customer base. |
Customers
We provide a comprehensive suite of transportation and logistics services to a wide variety of customers throughout the United States, Mexico, Canada, and Colombia, including a number of Fortune 500 and multi-national companies across a wide range of industries. Our customers are largely concentrated in the automotive, steel, oil and gas, alternative energy, and manufacturing industries geographically located throughout the United States. A significant portion of our revenue also results from our providing capacity to other transportation companies who aggregate loads from a variety of shippers in these and other industries. Many of our customers are large or middle-market corporations engaged in the design, manufacture and sale of higher value-added products that involve long or complex in-bound supply chains or aftermarket distribution networks. We develop and deliver customized, customer-centric supply chain solutions from a broad portfolio of services, creating additional value for customers seeking a single point of contact for logistics solutions. A significant portion of our revenues are derived from the domestic auto industry. During the fiscal years ended December 31, 2014, 2013 and 2012, aggregate sales in the automotive industry totaled 28.4%, 33.8% and 30.7% of revenue, respectively. During 2014, General Motors accounted for approximately 9.7% of our total operating revenues and sales to our top 10 customers, including General Motors, totaled 36.1%.
Contract Management
We use a standard, company-wide contract approval process to evaluate, develop and price contracts for new logistics opportunities. This mandatory process includes an evaluation of pricing, financial return and risk assessment, and is led by our senior management team. Each new major contract opportunity can go through six distinct steps before a customer contract is executed and a new project launched: (1) inquiry, (2) entry into an automated project tracking system, (3) initial project review, (4) executive summary, (5) bid phase, and (6) negotiation and agreement. In our value-added services and transportation businesses, formal management sign-off must be obtained before negotiations are finalized, regardless of contract size.
Our largest customers typically award business at the conclusion of a competitive bidding process. During the bid phase of a prospective new business award, we assess the financial returns and potential risks inherent in a new project, as well as anticipated capital expenditure requirements and fit with our strategic goals. In our transportation services and a portion of our value-added services business, we price services and invoice customers based on levels of activity, which results in variable revenues based on actual demand. In our intermodal business, contracts are transactional in nature, and the resulting revenues are variable based on the level of overall freight hauling activity.
A significant number of our value-added services contracts include a fixed price component that produces a stable revenue stream regardless of the volume of a customer’s supply chain activity. This pricing structure helps maintain the profitability of an operation and mitigates exposure to fixed facility and management costs, even when customer demand is volatile. Consideration is also given to the management of potential exposure to the early termination of a multi-year agreement, where our negotiating objective is to establish some recourse to mitigate exposure to uncompensated costs. In contrast, transportation services contracts primarily stipulate charges based on the number of miles driven to complete freight delivery, but may also include billing for fuel
9
Table of Contents
surcharges, loading and unloading activities and related services. Fees charged to customers by our intermodal operations are dictated by the specific mode of transportation chosen to forward or deliver freight on a shipment-by-shipment basis.
Through the life of a contract, we monitor our customers’ operating requirements and demand levels, and we review our revenue generation and operating profitability by operation to ensure that financial results meet the volume and margin targets established over the life of a new program at launch.
Independent Contractor Network
We utilize a network of agents and owner-operators located throughout the United States and in the Canadian provinces of Ontario and Quebec. These agents and owner-operators are independent contractors who earn a fixed commission calculated as a percentage of the revenue they generate.
Agents
A significant portion of the interaction with our shippers is provided by our agents. Over 50% of the freight we hauled in 2014 was solicited and controlled by our agents, with the balance generated by company-managed terminals and full service freight forwarding and customs house brokerage offices. Agents accounted for approximately 38% of our total operating revenues, and our top 100 agents in 2014 generated approximately 32% of our annual operating revenues. Of our approximately 388 agents, 288 generated more than $100,000 of operating revenues and 125 generated more than $1.0 million of operating revenues in 2014. Our agents typically focus on three or four shippers within a particular market and solicit most of their freight business from this core group. By focusing on a relatively small number of shippers, each agent is attuned to the specific transportation needs of that core group of shippers, while remaining alert to growth opportunities.
While the agents’ most important function is to generate freight shipments, they also provide valuable terminal and dispatch services for our owner-operators and they can be a source for recruitment of new owner-operators. Our agents use a company-provided software program to list available freight procured by the agents, dispatch owner-operators to haul the freight and provide all administrative information necessary for us to establish the credit arrangements for each shipper. Our agents do not have the authority to execute or fulfill shipping contracts on their own, as all shipping contracts are between one of our operating subsidiaries and the shipper directly, and we generally assume the liability for freight loss or damages.
We believe that our commission schedule, prompt payment practices, industry reputation, financial stability, back-office support and national freight network are attractive to agents. We generally pay our full-service agents a commission of approximately 8% of revenue generated, excluding fuel surcharges. While we have signed agreements with most of our newer agents, we rely on verbal agreements with most of our long-term agents. We believe that very few of our agents work exclusively with us. The loss of any large-volume agent or a significant decrease in volume from one of these agents could have a materially adverse effect on our results of operations.
Owner-Operators
Owner-operators are individuals who own, operate and maintain one or more tractors for which they either provide drivers or drive themselves. Our owner-operators provide us with approximately 3,300 tractors, which represent 80% of the tractors used in our transportation services business. Owner-operators also may own trailers that they provide to us in addition to their tractor and driving services. Our owner-operators provide approximately 1,675 trailers, which represent approximately 38% of the trailers we use in our business. Owner-operators are responsible for all expenses of owning and operating their equipment, including the wages and benefits paid to any drivers, fuel, physical damage insurance, maintenance, fuel taxes, highway use taxes and debt service.
10
Table of Contents
We believe that our commission schedule, prompt payment practices, financial stability, back-office support and national freight network are attractive to owner-operators. We generally pay our owner-operators 75% of the revenue generated from the freight they haul, if both a tractor and trailer are provided, and pass on 100% of any fuel surcharges we receive and a portion of other accessorial charges to our owner-operators. All owner-operators enter into standard written contracts with one of our operating subsidiaries that can be terminated by either party on short notice.
Pursuant to our arrangements with the owner-operators, we maintain the federal and state licensing required for them to operate a motor coach carrier. We also coordinate insurance coverage for the owner-operators and are primarily liable to the shipper for damaged or lost freight and to third parties for personal injury claims arising out of accidents involving the owner-operators. We also administer the owner-operators’ compliance with safety, vehicle licensing and fuel-tax reporting rules. Each owner-operator must meet our guidelines with respect to matters such as motor vehicle records, or MVR’s, insurance, driving experience and past work history and must pass a federally mandated physical exam. Additionally, our owner-operators and their employees are subject to pre-lease drug and alcohol screening and to subsequent random testing.
Revenue Equipment
We offer our customers a wide range of transportation services by utilizing a diverse fleet of tractors and trailing equipment including company-owned equipment, equipment provided by owner-operators, and leased equipment. The following table represents our Company-operated fleet and owner-operator pool used to provide transportation services as of December 31, 2014:
| Type of Equipment |
Company- owned or Leased |
Owner- Operator Provided |
Total | |||||||||
| Tractors |
992 | 3,333 | 4,325 | |||||||||
| Yard Tractors |
83 | — | 83 | |||||||||
| Trailers |
4,614 | 1,677 | 6,291 | |||||||||
| Chassis |
954 | — | 954 | |||||||||
| Containers |
800 | — | 800 | |||||||||
Employees
As of December 31, 2014, we employed 4,218 people in the United States, Mexico and Canada. During the year ended December 31, 2014, we also engaged, on average, the full-time equivalency of 1,528 people on a contract basis.
As of December 31, 2014, approximately 1,512 of our employees were members of unions and subject to collective bargaining agreements of which approximately 20% are subject to contracts that expire in 2015. Certain of our customers require that our employees are union members at specific locations. Currently, we have 12 collective bargaining agreements with four unions, including the United Auto Workers, the International Brotherhood of Teamsters, the Canadian Auto Workers, and the Mexican Confederation of Workers. Substantially all of our unionized facilities in the United States have a separate agreement with the union that represents workers at such facilities, with each such agreement having an expiration date that is independent of other collective bargaining agreements. In general, we have not experienced a material work stoppage, slow-down or strike, and we believe our relationship with our employees is good. We provide 401(k) retirement savings programs for our workers. Other than a program for 9 Canadian employees, we do not offer any defined benefit pension programs.
Facilities
Our corporate headquarters and administrative offices are located in Warren, Michigan. We own our corporate administrative offices, as well as terminal yards and other properties in the following locations: Dearborn,
11
Table of Contents
Michigan; Louisville, Kentucky; Columbus, Ohio; Reading, Ohio; Latty, Ohio; Cleveland, Ohio; Gary, Indiana; Dallas, Texas; South Kearny, New Jersey; Rural Hall, North Carolina; Garden City, Georgia; Millwood, West Virginia; Memphis, Tennessee; and Albany, Missouri, offices in Tampa, Florida; Houston, Texas and a condominium in Monroeville, Pennsylvania. As of December 31, 2014, we leased 83 operating, terminal and yard, and administrative facilities in various U.S. cities located in 29 states, in Milton, Ontario; London, Ontario; Windsor; Ontario, and in San Luis Potosí, Mexico. We also deliver services inside or linked to 17 facilities provided by customers. To support our asset-light business model, we generally try to coordinate the length of real estate leases associated with our value-added services with the end date of the related customer contract associated with such facility, or use month-to-month leases, in order to mitigate exposure to unrecovered lease costs.
Certain of our leased facilities are leased from affiliates controlled by our majority shareholders. These facilities are leased on either a month-to-month basis or extended terms. For more information on these arrangements, see Part II, Item 8: Note 8 to the Consolidated Financial Statements. We believe that the properties we lease from these affiliates are, in the aggregate, leased at market rates and are suitable for their purposes and adequate to meet our needs.
Insurance
We provide group medical and dental insurance benefits to a substantial portion of our employees and we purchase insurance to cover the entire portion of such risks and maintain no deductible under the purchased insurance policies. In view of historical inflation that has affected the cost of group health insurance in the United States, we generally expect such costs to continue to increase in the future, despite recently enacted federal legislation, and we expect to attempt to offset such cost increases through a combination of price increases to our customers and additional cost-sharing with our employees.
We purchase insurance for workers’ compensation claims up to the statutory limits required by the respective states in which we operate, and as required by employment laws in Mexico and Canada. We believe our insurance coverage for such risks is comparable in terms of coverage and amount to other companies in our industry, and the absence of deductibles on our automobile and workers’ compensation insurance policies improves predictability in our costs.
Our customers and federal regulations generally require that we provide insurance for auto liability and general liability claims up to $1.0 million per occurrence. Accordingly, in the United States, we purchase such insurance from a licensed casualty insurance carrier providing a minimum $1.0 million of coverage for individual auto liability and general liability claims. The carrier is a related party. We are self-insured for auto and general liability claims above $1.0 million unless riders are sought to satisfy individual customer or vendor contract requirements. A liability is recognized for the estimated cost of all self-insured claims and for claims expected to exceed our policy limit, based on our knowledge of the facts and, in certain cases, opinions of outside counsel, including estimates of incurred but not reported claims based on historical experience. These financial reserves are periodically evaluated and adjusted to reflect estimated exposures related to our open auto liability and general liability claims. In Mexico, our operations and investment in equipment are insured through an internationally recognized third-party insurance underwriter.
Unless required by specific customer contracts, we typically self-insure for the risk of motor cargo liability claims associated with transportation service and for material handling claims resulting from our warehouse-based, value-added services operations. Accordingly, we establish financial reserves for anticipated losses and expenses related to motor cargo liability and material handling claims, and such reserves are periodically evaluated and adjusted to reflect our experience.
To reduce our exposure to non-trucking use liability claims (claims incurred while the vehicle is being operated without a trailer attached or is being operated with an attached trailer which does not contain or carry any cargo),
12
Table of Contents
we require our owner-operators to maintain non-trucking use liability coverage, which we refer to as deadhead bobtail coverage, of $2.0 million per occurrence.
In brokerage arrangements, our exposure to liability associated with accidents incurred by other third-party carriers, who haul freight on our behalf, is reduced by various factors, including the extent to which the third party providers maintain their own insurance coverage.
Insurance carriers have been raising premiums in recent years, including to transportation and logistics services companies. As a result, our future insurance costs could increase as a result of higher premiums, which could necessitate that we reduce our insurance coverage by assuming additional levels of risk with assumption of policy deductibles when our policies are renewed. We believe the ability of our labor relations group, together with our safety and loss prevention programs, will continue to help us manage our group benefit, casualty insurance, and motor cargo liability and material handling claims costs.
Corporate Services
We oversee most administrative functions related to our operations at our corporate headquarters in Warren, Michigan. The administrative functions undertaken at our corporate headquarters are primarily focused on providing support to our agents and operating subsidiaries, such as creating work instructions for various operations at each facility, supervising strategic planning, accounting, billing and collections functions, contractor settlements, purchasing, coordinating the management information systems used by our various facilities, and performing compliance, licensing, safety and risk management functions. We also provide support to various operating subsidiaries using sophisticated, site-specific material management systems and vehicle tracking systems.
Information Technology
The advanced functionality of our proprietary and third-party information technology platform is a critical component of our broad service offering and exceptional customer service, including our ability to provide real-time responses to quality issues. Our multifaceted software tools and hardware platforms support seamless integration with the IT networks of our customers and vendors via electronic data exchange systems, thereby enhancing our relationships and our ability to effectively communicate with our customers and vendors. Our tools and platforms provide real-time, web-based visibility into the supply chain of our customers.
Our, proprietary Warehouse Management System (WMS) is customized to meet the needs of individual customers. It provides the ability to send our customers an advance shipping notice through a simple, web-based interface that can be used by a broad variety of vendors. Once a product is received at our warehouse, labels are scanned, validated against the original data the vendor entered into the web-based interface, and placed into inventory. An electronic material release instruction from the customer draws the product from the inventory and creates a bill of lading, and a wireless scan of the product into a specific trailer automatically decreases stock level. This enables the company to clearly identify and communicate to the customer any vendor-related problems that may cause delays to the production line.
Our cross-dock and container return management applications automate the cycle of material receipt and empty container return. Vendor material is received at our dock via established transportation “milk runs,” wirelessly scanned at each step of the cross-dock process, and delivered into the customer facility for a “just-in-time” installation. At this point in the workflow, a previously delivered batch of containers (now empty) are recovered, processed and returned to the cross-dock for ultimate return to the original vendor.
Our proprietary and third-party transportation management system allows full operational control and visibility from dispatch to delivery, and from invoicing to receivables collections. For our employee drivers, the system provides automated dispatch to hand-held devices, satellite tracking for quality control and electronic status
13
Table of Contents
broadcasts to customers when requested. Our international and domestic air freight and ocean forwarding services use similar systems with added functionalities for managing air and ocean freight transportation requirements. Regulatory requirements for national security compliance are built into our system. All of the above systems have customer-oriented web interfaces that allow for full shipment tracking and visibility, as well as for customer shipment input. We also provide systems that allow agents to list pending freight shipments and owner-operators with available capacity, and track particular shipments at various points in the shipping route.
The network supporting these tools is built upon multiple layers of redundancy to ensure continuous, uninterrupted freight movement and handling operations. All time-sensitive operations have redundant data circuits, dual servers with data backup, battery backup devices to support all network equipment, and generators to support long-term outages. We believe that these tools improve our services and quality controls, strengthen our relationships with our customers, and enhance our value proposition. We rely on the proper operation of our management information systems. Any significant disruption or failure of these systems could have a materially adverse effect on our operations and financial results.
Competitive Environment
The transportation and logistics service industry is highly competitive and extremely fragmented. We compete based on quality and reliability of service, price, breadth of logistics solution, and IT capabilities. We believe that the companies best positioned to succeed in our industry must be able to provide their customers with integrated supply chain solutions that are international in scope and scale. We compete with asset and non-asset based truckload and less-than-truckload carriers, intermodal transportation, logistics providers and, in some aspects of our business, railroads. We also compete with other motor carriers for owner-operators and agents.
Our customers may choose not to outsource their logistics operations and, rather, to retain or restore such activities as their own, internal operations. In our largest vertical market, the automotive industry, we compete more frequently with a relatively small number of privately-owned firms or with subsidiaries of large public companies. These vendors have the scope and capabilities to provide the breadth of services required by the large and complex supply chains of automotive original equipment manufacturers.
We also encounter competition from regional and local third-party logistics providers, integrated transportation companies that operate their own aircraft, cargo sales agents and brokers, surface freight forwarders and carriers, airlines, associations of shippers organized to consolidate their members’ shipments to obtain lower freight rates, and internet-based freight exchanges. In addition, computer information and consulting firms, which traditionally operated outside of the supply chain management industry, have been expanding the scope of their services to include supply chain related activities. We believe it is becoming increasingly difficult for smaller or regional competitors or providers with a more limited service solutions or information technology offering to compete, which we expect to result in further industry consolidation.
Government Regulation
Our operations are regulated and licensed by various U.S. federal and state agencies, as well as comparable agencies in Mexico, Canada, and Colombia. Interstate motor carrier operations are subject to the broad regulatory powers, to include safety and insurance requirements, prescribed by the Federal Motor Carrier Safety Administration (FMCSA), which is an agency of the U.S. Department of Transportation (DOT). Such matters as weight and equipment dimensions also are subject to United States federal and state regulation. We operate in the United States, throughout the regions we serve, under operating authority granted by the DOT. We are also subject to regulations relating to testing and specifications of transportation equipment and product handling requirements. In addition, our drivers and owner-operators must have a commercial driver’s license and comply with safety and fitness regulations promulgated by the FMCSA, including those relating to drug and alcohol testing.
14
Table of Contents
In December 2011, the FMCSA published new final hours-of-service (HOS) rules, which they believe comply with a court-imposed settlement agreement, allowing commercial motor carrier drivers to continue to drive up to 11 hours within a 14-hour workday and mandate at least 10 consecutive off-duty hours between workdays. The rules also allow drivers to continue to restart their calculations of weekly on-duty time limits after having at least 34 consecutive hours off-duty. The rules include changes to the definition of “on-duty” time in a parked vehicle, and a second set of changes effective July 2013 include (1) requiring a driver to take a 30 minute “off-duty” break within the first eight hours of driving and (2) limiting a driver “restart” to once a week. Advocacy groups continue to challenge HOS regulations. The Company believes the FMCSA also still favors a 10-hour driving limit, which would yield a loss of 1-hour of service from current standards.
In December 2010, the FMCSA also initiated its Compliance Safety Accountability (CSA) initiative (formerly Comprehensive Safety Analysis 2010). The CSA system fundamentally changes the safety evaluation process for all motor carriers and includes a scope of enforcement to the driver level to make driver safety performance history more transparent to law enforcement and motor carriers. There is a rulemaking due to be published July 2015 that will propose setting standards for rating motor carriers based on these CSA scores alone unlike the previous process that required an onsite audit to rate the motor carrier for continued operation.
We are also preparing for an anticipated change in the manner in which commercial drivers will be required to document their HOS. In April 2010, the FMCSA published a regulation that would require interstate carriers, with documented patterns of HOS violations, to install electronic on-board recorders (EOBR) in their vehicles. EOBRs are devices attached to a vehicle that automatically record the number of hours a driver spends operating the vehicle. The current system is a manual log system. The ruling was challenged in Federal Court and was withdrawn by FMSCA, as the ruling did not protect drivers from possible harassment from the carrier. The FMCSA is working on a new proposed rulemaking to mandate the use of Electronic Log Devices (ELDs) in most motor vehicles governed by FMCSA regulations. This rulemaking is due to be published in November 2015, and will allow for input from all transportation stakeholders and should have implementation projected for some time in 2017.
Additionally, a change in liability insurance requirements is being proposed from the current federal standard of $750,000 to a new standard of $2 million.
Our international operations, which include facilities in Mexico, Canada and Colombia and transportation shipments managed by our specialized service operations, are impacted by a wide variety of U.S. government regulations and applicable international treaties. These include regulations of the U.S. Department of State, U.S. Department of Commerce, and the U.S. Department of Treasury. Regulations cover specific commodities, destinations and end-users. A certain portion of our specialized services operations is engaged in the arrangement of imported and exported freight. As such, we are subject to U.S. Customs regulations, which include significant notice and registration requirements. In various Canadian provinces, we operate transportation services under authority granted by the Ministries of Transportation and Communications.
Transportation-related regulations are greatly affected by U.S. national security legislation and related regulations. We believe we are in substantial compliance with applicable material regulations and that the costs of regulatory compliance are an ordinary operating cost of our business.
Environmental
We are subject to various environmental laws and regulations applicable to the transportation industry and to operators of large facilities. Our operations can be subject to the risk of fuel spillage and any resultant environmental damage. If we are involved in a fuel spill or other accident involving hazardous substances or if we have been in violation of any such laws and regulations, we could be subject to substantial fines or penalties and to criminal and civil liability. We maintain applicable licenses required to transport and hold certain hazardous materials in the course of providing transportation services for our customers’ commodities.
15
Table of Contents
Environmental laws and regulations, including those concerning the discharge of pollutants into the air and water, the handling, transport and disposal of, or exposure to, hazardous materials and wastes, the investigation and remediation of property contamination, and other aspects of environmental protection, are in effect wherever we operate and subject to frequent reinterpretation. As a low-level waste emitter, our current operations do not involve material costs to comply with such laws and regulations, and they have not given rise to, nor are they expected to give rise to, material liabilities under these laws and regulations for investigation or remediation of contamination.
Claims for environmental liabilities arising out of property contamination have been asserted against us and our predecessors from time to time. These claims have not resulted in a material liability to us. However, additional environmental claims, including those relating to any of our former operations, could arise and result in significant losses.
The transportation industry is one of the largest sources of “greenhouse gas” emissions. National and international laws and initiatives to reduce and mitigate the asserted effects of such emissions could significantly impact transportation modes and the economics of the transportation industry. Absent mitigating technologies or government policies, environmental laws in this area have adversely affected our operating costs, business practices, and results of operations. California Air Resource Board has three programs in existence that require particulate filters for tractors and reefer trailers based on age, SmartWay tires and aerodynamic devices for trailers.
Seasonality
Generally, demand for our value-added services delivered to existing customers increases during the second calendar quarter of each year as a result of the automotive industry’s spring selling season and decreases during the third quarter of each year due to the impact of scheduled OEM customer plant shutdowns in July for vacations and changeovers in production lines for new model years. Our value-added services business is also impacted in the fourth quarter by plant shutdowns during the December holiday period. Prolonged adverse weather conditions, particularly in winter months, can also adversely impact margins due to productivity declines and related challenges meeting customer service requirements.
Additionally, our transportation services business, excluding dedicated transportation tied to specific customer supply chains, is generally impacted by decreased activity during the post-holiday winter season and, in certain states during hurricane season, because some shippers reduce their shipments and inclement weather impedes trucking operations or underlying customer demand.
Available Information
We make available free of charge on or through our website our annual reports on Form 10-K, quarterly reports on Form 10-Q, current reports on Form 8-K and all amendments to those reports as soon as reasonably practicable after such material is electronically filed with or furnished to the Securities and Exchange Commission (SEC). Our website address is www.goutsi.com. The SEC maintains a website at www.sec.gov that contains the Company’s current and periodic reports, proxy and information statements and other information filed electronically with the SEC.
We rely extensively on owner-operators to provide transportation services to our customers. Continued reliance on owner-operators, as well as reductions in our pool of available driver candidates, could limit our growth.
The transportation services that we provide are frequently carried out by owner-operators who are generally responsible for paying for their own equipment, fuel and other operating costs. In addition, our owner-operators provide a substantial portion of the tractors used in our business. Owner-operators make up a relatively small
16
Table of Contents
portion of the pool of all truck drivers. Thus, continued reliance primarily on owner-operators could limit our ability to grow. In addition, the following factors recently have combined to create a difficult operating environment for owner-operators:
| • | increases in the prices of new and used tractors; |
| • | a tightening of financing sources available to owner-operators for the acquisition of equipment; |
| • | high fuel prices; |
| • | increases in insurance costs; and |
| • | effects of some states and trade unions to classify owner-operators as employees. |
In recent years, these factors have caused many owner-operators to join company-owned fleets or to exit the industry entirely. As a result of the smaller available pool of qualified owner-operators, the already strong competition among carriers for their services has intensified. Due to the difficult operating environment and intense competition, turnover among owner-operators in the trucking industry is high. Additionally, our agreements with our owner-operators are terminable by either party upon short notice and without penalty. Consequently, we regularly need to recruit qualified owner-operators to replace those who have left our fleet. If we are unable to retain our existing owner-operators or recruit new owner-operators, it could have a materially adverse effect on our business and results of operations.
In the event that the current operating environment for owner-operators worsens, we could adjust our owner-operator compensation package or, alternatively, acquire more of our own revenue equipment and seat it with employee drivers in order to maintain or increase the size of our fleet. The adoption of either of these measures could materially and adversely affect our financial condition and results of operations. If we are required to increase the compensation of owner-operators, our results of operations would be adversely affected to the extent increased expenses are not offset by higher freight rates. If we elect to purchase more of our own tractors and hire additional employee drivers, our capital expenditures would increase, we would incur additional employee benefits costs, depreciation, interest, and/or equipment rental expenses. The financial return on our assets would decline and we would be exposed to the risks associated with implementing a different business model.
We rely heavily upon our agents to develop customer relationships and to locate freight, and the loss of any agent or agents responsible for a significant portion of our revenue could adversely affect our revenue and results of operations.
We rely heavily upon our agents to market our transportation services, to act as intermediaries with customers and to recruit owner-operators. Although we employ a small field management staff that maintains direct relationships with some of our larger, national customers and is responsible for supporting, coordinating and supervising our agent’s activities, the primary relationship with our customers generally is with our agents and not directly with us. We rely on verbal agreements with many of our agents and these verbal agreements do not obligate our agents to provide us with a specific amount of service or to refer freight exclusively to us. Our reliance on verbal agreements may increase the likelihood that we or our agents have a disagreement or a misunderstanding of our and their respective rights and obligations. In addition, in the event of a dispute with one of our agents, we may not be able to verify the terms of the agreement.
We compete with other trucking companies that utilize agent networks both to recruit quality agents and for the business that they generate, which typically involves both competition with respect to the freight rates that we charge shippers and the compensation paid to the agents. There can be no assurance that we will be able to retain our agents or that our agents will continue to refer to us the amount of business that they have in the past. If we were to lose the service of an agent or agents responsible for a significant portion of our operating revenues or if any such agent or agents were to significantly reduce the volume of business that they refer to us, it would have a materially adverse effect on our operating revenues and results of operations. Further, if we were required to increase the compensation we pay to agents in order to retain or maintain business volumes with them, our
17
Table of Contents
operating results would be adversely affected to the extent that we could not pass these increased costs on to our customers.
We rely on subcontractors or suppliers to perform their contractual obligations.
Some of our contracts involve subcontracts with other companies upon which we rely to perform a portion of the services we must provide to our customers. There is a risk that we may have disputes with our subcontractors, including disputes regarding the quality and timeliness of their work or to customer concerns about a subcontractor. Failure by our subcontractors to perform the agreed-upon services or to provide on a timely basis the agreed-upon supplies may materially and adversely impact our ability to perform our obligations. A delay in our ability to obtain components and equipment parts from our suppliers may affect our ability to meet our customers’ needs, which could materially and adversely affect our financial condition and results of operations.
We self-insure for a significant portion of our potential liability for auto liability, workers’ compensation and general liability claims. One or more significant claims, our failure to adequately reserve for such claims, or the cost of maintaining our insurance, could have a materially adverse impact on our financial condition and results of operations.
We maintain workers compensation and general liability insurance with licensed insurance carriers. We also maintain auto liability insurance up to a limit of $1,000,000 per occurrence unless riders are sought to satisfy individual customer or vendor contract requirements. We are self-insured for claims in excess of these limits and for all cargo, material handling and equipment damage claims.
The nature of our industry is that auto accidents occur and, when they do, they almost always result in equipment damage and they often result in injuries or death. If we experience claims that are not covered by our insurance or that exceed our reserves, or if we experience claims for which coverage is not provided, it could increase the volatility of our earnings and have a materially adverse effect on our financial condition and results of operations.
We expect our insurance and claims expense will continue to increase over historical levels, even if we do not experience an increase in the number of insurance claims. Insurance carriers have significantly raised premiums for many businesses, including trucking companies. If we decide to increase our insurance coverage in the future, our costs would be expected to further increase. A significant increase in insurance costs could materially and adversely affect our financial condition and results of operations.
Our current or future levels of indebtedness and our debt service obligations could harm our ability to operate our business, remain in compliance with debt covenants and make payments on our debt.
On December 19, 2013, we entered into a second amendment to our secured credit agreement in connection with the acquisition of Westport USA Holding, LLC which allows borrowings totaling up to $300.0 million. At December 31, 2014, $235.3 million is borrowed under the credit agreement. As a result of our recent acquisitions, we are leveraged and have significant debt service obligations. Our expected level of indebtedness increases the possibility that we may be unable to generate cash sufficient to pay when due the principal of, interest on or other amounts due in respect of such indebtedness. In addition, we may incur additional debt from time to time to finance strategic acquisitions, investments, joint ventures or for other purposes, subject to the restrictions contained in the documents that will be governing our indebtedness. If we incur additional debt, the risks associated with our leverage, including our ability to service our debt, would increase.
Our debt could have other important consequences, which include, but are not limited to, the following:
| • | a substantial portion of our cash flow from operations could be required to pay principal and interest on our debt; |
| • | our interest expense could increase if interest rates increase because the loans under our credit agreement would generally bear interest at floating rates; |
18
Table of Contents
| • | our leverage could increase our vulnerability to general economic downturns and adverse competitive and industry conditions, placing us at a disadvantage compared to those of our competitors that are less leveraged; |
| • | our debt service obligations could limit our flexibility in planning for, or reacting to, changes in our business and in the commercial real estate services industry; |
| • | our failure to comply with the financial and other restrictive covenants in the documents governing our indebtedness could result in an event of default that, if not cured or waived, results in foreclosure on substantially all of our assets; and |
| • | our level of debt may restrict us from raising additional financing on satisfactory terms to fund strategic acquisitions, investments, joint ventures and other general corporate requirements. |
We cannot be certain that our earnings will be sufficient to allow us to pay principal and interest on our debt and meet our other obligations. If we do not have sufficient earnings, we may be required to seek to refinance all or part of our then existing debt, sell assets, borrow more money or sell more securities, none of which we can guarantee that we will be able to do and which, if accomplished, may adversely affect us.
Our business is subject to general economic and business factors that are largely out of our control, any of which could have a materially adverse effect on our operating results.
Our business is dependent upon a number of general economic and business factors that may have a materially adverse effect on our results of operations. Many of these are beyond our control, including new equipment prices and used equipment values, interest rates, fuel taxes, tolls, and license and registration fees, all of which could increase the costs borne by our owner-operators, and capacity levels in the trucking industry, particularly in the industry segments and geographic regions in which we operate.
We also are affected by recessionary economic cycles, changes in inventory levels, and downturns in customers’ business cycles, particularly in market segments and industries where we have a significant concentration of customers, such as automotive, steel and other metals, building materials and machinery. Economic conditions may adversely affect our customers, their need for our services, or their ability to pay for our services. Adverse changes in any of these factors could have a materially adverse effect on our business and results of operations.
We operate in the highly competitive and fragmented transportation and logistics industry, and our business may suffer if we are unable to adequately address factors that may adversely affect our revenue and costs relative to our competitors.
Numerous competitive factors could impair our ability to maintain our current profitability. These factors include the following:
| • | we compete with many other truckload carriers and logistics companies of varying sizes, some of which have more equipment, a broader coverage network, a wider range of services and greater capital resources than we do; |
| • | some of our competitors periodically reduce their rates to gain business, especially during times of reduced growth rates in the economy, which may limit our ability to maintain or increase rates, maintain our operating margins or maintain significant growth in our business; |
| • | many customers reduce the number of carriers they use by selecting so-called “core carriers” as approved service providers, and in some instances we may not be selected; |
| • | some companies hire lead logistics providers to manage their logistics operations, and these lead logistics providers may hire logistics providers on a non-neutral basis which may reduce the number of business opportunities available to us; |
19
Table of Contents
| • | many customers periodically accept bids from multiple carriers and providers for their shipping and logistic service needs, and this process may result in the loss of some of our business to competitors and/or price reductions; |
| • | the trend toward consolidation in the trucking and third-party logistics industries may create other large providers with greater financial resources and other competitive advantages relating to their size and with whom we may have difficulty competing; |
| • | advances in technology require increased investments to remain competitive, and our customers may not be willing to accept higher rates to cover the cost of these investments; |
| • | competition from Internet-based and other brokerage companies may adversely affect our relationships with our customers and freight rates; |
| • | economies of scale that may be passed on to smaller providers by procurement aggregation providers may improve the ability of smaller providers to compete with us; |
| • | some areas of our service coverage requires trucks with engines no older than 2010 in order to comply with environmental rules; and |
| • | an inability to continue to access capital markets to finance equipment acquisition could put us at a competitive disadvantage. |
Any decrease in demand for outsourced services in the industries we serve could reduce our revenue and seriously harm our business.
Our growth strategy is partially based on the assumption that the trend towards outsourcing logistics services will continue despite potentially adverse economic trends affecting our customers. Declines in sales volumes in the industries we serve may lead to a declining demand for logistics services.
Production volumes of our customers are sensitive to consumer demand as well as employee and labor relations. Declines in sales volumes, or the expectation of declines, could result in production cutbacks and unplanned plant shutdowns. Likewise, potential customers may see a risk, based on labor relations issues or other factors, in relying on third-party logistics service providers or may define these activities as their own core competencies and may seek means to deploy excess labor or other resources, and hence may prefer to perform logistics operations themselves. We therefore cannot assure you that the market for logistics services will not decline or will grow as we expect.
Other developments may also lead to a decline in the demand for our services by our customers. For example, consolidation or acquisitions, particularly involving our customers, may decrease the potential number of buyers of our services. Similarly, the relocation or expansion of our customers’ production operations in locations where we do not have an established presence, or where our competitive position is not as strong, may adversely affect our business, even if production increases worldwide, if we are not able to effectively service these customers in such locations. Any significant reduction in or the elimination of the use of the services we provide would result in reduced revenue and harm our business.
Many of our customers experience rapid changes in their prospects, substantial price competition and pressure on their profitability. Although such pressures can encourage outsourcing as a cost-reduction measure, they may also result in increasing pressure on us from our customers to lower our prices, which could negatively affect our business, results of operations, financial condition and cash flows.
Our profitability could be negatively impacted by downward pricing pressure from certain of our customers.
Given the nature of our services and the competitive environment in which we operate, our largest customers exert downward pricing pressure and often require modifications to our standard commercial terms. Due to their
20
Table of Contents
size and market concentration, some of our customers utilize competitive bidding procedures involving bids from a number of competitors or otherwise exert pressure on our prices and margins. Likewise, such customers’ increased bargaining power could have a negative effect on the non-monetary terms of our customer contracts, for example, in relation to the allocation of risk or the terms of payment. While we believe our ongoing cost reduction initiatives have helped mitigate the effect of price reduction pressures from our customers, there is no assurance that we will be able to maintain or improve our current levels of profitability.
Fluctuations in the price or availability of fuel and our ability to collect fuel surcharges may affect our ability to retain or recruit owner-operators.
Our owner-operators bear the costs of operating their tractors, including the cost of fuel and fuel taxes. The tractors operated by our owner-operators consume large amounts of diesel fuel. Diesel fuel prices fluctuate greatly due to economic, political and other factors beyond our control. For example, average weekly diesel fuel prices ranged from $3.21 per gallon to $4.02 per gallon in 2014, compared with $3.82 per gallon to $4.16 per gallon in 2013. To address fluctuations in fuel prices, we seek to impose fuel surcharges on our customers and pass these surcharges on to our owner-operators. These arrangements will not fully protect our owner-operators from fuel price increases. If costs for fuel escalate significantly it could make it more difficult to attract additional qualified owner-operators and retain our current owner-operators. Our owner-operators also may seek higher compensation from us in the form of higher commissions, which could have a materially adverse effect on our results of operations. If we lose the services of a significant number of owner-operators or are unable to attract additional owner-operators, it could have a materially adverse effect on our business and results of operations.
We may not be able to successfully execute our acquisition strategy, which could cause our business and future growth prospects to suffer.
One component of our growth strategy is to pursue strategic acquisitions of transportation companies and third-party providers of logistic services that meet our acquisition criteria. Our growth plans are highly dependent upon being able to make strategic acquisitions. However, suitable acquisition candidates may not be available on terms and conditions we find acceptable. In pursuing acquisitions, we compete with other companies, many of which may have greater resources than we do. If we are unable to secure sufficient funding for potential acquisitions, we may not be able to complete strategic acquisitions that we otherwise find desirable. Further, if we succeed in consummating strategic acquisitions, our business, financial condition and results of operations may be negatively affected because:
| • | some of the acquired businesses may not achieve anticipated revenues, earnings or cash flows; |
| • | we may assume liabilities that were not disclosed to us or exceed our estimates; |
| • | we may be unable to integrate acquired businesses successfully and realize anticipated economic, operational, and other benefits in a timely manner, which could result in substantial costs and delays or other operational, technical or financial problems; |
| • | acquisitions could disrupt our ongoing business, distract our management and divert our resources; |
| • | we may experience difficulties operating in markets in which we have had no or only limited direct experience; |
| • | we may lose the customers, key employees, agents and owner-operators of the acquired company; |
| • | we may finance future acquisitions by issuing common stock for some or all of the purchase price, which could dilute the ownership interests of our shareholders; |
| • | we may incur additional debt related to future acquisitions; or |
| • | we may acquire companies that derive a portion of their revenues from asset-based operations and experience unforeseen difficulties in integrating this business model. |
21
Table of Contents
We may not realize the expected benefits of the Westport Acquisition because of integration difficulties and other challenges.
On December 19, 2013, we acquired Westport in a transaction pursuant to which Westport became our wholly owned subsidiary (the “Westport Acquisition”). The success of the Westport Acquisition will depend, in part, on our ability to integrate Westport’s business with our existing businesses. The diversion of our management’s attention from other operations and any difficulties encountered in combining operations could prevent us from realizing the full benefits anticipated to result from the Westport Acquisition and could adversely affect our business.
If we are unable to retain our executive officers, our business and results of operations could be harmed.
We are highly dependent upon the services of our executive officers and the officers of our operating subsidiaries. We do not maintain key-man life insurance on any of these persons. The loss of the services of any of these individuals could have a materially adverse effect on our operations and future profitability. We also need to continue to develop and retain a core group of managers if we are to realize our goal of expanding our operations and continuing our growth. The market for qualified employees can be highly competitive, and we cannot assure you that we will be able to attract and retain the services of qualified executives, managers or other employees.
We operate in a highly regulated industry and increased costs of compliance with, liability for violation of, or changes in, existing or future regulations could have a materially adverse effect on our business and our ability to retain or recruit owner-operators.
The U.S. Federal Motor Carrier Safety Administration, or FMCSA, and various state and local agencies exercise broad powers over our business, generally governing such activities as authorization to engage in motor carrier operations, safety and insurance requirements. Our owner-operators must comply with the safety and fitness regulations promulgated by the FMCSA, including those relating to drug and alcohol testing and hours-of-service. There also are regulations specifically relating to the trucking industry, including testing and specifications of equipment and product handling requirements. These measures could disrupt or impede the timing of our deliveries and we may fail to meet the needs of our customers. The cost of complying with these regulatory measures, or any future measures, could have a materially adverse effect on our business or results of operations.
In December 2011, the FMCSA published new final hours-of-service (HOS) rules, which they believe comply with a court imposed settlement agreement, allowing commercial motor carrier drivers to continue to drive up to 11 hours within a 14-hour workday and mandate at least 10 consecutive off-duty hours between workdays. The rule also allows drivers to continue to restart their calculations of weekly on-duty time limits after having at least 34 consecutive hours off-duty. We believe the FMCSA still favors a 10-hour driving limit, which would yield a loss of 1-hour of service from current standards, but they currently have insufficient research data to support such a change.
In December 2010, the FMCSA also initiated its Compliance Safety Accountability (CSA) initiative (formerly Comprehensive Safety Analysis 2010). The CSA system fundamentally changes the safety evaluation process for all motor carriers and includes a scope of enforcement to the driver/owner-operator level to make safety performance history more transparent to law enforcement and motor carriers. We believe the intent is to improve regulatory oversight of motor carriers and drivers. There is a rulemaking due to be published July 2015 that will proposed setting standards for rating motor carriers based on these CSA scores alone unlike the previous process that required an onsite audit to rate the motor carrier for continued operation.
We are also preparing for an anticipated change in the manner in which commercial drivers will be required to document their HOS. In April 2010, the FMCSA published a regulation that would require interstate carriers, with documented patterns of HOS violations, to install electronic on-board recorders (EOBR) in their vehicles.
22
Table of Contents
EOBRs are devices attached to a vehicle that automatically record the number of hours a driver spends operating the vehicle. The current system is a manual log system The FMCSA is working on a new proposed rulemaking to mandate the use of Electronic Log Devices (ELDs) in most motor vehicles governed by FMCSA regulations. This rulemaking is due to be published in November 2015, will allow for input from all transportation stakeholders and should have implementation projected for some time in 2017.
Additionally, a change in liability insurance requirements is being proposed from the current federal standard of $750,000 to a new standard of $2 million
Advocacy groups may continue to challenge the final rulings of the FMCSA, and we are unable to predict how a court may rule on such challenges. We will continue to monitor the actions of the FMCSA.
Our operations are subject to various environmental laws and regulations, the violation of which could result in substantial fines or penalties.
Our operations involve the risks of fuel spillage and environmental damage, among others, and we are subject to various environmental laws and regulations. If we are involved in a spill or other accident involving hazardous substances, or if we are found to be in violation of applicable laws or regulations, we could be subject to substantial fines or penalties and to criminal and civil liability, which could have a materially adverse effect on our business and operating results. In addition, claims for environmental liabilities arising out of property contamination have been asserted against us from time to time. Such claims, in some instances, have been associated with businesses related to entities or facilities we acquired and have been based on conduct that occurred prior to our acquisition of those entities or facilities. While none of the claims identified to date have resulted in a material liability to us, additional environmental liabilities relating to any of our former operations or any entities or facilities we have acquired could be identified and give rise to claims against us involving significant losses. In addition, compliance with current and future environmental laws and regulations, such as those relating to carbon emissions and the effects of global warming, can be expected to have a significant impact on our transportation services and could adversely affect our business and results of operations.
A determination by regulators that our agents and owner-operators are employees could expose us to various liabilities and additional costs.
From time to time, tax and other regulatory authorities have sought to assert that independent contractors in the transportation services industry, such as our agents and owner-operators, are employees rather than independent contractors. There can be no assurance that these interpretations and tax laws that consider these persons independent contractors will not change or that these authorities will not successfully assert this position. If our agents or owner-operators are determined to be our employees, that determination could materially increase our exposure under a variety of federal and state tax, workers’ compensation, unemployment benefits, labor, employment and tort laws, as well as our potential liability for employee benefits. Our business model relies on the fact that our agents and owner-operators are not deemed to be our employees, and exposure to any of the above increased costs would have a materially adverse effect on our business and operating results.
Our business may be disrupted by natural disasters causing supply chain disruptions.
Natural disasters such as earthquakes, tsunamis, hurricanes, tornadoes, floods or other adverse weather and climate conditions, whether occurring in the United States or abroad, could disrupt our operations or the operations of our customers and could damage or destroy infrastructure necessary to transport products as part of the supply chain. These events could make it difficult or impossible for us to provide logistics and transportation services, disrupt or prevent our ability to perform functions at the corporate level, and/or otherwise impede our ability to continue business operations in a continuous manner consistent with the level and extent of business activities prior to the occurrence of the unexpected event, which could adversely affect our business and results of operations.
23
Table of Contents
We are dependent on access to transportation networks.
We do not maintain all of our own transportation networks, and we rely on other third-party transportation service providers for some of our logistics services. Access to competitive transportation networks is important to logistics companies such as ourselves. We cannot assure you that we will always be able to ensure access to preferred third-party networks or that these networks will continue to meet our needs and allow us to remain competitive, in particular as compared with our large competitors with their own affiliated networks. If we are unable to ensure sufficient access to the most competitive domestic and international networks on a long-term basis, this could have a material adverse effect on our business and net sales, and the related operating results and operating cash flows.
Our business may be harmed by terrorist attacks, future war or anti-terrorism measures.
Federal, state and municipal authorities continue to implement and follow various security measures, including checkpoints and travel restrictions on large trucks. Such measures may have costs associated with them, which we or our owner-operators could be forced to bear, or may otherwise reduce the productivity of our owner-operators. For example, security measures imposed at bridges, tunnels, border crossings and other points on key trucking routes may cause delays and increase the non-driving time of our owner-operators, which could have a materially adverse effect on our operating results. Our international operations in Mexico, Canada and Colombia may be affected significantly if there are any disruptions or closures of border traffic due to security measures. In addition, war, risk of war or a terrorist attack also may have an adverse effect on the economy. A decline in economic activity could adversely affect our revenues or restrict our future growth. Instability in the financial markets as a result of terrorism or war also could affect our ability to raise capital. In addition, the insurance premiums charged for some or all of the coverage currently maintained by us could increase dramatically or such coverage could be unavailable in the future.
Our ability to grow may be affected if shippers refuse to use our services because we operate a portion of our business through agents and owner-operators.
In our experience, certain high-volume shippers have determined that their freight must be hauled by carriers that use company drivers and equipment. Such shippers believe that they can obtain a more homogenous fleet and more control over service standards. Such policies could prevent us from pursuing certain business opportunities, which could adversely affect our growth and results of operations.
Our intermodal business could be adversely affected by a decrease in the volume of international shipments.
A portion of our business comes from the intermodal segment of the transportation market, and we believe that by expanding our intermodal support services we have a substantial opportunity to grow our business. A decrease in intermodal transportation services resulting from general economic conditions or other factors such as work stoppages, price competition from other modes of transportation, or a disruption in steamship or rail service could have an adverse effect on these growth opportunities and have a materially adverse effect on our business.
Cyclicality and seasonality in our business and the impact of weather could adversely affect our quarterly operating results.
Our revenues and profitability are impacted by industrial demand. Most notably, our value-added services and dedicated transportation services, which comprise a significant component of our profitability, are somewhat dependent upon North American automotive sales and the vehicle production schedules of our customers. The automotive market and other industrial markets are cyclical and depend on general economic conditions, interest rates and consumer spending patterns. These markets also have seasonal characteristics. Generally, demand for our value-added services delivered to existing customers increases during the second calendar quarter of each year as a result of the automotive industry’s spring selling season and decreases during the third quarter of each year due to the impact of scheduled OEM customer plant shutdowns in July for vacations and changeovers in
24
Table of Contents
production lines for new model years. Our value-added services business is also impacted in the fourth quarter by plant shutdowns during the December holiday period. Prolonged adverse weather conditions, particularly in winter months, can also adversely impact margins due to productivity declines and related challenges meeting customer service requirements.
Additionally, our transportation services business, excluding dedicated transportation tied to specific customer supply chains, is generally impacted by decreased activity during the post-holiday winter season and, in certain states during hurricane season, because some shippers reduce their shipments and inclement weather impedes trucking operations or underlying customer demand.
The impact of these seasonal and cyclical effects on our operating results has historically and in the future may be ameliorated or exacerbated by the timing of the launch of new value-added projects or other customer relationships, or the termination of existing customer projects or relationships. All of these factors could materially and adversely affect our future quarterly operating results.
Our operations in Mexico, Canada and Colombia make us vulnerable to risks associated with doing business in foreign countries.
As a result of our existing operations in Mexico, Canada and Colombia, an increasing portion of our revenue and expenses are expected to be denominated in currencies other than U.S. dollars. International operations are subject to certain risks inherent in doing business abroad, including:
| • | exposure to local economic and political conditions; |
| • | foreign exchange rate fluctuations and currency controls; |
| • | withholding and other taxes on remittances and other payments by subsidiaries; |
| • | investment restrictions or requirements; and |
| • | export and import restrictions. |
Expanding our business in Mexico, Canada and Colombia, and developing business relationships with manufacturers in such jurisdictions are important strategic elements. As a result, exposure to the risks described above may be greater in the future. The likelihood of such risks and their potential effect on us may vary from country to country and are unpredictable. However, any such occurrences could materially and adversely affect our financial condition and results of operations.
We may be subject to additional impairment charges due to future declines in the fair value of our equity securities.
We hold equity securities as short term investments. Holding equity securities subjects us to fluctuations in the market value of our investment portfolio based on current market prices. Marketable securities are carried at fair value and are marked to market at the end of each quarter, with the unrealized gains and losses, net of tax, included as a component of accumulated other comprehensive income, unless the declines in value are judged to be other-than-temporary, in which case an impairment charge is included in the determination of net income. In past years, we have had to record other-than-temporary impairment charges for marketable equity securities classified as available-for-sale. Although we currently consider unrealized losses within our investment portfolio to be temporary, we may incur future impairment charges if declines in market values continue and/or worsen and impairments are no longer considered temporary.
25
Table of Contents
We may be required to write down goodwill and other intangible assets, causing our financial condition and results to be negatively impacted.
When we acquire a business, a portion of the purchase price may be allocated to goodwill and other identifiable intangible assets. Goodwill represents the excess purchase price over the fair value of assets acquired in connection with our acquisitions. At December 31, 2014, our goodwill and other identifiable intangible assets were approximately $128.3 million. Under current accounting standards, if we determine goodwill or intangible assets are impaired, we would be required to write down the value of these assets. We are required to test goodwill for impairment annually or more frequently, whenever events occur or circumstances change that would more likely than not reduce the fair value of a reporting unit with goodwill below its carrying amount. We annually test goodwill for impairment during the third fiscal quarter of each year. As a result of our impairment analysis, we have concluded that no impairment charge was necessary for the year ended December 31, 2014. However, we cannot provide assurance whether we will be required to take an impairment charge in the future. Any impairment charge would have a negative effect on our financial results.
Any disputes that arise between us and CenTra, an entity controlled by our majority shareholders, with respect to our past and ongoing relationships could harm our business operations.
Disputes may arise between CenTra, an entity controlled by our majority shareholders, and us in a number of areas relating to our past and ongoing relationships, including:
| • | labor, tax, employee benefit, indemnification and other matters arising from our separation from CenTra; |
| • | employee retention and recruiting; |
| • | the nature, quality and pricing of transitional services CenTra has agreed to provide us; and |
| • | business opportunities that may be attractive to both CenTra and us. |
We may not be able to resolve any potential conflicts and even if we do, the resolution may be less favorable than if we were dealing with an unaffiliated party. The agreements we have entered into with CenTra and with other affiliates controlled by our majority shareholders may be amended upon agreement between the parties.
Our revenue is somewhat dependent on North American automotive industry production volume, and may be negatively affected by future downturns in North American automobile production.
A significant portion of our larger customers are concentrated in the North American automotive industry. For the fiscal year ended December 31, 2014, 28% of our operating revenues were derived from customers in the North American automotive industry. Our business and growth largely depend on continued demand for its services from customers in this industry.
During the global economic crisis of the last decade that began 2008, the substantial decline in consumer demand for automobile purchases led to significant reductions in light vehicle production in North America, as General Motors and Chrysler restructured through bankruptcies and other North American manufacturers re-scaled their operations to adjust to changing market demands. As a result of plant closings and the general downturn in North American automobile production, we experienced significant variability in our revenues derived from our North American automotive customers during this period, including a 44% decrease from $303.4 million during the year ended December 31, 2007 to $168.5 million during the year ended December 31, 2009.
While North American automobile production has rebounded and our revenues from our North American automotive customers have in turn recovered since the economic crisis, any future downturns in North American automobile production, which also impacts our steel and metals customers, could similarly affect our revenues in future periods.
26
Table of Contents
Our business derives a large portion of revenue from a few major customers, and the loss of any one or more of them as customers, or a reduction in their operations, could have a material adverse effect on our business.
A large portion of our revenue is generated from a limited number of major customers concentrated in the automotive, steel and metals, and energy industries. Our top 10 customers accounted for approximately 36% of our operating revenues for the year ended December 31, 2014. Our contracts with customers generally contain cancellation clauses, and there can be no assurance that these customers will continue to utilize our services or that they will continue at the same levels. Further, there can be no assurance that these customers will not be affected by a future downturn in demand, which would result in a reduction in their operations and corresponding need for our services. Moreover, our customers may individually lose market share, apart from general economic trends. If our major customers lose U.S. market share, they may have less need for services. A reduction in or termination of services by one or more of its major customers could have a material adverse effect on its business and results of operations.
Customer manufacturing plant closures could have a material effect on our performance.
We derive a substantial portion of our revenue from the operation and management of operating facilities, which are often located adjacent to a customer’s manufacturing plant and are directly integrated into the customer’s production line process. We may experience significant revenue loss and shut-down costs, including costs related to early termination of leases, causing our business to suffer if customers closed their plants or significantly modified their capacity or supply chains at a plant that we service.
In past years, we have had to discontinue and close operations in response to our customers closing their related manufacturing plants and have incurred shut-down charges as a result of those closings. Although we do not currently operate any facilities linked to announced plant closures, our results of operations could be materially and adversely impacted by future announcements of plant closures.
If our customers are able to reduce their total cost structure regarding their employees that provide internal logistics and transportation services, our business and results of operations may be harmed.
A major driver for customers to use third-party logistics providers instead of their own personnel is their inherent high cost of labor. Third-party logistics service providers such as us are generally able to provide such services more efficiently than otherwise could be provided “in-house” primarily as a result of our lower and more flexible employee cost structure. Historically, this has been the case in the U.S. automotive industry. If, however, the U.S. automotive industry, which has received concessions from the United Auto Worker and other unions, or any other industry we serve, is able to renegotiate the terms of its labor contracts or otherwise reduce its total cost structure regarding its employees, or if it has to make concessions as a result of pressure from the unions with which it deals, we may not be able to provide our customers with an attractive alternative for their logistics needs and our business and results of operations may be harmed.
We face a variety of risks relating to our material handling services.
For certain value-added material handling services, we lease warehouses and distribution facilities on a long-term basis. In one situation, we also assumed employment arrangements from a customer. Such actions may require substantial investments in property, plant and equipment, personnel and management capacity. If we acquire or take over existing facilities of a customer or a competing provider, we may in some jurisdictions assume by operation of law all rights and obligations arising under the existing employment relationships between our customer or the competing provider and the employees employed at such facilities. This may result in additional costs and obligations to be incurred by us, such as wages and employee benefits, which may include severance or other employment-related obligations.
We commit facilities, labor and equipment on the basis of projections of future demand, and our projections may prove inaccurate as a result of changes to economic conditions or a decision by our customers to terminate or not
27
Table of Contents
to renew their contracts with us. We generally strive to minimize these risks for our dedicated warehouses and other assets by negotiating coterminous lease agreements, which have the same duration as that of the assets deployed to service the contract. Where we take assignment of existing employment relationships, we typically seek indemnities for employee service liabilities from the previous employer. Our revenue, cash flows and results of operations may be adversely affected if we are unable to secure terms coterminous with our customer commitments or to be indemnified for employee service liabilities. This could result in an impairment of assets and adversely affect our cash flow.
Under some of our third-party logistics agreements, we have agreed to reduce our prices over time in accordance with anticipated cost savings and efficiency improvements. If we are compelled to perform our contractual obligations on unfavorable terms (including when such anticipated cost savings and improvements are not realized), our results of operations could be adversely affected.
Our customers may terminate contracts before completion or choose not to renew contracts, which could adversely affect our business and reduce our revenue.
The terms of our customer contracts, particularly for value-added services, often range up to five years. Many of our customer contracts may be terminated by such customers with or without cause, with one to six months’ notice and in most cases without significant penalty. The termination of a substantial percentage of these contracts could adversely affect our business and reduce our revenue. Failure to meet contractual or performance requirements could result in cancellation or non-renewal of a contract. In addition, a contract termination or significant reduction in work assigned to us by a major customer could cause us to experience a higher than expected number of unassigned employees or other underutilized resources, which would reduce our operating margin until we are able to reduce or reallocate headcount or other overcapacity. We may not be able to replace any customer that elects to terminate or not renew its contract, which would adversely affect our business and revenues.
Our business is highly dependent on dynamic information technology.
The provision and application of information technology is an important competitive factor in the logistics industry. Among other things, our information systems must frequently interact with those of our customers and transportation providers. Our future success will depend on our ability to employ logistics software that meets industry standards and customer demands. Although there are redundancy systems and procedures in place, the failure of the hardware or software that supports our information technology systems could significantly disrupt client workflows and cause economic losses for which we could be held liable and which would damage our reputation.
We expect customers to continue to demand more sophisticated and fully integrated information technology systems from their logistics providers, which are compatible with their own information technology environment. In addition, our competitors may have or develop information technology systems that permit them to be more cost effective and otherwise better situated to meet customer demands than we are able to develop. Larger competitors may be able to develop or license information technology systems more cost effectively than we can by spreading the cost across a larger customer base, and competitors with greater financial resources may be able to develop or purchase information technology systems that we cannot afford. If we fail to meet the demands of our customers or protect against disruptions of both our and our customers’ operations, we may lose customers, which could seriously harm our business and adversely affect our operating results and operating cash flow.
We license a variety of software that is used in our information technology system. As a result, the success and functionality of our information technology is dependent upon our ability to continue to license the software platforms upon which it is built. There can be no assurances that we will be able to maintain these licenses or replace the functionality provided by this software on commercially reasonable terms or at all.
28
Table of Contents
Additionally, while we are not aware of any pending infringement matters and we believe that we have all necessary licenses to implement our system, we could be subject to claims of infringement in the future. The failure to maintain these licenses or any significant delay in the replacement of, or interference in, our use of this software or any claims of infringement, even those without merit, could have a material adverse effect on our business, financial condition and results of operations.
A significant labor dispute involving us or one or more of our customers, or that could otherwise affect our operations, could reduce our revenues and harm our profitability.
A substantial number of our employees and of the employees of our largest customers are members of industrial trade unions and are employed under the terms of collective bargaining agreements. Each of our unionized facilities has a separate agreement with the union that represents the workers at only that facility. Labor disputes involving either us or our customers could affect our operations. If the UAW and our automotive customers and their suppliers are unable to negotiate new contracts and our customers’ plants experience slowdowns or closures as a result, our revenue and profitability could be negatively impacted. A labor dispute involving another supplier to our customers that results in a slowdown or closure of our customers’ plants to which we provide services could also have a material adverse effect on our business. Significant increases in labor costs as a result of the renegotiation of collective bargaining agreements could also be harmful to our business and our profitability. As of December 31, 2014, 1,512 of our 4,218 employees are subject to collective bargaining agreements, 20% of which are subject to contracts that expire in 2015.
In addition, strikes, work stoppages and slowdowns by our employees may affect our ability to meet our customers’ needs, and customers may do more business with competitors if they believe that such actions may adversely affect our ability to provide service. We may face permanent loss of customers if we are unable to provide uninterrupted service. The terms of our future collective bargaining agreements also may affect our competitive position and results of operations.
If we are unable to enter new business industries or segments successfully, our future growth prospects could suffer.
Our growth strategy requires us to enter into geographic or business markets in which we have little or no prior experience. In addition to the risks inherent in entering new markets or lines of business, our success in entering such new markets or businesses may be dependent on our ability to create new and appropriate business models. There can be no assurance that we will be able to develop successful business models that can adapt to new lines of businesses in which we have little or no experience.
Product recalls or isolated product liability claims may negatively impact our business, financial condition, results of operations and cash flows.
Recalls may result in decreased production levels due to (i) the manufacturer focusing its efforts on addressing the problems underlying the recall, as opposed to generating new sales volume, and (ii) consumers electing not to purchase automobiles manufactured by manufacturers initiating the recall, or by automotive companies in general, while such recalls persist. Any reductions in the production volumes of our customers could have a material adverse impact on our business, financial condition and results of operations.
We provide sub-assembly services for certain customers in the United States and Mexico. In the ordinary course of operations, we manage charge-backs for non-conforming goods or service failure claims. To the extent that product recalls or isolated product liability claims are caused by or involve components we have sub-assembled, we may be subject to risk of loss or other damage claims in connection with such sub-assembly services. We are not involved in the design, development or specification of any components. Our customers purchase all components and also specify sub-assembly processes and related equipment. We do warrant that items assembled by us will be fit and sufficient for the particular purpose intended by our customer and will, in particular, achieve specific testing, assembly and data capture criteria established by our customer for the sub-assembly process,
29
Table of Contents
based on detailed interim and final testing. If we do not expressly modify or exclude language appearing in the general terms and conditions attached to its major customers’ purchase orders, such losses or claims could have a material adverse impact on our business, financial condition, results of operations and cash flows.
Because Matthew T. Moroun and Manuel J. Moroun hold a controlling interest in us, the influence of our public shareholders over significant corporate actions is limited, and we are not subject to certain corporate governance standards that apply to other publicly traded companies.
As of December 31, 2014, Matthew T. Moroun, the Chairman of our Board of Directors, Manuel J. Moroun, a member of our Board of Directors, and trusts controlled by Manuel J. Moroun and Matthew T. Moroun, together own approximately 71.8% of our outstanding common stock. As a result, the Moroun family has the power to:
| • | control all matters submitted to our shareholders; |
| • | elect our directors; |
| • | adopt, extend or remove any anti-takeover provisions that are available to us; and |
| • | exercise control over our business, policies and affairs. |
This concentration of ownership could limit the price that some investors might be willing to pay for shares of our common stock, and our ability to engage in significant transactions, such as a merger, acquisition or liquidation, will require the consent of the Moroun family. Conflicts of interest could arise between us and the Moroun family, and any conflict of interest may be resolved in a manner that does not favor us. Accordingly, the Moroun family could cause us to enter into transactions or agreements of which our other shareholders would not approve or make decisions with which they may disagree. Because of the Morouns’ level of ownership, we have elected to be treated as a controlled company in accordance with the rules of the NASDAQ Stock Market. Accordingly, we are not required to comply with NASDAQ Stock Market rules which would otherwise require a majority of our board to be comprised of independent directors and require our board to have a compensation committee and a nominating and corporate governance committee comprised of independent directors.
The Moroun family may continue to retain control of us for the foreseeable future and may decide not to enter into a transaction in which shareholders would receive consideration for our common stock that is much higher than the then-current market price of our common stock. In addition, the Moroun family could elect to sell a controlling interest in us to a third-party and our other shareholders may not be able to participate in such transaction or, if they are able to participate in such a transaction, such shareholders may receive less than the then current fair market value of their shares. Any decision regarding their ownership of us that the Moroun family may make at some future time will be in their absolute discretion, subject to applicable laws and fiduciary duties.
Sales of our common shares by the Moroun family or issuances by us in connection with future acquisitions or otherwise could cause the price of our common stock to decline or may dilute your ownership in us.
If the Moroun family sells a substantial number of shares of our common stock in the future, the market price of our common stock could decline. A perception among investors that these sales may occur could produce the same effect. The Moroun family has rights to require us to include shares of common stock owned by them in registration statements that we may file. By exercising their registration rights and selling a large number of shares of common stock, the Moroun family could cause the price of our common stock to decline. Furthermore, the inclusion of shares of common stock held by the Moroun family in a registration statement initiated by us could impair our ability to raise needed capital by depressing the price at which we could sell our common stock.
One component of our business strategy is to make acquisitions. In the event of any future acquisitions, we could issue additional shares of common stock, which would have the effect of diluting your percentage ownership of our common stock and could cause the price of our common stock to decline.
30
Table of Contents
In addition, we could decide to issue common stock in connection with capital raising efforts or otherwise. Issuances of substantial amounts of shares of our common stock in the public market, or the perception that those sales will occur, could cause the market price of our common stock to decline or be depressed.
Our stock trading volume may not provide adequate liquidity for investors.
Although shares of our common stock are traded on the NASDAQ Global Select Market, the average daily trading volume in our common stock is less than that of other larger transportation and logistics companies. A public trading market having the desired characteristics of depth, liquidity and orderliness depends on the presence in the marketplace of a sufficient number of willing buyers and sellers of the common stock at any given time. This presence depends on the individual decisions of investors and general economic and market conditions over which we have no control. Given the daily average trading volume of our common stock, significant sales of the common stock in a brief period of time, or the expectation of these sales, could cause a decline in the price of our common stock. Additionally, low trading volumes may limit a shareholder’s ability to sell shares of our common stock.
Our ability to pay regular dividends on our common stock is subject to the discretion of our Board of Directors and will depend on, among other things, our financial condition, results of operations, capital requirements, any covenants included in our credit facilities any legal or contractual restrictions on the payment of dividends and other factors the Board of Directors deem relevant.
We have adopted a cash dividend policy which anticipates a total annual dividend of $0.28 per share of common stock. However, the payment of future dividends will be at the discretion of our Board of Directors and will depend, among other things, on our financial condition, results of operations, capital requirements, any covenants included in our credit facilities, any legal or contractual restrictions on the payment of dividends and other factors the Board of Directors deem relevant. As a consequence of these limitations and restrictions, we may not be able to make, or may have to reduce or eliminate, the payment of dividends on our common stock. Additionally, any change in the level of our dividends or the suspension of the payment thereof could adversely affect the market price of our common stock.
Our articles of incorporation and bylaws have, and under Michigan law are subject to, provisions that could delay, deter or prevent a change of control.
Our articles of incorporation and bylaws contain provisions that might enable our management to resist a proposed takeover of our Company. These provisions could discourage, delay or prevent a change of control of our Company or an acquisition of our Company at a price that our shareholders may find attractive. These provisions also may discourage proxy contests and make it more difficult for our shareholders to elect directors and take other corporate actions. The existence of these provisions could limit the price that investors might be willing to pay in the future for shares of our common stock. These provisions include:
| • | a requirement that special meetings of our shareholders may be called only by our Board of Directors, the Chairman of our Board of Directors, our Chief Executive Officer or the holders of a majority of our outstanding common stock; |
| • | advance notice requirements for shareholder proposals and nominations; and |
| • | the authority of our Board of Directors to issue, without shareholder approval, preferred stock with such terms as the Board of Directors may determine, including in connection with our implementation of any shareholders rights plan, or “poison pill.” |
In addition, certain provisions of Michigan law that apply to us could discourage, delay or prevent a change of control or acquisition of our Company.
31
Table of Contents
ITEM 1B: UNRESOLVED SECURITIES & EXCHANGE COMMISSION STAFF COMMENTS
None.
We are headquartered and maintain our corporate administrative offices in Warren, Michigan. We own our corporate administrative offices, as well as terminal yards and other properties in the following locations: Dearborn, Michigan; Louisville, Kentucky; Columbus, Ohio; Reading, Ohio; Latty, Ohio; Cleveland, Ohio; Gary, Indiana; Dallas, Texas; South Kearny, New Jersey; Rural Hall, North Carolina; Garden City, Georgia; Millwood, West Virginia and Memphis, Tennessee; offices in Tampa, Florida; Houston, Texas and a condominium in Monroeville, Pennsylvania. Our properties are subject to a mortgage granted to Comerica Bank, as agent for our senior lenders.
As of December 31, 2014, we also leased 83 operating, terminal and yard, and administrative facilities in various U.S. cities located in 29 states, in Milton, Ontario; London, Ontario; Windsor; Ontario, and in San Luis Potosí, Mexico. We also deliver services inside or linked to 17 facilities provided by customers. Certain of our leased facilities are leased from entities controlled by our majority shareholders. These facilities are leased on either a month-to-month basis or extended terms. We believe that the properties we lease from these affiliates are, in the aggregate, leased at market rates and are suitable for their purposes and adequate to meet our needs. For more information on our lease arrangements, see Part II, Item 8: Notes 8 and 10 to the Consolidated Financial Statements.
The nature of our business routinely results in litigation incidental to the ordinary course of our business, primarily involving claims for personal injury and property damage incurred in the transportation of freight. Based on knowledge of the facts and, in certain cases, opinions of outside counsel, we believe all such litigation is adequately covered by insurance or otherwise reserved for and that adverse results in one or more of those cases would not have a materially adverse effect on our financial condition, operating results or cash flows.
ITEM 4: MINE SAFETY DISCLOSURES
Not applicable.
32
Table of Contents
| ITEM 5: | MARKET FOR THE REGISTRANT’S COMMON EQUITY, RELATED STOCKHOLDER MATTERS AND ISSUER PURCHASES OF EQUITY SECURITIES |
Market Information
Our common stock is traded on The NASDAQ Global Select Market under the symbol “UACL”. The following table shows the reported high and low sales prices of our common stock for the periods indicated.
| 2014 | 2013 | |||||||||||||||
| Fiscal Period |
High | Low | High | Low | ||||||||||||
| First Quarter |
$ | 32.99 | $ | 24.69 | $ | 24.90 | $ | 16.67 | ||||||||
| Second Quarter |
$ | 29.08 | $ | 22.53 | $ | 28.04 | $ | 22.65 | ||||||||
| Third Quarter |
$ | 25.62 | $ | 23.85 | $ | 28.65 | $ | 23.85 | ||||||||
| Fourth Quarter |
$ | 29.03 | $ | 23.98 | $ | 30.61 | $ | 26.17 | ||||||||
The reported last sale price per share of the Common Stock as quoted through the NASDAQ Global Select Market on March 2, 2015 was $25.78 per share. As of such date we had 29,997,784 shares outstanding. The number of shareholders of record on March 2, 2015, was 9; however, we estimate that we have a significantly greater number of shareholders because a substantial number of our common shares are held at The Depository Trust & Clearing Corporation on behalf of our shareholders.
Dividends
On July 24, 2013, our Board of Directors approved a new cash dividend policy, which anticipates a total annual dividend of $0.28 per share of common stock, payable in quarterly increments of $0.07 per share of common stock. Pursuant to the cash dividend policy, the Board of Directors declared quarterly cash dividends of $0.07 per common share totaling $0.14 per common share during 2013 and $0.28 per common share during 2014. Declaration of future cash dividends, and the establishment of record and payment dates, are subject to final determination by the Board of Directors each quarter after its review of our financial condition, results of operations, capital requirements, any legal or contractual restrictions on the payment of dividends and other factors the Board of Directors deems relevant.
Limitations on our ability to pay dividends are described under the section captioned “Liquidity and Capital Resources—Revolving Credit and Term Loan Agreement” in Item 7 of this Form 10-K.
Equity Compensation Plan Information
On April 23, 2014, our Board of Directors adopted the 2014 Amended and Restated Stock Incentive Plan, or the Plan. The Plan was approved by our shareholders at the 2014 Annual Meeting and became effective as of the date it was adopted by the Board of Directors. The Plan replaced our 2004 Stock Incentive Plan and carried forward the shares of common stock that remained available for issuance under the 2004 Stock Incentive Plan. The grants may be made in the form of stock options, restricted stock bonuses, restricted stock purchase rights, stock appreciation rights, phantom stock units, restricted stock units or unrestricted common stock. There were no grants made under the Plan during the year ended December 31, 2014. Restricted stock awards currently outstanding under the 2004 Stock Incentive Plan will remain outstanding in accordance with the terms of that
33
Table of Contents
plan. For more information on the Plan, see Item 8: Note 13 to the Consolidated Financial Statements. The following table presents information related to securities issued and authorized for issuance under these plans at December 31, 2014:
| Plan Category |
Number of securities to be issued upon exercise of outstanding options, warrants and rights |
Weighted average exercise price of outstanding options, warrants and rights |
Number of securities remaining available for future issuance |
|||||||||
| Equity compensation plans approved by security holders |
16,446 | $ | — | (1) | 316,880 | |||||||
| Equity compensation plans not approved by security holders |
— | $ | — | — | ||||||||
|
|
|
|
|
|
|
|||||||
| Total |
16,446 | $ | — | (1) | 316,880 | |||||||
|
|
|
|
|
|
|
|||||||
| (1) | Reflects shares to be issued under restricted stock bonus awards, which do not have an exercise price. As of December 31, 2014, the Company has no outstanding options, warrants or rights that require payment of an exercise price. |
Purchases of Equity Securities by the Issuer and Affiliated Purchasers
On June 30, 2014, the Company announced that it had been authorized to purchase up to 800,000 shares of its Common Stock from time to time in the open market. There have not been any purchases of shares under this authorization. The Company did, however, acquire 32,406 shares of common stock for $845,000 pursuant to its right of first refusal under restricted stock bonus award agreements and 1,287 shares for $37,000 related to employee withholding upon vesting of restricted stock during the fourth fiscal quarter of 2014.
34
Table of Contents
Performance Graph
The graph below matches Universal Truckload Services, Inc.‘s cumulative 5-Year total shareholder return on common stock with the cumulative total returns of the NASDAQ Composite index and the NASDAQ Transportation index. The graph tracks the performance of a $100 investment in our common stock and in each index (with the reinvestment of all dividends) from 12/31/2009 to 12/31/2014.
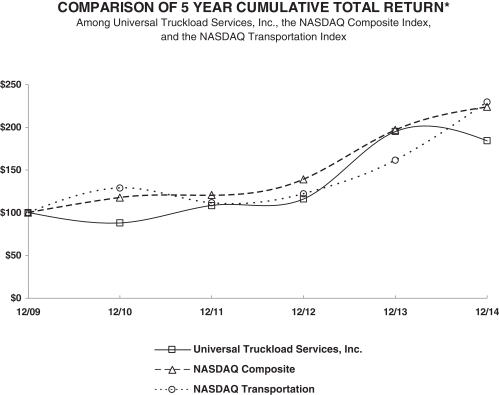
| 12/09 | 12/10 | 12/11 | 12/12 | 12/13 | 12/14 | |||||||||||||||||||
| Universal Truckload Services, Inc. |
100.00 | 87.96 | 108.34 | 116.01 | 194.94 | 184.18 | ||||||||||||||||||
| NASDAQ Composite |
100.00 | 117.61 | 118.70 | 139.00 | 196.83 | 223.74 | ||||||||||||||||||
| NASDAQ Transportation |
100.00 | 128.91 | 111.44 | 122.10 | 161.38 | 229.56 | ||||||||||||||||||
The stock price performance included in this graph is not necessarily indicative of future stock price performance.
35
Table of Contents
| ITEM 6: | SELECTED FINANCIAL DATA |
The following table sets forth the selected historical financial and operating data as of and for the periods presented. In October 2012, Universal acquired LINC Logistics Company (LINC). Universal and LINC were under common control, and as such, the financial statements of Universal have been retrospectively revised to reflect the accounts of LINC as if they had been consolidated for all previous periods. The selected historical balance sheet data at December 31, 2014, 2013, 2012 and 2011 and the selected historical statement of income data for the years ended December 31, 2014, 2013, 2012, 2011 and 2010 have been derived from our audited consolidated financial statements. The selected historical balance sheet data at December 31, 2010 has been combined for Universal and LINC, and derived from Universal’s audited consolidated financial statements and LINC’s audited consolidated financial statements. The selected historical financial and operating data presented below should be read in conjunction with the information included under the heading “Management’s Discussion and Analysis of Financial Condition and Results of Operations” and our consolidated financial statements and related notes included elsewhere in this Form 10-K. The following financial and operating data may not be indicative of our future performance.
| Years ended December 31, | ||||||||||||||||||||
| 2014 | 2013 | 2012 | 2011 | 2010 | ||||||||||||||||
| (In thousands, except per share information, operating data and percentages) |
||||||||||||||||||||
| Statements of Income Data: |
||||||||||||||||||||
| Operating revenues |
$ | 1,191,521 | $ | 1,033,492 | $ | 1,037,006 | $ | 990,672 | $ | 851,868 | ||||||||||
| Operating expenses: |
||||||||||||||||||||
| Purchased transportation and equipment rent |
615,327 | 560,024 | 592,493 | 581,980 | 498,296 | |||||||||||||||
| Direct personnel and related benefits |
205,905 | 178,441 | 163,069 | 145,841 | 122,502 | |||||||||||||||
| Commission expense |
43,922 | 39,248 | 42,157 | 42,593 | 39,457 | |||||||||||||||
| Operating expenses (exclusive of items shown seperately) |
115,154 | 79,263 | 71,117 | 66,313 | 53,703 | |||||||||||||||
| Occupancy expense |
26,520 | 20,049 | 19,275 | 18,438 | 16,688 | |||||||||||||||
| Selling, general, and administrative |
44,814 | 33,046 | 41,159 | 29,865 | 30,463 | |||||||||||||||
| Insurance and claims |
25,991 | 19,242 | 20,342 | 21,843 | 20,768 | |||||||||||||||
| Depreciation and amortization |
33,053 | 19,686 | 18,237 | 17,731 | 17,539 | |||||||||||||||
|
|
|
|
|
|
|
|
|
|
|
|||||||||||
| Total operating expenses |
1,110,686 | 948,999 | 967,849 | 924,604 | 799,416 | |||||||||||||||
|
|
|
|
|
|
|
|
|
|
|
|||||||||||
| Income from operations |
80,835 | 84,493 | 69,157 | 66,068 | 52,452 | |||||||||||||||
| Interest income |
46 | 130 | 241 | 83 | 199 | |||||||||||||||
| Interest expense |
(8,229 | ) | (4,166 | ) | (4,224 | ) | (2,241 | ) | (1,593 | ) | ||||||||||
| Other non-operating income (loss) |
447 | 459 | 2,778 | 1,743 | 5,937 | |||||||||||||||
|
|
|
|
|
|
|
|
|
|
|
|||||||||||
| Income before provision for income taxes |
73,099 | 80,916 | 67,952 | 65,653 | 56,995 | |||||||||||||||
| Provision for income taxes |
27,729 | 30,344 | 20,264 | 14,207 | 11,286 | |||||||||||||||
|
|
|
|
|
|
|
|
|
|
|
|||||||||||
| Net income |
$ | 45,370 | $ | 50,572 | $ | 47,688 | $ | 51,446 | $ | 45,709 | ||||||||||
|
|
|
|
|
|
|
|
|
|
|
|||||||||||
| Earnings per common share: |
||||||||||||||||||||
| Basic |
$ | 1.51 | $ | 1.68 | $ | 1.59 | $ | 1.71 | $ | 1.50 | ||||||||||
| Diluted |
$ | 1.51 | $ | 1.68 | $ | 1.59 | $ | 1.71 | $ | 1.50 | ||||||||||
| Weighted average number of common shares outstanding: |
||||||||||||||||||||
| Basic |
30,013 | 30,064 | 30,032 | 30,121 | 30,445 | |||||||||||||||
| Diluted |
30,044 | 30,160 | 30,036 | 30,121 | 30,445 | |||||||||||||||
| Dividends paid per common share |
$ | 0.28 | $ | 0.14 | $ | — | $ | — | $ | — | ||||||||||
|
|
|
|
|
|
|
|
|
|
|
|||||||||||
| Pre-merger dividends paid per common share |
$ | — | $ | — | $ | 1.00 | $ | 1.00 | $ | — | ||||||||||
|
|
|
|
|
|
|
|
|
|
|
|||||||||||
36
Table of Contents
| Years ended December 31, | ||||||||||||||||||||
| 2014 | 2013 | 2012 | 2011 | 2010 | ||||||||||||||||
| (In thousands, except per share information, operating data and percentages) |
||||||||||||||||||||
| Balance Sheet Data (at end of period): |
||||||||||||||||||||
| Cash and cash equivalents |
$ | 8,001 | $ | 10,223 | $ | 2,554 | $ | 5,511 | $ | 9,773 | ||||||||||
| Total assets |
$ | 529,014 | $ | 490,136 | $ | 327,369 | $ | 315,847 | $ | 294,841 | ||||||||||
| Total debt |
$ | 235,298 | $ | 237,500 | $ | 146,000 | $ | 83,061 | $ | 63,544 | ||||||||||
| Pro Forma Data (unaudited): |
||||||||||||||||||||
| Income before provision for income taxes |
$ | 67,952 | $ | 65,653 | $ | 56,995 | ||||||||||||||
| Pro forma provision for income taxes (1) |
31,323 | 26,223 | 22,323 | |||||||||||||||||
|
|
|
|
|
|
|
|||||||||||||||
| Pro forma net income |
$ | 36,629 | $ | 39,430 | $ | 34,672 | ||||||||||||||
|
|
|
|
|
|
|
|||||||||||||||
| Pro forma earnings per share: |
||||||||||||||||||||
| Basic |
$ | 1.22 | $ | 1.31 | $ | 1.14 | ||||||||||||||
| Diluted |
$ | 1.22 | $ | 1.31 | $ | 1.14 | ||||||||||||||
| Other Data: |
||||||||||||||||||||
| EBITDA (5) |
$ | 113,888 | $ | 104,179 | $ | 87,394 | $ | 83,799 | $ | 69,991 | ||||||||||
| EBITDA margin (5) |
9.6 | % | 10.1 | % | 8.4 | % | 8.5 | % | 8.2 | % | ||||||||||
| Adjusted EBITDA (2) |
$ | 113,888 | $ | 104,902 | $ | 97,645 | $ | 83,799 | $ | 69,991 | ||||||||||
| Adjusted EBITDA margin (5) |
9.6 | % | 10.2 | % | 9.4 | % | 8.5 | % | 8.2 | % | ||||||||||
| Operating margin (5) |
6.8 | % | 8.2 | % | 6.7 | % | 6.7 | % | 6.2 | % | ||||||||||
| Adjusted operating margin (5) |
6.8 | % | 8.2 | % | 7.7 | % | 6.7 | % | 6.2 | % | ||||||||||
| Return on average assets (6) |
8.9 | % | 12.4 | % | 14.8 | % | 16.8 | % | 15.7 | % | ||||||||||
| Average number of employees |
4,219 | 3,449 | 2,484 | 2,376 | 2,238 | |||||||||||||||
| Average number of full time equivalents |
1,528 | 1,786 | 2,182 | 1,605 | 1,135 | |||||||||||||||
| Average number of tractors |
4,180 | 4,123 | 3,999 | 4,024 | 3,989 | |||||||||||||||
| Number of facilities managed (7) |
45 | 43 | 41 | 37 | 29 | |||||||||||||||
| Number of agents (8) |
288 | 307 | 353 | 385 | 402 | |||||||||||||||
| Operating revenues per loaded mile (9) |
$ | 3.21 | $ | 2.96 | $ | 2.93 | $ | 2.75 | $ | 2.46 | ||||||||||
| Operating revenues per load (9) |
$ | 850 | $ | 794 | $ | 775 | $ | 768 | $ | 720 | ||||||||||
| Average length of haul (in miles) (9) |
265 | 269 | 265 | 279 | 292 | |||||||||||||||
| Number of loads (9) |
951,884 | 926,171 | 996,094 | 994,147 | 890,627 | |||||||||||||||
| Fuel surcharge revenues (where separately identified) |
$ | 119,749 | $ | 118,594 | $ | 115,208 | $ | 110,574 | $ | 67,429 | ||||||||||
| (1) | Pro forma provision for income taxes is computed to give effect to the termination of LINC’s S Corporation status and acquisition by Universal. We assume a blended statutory federal, state and local income tax rates of 46.1%, 39.9% and 39.2% in 2012, 2011 and 2010, respectively |
| (2) | In addition to providing consolidated financial statements based on generally accepted accounting principles in the United States of America (GAAP), we are providing additional financial measures that are not required by or prepared in accordance with GAAP (non-GAAP). We present adjusted income from operations and adjusted EBITDA as supplemental measures of our performance. We define adjusted income from operations as income from operations adjusted to eliminate the impact of certain items that we do not consider indicative of our ongoing operating performance, including transaction and other costs related to our acquisitions of Westport and LINC and previous costs related to LINC’s capital market activity, which was terminated in the second quarter of 2012. We define adjusted EBITDA as net income plus (i) interest expense, net, (ii) provision for income taxes and (iii) depreciation and amortization, and less other non-operating income, or EBITDA, further adjusted to eliminate the impact of certain items that we do not consider indicative of our ongoing operating performance, including transaction and other costs related to our acquisitions of Westport and LINC and previous costs related to LINC’s capital market activity. These further adjustments are itemized below. You are encouraged to evaluate these adjustments and the reasons we consider them appropriate for supplemental analysis. In evaluating adjusted income from operations and |
37
Table of Contents
| adjusted EBITDA, you should be aware that in the future we may incur expenses that are the same as or similar to some of the adjustments in this presentation. Our presentation of adjusted income from operations and adjusted EBITDA should not be construed as an inference that our future results will be unaffected by unusual or non-recurring items. |
In accordance with the requirements of Regulation G issued by the Securities and Exchange Commission, we are presenting the most directly comparable GAAP financial measure and reconciling the non-GAAP financial measure to the comparable GAAP measure. Set forth below is a reconciliation of income from operations, the most comparable GAAP measure, to adjusted income from operations; and of net income, the most comparable GAAP measure, to EBITDA and adjusted EBITDA for each of the periods indicated:
| Years ended December 31, | ||||||||||||||||||||
| 2014 | 2013 | 2012 | 2011 | 2010 | ||||||||||||||||
| (In thousands, except per share information, operating data and percentages) |
||||||||||||||||||||
| Adjusted income from operations |
||||||||||||||||||||
| Income from operations |
$ | 80,835 | $ | 84,493 | $ | 69,157 | $ | 66,068 | $ | 52,452 | ||||||||||
| Transaction and other costs (3) |
— | 723 | 8,369 | — | — | |||||||||||||||
| Suspended capital markets activity (4) |
— | — | 1,882 | — | — | |||||||||||||||
|
|
|
|
|
|
|
|
|
|
|
|||||||||||
| Adjusted income from operations |
$ | 80,835 | $ | 85,216 | $ | 79,408 | $ | 66,068 | $ | 52,452 | ||||||||||
|
|
|
|
|
|
|
|
|
|
|
|||||||||||
| Adjusted EBITDA |
||||||||||||||||||||
| Net income |
$ | 45,370 | $ | 50,572 | $ | 47,688 | $ | 51,446 | $ | 45,709 | ||||||||||
| Provision for income taxes |
27,729 | 30,344 | 20,264 | 14,207 | 11,286 | |||||||||||||||
| Interest expense, net |
8,183 | 4,036 | 3,983 | 2,158 | 1,394 | |||||||||||||||
| Depreciation and amortization |
33,053 | 19,686 | 18,237 | 17,731 | 17,539 | |||||||||||||||
| Other non-operating income |
(447 | ) | (459 | ) | (2,778 | ) | (1,743 | ) | (5,937 | ) | ||||||||||
|
|
|
|
|
|
|
|
|
|
|
|||||||||||
| EBITDA |
113,888 | 104,179 | 87,394 | 83,799 | 69,991 | |||||||||||||||
| Merger transaction costs (3) |
— | 723 | 8,369 | — | — | |||||||||||||||
| Suspended capital markets activity (4) |
— | — | 1,882 | — | — | |||||||||||||||
|
|
|
|
|
|
|
|
|
|
|
|||||||||||
| Adjusted EBITDA |
$ | 113,888 | $ | 104,902 | $ | 97,645 | $ | 83,799 | $ | 69,991 | ||||||||||
|
|
|
|
|
|
|
|
|
|
|
|||||||||||
We present adjusted income from operations and adjusted EBITDA in this Form 10-K because we believe it assists investors and analysts in comparing our performance across reporting periods on a consistent basis by excluding items that we do not believe are indicative of our core operating performance.
Adjusted income from operations and adjusted EBITDA have limitations as an analytical tool. Some of these limitations are:
| • | Adjusted income from operations and adjusted EBITDA do not reflect our cash expenditures, or future requirements, for capital expenditures or contractual commitments; |
| • | Adjusted income from operations and adjusted EBITDA do not reflect changes in, or cash requirements for, our working capital needs; |
| • | Adjusted income from operations and adjusted EBITDA do not reflect the significant interest expense, or the cash requirements necessary to service interest or principal payments, on our debts; |
| • | although depreciation and amortization are non-cash charges, the assets being depreciated and amortized will often have to be replaced in the future, and adjusted EBITDA does not reflect any cash requirements for such replacements; |
38
Table of Contents
| • | Adjusted income from operations and adjusted EBITDA do not reflect the impact of certain cash charges resulting from matters we consider not to be indicative of our ongoing operations; and |
| • | Other companies in our industry may calculate adjusted income from operations and adjusted EBITDA differently than we do, limiting its usefulness as a comparative measure. |
Because of these limitations, adjusted income from operations and adjusted EBITDA should not be considered in isolation or as a substitute for performance measures calculated in accordance with GAAP. We compensate for these limitations by relying primarily on our GAAP results and using adjusted income from operations and Adjusted EBITDA only supplementally.
| (3) | Represents transaction and other costs incurred that were directly related to the acquisitions of Westport in December 2013 and LINC in October 2012. |
| (4) | Represents expenses incurred as a result of LINC’s preparations for an IPO in early 2012. When the IPO efforts were abandoned in May 2012, the costs were then taken as a charge to income. |
| (5) | Operating margin, adjusted operating margin, EBITDA margin, and Adjusted EBITDA margin are computed by dividing income from operations, adjusted income from operations, EBITDA, and Adjusted EBITDA, respectively, by total operating revenues for each of the periods indicated. |
| (6) | Net income divided by total average assets during the period. Average assets are the sum of our total assets at the end of the fiscal year and our total assets at the end of the prior fiscal year divided by two. |
| (7) | Excludes storage yards, terminals and office facilities. |
| (8) | Includes only those agents who generated at least $100,000 in operating revenues during the period indicated. |
| (9) | Includes fuel surcharges, where separately identifiable, and excludes Universal Logistics Solutions International, Inc., in order to improve the relevance of the statistical data related to our brokerage services and improve the comparability to our peer companies. Also excludes final mile delivery and shuttle service loads. |
39
Table of Contents
| ITEM 7: | MANAGEMENT’S DISCUSSION AND ANALYSIS OF FINANCIAL CONDITION AND RESULTS OF OPERATIONS |
Overview
We are a leading asset-light provider of customized transportation and logistics solutions throughout the United States, Mexico, Canada, and Colombia. In October 2012, we acquired LINC Logistics Company (LINC). Universal and LINC were under common control, and as such, the financial statements of Universal have been retrospectively revised to reflect the accounts of LINC as if they had been consolidated for all previous periods. The acquisition significantly enhanced our position as a leading provider of third party transportation, value-added and intermodal services. In December 2013, we acquired Westport USA Holding, LLC (“Westport”) for $123.0 million in cash, subject to a working capital adjustment after closing. Pursuant to the terms of the Unit Purchase Agreement, Westport was acquired on a cash-free, debt-free basis. Based in Louisville, Kentucky, Westport provides value-added warehousing and component distribution services to U.S. manufacturers of Class 4-8 trucks, RVs and super-duty trucks. Westport also machines and distributes steering knuckles and axle components for the automotive industry. The acquisition of Westport further enhances our value-added service capabilities.
We provide a comprehensive suite of transportation and logistics solutions that allow our customers and clients to reduce costs and manage their global supply chains more efficiently. We market our services through a direct sales and marketing network focused on selling our portfolio of services to large customers in specific industry sectors, through a contract network of agents who solicit freight business directly from shippers, and through company-managed facilities and full-service freight forwarding and customs house brokerage offices.
Our network of agents and owner-operators is located throughout the United States and in the Canadian provinces of Ontario and Quebec, and we operate, manage or provide transportation services at 83 logistics locations in the United States, Mexico and Canada. Seventeen of our value-added service operations are located inside customer plants or distribution operations; the other facilities are generally located close to our customers’ plants to optimize the efficiency of their component supply chains and production processes. Our facilities and services are often directly integrated into the production processes of our customers and represent a critical piece of their supply chains. To support our asset-light business model, we generally try to coordinate the length of real estate leases associated with our value-added services with the end date of the related customer contract associated with such facility, or use month-to-month leases, in order to mitigate exposure to unrecovered lease costs.
We offer our customers a wide range of transportation services by utilizing a diverse fleet of tractors and trailing equipment provided by us, our owner-operators and third-party transportation companies. Our owner-operators provided us with approximately 3,300 tractors and 1,675 trailers. We own approximately 1,000 tractors, 4,600 trailers, 950 chassis and 800 containers. Our agents and owner-operators are independent contractors who earn a fixed commission calculated as a percentage of the revenue or gross profit they generate for us and who bring an entrepreneurial spirit to our business. Our transportation services are provided through a network of both union and non-union employee drivers, owner-operators, contract drivers, and third-party transportation companies.
We employ 4,218 people in the United States, Mexico and Canada, including 1,512 employees subject to collective bargaining agreements. We also engaged staffing contract vendors to supply an average of 1,528 additional personnel on a full-time-equivalent basis.
Our use of agents, owner-operators, third-party providers and contract staffing vendors allows us to maintain both a highly flexible cost structure and a scalable business operation, while reducing investment requirements. These benefits are passed on to our customers in the form of cost savings and increased operating efficiency, while enhancing our cash generation and the returns on our invested capital and assets.
We believe that our flexible business model also offers us substantial opportunities to grow through a mixture of organic growth and acquisitions. We intend to continue our organic growth by recruiting new agents and
40
Table of Contents
owner-operators, expanding into new industry verticals and targeting further penetration of our key customers. We believe our integrated suite of transportation and logistics services, our network of facilities in the United States, Mexico and Canada, our long-term customer relationships and our reputation for operational excellence will allow us to capitalize on these growth opportunities. We also expect to continue to make strategic acquisitions of companies that complement our asset light business model, as well as companies that derive a portion of their revenues from asset based operations.
Factors Affecting Our Revenues
Operating Revenues. We generate substantially all of our revenues through fees charged to customers for the transportation of freight and for the customized logistics services we provide. We also derive revenue from fuel surcharges, where separately identifiable, loading and unloading activities, equipment detention, container management and storage and other related services. Operations aggregated in our transportation segment are associated with individual freight shipments coordinated by our agents, company-managed terminals and specialized services operations. In contrast, operations aggregated in our logistics segment deliver value-added services and transportation services to specific customers on a dedicated basis, generally pursuant to contract terms of one year or longer. Our segments are distinguished by the amount of forward visibility we have in regards to pricing and volumes, and also by the extent to which we dedicate resources and company-owned equipment. Fees charged to customers by our full service international freight forwarding and customs house brokerage are based on the specific means of forwarding or delivering freight on a shipment-by-shipment basis.
Our transportation revenues are primarily influenced by fluctuations in freight volumes and shipping rates. The main factors that affect these are competition, available truck capacity, and economic market conditions. Our value-added contract business is substantially driven by the level of demand for outsourced logistics services. Major factors that affect our revenues include changes in manufacturing supply chain requirements, production levels in specific industries, pricing trends due to levels of competition and resource costs in logistics and transportation, and economic market conditions.
We recognize revenue on a gross basis at the time that persuasive evidence of an arrangement with our customer exists, sales price is fixed and determinable, and collectability is reasonably assured. Our revenue is recognized at the time of delivery to the receiver’s location, or for service arrangements, after the related services have been rendered.
Factors Affecting Our Expenses
Purchased transportation and equipment rent. Purchased transportation and equipment rent represents the amounts we pay to our owner-operators or other third party equipment providers to haul freight and, to the extent required to deliver certain logistics services, the cost of equipment leased under short-term contracts from third parties. The amount of the purchased transportation we pay to our owner-operators is primarily based on a contractually agreed-upon percentage of our revenue for each load hauled. The expense also includes the amount of fuel surcharges, where separately identifiable, that we receive from our customers and pass through to our owner-operators. Our strategy is to maintain a highly flexible business model that employs a cost structure that is mostly variable in nature. As a result, purchased transportation and equipment rent is the largest component of our costs and increases or decreases proportionately with changes in the amount of revenue generated by our owner-operators and other third party providers and with the production volumes of our customers. We recognize purchased transportation and equipment rent as the services are provided.
Direct personnel and related benefits. Direct personnel and related benefits include the salaries, wages and fringe benefits of our employees, as well as costs related to contract labor utilized in operating activities. These costs are a significant component of our cost structure and increase or decrease proportionately with the expansion, addition or closing of operating facilities. As of December 31, 2014, approximately 36% of our employees were subject to collective bargaining agreements. Any changes in union agreements will affect our personnel and
41
Table of Contents
related benefits cost. The operations in the United States, Mexico and Canada that are subject to collective bargaining agreements have separate, individualized agreements with several different unions that represent employees in these operations. While there are some facilities with multiple unions, each collective bargaining agreement with each union covers a single facility for that union. Such agreements have expiration dates that are generally independent of other collective bargaining agreements and include economics and operating terms tailored to the specific operational requirements of a customer. Our operation in Mexico provides competitive compensation within the Mexican statutory framework for managerial and supervisory personnel.
Commission expense. Commission expense represents the amount we pay our agents for generating shipments on our behalf. The commissions we pay to our agents are generally established through informal oral agreements and are based on a percentage of revenue or gross profit generated by each load hauled. Traditionally, commission expense increase or decrease in proportion to the revenues generated through our agents. We recognize commission expenses at the time we recognize the associated revenue.
Operating expense (exclusive of items shown separately). These expenses include items such as fuel, tires and parts repair items primarily related to the maintenance of company owned/leased tractors, trailers and lift equipment, as well as licenses, dock supplies, communication, utilities, operating taxes and other general operating expenses. We also receive rental income by leasing our trailers to owner-operators. These expenses are presented net of rental income. Because we maintain a flexible business model, our operating expenses (exclusive of items shown separately) generally relate to equipment utilization, fluctuations in customer demand and the related impact on our operating capacity. Our transportation services provided by company owned equipment depend on the availability and pricing of diesel fuel. Although we often include fuel surcharges in our billing to customers to offset increases in fuel costs, other operating costs have been, and may continue to be, impacted by fluctuating fuel prices. We recognize these expenses as they are incurred and the rental income as it is earned.
Occupancy expense. Occupancy expense includes all costs related to the lease and tenancy of terminals and operating facilities, except utilities, unless such costs are otherwise covered by our customers. Although occupancy expense is generally related to fluctuations in overall customer demand, our contracting and pricing strategies help mitigate the cost impact of changing production volumes. To minimize potential exposure to inactive or underutilized facilities that are dedicated to a single customer, we strive where possible to enter into lease agreements that are coterminous with individual customer contracts, and we seek contract pricing terms that recover fixed occupancy costs, regardless of production volume. Occupancy expense may also include certain lease termination and related occupancy costs that are accelerated for accounting purposes into the fiscal year in which such a decision was implemented.
Selling, general and administrative expense. Selling, general and administrative expense includes the salaries, wages and benefits of sales and administrative personnel, related support costs, taxes (other than income and property taxes), adjustments due to foreign currency transactions, bad debt expense, and other general expenses, including gains or losses on the sale or disposal of assets. These expenses are generally not directly related to levels of operating activity and may contain non-recurring or one-time expenses related to general business operations. We recognize selling, general and administrative expense when it is incurred.
Insurance and claims. Insurance and claims expense represents our insurance premiums and the accruals we make for claims within our self-insured retention amounts. Our insurance premiums are generally calculated based on a mixture of a percentage of line-haul revenue and the size of our fleet. Our accruals have primarily related to cargo and property damage claims. We may also make accruals for personal injuries and property damage to third parties, physical damage to our equipment, general liability and workers’ compensation claims if we experience a claim in excess of our insurance coverage. To reduce our exposure to non-trucking use liability claims (claims incurred while the vehicle is being operated without a trailer attached or is being operated with an attached trailer which does not contain or carry any cargo), we require our owner-operators to maintain non-trucking use liability coverage, which we refer to as deadhead bobtail coverage, of $2.0 million per occurrence.
42
Table of Contents
Our exposure to liability associated with accidents incurred by other third party providers who haul freight on our behalf is reduced by various factors including the extent to which they maintain their own insurance coverage. Our insurance expense varies primarily based upon the frequency and severity of our accident experience, insurance rates, our coverage limits and our self-insured retention amounts.
Depreciation and amortization. Depreciation and amortization expense relates primarily to the depreciation of owned tractors, trailers, computer and operating equipment, and buildings as well as the amortization of the intangible assets recorded for our acquired customer contracts and customer and agent relationships. We estimate the salvage value and useful lives of depreciable assets based on current market conditions and experience with past dispositions.
Operating Revenues
We broadly group our services into the following categories: transportation services, value-added services and intermodal services. Our intermodal services and transportation services associated with individual freight shipments coordinated by our agents and company-managed terminals are aggregated into our reportable transportation segment, while our value-added services and transportation services to specific customers on a dedicated basis make up our logistics segment. The following table sets forth operating revenues resulting from each of these service categories for the years ended December 31, 2014, 2013 and 2012, presented as a percentage of total operating revenues:
| Years ended December 31, | ||||||||||||
| 2014 | 2013 | 2012 | ||||||||||
| Operating revenues: |
||||||||||||
| Transportation services |
64.6 | % | 68.4 | % | 71.5 | % | ||||||
| Value-added servcies |
23.9 | 18.9 | 16.9 | |||||||||
| Intermodal services |
11.6 | 12.7 | 11.6 | |||||||||
|
|
|
|
|
|
|
|||||||
| Total operating revenues |
100.0 | % | 100.0 | % | 100.0 | % | ||||||
|
|
|
|
|
|
|
|||||||
Results of Operations
The following table sets forth items derived from our Consolidated Statements of Income for the years ended December 31, 2014, 2013 and 2012, presented as a percentage of operating revenues:
| Years ended December 31, | ||||||||||||
| 2014 | 2013 | 2012 | ||||||||||
| Operating revenues |
100.0 | % | 100.0 | % | 100.0 | % | ||||||
| Operating expenses: |
||||||||||||
| Purchased transportation and equipment rent |
51.6 | 54.2 | 57.1 | |||||||||
| Direct personnel and related benefits |
17.3 | 17.3 | 15.7 | |||||||||
| Commission expense |
3.7 | 3.8 | 4.1 | |||||||||
| Operating expenses (exclusive of items shown seperately) |
9.7 | 7.7 | 6.9 | |||||||||
| Occupancy expense |
2.2 | 1.9 | 1.9 | |||||||||
| Selling, general, and administrative |
3.8 | 3.2 | 4.0 | |||||||||
| Insurance and claims |
2.2 | 1.9 | 2.0 | |||||||||
| Depreciation and amortization |
2.8 | 1.9 | 1.8 | |||||||||
|
|
|
|
|
|
|
|||||||
| Total operating expenses |
93.2 | 91.8 | 93.3 | |||||||||
|
|
|
|
|
|
|
|||||||
| Income from operations |
6.8 | 8.2 | 6.7 | |||||||||
| Interest and other non-operating income (expense), net |
(0.7 | ) | (0.4 | ) | (0.1 | ) | ||||||
|
|
|
|
|
|
|
|||||||
| Income before provision for income taxes |
6.1 | 7.8 | 6.6 | |||||||||
| Provision for income taxes |
2.3 | 2.9 | 2.0 | |||||||||
|
|
|
|
|
|
|
|||||||
| Net income |
3.8 | % | 4.9 | % | 4.6 | % | ||||||
|
|
|
|
|
|
|
|||||||
43
Table of Contents
2014 Compared to 2013
Operating revenues. Operating revenues for 2014 increased by $158.0 million, or 15.3%, to $1.192 billion from $1.034 billion for 2013. Included in operating revenues are fuel surcharges, where separately identifiable, of $119.7 million for 2014, which compares to $118.6 million for 2013. Revenues from our transportation segment increased $73.0 million, or 10.4%, and income from operations increased $6.4 million, or 22.4% compared to the same period last year. In our logistics segment, revenues increased $85.0 million, or 26.0%, over the same period last year, and included $103.1 million of revenues from our December 2013 acquisition of Westport. Income from operations in our logistics segment decreased $7.8 million, or 13.3%, to $58.7 million compared to the same period last year, and also included the results of Westport, which contributed approximately $14.6 million to income from operations. Year-to-date operating margins continue to reflect the negative impact of the harsh weather conditions we experienced during the first quarter of 2014, as well as the price and cost challenges associated with our two largest dedicated transportation customers.
The increase in consolidated operating revenues was primarily the result of a $62.3 million increase in our transportation services and $103.1 million of acquisition revenue from Westport in our value-added service operations. These increases were partially offset by a decrease of $18.2 million in our existing value-added service business. The increase in transportation services was the result of both higher load volumes and improved operating revenues per loaded mile. The number of loads from our transportation operations increased to 643,000 for 2014 compared to 619,000 for 2013. Our operating revenue per loaded mile, excluding fuel surcharges increased to $2.61 from $2.39 for 2013.
The decreased demand in value-added services excluding Westport was primarily due to the phase out of an aerospace operation due to reductions in military spending, in-sourcing at an industrial customer’s value-added service operations, the closing of operations at an automotive customer’s location, and seasonal supply chain adjustments. At December 31, 2014, we provided value-added services at 45 locations, including 4 Westport locations, compared to 43 at December 31, 2013.
Our intermodal operations also experienced an increase in load volumes and higher operating revenues per loaded mile; however, this increase was partially offset by a $8.7 million reduction in our domestic container-related operations with an affiliate. The number of loads from our intermodal operations increased to 309,000 for 2014 compared to 307,000 for 2013, and our operating revenue per loaded mile, excluding fuel surcharges increased to $4.35 from $3.74 for 2013.
Purchased transportation and equipment rent. Purchased transportation and equipment rental costs for 2014 increased by $55.3 million, or 9.9%, to $615.3 million from $560.0 million for 2013. Purchased transportation and equipment rent generally increases or decreases in proportion to the revenues generated through owner-operators and other third party providers, and is generally correlated with changes in demand for transportation and intermodal services. Combined, transportation and intermodal service revenues increased 8.2% to $907.0 million for 2014 compared to $838.4 million for 2013. As a percentage of operating revenues, purchased transportation and equipment rent expense decreased to 51.6% for 2014 from 54.2% for 2013. This decrease is primarily due to a combined decrease in transportation and intermodal service revenues as a percentage of total operating revenues. Transportation and intermodal services revenues combined comprise 76.2% of total operating revenues for 2014 compared to 81.1% for 2013.
Direct personnel and related benefits. Direct personnel and related benefits expenses for 2014 increased by $27.5 million, or 15.4%, to $205.9 million compared to $178.4 million for 2013. Trends in these expenses are generally correlated with changes in operating facilities and headcount requirements and, therefore, increase with the level of demand for our value-added services and staffing needs of our operations. The increase in direct personnel and related benefits expense was primarily due to the operations of Westport, which accounted for $30.9 million of the expense. As a percentage of operating revenues, personnel and related benefits expenses remained consistent at 17.3% for both 2013 and 2014. The percentage is derived on an aggregate basis from both
44
Table of Contents
existing and new programs, and from customer operations at various stages in their lifecycles. Individual operations may be impacted by additional production shifts or by overtime at selected operations. While generalizations about the impact of personnel and related benefits costs as a percentage of total revenue are difficult, we manage compensation and staffing levels, including the use of contract labor, to maintain target economics based on near-term projections of demand for our services. The loss of productivity and additional labor and overtime needs to meet customer service obligations during the harsh winter experienced in the first quarter of 2014, and the lower productivity during the start-up phase of a dedicated transportation contract awarded in the second quarter 2014 both negatively impacted the year-to-date results.
Commission expense. Commission expense for 2014 increased by $4.7 million, or 12.0%, to $43.9 million from $39.2 million for 2013. The absolute increase was primarily due to increases in our operating revenues from transportation and intermodal services. Commission expense generally increases or decreases in proportion to our transportation and intermodal revenues, excluding where we generate a higher proportion of our revenues at company-managed terminals. As a percentage of operating revenues, commission expense decreased to 3.7% for 2014 compared to 3.8% for 2013. As a percentage of operating revenues, the decrease in commission expense is due to an increase in our value-added services operations, including Westport, where no commissions are paid.
Operating expenses (exclusive of items shown separately). Operating expenses (exclusive of items shown separately) increased by $35.9 million, or 45.3%, to $115.2 million for 2014, compared to $79.3 million for 2013. As a percentage of operating revenues, operating expenses (exclusive of items shown separately) increased to 9.7% for 2014 from 7.7% for 2013. These expenses include items such as fuel, maintenance, cost of materials, insurance, communications, utilities and other general expenses, and generally relate to fluctuations in customer demand. The increase was primarily due to the operations of Westport, which totaled $34.1 million in operating expenses (exclusive of items shown separately). Additional increases include increased fuel expenses on company owned tractors of $2.1 million and repair and maintenance expense of $2.4 million.
Occupancy expense. Occupancy expense for 2014 increased by $6.5 million, or 32.5%, to $26.5 million from $20.0 million for 2013. As a percentage of operating revenue, occupancy expense increased to 2.2% for 2014 compared to 1.9% for the same period last year. The absolute increase in occupancy expense is primarily attributable to the operations of Westport, which contributed approximately $5.8 million in additional building rents and related costs during the period.
Selling, general and administrative. Selling, general and administrative expense for 2014 increased by $11.8 million, or 35.8%, to $44.8 million from $33.0 million for 2013. As a percentage of operating revenues, selling, general and administrative expense increased to 3.8% for 2014 compared to 3.2% for 2013. The largest component of selling, general and administrative expense, salaries, wages and related benefits, increased $7.6 million, including $2.6 million attributable to Westport, $0.7 million of additional bonus expense, and an additional $0.9 million of stock-based compensation expense due to accelerated vesting of executive officers upon retirement. Also included in selling, general and administrative expense is $2.0 million charge for an uncollectible account related to a customer in the oil exploration industry. Minor fluctuations in other expense categories reflect our efforts to maintain stable overhead expenditures while expanding the business.
Insurance and claims. Insurance and claims expense for 2014 increased by $6.8 million, or 35.4%, to $26.0 million from $19.2 million for 2013. As a percentage of operating revenues, insurance and claims expense increased to 2.2% for 2014 from 1.9% for 2013. The absolute increase was primarily the result of an increase in cargo and service claims expense of $2.9 million and in our auto liability insurance premiums and claims expense of $3.8 million. The increase in auto liability insurance premiums and claims expense was primarily driven by an increase in our outstanding exposure to existing claims, including increased exposure resulting from our global reorganization and streamlining initiative.
Depreciation and amortization. Depreciation and amortization expense for 2014 increased by $13.4 million, or 68.0%, to $33.1 million from $19.7 million for 2013. The absolute increase is primarily the result of the
45
Table of Contents
acquisition of Westport. Amortization on Westport’s acquired intangible assets was $8.4 million, while depreciation expense on acquired machinery, equipment and leasehold improvement was approximately $2.5 million. Additional increases in depreciation expense are attributable to the significant investment in capital expenditures which totaled $59.8 million in 2014. These increases were partially offset by decreases in certain other intangible assets becoming fully amortized.
Interest expense, net. Net interest expense was $8.2 million for 2014 compared to $4.0 million for 2013. As of December 31, 2014, we had outstanding borrowings totaling $235.3 million, including $120.5 million advanced on December 19, 2013 in connection with our acquisition of Westport, compared to $237.5 million at December 31, 2013.
Other non-operating income. Other non-operating income was $0.4 million in both 2014 and 2013. There were no significant or unusual items impacting other non-operating income.
Provision for income taxes. Provision for income taxes for 2014 was $27.7 million compared to $30.3 million for 2013, based on an effective tax rate of 37.9% and 37.5%, respectively.
2013 Compared to 2012
Operating revenues. Operating revenues for 2013 decreased by $3.5 million, or 0.3%, to $1.034 billion from $1.037 billion for 2012. Revenues from our transportation segment decreased by $41.8 million, or 5.6%, compared to the same period last year, and income from operations decreased to $28.5 million for 2013 compared to $30.6 million for 2012. In our logistics segment, revenues increased by $38.2 million, or 13.2%, compared to the same period last year. Income from operations in our logistics segment increased by $9.2 million, or 18.6%, to $58.7 million for 2013 from $49.5 million for 2012. Included in operating revenues are fuel surcharges, where separately identifiable, of $118.6 million for the 2013, which compares to $115.2 million for 2012.
The decrease in consolidated operating revenues was primarily the result of a $34.7 million decrease in transportation services, which was primarily offset by increases of $20.1 million in our value-added services and $11.0 million in our intermodal services, respectively. Although demand has improved in certain of our market sectors throughout 2013, including automotive, wind-energy and oil and gas, overall load counts in our transportation services continue to be below the levels we experienced last year. Volumes have been negatively impacted by the exiting of certain underperforming sales channels last year and lower volumes in certain market sectors, including government services, building products and metals. The number of loads from our transportation operations decreased to approximately 619,000 for 2013 compared to approximately 678,000 for 2012. Our operating revenue per loaded mile, excluding fuel surcharges decreased slightly to $2.39 for 2013 from $2.42 for 2012.
Overall, demand for our value-added services increased during 2013 with the launch of several new operations for our existing automotive and industrial customers, as well as improving volumes with our existing programs. The pace of growth throughout the year however was dampened during the fourth quarter of 2013 resulting from the phasing out of an aerospace operation due to reductions in military spending, additional scheduled holiday downtime and in-sourcing at an industrial customer’s value-added service operation. At December 31, 2013, we provided value-added services at 43 locations compared to 41 at December 31, 2012. Our average headcount, which is significantly impacted by growth in services delivered, grew by 12% compared to the same period last year.
Our intermodal services increased by $11.0 million, or 9.1%, to $131.4 million for 2013 from $120.4 million for 2012. The increase was primarily driven by an increase in our operating revenues per loaded mile, which was partially offset by decreases in the number of loads hauled and in our domestic container-related operations with an affiliate. Our operating revenue per loaded mile, excluding fuel surcharges, increased to $3.74 for 2013 from
46
Table of Contents
$3.40 for 2012. The total number of intermodal loads hauled decreased during 2013 to approximately 307,000 compared to approximately 318,000 for 2012.
Purchased transportation and equipment rent. Purchased transportation and equipment rental costs for 2013 decreased by $32.5 million, or 5.5%, to $560.0 million from $592.5 million for 2012. Purchased transportation and equipment rent generally increases or decreases in proportion to the revenues generated through owner-operators and other third party providers, and is generally correlated with changes in demand for transportation and intermodal services. Combined, transportation and intermodal service revenues decreased 2.7% to $838.4 million for 2013 compared to $862.1 million for 2012. As a percentage of operating revenues, purchased transportation and equipment rent expense decreased to 54.2% for 2013 from 57.1% for 2012. This decrease is primarily due to a combined increase in intermodal and value-added service revenues as a percentage of total revenues, which have typically operated with lower purchased transportation and equipment rental costs. Value-added and intermodal services revenues combined comprise 31.6% of total operating revenues for 2013 compared to 28.5% for 2012.
Direct personnel and related benefits. Direct personnel and related benefits expenses for 2013 increased by $15.3 million, or 9.4%, to $178.4 million compared to $163.1 million for 2012. Trends in these expenses are generally correlated with changes in operating facilities and headcount requirements and, therefore, increase with the level of demand for our value-added services and staffing needs of our operations. As a percentage of revenue, personnel and related benefits expenses increased to 17.3% for 2013, compared to 15.7% for 2012. The percentage is derived on an aggregate basis from both existing and new programs, and from customer operations at various stages in their lifecycles. Individual operations may be impacted by additional production shifts or by overtime at selected operations. While generalizations about the impact of personnel and related benefits costs as a percentage of total revenue are difficult, we manage compensation and staffing levels, including the use of contract labor, to maintain target economics based on near-term projections of demand for our services.
Commission expense. Commission expense for 2013 decreased by $3.0 million, or 7.1%, to $39.2 million from $42.2 million for 2012. The absolute decrease was primarily due to the decrease in our operating revenues from transportation services. Commission expense generally increases or decreases in proportion to our transportation and intermodal revenues, excluding where we generate a higher proportion of our revenues at company-managed terminals. As a percentage of operating revenues, commission expense decreased to 3.8% for 2013 compared to 4.1% for 2012. As a percentage of revenues, the decrease in commission expense is due to an increase in fuel surcharges, which are generally passed through to our owner-operators, and a shift in the mix of revenues generated by company managed-locations and value-added services operations where no commissions are paid.
Operating expenses (exclusive of items shown separately). Operating expenses (exclusive of items shown separately) increased by $8.2 million, or 11.5%, to $79.3 million for 2013, compared to $71.1 million for 2012. As a percentage of operating revenues, other operating expenses (exclusive of items shown separately) increased to 7.7% for 2013 from 6.9% for 2012. These expenses include items such as fuel, maintenance, insurance, communications, utilities and other general expenses, and generally relate to fluctuations in customer demand. The increase is primarily due to an increase in fuel expenses on company owned tractors of $2.4 million, repairs and maintenance of $2.4 million, utilities of $1.0 million, and $1.8 million of other operating expense primarily due to new business at our value-added locations. Additional elements of the increase in operating expenses (exclusive of items shown separately) include increases in meals cost, security, office and dock supplies. These increases were partially offset by a decrease of $0.5 million in permit costs primarily attributable to a decrease in our heavy-haul operations.
Occupancy expense. Occupancy expense for 2013 increased by $0.7 million, or 3.6%, to $20.0 million from $19.3 million for 2012. As a percentage of operating revenue, occupancy expense remained consistent at 1.9% for both 2013 and 2012. Included in the increase was additional rental expense related to new operating locations, including our recently acquired Westport operations, as well as added space at existing facilities. These increases were partially offset by rental rate reductions and sub-letting of space at various existing facilities.
47
Table of Contents
Selling, general and administrative. Selling, general and administrative expense decreased by $8.2 million, or 19.9%, to $33.0 million from $41.2 million for 2012. Included in selling, general and administrative expense during 2012 were $8.4 million of transaction fees and other costs that were directly related to the acquisition of LINC and $1.9 million of LINC’s IPO costs that were taken as a charge to income when the efforts were abandoned in May 2012. Excluding acquisition and IPO-related charges, as a percentage of operating revenues, selling, general and administrative expense increased to 3.2% for 2013 compared to 3.0% for 2012. The largest component of selling, general and administrative expense, salaries and wages, increased by $0.5 million compared to the prior year, and there were also increases in professional fees of $1.5 million, bad debts and uncollectible agent loans of $0.4 million and other selling, general and administrative expense of $0.2 million. Included in legal and professional fees are costs incurred in connection with IT and sales support initiatives, a suspended private placement note offering, Westport acquisition costs and increased corporate development activity.
Insurance and claims. Insurance and claims expense for 2013 decreased by $1.1 million, or 5.4%, to $19.2 million from $20.3 million for 2012. As a percentage of operating revenues, insurance and claims decreased slightly to 1.9% for 2013 from 2.0% for 2012. The absolute decrease was primarily the result of decreases in auto liability insurance premiums and claims expense of $1.9 million, which was partially offset by an increase in our cargo and service claims expense of $0.9 million.
Depreciation and amortization. Depreciation and amortization expense for 2013 increased by $1.5 million, or 8.2%, to $19.7 million from $18.2 million for 2012. The absolute increase is primarily the result of additional depreciation totaling $2.4 million on our capital expenditures made throughout 2012, particularly related to enhancements to our Mexican assembly line placed in service in December 2012. This increase was partially offset by a decrease in amortization of $0.9 million due to certain intangible assets becoming fully amortized.
Interest expense, net. Net interest expense was $4.0 million for 2013 and 2012. As of December 31, 2014, we had outstanding borrowings totaling $237.5 million, including $120.5 million advanced on December 19, 2013 in connection with our acquisition of Westport, compared to $146.0 million outstanding at December 31, 2013.
Other non-operating income. Other non-operating income for 2013 was $0.4 million compared to $2.8 million for 2012. Included in other non-operating income for 2013 were $0.1 million in pre-tax gains on the sales of marketable equity securities compared to $2.2 million in 2012.
Provision for income taxes. Provision for income taxes for 2013 was $30.3 million compared to $20.3 million for 2012, based on an effective tax rate of 37.5% and 29.8%, respectively. Prior to the merger, LINC elected to be treated as a “Subchapter S corporation” for federal income tax purposes. As a result, the financial results related to LINC for the first three quarters of 2012 incurred no federal income tax liabilities or, in many jurisdictions, state or local tax liabilities. Additionally, due to the nature of certain costs and expenses associated with the LINC merger, approximately $6.8 million of transaction costs were not deductible for tax purposes in 2012.
Liquidity and Capital Resources
Our primary sources of liquidity are funds generated by operations, our availability under our $120 million revolving credit and $60 million equipment credit facilities, our ability to borrow on margin against our marketable securities held at UBS, and proceeds from the sales of marketable securities. Additionally, our revolving credit facility includes an accordion feature which would allow us to increase availability by up to $20 million upon our request and approval of the lenders.
We employ an asset-light operating strategy which we believe lowers our capital expenditure requirements. In general, our facilities used in our value-added services are leased on terms that are either substantially matched to our customer’s contracts, are month-to-month or are provided to us by our customers. We also utilize owner-operators and third-party carriers to provide a significant portion of our transportation and specialized services. A
48
Table of Contents
significant portion of the tractors and trailers used in our business are provided by our owner-operators. In addition, our use of agents reduces our overall need for large terminals. As a result, our capital expenditure requirements are limited in comparison to most large transportation and logistics service providers, which maintain significant properties and sizable fleets of owned tractors and trailers.
In 2014, our capital expenditures totaled $59.8 million. These expenditures primarily consisted of transportation equipment and investments in support of our value-added service operations. Our asset-light business model depends somewhat on the customized solutions we implement for specific customers. As a result, our capital expenditures will depend on specific new contracts and the overall age and condition of our owned transportation equipment. In 2015, exclusive of acquisitions of businesses, we expect to incur capital expenditures in the range of 3.5% to 5% of operating revenues for the acquisition of transportation equipment, to support our value-added service operations and for the acquisition of real property and improvements to our existing terminal yard and container facilities.
On July 24, 2013, our Board of Directors approved a cash dividend policy, which anticipates a total annual dividend of $0.28 per share of common stock, payable in quarterly increments of $0.07 per share of common stock. We paid $0.28 per common share, or $8.4 million, during the year ended December 31, 2014. On February 19, 2015, our Board of Directors declared a quarterly cash dividend of $0.07 per share of common stock, which is payable to shareholders of record at the close of business on March 2, 2015 and was paid on March 12, 2015. Declaration of future cash dividends are subject to final determination by the Board of Directors each quarter after its review of our financial condition, results of operations, capital requirements, any legal or contractual restrictions on the payment of dividends and other factors the Board of Directors deems relevant.
We expect that our cash flow from operations, working capital and available borrowings will be sufficient to meet our capital commitments and fund our operational needs for at least the next twelve months. Based on the availability of borrowings under our credit facilities, against our marketable security portfolio and other financing sources, and assuming the continuation of our current level of profitability, we do not expect that we will experience any liquidity constraints in the foreseeable future.
We continue to evaluate business development opportunities, including potential acquisitions that fit our strategic plans. There can be no assurance that we will identify any opportunities that fit our strategic plans or will be able to execute any such opportunities on terms acceptable to us. Depending on prospective consideration to be paid for an acquisition, any such opportunities would be financed first from available cash and cash equivalents and availability of borrowings under our credit facilities.
Revolving Credit and Term Loan Agreement
On December 19, 2013, the Company entered into a Second Amendment, the Amendment, to its Revolving Credit and Term Loan Agreement dated August 28, 2012, the Credit Agreement, with and among the lenders parties thereto and Comerica Bank, as administrative agent, to provide for aggregate borrowing facilities of up to $300 million. The Amendment modifies the Credit Agreement to allow for additional borrowings of $70 million under a new term loan and a $10 million increase in the revolving credit facility. The Credit Agreement, as amended, consists of a $120 million revolving credit facility (which amount may be increased by up to $20 million upon request of the Company and approval of the lenders), a $60 million equipment credit facility, a $50 million term loan, and a $70 million term loan B. Additionally, the Credit Agreement provides for up to $5 million in letters of credit, which letters of credit reduce availability under the revolving credit facility. Borrowings under the revolving credit facility may be made until, and mature on, August 28, 2017. Borrowings under the equipment credit facility may be made until August 28, 2015, and such borrowings made in any year shall be repaid in 28 quarterly installments beginning on April 1 of the year after the applicable borrowing was made. Borrowings under the term loan facilities shall mature on August 28, 2017. Borrowings under the Credit Agreement bear interest at LIBOR or a base rate, plus an applicable margin for each. The applicable margin fluctuates based on the Company’s total debt to EBITDA ratio, as defined in the Credit Agreement.
49
Table of Contents
The Credit Agreement requires us to repay the borrowings made under the term loan facility and the equipment credit facility as follows: 50% (which percentage shall be reduced to 0% subject to the Company attaining a certain leverage ratio) of our annual excess cash flow, as defined; 100% of net cash proceeds of certain asset sales; and 100% of certain insurance and condemnation proceeds. We may voluntarily repay outstanding loans under each of the facilities at any time, subject to certain customary “breakage” costs with respect to LIBOR-based borrowings. In addition, we may elect to permanently terminate or reduce all or a portion of the revolving credit facility.
All obligations under the Credit Agreement are unconditionally guaranteed by our material U.S. subsidiaries and the obligations of the Company and such subsidiaries under the Credit Agreement and such guarantees are secured by, subject to certain exceptions, substantially all of their assets. The Credit Agreement also may, in certain circumstances, limit our ability to pay dividends or distributions. The Credit Agreement includes financial covenants requiring us to maintain maximum leverage ratios and a minimum fixed charge coverage ratio, as well as customary affirmative and negative covenants and events of default. At December 31, 2014, the Company was in compliance with its debt covenants. As of December 31, 2014, there were no letters of credit issued under the Credit Agreement, and the outstanding balance was $235.3 million. At December 31, 2014, our $59.5 million revolver advance was secured by, among other assets, net eligible accounts receivable totaling $122.4 million, of which, $104.1 million were available for borrowing pursuant to the agreement.
Secured Line of Credit
The Company maintains a secured borrowing facility at UBS Financial Services, Inc., or UBS, using its marketable securities as collateral for the short-term line of credit. The line of credit bears an interest rate equal to LIBOR plus 1.10%, and interest is adjusted and billed monthly. No principal payments are due on the borrowing; however, the line of credit is callable at any time. The amount available under the line of credit is based on a percentage of the market value of the underlying securities. If the equity value in the account falls below the minimum requirement, the Company must restore the equity value, or UBS may call the line of credit. As of December 31, 2014 the Company did not have any amounts outstanding under the line of credit, and the maximum available borrowings against the line of credit were $6.9 million.
Discussion of Cash Flows
At December 31, 2014, we had cash and cash equivalents of $8.0 million compared to $10.2 million at December 31, 2013. Net cash provided by operating activities was $79.4 million, while we used $63.2 million in investing activities and $17.6 million in financing activities.
The $79.4 million in net cash provided by operations was primarily attributed to $45.4 million of net income which reflects non-cash depreciation and amortization, losses on the sales property and equipment, amortization of debt issuance costs, stock-based compensation, provisions for doubtful accounts and a change in deferred income taxes totaling $40.4 million, net. Net cash provided by operating activities also reflects an aggregate increase in net working capital totaling $6.4 million. The increase in the working capital position is primarily the result of an increase in accounts receivable due to increased revenues and a decrease in other long-term liabilities. This increase in net working capital was partially offset by a decrease in prepaid expenses and other assets, as well as increases in accounts payable, accrued expenses and other current liabilities, and insurance and claims accruals. Also included in the change in working capital were affiliate transactions consisting of a decrease in receivable from affiliates of $0.7 million and a decrease in accounts payable to affiliates of $0.7 million.
The $63.2 million in net cash used in investing activities consisted of $59.8 million of capital expenditures, $2.6 million for a business acquisition and the payment of Westport’s working adjustment and $2.1 million in the purchases of marketable securities. These uses were partially offset by $1.3 million in proceeds from the sale of property and equipment.
50
Table of Contents
Net cash used in financing activities totaled $17.6 million. As of December 31, 2014, we had outstanding borrowings totaling $235.3 million compared to $237.5 million at December 31, 2013. During the year ended December 31, 2014, we utilized our revolving credit facility to provide liquidity to fund our capital expenditures on a short-term basis. We also paid cash dividends of $8.4 million, and used $5.6 million for purchases of treasury stock and $1.3 million to pay capital lease obligations.
Contractual Obligations
The following summarizes our contractual obligations at December 31, 2014, and the effect such obligations are expected to have on our liquidity and cash flow in future periods (in thousands):
| Payments due by period | ||||||||||||||||||||
| Total | Less Than 1 Year |
1 – 3 Years |
3 – 5 Years |
More Than 5 Years |
||||||||||||||||
| Debt |
||||||||||||||||||||
| Syndicated credit facility |
||||||||||||||||||||
| $120 million revolving credit facility |
$ | 59,500 | $ | — | $ | 59,500 | $ | — | $ | — | ||||||||||
| Swing-line |
370 | 370 | — | — | ||||||||||||||||
| $60 million equipment credit facility |
55,428 | 8,571 | 46,857 | — | — | |||||||||||||||
| $50 million term loan |
50,000 | 1,022 | 48,978 | — | — | |||||||||||||||
| $70 million term loan |
70,000 | — | 70,000 | — | — | |||||||||||||||
|
|
|
|
|
|
|
|
|
|
|
|||||||||||
| Total debt |
235,298 | 9,593 | 225,705 | — | — | |||||||||||||||
| Capital lease obligations |
3,290 | 1,191 | 1,719 | 380 | ||||||||||||||||
| Operating lease obligations (1) |
34,384 | 16,434 | 15,596 | 2,354 | — | |||||||||||||||
|
|
|
|
|
|
|
|
|
|
|
|||||||||||
| Total |
$ | 272,972 | $ | 27,218 | $ | 243,020 | $ | 2,734 | $ | — | ||||||||||
|
|
|
|
|
|
|
|
|
|
|
|||||||||||
| (1) | Certain operating lease obligations in a currency other than the U.S. dollar will be affected by the exchange rate in effect at the time each cash payment is made. |
Total debt represents borrowings under the Credit Agreement and does not include interest. At December 31, 2014, the total amount of gross unrecognized tax benefits was $0.4 million. This amount is not included in the above table as the Company cannot reasonably estimate the timing of cash settlements, if any, with taxing authorities. At December 31, 2014, the Company has insurance and claims liabilities of $20.7 million, of which $10.7 million are covered by insurance. This amount is not included in the above table as the Company cannot reasonably estimate the timing of cash settlements on these liabilities.
Off-Balance Sheet Arrangements
None.
Legal Matters
We are subject to various legal proceedings and other contingencies, the outcomes of which are subject to significant uncertainty. We accrue for estimated losses if it is probable that an asset has been impaired or a liability has been incurred and the amount of the loss can be reasonably estimated. We use judgment and evaluate, with the assistance of legal counsel, whether a loss contingency arising from litigation should be disclosed or recorded. The outcome of legal proceedings is inherently uncertain and so typically a loss cannot be precisely estimated. Accordingly, if the outcome of legal proceedings is different than is anticipated by us, we would have to record the matter at the actual amount at which it was resolved, in the period resolved, impacting our results of operations and financial position for the period.
51
Table of Contents
Critical Accounting Policies
Our financial statements have been prepared in accordance with U.S. generally accepted accounting principles. The preparation of these financial statements requires us to make estimates and judgments that affect the reported amounts of assets, liabilities, operating revenues and operating expenses.
Critical accounting policies are those that are both (1) important to the portrayal of our financial condition and results of operations and (2) require management’s most difficult, subjective or complex judgments, often as a result of the need to make estimates about the effect of matters that are inherently uncertain. As the number of variables and assumptions affecting the possible future resolution of the uncertainties increase, those judgments become even more subjective and complex. In order to provide an understanding about how our management forms its judgments about future events, including the variables and assumptions underlying the estimates, and the sensitivity of those judgments to different circumstances, we have identified our critical accounting policies below.
Revenue recognition
We recognize revenue at the time (1) persuasive evidence of an arrangement with our customer exists, (2) services have been rendered, (3) sales price is fixed and determinable, and (4) collectability is reasonably assured. For transportation services, we recognize revenue at the time of delivery to the receiver’s location. For service arrangements in general, we recognize revenue after the related services have been rendered. Our customer contracts could involve multiple revenue-generating activities performed for the same customer. When several contracts are entered into with the same customer in a short period of time, we evaluate whether these contracts should be considered as a single, multiple element contract for revenue recognition purposes. Criteria we consider that may result in the aggregation of contracts include whether such contracts are actually entered into within a short period of time, whether services in multiple contracts are interrelated, or if the negotiation and terms of one contract show or include consideration for another contract or contracts. Our current contracts have not been required to be aggregated, as they are negotiated independently on a standalone basis. Our customers typically choose their vendor and award business at the conclusion of a competitive bidding process for each service. As a result, although we evaluate customer purchase orders and agreements for multiple elements and aggregation of individual contracts into a multiple element arrangement, our current contracts do not meet the criteria required for multiple element contract accounting.
We are the primary obligor when rendering transportation, value-added and intermodal services and assume the corresponding credit risk with customers. We have discretion in setting sales prices and, as a result, our earnings may vary. In addition, we have discretion to choose and negotiate terms with our multiple suppliers for the services ordered by our customers. This includes owner-operators with whom we contract to deliver our transportation services.
Allowance for Uncollectible Receivables
The allowance for potentially uncollectible receivables is based on a combination of historical data, cash payment trends, specific customer issues, write-off trends, general economic conditions and other factors. Management continuously monitors these factors to arrive at the estimate of accounts receivable that may be ultimately uncollectible. The receivables analyzed include trade receivables, as well as loans and advances made to owner-operators. All other balances are reviewed on a pooled basis. This analysis requires us to make significant estimates. Changes in the facts and circumstances that these estimates are based upon and changes in the general economic environment could result in a material change to the allowance for uncollectible receivables. These changes include, but are not limited to, deterioration of customers’ financial position, changes in our relationships with our customers, agents and owner-operators and unforeseen issues relating to individual receivables.
52
Table of Contents
Insurance and Claim Costs
We maintain auto liability, workers compensation and general liability insurance with licensed insurance carriers. We are self-insured for all cargo and equipment damage claims. Insurance and claims expense represents premiums paid by us and the accruals made for claims within our self-insured retention amounts. A liability is recognized for the estimated cost of all self-insured claims including an estimate of incurred but not reported claims based on historical experience and for claims expected to exceed our policy limits. In addition, legal expenses related to auto liability claims are covered under our policy. We are responsible for all other legal expenses related to claims.
As of December 31, 2014, we did not have any reserves for workers’ compensation or general liability claims. We do establish reserves for anticipated losses and expenses related to cargo and equipment damage claims and auto liability claims. The reserves consist of specific reserves for all known claims and an estimate for claims incurred but not reported, and losses arising from known claims ultimately settling in excess of insurance coverage using loss development factors based upon industry data and past experience. In determining the reserves, we specifically review all known claims and record a liability based upon our best estimate of the amount to be paid. In making our estimate, we consider the amount and validity of the claim, as well as our past experience with similar claims. In establishing the reserve for claims incurred but not reported, we consider our past claims history, including the length of time it takes for claims to be reported to us. Based on our past experience, the time between when a claim occurs and when it is reported to us is short. As a result, we believe that the number of incurred but not reported claims at any given point in time is small. These reserves are periodically reviewed and adjusted to reflect our experience and updated information relating to specific claims. If we experience claims that are not covered by our insurance or that exceed our estimated claim reserve, it could increase the volatility of our earnings and have a materially adverse effect on our financial condition, results of operations or cash flows.
Valuation of Long-Lived Asset, including Goodwill and Intangible Assets
We are required to test goodwill for impairment annually or more frequently, whenever events occur or circumstances change that would more likely than not reduce the fair value of a reporting unit with goodwill below its carrying amount. We annually test goodwill impairment during the 3rd fiscal quarter. Goodwill represents the excess purchase price over the fair value of assets acquired in connection with our acquisitions. We continually assess whether any indicators of impairment exist, which requires a significant amount of judgment. Such indicators may include a sustained significant decline in our share price and market capitalization; a decline in our expected future cash flows; a significant adverse change in legal factors or in the business climate; unanticipated competition; overall weaknesses in our industry; and slower growth rates. Adverse changes in these factors could have a significant impact on the recoverability of goodwill and could have a material impact on our consolidated financial statements. The Company has the option to first assess qualitative factors such as current performance and overall economic conditions to determine whether or not it is necessary to perform a two-step quantitative goodwill impairment test. If the Company choose that option, we would not be required perform Step 1 of the test unless we determine that, based on a qualitative assessment, it is more likely than not that the fair value of a reporting unit is less than its carrying value. If we determine that it is more likely than not, or if we choose not to perform a qualitative assessment, then we may then proceed with Step 1 of the two-step impairment test. In the two-step quantitative goodwill test, the Company compares the carrying value of a reporting unit to its fair value. If the carrying value of the reporting unit exceeds the estimated fair value, a second step is performed, which compares the implied fair value of goodwill to the carrying value, to determine the amount of impairment. During the third quarter of 2014, we completed our goodwill impairment testing by performing a qualitative assessment. Based on the results of this test, no impairment loss was recognized.
We evaluate the carrying value of long-lived assets, other than goodwill, for impairment by analyzing the operating performance and anticipated future cash flows for those assets, whenever events or changes in
53
Table of Contents
circumstances indicate that the carrying amounts of such assets may not be recoverable. We evaluate the need to adjust the carrying value of the underlying assets if the sum of the expected cash flows is less than the carrying value. Our projection of future cash flows, the level of actual cash flows, the methods of estimation used for determining fair values and salvage values can impact impairment. Any changes in management’s judgments could result in greater or lesser annual depreciation and amortization expense or impairment charges in the future. Depreciation and amortization of long-lived assets is calculated using the straight-line method over the estimated useful lives of the assets.
Other-than-temporary Impairments
Periodically, we review all available-for-sale securities for other-than-temporary impairment. An impairment that is an other-than-temporary impairment is a decline in the fair value of a security below its cost basis attributable to factors that indicate the cost basis in the security may not be recoverable in the near term. The determination of an other-than-temporary impairment is a subjective process, and requires judgment and assumptions that could affect the timing of loss realization. We consider several factors including the severity and duration of the decline, the financial condition and near-term prospects of the specific issuers and the industries in which they operate, and our intent and ability to hold these securities for a sufficient period of time to allow for a recovery. If, in our judgment, the impairment is determined to be other-than-temporary, the cost basis of the security is written down to the then-current market value, and the unrealized loss is transferred from accumulated other comprehensive loss as an immediate reduction of current earnings. Gross unrealized holding losses of $0.3 million as of December 31, 2014 have not been recognized in earnings as these impairments in value were judged to be temporary. We may incur future impairment charges if declines in market values continue or worsen and impairments are no longer considered temporary.
Recently Issued Accounting Pronouncements Not Currently Effective
See Item 8: Note 1(x) to the Consolidated Financial Statements for discussion of new accounting pronouncements.
| ITEM 7A: | QUANTITATIVE AND QUALITATIVE DISCLOSURES ABOUT MARKET RISK |
Interest Rate Risk
Our principal exposure to interest rate risk relates to outstanding borrowing under our Credit Agreement with Comerica Bank and our secured line of credit with UBS, all of which incur interest at floating rates. Borrowings under the Credit Agreement with Comerica Bank bear interest at LIBOR or a base rate, plus an applicable margin for each. The applicable margin fluctuates based on our total debt to EBITDA ratio, as defined in the Credit Agreement. Our secured line of credit with UBS bears interest at a floating rate equal to LIBOR plus 1.10%. As of December 31, 2014, we had total variable interest rate borrowings of $235.3 million. Assuming debt levels remain at $235.3 million, a 100 basis point increase in interest rates on our variable rate debt would increase interest expense approximately $2.4 million on an annualized basis.
Included in cash and cash equivalents is $21,000 in short-term investment grade instruments. The interest rates on these instruments are adjusted to market rates at least monthly. In addition, we have the ability to put these instruments back to the issuer at any time. Accordingly, any future interest rate risk on these short-term investments would not be material.
Commodity Price Risk
Fluctuations in fuel prices can affect our profitability by affecting our ability to retain or recruit owner-operators. Our owner-operators bear the costs of operating their tractors, including the cost of fuel. The tractors operated by our owner-operators consume large amounts of diesel fuel. Diesel fuel prices fluctuate greatly due to economic,
54
Table of Contents
political and other factors beyond our control. To address fluctuations in fuel prices, we seek to impose fuel surcharges on our customers and pass these surcharges on to our owner-operators. Historically, these arrangements have not fully protected our owner-operators from fuel price increases. If costs for fuel escalate significantly it could make it more difficult to attract additional qualified owner-operators and retain our current owner-operators. If we lose the services of a significant number of owner-operators or are unable to attract additional owner-operators, it could have a materially adverse effect on our financial condition, results of operations and cash flows.
Exposure to market risk for fluctuations in fuel prices also relates to a small portion of our transportation service contracts for which the cost of fuel is integral to service delivery and the service contract does not have a mechanism to adjust for increases in fuel prices. Increases and decreases in the price of fuel are generally passed on to our customers for which we realize minimal changes in profitability during periods of steady market fuel prices. However, profitability may be positively or negatively impacted by sudden increases or decreases in market fuel prices during a short period of time as customer pricing for fuel services is established based on market fuel costs. We believe the exposure to fuel price fluctuations would not materially impact our results of operations, cash flows or financial position.
Equity Securities Risk
The Company from time to time invests cash in excess of its current needs in marketable securities, much of which is held in equity securities, which are actively traded on public exchanges. It is the philosophy of the Company to minimize the risk of capital loss without foregoing the potential for capital appreciation through investing in value-and-income oriented investments. However, holding equity securities subjects the Company to fluctuations in the market value of its investment portfolio based on current market prices. A drop in market prices or other unstable market conditions could cause a loss in the value of the Company’s marketable securities classified as available-for-sale.
Marketable securities are carried at fair value and are marked to market at the end of each quarter, with the unrealized gains and losses, net of tax, included as a component of accumulated other comprehensive income, unless the declines in value are judged to be other-than-temporary, in which case an impairment charge would be included in the determination of net income. Gross unrealized holding losses of $0.3 million as of December 31, 2014 have not been recognized in earnings as these impairments in value were judged to be temporary. We may incur future impairment charges if declines in market values continue or worsen and impairments are no longer considered temporary. See Item 8, Note 1(e) to the Consolidated Financial Statements.
As of December 31, 2014, the fair value of equity securities was $14.3 million compared to $11.6 million at December 31, 2013. The increase during 2014 represents purchases of securities totaling $2.1 million and net unrealized holding gains of $0.6 million. A 10% decrease in the market price of our marketable equity securities would cause a corresponding 10% decrease in the carrying amounts of these securities, or approximately $1.4 million.
Foreign Exchange Risk
For the year ended December 31, 2014, 3.2% of our revenues were derived from services provided outside the United States, principally in Mexico and Canada. Exposure to market risk for changes in foreign currency exchange rates relates primarily to selling services and incurring costs in currencies other than the local currency and to the carrying value of net investments in foreign subsidiaries. As a result, we are exposed to foreign currency exchange rate risk due primarily due to translation of the accounts of our Mexican and Canadian operations from their local currencies into U.S. dollars and also to the extent we engage in cross-border transactions. The majority of our exposure to fluctuations in the Mexican peso and Canadian dollar is naturally hedged, since a substantial portion of our revenues and operating costs are denominated in each country’s local currency. Historically, we have not entered into financial instruments for trading or speculative purposes.
55
Table of Contents
Short-term exposures to fluctuating foreign currency exchange rates are related primarily to intercompany transactions. The duration of these exposures is minimized by ongoing settlement of intercompany trading obligations.
The net investments in our Mexican and Canadian operations are exposed to foreign currency translation gains and losses, which are included as a component of accumulated other comprehensive income in our statement of shareholders’ equity. Adjustments from the translation of the net investment in these operations decreased equity by approximately $1.6 million for the year ended December 31, 2014.
56
Table of Contents
ITEM 8: FINANCIAL STATEMENTS AND SUPPLEMENTARY DATA
Report of Independent Registered Public Accounting Firm
Board of Directors and Stockholders
Universal Truckload Services, Inc.
Warren, Michigan
We have audited the accompanying consolidated balance sheets of Universal Truckload Services, Inc. as of December 31, 2014 and 2013, and the related consolidated statements of income, comprehensive income, shareholders’ equity, and cash flows for each of the years in the two-year period ended December 31, 2014. Our responsibility is to express an opinion on these financial statements based on our audits.
We conducted our audits in accordance with the standards of the Public Company Accounting Oversight Board (United States). Those standards require that we plan and perform the audit to obtain reasonable assurance about whether the financial statements are free of material misstatement. An audit also includes examining, on a test basis, evidence supporting the amounts and disclosures in the financial statements, assessing the accounting principles used and significant estimates made by management, as well as evaluating the overall presentation of the financial statements. We believe that our audits provide a reasonable basis for our opinion.
In our opinion, the consolidated financial statements referred to above present fairly, in all material respects, the financial position of Universal Truckload Services, Inc. at December 31, 2014 and 2013, and the results of its operations and its cash flows for each of the years in the two-year period ended December 31, 2014, in conformity with accounting principles generally accepted in the United States of America.
We also have audited, in accordance with the standards of the Public Company Accounting Oversight Board (United States), Universal Truckload Service, Inc.’s internal control over financial reporting as of December 31, 2014, based on criteria established in Internal Control – Integrated Framework (2013) issued by the Committee of Sponsoring Organizations of the Treadway Commission (COSO) and our report dated March 16, 2015 expressed an unqualified opinion thereon.
/s/ BDO USA, LLP
Troy, Michigan
March 16, 2015
57
Table of Contents
Report of Independent Registered Public Accounting Firm
The Board of Directors and Shareholders
Universal Truckload Services, Inc.:
We have audited the accompanying consolidated statements of income, comprehensive income, cash flows and shareholders’ equity of Universal Truckload Services, Inc. and subsidiaries for the year ended December 31, 2012. These consolidated financial statements are the responsibility of the Company’s management. Our responsibility is to express an opinion on these consolidated financial statements based on our audit.
We conducted our audit in accordance with the standards of the Public Company Accounting Oversight Board (United States). Those standards require that we plan and perform the audit to obtain reasonable assurance about whether the financial statements are free of material misstatement. An audit includes examining, on a test basis, evidence supporting the amounts and disclosures in the financial statements. An audit also includes assessing the accounting principles used and significant estimates made by management, as well as evaluating the overall financial statement presentation. We believe that our audit provides a reasonable basis for our opinion.
In our opinion, the consolidated financial statements referred to above present fairly, in all material respects, the results of operations and the cash flows of Universal Truckload Services, Inc. and subsidiaries for the year ended December 31, 2012, in conformity with U.S. generally accepted accounting principles.
/s/ KPMG LLP
Detroit, Michigan
March 18, 2013, except as to note 17, which is as of March 13, 2014
58
Table of Contents
UNIVERSAL TRUCKLOAD SERVICES, INC.
December 31, 2014 and 2013
(In thousands, except share data)
| Assets | 2014 | 2013 | ||||||
| Current assets: |
||||||||
| Cash and cash equivalents |
$ | 8,001 | $ | 10,223 | ||||
| Marketable securities |
14,309 | 11,626 | ||||||
| Accounts receivable—net of allowance for doubtful accounts of $5,207 and $2,688, respectively |
151,107 | 132,001 | ||||||
| Other receivables |
13,856 | 17,966 | ||||||
| Due from affiliates |
1,562 | 2,283 | ||||||
| Prepaid income taxes |
2,719 | 7,988 | ||||||
| Prepaid expenses and other |
19,340 | 16,426 | ||||||
| Deferred income taxes |
5,386 | 4,876 | ||||||
|
|
|
|
|
|||||
| Total current assets |
216,280 | 203,389 | ||||||
| Property and equipment, net |
178,069 | 142,656 | ||||||
| Goodwill |
74,484 | 74,589 | ||||||
| Intangible assets—net of accumulated amortization of $34,340 and $24,345, respectively |
53,820 | 62,807 | ||||||
| Other assets |
6,361 | 6,695 | ||||||
|
|
|
|
|
|||||
| Total assets |
$ | 529,014 | $ | 490,136 | ||||
|
|
|
|
|
|||||
| Liabilities and Shareholders’ Equity | ||||||||
| Current liabilities: |
||||||||
| Accounts payable |
$ | 57,448 | $ | 46,487 | ||||
| Due to affiliates |
2,896 | 3,618 | ||||||
| Accrued expenses and other current liabilities |
22,341 | 21,072 | ||||||
| Insurance and claims |
20,704 | 22,719 | ||||||
| Current maturities of capital lease obligations |
1,051 | 1,592 | ||||||
| Current portion of long-term debt |
9,593 | 5,482 | ||||||
|
|
|
|
|
|||||
| Total current liabilities |
114,033 | 100,970 | ||||||
| Long-term liabilities: |
||||||||
| Long-term debt |
225,705 | 232,018 | ||||||
| Capital lease obligations, net of current maturities |
1,980 | 3,051 | ||||||
| Deferred income taxes |
45,883 | 43,748 | ||||||
| Other long-term liabilities |
4,252 | 4,784 | ||||||
|
|
|
|
|
|||||
| Total long-term liabilities |
277,820 | 283,601 | ||||||
| Shareholders’ equity: |
||||||||
| Common stock, no par value. Authorized 100,000,000 shares; 30,856,506 and 30,746,067 shares issued; 29,997,784 and 30,114,324 shares outstanding, respectively |
30,857 | 30,746 | ||||||
| Paid-in capital |
2,448 | 1,074 | ||||||
| Treasury stock, at cost; 858,722 and 631,743 shares, respectively |
(14,953 | ) | (9,322 | ) | ||||
| Retained earnings |
117,913 | 80,952 | ||||||
| Accumulated other comprehensive income: |
||||||||
| Unrealized holding gain on available-for-sale securities, net of income taxes of $1,642 and $1,433, respectively |
2,888 | 2,476 | ||||||
| Foreign currency translation adjustments |
(1,992 | ) | (361 | ) | ||||
|
|
|
|
|
|||||
| Total shareholders’ equity |
137,161 | 105,565 | ||||||
|
|
|
|
|
|||||
| Total liabilities and shareholders’ equity |
$ | 529,014 | $ | 490,136 | ||||
|
|
|
|
|
|||||
See accompanying notes to consolidated financial statements.
59
Table of Contents
UNIVERSAL TRUCKLOAD SERVICES, INC.
Consolidated Statements of Income
Years ended December 31, 2014, 2013 and 2012
(In thousands, except per share data)
| 2014 | 2013 | 2012 | ||||||||||
| Operating revenues: |
||||||||||||
| Transportation services, including related party amounts of $138, $195 and $298, respectively |
$ | 769,308 | $ | 706,998 | $ | 741,650 | ||||||
| Value-added services |
284,496 | 195,086 | 174,975 | |||||||||
| Intermodal services, including related party amounts of $170, $9,605 and $2,346, respectively |
137,717 | 131,408 | 120,381 | |||||||||
|
|
|
|
|
|
|
|||||||
| Total operating revenues |
1,191,521 | 1,033,492 | 1,037,006 | |||||||||
| Operating expenses: |
||||||||||||
| Purchased transportation and equipment rent, including related party amounts of $930, $311 and $285, respectively |
615,327 | 560,024 | 592,493 | |||||||||
| Direct personnel and related benefits, including related party amounts of $16,623, $14,398 and $14,410, respectively |
205,905 | 178,441 | 163,069 | |||||||||
| Commission expense |
43,922 | 39,248 | 42,157 | |||||||||
| Operating expenses (exclusive of items shown separately), including related party amounts of $1,233, $1,590 and $3,623, respectively |
115,154 | 79,263 | 71,117 | |||||||||
| Occupancy expense, including related party amounts of $10,472, $11,352 and $10,787, respectively |
26,520 | 20,049 | 19,275 | |||||||||
| Selling, general, and administrative, including related party amounts of $3,736, $3,617 and $3,829, respectively |
44,814 | 33,046 | 41,159 | |||||||||
| Insurance and claims, including related party amounts of $18,102, $16,949 and $17,842, respectively |
25,991 | 19,242 | 20,342 | |||||||||
| Depreciation and amortization |
33,053 | 19,686 | 18,237 | |||||||||
|
|
|
|
|
|
|
|||||||
| Total operating expenses |
1,110,686 | 948,999 | 967,849 | |||||||||
|
|
|
|
|
|
|
|||||||
| Income from operations |
80,835 | 84,493 | 69,157 | |||||||||
| Interest income |
46 | 130 | 241 | |||||||||
| Interest expense |
(8,229 | ) | (4,166 | ) | (4,224 | ) | ||||||
| Other non-operating income |
447 | 459 | 2,778 | |||||||||
|
|
|
|
|
|
|
|||||||
| Income before provision for income taxes |
73,099 | 80,916 | 67,952 | |||||||||
| Provision for income taxes |
27,729 | 30,344 | 20,264 | |||||||||
|
|
|
|
|
|
|
|||||||
| Net income |
$ | 45,370 | $ | 50,572 | $ | 47,688 | ||||||
|
|
|
|
|
|
|
|||||||
| Earnings per common share: |
||||||||||||
| Basic |
$ | 1.51 | $ | 1.68 | $ | 1.59 | ||||||
| Diluted |
$ | 1.51 | $ | 1.68 | $ | 1.59 | ||||||
| Weighted average number of common shares outstanding: |
||||||||||||
| Basic |
30,013 | 30,064 | 30,032 | |||||||||
| Diluted |
30,044 | 30,160 | 30,036 | |||||||||
| Dividends paid per common share |
$ | 0.28 | $ | 0.14 | $ | — | ||||||
|
|
|
|
|
|
|
|||||||
| Pre-merger dividends paid per common share |
$ | 1.00 | ||||||||||
|
|
|
|||||||||||
| Pro Forma earnings per common share—“C” corporation status (unaudited): |
||||||||||||
| Pro Forma provision for income taxes due to LINC Logistics Company conversion to “C” corporation |
$ | 11,059 | ||||||||||
| Earnings per common share: |
||||||||||||
| Basic |
$ | 1.22 | ||||||||||
| Diluted |
$ | 1.22 | ||||||||||
See accompanying notes to consolidated financial statements.
60
Table of Contents
UNIVERSAL TRUCKLOAD SERVICES, INC.
Consolidated Statements of Comprehensive Income
Years ended December 31, 2014, 2013 and 2012
(In thousands, except per share data)
| 2014 | 2013 | 2012 | ||||||||||
| Net Income |
$ | 45,370 | $ | 50,572 | $ | 47,688 | ||||||
| Other comprehensive income (loss): |
||||||||||||
| Unrealized holding gains on available-for-sale investments arising during the period, net of income taxes |
412 | 1,546 | 566 | |||||||||
| Realized gains on available-for-sale investments reclassified into income, net of income taxes |
— | (68 | ) | (1,176 | ) | |||||||
| Foreign currency translation adjustments |
(1,631 | ) | (227 | ) | 312 | |||||||
|
|
|
|
|
|
|
|||||||
| Total other comprehensive income (loss) |
(1,219 | ) | 1,251 | (298 | ) | |||||||
|
|
|
|
|
|
|
|||||||
| Total comprehensive income |
$ | 44,151 | $ | 51,823 | $ | 47,390 | ||||||
|
|
|
|
|
|
|
|||||||
See accompanying notes to consolidated financial statements.
61
Table of Contents
UNIVERSAL TRUCKLOAD SERVICES, INC.
Consolidated Statements of Cash Flows
Years ended December 31, 2014, 2013 and 2012
(In thousands)
| 2014 | 2013 | 2012 | ||||||||||
| Cash flows from operating activities: |
||||||||||||
| Net income |
$ | 45,370 | $ | 50,572 | $ | 47,688 | ||||||
| Adjustments to reconcile net income to net cash provided by operating activities: |
||||||||||||
| Depreciation and amortization |
33,053 | 19,686 | 18,237 | |||||||||
| Gain on sale of marketable equity securities |
— | (107 | ) | (2,189 | ) | |||||||
| Loss (gain) on disposal of property and equipment |
233 | (117 | ) | 45 | ||||||||
| Amortization of debt issuance costs |
693 | — | — | |||||||||
| Change in the fair value of acquisition related contingent consideration |
— | — | 16 | |||||||||
| Non-cash charges incurred from LINC |
— | — | 2,442 | |||||||||
| Stock-based compensation |
1,485 | 585 | 586 | |||||||||
| Provision for doubtful accounts |
3,504 | 1,515 | 1,190 | |||||||||
| Deferred income taxes |
1,433 | 2,495 | 4,389 | |||||||||
| Change in assets and liabilities: |
||||||||||||
| Trade and other accounts receivable |
(19,857 | ) | 767 | (8,076 | ) | |||||||
| Prepaid income taxes, prepaid expenses and other assets |
984 | (3,594 | ) | 1,276 | ||||||||
| Accounts payable, accrued expenses, insurance and claims and other current liabilities |
13,027 | (15,152 | ) | 7,922 | ||||||||
| Due to/from affiliates, net |
(1 | ) | 837 | (3,769 | ) | |||||||
| Other long-term liabilities |
(532 | ) | 103 | 646 | ||||||||
|
|
|
|
|
|
|
|||||||
| Net cash provided by operating activities |
79,392 | 57,590 | 70,403 | |||||||||
| Cash flows from investing activities: |
||||||||||||
| Capital expenditures |
(59,784 | ) | (17,035 | ) | (29,566 | ) | ||||||
| Proceeds from the sale of property and equipment |
1,326 | 1,790 | 987 | |||||||||
| Purchases of marketable securities |
(2,063 | ) | (24 | ) | (19 | ) | ||||||
| Proceeds from sale of marketable securities |
— | 520 | 7,500 | |||||||||
| Affiliate notes receivables—LINC |
— | — | (5,000 | ) | ||||||||
| Proceeds from affiliate notes receivable—LINC |
— | — | 5,000 | |||||||||
| Acquisitions of businesses |
(2,648 | ) | (121,057 | ) | (850 | ) | ||||||
|
|
|
|
|
|
|
|||||||
| Net cash used in investing activities |
(63,169 | ) | (135,806 | ) | (21,948 | ) | ||||||
| Cash flows from financing activities: |
||||||||||||
| Proceeds from borrowing—revolving debt |
134,228 | 48,218 | 94,871 | |||||||||
| Repayments of debt—revolving debt |
(134,358 | ) | (52,218 | ) | (44,871 | ) | ||||||
| Proceeds from borrowing—term debt |
2,500 | 95,500 | 82,000 | |||||||||
| Repayments of debt—term debt |
(4,572 | ) | — | (69,061 | ) | |||||||
| Proceeds from borrowing—UBS facility |
791 | — | — | |||||||||
| Repayments of debt—UBS facility |
(791 | ) | — | — | ||||||||
| Distributions to LINC shareholders |
— | — | (95,985 | ) | ||||||||
| Dividends paid |
(8,409 | ) | (4,209 | ) | — | |||||||
| Pre-merger dividends paid |
— | — | (15,499 | ) | ||||||||
| Payment of capital lease obligations |
(1,349 | ) | (42 | ) | — | |||||||
| Purchases of treasury stock |
(5,631 | ) | (6 | ) | (991 | ) | ||||||
| Payment of earnout obligations related to acquisitions |
— | (24 | ) | (206 | ) | |||||||
| Capitalized financing costs |
— | (1,230 | ) | (1,752 | ) | |||||||
|
|
|
|
|
|
|
|||||||
| Net cash provided by (used in) financing activities |
(17,591 | ) | 85,989 | (51,494 | ) | |||||||
| Effect of exchange rate changes on cash and cash equivalents |
(854 | ) | (104 | ) | 82 | |||||||
|
|
|
|
|
|
|
|||||||
| Net increase (decrease) in cash |
(2,222 | ) | 7,669 | (2,957 | ) | |||||||
| Cash and cash equivalents—January 1 |
10,223 | 2,554 | 5,511 | |||||||||
|
|
|
|
|
|
|
|||||||
| Cash and cash equivalents—December 31 |
$ | 8,001 | $ | 10,223 | $ | 2,554 | ||||||
|
|
|
|
|
|
|
|||||||
See accompanying notes to consolidated financial statements.
62
Table of Contents
UNIVERSAL TRUCKLOAD SERVICES, INC.
Consolidated Statements of Cash Flows—Continued
Years ended December 31, 2014, 2013 and 2012
(In thousands)
| 2014 | 2013 | 2012 | ||||||||||
| Supplemental cash flow information: |
||||||||||||
| Cash paid for interest |
$ | 7,379 | $ | 3,595 | $ | 2,990 | ||||||
|
|
|
|
|
|
|
|||||||
| Cash paid for income taxes |
$ | 20,833 | $ | 31,236 | $ | 12,759 | ||||||
|
|
|
|
|
|
|
|||||||
| Distributions to LINC shareholders: |
||||||||||||
| Purchase adjustment pursuant to merger agreement |
$ | — | $ | — | $ | 10,102 | ||||||
| Payment of dividend payable |
— | — | 27,000 | |||||||||
| Dividends paid |
— | — | 58,500 | |||||||||
| Distribution for shareholder state tax withholding |
— | — | 383 | |||||||||
|
|
|
|
|
|
|
|||||||
| Net cash paid |
$ | — | $ | — | $ | 95,985 | ||||||
|
|
|
|
|
|
|
|||||||
| Acquisition of businesses: |
||||||||||||
| Fair value of assets acquired, net of cash |
$ | 1,270 | $ | 156,741 | $ | 1,100 | ||||||
| Liabilities assumed |
— | (33,738 | ) | — | ||||||||
| Fair value of acquisition obligations |
— | (2,196 | ) | (250 | ) | |||||||
| Payment of acquisition obligations |
1,378 | 250 | — | |||||||||
|
|
|
|
|
|
|
|||||||
| Net cash paid for acquisition of businesses |
$ | 2,648 | $ | 121,057 | $ | 850 | ||||||
|
|
|
|
|
|
|
|||||||
See accompanying notes to consolidated financial statements.
63
Table of Contents
UNIVERSAL TRUCKLOAD SERVICES, INC.
Consolidated Statements of Shareholders’ Equity
Years ended December 31, 2014, 2013 and 2012
(In thousands)
| Common stock |
Paid-in capital |
Treasury stock |
Retained earnings |
Accumulated Other Comprehensive Income (Loss) |
Total | |||||||||||||||||||
| Balances—December 31, 2011 |
$ | 30,649 | $ | 65,387 | $ | (8,325 | ) | $ | 5,998 | $ | 1,162 | $ | 94,871 | |||||||||||
| Net income |
— | — | — | 47,688 | — | 47,688 | ||||||||||||||||||
| Comprehensive income |
— | — | — | — | (298 | ) | (298 | ) | ||||||||||||||||
| Dividends paid ($1.00 per share) |
— | — | — | (15,499 | ) | — | (15,499 | ) | ||||||||||||||||
| Dividends declared by LINC |
— | — | — | (58,500 | ) | — | (58,500 | ) | ||||||||||||||||
| LINC distribution for state tax witholding |
— | — | — | (383 | ) | — | (383 | ) | ||||||||||||||||
| LINC purchase adjustment |
— | (10,102 | ) | — | — | — | (10,102 | ) | ||||||||||||||||
| Termination of LINC’s S-Corp status |
— | (55,285 | ) | — | 55,285 | — | — | |||||||||||||||||
| Stock based compensation |
36 | 550 | — | — | — | 586 | ||||||||||||||||||
| Purchases of treasury stock |
— | — | (991 | ) | — | — | (991 | ) | ||||||||||||||||
|
|
|
|
|
|
|
|
|
|
|
|
|
|||||||||||||
| Balances—December 31, 2012 |
$ | 30,685 | $ | 550 | $ | (9,316 | ) | $ | 34,589 | $ | 864 | $ | 57,372 | |||||||||||
| Net income |
— | — | — | 50,572 | — | 50,572 | ||||||||||||||||||
| Comprehensive income |
— | — | — | — | 1,251 | 1,251 | ||||||||||||||||||
| Dividends paid ($0.14 per share) |
— | — | — | (4,209 | ) | — | (4,209 | ) | ||||||||||||||||
| Issuance of common stock |
25 | (25 | ) | — | ||||||||||||||||||||
| Stock based compensation |
36 | 549 | — | — | — | 585 | ||||||||||||||||||
| Purchases of treasury stock |
— | — | (6 | ) | — | — | (6 | ) | ||||||||||||||||
|
|
|
|
|
|
|
|
|
|
|
|
|
|||||||||||||
| Balances—December 31, 2013 |
$ | 30,746 | $ | 1,074 | $ | (9,322 | ) | $ | 80,952 | $ | 2,115 | $ | 105,565 | |||||||||||
| Net income |
— | — | — | 45,370 | — | 45,370 | ||||||||||||||||||
| Comprehensive loss |
— | — | — | — | (1,219 | ) | (1,219 | ) | ||||||||||||||||
| Dividends paid ($0.28 per share) |
— | — | — | (8,409 | ) | — | (8,409 | ) | ||||||||||||||||
| Issuance of common stock |
20 | (20 | ) | — | — | — | — | |||||||||||||||||
| Stock based compensation |
91 | 1,394 | — | — | — | 1,485 | ||||||||||||||||||
| Purchases of treasury stock |
— | — | (5,631 | ) | — | — | (5,631 | ) | ||||||||||||||||
|
|
|
|
|
|
|
|
|
|
|
|
|
|||||||||||||
| Balances—December 31, 2014 |
$ | 30,857 | $ | 2,448 | $ | (14,953 | ) | $ | 117,913 | $ | 896 | $ | 137,161 | |||||||||||
|
|
|
|
|
|
|
|
|
|
|
|
|
|||||||||||||
See accompanying notes to consolidated financial statements.
64
Table of Contents
UNIVERSAL TRUCKLOAD SERVICES, INC.
Notes to Consolidated Financial Statements
December 31, 2014, 2013 and 2012
| (1) | Summary of Significant Accounting Policies |
| (a) | Business |
Universal Truckload Services, Inc., referred to herein as Universal, or us, we or the Company, through its subsidiaries, is a leading asset-light provider of customized transportation and logistics solutions throughout the United States, Mexico, Canada, and Colombia. We provide our customers with supply chain solutions that can be scaled to meet their changing demands. We offer our customers with a broad array of services across their entire supply chain, including transportation, value-added, and intermodal services. Our customized solutions and flexible business model are designed to provide us with a highly variable cost.
| (b) | Basis of Presentation |
The consolidated financial statements include the accounts of the Company and its wholly owned subsidiaries. Effective on December 31, 2014, the Company executed a plan to reduce the number of its subsidiaries, re-naming and re-branding our principal surviving operating subsidiaries. The organizational streamlining plan included the statutory merger of certain subsidiaries, along with the transfer of certain business units between subsidiaries. At December 31, 2014, we conducted our operation through the following operating and support subsidiaries: Cavalry Logistics, LLC, Diversified Contract Services, Inc., Flint Special Services, Inc., LGSI Equipment of Indiana, LLC, LINC Logistics, LLC, LINC Ontario, Ltd., Logistics Insight Corp., Logistics Insight Corporation S. de R.L. de C.V., Logistics Insight GmbH, Louisiana Transportation, Inc., Mason Dixon Intermodal, Inc., ULINC Staffing de Mexico, S. de R.L. de C.V., Universal Dedicated, Inc., Universal Logistics Solutions International, Inc., Universal Logistics Solutions Canada, Ltd., Universal Management Services, Inc., Universal Specialized, Inc., Universal Truckload, Inc., UT Rent A Car, Inc., UTS Realty, LLC, UTSI Finance, Inc., Westport Holding, LLC and Westport Axle Corporation. All significant intercompany accounts and transactions have been eliminated.
Through December 31, 2004, Universal was a wholly-owned subsidiary of CenTra, Inc. On December 31, 2004, CenTra distributed all of Universal’s common stock to Matthew T. Moroun and a trust controlled by Manuel J. Moroun, collectively the Morouns, the sole shareholders of CenTra, Inc. CenTra, Inc., its subsidiaries and affiliates are referred to as “CenTra.” Subsequent to the initial public offering in 2005, the Morouns retained and continue to hold a controlling interest in Universal. The accompanying consolidated financial statements present the historical financial position, results of operations, and cash flows of the Company and are not necessarily indicative of what the financial position, results of operations, or cash flows would have been had the Company operated as an unaffiliated company during the periods presented.
Our fiscal year consists of four quarters, each with thirteen weeks.
| (c) | Use of Estimates |
The preparation of the consolidated financial statements requires management of the Company to make a number of estimates and assumptions related to the reported amounts of assets and liabilities and the disclosure of contingent assets and liabilities at the date of the consolidated financial statements and the reported amounts of revenues and expenses during the period. Significant items subject to such estimates and assumptions include the fair value of assets and liabilities acquired in business combinations; carrying amounts of property and equipment and intangible assets; marketable
65
Table of Contents
UNIVERSAL TRUCKLOAD SERVICES, INC.
Notes to Consolidated Financial Statements—(Continued)
December 31, 2014, 2013 and 2012
| (1) | Summary of Significant Accounting Policies—continued |
| (c) | Use of Estimates—continued |
securities; valuation allowances for receivables; and liabilities related to insurance and claim costs. Actual results could differ from those estimates.
| (d) | Cash and Cash Equivalents |
Cash and cash equivalents consist of cash and short-term, highly liquid investments with an original maturity of three months or less.
It is our policy to record checks issued in excess of funds on deposit as accounts payable for balance sheet presentation, and include the changes in these positions as cash flows from operating activities in the statements of cash flows. At December 31, 2014, accounts payable included reclassification of checks issued in excess of funds on deposit in the amount of $13.4 million. At December 31, 2013, funds on deposit were in excess of checks issued and no reclassification was necessary. The change in the amount of checks issued in excess of funds on deposit of $13.4 million, $(13.4) million, and $3.4 million for 2014, 2013 and 2012, respectively, is included in cash flows from operating activities in the statements of cash flows as a change in accounts payable, accrued expenses and other current liabilities.
| (e) | Marketable Securities |
At December 31, 2014 and 2013, marketable securities, all of which are available-for-sale, consist of common and preferred stocks. Marketable securities are carried at fair value, with unrealized gains and losses, net of related income taxes, reported as accumulated other comprehensive income (loss), except for losses from impairments which are determined to be other-than-temporary. Realized gains and losses, and declines in value judged to be other-than-temporary on available-for-sale securities are included in the determination of net income and are included in other non-operating income (expense), at which time the average cost basis of these securities are adjusted to fair value. Fair values are based on quoted market prices at the reporting date. Interest and dividends on available-for-sale securities are included in other non-operating income (expense). During the year ended December 31, 2014, the Company made purchases of securities totaling $2.1 million, but did not sell any marketable securities. During the years ended December 31, 2013 and 2012, we received proceeds of $0.5 million and $7.5 million from the sale of marketable securities with a combined cost of $0.4 million $5.3 million resulting in a realized gain of $0.1 million and $2.2 million, respectively.
The cost, gross unrealized holding gains, gross unrealized holding losses, and fair value of available-for-sale securities by type were as follows (in thousands):
| Cost | Gross unrealized holding gains |
Gross unrealized holding (losses) |
Fair Value |
|||||||||||||
| At December 31, 2014 |
||||||||||||||||
| Equity Securities |
$ | 9,779 | $ | 4,825 | $ | (295 | ) | $ | 14,309 | |||||||
|
|
|
|
|
|
|
|
|
|||||||||
| At December 31, 2013 |
||||||||||||||||
| Equity Securities |
$ | 7,717 | $ | 3,974 | $ | (65 | ) | $ | 11,626 | |||||||
|
|
|
|
|
|
|
|
|
|||||||||
66
Table of Contents
UNIVERSAL TRUCKLOAD SERVICES, INC.
Notes to Consolidated Financial Statements—(Continued)
December 31, 2014, 2013 and 2012
| (1) | Summary of Significant Accounting Policies—continued |
| (e) | Marketable Securities—continued |
Included in equity securities at December 31, 2014 were securities with a book basis of $1.8 million and a cumulative loss position of $0.3 million, the impairment of which we consider to be temporary. We consider several factors in determining as to whether declines in value are judged to be temporary or other-than-temporary, including the severity and duration of the decline, the financial condition and near-term prospects of the specific issuers and the industries in which they operate, and our intent and ability to hold these securities. We may incur future impairment charges if declines in market values continue and/or worsen and impairments are no longer considered temporary.
The fair value and gross unrealized holding losses of our marketable securities that are not deemed to be other-than-temporarily impaired aggregated by type and length of time they have been in a continuous unrealized loss position were as follows (in thousands):
| Less than 12 Months | 12 Months or Greater | Total | ||||||||||||||||||||||
| Fair Value |
Unrealized Losses |
Fair Value |
Unrealized Losses |
Fair Value |
Unrealized Losses |
|||||||||||||||||||
| At December 31, 2014 |
||||||||||||||||||||||||
| Equity securities |
$ | 1,380 | $ | 197 | $ | 146 | $ | 98 | $ | 1,526 | $ | 295 | ||||||||||||
|
|
|
|
|
|
|
|
|
|
|
|
|
|||||||||||||
| At December 31, 2013 |
||||||||||||||||||||||||
| Equity securities |
$ | 167 | $ | 3 | $ | 289 | $ | 62 | $ | 456 | $ | 65 | ||||||||||||
|
|
|
|
|
|
|
|
|
|
|
|
|
|||||||||||||
At December 31, 2014, our portfolio of equity securities in a continuous loss position, the impairment of which we consider to be temporary, consists primarily of common stocks in the oil and gas, banking, communications, steel, and transportation industries. The fair value and unrealized losses are distributed in sixteen publicly traded companies, with no single industry or company representing a material or concentrated unrealized loss. We have evaluated the near-term prospects of the various industries, as well as the specific issuers within our portfolio, in relation to the severity and duration of the impairments, and based on that evaluation, and our ability and intent to hold these investments for a reasonable period of time to allow for a recovery of fair value, we do not consider these investments to be other-than-temporarily impaired at December 31, 2014.
The Company from time to time invests cash in excess of its current needs in marketable securities, much of which is held in equity securities, which are actively traded on public exchanges. It is our philosophy to minimize the risk of capital loss without foregoing the potential for capital appreciation through investing in value-and-income oriented investments. However, holding equity securities subjects us to fluctuations in the market value of our investment portfolio based on current market prices, and a decline in market prices or other unstable market conditions could cause a loss in the value of our marketable securities classified as available-for-sale.
| (f) | Accounts Receivable |
Accounts receivable are recorded at the net invoiced amount, net of an allowance for doubtful accounts, and do not bear interest. They include unbilled amounts for services rendered in the respective period but not yet billed to the customer until a future date, which typically occurs within one month. In order to reflect customer receivables at their estimated net realizable value, we record charges against revenue based upon current information. These charges generally arise from rate
67
Table of Contents
UNIVERSAL TRUCKLOAD SERVICES, INC.
Notes to Consolidated Financial Statements—(Continued)
December 31, 2014, 2013 and 2012
| (1) | Summary of Significant Accounting Policies—continued |
| (f) | Accounts Receivable—continued |
changes, errors, and revenue adjustments that may arise from contract disputes or differences in calculation methods employed by the customer. The allowance for doubtful accounts is our best estimate of the amount of probable credit losses in our existing accounts receivable. We determine the allowance based on historical write-off experience and the aging of our outstanding accounts receivable. Balances are considered past due based on invoiced terms. Account balances are charged off against the allowance after all means of collection have been exhausted and the potential for recovery is considered remote. We do not have any off-balance-sheet credit exposure related to our customers. Accounts receivable from affiliates are shown separately and include trade receivables from the sale of services to affiliates.
| (g) | Inventories |
Included in prepaid expenses and other is inventory used in a portion of our value-added service operations. Inventories are stated at the lower of cost or market. Cost is determined using the first-in, first-out method. Provisions for excess and obsolete inventories are based on our assessment of excess and obsolete inventory on a product-by-product basis.
At December 31, inventory consists of the following (in thousands):
| 2014 | 2013 | |||||||
| Raw materials and supplies |
$ | 6,903 | $ | 3,197 | ||||
| Finished goods |
1,347 | 428 | ||||||
|
|
|
|
|
|||||
| $ | 8,250 | $ | 3,625 | |||||
|
|
|
|
|
|||||
| (h) | Property and Equipment |
Property and equipment, including leasehold improvements, are carried at cost less accumulated depreciation. Depreciation is computed using the straight-line method over the estimated useful lives of the assets as follows:
| Description |
Life in Years | |||
| Transportation equipment |
5 - 15 | |||
| Other operating assets |
3 - 15 | |||
| Information technology equipment |
2 - 5 | |||
| Buildings and related assets |
10 - 39 | |||
The amounts recorded for depreciation expense were $23.1 million, $17.6 million, and $15.2 million for the years ended December 31, 2014, 2013 and 2012, respectively.
Tire repairs, replacement tires, replacement batteries, consumable tools used in our logistics services, and routine repairs and maintenance on vehicles are expensed as incurred. Parts and fuel inventories are included in prepaid expenses and other. We capitalize certain costs associated with vehicle repairs and maintenance that materially extend the life or increase the value of the vehicle or pool of vehicles.
68
Table of Contents
UNIVERSAL TRUCKLOAD SERVICES, INC.
Notes to Consolidated Financial Statements—(Continued)
December 31, 2014, 2013 and 2012
| (1) | Summary of Significant Accounting Policies—continued |
| (i) | Intangible Assets |
Intangible assets subject to amortization consist of customer contracts and agent and customer relationships that have been acquired in business combinations. These assets are amortized either over the period of economic benefit or on a straight-line basis over the estimated useful lives of the related intangible asset. The estimated useful lives of these intangible assets range from one to nineteen years. The weighted average amortization period for customer contracts is approximately two years, and the weighted average amortization period for agent and customer relationships is approximately fifteen years. Collectively, the weighted average amortization period of assets subject to amortization is approximately twelve years. The useful lives of acquired trademarks are indefinite and, therefore, not subject to amortization.
Our identifiable intangible assets as of December 31, 2014 and 2013 are as follows (in thousands):
| 2014 | 2013 | |||||||
| Indefinite Lived Intangibles: |
||||||||
| Trademarks |
$ | 2,500 | $ | 2,500 | ||||
|
|
|
|
|
|||||
| Definite Lived Intangibles: |
||||||||
| Agent and customer relationships |
65,060 | 64,052 | ||||||
| Customer contracts |
20,600 | 20,600 | ||||||
| Less: accumulated amortization |
(34,340 | ) | (24,345 | ) | ||||
|
|
|
|
|
|||||
| Intangible assets, net |
$ | 51,320 | $ | 60,307 | ||||
|
|
|
|
|
|||||
| Total Identifiable Intangible Assets |
$ | 53,820 | $ | 62,807 | ||||
|
|
|
|
|
|||||
Estimated amortization expense by year is as follows (in thousands):
| 2015 |
$ | 9,102 | ||
| 2016 |
7,423 | |||
| 2017 |
5,995 | |||
| 2018 |
2,519 | |||
| 2019 |
2,254 | |||
| Thereafter |
24,027 | |||
|
|
|
|||
| Total |
$ | 51,320 | ||
|
|
|
The amounts recorded for amortization expense were $9.9 million, $2.1 million, and $3.0 million for the years ended December 31, 2014, 2013 and 2012, respectively.
| (j) | Goodwill |
Goodwill represents the excess purchase price over the fair value of assets acquired in connection with the Company’s acquisitions. Under FASB Accounting Standards Codification, or ASC, Topic 805 “Business Combinations”, we are required to test goodwill for impairment annually (in our third fiscal quarter) or more frequently, whenever events occur or circumstances change that would more likely than not reduce the fair value of a reporting unit with goodwill below its carrying amount. We have the option to first assess qualitative factors such as current performance and overall economic conditions to
69
Table of Contents
UNIVERSAL TRUCKLOAD SERVICES, INC.
Notes to Consolidated Financial Statements—(Continued)
December 31, 2014, 2013 and 2012
| (1) | Summary of Significant Accounting Policies—continued |
| (j) | Goodwill—continued |
determine whether or not it is necessary to perform a two-step quantitative goodwill impairment test. If we choose that option, we would not be required perform Step 1 of the test unless we determine that, based on a qualitative assessment, it is more likely than not that the fair value of a reporting unit is less than its carrying value. If we determine that it is more likely than not, or if we choose not to perform a qualitative assessment, then we may then proceed with Step 1 of the two-step impairment test. In the quantitative goodwill test, a company compares the carrying value of a reporting unit to its fair value. If the carrying value of the reporting unit exceeds the estimated fair value, a second step is performed, which compares the implied fair value of goodwill to the carrying value, to determine the amount of impairment. During the third quarter of 2014, we completed our goodwill impairment testing by performing a qualitative assessment. Based on the results of this test, no impairment loss was recognized.
The changes in the carrying amount of goodwill for the years ended December 31, 2014 and 2013 are as follows (in thousands):
| Balance as of January 1, 2013 |
$ | 17,965 | ||
| Westport Acquisition |
56,624 | |||
|
|
|
|||
| Balance as of December 31, 2013 |
74,589 | |||
| Bull’s Eye acquisitions |
163 | |||
| Westport adjustments |
(268 | ) | ||
|
|
|
|||
| Balance as of December 31, 2014 |
$ | 74,484 | ||
|
|
|
At both December 31, 2014 and 2013, $18.2 million and $18.0 million of goodwill was recorded in our transportation segment, respectively. At December 31, 2014 and 2013, $56.3 million and $56.6 million of goodwill was recorded in our logistics segment, respectively.
| (k) | Long-Lived Assets |
Long-lived assets, other than goodwill, and indefinite lived intangibles such as property and equipment and purchased intangible assets subject to amortization are reviewed for impairment whenever events or changes in circumstances indicate that the carrying amount of an asset may not be recoverable. If circumstances require a long-lived asset to be tested for possible impairment, we first compare the undiscounted cash flows expected to be generated by a long-lived asset to its carrying value. If the carrying value of the long-lived asset is deemed to not be recoverable on an undiscounted cash flow basis, an impairment charge is recognized to the extent that the carrying value exceeds its fair value. Fair value is determined through various valuation techniques including discounted cash flow models, quoted market prices and independent third-party appraisals. Changes in management’s judgment relating to salvage values and/ or estimated useful lives could result in greater or lesser annual depreciation expense or impairment charges in the future. Indefinite lived intangibles are tested for impairment annually by comparing the carrying value of the assets to their fair value.
| (l) | Contingent Consideration |
Contingent consideration arrangements granted in connection with a business combination are evaluated to determine whether contingent consideration is, in substance, additional purchase price of
70
Table of Contents
UNIVERSAL TRUCKLOAD SERVICES, INC.
Notes to Consolidated Financial Statements—(Continued)
December 31, 2014, 2013 and 2012
| (1) | Summary of Significant Accounting Policies—continued |
| (l) | Contingent Consideration—continued |
an acquired enterprise or compensation for services, use of property or profit sharing. Additional purchase price is added to the fair value of consideration transferred in the business combination and compensation is included in operating expenses in the period it is incurred. Contingent consideration is remeasured to fair value at each reporting date until the contingency is resolved.
| (m) | Fair Value of Financial Instruments |
For cash equivalents, accounts receivables, accounts payable, and accrued expenses, the carrying amounts are reasonable estimates of fair value as the assets are readily redeemable or short-term in nature and the liabilities are short-term in nature. Marketable securities, consisting primarily of equity securities, are carried at fair market value as determined by quoted market prices. Our senior debt and line of credit consists of variable rate borrowings. The carrying value of these borrowings approximates fair value because the applicable interest rates are adjusted frequently based on short-term market rates.
| (n) | Deferred Compensation |
Deferred compensation relates to our bonus plans. Annual bonuses may be awarded to certain operating, sales and management personnel based on overall Company performance and achievement of specific employee or departmental objectives. Such bonuses are typically paid in annual installments over a five-year period. All bonus amounts earned by and due to employees in the current year are included in accrued expenses and other current liabilities. Those that are payable in subsequent years are included in other long-term liabilities.
| (o) | Closing Costs |
Our customers may discontinue or alter their business activity in a location earlier than anticipated, prompting us to exit a customer-dedicated facility. We recognize exit costs associated with operations that close or are identified for closure as an accrued liability in the Consolidated Balance Sheets. Such charges include lease termination costs, employee termination charges, asset impairment charges, and other exit-related costs associated with a plan approved by management. If we close an operating facility before its lease expires, costs to terminate a lease are recognized when an early termination provision is exercised, or we record a liability for non-cancellable lease obligations based on the fair value of remaining lease payments, reduced by any existing or prospective sublease rentals. Employee termination costs are recognized in the period that the closure is communicated to affected employees. The recognition of exit and disposal charges requires us to make certain assumptions and estimates as to the amount and timing of such charges. Subsequently, adjustments are made for changes in estimates in the period in which the change becomes known.
| (p) | Revenue and Related Expenses |
We are the primary obligor when rendering transportation services, value-added services and intermodal services, and we assume the corresponding credit risk with customers. We have discretion in setting sales prices and, as a result, our earnings may vary. In addition, we have discretion to choose and negotiate terms with our multiple suppliers for the services ordered by our customers. This
71
Table of Contents
UNIVERSAL TRUCKLOAD SERVICES, INC.
Notes to Consolidated Financial Statements—(Continued)
December 31, 2014, 2013 and 2012
| (1) | Summary of Significant Accounting Policies—continued |
| (p) | Revenue and Related Expenses—continued |
includes owner-operators with whom we contract to deliver our transportation services. As such, revenue and the related purchased transportation and commissions are recognized on a gross basis when persuasive evidence of an arrangement exists, delivery has occurred at the receiver’s location or for service arrangements after the related services have been rendered, the revenue and related expenses are fixed or determinable and collectability is reasonably assured. Fuel surcharges, where separately identifiable, of $119.7 million, $118.6 million and $115.2 million for the years ended December 31, 2014, 2013 and 2012, respectively, are included in operating revenues.
Revenues and associated costs for the sales of axles and machined components are recognized when title has passed and the risks and rewards of ownership are transferred, which is at the time of shipment.
Our customer contracts could involve multiple revenue-generating activities performed for the same customer. When several contracts are entered into with the same customer in a short period of time, we evaluate whether these contracts should be considered as a single, multiple element contract for revenue recognition purposes. Criteria we consider that may result in the aggregation of contracts include whether such contracts are actually entered into within a short period of time, whether services in multiple contracts are interrelated, or if the negotiation and terms of one contract show or include consideration for another contract or contracts. Our current contracts have not been required to be aggregated, as they are negotiated independently on a standalone basis. Our customers typically choose their vendor and award business at the conclusion of a competitive bidding process for each service. As a result, although we evaluate customer purchase orders and agreements for multiple elements and aggregation of individual contracts into a multiple element arrangement, our current contracts do not meet the criteria required for multiple element contract accounting.
| (q) | Insurance & Claims |
Insurance and claims expense represents charges for premiums and the accruals made for claims within our self-insured retention amounts. The accruals are primarily related to auto liability, general liability, cargo and equipment damage, and service failure claims. A liability is recognized for the estimated cost of all self-insured claims including an estimate of incurred but not reported claims based on historical experience and for claims expected to exceed our policy limits. We may also make accruals for personal injury and property damage to third parties, and workers’ compensation claims if a claim exceeds our insurance coverage. Such accruals are based upon individual cases and estimates of ultimate losses, incurred but not reported losses, and losses arising from known claims ultimately settling in excess of insurance coverage using loss development factors based upon industry data and past experience. Since the reported accrual is an estimate, the ultimate liability may be different from the amount recorded. If adjustments to previously established accruals are required, such amounts are included in operating expenses in the current period. We maintain insurance with licensed insurance carriers. Legal expenses related to auto liability claims are covered under our insurance policy. We are responsible for all other legal expenses related to claims.
In brokerage arrangements, our exposure to liability associated with accidents incurred by other third-party carriers, who haul freight on our behalf, is reduced by various factors including the extent to which the third party providers maintain their own insurance coverage.
72
Table of Contents
UNIVERSAL TRUCKLOAD SERVICES, INC.
Notes to Consolidated Financial Statements—(Continued)
December 31, 2014, 2013 and 2012
| (1) | Summary of Significant Accounting Policies—continued |
| (q) | Insurance & Claims—continued |
Our insurance expense varies primarily based upon the frequency and severity of our accident experience, insurance rates, coverage limits, and self-insured retention amounts.
| (r) | Stock Based Compensation |
We record compensation expense for the grant of stock based awards. Compensation expense is measured at the grant date, based on the calculated fair value of the award, and recognized as an expense over the requisite service period (generally the vesting period of the grant). No stock based awards were granted in 2014 or 2013. During 2012, the Company granted 178,137 shares of restricted stock to certain employees with a market price at the date of grant of $16.42.
| (s) | Income Taxes |
Deferred income taxes are provided for temporary differences between the carrying amounts of assets and liabilities for financial reporting purposes and the amounts used for income tax purposes. Deferred tax assets and liabilities are measured using enacted tax rates expected to apply to taxable income in the years in which those temporary differences are expected to be recovered or settled. The effect on deferred tax assets and liabilities of a change in tax rates is recognized in income in the period that includes the enactment date.
We are no longer subject to U.S. federal income tax examinations by tax authorities for years before 2011. In addition, we file income tax returns in various state, local and foreign jurisdictions. Historically, we have been responsible for filing separate state, local and foreign income tax returns for our self and our subsidiaries. We are no longer subject to state or foreign jurisdiction income tax examinations for years before 2010 and 2009, respectively.
We recognize the effect of income tax positions only if those positions are more likely than not of being sustained. Recognized income tax positions are measured at the largest amount that is greater than 50% likely of being realized. Changes in recognition or measurement are reflected in the period in which the change in judgment occurs. We recognize interest related to unrecognized tax benefits in income tax expense and penalties in other operating expenses.
| (t) | Foreign Currency Translation |
The financial statements of the Company’s subsidiaries operating in Mexico and Canada are prepared to conform to U.S. GAAP and translated into U.S. Dollars by applying a current exchange rate. The local currency has been determined to be the functional currency. Items appearing in the Consolidated Statements of Income are translated using average exchange rates during each period. Assets and liabilities of international operations are translated at period-end exchange rates. Translation gains and losses are reported in accumulated other comprehensive income (loss) as a component of shareholders’ equity.
| (u) | Segment Information |
We report our financial results in two reportable segments, the transportation segment and the logistics segment, based on the nature of the underlying customer commitment and the types of investments
73
Table of Contents
UNIVERSAL TRUCKLOAD SERVICES, INC.
Notes to Consolidated Financial Statements—(Continued)
December 31, 2014, 2013 and 2012
| (1) | Summary of Significant Accounting Policies—continued |
| (u) | Segment Information—continued |
required to support these commitments. This presentation reflects the manner in which management evaluates our operating segments, including an evaluation of economic characteristics and applicable aggregation criteria.
Operations aggregated in our transportation segment are associated with individual freight shipments coordinated by our agents, company-managed terminals and specialized services operations. In contrast, operations aggregated in our logistics segment deliver value-added services or transportation services to specific customers on a dedicated basis, generally pursuant to contract terms of one year or longer. Other non-reportable operating segments are comprised of the Company’s subsidiaries that provide support services to other subsidiaries and to owner-operators, including shop maintenance and equipment leasing.
| (v) | Concentrations of Credit Risk |
Financial instruments, which potentially subject us to concentrations of credit risk, consist principally of cash and cash equivalents, marketable securities and accounts receivable. We maintain our cash and cash equivalents and marketable securities with high quality financial institutions. We perform ongoing credit evaluations of our customers and generally do not require collateral. Our customers are generally concentrated in the automotive, wind energy, building materials, machinery and metals industries. During the fiscal years ended December 31, 2014, 2013 and 2012, aggregate sales in the automotive industry totaled 28.4%, 33.8% and 30.7% of revenue, respectively. In 2014, General Motors accounted for approximately 9.7% of our total operating revenues and sales to our top 10 customers, including General Motors, totaled 36.1%.
| (w) | Unaudited Pro Forma Earnings Per Share |
Prior to its acquisition by Universal on October 1, 2012, LINC was an S Corporation for U.S. federal income tax purposes. As a result, LINC had no U.S. federal income tax liability, but had state and local liabilities in certain jurisdictions attributable to earnings as an S Corporation. Pro forma basic and diluted earnings per share have been computed to give effect to the termination of LINC’s S Corporation status and acquisition by Universal, which changes the provision for income taxes for each period presented. We assume a blended statutory federal, state and local rate of 38.5% in 2012.
74
Table of Contents
UNIVERSAL TRUCKLOAD SERVICES, INC.
Notes to Consolidated Financial Statements—(Continued)
December 31, 2014, 2013 and 2012
| (1) | Summary of Significant Accounting Policies—continued |
| (w) | Unaudited Pro Forma Earnings Per Share—continued |
The following table sets forth a reconciliation of the numerator and denominator used in the calculation of basic and diluted earnings per share for the periods presented (in thousands, except per share data):
| 2012 | ||||
| Net income |
$ | 47,688 | ||
| Pro forma provision for income taxes due to LINC’s conversion to a “C” corporation |
11,059 | |||
|
|
|
|||
| Pro forma net income |
$ | 36,629 | ||
|
|
|
|||
| Pro forma earnings per common share: |
||||
| Basic |
$ | 1.22 | ||
| Diluted |
$ | 1.22 | ||
| Weighted average number of common shares outstanding: |
||||
| Basic |
30,032 | |||
| Diluted |
30,036 | |||
| (x) | Recent Accounting Pronouncements |
In April 2014, the Financial Accounting Standards Board (“FASB”) issued Accounting Standards Update (“ASU”) 2014-08, Presentation of Financial Statements and Property, Plant, and Equipment, which provided new guidance related to reporting discontinued operations. This new standard raises the threshold for a disposal to qualify as a discontinued operation and requires new disclosures of both discontinued operations and certain other disposals that do not meet the definition of a discontinued operation. The new standard is effective for fiscal years beginning on or after December 15, 2014. Early adoption is permitted but only for disposals that have not been reported in financial statements previously issued. The adoption of this guidance is not expected to have a significant impact on the Company’s financial condition, results of operations, or cash flow.
In May 2014, the FASB issued ASU 2014-09, Revenue from Contracts with Customers, which provided new accounting guidance related to revenue recognition. The objective of ASU 2014-09 is to establish a single comprehensive model for entities to use in accounting for revenue arising from contracts with customers and will supersede most of the existing revenue recognition guidance, including industry-specific guidance. The core principle of ASU 2014-09 is that an entity recognizes revenue to depict the transfer of promised goods or services to customers in an amount that reflects the consideration to which the entity expects to be entitled in exchange for those goods or services. In applying the new guidance, an entity will (1) identify the contract(s) with a customer; (2) identify the performance obligations in the contract; (3) determine the transaction price; (4) allocate the transaction price to the contract’s performance obligations; and (5) recognize revenue when (or as) the entity satisfies a performance obligation. ASU 2014-09 applies to all contracts with customers except those that are within the scope of other topics in the FASB Accounting Standards Codification. The new guidance is effective for annual reporting periods (including interim periods within those periods)
beginning after December 15, 2016 for public companies. Early adoption is not permitted. Entities have the option of using either a full retrospective or modified approach to adopt ASU 2014-09. We are
75
Table of Contents
UNIVERSAL TRUCKLOAD SERVICES, INC.
Notes to Consolidated Financial Statements—(Continued)
December 31, 2014, 2013 and 2012
| (1) | Summary of Significant Accounting Policies—continued |
| (x) | Recent Accounting Pronouncements—continued |
evaluating the effect, if any, that adopting this new accounting standard will have on our consolidated financial statements and related disclosures.
| (2) | Business Combinations |
Acquisitions Accounted for Using the Purchase Method
In September 2014, we acquired certain assets of Bull’s-Eye Express, Inc. and its several affiliated companies, or Bull’s-Eye, based in Albany, Missouri through a Limited Asset Purchase Agreement for $1.6 million. Bull’s-Eye is a regional provider of industrial equipment transportation and freight consolidation services and is strategically positioned to service customers in the Midwest. As of December 31, 2014, $1.3 million of the purchase price was paid in cash and an additional $0.3 million consisted of partial forgiveness of a debt due to us. Pursuant to the acquisition, Bull’s-Eye operates as part of Universal Truckload, Inc.
The pro forma effect of this acquisition has been omitted, as the effect is immaterial to the Company’s results of operations, financial position and cash flows. The allocation of the purchase price is as follows (in thousands):
| Intangible assets |
$ | 1,007 | ||
| Property and equipment |
400 | |||
| Goodwill (tax deductible) |
163 | |||
|
|
|
|||
| $ | 1,570 | |||
|
|
|
The intangible assets acquired represent the acquired companies’ customer relationships and are being amortized over a period of seven years.
The operating results of the Bull’s-Eye have been included in the Consolidated Statements of Income since its acquisition date; however, it has not been separately disclosed as it is deemed immaterial.
Goodwill represents the excess of purchase price over the estimated fair value assigned to the net tangible and identifiable intangible assets of the businesses acquired, and the expected synergies to be achieved through the integration of the acquired companies into Universal.
In December 2013, we acquired Westport USA Holding, LLC (“Westport”) for $123.0 million in cash, subject to a working capital adjustment after closing. Pursuant to the terms of the Unit Purchase Agreement, Westport was acquired on a cash-free, debt-free basis. Based in Louisville, Kentucky, Westport provides value-added warehousing and component distribution services to U.S. manufacturers of Class 4-8 trucks, RVs and super-duty trucks. Westport also machines and distributes steering knuckles and axle components for the automotive industry. During 2014, we finalized the working capital adjustment and made a final payment of $1.4 million in cash. We used available cash and borrowings under our Revolving Credit and Term Loan Agreement to finance the acquisition (see Note 6 “Debt”).
76
Table of Contents
UNIVERSAL TRUCKLOAD SERVICES, INC.
Notes to Consolidated Financial Statements—(Continued)
December 31, 2014, 2013 and 2012
| (2) | Business Combinations—continued |
The acquisition of Westport was accounted for in accordance with ASC 805 “Business Combinations.” Assets acquired and liabilities assumed were recorded at their estimated fair values as of December 19, 2013, with the remaining unallocated purchase price recorded as goodwill. The goodwill recorded is included in our logistics segment, and is non-deductible for income tax purposes. The estimated useful lives of these intangible assets ranged from five months to nineteen years. The final allocation of the purchase price is as follows (in thousands):
| Current assets |
$ | 24,492 | ||
| Property and equipment |
17,081 | |||
| Goodwill |
56,356 | |||
| Intangible assets |
57,800 | |||
| Other long-term assets |
474 | |||
| Current liabilities |
(2,932 | ) | ||
| Capital lease obligations |
(5,164 | ) | ||
| Deferred tax liabilities, net |
(25,083 | ) | ||
|
|
|
|||
| $ | 123,024 | |||
|
|
|
The intangible assets acquired represent Westport’s acquired trademarks, customer contracts and customer relationships. The acquired customer contracts and customer relationships are being amortized over a period from five months to nineteen years. The useful lives of acquired trademarks are indefinite and, therefore, not subject to amortization.
The following unaudited pro forma consolidated results of operations for the twelve-month periods ended December 31, 2013 and 2012 present consolidated information of the Company as if Westport was acquired on January 1, 2012 (in thousands, except per share data):
| Pro Forma Twelve Months Ended December 31, 2013 |
Pro Forma Twelve Months Ended December 31, 2012 |
|||||||
| Operating revenues |
$ | 1,121,459 | $ | 1,095,393 | ||||
| Operating income |
$ | 93,972 | $ | 66,848 | ||||
| Net Income |
$ | 54,791 | $ | 44,143 | ||||
| Earnings per common share: |
||||||||
| Basic |
$ | 1.82 | $ | 1.47 | ||||
| Diluted |
$ | 1.82 | $ | 1.47 | ||||
The unaudited pro forma consolidated results for the twelve-month periods were prepared using the acquisition method of accounting and are based on the historical financial information of Westport and the Company. The historical financial information has been adjusted to give effect to pro forma adjustments that are: (i) directly attributable to the acquisition, (ii) factually supportable and (iii) expected to have a continuing impact on the combined results. The unaudited pro forma condensed combined financial statements are presented for illustrative purposes and do not purport to represent what the financial position or results of operations would actually have been had we acquired Westport on January 1, 2012.
The acquisition of Westport strategically enhances our customer base by further penetrating industrial markets, specifically to manufacturers of medium and heavy-duty trucks. We believe that Westport’s
77
Table of Contents
UNIVERSAL TRUCKLOAD SERVICES, INC.
Notes to Consolidated Financial Statements—(Continued)
December 31, 2014, 2013 and 2012
| (2) | Business Combinations—continued |
value-added services and limited capital requirements fit nicely into our business model and long-term growth strategy. The operating results of Westport have been included in the Consolidated Statements of Income since its acquisition date. Included in our operating results during the year ended December 31, 2013 are transaction and other acquisition related costs totaling $0.7 million, which are reflected in selling, general and administrative expenses in the Consolidated Statements of Income.
In May 2012, we acquired certain assets of TFX Incorporated, or TFX, based in Durham, North Carolina through a Limited Asset Purchase Agreement for approximately $1.1 million. TFX is primarily a regional provider of intermodal transportation services strategically positioned to service the primary port areas on the East Coast and the key railheads and major manufacturing centers of the Southern and Midwestern United States. We used available cash and cash equivalents to finance acquisition. Pursuant to the acquisition, TFX operates as part of Mason Dixon Intermodal, Inc.
The pro forma effect of this acquisition has been omitted, as the effect is immaterial to the Company’s results of operations, financial position and cash flows. The allocation of the purchase price is as follows (in thousands):
| Intangible assets |
$ | 657 | ||
| Property and equipment |
200 | |||
| Goodwill (tax deductible) |
243 | |||
|
|
|
|||
| $ | 1,100 | |||
|
|
|
The intangible assets acquired represent the acquired companies’ customer relationships and are being amortized over a period of seven years.
The operating results of the TFX have been included in the Consolidated Statements of Income since its acquisition date; however, it has not been separately disclosed as it is deemed immaterial.
Goodwill represents the excess of purchase price over the estimated fair value assigned to the net tangible and identifiable intangible assets of the businesses acquired, and the expected synergies to be achieved through the integration of the acquired companies into Universal.
Acquisition Accounted for Between Entities Under Common Control
In October 2012, we completed the acquisition of LINC whereby each outstanding share of LINC common stock was converted into the right to receive consideration consisting of 0.700 of a share of common stock of the Company and cash in lieu of fractional shares. This resulted in the issuance of 14,527,332 shares of the Company’s common stock. Our majority shareholders beneficially owned, in the aggregate, 100% of the common stock of LINC. The transaction was accounted for using the guidance for transactions between entities under common control as described in ASC Topic 805—“Business Combinations”, which resulted in the Company presenting the transaction at carryover basis and prior periods were retroactively restated.
Upon closing the merger with LINC on October 1, 2012, we borrowed approximately $149.1 million to repay LINC’s outstanding indebtedness and dividends payable. During 2012, we also expensed transaction fees and other costs related to the merger totaling $8.4 million, which are reflected in selling, general and administrative expenses in the Consolidated Statements of Income.
78
Table of Contents
UNIVERSAL TRUCKLOAD SERVICES, INC.
Notes to Consolidated Financial Statements—(Continued)
December 31, 2014, 2013 and 2012
| (3) | Accounts Receivable |
Accounts receivable amounts appearing in the financial statements include both billed and unbilled receivables. We bill customers in accordance with contract terms, which may result in a brief timing difference between when revenue is recognized and when invoices are rendered. Unbilled receivables, which usually are billed within one month, totaled $11.6 million and $12.8 million at December 31, 2014 and 2013, respectively.
Accounts receivable are presented net of an allowance for doubtful accounts. Following is a summary of the activity in the allowance for doubtful accounts for the years ended December 31 (in thousands):
| 2014 | 2013 | 2012 | ||||||||||
| Balance at beginning of year |
$ | 2,688 | $ | 2,515 | $ | 3,874 | ||||||
| Provision for doubtful accounts |
3,504 | 1,515 | 1,190 | |||||||||
| Acquisition of businesses |
— | 163 | — | |||||||||
| Uncollectible accounts written off |
(985 | ) | (1,505 | ) | (2,549 | ) | ||||||
|
|
|
|
|
|
|
|||||||
| Balance at end of year |
$ | 5,207 | $ | 2,688 | $ | 2,515 | ||||||
|
|
|
|
|
|
|
|||||||
| (4) | Property and Equipment |
Property and equipment at December 31 consists of the following (in thousands):
| 2014 | 2013 | |||||||
| Transportation equipment |
$ | 186,344 | $ | 151,395 | ||||
| Land, buildings and related assets |
67,472 | 68,653 | ||||||
| Other operating assets |
54,433 | 43,624 | ||||||
| Information technology equipment |
15,261 | 14,427 | ||||||
| Construction in process |
4,169 | 2,163 | ||||||
|
|
|
|
|
|||||
| 327,679 | 280,262 | |||||||
| Less accumulated depreciation |
(149,610 | ) | (137,606 | ) | ||||
|
|
|
|
|
|||||
| Total |
$ | 178,069 | $ | 142,656 | ||||
|
|
|
|
|
|||||
| (5) | Accrued Expenses and Other Current Liabilities |
Accrued expenses consist of the following items at December 31 (in thousands):
| 2014 | 2013 | |||||||
| Payroll related items |
$ | 8,827 | $ | 8,080 | ||||
| Driver escrow liabilities |
4,519 | 6,099 | ||||||
| Commissions, taxes and other |
8,995 | 6,893 | ||||||
|
|
|
|
|
|||||
| Total |
$ | 22,341 | $ | 21,072 | ||||
|
|
|
|
|
|||||
79
Table of Contents
UNIVERSAL TRUCKLOAD SERVICES, INC.
Notes to Consolidated Financial Statements—(Continued)
December 31, 2014, 2013 and 2012
| (6) | Debt |
Debt is comprised of the following (in thousands):
| Interest Rates
at December 31, 2014 |
December 31, | |||||||||
| 2014 | 2013 | |||||||||
| Outstanding Debt: |
||||||||||
| Syndicated credit facility |
||||||||||
| $120 million revolving credit facility |
LIBOR + 1.85% | $ | 59,500 | $ | 60,000 | |||||
| Swing Line sub-facility |
Prime + 0.85% | 370 | — | |||||||
| $60 million equipment financing facility |
LIBOR + 2.35% | 55,428 | 57,500 | |||||||
| $50 million term loan |
LIBOR + 3.00% | 50,000 | 50,000 | |||||||
| $70 million term loan B |
LIBOR + 3.00% | 70,000 | 70,000 | |||||||
| UBS secured borrowing facility |
LIBOR + 1.10% | — | — | |||||||
|
|
|
|
|
|||||||
| 235,298 | 237,500 | |||||||||
| Less current portion |
9,593 | 5,482 | ||||||||
|
|
|
|
|
|||||||
| Total long-term debt |
$ | 225,705 | $ | 232,018 | ||||||
|
|
|
|
|
|||||||
Syndicated credit facility
On December 19, 2013, we entered into a Second Amendment (the “Amendment”) to our Revolving Credit and Term Loan Agreement dated August 28, 2012, (the “Credit Agreement”) with and among the lenders parties thereto and Comerica Bank, as administrative agent, to provide for aggregate borrowing facilities of up to $300 million. The Amendment modifies the Credit Agreement to allow for additional borrowings of $70 million under a new term loan and a $10 million increase in the revolving credit facility. The Credit Agreement, as amended, consists of a $120 million revolving credit facility (which amount may be increased by up to $20 million upon request of the Company and approval of the lenders), a $60 million equipment credit facility, a $50 million term loan, and a $70 million term loan B. Additionally, the Credit Agreement provides for up to $5 million in letters of credit, which letters of credit reduce availability under the revolving credit facility.
On December 19, 2013, we used available cash, $70 million in proceeds from the new term loan, $25 million in proceeds from our revolving credit facility, and $25.5 million in additional borrowings from our existing equipment credit facility to pay the aggregate cash consideration and expenses related to the acquisition of Westport (see Note 2 “Business Combinations”).
$120 million Revolving Credit Facility
The revolving credit facility is available to refinance existing indebtedness and to finance working capital through, and mature on, August 28, 2017. Two interest rate options are applicable to advances borrowed pursuant to the facility: Eurodollar-based advances and base rate advances. Eurodollar-based advances bear interest at 30, 60 or 90-day LIBOR rates plus an applicable margin, which varies from 1.35% to 2.10% based on our ratio of total debt to earnings before interest, taxes, depreciation and amortization (“EBITDA”), as defined. As an alternative, base rate advances bear interest at a base rate, as defined, plus an applicable margin, which also varies based on our ratio of total debt to EBITDA in a range from 0.35% to 1.10%. The base rate is the greater of the prime rate announced by Comerica Bank, the federal funds effective rate plus 1.0%, or the daily adjusting LIBOR rate plus 1.0%. At December 31, 2014, interest accrued at 2.02% based on 30-day LIBOR.
80
Table of Contents
UNIVERSAL TRUCKLOAD SERVICES, INC.
Notes to Consolidated Financial Statements—(Continued)
December 31, 2014, 2013 and 2012
| (6) | Debt—continued |
To support daily borrowing and other operating requirements, the revolving credit facility contains a $10.0 million Swing Line sub-facility and a $5.0 million letter of credit sub-facility. On June 3, 2013, we executed an amendment to our Revolving Credit and Term Loan Agreement (the “First Amendment”) which split the availability on the Swing Line between two existing lenders, Comerica Bank and KeyBank. The SwingLine was split to provide for borrowings of up to $7.0 million from Comerica Bank and $3.0 million from KeyBank, so long as the Comerica Bank and KeyBank advances do not exceed $10.0 million in the aggregate. Swing Line borrowings incur interest at either the base rate plus the applicable margin or, alternatively, at a quoted rate offered by the applicable Swing Line lender in its sole discretion. At December 31, 2014, there was $0.4 million outstanding under the Swing Line and interest accrued at 4.10% based on the prime rate. We did not have any letters of credit issued against the revolving credit facility.
Interest on the unpaid balance of all revolving credit facility and swing line base rate advances is payable quarterly in arrears commencing on October 1, 2012, and on the first day of each October, January, April and July thereafter. Interest on the unpaid balance of each Eurodollar-based advance of the revolving credit facility is payable on the last day of the applicable Eurodollar interest period. Interest on the unpaid balance of each quoted rate based advance of the swing line is payable on the last day of the applicable quoted rate interest period.
The revolving credit facility is subject to a facility fee, which is payable quarterly in arrears, of either 0.25% or 0.50%, depending on our ratio of total debt to EBITDA. Other than in connection with Eurodollar-based advances or quoted rate advances that are paid off and terminated prior to an applicable interest period, there are no premiums or penalties resulting from prepayment. Borrowings outstanding at any time under the revolving credit facility are limited to the value of eligible accounts receivable of our principal operating subsidiaries, pursuant to a monthly borrowing base certificate. At December 31, 2014, our $59.5 million revolver advance was secured by, among other assets, net eligible accounts receivable totaling $122.4 million, of which, $104.1 million were available for borrowing against pursuant to the agreement.
$60 million Equipment Credit Facility
The equipment credit facility is available to refinance existing indebtedness and to finance capital expenditures including in connection with acquisitions. Borrowings under the equipment credit facility may be made until August 28, 2015, and such borrowings shall be repaid in quarterly installments equal to 1/28th of the aggregate amount of borrowings under the equipment credit facility commencing on January 1, 2014.
The two interest rate options that apply to revolving credit facility advances also apply to equipment credit facility advances. Eurodollar-based advances bear interest at 30, 60 or 90-day LIBOR rates plus an applicable margin, which varies from 1.60% to 2.60% based on our ratio of total debt to EBITDA. Base rate advances bear interest at a base rate, as defined, plus an applicable margin, which also varies based on our ratio of total debt to EBITDA in a range from 0.60% to 1.60%. The equipment credit facility is subject to an unused fee, which is payable quarterly in arrears, of 0.50%. At December 31, 2014, interest accrued at 2.52% based on 30-day LIBOR.
Interest on the unpaid balance of all equipment credit facility base rate advances is payable quarterly in arrears commencing on October 1, 2012, and on the first day of each October, January, April and July
81
Table of Contents
UNIVERSAL TRUCKLOAD SERVICES, INC.
Notes to Consolidated Financial Statements—(Continued)
December 31, 2014, 2013 and 2012
| (6) | Debt—continued |
thereafter. Interest on the unpaid balance of each Eurodollar-based advance of the equipment credit facility is payable on the last day of the applicable Eurodollar interest period.
$50 million Term Loan
Proceeds of the term loan were advanced on October 1, 2012 and used to refinance existing indebtedness of LINC. The outstanding principal balance is due on August 28, 2017, to the extent not already reduced by mandatory or optional prepayments. The applicable interest rate on the effective date of the term loan indebtedness was the base rate. Base rate advances bear interest at a defined base rate plus an applicable margin which varies from 1.50% to 2.25%, based on our ratio of total debt to EBITDA. Thereafter, we may convert base rate advances to Eurodollar-based advances, which bear interest at 30, 60 or 90-day LIBOR rates plus an applicable margin which varies from 2.50% to 3.25%, based on our ratio of total debt to EBITDA. At December 31, 2014, interest accrued at 3.17% based on 30-day LIBOR.
Interest on the unpaid principal of all term loan base rate advances is payable quarterly in arrears commencing on October 1, 2012, and on the first day of each October, January, April and July thereafter. Interest on the unpaid principal of each Eurodollar-based advance of the term loan is payable on the last day of the applicable Eurodollar interest period.
$70 million Term Loan B
Proceeds of the term loan were advanced on December 19, 2013 and used to finance the acquisition of Westport. The outstanding principal balance is due on August 28, 2017, to the extent not already reduced by mandatory or optional prepayments. The applicable interest rate on the effective date of the term loan indebtedness was the base rate. Base rate advances bear interest at a defined base rate plus an applicable margin which varies from 1.50% to 2.25%, based on our ratio of total debt to EBITDA. Thereafter, we may convert base rate advances to Eurodollar-based advances, which bear interest at 30, 60 or 90-day LIBOR rates plus an applicable margin which varies from 2.50% to 3.25%, based on our ratio of total debt to EBITDA. At December 31, 2014, interest accrued at 3.17% based on 30-day LIBOR.
Interest on the unpaid principal of all term loan base rate advances is payable quarterly in arrears commencing on January 1, 2014, and on the first day of each January, April, July and October thereafter. Interest on the unpaid principal of each Eurodollar-based advance of the term loan is payable on the last day of the applicable Eurodollar interest period.
The Credit Agreement requires us to repay the borrowings made under the term loan facilities and the equipment credit facility as follows: 50% (which percentage shall be reduced to 0% subject to the Company attaining a certain leverage ratio) of our annual excess cash flow, as defined; 100% of net cash proceeds of certain asset sales; and 100% of certain insurance and condemnation proceeds. Mandatory prepayments of the term loans were $1.0 million as of December 31, 2014. We may voluntarily repay outstanding loans under each of the facilities at any time, subject to certain customary “breakage” costs with respect to LIBOR-based borrowings. In addition, we may elect to permanently terminate or reduce all or a portion of the revolving credit facility.
All obligations under the Credit Agreement are unconditionally guaranteed by the Company’s material U.S. subsidiaries, and the obligations of the Company and such subsidiaries under the Credit Agreement and such guarantees are secured by, subject to certain exceptions, substantially all of their
82
Table of Contents
UNIVERSAL TRUCKLOAD SERVICES, INC.
Notes to Consolidated Financial Statements—(Continued)
December 31, 2014, 2013 and 2012
| (6) | Debt—continued |
assets. The Credit Agreement also may, in certain circumstances, limit our ability to pay dividends or distributions. The Credit Agreement includes annual, quarterly and ad hoc financial reporting requirements and financial covenants requiring the Company to maintain maximum leverage ratios and a minimum fixed charge coverage ratio, as well as customary affirmative and negative covenants and events of default. Specifically, we may not exceed a maximum senior debt to EBITDA ratio, as defined, of 2.5:1 and a maximum total debt to EBITDA ratio, as defined, of 3.0:1. We must also maintain a fixed charge coverage ratio, as defined, of not less than 1.25:1. As of December 31, 2014, the Company was in compliance with its debt covenants.
UBS Secured Borrowing Facility
We also maintain a secured borrowing facility at UBS Financial Services, Inc., or UBS, using our marketable securities as collateral for the short-term line of credit. The line of credit bears an interest rate equal to LIBOR plus 1.10% (effective rate of 1.27% at December 31, 2014), and interest is adjusted and billed monthly. No principal payments are due on the borrowing; however, the line of credit is callable at any time. The amount available under the line of credit is based on a percentage of the market value of the underlying securities. If the equity value in the account falls below the minimum requirement, we must restore the equity value, or UBS may call the line of credit. We did not have any amounts outstanding under our line of credit at December 31, 2014 or 2013, and the maximum available borrowings under the line of credit were $6.9 million and $5.4 million, respectively.
Maturities
The following table reflects the maturities of our principal repayment obligations as of December 31, 2014 (in thousands):
| Years Ending |
Revolving Credit Facility |
Swing Line Sub-Facility |
Equipment Financing Facility |
Term Loan |
Term Loan B |
Total | ||||||||||||||||||
| 2015 |
$ | — | $ | — | $ | 8,571 | $ | 1,022 | $ | — | $ | 9,593 | ||||||||||||
| 2016 |
— | — | 8,571 | — | — | 8,571 | ||||||||||||||||||
| 2017 |
59,500 | 370 | 38,286 | 48,978 | 70,000 | 217,134 | ||||||||||||||||||
|
|
|
|
|
|
|
|
|
|
|
|
|
|||||||||||||
| Total |
$ | 59,500 | $ | 370 | $ | 55,428 | $ | 50,000 | $ | 70,000 | $ | 235,298 | ||||||||||||
|
|
|
|
|
|
|
|
|
|
|
|
|
|||||||||||||
| (7) | Fair Value Measurement and Disclosures |
ASC Topic 820, “Fair Value Measurements and Disclosures”, defines fair value as the exchange price that would be received for an asset or paid to transfer a liability in the principal or most advantageous market for the asset or liability in an orderly transaction between market participants at the measurement date and expanded disclosures with respect to fair value measurements.
ASC Topic 820 also establishes a three-level fair value hierarchy that prioritizes the inputs used to measure fair value. This hierarchy requires entities to maximize the use of observable inputs and minimize the use of unobservable inputs. The three levels of inputs used to measure fair value are as follows:
| • | Level 1—Quoted prices in active markets for identical assets or liabilities. |
83
Table of Contents
UNIVERSAL TRUCKLOAD SERVICES, INC.
Notes to Consolidated Financial Statements—(Continued)
December 31, 2014, 2013 and 2012
| (7) | Fair Value Measurement and Disclosures—continued |
| • | Level 2—Observable inputs other than quoted prices included in Level 1, such as quoted prices for similar assets and liabilities in active markets; quoted prices for identical or similar assets and liabilities in markets that are not active; or other inputs that are observable or can be corroborated by observable market data. |
| • | Level 3—Unobservable inputs that are supported by little or no market activity and that are significant to the fair value of the assets or liabilities. This includes certain pricing models, discounted cash flow methodologies and similar techniques that use significant unobservable inputs. |
We have segregated all financial assets that are measured at fair value on a recurring basis into the most appropriate level within the fair value hierarchy based on the inputs used to determine the fair value at the measurement date in the tables below (in thousands):
| December 31, 2014 | ||||||||||||||||
| Level 1 | Level 2 | Level 3 | Fair Value Measurement |
|||||||||||||
| Assets |
||||||||||||||||
| Cash equivalents |
$ | 21 | $ | — | $ | — | $ | 21 | ||||||||
| Marketable securities |
14,309 | — | — | 14,309 | ||||||||||||
|
|
|
|
|
|
|
|
|
|||||||||
| Total Assets |
$ | 14,330 | $ | — | $ | — | $ | 14,330 | ||||||||
|
|
|
|
|
|
|
|
|
|||||||||
| December 31, 2013 | ||||||||||||||||
| Level 1 | Level 2 | Level 3 | Fair Value Measurement |
|||||||||||||
| Assets |
||||||||||||||||
| Cash equivalents |
$ | 117 | $ | — | $ | — | $ | 117 | ||||||||
| Marketable securities |
11,626 | — | — | 11,626 | ||||||||||||
|
|
|
|
|
|
|
|
|
|||||||||
| Total Assets |
$ | 11,743 | $ | — | $ | — | $ | 11,743 | ||||||||
|
|
|
|
|
|
|
|
|
|||||||||
The valuation techniques used to measure fair value for the items in the tables above are as follows:
| • | Cash equivalents—This category consists of money market funds which are listed as Level 1 assets and measured at fair value based on quoted prices for identical instruments in active markets. |
| • | Marketable securities—Marketable securities represent equity securities, which consist of common and preferred stocks, are actively traded on public exchanges and are listed as Level 1 assets. Fair value was measured based on quoted prices for these securities in active markets. |
Our senior debt and line of credit consists of variable rate borrowings. We categorize borrowings under the credit agreement and line of credit as Level 2 in the fair value hierarchy. The carrying value of these borrowings approximate fair value because the applicable interest rates are adjusted frequently based on short-term market rates.
| (8) | Transactions with Affiliates |
Through December 31, 2004, Universal was a wholly-owned subsidiary of CenTra, Inc. On December 31, 2004, CenTra distributed all of Universal’s common stock to the shareholders of
84
Table of Contents
UNIVERSAL TRUCKLOAD SERVICES, INC.
Notes to Consolidated Financial Statements—(Continued)
December 31, 2014, 2013 and 2012
| (8) | Transactions with Affiliates—continued |
CenTra. Subsequent to our initial public offering in 2005, our majority shareholders retained and continue to hold a controlling interest in Universal. CenTra provides administrative support services to Universal, including legal, human resources, and tax services. The cost of these services is based on the actual or estimated utilization of the specific service. Management believes these charges are reasonable. However, the costs of these services charged to Universal are not necessarily indicative of the costs that would have been incurred if Universal had internally performed or acquired these services as a separate unaffiliated entity.
In addition to the administrative support services described above, Universal purchases other services from affiliates. Following is a schedule of cost incurred and included in operating expenses for services provided by affiliates for the years ended December 31 (in thousands):
| 2014 | 2013 | 2012 | ||||||||||
| Administrative support services |
$ | 2,459 | $ | 2,367 | $ | 2,535 | ||||||
| Truck fueling and maintenance |
1,320 | 1,774 | 3,850 | |||||||||
| Real estate rent and related costs |
10,472 | 11,352 | 10,787 | |||||||||
| Insurance and employee benefit plans |
36,073 | 32,710 | 33,657 | |||||||||
| Contracted transportation services |
930 | 311 | 285 | |||||||||
|
|
|
|
|
|
|
|||||||
| Total |
$ | 51,254 | $ | 48,514 | $ | 51,114 | ||||||
|
|
|
|
|
|
|
|||||||
In connection with our transportation services, we also routinely cross the Ambassador Bridge between Detroit, Michigan and Windsor, Ontario, and we pay tolls and other fees to certain related entities which are under common control with CenTra. CenTra also charges us for the direct variable cost of various maintenance, fueling and other operational support costs for services delivered at their trucking terminals that are geographically remote from our own facilities. Such activities are billed when incurred, paid on a routine basis, and reflect actual labor utilization, repair parts costs or quantities of fuel purchased.
A significant number of our transportation and logistics service operations are located at facilities leased from affiliates. At 43 facilities, occupancy is based on either month-to-month or contractual, multi-year lease arrangements which are billed and paid monthly. Leasing properties provided by an affiliate that owns a substantial commercial property portfolio affords us significant operating flexibility. However, we are not limited to such arrangements. See Note 10, “Leases” for further information regarding the cost of leased properties.
We purchase workers’ compensation, property and casualty, cargo, warehousing and other general liability insurance from an insurance company controlled by our majority shareholders. Our employee health care benefits and 401(k) programs are also provided by this affiliate.
Other services from affiliates, including leased real estate, insurance and employee benefit plans, and contracted transportation services, are delivered to us on a per-transaction-basis or pursuant to separate contractual arrangements provided in the ordinary course of business. At December 31, 2014 and 2013, amounts due to affiliates were $2.9 million and $3.6 million, respectively. In our Consolidated Balance Sheets, we record our insured claims liability and the related recovery from an affiliate insurance provider in insurance and claims, and other receivables. At December 31, 2014 and 2013, there were $10.7 million and $15.8 million, respectively, included in each of these accounts for insured claims.
85
Table of Contents
UNIVERSAL TRUCKLOAD SERVICES, INC.
Notes to Consolidated Financial Statements—(Continued)
December 31, 2014, 2013 and 2012
| (8) | Transactions with Affiliates—continued |
We incurred approximately $0.5 million of costs in both 2014 and 2013 relating to underwritten public offerings of our common stock. Under the Amended and Restated Registration Rights Agreement, dated as of July 25, 2012 with our majority shareholders, we were responsible to pay for the cost of the offering. After deducting the underwriting discount and offering expenses, we did not have any remaining proceeds from the sales of our common stock.
During 2014, we purchased ten used tractors and one used trailer from an affiliate totaling approximately $0.8 million. During 2013, we purchased 39 used tractors from an affiliate for approximately $1.6 million.
We have retained the law firm of Sullivan Hincks & Conway to provide legal services. Daniel C. Sullivan, a member of our Board, is a partner at Sullivan Hincks & Conway. Not included in the table above are amounts paid for legal services during 2014, 2013 and 2012 were $92,000, $7,000 and $144,000, respectively.
Services provided by Universal to Affiliates
We may assist our affiliates with selected transportation and logistics services in connection with their specific customer contracts or purchase orders. Truck fueling and administrative expenses are presented net in operating expense. Following is a schedule of services provided to CenTra and affiliates for the years ended December 31 (in thousands):
| 2014 | 2013 | 2012 | ||||||||||
| Transportation and intermodal services |
$ | 308 | $ | 9,800 | $ | 2,644 | ||||||
| Truck fueling and maintenance |
87 | 184 | 227 | |||||||||
| Administrative and customer support services |
71 | 113 | 111 | |||||||||
|
|
|
|
|
|
|
|||||||
| Total |
$ | 466 | $ | 10,097 | $ | 2,982 | ||||||
|
|
|
|
|
|
|
|||||||
At December 31, 2014 and 2013, amounts due from affiliates were $1.6 million and $2.3 million, respectively.
During 2014, we sold forty-one used trailers to an affiliate for approximately $82,000, and recognized an $82,000 gain on the sale of those trailers.
Also during 2014, we acquired selected assets, operations and businesses in connection with international border crossing freight processing, customs documentation and compliance services from an affiliate for approximately $100,000.
In October 2012, we completed the acquisition of LINC. Our principal shareholders beneficially owned, in the aggregate, 100% of the common stock of LINC. See Note 2 “Business Combinations—Acquisition Accounted for Between Entities Under Common Control”.
On March 12, 2015, we entered into a Service Level Agreement with Data System Services, LLC, a related party, to provide IT infrastructure and services to host our accounting system in a data center environment. Initial setup costs are approximately $0.2 million and recurring annual costs are estimated at $0.2 million, based on our anticipated number of users.
86
Table of Contents
UNIVERSAL TRUCKLOAD SERVICES, INC.
Notes to Consolidated Financial Statements—(Continued)
December 31, 2014, 2013 and 2012
| (9) | Income Taxes |
A summary of income related to U.S. and non-U.S. operations are as follows (in thousands):
| Year Ended December 31, | ||||||||||||
| 2014 | 2013 | 2012 | ||||||||||
| Operations |
||||||||||||
| U.S. Domestic |
$ | 70,079 | $ | 74,697 | $ | 63,427 | ||||||
| Foreign |
3,020 | 6,219 | 4,525 | |||||||||
|
|
|
|
|
|
|
|||||||
| Total pre-tax income |
$ | 73,099 | $ | 80,916 | $ | 67,952 | ||||||
|
|
|
|
|
|
|
|||||||
The provision for income taxes attributable to income from continuing operations for the years ended December 31 consists of the following (in thousands):
| 2014 | 2013 | 2012 | ||||||||||
| Current: |
||||||||||||
| U.S. Federal |
$ | 20,822 | $ | 22,797 | $ | 12,554 | ||||||
| State |
4,838 | 3,609 | 1,740 | |||||||||
| Foreign |
590 | 1,442 | 1,586 | |||||||||
|
|
|
|
|
|
|
|||||||
| 26,250 | 27,848 | 15,880 | ||||||||||
| Deferred: |
||||||||||||
| U.S. Federal |
489 | 1,922 | 4,155 | |||||||||
| State |
891 | 524 | 354 | |||||||||
| Foreign |
99 | 50 | (125 | ) | ||||||||
|
|
|
|
|
|
|
|||||||
| 1,479 | 2,496 | 4,384 | ||||||||||
|
|
|
|
|
|
|
|||||||
| Total |
$ | 27,729 | $ | 30,344 | $ | 20,264 | ||||||
|
|
|
|
|
|
|
|||||||
87
Table of Contents
UNIVERSAL TRUCKLOAD SERVICES, INC.
Notes to Consolidated Financial Statements—(Continued)
December 31, 2014, 2013 and 2012
| (9) | Income Taxes—continued |
Deferred income tax assets and liabilities at December 31 consist of the following (in thousands):
| 2014 | 2013 | |||||||||||||||
| Current | Long-term | Current | Long-term | |||||||||||||
| Domestic deferred tax assets: |
||||||||||||||||
| Allowance for doubtful accounts |
$ | 1,391 | $ | — | $ | 578 | $ | — | ||||||||
| Other assets |
— | 3,083 | — | 1,018 | ||||||||||||
| Accrued expenses |
5,285 | — | 5,826 | — | ||||||||||||
|
|
|
|
|
|
|
|
|
|||||||||
| Total domestic deferred tax assets |
6,676 | 3,083 | 6,404 | 1,018 | ||||||||||||
|
|
|
|
|
|
|
|
|
|||||||||
| Domestic deferred tax liabilities: |
||||||||||||||||
| Prepaid expenses |
(1,290 | ) | — | (1,528 | ) | — | ||||||||||
| Marketable securities |
— | (1,687 | ) | — | (1,480 | ) | ||||||||||
| Intangible assets |
— | (18,404 | ) | — | (21,248 | ) | ||||||||||
| Property and equipment |
— | (29,061 | ) | — | (22,261 | ) | ||||||||||
|
|
|
|
|
|
|
|
|
|||||||||
| Total domestic deferred tax liabilities |
(1,290 | ) | (49,152 | ) | (1,528 | ) | (44,989 | ) | ||||||||
|
|
|
|
|
|
|
|
|
|||||||||
| Foreign deferred tax asset |
||||||||||||||||
| Other assets |
— | 590 | — | 624 | ||||||||||||
| Valuation allowance—foreign |
— | (404 | ) | — | (401 | ) | ||||||||||
|
|
|
|
|
|
|
|
|
|||||||||
| Total foreign deferred tax asset |
— | 186 | — | 223 | ||||||||||||
|
|
|
|
|
|
|
|
|
|||||||||
| Net deferred tax asset (liability) |
$ | 5,386 | $ | (45,883 | ) | $ | 4,876 | $ | (43,748 | ) | ||||||
|
|
|
|
|
|
|
|
|
|||||||||
In assessing the realizability of deferred tax assets, management considers whether it is more likely than not that some portion or all of the domestic and foreign deferred tax assets will not be realized. The deferred tax assets and liabilities were reviewed separately by jurisdictions when measuring the need for valuation allowances. The ultimate realization of deferred tax assets is dependent upon the generation of future taxable income (both ordinary income and taxable capital gains) during the periods in which those temporary differences reverse. Management considers the scheduled reversal of deferred tax liabilities, projected future taxable income, and tax planning strategies in making this assessment. Valuation allowances are established when necessary to reduce deferred tax assets when it is more likely than not that a portion or all of the deferred tax assets will not be realized. Based upon the level of historical taxable income, reversal of existing taxable temporary differences, projections for future taxable income over the periods in which the domestic deferred tax assets are expected to reverse, and our ability to generate future capital gains, management believes it is more likely than not that we will realize the benefits of these deductible differences. Thus, no valuation allowance has been established for the domestic deferred tax assets. Based on the anticipated earnings projections of the foreign subsidiaries, management has recorded a full valuation allowance for the deferred tax assets associated with the German subsidiary.
The company has not provided for U.S. income taxes on foreign subsidiaries undistributed earnings since they are expected to be reinvested indefinitely outside the U.S. It is not possible to predict the amount of U.S. income taxes that might be payable if these earnings were eventually repatriated. As of December 31, 2014, the undistributed earnings of foreign subsidiaries was approximately $9.8 million.
88
Table of Contents
UNIVERSAL TRUCKLOAD SERVICES, INC.
Notes to Consolidated Financial Statements—(Continued)
December 31, 2014, 2013 and 2012
| (9) | Income Taxes—continued |
The amount of the domestic and foreign deferred tax assets considered realizable, however, could be reduced in the near term if estimates of future taxable income are reduced or capital gains contemplated under tax planning strategies are not realized.
Income tax expense attributable to income from continuing operations differs from the statutory rates as follows:
| 2014 | 2013 | 2012 | ||||||||||
| Federal statutory rate |
35 | % | 35 | % | 35 | % | ||||||
| S-Corp earnings taxed at shareholder level |
0 | % | 0 | % | -14 | % | ||||||
| Non-deductible (benefit) expense |
-2 | % | -1 | % | 3 | % | ||||||
| LINC tax status change |
0 | % | 0 | % | 4 | % | ||||||
| State, net of federal benefit |
5 | % | 3 | % | 2 | % | ||||||
| Foreign |
0 | % | 0 | % | 0 | % | ||||||
|
|
|
|
|
|
|
|||||||
| Effective tax rate |
38 | % | 37 | % | 30 | % | ||||||
|
|
|
|
|
|
|
|||||||
Prior to LINC’s acquisition by Universal on October 1, 2012, LINC was an S Corporation for U.S. federal income tax purposes. As a result, LINC had no U.S. federal income tax liability, but had state and local liabilities in certain jurisdictions attributable to earnings as an S Corporation. See Note 1(w) “Unaudited Pro Forma Earnings Per Share”. The merger transaction resulted in a termination of the S election for LINC, and LINC is now treated as a C corporation subject to federal income taxes. The tax rate adjustment accounts for the periods before the change in LINC’s federal tax status. Additionally, in connection with the acquisition by a C Corporation, we recorded the federal component of the deferred tax accounts resulting in the recognition of additional income tax expense of $2.5 million.
As of December 31, 2014, the total amount of unrecognized tax benefit representing uncertainty in certain tax positions was $0.4 million. These uncertain tax positions are based on recognition thresholds and measurement attributes for the financial statement recognition and measurements of a tax position taken or expected to be taken in a tax return. Any prospective adjustments to our accrual for uncertain tax positions will be recorded as an increase or decrease to the provision for income taxes and would impact our effective tax rate. At December 31, 2014, there are no positions for which it is reasonably possible that the total amounts of unrecognized tax benefits would significantly increase or decrease within 12 months. As of December 31, 2014, the amount of accrued interest and penalties was $0.1 million and $0.1 million, respectively.
The changes in our gross unrecognized tax benefits during the years ended December 31 are as follows (in thousands):
| 2014 | 2013 | 2012 | ||||||||||
| Unrecognized tax benefit—beginning of year |
$ | 652 | $ | 741 | $ | 687 | ||||||
| Increases related to prior year tax positions |
4 | 137 | 12 | |||||||||
| Increases related to current year tax positions |
13 | 15 | 42 | |||||||||
| Decreases related to prior year tax positions |
(255 | ) | (241 | ) | — | |||||||
| Settlements with taxing authorities |
— | — | — | |||||||||
| Lapse of statutes of limitations |
— | — | — | |||||||||
|
|
|
|
|
|
|
|||||||
| Unrecognized tax benefit—end of year |
$ | 414 | $ | 652 | $ | 741 | ||||||
|
|
|
|
|
|
|
|||||||
89
Table of Contents
UNIVERSAL TRUCKLOAD SERVICES, INC.
Notes to Consolidated Financial Statements—(Continued)
December 31, 2014, 2013 and 2012
| (10) | Leases |
We lease office space, warehouses, freight distribution centers, terminal yards and equipment under non-cancelable capital and operating lease arrangements. Except where we deliver services within facilities provided by our customers, we lease all warehouse and freight distribution centers used in our logistics operations, often in connection with a specific customer program. Where facilities are substantially dedicated to a single customer and our lease is with an independent property owner, we attempt to align lease terms with the expected duration of the underlying customer program. Except as described in Note 8, “Transactions with Affiliates”, facilities rented from affiliates are generally occupied pursuant to month-to-month lease agreements.
In most cases, we expect our facility leases will be renewed or replaced by other leases in the ordinary course of business. Where possible, we contractually secure the recovery of certain occupancy costs, including rent, during the term of a customer program. Future minimum rental payments pursuant to leases that have an initial or remaining non-cancelable lease term in excess of one year as of December 31, 2014 are as follows (in thousands):
| Operating Leases | ||||||||||||||||
| Years Ending December 31 |
Capital Leases |
With Affiliates |
With Third Parties |
Total | ||||||||||||
| 2015 |
$ | 1,191 | $ | 5,956 | $ | 10,478 | $ | 17,625 | ||||||||
| 2016 |
988 | 4,136 | 4,857 | 9,981 | ||||||||||||
| 2017 |
731 | 2,904 | 3,699 | 7,334 | ||||||||||||
| 2018 |
380 | 810 | 1,206 | 2,396 | ||||||||||||
| 2019 |
— | 338 | — | 338 | ||||||||||||
| Thereafter |
— | — | — | — | ||||||||||||
|
|
|
|
|
|
|
|
|
|||||||||
| Total required payments |
3,290 | $ | 14,144 | $ | 20,240 | $ | 37,674 | |||||||||
|
|
|
|
|
|
|
|||||||||||
| Less amounts representing interest (1.4% to 4.7%) |
259 | |||||||||||||||
|
|
|
|||||||||||||||
| Present value of minimum lease payments |
3,031 | |||||||||||||||
| Less current maturities |
1,051 | |||||||||||||||
|
|
|
|||||||||||||||
| $ | 1,980 | |||||||||||||||
|
|
|
|||||||||||||||
At December 31, 2014, assets under capital leases, consisting primarily of machinery and equipment, had a cost of approximately $6.9 million and accumulated amortization of $0.9 million. At December 31, 2013, assets under capital leases, consisting primarily of machinery and equipment, had a cost of approximately $6.9 million and accumulated amortization of $0.1 million. Included in depreciation and amortization expense in the accompanying Consolidated Statements of Income for the years ended December 31, 2014 and 2013 is amortization expense of $0.8 million and $0.1 million, respectively. There were no assets under capital lease at December 31, 2012.
Rental expense for facilities, vehicles and other equipment leased from third parties under operating leases approximated $21.9 million, $14.4 million and $10.7 million for the years ended December 31, 2014, 2013 and 2012.
90
Table of Contents
UNIVERSAL TRUCKLOAD SERVICES, INC.
Notes to Consolidated Financial Statements—(Continued)
December 31, 2014, 2013 and 2012
| (11) | Comprehensive Income |
Comprehensive income includes the following for the years ended December 31 (in thousands):
| 2014 | 2013 | 2012 | ||||||||||
| Unrealized holding gains on available-for-sale investments arising during the period: |
||||||||||||
| Gross amount |
$ | 620 | $ | 2,160 | $ | 1,383 | ||||||
| Income tax (expense) benefit |
(208 | ) | (614 | ) | (817 | ) | ||||||
|
|
|
|
|
|
|
|||||||
| Net of tax amount |
$ | 412 | $ | 1,546 | $ | 566 | ||||||
|
|
|
|
|
|
|
|||||||
| Realized (gains) on available-for-sale investments reclassified into income: |
||||||||||||
| Gross amount |
$ | — | $ | (107 | ) | $ | (2,189 | ) | ||||
| Income tax expense |
— | 39 | 1,013 | |||||||||
|
|
|
|
|
|
|
|||||||
| Net of tax amount |
$ | — | $ | (68 | ) | $ | (1,176 | ) | ||||
|
|
|
|
|
|
|
|||||||
| Foreign currency translation adjustments |
$ | (1,631 | ) | $ | (227 | ) | $ | 312 | ||||
|
|
|
|
|
|
|
|||||||
The unrealized holding gains and losses on available-for-sale investments represent mark-to-market adjustments net of related income taxes.
| (12) | Retirement Plans |
We offer 401(k) defined contribution plans to our employees. The plans are administered by a company controlled by our principal shareholders and include different matching provisions depending on which subsidiary or affiliate is involved. In the plans available to certain employees not subject to collective bargaining agreements, we matched contributions up to $600 annually for each employee who is not considered highly compensated through December 31, 2008, after which some matching contributions were suspended as a response to market conditions at certain subsidiaries. Three other 401(k) plans are provided to employees of specific operations and offer matching contributions that range from zero to $2,080 per participant annually. The total expense for contributions for 401(k) plans, including plans related to collective bargaining agreements, was $0.4 million for the each of the years ended December 31, 2014, 2013 and 2012.
Great American Lines, Inc., a wholly-owned subsidiary of the Company, maintained a Simplified Employee Pension Plan, which is a defined contribution plan and covers all full-time employees. Eligibility requirements include completion of one year of service and attaining the age of 21. Contributions to the plan are at management’s discretion. No contributions were made under this plan for the years ended December 31, 2014, 2013 or 2012.
In connection with a collective bargaining agreement that covered 9 Canadian employees at December 31, 2014, we are required to make defined contributions into the Canada Wide Industrial Pension Plan. At December 31, 2014 and 2013, the required contributions totaled approximately $30,000 and $38,000, respectively.
| (13) | Stock Based Compensation |
On April 23, 2014, our Board of Directors adopted the 2014 Amended and Restated Stock Incentive Plan, or the Plan. The Plan was approved by our shareholders at the 2014 Annual Meeting and became
91
Table of Contents
UNIVERSAL TRUCKLOAD SERVICES, INC.
Notes to Consolidated Financial Statements—(Continued)
December 31, 2014, 2013 and 2012
| (13) | Stock Based Compensation—continued |
effective as of the date it was adopted by the Board of Directors. The Plan replaced our 2004 Stock Incentive Plan and carried forward the shares of common stock that remained available for issuance under the 2004 Stock Incentive Plan. The grants may be made in the form of stock options, restricted stock bonuses, restricted stock purchase rights, stock appreciation rights, phantom stock units, restricted stock units or unrestricted common stock. Restricted stock awards currently outstanding under the 2004 Stock Incentive Plan will remain outstanding in accordance with the terms of that plan.
On December 20, 2012, the Company granted 178,137 shares of restricted stock to certain of its employees under the 2004 Stock Incentive Plan. The restricted stock grants vested 20% on December 20, 2012, and an additional 20% will vest on each anniversary of the grant through December 20, 2016, subject to continued employment of the grantee with the Company. A grantee’s vesting may be accelerated under certain conditions, including retirement.
A summary of the status of our non-vested shares as of December 31, 2014, and changes during the year ended December 31, 2014, is presented below:
| Shares | Weighted Average Grant Date Fair Value |
|||||||
| Nonvested at January 1, 2014 |
106,885 | $ | 16.42 | |||||
| Granted |
— | $ | — | |||||
| Vested |
(90,439 | ) | $ | 16.42 | ||||
| Forfeited |
— | $ | — | |||||
|
|
|
|||||||
| Balance at December 31, 2014 |
16,446 | $ | 16.42 | |||||
|
|
|
|||||||
As of December 31, 2014, there was $0.3 million of total unrecognized compensation cost related to non-vested share-based compensation arrangements granted under the Plan. That cost is expected to be recognized over a weighted-average period of 2 years. The total fair value of shares vested during the year ended December 31, 2014 was $1.5 million.
| (14) | Commitments and Contingencies |
Our principal commitments relate to long-term real estate leases and payment obligations to equipment vendors.
We are involved in certain claims and pending litigation arising from the ordinary conduct of business. We also provide accruals for claims within our self-insured retention amounts. Based on the knowledge of the facts, and in certain cases, opinions of outside counsel, in the Company’s opinion the resolution of these claims and pending litigation will not have a material effect on our financial position, results of operations or cash flows.
At December 31, 2014, approximately 36% of our employees in the United States, Mexico and Canada are subject to collective bargaining agreements that are renegotiated periodically, 20% of which are subject to contracts that expire in 2015.
92
Table of Contents
UNIVERSAL TRUCKLOAD SERVICES, INC.
Notes to Consolidated Financial Statements—(Continued)
December 31, 2014, 2013 and 2012
| (15) | Earnings Per Share |
Basic earnings per common share amounts are based on the weighted average number of common shares outstanding, excluding outstanding non-vested restricted stock. Diluted earnings per common share include dilutive common stock equivalents determined by the treasury stock method. For the years ended December 31, 2014, 2013 and 2012, there were 31,230, 95,656 and 4,597 weighted average non-vested shares of restricted stock, respectively, included in the denominator for the calculation of diluted earnings per share.
| (16) | Quarterly Financial Data (unaudited) |
| 2014 | ||||||||||||||||
| 1st quarter | 2nd quarter | 3rd quarter | 4th quarter | |||||||||||||
| (in thousands, except per share information) | ||||||||||||||||
| Operating revenue |
$ | 279,364 | $ | 307,549 | $ | 302,128 | $ | 302,480 | ||||||||
| Operating income |
14,629 | 24,413 | 23,000 | 18,793 | ||||||||||||
| Income before income taxes |
13,143 | 22,075 | 21,052 | 16,829 | ||||||||||||
| Provision for income taxes |
5,019 | 8,442 | 7,958 | 6,310 | ||||||||||||
|
|
|
|
|
|
|
|
|
|||||||||
| Net income |
$ | 8,124 | $ | 13,633 | $ | 13,094 | $ | 10,519 | ||||||||
|
|
|
|
|
|
|
|
|
|||||||||
| Earnings per common share: |
||||||||||||||||
| Basic |
$ | 0.27 | $ | 0.45 | $ | 0.44 | $ | 0.35 | ||||||||
| Diluted |
$ | 0.27 | $ | 0.45 | $ | 0.44 | $ | 0.35 | ||||||||
| Weighted average number of common shares outstanding: |
||||||||||||||||
| Basic |
30,112 | 30,054 | 29,947 | 29,946 | ||||||||||||
| Diluted |
30,158 | 30,092 | 29,982 | 29,952 | ||||||||||||
| 2013 | ||||||||||||||||
| 1st quarter | 2nd quarter | 3rd quarter | 4th quarter | |||||||||||||
| (in thousands, except per share information) | ||||||||||||||||
| Operating revenue |
$ | 248,109 | $ | 264,172 | $ | 261,663 | $ | 259,548 | ||||||||
| Operating income |
19,251 | 23,629 | 22,480 | 19,133 | ||||||||||||
| Income before income taxes |
18,283 | 22,828 | 21,491 | 18,314 | ||||||||||||
| Provision for income taxes |
6,909 | 8,674 | 7,749 | 7,012 | ||||||||||||
|
|
|
|
|
|
|
|
|
|||||||||
| Net income |
$ | 11,374 | $ | 14,154 | $ | 13,742 | $ | 11,302 | ||||||||
|
|
|
|
|
|
|
|
|
|||||||||
| Earnings per common share: |
||||||||||||||||
| Basic |
$ | 0.38 | $ | 0.47 | $ | 0.46 | $ | 0.38 | ||||||||
| Diluted |
$ | 0.38 | $ | 0.47 | $ | 0.46 | $ | 0.38 | ||||||||
| Weighted average number of common shares outstanding: |
||||||||||||||||
| Basic |
30,054 | 30,054 | 30,065 | 30,083 | ||||||||||||
| Diluted |
30,196 | 30,196 | 30,118 | 30,127 | ||||||||||||
| (17) | Segment Reporting |
We report our financial results in two reportable segments, the transportation segment and the logistics segment, based on the nature of the underlying customer commitment and the types of investments required to support these commitments. This presentation reflects the manner in which management
93
Table of Contents
UNIVERSAL TRUCKLOAD SERVICES, INC.
Notes to Consolidated Financial Statements—(Continued)
December 31, 2014, 2013 and 2012
| (17) | Segment Reporting—continued |
evaluates our operating segments, including an evaluation of economic characteristics and applicable aggregation criteria.
Operations aggregated in our transportation segment are associated with individual freight shipments coordinated by our agents, company-managed terminals and specialized services operations. In contrast, operations aggregated in our logistics segment deliver value-added services or transportation services to specific customers on a dedicated basis, generally pursuant to contract terms of one year or longer. Other non-reportable operating segments are comprised of the Company’s subsidiaries that provide support services to other subsidiaries and to owner-operators, including shop maintenance and equipment leasing.
The following tables summarize information about our reportable segments as of and for the fiscal years ended December 31, 2014, 2013 and 2012 (in thousands):
| 2014 |
Transportation | Logistics | Other | Total | ||||||||||||
| Operating revenues |
$ | 778,603 | $ | 412,507 | $ | 411 | $ | 1,191,521 | ||||||||
| Eliminated inter-segment revenues |
5,160 | 7,473 | — | 12,633 | ||||||||||||
| Depreciation and amortization |
11,256 | 21,507 | 290 | 33,053 | ||||||||||||
| Income from operations |
34,931 | 50,892 | (4,988 | ) | 80,835 | |||||||||||
| Capital expenditures |
16,444 | 42,413 | 927 | 59,784 | ||||||||||||
| Total assets |
246,190 | 247,155 | 35,669 | 529,014 | ||||||||||||
| 2013 |
Transportation | Logistics | Other | Total | ||||||||||||
| Operating revenues |
$ | 705,557 | $ | 327,498 | $ | 437 | $ | 1,033,492 | ||||||||
| Eliminated inter-segment revenues |
679 | 179 | — | 858 | ||||||||||||
| Depreciation and amortization |
11,557 | 7,861 | 268 | 19,686 | ||||||||||||
| Income from operations |
28,537 | 58,724 | (2,768 | ) | 84,493 | |||||||||||
| Capital expenditures |
9,084 | 6,426 | 1,525 | 17,035 | ||||||||||||
| Total assets |
221,428 | 229,947 | 38,761 | 490,136 | ||||||||||||
| 2012 |
Transportation | Logistics | Other | Total | ||||||||||||
| Operating revenues |
$ | 747,313 | $ | 289,268 | $ | 425 | $ | 1,037,006 | ||||||||
| Eliminated inter-segment revenues |
514 | 83 | — | 597 | ||||||||||||
| Depreciation and amortization |
12,066 | 5,957 | 214 | 18,237 | ||||||||||||
| Income from operations |
30,623 | 49,497 | (10,963 | ) | 69,157 | |||||||||||
| Capital expenditures |
15,463 | 12,927 | 1,176 | 29,566 | ||||||||||||
| Total assets |
226,896 | 77,563 | 22,910 | 327,369 | ||||||||||||
We provide a portfolio of transportation and logistics services to a wide range of customers throughout the United States, Mexico, Canada, and to a lesser extent, Europe and other countries around the world.
94
Table of Contents
UNIVERSAL TRUCKLOAD SERVICES, INC.
Notes to Consolidated Financial Statements—(Continued)
December 31, 2014, 2013 and 2012
| (17) | Segment Reporting—continued |
Revenues for selected services as provided to the chief operating decision maker are as follows (in thousands):
| Year Ended December 31, | ||||||||||||
| 2014 | 2013 | 2012 | ||||||||||
| Transportation services |
$ | 769,308 | $ | 706,998 | $ | 741,650 | ||||||
| Value-added services |
284,496 | 195,086 | 174,975 | |||||||||
| Intermodal services |
137,717 | 131,408 | 120,381 | |||||||||
|
|
|
|
|
|
|
|||||||
| Total |
$ | 1,191,521 | $ | 1,033,492 | $ | 1,037,006 | ||||||
|
|
|
|
|
|
|
|||||||
Revenues are attributed to geographic areas based upon completion of the underlying service at the point of delivery. In some instances, we are paid one rate for “round-trip” services that originate and terminate in Canada, but have destinations in the United States. In those instances we allocate half of the total revenue to Canada and half to the United States (in thousands).
| Year Ended December 31, | ||||||||||||
| 2014 | 2013 | 2012 | ||||||||||
| United States |
$ | 1,153,154 | $ | 992,511 | $ | 999,668 | ||||||
| Mexico |
24,860 | 23,440 | 20,266 | |||||||||
| Canada |
9,786 | 14,029 | 13,407 | |||||||||
| Europe |
2,419 | 2,278 | 2,057 | |||||||||
| Other |
1,302 | 1,234 | 1,608 | |||||||||
|
|
|
|
|
|
|
|||||||
| Total |
$ | 1,191,521 | $ | 1,033,492 | $ | 1,037,006 | ||||||
|
|
|
|
|
|
|
|||||||
Net long-lived property and equipment assets are presented in the table below (in thousands):
| Year Ended December 31, | ||||||||
| 2014 | 2013 | |||||||
| United States |
$ | 172,360 | $ | 134,951 | ||||
| Mexico |
5,671 | 7,640 | ||||||
| Canada |
38 | 65 | ||||||
|
|
|
|
|
|||||
| Total |
$ | 178,069 | $ | 142,656 | ||||
|
|
|
|
|
|||||
| (18) | Subsequent Events |
On February 19, 2015, our Board of Directors declared a quarterly cash dividend of $0.07 per share of common stock, which is payable to shareholders of record at the close of business on March 2, 2015 and was paid on March 12, 2015. Declaration of future cash dividends is subject to final determination by the Board of Directors each quarter after its review of our financial condition, results of operations, capital requirements, any legal or contractual restrictions on the payment of dividends and other factors the Board of Directors deems relevant.
95
Table of Contents
| ITEM 9: | CHANGES IN AND DISAGREEMENTS WITH ACCOUNTANTS ON ACCOUNTING AND FINANCIAL DISCLOSURES |
On April 24, 2013, KPMG, our previous independent registered public accounting firm, notified the Company that they would resign upon the completion of their review of the Company’s financial statements as of and for this quarter ended March 30, 2013. On April 26, 2013, the Company’s Audit Committee selected BDO USA, LLP to be our new independent registered public accounting firm for the fiscal year ending December 31, 2013. Information with respect to this matter is included in the Company’s current report on Form 8-K filed April 26, 2013.
ITEM 9A: CONTROLS AND PROCEDURES
Disclosure Controls and Procedures
We carried out an evaluation, under the supervision and with the participation of our management, including our Chief Executive Officer and Chief Financial Officer, of the effectiveness of the design and operation of our disclosure controls and procedures pursuant to paragraph (b) of Rule 13a-15 and 15d-15 of the Securities Exchange Act of 1934, as amended (or the Exchange Act). Based upon that evaluation, our Chief Executive Officer and Chief Financial Officer concluded that, as of December 31, 2014, our disclosure controls and procedures were effective in causing the material information required to be disclosed in the reports that it files or submits under the Exchange Act (i) to be recorded, processed, summarized and reported, to the extent applicable, within the time periods required for us to meet the Securities and Exchange Commission’s (or SEC) filing deadlines for these reports specified in the SEC’s rules and forms and (ii) to be accumulated and communicated to our management, including our Chief Executive Officer and Chief Financial Officer, as appropriate to allow timely decisions regarding required disclosure.
Changes in Internal Controls
Except as otherwise discussed above, there have been no changes in our internal controls over financial reporting as such term is defined in Rules 13a-15(f) and 15d-15(f) under the Exchange Act, during the quarter ended December 31, 2014 identified in connection with our evaluation that have materially affected, or are reasonably likely to materially affect, our internal controls over financial reporting.
96
Table of Contents
REPORT OF MANAGEMENT ON INTERNAL CONTROL OVER FINANCIAL REPORTING
Management of Universal Truckload Services, Inc., or the Company, is responsible for establishing and maintaining effective internal controls over financial reporting, as such term is defined in Rules 13a-15(f) under the Securities Exchange Act of 1934, as amended.
Internal control over financial reporting is a process designed to provide reasonable assurance regarding the reliability of financial reporting and the preparation of financial statements for external purposes in accordance with generally accepted accounting principles. The Company’s internal control over financial reporting includes those policies and procedures that (1) pertain to the maintenance of records that, in reasonable detail, accurately and fairly reflect the transactions and dispositions of the assets of the Company; (2) provide reasonable assurance that transactions are recorded as necessary to permit preparation of financial statements in accordance with generally accepted accounting principles, and that receipts and expenditures of the Company are being made only in accordance with authorizations of management and directors of the Company; and (3) provide reasonable assurance regarding prevention or timely detection of unauthorized acquisition, use, or disposition of the Company’s assets that could have a material effect on the Company’s financial statements.
Management, with the participation of the Company’s principal executive and principal financial officers, assessed the effectiveness of the Company’s internal control over financial reporting as of December 31, 2014. This assessment was performed using the criteria established under the Internal Control-Integrated Framework (2013) established by the Committee of Sponsoring Organizations of the Treadway Commission, or COSO.
Based on the assessment performed using the criteria established by COSO, management has concluded that the Company maintained effective internal control over financial reporting as of December 31, 2014.
BDO USA LLP, the independent registered public accounting firm that audited the financial statements included in this Annual Report on Form 10-K for the fiscal year ended December 31, 2014, has issued an audit report on the effectiveness of the Company’s internal control over financial reporting as of December 31, 2014. Such report appears immediately below.
97
Table of Contents
Report of Independent Registered Public Accounting Firm
Board of Directors and Stockholders
Universal Truckload Services, Inc.
Warren, Michigan
We have audited Universal Truckload Services, Inc.’s internal control over financial reporting as of December 31, 2014, based on criteria established in Internal Control – Integrated Framework (2013) issued by the Committee of Sponsoring Organizations of the Treadway Commission (the COSO criteria). Universal Truckload Services, Inc.’s management is responsible for maintaining effective internal control over financial reporting and for its assessment of the effectiveness of internal control over financial reporting, included in the accompanying “Item 9A, Report of Management on Internal Control Over Financial Reporting”. Our responsibility is to express an opinion on the company’s internal control over financial reporting based on our audit.
We conducted our audit in accordance with the standards of the Public Company Accounting Oversight Board (United States). Those standards require that we plan and perform the audit to obtain reasonable assurance about whether effective internal control over financial reporting was maintained in all material respects. Our audit included obtaining an understanding of internal control over financial reporting, assessing the risk that a material weakness exists, and testing and evaluating the design and operating effectiveness of internal control based on the assessed risk. Our audit also included performing such other procedures as we considered necessary in the circumstances. We believe that our audit provides a reasonable basis for our opinion.
A company’s internal control over financial reporting is a process designed to provide reasonable assurance regarding the reliability of financial reporting and the preparation of financial statements for external purposes in accordance with generally accepted accounting principles. A company’s internal control over financial reporting includes those policies and procedures that (1) pertain to the maintenance of records that, in reasonable detail, accurately and fairly reflect the transactions and dispositions of the assets of the company; (2) provide reasonable assurance that transactions are recorded as necessary to permit preparation of financial statements in accordance with generally accepted accounting principles, and that receipts and expenditures of the company are being made only in accordance with authorizations of management and directors of the company; and (3) provide reasonable assurance regarding prevention or timely detection of unauthorized acquisition, use, or disposition of the company’s assets that could have a material effect on the financial statements.
Because of its inherent limitations, internal control over financial reporting may not prevent or detect misstatements. Also, projections of any evaluation of effectiveness to future periods are subject to the risk that controls may become inadequate because of changes in conditions, or that the degree of compliance with the policies or procedures may deteriorate.
In our opinion, Universal Truckload Services, Inc. maintained, in all material respects, effective internal control over financial reporting as of December 31, 2014, based on the COSO criteria.
We also have audited, in accordance with the standards of the Public Company Accounting Oversight Board (United States), the consolidated balance sheets of Universal Truckload Services, Inc. as of December 31, 2014 and 2013, and the related consolidated statements of income, comprehensive income, shareholders’ equity, and cash flows for each of the years in the two-years ended December 31, 2014, and our report dated March 16, 2015 expressed an unqualified opinion thereon.
/s/ BDO USA, LLP
Troy, Michigan
March 16, 2015
98
Table of Contents
On March 12, 2015, we entered into a Service Level Agreement with Data System Services, LLC, a related party, to provide IT infrastructure and services to host our accounting system in a data center environment. Initial setup costs are approximately $0.2 million and recurring annual costs are estimated at $0.2 million, based on our anticipated number of users. The agreement, a copy of which is filed as Exhibit 10.7 to this Annual Report on Form 10-K, is dated effective as of January 1, 2015.
99
Table of Contents
| ITEM 10: | DIRECTORS, EXECUTIVE OFFICERS, AND CORPORATE GOVERNANCE |
The information required by this Item concerning the Directors and Executive Officers of the Company is set forth under the captions “Election of Directors,” “Directors of the Company,” “Information Regarding Board of Directors and Committees,” and “Executive Officers of the Company” and “Section 16(a) Beneficial Ownership Reporting Compliance” in the Company’s definitive Proxy Statement for its annual meeting of shareholders to be filed with the Securities and Exchange Commission within 120 days of December 31, 2014, and is incorporated herein by reference. The information required by this Item concerning Director Independence, the Company’s Audit Committee and the Audit Committee’s Financial Expert is set forth under the caption “Information Regarding Board of Directors and Committees” and “Report of the Audit Committee” in the Company’s definitive Proxy Statement for its annual meeting of shareholders filed with the Securities and Exchange Commission pursuant to Regulation 14A, and is incorporated herein by reference.
We have adopted a Code of Business Conduct and Ethics that applies to all our directors, executive and financial officers and employees. The Code of Business Conduct and Ethics has been posted on our website at www.goutsi.com in the Investor Relations section under Corporate Governance and is available free of charge through our website. We will post information regarding any amendment to, or waiver from, our Code of Business Conduct and Ethics for executive and financial officers and directors on our website in the Company section under the Investor Relations section under Corporate Governance.
ITEM 11: EXECUTIVE COMPENSATION
The information required by this Item is set forth under the captions “Compensation of Directors,” “Compensation of Executive Officers,” “Compensation and Stock Option Committee Report on Executive Compensation,” “Compensation Committee Interlocks and Insider Participation” and “Key Executive Employment Protection Agreements” in the Company’s definitive Proxy Statement for its annual meeting of shareholders to be filed with the Securities and Exchange Commission within 120 days of December 31, 2014, and is incorporated herein by reference.
| ITEM 12: | SECURITY OWNERSHIP OF CERTAIN BENEFICIAL OWNERS AND MANAGEMENT AND RELATED STOCKHOLDER MATTERS |
The information required by this Item pursuant to Item 201(d) of Regulation S-K is set forth under the caption “Market for Registrants Common Equity and Related Stockholder Matters” in Part II, Item 5 of this report, and is incorporated by reference herein.
The information required by this Item pursuant to Item 403 of Regulation S-K is set forth under the captions “Security Ownership by Management and Others” and “Equity Compensation Plan Information,” in the Company’s definitive Proxy Statement for its annual meeting of shareholders to be filed with the Securities and Exchange Commission within 120 days of December 31, 2014, and is incorporated herein by reference.
| ITEM 13: | CERTAIN RELATIONSHIPS AND RELATED TRANSACTIONS, AND DIRECTOR INDEPENDENCE |
The information required by this item is set forth under the captions “Transactions With Management and Others” and “Transactions With Management and Others and Certain Business Relationships” and “Compensation Committee Interlocks and Insider Participation,” in the Company’s definitive Proxy Statement for its annual meeting of shareholders filed with the Securities and Exchange Commission within 120 days of December 31, 2014, and is incorporated herein by reference.
ITEM 14: PRINCIPAL ACCOUNTING FEES AND SERVICES
The information required by this item is set forth under the captions “Report of the Audit Committee” and “Ratification of Appointment of Independent Registered Public Accounting Firm” in the Company’s definitive Proxy Statement for its annual meeting of shareholders filed with the Securities and Exchange Commission within 120 days of December 31, 2014, and is incorporated herein by reference.
100
Table of Contents
ITEM 15: EXHIBITS AND FINANCIAL STATEMENT SCHEDULES
| (1) Financial Statements |
||||
| Page | ||||
| 57 | ||||
| 59 | ||||
| 60 | ||||
| 61 | ||||
| 62 | ||||
| 64 | ||||
| 65 | ||||
| (2) Financial Statement Schedules |
||||
| Financial statement schedules have been omitted since they are either not required, not applicable, or the information is otherwise included elsewhere in this Form 10-K. |
||||
| (3) Exhibits |
||||
| Exhibit No. |
Description | |
| 3.1 | Amended and Restated Articles of Incorporation (Incorporated by reference to Exhibit 3.1 to the Registrant’s Registration Statement on Form S-1 filed on November 15, 2004) | |
| 3.2 | Amendment to Articles of Incorporation (Incorporated by reference to Exhibit 3(i)-1 and 3(i)-2 to the Registrant’s Current Report filed on November 1, 2012) | |
| 3.3 | Amended and Restated Bylaws, as amended effective April 22, 2009 (Incorporated by reference to Exhibit 3.1 to the Registrant’s Current Report on Form 8-K filed on April 24, 2009) | |
| 4.1 | Amended and Restated Registration Rights Agreement, dated as of July 25, 2012, among Registrant, Matthew T. Moroun, the Manuel J. Moroun Revocable Trust U/A March 24, 1977, as amended and restated on December 22, 2004 and the M.J. Moroun 2012 Annuity Trust dated April 30, 2012 ((Incorporated by reference to Exhibit 4.1 to the Registrant’s Current Report on Form 8-K filed July 26, 2012) | |
| 4.2 | Specimen Common Share Certificate (Incorporated by reference to Exhibit 4.2 to the Registrant’s Registration Statement on Form S-1 filed on November 15, 2004 (Commission File No. 333-120510)) | |
| 10.1+ | Universal Truckload Services, Inc. 2013 Short-Term Incentive Plan B (Incorporated by reference to Exhibit 10.2 to the Registrant’s Current Report on Form 8-K filed on April 26, 2013) | |
| 10.2 | Consulting Agreement between Universal Truckload Services, Inc. and Manuel J. Moroun, dated April 24, 2013. (Incorporated by reference to Exhibit 10.1 to the Registrant’s Current Report on Form 8-K filed on April 26, 2013) | |
| 10.3+* | Employment agreement, dated June 2, 2014, by and between Universal Management Services, Inc. and Jeff Rogers. | |
| 10.4 | Revolving Credit and Term Loan Agreement, dated as of August 28, 2012, among Universal Truckload Services, Inc., the lenders parties thereto and Comerica Bank, as administrative agent, arranger and documentation agent (Incorporated by reference to Exhibit 10.1 to the Registrant’s Current Report on Form 8-K filed August 31, 2012) | |
101
Table of Contents
| Exhibit No. |
Description | |
| 10.5 | First Amendment to Revolving Credit and Term Loan Agreement, date June 3, 2013 (Incorporated by reference to Exhibit 10.1 to the Registrant’s Current Report on Form 8-K filed on June 5, 2013) | |
| 10.6 | Second Amendment to Revolving Credit and Term Loan Agreement, dated December 19, 2013 Incorporated by reference to Exhibit 10.1 to the Registrant’s Current Report on Form 8-K filed on December 20, 2013) | |
| 10.7* | Service Level Agreement between Universal Truckload Services, Inc. and Data System Services, LLC dated as of January 1, 2015. | |
| 21.1* | Subsidiaries of Universal Truckload Services, Inc. | |
| 23.1* | Consent of BDO USA LLP, independent registered public accounting firm | |
| 23.2* | Consent of KPMG LLP, independent registered public accounting firm | |
| 24* | Powers of Attorney (see signature page) | |
| 31.1* | Chief Executive Officer certification, as adopted pursuant to section 302 of the Sarbanes-Oxley Act of 2002 | |
| 31.2* | Chief Financial Officer certification, as adopted pursuant to section 302 of the Sarbanes-Oxley Act of 2002 | |
| 32.1** | Chief Executive Officer and Chief Financial Officer certification pursuant to 18 U.S.C. Section 1350, as adopted pursuant to section 906 of the Sarbanes-Oxley Act of 2002 | |
| 101.INS** | XBRL Instance Document | |
| 101.SCH** | XBRL Schema Document | |
| 101.CAL** | XBRL Calculation Linkbase Document | |
| 101.DEF** | XBRL Definition Linkbase Document | |
| 101.LAB** | XBRL Labels Linkbase Document | |
| 101.PRE** | XBRL Presentation Linkbase Document | |
| + | Indicates a management contract, compensatory plan or arrangement. |
| * | Filed herewith. |
| ** | Furnished herewith. |
102
Table of Contents
Pursuant to the requirements of Section 13 or 15(d) of the Securities Exchange Act of 1934, the registrant has duly caused this report on Form 10-K to be signed on its behalf by the undersigned, thereunto duly authorized.
| Universal Truckload Services, Inc. | ||
| (Registrant) | ||
| By: | /s/ David A. Crittenden | |
| David A. Crittenden, Chief Financial Officer | ||
| Date: March 16, 2015 | ||
POWER OF ATTORNEY
Know all persons by these presents, that each person whose signature appears below constitutes and appoints Jeff Rogers and David A. Crittenden, jointly and severally, his attorneys-in-fact, each with the power of substitution, for him in any and all capacities, to sign any amendments to this Form 10-K, and to file the same, with exhibits thereto and other documents in connection therewith, with the Securities and Exchange Commission, hereby ratifying and confirming all that each of said attorneys-in-fact, or his substitutes, may do or cause to be done by virtue hereof.
Pursuant to the requirements of the Securities Exchange Act of 1934, this report has been signed below by the following persons on behalf of the registrant and in the capacities and on the dates indicated.
| Signatures |
Title |
Date | ||
| /s/ Jeff Rogers Jeff Rogers |
Chief Executive Officer (Principal Executive Officer) | March 16, 2015 | ||
| /s/ David A. Crittenden David A. Crittenden |
Chief Financial Officer and Treasurer (Principal Financial and Accounting Officer) | March 16, 2015 | ||
| /s/ Matthew T. Moroun Matthew T. Moroun |
Chairman of the Board | March 16, 2015 | ||
| /s/ Manuel J. Moroun Manuel J. Moroun |
Director | March 16, 2015 | ||
| /s/ Frederick P. Calderone Frederick P. Calderone |
Director | March 16, 2015 | ||
| /s/ Joseph J. Casaroll Joseph J. Casaroll |
Director | March 16, 2015 | ||
| /s/ Daniel J. Deane Daniel J. Deane |
Director | March 16, 2015 | ||
| /s/ Michael A. Regan Michael A. Regan |
Director | March 16, 2015 | ||
103
Table of Contents
| Signatures |
Title |
Date | ||
| /s/ Daniel C. Sullivan Daniel C. Sullivan |
Director | March 16, 2015 | ||
| /s/ Richard P. Urban Richard P. Urban |
Director | March 16, 2015 | ||
| /s/ Ted B. Wahby Ted B. Wahby |
Director | March 16, 2015 | ||
| /s/ H.E. “Scott” Wolfe H. E. “Scott” Wolfe |
Director | March 16, 2015 | ||
104