Attached files
| file | filename |
|---|---|
| EX-21 - EX-21 - RENTECH, INC. | d824832dex21.htm |
| EX-32.1 - EX-32.1 - RENTECH, INC. | d824832dex321.htm |
| EX-31.2 - EX-31.2 - RENTECH, INC. | d824832dex312.htm |
| EX-32.2 - EX-32.2 - RENTECH, INC. | d824832dex322.htm |
| EX-23.1 - EX-23.1 - RENTECH, INC. | d824832dex231.htm |
| EX-31.1 - EX-31.1 - RENTECH, INC. | d824832dex311.htm |
| EXCEL - IDEA: XBRL DOCUMENT - RENTECH, INC. | Financial_Report.xls |
Table of Contents
UNITED STATES
SECURITIES AND EXCHANGE COMMISSION
Washington, D.C. 20549
Form 10-K
(Mark One)
| x | ANNUAL REPORT PURSUANT TO SECTION 13 OR 15(d) OF THE SECURITIES EXCHANGE ACT OF 1934 |
For the Fiscal Year Ended December 31, 2014
OR
| ¨ | TRANSITION REPORT PURSUANT TO SECTION 13 OR 15(d) OF THE SECURITIES EXCHANGE ACT OF 1934 |
For the Transition Period from to
Commission File No. 001-15795
RENTECH, INC.
(Exact name of registrant as specified in its charter)
| Colorado | 84-0957421 | |
| (State or other jurisdiction of incorporation or organization) |
(I.R.S. Employer Identification No.) |
10877 Wilshire Boulevard, 10th Floor
Los Angeles, California 90024
(Address of principal executive offices)
(310) 571-9800
(Registrant’s telephone number, including area code)
Securities registered pursuant to Section 12(b) of the Act:
Common Stock
Name of Each Exchange on Which Registered: NASDAQ Stock Market
Securities registered pursuant to Section 12(g) of the Act: None
Indicate by check mark if the registrant is a well-known seasoned issuer, as defined in Rule 405 of the Securities Act. Yes ¨. No x.
Indicate by check mark if the registrant is not required to file reports pursuant to Section 13 or Section 15(d) of the Act. Yes ¨. No x.
Indicate by check mark whether the registrant (1) has filed all reports required to be filed by Section 13 or 15(d) of the Securities Exchange Act of 1934 during the preceding 12 months (or for such shorter period that the registrant was required to file such reports), and (2) has been subject to such filing requirements for the past 90 days. Yes x No ¨
Indicate by check mark whether the registrant has submitted electronically and posted on its corporate Web site, if any, every Interactive Data File required to be submitted and posted pursuant to Rule 405 of Regulation S-T (§232.405 of this chapter) during the preceding 12 months (or for such shorter period that the registrant was required to submit and post such files). Yes x No ¨
Indicate by check mark if disclosure of delinquent filers pursuant to Item 405 of Regulation S-K (§229.405 of this chapter) is not contained herein, and will not be contained, to the best of registrant’s knowledge, in definitive proxy or information statements incorporated by reference in Part III of this Form 10-K or any amendment to this Form 10-K. ¨
Indicate by check mark whether the registrant is a large accelerated filer, an accelerated filer, a non-accelerated filer, or a smaller reporting company. See the definitions of “large accelerated filer,” “accelerated filer” and “smaller reporting company” in Rule 12b-2 of the Exchange Act. (Check one):
| Large accelerated filer | ¨ | Accelerated filer | x | |||
| Non-accelerated filer | ¨ (Do not check if a smaller reporting company) | Smaller reporting company | ¨ | |||
Indicate by check mark whether the registrant is a shell company (as defined in Rule 12b-2 of the Exchange Act). Yes ¨ No x
The aggregate market value of the voting and non-voting common equity held by non-affiliates as of June 30, 2014, the last business day of the registrant’s most recently completed second fiscal quarter, was approximately $577.7 million (based upon the closing price of the common stock on June 30, 2014, as reported by the NASDAQ Stock Market).
The number of shares of the registrant’s common stock outstanding as of February 27, 2015 was 229,421,453.
DOCUMENTS INCORPORATED BY REFERENCE: None
Table of Contents
2
Table of Contents
FORWARD-LOOKING STATEMENTS
Certain information included in this report contains, and other reports or materials filed or to be filed by us with the Securities and Exchange Commission, or SEC (as well as information included in oral statements or other written statements made or to be made by us or our management) contain or will contain, “forward-looking statements” within the meaning of Section 21E of the Securities Exchange Act of 1934, as amended, or the Exchange Act, Section 27A of the Securities Act of 1933, as amended, and pursuant to the Private Securities Litigation Reform Act of 1995. The forward-looking statements may relate to financial results and plans for future business activities, and are thus prospective. The forward-looking statements are subject to risks, uncertainties and other factors that could cause actual results to differ materially from future results expressed or implied by the forward-looking statements. They can be identified by the use of terminology such as “may,” “will,” “expect,” “believe,” “intend,” “plan,” “estimate,” “anticipate,” “should” and other comparable terms or the negative of them. You are cautioned that, while forward-looking statements reflect management’s good faith belief and best judgment based upon current information, they are not guarantees of future performance and are subject to known and unknown risks and uncertainties. Factors that could affect our results include the risk factors detailed in Part I—Item 1A “Risk Factors” and from time to time in our periodic reports and registration statements filed with the SEC. You should not place undue reliance on our forward-looking statements. Although forward-looking statements reflect our good faith beliefs, forward-looking statements involve known and unknown risks, uncertainties and other factors, which may cause our actual results, performance or achievements to differ materially from anticipated future results, performance or achievements expressed or implied by such forward-looking statements. We undertake no obligation to publicly update or revise any forward-looking statement, whether as a result of new information, future events, changed circumstances or otherwise, unless required by law.
As used in this report, the terms “we,” “our,” “us,” “the Company” and “Rentech” mean Rentech, Inc., a Colorado corporation and its consolidated subsidiaries, unless the context indicates otherwise. References to “RNHI” refer to Rentech Nitrogen Holdings, Inc., a Delaware corporation and one of our indirect wholly owned subsidiaries. References to “RNP” refer to Rentech Nitrogen Partners, L.P., a publicly traded Delaware limited partnership and one of our indirectly majority owned subsidiaries. References to “the General Partner” refer to Rentech Nitrogen GP, LLC, a Delaware limited liability company, RNP’s general partner and one of our indirect wholly owned subsidiaries. References to “RNLLC” refer to Rentech Nitrogen, LLC, a Delaware limited liability company. References to “RNPLLC” refer to Rentech Nitrogen Pasadena, LLC, a Delaware limited liability company that was formerly known as Agrifos Fertilizer, LLC. References to “Fulghum” refer to Fulghum Fibres, Inc., a Georgia corporation and one of our indirectly wholly owned subsidiaries. References to “NEWP” refer to New England Wood Pellet, LLC, a Delaware limited liability company and one of our indirectly wholly owned subsidiaries.
3
Table of Contents
PART I
| ITEM 1. | BUSINESS |
Company Overview
We are a leading provider of wood fibre processing services, high-quality wood chips and wood pellets. Our processing business includes Fulghum, which operates 31 wood chipping mills in the United States and South America. It provides wood yard operations services and wood fibre processing services, and sells wood chips to the pulp, paper and packaging industry. Fulghum also owns and manages forestland and sells bark to industrial consumers in South America. Our wood pellet business includes our Atikokan and Wawa facilities and NEWP. Wood pellets produced at the Atikokan and Wawa facilities, which are expected to have a combined annual production capacity of 560,000 metric tons, will be used for power generation in Canada and the United Kingdom. NEWP is one of the largest producers of wood pellets for the United States residential and commercial heating markets, operating four wood pellet facilities with a combined annual production capacity of approximately 280,000 tons. The facilities are located in Jaffrey, New Hampshire; Deposit, New York; Schuyler, New York; and Youngsville, Pennsylvania. We acquired the Youngsville facility in January 2015.
We are engaged in the fertilizer business, which includes the ownership of the general partner interest and 59.7% of the common units representing limited partner interests in RNP, a publicly traded master limited partnership that owns and operates two fertilizer manufacturing facilities. Through its wholly owned subsidiary, RNLLC, RNP manufactures natural-gas based nitrogen fertilizer products at its facility in East Dubuque, Illinois, or our East Dubuque Facility. It sells its products to customers located in the Mid Corn Belt region of the United States. Through its wholly owned subsidiary, RNPLLC, RNP manufactures ammonium sulfate fertilizer, sulfuric acid and ammonium thiosulfate fertilizer at its facility in Pasadena, Texas, or our Pasadena Facility. The Pasadena Facility purchases ammonia as a feedstock at contractual prices based on the monthly Tampa Index market, while the East Dubuque Facility sells ammonia at prevailing prices in the Mid Corn Belt region. Ammonia prices are typically significantly higher in the Mid Corn Belt than in Tampa.
Our ownership interest in RNP currently entitles us to 59.7% of all cash distributions made by RNP to its common unit holders. We receive no distributions or other economic benefit as the general partner of RNP. Our ownership interest may be reduced over time if we were to elect to sell any of our common units, or if additional common units were to be issued by RNP.
Overview of Certain Significant Events that Occurred during 2014
During 2014, we (i) entered into the residential and commercial heating markets for wood pellets with the acquisition of New England Wood Pellet, LLC, or NEWP; (ii) continued converting our two acquired facilities in Canada into wood pellet production facilities; (iii) completed the sale of our alternative energy technologies, which resulted in a gain of $15.3 million being recorded in discontinued operations; (iv) completed the integration of Fulghum, which we acquired in 2013; (v) sold 100,000 shares of our Series E Convertible Preferred Stock, or the 2014 Preferred Stock, for an aggregate original issue price of $100.0 million; (vi) entered into a $50.0 million term loan facility, or the GSO Credit Agreement, which was amended and restated in February 2015 to increase outstanding borrowings under the facility from $50.0 million to $75.0 million with an additional available borrowing capacity of $38.0 million, or the A&R GSO Credit Agreement; and (vii) continued to operate, and expand production capacity at, RNP.
During 2014, RNP (i) completed the urea expansion project at our East Dubuque Facility; (ii) substantially completed the power generation project and completed the sulfuric acid converter project at our Pasadena Facility; (iii) wrote off the remaining $27.2 million of goodwill relating to the acquisition of Agrifos LLC, or the Agrifos Acquisition; and (iv) reached an agreement with the seller in the Agrifos Acquisition to settle all existing and future indemnity claims relating to the Agrifos Acquisition, which resulted in income of $5.6 million to RNP. On February 17, 2015, RNP announced that its board of directors has initiated a process to explore and evaluate potential strategic alternatives for RNP, which may include a sale of RNP, a merger with another party, a sale of some or all of its assets, or another strategic transaction. There can be no assurance that this strategic review process will result in a transaction.
Several negative factors affected our operating results in 2014. At RNP, sales volumes were lower than we had expected due to both unplanned downtime at our East Dubuque Facility and a decision to reduce output and sales from our Pasadena Facility in order to improve the profitability of that facility. As discussed above, we also wrote down all of the remaining goodwill at our Pasadena Facility as a result of the continued outlook for profits to be lower than we had foreseen at the time of the Agrifos Acquisition. We lost revenue and incurred unplanned expenses as the results of a fire at a Fulghum wood chip mill in Maine, and of unplanned downtime for several of our customers’ mills. We also incurred higher labor and maintenance expenses than we had planned. We are behind schedule in completing our Atikokan and Wawa wood pellet projects, and have significantly exceeded the original construction cost estimates for those projects. We believe we have addressed liquidity issues that arose from the higher capital expenditures and the delay in expected cash flow from those projects through the loans provided under the A&R GSO Credit Agreement. During 2014, we sold our former energy technologies business, but incurred unexpected expenses as that sale closed six months later than expected. Our corporate expenses increased primarily as a result of transaction fees related to our acquisition of NEWP, cost studies, settlements with shareholders, and higher information technology and accounting fees.
4
Table of Contents
Our Businesses
Our Wood Fibre Processing Business
Our wood fibre processing business primarily consists of wood chipping services to the pulp, paper and packaging industry and wood pellet production for the industrial power generation market and the residential and commercial heating markets.
Our Wood Chipping Business — Fulghum Fibres
Fulghum provides wood yard operations services and high-quality wood chipping services, and produces and sells wood chips to the pulp, paper and packaging industry. In South America, Fulghum also manufactures and sells wood chips, processes and sells biomass fuel to industrial heat and utility customers, owns and manages forestland, and buys and trades wood chips. Fulghum services and sells to customers in the United States, South America and Asia. Fulghum and its subsidiaries operate 31 wood chipping mills, of which 26 are located in the United States, four are located in Chile and one is located in Uruguay. Fulghum owns 88% of the equity interest in the subsidiaries located in Chile and 87% of the equity interest in the subsidiary located in Uruguay.
During the year ended December 31, 2014, our mills in the United States processed 12.6 million green metric tons, or GMT, of logs into wood chips and residual fuels; our mills in South America processed 2.3 million GMT of logs. For the period May 1, 2013 through December 31, 2013, our mills in the United States processed 8.4 million GMT of logs into wood chips and residual fuels; our mills in South America processed 1.5 million GMT of logs.
Expansion Projects
From time to time, we evaluate and pursue opportunities to increase our profitability by expanding our chip mills’ production capacities and product offerings. We installed a second debarking line at one of our mills in Chile. We expect the project to increase debarking capacity at the mill from 120,000 to 400,000 BDMTs per year. Construction of this project was completed during 2014, at a cost of $2.7 million. We also constructed a new chipping line at the same mill in Chile, which was completed in January 2015. We expect the project to increase chipping capacity from 180,000 to 400,000 BDMTs per year. The cost of this project was $6.6 million. This new chipping line is expected to reach full capacity in the second quarter of 2015. Both projects are being funded with Chilean bank debt financing.
Services/Products
Service revenues represent revenues earned under agreements for wood fibre processing services and wood yard operations. Product revenues represent revenues earned by our Chilean operations from the sale of wood chips and bark. Our operations include: managing industrial scale wood yards; debarking and chipping of logs; and screening and storing of chips and bark.
Customers
The majority of Fulghum’s customers are large pulp, paper and packaging manufacturers who use wood chips from our mills to manufacture products such as: boxboard, containerboard, fluff, kraftliner, dissolving pulp, paper and medium density fiberboard for building products.
Fulghum generates revenue primarily from fees under exclusive processing agreements. Each of our United States mills typically operates under an exclusive processing agreement with a single customer. At these mills, Fulghum is paid a processing fee based on tons processed, with minimum volume base rates and a reduced fee rate for higher volumes. In most cases, if the customer fails to deliver the minimum contracted log volume for processing, it must pay a shortage fee to Fulghum, which is typically lower than the base rate. Under our processing agreements, the customer generally has the opportunity to make up for any shortfall below minimum volume requirements with additional volumes in subsequent months before it is required to pay a shortfall fee. Shortfall fees are typically settled quarterly. Fulghum’s Chilean operations include chipping services that earn fees based on a per ton processing fee structure similar to that described above. Fulghum’s Chilean operations also involve the sale of wood chips for export and the local sale of bark for industrial heat and utility applications. In Chile, we purchase raw material and sell products through two subsidiaries. Forestal Los Andes S.A., or FLA, purchases logs from the market to fulfill an order from a customer which is typically for a specific vessel of wood chips. Forestal Pacifico S.A., or FP, provides de-barking services for FLA and several of our customers. FP processes bark into a biomass fuel that is sold to local power utilities and industrial customers for heat and electricity applications. We also operate one mill in Uruguay under a chipping services-for-fee contract.
5
Table of Contents
Most of our mills operate under multi-year contracts with the majority of total processing volume contracted through 2018 and beyond. Nine mills in the United States representing over 50% of our United States volume and two mills in Chile representing 44% of our South American volume are under contract through 2018 and beyond. Six of our mills located in the United States and two of our mills located in South America have contracts that are renegotiated annually. One of our mills located in the United States provides wood chips to its customer on an as-needed basis on the spot market. We own 21 of the 31 mills we operate in the United States and South America. For each of the mills that we own, the customer has an option to purchase the mill for a pre-determined price. For each of the mills that we do not own but operate under an agreement with the customer, the customer can terminate the agreement with prior written notice (in most cases, the processing agreements require 90 days’ prior written notice). Four contracts with Fulghum’s U.S. customers have been terminated prior to their expiration in the last 20 years (three due to mill closures and one associated with a customer buy-out in 1995).
During 2014, approximately 70% of the log volume we processed in the United States was for five customers at 13 mills, as listed below.
| Customer |
Number of Mills |
% of United States Volume |
Weighted Average Remaining Contractual Life in Years(1) |
|||||||||
| Graphic Packaging |
2 | 17 | % | 4.9 | ||||||||
| RockTenn |
6 | 17 | % | 2.9 | ||||||||
| Packaging Corp. of America |
1 | 14 | % | 13.9 | ||||||||
| Georgia-Pacific |
2 | 11 | % | 2.6 | ||||||||
| Weyerhaeuser |
2 | 11 | % | 1.0 | ||||||||
| (1) | As of December 31, 2014. |
Seasonality and Volatility
Our wood chipping mills typically operate throughout the year; however, there may be quarter-to-quarter fluctuations in processing revenue at individual mills. These fluctuations are usually due to variations in customer-controlled deliveries of logs, production levels at customers’ mills, maintenance requirements, and/or weather-related events. Our customer contracts stipulate minimum volume requirements and shortfall fees. Such fees partially mitigate the volatility in revenues of our United States mills. If heavy rain is expected to prevent deliveries or make deliveries of logs to the mills difficult, we frequently coordinate delivery schedules with our customers to build log inventories in advance of such conditions. Building sufficient inventory of logs at our mill sites enables the mills to process with fewer interruptions during the rainy season. Based on our customers’ expected relatively continuous wood chip requirements, the terms of our processing agreements and our focus on maintaining proper log inventories, we do not expect to experience material seasonality in Fulghum’s United States or Uruguayan operations. However, one of our mills in Chile typically ceases wood chip processing operations for one to two months during its winter season due to the customer’s inability to harvest and deliver logs to the facility. Since a significant portion of the revenue in Fulghum’s South American operations is derived from the sale of wood chips, primarily for export from Chile, an interruption in the supply of logs could adversely affect revenue and profitability. This portion of revenue, and the associated profits, may be more variable than the revenue and profits derived from processing fees pursuant to long-term contracts.
Raw Materials
The customers of our 26 mills located in the United States and the customers of most of our five mills in Chile and Uruguay are responsible for the procurement and delivery of wood to our mills. As a result, these mills are not directly exposed to logistics or delivery risks or to market risk associated with potential changes in wood supply or pricing, although they may be indirectly impacted if a customer experiences these risks. For service revenue generated under our processing contracts, title to the wood remains with the customer throughout our receipt and processing of the wood fibre. In Chile, in addition to providing wood processing services, we sell wood chips primarily for export to Asian markets. We typically purchase logs only to fulfill obligations under contracts with established prices for the delivery of wood chips, thereby minimizing our exposure to market fluctuations in prices for wood chips and logs. We also own approximately 1,400 acres of forestland in South America that can be harvested in cases of high log prices, which can help reduce market exposure in the short-term. However, if prices of wood remain at high levels for a prolonged period of time, revenue and profitability of our Chilean operations, which sells wood chips could be adversely affected.
6
Table of Contents
Transportation
In the United States, Fulghum’s customers are responsible for delivering logs to the Fulghum chipping facility and arranging transportation of the processed wood chips from the mill to the final destination, except at those mills which are within or adjacent to customers’ premises, where wood chips are delivered by conveyor. Our Uruguayan and certain of our Chilean operations are similar to the United States business model in that the customer is responsible for delivering logs to the wood chipping facility and either takes receipt of the wood chips from the mill (domestic customers) or requires Fulghum to load the wood chips into a ship for export at the customer’s expense (foreign customers).
Competition
While a significant portion of the wood chipping mills in the United States are integrated facilities (i.e. owned and operated by forestry or paper companies that produce wood chips for internal consumption), the number of contract wood chipping mills in the United States has grown over the last decade. We estimate that Fulghum has a 70% market share of the contract wood chipping market in the United States, and we believe we have an opportunity to expand its business further due to the benefits to paper and forestry companies to outsource wood yard operations and chip processing. We believe that most of the other contract wood chip processors in the United States that compete with Fulghum are considerably smaller and less experienced and recognized than Fulghum. We believe that Fulghum’s 25 years of operating experience in the wood chipping industry, level of expertise and efficiency, scale, brand recognition and quality of products have enabled us, and will continue to enable us, to favorably distinguish ourselves from these competitors.
Our Wood Pellet Business — Industrial
In 2013, we acquired an idled oriented strand board processing mill in Wawa, Ontario, Canada. We are in the process of converting the mill to a wood pellet facility, or the Wawa Facility, designed to produce approximately 450,000 metric tons of wood pellets annually, or the Wawa Project. We expect the Wawa Facility will process annually approximately 855,000 green metric tons of sustainably managed wood fibre allocated to us by the Government of Ontario, or Crown Fibre. We also expect that the Wawa Facility will be able to accommodate 50 rail cars on-site at any one time. The Wawa Facility is nearing completion of construction. We expect the facility to begin startup and commissioning in the second quarter of 2015 and to operate at full capacity within one year from the start of commissioning. Also, in 2013, we acquired a former particle board processing mill in Atikokan, Ontario, Canada. We converted this mill into a wood pellet facility, or the Atikokan Facility, and expect it to produce approximately 110,000 metric tons of wood pellets annually, or the Atikokan Project. We expect that the Atikokan Facility will process approximately 209,000 green metric tons of sustainably managed Crown Fibre annually. We also expect the Atikokan Facility will be able to accommodate ten rail cars on-site at any one time. The Atikokan Facility is currently in the commissioning phase and is producing and selling wood pellets to Ontario Power Generation Inc., or OPG. We expect the Atikokan Facility to be operating at full capacity in six to 12 months.
We currently estimate the total cost to acquire and convert the Atikokan and Wawa Facilities will be approximately $125.0 million to $130.0 million, up from previous estimates of $105.0 million. The majority of the increase is due to delays in construction and higher than expected labor costs for installation of electrical and mechanical components. Approximately $104.0 million of the estimated cost had been spent through December 31, 2014. We expect that the total project cost will include working capital and the costs to commission the facilities of $6.0 million to $10.0 million, which is in addition to the cost to acquire and convert the facilities. In 2015, total combined expenditures, including construction, working capital, and costs to commission, for the Atikokan and Wawa Projects are expected to be between $27.0 million and $36.0 million. We expect that the new term loan under the A&R GSO Credit Agreement, together with cash on hand, will be sufficient to fund the Atikokan and Wawa Projects until they have been commissioned and later begin to generate positive cash flow.
Products
Our industrial wood pellets are used in larger scale power generation facilities. Our wood pellets are subject to specific product quality standards, which include energy density, ash content, durability index, fines content, chemical content and grindability as both utilities and government regulators have standards for wood pellets used in renewable energy. Proof of biomass sustainability and independent verification of feedstock supply are also requirements to sell wood pellets to European utilities.
Customers
In 2013, we entered into a ten-year take-or-pay contract, or the Drax Contract, with Drax Power Limited, or Drax. Under the Drax Contract, we are required to sell to Drax the first 400,000 metric tonnes of wood pellets per year produced from the Wawa Facility, with the first delivery under the contract scheduled for the end of year 2014. During 2014, we did not meet our commitment under the Drax Contract to deliver wood pellets. We have amended the Drax Contract to cancel all wood pellet deliveries that were due in 2014 and to reduce the required volume of wood pellets to be delivered to Drax in 2015 to 240,000 tonnes from 360,000 tonnes. In exchange for the cancelled deliveries and reduced volume commitments, we paid Drax a penalty of approximately $170,000 and expect to provide price concessions in the amount of $0.9 million on shipments made to Drax in 2015. In the event such shipments are not made, the price reductions would become cash penalties payable to Drax, in addition to other penalties that may be due under the Drax Contract for such failed deliveries. In addition, 72,000 tonnes of the original 2015 deliveries are being deferred to future years for delivery at 2015 pricing, which is expected to be lower than the pricing under the terms of the Drax Contract in those future years.
7
Table of Contents
For the Atikokan Facility, we entered into a ten-year take-or-pay contract, or the OPG Contract, with OPG, under which we are required to deliver 45,000 metric tonnes of wood pellets annually. OPG has the option to increase required delivery of wood pellets from the Atikokan Facility to up to 90,000 metric tonnes annually. We expect that wood pellets produced at the Atikokan Facility not purchased by OPG may be sold to Drax or marketed elsewhere. The Atikokan Facility made its first delivery of wood pellets to OPG in May 2014 using wood pellets supplied by a third-party wood pellet producer.
Seasonality and Volatility
We do not expect significant seasonality in our profits from our Atikokan and Wawa Facilities, although we do expect to recognize revenue and receive cash in large increments as we complete each shipment by vessel for exported pellets. We expect each vessel to contain approximately 50,000 tonnes, and we will recognize revenue and receive cash payments upon each shipment. We have entered into long-term off-take contracts with Drax and OPG, which are utility companies that operate throughout the year. Once we begin operating the Atikokan and Wawa Facilities at full capacity, we intend to produce wood pellets from these facilities year-round to meet these contractual requirements. Ground conditions during the wet season referred to as “spring break-up” or “snow melt”, may prevent or curtail the harvesting of wood to supply pellet production. We expect that our wood pellet mills will build sufficient wood inventory on site through the autumn and winter months to mitigate this potential interruption of wood supply. This inventory build-up may increase our working capital requirements. The Port of Quebec typically remains ice-free during the winter months, which we expect will reduce the risk of interruptions in shipments to Drax. Because shipments to Drax will occur in large vessels, quarterly or annual revenues and profits could fluctuate depending on the timing and number of shipments in each period, particularly until we reach full production capacity at the Wawa Facility.
Raw Materials and Supply
We intend to utilize Crown Fibre as the primary feedstock at our wood pellet facilities. We believe that using Crown Fibre is desirable due to Ontario’s long-term forest management regime, which supports the availability and supply of wood fibre, and its industry-leading sustainability practices. In addition, we believe that the mixed hardwood trees in Northern Ontario, which have a long maturity period before they can be harvested, have a natural chemical composition that allows for the production of high quality wood pellets for thermal applications. We may also use sawmill wood residuals and other sources of biomass, from time to time, as part of the feedstock for the Atikokan and Wawa Facilities.
Transportation
We have a contract with Canadian National Railway Company, or the Canadian National Contract, for all rail transportation of wood pellets from the Atikokan Facility and the Wawa Facility to the Port of Quebec. The Atikokan Facility is located 1,300 track miles and the Wawa Facility is located 1,100 track miles from the Port of Quebec. We have a contract with Quebec Stevedoring Company Limited, or QSL, for our exclusive use of pellet storage domes and for loading services at the Port of Quebec. Access to the Port of Quebec port terminal is available for the entire year. The Port of Quebec’s location along the Saint Lawrence Seaway provides a direct route from Eastern Canada to Europe, and the port can accommodate large Panamax vessels that provide attractive economies of scale for our customers, in contrast to other nearby ports that can accommodate only smaller vessels.
Joint Venture with Graanul
In connection with our acquisition of Fulghum, or the Fulghum Acquisition, we entered into a joint venture with Graanul Invest AS, or Graanul, a European producer of wood pellets, for the potential development and construction of, and investment in, wood pellet plants in the United States and Canada. We and Graanul each own 50% equity interests in the joint venture, or the Rentech/Graanul JV, which is accounted for under the equity method. Neither our Atikokan Project nor our Wawa Project are owned by the Rentech/Graanul JV. The joint venture has the right to develop certain wood pellet-related projects and has certain rights as exercised by either member to participate in future wood pellet projects or acquisitions in North America sourced by the other member. The joint venture currently does not own any tangible assets.
Our Wood Pellet Business — NEWP
On May 1, 2014, we acquired all of the equity interests of NEWP. This acquisition is consistent with our strategy of expanding our wood fibre business. The purchase price consists of $40.4 million of cash, including earn-out consideration of up to $5.0 million. Upon the closing of this transaction, or the NEWP Acquisition, NEWP became a wholly owned subsidiary of ours. In January 2015, NEWP acquired the assets of Allegheny Pellet Corporation, which consists of a wood pellet processing facility located in Youngsville, Pennsylvania, or the Allegheny Facility. NEWP operates four wood pellet processing facilities with a combined annual production capacity of approximately 280,000 tons. The other three facilities are located in Jaffrey, New Hampshire; Deposit, New York; and Schuyler, New York.
8
Table of Contents
Products
NEWP’s wood pellets, which are designed to have low moisture and ash content, are used in commercial and residential heating applications.
Customers
NEWP’s facilities and customers are located in the Northeastern United States. NEWP sells its wood pellets to big-box retailers and specialty retailers, including lawn and garden centers, heating supply stores, hardware stores, markets and convenience stores. It also sells pellets in bulk to large institutions, including schools, universities and governmental agencies to heat buildings. In the aggregate, NEWP’s top two big-box retailers, Home Depot and Lowe’s Home Improvement, represented approximately 40% of NEWP’s total sales for the year ended December 31, 2014. As is typical in the retail wood pellet industry, NEWP’s sales to its customers are primarily made on a purchase order basis, and NEWP generally does not have long-term orders or commitments.
Seasonality and Volatility
Since NEWP’s wood pellets are used for heating, its sales are seasonal. For the last three years, over 60% of NEWP’s annual sales have taken place from September through February. As a result of the seasonality of shipments and sales, we expect to experience significant fluctuations in NEWP’s revenues, income and net working capital levels from quarter to quarter. Weather conditions can significantly impact quarterly results by affecting the timing and amount of product deliveries. To accommodate NEWP’s seasonal sales, we build up NEWP’s finished goods inventory from March through August of each year. This inventory build-up typically increases our working capital requirements.
Raw Materials
Wood feedstock (wood chips and sawdust) represents the largest component of NEWP’s wood pellet product cost. Competition for wood feedstock supply from pulp, paper and packaging manufacturing, and commercial and institutional wood boiler heating systems may affect our cost of wood feedstock. Our Jaffrey, New Hampshire production facility is affected the most by this competition, followed by our Schuyler, New York production facility, with our Deposit, New York production facility and the Allegheny Facility least affected. We have approximately 180 wood suppliers, of which approximately 50 provide 80% of our wood feedstock needs. We have developed relationships with our suppliers such that our wood costs have remained relatively flat with minimal variability over the last several years.
Transportation
NEWP’s customers take delivery of the wood pellets at the applicable facility.
Growth Plans
We are pursuing acquisitions of assets and businesses and developing projects related to both our wood chipping and wood pellets businesses, and other closely related lines of business. Our objective in any acquisition or development project is to achieve returns on investment at least commensurate with the risk of such investment. Acquisitions may be for stock, cash, or other consideration and we may assume or incur debt in connection with such acquisitions. Acquisitions and development projects involve numerous risks and uncertainties, including the potential unavailability of financing if needed, difficulties in completing any transaction on sufficiently favorable terms or any development project on budget, and the possibility that any expected benefits of the acquisition or expansion project may not be realized. As a result, there can be no assurance that we will be able to complete any acquisitions or projects on a timely basis or at all.
We intend to pursue strategies and financing vehicles for our wood chipping and wood pellets businesses that will maximize value for our shareholders. Such strategies may include an initial public offering of these businesses through a master limited partnership, depending on market conditions and the level of cash flow from these businesses. Our ability to complete an initial public offering and its timing are both subject to a number of factors, including our ability to complete our development projects and achieve our intended growth and profitability, and also subject to market factors and various other factors that are outside of our control. As a result, there can be no assurance that we will be able to complete any initial public offering of these businesses on a timely basis or at all. This report does not constitute an offer to sell or a solicitation to buy any securities.
9
Table of Contents
Our Nitrogen Fertilizer Business
We own, through our wholly owned subsidiaries, the general partner interest and 59.7% of the common units representing limited partner interests in RNP, a publicly traded partnership. RNP, through its wholly owned subsidiary, RNLLC, manufactures natural-gas based nitrogen fertilizer products at our East Dubuque Facility and sells such products to customers located in the Mid Corn Belt region of the United States. In addition, RNP, through its wholly owned subsidiary, RNPLLC, manufactures fertilizer products and sulfuric acid at our Pasadena Facility and sells, through distributors, its products to customers primarily in the United States. Our East Dubuque Facility and our Pasadena Facility are referred to collectively as the “Fertilizer Facilities.” Substantially all of RNP’s revenues are derived from the sale of nitrogen-based fertilizer products.
Our East Dubuque Facility
Our East Dubuque Facility is located on 210 acres in the northwest corner of Illinois on a 140-foot bluff above the Upper Mississippi River. Our East Dubuque Facility produces ammonia, urea ammonium nitrate solution, or UAN, liquid and granular urea, nitric acid and food-grade carbon dioxide, or CO2, using natural gas as its primary feedstock. We sell such products to customers located in the Mid Corn Belt region of the United States, the largest market in the United States for direct application of nitrogen fertilizer products. Our East Dubuque Facility operates continuously, except for planned shutdowns for maintenance and efficiency improvements, and unplanned shutdowns. Our East Dubuque Facility can optimize its product mix according to changes in demand and pricing for its various products. Some of these products are final products sold to customers, and others, including ammonia, are both final products and feedstocks for other products, such as UAN, nitric acid, liquid urea and granular urea.
The following table sets forth our East Dubuque Facility’s current rated production capacity for the listed products in tons per day and tons per year, and its product storage capacity:
| Product |
Approximate Production Capacity |
Product Storage Capacity | ||||||||
| Tons /Day | Tons /Year(1) | |||||||||
| Ammonia |
1,025 | 374,125 | 60,000 tons (3 tanks); 15,000 tons(2) | |||||||
| UAN |
1,100 | 401,500 | 80,000 tons (2 tanks) | |||||||
| Urea (liquid) |
484 | 176,660 | Limited capacity is not a factor | |||||||
| Urea (granular) |
140 | 51,100 | 12,000 granular ton warehouse | |||||||
| Nitric acid |
380 | 138,700 | Limited capacity is not a factor | |||||||
| CO2 |
350 | 127,750 | 1,900 tons | |||||||
| (1) | Production capacity for the year is based on daily rated production capacity times 365 days. The number of actual operating days will vary from year to year. |
| (2) | Represents 15,000 tons of storage capacity at the terminal of Agrium U.S.A., Inc., or Agrium, in Niota, Illinois where we have the right to store ammonia pursuant to our distribution agreement with Agrium. RNLLC’s right to store ammonia at this terminal expires on June 30, 2016, but automatically renews for successive one year periods, unless we deliver a termination notice to Agrium with respect to such storage rights at least three months prior to an automatic renewal. Notwithstanding the foregoing, our right to use the storage space immediately terminates if the distribution agreement terminates in accordance with its terms. See “—Marketing and Distribution.” |
The following table sets forth the amount of products produced by, and shipped from, the East Dubuque Facility for the years ended December 31, 2014, 2013 and 2012:
| For the Years Ended December 31, |
||||||||||||
| 2014 | 2013 | 2012 | ||||||||||
| (in thousands of tons) | ||||||||||||
| Products Produced |
||||||||||||
| Ammonia(1) |
324 | 244 | 293 | |||||||||
| UAN |
269 | 262 | 301 | |||||||||
| Urea (liquid) |
150 | 137 | 139 | |||||||||
| Urea (granular) |
25 | 22 | 23 | |||||||||
| Nitric acid |
105 | 106 | 122 | |||||||||
| CO2 |
82 | 69 | 76 | |||||||||
| Products Shipped |
||||||||||||
| Ammonia |
153 | 103 | 149 | |||||||||
| UAN |
267 | 269 | 291 | |||||||||
| Urea (liquid) |
30 | 21 | 13 | |||||||||
| Urea (granular) |
25 | 22 | 22 | |||||||||
| Nitric acid |
11 | 14 | 14 | |||||||||
| CO2 |
81 | 71 | 76 | |||||||||
| (1) | Ammonia is used in the production of all other products produced by our East Dubuque Facility, except CO2. |
10
Table of Contents
Expansion Projects
In 2014, we completed the urea expansion project at our East Dubuque Facility. As part of the project, we installed an additional CO2 compressor, which increased liquid urea production capacity at our East Dubuque Facility from 460 tons per day to 484 tons per day, or from 167,900 tons annually to 176,660 tons annually. We spent $3.2 million on this project.
We are regularly evaluating or pursuing opportunities to increase our profitability by expanding the East Dubuque Facility’s production capabilities and product offerings, including with the following expansion projects:
| • | Nitric Acid Expansion Project. In 2014, we commenced the replacement of a compressor train in one of our nitric acid plants at our East Dubuque Facility. This project is expected to increase nitric acid production at the facility by 30 tons per day or 11,000 tons annually, and decrease electric power usage. We expect to complete this project during the second quarter of 2015 at a cost of $7.0 million. This project will be funded initially with borrowings under the credit agreement RNP entered into in July 2014 with General Electric Capital Corporation,, or the GE Credit Agreement. |
| • | Ammonia Synthesis Converter Project. We plan to replace the ammonia synthesis converter at our East Dubuque Facility, which is expected to increase reliability, production and plant efficiency. The project is expected to cost approximately $30.0 million and to be completed by the end of 2016. This project will be funded initially with borrowings under the GE Credit Agreement. |
Products
Our East Dubuque Facility’s product sales are heavily weighted toward sales of ammonia and UAN, which together made up 80% or more of our East Dubuque Facility’s total revenues for the years ended December 31, 2014, 2013 and 2012. A majority of our East Dubuque Facility’s products are sold through our distribution agreement with Agrium as described below under “—Marketing and Distribution,” with the exception of CO2, which we sell directly to customers in the food and beverage market at negotiated contract prices. Ammonia and UAN are each sources of nitrogen, but each has its own characteristics, and customers’ preferences for each product vary according to the crop planted, soil and weather conditions, regional farming practices, relative prices and the cost and availability of storage, transportation, handling and application equipment. During the years ended December 31, 2014, 2013 and 2012, we sold more than 90% of our East Dubuque Facility’s nitrogen products to customers for agricultural application, with the remaining portion sold to customers for industrial uses.
Ammonia. Our East Dubuque Facility produces ammonia, the simplest form of nitrogen fertilizer and the feedstock for the production of other nitrogen fertilizers. The ammonia processing unit at our East Dubuque Facility has a current rated capacity of 1,025 tons per day. Our East Dubuque Facility’s ammonia product storage consists of three 20,000 ton tanks and 15,000 tons of leased storage in Niota, Illinois.
UAN. UAN is a liquid fertilizer that has a slight ammonia odor but, unlike ammonia, it does not need to be refrigerated or pressurized when transported or stored. Our East Dubuque Facility has two UAN storage tanks with a combined capacity of 80,000 tons.
Urea. Our East Dubuque Facility’s urea solution is (i) sold in its liquid state, (ii) processed into granular urea through the facility’s urea granulation plant to create dry granular urea, (iii) upgraded into UAN or (iv) upgraded into diesel exhaust fluid, or DEF. We assess market demand for each of these four end products and allocate our East Dubuque Facility’s urea solution as appropriate. We sell liquid urea, including DEF, primarily to industrial customers in the power, ethanol and diesel emissions markets. DEF is a urea-based chemical reactant that is intended to reduce nitrogen oxide emissions in the exhaust systems of certain diesel engines of trucks and off-road farm and construction equipment. Although we believe that there is high demand for our granular urea in agricultural markets, we sell it primarily to customers in specialty urea markets where the spherical shape and consistent size of the granules produced by our curtain granulation technology generally command a premium price. Our East Dubuque Facility has a 12,000 ton capacity bulk warehouse that can be used for storage of dry bulk granular urea.
11
Table of Contents
Nitric Acid. Our East Dubuque Facility produces nitric acid through two separate nitric acid plants at the facility. Nitric acid is either sold to third parties or used within the facility for the production of ammonium nitrate solution, as an intermediate from which UAN is produced. We believe that our East Dubuque Facility currently has sufficient storage capacity available for the nitric acid produced at the facility.
CO2. CO2 is a gaseous product that is co-manufactured with ammonia, with 1.1 tons of CO2 produced per ton of ammonia produced. Our East Dubuque Facility utilizes CO2 in its urea production and has developed a market for CO2 through purification to a food grade liquid CO2. Our East Dubuque Facility has storage capacity for 1,900 tons of CO2. We have multiple CO2 sales agreements that allow for regular shipment of CO2 throughout the year, and our current storage capacity is sufficient to support our CO2 delivery commitments.
Marketing and Distribution
In 2006, RNLLC entered into a distribution agreement with Agrium under which a majority of our East Dubuque Facility’s products, including ammonia and UAN, are sold. Pursuant to the distribution agreement, Agrium is obligated to use commercially reasonable efforts to promote the sale of, and to solicit and secure orders from its customers, for ammonia, liquid and granular urea, UAN and nitric acid. Under the distribution agreement, Agrium bears the credit risk on products sold through Agrium pursuant to the agreement. The distribution agreement has a term that ends in April 2016, but automatically renews for subsequent one-year periods, unless either party delivers a termination notice to the other party at least three months prior to an automatic renewal.
During the years ended December 31, 2014, 2013 and 2012, 78% or more of our East Dubuque Facility product sales were through Agrium pursuant to the distribution agreement, and the remainder sold directly to customers. RNLLC’s management approves price, quantity and other terms for each sale through Agrium, and it pays Agrium a commission for its services. RNLLC’s rights under the distribution agreement include the right to store specified amounts of its ammonia for a monthly fee at Agrium’s ammonia terminal in Niota, Illinois, which serves as a distribution point where ammonia produced at its East Dubuque Facility is sold. RNLLC’s right to store ammonia at Agrium’s terminal expires on June 30, 2016, but automatically renews for successive one year periods, unless it delivers a termination notice to Agrium with respect to such storage rights at least three months prior to an automatic renewal. Notwithstanding the foregoing, RNLLC’s right to use the storage space immediately terminates if the distribution agreement terminates in accordance with its terms. Outside of the distribution agreement, RNLLC also sells its East Dubuque Facility’s nitrogen products and CO2 directly to its customers.
Under the distribution agreement, RNLLC pays commissions to Agrium on applicable gross sales during the first 10 years of the agreement, not to exceed $5 million during each contract year. The commission rate is 5%. The effective commission rate associated with sales under the distribution agreement was 3.4% for the year ended December 31, 2014, 3.6% for the year ended December 31, 2013 and 2.7% for the year ended December 31, 2012.
Customers
We sell a majority of our East Dubuque Facility’s nitrogen products to customers located in the facility’s core market, which is the area located within an estimated 200-mile radius of the facility. Given the nature of our business, and consistent with industry practice, we generally do not have long-term minimum sales contracts for fertilizer products with any of our customers. The following table shows for the periods presented the percentage of our sales of products to our top five customers and sales to certain specific customers:
| For the Years Ended December 31, |
||||||||||||
| 2014 | 2013 | 2012 | ||||||||||
| Sales of Products to Top 5 Customers |
||||||||||||
| Ammonia, as a % of total ammonia sales |
62 | % | 57 | % | 54 | % | ||||||
| UAN, as a % of total UAN sales |
58 | % | 59 | % | 38 | % | ||||||
| Sales to Customers, as a % of total sales |
||||||||||||
| Agrium (as a direct customer) |
— | 2 | % | 2 | % | |||||||
| Crop Production Services, Inc., or CPS |
12 | % | 12 | % | 9 | % | ||||||
12
Table of Contents
Seasonality and Volatility
Ammonia, UAN and other nitrogen based fertilizer sales are seasonal, based upon planting, growing and harvesting cycles, and product availability. Inventories are accumulated to allow for shipments to customers during the spring and fall fertilizer application seasons, which require significant storage capacity. The accumulation of inventory to be available for seasonal sales creates significant seasonal working capital requirements. This seasonality generally results in higher fertilizer prices during peak fertilizer application periods, with prices normally reaching their highest point in the spring, decreasing in the summer, and increasing again in the fall. Our East Dubuque Facility’s products are sold both on the spot market for immediate delivery and under prepaid contracts for future delivery of products at fixed prices. The terms of the prepaid contracts, including the percentage of the purchase price paid as a down payment, can vary from season to season. Variations in the proportion of product sold through forward sales contracts and variations in the terms of such contracts can increase the seasonal volatility of our cash flows and cause changes in the patterns of seasonal volatility from year-to-year. The cash from prepaid contracts is included in our operating cash flow in the quarter in which the cash is received, while revenue and cost of sales related to prepaid contracts are recognized when products are picked up or delivered and the customer takes title. As a result, the timing of cash received under prepaid contracts may be very different from the timing of recognition of income and expense under those same contracts; significant amounts of profit may be related to cash collected in earlier periods and recorded profits may not be accompanied by a corresponding collection of cash in a particular reporting period. See “Part II — Item 7. Management’s Discussion and Analysis of Financial Condition and Results of Operations.”
Another seasonal factor affecting the nitrogen fertilizer industry is the effect of weather-related conditions on the ability to transport products by barge on the Upper Mississippi River. During certain times of the winter, the Upper Mississippi River cannot be used for transport due to lock closures, which could preclude the transportation of nitrogen products by barge during this period and may increase transportation costs. The following table sets forth the percentage of ammonia and UAN tonnage sold that was transported from our East Dubuque Facility by barge:
| For the Years Ended December 31, |
||||||||||||
| 2014 | 2013 | 2012 | ||||||||||
| Ammonia |
— | 4.8 | % | 5.6 | % | |||||||
| UAN |
4.5 | % | — | 1.7 | % | |||||||
The following table shows total tons of our East Dubuque Facility’s products shipped for each quarter presented below:
| For the Years Ended December 31, |
||||||||||||
| 2014 | 2013 | 2012 | ||||||||||
| (in thousands of tons) | ||||||||||||
| Ammonia |
||||||||||||
| Quarter ended March 31 |
7 | 11 | 30 | |||||||||
| Quarter ended June 30 |
72 | 41 | 40 | |||||||||
| Quarter ended September 30 |
27 | 24 | 31 | |||||||||
| Quarter ended December 31 |
47 | 27 | 48 | |||||||||
| UAN |
||||||||||||
| Quarter ended March 31 |
49 | 61 | 34 | |||||||||
| Quarter ended June 30 |
82 | 59 | 92 | |||||||||
| Quarter ended September 30 |
83 | 117 | 110 | |||||||||
| Quarter ended December 31 |
53 | 32 | 55 | |||||||||
| Other Nitrogen Products |
||||||||||||
| Quarter ended March 31 |
16 | 15 | 13 | |||||||||
| Quarter ended June 30 |
17 | 20 | 13 | |||||||||
| Quarter ended September 30 |
16 | 14 | 14 | |||||||||
| Quarter ended December 31 |
17 | 8 | 9 | |||||||||
| CO2 |
||||||||||||
| Quarter ended March 31 |
20 | 23 | 15 | |||||||||
| Quarter ended June 30 |
22 | 24 | 15 | |||||||||
| Quarter ended September 30 |
19 | 21 | 25 | |||||||||
| Quarter ended December 31 |
20 | 3 | 21 | |||||||||
|
|
|
|
|
|
|
|||||||
| Total Tons Shipped |
567 | 500 | 565 | |||||||||
|
|
|
|
|
|
|
|||||||
13
Table of Contents
RNLLC typically ships the highest volume of tons from our East Dubuque Facility during the spring planting season, which occurs during the quarter ending June 30 of each year. The next highest volume of tons shipped is typically after the fall harvest during the quarter ending December 31 of each year. However, as reflected in the table above, the seasonal patterns may change substantially from year-to-year due to various circumstances, including timing of or changes in weather. These seasonal increases and decreases in demand also can cause fluctuations in sales prices. In winter seasons with warmer weather, early planting may shift significant ammonia sales into the quarter ending March 31. Wet or cold weather during the normal spring application season can delay deliveries that would normally occur in the spring. Weather conditions can also affect the mix of demand for our products at various times in the year. Certain weather and soil conditions favor the application of ammonia, while other conditions favor the application of UAN solution.
Raw Materials
The principal raw material used to produce nitrogen fertilizer products at our East Dubuque Facility is natural gas. We have historically purchased natural gas in the spot market, through the use of forward purchase contracts, or a combination of both. We use forward purchase contracts to lock in pricing for a portion of our East Dubuque Facility’s natural gas requirements. These forward purchase contracts are generally either fixed-price or index-price, short term in nature and for a fixed supply quantity. Our general policy is to purchase enough natural gas under fixed-price forward contracts to manufacture the products that have been sold under prepaid contracts for future delivery, effectively fixing a substantial portion of the gross margin on pre-sold product. We sometimes also purchase or fix prices on natural gas in excess of those requirements, when we believe that gas prices are attractive enough to lock in even without matching product pre-sales. We are able to purchase natural gas at competitive prices due to our East Dubuque Facility’s connection to the Northern Natural Gas interstate pipeline system, which is within one mile of the facility, and the facility’s connection to the ANR Pipeline Company, or ANR, pipeline. The pipelines are connected to Nicor Inc.’s, or Nicor’s, distribution system at the Chicago Citygate receipt point and at the Hampshire interconnect, respectively, from which natural gas is transported to the facility. Though we do not typically purchase natural gas for the purpose of resale, we occasionally sell natural gas when purchase commitments exceed production requirements and/or storage capacities, or when the margin from selling natural gas significantly exceeds the margin from producing additional ammonia. The East Dubuque Facility’s receipt point locations and access to the Chicago Citygate receipt point has allowed us to obtain relatively favorable natural gas prices for sales of our excess natural gas due to our proximity to the stable residential demand for the commodity in Chicago, Illinois. The following table shows the natural gas purchased and used in production:
| For the Years Ended December 31, |
||||||||||||
| 2014 | 2013 | 2012 | ||||||||||
| Volume (MMBtu, or million British thermal units) |
11,487,000 | 8,942,000 | 10,644,000 | |||||||||
We plan to continue to operate our East Dubuque Facility with natural gas as its primary feedstock. Competitors may have access to cheaper natural gas or other feedstocks that could provide them with a cost advantage. Depending on its magnitude, the amount of this cost advantage could offset our savings on transportation and storage costs as a result of our East Dubuque Facility’s location. The following table shows the average prices for natural gas in our cost of sales for the periods presented:
| For the Years Ended December 31, |
||||||||||||
| 2014 | 2013 | 2012 | ||||||||||
| Cost of natural gas ($ per MMBtu) |
$ | 5.00 | $ | 4.16 | $ | 3.59 | ||||||
Changes in the levels of natural gas prices and market prices of nitrogen-based products can materially affect our financial position and results of operations. Natural gas prices in the United States have experienced significant fluctuations over the last several years, increasing substantially in 2008 and subsequently declining to the current lower levels. Several recent discoveries of large natural gas deposits in North America, combined with advances in technology for natural gas production have caused large increases in the estimates of available natural gas reserves and production in the United States, contributing to significant reductions in the market price of natural gas.
In 2014, we entered into fixed-quantity forward purchase contracts at fixed and indexed prices for various delivery dates through June 30, 2015. As of December 31, 2014, the total MMBtus associated with these forward purchase contracts are 3.7 million and the total amount of the purchase commitments are $15.6 million, resulting in a weighted average rate per MMBtu of $4.18 in these commitments. During January and February 2015, we entered into additional fixed-quantity forward purchase contracts at fixed and indexed prices for various delivery dates through December 31, 2015. The total MMBtus associated with these additional forward purchase contracts are 2.7 million and the total amount of the purchase commitments is $7.7 million, resulting in a weighted average rate per MMBtu of $2.88 in these new commitments.
14
Table of Contents
Transportation
In most instances, our East Dubuque Facility’s customers take delivery of nitrogen products at the facility, and then arrange and pay to transport the products to their final destinations by truck. Similarly, under the distribution agreement, neither we nor Agrium are responsible for transportation, and customers that purchase our East Dubuque Facility’s products through Agrium also take delivery of such products at the facility. When products are purchased for delivery at the facility, the customer is responsible for all costs of, and bears all risks associated with, the transportation of products from the facility.
In certain instances, customers take delivery of products at the final destination. In these circumstances, we are responsible for the associated transportation costs. In order to accommodate barge and rail deliveries, we own and operate a barge dock on the Mississippi River, and a rail spur that connects to the Burlington Northern Santa Fe Railway and the Canadian National Railway Company, or Canadian National. We also ship products by barge to our leased storage facility in Niota, Illinois, which provides another distribution point from which our customers may pick up our East Dubuque Facility’s products by truck.
Competition
Our East Dubuque Facility competes with a number of domestic and foreign producers of nitrogen fertilizer products, many of which are larger than us and have significantly greater financial and other resources than we do.
We believe that customers for nitrogen fertilizer products make purchasing decisions principally on the delivered price and availability of the product at the critical application times. Our East Dubuque Facility’s proximity to its customers provides us with a competitive advantage over producers located further away from those customers. The nitrogen fertilizer facilities closest to our East Dubuque Facility are located about 190 miles away in Fort Dodge, Iowa; 275 miles away in Creston, Iowa; 300 miles away in Port Neal, Iowa; and 350 miles away in Lima, Ohio. Our East Dubuque Facility’s physical location in the center of the Mid Corn Belt provides the facility with a transportation cost advantage compared to other producers who must ship their products over greater distances to our East Dubuque Facility’s market area. The combination of our East Dubuque Facility’s proximity to its customers and our storage capacity at the facility allows customers to better time the pick-up and application of our products, as deliveries from more distant locations have a greater risk of missing the short periods of favorable weather conditions during which the application of nitrogen fertilizer and planting may occur. However, other producers of nitrogen fertilizer products are constructing or contemplating the construction of new nitrogen fertilizer facilities in North America, including in the Mid Corn Belt. For example, Orascom Construction Industries Company, or OCI, an Egyptian producer of fertilizer products, has announced that a wholly owned subsidiary of OCI is constructing a facility located 165 miles away from our East Dubuque Facility that is designed to produce between 1.5 to 2.0 million metric tons per year of ammonia, urea, UAN and DEF and that it expects the facility to be operational in late 2015. If a new nitrogen fertilizer facility is completed in our East Dubuque Facility’s core market, it could benefit from the same competitive advantage associated with the location of our East Dubuque Facility. The completion of such a facility could have a material adverse effect on our results of operations and financial condition.
Our Pasadena Facility
On November 1, 2012, RNP completed its acquisition of 100% of the membership interests of Agrifos LLC, or Agrifos, from Agrifos Holdings Inc., or the Seller, pursuant to a Membership Interest Purchase Agreement, or the Purchase Agreement. Upon the closing of this transaction, or the Agrifos Acquisition, Agrifos became a wholly owned subsidiary of RNP and its name changed to Rentech Nitrogen Pasadena Holdings, LLC. Rentech Nitrogen Pasadena Holdings, LLC owns all of the member interests in RNPLLC, which owns and operates the Pasadena Facility.
Our Pasadena Facility is located on an 85 acre site located on the Houston Ship Channel which includes 2,700 linear feet of water frontage and two deep-water docks. The property also includes 415 acres of land, which contains phosphogypsum stacks. In early 2011 prior to our ownership, the Pasadena Facility ceased production of diammonium phosphate and monoammonium phosphate. Agrifos undertook major capital and maintenance projects at the Pasadena Facility, including decommissioning certain phosphate production assets, and converting a portion of the Pasadena Facility’s assets to the production of ammonium sulfate fertilizer. Ammonium sulfate is now the primary product of the Pasadena Facility. Following the conversion, the Pasadena Facility continues to produce sulfuric acid and ammonium thiosulfate.
Our Pasadena Facility is the largest producer of synthetic ammonium sulfate and the third largest producer of ammonium sulfate in North America. We believe that our ammonium sulfate has several characteristics that distinguish it from competing products. In general, the ammonium sulfate that is available for sale in our industry is a byproduct of other processes and does not have certain characteristics valued by customers. Our ammonium sulfate is sized to the specifications preferred by customers and may more easily be blended with other fertilizer products. We also believe that our ammonium sulfate has a longer shelf-life, is more stable and is more easily transported and stored than many other competing products.
15
Table of Contents
In late 2014, we restructured operations at our Pasadena Facility. As part of the restructuring, our Pasadena Facility reduced expected annual production of ammonium sulfate by approximately 25 percent, to 500,000 tons. We intend to sell approximately 70 percent of the 500,000 tons in the domestic market and the remaining tons in New Zealand and Australia, which are the international markets with the highest net prices for ammonium sulfate. Our sales plan eliminates historically low-margin sales to Brazil, other than modest amounts expected during peak seasons when higher margins may be achievable. Our restructuring plan provides us the flexibility to increase ammonium sulfate production above the 500,000 ton rate, if market conditions are favorable.
We are evaluating opportunities to build terminalling assets on the site of our Pasadena Facility. We do not expect to invest significant amounts of our own capital in such assets, but expect to work with a joint venture partner on any such development.
The following table sets forth our Pasadena Facility’s current rated production capacity for the listed products in tons per day and tons per year, and our product storage capacity.
| Product |
Approximate Production Capacity | Product Storage Capacity |
||||||||||
| Tons /Day | Tons /Year(1) | |||||||||||
| Ammonium sulfate |
2,100 | 693,000 | 60,000 tons | |||||||||
| Sulfuric acid |
1,750 | 638,750 | 27,000 tons | |||||||||
| Ammonium thiosulfate |
220 | 80,300 | 14,000 tons | |||||||||
| (1) | Ammonium sulfate production capacity for the year is based on daily rated production capacity times 330 days given regular required cleanings of the granulator. Actual production, based on the restructuring plan, is expected to be 500,000 tons per year. Sulfuric acid and ammonium thiosulfate production capacities for the year are based on daily rated production capacity times 365 days. The number of actual operating days will vary from year to year. |
The following table sets forth the amount of products produced by, and shipped from, our Pasadena Facility for the years ended December 31, 2014 and 2013 and the period beginning November 1, 2012 (the closing date of the Agrifos Acquisition) through December 31, 2012:
| For the Years Ended December 31, |
For the Period November 1, 2012 Through December 31, |
|||||||||||
| 2014 | 2013 | 2012 | ||||||||||
| (in thousands of tons) | ||||||||||||
| Products Produced |
||||||||||||
| Ammonium sulfate |
522 | 465 | 88 | |||||||||
| Sulfuric acid(1) |
447 | 478 | 69 | |||||||||
| Ammonium thiosulfate |
63 | 60 | 9 | |||||||||
| Products Shipped |
||||||||||||
| Ammonium sulfate |
572 | 428 | 115 | |||||||||
| Sulfuric acid |
112 | 148 | 27 | |||||||||
| Ammonium thiosulfate |
67 | 54 | — | |||||||||
| (1) | Our Pasadena Facility produces sulfuric acid primarily for the production of ammonium sulfate. |
Expansion Projects and Other Significant Capital Projects
In 2014, we substantially completed the power generation project and completed the sulfuric acid converter project at our Pasadena Facility. In the power generation project, we installed a steam turbine/generator set that uses excess steam produced from the sulfuric acid plant at the facility to produce electrical power. We expect that a portion of the power will be used in our Pasadena Facility, reducing electricity expenses, and the remaining power will be sold in the deregulated Texas power market, creating an additional revenue stream. We spent $30.8 million on this project through December 31, 2014. We replaced the sulfuric acid converter for a cost of $16.7 million.
16
Table of Contents
Products
Our Pasadena Facility’s products are applied to many types of crops including soybeans, potatoes, cotton, canola, alfalfa, corn and wheat. Our Pasadena Facility’s product sales are heavily weighted toward sales of ammonium sulfate, which made up 80% or more of our Pasadena Facility’s total revenues for the years ended December 31, 2014 and 2013. Our Pasadena Facility’s products are sold primarily through distribution agreements as described below under “—Marketing and Distribution.”
Ammonium Sulfate. Ammonium sulfate is a solid dual-nutrient fertilizer produced by combining ammonia and sulfuric acid. The sulfur derived from ammonium sulfate is the form of sulfur most available as a nutrient for crops. Our Pasadena Facility produces ammonium sulfate that is sized to the specifications of other nitrogen, phosphate and potash fertilizer products which results in less segregation in blended products. The ammonium sulfate plant at our Pasadena Facility has a current rated capacity of 2,100 tons per day. Our Pasadena Facility has storage capacity for 60,000 tons of ammonium sulfate. In addition, we have an arrangement with Interoceanic Corporation, or IOC, that permits us to store approximately 60,000 tons of ammonium sulfate at IOC-controlled terminals, which are located near end customers of our Pasadena Facility’s ammonium sulfate.
Sulfuric Acid. Sulfuric acid not used for production of ammonium sulfate is sold to third parties. The majority of the sulfuric acid sold by our Pasadena Facility is sold through a distributor to industrial consumers. Our Pasadena Facility has storage capacity for 27,000 tons of sulfuric acid.
Ammonium Thiosulfate. Ammonium thiosulfate is a liquid fertilizer. Ammonium thiosulfate typically is combined with UAN to help increase the efficiency of nitrogen in crops. Our Pasadena Facility has storage capacity for 14,000 tons of ammonium thiosulfate.
Marketing and Distribution
We sell substantially all of our Pasadena Facility’s products through marketing and distribution agreements. Pursuant to an exclusive marketing agreement we have entered into with IOC, IOC has the exclusive right and obligation to market and sell all of our Pasadena Facility’s ammonium sulfate product. Under the marketing agreement, IOC is required to use commercially reasonable efforts to market the product to obtain the most advantageous price. We compensate IOC for transportation and storage costs relating to the ammonium sulfate product it markets through the pricing structure under the marketing agreement. The marketing agreement has a term that ends December 31, 2016, but automatically renews for subsequent one-year periods (unless either party delivers a termination notice to the other party at least 210 days prior to an automatic renewal). The marketing agreement may be terminated prior to its stated term for specified causes. During the years ended December 31, 2014 and 2013, the marketing agreement with IOC accounted for all of our Pasadena Facility’s ammonium sulfate revenues. The ammonium sulfate storage arrangement with IOC currently is not governed by a written contract. We also have marketing and distribution agreements to sell other products that automatically renew for successive one year periods.
Customers
We sell substantially all of the products from our Pasadena Facility to IOC and its other distributors, and do not have direct contact with our distributors’ customers. Our distributors sell a majority of our Pasadena Facility’s products to customers located west of the Mississippi River. Through our distributors, we sold all of our Pasadena Facility’s nitrogen products to customers for agricultural uses during the years ended December 31, 2014 and 2013. Given the nature of our business, and consistent with industry practice, we do not have direct sales contracts for fertilizer products with any of our end customers. The majority of the sulfuric acid our Pasadena Facility sells to its distributor is placed with industrial consumers.
Seasonality and Volatility
Significant seasonal weather factors have affected demand for and timing of deliveries for our Pasadena Facility’s domestic agricultural products. Domestic prices for ammonium sulfate and ammonium thiosulfate normally reach their highest point in the spring, decreasing in the summer, and increasing again in the fall. Sales prices of these products are adjusted seasonally in order to facilitate distribution of the products throughout the year. Sales to Australia, Brazil and New Zealand may partially offset this domestic seasonal pattern because they are in the southern hemisphere. We operate the ammonium sulfate plant at our Pasadena Facility throughout the year to the extent that there is available storage capacity for this product. We manage our storage capacity by distributing the product through IOC to customers in both domestic and offshore markets throughout the year. If storage capacity were to be insufficient, we would be forced to cease or reduce production of the product until storage capacity became available. Our Pasadena Facility’s ammonium sulfate product is delivered to IOC and sold at prevailing market prices. See “Part II — Item 7. Management’s Discussion and Analysis of Financial Condition and Results of Operations.”
Because we sell sulfuric acid through a distributor to industrial consumers, demand for this product generally is constant during the year. Sales of industrial products, such as sulfuric acid, are generally not impacted by seasons and weather. We typically ship sulfuric acid from our Pasadena Facility each month of the year with the majority of the product sold under annual contracts.
17
Table of Contents
Raw Materials
The principal raw materials used to produce nitrogen fertilizer products at our Pasadena Facility are ammonia and sulfur. We purchase ammonia for use at the facility from OCI Beaumont, LLC, or OCI Beaumont. OCI Beaumont operates an ammonia and methanol production facility on the Neches River in Nederland, Texas just outside of Beaumont, Texas. Ammonia pricing is based on a published Tampa, Florida market index that is set on a quarterly basis through negotiations between large industry producers and consumers, or the Tampa Index. The Tampa index is commonly used in annual contracts for both the agricultural and industrial sectors, and is based on the most recent major industry transactions in the Tampa market. Pricing considerations for ammonia incorporate international supply-demand, ocean freight and production factors. An 1,800 short ton ammonia barge delivers ammonia from Beaumont, Texas to our Pasadena Facility, pursuant to a long term lease we entered into with Port Arthur Towing Company. Ammonia purchased and used in production at our Pasadena Facility was 155,000 tons in the year ended December 31, 2014 and 128,000 tons in the year ended December 31, 2013.
We obtain sulfur for our Pasadena Facility primarily by truck from local refineries in the Houston area and, to a lesser extent, by rail car. Major suppliers of sulfur to our Pasadena Facility include refiners, such as Phillips 66 Company, Shell Oil Products U.S. and Valero Energy Corporation. Our contracts with these refiners generally have a term of one year. Once pricing for the first quarter of a year is negotiated, the price then fluctuates up or down each subsequent quarter based on changes to the Tampa Index. Sulfur purchased and used in production at our Pasadena Facility was 194,000 tons in the year ended December 31, 2014 and 172,000 tons in the year ended December 31, 2013.
Transportation
Our Pasadena Facility is located on the Houston Ship Channel with access to various modes of transportation at favorable prices. The facility has two deep-water docks and access to the Mississippi waterway system and key international waterways. The docks at the facility are suitable for loading and unloading bulk or liquid barges with payloads of up to 35,000 tons. The facility is also connected to key domestic railways which permit the efficient, cost-effective distribution of its products west of the Mississippi River. We believe this provides a significant cost advantage relative to producers located on the East Coast that are forced to switch railways when shipping product to this region. Our location on the Houston Ship Channel allows our distributors or us to use low cost barge and vessel transport when selling products and purchasing feedstocks.
Competition
Our Pasadena Facility competes with a number of domestic and foreign producers of nitrogen fertilizer products, many of which are larger than we are and have significantly greater financial and other resources than we do. We believe that customers who purchase the product make purchasing decisions based, in part, on the product’s size and shelf life. The majority of ammonium sulfate produced in North America and globally is generated as a byproduct of another process. We believe that our ammonium sulfate (which we refer to as synthetic ammonium sulfate) is made specifically for fertilizer, is sized to the specifications preferred by customers, is more easily blended with other fertilizer products and is better suited for use in agricultural application equipment. We also believe that our ammonium sulfate has a longer shelf-life, is more stable and is more easily transported and stored than many other competing products. Honeywell International Inc., or Honeywell, the largest producer of ammonium sulfate in the United States is located in Hopewell, Virginia, about 1,350 miles away from our Pasadena Facility. BASF AG, the second largest producer of ammonium sulfate, is located in Freeport, Texas, about 60 miles away from our Pasadena Facility. Our Pasadena Facility has access to transportation at favorable prices, such as low cost barge and vessel. We believe that our close proximity to sources of our primary feedstocks and access to low-cost transportation enables the facility to offer competitive pricing to customers adjacent to and west of the Mississippi River.
We also face competition from numerous regional producers of sulfuric acid, including E. I. du Pont de Nemours and Company located in El Paso and La Porte, Texas and Burnside, Louisiana, Eco Services located in Baytown and Houston, Texas and Chemtrade Logistics Inc., located in Beaumont, Texas.
Growth Plans
We seek to continue to organically expand capacity at our Fertilizer Facilities, although any such expansion projects are likely to be smaller than the ongoing or recently-completed capacity expansions at each facility. We expect any expansion project to require new capital as we do not expect to use our operating cash flow to invest in any new growth projects. Expansion projects involve numerous risks and uncertainties, and there can be no assurance that we will be able to complete any expansion projects on a timely basis or at all.
18
Table of Contents
Environmental Matters
Our business is subject to extensive and frequently changing federal, state and local, environmental, health and safety regulations governing a wide range of matters, including the emission of air pollutants, the release of hazardous substances into the environment, the treatment and discharge of waste water and the storage, handling, use and transportation of our fertilizer products, raw materials, and other substances that are part of our operations. These laws include the Clean Air Act, or the CAA, the federal Water Pollution Control Act, or the Clean Water Act, the Resource Conservation and Recovery Act, or RCRA, the Comprehensive Environmental Response, Compensation and Liability Act, or CERCLA, the Toxic Substances Control Act, or the TSCA, and various other federal, state and local laws and regulations. These laws, their underlying regulatory requirements and the enforcement thereof impact us by imposing:
| • | restrictions on operations or the need to install enhanced or additional controls; |
| • | the need to obtain and comply with permits and authorizations; |
| • | liability for the investigation and remediation of contaminated soil and groundwater at current and former facilities (if any) and off-site waste disposal locations; and |
| • | specifications for the products we market. |
These laws significantly affect our operating activities as well as the level of our operating costs and capital expenditures. Failure to comply with environmental laws, including the permits issued to us thereunder, generally could result in substantial fines, penalties or other sanctions, court orders to install pollution-control equipment, permit revocations and facility shutdowns. The following table shows capital expenditures related to environmental, health and safety at the East Dubuque Facility and the Pasadena Facility:
| For the Years Ended December 31, |
||||||||||||
| 2014 | 2013 | 2012 | ||||||||||
| (in millions) | ||||||||||||
| East Dubuque Facility |
$0.2 | $ | 0.2 | $ | 0.3 | |||||||
| Pasadena Facility |
0.2 | 0.3 | 1.0 | |||||||||
Our operations require numerous permits and authorizations. A decision by a governmental regulator to revoke or substantially modify an existing permit or authorization could have a material adverse effect on our ability to continue operations at the impacted facility. Expansion of our operations is predicated upon obtaining the necessary environmental permits and authorizations. We may experience delays in obtaining or be unable to obtain required permits, which may delay or interrupt our operations and limit our growth and revenue.
In addition, environmental, health and safety laws may impose joint and several liability, without regard to fault, for cleanup of a contaminated site on current owners and operators of the site, former owners and operators of the site at the time of the disposal of the hazardous substances, any person who arranges for the transportation, disposal or treatment of the hazardous substances, and the transporters who select the disposal and treatment facilities, regardless of the care exercised by such persons. Private parties, including the owners of properties adjacent to other facilities where our wastes are taken for disposal, also may have the right to pursue legal actions to enforce compliance as well as to seek damages for non-compliance with environmental laws and regulations or for personal injury or property or natural resource damages. In addition, the risk of accidental spills or releases could expose us to significant liabilities that could have a material adverse effect on our business, financial condition or results of operations.
The laws and regulations to which we are subject are complex, change frequently and have tended to become more stringent over time. The ultimate impact on our business of complying with existing laws and regulations is not always clearly known or determinable due in part to the fact that our operations may change over time and certain implementing regulations for laws, such as the CAA, have not yet been finalized, are under governmental or judicial review or are being revised. These laws and regulations could result in increased capital, operating and compliance costs.
Our facilities have experienced some level of regulatory scrutiny in the past, and we may be subject to further regulatory inspections, future requests for investigation or assertions of liability relating to environmental issues. In the future, we could incur material liabilities or costs related to environmental matters, and these environmental liabilities or costs (including fines or other sanctions) could have a material adverse effect on our results of operations, financial condition and ability to make cash distributions.
19
Table of Contents
Certain environmental regulations and risks associated with our business are outlined below. We strive to maintain compliance with these regulations; however, they are complex and varied, and our operations are heavily regulated, and we may, from time to time, fall out of compliance. For example, the Pasadena Facility may not comply with wastewater and stormwater discharge requirements and solid and hazardous waste requirements. As another example the Illinois Environmental Protection Agency, or the IEPA, alleged that an ammonia release at our East Dubuque Facility violated environmental laws, and we entered into a settlement agreement with the IEPA in August 2013 requiring us to connect a device at the facility to an ammonia safety flare by December 1, 2015.
The Federal Clean Air Act. The CAA and its implementing regulations, as well as the corresponding state laws and regulations that regulate emissions of pollutants into the air, impose permitting and emission control requirements relating to specific air pollutants, as well as the requirement to maintain a risk management program to help prevent accidental releases of certain substances. Standards promulgated pursuant to the CAA may require that we install controls at or make other changes to our facilities. If new controls or changes to operations are needed, the costs could be significant. In addition, failure to comply with the requirements of the CAA and its implementing regulations could result in substantial fines, civil or criminal penalties, or other sanctions.
The regulation of air emissions under the CAA requires that we obtain various construction and operating permits, including Title V air permits and incur capital expenditures for the installation of certain air pollution control devices at our facilities. Measures have been taken to comply with various regulations specific to our operations, such as National Emission Standard for Hazardous Air Pollutants, New Source Performance Standards and New Source Review. We have incurred, and expect to continue to incur, substantial capital expenditures to maintain compliance with these and other air emission regulations that have been promulgated or may be promulgated or revised in the future. As one example, we entered into a consent decree that required us to take action to achieve compliance with the emissions limits and other requirements applicable to our East Dubuque Facility.
In July 2011, we voluntarily began operating what we believe is the first tertiary nitrous oxide, or N2O catalytic converter in the United States on one of our nitric acid plants at our East Dubuque Facility. This converter is designed to convert approximately 90% of the N2O generated in our production of nitric acid into nitrogen and oxygen at that one plant. During the year ended December 31, 2014, 91%, or 331 metric tonnes, of N2O generated by that plant was converted into nitrogen and oxygen. In late December 2013, we installed a N2O abatement catalyst in the other nitric acid plant at our East Dubuque Facility. This catalyst is also designed to convert approximately 90% of the N2O generated in our production of nitric acid into nitrogen and oxygen. During the year ended December 31, 2014, 93%, or 340 metric tonnes, of N2O generated by that plant was converted into nitrogen and oxygen. We monitor and record the reduction in N2O emissions, which is verified by a third party. We have listed the credits on an active registry, such as the Climate Registry maintained by the Climate Action Reserve, and sell the credits for a profit. We have entered into a five-year agreement to supply emission reduction credits with sales totaling $0.5 million for the year ended December 31, 2014 and $0.1 million during each of the years ended December 31, 2013 and 2012.
Release Reporting. The release of hazardous substances or extremely hazardous substances into the environment is subject to release reporting requirements under federal and state environmental laws, including the Emergency Planning and Community Right-to-Know Act. We occasionally experience releases of hazardous or extremely hazardous substances from our operations or properties. We report such releases to the EPA, the IEPA, the Texas Commission on Environmental Quality, and other relevant federal, state and local agencies as required by applicable laws and regulations. If we fail to properly report a release, or if the release violates the law or our permits, it could cause us to become the subject of a governmental enforcement action or third-party claims. Government enforcement or third-party claims relating to releases of hazardous or extremely hazardous substances could result in significant expenditures and liability.
Clean Water Act. The Clean Water Act and analogous state laws impose restrictions and strict controls with respect to the discharge of pollutants, including spills and leaks of oil and other substances, into waters of the United States. The discharge of pollutants into regulated waters is prohibited, except in accordance with the terms of a permit issued by the EPA or an analogous state agency. The Clean Water Act and regulations implemented thereunder also prohibit the discharge of dredge and fill material into regulated waters, including wetlands, unless authorized by an appropriately issued permit. In addition, the Clean Water Act and analogous state laws require individual permits or coverage under general permits for discharges of storm water runoff from certain types of facilities. Spill prevention, control and countermeasure requirements of federal laws require appropriate containment berms and similar structures to help prevent the contamination of navigable waters by a petroleum hydrocarbon tank spill, rupture or leak. Federal and state regulatory agencies can impose administrative, civil and criminal penalties for non-compliance with discharge permits or other requirements of the Clean Water Act and analogous state laws and regulations.
Greenhouse Gas Emissions. Legislative and regulatory measures to address greenhouse gas, or GHG, emissions (including CO2, methane and N2O) are in various phases of discussion or implementation. At the federal legislative level, Congress has previously considered legislation requiring a mandatory reduction of GHG emissions. Although Congressional passage of such legislation does not appear imminent at this time, it could be adopted at a future date. It is also possible that Congress may pass alternative climate change bills that do not mandate a nationwide cap-and-trade program and instead focus on promoting renewable energy and energy efficiency or impose a carbon fee.
20
Table of Contents
Management of Hazardous Substances and Contamination. Under CERCLA and related state laws, certain persons may be liable at sites where or from release or threatened release of hazardous substances has occurred or is threatened. These persons can include the current owner or operator of property where a release or threatened release occurred, any persons who owned or operated the property when the release occurred, and any persons who disposed of, or arranged for the transportation or disposal of, hazardous substances at a contaminated property. Liability under CERCLA is strict, retroactive and, under certain circumstances, joint and several, so that any responsible party may be held liable for the entire cost of investigating and remediating the release of hazardous substances. RCRA regulates the generation, treatment, storage, handling, transportation and disposal of solid waste and requires states to develop programs to ensure the safe disposal of solid waste. Under RCRA, persons may be liable at sites where the past or present storage, handling, treatment, transportation, or disposal of any solid or hazardous waste may present an imminent and substantial endangerment to health or the environment. These persons can include the current owner or operator of property where disposal occurred, any persons who owned or operated the property when the disposal occurred, and any persons who disposed of, or arranged for the transportation or disposal of, hazardous substances at a contaminated property. Liability under RCRA is strict and, under certain circumstances, joint and several, so that any responsible party may be held liable for the entire cost of investigating and remediating the release of hazardous substances. As is the case with all companies engaged in similar industries, depending on the underlying facts and circumstances we face potential exposure from future claims and lawsuits involving environmental matters, including soil and water contamination, personal injury or property damage allegedly caused by hazardous substances that we manufactured, handled, used, stored, transported, spilled, disposed of or released. We cannot assure you that we will not become involved in future proceedings related to our release of hazardous or extremely hazardous substances or that, if we were held responsible for damages in any existing or future proceedings, such costs would be covered by insurance or would not be material. For a discussion of hazardous substances management at the Pasadena Facility, see the risk factor captioned “There are phosphogypsum stacks located at the Pasadena Facility that will require closure. In the event we become financially obligated for the costs of closure, this would have a material adverse effect on our business and cash flow.” For a discussion of releases at the Pasadena Facility, see the risk factor captioned “Soil and groundwater at the Pasadena Facility is pervasively contaminated, and we may incur costs to investigate and remediate known or suspected contamination at the Pasadena Facility. We may also face legal actions or sanctions or incur costs related to contamination or noncompliance with environmental laws at the facility.”
Underground Injection Operations. Underground injection operations are subject to the Safe Drinking Water Act, or SWDA, as well as analogous state laws and regulations. Under the SWDA, the EPA established the underground injection control, or UIC program, which includes requirements for permitting, testing, monitoring, record keeping, and reporting of injection well activities, as well as a prohibition against the migration of fluid containing any contaminant into underground sources of drinking water. ExxonMobil Corporation (a former owner of the Pasadena Facility), or ExxonMobil, operates injection wells located at or surrounded by our Pasadena Facility for the disposal of wastewater related to the phosphogypsum stacks. State regulations require that a permit be obtained from the applicable regulatory agencies to operate underground injection wells. Any leakage from the subsurface portions of the injection wells could cause degradation of fresh groundwater resources, potentially resulting in suspension of ExxonMobil’s UIC permit, which could adversely impact the closure of the phosphogypsum stacks.
Environmental Insurance. We have a premises pollution liability insurance policy which covers third party bodily injury and property damages claims, remediation costs and associated legal defense expenses for pollution conditions at or migrating from our facilities and the transportation risks associated with moving waste from our facilities to offsite locations for unloading or depositing waste. The policy also covers business interruptions and non-owned disposal sites. Our policy is subject to a limit and self-insured retention and contains other terms, exclusions, conditions and limitations that could apply to a particular pollution condition claim, including the closure post closure of the gypsum stacks (the responsibility of ExxonMobil) and we cannot guarantee that a claim will be adequately insured for all potential damages.
Safety, Health and Security Matters
We are subject to a number of federal and state laws and regulations related to safety, including the federal Occupational Safety and Health Act, or OSHA, and comparable state statutes, the purpose of which are to protect the health and safety of workers. Various OSHA standards may apply to our operations, including standards concerning notices of hazards, safety in excavation and demolition work, the handling of asbestos and asbestos-containing materials and worker training and emergency response programs. We also are subject to OSHA Process Safety Management regulations, which are designed to prevent or minimize the consequences of catastrophic releases of toxic, reactive, flammable or explosive chemicals. These regulations apply to any process that involves a chemical at or above the specified thresholds or any process that involves flammable liquid or gas, pressurized tanks, caverns and wells in excess of 10,000 pounds at various locations. We have an internal safety, health and security program designed to monitor and enforce compliance with worker safety requirements. We also are subject to EPA Chemical Accident Prevention Provisions, known as the Risk Management Plan requirements, which are designed to prevent the accidental release of toxic, reactive, flammable or explosive materials, and the United States Coast Guard’s Maritime Security Standards for Facilities, which are designed to regulate the security of high-risk maritime facilities.
21
Table of Contents
Financial Information About Our Business Segments
Financial information about our business segments is provided in Note 22 of our Consolidated Financial Statements in “Part II — Item 8. Financial Statements and Supplementary Data.”
Employees and Labor Relations
As of December 31, 2014, we had 706 non-unionized and salaried employees, and 185 unionized employees. Of these employees, 434 were employed by Fulghum, 81 were employed by NEWP, 66 were employed in Canada by Rentech, and 267 employees were employed by RNP. We believe that we have good relations with our employees. The General Partner has collective bargaining agreements in place covering unionized employees at our East Dubuque Facility and Pasadena Facility. Fulghum has a collective bargaining agreement in place covering unionized employees at one of its mills. The agreement for the East Dubuque Facility expires on October 17, 2016. There are two agreements for the Pasadena Facility. One agreement expires on March 28, 2016 and the other expires on April 30, 2016. The collective bargaining agreement covering unionized employees at one of our Fulghum mills expires on October 31, 2018. We have not experienced work stoppages in the recent past.
Available Information
Our Annual Report on Form 10-K, Quarterly Reports on Form 10-Q, Current Reports on Form 8-K and amendments to those reports are available free of charge as soon as reasonably practical after they are filed or furnished to the SEC, at the “Investor Relations” portion of our website, www.rentechinc.com. Materials we file with the SEC may be read and copied at the SEC’s Public Reference Room at 100 F Street, NE, Washington, D.C. 20549. Information on the operation of the Public Reference Room may be obtained by calling the SEC at 1-800-SEC-0330. The SEC also maintains an Internet website at www.sec.gov that contains reports, proxy and information statements, and other information regarding us that we file electronically with the SEC. The information contained on our website does not constitute part of this report.
Set forth below are certain risk factors related to our business. Actual results could differ materially from those anticipated as a result of these and various other factors, including those set forth in our other periodic and current reports filed with the SEC, from time to time. If any risks or uncertainties develop into an actual event, our business, financial condition, cash flow or results of operations could be materially adversely affected. In that case, the trading price of our common stock could decline and you could lose all or part of your investment.
Risks Related to Our Wood Fibre Processing Business
We face competition from other wood fibre processing businesses.
We have a number of competitors in the wood fibre processing business in the United States and in other countries. Our wood chipping business’s principal competitors include major domestic and foreign biomass supply companies and paper and pulp manufacturers, our industrial wood pellet business’s principal competitors include major domestic and foreign biomass supply companies, and we have a number of competitors in our residential and commercial wood pellet business. Some competitors have greater total resources, or better name recognition, and are less dependent on earnings from those businesses, which make them less vulnerable to industry downturns and better positioned to pursue new expansion and development opportunities. Our competitive position could suffer to the extent that we are not able to adapt or expand our own resources either through investments in new or existing operations or through acquisitions, joint ventures or partnerships. An inability to compete successfully in the wood fibre processing business could result in the loss of customers, which could adversely affect our sales and profitability. In addition, as a result of increased pricing pressures in the wood fibre processing business caused by competition, we may in the future experience reductions in our profit margins on sales, or may be unable to pass future input price increases on to our customers, which would reduce our cash flows.
We have experienced difficulties in constructing our Canadian wood pellet facilities. We may face further difficulties in the future and may not be successful in growing our wood fibre processing businesses.
We have experienced difficulties in completing the construction of the Wawa Project and Atikokan Project, including significant cost overruns and delays. We intend to grow our wood fibre processing businesses organically through these and future projects and through strategic investments, expansion projects and/or acquisitions. However, our success in growing these businesses is subject to various risks, including the other risks described in this report. We cannot assure you that we will be successful and, in the event that we are unable to achieve the growth in these businesses that we desire, this would limit our returns and our ability to realize upon the investments we have made, including through any initial public offering of such businesses. Accordingly, any failure to achieve the growth we intend to achieve in these businesses would have a material adverse effect on our prospects.
22
Table of Contents
We could face significant difficulties in completing the development and commencing operation of the Atikokan Project, the Wawa Project and future projects, which could result in cost overruns and delays. These difficulties could include, among others:
| • | unforeseen engineering problems or unavailability or failure of necessary equipment; |
| • | weather interference; |
| • | increase in development costs and delay due to transporting machinery and equipment, and construction personnel to remote sites; |
| • | increase in development costs due to unfavorable changes in exchange rates between the U.S. dollar and Canadian dollar; |
| • | added expense and time due to potential infrastructure upgrades needed, but currently unknown, at the sites; |
| • | strain on us to properly monitor activities in rural areas outside the United States; |
| • | added expense to us to establish and enforce proper controls and safety procedures at the sites; |
| • | the inability to obtain necessary permits; |
| • | expenditures related to the cost of compliance with environmental, health and safety laws and standards; and |
| • | difficulty in hiring and retaining qualified personnel. |
There can be no assurance that we will be able to complete the development of these projects or future projects on budget and on time. Any failure by us to complete these projects could have a material adverse effect on our business, financial condition, results of operations and cash flows.
In addition, in connection with the Fulghum Acquisition, we and Graanul Invest AS, or Graanul, entered into a joint venture for the potential development and construction of, and investment in, wood pellet facilities in the United States and Canada. Pursuant to the terms of the parties’ Joint Venture Agreement, until the earliest of: (i) May 1, 2018, (ii) the date on which either we or Graanul (together with its respective affiliates) ceases to hold at least 20% of the total interests in the joint venture, and (iii) the date on which the joint venture and its subsidiaries have projects producing an aggregate annual name plate capacity of 1,250,000 metric tons of wood pellets (referred to as the “exclusivity period”), we and our affiliates are prohibited from constructing any new wood pellet mills in the United States or Canada unless we first offer the joint venture the opportunity to construct and own such project. During the exclusivity period, we and our affiliates must also offer Graanul the opportunity to acquire a 50% equity interest of mills we acquire in the United States or Canada. To the extent that the exercise of these rights of first refusal will require negotiation with Graanual regarding the construction or acquisition of wood pellet facilities, these rights of first refusal could complicate, delay or prohibit the successful construction or acquisition of those facilities.
Our acquisition strategy involves significant risks.
One of our business strategies is to pursue acquisitions in our wood fibre processing businesses. However, acquisitions involve numerous risks and uncertainties, including intense competition for suitable acquisition targets, the potential unavailability of financial resources necessary to consummate acquisitions, difficulties in identifying suitable acquisition targets or in completing any transactions identified on sufficiently favorable terms, and the need to obtain regulatory or other governmental approvals that may be necessary to complete acquisitions. In addition, any future acquisitions may entail significant transaction costs, tax consequences and risks associated with entry into new markets and lines of business.
In addition to the risks involved in identifying and completing acquisitions described above, even when acquisitions are completed, integration of acquired entities can involve significant difficulties, such as:
| • | unforeseen difficulties in the acquired operations and disruption of the ongoing operations of our business; |
| • | failure to achieve cost savings or other financial or operating objectives with respect to an acquisition; |
| • | strain on the operational and managerial controls and procedures of our business, and the need to modify systems or to add management resources; |
| • | difficulties in the integration and retention of customers or personnel and the integration and effective deployment of operations or technologies; |
23
Table of Contents
| • | assumption of unknown material liabilities or regulatory non-compliance issues; |
| • | amortization of acquired assets, which would reduce future reported earnings; |
| • | possible adverse short-term effects on our cash flows or operating results; |
| • | diversion of management’s attention from the ongoing operations of our business; and |
| • | the use of cash and other resources for the acquisition that might affect our liquidity, and that could have been used for other purposes. |
Failure to manage wood fibre acquisition growth risks could have a material adverse effect on our results of operations, financial condition and cash flows. There can be no assurance that we will be able to consummate any wood fibre acquisitions, successfully integrate acquired entities, or generate positive cash flow at any acquired company.
Our wood chipping business depends, in significant part, on continued demand from the board, paper, pulp and packaging industry. Any decline in demand for our services from this industry could have a negative impact on us.
Our wood chipping business provides services to manufacturers of boxboard, container board, paper, pulp and similar products. Any decline in the industries in which these manufacturers participate could, in turn, have a negative impact on us. Some of the risks relating to this industry include:
| • | Consumption of writing and printing paper products has declined recently as a result of technological advances and the development of substitutes for paper products. The continuation of this trend could adversely impact our business in Chile and Uruguay that provides a significant amount of services to paper manufacturers; and |
| • | If the price of wood increases, this would negatively impact the businesses of our customers that supply wood to us for processing. Currently, all of our customers in the United States are responsible for the cost of wood used in our operations. |
In the event that our wood chipping business experiences a decline as a result of these factors or otherwise, this would have a material adverse effect on our business, financial condition, results of operations and cash flows.
We have contracted to sell a significant portion of our industrial wood pellets from the Atikokan and Wawa Facilities pursuant to our off-take contracts with Drax and OPG. We expect to sell the remaining portion of our industrial wood pellets from the Atikokan and Wawa Facilities in spot market arrangements rather than through off-take contracts. If either the Drax or OPG contract is terminated, or if market pricing for industrial wood pellets falls substantially, this likely would adversely affect our business, financial condition, results of operations and cash flows.
We have entered into a ten-year off-take contract with Drax under which we are required to sell to Drax the first 400,000 metric tonnes of wood pellets per year produced from our Wawa Facility, and we have entered into a ten-year off-take contract with OPG under which we are required to deliver 45,000 metric tonnes of wood pellets annually. OPG has the option to increase the amount of wood pellets we are required to deliver under the contract to up to 90,000 metric tonnes annually. Under each of the off-take contracts, Drax and OPG have the right to terminate the contracts for specified reasons. For example, under the Drax Contract, in the event of certain changes to legislation in the UK relating to sustainability, each party may require the other to be financially responsible for half of the costs of such change in an amount up to $2.50 per tonne of wood pellets. In the event that the cost of such changes exceeds such cap, then either party may terminate the contract. We expect to sell the remaining portion of our industrial wood pellets from the Atikokan and Wawa Facilities in spot market arrangements rather than through off-take contracts. If either the Drax or OPG contract is terminated, or if market pricing for industrial wood pellets falls substantially, this could adversely affect our business, financial condition, results of operations and cash flows.
Unfavorable changes in exchange rates could adversely affect us.
We are incurring expenses in Canadian dollars, and have contracted to sell a significant portion of our industrial wood pellets pursuant to off-take contracts under which the purchases are priced in Canadian dollars. As a result, we are subject to the effects of changing rates of exchange for the relevant currencies. Both the expenses we incur outside the United States and the value to our shareholders of future profits earned in foreign currencies may be affected by such exchange rates.
For financial statement reporting purposes, we translate the assets and liabilities of our Canadian subsidiaries at the exchange rates in effect on the balance sheet date and translate their costs and expenses at the rates of exchange in effect at the time of the transaction. We include translation gains and losses in the stockholders’ equity section of our balance sheets. We include net gains and losses resulting from foreign exchange transactions in interest and other income in our statements of operations. Since we translate Canadian dollars into United States dollars for financial reporting purposes, currency fluctuations can have an impact on our financial results. Although the impact of currency fluctuations on our financial results has generally been immaterial in the past there can be no guarantee that the impact of currency fluctuations will not be material in the future.
We may not be able to successfully negotiate industrial wood pellet off-take contracts in the future.
In connection with future industrial wood pellet projects, we expect to enter into long-term off-take contracts for the sale of wood pellets. However, there is no guarantee that we will be able to successfully negotiate off-take contracts on acceptable terms. Our ability to proceed with future wood pellet projects likely will depend on our ability to enter into off-take contracts for those projects. As a result, in the event that we are not able to enter into an off-take contract on satisfactory terms, this may prevent us from proceeding with the project and, in turn, materially adversely affect our business and growth prospects.
We have entered into various contracts relating to our Atikokan and Wawa Facilities, which will require us to pay penalties if we do not comply with their terms.
Under the Drax Contract, we are required to sell to Drax the first 400,000 metric tonnes of wood pellets per year produced from our Wawa Facility and, under the OPG contract, we are required to sell to OPG up to 90,000 metric tonnes of wood pellets per year. In the event that we do not deliver wood pellets as required under the contracts, we will be required to pay an amount equal to
24
Table of Contents
the difference between the contract price for the wood pellets and the price of any wood pellets purchased in replacement. For 2014, we did not meet the contracted delivery schedule under the Drax Contract. We have amended the Drax Contract to cancel all wood pellet deliveries that were due in 2014 and to reduce the required volume of wood pellets to be delivered to Drax in 2015 to 240,000 tonnes from 360,000 tonnes. In exchange for the cancelled deliveries and reduced volume commitments, we paid Drax a penalty of approximately $170,000 and expect to provide price concessions in the amount of $0.9 million on shipments made to Drax in 2015. In the event such shipments are not made, the price reductions will become cash penalties payable to Drax, in addition to other penalties that may be due under the Drax Contract for such failed deliveries. In addition, 72,000 tonnes of the original 2015 deliveries are being deferred to future years at 2015 pricing, which is expected to be lower than the pricing under the terms of the contract in those future years. In addition, each contract contains certain quality requirements, the failure of which to satisfy would give Drax or OPG the right to reject the wood pellets and to return them to us at our cost. We also have entered into a contract with Canadian National Railway Company for rail transportation of wood pellets from our Atikokan and Wawa Facilities to the Port of Quebec for delivery to Drax. Under the contract, we committed to transport a minimum of 1,500 rail carloads during the year ended December 31, 2014, and 3,600 rail carloads annually thereafter for the duration of the contract. For 2014, we did not meet the minimum requirements and, therefore, we are required to pay $0.5 million to Canadian National Railway Company. If we do not meet these commitments again in the future, we would be required to pay a penalty equal to $1,000 per rail car. We have entered into a lease agreement with TrinityRail Canada, Inc. under which we have committed to lease the required rail cars needed to satisfy our transportation requirements under the Drax Contract. Accordingly, in the event that we do not meet the commitments under the contracts described above, we will be required to pay penalties and other damages resulting from our failure to perform, which would adversely affect our financial condition, results of operations and cash flows.
We will rely primarily on Crown Fibre from the Government of Ontario for our feedstock needs at our wood pellet facilities in Canada. In the event that we lose the right to Crown Fibre or we are otherwise unable to secure adequate supplies of wood fibre on acceptable terms, this would likely materially adversely affect operations at our Canadian wood pellet facilities.
We will use primarily Crown Fibre for our wood pellet facilities in Canada. Generally, obtaining Crown Fibre is a two-step process. First, the Government of Ontario must agree to make fibre available to us. At the Wawa Facility, we expect this will be achieved via multiple one to two year forest resource licenses. We expect to employ a similar strategy at our Atikokan Facility, except that we intend to enter into an Agreement for the Supply of Crown Forest Resources in the near term pursuant to which the Government of Ontario would make available to us 279,400 cubic meters of Crown Fibre annually for a 10 year term. There is no guarantee that the Government of Ontario will enter into or renew forest resource licenses as they expire. Further, there is no guarantee in the forest resource licenses or the Agreement for the Supply of Crown Forest Resources that the volumes contemplated therein will actually be available and the Government of Ontario reserves broad rights to modify and terminate such licenses and agreements.
The second step of our process for obtaining Crown Fibre is to enter into agreements with private parties that have existing rights over the forests from which the Government of Ontario has agreed to make Crown Fibre available to us. We expect that these agreements will provide us with the right to access and harvest or purchase the Crown Fibre made available to us by the Government of Ontario. While the private parties are statutorily required to make fibre available to parties such as us, the terms on which they make the fibre available may not be economical to us. As a result, we cannot assure you that will enter into such agreements on satisfactory terms or at all.
If the Government of Ontario ceases to make fibre available to us or we are unable to obtain the right to access and harvest or purchase Crown Fibre from the private parties on acceptable terms, we may attempt to make open market purchases of wood fibre to satisfy the feedstock needs for our Canadian wood pellet facilities. However, there is no guarantee that we would be able to secure a sufficient supply of wood fibre on acceptable terms or at all. If we are unable to secure adequate supplies of wood fibre on acceptable terms, this would likely have a material adverse effect on our business, financial condition, results of operations, and cash flows.
We expect to depend on third parties to deliver and harvest the timber we process at, and to transport the finished wood pellets from, our wood pellet facilities in Canada.
We expect to contract with independent harvesting companies to harvest and deliver timber to our Atikokan and Wawa Facilities. Under the contracts, we expect that the harvesting companies will be responsible for all elements of harvesting and transporting timber to our wood pellet facilities in Canada, including but not limited to building haul roads, surveying, scarification and block layout. The harvesting companies’ ability to timely deliver timber to our facilities could be adversely impacted by various factors, including but not limited to the inability to build necessary roads on time, employee strikes, weather conditions or traffic accidents. In the event that the harvesting companies fail to deliver timber to our facilities on a timely basis, this would hinder our ability to produce wood pellets and, in turn, would materially adversely affect our business, financial condition, results of operations and cash flows.
In connection with the delivery of finished wood pellets to Drax at the Port of Quebec, we have entered into (i) the Canadian National Contract for all rail transportation of wood pellets from the Atikokan Facility and the Wawa Facility to the Port of Quebec and (ii) a contract with QSL for our exclusive use of pellet storage domes and loading services at the Port of Quebec. The Atikokan Facility is located 1,300 track miles, and the Wawa Facility is located 1,100 track miles, from the Port of Quebec. In the event that either Canadian National or QSL fails to perform its respective obligations under the applicable contract, this could hinder, delay or prevent our ability to meet our contractual obligations with respect to delivery of wood pellets to Drax and, in turn, could materially adversely affect our business, financial condition, results of operations and cash flows.
25
Table of Contents
The energy industry is highly competitive. Our wood pellet businesses may not successfully compete with other forms of energy.
Our wood pellet businesses will face intense competition from well-established, conventional forms of energy, including petroleum, coal and natural gas. These forms of energy are abundant and widely accepted by consumers, and we may not be able to successfully compete with them. If we complete wood pellet projects and the price of these competing fuels declines as a result of the discovery of new deposits of oil, gas or coal or otherwise, this likely would weaken demand for our wood pellet products. Our wood pellet projects also will compete with other forms of renewable energy, many of which are developing and could attain greater market acceptance than electricity generated from wood pellets. Any failure of our wood pellet businesses to successfully compete with other forms of energy could have a material adverse effect on our business, financial condition, results of operations and cash flows.
The demand for industrial wood pellets is dependent, in significant part, on government regulations over which we have no control.
The demand for industrial wood pellets for energy production is driven, in significant part, by governmental policies and incentives. For example, the European Union, or EU, has adopted legislation that includes certain climate and energy targets for the EU known as the “20-20-20 target.” This legislation aims to achieve the following targets by 2020: (i) a 20% reduction in EU greenhouse gas emissions from 1990 levels; (ii) an increase in the share of EU energy consumption produced from renewable resources to 20%; and (iii) a 20% improvement in the EU’s energy efficiency. The European Commission also has adopted the Communication “Energy Roadmap 2050” renewing its commitment to reduce greenhouse gas emissions to 80 to 95% below 1990 levels by 2050. As part of the Energy Roadmap 2050, the European Commission released the 2030 policy framework for climate and energy, which targets to reduce EU domestic greenhouse gas emissions by 40% below the 1990 level by 2030 and to increase the share of renewable energy consumption to at least 27% by 2030. The UK has been an early adopter of these policies. The UK has adopted legislation targeting a reduction in its greenhouse gas emissions by 80% of 1990 levels by 2050. Through the launch of the Renewable Heat Incentive, the UK has also introduced a new payment system for the generation of heat from renewable sources. Moreover, the “Renewables Obligation” imposed by the UK in 2002 requires all electricity suppliers licensed in the UK to source a specified and annually increasing proportion of electricity from eligible renewable resources, or such suppliers will face a penalty. Under current law, the Renewables Obligation will remain in place through 2037. Some electricity suppliers are transitioning from more traditional fuel such as coal, which cost less than wood pellets, to using wood pellets as a feedstock to comply with this legislation and to receive the related incentives. These transitions would not occur in the absence of such legislation and related incentives. In the event that any of these or other similar governmental policies and incentives are modified or withdrawn, the demand for wood pellets would likely decrease significantly. Any such change in government policies could have a material adverse effect on our business, financial condition, results of operations and cash flows.
Our wood fibre processing business is subject to environmental laws and regulations. We expect that the cost of compliance with these laws and regulations will increase over time, and we could become subject to material environmental liabilities.
Our wood fibre processing business is subject to federal, state and local environmental, health and safety regulations governing the emission and release of hazardous substances into the environment and the treatment and discharge of waste water and the storage, handling, use and transportation of hazardous substances. These laws may include, in the United States, the CAA, the Clean Water Act, RCRA, CERCLA, TSCA, and various other federal, state and local laws and regulations, and other laws in Canada and other jurisdictions. Violations of these laws and regulations could result in substantial penalties, injunctive orders compelling installation of additional controls, civil and criminal sanctions, permit revocations or facility shutdowns. In addition, new environmental laws and regulations, new interpretations of existing laws and regulations, increased governmental enforcement of laws and regulations or other developments could require us to make additional expenditures. These expenditures or costs for environmental compliance could have a material adverse effect on our business, financial condition, results of operations and cash flows.
Our operations require permits and authorizations. Failure to comply with these permits or environmental laws generally could result in substantial fines, penalties or other sanctions, court orders to install pollution-control equipment, permit revocations and facility shutdowns. We may experience delays in obtaining or be unable to obtain required permits, which may delay or interrupt our operations and limit our growth and revenue.
Our business, and the real property on which it is operated, also is subject to spills, discharges or other releases of hazardous substances into the environment. We could be held liable for past or future releases at or migrating beneath the real property where we have operated, or the real property currently or formerly owned or leased by us, even if we did not cause the release or own, operate or lease the real property when the release occurred. Past or future spills related to our facilities or transportation of products or hazardous substances from our facilities may give rise to liability (including strict liability, or liability without fault, and potential clean-up responsibility) to governmental entities or private parties under federal, state or local environmental laws, as well as under common law. For example, we could be held strictly liable under CERCLA, for past or future spills without regard to fault or whether our actions were in
26
Table of Contents
compliance with the law at the time of the spills. Pursuant to CERCLA and similar state statutes, we could be held liable for contamination associated with our facilities, facilities we formerly owned or operated (if any) and facilities to which we transported or arranged for the transportation of wastes or by-products containing hazardous substances for treatment, storage or disposal. The potential penalties and clean-up costs for past or future releases or spills, liability to third parties for damage to their property or exposure to hazardous substances, or the need to address newly discovered information or conditions that may require response actions could be significant and could have a material adverse effect on our financial condition and results of operations.
Our operations outside the United States may be adversely affected by the operation of laws in those jurisdictions.
Our operations in non-United States jurisdictions are subject to the laws of the jurisdictions in which they operate. Laws in some jurisdictions differ in significant respects from those in the United States, and these differences can affect our ability to react to changes in our business and our rights or ability to enforce rights may be different than would be expected under United States law. Moreover, enforcement of laws in some overseas jurisdictions can be inconsistent and unpredictable, which can affect both our ability to enforce our rights and to undertake activities that we believe are beneficial to our business. As a result, our ability to generate revenue and our expenses in non-United States jurisdictions may differ from what would be expected if United States law governed these operations.
Our wood fibre processing and sales operations in Chile and Uruguay face additional risks.
Fulghum has four wood processing mills in Chile and one in Uruguay. We also sell wood chips and biomass fuel in Chile. Our operations in Chile and Uruguay expose us to the following risks:
| • | We purchase wood to support the export of chips from Chile. As a result, this business is subject to risks related to the supply and cost of wood. See “Part II — Item 7A. Quantitative and Qualitative Disclosures about Market Risk — Commodity Price Risk” included in this report. |
| • | Because they are located in locations more distant to us than our operations in the United States, we may have greater difficulty overseeing manufacturing operations at our wood processing mills in Chile and Uruguay. |
| • | If an adverse change in local, political, economic, social or labor conditions, or tax or other laws, occurs in Chile or Uruguay, our operations in those countries could be adversely impacted. |
| • | We may have greater difficulty hiring personnel needed to oversee our operations in Chile and Uruguay. |
| • | Our operations in Chile and Uruguay could expose us to risks relating to longer payment cycles, increased credit risk, higher levels of payment fraud or unfavorable changes in foreign currency exchange rates. |
| • | Our operations in Chile and Uruguay could expose us to risks relating to foreign laws and legal systems, some of which are still developing. |
| • | Our operations in Chile and Uruguay could expose us to risks relating to different employee/employer relationships, existence of workers’ councils and labor unions and other challenges caused by distance, language and cultural differences. |
If any of these risks materialize or worsen, this could have a material adverse effect on our business, financial condition, results of operations and cash flows.
Weather conditions could adversely affect the results of operations and financial condition of our wood pellet business. In addition, NEWP’s business is seasonal, and events occurring during seasons in which revenues for this business are typically higher may disproportionately affect our results of operations and financial condition.
Adverse weather conditions could negatively impact sales of NEWP’s wood pellets and the processing of our industrial, residential and commercial wood pellets. Weather conditions generally have an impact on the demand for wood pellets. Because NEWP supplies distributors whose customers depend on heating fuel during the winter, warmer-than-normal temperatures during the first and fourth calendar quarters in one or more regions in which NEWP operates can decrease the total volume we sell and the gross margin realized on those sales. Warmer temperatures in the Northeast could have a particularly adverse impact on sales, since almost all of NEWP’s wood pellets are consumed in that region. A reduction in the total volume we sell or in the gross margin we realize on such sales would negatively impact our business, financial condition and results of operations. To accommodate the seasonality in sales, NEWP typically builds inventory during the months of March through August, which increases its working capital requirements during those months of the year. As a result of the seasonality in its business, NEWP’s revenues, results of operations and net working capital will vary from quarter to quarter.
27
Table of Contents
In addition, colder weather during the winter months could adversely impact our ability to process and pelletize wood for our industrial and residential wood pellet facilities. Weather and weather changes have an impact on our production efficiencies. Colder weather during winter months may adversely impact the processing of wood (particle sizing and drying) prior to pelletizing. Significant moisture from rain and snow may also adversely impact the drying of wood and increase the costs of drying wood fuel. Production process changes such as moisture content, particle sizing, and pelletizing die size may be needed when weather climate conditions change, all of which may adversely affect the processing and pelletizing of wood. A decrease in production efficiencies would increase our production costs. A reduction in the gross margin we realize on such sales would negatively impact our business, financial condition and results of operations.
We may not be able to integrate NEWP and Allegheny Pellet Corp. into our operations successfully.
In May 2014, we are acquired all of the outstanding equity of NEWP, and in January 2015, NEWP acquired the assets of Allegheny Pellet Corporation, which consists of a wood pellet processing facility located in Youngsville, Pennsylvania. We could face significant difficulties in integrating these businesses into our operations. These difficulties could include:
| • | unforeseen difficulties in the acquired operations and disruption of the ongoing operations of our business; |
| • | failure to achieve financial or operating objectives with respect to these acquisitions; |
| • | strain on the operational and managerial controls and procedures of our business, and the need to modify systems or to add management resources; |
| • | difficulties in the integration and retention of customers or personnel and the integration and effective deployment of operations or technologies; |
| • | assumption of unknown material liabilities or regulatory non-compliance issues; |
| • | difficulties in the integration of financial reporting systems, which could cause a delay in the issuance of, or impact the reliability of our financial statements; |
| • | failure to comply with Section 404 of the Sarbanes-Oxley Act of 2002, including a delay in or failure to successfully integrate these businesses into our internal control over financial reporting; |
| • | amortization of acquired assets, which would reduce future reported earnings; |
| • | possible adverse effects on our consolidated cash flows or operating results; and |
| • | expenditures related to the cost of compliance with environmental, health and safety laws and standards. |
There can be no assurance that we will be able to integrate these businesses into our operations successfully. Any failure by us to integrate these businesses into our operations could have a material adverse effect on our business, financial condition, results of operations and cash flows.
We are dependent upon the personnel we acquired from the Fulghum and NEWP acquisitions, the loss of whom could adversely affect our business.
Because efficient wood processing requires skilled employees, we depend on the services of the personnel that we acquired through the Fulghum and NEWP acquisitions. Since we have only recently acquired our wood processing business, we may not have sufficient experience or knowledge regarding the operations of this industry without these personnel. As a result, we may be dependent upon the expertise of these personnel to operate the assets or business successfully. If these personnel quit, retire or otherwise cease to be employed by us and we are unable to locate or hire qualified replacements, or if the cost to locate and hire qualified replacements for these employees increases materially, our business, financial condition and results of operations could be adversely affected.
28
Table of Contents
Due to our dependence on significant customers in our residential and commercial wood pellet business, the loss of one or more of such significant customers could adversely affect our results of operations.
NEWP depends on significant customers, and the loss of one or several of such significant customers may have a material adverse effect on its results of operations and financial condition. In the aggregate, NEWP’s top two big-box retailers, Home Depot and Lowe’s Home Improvement, represented about 40% of NEWP’s total sales for the year ended December 31, 2014. As is typical in the wood pellet industry, NEWP’s sales to big-box retailers are primarily made on a purchase order basis, and NEWP generally does not have long-term orders or commitments from our big-box retailers. As a result, we are limited in our ability to predict the level of future sales or commitments from our current customers. If our sales to any of our significant customers were to decline, we may not be able to find other customers to purchase the excess supply of NEWP’s products. The loss of one or several of our significant customers of our wood pellet products, or a significant reduction in purchase volume by any of them, could have a material adverse effect on our results of operation and financial condition.
Risks Related to Our Nitrogen Fertilizer Business
Our nitrogen fertilizer operations may become unprofitable and may require substantial working capital financing.
In recent years, our nitrogen fertilizer business has generated positive income from operations and positive cash flow from operations. However, in the past, we sustained losses and negative cash flow from operations. Our profits and cash flow are subject to changes in the prices for our products and our main inputs, natural gas, ammonia and sulfur, which are commodities, and, as such, the prices can be volatile in response to numerous factors outside of our control. For example, during the year ended December 31, 2014, the market prices for ammonia and sulfur increased at a faster rate than the increase in prices for our ammonium sulfate and sulfur acid products. As a result, our Pasadena Facility had to write-down $6.0 million of ammonium sulfate inventory to market value, which contributed to a gross loss at the Pasadena Facility for the year. Further, our profits depend on maintaining high rates of production of our products, and interruptions in operations at the Fertilizer Facilities, could materially adversely affect our profitability. In the fourth quarter of 2013, we experienced disruptions at both of our Fertilizer Facilities. The Pasadena Facility underwent a turnaround in December 2013, which lasted longer than anticipated due to issues with a contractor and weather delays, and experienced several relatively small disruptions in production that, in the aggregate, negatively impacted production in 2013. The East Dubuque Facility also experienced a turnaround and a fire, which halted the production of all products in late November and for most of December 2013. These events significantly contributed to a substantial decrease in sales volume in ammonia and UAN sales between the years ended 31, 2013 and 2012. If we are not able to operate the Fertilizer Facilities at a profit or if we are not able to retain cash or access a sufficient amount of financing for working capital for our nitrogen fertilizer operations, our business, financial condition, cash flow and results of operations could be materially adversely affected, which could adversely affect the trading price of our common stock.
The nitrogen fertilizer business and nitrogen fertilizer prices are seasonal, cyclical and highly volatile and have experienced substantial and sudden downturns in the past. Currently, nitrogen fertilizer demand is at a relative high point and could decrease significantly in the future. Cycles in demand and pricing could potentially expose us to significant fluctuations in our operating and financial results and expose you to material reductions in the trading price of our common stock.
We are exposed to fluctuations in nitrogen fertilizer demand and prices in the agricultural industry. These fluctuations historically have had, and could in the future have, significant effects on prices across all nitrogen fertilizer products and, in turn, our financial condition, cash flow and results of operations, which could result in significant volatility or material reductions in the price of our common stock.
Nitrogen fertilizer products are commodities, the prices of which can be highly volatile. The price of nitrogen fertilizer products depends on a number of factors, including general economic conditions, cyclical trends in end-user markets, supply and demand imbalances, the prices of natural gas, ammonia, sulfur and other raw materials, the prices of other commodities such as corn, soybeans, potatoes, cotton, canola, alfalfa and wheat, and weather conditions, all of which have a greater relevance because of the seasonal nature of fertilizer application. If seasonal demand exceeds the projections on which we base production, our customers may acquire nitrogen fertilizer products from our competitors, and our profitability will be negatively impacted. If seasonal demand is less than we expect, we will be left with excess inventory for which we have limited storage capacity and that will have to be stored or liquidated, which could adversely affect our operating margins.
Demand for nitrogen fertilizer products is dependent on demand for crop nutrients by the global agricultural industry. In recent years, nitrogen fertilizer products have been in high demand, driven by a growing world population, changes in dietary habits and an expanded production of corn. Supply is affected by available capacity and operating rates of nitrogen producers, raw material costs, government policies and global trade. Our results of operations in any year could be negatively impacted by these factors. For example, RNP’s results for the year ended December 31, 2014 were heavily affected by significant unanticipated declines in nitrogen prices. During the year ended December 31, 2014, fertilizer prices fell due to weather factors, reduced expectations for corn acreage in
29
Table of Contents
2015 and increased volumes of urea exported from China. A significant or prolonged decrease in nitrogen fertilizer prices would have a material adverse effect on our business and cash flow. Further, the margins on the sale of ammonium sulfate fertilizer products are currently lower than the margins on our other main nitrogen fertilizer products. If our costs to produce ammonium sulfate fertilizer products increase and the prices at which RNPLLC sells these products do not correspondingly increase, our profits from the sale of these products may decrease or we may suffer losses on these sales. For example, during the year ended December 31, 2014, our Pasadena Facility suffered a gross loss due to lower ammonium sulfate sales prices, a write-down of inventory and other factors. A significant or prolonged decrease in profits (or increase in losses) on the sale of our ammonium sulfate fertilizer products would have a material adverse effect on our business and cash flow.
Any decline in United States agricultural production or crop prices or limitations on the use of nitrogen fertilizer for agricultural purposes could have a material adverse effect on the market for nitrogen fertilizer, and on our results of operations and financial condition.
Conditions in the United States agricultural industry significantly impact our operating results. This is particularly the case in the production of corn, which is a major driver of the demand for nitrogen fertilizer products in the United States. The United States agricultural industry in general, and the production and prices of corn in particular, can be affected by a number of factors, including weather patterns and soil conditions, current and projected grain inventories and prices, domestic and international supply of and demand for United States agricultural products and United States and foreign policies regarding trade in agricultural products. Prices for these agricultural products can decrease suddenly and significantly.
State and federal governmental regulations and policies, including farm and biofuel subsidies and commodity support programs, as well as the prices of fertilizer products, may also directly or indirectly influence the number of acres planted, the mix of crops planted and the use of fertilizers for particular agricultural applications. Developments in crop technology, such as nitrogen fixation, the conversion of atmospheric nitrogen into compounds that plants can assimilate, could also reduce the use of chemical fertilizers and adversely affect the demand for nitrogen fertilizer. In addition, from time to time various state legislatures have considered limitations on the use and application of chemical fertilizers due to concerns about the impact of these products on the environment. The adoption or enforcement of such regulations could adversely affect the demand for and prices of nitrogen fertilizers, which could adversely affect our results of operations and cash flows.
A major factor underlying the current high level of demand for our nitrogen-based fertilizer products is the expanding production of ethanol. A decrease in ethanol production, an increase in ethanol imports or a shift away from corn as a principal raw material used to produce ethanol could have a material adverse effect on our results of operations and financial condition.
A major factor underlying the current level of demand for corn and the use of nitrogen fertilizer products is the current production level of ethanol in the United States. Ethanol production in the United States is dependent in part upon a myriad of federal and state incentives. Such incentive programs may not be renewed, or if renewed, they may be renewed on terms significantly less favorable to ethanol producers than current incentive programs. Studies showing that expanded ethanol production may increase the level of GHGs in the environment, or other factors, may reduce political support for ethanol production. The EPA has proposed reducing 2014 renewable blending mandates, which could reduce the level of corn-based ethanol to be blended into the nation’s gasoline supply. If the target for use of renewable fuels such as ethanol is reduced, the demand for corn may fall significantly. Moreover, the current trend in ethanol production research is to develop an efficient method of producing ethanol from cellulose-based biomass. If another ethanol-related subsidy is not implemented, or if an efficient method of producing ethanol from cellulose-based biomass is developed and commercially deployed at scale, the demand for corn may decrease significantly. Any reduction in the demand for corn and, in turn, for nitrogen fertilizer products could have a material adverse effect on our results of operations and financial condition.
We face intense competition from other nitrogen fertilizer producers.
We have a number of competitors in the nitrogen fertilizer business in the United States and in other countries, including state-owned and government-subsidized entities. Our East Dubuque Facility’s principal competitors include domestic and foreign fertilizer producers, major grain companies and independent distributors and brokers, including Koch, CF Industries, Agrium, Gavilon, LLC, CHS Inc., Transammonia, Inc., OCI and Helm Fertilizer Corp. Our Pasadena Facility’s principal competitors include domestic and foreign fertilizer producers and independent distributors and brokers, including BASF AG, Honeywell, Agrium, Royal DSM N.V., Dakota Gasification Company and Martin Midstream Partners L.P. and producers of nitrogen fertilizer in China.
30
Table of Contents
Some competitors have greater total resources, or better name recognition, and are less dependent on earnings from fertilizer sales, which make them less vulnerable to industry downturns and better positioned to pursue new expansion and development opportunities. For example, certain of our East Dubuque Facility’s nitrogen fertilizer competitors have recently expanded production capacity for their nitrogen fertilizer products. Furthermore, a few dormant nitrogen production facilities located outside of the East Dubuque Facility’s core market have recently resumed operations. The additional capacity has placed downward pressure on average sales prices for ammonia and UAN. Moreover, we may face additional competition due to further expansion of facilities that are currently operating and the reopening of currently dormant facilities. Also, other producers of nitrogen fertilizer products are contemplating the construction of new nitrogen fertilizer facilities in North America, including in the Mid Corn Belt. For example, OCI has announced that it is constructing a facility located 165 miles away from our East Dubuque Facility that is designed to produce between 1.5 to 2.0 million metric tons per year of ammonia, urea, UAN and diesel exhaust fluid. The facility is expected to begin production in late 2015. If a new nitrogen fertilizer facility is completed in the East Dubuque Facility’s core market, it could benefit from the same competitive advantage associated with the location of the facility. As a result, the completion of such a facility could have a material adverse effect on our business and cash flow.
Many of our competitors in the nitrogen fertilizer business incur greater costs than we and our customers do in transporting their products over longer distances via rail, ships, barges and pipelines. There can be no assurance that our competitors’ transportation costs will not decline or that additional pipelines will not be built in the future, lowering the price at which our competitors can sell their products, which could have a material adverse effect on our results of operations and financial condition.
Our competitive position could also suffer to the extent that we are not able to adapt our nitrogen fertilizer product mix to meet the needs of our customers or expand our own resources either through investments in new or existing operations or through joint ventures or partnerships. An inability to compete successfully in the nitrogen fertilizer business could result in the loss of customers, which could adversely affect our sales and profitability. In addition, as a result of increased pricing pressures in the nitrogen fertilizer business caused by competition, we may in the future experience reductions in our profit margins on sales, or may be unable to pass future input price increases on to our customers, which would reduce our cash flows. For example, higher exports of ammonium sulfate from China during 2014 put downward pressure on ammonium sulfate prices, and prices for ammonia and sulfur, key inputs for ammonium sulfate, increased significantly. The factors together negatively impacted product margins for ammonium sulfate.
Our nitrogen fertilizer business is seasonal, which may result in our carrying significant amounts of inventory and seasonal variations in working capital. Our inability to predict future seasonal nitrogen fertilizer demand accurately may result in excess inventory or product shortages.
Our nitrogen fertilizer business is highly seasonal. Historically, most of the annual deliveries of the products from our East Dubuque Facility have occurred during the quarters ending June 30 and December 31 of each year due to the condensed nature of the spring planting season and the fall harvest in the East Dubuque Facility’s market. Farmers in that market tend to apply nitrogen fertilizer during two short application periods, one in the spring and the other in the fall. Since interim period operating results reflect the seasonal nature of our nitrogen fertilizer business, they are not indicative of results expected for the full fiscal year. In addition, results for comparable quarters can vary significantly from one year to the next due primarily to weather-related shifts in planting schedules and purchase patterns of our customers. We expect to incur substantial expenditures for fixed costs throughout the year and substantial expenditures for inventory in advance of the spring planting season and fall harvest season in our East Dubuque Facility’s market as we build inventories during these low demand periods. Seasonality also relates to the limited windows of opportunity that nitrogen fertilizer customers have to complete required tasks at each stage of crop cultivation. Should events such as adverse weather or production or transportation interruptions occur during these seasonal windows, we would face the possibility of reduced revenue without the opportunity to recover until the following season. In addition, an adverse weather pattern affecting one of our markets could have a material adverse effect on the demand for our nitrogen fertilizer products and our revenues, and we may not have sufficient geographic diversity in our customer base to mitigate such effects. Because of the seasonality of agriculture, we also expect to face the risk of significant inventory carrying costs should our customers’ activities be curtailed during their normal seasons. The seasonality can negatively impact accounts receivable collections and increase bad debts. In addition, variations in the proportion of product sold through forward sales and variances in the terms and timing of prepaid contracts can affect working capital requirements and increase the seasonal and year-to-year volatility of our cash flow.
If seasonal demand for nitrogen fertilizer exceeds our projections, we will not have enough product and our customers may acquire products from our competitors. If seasonal demand is less than we expect, we will be left with excess inventory and higher working capital and liquidity requirements. The degree of seasonality of our business can change significantly from year to year due to conditions in the agricultural industry and other factors.
31
Table of Contents
The market for natural gas has been volatile. Natural gas prices are currently at a relative low point. An increase in natural gas prices could impact our relative competitive position when compared to other foreign and domestic nitrogen fertilizer producers, and if prices for natural gas increase significantly, we may not be able to economically operate our East Dubuque Facility.
The operation of our East Dubuque Facility with natural gas as the primary feedstock exposes us to market risk due to increases in natural gas prices, particularly if the price of natural gas in the United States were to become higher than the price of natural gas outside the United States. An increase in natural gas prices would impact our East Dubuque Facility’s operations by making us less competitive with competitors who do not use natural gas as their primary feedstock, and would therefore have a material adverse impact on the trading price of our common stock. In addition, if natural gas prices in the United States were to increase relative to prices of natural gas paid by foreign nitrogen fertilizer producers, this may negatively affect our competitive position in the Mid Corn Belt region and thus have a material adverse effect on our results of operations, financial condition and cash flows.
The profitability of operating our East Dubuque Facility is significantly dependent on the cost of natural gas, and our East Dubuque Facility has operated in the past, and may operate in the future, at a net loss. Local factors may affect the price of natural gas available to us, in addition to factors that determine the benchmark prices of natural gas. Since we expect to purchase a substantial portion of our natural gas for use in our East Dubuque Facility on the spot market, we remain susceptible to fluctuations in the price of natural gas in general and in local markets in particular. We also expect to use short-term, fixed supply, fixed price forward purchase contracts to lock in pricing for a portion of our natural gas requirements. Our ability to enter into forward purchase contracts is dependent upon our creditworthiness and, in the event of a deterioration in our credit, counterparties could refuse to enter into forward purchase contracts on acceptable terms. If we are unable to enter into forward purchase contracts for the supply of natural gas, we would need to purchase natural gas on the spot market, which would impair our ability to hedge our exposure to risk from fluctuations in natural gas prices. If we fix the price of natural gas with forward purchase contracts, and natural gas prices decrease, then our cost of sales could be higher than it would have been in the absence of the forward purchase contracts. However, forward purchase contracts may not protect us from all of the increases in natural gas prices. A hypothetical increase of $0.10 per MMBtu of natural gas would increase our cost to produce one ton of ammonia by $3.30. Higher than anticipated costs for the catalyst and other materials used at our East Dubuque Facility could also adversely affect operating results. These increased costs could materially and adversely affect our results of operations and financial condition.
Any interruption in the supply of natural gas to our East Dubuque Facility through Nicor could have a material adverse effect on our results of operations and financial condition.
Our East Dubuque operations depend on the availability of natural gas. We have an agreement with Nicor pursuant to which we access natural gas from the ANR and Northern Natural Gas pipelines. Our access to satisfactory supplies of natural gas through Nicor could be disrupted due to a number of causes, including volume limitations under the agreement, pipeline malfunctions, service interruptions, mechanical failures or other reasons. The agreement extends for five consecutive periods of 12 months each, with the first period having commenced on November 1, 2010 and the last period ending October 31, 2015. For each period, Nicor may establish a bidding period during which we may match the best bid received by Nicor for the natural gas capacity provided under the agreement. We could be out-bid for any of the remaining periods under the agreement. In addition, upon expiration of the last period, we may be unable to renew the agreement on satisfactory terms, or at all. Any disruption in the supply of natural gas to our East Dubuque Facility could restrict our ability to continue to make products at the facility. In the event we needed to obtain natural gas from another source, we would need to build a new connection from that source to our East Dubuque Facility and negotiate related easement rights, which would be costly, disruptive and/or unfeasible. As a result, any interruption in the supply of natural gas through Nicor could have a material adverse effect on our results of operations and financial condition.
The markets for ammonia and sulfur have been volatile. If prices for either ammonia or sulfur increase or decrease significantly, we may not be able to economically operate our Pasadena Facility.
The operation of our Pasadena Facility with ammonia and sulfur as its primary feedstocks also exposes us to market risk due to increases in ammonia or sulfur prices. Since we expect to purchase a substantial portion of our ammonia and sulfur for use in our Pasadena Facility on the spot market we remain susceptible to fluctuations in the respective prices of ammonia and sulfur. The margins on the sale of ammonium sulfate fertilizer products are relatively low. If our costs to produce ammonium sulfate fertilizer products increase and the prices at which we sell these products do not correspondingly increase, our profits from the sale of these products may decrease or we may suffer losses on these sales. A hypothetical increase of $10.00 per ton of ammonia would increase the cost to produce one ton of ammonium sulfate by $2.50. A hypothetical increase of $10.00 per ton of sulfur would also increase the cost to produce one ton of ammonium sulfate by $2.50. We do not believe that there is any significant opportunity to reduce the costs of these inputs through hedging.
32
Table of Contents
During the year ended December 31, 2014, the prices paid by our Pasadena Facility for ammonia and sulfur increased substantially, which increased our costs of inputs, but the prices of our products did not rise at the same rate. As a result, during the year ended December 31, 2014, we had significant amounts of inventory at costs representing input costs higher than the current market price for our products, and we incurred an approximate $6.0 million write-down of ammonium sulfate inventory. Market prices for ammonia and sulfur products may continue to remain low, which could have a material adverse effect on our results of operations and financial condition.
The success of our ammonium sulfate fertilizer business depends on our ability to improve product sales and margins and to reduce cost at the Pasadena Facility.
Our ammonium sulfate fertilizer business has a limited operating history upon which its business and products can be evaluated. The Pasadena Facility produced phosphate fertilizer until early 2011 when it underwent a conversion to produce ammonium sulfate fertilizer products. In late 2014, we restructured operations at our Pasadena Facility, including to reduce expected annual production of ammonium sulfate by approximately 25 percent, to 500,000 tons. Because our ammonium sulfate fertilizer business has a limited operating history, we may not be able to effectively:
| • | maintain product quality, product sales prices, margins and operating costs at levels that we currently expect; |
| • | achieve production rates and on-stream factor that we currently expect; |
| • | implement potential capital improvements to lower costs and increase revenues at the Pasadena Facility; |
| • | attract and retain customers for our products from our existing production capacity; |
| • | comply with evolving regulatory requirements, including environmental regulations; |
| • | anticipate and adapt to changes in the ammonium sulfate fertilizer market; |
| • | maintain and develop strategic relationships with distributors and suppliers to facilitate the distribution and acquire necessary materials for our products; and |
| • | attract, retain and motivate qualified personnel. |
The operations at the Pasadena Facility are subject to many of the risks inherent in the growth of a new business. The likelihood of the facility’s success must be evaluated in light of the challenges, expenses, difficulties, complications and delays frequently encountered in the operation of a new business. Moreover, the sales prices for ammonium sulfate have significantly worsened and remain low. We cannot assure you that we will achieve the goals set forth above or any goals we may set in the future. Our failure to meet any of these goals could have a material adverse effect on our business and cash flow.
We have recorded goodwill impairment charges and recorded write-downs of finished goods and raw material inventories with respect to our Pasadena Facility, and we could be required to record additional material impairment charges and write-downs in the future.
During 2014, we lowered our profitability expectations for the Pasadena Facility primarily due to lower projected market prices for ammonium sulfate. As a result, during the year ended December 31, 2014, we recorded a goodwill impairment charge of $27.2 million relating to the Agrifos Acquisition, and we incurred an approximate $6.0 million write-down of ammonium sulfate inventory. The future profitability of our Pasadena Facility will be significantly affected by, among other things, nitrogen fertilizer product prices and the prices of the inputs to its production processes. It is possible that adverse changes to supply and demand factors relating to the Pasadena Facility’s nitrogen fertilizer products could require us to lower further our expectations for the profitability of the facility in the future. If this were to occur, we could be required to record additional material impairment charges, including with respect to impairment of long-lived assets, and additional write-downs, which could have a material adverse effect on our results of operations, the trading price of our common stock and our reputation.
There are phosphogypsum stacks located at the Pasadena Facility that will require closure. In the event we become financially obligated for the costs of closure, this would have a material adverse effect on our business and cash flow.
The Pasadena Facility was used for phosphoric acid production until 2011, which resulted in the creation of a number of phosphogypsum stacks at the Pasadena Facility. Phosphogypsum stacks are composed of the mineral processing waste that is the byproduct of the extraction of phosphorous from mineral ores. Certain of the stacks also have been or are used for other waste materials and wastewater. Applicable environmental laws extensively regulate phosphogypsum stacks.
The EPA reached a CAFO with ExxonMobil in September 2010 making ExxonMobil responsible for closure of the stacks, proper disposal of process wastewater related to the stacks and other expenses. In addition, the asset purchase agreement between a subsidiary of Agrifos and ExxonMobil, or the 1998 APA, pursuant to which the subsidiary purchased the Pasadena Facility in 1998 also makes ExxonMobil liable for closure and post-closure care of the stacks, with certain limitations relating to use of the stacks after the date of the agreement. ExxonMobil is in the process of closing the “south stack” (a large phosphogypsum stack that combines “stacks 2, 3 and 5”) and “stack 4” at the facility. ExxonMobil has not yet started closure of “stack 1” at the facility, which is the only remaining stack that is currently in use for disposal of waste streams. Although ExxonMobil has expended significant funds and
33
Table of Contents
resources relating to the closures, we cannot assure you that ExxonMobil will remain able and willing to complete closure and post-closure care of the stacks in the future, including as a result of actions taken by Agrifos prior to the closing of the Agrifos Acquisition. As of January 2012, ExxonMobil estimated that its total outstanding costs associated with the closures and long-term maintenance, monitoring and care of the stacks will be $102 million over the next 50 years. However, the actual amount of such costs could be in excess of this amount.
As discussed above, the costs of closure and post-closure care of the stacks will be substantial. If we become financially responsible for the costs of closure of the stacks, this would have a material adverse effect on our business and cash flow.
Soil and groundwater at the Pasadena Facility is pervasively contaminated, and we may incur costs to investigate and remediate known or suspected contamination at the Pasadena Facility. We may also face legal actions or sanctions or incur costs related to contamination or noncompliance with environmental laws at the facility.
The soil and groundwater at the Pasadena Facility is pervasively contaminated. The facility has produced fertilizer since as early as the 1940s, and a large number of spills and releases have occurred at the facility, many of which involved hazardous substances. Furthermore, naturally occurring and other radioactive contaminants have been discovered at the facility in the past, and asbestos-containing materials currently exist at the facility. In the past there have been numerous instances of weather events which have resulted in flooding and releases of hazardous substances from the facility. We cannot assure you that past environmental investigations at the facility were complete, and there may be other contaminants at the facility that have not been detected. Contamination at the Pasadena Facility has the potential to result in toxic tort, property damage, personal injury and natural resources damages claims or other lawsuits. Further, regulators may require investigation and remediation at the facility in the future at significant expense.
ExxonMobil submitted Affected Property Assessment Reports, or APARs, under the Texas Risk Reduction Program to the Texas Commission on Environmental Quality, or the TCEQ, beginning in 2011 for the plant site and phosphogypsum stacks at the Pasadena Facility. The APARs identify instances in which various regulatory limits for numerous hazardous materials in both the soil and groundwater at the plant site and in the vicinity of the stacks have been exceeded. TCEQ is requiring ExxonMobil to perform significant additional investigative work as part of the APAR process. The TCEQ may also require further remediation of the contamination at the Pasadena Facility. The TCEQ or other regulatory agencies may hold Agrifos or its subsidiaries responsible for certain of the contamination at the Pasadena Facility.
In the past, governmental authorities have alleged or determined that the Pasadena Facility has been in substantial noncompliance with environmental laws and the Pasadena Facility has been the subject of numerous regulatory enforcement actions. The facility has also been subject to a number of past or current governmental enforcement actions, consent agreements, orders, and lawsuits, including, as examples, actions concerning the closure of the phosphogypsum stacks at the facility, the release of process water and wastewater, hydrogen fluoride emissions, emissions of oxides of sulfur, releases of ammonia and other hazardous substances, various alleged Clean Water Act violations, the potential for off-site contamination, and other matters. In the future, we may be required to expend significant funds to attain or maintain compliance with environmental laws. For example, the facility may not comply with wastewater and stormwater discharge requirements and solid and hazardous waste requirements. Following closure of phosphogypsum stack 1 at the facility, we may need to upgrade the facility’s wastewater system and arrange for offsite disposal of wastes that are currently disposed of onsite in order to maintain compliance with environmental laws, and the costs to design, construct, and operate such a system could be material. Regulatory findings of noncompliance could trigger sanctions, including monetary penalties, require installation of control or other equipment or other modifications, adverse permit modifications, the forced curtailment or termination of operations or other adverse impacts.
The costs we may incur in connection with the matters described above could be material. Subject to the terms and conditions of the 1998 APA, we are entitled to indemnification from ExxonMobil for certain losses relating to environmental matters relating to the facility and arising out of conditions present prior to our acquisition of the facility. However, our rights to indemnification under this agreement is subject to important limitations, and we cannot assure you we will be able to obtain payment from ExxonMobil on a timely basis, or at all. Depending on the amount of the costs we may incur for such matters in a given period, this could have a material adverse effect on the results of our business and cash flow.
Due to our lack of diversification, adverse developments in the nitrogen fertilizer industry or at either of our Fertilizer Facilities could adversely affect our results of operations.
We rely primarily on the revenues generated from our two Fertilizer Facilities. An adverse development in the market for nitrogen fertilizer products in our regions generally or at either of our Fertilizer Facilities in particular would have a significantly greater impact on our operations than it would on other companies that are more diversified geographically or that have a more diverse asset and product base. The largest publicly traded companies with which we compete in the nitrogen fertilizer business sell a more diverse range of fertilizer products to broader markets.
34
Table of Contents
Our Fertilizer Facilities face operating hazards and interruptions, including unplanned maintenance or shutdowns. We could face potentially significant costs to the extent these hazards or interruptions cause a material decline in production and are not fully covered by our existing insurance coverage. Insurance companies that currently insure companies in our industry may cease to do so, may change the coverage provided or may substantially increase premiums in the future.
Our nitrogen fertilizer operations are subject to significant operating hazards and interruptions. Any significant curtailing of production at one of the Fertilizer Facilities or individual units within one of the Fertilizer Facilities could result in materially lower levels of revenues and cash flow for the duration of any shutdown. Operations at the Fertilizer Facilities could be curtailed or partially or completely shut down, temporarily or permanently, as the result of a number of circumstances, most of which are not within our control, such as:
| • | unplanned maintenance or catastrophic events such as a major accident or fire, damage by severe weather, flooding or other natural disaster: |
| • | labor difficulties that result in a work stoppage or slowdown; |
| • | environmental proceedings or other litigation that compel the cessation of all or a portion of the operations at one of our Fertilizer Facilities; |
| • | increasingly stringent environmental and emission regulations; |
| • | a disruption in the supply of natural gas to our East Dubuque Facility or ammonia or sulfur to our Pasadena Facility; and |
| • | a governmental ban or other limitation on the use of nitrogen fertilizer products, either generally or specifically those manufactured at our Fertilizer Facilities. |
The magnitude of the effect on us of any unplanned shutdown will depend on the length of the shutdown and the extent of the operations affected by the shutdown.
Our East Dubuque Facility has been in operation since 1965. Our Pasadena Facility has been in operation producing various products since the 1940s. In 2011, the Pasadena Facility was converted to the production of high-quality granulated synthetic ammonium sulfate, and began selling ammonium sulfate and ammonium thiosulfate as its primary products. Historically, our East Dubuque Facility and Pasadena Facility have required a planned maintenance turnaround every two years. Starting with our planned maintenance turnaround in 2016, our East Dubuque Facility will have a planned maintenance turnaround every three years. Turnarounds at our East Dubuque Facility generally last between 18 and 25 days, and turnarounds at our Pasadena Facility generally last between 14 and 25 days. We intend to alternate the year in which a turnaround occurs at each facility, so that both facilities do not experience a turnaround in the same year. Upon completion of a facility turnaround, we may face delays and difficulties restarting production at the Fertilizer Facilities. During the fourth quarter of 2013, our East Dubuque Facility halted production due to a turnaround and a fire. Our Pasadena Facility also underwent a turnaround in December of 2013 which lasted longer than anticipated due to issues with a contractor and weather delays. The duration of our turnarounds or other shutdowns, and the impact they have on our operations, have in the past and could in the future materially adversely affect our cash flow in the quarter or quarters in which such turnarounds or shutdowns occur.
A major accident, fire, explosion, flood, severe weather event, terrorist attack or other event also could damage the Fertilizer Facilities or the environment and the surrounding communities or result in injuries or loss of life. Scheduled and unplanned maintenance could reduce our cash flow for the period of time that any portion of the Fertilizer Facilities are not operating.
If we experience significant property damage, business interruption, environmental claims, fines, penalties or other liabilities, our business could be materially adversely affected to the extent the damages or claims exceed the amount of valid and collectible insurance available to us. We are currently insured under our casualty, environmental, property and business interruption insurance policies. The policies are subject to limits, deductibles, and waiting periods and also contain exclusions and conditions that could have a material adverse impact on our ability to receive indemnification thereunder, as well as customary sub-limits for particular types of losses. For example, the current property policies contain specific sub-limits for losses resulting from business interruptions and for damage caused by covered flooding or named windstorms and resulting flooding or storm surge. We are fully exposed to all losses in excess of the applicable limits and sub-limits and for certain losses due to business interruptions.
Under the insurance policies that cover our Pasadena Facility, property exposures are subject to limits, deductibles and waiting periods with respect to insured physical damage and time element occurrences. Catastrophic perils such as named windstorms, floods and storm surges are subject to additional limitations that apply to each occurrence. The policies also contain exclusions and conditions that could have a material adverse impact on our ability to receive indemnification thereunder, as well as customary sub- limits for particular types of losses. For example, the current property policy contains specific sub-limits for losses resulting from business interruption.
35
Table of Contents
Market factors, including but not limited to catastrophic perils that impact the nitrogen fertilizer industry, significant changes in the investment returns of insurance companies, insurance company solvency trends and industry loss ratios and loss trends, can negatively impact the future cost and availability of insurance. There can be no assurance that we will be able to buy and maintain insurance with adequate limits, reasonable pricing terms and conditions or collect from insurance claims that we make.
Our results of operations of our nitrogen fertilizer business are highly dependent upon and fluctuate based upon business and economic conditions and governmental policies affecting the agricultural industry. These factors are outside of our control and may significantly affect our profitability.
Our results of operations of our nitrogen fertilizer business are highly dependent upon business and economic conditions and governmental policies affecting the agricultural industry, which we cannot control. The agricultural products business can be affected by a number of factors. The most important of these factors, for United States markets, are:
| • | weather patterns and field conditions (particularly during periods of traditionally high nitrogen fertilizer consumption); |
| • | quantities of nitrogen fertilizers imported to and exported from North America; |
| • | current and projected grain inventories and prices, which are heavily influenced by United States exports and world-wide grain markets; and |
| • | United States governmental policies, including farm and biofuel policies, which may directly or indirectly influence the number of acres planted, the level of grain inventories, the mix of crops planted or crop prices. |
International market conditions, which are also outside of our control, may also significantly influence our operating results. The international market for nitrogen fertilizers is influenced by such factors as the relative value of the United States dollar and its impact upon the cost of importing nitrogen fertilizers, foreign agricultural policies, the existence of, or changes in, import or foreign currency exchange barriers in certain foreign markets, changes in the hard currency demands of certain countries and other regulatory policies of foreign governments, as well as the laws and policies of the United States affecting foreign trade and investment.
Ammonia can be very volatile and extremely hazardous. Any liability for accidents involving ammonia that cause severe damage to property or injury to the environment and human health could have a material adverse effect on our results of operations and financial condition. In addition, the costs of transporting ammonia could increase significantly in the future.
We produce, process, store, handle, distribute and transport ammonia, which can be very volatile and extremely hazardous. Major accidents or releases involving ammonia could cause severe damage or injury to property, the environment and human health, as well as a possible disruption of supplies and markets. Such an event could result in civil lawsuits, fines, penalties and regulatory enforcement proceedings, all of which could lead to significant liabilities. Any damage to persons, equipment or property or other disruption of our ability to produce or distribute our products could result in a significant decrease in operating revenues and significant additional cost to replace or repair and insure our assets, which could have a material adverse effect on our results of operations and financial condition. We periodically experience releases of ammonia related to leaks from our equipment or error in operation and use of equipment at our Fertilizer Facilities. Similar events may occur in the future.
These circumstances may result in sudden, severe damage or injury to property, the environment and human health. In the event of pollution, we may be held responsible even if we are not at fault and even if we complied with the laws and regulations in effect at the time of the accident. Litigation arising from accidents involving ammonia may result in our being named as a defendant in lawsuits asserting claims for large amounts of damages, which could have a material adverse effect on our results of operations and financial condition. Given the risks inherent in transporting ammonia, the costs of transporting ammonia could increase significantly in the future.
We are subject to risks and uncertainties related to transportation and equipment that are beyond our control and that may have a material adverse effect on our results of operations and financial condition.
Although our customers and distributors generally pick up our nitrogen fertilizer products at our Fertilizer Facilities, we occasionally rely on barge and railroad companies to ship products to our customers and distributors. The availability of these transportation services and related equipment is subject to various hazards, including extreme weather conditions, work stoppages, delays, spills, derailments and other accidents and other operating hazards. For example, barge transport can be impacted by lock closures resulting from inclement weather or surface conditions, including fog, rain, snow, wind, ice, strong currents, floods, droughts and other unplanned natural phenomena, lock malfunction, tow conditions and other conditions. Further, the limited number of towing companies and of barges available for ammonia transport may also impact the availability of transportation for our products. These
36
Table of Contents
transportation services and equipment are also subject to environmental, safety and other regulatory oversight. Due to concerns related to terrorism or accidents, local, state and federal governments could implement new regulations affecting the transportation of our products. In addition, new regulations could be implemented affecting the equipment used to ship products from our Fertilizer Facilities. Any delay in our ability to ship our nitrogen fertilizer products as a result of transportation companies’ failure to operate properly, the implementation of new and more stringent regulatory requirements affecting transportation operations or equipment, or significant increases in the cost of these services or equipment could have a material adverse effect on our results of operations and financial condition.
Our nitrogen fertilizer business is subject to extensive and frequently changing environmental laws and regulations. We expect that the cost of compliance with these laws and regulations will increase over time, and we could become subject to material environmental liabilities.
Our nitrogen fertilizer business is subject to extensive and frequently changing federal, state and local environmental, health and safety regulations governing the emission and release of hazardous substances into the environment, the treatment and discharge of waste water and the storage, handling, use and transportation of our nitrogen fertilizer products. These laws include the CAA, the federal Clean Water Act, the RCRA, CERCLA, the TSCA, and various other federal, state and local laws and regulations. Violations of these laws and regulations could result in substantial penalties, injunctive orders compelling installation of additional controls, civil and criminal sanctions, permit revocations or facility shutdowns. In addition, new environmental laws and regulations, new interpretations of existing laws and regulations, increased governmental enforcement of laws and regulations or other developments could require us to make additional expenditures. Many of these laws and regulations are becoming increasingly stringent, and we expect the cost of compliance with these requirements to increase over time. The ultimate impact on our business of complying with existing laws and regulations is not always clearly known or determinable due in part to the fact that our operations may change over time and certain implementing regulations for laws, such as the CAA, have not yet been finalized, are under governmental or judicial review or are being revised. These expenditures or costs for environmental compliance could have a material adverse effect on our results of operations and financial condition.
Our nitrogen fertilizer operations, as well as expansion of such operations, require numerous permits and authorizations. Failure to obtain, renew, or comply with these permits or environmental laws generally could result in substantial fines, penalties or other sanctions, court orders to install pollution-control equipment, permit revocations and facility shutdowns. We may experience delays in obtaining or be unable to obtain required permits, which may delay or interrupt our operations and limit our growth and revenue. A decision by a government agency to revoke or substantially modify an existing permit or approval could have a material adverse effect on our ability to continue operations and on our business, financial condition and results of operations.
Our nitrogen fertilizer business is subject to accidental spills, discharges or other releases of hazardous substances into the environment. Past or future spills related to our Fertilizer Facilities or transportation of products or hazardous substances from our Fertilizer Facilities may give rise to liability (including strict liability, or liability without fault, and potential cleanup responsibility) to governmental entities or private parties under federal, state or local environmental laws, as well as under common law. For example, we could be held strictly liable under CERCLA, for past or future spills without regard to fault or whether our actions were in compliance with the law at the time of the spills. Pursuant to CERCLA and similar state statutes, we could be held liable for contamination associated with our Fertilizer Facilities, facilities we formerly owned or operated (if any) and facilities to which we transported or arranged for the transportation of wastes or byproducts containing hazardous substances for treatment, storage or disposal. The potential penalties and cleanup costs for past or future releases or spills, liability to third parties for damage to their property or exposure to hazardous substances, or the need to address newly discovered information or conditions that may require response actions could be significant and could have a material adverse effect on our results of operations and financial condition. For a discussion of releases at the Pasadena Facility, see the risk factor captioned “Soil and groundwater at the Pasadena Facility is pervasively contaminated, and we may incur costs to investigate and remediate known or suspected contamination at the Pasadena Facility. We may also face legal actions or sanctions or incur costs related to contamination or noncompliance with environmental laws at the facility.” In addition, limited subsurface investigation indicates the presence of certain contamination at the East Dubuque facility. In the future, we may determine that there are conditions at the East Dubuque Facility that require remediation or other response.
We may incur future costs relating to the off-site disposal of hazardous wastes. Companies that dispose of, or arrange for the transportation or disposal of, hazardous substances at off-site locations may be held jointly and severally liable for the costs of investigation and remediation of contamination at those off-site locations, regardless of fault. We could become involved in litigation or other proceedings involving off-site waste disposal and the damages or costs in any such proceedings could be material.
37
Table of Contents
Environmental laws and regulations on fertilizer end-use and application and numeric nutrient water quality criteria could have a material adverse impact on fertilizer demand in the future.
Future environmental laws and regulations on the end-use and application of fertilizers could cause changes in demand for our nitrogen fertilizer products. In addition, future environmental laws and regulations, or new interpretations of existing laws or regulations, could limit our ability to market and sell such products to end users. From time to time, various state legislatures have proposed bans or other limitations on fertilizer products. In addition, a number of states have adopted or proposed numeric nutrient water quality criteria that could result in decreased demand for our fertilizer products in those states. Any such laws, regulations or interpretations could have a material adverse effect on our results of operations and financial condition.
Climate change laws, regulations, and impacts could have a material adverse effect on our results of operations and financial condition.
Legislative and regulatory measures to address GHG emissions (including CO2, methane and N2O) are in various phases of discussion or implementation. At the federal legislative level, Congress has previously considered legislation requiring a mandatory reduction of GHG emissions. Although Congressional passage of such legislation does not appear imminent at this time, it could be adopted at a future date. It is also possible that Congress may pass alternative climate change bills that do not mandate a nationwide cap-and-trade program and instead focus on promoting renewable energy and energy efficiency or impose a carbon fee.
In the absence of congressional legislation curbing GHG emissions, the EPA is moving ahead administratively under its CAA authority. In October 2009, the EPA finalized a rule requiring certain large emitters of GHGs to inventory and report their GHG emissions to the EPA. In accordance with the rule, we monitor our GHG emissions from our facilities and began reporting the emissions to the EPA annually beginning in September 2011. In December 2009, the EPA finalized its “endangerment finding” that GHG emissions, including CO2, pose a threat to human health and welfare. The finding allows the EPA to regulate GHG emissions as air pollutants under the CAA. The EPA adopted regulations that limit emissions of greenhouse gases from motor vehicles, which then triggered the imposition of CAA construction and operating permit requirements under the Prevention of Significant Deterioration (“PSD”) and Title V permitting programs for certain large stationary sources that are already subject to these requirements due to emissions of conventional, or criteria, pollutants. Facilities that are required to obtain permits for their GHG emissions are required to reduce those emissions using “best available control technology,” or BACT, standards, which are currently being developed on a case-by-case basis. Future modification to one of our facilities may require us to satisfy BACT requirements and potentially require us to meet other CAA requirements applicable to GHG emissions. A number of states also have adopted reporting and mitigation requirements.
The implementation of additional EPA regulations and/or the passage of federal or state climate change legislation would likely increase the costs we incur to (i) operate and maintain our facilities, (ii) install new emission controls on our facilities and (iii) administer and manage any GHG emissions program. Increased costs associated with compliance with any future legislation or regulation of GHG emissions, if it occurs, may have a material adverse effect on our results of operations and financial condition. In addition, climate change legislation and regulations may result in increased costs not only for our nitrogen fertilizer business but also for agricultural producers that utilize our fertilizer products, thereby potentially decreasing demand for our nitrogen fertilizer products. Decreased demand for our nitrogen fertilizer products may have a material adverse effect on our results of operations and financial condition.
Similarly, the impact of potential climate change on our operations and those of our customers is uncertain and could adversely affect us.
Agrium is a distributor and customer of a significant portion of our nitrogen fertilizer products, and we have the right to store products at Agrium’s terminal in Niota, Illinois. Any loss of Agrium as our distributor or customer, loss of our storage rights or decline in sales of products through or to Agrium could materially adversely affect our results of operations and financial condition.
We use Agrium as a distributor of a significant portion of our nitrogen fertilizer products of our East Dubuque Facility pursuant to a distribution agreement between Agrium and us. For the years ended December 31, 2014, 2013 and 2012, 78% or more of our East Dubuque Facility’s total product sales were made through Agrium. Under the distribution agreement, if we are unable to reach an agreement with Agrium for the purchase and sale of our products, Agrium is under no obligation to make such purchase and sale. Agrium sells products that compete with ours, and may be incentivized to prioritize the sale of its products over ours. In the event of any decline in sales of our nitrogen fertilizer products through Agrium as distributor, we may not be able to find buyers for our products.
38
Table of Contents
The distribution agreement has a term that ends in April 2016, but automatically renews for subsequent one-year periods (unless either party delivers a termination notice to the other party at least three months prior to an automatic renewal). The distribution agreement may be terminated prior to its stated term for specified causes. Under the distribution agreement, Agrium bears the credit risk on products sold through Agrium pursuant to the agreement. Agrium also is largely responsible for marketing our nitrogen fertilizer products to customers and the associated expense. As a result, if our distribution agreement with Agrium terminates for any reason, Agrium would no longer bear the credit risk on the sale of any of our products and we would become responsible for all of the marketing costs for such products.
Under the distribution agreement, we have the right to store up to 15,000 tons of ammonia at Agrium’s terminal in Niota, Illinois, and we sell a portion of our ammonia at that terminal. Our right to store ammonia at the terminal expires on June 30, 2016, but automatically renews for successive one year periods, unless we deliver a termination notice to Agrium with respect to such storage rights at least three months prior to an automatic renewal. Our right to use the storage space immediately terminates if the distribution agreement terminates in accordance with its terms. Ammonia storage sites and terminals served by barge on the Mississippi River are controlled primarily by CF Industries, Koch and Agrium, each of which is one of our competitors. If we lose the right to store ammonia at the Niota, Illinois terminal, we may not be able to find suitable replacement storage on acceptable terms, or at all, and we may be forced to reduce production. We also may lose sales to customers that purchase products at the terminal.
In addition to distributing our products, Agrium is also a significant customer of our nitrogen fertilizer products. For the years ended December 31, 2014, 2013 and 2012, 0%, 2% and 2%, respectively, of the total product sales of our nitrogen fertilizer business were to Agrium as a direct customer (rather than a distributor) and 12%, 12% and 9%, respectively, of the total product sales of our nitrogen fertilizer business were to CPS, a controlled affiliate of Agrium. Agrium or CPS could elect to reduce or cease purchasing our nitrogen fertilizer products for a number of reasons, especially if our relationship with Agrium as a distributor were to end. If our sales to Agrium as a direct customer or CPS decline, we may not be able to find other customers to purchase the excess supply of our products.
Sales of our nitrogen fertilizer products through or to Agrium could decline or the distribution agreement or our rights to storage could terminate as a result of a number of causes which are outside of our control. Any loss of Agrium as our distributor or customer, loss of our storage rights or decline in sales of products through Agrium could materially adversely affect our results of operations and financial condition.
IOC is the exclusive distributor of our ammonium sulfate fertilizer. Any loss of IOC as our distributor could materially adversely affect our results of operations and financial condition.
We have a marketing agreement that grants IOC the exclusive right and obligation to market and sell all of our Pasadena Facility’s granular ammonium sulfate. The marketing agreement has a term that ends December 31, 2016, but automatically renews for subsequent one-year periods (unless either party delivers a termination notice to the other party at least 210 days prior to an automatic renewal). The marketing agreement may be terminated prior to its stated term for specified causes. If we are unable to renew our contract with IOC, we may be unable to find buyers for our granular ammonium sulfate. In addition, we have an arrangement with IOC that permits us to store approximately 60,000 tons of ammonium sulfate at IOC-controlled terminals, which are located near end customers of our Pasadena Facility’s ammonium sulfate. This arrangement currently is not governed by a written contract. If we lose the right to store ammonium sulfate at these IOC-controlled terminals, we may not be able to find suitable replacement storage on acceptable terms, or at all, and we may be forced to reduce production. Any loss of IOC as our distributor, loss of our storage rights or decline in sales of products through IOC could materially adversely affect our results of operations and financial condition.
Due to our dependence on significant customers in our nitrogen fertilizer business, the loss of one or more of such significant customers could adversely affect our results of operations.
Our nitrogen fertilizer business depends on significant customers, and the loss of one or several of such significant customers may have a material adverse effect on our results of operations and financial condition. In the aggregate, our top five ammonia customers represented 62%, 57% and 54%, respectively, of our ammonia sales for the years ended December 31, 2014, 2013 and 2012, and our top five UAN customers represented 58%, 59% and 38%, respectively, of our UAN sales for the same periods. For the years ended December 31, 2014, 2013 and 2012, 0%, 2% and 2%, respectively, of the East Dubuque Facility’s total product sales of our nitrogen fertilizer business were to Agrium as a direct customer (rather than a distributor) and 12%, 12% and 9%, respectively, of the East Dubuque Facility’s total product sales of our nitrogen fertilizer business were to CPS, a controlled affiliate of Agrium. During the period beginning November 1, 2012 through December 31, 2014, the marketing agreement with IOC accounted for 100% of our Pasadena Facility’s revenues from the sale of ammonium sulfate. Given the nature of our business, and consistent with industry practice, we generally do not have long-term minimum sales contracts with any of our customers. If our sales to any of our significant customers were to decline, we may not be able to find other customers to purchase the excess supply of our products. The loss of one or several of our significant customers of our nitrogen fertilizer products, or a significant reduction in purchase volume by any of them, could have a material adverse effect on our results of operations and financial condition.
39
Table of Contents
The sale of our products to customers in international markets exposes us to additional risks that could harm our business, operating results, and financial condition.
Our Pasadena Facility’s products are sold through distributors to customers in North America, New Zealand, Australia, Brazil and Thailand, and our distributors could expand sales to additional international markets in the future. In addition to risks described elsewhere in this section, the sale of our products in international markets expose us to other risks, including the following:
| • | changes in local political, economic, social and labor conditions, which may adversely harm our business; |
| • | import and export requirements, tariffs, trade disputes and barriers, and customs classifications that may prevent our distributors from offering our products to a particular market; |
| • | longer payment cycles in some countries, increased credit risk, higher levels of payment fraud, and unfavorable changes in foreign currency exchange rates; |
| • | still developing foreign laws and legal systems; |
| • | uncertainty regarding liability for products, including uncertainty as a result of local laws and lack of legal precedent; |
| • | different employee/employer relationships, existence of workers’ councils and labor unions and other challenges caused by distance, language, and cultural differences, making it harder to do business in certain jurisdictions; and |
| • | natural disasters, military or political conflicts, including war and other hostilities and public health issues and outbreaks. |
In addition, our distributors must comply with complex foreign and United States laws and regulations that apply to international sales and operations. These numerous and sometimes conflicting laws and regulations include internal control and disclosure rules, anti-corruption laws, such as the Foreign Corrupt Practices Act, and other local laws prohibiting corrupt payments to governmental officials, and antitrust and competition regulations, among others. Violations of these laws and regulations could result in fines and penalties, criminal sanctions against our distributors, prohibitions on the conduct of their business and on our ability to offer our products in one or more countries, and could also materially affect our brand, our ability to attract and retain employees, our business and our operating results. Although we have implemented policies and procedures designed to ensure our distributors’ compliance with these laws and regulations, there can be no assurance that our distributors will not violate our policies.
We are largely dependent on our customers and distributors to transport purchased goods from our Fertilizer Facilities because we do not maintain a fleet of trucks or rail cars.
We do not maintain a fleet of trucks and, unlike some of our major competitors, we do not maintain a fleet of rail cars. Our customers and distributors generally are located close to our Fertilizer Facilities and have been willing and able to transport purchased goods from each Fertilizer Facility. In most instances, our customers and distributors purchase products for delivery at the Fertilizer Facility and then arrange and pay to transport them to their final destinations by truck. However, in the future, the transportation needs of our customers and distributors as well as their preferences may change, and those customers and distributors may no longer be willing or able to transport purchased goods from our Fertilizer Facilities. In the event that our competitors are able to transport their products more efficiently or cost effectively than our customers and distributors, those customers and distributors may reduce or cease purchases of our products. If this were to occur, we could be forced to make a substantial investment in a fleet of trucks and/or rail cars to meet the delivery needs of customers and distributors, and this would be expensive and time consuming. We may not be able to obtain transportation capabilities on a timely basis or at all, and our inability to provide transportation for products could have a material adverse effect on our business and cash flow.
We are subject to strict laws and regulations regarding employee and process safety, and failure to comply with these laws and regulations could have a material adverse effect on our results of operations and financial condition.
We are subject to a number of federal and state laws and regulations related to safety, including OSHA and comparable state statutes, the purpose of which are to protect the health and safety of workers. In addition, OSHA requires that we maintain information about hazardous materials used or produced in our nitrogen fertilizer operations and that we provide this information to employees, state and local governmental authorities, and local residents. Failure to comply with OSHA requirements and other related state regulations, including general industry standards, record keeping requirements and monitoring and control of occupational exposure to regulated substances, could have a material adverse effect on our results of operations and financial condition if we are subjected to significant penalties, fines or compliance costs.
40
Table of Contents
Expansion of our nitrogen fertilizer production capacity may change the balance of supply and demand in our markets, and our new products may not achieve market acceptance.
At our East Dubuque Facility, we increased our capacity to produce ammonia and urea and started to produce and sell DEF. Increased production of our existing nitrogen fertilizer products may reduce the selling price for those products as a result of market saturation. We may be required to sell these products at lower prices, or may not be able to sell all of the products we produce. In addition, there can be no assurance that our new products will be well-received or that we will achieve revenues or profitability levels we expect. If we cannot sell our products or are forced to reduce the prices at which we sell them, this could have a material adverse effect on our results of operations and financial condition.
A shortage of skilled labor, together with rising labor costs, could adversely affect our results of operations.
Efficient production of nitrogen fertilizer using modern techniques and equipment requires skilled employees. To the extent that the services of skilled labor becomes unavailable to us for any reason, including as a result of the expiration and non-renewal of our collective bargaining agreement or the retirement of experienced employees from our aging work force, we would be required to hire other personnel. We have a collective bargaining agreement in place covering unionized employees at our East Dubuque Facility which will expire in October 2016. In addition, we have two collective bargaining agreements for our Pasadena Facility. One of these agreements expires on March 28, 2016, and the other will expire on April 30, 2016. Upon expiration, we may be unable to renew the collective bargaining agreements on satisfactory terms or at all. We face hiring competition from our competitors, our customers and other companies operating in our industry, and we may not be able to locate or employ qualified replacements on acceptable terms or at all. If our current skilled employees quit, retire or otherwise cease to be employed by us and we are unable to locate or hire qualified replacements, or if the cost to locate and hire qualified replacements for these employees increases materially, our results of operations could be adversely affected.
Any reduction in RNP’s credit rating could adversely affect our fertilizer business.
Rating agencies regularly evaluate the RNP Notes, and their ratings are based on a number of factors, including RNP’s financial strength as well as factors not entirely within its control, including conditions affecting the fertilizer industry generally. There can be no assurance that the RNP Notes will maintain their current ratings. In September 2014, Standard & Poor’s downgraded the RNP Notes one notch to B-. While this action had little to no detrimental impact on our or RNP’s profitability, borrowing costs, or ability to access the capital markets, future downgrades to the RNP Notes or RNP’s or its credit rating could adversely affect our and RNP’s profitability, borrowing costs, or ability to access the capital markets or otherwise have a negative effect on our and RNP’s results of operations or financial condition. Additionally, a downgrade of the credit rating of any particular security issued by us or RNP could negatively affect the ability of the holders of that security to sell the securities and the prices at which any such securities may be sold.
The GE Credit Agreement, the Indenture governing the RNP Notes and the A&R GSO Credit Agreement contain significant limitations on RNP’s business operations, including RNP’s ability to make distributions to its common unitholders (including us).
On February 12, 2015, we entered into the A&R GSO Credit Agreement, comprised of a $75.0 million term loan and additional potential available borrowing capacity of up to $38.0 million, and we entered into an amendment to the Subscription Agreement, or the Subscription Agreement, with funds managed by or affiliated with GSO Capital Partners LP, or GSO Capital, or the Series E Purchasers. In July 2014, RNP entered into the GE Credit Agreement, comprised of a $50.0 million senior secured revolving credit facility, or the GE Credit Facility. In April 2013, RNP entered into an indenture, or the Indenture, governing the RNP Notes.
The Indenture prohibits RNP from making distributions to its common unitholders (including us) if any Default (except a Reporting Default) or Event of Default (each as defined in the Indenture) exists. In addition, the Indenture contains covenants limiting RNP’s ability to pay distributions to its common unitholders. The covenants apply differently depending on RNP’s Fixed Charge Coverage Ratio (as defined in the Indenture). If the Fixed Charge Coverage Ratio is not less than 1.75 to 1.0, RNP will generally be permitted to make restricted payments, including distributions to its common unitholders, without substantive restriction. If the Fixed Charge Coverage ratio is less than 1.75 to 1.0, RNP will generally be permitted to make restricted payments, including distributions to its common unitholders, up to an aggregate $60.0 million basket plus certain other amounts referred to as “incremental funds” under the Indenture. For the year ended December 31, 2014, RNP’s Fixed Charge Coverage ratio was 3.60 to 1.00.
Under the GE Credit Agreement, in the event that, on a pro forma basis, less than 30% of the commitment amount is available for borrowing on any distribution date, then in order to make a distribution on such date (a) RNP must maintain a first lien leverage ratio no greater than 1.0 to 1 on a pro forma basis and (b) the sum of (i) the undrawn amount under the GE Credit Facility and (ii) cash maintained by RNP and its subsidiaries in collateral deposit accounts must be at least $5 million (after giving effect to the distribution). In addition, before RNP can make distributions, there cannot be any default under the GE Credit Agreement. The GE Credit Agreement also contains a requirement that RNP maintain a first lien leverage ratio not to exceed 1.0 to 1 at the end of each fiscal quarter where less than 30% of the commitment amount is available for drawing under the GE Credit Facility or a default has occurred and is continuing. As of December 31, 2014, the first lien leverage ratio was 0.2 to 1.
41
Table of Contents
We are subject to covenants contained in the agreements governing our indebtedness and preferred stock and may be subject to additional agreements governing other future indebtedness or preferred stock. These covenants restrict our ability to, among other things, incur, assume or permit to exist additional indebtedness, guarantees and other contingent obligations, incur liens, make negative pledges, pay dividends or make other distributions, make payments to our subsidiaries, make certain loans and investments, consolidate, merge or sell all or substantially all of our or RNP’s assets, enter into sale-leaseback transactions and enter into transactions with affiliates. Any failure to comply with these covenants could result in a default under the A&R GSO Credit Agreement, the Subscription Agreement, the GE Credit Agreement or the RNP Notes. Upon a default, unless waived, the lenders under our A&R GSO Credit Agreement or our GE Credit Agreement and holders of our RNP Notes would have all remedies available to a secured lender, including the ability to cause the outstanding amounts of such indebtedness to become due and payable in full, institute foreclosure proceedings against our or RNP’s assets, and force us or RNP into bankruptcy or liquidation.
We may not have sufficient funds to repay the loans under the A&R GSO Credit Agreement or the GE Credit Agreement or to repurchase the RNP Notes or Series E Preferred Stock upon the occurrence of certain “change of control” events relating to RNP.
Upon the occurrence of a certain events defined as a “change of control” under the Subscription Agreement, each of the Series E Purchasers may require us to repurchase some or all of our Series E Preferred Stock at a repurchase price equal to $1,000 per share (as adjusted for any stock splits, stock dividends, recapitalizations or the like), plus all accrued and unpaid dividends thereon. These events would also constitute an event of default under the A&R GSO Credit Agreement, allowing the lenders thereunder to accelerate the loans under the agreement. The definition of a “change of control” for these purposes includes, among other things, the issuance by RNP of any equity interests to any third party (other than equity compensation issued by RNP in the ordinary course of business); provided that a one-time issuance by RNP of no more than two million common units in the aggregate will not be a “change of control” if the board of directors of the general partner of RNP determines in good faith (after consultation with its outside legal counsel) that the failure to make such issuance is inconsistent with the directors’ fiduciary duties under applicable law, as modified by the limited partnership agreement of RNP. For further information regarding these terms, see “Note 25 — Subsequent Events” to the consolidated financial statements included in “Part II—Item 8. Financial Statements and Supplementary Data” in this report.
In addition, upon the occurrence of a change of control of RNP (as defined in the Indenture) each holder of the RNP Notes may require RNP to repurchase some or all of the RNP Notes at a repurchase price equal to 101% of their face amount, plus any accrued and unpaid interest. Further, the occurrence of such a change of control would constitute an event of default under the GE Credit Agreement, allowing the lenders thereunder to accelerate the loans under the agreement.
If a change of control event occurs, we may not have sufficient funds to satisfy our obligations under the A&R GSO Credit Agreement, the Subscription Agreement, the Indenture and/or the GE Credit Agreement. Our failure to satisfy these obligations would be a default under the applicable agreement giving rise to the applicable counterparties’ right to pursue remedies against us. As a result, any failure to meet these obligations would have a material adverse effect on us.
Risks Related to Our Consolidated Business, Liquidity, Financial Condition, and Results of Operations
We have never operated at a profit. If RNP’s current revenue, income or cash flow levels decrease or if we do not become profitable on an ongoing basis, we may be unable to continue our operations.
We have a history of operating losses and have never operated at a profit. From our inception on December 18, 1981 through December 31, 2014, we have an accumulated deficit of $417.3 million. If RNP’s current revenues, income or cash flow levels decrease or if we do not become profitable on an ongoing basis, we may be unable to continue our operations. Ultimately, our ability to remain in business may depend upon earning a profit from our wood fibre processing business and, unless we sell RNP, RNP’s nitrogen fertilizer business. Failure to do so would have a material adverse effect on our financial position, results of operations, cash flows and prospects.
If our cash flow and capital resources are insufficient to fund our debt service obligations, we may be forced to reduce or delay capital expenditures, acquisitions, investments or other business activities, reduce or eliminate future borrowings, sell assets, seek additional capital or restructure or refinance our indebtedness. These alternative measures may not be successful and may not permit us to meet our scheduled debt service obligations. Failure to pay our indebtedness on time would constitute an event of default under the agreements governing our indebtedness, which would give rise to our lenders’ ability to accelerate the obligations under such agreements and seek other remedies against us.
42
Table of Contents
RNP is exploring and evaluating potential strategic alternatives and there can be no assurance that RNP will be successful in identifying, or completing any strategic alternative, that any such strategic alternative will yield additional value for us or that the process will not have an adverse impact on our business.
On February 17, 2015, RNP announced that the General Partner’s board of directors had initiated a process to explore and evaluate potential strategic alternatives for RNP, which may include a sale of RNP, a merger with another party, a sale of some or all of its assets, or another strategic transaction. However, there can be no assurance that the exploration of strategic alternatives will result in the identification or consummation of any transaction. In addition, RNP expects to incur substantial expenses associated with identifying and evaluating potential strategic alternatives. The process of exploring strategic alternatives may be time consuming and disruptive to RNP’s business operations and, if the General Partner is unable to effectively manage the process, RNP’s and our business, financial condition and results of operations could be adversely affected. No decision has been made with respect to any transaction and we cannot assure you that the General Partner will be able to identify and undertake any transaction that allows our shareholders to realize an increase in the value of their stock or provide any guidance on the timing of such action, if any. We also cannot assure you that any potential transaction or other strategic alternative, if identified, evaluated and consummated, will provide greater value to our shareholders than that reflected in the current stock price. Any potential transaction would be dependent upon a number of factors that may be beyond our and RNP’s control, including, among other factors, market conditions, industry trends, the interest of third parties in RNP’s business and the availability of financing to potential buyers on reasonable terms. A transaction to sell all or substantially all of RNP’s assets, including by way of a merger, generally requires the approval of the holders of a majority of RNP’s outstanding common units (including common units held by us). The sale of all or substantially all of Rentech’s assets must be authorized by the affirmative vote of the holders of at least two-thirds of our capital stock then issued and outstanding. We and the General Partner do not intend to comment regarding the evaluation of strategic alternatives until such time as the General Partner’s board of directors has determined the outcome of the process or otherwise has deemed that disclosure is appropriate. As a consequence, perceived uncertainties related to the future of RNP may result in the loss of potential business opportunities and volatility in the market price of our common stock and RNP’s common units and may make it more difficult for RNP to attract and retain qualified personnel and business partners.
A sale of RNP likely would be a change of control as defined in the A&R GSO Credit Agreement and the Subscription Agreement relating to the Series E Preferred Stock. A change of control would trigger the right of the lenders under the A&R GSO Credit Agreement to be repaid and trigger the right of the holders of the Series E Preferred Stock to be repurchased, which could have major effects on our liquidity and/or require us to negotiate settlements with these lenders and holders. For further discussion, see the risk factor captioned “We may not have sufficient funds to repay the loans under the A&R GSO Credit Agreement or the GE Credit Agreement or to repurchase the RNP Notes or Series E Preferred Stock upon the occurrence of certain ‘change of control’ events relating to RNP” in this report.
There are significant risks associated with construction, expansion and other projects that may prevent completion of those projects on budget, on schedule or at all.
We intend to continue to expand our wood fibre processing business through the construction of future wood pellet projects and may undertake additional expansion projects at our Fertilizer Facilities. Projects of the scope and scale we are undertaking or may undertake in the future entail significant risks, including:
| • | unanticipated cost increases; |
| • | unforeseen engineering or environmental problems; |
| • | work stoppages; |
| • | weather interference; |
| • | unavailability or failure of necessary equipment; and |
| • | unavailability of financing on acceptable terms. |
Construction, equipment or staffing problems or difficulties in obtaining any of the requisite licenses, permits and authorizations from regulatory authorities could increase the total cost, delay or prevent the construction or completion of a project. Expansion projects also increase operational risk due to the operation of new equipment and the integration of new equipment into facility operations.
In addition, we cannot assure you that we will have adequate sources of funding to undertake or complete major projects. As a result, we may need to obtain additional debt and/or equity financing to complete such projects. There is no guarantee that we will be able to obtain other debt or equity financing on acceptable terms or at all. Moreover, if we are able to complete these projects, production levels at our facilities may not meet expectations that we have set.
As a result of these factors, we cannot assure you that our projects will commence operations on schedule or at all, that the costs for the projects will not exceed budgeted amounts or that production levels will achieve the expectations that we have set. Failure to complete a project on budget, on schedule or at all or to achieve expected production levels may adversely impact our ability to grow our business.
Any operational disruption at our facilities, as a result of equipment failure, an accident, adverse weather, a natural disaster or another interruption, could result in a reduction of sales volumes and could cause us to incur substantial expenditures. A prolonged disruption could materially affect the cash flow we expect from our facilities, or lead to a default under our debt agreements.
The equipment at our facilities could fail and could be difficult to replace. Our facilities may be subject to significant interruption if they were to experience a major accident or equipment failure, including accidents or equipment failures caused during expansion projects, or if they were damaged by severe weather or natural disaster. Significant shutdowns at our facilities could significantly reduce the amount of product available for sale, which could reduce or eliminate profits and cash flow from our operations. For example, in March 2014, we experienced an operational disruption at one of our wood chipping facilities, and in the fourth quarter of 2013, we experienced operational disruptions at both of our Fertilizer Facilities, which in each case negatively affected our results of operations. In the case of the wood chipping facility, a fire started in the maintenance area during normal welding and grinding operations, and approximately 65% of the facility was lost in the fire, including the entire electrical system. We deployed portable and other temporary chipping systems to supply partial volumes to the facility’s customer while the facility was rebuilt. Construction of a new facility and supporting infrastructure was completed in September 2014. Our East Dubuque Facility halted production due to a fire and operated at reduced rates following its turnaround after the discovery of the need for repairs to the foundation of one of its syngas compressors. Our Pasadena Facility also underwent a turnaround in December 2013, which lasted
43
Table of Contents
longer than anticipated due to issues with a contractor and weather delays. In addition, we are preparing to replace the ammonia synthesis converter at our East Dubuque Facility, which we expect to be completed by the end of 2016. However, if the existing ammonia synthesis converter were to fail or suffer damage prior to completion of its replacement, this could cause a shutdown of our East Dubuque Facility.
Repairs to our facilities could be expensive, and could be so extensive that our facilities could not economically be placed back into service. It has become increasingly difficult to obtain replacement parts for equipment and the unavailability of replacement parts could impede our ability to make repairs to our facilities when needed. We currently maintain property insurance, including business interruption insurance, but we may not have sufficient coverage, or may be unable in the future to obtain sufficient coverage at reasonable costs. A prolonged disruption at our facilities could materially affect the cash flow we expect from our facilities, or lead to a default under our debt agreements. In addition, operations at our Fertilizer Facilities are subject to hazards inherent in chemical processing. Some of those hazards may cause personal injury and loss of life, severe damage to or destruction of property and equipment and environmental damage, and may result in suspension of operations and the imposition of civil or criminal penalties. As a result, operational disruptions at our facilities could materially adversely impact our business, financial condition and results of operations.
Our Chief Executive Officer transition involves significant risks and our ability to successfully manage this transition and other organizational change could impact our business results.
Mr. Forman was elected as our Chief Executive Officer and President on December 9, 2014. He is in the process of assessing our business and refining our strategy and operations. Leadership transitions can be inherently difficult to manage, and an inadequate transition of our CEO may cause disruption to our business, including our relationships with customers. In addition, we continue to execute a number of significant business and organizational changes, including acquisitions, divestitures and workforce optimization projects to support our growth strategies. Successfully managing these changes, including retention of particularly key employees, is critical to our business success. This includes developing organization capabilities in key growth markets where the depth of skilled or experienced employees may be limited and competition for these resources is intense.
We may have to raise substantial additional capital to execute our business plan and, in the event that our current and expected sources of funding are insufficient, to fund working capital and to continue our operations. Competitors with superior access to capital may have a substantial advantage over us.
We would require additional capital to pursue acquisitions of wood chipping or wood pellet businesses, to refinance our existing indebtedness and to pursue additional wood pellet projects. Our competitors who have superior access to capital may have a competitive advantage over us in these activities. In addition, since we have never operated at a profit, we may require additional capital to fund our working capital needs after we have exhausted our current cash on hand if we are unable to operate at a profit in the future. Our failure to raise additional capital when needed would have a material adverse effect on our results of operations, liquidity and cash flows and our ability to execute our business plan.
Changes in ownership of shares of our common stock could result in the loss of our ability to use our net operating losses.
We have accumulated substantial operating losses. For federal and state tax purposes, we may “carry forward” these losses to offset current and future taxable income and thereby reduce our tax liability, subject to certain requirements and restrictions. As of December 31, 2014, we had $176.7 million of federal tax net operating loss carryforwards. We believe our net operating loss carryforwards are an important asset of the Company.
Realization of any benefit from our tax net operating losses is dependent on: (1) our ability to generate future taxable income and (2) the absence of certain future “ownership changes” of our common stock. An “ownership change,” as defined in the applicable federal income tax rules, would place significant limitations, on an annual basis, on the use of such net operating losses to offset any future taxable income we may generate. Such limitations, in conjunction with the net operating loss expiration provisions, could effectively eliminate our ability to use a substantial portion of our net operating losses to offset any future taxable income.
The issuance of shares of our common stock could cause an “ownership change” which would limit our ability to use our net operating losses. Issuances of shares of our common stock that could cause an “ownership change” include the issuance of shares of common stock in financing or strategic transactions or upon future conversion or exercise of outstanding options and warrants.
44
Table of Contents
Execution of our strategy depends, in part, upon the continuing treatment of RNP as a partnership for tax purposes, as well as the continuing ability to obtain partnership treatment for a potential master limited partnership to which we would transfer our wood fibre processing assets.
The present United States federal income tax treatment of publicly traded limited partnerships, including RNP, may be modified by administrative, legislative or judicial interpretation at any time, including on a retroactive basis. For example, from time to time, members of Congress and the President propose and consider substantive changes to the existing United States federal income tax laws that affect publicly traded limited partnerships, including the elimination of the qualifying income exception under Internal Revenue Code Section 7704(d), upon which RNP relies for its treatment as a partnership for United States federal income tax purposes. Any modification to the United States federal income tax laws and interpretations thereof may or may not be retroactively applied and could make it more difficult or impossible to meet the exception for RNP to be treated as a partnership for United States federal income tax purposes. However, we are unable to predict whether any such changes, or other proposals, will ultimately be enacted or, if enacted, whether they will be enacted in their proposed form, or whether they will apply to us. Any such changes could cause a substantial reduction in the value of our common units.
We have identified and disclosed material weaknesses in our internal control over financial reporting, which could, if not remediated, result in material misstatements in our financial statements, adversely affect investor confidence, impair the value of our common stock and increase our cost of raising capital. There is also the risk that additional control weaknesses could be discovered.
Our management identified material weaknesses in our internal control over financial reporting for the fiscal year ended December 31, 2014 relating to (i) the review of the cash flow forecasts used in the accounting for long-lived asset recoverability and goodwill impairment, (ii) the determination of the goodwill impairment charge in accordance with generally accepted accounting principles, and (iii) maintaining documentation supporting management’s review of events and changes in circumstances that indicate it is more likely than not that a goodwill impairment has occurred between annual impairment tests. For a discussion of our internal control over financial reporting and a description of the identified material weaknesses, see “Part II—Item 9A. Controls and Procedures.”
A material weakness is a deficiency, or combination of deficiencies, in internal control over financial reporting, such that there is a reasonable possibility that a material misstatement of the annual or interim financial statements will not be prevented or detected on a timely basis. Although management has implemented, and is continuing to implement, certain procedures to strengthen our internal controls, material weaknesses in our internal control over financial reporting could adversely impact our ability to provide timely and accurate financial information. If we are unsuccessful in implementing or following our remediation plan, or if we discover additional control weaknesses, we may not be able to accurately report our financial condition, results of operations or cash flows or maintain effective internal control over financial reporting. If we are unable to report financial information timely and accurately or to maintain effective disclosure controls and procedures, we could be subject to, among other things, regulatory or enforcement actions by the SEC and NASDAQ, including a delisting from NASDAQ, securities litigation and a general loss of investor confidence, any one of which could adversely affect investor confidence, impair the value of our common stock and increase our cost of raising capital.
Risks Related to the Market for Rentech Common Stock
The issuance of 100,000 shares of our Series E Preferred Stock to certain funds managed by or affiliated with GSO Capital in April 2014 reduces the relative voting power of holders of our common stock, may dilute the ownership of such holders, and may adversely affect the market price of our common stock.
On April 9, 2014, we entered into a Subscription Agreement, or the Subscription Agreement, with funds managed by or affiliated with GSO Capital, or the Series E Purchasers, pursuant to which we sold 100,000 shares of our Series E Convertible Preferred Stock, or the Series E Preferred Stock, to the Series E Purchasers, which is convertible into approximately 16.4% of our outstanding common stock, on an as-converted basis. As holders of our Series E Preferred Stock are entitled to vote, on an as-converted basis, together with holders of our common stock as a single class on all matters submitted to a vote of our common stock holders, the issuance of the Series E Preferred Stock to the Series E Purchasers has effectively reduced the relative voting power of the holders of our common stock.
In addition, conversion of the Series E Preferred Stock to common stock would dilute the ownership interest of existing holders of our common stock, and any sales in the public market of the common stock issuable upon conversion of the Series E Preferred Stock could adversely affect prevailing market prices of our common stock. We have granted the Series E Purchasers registration rights in respect of the shares of Series E Preferred Stock and any shares of common stock issued upon conversion of the Series E Preferred Stock. These registration rights would facilitate the resale of such securities into the public market, and any such resale would increase the number of shares of our common stock available for public trading. Sales by the Series E Purchasers of a substantial number of shares of our common stock in the public market, or the perception that such sales might occur, could have a material adverse effect on the price of our common stock.
The Series E Purchasers may exercise significant influence over us, including through their ability to elect up to two members of our board of directors, or our Board.
As of December 31, 2014, the shares of Series E Preferred Stock owned by the Series E Purchasers represent approximately 16.4% of the voting rights of our common stock, on an as-converted basis. As a result, the Series E Purchasers have the ability to significantly influence the outcome of any matter submitted for the vote of our stockholders. In addition, our articles of incorporation grant certain consent rights to the holders of Series E Preferred Stock in respect of certain actions by us, including (a) issuing any indebtedness directly or indirectly convertible into or exchangeable for any capital stock; (b) redeeming or repurchasing or permitting any of our subsidiaries to redeem or repurchase any shares of any class or series of our capital stock, subject to certain exceptions; and (c) increasing or decreasing the maximum number of directors of our Board to more than ten persons or to less than eight persons, or collectively, the Protective Provisions. The Subscription Agreement also imposes a number of affirmative and negative covenants on us. The Series E Purchasers may have interests that diverge from, or even conflict with, those of our other shareholders. For example, the Series E Purchasers may have an interest in directly or indirectly pursuing acquisitions, divestitures, financings or other transactions that, in their judgment, could enhance their other equity investments, even though such transactions might involve risks to us.
In addition, our articles of incorporation grant the Series E Purchasers certain rights to designate directors to serve on our Board. For so long as the Series E Purchasers and their permitted transferees (i) own at least 85% of the shares of Series E Preferred Stock issued as of the original issue date, the holders of the outstanding shares of Series E Preferred Stock, voting as a separate class, are entitled to elect two individuals to our Board, or (ii) own at least 42.5% of the shares of Series E Preferred Stock issued as of the original issue date, the holders of the outstanding shares of Series E Preferred Stock, voting as a separate class, are entitled to elect one individual to our Board. Under the Subscription Agreement, in addition to the rights under our articles of incorporation, for so long as the Series E Purchasers in the aggregate have record and beneficial ownership of shares of common stock issued upon conversion of the Series E Preferred Stock, or the Conversion Shares, that constitute at least 6% of our outstanding common stock, the Series E Purchasers’ collectively have the right to nominate one person for election to our Board. For so long as the Series E Purchasers in the aggregate have record and beneficial ownership of Conversion Shares that constitute more than 18% of our outstanding common stock and less than 42.5% of the Series E Preferred Stock issued on the date of the Subscription Agreement, the Series E Purchasers collectively are entitled to nominate a total of two nominees for election to our Board. For so long as the Series E Purchasers have the
45
Table of Contents
right to appoint or nominate at least one person to our Board in accordance with the Subscription Agreement, the Series E Purchasers collectively have the right to appoint one observer to our Board who must be reasonably acceptable to us. Notwithstanding the fact that all directors will be subject to fiduciary duties and applicable law, the interests of the directors appointed by the Series E Purchasers may differ from the interests of our security holders as a whole or of our other directors.
The Series E Preferred Stock issued to the Series E Purchasers has rights, preferences and privileges that are not held by, and are preferential to, the rights of our common shareholders. Such preferential rights could adversely affect our liquidity and financial condition, and may result in the interests of the Series E Purchasers differing from those of our common stockholders.
As holders of Series E Preferred Stock, the Series E Purchasers have the right to receive a liquidation preference entitling them to be paid out of our assets available for distribution to shareholders, before any payment may be made to holders of any other class or series of capital stock, an amount equal to the greater of (a) the original issue price plus all unpaid and accumulated dividends thereon (including any amounts accrued and unpaid since the last dividend payment date) of each outstanding share of Series E Preferred Stock held and (b) the amount that such holder would have been entitled to receive upon our liquidation, dissolution and winding up if all outstanding shares of Series E Preferred Stock had been converted into common stock immediately prior to such liquidation, dissolution or winding up.
In addition, dividends on the Series E Preferred Stock accrue and are cumulative, whether or not declared by our Board, at the rate of 4.5% per annum on the sum of the original issue price plus all unpaid accrued and accumulated dividends thereon, whether or not declared by our Board. Moreover, if we declare or pay a cash dividend on our common stock, we are required to declare and pay a dividend on the outstanding shares of Series E Preferred Stock on a pro rata basis with the common stock determined on an as-converted basis.
The holders of our Series E Preferred Stock also have certain redemption rights or put rights, including, but not limited to, upon the earliest of: (a) the seventh anniversary of the original issue date, (b) certain change in control events involving us, (c) a bankruptcy, dissolution, liquidation or the winding up of our affairs, or (d) uncured breach of any of the Protective Provisions, which, if exercised, could require us to repurchase any or all of the outstanding shares of Series E Preferred Stock at their original issue price plus all unpaid accrued and accumulated dividends thereon, including any amounts accrued and unpaid since the last dividend payment date, or the Redemption Price. In the event that we fail to redeem or purchase the Series E Preferred Stock and to pay to the Series E Purchaser the Redemption Price of such shares on the applicable redemption or purchase date, whether or not such payment or redemption is legally permissible or is otherwise prohibited, such Series E Purchaser will have the right, but not obligation, to cause a wholly owned subsidiary of ours, DSHC, LLC, or DSHC, to purchase any or all of the Series E Preferred Stock (other than the Series E Preferred Stock that has been redeemed). In such a case, the purchase price for the Series E Preferred Stock will equal (a) $1,000 per share (as adjusted for stock splits, stock dividends, recapitalizations or similar transactions with respect to the Series E Preferred Stock), plus (b) all accrued and unpaid dividends on such Series E Preferred Stock (including all amounts accrued since the last dividend payment date). DSHC’s obligation is secured by 9,453,314 common units of RNP owned by DSHC.
Our obligations to pay accrued and accumulated dividends, whether or not declared by our Board, to the holders of our Series E Preferred Stock on a pro-rata basis with the common stock when we declare or pay a cash dividend, and to repurchase any and all of the outstanding shares of Series E Preferred Stock under certain circumstances, could impact our liquidity and reduce the amount of cash flows available for working capital, capital expenditures, growth opportunities, acquisitions, and other general corporate purposes. Our obligations to the holders of Series E Preferred Stock could also limit our ability to obtain additional financing or increase our borrowing costs, which could have an adverse effect on our financial condition. The preferential rights could also result in divergent interests between the Series E Purchasers and those of our common shareholders.
We have a substantial overhang of common stock and future sales of our common stock or of securities linked to our common stock may cause substantial dilution and may negatively affect the market price of our shares.
As of December 31, 2014, there were 229.3 million shares of our common stock outstanding. As of that date, we also had an aggregate of 15.7 million shares of common stock that may be issued upon exercise of restricted stock units, options and warrants, and 45.0 million shares of common stock that may be issued upon the conversion of Series E Preferred Stock. In addition, we have one shelf registration statement covering $200.0 million aggregate initial offering price of securities (up to all of which could be issued as shares of common stock) for issuance in future financing transactions. In the event that we acquire companies or assets, we may issue additional shares of stock to acquire those companies or assets.
The sale of common stock and common stock equivalents in material amounts may be necessary to finance the progress of our business plan and operations. Certain future holders of our securities may be granted rights to participate in or to require us to file registration statements with the SEC for resale of common stock.
46
Table of Contents
We cannot predict the effect, if any, that future sales of shares of our common stock into the market, or the availability of shares of common stock for future sale, will have on the market price of our common stock. Sales of substantial amounts of common stock (including shares issued upon the exercise, conversion or exchange of other securities), or the perception that such sales could occur, may materially and adversely affect prevailing market prices for our common stock.
| ITEM 1B. | UNRESOLVED STAFF COMMENTS |
Not Applicable.
| ITEM 2. | PROPERTIES |
Nitrogen Products Manufacturing Segment Properties
The East Dubuque Facility is located on a 210 acre site in the northwest corner of Illinois on a 140-foot bluff above Mile Marker 573 on the Upper Mississippi River. RNLLC owns all of the East Dubuque Facility’s properties and equipment; these include land, roads, buildings, several special purpose structures, equipment, storage tanks, and specialized truck, rail and river barge loading facilities. RNLLC also has 15,000 tons of leased storage tank capacity for ammonia products at Agrium’s terminal in Niota, Illinois.
The Pasadena Facility is located on an 85 acre site located on the Houston Ship Channel which includes 2,700 linear feet of water frontage and two deep-water docks. The property also includes 415 acres of land which contains phosphogypsum stacks. In addition, we have an arrangement with IOC under which we are permitted to store ammonium sulfate at terminals controlled by IOC that are located near end customers of our Pasadena Facility’s ammonium sulfate.
Fulghum Fibres Mills
| Locations – United States |
Number of Properties |
Land(1) |
Buildings/Equipment(1) |
Wood Processing Capacity (GMT) |
||||||||
| Alabama |
3 | 2 Owned; 1 Operated | 2 Owned; 1 Operated | 2,750,000 | ||||||||
| Arkansas |
1 | Leased | Owned | 550,000 | ||||||||
| Florida |
1 | Owned | Owned | 1,350,000 | ||||||||
| Georgia |
11 | (2) | 4 Owned; 5 Leased; 2 Operated | 8 Owned; 3 Operated | 7,550,000 | |||||||
| Louisiana |
3 | 1 Owned; 1 Leased; 1 Operated | 2 Owned; 1 Operated | 3,100,000 | ||||||||
| Maine |
1 | Leased | Owned | 1,250,000 | ||||||||
| Mississippi |
3 | 2 Owned; 1 Leased | 3 Owned | 1,550,000 | ||||||||
| Virginia |
4 | 2 Leased; 2 Operated | 2 Owned; 2 Operated | 1,100,000 | ||||||||
| Locations – South America |
Number of Properties |
Land(1) |
Buildings/Equipment(1) |
Wood Chip Capacity (GMT) |
||||||||
| Chile |
5 | (3) | 2 Owned; 1 Leased; 2 Operated | 3 Owned; 2 Operated | 2,500,000 | |||||||
| Uruguay |
1 | Operated | Operated | 650,000 | ||||||||
| (1) | Generally, under the terms of our processing agreements, customers have the option to purchase the mill equipment for a pre-negotiated amount (which decreases over time) and, in some cases, customers have the option to acquire the land. |
| (2) | One of the mills currently is not operating. |
| (3) | In addition to the four mills in Chile, we also own about 1,400 acres of forestland. |
Wood Pellets: Industrial
The Atikokan Project is located on about a 15 acre site that we own in Atikokan, Ontario, Canada. The Wawa Project is located on a 248 acre site that we own in Wawa, Ontario, Canada.
47
Table of Contents
Wood Pellets: NEWP
| Locations |
Production Capacity Tons (Short Tons) |
Indoor Storage Capacity Tons (Short Tons) |
||||||
| New Hampshire – one facility(1) |
84,000 | 3,000 | ||||||
| New York – two facilities |
160,000 | 33,000 | ||||||
| Pennsylvania – one facility(2) |
38,000 | 2,000 | ||||||
| (1) | At another New Hampshire location, we have an 11,000 square foot fabrication facility where we design, test and build pellet manufacturing equipment and technology. |
| (2) | This facility was acquired in the Allegheny Acquisition. The previous owners operated the facility slightly over four days a week, which resulted in the 38,000 tons of annual production capacity. It is our intent over the next year to ramp up the production to seven days a week, which would result in an annual production capacity of 60,000 tons. |
Office Leases
Our executive offices are located in Los Angeles, California, and consist of 16,600 square feet of leased office space. The lease expires in June 2020. These offices are used by all five of our segments.
Our other principal leased offices are located in Denver, Colorado, and consist of 3,400 square feet of office space. The lease expires in October 2015. These offices are used by all five of our segments. We also have leased offices located in Thunder Bay, Ontario, Canada, which consist of 1,600 square feet of leased office space. The lease expires in August 2015. These offices are used by our Wood Pellets: Industrial segment. Fulghum has leased offices located in Augusta, Georgia, which consist of 7,900 square feet of leased office space. The lease is month-to-month. NEWP leases offices located in Jaffrey, New Hampshire, which consist of 5,200 square feet of office space.
RETC Properties
We own the site located in Commerce City, Colorado, which houses our decommissioned Product Demonstration Unit, or the PDU. The site consists of 17 acres located in an industrial area adjacent to a rail line and an interstate highway. Approximately six acres of the site are occupied by the PDU and our gasifier, and the remaining approximately 11 acres of the site are available for other uses. There is an approximately 12,000 square foot building on that site that was used primarily for laboratory and maintenance functions supporting the PDU. This property was used in our energy technologies segment. We are in the process of attempting to sell the property.
In 2013, we sold our property located in Natchez, Mississippi, or Natchez. We continue to own an approximately 18 mile-long natural gas pipeline that runs from Tensas Parish, Louisiana to the site in Natchez. We are working with the Federal Energy Regulatory Commission to abandon the pipeline.
| ITEM 3. | LEGAL PROCEEDINGS |
In the normal course of business, we are party to litigation from time to time. We maintain insurance to cover certain actions and believe that resolution of our current litigation matters will not have a material adverse effect on us.
We are negotiating a settlement agreement with Region 6 of the Environmental Protection Agency relating to an ammonia release that occurred at our Pasadena Facility on April 20, 2014. We estimate the amount of the penalty required by the settlement agreement to be approximately $0.1 million.
| ITEM 4. | MINE SAFETY DISCLOSURES |
Not Applicable.
48
Table of Contents
PART II
| ITEM 5. | MARKET FOR REGISTRANT’S COMMON EQUITY, RELATED STOCKHOLDER MATTERS AND ISSUER PURCHASES OF EQUITY SECURITIES |
We transferred our listing from the NYSE MKT to the NASDAQ Stock Market, or NASDAQ, effective with the start of trading on August 13, 2013. Our common stock is traded under the symbol “RTK.” The following table sets forth the range of high and low closing prices for our common stock as reported by the applicable market, for each quarterly period during the years ended December 31, 2014 and 2013:
| Year Ended December 31, 2014 |
High | Low | ||||||
| First Quarter, ended March 31, 2014 |
$ | 2.04 | $ | 1.74 | ||||
| Second Quarter, ended June 30, 2014 |
$ | 2.61 | $ | 1.79 | ||||
| Third Quarter, ended September 30, 2014 |
$ | 2.52 | $ | 1.71 | ||||
| Fourth Quarter, ended December 31, 2014 |
$ | 1.73 | $ | 1.13 | ||||
| Year Ended December 31, 2013 |
High | Low | ||||||
| First Quarter, ended March 31, 2013 |
$ | 3.15 | $ | 2.32 | ||||
| Second Quarter, ended June 30, 2013 |
$ | 2.42 | $ | 1.85 | ||||
| Third Quarter, ended September 30, 2013 |
$ | 2.35 | $ | 1.90 | ||||
| Fourth Quarter, ended December 31, 2013 |
$ | 2.20 | $ | 1.59 | ||||
The approximate number of shareholders of record of our common stock as of February 27, 2015 was 430. Based upon the securities position listings maintained for our common stock by registered clearing agencies, we estimate the number of beneficial owners is not less than 18,200.
Until 2012, we had never paid cash dividends on our common stock. On December 27, 2012, we paid a special one-time distribution of $0.19 per common share, which resulted in total distributions in the amount of $43.8 million. We will continue to evaluate from time to time whether additional dividends or distributions are warranted. Any future determination relating to dividend policy will be made at the discretion of our Board and will depend on a number of factors, including our future earnings, capital requirements, investment opportunities, access to capital, financial condition, future prospects, and other factors as our Board may deem relevant.
STOCK PERFORMANCE GRAPH
The following graph and table compare the cumulative total shareholder return on our common stock to those of the Russell 2000 Index, or the Russell 2000, an alternative energy peer group which is the Ardour Global Alternative Energy Index—North America, or the Alternative Energy Peer Group, and two customized peer groups for the 63 months ending December 31, 2014. The first customized peer group of four companies includes: Agrium, CF Industries, Terra Nitrogen Company, L.P., or Terra Nitrogen, and Yara International, or the Old Fertilizer Peer Group. The second customized peer group of four companies includes: Agrium, CF Industries, Terra Nitrogen, and CVR Partners, LP, or CVR Partners, or the New Fertilizer Peer Group. The following graph and table assumes that a $100 investment was made at the close of trading on September 30, 2009 in our common stock and in the index and the peer groups, and that dividends, if any, were reinvested. The stock price performance shown on the graph below should not be considered indicative of future price performance.
Rentech has used the Alternative Energy Peer Group in the past for comparison purposes because Rentech believed that the selected index was more comparable to Rentech’s energy technologies business than other published indexes at the time. However, Rentech decided to exit the energy technologies business, making this comparison no longer appropriate. Rentech also has used the Old Fertilizer Peer Group for comparison purposes because Rentech believed that the selected companies were more comparable to Rentech’s nitrogen fertilizer business than the published indexes at the time. However, CVR Partners, which is a master limited partnership located in the United States, offers a more appropriate comparison than Yara International. The New Fertilizer Peer Group replaces Yara International with CVR Partners. For the periods after December 31, 2014, Rentech has ceased the use of the Old Fertilizer Peer Group and the Alternative Energy Peer Group and instead begun using the New Fertilizer Peer Group for the comparisons to cumulative total return of our common stock. Rentech believes that the New Fertilizer Peer Group will be more comparable to Rentech’s nitrogen fertilizer business than the Old Fertilizer Peer Group.
49
Table of Contents
COMPARISON OF 63 MONTH CUMULATIVE TOTAL RETURN*
Among Rentech, Inc., the Russell 2000 Index,
and Peer Groups
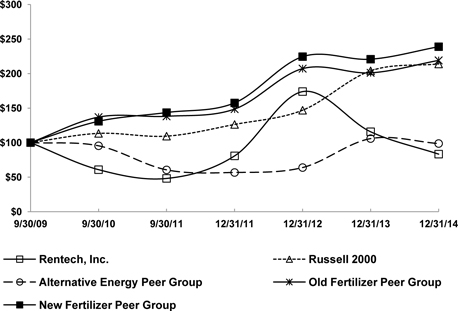
*$100 invested on 9/30/09 in stock or index, including reinvestment of dividends.
| 9/09 | 9/10 | 9/11 | 12/11 | 12/12 | 12/13 | 12/14 | ||||||||||||||||||||||
| Rentech, Inc. |
100.00 | 60.86 | 48.16 | 80.86 | 173.99 | 115.77 | 83.35 | |||||||||||||||||||||
| Russell 2000 |
100.00 | 113.35 | 109.35 | 126.27 | 146.91 | 203.95 | 213.93 | |||||||||||||||||||||
| Alternative Energy Peer Group |
100.00 | 95.43 | 60.54 | 56.74 | 63.89 | 105.88 | 98.71 | |||||||||||||||||||||
| Old Fertilizer Peer Group |
100.00 | 136.92 | 138.10 | 148.57 | 207.16 | 201.07 | 219.09 | |||||||||||||||||||||
| New Fertilizer Peer Group |
100.00 | 130.84 | 143.53 | 157.54 | 224.50 | 220.79 | 238.87 | |||||||||||||||||||||
50
Table of Contents
| ITEM 6. | SELECTED FINANCIAL DATA |
During 2012, our Board approved a change in our fiscal year end from September 30 to December 31. The following tables include selected summary financial data for the years ended December 31, 2014, 2013, 2012 and 2011, the three months ended December 31, 2011 and 2010 and each of the two fiscal years ended September 30, 2011 and 2010. The statement of operations data for the calendar year ended December 31, 2011 was derived by deducting the statement of operations data for the three months ended December 31, 2010 from the statement of operations data for the fiscal year ended September 30, 2011 and then adding the statement of operations data from the three months ended December 31, 2011. The statements of operations data for calendar year ended December 31, 2011 and the three months ended December 31, 2010, while not required, are presented for comparison purposes.
The operations of the Pasadena Facility, Fulghum and NEWP are included in our historical results of operations only from the date of the closing of the Agrifos Acquisition, which was November 1, 2012, the Fulghum Acquisition, which was May 1, 2013, and the NEWP Acquisition, which was May 1, 2014. The results of our energy technologies segment are included in “loss from discontinued operations, net of tax”. The data below should be read in conjunction with “Item 7. Management’s Discussion and Analysis of Financial Condition and Results of Operations” and “Item 8. Financial Statements and Supplementary Data.”
| For the Years Ended December 31, |
Three Months Ended December 31, |
Fiscal Years Ended September 30, |
||||||||||||||||||||||||||||||
| 2014 | 2013 | 2012 | 2011 | 2011 | 2010 | 2011 | 2010 | |||||||||||||||||||||||||
| (unaudited) | (unaudited) | |||||||||||||||||||||||||||||||
| (in thousands, except per share data) | ||||||||||||||||||||||||||||||||
| CONSOLIDATED STATEMENTS OF OPERATIONS DATA |
||||||||||||||||||||||||||||||||
| Revenues |
$ | 472,661 | $ | 374,349 | $ | 261,635 | $ | 199,909 | $ | 63,014 | $ | 42,962 | $ | 179,857 | $ | 131,396 | ||||||||||||||||
| Cost of Sales |
$ | 392,987 | $ | 290,963 | $ | 129,796 | $ | 113,911 | $ | 37,460 | $ | 26,835 | $ | 103,286 | $ | 106,021 | ||||||||||||||||
| Gross Profit |
$ | 79,674 | $ | 83,386 | $ | 131,839 | $ | 85,998 | $ | 25,554 | $ | 16,127 | $ | 76,571 | $ | 25,375 | ||||||||||||||||
| Income (Loss) from Continuing Operations |
$ | (39,763 | ) | $ | 6,644 | $ | 65,063 | $ | 24,386 | $ | 2,706 | $ | 1,192 | $ | 19,005 | $ | (15,608 | ) | ||||||||||||||
| Income (Loss) from Discontinued Operations, net of tax |
$ | 7,259 | $ | (6,606 | ) | $ | (37,376 | ) | $ | (87,982 | ) | $ | (6,804 | ) | $ | (7,076 | ) | $ | (84,387 | ) | $ | (26,654 | ) | |||||||||
| Net Income (Loss) |
$ | (32,504 | ) | $ | 38 | $ | 27,687 | $ | (63,596 | ) | $ | (4,098 | ) | $ | (5,884 | ) | $ | (65,382 | ) | $ | (42,262 | ) | ||||||||||
| Net (Income) Loss Attributable to Noncontrolling Interests |
$ | 494 | $ | (1,570 | ) | $ | (41,687 | ) | $ | (3,700 | ) | $ | (4,433 | ) | $ | 366 | $ | 1,099 | $ | 94 | ||||||||||||
| Preferred Stock Dividends |
(3,840 | ) | — | — | — | — | — | — | — | |||||||||||||||||||||||
| Net Loss Attributable to Rentech |
$ | (35,850 | ) | $ | (1,532 | ) | $ | (14,000 | ) | $ | (67,296 | ) | $ | (8,531 | ) | $ | (5,518 | ) | $ | (64,283 | ) | $ | (42,168 | ) | ||||||||
| Net Loss per Common Share Attributable to Rentech: |
||||||||||||||||||||||||||||||||
| Basic: |
||||||||||||||||||||||||||||||||
| Continuing Operations |
$ | (0.19 | ) | $ | 0.02 | $ | 0.10 | $ | 0.09 | $ | (0.01 | ) | $ | 0.01 | $ | 0.09 | $ | (0.07 | ) | |||||||||||||
|
|
|
|
|
|
|
|
|
|
|
|
|
|
|
|
|
|||||||||||||||||
| Discontinued Operations |
$ | 0.03 | $ | (0.03 | ) | $ | (0.17 | ) | $ | (0.39 | ) | $ | (0.03 | ) | $ | (0.03 | ) | $ | (0.38 | ) | $ | (0.12 | ) | |||||||||
|
|
|
|
|
|
|
|
|
|
|
|
|
|
|
|
|
|||||||||||||||||
| Net Income (Loss) |
$ | (0.16 | ) | $ | (0.01 | ) | $ | (0.06 | ) | $ | (0.30 | ) | $ | (0.04 | ) | $ | (0.02 | ) | $ | (0.29 | ) | $ | (0.20 | ) | ||||||||
|
|
|
|
|
|
|
|
|
|
|
|
|
|
|
|
|
|||||||||||||||||
| Diluted: |
||||||||||||||||||||||||||||||||
| Continuing Operations |
$ | (0.19 | ) | $ | 0.02 | $ | 0.10 | $ | 0.09 | $ | (0.01 | ) | $ | 0.01 | $ | 0.09 | $ | (0.07 | ) | |||||||||||||
|
|
|
|
|
|
|
|
|
|
|
|
|
|
|
|
|
|||||||||||||||||
| Discontinued Operations |
$ | 0.03 | $ | (0.03 | ) | $ | (0.16 | ) | $ | (0.39 | ) | $ | (0.03 | ) | $ | (0.03 | ) | $ | (0.37 | ) | $ | (0.12 | ) | |||||||||
|
|
|
|
|
|
|
|
|
|
|
|
|
|
|
|
|
|||||||||||||||||
| Net Income (Loss) |
$ | (0.16 | ) | $ | (0.01 | ) | $ | (0.06 | ) | $ | (0.30 | ) | $ | (0.04 | ) | $ | (0.02 | ) | $ | (0.28 | ) | $ | (0.20 | ) | ||||||||
|
|
|
|
|
|
|
|
|
|
|
|
|
|
|
|
|
|||||||||||||||||
| Weighted-average shares used to compute net loss per common share: |
||||||||||||||||||||||||||||||||
| Basic |
228,560 | 226,139 | 223,189 | 223,281 | 224,414 | 221,980 | 222,664 | 216,069 | ||||||||||||||||||||||||
| Diluted |
228,560 | 233,703 | 230,524 | 226,182 | 224,414 | 226,679 | 226,680 | 216,069 | ||||||||||||||||||||||||
51
Table of Contents
| As of December 31, | As of September 30, | |||||||||||||||||||||||||||
| 2014 | 2013 | 2012 | 2011 | 2010 | 2011 | 2010 | ||||||||||||||||||||||
| (unaudited) | ||||||||||||||||||||||||||||
| (in thousands) | ||||||||||||||||||||||||||||
| CONSOLIDATED BALANCE SHEET DATA |
||||||||||||||||||||||||||||
| Cash |
$ | 44,195 | $ | 106,369 | $ | 141,637 | $ | 237,478 | $ | 84,586 | $ | 121,209 | $ | 54,146 | ||||||||||||||
| Working Capital |
$ | 3,180 | $ | 69,822 | $ | 107,059 | $ | 206,434 | $ | 26,843 | $ | 36,332 | $ | 22,107 | ||||||||||||||
| Construction in Progress |
$ | 179,423 | $ | 60,136 | $ | 61,417 | $ | 7,332 | $ | 5,017 | $ | 20,788 | $ | 2,938 | ||||||||||||||
| Total Assets |
$ | 828,150 | $ | 703,590 | $ | 479,202 | $ | 360,528 | $ | 239,556 | $ | 254,674 | $ | 200,515 | ||||||||||||||
| Total Long-Term Liabilities |
$ | 472,504 | $ | 432,584 | $ | 194,130 | $ | 53,475 | $ | 113,702 | $ | 155,752 | $ | 98,520 | ||||||||||||||
| Total Rentech Stockholders’ Equity |
$ | 120,733 | $ | 158,073 | $ | 157,987 | $ | 208,848 | $ | 33,203 | $ | (19,628 | ) | $ | 37,920 | |||||||||||||
| ITEM 7. | MANAGEMENT’S DISCUSSION AND ANALYSIS OF FINANCIAL CONDITION AND RESULTS OF OPERATIONS |
In addition to the information provided here in Management’s Discussion and Analysis of Financial Condition and Results of Operations, we believe that in order to more fully understand our discussion in this section, you should read our consolidated financial statements and the notes thereto and the other disclosures herein, including the discussion of our business and the risk factors.
OVERVIEW OF OUR BUSINESS
We are a leading provider of wood fibre processing services, high-quality wood chips and wood pellets. Our processing business includes Fulghum, which operates 31 wood chipping mills in the United States and South America. It provides wood yard operations services and wood fibre processing services, and sells wood chips to the pulp, paper and packaging industry. Fulghum also owns and manages forestland and sells bark to industrial consumers in South America. Our wood pellet business includes our Atikokan and Wawa Facilities and NEWP. Wood pellets produced at the Atikokan and Wawa Facilities, which are expected to have a combined annual production capacity of 560,000 metric tons, will be used for commercial power generation in Canada and the United Kingdom. The Atikokan Facility is currently in commissioning and producing wood pellets. We expect the Atikokan Facility to be operating at full capacity in six to 12 months. The Wawa Facility is nearing completion of construction. We expect the Wawa Facility to begin start-up and commissioning in the second quarter of 2015 and to operate at full capacity within one year from the start of commissioning. NEWP is one of the largest producers of wood pellets for the United States residential and commercial heating markets, operating four wood pellet facilities with a combined annual production capacity of approximately 280,000 tons. The facilities are located in Jaffrey, New Hampshire; Deposit, New York; Schuyler, New York; and Youngsville, Pennsylvania. We acquired the Youngsville facility in January 2015.
Our fertilizer business includes the ownership of the general partner interest and 59.7% of the common units representing limited partner interests in RNP, a publicly traded master limited partnership that owns and operates two fertilizer manufacturing facilities. Through its wholly owned subsidiary, RNLLC, RNP manufactures natural-gas based nitrogen fertilizer products at its East Dubuque Facility. It sells its products to customers located in the Mid Corn Belt region of the United States. Through its wholly owned subsidiary, RNPLLC, RNP manufactures ammonium sulfate fertilizer, sulfuric acid and ammonium thiosulfate fertilizer at its Pasadena Facility. The Pasadena Facility purchases ammonia as a feedstock at contractual prices based on the monthly Tampa Index market, while the East Dubuque Facility sells ammonia at prevailing prices in the Mid Corn Belt region. Ammonia prices are typically significantly higher in the Mid Corn Belt than in Tampa.
Our ownership interest in RNP currently entitles us to 59.7% of all cash distributions made by RNP to its common unit holders, which distributions can be used for general corporate purposes. However, Rentech’s ownership interest may be reduced over time if it elects to cause RNHI to sell any of its common units or if additional common units are issued by RNP in a manner that dilutes Rentech’s ownership interest in RNP.
Several negative factors affected our operating results in 2014. At RNP, sales volumes were lower than we had expected due to both unplanned downtime at our East Dubuque Facility and a decision to reduce output and sales from our Pasadena Facility in order to improve the profitability of that facility. As we discussed above, we also wrote down all of the remaining goodwill at our Pasadena Facility as a result of the continued outlook for profits to be lower than we had foreseen at the time of the Agrifos Acquisition. We lost revenue and incurred unplanned expenses as the results of a fire at a Fulghum wood chip mill in Maine, and of unplanned downtime for several of our customer’s mills. We also incurred higher labor and maintenance expenses than we had planned. We are behind schedule in completing our Atikokan and Wawa Projects, and have significantly exceeded the original construction cost estimates for those projects. We believe we have addressed liquidity issues that arose from the higher capital expenditures and the delay in expected cash flow from those projects through the loans provided under the A&R GSO Credit Agreement. During 2014, we sold our former energy technologies business, but incurred unexpected expenses as that sale closed six months later than expected. Our corporate expenses increased as a result of transaction fees related to our acquisition of NEWP and the financings we completed.
52
Table of Contents
For further information concerning our potential financing needs and related risks, see “Part I — Item 1. Business” and “Part I — Item 1A. Risk Factors.”
FACTORS AFFECTING COMPARABILITY OF FINANCIAL INFORMATION
Our historical results of operations for the periods presented may not be comparable with our results of operations for the subsequent periods for the reasons discussed below.
Supply and Demand Factors
Our earnings and cash flow from our fertilizer operations are significantly affected by nitrogen fertilizer product prices, the prices of the inputs to our production processes, and the timing of product deliveries as required by our customers. The price at which we ultimately sell our nitrogen fertilizer products depends on numerous factors, including global and local supply and demand for nitrogen fertilizer products and global and local supply and demand for our key raw materials, many of which factors may be significantly affected by weather patterns and the behavior of our competitors and suppliers.
RNP’s results for 2014 were adversely affected by escalating feedstock costs at our Pasadena Facility, higher exports of ammonium sulfate, which typically sells at a discount from products sold in the domestic market, and low-priced urea from China that put downward pressure on fertilizer prices. In addition, we incurred significant incremental maintenance costs due to unscheduled down time at both our East Dubuque and Pasadena facilities, which also decreased the amount of product available for sale. Escalating costs for ammonia and sulfur drove our Pasadena Facility’s production costs much higher than expected. Offshore ammonia prices surged higher during the second half of 2014, without a corresponding increase in nitrogen fertilizer prices that has historically occurred. The increase in ammonia prices was due to lower ammonia production caused by natural gas curtailments and political unrest in multiple areas of the globe. These conditions have improved with Black Sea ammonia shipments resuming along with increased ammonia production in Trinidad. Chinese urea exports rose throughout the year increasing by more than five million tons, as compared to 2013. Chinese ammonium sulfate exports also grew during the same period. These factors were the key reasons for the downward pressure on our fertilizer prices. Market conditions have improved during the first two months of 2015 for our Pasadena operations with Tampa ammonia prices declining. At the same time, ammonium sulfate prices remain firm along with lower levels of inventory available. Midwest ammonia prices have remained firm and stable during the dynamic swing in offshore pricing. The spread between Tampa and Midwest prices continues to widen. As of the date of this report, grain prices are lower than they have been in the past three years. Farmers may switch corn acres that generate low returns to other crops. Current corn planting estimates are slightly below the actual amounts for 2014. We do not anticipate that our East Dubuque Facility’s market will experience this decline. However, lower aggregate corn acres could reduce the total nitrogen consumed in North America, which could negatively impact our business. At this time, natural gas prices are very favorable, which is expected to positively impact our business.
Wood feedstock represents the largest component of NEWP’s wood pellet product cost. Competition for wood feedstock supply from pulp and paper manufacturing companies, and used in commercial and institutional wood boiler heating systems, may affect our cost of wood feedstock.
Acquired Operations
Pasadena Operations
The Pasadena Facility’s operations are included in our historical operating results from the closing date of the Agrifos Acquisition, which was November 1, 2012. Our Pasadena Facility produces three products that we did not produce or sell before the Agrifos Acquisition: ammonium sulfate, ammonium thiosulfate and sulfuric acid.
Fulghum Operations
Fulghum’s operations are included in our historical operating results from the closing date of the Fulghum Acquisition, which was May 1, 2013. Fulghum provides wood yard operations services and wood fibre processing services, and sells wood chips to the pulp, paper and packaging industry. It also owns and manages forestland and sells bark to industrial consumers in South America.
NEWP Operations
NEWP’s operations are included in our historical operating results from the closing date of the NEWP Acquisition, which was May 1, 2014. NEWP is one of the largest producers of wood pellets for the United States’ residential and commercial heating markets.
53
Table of Contents
The Agrifos, Fulghum and NEWP Acquisitions also broadened the geographic area into which our products are sold. For periods after the closing of each acquisition: (i) our general and administrative expenses as well as sales-related expenses have increased due to the addition of the acquired operations; (ii) our depreciation and amortization expenses have increased due to the increase in tangible and definite lived intangible assets, which were recorded at fair value on the date of the acquisition; and (iii) our interest expense has increased due to the debt assumed with the Fulghum and NEWP Acquisitions that continues to be outstanding and, in the case of Agrifos Acquisition, the debt incurred to finance a significant portion of the purchase price. Due to these factors, our operating results for the periods prior to and after the closing dates of the Agrifos Acquisition, Fulghum Acquisition and NEWP Acquisition may not be comparable.
Expansion Projects and Other Significant Capital Projects
We have commenced additional projects and/or are evaluating other potential projects to expand our fertilizer production and wood fibre processing capabilities and product offerings. We expect to incur significant costs and expenses developing and building such projects. Our depreciation expense has increased and we expect our depreciation expense to further increase as we place additional assets into service. Consequently, our operating results may not be comparable for periods before, during and after the construction of any expansion project or other significant capital project.
Restructuring of Pasadena’s Operations
In late 2014, we restructured operations at our Pasadena Facility. As part of the restructuring, our Pasadena Facility reduced expected annual production of ammonium sulfate by approximately 25 percent, to 500,000 tons. We intend to sell 70 percent of the 500,000 tons in the domestic market and the remaining tons in New Zealand and Australia, which are historically the international markets with the highest net prices for ammonium sulfate. Our sales plan reduces historically low-margin sales to Brazil, other than modest amounts expected during peak seasons when higher margins may be achievable. The restructuring plan provides the flexibility to increase ammonium sulfate production above the 500,000 ton rate for limited periods, if needed. The restructuring plan also included a reduction of the number of contractors and employees at the Pasadena Facility, which reduced the full-time equivalent workforce by approximately 20 percent. Severance and other one-time employee-related expenses of $0.2 million were recorded for the year ended December 31, 2014 in connection with these reductions in the workforce.
We expect the restructuring to reduce operating and selling, general and administrative expenses and annual maintenance capital expenditures. This should enable our Pasadena Facility’s operations, including the benefits from our power generation project, to generate positive EBITDA in 2015, based on our current outlook for input costs and prices of ammonium sulfate and other products. We cannot assure you that we will obtain these anticipated benefits from the restructuring. If we do not obtain the anticipated benefits, this could have a material adverse effect on our results of operations and financial condition.
Acquisitions
One of our business strategies is to pursue acquisitions in related businesses. We may pursue acquisitions of additional wood fibre processing assets and businesses. If completed, acquisitions could have significant effects on our business, financial condition and results of operations. We cannot assure you that we will enter into any definitive acquisition agreements on satisfactory terms, or at all. Costs associated with potential acquisitions are expensed as incurred, and could be significant.
Discontinued Operations — Energy Technologies
We were initially formed to develop and commercialize certain alternative energy technologies, and we acquired other energy technologies that we further developed. We conducted significant research and development and project development activities related to those technologies. In 2013, we ceased operations and reduced staffing at, and mothballed, our PDU, located in Commerce City, Colorado. We also eliminated all research and development activities in the first half of 2013. In October 2014, we sold our alternative energy technologies and certain pieces of equipment at the PDU. Any ongoing activities related to our alternative energy technologies will be to maintain the Commerce City site until it is sold and the natural gas pipeline at Natchez until it is abandoned.
CRITICAL ACCOUNTING POLICIES AND ESTIMATES
Preparing our consolidated financial statements in conformity with generally accepted accounting principles in the United States of America, or GAAP, requires management to make estimates and judgments that affect the reported amounts of assets, liabilities, revenues and expenses and related disclosure of contingent assets and liabilities. Actual results may differ based on the accuracy of the information utilized and subsequent events. Our accounting policies are described in the notes to our audited consolidated financial statements included elsewhere in this report. Our critical accounting policies, estimates and assumptions could materially affect the amounts recorded in our consolidated financial statements. The most significant estimates and assumptions relate to: revenue recognition, inventories, valuation of long-lived assets and intangible assets, recoverability of goodwill, accounting for major maintenance and the acquisition method of accounting.
54
Table of Contents
Revenue Recognition. We recognize revenue when the following elements are substantially satisfied: when the customer takes ownership from our facilities or storage locations and assumes risk of loss; there are no uncertainties regarding customer acceptance; there is persuasive evidence that an agreement exists documenting the specific terms of the transaction; the sales price is fixed or determinable; and collectibility is reasonably assured. Management assesses the business environment, the customer’s financial condition, historical collection experience, accounts receivable aging and customer disputes to determine whether collectibility is reasonably assured. If collectibility is not considered reasonably assured at the time of sale, we do not recognize revenue until collection occurs.
Certain product sales occur under prepaid contracts which require payment in advance of delivery. We record a liability for deferred revenue in the amount of, and upon receipt of, cash in advance of shipment. We recognize revenue related to prepaid contracts and relieve the liability for deferred revenue when customers take ownership of products. A significant portion of the revenue recognized during any period may be related to prepaid contracts, for which cash may have been collected during an earlier period, with the result being that a significant portion of revenue recognized during a period may not generate cash receipts during that period.
Natural gas, although not typically purchased for the purpose of resale, is occasionally sold under certain circumstances. Natural gas is sold when purchase commitments are in excess of production requirements or storage capacities, or when the margin from selling natural gas significantly exceeds the margin from producing additional ammonia, in which case the sales price is recorded in revenues and the related cost is recorded in cost of sales.
Inventories. Our inventory is stated at the lower of cost or estimated net realizable value. The cost of inventories is determined using the first-in first-out method. We perform an analysis of our inventory balances at least quarterly to determine if the carrying amount of inventories exceeds their net realizable value. The analysis of estimated net realizable value is based on customer orders, market trends and historical pricing. If the carrying amount exceeds the estimated net realizable value, the carrying amount is reduced to the estimated net realizable value. We allocate fixed production overhead costs to inventory based on the normal capacity of our production facilities.
Valuation of Long-Lived Assets and Finite-Lived Intangible Assets. We assess the realizable value of long-lived assets and finite-lived intangible assets for potential impairment whenever events or changes in circumstances indicate that the carrying value may not be recoverable. In assessing the recoverability of our assets, we make assumptions regarding estimated future cash flows and other factors to determine the fair value of the respective assets. As applicable, we make assumptions regarding the useful lives of the assets. If these estimates or their related assumptions change in the future, we may be required to record impairment charges for these assets.
Recoverability of Goodwill. We recorded goodwill impairments in 2014 and 2013. We test goodwill for impairment annually, or more often if an event or change of circumstance indicates that an impairment may have occurred. The first step of the required impairment test consists of a comparison of the fair value of a reporting unit to its carrying value. The determination of fair value involves a high degree of judgment as there are significant assumptions underlying the valuation. If the fair value of a reporting unit is greater than its carrying value, then there is no indication of potential impairment and step two of the goodwill impairment test is not required. If an indication of potential impairment exists, then step two is required whereby the fair value of the reporting unit is allocated to all of its assets and liabilities excluding goodwill, with the residual amount representing the fair value of goodwill. An impairment loss is measured as the amount by which the book value of the reporting unit’s goodwill exceeds the estimated fair value of goodwill.
Accounting for Major Maintenance. Expenditures for improving, replacing or adding to assets are capitalized. Expenditures for the acquisition, construction or development of new assets to maintain operating capacity, or to comply with environmental, health, safety or other regulations, are also capitalized. Costs of general maintenance and repairs are expensed. The East Dubuque Facility and Pasadena Facility require a planned maintenance turnaround every two years. Turnarounds at the East Dubuque Facility generally last between 18 and 25 days, and turnarounds at the Pasadena Facility generally last between 14 and 25 days. We intend to alternate the year in which a turnaround occurs at each facility, so that both facilities do not experience a turnaround in the same year. As a result, the facilities incur turnaround expenses which represent the cost of shutting down the plants for planned maintenance. Such costs are expensed as incurred. In many cases, the East Dubuque Facility and the Pasadena Facility also perform significant maintenance capital projects at the plants during a turnaround to minimize disruption to operations. Such projects are capitalized as property, plant and equipment rather than expensed as turnaround costs.
Examples of maintenance capital projects include the installation of additional components and projects that increase an asset’s useful life, increase the quantity or quality of the product manufactured or create efficiencies in the production process. Major turnaround costs, which are expensed, include gas, electricity and other shutdown and startup costs, labor, contractor and materials costs used to complete non-capital activities such as opening, dismantling, inspecting and reassembling major vessels, testing pressure and safety devices, cleaning or hydro-jetting major exchangers, replacing gaskets, repacking valves, checking instrument calibration and performing mechanical integrity inspections, all of which are completed with the goal of improving reliability and likelihood for continuous operation until the next turnaround.
55
Table of Contents
Acquisition Method of Accounting. We account for business combinations using the acquisition method of accounting, which requires, among other things, that assets acquired, liabilities assumed and potential earn-out consideration be recognized at their respective fair values as of the acquisition date. The earn-out consideration will be measured at each reporting date with changes in its fair value recognized in the consolidated statements of operations.
Business Segments
We operate in five business segments, as described below. The Pasadena Facility’s operations are included in our historical operating results only from the closing date of the Agrifos Acquisition, which was November 1, 2012. Fulghum’s operations are included only from the closing date of the Fulghum Acquisition, which was May 1, 2013. NEWP’s operations are included only from the closing date of the NEWP Acquisition, which was May 1, 2014. Results of the energy technologies segment are accounted for as discontinued operations for all periods presented. Our five business segments are:
| • | East Dubuque — The operations of the East Dubuque Facility, which produces primarily ammonia and UAN. |
| • | Pasadena — The operations of the Pasadena Facility, which produces primarily ammonium sulfate. |
| • | Fulghum Fibres — The operations of Fulghum, which provides wood yard operations services and wood fibre processing services, sells wood chips to the pulp, paper and packaging industry, and owns and manages forestland and sells bark to industrial consumers in South America. |
| • | Wood Pellets: Industrial — This segment includes wood pellet plant projects, currently the Atikokan and Wawa Projects, which are both nearing completion, other wood pellet development activities, the sale of third party produced pellets, and management of our wood pellet projects and development activities. The wood pellet development activities represent the Company’s personnel costs for employees dedicated to the wood pellet business infrastructure and administration costs and other third party costs. |
| • | Wood Pellets: NEWP — The operations of NEWP, which produces wood pellets for the residential and commercial heating markets. |
| For the Years Ended December 31, |
||||||||||||
| 2014 | 2013 | 2012 | ||||||||||
| (in thousands) | ||||||||||||
| Revenues: |
||||||||||||
| East Dubuque |
$ | 196,379 | $ | 177,700 | $ | 224,205 | ||||||
| Pasadena |
138,233 | 133,675 | 37,430 | |||||||||
| Fulghum Fibres |
101,849 | 62,974 | — | |||||||||
| Wood Pellets: Industrial |
4,086 | — | — | |||||||||
| Wood Pellets: NEWP |
32,114 | — | — | |||||||||
|
|
|
|
|
|
|
|||||||
| Total revenues |
$ | 472,661 | $ | 374,349 | $ | 261,635 | ||||||
|
|
|
|
|
|
|
|||||||
| Gross profit (loss): |
||||||||||||
| East Dubuque |
$ | 74,785 | $ | 80,883 | $ | 133,543 | ||||||
| Pasadena |
(14,308 | ) | (9,529 | ) | (1,704 | ) | ||||||
| Fulghum Fibres |
12,444 | 12,032 | — | |||||||||
| Wood Pellets: Industrial |
703 | — | — | |||||||||
| Wood Pellets: NEWP |
6,050 | — | — | |||||||||
|
|
|
|
|
|
|
|||||||
| Total gross profit |
$ | 79,674 | $ | 83,386 | $ | 131,839 | ||||||
|
|
|
|
|
|
|
|||||||
| Operating income (loss) |
||||||||||||
| East Dubuque |
$ | 69,888 | $ | 75,310 | $ | 125,984 | ||||||
| Pasadena |
(47,907 | ) | (48,208 | ) | (2,648 | ) | ||||||
| Fulghum Fibres |
3,919 | 9,914 | — | |||||||||
56
Table of Contents
| For the Years Ended December 31, |
||||||||||||
| 2014 | 2013 | 2012 | ||||||||||
| (in thousands) | ||||||||||||
| Wood Pellets: Industrial |
(11,954 | ) | (5,505 | ) | (1,919 | ) | ||||||
| Wood Pellets: NEWP |
4,388 | — | — | |||||||||
|
|
|
|
|
|
|
|||||||
| Total segment operating income |
$ | 18,334 | $ | 31,511 | $ | 121,417 | ||||||
|
|
|
|
|
|
|
|||||||
| Net income (loss): |
||||||||||||
| East Dubuque |
$ | 69,803 | $ | 75,244 | $ | 123,721 | ||||||
| Pasadena |
(47,925 | ) | (48,357 | ) | (2,648 | ) | ||||||
| Fulghum Fibres |
75 | 6,967 | — | |||||||||
| Wood Pellets: Industrial |
(11,616 | ) | (5,180 | ) | (1,919 | ) | ||||||
| Wood Pellets: NEWP |
4,342 | — | — | |||||||||
|
|
|
|
|
|
|
|||||||
| Total segment net income |
$ | 14,679 | $ | 28,674 | $ | 119,154 | ||||||
|
|
|
|
|
|
|
|||||||
| Reconciliation of segment net income to consolidated net income (loss): |
||||||||||||
| Segment net income |
$ | 14,679 | $ | 28,674 | $ | 119,154 | ||||||
| RNP—partnership and unallocated expenses recorded as selling, general and administrative expenses |
(8,768 | ) | (7,945 | ) | (11,773 | ) | ||||||
| RNP—partnership and unallocated income (expenses) recorded as other income (expense) |
4,800 | (1,081 | ) | 232 | ||||||||
| RNP—unallocated interest expense and loss on interest rate swaps |
(18,972 | ) | (14,096 | ) | (2,226 | ) | ||||||
| RNP— income tax benefit (expense) |
— | 303 | (303 | ) | ||||||||
| Corporate and unallocated expenses recorded as selling, general and administrative expenses |
(28,043 | ) | (24,849 | ) | (23,432 | ) | ||||||
| Corporate and unallocated depreciation and amortization expense |
(579 | ) | (596 | ) | (754 | ) | ||||||
| Corporate and unallocated income (expenses) recorded as other income (expense) |
(1,634 | ) | 19 | (2,708 | ) | |||||||
| Corporate and unallocated interest expense |
(380 | ) | (532 | ) | (9,055 | ) | ||||||
| Corporate income tax benefit (expense) |
(866 | ) | 26,747 | (4,072 | ) | |||||||
| Income (loss) from discontinued operations, net of tax |
7,259 | (6,606 | ) | (37,376 | ) | |||||||
|
|
|
|
|
|
|
|||||||
| Consolidated net income (loss) |
$ | (32,504 | ) | $ | 38 | $ | 27,687 | |||||
|
|
|
|
|
|
|
|||||||
THE YEAR ENDED DECEMBER 31, 2014 COMPARED TO THE YEAR ENDED DECEMBER 31, 2013
Continuing Operations:
Revenues
| For the Years Ended December 31, |
||||||||
| 2014 | 2013 | |||||||
| (in thousands) | ||||||||
| Revenues: |
||||||||
| East Dubuque |
$ | 196,379 | $ | 177,700 | ||||
| Pasadena |
138,233 | 133,675 | ||||||
|
|
|
|
|
|||||
| Total RNP |
334,612 | 311,375 | ||||||
| Fulghum Fibres |
101,849 | 62,974 | ||||||
| Wood Pellets: Industrial |
4,086 | — | ||||||
| Wood Pellets: NEWP |
32,114 | — | ||||||
|
|
|
|
|
|||||
| Total revenues |
$ | 472,661 | $ | 374,349 | ||||
|
|
|
|
|
|||||
57
Table of Contents
East Dubuque
| For the Year Ended December 31, 2014 |
For the Year Ended December 31, 2013 |
|||||||||||||||
| Tons | Revenue | Tons | Revenue | |||||||||||||
| (in thousands) | (in thousands) | |||||||||||||||
| Revenues: |
||||||||||||||||
| Ammonia |
153 | $ | 83,796 | 103 | $ | 66,796 | ||||||||||
| UAN |
267 | 74,666 | 269 | 79,377 | ||||||||||||
| Urea (liquid and granular) |
55 | 24,920 | 43 | 20,455 | ||||||||||||
| CO2 |
81 | 2,593 | 71 | 2,416 | ||||||||||||
| Nitric Acid |
11 | 3,803 | 14 | 5,150 | ||||||||||||
| Other |
N/A | 6,601 | N/A | 3,506 | ||||||||||||
|
|
|
|
|
|
|
|
|
|||||||||
| Total |
567 | $ | 196,379 | 500 | $ | 177,700 | ||||||||||
|
|
|
|
|
|
|
|
|
|||||||||
We generate revenue primarily from the sale of nitrogen fertilizer products manufactured at our East Dubuque Facility. Our East Dubuque Facility produces ammonia, UAN, liquid and granular urea, which are nitrogen fertilizers that use natural gas as a feedstock. We also produce nitric acid and food-grade CO2. Nitrogen fertilizer products are used primarily in the production of corn. Revenues are seasonal based on the planting, growing, and harvesting cycles of customers who use nitrogen fertilizer.
Revenues for the year ended December 31, 2014 were $196.4 million, compared to $177.7 million for the same period in the prior year. The increase was due to higher sales volumes for ammonia and urea and higher natural gas sales, partially offset by lower sales prices for ammonia, UAN and urea.
Ammonia production capacity increased 23% after we completed the ammonia expansion project in December 2013. This additional ammonia available for sale enabled higher ammonia deliveries during the year ended December 31, 2014. During the fourth quarter of 2013, production was interrupted due to a planned turnaround and a subsequent fire, which resulted in lower amounts of ammonia available for sale in 2013. Urea sales increased during 2014 due to higher sales of DEF and granular urea.
Average sales prices per ton for the year ended December 31, 2014 were 16% lower for ammonia and 5% lower for UAN, as compared to the same period in the prior year. These two products comprised 81% of our East Dubuque Facility’s revenues for the year ended December 31, 2014 and 82% for the same period in the prior year. The decreases in our sales prices for ammonia and UAN were consistent with the decline in global nitrogen fertilizer prices in the earlier portions of the respective years, partially offset by increases in the latter portions of the respective years. These decreases were caused by significantly higher levels of low-priced urea in the global market, particularly from China. Prices were also affected by additional nitrogen fertilizer production brought on line in North America over the last 12 months.
Other revenues consist primarily of natural gas sales. We occasionally sell natural gas when purchase commitments exceed production requirements or storage capacities, or when the margin from selling natural gas significantly exceeds the margin from producing additional ammonia. During the year ended December 31, 2014, we recorded $6.1 million in natural gas sales and $0.5 million in sales of nitrous oxide emission reduction credits. On rare occasions, we have also purchased natural gas with the specific intent of immediately reselling it when local market anomalies create low-risk opportunities for gain. During the first quarter of 2014, temporary operational problems with a natural gas pipeline in the Midwest caused a significant spike in the local price of natural gas. This created a unique opportunity to purchase natural gas from other locations at lower prices for the purpose of reselling it at significantly higher prices. We also sold natural gas originally purchased for production at a gross profit that exceeded the expected gross profits from additional production using that natural gas. During the first quarter of 2014, we sold, at an average price of $29.90 per MMBtu, 151,000 MMBtus of natural gas that cost an average of $9.42 per MMBtu. The total $4.5 million in natural gas sales in the first quarter resulted in a gross profit of $3.1 million, which was significantly higher than the profit we would likely have realized on the 2,900 tons of lost ammonia production. During the year ended December 31, 2013, we recorded $3.4 million in natural gas sales and $0.1 million in sales of nitrous oxide emission reduction credits.
Pasadena
| For the Year Ended December 31, 2014 |
For the Year Ended December 31, 2013 |
|||||||||||||||
| Tons | Revenue | Tons | Revenue | |||||||||||||
| (in thousands) | (in thousands) | |||||||||||||||
| Revenues: |
||||||||||||||||
| Ammonium sulfate |
572 | $ | 116,330 | 428 | $ | 107,435 | ||||||||||
| Sulfuric acid |
112 | 9,624 | 148 | 13,514 | ||||||||||||
| Ammonium thiosulfate |
67 | 10,217 | 54 | 10,221 | ||||||||||||
| Other |
N/A | 2,062 | N/A | 2,505 | ||||||||||||
|
|
|
|
|
|
|
|
|
|||||||||
| Total |
751 | $ | 138,233 | 630 | $ | 133,675 | ||||||||||
|
|
|
|
|
|
|
|
|
|||||||||
58
Table of Contents
We generate revenue from sales of nitrogen fertilizer and other products manufactured at our Pasadena Facility. The facility produces ammonium sulfate, and ammonium thiosulfate, which are nitrogen fertilizers, as well as sulfuric acid. These fertilizer products are used in growing corn, soybeans, potatoes, cotton, canola, alfalfa and wheat. Revenues from domestic sales are seasonal based on planting, growing, and harvesting cycles of customers who use nitrogen fertilizer. Planting seasons in the Southern Hemisphere are typically opposite those in the United States thus ammonium sulfate international sales partially offset domestic seasonality.
Revenues for the year ended December 31, 2014 were $138.2 million, compared to $133.7 million for the year ended December 31, 2013. The increase was due to higher sales volumes for ammonium sulfate, partially offset by lower sales volumes for sulfuric acid and lower sales prices for ammonium sulfate and sulfuric acid.
Ammonium sulfate production increased after we completed the debottlenecking project in December 2013. Also, demand increased due to favorable weather during the planting season and an increase in international orders. We produce ammonium sulfate by combining ammonia and sulfuric acid, which we also produce to make ammonium sulfate or to sell to the industrial market. After expanding ammonium sulfate production capacity, less sulfuric acid was available for sale causing a decline in sulfuric acid sales volume during the year ended December 31, 2014 as compared to the same period in the prior year
Average sales prices per ton decreased by 19% for ammonium sulfate and 6% for sulfuric acid for the year ended December 31, 2014, as compared with the same period in the prior year. These two products comprised 91% of our Pasadena Facility’s revenues for the year ended December 31, 2014 and 90% for the year ended December 31, 2013. A higher proportion of export sales, priced lower than domestic sales, contributed to the decline in average product price. Furthermore, higher exports of ammonium sulfate from China put downward pressure on prices. The additional supplies from China originated from new plants that produce ammonium sulfate as a by-product of manufacturing caprolactam.
Fulghum Fibres
| For the Years Ended December 31, |
||||||||
| 2014 | 2013 | |||||||
| (in thousands) | ||||||||
| Revenues: |
||||||||
| Service |
$ | 70,317 | $ | 49,822 | ||||
| Product |
31,532 | 13,152 | ||||||
|
|
|
|
|
|||||
| Total revenues |
$ | 101,849 | $ | 62,974 | ||||
|
|
|
|
|
|||||
We generate revenues at Fulghum Fibres from providing wood yard operation services and wood fibre processing services, and selling wood chips to the pulp, paper and packaging industry. Fulghum also owns and manages forestland and sells bark to industrial consumers in South America.
Fulghum’s operations are included in our historical operating results only from the closing date of the Fulghum Acquisition, which was May 1, 2013. Revenues for the year ended December 31, 2014 were $101.8 million, compared to $63.0 million for the year ended December 31, 2013. The increase was due to our ownership of Fulghum for the full year in 2014 as compared to eight months in 2013. For the year ended December 31, 2014, United States operations generated $59.0 million of revenues, while South America operations recorded $42.8 million of revenues. For the year ended December 31, 2013 United States operations generated $40.7 million of revenues, while South America operations recorded $22.3 million of revenues. Service revenues are those earned under agreements for wood yard operations services and wood fibre processing services in the United States and South America. Product revenues are those earned by our Chilean operations from the sale of wood chips and bark. During the year ended December 31, 2014, our mills in the United States processed 12.6 million GMT of logs into wood chips and residual fuels; our mills in South America processed 2.3 million GMT of logs. During the eight months ended December 31, 2013, our mills in the United States processed 8.4 million GMT of logs into wood chips and residual fuels; our mills in South America processed 1.5 million GMT of logs.
59
Table of Contents
While revenues increased from 2013 due to our ownership of Fulghum for the full year in 2014, revenues were lower than expected in 2014 due to a number of issues. During 2014, service revenues at our mill in Maine were lower due to downtime and constraints resulting from conducting operations with temporary equipment following a fire that occurred in the first quarter. In addition, revenues for the sale of wood chips and biomass in South America were lower than expected due primarily to lower sales prices and reduced demand from customers.
Wood Pellets: Industrial
We generate revenues from sales of wood pellets to industrial customers, specifically utilities generating electricity. Revenues were $4.1 million at the Atikokan Facility for the year ended December 31, 2014, earned by delivering to OPG 21,000 metric tons of wood pellets sourced from a third-party wood pellet producer.
The Atikokan Facility is currently in the commissioning phase and producing wood pellets. We expect the Atikokan Facility to be operating at full capacity in six to 12 months. The Wawa Facility is nearing construction completion. We expect the facility to begin start-up and commissioning in the second quarter of 2015 and to operate at full capacity within one year from the start of commissioning.
Wood Pellets: NEWP
We generate revenues at NEWP from sales of wood pellets to the United States’ residential and commercial heating markets. Revenues were $32.1 million from May 1, 2014 through December 31, 2014 on deliveries of 165,000 tons of wood pellets.
Cost of Sales
| For the Years Ended December 31, |
||||||||
| 2014 | 2013 | |||||||
| (in thousands) | ||||||||
| Cost of sales: |
||||||||
| East Dubuque |
$ | 121,594 | $ | 96,817 | ||||
| Pasadena |
152,541 | 143,204 | ||||||
|
|
|
|
|
|||||
| Total RNP |
274,135 | 240,021 | ||||||
| Fulghum Fibres |
89,405 | 50,942 | ||||||
| Wood Pellets: Industrial |
3,383 | — | ||||||
| Wood Pellets: NEWP |
26,064 | — | ||||||
|
|
|
|
|
|||||
| Total cost of sales |
$ | 392,987 | $ | 290,963 | ||||
|
|
|
|
|
|||||
East Dubuque
Cost of sales primarily consists of the cost of natural gas (East Dubuque’s primary feedstock), labor, depreciation and electricity. Cost of sales for the year ended December 31, 2014 was $121.6 million compared to $96.8 million for the same period in the prior year. The increase in the cost of sales was primarily due to an increase in depreciation, the cost of natural gas and electricity. Increased natural gas costs were due to an increase in product sales volumes, additional natural gas purchased for resale and a loss on natural gas derivatives of $4.0 million. Natural gas comprised 47% and labor costs comprised 13% of cost of sales on product shipments for the year ended December 31, 2014. For the year ended December 31, 2013, natural gas was 43% and labor was 12% of cost of sales. Depreciation expense included in cost of sales was $15.7 million for the year ended December 31, 2014 and $9.0 million for the year ended December 31, 2013. The increase in depreciation expense was primarily due to the completion of the ammonia expansion project in late 2013. Increased electricity costs reflected higher rates and usage due in part to the new equipment installed as part of the ammonia expansion project. During the year ended December 31, 2014, we recorded an additional $0.9 million of expense reimbursements under an insurance claim filed for the fire, which occurred in 2013.
60
Table of Contents
Pasadena
Cost of sales primarily consists of the cost of ammonia, sulfur, labor, depreciation and electricity. Cost of sales for the year ended December 31, 2014 was $152.5 million, compared to $143.2 million for the year ended December 31, 2013. The increase in cost of sales was primarily due to selling a higher volume of ammonium sulfate and higher unit prices for inputs. Ammonia and sulfur together comprised 61% of cost of sales for the year ended December 31, 2014, compared to 59% for the same period in the prior year. Labor costs comprised 7% of cost of sales for each of the years ended December 31, 2014 and 2013. For the year ended December 31, 2014, we wrote down our ammonium sulfate inventory by $6.0 million because production costs exceeded market prices. During the same period in the prior year, we wrote down our ammonium sulfate, sulfur and sulfuric acid inventory by $12.4 million due to lower market prices of ammonium sulfate and sulfuric acid. During the year ended December 31, 2014, we incurred turnaround expenses of $2.1 million and unanticipated maintenance expenses of $1.3 million. Turnaround expenses represent maintenance costs incurred during planned shut-downs. The duration of the 2014 turnaround was extended by 13 days, as compared to the duration of a typical turnaround, to undertake activities necessary to tie-in the new sulfuric acid converter and cogeneration projects. During the extended outage, we conducted a comprehensive examination of other components within the sulfuric acid plant. This examination resulted in the discovery and repair of previously unidentified items. The incremental cost of these items and the extended downtime was approximately $1.3 million. These activities are not expected to recur in the future. Prices for ammonia and sulfur, key inputs for ammonium sulfate, increased significantly during 2014. Global ammonia supplies were lower than normal due to production issues in Egypt, Algeria, Trinidad and Qatar, as well as political issues in Libya and Ukraine. Because our sulfuric acid plant was down during the turnaround period in order to continue producing ammonium sulfate and meet sales demand for sulfuric acid, we purchased sulfuric acid, which increased the cost of sales for the year ended December 31, 2014.
Depreciation expense included in cost of sales was $7.0 million for the year ended December 31, 2014 and $4.2 million for the year ended December 31, 2013. The increased depreciation expense was primarily due to an increase in property, plant and equipment resulting from the completion of the debottlenecking project in late 2013, and the increase in ammonium sulfate volumes sold in 2014 compared to 2013.
Fulghum Fibres
Costs for our wood chipping mill operations include (i) service costs, which primarily consist of costs for labor, repairs and maintenance, depreciation and utilities, and (ii) product costs relating to our operations in Chile, which consist of costs to purchase, process and export wood fibre products.
Cost of sales for the year ended December 31, 2014 was $89.4 million, compared to $50.9 million for the year ended December 31, 2013. The increase in cost of sales was primarily due to our owning Fulghum for the full year in 2014 as compared to eight months during the year ended December 31, 2013. For the year ended December 31, 2014, service costs represented 64% of our cost of sales, while product costs represented 36% of our cost of sales. For the year ended December 31, 2013, service costs represented 75% of our cost of sales, while product costs represented 25% of our cost of sales. Labor costs comprised 37% of our service cost of sales for the year ended December 31, 2014 and 35% for the same period in the prior year. Repairs and maintenance and utilities comprised 40% of our service cost of sales for the year ended December 31, 2014 and 44% for the same period in the prior year. Depreciation expense included in cost of sales was $7.4 million during the year ended December 31, 2014 and $4.8 million for the same period in the prior year.
Several of Fulghum’s customers experienced unusually long outages in 2014 at their production facilities to which our mills supply chips. During the customers’ downtime, Fulghum performed significant preventative maintenance at these mills, which increased operating costs during the period. In addition, labor costs during 2014 were higher than normal, partially due to this increased maintenance work. A fire at our mill in Maine during the first quarter of 2014 disrupted operations, reducing chipping volumes and increasing processing costs at the facility in 2014.
Wood Pellets: Industrial
As of December 31, 2014, we had not yet begun producing wood pellets at either the Atikokan or Wawa Facilities. As a result, cost of sales primarily consists of purchasing and transporting wood pellets from a third party supplier to our customer OPG. Cost of sales for year ended December 31, 2014 was $3.4 million. Wood pellet purchases in cost of sales were $2.2 million for the year ended December 31, 2014. Transportation costs were $1.1 million for the year ended December 31, 2014. Cost of sales also included penalties of $0.7 million of which $0.5 million was for commitment shortfalls under the Canadian National Contract and $0.2 million for commitment shortfalls under the Drax Contract. During 2014, we did not meet our commitment under the Canadian National Contract to transport a minimum of 1,500 rail carloads. During 2014, we did not meet our commitment under the Drax Contract to deliver the wood pellets required under contract.
We have amended the Drax Contract to cancel all wood pellet deliveries that were due in 2014 and to reduce the required volume of wood pellets to be delivered to Drax in 2015 to 240,000 tonnes from 360,000 tonnes. In exchange for the cancelled deliveries and reduced volume commitments, we paid Drax a penalty of approximately $170,000 and expect to provide price concessions in the amount of $0.9 million on shipments made to Drax in 2015. In the event such shipments are not made, the price reductions will become cash penalties payable to Drax, in addition to other penalties that may be due under the Drax Contract for such failed deliveries. In addition, a portion of the original 2015 deliveries are being deferred to future years at 2015 pricing, which is expected to lower the pricing under the terms of the contract in those future years.
61
Table of Contents
Wood Pellets: NEWP
Cost of sales primarily consists of expenses for wood fibre feedstock (wood chips and sawdust), packaging, labor, electricity, freight and depreciation. Cost of sales for the year ended December 31, 2014 was $26.1 million. For the year ended December 31, 2014, wood fibre feedstock comprised 46%, packaging comprised 11%, and labor and electricity each comprised 7% of cost of sales. Depreciation expense included in the cost of sales was $1.9 million for the year ended December 31, 2014. Cost of sales for the year ended December 31, 2014 also included a $0.2 million write-up of inventory to fair value as part of the NEWP Acquisition.
Gross Profit (Loss)
| For the Years Ended December 31, |
||||||||
| 2014 | 2013 | |||||||
| (in thousands) | ||||||||
| Gross profit (loss): |
||||||||
| East Dubuque |
$ | 74,785 | $ | 80,883 | ||||
| Pasadena |
(14,308 | ) | (9,529 | ) | ||||
|
|
|
|
|
|||||
| Total RNP |
60,477 | 71,354 | ||||||
| Fulghum Fibres |
12,444 | 12,032 | ||||||
| Wood Pellets: Industrial |
703 | — | ||||||
| Wood Pellets: NEWP |
6,050 | — | ||||||
|
|
|
|
|
|||||
| Total gross profit |
$ | 79,674 | $ | 83,386 | ||||
|
|
|
|
|
|||||
East Dubuque
Gross profit was $74.8 million for the year ended December 31, 2014, compared to $80.9 million for the year ended December 31, 2013. Gross profit margin was 38% for the year ended December 31, 2014, compared to 46% for the year ended December 31, 2013. The decreases in gross profit and gross margin were primarily due to lower product pricing and increased costs of natural gas, depreciation and electricity.
Gross profit margin can vary significantly from period to period. Nitrogen fertilizer and natural gas are both commodities, the prices of which can vary significantly from period to period and do not always move in the same direction. In addition, certain fixed costs of operating our East Dubuque Facility are recorded in cost of sales. Their impact on gross profit and gross margins varies as product sales volumes vary seasonally.
During the fourth quarter of 2014, our East Dubuque Facility’s ammonia plant was shut down for seven days for unplanned maintenance. Also, during the third quarter of 2014, our East Dubuque Facility’s ammonia plant was shut down for ten days for unplanned maintenance. Gross profit was negatively impacted as the outages reduced the amount of product available for sale. Problems with the ammonia synthesis converter caused the shut-downs in both cases. The converter was damaged during a fire in 2013, then repaired and returned to service. The facility is currently operating near capacity, but it is possible that additional repairs will be needed before the converter is expected to be replaced at the end of 2016.
Pasadena
Gross loss was $14.3 million for the year ended December 31, 2014, compared to $9.5 million for the year ended December 31, 2013. Gross loss margin for the year ended December 31, 2014 was 10%, compared to gross loss margin of 7% for the year ended December 31, 2013. The decreases in gross profit and gross profit margin were primarily due to declines in average sales prices for ammonium sulfate, increases in the unit prices of raw materials, turnaround expenses and other unplanned maintenance expenses.
Gross profit margin at our Pasadena Facility can vary significantly from period to period due to changes in the prices of nitrogen fertilizer, ammonia and sulfur, which are all commodities. The prices of these commodities can vary significantly from period to period and do not always move in the same direction. In addition, certain fixed costs of operating our Pasadena Facility are recorded in cost of sales. Their impact on gross profit and gross margins varies as product sales volumes vary seasonally. Moreover, forward sales contracts have not developed for ammonium sulfate to the extent that they have for other nitrogen fertilizer products, so it is not possible to lock in product prices and input prices at the same time, as has been our practice for a significant portion of the
62
Table of Contents
sales at our East Dubuque Facility. Since input prices for ammonium sulfate are typically fixed several months before the corresponding product sales prices are known, margins may be compressed during a declining commodity market. See “Note 12 — Goodwill” to the consolidated financial statements included in “Part II — Item 8. Financial Statements and Supplementary Data” in this report.
Fulghum Fibres
Gross profit was $12.4 million for the year ended December 31, 2014, compared to $12.0 million for the year ended December 31, 2013. Gross profit margin for the year ended December 31, 2014 was 12%, compared to 19% for the same period in the prior year. The decrease in gross profit margin was primarily due to losses associated with the fire at our mill in Maine, increased labor and maintenance costs at our various other U.S. mills, and lower margins on South American exports. Our losses related to the fire in Maine, which reflect lost revenues and increased operating costs associated with interim chip processing during the reconstruction, totaled approximately $1.0 million in 2014.
Wood Pellets: Industrial
Gross profit for the year ended December 31, 2014 was $0.7 million. Gross profit margin was 17% for the year ended December 31, 2014.
Wood Pellets: NEWP
Gross profit for the year ended December 31, 2014 was $6.1 million. Gross profit margin was 19% for the year ended December 31, 2014.
Operating Expenses
| For the Years Ended December 31, |
||||||||
| 2014 | 2013 | |||||||
| (in thousands) | ||||||||
| Operating expenses: |
||||||||
| East Dubuque |
$ | 4,897 | $ | 5,573 | ||||
| Pasadena |
33,600 | 38,679 | ||||||
| RNP – partnership and unallocated expenses |
8,768 | 7,945 | ||||||
|
|
|
|
|
|||||
| Total RNP |
47,265 | 52,197 | ||||||
| Fulghum Fibres |
8,525 | 2,118 | ||||||
| Wood pellets: Industrial |
12,657 | 5,505 | ||||||
| Wood pellets: NEWP |
1,661 | — | ||||||
| Corporate and unallocated expenses |
28,636 | 25,445 | ||||||
|
|
|
|
|
|||||
| Total operating expenses |
$ | 98,744 | $ | 85,265 | ||||
|
|
|
|
|
|||||
East Dubuque
Operating expenses were $4.9 million for the year ended December 31, 2014, compared to $5.6 million for the year ended December 31, 2013. These expenses were primarily comprised of selling, general and administrative expenses, depreciation expense and asset disposal costs.
Selling, General and Administrative Expenses. Selling, general and administrative expenses for the year ended December 31, 2014 were $4.2 million, compared to $4.6 million for the year ended December 31, 2013. This decrease was primarily due to decreases in various professional services fees of $0.3 million.
Depreciation and Amortization. Depreciation expense included in operating expense was $0.2 million for the years ended December 31, 2014 and 2013. The majority of depreciation expense incurred was a manufacturing cost and was distributed between cost of sales and finished goods inventory, based on production volumes and ending inventory levels. However, a portion of depreciation expense was associated with assets supporting general and administrative functions and was recorded in operating expense.
Other. Other expenses include loss on disposal of fixed assets, which was $0.5 million for the year ended December 31, 2014, compared to $0.8 million for the prior year.
63
Table of Contents
Pasadena
Operating expenses were comprised primarily of selling, general and administrative expenses, depreciation expense and Pasadena goodwill impairment. Operating expenses were $33.6 million for the year ended December 31, 2014, compared to $38.7 million for the year ended December 31, 2013.
Selling, General and Administrative Expenses. Selling, general and administrative expenses for the year ended December 31, 2014 were $5.1 million, compared to $4.8 million for the year ended December 31, 2013.
Depreciation and Amortization. Depreciation and amortization expense included in operating expenses was $1.3 million for the year ended December 31, 2014, compared to $3.9 million for the years ended December 31, 2013. Depreciation and amortization expense represents primarily amortization of intangible assets. The decreases between periods were primarily due to an intangible asset having been fully amortized at December 31, 2013. The majority of depreciation expense incurred was a manufacturing cost and was distributed between cost of sales and finished goods inventory, based on production volumes and ending inventory levels.
Pasadena Goodwill Impairment. Pasadena goodwill impairment was $27.2 million for the year ended December 31, 2014, compared to $30.0 million for the year ended December 31, 2013. There is no remaining goodwill associated with the Pasadena Facility. See “Note 12 — Goodwill” to the consolidated financial statements included in “Part II — Item 8. Financial Statements and Supplementary Data” in this report.
RNP – Partnership and Unallocated Expenses
Partnership and unallocated expenses represent costs that relate directly to RNP and its subsidiaries but are not allocated to a segment. Partnership and unallocated expenses recorded in selling, general and administrative expenses consist primarily of business development expenses for RNP; unit-based compensation expense for executives of RNP; services from Rentech for executive, legal, finance, accounting, human resources, and investor relations support in accordance with the services agreement between RNP and Rentech; audit and tax fees; legal fees; compensation for RNP partnership level personnel; certain insurance costs; and board of director expenses.
Partnership and unallocated expenses recorded as selling, general and administrative expenses for the year ended December 31, 2014 were $8.8 million, compared to $7.9 million for the same period in the prior year. The increase was primarily due to the 2014 severance costs for a former officer of the Company of $1.0 million, partially offset by a decrease in bonus expense of $0.5 million. Non-cash unit–based compensation expense, recorded in selling, general and administrative expenses, was $1.3 million for the year ended December 31, 2014, compared to $1.5 million for the same period in the prior year.
Fulghum Fibres
Operating expenses were comprised of selling, general and administrative expense and depreciation and amortization expense. Selling, general and administrative expenses for the year ended December 31, 2014 were $6.4 million, compared to $3.8 million for the same period in the prior year. These expenses are for general administrative purposes, such as costs associated with general management personnel, travel, legal, office space, consulting, and information technology. The increase was due to our ownership of Fulghum for the full year of 2014 as compared to eight months for 2013. Depreciation and amortization expense included in operating expense for the year ended December 31, 2014 was $2.1 million and ($1.7) million for the same period in the prior year. For the year ended December 31, 2013, amortization of unfavorable processing agreements exceeded amortization of favorable processing agreements resulting in a credit in depreciation and amortization expense. The majority of depreciation expense relates to wood chip processing assets and was recorded in cost of sales.
64
Table of Contents
Wood Pellets: Industrial
Operating expenses were primarily comprised of selling, general and administrative expenses, which include personnel costs, travel, acquisition-related and development costs associated with the Atikokan and Wawa Projects, and other business development costs. Our operating expenses are not indicative of the amount of operating expenses we expect after the Atikokan and Wawa Facilities are commissioned and operating. Once we begin producing and selling wood pellets, certain expenses currently recorded as operating expenses will be capitalized to product inventory and included in cost of sales when the inventories are sold.
Operating expenses were $12.7 million for the year ended December 31, 2014, compared to $5.5 million for the same period in the prior year. The increase was primarily due to increases in plant personnel costs of $1.9 million, utilities and other plant start-up costs of $2.6 million, rail car delivery and lease expenses of $2.4 million and professional and consulting services of $0.7 million, partially offset by a gain on disposal of fixed assets of $0.4 million.
Wood Pellets: NEWP
Operating expenses consist of selling, general and administrative expenses and depreciation and amortization expense. Selling, general and administrative expenses for the year ended December 31, 2014 were $1.6 million.
Depreciation and amortization expense included in operating expense for the year ended December 31, 2014 was $0.1 million. At the time of the NEWP Acquisition, we recorded customer relationships at their fair values as part of purchase accounting for the acquisition. The majority of depreciation expense relates to wood pellet processing assets and was recorded in cost of sales.
Corporate and Unallocated Expenses
Corporate and unallocated expenses represent costs that relate directly to Rentech and its non-RNP subsidiaries but are not allocated to a segment. Operating expenses consist primarily of selling, general and administrative expenses and depreciation and amortization expense. Selling, general and administrative expenses include cash and non-cash personnel costs, acquisition related expenses, insurance costs, information technology costs and professional services fees for legal, audit, tax and investor relations activities. Selling, general and administrative expenses were $28.0 million for the year ended December 31, 2014, compared to $24.8 million for the year ended December 31, 2013. The increase was primarily due to $1.5 million in legal and consulting costs associated with evaluating shareholder proposals, completing settlements with shareholders and conducting cost studies, a $1.2 million increase in accounting, tax and audit fees, $1.1 million in transaction costs related to the NEWP acquisition, and $0.7 million higher information technology costs, partially offset by $0.5 million lower cash personnel costs and a $0.4 million decrease in non-cash equity based compensation. Non-cash equity-based compensation expense was $5.5 million for the year ended December 31, 2014 compared to $5.9 million for the same period in the prior year
Operating Income (Loss)
| For the Years Ended December 31, |
||||||||
| 2014 | 2013 | |||||||
| (in thousands) | ||||||||
| Operating income (loss): |
||||||||
| East Dubuque |
$ | 69,888 | $ | 75,310 | ||||
| Pasadena |
(47,907 | ) | (48,208 | ) | ||||
| RNP – partnership and unallocated expenses |
(8,768 | ) | (7,945 | ) | ||||
|
|
|
|
|
|||||
| Total RNP |
13,213 | 19,157 | ||||||
| Fulghum Fibres |
3,919 | 9,914 | ||||||
| Wood pellets: Industrial |
(11,954 | ) | (5,505 | ) | ||||
| Wood pellets: NEWP |
4,388 | — | ||||||
| Corporate |
(28,636 | ) | (25,445 | ) | ||||
|
|
|
|
|
|||||
| Total operating loss |
$ | (19,070 | ) | $ | (1,879 | ) | ||
|
|
|
|
|
|||||
East Dubuque
Operating income was $69.9 million for the year ended December 31, 2014, compared to $75.3 million for the year ended December 31, 2013. The decrease was primarily due to lower product pricing, and increased costs of natural gas, depreciation and electricity.
65
Table of Contents
Pasadena
Operating loss was $47.9 million for the year ended December 31, 2014, compared to $48.2 million for the year ended December 31, 2013. The improvement in the operating loss was primarily due to a lower goodwill impairment, inventory write-down, and depreciation and amortization expense, partially offset by the decline in average sales prices for ammonium sulfate, increases in the unit price of raw materials, and turnaround and maintenance expenses in 2014 as described above.
RNP – Partnership and Unallocated Expenses
Operating loss, which represents operating expenses, was $8.8 million for the year ended December 31, 2014, compared to $7.9 million for the year ended December 31, 2013. The increase was due to the increase in selling, general and administrative expenses as described above.
Fulghum Fibres
Operating income was $3.9 million for the year ended December 31, 2014 and $9.9 million for the same period in the prior year. The decrease in operating income was due to losses associated with the fire at our mill in Maine, increased labor and maintenance costs at our various other U.S. mills, lower margins on South American exports, and increased depreciation and amortization expense as described above.
Wood Pellets: Industrial
Operating loss was $12.0 million for the year ended December 31, 2014, compared to $5.5 million for the same period in the prior year. This increase was due to non-capitalizable start-up costs in 2014, including personnel costs, related to the Atikokan and Wawa Projects. These costs were higher than expected in 2014 due to the delays in completing the Atikokan and Wawa Projects and placing the facilities into service.
Wood Pellets: NEWP
Operating income was $4.4 million for the year ended December 31, 2014, which reflects gross profit and operating expenses as described above.
Corporate and Unallocated Expenses
Loss from operations primarily consists of operating expenses, such as selling, general and administrative expenses and depreciation and amortization as described above.
Other Income (Expense), Net
| For the Years Ended December 31, |
||||||||
| 2014 | 2013 | |||||||
| (in thousands) | ||||||||
| Other income (expense), net: |
||||||||
| East Dubuque |
$ | (84 | ) | $ | — | |||
| Pasadena |
— | (8 | ) | |||||
| RNP – unallocated interest expense and other |
(14,172 | ) | (15,177 | ) | ||||
|
|
|
|
|
|||||
| Total RNP |
(14,256 | ) | (15,185 | ) | ||||
| Fulghum Fibres |
(2,867 | ) | (2,169 | ) | ||||
| Wood pellets: Industrial |
343 | 326 | ||||||
| Wood pellets: NEWP |
(18 | ) | — | |||||
| Corporate and unallocated expenses |
(2,000 | ) | (513 | ) | ||||
|
|
|
|
|
|||||
| Total other expense, net |
$ | (18,798 | ) | $ | (17,541 | ) | ||
|
|
|
|
|
|||||
66
Table of Contents
RNP – Partnership and Unallocated Expenses
Other expense, net for the year ended December 31, 2014 consists primarily of unallocated interest expense of $19.0 million and loss on debt extinguishment of $0.6 million partially offset by the Agrifos settlement of $5.6 million. Unallocated interest expense represents primarily interest expense on the RNP Notes, which were issued in April 2013. In October 2014, RNP reached an agreement to settle all existing and future indemnity claims it may have under the Membership Interest Purchase Agreement dated October 31, 2012, as amended, pursuant to which RNP acquired the Pasadena Facility from Agrifos Holdings Inc. The parties agreed to distribute $5.0 million of cash and 59,186 RNP common units to RNP held in escrow accounts established at the closing of the acquisition to satisfy potential indemnity claims. The remaining $0.9 million of cash and 264,090 RNP common units held in escrow was released to Agrifos Holdings Inc.
Other expense, net for the year ended December 31, 2013 consists primarily of unallocated interest expense of $14.1 million and loss on debt extinguishment of $6.0 million partially offset by a fair value reduction to earn-out consideration of $ 4.9 million related to the Agrifos Acquisition.
Fulghum Fibres
Other expense, net was $2.9 million for the year ended December 31, 2014, compared to $2.2 million for the same period in the prior year. The increase was primarily due to an increase in interest expense, resulting from additional debt in South America.
Corporate and Unallocated Expenses
Corporate and unallocated expenses recorded as other expense for the year ended December 31, 2014 was $2.0 million compared to $0.5 million for the same period in the prior year. The increase was primarily due to a fair value adjustment to earn-out consideration of $1.2 million related to the NEWP Acquisition and a loss on debt extinguishment of $0.9 million, partially offset by miscellaneous income of $0.4 million.
Discontinued Operations:
Income from discontinued operations, our former energy technologies segment, for the year ended December 31, 2014 was $7.3 million, compared to a loss from discontinued operations of $6.6 million for the same period in the prior year.
Selling, general and administrative costs consist primarily of personnel and travel costs of the personnel team essential to the sale of the operations, insurance costs, security costs and property taxes. Selling, general and administrative expenses were $5.6 million for the year ended December 31, 2014, compared to $7.7 million for the year ended December 31, 2013. The decrease between the periods was due to the elimination of expenses associated with research and development and business development activities, and to costs of terminating our alternative energy operations in 2013.
Research and development expense was $0 for the year ended December 31, 2014, compared to $5.7 million for the year ended December 31, 2013. During 2013, we terminated research and development activities and ceased operations, reduced staff at, and mothballed the PDU.
During the year ended December 31, 2014, we completed the sale of our alternative energy technologies, which resulted in a gain of $15.3 million, and recorded a loss on impairment on the PDU of $2.9 million. During the year ended December 31, 2013, we sold Natchez, which resulted in a gain of $6.3 million. Tax benefit for the years ended December 31, 2014 and 2013 was $1.2 million and $0.3 million, respectively.
THE YEAR ENDED DECEMBER 31, 2013 COMPARED TO THE YEAR ENDED DECEMBER 31, 2012
Continuing Operations:
Revenues
| For the Years Ended December 31, |
||||||||
| 2013 | 2012 | |||||||
| (in thousands) | ||||||||
| Revenues: |
||||||||
| East Dubuque |
$ | 177,700 | $ | 224,205 | ||||
| Pasadena |
133,675 | 37,430 | ||||||
|
|
|
|
|
|||||
| Total RNP |
311,375 | 261,635 | ||||||
| Fulghum Fibres |
62,974 | — | ||||||
|
|
|
|
|
|||||
| Total revenues |
$ | 374,349 | $ | 261,635 | ||||
|
|
|
|
|
|||||
67
Table of Contents
East Dubuque
| For the Year Ended December 31, 2013 |
For the Year Ended December 31, 2012 |
|||||||||||||||
| Tons | Revenue | Tons | Revenue | |||||||||||||
| (in thousands) | (in thousands) | |||||||||||||||
| Revenues: |
||||||||||||||||
| Ammonia |
103 | $ | 66,796 | 149 | $ | 99,378 | ||||||||||
| UAN |
269 | 79,377 | 291 | 94,836 | ||||||||||||
| Urea (liquid and granular) |
43 | 20,455 | 35 | 21,189 | ||||||||||||
| CO2 |
71 | 2,416 | 76 | 2,517 | ||||||||||||
| Nitric Acid |
14 | 5,150 | 14 | 5,016 | ||||||||||||
| Other |
N/A | 3,506 | N/A | 1,269 | ||||||||||||
|
|
|
|
|
|
|
|
|
|||||||||
| Total |
500 | $ | 177,700 | 565 | $ | 224,205 | ||||||||||
|
|
|
|
|
|
|
|
|
|||||||||
Revenues were $177.7 million for the year ended December 31, 2013 compared to $224.2 million for the year ended December 31, 2012. The decrease in revenue for the year ended December 31, 2013 compared to the year ended December 31, 2012 was primarily the result of a decrease in ammonia and UAN sales volumes and sales prices.
Average sales prices per ton for the year ended December 31, 2013 were 3% lower for ammonia and 10% lower for UAN, as compared to the year ended December 31, 2012. These two products comprised 82% of our East Dubuque Facility’s revenues for the year ended December 31, 2013 and 87% for the year ended December 31, 2012. The decrease in sales prices for UAN for the year ended December 31, 2013 as compared to 2012 was due largely to weather. The drought in the Midwestern region of the United States during the spring and summer of 2012 created expectations of poor corn yields and anticipated increases in acreage dedicated to corn in 2013; as a result, fertilizer prices remained high throughout 2012. Nitrogen fertilizer prices then declined significantly in the second half of 2013 as wet weather persisted throughout much of the country which severely limited the spring planting and application season.
During the fourth quarter of 2013, our East Dubuque Facility halted production due to a planned turnaround and a fire. For most of October and a portion of November, we underwent a turnaround, which lasted slightly longer than anticipated due to operating difficulties experienced while commissioning new equipment. Our East Dubuque Facility also operated at reduced rates following the turnaround after the discovery of the need for repairs to the foundation of one of its syngas compressors. At the end of November, we experienced a fire that began in the ammonia converter of the ammonia synthesis loop. As a result of the fire, the production of all products was halted in late November and for most of December. During the turnaround and the aftermath of the fire, we were able to continue shipments of our products from inventory. These fourth quarter events were the primary reason why ammonia and UAN sales volume decreased between the years ended December 31, 2013 and 2012.
Other revenue consists primarily of sales of excess inventory of natural gas. Sales of natural gas for the year ended December 30, 2013 was $3.4 million, compared to $1.1 million for the year ended December 31, 2012.
Pasadena
| For the Year Ended December 31, 2013 |
For the Year Ended December 31, 2012 |
|||||||||||||||
| Tons | Revenue | Tons | Revenue | |||||||||||||
| (in thousands) | (in thousands) | |||||||||||||||
| Revenues: |
||||||||||||||||
| Ammonium sulfate |
428 | $ | 107,435 | 115 | $ | 34,493 | ||||||||||
| Sulfuric acid |
148 | 13,514 | 27 | 2,586 | ||||||||||||
| Ammonium thiosulfate |
54 | 10,221 | — | — | ||||||||||||
| Other |
N/A | 2,505 | N/A | 351 | ||||||||||||
|
|
|
|
|
|
|
|
|
|||||||||
| Total |
630 | $ | 133,675 | 142 | $ | 37,430 | ||||||||||
|
|
|
|
|
|
|
|
|
|||||||||
68
Table of Contents
Revenues were $133.7 million for the year ended December 31, 2013, compared to $37.4 million for the year ended December 31, 2012. The increase in revenue for the year ended December 31, 2013 compared to the year ended December 31, 2012 reflects our full year of ownership of the Pasadena Facility.
Average sales prices per ton decreased by 16% for ammonium sulfate and by 5% for sulfuric acid for the year ended December 31, 2013 as compared with the year ended December 31, 2012. These two products comprised 90% of our Pasadena Facility’s revenues for the year ended December 31, 2013 and 99% for the year ended December 31, 2012.The decrease in sales prices for the ammonium sulfate for the year ended December 31, 2013 was in part a result of weather which delayed the application of the product. During the year ended December 31, 2013 significant volumes of urea were exported from China and this supply also suppressed global urea and other nitrogen fertilizer prices. The sales price for ammonium sulfate has significantly worsened and still remains low. Our Pasadena Facility also underwent a turnaround in December 2013, which lasted a little longer than anticipated due to issues with a contractor and weather delays, and experienced several relatively small disruptions in production that reduced production during 2013. During the turnaround, we conducted scheduled debottlenecking and reliability improvement projects. Our Pasadena Facility was off-line for three weeks in December 2013.
Fulghum Fibres
| For the Year Ended December 31, 2013 |
||||
| (in thousands) | ||||
| Revenues: |
||||
| Service |
$ | 49,822 | ||
| Product |
13,152 | |||
|
|
|
|||
| Total revenues |
$ | 62,974 | ||
|
|
|
|||
Fulghum’s operations are included in our historical operating results only from the closing date of the Fulghum Acquisition, which was May 1, 2013. Revenues for the year ended December 31, 2013 were $63.0 million, of which $40.7 million were from sales in the United States and $22.3 million were from sales in South America. During the eight months ended December 31, 2013, our mills in the United States processed 8.4 million GMT of logs into wood chips and residual fuels; our mills in South America processed 1.5 million GMT of logs.
Cost of Sales
| For the Years Ended December 31, |
||||||||
| 2013 | 2012 | |||||||
| (in thousands) | ||||||||
| Cost of sales: |
||||||||
| East Dubuque |
$ | 96,817 | $ | 90,662 | ||||
| Pasadena |
143,204 | 39,134 | ||||||
|
|
|
|
|
|||||
| Total RNP |
240,021 | 129,796 | ||||||
| Fulghum Fibres |
50,942 | — | ||||||
|
|
|
|
|
|||||
| Total cost of sales |
$ | 290,963 | $ | 129,796 | ||||
|
|
|
|
|
|||||
East Dubuque
Cost of sales was $96.8 million for the year ended December 31, 2013 compared to $90.7 million for the year ended December 31, 2012. The increase in cost of sales was primarily due to turnaround expenses in 2013 of $7.9 million, higher market prices for natural gas which increased the cost of natural gas by $2.7 million, fixed operating costs while idle of $4.3 million, and the $1.0 million insurance deductible for the fire which occurred in late November 2013, all of which were partially offset by lower sales volumes. Turnaround expenses represent the cost of maintenance during turnarounds, which occur every two years. A facility turnaround at the East Dubuque Facility occurred in October and November of 2013. The East Dubuque Facility has fixed production costs that it incurs whether or not the facility is operating. These production costs are recorded directly to cost of sales when the facility is idle. RNP filed an insurance claim for $2.7 million related to damage caused by the fire, and incurred the $1.0 million deductible under its property insurance policy in 2013. RNP received payment of $1.7 million for the claim in 2014.
69
Table of Contents
Natural gas costs comprised 43% of cost of sales for each of the years ended December 31, 2013 and December 31, 2012. Labor costs comprised 12% of cost of sales for the year ended December 31, 2013 compared to 14% of cost of sales for the same period in the prior year. Depreciation expense included in cost of sales was $9.0 million, or 10% of cost of sales, for the year ended December 31, 2013, and $10.7 million, or 12% of cost of sales, for year ended December 31, 2012.
Pasadena
Costs of sales were $143.2 million for the year ended December 31, 2013 compared to $39.1 million for the year ended December 31, 2012. The increase in cost of sales for the year ended December 31, 2013 compared to the year ended December 31, 2012 reflects our full year of ownership of the Pasadena Facility. Cost of sales consists primarily of expenses for ammonia, sulfur, labor and depreciation. Ammonia and sulfur together comprised 59% of cost of sales for the year ended December 31, 2013, compared to 64% for the year ended December 31, 2012. Labor costs comprised 7% of cost of sales for the year ended December 31, 2013, compared to 5% for the year ended December 31, 2012. Depreciation expense included in cost of sales was $4.2 million for the year ended December 31, 2013 and $0.4 million for the year ended December 31, 2012. During the year ended December 31, 2013, we incurred a write-down of ammonium sulfate, sulfur and sulfuric acid inventory to market value of $12.4 million due primarily to lower market prices of ammonium sulfate, in accordance with accounting guidance. Cost of sales includes turnaround expenses of $1.7 million. Turnaround expenses represent the cost of maintenance during turnarounds, which occur every two years.
Cost of sales also includes maintenance expenses. Turnaround at the sulfuric acid plant occurred in November 2012. As a result, we incurred turnaround expenses of $0.8 million. The turnaround was originally scheduled for the first quarter of 2013, but due to two unexpected outages at the sulfuric acid plant, we decided to conduct the turnaround early. As a result of the two unexpected outages, we incurred $0.5 million in additional expenses. The acquisition method of accounting required that the inventory be recognized at fair value as of the closing date of the Agrifos Acquisition. This resulted in the value of inventory, which was sold during the two-month period ended December 31, 2012, being increased by $3.4 million.
Fulghum Fibres
Product costs amounted to 25% of the cost of sales for the year ended December 31, 2013 and include expenses related to the sale of wood fibre products and the export of those products. Service costs amounted to 75% of the cost of sales for the year ended December 31, 2013 and include the cost of chip mill operations, primarily consisting of labor costs, repairs and maintenance, depreciation and utilities. Labor costs comprised 26% of the cost of sales for the year ended December 31, 2013, while repairs and maintenance and utilities comprised 32% of such cost of sales. Depreciation expense included in cost of sales was $4.8 million during the same period.
Gross Profit (Loss)
| For the Years Ended December 31, |
||||||||
| 2013 | 2012 | |||||||
| (in thousands) | ||||||||
| Gross profit (loss): |
||||||||
| East Dubuque |
$ | 80,883 | $ | 133,543 | ||||
| Pasadena |
(9,529 | ) | (1,704 | ) | ||||
|
|
|
|
|
|||||
| Total RNP |
71,354 | 131,839 | ||||||
| Fulghum Fibres |
12,032 | — | ||||||
|
|
|
|
|
|||||
| Total gross profit |
$ | 83,386 | $ | 131,839 | ||||
|
|
|
|
|
|||||
East Dubuque
Gross profit was $80.9 million for the year ended December 31, 2013 compared to $133.5 million for the same period in the prior year. Gross profit margin was 46% for the year ended December 31, 2013 as compared to 60% for the same period in the prior year.
Gross profit margin can vary significantly from period to period due to changes in nitrogen fertilizer prices and natural gas costs, both of which are commodities. The prices of these commodities can vary significantly from period to period and do not always move in the same direction. In addition, there are certain fixed costs of operating our East Dubuque Facility that are recorded in cost of sales and whose impact on gross profit and gross margins varies as product sales volumes vary seasonally. The decrease in gross profit margin during the year ended December 31, 2013 was primarily due to a decrease in revenues and an increase in cost of sales as described above.
70
Table of Contents
Pasadena
Gross loss margins for the year ended December 31, 2013 was 7% and 5% for the year ended December 31, 2012. Gross loss for year ended December 31, 2013 is due to lower ammonium sulfate sale prices and the write-down of inventory, as described above. Similar to our East Dubuque Facility, gross profit margin can vary significantly from period to period due to changes in the prices of nitrogen fertilizer, ammonia and sulfur, which are commodities. The prices of these commodities can vary significantly from period to period and do not always move in the same direction. In addition, there are certain fixed costs of operating our Pasadena Facility that are recorded in cost of sales and whose impact on gross profit and gross margins varies as product sales volumes vary seasonally. Moreover, forward sales contracts have not developed for ammonium sulfate to the extent that they have for other nitrogen fertilizer products, so it is not possible to lock product prices and input prices at the same time, as has been our practice for a portion of the sales of the most important products of our East Dubuque Facility. Since input prices for ammonium sulfate are typically fixed several months before the corresponding product price, margins may be compressed during a declining commodity market. Gross loss for year ended December 31, 2012 was primarily due to reduced margins due to the write-up of inventory to fair value, along with the turnaround expenses at the sulfuric acid plant and expenses related to two unexpected outages of the sulfuric acid plant.
Fulghum Fibres
Gross profit for the year ended December 31, 2013 (period May 1, 2013 through December 31, 2013) was $12.0 million and gross profit margin for the same period was 19%.
Operating Expenses
| For the Years Ended December 31, |
||||||||
| 2013 | 2012 | |||||||
| (in thousands) | ||||||||
| Operating expenses: |
||||||||
| East Dubuque |
$ | 5,573 | $ | 7,559 | ||||
| Pasadena |
38,679 | 944 | ||||||
| RNP – partnership and unallocated expenses |
7,945 | 11,773 | ||||||
|
|
|
|
|
|||||
| Total RNP |
52,197 | 20,276 | ||||||
| Fulghum Fibres |
2,118 | — | ||||||
| Wood Pellets: Industrial |
5,505 | 1,919 | ||||||
| Corporate and unallocated expenses |
25,445 | 24,186 | ||||||
|
|
|
|
|
|||||
| Total operating expenses |
$ | 85,265 | $ | 46,381 | ||||
|
|
|
|
|
|||||
East Dubuque
Operating expenses were $5.6 million for the year ended December 31, 2013 compared to $7.6 million for the same period in the prior year. These expenses were primarily comprised of selling, general and administrative expense and depreciation expense.
Selling, General and Administrative Expenses. Selling, general and administrative expenses were $4.6 million for the year ended December 31, 2013 compared to $6.2 million for the same period in the prior year. This decrease was primarily due to decreases in various professional services fees of $0.6 million, salaries of $0.4 million and debt related expenses of $0.4 million.
Depreciation and Amortization. Depreciation expense for the year ended December 31, 2013 was $0.2 million, compared to $0.8 million for the year ended December 31, 2012. This decrease was primarily due to the acceleration of depreciation in 2012 on an asset that was dismantled as part of the ammonia production and storage capacity expansion project and certain software having been fully depreciated. A portion of depreciation expense is associated with assets supporting general and administrative functions and is recorded in operating expense. The majority of depreciation expense, as a manufacturing cost, is distributed between cost of sales and finished goods inventory, based on production volumes and inventory levels.
Pasadena
Operating expenses were $38.7 million for the year ended December 31, 2013 compared to $0.9 million for the same period in the prior year. These expenses were primarily comprised of selling, general and administrative expense, depreciation expense and Pasadena goodwill impairment.
71
Table of Contents
Selling, General and Administrative Expenses. Selling, general and administrative expenses were $4.8 million for the year ended December 31, 2013. These expenses are for general administrative purposes at our Pasadena Facility, such as general management salaries and travel, legal, consulting, information technology, and banking fees. Selling, general and administrative expenses for the year ended December 31, 2013 included $0.7 million in integration related expenses.
Depreciation and Amortization. Amortization expense was $3.9 million for the year ended December 31, 2013. This amount represents amortization of intangible assets. The depreciation expense relating to fixed assets is a manufacturing cost which is distributed between cost of sales and finished goods inventory, based on production volumes and inventory levels.
Pasadena Goodwill Impairment. Pasadena goodwill impairment was $30.0 million for the year ended December 31, 2013. See “Note 12 — Goodwill” to the consolidated financial statements included in “Part II — Item 8. Financial Statements and Supplementary Data”.
RNP – Partnership and Unallocated Expenses
Partnership and unallocated expenses recorded as selling, general and administrative expenses for the year ended December 31, 2013 were $7.9 million, compared to $11.8 million for the same period in the prior year. The decrease was primarily due to decreases in business development expenses of $3.5 million and unit-based compensation of $1.4 million, partially offset by increases in various professional services fees of $0.5 million and salaries of $0.5 million.
Fulghum Fibres
Operating expenses were comprised of selling, general and administrative expense and depreciation and amortization expense. Selling, general and administrative expenses for the year ended December 31, 2013 were $3.8 million. These expenses are for general administrative purposes, such as costs associated with general management personnel, travel, legal, office space, consulting, and information technology. Depreciation and amortization expense included in operating expense for the year ended December 31, 2013 was ($1.7) million. Amortization of unfavorable processing agreements exceeded amortization of favorable processing agreements resulting in a credit in depreciation and amortization expense. The majority of depreciation expense relates to wood chip processing assets and was recorded in cost of sales.
Wood Pellets: Industrial
Operating expenses were primarily comprised of selling, general and administrative expenses, which include personnel costs, travel, acquisition-related and development costs associated with the Atikokan and Wawa Projects, and other business development costs. Our operating expenses are not indicative of the amount of operating expenses we expect after the Atikokan and Wawa Facilities are commissioned and operating. Once we begin producing and selling wood pellets, certain expenses currently recorded as operating expenses will be capitalized to product inventory and included in cost of sales when the inventories are sold.
Corporate and Unallocated Expenses
Operating expenses consist primarily of selling, general and administrative expense and depreciation and amortization expense. Selling, general and administrative expenses were $24.8 million for the year ended December 31, 2013 compared to $23.4 million for the same period in the prior year.
Operating Income (Loss)
| For the Years Ended December 31, |
||||||||
| 2013 | 2012 | |||||||
| (in thousands) | ||||||||
| Operating income (loss): |
||||||||
| East Dubuque |
$ | 75,310 | $ | 125,984 | ||||
| Pasadena |
(48,208 | ) | (2,648 | ) | ||||
| RNP – partnership and unallocated expenses |
(7,945 | ) | (11,773 | ) | ||||
|
|
|
|
|
|||||
| Total RNP |
19,157 | 111,563 | ||||||
| Fulghum Fibres |
9,914 | — | ||||||
| Wood Pellets: Industrial |
(5,505 | ) | (1,919 | ) | ||||
| Corporate |
(25,445 | ) | (24,186 | ) | ||||
|
|
|
|
|
|||||
| Total operating loss |
$ | (1,879 | ) | $ | 85,458 | |||
|
|
|
|
|
|||||
72
Table of Contents
East Dubuque
Operating income was $75.3 million for the year ended December 31, 2013 compared to $126.0 million for the same period in the prior year. The decrease was primarily due to lower revenues and higher cost of sales partially offset by lower selling, general and administrative expenses and depreciation and amortization expense as described above.
Pasadena
Operating loss for the year ended December 31, 2013 was $48.2 million, compared to operating loss of $2.6 million for the same period in the prior year. The increase in operating loss was due to lower ammonium sulfate sale prices, the write-down of inventory and the Pasadena goodwill impairment, as described above.
RNP – Partnership and Unallocated Expenses
Operating loss was $7.9 million for the year ended December 31, 2013 compared to operating loss of $11.8 million for the same period in the prior year. The decrease in operating loss was due to operating expenses as described above.
Fulghum Fibres
Operating income was $9.9 million for the year ended December 31, 2013 (period May 1, 2013 through December 31, 2013).
Wood Pellets: Industrial
Operating loss was $5.5 million for the year ended December 31, 2013 compared to $1.9 million for the same period in the prior year. The increase was due to operating expenses as described above.
Corporate and Unallocated Expenses
Operating loss for the year ended December 31, 2013 was $25.4 million, compared to $24.2 million for the same period in the prior year.
Other Income (Expense), Net
| For the Years Ended December 31, |
||||||||
| 2013 | 2012 | |||||||
| (in thousands) | ||||||||
| Other income (expense), net: |
||||||||
| East Dubuque |
$ | — | $ | (2,263 | ) | |||
| Pasadena |
(8 | ) | — | |||||
| RNP – unallocated interest expense and other |
(15,177 | ) | (1,994 | ) | ||||
|
|
|
|
|
|||||
| Total RNP |
(15,185 | ) | (4,257 | ) | ||||
| Fulghum Fibres |
(2,169 | ) | — | |||||
| Wood Pellets: Industrial |
326 | — | ||||||
| Corporate and unallocated expenses |
(513 | ) | (11,763 | ) | ||||
|
|
|
|
|
|||||
| Total other expense, net |
$ | (17,541 | ) | $ | (16,020 | ) | ||
|
|
|
|
|
|||||
East Dubuque
Other expense, net was $0 for the year ended December 31, 2013 compared to $2.3 million for the same period in the prior year. The entry into the credit agreement entered into in October 2012, or the Second 2012 Credit Agreement, and the payoff of the credit agreement entered into in February 2012, or the First 2012 Credit Agreement, resulted in a loss on debt extinguishment of $2.1 million for the year ended December 31, 2012.
73
Table of Contents
RNP – Partnership and Unallocated Expenses
Other expense, net consists primarily of unallocated interest expense of $14.1 million and loss on debt extinguishment of $6.0 million partially offset by fair value adjustment to earn-out consideration of $ 4.9 million. Unallocated interest expense for the year ended December 31, 2013 represents primarily interest expense on the RNP Notes.
Corporate and Unallocated Expenses
Corporate and unallocated expenses recorded as other expense for the year ended December 31, 2012 consists primarily of loss on debt extinguishment relating to the convertible notes due in 2013, or the Convertible Notes. On December 31, 2012, the Convertible Notes were completely redeemed for cash and the unamortized debt discount and debt issuance costs were written off, which resulted in a loss on debt extinguishment of $2.7 million. Corporate and unallocated interest expense for the year ended December 31, 2012 consists primarily of interest expense on the Convertible Notes.
Discontinued Operations:
Loss from discontinued operations, our former energy technologies segment, for the year ended December 31, 2013 was $6.6 million, compared to a loss of $37.4 million for the same period in the prior year.
Selling, general and administrative expenses were $7.7 million for the year ended December 31, 2013 compared to $4.5 million for the same period in the prior year. The increase was primarily due to the inclusion of $4.4 million in costs that were previously reported as research and development expense partially offset by a decrease in project development costs of $0.9 million. These former research and development costs include third party costs of $1.4 million in support of de-commissioning the PDU, labor cost of $0.9 million, patent costs of $0.8 million and various taxes of $1.1 million.
Research and development expense was $5.7 million for the year ended December 31, 2013 compared to $20.9 million for the same period in the prior year. The decrease was due to terminating research and development activities and ceasing operations, reducing staff at, and mothballing the PDU.
During the year ended December 31, 2013, we sold the Natchez site which resulted in a gain of $6.3 million. During the year ended December 31, 2012, we recorded loss on impairments primarily relating to the capitalized SilvaGas patents and goodwill from the acquisition of ClearFuels in the amounts of $8.5 million and $7.2 million, respectively, for a loss on impairments of $15.7 million.
Tax benefit was $0.3 million for the year ended December 31, 2013 compared to tax benefit of $3.0 million for the same period in the prior year.
INFLATION
Inflation has and is expected to have an insignificant impact on our results of operations and sources of liquidity.
ADJUSTED EBITDA
RNP’s Adjusted EBITDA is defined as RNP’s net income (loss) plus: interest expense and other financing costs, Pasadena goodwill impairment, loss on debt extinguishment, loss on interest rate swaps, income tax (benefit) expense, depreciation and amortization, and acquisition costs less the Agrifos settlement and fair value adjustment to earn-out consideration. Fulghum’s Adjusted EBITDA is defined as Fulghum’s net income plus interest expense and other financing costs, depreciation and amortization, and income tax expense. NEWP’s Adjusted EBITDA is defined as NEWP’s net income plus interest expense and other financing costs, depreciation and amortization, and income tax expense. Adjusted EBITDA is used as a supplemental financial measure by management and by external users of our consolidated financial statements, such as investors and commercial banks, to assess:
| • | the financial performance of our assets without regard to financing methods, capital structure or historical cost basis; and |
| • | our operating performance and return on invested capital compared to those of other publicly traded limited partnerships and other public companies, without regard to financing methods and capital structure. |
Adjusted EBITDA should not be considered an alternative to net income, operating income, net cash provided by operating activities or any other measure of financial performance or liquidity presented in accordance with GAAP. Adjusted EBITDA may have material limitations as a performance measure because it excludes items that are necessary elements of our costs and operations. In addition, Adjusted EBITDA presented by other companies may not be comparable to our presentation, since each company may define these terms differently.
74
Table of Contents
The table below reconciles RNP’s Adjusted EBITDA, which is a non-GAAP financial measure, to net income (loss) for RNP for the periods presented.
| Year Ended December 31, | ||||||||||||
| 2014 | 2013 | 2012 | ||||||||||
| (unaudited, in thousands) | ||||||||||||
| Consolidated net income (loss) |
$ | (32,504 | ) | $ | 38 | $ | 27,687 | |||||
| Add back: non-RNP loss |
31,442 | 4,030 | 79,316 | |||||||||
|
|
|
|
|
|
|
|||||||
| RNP net income (loss) |
$ | (1,062 | ) | $ | 4,068 | $ | 107,003 | |||||
| Add RNP Items: |
||||||||||||
| Net interest expense |
19,057 | 14,098 | 1,424 | |||||||||
| Pasadena goodwill impairment |
27,202 | 30,029 | — | |||||||||
| Agrifos settlement |
(5,632 | ) | — | — | ||||||||
| Loss on debt extinguishment |
635 | 6,001 | 2,114 | |||||||||
| Gain on fair value adjustment to earn-out consideration |
— | (4,920 | ) | — | ||||||||
| Loss on interest rate swaps |
— | 7 | 951 | |||||||||
| Income tax (benefit) expense |
18 | (96 | ) | 303 | ||||||||
| Depreciation and amortization |
24,257 | 17,312 | 12,460 | |||||||||
| Acquisition costs |
— | — | 4,131 | |||||||||
| Other |
202 | (1 | ) | (232 | ) | |||||||
|
|
|
|
|
|
|
|||||||
| RNP’s Adjusted EBITDA |
$ | 64,677 | $ | 66,498 | $ | 128,154 | ||||||
|
|
|
|
|
|
|
|||||||
The table below reconciles Fulghum’s Adjusted EBITDA, which is a non-GAAP financial measure, to segment net income for Fulghum. For the year ended December 31, 2013, the period only reflects operations from the date of acquisition, May 1, 2013, through December 31, 2013.
| Year Ended December 31, | ||||||||
| 2014 | 2013 | |||||||
| (unaudited, in thousands) | ||||||||
| Fulghum net income per segment disclosure |
$ | 75 | $ | 6,967 | ||||
| Add Fulghum Items: |
||||||||
| Net interest expense |
2,578 | 1,755 | ||||||
| Depreciation and amortization |
9,462 | 3,128 | ||||||
| Income tax expense |
584 | 536 | ||||||
| Other |
682 | 656 | ||||||
|
|
|
|
|
|||||
| Fulghum’s Adjusted EBITDA |
$ | 13,381 | $ | 13,042 | ||||
|
|
|
|
|
|||||
The table below reconciles NEWP’s Adjusted EBITDA, which is a non-GAAP financial measure, to segment net income for NEWP, from the date of the acquisition, May 1, 2014, through December 31, 2014.
| Year Ended December 31, 2014 |
||||
| (unaudited, in thousands) |
||||
| NEWP net income per segment disclosure |
$ | 4,342 | ||
| Add NEWP Items: |
||||
| Net interest expense |
301 | |||
| Depreciation and amortization |
1,967 | |||
| Income tax expense |
29 | |||
| Other |
(283 | ) | ||
|
|
|
|||
| NEWP’s Adjusted EBITDA |
$ | 6,356 | ||
|
|
|
|||
75
Table of Contents
ANALYSIS OF CASH FLOWS
The following table summarizes our Consolidated Statements of Cash Flows:
| Year the Years Ended December 31, |
||||||||||||
| 2014 | 2013 | 2012 | ||||||||||
| (in thousands) | ||||||||||||
| Net Cash Provided by (Used in): |
||||||||||||
| Operating activities |
$ | 24,935 | $ | 12,354 | $ | 70,237 | ||||||
| Investing activities |
(190,011 | ) | (162,194 | ) | (188,198 | ) | ||||||
| Financing activities |
103,118 | 114,473 | 22,219 | |||||||||
| Effect of exchange rate on cash |
(216 | ) | — | — | ||||||||
|
|
|
|
|
|
|
|||||||
| Net Increase (Decrease) in Cash |
$ | (62,174 | ) | $ | (35,367 | ) | $ | (95,742 | ) | |||
|
|
|
|
|
|
|
|||||||
In the consolidated statements of cash flows, the cash flows of discontinued operations are not separately classified or aggregated, and are reported in the respective categories with those of continuing operations.
Operating Activities
Net cash provided by operating activities for the year ended December 31, 2014 was $24.9 million. We had net loss of $32.5 million for the year ended December 31, 2014, including a goodwill impairment charge of $27.2 million, which relates to the Agrifos Acquisition. For the year ended December 31, 2014, we had a net gain on sale of assets of $14.7 million, which consisted of a gain of $15.3 million related to the sale of our alternative energy technologies, partially offset by an increase of $0.8 million in the asset retirement obligation related to Natchez. The gain on sale and the loss related to asset retirement obligation were recorded in discontinued operations. We also had non-cash equity-based compensation expense of $6.8 million during the year ended December 31, 2014. In 2014, we recorded an impairment of $2.9 million for the PDU, which was recorded in discontinued operations. We had a loss on natural gas derivatives of $4.0 million relating to our East Dubuque Facility’s forward purchase natural gas contracts. Accounts receivable increased by $17.0 million due primarily to collections timing at our Pasadena Facility and higher ammonia deliveries at our East Dubuque Facility during the year ended December 31, 2014.
Net cash provided by operating activities for the year ended December 31, 2013 was $12.4 million. We had net income of $38,000 for the year ended December 31, 2013. For the year ended December 31, 2013, we had Pasadena goodwill impairment of $30.0 million. During this period, we issued the RNP Notes and paid off the outstanding principal balance under our Second 2012 Credit Agreement, which resulted in a loss on the extinguishment of debt of $6.0 million. We also had equity-based compensation expense of $7.4 million. Due to the fire and the resulting interruption of production, our East Dubuque Facility had excess natural gas which it sold. Accrued interest increased by $4.1 million due primarily to the RNP Notes. Deferred income tax benefit of $27.1 million was due primarily to the release of income tax valuation allowances resulting from recording deferred tax liabilities related to the Fulghum Acquisition.
Net cash provided by operating activities for the calendar year ended December 31, 2012 was $70.2 million. We had net income of $27.7 million for the calendar year ended December 31, 2012. During this period, we recorded loss on impairments relating to the capitalized SilvaGas patents and goodwill from the acquisition of ClearFuels in the amounts of $8.5 million and $7.2 million, respectively, which accounted for $15.7 million out of the total loss on impairments of 16.0 million. We entered into our Second 2012 Credit Agreement and paid off the outstanding principal balance under our First 2012 Credit Agreement. This transaction resulted in a loss on the extinguishment of debt of $2.1 million. As a result of redeeming the Convertible Notes prior to maturity, the unamortized debt discount and debt issuance costs were written off which resulted in a loss on debt extinguishment of $2.7 million. These two transactions resulted in a loss on debt extinguishment of $4.8 million for the calendar year ended December 31, 2012. We also had equity-based compensation expense of $10.8 million. Deposits on natural gas contracts decreased by $2.8 million due to obtaining lines of credit with two natural gas vendors that had previously required prepayment. Accrued liabilities decreased by $23.4 million due to the payment of income taxes of $8.1 million relating to the sale of the 39.2% of RNP outstanding common units in the offering, an $3.1 million reduction in liability for sales and use taxes relating to the PDU and our Pasadena Facility decreasing their accrued liabilities by $9.1 million primarily due to the payment of bonuses of $7.2 million, which was partially offset by our East Dubuque Facility increasing their accrued liabilities primarily from amounts due to customers for recent overpayments and refunds on prepaid contracts that we chose to cancel.
76
Table of Contents
Investing Activities
Net cash used in investing activities was $190.0 million for the year ended December 31, 2014, $162.2 million for the year ended December 31, 2013, and $188.2 million for the year ended December 31, 2012. Net cash used in investing activities for the year ended December 31, 2014 was primarily related to capital expenditures of $174.5 million to construct the Atikokan and Wawa Projects, to upgrade a nitric acid compressor train and complete our urea expansion project at our East Dubuque Facility, and to construct the power generation project and replace the sulfuric acid converter at our Pasadena Facility. During the period, we also completed the NEWP Acquisition for net cash of $31.6 million and sold the alternative energy technologies business and some related equipment, which resulted in cash receipts of $14.8 million.
During the year ended December 31, 2013, we paid approximately $53.2 million, net of cash received, for the Fulghum Acquisition, $6.2 million for the Wawa Project and $4.9 million for the Atikokan Project. Also during the period, we had capital expenditures of $104.7 million related to the ammonia production and storage capacity expansion project at our East Dubuque Facility, and the ammonium sulfate debottlenecking and production capacity project, the power generation project and the initial phases of the sulfuric acid converter replacement project at our Pasadena Facility.
During the year ended December 31, 2012, we paid $128.6 million, net of cash received, for the Agrifos Acquisition. The amount for purchase of property, plant, equipment and construction in progress of $59.1 million for the year ended December 31, 2012 relates primarily to the ammonia production and storage capacity expansion project, the urea expansion project and the DEF build-out.
Financing Activities
Net cash provided by financing activities was $103.1 million for the year ended December 31, 2014. During the year ended December 31, 2014, we issued the 2014 Preferred Stock for an aggregate purchase price of $94.5 million (reflecting an issuance discount of 2% and other costs) and entered into the GSO Credit Agreement, borrowing $50.0 million under the facility. During the period, we also paid off the outstanding balance of $50.0 million under a $100.0 million revolving loan facility existing at that time. During the year ended December 31, 2014, we made debt payments of $61.5 million and dividend payments to preferred stockholders of $2.9 million, and RNP made cash distributions to holders of noncontrolling interests of $4.9 million.
Net cash provided by financing activities was $114.5 million for the year ended December 31, 2013. During the year ended December 31, 2013, we issued the RNP Notes for $320.0 million and paid off the Second 2012 Credit Agreement in the amount of $205.0 million. We also entered into the RNHI Revolving Loan and borrowed $50.0 million under such facility, and RNP paid distributions to noncontrolling interests of $37.3 million.
Net cash provided by financing activities was $22.2 million for the year ended December 31, 2012. During the year ended December 31, 2012, RNP had borrowings under its Second 2012 Credit Agreement and its First 2012 Credit Agreement which totaled $222.8 million and repaid borrowings under our First 2012 Credit Agreement of $29.5 million. We also redeemed the Convertible Notes for cash of $57.5 million and paid distributions of $43.3 million. RNP paid distributions to noncontrolling interests of $47.2 million.
LIQUIDITY AND CAPITAL RESOURCES
At December 31, 2014, our current assets and current liabilities consisted of the following:
| Excluding RNP | RNP | Rentech, Inc. Consolidated |
||||||||||
| (in thousands) | ||||||||||||
| Cash |
$ | 16,167 | $ | 28,028 | $ | 44,195 | ||||||
| Accounts receivable |
16,905 | 16,714 | 33,619 | |||||||||
| Inventories |
10,349 | 27,736 | 38,085 | |||||||||
| Other current assets |
18,733 | 5,299 | 24,032 | |||||||||
|
|
|
|
|
|
|
|||||||
| Total current assets |
$ | 62,154 | $ | 77,777 | $ | 139,931 | ||||||
|
|
|
|
|
|
|
|||||||
|
Accounts payable |
$ | 16,593 | $ | 14,846 | $ | 31,439 | ||||||
| Accrued liabilities |
27,353 | 17,238 | 44,591 | |||||||||
| Debt |
17,784 | — | 17,784 | |||||||||
| Other current liabilities |
11,743 | 31,194 | 42,937 | |||||||||
|
|
|
|
|
|
|
|||||||
| Total current liabilities |
$ | 73,473 | $ | 63,278 | $ | 136,751 | ||||||
|
|
|
|
|
|
|
|||||||
77
Table of Contents
We had long-term liabilities of $472.5 million, comprised primarily of the RNP Notes, Fulghum debt, GSO Credit Agreement, NEWP debt, and the financing obligation with respect to the construction of assets by QSL, or the QS Construction Facility.
At December 31, 2014, our debt consisted of the following:
| Excluding RNP | RNP | Rentech, Inc. Consolidated |
||||||||||
| (in thousands) | ||||||||||||
| RNP Notes |
$ | — | $ | 320,000 | $ | 320,000 | ||||||
| GSO Credit Agreement |
50,000 | — | 50,000 | |||||||||
| GE Credit Agreement |
— | 15,000 | 15,000 | |||||||||
| Fulghum debt(1) |
53,179 | — | 53,179 | |||||||||
| NEWP debt(2) |
10,913 | — | 10,913 | |||||||||
| QS Construction Facility |
18,679 | — | 18,679 | |||||||||
|
|
|
|
|
|
|
|||||||
| Total debt |
$ | 132,771 | $ | 335,000 | $ | 467,771 | ||||||
|
|
|
|
|
|
|
|||||||
| (1) | The Fulghum debt consists primarily of 19 term loans and seven short term lines of credit with various financial institutions with each loan secured by specific property and equipment. |
| (2) | The NEWP debt consists primarily of three term loans with each term loan secured by specific property and equipment. |
Cash can be distributed to us from our subsidiaries to the extent that such distributions are permitted in our debt agreements. We do not have direct access to RNP’s cash. Any cash received from RNP is in the form of distributions received on a pro rata basis with other RNP unitholders.
Management believes we have adequate liquidity from operations, our existing credit facilities and working capital to meet our obligations for the coming year. We entered into the A&R GSO Credit Agreement in part to secure funds in order to pay down our accounts payable and accrued liabilities, which included invoices for construction of our two wood pellet projects in Canada. After December 31, 2014, we borrowed $25.0 million under this facility.
On February 17, 2015, RNP announced that the General Partner’s board of directors has initiated a process to explore and evaluate potential strategic alternatives for RNP, which may include a sale of RNP, a merger with another party, a sale of some or all of its assets, or another strategic transaction. We own approximately 60% of RNP’s common units and receive approximately 60% of any quarterly cash distributions from RNP. While there can be no assurance that this strategic review process will result in a transaction, if RNP does consummate a transaction, it is expected to have a significant impact on our liquidity. For example, if RNP were to be purchased by or merge with another company, then we may receive equity securities, cash or a combination of both from the acquiring party in exchange for our RNP common units. Future cash distributions from RNP may be reduced or eliminated depending on the structure of such a transaction. Such a transaction could also constitute a change of control as defined in the A&R GSO Credit Agreement, the Subscription Agreement, the Indenture and the GE Credit Agreement. Upon the occurrence of a change of control of RNP, we may be required to repay all of the loans under the A&R GSO Credit Agreement and to repurchase some or all of our Series E Preferred Stock at a repurchase price equal to $1,000 per share (as adjusted for any stock splits, stock dividends, recapitalizations or the like), plus all accrued and unpaid dividends thereon. Further, upon the occurrence of such a change of control, RNP may be required to repay all of the loans under the GE Credit Agreement and to repurchase some or all of the RNP Notes at a repurchase price equal to 101% of their face amount, plus any accrued and unpaid interest.
RNP Activities
Sources of Capital
Our principal sources of capital at RNP have historically been cash from operations, the proceeds of RNP’s initial public offering, and borrowings. RNP’s current outstanding debt obligations are the RNP Notes and the GE Credit Agreement. We expect to be able to fund RNP’s operating needs, including maintenance capital expenditures, from RNP’s operating cash flow, cash on hand at RNP and borrowings under the GE Credit Agreement, for at least the next 12 months. We expect to fund RNP’s announced expansion projects through borrowings under the GE Credit Agreement. If additional expansion projects were to exceed the capacity available under the GE Credit Agreement, we would need to fund them with new capital at RNP, which may be limited as described below under the heading “Restrictions on Sales of RNP Common Units”.
78
Table of Contents
Capital markets have experienced periods of significant volatility in the recent past, and access to those markets may become difficult. If we need to access capital markets, we cannot assure you that we will be able to do so on acceptable terms, or at all.
RNP Notes
The RNP Notes, with a principal amount of $320.0 million, bear interest at a rate of 6.5% per year, and are payable semi-annually in arrears on April 15 and October 15 of each year. The RNP Notes will mature on April 15, 2021, unless repurchased or redeemed earlier in accordance with their terms.
The Indenture governing the RNP Notes prohibits RNP from making distributions to its common unitholders (including us) if any Default (except a Reporting Default) or Event of Default (each as defined in the Indenture) exists. In addition, the Indenture contains covenants that may limit RNP’s ability to pay distributions to its common unitholders. The effect, if any, of the covenants depends on RNP’s Fixed Charge Coverage Ratio (as defined in the Indenture). If the Fixed Charge Coverage Ratio is equal to or greater than 1.75 to 1.00, RNP will generally be permitted to make distributions to its common unitholders under the Indenture. If the Fixed Charge Coverage ratio is less than 1.75 to 1.00, RNP may make distributions to its common unitholders in an amount not exceed $60.0 million. For the year ended December 31, 2014, RNP’s Fixed Charge Coverage Ratio was 3.60 to 1.00. For a description of the terms of the RNP Notes, see “Note 14 — Debt” to the consolidated financial statements included in “Part II—Item 8. Financial Statements and Supplementary Data” in this report.
RNP GE Credit Agreement
On July 22, 2014, RNP replaced a prior revolving credit agreement by entering into the GE Credit Agreement. The GE Credit Agreement consists of a $50.0 million senior secured revolving credit facility, or the GE Credit Facility, with a $10.0 million letter of credit sublimit. As of December 31, 2014, RNP had $15.0 million outstanding borrowings under the GE Credit Agreement.
Under the GE Credit Agreement, in the event that, on a pro forma basis, less than 30% of the commitment amount is available for borrowing on any distribution date, then in order to make a distribution on such date (a) RNP must maintain a first lien leverage ratio no greater than 1 to 1 on a pro forma basis and (b) the sum of (i) the undrawn amount under the GE Credit Facility and (ii) cash maintained by RNP and its subsidiaries in collateral deposit accounts must be at least $5 million (after giving effect to the distribution). In addition, before RNP can make distributions, there cannot be any default under the GE Credit Agreement. The GE Credit Agreement also contains a requirement that RNP maintain a first lien leverage ratio not to exceed 1.0 to 1.0 at the end of each fiscal quarter where less than 30% of the commitment amount is available for drawing under the GE Credit Facility or a default has occurred and is continuing. The first lien leverage ratio as of December 31, 2014 was 0.20 to 1.0.
Borrowing pursuant to the GE Credit Agreement is subject to compliance with certain conditions, and RNP is, as of the filing date of this report, in compliance with those conditions. Based on its current forecast, RNP expects to be able to borrow under the GE Credit Agreement. For a description of the terms of the GE Credit Agreement, see “Note 14 — Debt” to the consolidated financial statements included in “Part II—Item 8. Financial Statements and Supplementary Data” in this report.
Shelf Registration
RNP has an effective shelf registration statement with the SEC, which allows RNP and our subsidiary RNHI, from time to time, in one or more offerings, to offer and sell up to $500.0 million in the aggregate of securities comprised of (i) up to $265.5 million of common units and debt securities to be offered and sold by RNP in primary offerings and (ii) up to 12.5 million common units to be offered and sold by RNHI in secondary offerings. This report shall not constitute an offer to sell or the solicitation of an offer to buy, nor shall there be any sale of securities in any jurisdiction in which such offer, solicitation or sale would be unlawful prior to registration or qualification under the securities laws of any such jurisdiction.
Uses of Capital
Our primary uses of cash at RNP have been, and are expected to continue to be, for operating expenses, capital expenditures, debt service and cash distributions to common unitholders.
Capital Expenditures
We divide our capital expenditures into two categories: maintenance and expansion. Maintenance capital expenditures include those for improving, replacing or adding to our assets, as well as expenditures for acquiring, constructing or developing new assets to maintain our operating capacity, or to comply with environmental, health, safety or other regulations. Maintenance capital expenditures that are required to comply with regulations may also improve the output, efficiency or reliability of our facilities. Expansion capital expenditures are those incurred for acquisitions or capital improvements that we expect will increase our operating capacity or operating income over the long-term. We generally fund maintenance capital expenditures from operating cash flow, and expansion capital expenditures from new capital. However, at our Pasadena Facility, we funded the sulfuric acid converter, a major maintenance project, from the proceeds of the RNP Notes.
79
Table of Contents
Maintenance capital expenditures for our East Dubuque Facility totaled $9.4 million for the year ended December 31, 2014, $9.3 million for the year ended December 31, 2013 and $7.9 million for the year ended December 31, 2012. Maintenance capital expenditures for our East Dubuque Facility are expected to be $10.7 million for the year ending December 31, 2015. Expansion capital expenditures for our East Dubuque Facility totaled $14.4 million for the year ended December 31, 2014, $50.5 million for the year ended December 31, 2013 and $52.4 million for the year ended December 31, 2012. Expansion capital expenditures for our East Dubuque Facility are expected to be $19.0 million for the year ending December 31, 2015, of which $14.1 million is related to the ammonia synthesis converter project.
Maintenance capital expenditures for our Pasadena Facility totaled $22.3 million, including $14.5 million spent as part of the project to replace the sulfuric acid converter, for the year ended December 31, 2014. In 2013, maintenance capital expenditures for the Pasadena Facility totaled $9.0 million, including $2.4 million spent as part of the project to replace the sulfuric acid converter. Maintenance capital expenditures for our Pasadena Facility are expected to be $4.0 million for the year ending December 31, 2015. Expansion capital expenditures for our Pasadena Facility totaled $14.4 million for the year ended December 31, 2014, primarily related to the power generation project, and $24.2 million in the year ended December 31, 2013, primarily related to the power generation project and the ammonium sulfate debottlenecking and production capacity project. Expansion capital expenditures for our Pasadena Facility are expected to be $1.8 million for the year ending December 31, 2015, primarily related to the power generation project.
Our forecasted capital expenditures are subject to change due to unanticipated increases in the cost, scope and completion time for our capital projects. For example, we may experience increases in labor or equipment costs necessary to comply with government regulations or to complete projects that sustain or improve the profitability of our facilities.
Wood Fibre Processing Business and Corporate Activities
Sources of Capital
During the twelve months ended December 31, 2014, we funded development activities, operations and investments in our wood fibre processing business and corporate activities primarily through cash on hand, distributions from RNP, proceeds from a previous credit agreement, the GSO Credit Agreement, and the issuance of the 2014 Preferred Stock. Capital expenditures at one of our mills in Chile were funded with Chilean bank debt.
Our debt facilities used to support our wood fibre processing business and corporate activities are the Fulghum debt, the NEWP debt, the QS Construction Facility, the credit agreement with Bank of Montreal, or the BMO Credit Agreement, and the GSO Credit Agreement. For a description of the terms of the Fulghum debt, the NEWP debt, the QS Construction Facility, and the BMO Credit Agreement, see “Note 14 — Debt” to the consolidated financial statements included in “Part II—Item 8. Financial Statements and Supplementary Data” in this report. In January 2015, we funded the acquisition of Allegheny’s assets with a five-year, $8.0 million term loan, which amortizes as if it had a seven-year maturity. The term loan has an interest rate of LIBOR plus 2.25 percent, and contains financial covenants that may restrict dividends from NEWP to Rentech. The excess proceeds from the term loan will be used for transaction costs and capital expenditures. We also borrowed $25.0 million under the A&R GSO Credit Agreement (see below and “Note 14—Debt” to the consolidated financial statements included in “Part II—Item 8. Financial Statements and Supplementary Data” in this report).
During the next 12 months, we expect the liquidity needs of our wood fibre processing business, including announced ongoing construction projects, and of our corporate activities to be met from: (i) cash on hand, (ii) distributions from RNP, (iii) cash generated by our wood fibre processing business, (iv) borrowings under the A&R GSO Credit Agreement, and (v) in the case of capital expenditures and working capital in Chile, Chilean bank debt financing. We expect that we would need to seek additional funds from our investors or in the capital markets if any of the following circumstances occur: (i) the sources of funds summarized in this paragraph were less than expected, (ii) our expenses, including capital expenditures to complete and commission the Atikokan and Wawa Projects, were higher than expected, (iii) the cash flow from the Atikokan or Wawa Facilities were less than or later than expected, or (iv) we were to approve new capital projects, enter into additional commitments or acquire assets in addition to those that could be funded from the sources identified above. We may not be able to obtain funding in the equity or debt capital markets on terms we find acceptable if we were to need such financing. A potential additional source of capital that could be available to fund shortfalls in the event of the possible circumstances mentioned above, or to enhance expected liquidity, would be the sale of some or all of the 3.1 million common units of RNP that we own, once those units are released from being pledged collateral under the A&R GSO Credit Agreement. We expect those units to be released no later than April 2, 2015. For further information regarding the release of the units as collateral under the A&R GSO Credit Agreement, see “Restriction on Sales of RNP Common Units” in “Part II—Item 7. Management’s Discussion and Analysis of Financial Condition and Results of Operations” in this report.
GSO Credit Agreement and A&R GSO Credit Agreement
On April 9, 2014, we entered into the GSO Credit Agreement, which consists of a $50.0 million term loan facility, with a five-year maturity. On February 12, 2015, we entered into the A&R GSO Credit Agreement, which increased outstanding borrowings under the facility from $50.0 million to $75.0 million with an additional potentially available borrowing capacity of up to $38.0 million. Of the undrawn borrowing capacity under the A&R GSO Credit Agreement, $18 million would be available only if cash distributions to RNHI from RNP were to be lower than expected for the reasons specified in the agreement.
80
Table of Contents
2014 Preferred Stock
On April 9, 2014, we issued the 2014 Preferred Stock in the aggregate purchase price of $98.0 million (reflecting an issuance discount of 2%). Dividends, which are payable in cash, on the 2014 Preferred Stock accrue and are cumulative, whether or not declared by our Board, at the rate of 4.5% per annum on the sum of the original issue price plus all unpaid accrued and accumulated dividends thereon. For a description of the terms of the 2014 Preferred Stock and the subsequent agreements related thereto, see “Note 16 — Preferred Stock” and “Note 25 — Subsequent Events” to the consolidated financial statements included in “Part II—Item 8. Financial Statements and Supplementary Data” in this report.
Restriction on Sales of RNP Common Units
Certain provisions of the A&R GSO Credit Agreement and the Subscription Agreement may have substantial effects on our liquidity. Pursuant to these agreements, we have pledged all of the common units we own in RNP, but upon the satisfaction of certain post-closing covenants, the lenders under the A&R GSO Credit Agreement will release 3.1 million common units currently pledged. While the sale of any of the pledged common units would be an event of default under these agreements, the agreements do not restrict our ability to sell the 3.1 million common units of RNP once they have been released. We expect such common units to be released no later than April 2, 2015.
Upon the occurrence of a certain events defined as a “change of control” under the Subscription Agreement, each of the Series E Purchasers may require us to repurchase some or all of our Series E Preferred Stock at a repurchase price equal to $1,000 per share (as adjusted for any stock splits, stock dividends, recapitalizations or the like), plus all accrued and unpaid dividends thereon. These events would also constitute an event of default under the A&R GSO Credit Agreement, allowing the lenders thereunder to accelerate the loans under the agreement. The definition of a “change of control” for these purposes includes, among other things, the issuance by RNP of any equity interests to any third party (other than equity compensation issued by RNP in the ordinary course of business); provided that a one-time issuance by RNP of no more than two million common units in the aggregate will not be a “change of control” if the board of directors of the general partner of RNP determines in good faith (after consultation with its outside legal counsel) that the failure to make such issuance is inconsistent with the directors’ fiduciary duties under applicable law, as modified by the limited partnership agreement of RNP. For further information regarding these terms, see “Note 25 — Subsequent Events” to the consolidated financial statements included in “Part II—Item 8. Financial Statements and Supplementary Data” in this report.
Distributions
We expect quarterly distributions from RNP to be a source of liquidity for our wood fibre processing and corporate activities. Cash distributions from RNP may vary significantly from quarter to quarter and from year to year, and could be as low as zero for any quarter. Cash distributions in 2015 may be significantly less than cash available for distribution if RNP elects to replenish working capital reserves. We receive 59.7% of any quarterly distributions made to RNP’s common unitholders based on our current ownership interest in RNP. However, our ownership interest may be reduced over time if we elect to sell any of our common units or if additional common units were to be issued by RNP. In addition, if RNP consummates a strategic transaction in 2015, then future cash distributions from RNP may be reduced or eliminated depending on the structure of such a transaction. RNP paid cumulative cash distributions for the twelve months ended December 31, 2014 of $0.56 per unit, which resulted in distributions to us of $13.0 million. The Indenture governing the RNP Notes and the GE Credit Agreement contain important restrictions on RNP’s ability to make distributions to its common unitholders (including us), as discussed above in “RNP Activities—Sources of Capital—RNP Notes Offering” and “RNP Activities—Sources of Capital—RNP GE Credit Agreement.” Under certain circumstances described in the A&R GSO Credit Agreement, up to $18 million of additional borrowing capacity would be available if distributions from RNP were below expectations.
Shelf Registration
We filed a shelf registration statement with the SEC, which allows us from time to time, in one or more offerings, to offer and sell up to $200.0 million in aggregate initial offering price of debt securities, common stock, preferred stock, depositary shares, warrants, rights to purchase shares of common stock and/or any of the other registered securities or units of any of the other registered securities. Capital markets have experienced periods of extreme uncertainty in the recent past, and access to those markets may become difficult. If we need to access capital markets, we cannot assure you that we will be able to do so on acceptable terms, or at all. This report shall not constitute an offer to sell or the solicitation of an offer to buy, nor shall there be any sale of securities in any jurisdiction in which such offer, solicitation or sale would be unlawful prior to registration or qualification under the securities laws of any such jurisdiction.
Sale of Alternative Energy Technologies
On October 31, 2014, we closed the previously announced sale of our alternative energy technologies to Sunshine Kaidi New Energy Group Co., Ltd., or Kaidi. We received a cash payment of $14.4 million from Kaidi at the closing, which was in addition to $0.5 million in cash payments previously received. Kaidi also paid an additional $0.4 million to us to purchase various equipment located at the PDU, resulting in $15.3 million of total proceeds to us from these transactions. See “Note 7 — Discontinued Operations” to the consolidated financial statements included in “Part II—Item 8. Financial Statements and Supplementary Data” in this report.
81
Table of Contents
Uses of Capital
Our primary uses of cash have been, and are expected to continue to be, for operating expenses, capital expenditures, acquisitions and debt service.
Capital Expenditures
We estimate the total cost to acquire and convert the Atikokan and Wawa Projects to be approximately $125.0 million to $130.0 million, up from previous estimates of $105.0 million. The majority of the increase is due to delays in construction and higher than expected labor costs for installation of electrical and mechanical components. Approximately $104.0 million of the estimated cost had been spent through December 31, 2014. We expect that the total project cost will include working capital and the costs to commission the plants of $6.0 million to $10.0 million, which is in addition to the cost to acquire and convert the facilities. In 2015, total combined expenditures, including construction, working capital, and costs to commission, for the Atikokan and Wawa Projects are expected to be between $27.0 million and $36.0 million. We expect that the new term loan under the A&R GSO Credit Agreement, together with cash on hand will be sufficient to fund the Atikokan and Wawa Projects until they have been commissioned and later begin to generate positive cash flow. The Atikokan Facility is currently in the commissioning phase and is producing and selling wood pellets to OPG. We expect the Atikokan Facility to be operating at full capacity in six to 12 months. The Wawa Facility is nearing completion of construction. We expect the facility to begin startup and commissioning in the second quarter of 2015 and to operate at full capacity within one year from the start of commissioning.
We installed a second debarking line at one of our mills in Chile. We expect the project to increase debarking capacity at the mill from 120,000 to 240,000 BDMTs per year. Construction of this project was completed during 2014, at a cost of $2.5 million. We also constructed a new chipping line at the same mill in Chile. We expect the project to increase chipping capacity from 180,000 to 400,000 BDMTs per year. The cost of this project was $6.8 million. This new chipping line started operating in January 2015. It is expected to reach full capacity in the second quarter of 2015. Both projects were funded with Chilean bank debt financing.
On January 23, 2015, NEWP acquired the assets of Allegheny Pellet Corporation, which consists of a wood pellet processing facility located in Youngsville, Pennsylvania, for $7.2 million. At the Allegheny facility, we plan to spend $2.0 million, $1.0 million in each of 2015 and 2016, to address regulatory compliance issues related to state environmental and air emissions requirements as well as safety requirements.
We would need to raise additional capital in order to develop or acquire additional wood pellet processing facilities. For example, we would need additional capital in 2015 to develop another project like Atikokan or Wawa or to acquire another pellet plant like Allegheny. We would also need to raise additional capital to expand our Fulghum Fibres business by investing in new processing facilities.
CONTRACTUAL OBLIGATIONS
The following table lists our significant contractual obligations and their future payments at December 31, 2014:
| Contractual Obligations |
Total | Less than 1 Year |
1-3 Years | 3-5 Years | More than 5 Years |
|||||||||||||||
| (in thousands) | ||||||||||||||||||||
| RNP Notes (1) |
$ | 320,000 | $ | — | $ | — | $ | — | $ | 320,000 | ||||||||||
| GSO Credit Agreement (2) |
50,000 | — | — | 50,000 | — | |||||||||||||||
| GE Credit Agreement (3) |
15,000 | — | — | 15,000 | — | |||||||||||||||
| Fulghum debt (4) |
53,179 | 14,816 | 12,131 | 5,951 | 20,281 | |||||||||||||||
| NEWP debt (5) |
10,913 | 1,758 | 4,219 | 3,467 | 1,469 | |||||||||||||||
| QS Construction Facility (6) |
18,679 | 686 | 1,407 | 1,661 | 14,925 | |||||||||||||||
| Interest on debt (7) |
183,484 | 30,413 | 58,824 | 53,819 | 40,428 | |||||||||||||||
| Earn-out consideration (8) |
6,295 | 5,000 | — | — | 1,295 | |||||||||||||||
| Natural gas (9) |
15,568 | 15,568 | — | — | — | |||||||||||||||
| Purchase obligations (10) |
24,983 | 24,983 | — | — | — | |||||||||||||||
| Asset retirement obligation – Continuing Operations (11) |
4,404 | — | — | — | 4,404 | |||||||||||||||
| Asset retirement obligation – Discontinued Operations(12) |
718 | 718 | — | — | — | |||||||||||||||
| Operating leases – Continuing Operations |
38,271 | 7,194 | 10,804 | 6,777 | 13,496 | |||||||||||||||
| Gas and electric fixed charges (13) |
679 | 679 | — | — | — | |||||||||||||||
| Pension plans and postretirement plan (14) |
83 | 83 | — | — | — | |||||||||||||||
|
|
|
|
|
|
|
|
|
|
|
|||||||||||
| Total |
$ | 742,256 | $ | 101,898 | $ | 87,385 | $ | 136,675 | $ | 416,298 | ||||||||||
|
|
|
|
|
|
|
|
|
|
|
|||||||||||
| (1) | There is $320.0 million of principal outstanding under the RNP Notes. |
82
Table of Contents
| (2) | Amount is net of unamortized discount. There is $50.0 million of principal outstanding under the GSO Credit Agreement. On February 12, 2015, we entered into the A&R GSO Credit Agreement to increase borrowings under the facility to $113.0 million. As of the date of this report, there is $75.0 million of principal outstanding. |
| (3) | There is $15.0 million of principal outstanding under the GE Credit Agreement. |
| (4) | As of December 31, 2014, Fulghum had outstanding debt of $53.2 million with a weighted average interest rate of 6.3%. The loans amortize and include prepayment penalties. |
| (5) | As of December 31, 2014, NEWP had outstanding debt of $10.9 million with a weighted average interest rate of 5.0%. NEWP also had interest rate swaps with a total outstanding liability of $0.7 million. The swaps were used to fix the interest rates of each term loan. On January 23, 2015, in connection with the Allegheny Acquisition, NEWP entered into a five-year, $8.0 million term loan, which amortizes as if it had a seven-year maturity. |
| (6) | Pursuant to the Port Agreement, QSL is required to build handling equipment and 75,000 metric tons of wood pellet storage exclusively for our use at the port, with the same amount becoming a financing obligation for us, or the QS Construction Facility. The fifteen-year note for $20.0 million bears interest at a rate of 10% per year. |
| (7) | Interest on debt assumes interest rates existing at December 31, 2014 for variable rate debt. |
| (8) | We entered into an asset purchase agreement relating to the Atikokan Project which, among other things, provides for the potential payment of earn-out consideration, which will equal 7% of annual EBITDA of the Atikokan Project, as defined in the asset purchase agreement for the Atikokan Project, over a ten-year period. At December 31, 2014, the potential earn-out consideration relating to the Atikokan Project was $1.3 million. The purchase agreement for the NEWP Acquisition provides for up to $5.0 million of potential earn-out consideration, to be paid in cash. The earn-out consideration of $5.0 million was fully earned as of December 31, 2014. |
| (9) | As of December 31, 2014, the natural gas forward purchase contracts included delivery dates through June 30, 2015. During January and February 2015, we entered into additional fixed-quantity forward purchase contracts at fixed and indexed prices for various delivery dates through December 31, 2015. The total MMBtus associated with these additional forward purchase contracts are 2.7 million and the total amount of the purchase commitments is $7.7 million, resulting in a weighted average rate per MMBtu of $2.88 in these new commitments. We are required to make additional prepayments under these forward purchase contracts in the event that market prices fall below the purchase prices in the contracts. |
| (10) | The amount presented represents certain open purchase orders with our vendors. Not all of our open purchase orders are purchase obligations, since some of the orders are not enforceable or legally binding on us until the goods are received or the services are provided. |
| (11) | We have recorded asset retirement obligations, or AROs, related to future costs associated with the removal of contaminated material upon removal of the phosphoric acid plant at our Pasadena Facility, handling and disposal of asbestos at our East Dubuque Facility, and removal of machinery and equipment at Fulghum mills on leased property. The fair value of a liability for an ARO is recorded in the period in which it is incurred and the cost of such liability increases the carrying amount of the related long-lived asset by the same amount. The liability is accreted each period through charges to operating expense and the capitalized cost is depreciated over the remaining useful life of the asset. The obligation is considered long-term and, therefore, considered to be incurred more than five years after December 31, 2014. |
| (12) | We have recorded an ARO related to the abandonment of the natural gas pipeline at Natchez. |
| (13) | As part of the natural gas transportation and electricity supply contracts at our East Dubuque Facility, we must pay monthly fixed charges over the term of the contracts. |
| (14) | We expect to contribute $0 to the pension plans and $83,000 to the postretirement plan in 2015. |
In addition, we have entered into the following contracts:
| • | We entered into the Drax Contract under which, as amended, we have committed to deliver approximately 240,000 metric tons of pellets in 2015, 436,000 metric tons in each of 2018 and 2019, and 400,000 metric tons in all other years for the duration of the contract. |
| • | We entered into the OPG Contract under which we have committed to deliver 45,000 metric tons of wood pellets from the Atikokan Facility annually. |
| • | We entered into the Canadian National Contract under which we have committed to transport a minimum of 3,600 rail carloads annually thereafter for the duration of the contract. Delivery shortfalls result in a $1,000 per rail car penalty. |
| • | On April 9, 2014, we issued the 2014 Preferred Stock for an aggregate purchase price of $98.0 million (reflecting an issuance discount of 2%). Dividends on the 2014 Preferred Stock accrue and are cumulative at the rate of 4.5% per annum on the sum of the original issue price plus all unpaid accrued and accumulated dividends thereon. |
| • | On February 12, 2015, we entered into an amendment to the subscription agreement related to the 2014 Preferred Stock. See “Note 25 — Subsequent Events” to the consolidated financial statements included in “Part II—Item 8. Financial Statements and Supplementary Data” in this report for further information. |
83
Table of Contents
OFF-BALANCE SHEET ARRANGEMENTS
We did not have any material off-balance sheet arrangements as of December 31, 2014.
Recent Accounting Pronouncements From Financial Statement Disclosures
For a discussion of the recent accounting pronouncements relevant to our operations, please refer to “Note 2 — Recent Accounting Pronouncements” to the consolidated financial statements included in “Item 8. Financial Statements and Supplementary Data.”
| ITEM 7A. | QUANTITATIVE AND QUALITATIVE DISCLOSURES ABOUT MARKET RISK |
Interest Rate Risk. We are exposed to interest rate risks related to the GE Credit Agreement. Borrowings under the GE Credit Agreement bear interest at a rate equal to an applicable margin plus, at our option, either (a) in the case of base rate borrowings, a rate equal to the highest of (1) the prime rate, (2) the federal funds rate plus 0.5% or (3) LIBOR for an interest period of one month plus 1.00% or (b) in the case of LIBOR borrowings, the offered rate per annum for deposits of dollars for the applicable interest period on the day that is two business days prior to the first day of such interest period. The applicable margin for borrowings under the GE Credit Agreement is 2.25% with respect to base rate borrowings and 3.25% with respect to LIBOR borrowings. As of the date of this report, we had $15.0 million outstanding borrowings under the GE Credit Agreement. Assuming the entire $50.0 million was outstanding under the GE Credit Agreement, an increase or decrease of 100 basis points in the LIBOR rates would result in an increase or decrease in annual interest expense of $0.5 million.
We are exposed to interest rate risks related to the A&R GSO Credit Agreement. Borrowings under the first tranche of $50.0 million bear interest at a rate equal to the greater of (i) LIBOR plus 7.00% and (ii) 8.00% per annum. Borrowings under the second and third tranches, of up to an aggregate of $63 million, bear interest at a rate equal to the greater of (i) LIBOR plus 9.00% and (ii) 10.00% per annum. Currently, LIBOR is below the floor of 1.00%. As of the date of this report, we had outstanding borrowings under the A&R GSO Credit Agreement of $75.0 million. Assuming the entire $113.0 million was outstanding under the A&R GSO Credit Agreement and assuming interest rates were above the applicable floor, an increase or decrease of 100 basis points in the LIBOR rates would result in an increase or decrease in annual interest expense of approximately $1.1 million.
We are exposed to interest rate risks related to the NEWP debt. As of December 31, 2014, NEWP had outstanding debt of $10.9 million. Based upon this outstanding balance, and assuming no interest rate swaps, an increase or decrease by 100 basis points of interest would result in an increase or decrease in annual interest expense of approximately $0.1 million. NEWP entered into interest rate swaps to essentially fix the variable interest rate on its borrowings. At December 31, 2014, the fair value of the interest rate swaps was a liability of $0.7 million. An increase of 100 basis points in the LIBOR rates would result in the liability for interest rate swaps decreasing by $0.2 million. A decrease of 100 basis points in the LIBOR rates would result in the liability for interest rate swaps increasing by $0.2 million.
Commodity Price Risk. Our East Dubuque Facility is exposed to significant market risk due to potential changes in prices for fertilizer products and natural gas. Natural gas is the primary raw material used in the production of various nitrogen-based products manufactured at our East Dubuque Facility. Market prices of nitrogen-based products are affected by changes in the prices of commodities such as corn and natural gas as well as by supply and demand and other factors. Currently, we purchase natural gas for use in our East Dubuque Facility on the spot market, and through short-term, fixed supply, fixed-price and index price purchase contracts. Natural gas prices have fluctuated during the last several years, increasing substantially in 2008 and subsequently declining to the current lower levels. A hypothetical increase of $0.10 per MMBtu of natural gas would increase the cost to produce one ton of ammonia by $3.30.
In the normal course of business, RNLLC currently produces nitrogen-based fertilizer products throughout the year to supply the needs of our East Dubuque Facility’s customers during the high-delivery-volume spring and fall seasons. The value of fertilizer product inventory is subject to market risk due to fluctuations in the relevant commodity prices. Prices of nitrogen fertilizer products can be volatile. We believe that market prices of nitrogen products are affected by changes in grain prices and demand, natural gas prices and other factors.
RNLLC enters into fixed-price prepaid contracts committing its East Dubuque Facility’s customers to purchase its nitrogen fertilizer products at a later date. To a lesser extent, RNPLLC also enters into prepaid contracts for our Pasadena Facility’s products. By using fixed-price forward contracts, RNLLC purchases enough natural gas to manufacture the products that have been sold by our East Dubuque Facility under prepaid contracts for later delivery. We believe that entering into such fixed-price contracts for natural gas and prepaid contracts effectively allows RNLLC to fix most of the gross margin on pre-sold product and mitigate risk of increasing market prices of natural gas or decreasing market prices of nitrogen to the extent of such pre-sold products. However, this practice also subjects us to the risk that we may have locked in margins at levels lower than those that might be available if, in periods following these contract dates, natural gas prices were to fall, or nitrogen fertilizer commodity prices were to increase. In addition, RNLLC occasionally makes forward purchases of natural gas that are not directly linked to specific prepaid contracts. To the extent RNLLC makes such purchases, we may be unable to benefit from lower natural gas prices in subsequent periods.
84
Table of Contents
Our Pasadena Facility is exposed to significant market risk due to potential changes in prices for fertilizer products, and for ammonia, sulfuric acid and sulfur. Ammonia and sulfuric acid are the primary raw materials used in the production of ammonium sulfate which is the primary product manufactured at our Pasadena Facility. Sulfur is the primary raw material used in the production of sulfuric acid, which our Pasadena Facility produces for both internal consumption in the production of ammonium sulfate and for sales to third parties. During the year ended December 31, 2014, 90% of the sulfuric acid used in our Pasadena Facility’s production of ammonium sulfate was produced at our Pasadena Facility. We purchase a substantial portion of our ammonia and sulfur for use in our Pasadena Facility at prices based on market indices. The market price of ammonium sulfate is affected by changes in the prices of commodities such as soybeans, potatoes, cotton, canola, alfalfa, corn, wheat, ammonia and sulfur as well as by supply and demand for ammonium sulfate and other nitrogen fertilizers, and by other factors such as the price of its other inputs. The margins on the sale of ammonium sulfate fertilizer products are relatively low. If our costs to produce ammonium sulfate fertilizer products increase and the prices at which we sell these products do not correspondingly increase, our profits from the sale of these products may decrease or we may suffer losses on these sales. If the price of our products falls rapidly, we may not be able to recover the costs of our raw materials inventory that was purchased at an earlier time when commodity prices were at higher levels. A hypothetical increase of $10.00 per ton of ammonia would increase the cost to produce one ton of ammonium sulfate by $2.50. A hypothetical increase of $10.00 per ton of sulfur would also increase the cost to produce one ton of ammonium sulfate by $2.50.
Our Pasadena Facility purchases ammonia as a feedstock at contractual prices based on a published Tampa, Florida market index, while the East Dubuque Facility sells similar quantities of ammonia at prevailing prices in the Mid Corn Belt, which are typically significantly higher than Tampa ammonia prices.
We provide wood fibre processing services and wood yard operations in the United States, Chile and Uruguay. We typically purchase logs through our trading company, Forestal Los Andes S.A., or FLA, only to fulfill obligations under contracts with established prices for the delivery of wood chips, thereby minimizing our exposure to market fluctuations in prices for wood chips and logs. A hypothetical increase of $0.10 per GMT in the price of logs would increase the cost to produce one ton of wood chips by $0.12. However, FLA historically has not experienced an impact of this nature due to the offtake and feedstock contract negotiation process of the Chilean export market. Each year, the Japanese market sets a fixed price for each species of wood chips imported from Chile regardless of producer. As such, Chilean timber suppliers have little power in altering the price of wood and thus, adjust their price within a narrow price band in conjunction with the Japanese wood chip price. Therefore, we do not expect that changes in log prices to materially impact Fulghum’s results of operations.
The cost to complete our wood pellet projects are subject to changes in the prices of construction materials, equipment and labor to be used in construction. The off-take contracts for the products of the wood pellet plants are designed to pass-through certain changes in input prices, including general inflation, the price of fuel, and prices of wood supplied to the mills. However, such indexation may not exactly offset increases or decreases in the prices of inputs and the cost of transporting and handling wood pellets.
We operate in Chile and Uruguay, and are building wood pellet plants in Canada. We also have contracted to sell a significant portion of our industrial wood pellets pursuant to off-take contracts under which the purchases are priced in Canadian dollars. We are subject to the effects of changing rates of exchange for the relevant currencies. Both the expenses we incur outside the United States and the value to our shareholders of future profits earned in foreign currencies may be affected by such exchange rates.
Wood feedstock represents the largest component of NEWP’s wood pellet product cost. Competition for wood feedstock supply from pulp and paper manufacturing, and commercial and institutional wood boiler heating systems may affect our cost of wood feedstock. Our Jaffrey, New Hampshire production facility is affected the most by this competition, followed by our Schuyler, New York production facility, with our Deposit, New York production facility and our Allegheny Facility least affected . We have approximately 180 wood suppliers of which approximately 50 provide 80% of our wood feedstock needs. We have developed relationships with our suppliers such that our wood costs have remained relatively flat with minimal variability over the last several years. A hypothetical increase of $1.00 per green short ton in the price of wood fibre feedstock would increase the cost to produce one ton of wood pellets by $1.77.
Foreign Currency Exchange Risk. The functional currency of our Canadian subsidiaries is the Canadian dollar. We expect that, once the Atikokan Project and Wawa Facilities are operational, our Canadian subsidiaries will invoice customers and satisfy their financial obligations almost exclusively in their local currency. As a result, we do not expect that our exposure to currency exchange fluctuation risk from our Canadian operations will be significant.
The functional currency of our South American subsidiaries is the United States dollar. Our South American subsidiaries enter into significant contracts that are primarily denominated in United States dollars and satisfy their financial obligations in that currency. As a result, we generally do not have exposure to currency exchange fluctuation risk from our South American subsidiaries.
85
Table of Contents
For financial statement reporting purposes, we translate the assets and liabilities of our Canadian subsidiaries at the exchange rates in effect on the balance sheet date and translate their costs and expenses at the rates of exchange in effect at the time of the transaction. We include translation gains and losses in the stockholders’ equity section of our balance sheets. We include net gains and losses resulting from foreign exchange transactions in interest and other income in our statements of operations. Since we translate Canadian dollars into United States dollars for financial reporting purposes, currency fluctuations can have an impact on our financial results. Although the impact of currency fluctuations on our financial results has generally been immaterial in the past there can be no guarantee that the impact of currency fluctuations will not be material in the future.
86
Table of Contents
| ITEM 8. | FINANCIAL STATEMENTS AND SUPPLEMENTARY DATA |
RENTECH, INC.
INDEX TO CONSOLIDATED FINANCIAL STATEMENTS
| Page | ||||
| Consolidated Financial Statements: |
||||
| 88 | ||||
| 89 | ||||
| 90 | ||||
| 91 | ||||
| 92 | ||||
| 93 | ||||
| 95 | ||||
| Financial Statement Schedules: |
||||
| Schedule I – Condensed Financial Information (Parent Company Only) |
143 | |||
| Schedule II – Valuation and Qualifying Accounts for the years ended December 31, 2014, 2013 and 2012 |
148 | |||
87
Table of Contents
Report of Independent Registered Public Accounting Firm
To the Board of Directors and Stockholders of Rentech, Inc.
In our opinion, the consolidated financial statements listed in the accompanying index present fairly, in all material respects, the financial position of Rentech, Inc. and its subsidiaries at December 31, 2014 and 2013, and the results of their operations and their cash flows for each of the three years in the period ended December 31, 2014 in conformity with accounting principles generally accepted in the United States of America. In addition, in our opinion, the financial statement schedules listed in the accompanying index present fairly, in all material respects, the information set forth therein when read in conjunction with the related consolidated financial statements. Also in our opinion, the Company did not maintain, in all material respects, effective internal control over financial reporting as of December 31, 2014, based on criteria established in Internal Control — Integrated Framework (2013) issued by the Committee of Sponsoring Organizations of the Treadway Commission (COSO) because material weaknesses in internal control over financial reporting related to (i) the review of the cash flow forecasts used in the accounting for long-lived asset recoverability and goodwill impairment, (ii) the determination of the goodwill impairment charge in accordance with generally accepted accounting principles, and (iii) maintaining documentation supporting management’s review of events and changes in circumstances that indicate it is more likely than not that a goodwill impairment has occurred between annual impairment tests existed as of that date. A material weakness is a deficiency, or a combination of deficiencies, in internal control over financial reporting, such that there is a reasonable possibility that a material misstatement of the annual or interim financial statements will not be prevented or detected on a timely basis. The material weaknesses referred to above are described in Management’s Annual Report on Internal Control Over Financial Reporting appearing under Item 9A. We considered these material weaknesses in determining the nature, timing, and extent of audit tests applied in our audit of the 2014 consolidated financial statements, and our opinion regarding the effectiveness of the Company’s internal control over financial reporting does not affect our opinion on those consolidated financial statements. The Company’s management is responsible for these financial statements and financial statement schedules, for maintaining effective internal control over financial reporting and for its assessment of the effectiveness of internal control over financial reporting included in management’s report referred to above. Our responsibility is to express opinions on these financial statements, on the financial statement schedules, and on the Company’s internal control over financial reporting based on our integrated audits. We conducted our audits in accordance with the standards of the Public Company Accounting Oversight Board (United States). Those standards require that we plan and perform the audits to obtain reasonable assurance about whether the financial statements are free of material misstatement and whether effective internal control over financial reporting was maintained in all material respects. Our audits of the financial statements included examining, on a test basis, evidence supporting the amounts and disclosures in the financial statements, assessing the accounting principles used and significant estimates made by management, and evaluating the overall financial statement presentation. Our audit of internal control over financial reporting included obtaining an understanding of internal control over financial reporting, assessing the risk that a material weakness exists, and testing and evaluating the design and operating effectiveness of internal control based on the assessed risk. Our audits also included performing such other procedures as we considered necessary in the circumstances. We believe that our audits provide a reasonable basis for our opinions.
A company’s internal control over financial reporting is a process designed to provide reasonable assurance regarding the reliability of financial reporting and the preparation of financial statements for external purposes in accordance with generally accepted accounting principles. A company’s internal control over financial reporting includes those policies and procedures that (i) pertain to the maintenance of records that, in reasonable detail, accurately and fairly reflect the transactions and dispositions of the assets of the company; (ii) provide reasonable assurance that transactions are recorded as necessary to permit preparation of financial statements in accordance with generally accepted accounting principles, and that receipts and expenditures of the company are being made only in accordance with authorizations of management and directors of the company; and (iii) provide reasonable assurance regarding prevention or timely detection of unauthorized acquisition, use, or disposition of the company’s assets that could have a material effect on the financial statements.
Because of its inherent limitations, internal control over financial reporting may not prevent or detect misstatements. Also, projections of any evaluation of effectiveness to future periods are subject to the risk that controls may become inadequate because of changes in conditions, or that the degree of compliance with the policies or procedures may deteriorate.
As described in Management’s Annual Report on Internal Control Over Financial Reporting, management has excluded New England Wood Pellets (“NEWP”), from its assessment of internal control over financial reporting as of December 31, 2014 because the entity was acquired by the Company in a purchase business combination on May 1, 2014. We have also excluded NEWP from our audit of internal control over financial reporting. NEWP is a wholly-owned subsidiary whose total assets and total revenues represent approximately 6% and 7%, respectively, of the related consolidated financial statement amounts as of and for the year ended December 31, 2014.
/s/ PricewaterhouseCoopers LLP
Los Angeles, California
March 16, 2015
88
Table of Contents
RENTECH, INC.
(Amounts in thousands, except per share data)
| As of December 31, | ||||||||
| 2014 | 2013 | |||||||
| ASSETS | ||||||||
| Current assets |
||||||||
| Cash |
$ | 44,195 | $ | 106,369 | ||||
| Accounts receivable, including unbilled revenue, net of allowance for doubtful accounts of $500 at December 31, 2014 and 2013, respectively |
33,619 | 14,227 | ||||||
| Inventories |
38,085 | 35,376 | ||||||
| Prepaid expenses and other current assets |
11,142 | 8,309 | ||||||
| Deferred income taxes |
1,870 | 1,140 | ||||||
| Other receivables, net |
10,715 | 7,432 | ||||||
| Assets of discontinued operations |
305 | 19 | ||||||
|
|
|
|
|
|||||
| Total current assets |
139,931 | 172,872 | ||||||
|
|
|
|
|
|||||
| Property, plant and equipment, net |
392,451 | 334,654 | ||||||
|
|
|
|
|
|||||
| Construction in progress |
179,423 | 60,136 | ||||||
|
|
|
|
|
|||||
| Other assets |
||||||||
| Goodwill |
38,393 | 57,134 | ||||||
| Intangible assets |
61,804 | 59,730 | ||||||
| Debt issuance costs |
9,631 | 9,321 | ||||||
| Deposits and other assets |
4,840 | 5,092 | ||||||
| Assets of discontinued operations |
1,677 | 4,651 | ||||||
|
|
|
|
|
|||||
| Total other assets |
116,345 | 135,928 | ||||||
|
|
|
|
|
|||||
| Total assets |
$ | 828,150 | $ | 703,590 | ||||
|
|
|
|
|
|||||
| LIABILITIES AND STOCKHOLDERS’ EQUITY | ||||||||
| Current liabilities |
||||||||
| Accounts payable |
$ | 31,439 | $ | 19,875 | ||||
| Accrued payroll and benefits |
7,185 | 9,155 | ||||||
| Accrued liabilities |
37,406 | 33,953 | ||||||
| Deferred revenue |
28,607 | 21,643 | ||||||
| Current portion of long term debt |
17,784 | 9,916 | ||||||
| Accrued interest |
5,018 | 5,490 | ||||||
| Earn-out consideration |
5,000 | — | ||||||
| Other |
2,601 | 1,015 | ||||||
| Liabilities of discontinued operations |
1,711 | 2,003 | ||||||
|
|
|
|
|
|||||
| Total current liabilities |
136,751 | 103,050 | ||||||
|
|
|
|
|
|||||
| Long-term liabilities |
||||||||
| Debt |
451,072 | 412,063 | ||||||
| Earn-out consideration |
1,295 | 1,544 | ||||||
| Asset retirement obligation |
4,404 | 2,995 | ||||||
| Deferred income taxes |
9,850 | 9,271 | ||||||
| Other |
5,883 | 6,711 | ||||||
|
|
|
|
|
|||||
| Total long-term liabilities |
472,504 | 432,584 | ||||||
|
|
|
|
|
|||||
| Total liabilities |
609,255 | 535,634 | ||||||
|
|
|
|
|
|||||
| Commitments and contingencies (Note 15) |
||||||||
| Mezzanine equity |
||||||||
| Series E convertible preferred stock — $10 par value; 100,000 shares authorized, issued and outstanding; 4.5% dividend rate |
95,060 | — | ||||||
|
|
|
|
|
|||||
| Stockholders’ equity |
||||||||
| Preferred stock — $10 par value; 1,000 shares authorized; 90 series A convertible preferred shares authorized and issued; no shares outstanding and $0 liquidation preference |
— | — | ||||||
| Series C participating cumulative preferred stock — $10 par value; 500 shares authorized; no shares issued and outstanding |
— | — | ||||||
| Series D junior participating preferred stock — $10 par value; 45 shares authorized; no shares issued and outstanding |
— | — | ||||||
| Common stock — $.01 par value; 450,000 shares authorized; 229,308 and 227,512 shares issued and outstanding at December 31, 2014 and 2013, respectively |
2,293 | 2,275 | ||||||
| Additional paid-in capital |
543,091 | 541,254 | ||||||
| Accumulated deficit |
(417,349 | ) | (385,339 | ) | ||||
| Accumulated other comprehensive loss |
(7,302 | ) | (117 | ) | ||||
|
|
|
|
|
|||||
| Total Rentech stockholders’ equity |
120,733 | 158,073 | ||||||
| Noncontrolling interests |
3,102 | 9,883 | ||||||
|
|
|
|
|
|||||
| Total equity |
123,835 | 167,956 | ||||||
|
|
|
|
|
|||||
| Total liabilities and stockholders’ equity |
$ | 828,150 | $ | 703,590 | ||||
|
|
|
|
|
|||||
See Accompanying Notes to Consolidated Financial Statements.
89
Table of Contents
RENTECH, INC.
Consolidated Statements of Operations
(Amounts in thousands, except per share data)
| For the Years Ended December 31, |
||||||||||||
| 2014 | 2013 | 2012 | ||||||||||
| Revenues |
||||||||||||
| Product sales |
$ | 400,282 | $ | 322,022 | $ | 261,284 | ||||||
| Service revenues |
70,317 | 49,822 | — | |||||||||
| Other revenues |
2,062 | 2,505 | 351 | |||||||||
|
|
|
|
|
|
|
|||||||
| Total revenues |
472,661 | 374,349 | 261,635 | |||||||||
|
|
|
|
|
|
|
|||||||
| Cost of sales |
||||||||||||
| Product |
335,544 | 252,741 | 129,796 | |||||||||
| Service |
57,443 | 38,222 | — | |||||||||
|
|
|
|
|
|
|
|||||||
| Total cost of sales |
392,987 | 290,963 | 129,796 | |||||||||
|
|
|
|
|
|
|
|||||||
| Gross profit |
79,674 | 83,386 | 131,839 | |||||||||
|
|
|
|
|
|
|
|||||||
| Operating expenses |
||||||||||||
| Selling, general and administrative expense |
66,901 | 51,367 | 43,727 | |||||||||
| Depreciation and amortization |
4,396 | 2,991 | 2,144 | |||||||||
| Pasadena goodwill impairment |
27,202 | 30,029 | — | |||||||||
| Loss on sale of assets and impairments |
245 | 878 | 510 | |||||||||
|
|
|
|
|
|
|
|||||||
| Total operating expenses |
98,744 | 85,265 | 46,381 | |||||||||
|
|
|
|
|
|
|
|||||||
| Operating income (loss) |
(19,070 | ) | (1,879 | ) | 85,458 | |||||||
|
|
|
|
|
|
|
|||||||
| Other income (expense), net |
||||||||||||
| Interest expense |
(22,334 | ) | (16,385 | ) | (10,524 | ) | ||||||
| Agrifos settlement |
5,632 | — | — | |||||||||
| Loss on debt extinguishment |
(1,485 | ) | (6,001 | ) | (4,801 | ) | ||||||
| Gain (loss) on fair value adjustment to earn-out consideration |
(1,033 | ) | 5,122 | — | ||||||||
| Other income (expense), net |
422 | (277 | ) | (695 | ) | |||||||
|
|
|
|
|
|
|
|||||||
| Total other expenses, net |
(18,798 | ) | (17,541 | ) | (16,020 | ) | ||||||
|
|
|
|
|
|
|
|||||||
| Income (loss) from continuing operations before income taxes and equity in loss of investee |
(37,868 | ) | (19,420 | ) | 69,438 | |||||||
| Income tax (benefit) expense |
1,502 | (26,306 | ) | 4,375 | ||||||||
|
|
|
|
|
|
|
|||||||
| Income (loss) from continuing operations before equity in loss of investee |
(39,370 | ) | 6,886 | 65,063 | ||||||||
| Equity in loss of investee |
393 | 242 | — | |||||||||
|
|
|
|
|
|
|
|||||||
| Income (loss) from continuing operations |
(39,763 | ) | 6,644 | 65,063 | ||||||||
| Income (loss) from discontinued operations, net of tax |
7,259 | (6,606 | ) | (37,376 | ) | |||||||
|
|
|
|
|
|
|
|||||||
| Net income (loss) |
(32,504 | ) | 38 | 27,687 | ||||||||
| Net (income) loss attributable to noncontrolling interests |
494 | (1,570 | ) | (41,687 | ) | |||||||
| Preferred stock dividends |
(3,840 | ) | — | — | ||||||||
|
|
|
|
|
|
|
|||||||
| Net loss attributable to Rentech common shareholders |
$ | (35,850 | ) | $ | (1,532 | ) | $ | (14,000 | ) | |||
|
|
|
|
|
|
|
|||||||
| Net loss per common share allocated to Rentech common shareholders: |
||||||||||||
| Basic: |
||||||||||||
| Continuing operations |
$ | (0.19 | ) | $ | 0.02 | $ | 0.10 | |||||
|
|
|
|
|
|
|
|||||||
| Discontinued operations |
$ | 0.03 | $ | (0.03 | ) | $ | (0.17 | ) | ||||
|
|
|
|
|
|
|
|||||||
| Net loss |
$ | (0.16 | ) | $ | (0.01 | ) | $ | (0.06 | ) | |||
|
|
|
|
|
|
|
|||||||
| Diluted: |
||||||||||||
| Continuing operations |
$ | (0.19 | ) | $ | 0.02 | $ | 0.10 | |||||
|
|
|
|
|
|
|
|||||||
| Discontinued operations |
$ | 0.03 | $ | (0.03 | ) | $ | (0.16 | ) | ||||
|
|
|
|
|
|
|
|||||||
| Net loss |
$ | (0.16 | ) | $ | (0.01 | ) | $ | (0.06 | ) | |||
|
|
|
|
|
|
|
|||||||
| Weighted-average shares used to compute net income (loss) per common share: |
||||||||||||
| Basic |
228,560 | 226,139 | 223,189 | |||||||||
|
|
|
|
|
|
|
|||||||
| Diluted |
228,560 | 233,703 | 230,524 | |||||||||
|
|
|
|
|
|
|
|||||||
See Accompanying Notes to Consolidated Financial Statements.
90
Table of Contents
RENTECH, INC.
Consolidated Statements of Comprehensive Income (Loss)
(Amounts in thousands)
| For the Years Ended December 31, |
||||||||||||
| 2014 | 2013 | 2012 | ||||||||||
| Net income (loss) |
$ | (32,504 | ) | $ | 38 | $ | 27,687 | |||||
| Other comprehensive income (loss), net of tax: |
||||||||||||
| Pension and postretirement plan adjustments |
(1,304 | ) | 1,143 | 166 | ||||||||
| Foreign currency translation |
(6,405 | ) | (907 | ) | 6 | |||||||
|
|
|
|
|
|
|
|||||||
| Other comprehensive income (loss) |
(7,709 | ) | 236 | 172 | ||||||||
|
|
|
|
|
|
|
|||||||
| Comprehensive income (loss) |
(40,213 | ) | 274 | 27,859 | ||||||||
| Less: net (income) loss attributable to noncontrolling interests |
494 | (1,570 | ) | (41,687 | ) | |||||||
| Less: other comprehensive (income) loss attributable to noncontrolling interests |
524 | (458 | ) | (67 | ) | |||||||
|
|
|
|
|
|
|
|||||||
| Comprehensive loss attributable to Rentech |
$ | (39,195 | ) | $ | (1,754 | ) | $ | (13,895 | ) | |||
|
|
|
|
|
|
|
|||||||
See Accompanying Notes to Consolidated Financial Statements.
91
Table of Contents
RENTECH, INC.
Consolidated Statements of Stockholders’ Equity
(Amounts in thousands)
| Additional Paid-in |
Accumulated Other Comprehensive |
Total Rentech Stockholders’ |
Total Stockholders’ |
|||||||||||||||||||||||||||||
| Common Stock | Accumulated | Noncontrolling | ||||||||||||||||||||||||||||||
| Shares | Amount | Capital | Deficit | Income | Equity | Interests | Equity | |||||||||||||||||||||||||
| Balance, December 31, 2011 |
225,231 | $ | 2,252 | $ | 576,403 | $ | (369,807 | ) | $ | — | $ | 208,848 | $ | 39,425 | $ | 248,273 | ||||||||||||||||
| Agrifos Acquisition |
— | — | 11,177 | — | — | 11,177 | 8,823 | 20,000 | ||||||||||||||||||||||||
| Common stock issued for services |
259 | 2 | (2 | ) | — | — | — | — | — | |||||||||||||||||||||||
| Common stock issued for acquisition |
2,000 | 20 | (20 | ) | — | — | — | — | — | |||||||||||||||||||||||
| Common stock issued for stock options exercised |
264 | 3 | 287 | — | — | 290 | — | 290 | ||||||||||||||||||||||||
| Common stock issued for warrants exercised |
3,371 | 34 | 2,406 | — | — | 2,440 | — | 2,440 | ||||||||||||||||||||||||
| Payment of stock issuance costs |
— | — | (40 | ) | — | — | (40 | ) | — | (40 | ) | |||||||||||||||||||||
| Distributions |
— | — | (44,100 | ) | — | — | (44,100 | ) | — | (44,100 | ) | |||||||||||||||||||||
| Distribution to noncontrolling interests |
— | — | — | — | — | — | (47,205 | ) | (47,205 | ) | ||||||||||||||||||||||
| Equity-based compensation expense |
— | — | 9,737 | — | — | 9,737 | 1,112 | 10,849 | ||||||||||||||||||||||||
| Restricted stock units |
2,080 | 21 | (2,548 | ) | — | — | (2,527 | ) | — | (2,527 | ) | |||||||||||||||||||||
| Repurchase of common stock, including commissions |
(9,084 | ) | (91 | ) | (16,630 | ) | — | — | (16,721 | ) | — | (16,721 | ) | |||||||||||||||||||
| Income tax provision true-up for prior year equity adjustment |
— | — | 2,757 | — | 2,757 | — | 2,757 | |||||||||||||||||||||||||
| Net income |
— | — | — | (14,000 | ) | — | (14,000 | ) | 41,687 | 27,687 | ||||||||||||||||||||||
| Other comprehensive income |
— | — | — | — | 105 | 105 | 67 | 172 | ||||||||||||||||||||||||
| Other |
— | — | 21 | — | — | 21 | (828 | ) | (807 | ) | ||||||||||||||||||||||
|
|
|
|
|
|
|
|
|
|
|
|
|
|
|
|
|
|||||||||||||||||
| Balance, December 31, 2012 |
224,121 | $ | 2,241 | $ | 539,448 | $ | (383,807 | ) | $ | 105 | $ | 157,987 | $ | 43,081 | $ | 201,068 | ||||||||||||||||
| Noncontrolling interests |
— | — | — | — | — | — | 4,000 | 4,000 | ||||||||||||||||||||||||
| Acquisition for additional interest in subsidiary |
— | — | (536 | ) | — | — | (536 | ) | (1,964 | ) | (2,500 | ) | ||||||||||||||||||||
| Common stock issued for services |
178 | 2 | (2 | ) | — | — | — | — | — | |||||||||||||||||||||||
| Common stock issued for stock options exercised |
533 | 5 | 293 | — | — | 298 | — | 298 | ||||||||||||||||||||||||
| Payment of stock issuance costs |
— | — | (48 | ) | — | — | (48 | ) | — | (48 | ) | |||||||||||||||||||||
| Distributions to noncontrolling interests |
— | — | — | — | — | — | (37,329 | ) | (37,329 | ) | ||||||||||||||||||||||
| Equity-based compensation expense |
— | — | 6,814 | — | — | 6,814 | 586 | 7,400 | ||||||||||||||||||||||||
| Restricted stock units |
2,680 | 27 | (4,715 | ) | — | — | (4,688 | ) | — | (4,688 | ) | |||||||||||||||||||||
| Net income |
— | — | — | (1,532 | ) | — | (1,532 | ) | 1,570 | 38 | ||||||||||||||||||||||
| Other comprehensive income |
— | — | — | — | (222 | ) | (222 | ) | 458 | 236 | ||||||||||||||||||||||
| Other |
— | — | — | — | — | — | (519 | ) | (519 | ) | ||||||||||||||||||||||
|
|
|
|
|
|
|
|
|
|
|
|
|
|
|
|
|
|||||||||||||||||
| Balance, December 31, 2013 |
227,512 | $ | 2,275 | $ | 541,254 | $ | (385,339 | ) | $ | (117 | ) | $ | 158,073 | $ | 9,883 | $ | 167,956 | |||||||||||||||
| Common stock issued for stock options exercised |
214 | 2 | 91 | — | — | 93 | — | 93 | ||||||||||||||||||||||||
| Dividends – preferred stock |
— | — | (3,840 | ) | — | — | (3,840 | ) | — | (3,840 | ) | |||||||||||||||||||||
| Distribution to noncontrolling interests |
— | — | — | — | — | — | (4,907 | ) | (4,907 | ) | ||||||||||||||||||||||
| Equity-based compensation expense |
— | — | 6,297 | — | — | 6,297 | 516 | 6,813 | ||||||||||||||||||||||||
| Restricted stock units |
1,582 | 16 | (1,031 | ) | — | — | (1,015 | ) | — | (1,015 | ) | |||||||||||||||||||||
| Net loss |
— | — | — | (32,010 | ) | — | (32,010 | ) | (494 | ) | (32,504 | ) | ||||||||||||||||||||
| Other comprehensive loss |
— | — | — | — | (7,185 | ) | (7,185 | ) | (524 | ) | (7,709 | ) | ||||||||||||||||||||
| Other |
— | — | 320 | — | — | 320 | (1,372 | ) | (1,052 | ) | ||||||||||||||||||||||
|
|
|
|
|
|
|
|
|
|
|
|
|
|
|
|
|
|||||||||||||||||
| Balance, December 31, 2014 |
229,308 | $ | 2,293 | $ | 543,091 | $ | (417,349 | ) | $ | (7,302 | ) | $ | 120,733 | $ | 3,102 | $ | 123,835 | |||||||||||||||
|
|
|
|
|
|
|
|
|
|
|
|
|
|
|
|
|
|||||||||||||||||
See Accompanying Notes to Consolidated Financial Statements.
92
Table of Contents
RENTECH, INC.
Consolidated Statements of Cash Flows
(Amounts in thousands)
| For the Years Ended December 31, |
||||||||||||
| 2014 | 2013 | 2012 | ||||||||||
| Cash flows from operating activities |
||||||||||||
| Net income (loss) |
$ | (32,504 | ) | $ | 38 | $ | 27,687 | |||||
| Adjustments to reconcile net income (loss) to net cash provided by operating activities |
||||||||||||
| Depreciation and amortization |
36,445 | 21,184 | 14,824 | |||||||||
| Pasadena goodwill impairment |
27,202 | 30,029 | — | |||||||||
| Deferred income tax benefit |
(316 | ) | (27,130 | ) | — | |||||||
| Loss on asset impairments |
2,949 | — | 15,965 | |||||||||
| Utilization of spare parts |
6,441 | 3,821 | 2,042 | |||||||||
| Write-down of inventory |
6,045 | 12,360 | — | |||||||||
| Non-cash interest expense |
521 | 248 | 7,138 | |||||||||
| Net (gain) loss on sale of assets |
(14,684 | ) | (5,379 | ) | 272 | |||||||
| Loss on debt extinguishment |
1,485 | 6,001 | 4,801 | |||||||||
| Equity-based compensation |
6,813 | 7,400 | 10,849 | |||||||||
| Unrealized loss on derivatives |
3,807 | — | — | |||||||||
| Other |
648 | 957 | 181 | |||||||||
| Changes in operating assets and liabilities: |
||||||||||||
| Accounts receivable |
(16,994 | ) | (585 | ) | 927 | |||||||
| Other receivables |
(4,030 | ) | 3,326 | 124 | ||||||||
| Inventories |
(5,714 | ) | (18,075 | ) | 8,727 | |||||||
| Other assets |
322 | (766 | ) | 2,807 | ||||||||
| Prepaid expenses and other current assets |
(2,524 | ) | 380 | (571 | ) | |||||||
| Accounts payable |
5,834 | (7,048 | ) | 1,810 | ||||||||
| Deferred revenue |
6,964 | (9,115 | ) | (3,954 | ) | |||||||
| Accrued interest |
199 | 4,110 | — | |||||||||
| Accrued liabilities, accrued payroll and other |
(3,974 | ) | (9,402 | ) | (23,392 | ) | ||||||
|
|
|
|
|
|
|
|||||||
| Net cash provided by operating activities |
24,935 | 12,354 | 70,237 | |||||||||
|
|
|
|
|
|
|
|||||||
| Cash flows from investing activities |
||||||||||||
| Payment for acquisitions, net of cash acquired |
(32,448 | ) | (65,823 | ) | (128,596 | ) | ||||||
| Capital expenditures |
(174,511 | ) | (104,705 | ) | (59,131 | ) | ||||||
| Proceeds from disposal of assets |
14,392 | 8,991 | 569 | |||||||||
| Other items |
2,556 | (657 | ) | (1,040 | ) | |||||||
|
|
|
|
|
|
|
|||||||
| Net cash used in investing activities |
(190,011 | ) | (162,194 | ) | (188,198 | ) | ||||||
|
|
|
|
|
|
|
|||||||
| Cash flows from financing activities |
||||||||||||
| Proceeds from issuance of notes |
— | 320,000 | — | |||||||||
| Proceeds from preferred stock, net of discount and issuance costs |
94,495 | — | — | |||||||||
| Payment of offering costs |
(16 | ) | (972 | ) | (245 | ) | ||||||
| Proceeds from credit facilities and term loan, net of original issue discount |
80,606 | 65,600 | 222,780 | |||||||||
| Payments and retirement of debt |
(61,459 | ) | (223,105 | ) | (86,990 | ) | ||||||
| Repurchase of common stock, including commissions |
— | — | (16,721 | ) | ||||||||
| Payment of stock issuance costs |
— | (48 | ) | (40 | ) | |||||||
| Proceeds from options and warrants exercised |
93 | 297 | 2,729 | |||||||||
| Payment of debt issuance costs |
(2,794 | ) | (9,972 | ) | (7,788 | ) | ||||||
| Dividends to preferred stockholders |
(2,900 | ) | — | — | ||||||||
| Distributions |
— | — | (43,301 | ) | ||||||||
| Distributions to noncontrolling interests |
(4,907 | ) | (37,329 | ) | (47,205 | ) | ||||||
| Other |
— | 2 | (1,000 | ) | ||||||||
|
|
|
|
|
|
|
|||||||
| Net cash provided by financing activities |
103,118 | 114,473 | 22,219 | |||||||||
|
|
|
|
|
|
|
|||||||
| Effect of exchange rate on cash |
(216 | ) | — | — | ||||||||
|
|
|
|
|
|
|
|||||||
| Decrease in cash |
(62,174 | ) | (35,367 | ) | (95,742 | ) | ||||||
| Cash, beginning of period |
106,369 | 141,736 | 237,478 | |||||||||
|
|
|
|
|
|
|
|||||||
| Cash, end of period |
$ | 44,195 | $ | 106,369 | $ | 141,736 | ||||||
|
|
|
|
|
|
|
|||||||
93
Table of Contents
For the years ended December 31, 2014, 2013 and 2012 the Company made certain cash payments as follows:
| For the Years Ended December 31, |
||||||||||||
| 2014 | 2013 | 2012 | ||||||||||
| Cash payments of interest |
||||||||||||
| Net of capitalized interest of $7,064 (Dec 2014), $3,246 (Dec 2013) and $701 (Dec 2012) |
$ | 21,528 | $ | 12,367 | $ | 3,805 | ||||||
| Cash payments of income taxes from continuing operations |
$ | 863 | $ | 288 | $ | 8,609 | ||||||
Excluded from the statements of cash flows were the effects of certain non-cash financing and investing activities as follows:
| For the Years Ended December 31, |
||||||||||||
| 2014 | 2013 | 2012 | ||||||||||
| Restricted stock units surrendered for withholding taxes payable |
$ | 1,016 | $ | 4,688 | $ | 2,527 | ||||||
| Units issued for acquisition |
— | — | 20,000 | |||||||||
| Fair value of assets in acquisition |
55,642 | 185,399 | — | |||||||||
| Fair value of liabilities assumed in acquisition |
16,367 | 117,231 | — | |||||||||
| Contingent consideration |
3,840 | 1,850 | — | |||||||||
| Purchase of property, plant, equipment and construction in progress in accounts payable and accrued liabilities |
24,164 | 20,503 | 5,301 | |||||||||
| Increase in QS Construction Facility obligation |
16,923 | 5,181 | — | |||||||||
| Accrued dividends on preferred stock |
2,625 | — | ||||||||||
| Increase in asset retirement obligation |
1,265 | — | — | |||||||||
See Accompanying Notes to Consolidated Financial Statements.
94
Table of Contents
RENTECH, INC.
Notes to Consolidated Financial Statements
Note 1 — Description of Business
Description of Business and Basis of Presentation
Rentech, Inc. (“Rentech,” “the Company,” “we,” “us” or “our”) operates currently in five segments including East Dubuque, Pasadena, Fulghum Fibres, Wood Pellets: Industrial and Wood Pellets: NEWP.
The accompanying consolidated financial statements include the accounts of the Company, its wholly owned subsidiaries and all subsidiaries in which the Company directly or indirectly owns a controlling financial interest. All significant intercompany accounts and transactions have been eliminated in consolidation.
Nitrogen Fertilizer:
The Company through its indirect majority-owned subsidiary, Rentech Nitrogen Partners, L.P. (“RNP”), owns and operates two fertilizer facilities: the Company’s East Dubuque Facility and the Company’s Pasadena Facility, referred to collectively as the “Fertilizer Facilities.” Our East Dubuque Facility is located in East Dubuque, Illinois. The Company produces primarily ammonia and urea ammonium nitrate solution (“UAN”) at the Company’s East Dubuque Facility, using natural gas as the facility’s primary feedstock. Our Pasadena Facility, which the Company acquired in November 2012, is located in Pasadena, Texas. The Company produces ammonium sulfate, ammonium thiosulfate and sulfuric acid at the Company’s Pasadena Facility, using ammonia and sulfur as the facility’s primary feedstocks. The noncontrolling interests reflected on the Company’s consolidated balance sheets are affected by the net income (loss) of, and distribution from, RNP.
Rentech Nitrogen Holdings, Inc. (“RNHI”), Rentech’s indirect wholly owned subsidiary, owns approximately 60% of RNP common units outstanding and Rentech Nitrogen GP, LLC (the “General Partner”), RNHI’s wholly owned subsidiary, owns 100% of the non-economic general partner interest in RNP.
On November 1, 2012, RNP completed its acquisition of 100% of the membership interests of Agrifos LLC (“Agrifos”) from Agrifos Holdings Inc. (the “Seller”), pursuant to a Membership Interest Purchase Agreement (the “Agrifos Purchase Agreement”). Upon the closing of this transaction (the “Agrifos Acquisition”), Agrifos became a wholly owned subsidiary of RNP and its name changed to Rentech Nitrogen Pasadena Holdings, LLC (“RNPH”). RNPH owns all of the member interests in Rentech Nitrogen Pasadena, LLC (“RNPLLC”), formerly known as Agrifos Fertilizer, LLC, which owns and operates the Pasadena Facility. For information on the Agrifos Acquisition refer to Note 5 — Agrifos Acquisition.
Fulghum Fibres:
On May 1, 2013, the Company acquired all of the capital stock of Fulghum Fibres, Inc. (“Fulghum”). Upon the closing of this transaction (the “Fulghum Acquisition”), Fulghum became a wholly owned subsidiary of the Company. Fulghum provides wood yard operation services and high-quality wood chipping services, and produces and sells wood chips to the pulp, paper and packaging industry. Fulghum operates 31 wood chipping mills, of which 26 are located in the United States, four are located in Chile and one is located in Uruguay. The noncontrolling interests reflected on the Company’s consolidated balance sheet also represent the non-acquired ownership interests in the subsidiaries located in Chile and Uruguay. Fulghum currently owns 88% of the equity interests in the subsidiaries located in Chile and 87% of the equity interests in the subsidiary located in Uruguay. For information on the Fulghum Acquisition refer to “Note 4 — Fulghum Acquisition”.
Each of Fulghum’s United States mills typically operates under an exclusive processing agreement with a single customer. Under each agreement, the customer is responsible for procuring and delivering wood, and Fulghum is paid a processing fee based on tons processed, with minimum and maximum fees tied to volumes. Under our processing agreements, the customer generally has the opportunity to make up for any shortfall below minimum volume requirements with additional volumes in subsequent months before it is required to pay a shortfall fee. Generally, under the terms of the Company’s processing agreements, customers have the option to purchase the mill equipment for a pre-negotiated amount (which decreases over time) and, in some cases, customers have the option to acquire the land. Fulghum’s Chilean operations also include the sale of wood chips for export and the local sale of bark for power production. In both situations, the wood is purchased by Fulghum.
In connection with the Fulghum Acquisition, the Company entered into a joint venture with Graanul Invest AS (“Graanul”), a European producer of wood pellets, for the potential development and construction of, and investment in, wood pellet plants in the United States and Canada. The Company and Graanul each own 50% equity interests in the joint venture (the “Rentech/Graanul JV”) which is accounted for under the equity method. The two facilities under development in Eastern Canada will not be owned by the Rentech/Graanul JV. For the year ended December 31, 2014, the Rentech/Graanul JV’s loss, which is shown as equity in loss of investee in the consolidated statements of operations, was $0.4 million and $0.2 million for the period May 1, 2013 through December 31, 2013.
95
Table of Contents
Wood Pellets: Industrial:
The Company is developing two facilities in Eastern Canada to produce and sell wood pellets for use as renewable fuel to produce electricity. See “Note 11 — Property, Plant and Equipment” for a description of the two facilities and “Note 15 — Commitments and Contingencies” for major contracts and commitments for this business segment.
Wood Pellets: NEWP:
On May 1, 2014, the Company acquired all of the equity interests of New England Wood Pellet, LLC (“NEWP”), pursuant to a Unit Purchase Agreement (the “NEWP Purchase Agreement”). Upon the closing of the transaction (the “NEWP Acquisition”), NEWP became a wholly owned subsidiary of the Company. NEWP is one of the largest producers of wood pellets for the United States residential and commercial heating markets. NEWP operates three wood pellet processing facilities with a combined annual production capacity of 240,000 tons. The facilities are located in Jaffrey, New Hampshire; Deposit, New York; and Schuyler, New York. For information on the NEWP Acquisition, refer to “Note 3 — NEWP Acquisition” and “Note 25 — Subsequent Events, Acquisition”.
Liquidity
During the next 12 months, the Company expects the liquidity needs of its wood fibre processing business, including announced ongoing construction projects, and of its corporate activities to be met from: (i) cash on hand, (ii) distributions from RNP, (iii) cash generated by its wood fibre processing business, (iv) borrowings under the A&R GSO Credit Agreement, as defined in Note 14 — Debt, and (v) in the case of capital expenditures and working capital in Chile, Chilean bank debt financing. The Company expects that it would need to seek additional funds from its investors or in the capital markets if any of the following circumstances occur: (i) the sources of funds summarized in this paragraph were less than expected, (ii) its expenses, including capital expenditures to complete and commission the Atikokan and Wawa Projects, as defined in Note 11 — Property, Plant and Equipment, were higher than expected, (iii) the cash flow from the Atikokan or Wawa Facilities, as defined in Note 11 — Property, Plant and Equipment, were less than or later than expected, or (iv) the Company were to approve new capital projects, enter into additional commitments or acquire assets in addition to those that could be funded from the sources identified above. The Company may not be able to obtain funding in the equity or debt capital markets on terms it finds acceptable if it were to need such financing. A potential additional source of capital that could be available to fund shortfalls in the event of the possible circumstances mentioned above or to enhance expected liquidity would be the sale of some or all of the 3.1 million common units of RNP that the Company owns, once those units are released from the pledge under the A&R GSO Credit Agreement. The Company expects those units to be released no later than April 2, 2015.
Discontinued Operations
The Company was initially formed to develop and commercialize certain alternative energy technologies, and it acquired other energy technologies that the Company further developed. The Company conducted significant research and development and project development activities related to those technologies. In 2013, the Company ceased operations and reduced staffing at, and mothballed, its PDU, located in Commerce City, Colorado. The Company also eliminated all research and development activities in the first half of 2013. In October 2014, the Company sold its alternative energy technologies and certain pieces of equipment at the PDU. Any ongoing activities related to its alternative energy technologies will be to maintain the Commerce City site until it is sold and the natural gas pipeline at Natchez until it is abandoned. See “Note 7 — Discontinued Operations”.
Prior Year Errors
The Company identified errors that impacted product sales and cost of sales for the year ended December 31, 2012. The impact of correcting these errors in 2013 increased operating income by $0.2 million. Management does not believe the impact of these errors was material to 2013 or any previously issued financial statements.
Note 2 — Summary of Certain Significant Accounting Policies
Use of Estimates
The preparation of consolidated financial statements in conformity with accounting principles generally accepted in the United States of America requires management to make estimates and assumptions that affect the reported amounts of assets and liabilities, the disclosure of contingent assets and liabilities as of the date of the consolidated financial statements, and the reported amounts of revenues and expenses during the reporting period. Actual results could differ from those estimates.
96
Table of Contents
Revenue Recognition
East Dubuque and Pasadena Policy
Product sales revenues from the Fertilizer Facilities are recognized when customers take ownership upon shipment from the Fertilizer Facilities, the East Dubuque Facility’s leased facility or the Pasadena Facility’s distributors’ facilities and (i) customer assumes risk of loss, (ii) there are no uncertainties regarding customer acceptance, (iii) collection of the related receivable is probable, (iv) persuasive evidence of a sale arrangement exists and (v) the sales price is fixed or determinable. Management assesses the business environment, the customer’s financial condition, historical collection experience, accounts receivable aging and customer disputes to determine whether collectability is reasonably assured. If collectability is not considered reasonably assured at the time of sale, the Company does not recognize revenue until collection occurs.
Natural gas, though not typically purchased for the purpose of resale, is occasionally sold by the East Dubuque Facility when contracted quantities received are in excess of production and storage capacities, in which case the sales price is recorded in product sales and the related cost is recorded in cost of sales. Natural gas sales were $6.1 million for the year ended December 31, 2014, $3.4 million for the year ended December 31, 2013 and $1.1 million for the year ended December 31, 2012.
East Dubuque Contracts
RNLLC has a distribution agreement (the “Distribution Agreement”) with Agrium U.S.A., Inc. (“Agrium”). The Distribution Agreement is for a 10 year period, subject to renewal options. Pursuant to the Distribution Agreement, Agrium is obligated to use commercially reasonable efforts to promote the sale of, and solicit and secure orders from its customers for nitrogen fertilizer products manufactured at the East Dubuque Facility, and to purchase from RNLLC nitrogen fertilizer products manufactured at the facility for prices to be negotiated in good faith from time to time. Under the Distribution Agreement, Agrium is appointed as the exclusive distributor for the sale, purchase and resale of nitrogen products manufactured at the East Dubuque Facility. Sale terms are negotiated and approved by RNLLC. Agrium bears the credit risk on products sold through Agrium pursuant to the Distribution Agreement. If an agreement is not reached on the terms and conditions of any proposed Agrium sale transaction, RNLLC has the right to sell to third parties provided the sale is on the same timetable and volumes and at a price not lower than the one proposed by Agrium. For the years ended December 31, 2014, 2013 and 2012, the Distribution Agreement accounted for 78%, 79% and 83%, respectively, of net revenues from product sales for the East Dubuque Facility. Receivables from Agrium accounted for 36% and 84% of the total accounts receivable balance of the East Dubuque Facility as of December 31, 2014 and 2013, respectively. Agrium made more timely payments in 2014 than in 2013 which accounted for the lower percentage in 2014.
RNLLC negotiates sales with other customers and these transactions are not subject to the terms of the Distribution Agreement.
Under the Distribution Agreement, the East Dubuque Facility pays commissions to Agrium not to exceed $5 million during each contract year on applicable gross sales during the first 10 years of the agreement. The effective commission rate for the year ended December 31, 2014 was 3.4%, 3.6% for the year ended December 31, 2013 and 2.7% for the year ended December 31, 2012. The commission expense was recorded in cost of sales for all periods.
Pasadena Contracts
RNPLLC sells substantially all of its products through marketing and distribution agreements. Pursuant to an exclusive marketing agreement RNPLLC has entered into with Interoceanic Corporation (“IOC”), IOC has the exclusive right and obligation to market and sell all of the Pasadena Facility’s ammonium sulfate product. Under the marketing agreement, IOC is required to use commercially reasonable efforts to market the product to obtain the most advantageous price. RNPLLC compensates IOC for transportation and storage costs relating to the ammonium sulfate product it markets through the pricing structure under the marketing agreement. The marketing agreement has a term that ends December 31, 2016, but automatically renews for subsequent one-year periods (unless either party delivers a termination notice to the other party at least 210 days prior to an automatic renewal). The marketing agreement may be terminated prior to its stated term for specified causes. During the years ended December 31, 2014, 2013 and the period beginning November 1, 2012 through December 31, 2012, the marketing agreement with IOC accounted for 100% of the Pasadena Facility’s revenues from the sale of ammonium sulfate. In addition, RNPLLC has an arrangement with IOC that permits RNPLLC to store approximately 60,000 tons of ammonium sulfate at IOC-controlled terminals, which are located near end customers of the Pasadena Facility’s ammonium sulfate. This arrangement currently is not governed by a written contract. RNPLLC also has marketing and distribution agreements to sell other products that automatically renew for successive one year periods.
Fulghum Fibres Contracts
Tolling and Offtake Arrangements – Fulghum has wood chip processing and wood yard operation agreements, which contain embedded leases for accounting purposes. This generally occurs when the agreement designates a specific chip mill or pellet plant in which the buyer purchases substantially all of the output and does not otherwise meet a fixed price per unit of output exception. The Company determined that these are operating leases.
97
Table of Contents
A tolling and offtake agreement that does not contain a lease may be classified as a derivative subject to a normal purchase and sale exception, in which case the agreement is classified as an executory contract and accounted for on an accrual basis. Tolling and offtake agreements, and components of these agreements that do not meet the above classifications, are accounted for on an accrual basis.
For sales which are not accounted for as operating leases as described above, the Company recognizes revenue at the time the service is provided or when customers take ownership upon shipment from the facilities of the chips or bark and assumes risk of loss, collection of the related receivable is probable, persuasive evidence of a sale arrangement exists and the sales price is fixed or determinable. Revenues associated with tolling arrangements are included in service revenues and sales of product under offtake agreements are included in product sales in our consolidated statements of operations.
Wood Pellets: Industrial
The Company recognizes revenue at the time when customers take ownership upon shipment of the pellets and assumes risk of loss, collection of the related receivable is probable, persuasive evidence of a sale arrangement exists and the sales price is fixed or determinable.
Wood Pellets: NEWP
The Company recognizes revenue at the time when customers take ownership upon shipment from the facilities of the pellets and assumes risk of loss, collection of the related receivable is probable, persuasive evidence of a sale arrangement exists and the sales price is fixed or determinable. Two customers accounted for 40% of NEWP’s total sales for the year ended December 31, 2014.
Deferred Revenue
A significant portion of the revenue recognized during any period may be related to prepaid contracts or products stored at distributor facilities, for which cash was collected during an earlier period, with the result that a significant portion of revenue recognized during a period may not generate cash receipts during that period. As of December 31, 2014 deferred revenue was $28.6 million and $21.6 million for the year ended December 31, 2013. At the East Dubuque Facility, the Company records a liability for deferred revenue to the extent that payment has been received under prepaid contracts, which create obligations for delivery of product within a specified period of time in the future. The terms of these prepaid contracts require payment in advance of delivery. At the Pasadena Facility, our distributor pre-pays a portion of the sales price for shipments received into its storage facilities which is recorded as deferred revenue. The Company recognizes revenue related to the prepaid contracts or products stored at distributor facilities and relieves the liability for deferred revenue when products are shipped (including shipments to end customers from distributor facilities).
Cost of Sales
Cost of sales are comprised of manufacturing costs related to the Company’s fertilizer products and processing costs for services. Cost of sales expenses include direct materials (such as natural gas, ammonia, sulfur and sulfuric acid), direct labor, indirect labor, employee fringe benefits, depreciation on plant machinery, electricity and other costs, including shipping and handling charges incurred to transport products sold.
Cost of sales are also comprised of manufacturing costs related to the Company’s wood pellet products and processing costs for services. Cost of sales expenses include direct materials (such as wood and packaging materials), direct labor, indirect labor, employee fringe benefits, depreciation on plant machinery, electricity and other costs, including freight charges incurred to transport products sold related to freight revenues.
The Company enters into short-term contracts to purchase physical supplies of natural gas in fixed quantities at both fixed and indexed prices. The Company anticipates that it will physically receive the contract quantities and use them in the production of fertilizer. The Company believes it is probable that the counterparties will fulfill their contractual obligations when executing these contracts. Natural gas purchases, including the cost of transportation to the East Dubuque Facility, are recorded at the point of delivery into the pipeline system.
98
Table of Contents
Accounting for Derivative Instruments
Accounting guidance establishes accounting and reporting requirements for derivative instruments and hedging activities. This guidance requires recognition of all derivative instruments as assets or liabilities on the Company’s consolidated balance sheets and measurement of those instruments at fair value. The accounting treatment of changes in fair value is dependent upon whether or not a derivative instrument is designated as a hedge and if so, the type of hedge. The Company currently does not designate any of its derivatives as hedges for financial accounting purposes. Gains and losses on derivative instruments not designated as hedges are currently included in earnings and reported under cash flows from operating activities.
Cash
The Company has checking and savings accounts with major financial institutions. At times balances with these institutions may be in excess of federally insured limits.
Accounts and Other Receivables
Trade receivables are recorded at net realizable value. The allowance for doubtful accounts reflects the Company’s best estimate of probable losses inherent in the accounts receivable balance. The Company determines the allowance based on known troubled accounts, historical experience, and other currently available evidence. The Company reviews its allowance for doubtful accounts quarterly. Past due balances over 90 days and over a specified amount are reviewed individually for collectibility. Account balances are charged off against the allowance after all means of collection have been exhausted and the potential for recovery is considered remote.
Inventories
Inventories consist of raw materials and finished goods. The primary raw material used by the East Dubuque Facility in the production of its nitrogen products is natural gas. The primary raw materials used by the Pasadena Facility in the production of its products are ammonia and sulfur. Raw materials also include certain chemicals used in the manufacturing process. Fulghum Fibres’ raw materials inventory consists of purchased roundwood to be chipped at its South American mills. Finished goods include the products stored at the Fertilizer Facilities that are ready for shipment along with any inventory that may be stored at remote facilities, and Fulghum Fibres’ processed wood chips. Raw materials at the wood pellet facilities primarily consist of wood fibre. Raw materials at NEWP primarily consist of wood chips and sawdust procured from third parties, and packaging materials. Inventories on the consolidated balance sheets included depreciation in the amount of $2.1 million at December 31, 2014 and $1.2 million at December 31, 2013.
Inventories are stated at the lower of cost or estimated net realizable value. The cost of inventories is determined using the first-in first-out method. The estimated net realizable value is based on customer orders, market trends and historical pricing. On at least a quarterly basis, the Company performs an analysis of its inventory balances to determine if the carrying amount of inventories exceeds its net realizable value. If the carrying amount exceeds the estimated net realizable value, the carrying amount is reduced to the estimated net realizable value. During turnarounds at the East Dubuque and Pasadena Facilities, the Company allocates fixed production overhead costs to inventory based on the normal capacity of its production facilities and unallocated overhead costs are recognized as expense in the period incurred.
Property, Plant and Equipment
Property, plant and equipment is stated at cost less accumulated depreciation. Depreciation expense is generally calculated using the straight-line method over the estimated useful lives of the assets as follows:
| Type of Asset |
Estimated Useful Life | |
| Land improvements |
5-20 years | |
| Building and building improvements |
4-40 years | |
| Machinery and equipment |
7-22 years | |
| Furniture, fixtures and office equipment |
3-10 years | |
| Computer equipment and software |
2-5 years | |
| Vehicles |
2-15 years | |
| Leasehold improvements |
Useful life or remaining lease term whichever is shorter | |
Expenditures during turnarounds or at other times for improving, replacing or adding to RNP’s assets are capitalized. Expenditures for the acquisition, construction or development of new assets to maintain operating capacity, or to comply with environmental, health, safety or other regulations, are also capitalized. Costs of general maintenance and repairs are expensed.
99
Table of Contents
When property, plant and equipment is retired or otherwise disposed of, the asset and accumulated depreciation are removed from the accounts and the resulting gain or loss is reflected in operating expenses.
Spare parts are maintained by the facilities to reduce the length of possible interruptions in plant operations from an infrastructure breakdown at the facilities. The spare parts may be held for use for years before the spare parts are used. As a result, they are capitalized as a fixed asset at cost. When spare parts are utilized, the book values of the assets are charged to earnings as a cost of production. Periodically, the spare parts are evaluated for obsolescence and impairment and if the value of the spare parts is impaired, it is charged against earnings.
Long-lived assets, construction in progress and identifiable intangible assets are reviewed whenever events or changes in circumstances indicate that the carrying amount may not be recoverable. If the expected future cash flow from the use of the asset and its eventual disposition is less than the carrying amount of the asset, an impairment loss is recognized and measured using the asset’s fair value.
The Company capitalizes certain direct development costs associated with internal-use software, including external direct costs of material and services, and payroll costs for employees devoting time to software implementation projects. Costs incurred during the preliminary project stage, as well as maintenance and training costs, are expensed as incurred.
Asset Retirement Obligations:
The Company has recorded asset retirement obligations (“AROs”) related to future costs associated with (i) the removal of contaminated material at the former phosphorous plant at the Pasadena Facility, (ii) disposal of asbestos at the East Dubuque Facility and (iii) removal of machinery and equipment at Fulghum mills on leased property. The fair value of a liability for an ARO is recorded in the period in which it is incurred and the cost of such liability increases the carrying amount of the related long-lived asset by the same amount. The liability is accreted each period through charges to operating expense and the capitalized cost is depreciated over the remaining useful life of the asset. The liability was $4.4 million at December 31, 2014 and $3.0 million at December 31, 2013.
A reconciliation of the change in the carrying value of the AROs is as follows:
| Balance at December 31, 2013 |
$ | 3,014 | ||
| Accretion expense |
125 | |||
| Revisions in the estimated cash flows |
1,265 | |||
|
|
|
|||
| Balance at December 31, 2014 |
$ | 4,404 | ||
|
|
|
Construction in Progress
The Company tracks project development costs and capitalizes those costs after a project has completed the scoping phase and enters the feasibility phase. The most significant projects under construction are the Atikokan and Wawa Facilities at December 31, 2014. The Company also capitalizes costs for improvements to the existing machinery and equipment at the Fertilizer Facilities and certain costs associated with the Company’s information technology initiatives. Interest incurred on development and construction projects is capitalized until construction is complete. The Company does not depreciate construction in progress costs until the underlying assets are placed into service.
Acquisition Method of Accounting
The Company accounts for business combinations using the acquisition method of accounting, which requires, among other things, that assets acquired, liabilities assumed and earn-out consideration be recognized at their fair values as of the acquisition date. The Company has recognized goodwill and intangibles related to its acquisitions as described in “Note 3 — NEWP Acquisition” and “Note 4 — Fulghum Acquisition”. The earn-out consideration will be measured at each reporting date with changes in its fair value recognized in the consolidated statements of operations.
Goodwill
Goodwill represents the excess of the purchase price over the fair value of identifiable net assets acquired in a business combination. The Company tests goodwill for impairment annually, or more often if an event or circumstance indicates that an impairment may have occurred. The analysis of the potential impairment of goodwill is a two-step process. Step one of the impairment test consists of comparing the fair value of the reporting unit with the aggregate carrying value, including goodwill. If the carrying value of a reporting unit exceeds the reporting unit’s fair value, step two must be performed to determine the amount, if any, of the goodwill impairment.
100
Table of Contents
There are significant assumptions involved in performing a goodwill impairment test, which include discount rates, terminal growth rates, future sales prices of end products, raw material costs, and sales volumes. The various valuation methods used (income approach, replacement cost and market approach) are weighted in determining fair value. Changes to any of these assumptions could increase or decrease the fair value of the Fulghum and NEWP reporting units. See Note 12 — Goodwill.
Intangible Assets
Intangible assets arose in conjunction with the NEWP Acquisition, Fulghum Acquisition and Agrifos Acquisition (See “Note 3 — NEWP Acquisition” and “Note 4 — Fulghum Acquisition” and Note 5 — Agrifos Acquisition). NEWP’s intangible assets consist of trade names, customer relationships and non-compete agreements. Fulghum’s intangible assets consist of trade names and processing agreements to provide services to its customers. Acquired trade names related to Fulghum were assessed as indefinite lived assets because there is no foreseeable limit on the period of time over which they are expected to contribute cash flows. Acquired trade names with indefinite lives are not amortized but are subject to an annual test for impairment and in between annual tests when events or circumstances indicate that the carrying value may not be recoverable. Acquired trade names related to NEWP are amortized over 20 years.
Intangible assets consist of the following at December 31, 2014 and 2013:
| 2014 | 2013 | Average Life | ||||||||||
| (in thousands) | ||||||||||||
| Trade names |
$ | 10,496 | $ | 5,496 | 20 / Indefinite | |||||||
| Wood chip processing agreements |
29,765 | 29,765 | 1-17 | |||||||||
| Off-take contract |
2,577 | 2,811 | 10 | |||||||||
| Technologies to produce fertilizers |
23,680 | 23,680 | 20 | |||||||||
| Fertilizer marketing agreements |
3,088 | 3,088 | 1.5 | |||||||||
| Customer relationships |
1,900 | — | 13 | |||||||||
| Non-competition agreements |
200 | — | 3 | |||||||||
|
|
|
|
|
|||||||||
| Intangibles, gross |
$ | 71,706 | $ | 64,840 | ||||||||
| Less: accumulated amortization |
(9,902 | ) | (5,110 | ) | ||||||||
|
|
|
|
|
|||||||||
| Intangibles, net |
$ | 61,804 | $ | 59,730 | ||||||||
|
|
|
|
|
|||||||||
At December 31, 2014, accumulated amortization for trade names, processing agreements, technologies, marketing agreements and customer relationships was $0.4 million, $4.2 million, $2.6 million, $3.1 million, and $(0.4) million, respectively. The amortization of the assets in 2015, 2016, 2017, 2018 and 2019 will result in amortization expense of $5.5 million, $4.3 million, $3.3 million, $3.2 million and $3.1 million, respectively.
We also have unfavorable processing agreements in the amount of $2.5 million related to Fulghum Acquisition, which are included in other liabilities both current and long term. These agreements along with processing agreements recorded in intangible assets are amortized over the economic life.
Technologies to produce fertilizers consist of certain proprietary technological processes, technological functions, intellectual property, formulations, and trade secrets to produce commercial volumes of synthetic ammonium sulfate fertilizer.
Income Taxes
The Company accounts for income taxes under the liability method, which requires an entity to recognize deferred tax assets and liabilities for temporary differences. Temporary differences are differences between the tax basis of assets and liabilities and their reported amounts in the financial statements that will result in taxable or deductible amounts in future years. An income tax valuation allowance has been established to reduce the Company’s deferred tax asset to the amount that is expected to be realized in the future.
The Company recognizes in its consolidated financial statements only those tax positions that are “more-likely-than-not” of being sustained, based on the technical merits of the position. The Company performs a comprehensive review of its material tax positions in accordance with the applicable guidance.
101
Table of Contents
Net Income (Loss) Per Common Share Allocated To Rentech
Basic net income (loss) per common share allocated to Rentech is calculated by dividing net income (loss) allocated to Rentech by the weighted average number of common shares outstanding for the period. Diluted net income (loss) per common share allocated to Rentech is calculated by dividing net income (loss) allocated to Rentech by the weighted average number of common shares outstanding plus the dilutive effect, calculated using (i) the “treasury stock” method for the unvested restricted stock units, outstanding stock options and warrants and (ii) the “if converted” method for the preferred stock and convertible debt if their inclusion would not have been anti-dilutive.
Foreign Currency Translation
Assets and liabilities have been translated to the reporting currency using the exchange rates in effect on the consolidated balance sheet dates. Equity accounts are translated at historical rates, except for the change in retained earnings during the year which is the result of the income statement translation process. A portion of the intercompany balances between the Parent and certain foreign subsidiaries are classified as a long term investment because the Company does not intend to settle such accounts in the foreseeable future. Revenue and expense accounts are translated using the weighted average exchange rate during the period. The cumulative translation adjustments associated with the net assets of foreign subsidiaries are recorded in accumulated other comprehensive loss in the accompanying consolidated statements of stockholders’ equity.
Comprehensive Income (Loss)
Comprehensive income (loss) includes all changes in consolidated stockholders’ equity during the period from non-owner sources. To date, accumulated other comprehensive income (loss) is primarily comprised of adjustments to the defined benefit pension plans and the postretirement benefit plans and foreign currency translation.
Accumulated other comprehensive loss is $7.3 million and $0.1 million at December 31, 2014 and 2013, respectively. The balance at December 31, 2014 is comprised of foreign currency transaction adjustments of $(7.3) million and pension and post-retirement plan adjustments of $4,000. The balance at December 31, 2013 is comprised of foreign currency translation adjustments of $(0.9) million and pension and post-retirement plan adjustments of $0.8 million. Activity for the years ending December 31, 2014 and 2013 are reflected in the Consolidated Statement of Comprehensive Income (Loss). The balance of the components as of December 31, 2012 are not material. There were no material amounts reclassified from accumulated other comprehensive income in any of the three years ending December 31, 2014.
Recent Accounting Pronouncements
In July 2013, the Financial Accounting Standards Board (the “FASB”) issued guidance as to when an unrecognized tax benefit should be classified as a reduction of a deferred tax asset or when it should be classified as a liability in the consolidated balance sheets. This guidance is effective for fiscal years, and interim periods within those years, beginning after December 15, 2013, and thus became effective for the Company’s interim period beginning on January 1, 2014. The adoption of this guidance did not have any impact on the Company’s consolidated financial position, results of operations or disclosures.
In April 2014, the FASB issued guidance that provides a narrower definition of discontinued operations than under previous guidance. It requires that only disposals of components of an entity (or groups of components) that represent a strategic shift that has or will have a major effect on the reporting entity’s operations are to be reported in the financial statements as discontinued operations. It also provides guidance on the financial statement presentations and disclosures of discontinued operations. This guidance is effective prospectively for disposals (or classifications of held-for-sale) of components of an entity that occur in annual or interim periods beginning after December 15, 2014. The impact of this guidance is dependent on whether or not future disposals occur.
In May 2014, the FASB issued guidance that will significantly enhance comparability of revenue recognition practices across entities, industries, jurisdictions, and capital markets. This guidance is effective for fiscal years, and interim periods within those years, beginning after December 15, 2016. Early application is not permitted. The Company is evaluating the provisions of this guidance and the potential impact, if any, on its consolidated financial position, results of operations and disclosures.
In June 2014, the FASB issued guidance on accounting for share-based payments when the terms of an award provide that a performance target could be achieved after the requisite service period. This guidance is effective for fiscal years, and interim periods within those years, beginning after December 15, 2015. The Company is evaluating the provisions of this guidance and the potential impact, if any, on its consolidated financial position, results of operations and disclosures.
In August 2014, the FASB issued guidance on presentation of financial statements – going concern, which applies to all companies. It requires management to evaluate whether there are conditions or events, considered in the aggregate, that raise substantial doubt about the entity’s ability to continue as a going concern within one year after the date that the financial statements are issued. This guidance is effective for the annual period ending after December 15, 2016, and for annual periods and interim periods thereafter. The Company is evaluating the provisions of this guidance and the potential impact, if any, on its consolidated financial position, results of operations and disclosures.
In November 2014, the FASB issued guidance on hybrid financial instruments. The guidance does not change the current criteria for determining when separation of certain embedded derivative features in a hybrid financial instrument is required. The guidance clarifies that an entity should consider all relevant terms and features, including the embedded derivative feature being evaluated for bifurcation, in evaluating the nature of the host contract. This guidance is effective for fiscal years, and interim periods within those fiscal years, beginning after December 15, 2015. The Company is evaluating the provisions of this guidance and the potential impact, if any, on its consolidated financial position, results of operations and disclosures.
102
Table of Contents
In January 2015, the FASB issued guidance, which eliminates the concept of extraordinary items. This guidance is effective for fiscal years, and interim periods within those fiscal years, beginning after December 15, 2015. The Company is evaluating the provisions of this guidance and the potential impact, if any, on its consolidated financial position, results of operations and disclosures.
Note 3 — NEWP Acquisition
On May 1, 2014, the Company acquired all of the equity interests of NEWP. This acquisition is consistent with the Company’s strategy of expanding its wood fibre business. The preliminary purchase price consisted of $35.4 million of cash as well as potential earn-out consideration of up to $5.0 million to be paid in cash. The amount of the purchase price is subject to certain potential post-closing adjustments set forth in the NEWP Purchase Agreement.
This business combination has been accounted for using the acquisition method of accounting, which requires, among other things, that assets acquired and liabilities assumed be recognized at their fair values as of the acquisition date.
The preliminary purchase price recognized in our financial statements consisted of the following (amounts in thousands):
| Cash |
$ | 35,434 | ||
| Estimate of expected earn-out consideration(1) |
3,840 | |||
|
|
|
|||
| Total preliminary purchase price |
$ | 39,274 | ||
|
|
|
| (1) | The amount of earn-out consideration reflected in the table above reflects the Company’s estimate, as of May 1, 2014, of the amount of the earn-out consideration it will be required to pay pursuant to the NEWP Purchase Agreement. The earn-out consideration will be measured at each reporting date; changes in its fair value will be recognized in the consolidated statements of operations. As of December 31, 2014, the earn-out consideration of $5.0 million was earned, and will be paid in 2015. |
The Company’s preliminary purchase price allocation is as follows (amounts in thousands):
| Cash |
$ | 3,852 | ||
| Accounts receivable |
2,925 | |||
| Inventories |
2,239 | |||
| Prepaid expenses and other current assets |
439 | |||
| Property, plant and equipment |
30,625 | |||
| Intangible assets (trade name—$5,000, customer relationships—$1,900, and non-compete agreements—$200) |
7,100 | |||
| Goodwill |
8,461 | |||
| Accounts payable |
(1,641 | ) | ||
| Accrued liabilities |
(442 | ) | ||
| Customer deposits |
(882 | ) | ||
| Loans |
(12,600 | ) | ||
| Interest rate swaps |
(802 | ) | ||
|
|
|
|||
| Total preliminary purchase price |
$ | 39,274 | ||
|
|
|
Intangible assets consist primarily of customer relationships, trade names and non-compete agreements with former owners. The estimated useful life of each of the trade names is 20 years, 13 years for customer relationships and three years for non-compete agreements.
The goodwill recorded reflects the value to Rentech of NEWP’s market position, of entry into the residential and commercial heating markets, and of the increases in Rentech’s products offerings, customer bases and geographic markets. The goodwill recorded as part of this acquisition is amortizable for tax purposes.
The final purchase price and the allocation thereof will not be known until the valuation of intangible assets is completed, which is expected to be during the second quarter of 2015.
NEWP’s operations are included in the consolidated statements of operations as of May 1, 2014. During the year ended December 31, 2014, the Company recorded revenue of $32.1 million and net income of $4.3 million related to NEWP. Acquisition related costs for this acquisition were $1.1 million for the year ended December 31, 2014, and have been included in the consolidated statements of operations within selling, general and administrative expenses. See “Note 6 — Pro Forma Information” for unaudited pro forma information relating to the NEWP Acquisition.
103
Table of Contents
Note 4 — Fulghum Acquisition
On May 1, 2013, the Company acquired all of the capital stock of Fulghum. The purchase price consisted of $64.2 million of cash, including $3.3 million used to retire certain debt of Fulghum at closing.
This business combination has been accounted for using the acquisition method of accounting. The Company’s final purchase price allocation is as follows (amounts in thousands):
| Cash |
$ | 10,137 | ||
| Accounts receivable |
3,936 | |||
| Inventories |
2,389 | |||
| Prepaid expenses and other current assets |
952 | |||
| Other receivables, net |
5,435 | |||
| Property, plant and equipment |
94,382 | |||
| Intangible assets (trade name—$5,496 and processing agreements—$29,765) |
35,261 | |||
| Goodwill |
29,932 | |||
| Other assets |
2,974 | |||
| Accounts payable |
(6,547 | ) | ||
| Accrued liabilities |
(5,823 | ) | ||
| Customer deposits |
(1,059 | ) | ||
| Asset retirement obligation |
(178 | ) | ||
| Credit facility and loans |
(61,865 | ) | ||
| Unfavorable processing agreements |
(6,496 | ) | ||
| Deferred income taxes |
(35,262 | ) | ||
| Noncontrolling interests |
(4,000 | ) | ||
|
|
|
|||
| Total purchase price |
$ | 64,168 | ||
|
|
|
Long-term deferred tax liabilities and other tax liabilities result from fair value adjustments to identifiable tangible and intangible assets. These adjustments create book basis higher than the tax basis. The excess is multiplied by the statutory tax rate for the jurisdiction and period in which the deferred taxes are expected to be realized. As part of purchase accounting for Fulghum, we recorded additional deferred tax liabilities of $15.8 million attributable to identifiable tangible and intangible assets.
The goodwill recorded reflects that value to Rentech of Fulghum’s market position, of entry into the wood chipping business, and of the increases in Rentech’s products offerings, customer bases and geographic markets. The goodwill recorded as part of this acquisition is not amortizable for tax purposes.
Fulghum’s operations are included in the consolidated statement of operations as of May 1, 2013. During the year ended December 31, 2013, the Company recorded revenue of $63.0 million and net income of $7.0 million related to Fulghum. Acquisition related costs for this acquisition totaled $1.5 million for the year ended December 31, 2013 and have been included in the consolidated statements of operations within selling, general and administrative expense. See “Note 6 — Pro Forma Information” for unaudited pro forma information relating to the Fulghum Acquisition.
Note 5 — Agrifos Acquisition
On November 1, 2012, the Company acquired all of the membership interest of Agrifos. The purchase price for Agrifos and its subsidiaries consisted of an initial purchase price of $136.3 million in cash, less working capital adjustments, and $20.0 million in common units representing limited partnership interests in RNP (the “Common Units”), which reduced the Company’s ownership interest in RNP at the time from 60.8% to 59.9%, as well as potential earn-out consideration of up to $50.0 million to be paid in Common Units or cash at RNP’s option based on the amount by which the two-year Adjusted EBITDA, as defined in the Agrifos Purchase Agreement, of the Pasadena Facility exceeds certain thresholds. We deposited with an escrow agent in several escrow accounts a portion of the initial consideration consisting of an aggregate of $7.25 million in cash, and 323,276 Common Units to satisfy certain indemnity claims.
In October 2014, RNP reached an agreement to settle all existing and future indemnity claims it may have under the Agrifos Purchase Agreement. The parties agreed to distribute $5.0 million of cash and 59,186 Common Units held in escrow to RNP. The remaining $0.9 million of cash and 264,090 Common Units held in escrow were released to the Seller. No earn-out consideration was earned. During the year ended December 31, 2014, the Company recognized income from the Agrifos settlement of $5.6 million.
104
Table of Contents
This business combination has been accounted for using the acquisition method of accounting, which requires, among other things, that most assets acquired, liabilities assumed and earn-out consideration be recognized at their fair values as of the acquisition date.
The purchase price consisted of the following (amounts in thousands):
| Cash (through borrowings under a previous credit agreement) less working capital adjustments |
$ | 136,308 | ||
| Fair market value of 538,793 Common Units issued |
20,000 | |||
| Estimate of potential earn-out consideration(1) |
4,920 | |||
|
|
|
|||
| Total purchase price |
$ | 161,228 | ||
|
|
|
| (1) | The amount of earn-out consideration reflected in the table above reflects the Company’s estimate, as of November 1, 2012, of the amount of the earn-out consideration RNP will be required to pay pursuant to the Agrifos Purchase Agreement, as defined in Note 8 — Fair Value. The earn-out consideration was measured at each reporting date with changes in its fair value recognized in the consolidated statements of operations. As of December 31, 2013, the fair value of the potential earn-out consideration was $0. |
RNP’s final purchase price allocation is as follows (amounts in thousands):
| Cash |
$ | 2,622 | ||
| Accounts receivable |
3,204 | |||
| Inventories |
30,373 | |||
| Prepaid expenses and other current assets |
566 | |||
| Property, plant and equipment |
68,688 | |||
| Construction in progress |
7,011 | |||
| Intangible assets (technology—$23,680 and marketing agreement—$3,088) |
26,768 | |||
| Goodwill |
57,231 | |||
| Other assets |
73 | |||
| Accounts payable |
(10,638 | ) | ||
| Accrued liabilities |
(6,640 | ) | ||
| Customer deposits |
(13,301 | ) | ||
| Asset retirement obligation |
(2,776 | ) | ||
| Other long-term liabilities |
(1,953 | ) | ||
|
|
|
|||
| Total purchase price |
$ | 161,228 | ||
|
|
|
The operations of Agrifos are included in the consolidated statement of operations effective November 1, 2012. During the calendar year ended December 31, 2012, the Company recorded revenue and net loss related to Agrifos of approximately $37.4 million and $2.6 million, respectively. Acquisition related costs for this acquisition totaled approximately $4.1 million for the calendar year ended December 31, 2012 and have been included in the consolidated statements of operations within selling, general and administrative expense.
105
Table of Contents
Note 6 — Pro Forma Information
The unaudited pro forma information has been prepared as if the NEWP Acquisition, as defined in “Note 3 — NEWP Acquisition”, had taken place on January 1, 2013. The unaudited pro forma information has also been prepared as if the Fulghum Acquisition and the Agrifos Acquisition, as defined in “Note 4 — Fulghum Acquisition” and “Note 5 — Agrifos Acquisition”, had taken place on January 1, 2012. The unaudited pro forma information is not necessarily indicative of the results that the Company would have achieved had the transactions actually taken place on January 1, 2012 or January 1, 2013, and the unaudited pro forma information does not purport to be indicative of future financial operating results.
| For the Year Ended December 31, 2014 |
||||||||||||
| As Reported | Pro Forma Adjustments |
Pro Forma | ||||||||||
| (in thousands) | ||||||||||||
| Revenues |
$ | 472,661 | $ | 14,329 | $ | 486,990 | ||||||
| Net income (loss) |
$ | (32,504 | ) | $ | 1,330 | $ | (31,174 | ) | ||||
| Net loss attributable to Rentech |
$ | (35,850 | ) | $ | 1,330 | $ | (34,520 | ) | ||||
| Basic and diluted net income (loss) from continuing operations per common share attributable to Rentech |
$ | (0.19 | ) | $ | 0.01 | $ | (0.18 | ) | ||||
| For the Calendar Year Ended December 31, 2013 |
||||||||||||
| As Reported | Pro Forma Adjustments |
Pro Forma | ||||||||||
| (in thousands) | ||||||||||||
| Revenues |
$ | 374,349 | $ | 80,399 | $ | 454,748 | ||||||
| Net income (loss)(1) |
$ | 38 | $ | (24,292 | ) | $ | (24,254 | ) | ||||
| Net loss attributable to Rentech |
$ | (1,532 | ) | $ | (24,427 | ) | $ | (25,959 | ) | |||
| Basic and diluted net income (loss) from continuing operations per common share attributable to Rentech |
$ | 0.02 | $ | (0.10 | ) | $ | (0.08 | ) | ||||
| For the Calendar Year Ended December 31, 2012 |
||||||||||||
| As Reported | Pro Forma Adjustments |
Pro Forma | ||||||||||
| (in thousands) | ||||||||||||
| Revenues |
$ | 261,635 | $ | 226,346 | $ | 487,981 | ||||||
| Net income(1) |
$ | 27,687 | $ | 29,137 | $ | 56,824 | ||||||
| Net income (loss) attributable to Rentech |
$ | (14,000 | ) | $ | 29,573 | $ | 15,573 | |||||
| Basic and diluted net income (loss) from continuing operations per common share attributable to Rentech |
$ | 0.10 | $ | 0.13 | $ | 0.23 | ||||||
| (1) | As discussed in Note 21 — Income Taxes, during the year ended December 31, 2013, there was a release of a valuation allowance resulting from recording deferred tax liabilities from the Fulghum Acquisition. Since the pro forma information is presented as if the transaction had taken place on January 1, 2012, the release of the valuation allowance is included in the pro forma results for the calendar year ended December 31, 2012 and excluded from the pro forma results for the calendar year ended December 31, 2013. |
Note 7 — Discontinued Operations
On October 28, 2014, the Company sold its alternative energy technologies and certain pieces of equipment at the PDU. The Company received a cash payment of $14.4 million from the buyer, Sunshine Kaidi New Energy Group Co., Ltd. (“Kaidi”), which was in addition to $0.5 million in cash payments previously received. Kaidi also paid an additional $0.4 million to the Company to purchase various equipment located at the Company’s PDU, resulting in $15.3 million of total proceeds to the Company from these transactions, which does not include the possibility of a success payment of up to $16.2 million upon the achievement of agreed milestones related to the development of the sold technologies. During the year ended December 31, 2014, the Company recorded a gain on sale of $15.3 million. As a result of the agreement to sell the technologies and certain equipment, the Company has classified its consolidated balance sheets and consolidated statements of operations for all periods presented in this report to reflect the energy technologies segment as a discontinued operation. In the consolidated statements of cash flows, the cash flows of discontinued operations are not separately classified or aggregated, and are reported in the respective categories with those of continuing operations.
All discussions and amounts in the consolidated financial statements and related notes, except for cash flows, for all periods presented relate to continuing operations only, unless otherwise noted.
106
Table of Contents
The following table summarizes the components of assets and liabilities of discontinued operations.
| As of | ||||||||
| December, 31 | ||||||||
| 2014 | 2013 | |||||||
| (in thousands) | ||||||||
| Prepaid expenses and other current assets |
$ | 305 | $ | 19 | ||||
| Other receivables |
— | — | ||||||
|
|
|
|
|
|||||
| Total current assets |
$ | 305 | $ | 19 | ||||
|
|
|
|
|
|||||
| Property held for sale |
$ | 1,677 | $ | 4,647 | ||||
| Deposits and other assets |
— | 4 | ||||||
|
|
|
|
|
|||||
| Total other assets |
$ | 1,677 | $ | 4,651 | ||||
|
|
|
|
|
|||||
| Total assets |
$ | 1,982 | $ | 4,670 | ||||
|
|
|
|
|
|||||
| Accounts payable |
$ | 144 | $ | 151 | ||||
| Accrued payroll and benefits |
559 | 356 | ||||||
| Accrued liabilities |
1,008 | 1,496 | ||||||
| Other |
— | — | ||||||
|
|
|
|
|
|||||
| Total liabilities |
$ | 1,711 | $ | 2,003 | ||||
|
|
|
|
|
|||||
The following table summarizes the results of discontinued operations.
| For the Years Ended December 31, |
||||||||||||
| 2014 | 2013 | 2012 | ||||||||||
| (in thousands) | ||||||||||||
| Revenues |
$ | 322 | $ | 506 | $ | 290 | ||||||
| Operating income (loss) |
$ | 6,053 | $ | (7,001 | ) | $ | (42,114 | ) | ||||
| Income (loss) from discontinued operations, net of tax |
$ | 7,259 | $ | (6,606 | ) | $ | (37,376 | ) | ||||
Note 8 — Fair Value
Fair value is defined as the price that would be received to sell an asset or paid to transfer a liability in an orderly transaction between market participants at the measurement date in a principal or most advantageous market. Fair value is a market-based measurement that is determined based on inputs, which refer broadly to assumptions that market participants use in pricing assets or liabilities. These inputs can be readily observable, market corroborated or generally unobservable inputs. The Company makes certain assumptions it believes that market participants would use in pricing assets or liabilities, including assumptions about risk, and the risks inherent in the inputs to valuation techniques. Credit risk of the Company and its counterparties is incorporated in the valuation of assets and liabilities. The Company believes it uses valuation techniques that maximize the use of observable market-based inputs and minimize the use of unobservable inputs.
Accounting guidance provides for a fair value hierarchy that prioritizes the inputs to valuation techniques used to measure fair value in three broad levels. The fair value hierarchy gives the highest priority to quoted prices (unadjusted) in active markets for identical assets or liabilities (Level 1) and the lowest priority to unobservable inputs (Level 3). In some cases, the inputs used to measure fair value might fall in different levels of the fair value hierarchy. All assets and liabilities are required to be classified in their entirety based on the lowest level of input that is significant to the fair value measurement in its entirety. Assessing the significance of a particular input may require judgment in considering factors specific to the asset or liability, and may affect the valuation of the asset or liability and its placement within the fair value hierarchy. The Company classifies fair value balances based on the fair value hierarchy, defined as follows:
| • | Level 1 — Consists of unadjusted quoted prices in active markets for identical assets or liabilities that the Company has the ability to access as of the reporting date. |
| • | Level 2 — Consists of inputs other than quoted prices included within Level 1 that are directly observable for the asset or liability or indirectly observable through corroboration with observable market data. |
107
Table of Contents
| • | Level 3 — Consists of unobservable inputs for assets or liabilities whose fair value is estimated based on internally developed models or methodologies using inputs that are generally less readily observable and supported by little, if any, market activity at the measurement date. Unobservable inputs are developed based on the best available information and subject to cost-benefit constraints. |
Fair values of cash, receivables, deposits, other current assets, accounts payable, accrued liabilities and other current liabilities were assumed to approximate carrying value since they are short term and can be settled on demand.
The following table presents the financial instruments that were accounted for at fair value by level as of December 31, 2014 and 2013.
| Level 1 | Level 2 | Level 3 | ||||||||||
| (in thousands) | ||||||||||||
| Liabilities |
||||||||||||
| Earn-out consideration—2014 |
$ | — | $ | — | $ | 1,295 | ||||||
| Earn-out consideration—2013 |
$ | — | $ | — | $ | 1,544 | ||||||
The following table presents the fair value and carrying value of the Company’s borrowings as of December 31, 2014.
| Fair Value | Carrying Value |
|||||||||||||||
| (in thousands) | ||||||||||||||||
| Level 1 | Level 2 | Level 3 | ||||||||||||||
| Liabilities |
||||||||||||||||
| RNP Notes |
$ | 310,202 | $ | — | $ | — | $ | 320,000 | ||||||||
| Fulghum debt |
— | 53,192 | — | 54,771 | ||||||||||||
| NEWP debt |
— | 10,968 | — | 11,265 | ||||||||||||
| GSO Credit Agreement |
— | 50,000 | — | 49,142 | ||||||||||||
| GE Credit Agreement |
— | 15,000 | — | 15,000 | ||||||||||||
The following table presents the fair value and carrying value of the Company’s borrowings as of December 31, 2013.
| Fair Value | Carrying Value |
|||||||||||||||
| (in thousands) | ||||||||||||||||
| Level 1 | Level 2 | Level 3 | ||||||||||||||
| Liabilities |
||||||||||||||||
| RNP Notes |
$ | 318,400 | $ | — | $ | — | $ | 320,000 | ||||||||
| Fulghum debt |
— | 45,970 | — | 47,452 | ||||||||||||
| RNHI Revolving Loan |
— | 50,000 | — | 50,000 | ||||||||||||
Earn-out Consideration
At December 31, 2014, the earn-out consideration reflected in our consolidated financial statements includes $5.0 million relating to the NEWP Acquisition. The earn-out consideration of $5.0 million was fully earned at December 31, 2014.
At December 31, 2014, the earn-out consideration includes $1.3 million of potential earn-out consideration relating to the Atikokan Project, as defined in “Note 11 — Property, Plant and Equipment”. This consideration is deemed to be a Level 3 financial instrument because the measurement is based on unobservable inputs. The fair value of earn-out consideration was determined based on the Company’s analysis of various scenarios involving the achievement of certain levels of EBITDA, as defined in the asset purchase agreement related to the Atikokan Project, over a ten-year period. The scenarios, which included a weighted probability factor, involved assumptions relating to product profitability and production levels. The earn-out consideration will be measured at each reporting date with changes in its fair value recognized in the consolidated statements of operations. Assuming the minimum required EBITDA level is achieved, an increase or decrease of $1.0 million in EBITDA would result in an increase or decrease in earn-out consideration of $0.1 million. The Company provided a loan to the sellers in the Atikokan Project of $0.9 million, which will be repayable from any earn-out consideration. The collectability of the loan is tied to the amount of earn-out consideration the sellers receive from the Company.
108
Table of Contents
There was potential additional consideration the Company may have been required to pay under the Agrifos Purchase Agreement. The earn-out consideration related to the Agrifos Acquisition was deemed to be a Level 3 financial instrument because the measurement is based on unobservable inputs. The fair value of earn-out consideration was determined based on the Company’s analysis of various scenarios involving the achievement of certain levels of Adjusted EBITDA, as defined in the Agrifos Purchase Agreement, over a two-year period. The scenarios, which included a weighted probability factor, involved assumptions relating to the market prices of the Company’s products and feedstocks, as well as product profitability and production. The earn-out consideration was measured at each reporting date with changes in its fair value recognized in the consolidated statements of operations. For the year ended December 31, 2013, the fair value of the liability decreased by $4.9 million. At December 31, 2013, the fair value of the potential earn-out consideration relating to the Agrifos Acquisition was $0. The decrease in fair value was a result of lower than expected profitability in 2013.
A reconciliation of the change in the carrying value of the earn-out consideration is as follows:
| Agrifos | Atikokan | NEWP | Total | |||||||||||||
| (in thousands) | ||||||||||||||||
| Balance at December 31, 2012 |
$ | 4,920 | $ | — | $ | — | $ | 4,920 | ||||||||
| Add: Earn-out consideration |
— | 1,850 | — | 1,850 | ||||||||||||
| Add: Unrealized (gain) loss |
(4,920 | ) | (202 | ) | — | (5,122 | ) | |||||||||
| Add: Unrealized gain on foreign currency translation |
— | (104 | ) | — | (104 | ) | ||||||||||
|
|
|
|
|
|
|
|
|
|||||||||
| Balance at December 31, 2013 |
$ | — | $ | 1,544 | $ | — | $ | 1,544 | ||||||||
| Add: Earn-out consideration |
— | — | 3,840 | 3,840 | ||||||||||||
| Add: Unrealized (gain) loss |
— | (127 | ) | 1,160 | 1,033 | |||||||||||
| Add: Unrealized gain on foreign currency translation |
— | (122 | ) | — | (122 | ) | ||||||||||
|
|
|
|
|
|
|
|
|
|||||||||
| Balance at December 31, 2014 |
$ | — | $ | 1,295 | $ | 5,000 | $ | 6,295 | ||||||||
|
|
|
|
|
|
|
|
|
|||||||||
Debt Valuation
The RNP Notes, as defined in “Note 14 — Debt”, are deemed to be Level 1 financial instruments because there was an active market for such debt. The fair value of such debt had been determined based on market prices.
The Fulghum and NEWP debt, as defined in “Note 14 — Debt”, is deemed to be Level 2 financial instruments because the measurement is based on observable market data. The Company’s valuation reflects discounted expected future cash flows, which incorporate yield curves for instruments with similar characteristics, such as credit ratings, weighted average lives and maturity dates.
The GSO Credit Agreement and GE Credit Agreement, as defined in “Note 14 — Debt”, are deemed to be a Level 2 financial instrument because the measurement is based on observable market data. It is concluded that the carrying value of the GSO Credit Agreement and GE Credit Agreement approximates the fair value of such loans as of December 31, 2014 based on their floating interest rates and the Company’s assessment that the fixed-rate margins are still at market.
The RNHI Revolving Loan, as defined in “Note 14 — Debt”, is deemed to be a Level 2 financial instrument because the measurement is based on observable market data. It is concluded that the carrying value of the RNHI Revolving Loan approximates the fair value of such loan as of December 31, 2013 because of the floating nature of the interest rate and the fact that the Company’s credit worthiness has not changed since the loan was issued. During the year ended December 31, 2014, the Company paid off the outstanding balance under RNHI Revolving Loan.
The levels within the fair value hierarchy at which the Company’s financial instruments have been evaluated have not changed for any of the Company’s financial instruments during the years ended December 31, 2014 and 2013.
109
Table of Contents
Note 9 — Derivative Instruments
Forward Natural Gas Contracts
RNP uses commodity-based derivatives to minimize its exposure to the fluctuations in natural gas prices. RNP recognizes the unrealized gains or losses related to the commodity-based derivative instruments in its consolidated financial statements. RNP does not have any master netting agreements or collateral relating to these derivatives.
Our East Dubuque Facility enters into forward natural gas purchase contracts to reduce its exposure to the fluctuations in natural gas prices. The forward natural gas contracts are deemed to be Level 2 financial instruments because the measurement is based on observable market data. The fair value of such contracts had been determined based on market prices. Gain or loss associated with forward natural gas contracts is recorded in cost of sales on the consolidated statements of operations. The amount of unrealized loss recorded was $4.0 million for the year ended December 31, 2014.
Interest Rate Swaps
NEWP entered into three interest rate swaps in notional amounts that cover the borrowings under its two industrial revenue bonds and a real estate mortgage loan. Through the three interest rate swaps, NEWP is essentially fixing the variable interest rate to be paid on its borrowings.
Under the interest rate swaps, NEWP pays interest at a fixed rate of 5.29% on the outstanding balance of one of the industrial revenue bonds, 5.05% on the outstanding balance of the other industrial revenue bond and 7.95% on the outstanding balance of the real estate mortgage loan. NEWP receives interest at the variable interest rates specified in the various swap agreements.
The interest rate swaps are designated as derivatives for accounting purposes. The interest rate swaps are deemed to be Level 2 financial instruments because the measurements are based on observable market data. The Company used a standard swap contract valuation method to value its interest rate derivatives, and the inputs it uses for present value discounting included forward one-month LIBOR rates, risk-free interest rates and an estimate of credit risk. The fair value of the interest rate swaps at December 31, 2014 represents the unrealized loss of $0.7 million. Any adjustments to the fair value of the interest rate swaps from the date of the NEWP Acquisition will be recorded on the consolidated statements of operations. For the eight months ended December 31, 2014, the Company recorded an unrealized gain of $0.2 million.
In 2012, RNLLC entered into two forward starting interest rate swaps in notional amounts which covered a portion of its outstanding borrowings. The interest rate swaps were deemed to be Level 2 financial instruments because the measurements were based on observable market data. RNP used a standard swap contract valuation method to value its interest rate derivatives, and the inputs it uses for present value discounting included forward one-month and three-month LIBOR rates, risk-free interest rates and an estimate of credit risk. The change in fair value was recorded in other expense, net on the consolidated statement of operations. The realized loss represents the cash payments required under the interest rate swaps.
Net gain (loss) on interest rate swaps:
| For the Years Ended December 31, |
||||||||||||
| 2014 | 2013 | 2012 | ||||||||||
| (in thousands) | ||||||||||||
| Realized loss |
$ | — | $ | (24 | ) | $ | (22 | ) | ||||
| Unrealized gain (loss) |
172 | 17 | (929 | ) | ||||||||
|
|
|
|
|
|
|
|||||||
| Total net gain (loss) on interest rate swaps |
$ | 172 | $ | (7 | ) | $ | (951 | ) | ||||
|
|
|
|
|
|
|
|||||||
During the year ended December 31, 2013, RNP paid $0.9 million to terminate the RNLLC interest rate swaps.
The forward natural gas contracts are recorded in accrued liabilities on the consolidated balance sheets. The interest rate swaps are recorded in other liabilities on the consolidated balance sheets.
| Current Liabilities |
||||
| (in thousands) | ||||
| Forward natural gas contracts: |
||||
| Gross amounts recognized |
$ | 3,955 | ||
| Gross amounts offset in consolidated balance sheets |
— | |||
|
|
|
|||
| Net amounts presented in the consolidated balance sheets |
$ | 3,955 | ||
|
|
|
|||
110
Table of Contents
| Current Liabilities |
||||
| (in thousands) | ||||
| Interest rate swaps: |
||||
| Gross amounts recognized |
$ | 653 | ||
| Gross amounts offset in consolidated balance sheets |
— | |||
|
|
|
|||
| Net amounts presented in the consolidated balance sheets |
$ | 653 | ||
|
|
|
|||
The following table presents the financial instruments that were accounted for at fair value by level as of December 31, 2014:
| Level 1 | Level 2 | Level 3 | ||||||||||
| (in thousands) | ||||||||||||
| Liabilities |
||||||||||||
| Forward gas contracts |
$ | — | $ | 3,955 | $ | — | ||||||
| Interest rate swaps |
— | 653 | — | |||||||||
Note 10 — Inventories
Inventories consisted of the following:
| As of December 31, | ||||||||
| 2014 | 2013 | |||||||
| (in thousands) | ||||||||
| Finished goods |
$ | 26,669 | $ | 27,638 | ||||
| Raw materials |
11,226 | 7,448 | ||||||
| Other |
190 | 290 | ||||||
|
|
|
|
|
|||||
| Total inventory |
$ | 38,085 | $ | 35,376 | ||||
|
|
|
|
|
|||||
During the year ended December 31, 2014, the Company wrote down the value of the Pasadena Facility’s ammonium sulfate inventory by $6.0 million to market value. During the year ended December 31, 2013, the Company wrote down the value of the Pasadena Facility’s ammonium sulfate, sulfur and sulfuric acid inventory by $12.4 million to market value. The various write-downs were reflected in cost of goods sold for the applicable periods.
Note 11 — Property, Plant and Equipment
Property, plant and equipment consisted of the following:
| As of December 31, | ||||||||
| 2014 | 2013 | |||||||
| (in thousands) | ||||||||
| Land and land improvements |
$ | 28,042 | $ | 26,149 | ||||
| Buildings and building improvements |
45,516 | 33,096 | ||||||
| Machinery and equipment |
406,489 | 334,645 | ||||||
| Furniture, fixtures and office equipment |
1,610 | 1,123 | ||||||
| Computer equipment and computer software |
8,748 | 7,977 | ||||||
| Vehicles |
5,893 | 4,624 | ||||||
| Leasehold improvements |
2,405 | 2,348 | ||||||
| Other |
1,453 | 210 | ||||||
|
|
|
|
|
|||||
| 500,156 | 410,172 | |||||||
| Less: Accumulated depreciation |
(107,705 | ) | (75,518 | ) | ||||
|
|
|
|
|
|||||
| Total property, plant and equipment, net |
$ | 392,451 | $ | 334,654 | ||||
|
|
|
|
|
|||||
111
Table of Contents
Construction in progress consisted of the following:
| As of December 31, | ||||||||
| 2014 | 2013 | |||||||
| (in thousands) | ||||||||
| East Dubuque Facility |
15,010 | 2,195 | ||||||
| Pasadena Facility |
32,747 | 31,335 | ||||||
| Fulghum Fibres |
7,197 | 273 | ||||||
| Atikokan Project |
36,931 | 8,458 | ||||||
| Wawa Project |
65,232 | 11,809 | ||||||
| Construction under QS Construction Facility |
21,712 | 5,198 | ||||||
| Other |
594 | 868 | ||||||
|
|
|
|
|
|||||
| Total construction in progress |
$ | 179,423 | $ | 60,136 | ||||
|
|
|
|
|
|||||
The construction in progress balance at December 31, 2014 includes $6.3 million of capitalized interest cost and $0.8 million at December 31, 2013.
The construction in progress amount at the Pasadena Facility consists primarily of the power generation project.
In 2013, the Company acquired an idled oriented strand board processing mill in Wawa, Ontario, Canada. The Company is in the process of converting the mill to a wood pellet facility (the Wawa Facility”) designed to produce 450,000 metric tons of wood pellets annually (the “Wawa Project”). The Wawa Facility is nearing completion of construction. The Company expects the facility to begin startup and commissioning in the second quarter of 2015 and to operate at full capacity within one year from the start of commissioning. Also, in 2013, the Company acquired a former particle board processing mill in Atikokan, Ontario, Canada. The Company is in the process of converting the mill to a wood pellet facility (the “Atikokan Facility”) and expects it to produce 110,000 metric tons of wood pellets annually (the “Atikokan Project”). In the first quarter of 2015, the Atikokan Facility began the commissioning phase and began producing and selling wood pellets. The Company expects the Atikokan Facility to be operating at full capacity in six to 12 months.
The Company expects that the new term loan under the A&R GSO Credit Agreement, together with cash on hand, will be sufficient to fund the Atikokan and Wawa Projects until they have been commissioned and later begin to generate positive cash flow.
Pursuant to the Port Agreement, as defined in “Note 14 — Debt”, Quebec Stevedoring Company Limited (“Quebec Stevedoring”) is required to build handling equipment and 75,000 metric tons of wood pellet storage exclusively for the Company’s use at the Port of Quebec, with the same amount becoming a financing obligation for the Company.
Note 12 — Goodwill
A reconciliation of the change in the carrying value of goodwill is as follows:
| Pasadena | Fulghum | NEWP | Total | |||||||||||||
| (in thousands) | ||||||||||||||||
| Balance at December 31, 2012 |
$ | 56,592 | $ | — | $ | — | $ | 56,592 | ||||||||
| Add: Acquisition |
— | 29,932 | — | 29,932 | ||||||||||||
| Add: Increase |
639 | — | — | 639 | ||||||||||||
| Less: Impairment |
(30,029 | ) | — | — | (30,029 | ) | ||||||||||
|
|
|
|
|
|
|
|
|
|||||||||
| Balance at December 31, 2013 |
$ | 27,202 | $ | 29,932 | $ | — | $ | 57,134 | ||||||||
| Add: Acquisition |
— | — | 8,461 | 8,461 | ||||||||||||
| Less: Impairment |
(27,202 | ) | — | — | (27,202 | ) | ||||||||||
|
|
|
|
|
|
|
|
|
|||||||||
| Balance at December 31, 2014 |
$ | — | $ | 29,932 | $ | 8,461 | $ | 38,393 | ||||||||
|
|
|
|
|
|
|
|
|
|||||||||
112
Table of Contents
The goodwill resulting from the Agrifos Acquisition and the NEWP Acquisition is amortizable for tax purposes, while the goodwill from the Fulghum Acquisition is not amortizable for tax purposes.
Note 13 — Impairments
The Company tests goodwill assets for impairment annually, or more often if an event or circumstances indicate an impairment may have occurred. Between annual goodwill impairment tests, the Company qualitatively assesses whether or not it is necessary to perform the two-step goodwill impairment test for each reporting unit. If based on the results of its qualitative assessment, it is more likely than not that the fair value of the reporting unit exceeds its carrying value, then the two-step goodwill impairment test is not required.
Year Ended December 31, 2014
During the second quarter of 2014, the Company incurred $2.8 million write-down of ammonium sulfate inventory to market value primarily due to lower market prices of ammonium sulfate. This expense is reflected in product cost of sales. Management considered this inventory impairment, negative gross margin and negative EBITDA, in the second quarter of 2014, as well as revised cash flow projections developed during the second quarter of 2014, taken together as indicators that a potential impairment of the goodwill related to the Pasadena Facility may have occurred. Factors that affect cash flow include, but are not limited to: product prices; product sales volumes; feedstock prices, labor, maintenance, and other operating costs; required capital expenditures; and plant productivity.
Cash flow projections decreased primarily because of a decline in forecasted product margins. The reduction of prices in the forecast was the result of an evaluation of many factors, including recent deterioration in reported margins. A global decline in nitrogen prices, along with higher exports of ammonium sulfate from China, put downward pressure on ammonium sulfate prices. The additional supplies from China originate from new plants that produce ammonium sulfate as a by-product of manufacturing caprolactam. Current prices for ammonia and sulfur, key inputs for ammonium sulfate, had increased significantly during the second quarter. Global ammonia supplies were tight, supported by production issues in Egypt, Algeria, Trinidad and Qatar, as well as political unrest in Libya and Ukraine.
The analysis of the potential impairment of goodwill is a two-step process. Step one of the impairment test consists of comparing the fair value of the reporting unit with the aggregate carrying value, including goodwill. If the carrying value of a reporting unit exceeds the reporting unit’s fair value, step two must be performed to determine the amount, if any, of the goodwill impairment. Step one of the goodwill impairment test involves a high degree of judgment and consists of a comparison of the fair value of a reporting unit with its book value. The fair value of the Pasadena reporting unit was based upon various assumptions and was based primarily on the discounted cash flows that the business could be expected to generate in the future (the “Income Approach”). The Income Approach valuation method required the Company to make projections of revenue and costs over a multi-year period. Additionally, the Company made an estimate of a weighted average cost of capital that a market participant would use as a discount rate. The Company also considered other valuation methods including the replacement cost and market approach. Based upon its analysis of the fair value of the Pasadena reporting unit, the Company believed it was probable that the Pasadena reporting unit had a carrying value in excess of its fair value at June 30, 2014. The inputs utilized in the analyses were classified as Level 3 inputs within the fair value hierarchy as defined in accounting guidance.
Step two of the goodwill impairment test consists of comparing the implied fair value of the reporting unit’s goodwill against the carrying value of the goodwill. The estimated difference between the fair value of the entire reporting unit as determined in step one and the net fair value of all identifiable assets and liabilities represents the implied fair value of goodwill. The valuation of assets and liabilities in step two is performed only for purposes of assessing goodwill for impairment and the Company did not adjust the net book value of the assets and liabilities on its consolidated balance sheets other than goodwill as a result of this process. Completion of step two of the goodwill impairment test indicated no remaining residual value of goodwill and resulted in the Company recording an impairment charge of $27.2 million during the quarter ended June 30, 2014. The goodwill impairment was primarily the result of a decrease in the implied fair value of the Pasadena reporting unit. A deterioration in projected cash flows and an increase in the rate used to discount such cash flows contributed to this decrease. In addition, the implied residual value of goodwill decreased because of an increase in the amount of invested capital at the Pasadena Facility, which primarily was the result of capital expenditures for the power generation project and expenditures to replace the sulfuric acid converter. The Company also considered the realizability of long-lived assets and intangible assets at June 30, 2014 and noted that no impairment of such assets was required.
Year Ended December 31, 2013
During the year, the Company incurred $12.4 million write-down of ammonium sulfate, sulfur and sulfuric acid inventory to market value primarily due to lower market prices of ammonium sulfate. This expense is reflected in product cost of sales.
113
Table of Contents
Ammonium sulfate is the primary product of the Pasadena Facility. Results for the year ended December 31, 2013 and our projections of future cash flow from the production and sale of this product are worse than the results originally projected in late 2012, when the Company acquired Agrifos. The expected results and cash flows as of 2012 were utilized to allocate the purchase price of the Agrifos Acquisition. The primary cause of the reduction in the estimated fair value of the Pasadena reporting unit is the decline in the cash flow expected to be generated from the sale of ammonium sulfate, compared to the expectations at the time of the acquisition. A major cause of the lower expected cash flows is a decline in the level of prices, and expected prices, for nitrogen fertilizer caused by, among other things, lower corn prices, poor weather conditions for fertilizer application throughout the United States in 2013 and increased supply of urea from China.
Factors that affect cash flows include, but are not limited to, product prices; product transportation costs; product sales volumes; feedstock prices and availability; labor, maintenance, and other operating costs; required capital expenditures, and plant productivity. The Pasadena Facility generated negative EBITDA during the year ended December 31, 2013. Current and projected prices for the products and inputs at that time were below the levels at the time of the acquisition, yielding expectations for lower variable dollar margins per ton of product, even though percentage margins are expected to be consistent with those at the time of the acquisition because the prices of ammonium sulfate and its major raw materials have dropped by similar percentages. Lower dollar variable margins provide fewer dollars per ton sold to cover the fixed costs of the facility, resulting in reduced expectations of cash generated by the facility in a lower-price environment. In addition, the Pasadena Facility’s production was lower than expected due to plant outages, and costs had been higher than expected due to higher maintenance expense.
Based upon its analysis of the value of the Pasadena reporting unit using the Income Approach, the Company recorded an estimated impairment to goodwill of $30.0 million during the quarter ended September 30, 2013. During the quarter ended December 31, 2013, the Company performed a “step 2” analysis of goodwill and determined no adjustment to the initial goodwill impairment charge was necessary. There are significant assumptions involved in determining a goodwill impairment charge, which includes discount rates, terminal growth rates, future prices of end products and raw materials, terminal values and production volumes. The various valuation methods used (income approach, replacement cost, market approach) are also weighted in determining fair market value. Changes to any of these assumptions could increase or decrease the fair value of the Pasadena reporting unit. At December 31, 2013 the fair value of the Pasadena reporting unit was essentially equal to its carrying value and any adverse change to the critical assumptions used to measure discounted cash flows could result in a diminution in fair value that may result in additional goodwill impairment charges.
Year Ended December 31, 2012
The Company recorded intangibles related to the acquisition of two subsidiaries in its energy technology segment. The Company expected that these assets would be used in various development projects with unrelated parties. During the year 2012 the Company determined, based upon the status of negotiations with third parties to fund development of projects using the technologies, that the likelihood of future cash flows were significantly diminished. The Company concluded, based on the high degree of uncertainty and low probability of completion of these projects, that the intangibles were impaired. As a result, the Company impaired the net book value of the intangibles in the amounts of $16.0 million, which is reflected in discontinued operations.
Note 14 — Debt
The Company’s borrowings at December 31, 2014 and 2013 are summarized below. Debt premium, discount and issuance expenses incurred in connection with financing are deferred and amortized on a straight line basis.
RNP Notes Offering
On April 12, 2013, RNP and Rentech Nitrogen Finance Corporation, a wholly owned subsidiary of RNP (“Finance Corporation” and collectively with RNP, the “Issuers”), issued $320.0 million of 6.5% second lien senior secured notes due 2021 (the “RNP Notes”) to qualified institutional buyers and non-United States persons in a private offering exempt from the registration requirements of the Securities Act of 1933, as amended. The RNP Notes bear interest at a rate of 6.5% per year, payable semi-annually in arrears on April 15 and October 15 of each year. The RNP Notes will mature on April 15, 2021, unless repurchased or redeemed earlier in accordance with their terms. RNP used part of the net proceeds from the offering to repay in full and terminate a credit agreement entered into in October 2012 (“the 2012 RNP Credit Agreement”) and related interest rate swaps, and intends to use the remaining proceeds to pay for expenditures related to its expansion projects and for general partnership purposes.
The RNP Notes are fully and unconditionally guaranteed, jointly and severally, by each of RNP’s existing domestic subsidiaries, other than Finance Corporation. In addition, the RNP Notes and the guarantees thereof are collateralized by a second priority lien on substantially all of RNP’s and the guarantors’ assets, subject to permitted liens.
114
Table of Contents
The Issuers may redeem some or all of the RNP Notes at any time prior to April 15, 2016 at a redemption price equal to 100% of the principal amount of the RNP Notes redeemed, plus a “make whole” premium, and accrued and unpaid interest, if any, to the date of redemption. At any time prior to April 15, 2016, RNP may also, on any one or more occasions, redeem up to 35% of the aggregate principal amount of the RNP Notes issued with the net proceeds of certain equity offerings at 106.5% of the principal amount of the RNP Notes, plus accrued and unpaid interest, if any, to the date of redemption. On or after April 15, 2016, RNP may redeem some or all of the RNP Notes at a premium that will decrease over time, plus accrued and unpaid interest, if any, to the redemption date.
RNP Credit Agreement
On April 12, 2013, RNP and Finance Corporation (collectively the “Borrowers”) entered into a new credit agreement (the “RNP Credit Agreement”) with various lenders. The RNP Credit Agreement consisted of a $35.0 million senior secured revolving credit facility (the “RNP Credit Facility”). As of December 31, 2013, there were no outstanding borrowings under the RNP Credit Agreement. The RNP Credit Agreement was terminated on July 22, 2014 and replaced with the GE Credit Agreement (as defined below).
QS Construction Facility
In connection with the Drax Contract (as defined in Note 15 — Commitments and Contingencies), on April 30, 2013, the Company and Quebec Stevedoring entered into a Master Services Agreement (the “Port Agreement”) pursuant to which Quebec Stevedoring is required to provide stevedoring, terminalling and warehousing services to the Company at the Port of Quebec. The Port Agreement is designed to support the term and volume commitments of the Drax Contract as well as future wood pellet exports through the Port of Quebec. Pursuant to the Port Agreement, Quebec Stevedoring is required to build handling equipment and 75,000 metric tons of wood pellet storage exclusively for the Company’s use at the port, with the same amount becoming a financing obligation for the Company (the “QS Construction Facility”). The fifteen-year note for $20.0 million bears interest at a rate of 10% per year.
Fulghum Debt
As of December 31, 2014, Fulghum’s outstanding debt consists primarily of term loans with various financial institutions with each term loan collateralized by specific property and equipment. The term loans have maturity dates ranging from 2015 through 2028. Amount of debt outstanding with financial institutions located in the United States was $34.7million and $18.5 million with financial institutions located in South America. The weighted average interest rate on the debt was 6.3%. Cash can be distributed to Rentech from Fulghum to the extent that such distributions are permitted in Fulghum’s debt agreements.
RNHI Revolving Loan
On September 23, 2013, RNHI obtained a $100.0 million revolving loan facility (“RNHI Revolving Loan”) by entering into a credit agreement (the “RNHI Credit Agreement”) among RNHI, Credit Suisse AG, Cayman Islands Branch, as administrative agent and each other lender from time to time party thereto. On September 24, 2013, the Company borrowed $50.0 million under the facility. On April 9, 2014, the Company paid off the outstanding balance under the facility with proceeds from the GSO Credit Agreement and terminated the RNHI Credit Agreement.
BMO Credit Agreement
On November 25, 2013, the Company entered into a credit agreement with Bank of Montreal (the “BMO Credit Agreement”). The BMO Credit Agreement originally consisted of a $3.0 million revolving credit facility, which could only be utilized as letters of credit.
On April 8, 2014, the BMO Credit Agreement was amended to increase the amount available under the revolving credit facility from $3.0 million to $10.0 million.
Borrowings bear a letter of credit fee of 3.75% per annum on the daily average face amount of the letters of credits outstanding during the preceding calendar quarter. The Company also is required to pay a commitment fee on the average daily undrawn portion of the credit facility at a rate equal to 0.75% per annum. This commitment fee is payable quarterly in arrears on the last day of each calendar quarter and on the termination date. The BMO Credit Agreement will terminate on November 25, 2015. At December 31, 2014, letters of credit had been issued, but not drawn upon, totaling $7.1 million, and $1.1 million had been issued at December 31, 2013.
115
Table of Contents
GSO Credit Agreement
On April 9, 2014, RNHI (the “Borrower”), entered into a Term Loan Credit Agreement (the “GSO Credit Agreement”) among the Borrower, certain funds managed by or affiliated with GSO Capital Partners LP (“GSO Capital”), as lenders, Credit Suisse AG, Cayman Islands Branch, as administrative agent and each lender from time to time party thereto. The Company used the borrowings from the facility to fund the acquisition and development of its wood fibre business, which consists of its wood chipping and wood pellet businesses, and for general corporate purposes
The facility originally consisted of a $50.0 million term loan, with a five-year maturity. The obligations of the Borrower under the facility are unconditionally guaranteed by the Company and are secured by common units of RNP owned by the Borrower. The term loan facility was subject to a 2.00% original issue discount.
Borrowings under the facility bear interest at a rate equal to the greater of (i) LIBOR plus 7.00% per annum and (ii) 8.00% per annum. In the event the Company prepays the facility prior to its first anniversary from funds other than those generated through certain sales of assets and under certain conditions, it will be required to pay a prepayment fee equal to 1.00% of the amount of the prepayment.
On February 12, 2015, the Company amended and restated the GSO Credit Agreement (the “A&R GSO Credit Agreement”), which increased borrowings by $25.0 million and added an additional $38.0 million available for borrowing. For information on the A&R GSO Credit Agreement, refer to “Note 25 — Subsequent Events”.
NEWP Debt
As of December 31, 2014, NEWP’s outstanding debt of $10.9 million had a weighted average interest rate of 5.0%. The debt consists primarily of term loans, bonds and a revolving credit facility with various financial institutions, and such debt is collateralized by the assets of NEWP. The debt has maturity dates ranging from 2016 through 2021. Cash can be distributed to Rentech from NEWP to the extent that such distributions are permitted in NEWP’s debt agreements.
On January 23, 2015, NEWP entered into an additional term loan with T.D. Bank, N.A. for $8.0 million that is also secured by the assets of NEWP. NEWP used the proceeds of the loan to acquire the assets of Allegheny Pellet Corporation (“Allegheny”) and for general corporate purposes. See “Note 25 — Subsequent Events”.
GE Credit Agreement
On July 22, 2014, RNP replaced the RNP Credit Agreement by entering into a new credit agreement (the “GE Credit Agreement”) by and among RNP and Finance Corporation as borrowers (the “GE Borrowers”), certain subsidiaries of RNP, as guarantors, General Electric Capital Corporation, for itself as agent for the lenders party thereto, the other financial institutions party thereto, and GE Capital Markets, Inc., as sole lead arranger and bookrunner.
The GE Credit Agreement consists of a $50.0 million senior secured revolving credit facility (the “GE Credit Facility”) with a $10.0 million letter of credit sublimit. RNP expects that the GE Credit Agreement will be used to fund growth projects, working capital needs, letters of credit and for other general partnership purposes.
Borrowings under the GE Credit Agreement bear interest at a rate equal to an applicable margin plus, at the GE Borrowers’ option, either (a) in the case of base rate borrowings, a rate equal to the highest of (1) the prime rate, (2) the federal funds rate plus 0.5% or (3) LIBOR for an interest period of one month plus 1.00% or (b) in the case of LIBOR borrowings, the offered rate per annum for deposits of dollars for the applicable interest period on the day that is two business days prior to the first day of such interest period. The applicable margin for borrowings under the GE Credit Agreement is 2.25% with respect to base rate borrowings and 3.25% with respect to LIBOR borrowings.
The GE Borrowers are required to pay a fee to the lenders under the GE Credit Agreement on the average undrawn available portion of the GE Credit Facility at a rate equal to 0.50% per annum. If letters of credit are issued, the GE Borrowers will also pay a fee to the lenders under the GE Credit Agreement at a rate equal to the product of the average daily undrawn face amount of all letters of credit issued, guaranteed or supported by risk participation agreements multiplied by a per annum rate equal to the applicable margin with respect to LIBOR borrowings. The GE Borrowers are also required to pay customary letter of credit fees on issued letters of credit. In the event the GE Borrowers reduce or terminate the commitments under the GE Credit Facility on or prior to the 18-month anniversary of the closing date, the GE Borrowers shall pay a prepayment fee equal to 1.0% of the amount of the commitment reduction.
116
Table of Contents
The GE Credit Agreement terminates on July 22, 2019. The GE Borrowers may voluntarily prepay their utilization and/or permanently cancel all or part of the available commitments under the GE Credit Agreement in minimum increments of $5.0 million (subject to the prepayment fee described above). Amounts repaid may be reborrowed. Borrowings under the GE Credit Agreement will be subject to mandatory prepayment under certain circumstances, with customary exceptions, from the proceeds of permitted dispositions of assets and from certain insurance and condemnation proceeds.
RNLLC, RNPLLC and Rentech Nitrogen Pasadena Holdings, LLC guarantee the GE Credit Agreement. The obligations under the GE Credit Agreement and the subsidiary guarantees thereof are secured by the same collateral securing the RNP Notes, which includes substantially all the assets of RNP and its subsidiaries. After the occurrence and during the continuation of an event of default, proceeds of any collection, sale, foreclosure or other realization upon any collateral will be applied to repay obligations under the GE Credit Agreement and the subsidiary guarantees thereof to the extent secured by the collateral before any such proceeds are applied to repay obligations under the RNP Notes.
As of December 31, 2014, the Company had $15.0 million outstanding borrowings under the GE Credit Agreement. At December 31, 2014, a letter of credit had been issued, but not drawn upon, in the amount of $1.8 million.
Total Debt
As of December 31, 2014, the Company was in compliance with all covenants under the RNP Notes, Fulghum debt, GSO Credit Agreement, NEWP debt, RNP Credit Agreement, GE Credit Agreement and BMO Credit Agreement. Total debt consisted of the following:
| As of December 31, | ||||||||
| 2014 | 2013 | |||||||
| (in thousands) | ||||||||
| RNP Notes |
$ | 320,000 | $ | 320,000 | ||||
| QS Construction Facility |
18,679 | 4,527 | ||||||
| Fulghum debt |
53,179 | 45,290 | ||||||
| RNHI Revolving Loan |
— | 50,000 | ||||||
| GSO Credit Agreement |
50,000 | — | ||||||
| NEWP debt |
10,913 | — | ||||||
| GE Credit Agreement |
15,000 | — | ||||||
|
|
|
|
|
|||||
| Total debt |
$ | 467,771 | $ | 419,817 | ||||
| Plus: Unamortized net premium |
1,085 | 2,162 | ||||||
| Less: Current portion |
(17,260 | ) | (9,270 | ) | ||||
| Less: Current portion unamortized premium |
(524 | ) | (646 | ) | ||||
|
|
|
|
|
|||||
| Long-term debt |
$ | 451,072 | $ | 412,063 | ||||
|
|
|
|
|
|||||
Future maturities of total debt are as follows (in thousands):
| For the Years Ending December 31 |
||||
| 2015 |
$ | 17,260 | ||
| 2016 |
9,634 | |||
| 2017 |
8,123 | |||
| 2018 |
5,710 | |||
| 2019 |
70,369 | |||
| Thereafter |
356,675 | |||
|
|
|
|||
| $ | 467,771 | |||
|
|
|
The termination of the RNP Credit Agreement resulted in a loss on debt extinguishment of $0.6 million for the year ended December 31, 2014. The payoff of the RNHI Revolving Loan resulted in a loss on debt extinguishment of $0.9 million for the year ended December 31, 2014. These two transactions resulted in a total loss on debt extinguishment of $1.5 million for the year ended December 31, 2014. The payoff of the 2012 RNP Credit Agreement resulted in a loss on debt extinguishment, for the year ended December 31, 2013, of $6.0 million. The entry into the 2012 RNP Credit Agreement and the payoff of a previous credit agreement resulted in a loss on debt extinguishment of $2.1 million. As a result of redeeming convertible notes prior to maturity, the unamortized debt discount and debt issuance costs were written off which resulted in a loss on debt extinguishment of $2.7 million. These two transactions resulted in a total loss on debt extinguishment of $4.8 million for the year ended December 31, 2012.
117
Table of Contents
Cash can be distributed to us from our subsidiaries to the extent that such distribution would not cause the subsidiary to be in violation of any financial covenants in its debt arrangements, and as permitted in our debt documents.
Note 15 — Commitments and Contingencies
Natural Gas Forward Purchase Contracts
The Company’s policy and practice are to enter into fixed-price forward purchase contracts for natural gas in conjunction with contracted nitrogen fertilizer product sales in order to substantially fix gross margin on those product sales contracts. The Company may also enter into a limited amount of additional fixed-price forward purchase contracts for natural gas in order to reduce monthly and seasonal gas price volatility. The Company occasionally enters into index-price contracts for the purchase of natural gas. The Company has entered into multiple natural gas forward purchase contracts for various delivery dates through June 30, 2015. Commitments for natural gas purchases consist of the following:
| As of December 31, | ||||||||
| 2014 | 2013 | |||||||
| (in thousands, except weighted average rate) | ||||||||
| MMBtus under fixed-price contracts |
3,188 | 2,071 | ||||||
| MMBtus under index-price contracts |
540 | 81 | ||||||
|
|
|
|
|
|||||
| Total MMBtus under contracts |
3,728 | 2,152 | ||||||
|
|
|
|
|
|||||
| Commitments to purchase natural gas |
$ | 15,568 | $ | 8,571 | ||||
| Weighted average rate per MMBtu based on the fixed rates and the indexes applicable to each contract |
$ | 4.18 | $ | 3.98 | ||||
As of December 31, 2014, deposits against these forward gas contracts were $0.9 million. During January and February 2015, the Company entered into additional fixed-quantity forward purchase contracts at fixed and indexed prices for various delivery dates through December 31, 2015. The total MMBtus associated with these additional forward purchase contracts are 2.7 million and the total amount of the purchase commitments is $7.7 million, resulting in a weighted average rate per MMBtu of $2.88 in these new commitments. The Company is required to make additional prepayments under these forward purchase contracts in the event that market prices fall below the purchase prices in the contracts.
Operating Leases
The Company has various operating leases of real and personal property which expire through September 2029. Total lease expense, including month-to-month rent, common area maintenance charges and other rent related fees, for the years ended December 31, 2014 was $6.4 million and $2.0 million for each of the years ended December 31, 2013 and 2012.
Future minimum lease payments as of December 31, 2014 are as follows (in thousands):
| For the Years Ending December 31, |
||||
| 2015 |
$ | 7,318 | ||
| 2016 |
6,642 | |||
| 2017 |
4,350 | |||
| 2018 |
3,380 | |||
| 2019 and thereafter |
16,893 | |||
|
|
|
|||
| $ | 38,583 | |||
|
|
|
|||
Contractual Obligations
Wood Pellets
On May 1, 2013, Rentech’s subsidiary that owns the Wawa Facility entered into a ten-year take-or-pay contract (the “Drax Contract”) with Drax Power Limited (“Drax”). Under the Drax Contract, such subsidiary is required to sell to Drax the first 400,000 metric tonnes of wood pellets per year produced from the Wawa Facility, with the first delivery under the contract scheduled for the end of year 2014. In 2014, we did not deliver wood pellets as required under the Drax Contract, the Rentech subsidiary that owns the
118
Table of Contents
Wawa Facility is required to pay Drax an amount equal to the positive difference, if any, between the contract price for the wood pellets and the price of any wood pellets Drax purchases in replacement. Rentech has guaranteed this obligation in an amount not to exceed $20.0 million. For 2014, the Company did not meet the contracted delivery schedule and, therefore, it was required to pay $0.2 million to Drax, which was recorded in cost of sales as of December 31, 2014.
Rentech’s subsidiary that owns the Atikokan Facility entered into a ten-year take-or-pay contract (the “OPG Contract”) with Ontario Power Generation (“OPG”) under which such subsidiary is required to deliver 45,000 metric tonnes of wood pellets annually starting in 2014, prorated in the first year based on the successful commissioning date of OPG’s Atikokan power station. OPG has the option to increase required delivery of wood pellets from the Atikokan Facility to up to 90,000 metric tonnes annually.
A Rentech subsidiary has contracted with Canadian National Railway Company (the “Canadian National Contract”) for all rail transportation of wood pellets from the Atikokan Facility and the Wawa Facility to the Port of Quebec. The Atikokan Facility is located 1,300 track miles and the Wawa Facility is located 1,100 track miles from the Port of Quebec.
Under the Canadian National Contract, such subsidiary has committed to transport a minimum of 1,500 rail carloads during the months of January 2014 through December 2014, and 3,600 rail carloads annually thereafter for the duration of the long-term contract. Delivery shortfalls would result in a $1,000 per rail car penalty. For 2014, the Company did not meet the minimum requirements and, therefore, it is required to pay a negotiated amount of $0.5 million to Canadian National Railway Company, which was recorded in cost of sales in 2014.
Litigation
The Company is party to litigation from time to time in the normal course of business. The Company accrues liabilities related to litigation only when it concludes that it is probable that it will incur costs related to such litigation, and can reasonably estimate the amount of such costs. In cases where the Company determines that it is not probable, but reasonably possible that it has a material obligation, it discloses such obligations and the possible loss or range of loss, if such estimate can be made. The outcome of the Company’s current material litigation matters are not estimable or probable. The Company maintains insurance to cover certain actions and believes that resolution of its current litigation matters will not have a material adverse effect on the Company’s financial statements.
Regulation
The Company’s business is subject to extensive and frequently changing federal, state and local, environmental, health and safety regulations governing a wide range of matters, including the emission of air pollutants, the release of hazardous substances into the environment, the treatment and discharge of waste water and the storage, handling, use and transportation of the Company’s fertilizer products, raw materials, and other substances that are part of our operations. These laws include the Clean Air Act (the “CAA”), the federal Water Pollution Control Act, the Resource Conservation and Recovery Act, the Comprehensive Environmental Response, Compensation and Liability Act, the Toxic Substances Control Act, and various other federal, state and local laws and regulations. The laws and regulations to which the Company is subject are complex, change frequently and have tended to become more stringent over time. The ultimate impact on the Company’s business of complying with existing laws and regulations is not always clearly known or determinable due in part to the fact that the Company’s operations may change over time and certain implementing regulations for laws, such as the CAA, have not yet been finalized, are under governmental or judicial review or are being revised. These laws and regulations could result in increased capital, operating and compliance costs.
The Company entered into a settlement agreement with the Illinois Environmental Protection Agency in August 2013 requiring it to connect a device at the East Dubuque Facility to an ammonia safety flare by December 1, 2015. The Company estimates the cost of the project required by the settlement agreement as being $0.4 million.
The Company is negotiating a settlement agreement with Region 6 of the Environmental Protection Agency relating to an ammonia release that occurred at the Pasadena Facility on April 20, 2014. The Company estimates the amount of the penalty required by the settlement agreement to be approximately $0.1 million.
Gain and Loss Contingencies
As indicated in “Note 7 — Discontinued Operations”, the Company sold most of its alternative energy business in 2014, which was based in Colorado. During the year ended December 31, 2014, the Company paid a 2013 county property tax assessment in Colorado in the amount of $1.3 million, which was accrued in 2013. However, the Company did not agree with the assessed property value and appealed to the Board of Assessment Appeals State of Colorado (“Board of Assessment”). In 2014, the Company won its appeal and the Company is owed a refund of $1.2 million. Adams County has appealed to the Colorado Court of Appeals. The Company has not recorded the receivable related to the overpayment as it represents a gain contingency.
For 2014, the Company has accrued the Colorado property taxes based on the property value approved by the Board of Assessment. However, the county has assessed the Company a higher property value than it did in 2013, which would require a property tax payment by the Company of $1.7 million. This amount is $1.6 million in excess of what the Company accrued. Because it won its appeal for 2013, the Company believes that the assessment of $1.7 million is not probable and has not reflected an accrual for the excess amount of $1.6 million.
119
Table of Contents
In 2013, the Company sold its property located in Natchez, Mississippi (“Natchez”) for $8.6 million. The Company continues to own an approximately 18 mile-long natural gas pipeline that runs from Tensas Parish, Louisiana to the site in Natchez, Mississippi. On February 6, 2015, the Company received an order from the Federal Energy Regulatory Commission to abandon the natural gas pipeline. The Company expects the abandonment costs to be $0.8 million. These costs were recorded in discontinued operations during the year ended December 31, 2014, but will be incurred to complete the abandonment process in 2015. As part of the Natchez property sale, the Company is entitled to reimbursement from the buyer of Natchez for its costs relating to the pipeline abandonment. The Company has not recorded the receivable related to the reimbursement of abandonment costs as it represents a gain contingency.
A fire at our mill in Maine during the first quarter of 2014 disrupted operations, causing lower processing volumes and higher than typical processing costs at the facility during the first half of 2014. The mill’s customer has indicated it incurred unspecified losses related to the production disruptions caused by the fire. The Company is unable at this time to estimate any potential liability from this contingency.
Note 16 — Preferred Stock
On April 9, 2014, the Company entered into a Subscription Agreement (the “Subscription Agreement”) with funds managed by or affiliated with GSO Capital (the “Series E Purchasers”), pursuant to which the Company sold 100,000 shares of its Series E Convertible Preferred Stock (the “2014 Preferred Stock” or “Series E Preferred Stock”) to the Series E Purchasers. The shares have an aggregate original issue price of $100.0 million and were purchased for an aggregate purchase price of $98.0 million (reflecting an issuance discount of 2%). Dividends on the 2014 Preferred Stock accrue and are cumulative, whether or not declared by the Board of Directors of the Company (the “Board”), at the rate of 4.5% per annum on the sum of the original issue price plus all unpaid accrued and accumulated dividends thereon. The 2014 Preferred Stock is convertible into up to 45,045,045 shares of Rentech’s common stock (“Common Stock”) at a conversion price of $2.22 per share, subject to adjustment. In certain circumstances, the 2014 Preferred Stock is redeemable by the Series E Purchasers for a price equal to the original issue price plus all accrued and unpaid dividends (including dividends accruing from the last dividend payment date).
On April 9, 2014, a newly formed wholly owned subsidiary of the Company, DSHC, LLC (“DSHC”), and each of the Series E Purchasers entered into a Put Option Agreement (the “Put Option Agreements”). Under the Put Option Agreements, each Series E Purchaser has the right to cause DSHC to purchase any of the 2014 Preferred Stock for the original issue price plus all accrued and unpaid dividends (including dividends accruing from the last dividend payment date) upon certain put trigger events, including the failure of the Company to redeem the 2014 Preferred Stock when required. All obligations of DSHC under the Put Option Agreements are secured by 5,524,862 common units of RNP owned by DSHC. DSHC is a special purpose entity referred to as a bankruptcy-remote entity whose operations are limited. DSHC is a separate and distinct legal entity from Rentech and its assets are not available to Rentech’s creditors.
The 2014 Preferred Stock is accounted for as mezzanine equity in the consolidated balance sheets. However, dividends are recorded in the consolidated statements of stockholders’ equity and consist of the 4.5% dividend plus the amortization of issuance costs and accretion of discount. Dividends are paid on the first business day of June and December of each year.
Mezzanine equity at December 31, 2014 consisted of the following (in thousands):
| Original issue price of 2014 Preferred Stock |
$ | 100,000 | ||
| Less: Issuance costs |
(3,144 | ) | ||
| Less: Unamortized discount |
(1,796 | ) | ||
|
|
|
|||
| Total mezzanine equity |
$ | 95,060 | ||
|
|
|
On February 12, 2015, the Company entered into an amendment to the Subscription Agreement (the “Subscription Amendment”) and DSHC entered into Amended and Restated Put Option Agreements with each of the Series E Purchasers (the “A&R Put Option Agreements”). For information on the Subscription Amendment and the A&R Put Option Agreements, refer to “Note 25 — Subsequent Events”.
Note 17 — Stockholders’ Equity
Shelf Registration Statement
On July 9, 2013, the Company filed a shelf registration statement with the Securities and Exchange Commission, which allows it from time to time, in one or more offerings, to offer and sell up to $200.0 million in aggregate initial offering price of debt securities, common stock, preferred stock, depositary shares, warrants, rights to purchase shares of common stock and/or any of the other registered securities or units of any of the other registered securities.
120
Table of Contents
Special Cash Distribution
On December 27, 2012, the Company paid a special one-time distribution of $0.19 per common share to its shareholders of record as of the close of business on December 20, 2012 (the “Special Distribution”). In connection with the Special Distribution and in accordance with and pursuant to the Company’s various equity plans, the Company equitably adjusted its outstanding stock options, restricted stock units and performance stock units, as follows: (i) the exercise price of each outstanding stock option and the number of shares subject to each option were adjusted to reflect the impact of the Special Distribution, while preserving the aggregate spread of the options (i.e., the difference between the aggregate fair market value of the shares underlying the option and the aggregate exercise price for such shares); (ii) holders of time-vesting restricted stock units (“RSUs”) received a distribution equivalent distribution of $0.19 per RSU on December 27, 2012, (iii) holders of performance-vesting restricted stock units (“PSUs”) became eligible to receive $0.19 per PSU, payable, in the case of any unvested PSUs, only upon the subsequent vesting of the PSUs, and (iv) for purposes of determining whether the performance vesting requirement of a $3.00 weighted average closing share price over a trailing thirty-day period has been met for outstanding PSUs, $0.19 per share is added to the closing price for each day occurring on or after December 18, 2012. The Company did not record any incremental stock-based compensation in connection with the adjustment of stock options, payment of distributions on the RSUs and accrual of distributions on the PSUs. Some of the PSUs vested in January 2013 and the Special Distributions related to such PSUs were paid. There is still $0.3 million which will be paid when the remaining PSUs vest. The Special Distribution payments were $0.5 million in 2013 and $43.3 million in 2012, for a total of $43.8 million.
Common Stock
On April 22, 2013, Rentech announced that the Board authorized the repurchase of up to $25.0 million, exclusive of commissions, of outstanding shares of its common stock through December 31, 2013. No shares were acquired through December 31, 2013 and the share purchase program has expired.
Preferred Stock / Tax Benefit Preservation Plan
On August 5, 2011, the Board approved a Tax Benefit Preservation Plan between the Company and Computershare Trust Company, N.A., as rights agent (as amended from time to time, the “Original Plan”).
The Company has accumulated substantial operating losses. By adopting the Original Plan, the Board is seeking to protect the Company’s ability to carry forward its net operating losses (collectively, “NOLs”). For federal and state income tax purposes, the Company may “carry forward” NOLs in certain circumstances to offset current and future taxable income, which will reduce future federal and state income tax liability, subject to certain requirements and restrictions. However, if the Company were to experience an “ownership change,” as defined in Section 382 of the Internal Revenue Code (the “Code”), its ability to utilize these NOLs to offset future taxable income could be significantly limited. Generally, an “ownership change” would occur if the percentage of the Company’s stock owned by one or more “five percent stockholders” increases by more than fifty percentage points over the lowest percentage of stock owned by such stockholders at any time during the prior three-year period.
The Original Plan is intended to act as a deterrent to any person acquiring 4.99% or more of the outstanding shares of the Company’s common stock or any existing 4.99% or greater holder from acquiring more than an additional 1% of then outstanding common stock, in each case, without the approval of the Board and to thus mitigate the threat that stock ownership changes present to the Company’s NOL. The Original Plan includes procedures whereby the Board will consider requests to exempt certain acquisitions of common stock from the applicable ownership trigger if the Board determines that the acquisition will not limit or impair the availability of the NOLs to the Company.
In connection with its adoption of the Original Plan, the Board declared a dividend of one preferred stock purchase right (individually, a “Right” and collectively, the “Rights”) for each share of common stock of the Company outstanding at the close of business on August 19, 2011 (the “Record Date”). Each Right entitles the registered holder, after the Rights become exercisable and until expiration, to purchase from the Company one ten-thousandth of a share of the Company’s Series D Junior Participating Preferred Stock, par value $10.00 per share (the “Preferred Stock”), at a price of $3.75 per one ten-thousandth of a share of Preferred Stock, subject to certain anti-dilution adjustments (the “Purchase Price”).
One Right was distributed to stockholders of the Company for each share of common stock owned of record by them at the close of business on August 19, 2011. As long as the Rights are attached to the common stock, the Company will issue one Right with each new share of common stock so that all such shares will have attached Rights. The Company has reserved 45,000 shares of Preferred Stock for issuance upon exercise of the Rights.
On August 1, 2014, the Company entered into an amendment to the Original Plan (the “Plan Amendment”, and together with the Original Plan, the “Plan”), primarily to extend the final expiration date of the rights contained therein from August 5, 2014 to August 4, 2017, subject to shareholder approval. As a result, the Rights will expire, unless earlier redeemed or exchanged by the Company or terminated, on the earliest to occur of: (i) August 5, 2017, subject to the Company’s right to extend such date, (ii) the first
121
Table of Contents
business day following the 2015 annual shareholder meeting, if shareholder approval of the Plan has not been obtained by that date, or (ii) the time at which the Board determines that the NOLs are fully utilized or no longer available under Section 382 of the Code, or that an ownership change under Section 382 of the Code would not adversely impact in any material respect the time period in which the Company could use the NOLs, or materially impair the amount of the NOLs that could be used by the Company in any particular time period, for applicable tax purposes. The Rights do not have any voting rights.
Long-Term Incentive Equity Awards
Performance Awards 2012 – 2014
Two types of performance awards were granted in December 2014, 2013 and 2012.
The performance awards granted during the year ended December 31, 2014 vest over a four year period based on the Company’s level of total shareholder return over such period plus the recipient’s continued service with the Company.
The performance awards granted during the year ended December 31, 2013 and 2012 vest equally over a three-year period from grant date based on the Company’s level of total shareholder return over such period plus the recipient’s continued service with the Company.
Time Vested Awards 2012 – 2014
All of the time-based awards, which were issued during the years ended December 31, 2014, 2013 and 2012, vest over a three year period subject to the recipient’s continued service with the Company.
During the years ended December 31, 2014, 2013 and 2012, the Company issued the following performance shares and restricted stock units:
| Number of Awards For the Years Ended December 31, |
||||||||||||
| 2014 | 2013 | 2012 | ||||||||||
| Type of Award |
||||||||||||
| Performance awards |
5,564,000 | 3,005,000 | 1,963,000 | |||||||||
| Time-vested awards |
521,000 | 1,994,000 | 1,136,000 | |||||||||
|
|
|
|
|
|
|
|||||||
| Total |
6,085,000 | 4,999,000 | 3,099,000 | |||||||||
|
|
|
|
|
|
|
|||||||
Note 18 — Accounting for Equity Based Compensation
The accounting guidance requires all share-based payments, including grants of stock options, to be recognized in the statement of operations, based on their fair values. Stock based compensation expense for all fiscal periods is based on estimated grant-date fair value. Stock options generally vest over three years. As a result, compensation expense recorded during the period includes amortization related to grants during the period as well as prior grants. Most grants have graded vesting provisions where an equal number of shares vest on each anniversary of the grant date. The Company allocates the total compensation cost on a straight-line attribution method over the requisite service period. Most grants vest upon the fulfillment of service conditions and have no performance or market-based vesting conditions. Certain grants of warrants and restricted stock units include share price driven vesting provisions. Stock based compensation expense that the Company records is included in selling, general and administrative expense. There was no tax benefit in periods reported herein from recording this non-cash expense as such benefits will be recorded upon utilization of the Company’s net operating losses.
122
Table of Contents
During the years ended December 31, 2014, 2013 and 2012, charges associated with all equity-based grants were recorded as follows:
| For the Years Ended December 31, |
||||||||||||
| 2014 | 2013 | 2012 | ||||||||||
| (in thousands) | ||||||||||||
| Compensation expense |
$ | 4,658 | $ | 5,319 | $ | 7,357 | ||||||
| Board compensation expense |
872 | 603 | 591 | |||||||||
|
|
|
|
|
|
|
|||||||
| Total compensation expense |
5,530 | 5,922 | 7,948 | |||||||||
| Consulting expense |
— | 18 | 74 | |||||||||
|
|
|
|
|
|
|
|||||||
| Total expense |
$ | 5,530 | $ | 5,940 | $ | 8,022 | ||||||
|
|
|
|
|
|
|
|||||||
| Reduction to both basic and diluted earnings per share from compensation expense |
$ | 0.02 | $ | 0.03 | $ | 0.04 | ||||||
The Company uses the Black-Scholes option pricing model to determine the weighted average fair value of options and warrants. The assumptions utilized to determine the fair value of options and warrants are indicated in the following table:
| For the Year Ended December 31, |
||||
| 2014 | ||||
| Risk-free interest rate |
1.28% - 1.65 | % | ||
| Expected volatility |
54.5% - 57.3 | % | ||
| Expected life (in years) |
3.58 - 4.41 | |||
| Dividend yield |
0 | % | ||
| Forfeiture rate |
0 - 22 | % | ||
The risk-free interest rate is based on a treasury instrument whose term is consistent with the expected life of the Company’s stock options. The Company used the last day of the month stock price over the last 54 months to calculate and project expected stock price volatility Expected volatility was assumed to equal historical volatility. The estimated expected term of the grant is based on the Company’s historical exercise experience. The Company included a forfeiture component in the pricing model on certain grants to employees, based on historical forfeiture rate for the grantees’ level employees.
The number of shares reserved and outstanding as of December 31, 2012 have been adjusted to reflect the increase of 312,000 shares that resulted from adjustments resulting from the Special Distribution. The number of shares reserved, outstanding and available for issuance are as follows:
| Shares Reserved as of December 31, |
Shares Underlying Outstanding Awards as of December 31, |
Shares Available for Issuance as of December 31, |
||||||||||||||||||
| 2014 | 2014 | 2013 | 2014 | 2013 | ||||||||||||||||
| (in thousands) | ||||||||||||||||||||
| Name of Plan |
||||||||||||||||||||
| 2005 Stock Option Plan |
1,000 | 210 | 195 | — | — | |||||||||||||||
| 2006 Incentive Award Plan: |
||||||||||||||||||||
| Stock options |
8,000 | 1,368 | 1,338 | — | — | |||||||||||||||
| Restricted stock units and performance share awards |
— | 1,322 | — | — | ||||||||||||||||
| 2009 Incentive Award Plan: |
||||||||||||||||||||
| Stock options |
39,217 | 1,438 | 1,713 | 12,285 | 4,483 | |||||||||||||||
| Restricted stock units and performance share awards |
8,286 | 9,991 | — | — | ||||||||||||||||
| Adjustment for Special Distribution |
312 | — | 244 | — | — | |||||||||||||||
|
|
|
|
|
|
|
|
|
|
|
|||||||||||
| 48,529 | 11,302 | 14,803 | 12,285 | 4,483 | ||||||||||||||||
| Restricted stock units not from a plan |
3,119 | 3,119 | 17 | — | — | |||||||||||||||
|
|
|
|
|
|
|
|
|
|
|
|||||||||||
| 51,648 | 14,421 | 14,820 | 12,285 | 4,483 | ||||||||||||||||
|
|
|
|
|
|
|
|
|
|
|
|||||||||||
123
Table of Contents
Stock Options
The Company has multiple stock option plans under which options have been granted to employees, including officers and directors of the Company, to purchase shares of the Company at a price not less than the fair market value of the Company’s common stock at the date the options were granted. Each of these plans allows the issuance of incentive stock options, within the meaning of the Code, and other options pursuant to the plan that constitute non-statutory options. Options under the Company’s 2005 Stock Option Plan generally expire five years from the date of grant or at an alternative date as determined by the committee of the Board that administers the plan. Options under the Company’s 2006 Incentive Award Plan and the 2009 Incentive Award Plan generally expire between three and ten years from the date of grant or at an alternative date as determined by the committee of the Board that administers the plan. Options under the Company’s 2005 Stock Option Plan, 2006 Incentive Award Plan and the 2009 Incentive Award Plan are generally exercisable on the grant date or a vesting schedule between one and three years from the grant date as determined by the committee of the Board that administers the plans.
During the years ended December 31, 2014, 2013 and 2012, charges associated with stock option grants were recorded as follows:
| For the Years Ended December 31, |
||||||||||||
| 2014 | 2013 | 2012 | ||||||||||
| (in thousands) | ||||||||||||
| Compensation expense |
$ | 39 | $ | 516 | $ | 658 | ||||||
| Board compensation expense |
17 | — | — | |||||||||
|
|
|
|
|
|
|
|||||||
| Total compensation expense |
56 | 516 | 658 | |||||||||
| Consulting expense |
— | 18 | 22 | |||||||||
|
|
|
|
|
|
|
|||||||
| Total expense |
$ | 56 | $ | 534 | $ | 680 | ||||||
|
|
|
|
|
|
|
|||||||
Option transactions during the years ended December 31, 2014, 2013 and 2012 are summarized as follows:
| Number of Shares |
Weighted Average Exercise Price |
Aggregate Intrinsic Value |
||||||||||
| Outstanding at December 31, 2011 |
4,672,000 | $ | 1.64 | |||||||||
| Granted |
— | — | ||||||||||
| Exercised |
(276,000 | ) | 1.10 | |||||||||
| Canceled / Expired |
(236,000 | ) | 1.89 | |||||||||
| Adjustment for Special Distribution |
312,000 | |||||||||||
|
|
|
|||||||||||
| Outstanding at December 31, 2012 |
4,472,000 | 1.67 | $ | 5,848,000 | ||||||||
| Granted |
— | — | ||||||||||
| Exercised |
(711,000 | ) | 1.03 | |||||||||
| Canceled / Expired |
(271,000 | ) | 2.40 | |||||||||
|
|
|
|||||||||||
| Outstanding at December 31, 2013 |
3,490,000 | $ | 1.59 | $ | 2,144,448 | |||||||
| Granted |
1,122,000 | 1.25 | ||||||||||
| Exercised |
(393,000 | ) | 1.17 | |||||||||
| Canceled / Expired |
(100,000 | ) | 0.89 | |||||||||
|
|
|
|||||||||||
| Outstanding at December 31, 2014 |
4,119,000 | $ | 1.55 | $ | 784,931 | |||||||
|
|
|
|||||||||||
| Options exercisable at December 31, 2014 |
3,017,000 | $ | 1.67 | $ | 762,882 | |||||||
| Options exercisable at December 31, 2013 |
3,436,000 | $ | 1.60 | |||||||||
| Options exercisable at December 31, 2012 |
3,485,000 | $ | 1.73 | |||||||||
| Weighted average fair value of options granted during the year ended December 31, 2014 |
$ | 0.53 | ||||||||||
124
Table of Contents
The aggregate intrinsic value was calculated based on the difference between the Company’s stock price on December 31, 2014 and the exercise price of the outstanding shares, multiplied by the number of shares underlying outstanding awards as of December 31, 2014. The total intrinsic values of options exercised during the years ended December 31, 2014, 2013 and 2012 were $0.35 million, $0.9 million and $0.3 million, respectively.
As of December 31, 2014, there was $0.3 million of total unrecognized compensation cost related to nonvested share-based compensation arrangements from previously granted stock options. This cost is expected to be recognized over a weighted-average period of 3.94 years.
The following information summarizes stock options outstanding and exercisable at December 31, 2014:
| Outstanding | Exercisable | |||||||||||||||||||
| Range of Exercise Prices |
Number Outstanding |
Weighted Average Remaining Contractual Life in Years |
Weighted Average Exercise Price |
Number Exercisable |
Weighted Average Exercise Price |
|||||||||||||||
| $0.50-$0.92 |
1,955,000 | 3.60 | $ | 0.88 | 1,955,000 | $ | 0.88 | |||||||||||||
| $0.96-$1.00 |
27,000 | 6.49 | 0.96 | 27,000 | 0.96 | |||||||||||||||
| $1.12-$1.81 |
1,360,000 | 4.66 | 1.25 | 258,000 | 1.31 | |||||||||||||||
| $2.07-$2.50 |
32,000 | 2.31 | 2.07 | 32,000 | 2.07 | |||||||||||||||
| $3.50 |
21,000 | 1.95 | 3.50 | 21,000 | 3.50 | |||||||||||||||
| $3.87-$4.00 |
724,000 | 1.14 | 3.88 | 724,000 | 3.88 | |||||||||||||||
|
|
|
|
|
|||||||||||||||||
| 4,119,000 | 3.52 | $ | 1.55 | 3,017,000 | $ | 1.67 | ||||||||||||||
|
|
|
|
|
|||||||||||||||||
Warrants
During fiscal 2005, the Company issued a warrant to Management Resource Center, Inc., an entity controlled by D. Hunt Ramsbottom, the Company’s former President and CEO. During the last quarter of fiscal 2005, Mr. Ramsbottom assigned the warrant to East Cliff Advisors, LLC, an entity controlled by Mr. Ramsbottom. The warrant is for the purchase of 3.5 million shares of the Company’s common stock at an exercise price of $1.82 per share. The warrant has vested or will vest in the following incremental amounts upon such time as the Company’s stock reaches the stated closing prices for 12 consecutive trading days: 10% at $2.10 (vested); 15% at $2.75 (vested); 20% at $3.50 (vested); 25% at $4.25 (vested); and 30% at $5.25 (not vested). The Company recognizes compensation expense as the warrants vest, as the total number of shares to be granted under the warrant was not known on the grant date. In fiscal 2005, the Company accounted for the warrant under guidance for accounting for stock issued to employees due to the employer-employee relationship between the Company and Mr. Ramsbottom. Under the guidance applicable at the time, compensation cost would be recognized for stock based compensation granted to employees only when the exercise price of the Company’s stock options granted is less than the market price of the underlying common stock on the date of grant.
The original warrants covered 2,082,500 shares that had vested and 1,050,000 shares that had not vested. East Cliff Advisors assigned 262,500 unvested warrants to a third party and continued to hold 787,500 unvested warrants. In January 2009, the vesting terms and expiration for the warrants held by East Cliff Advisors, LLC were amended. As amended, with respect to the unvested warrants representing 787,500 shares, half of these warrants vested on December 31, 2011. The exercise price of the warrants remained at $1.82 per share. The expiration date for this half of the warrants was extended from August 4, 2010 to December 31, 2012. The warrants were excised during the year ended December 31, 2012. The other 393,750 unvested warrants and the original vested 2,082,500 warrants expired on December 31, 2011.
During the years ended December 31, 2014, 2013 and 2012, there was no compensation expense associated with grants of warrants.
125
Table of Contents
Warrant transactions during the years ended December 31, 2014, 2013 and 2012 are summarized as follows:
| Number of Shares |
Weighted Average Exercise Price |
|||||||
| Outstanding at December 31, 2011 |
10,424,000 | $ | 1.96 | |||||
| Granted |
— | — | ||||||
| Vested |
— | — | ||||||
| Exercised |
(5,156,000 | ) | 1.27 | |||||
| Canceled / Expired |
(4,018,000 | ) | 3.28 | |||||
|
|
|
|||||||
| Outstanding at December 31, 2012 |
1,250,000 | $ | 0.57 | |||||
| Granted |
— | — | ||||||
| Vested |
— | — | ||||||
| Exercised |
— | — | ||||||
| Canceled / Expired |
— | — | ||||||
|
|
|
|||||||
| Outstanding at December 31, 2013 |
1,250,000 | $ | 0.57 | |||||
| Granted |
— | — | ||||||
| Vested |
— | — | ||||||
| Exercised |
— | — | ||||||
| Canceled / Expired |
— | — | ||||||
|
|
|
|||||||
| Outstanding at December 31, 2014 |
1,250,000 | $ | 0.57 | |||||
|
|
|
|||||||
| Warrants exercisable at December 31, 2014, 2013 and 2012 |
1,250,000 | $ | 0.57 | |||||
As of December 31, 2014, there was no unrecognized compensation cost related to share-based compensation arrangements from previously granted warrants.
The following information summarizes warrants outstanding and exercisable at December 31, 2014:
| Outstanding | Exercisable | |||||||||||||||||||
| Range of Exercise Prices |
Number Outstanding |
Weighted Average Remaining Contractual Life in Years |
Weighted Average Exercise Price |
Number Exercisable |
Weighted Average Exercise Price |
|||||||||||||||
| $0.57 |
1,250,000 | N/A | $ | 0.57 | 1,250,000 | $ | 0.57 | |||||||||||||
Restricted Stock Units and Performance Share Awards
The Company issues Restricted Stock Units (“RSUs”) which are equity-based instruments that may be settled in shares of common stock of the Company. In the years ended December 31, 2014, 2013 and 2012, the Company issued RSUs and Performance Share Awards to certain employees and directors as long-term incentives.
Most RSU agreements vest with the passage of time and include a three-year vesting period such that one-third will vest on each annual anniversary date of the commencement date of the agreement. Other RSU agreements contain vesting provisions based on performance against certain specific goals. The vesting of all RSUs is contingent on continued employment of the grantee. The vesting of various RSUs are subject to partial or complete acceleration under certain circumstances, including termination without cause, end of employment for good reason or upon a change in control (in each case as defined in the agreement). In certain agreements, if the Company fails to offer to renew an employment agreement on competitive terms or if a termination occurs which would entitle the grantee to severance during the period of three months prior and two years after a change in control, the vesting of the restricted stock unit grant will accelerate.
The compensation expense incurred by the Company for RSUs is based on the closing market price of the Company’s common stock on the date of grant and is amortized ratably on a straight-line basis over the requisite service period and charged to selling, general and administrative expense with a corresponding increase to additional paid-in capital. The compensation expense incurred by the Company for Performance Share Awards is based on the Monte Carlo valuation model. For the 2014 Performance Share Awards, the key assumptions used in the Monte Carlo valuation model were an expected volatility of 54.58%, a risk-free rate of interest of 1.38% and a dividend yield of 0.00%. For the 2013 Performance Share Awards, the key assumptions used in the Monte Carlo valuation model were an expected volatility of 57.51%, a risk-free rate of interest of 0.64% and a dividend yield of 0.00%.
126
Table of Contents
During the years ended December 31, 2014, 2013 and 2012, charges associated with RSUs and Performance Share Award grants were recorded as follows:
| For the Years Ended December 31, |
||||||||||||
| 2014 | 2013 | 2012 | ||||||||||
| Compensation expense |
$ | 4,619 | $ | 4,803 | $ | 6,699 | ||||||
| Board compensation expense |
504 | 202 | 190 | |||||||||
|
|
|
|
|
|
|
|||||||
| Total compensation expense |
$ | 5,123 | $ | 5,005 | $ | 6,889 | ||||||
|
|
|
|
|
|
|
|||||||
RSU and Performance Share Award transactions during the year ended December 31, 2014, 2013 and 2012 are summarized as follows:
| Number of Shares |
Weighted Average Grant Date Fair Value |
Aggregate Intrinsic Value |
||||||||||
| Outstanding at December 31, 2011 |
11,888,000 | 1.37 | ||||||||||
| Granted |
3,099,000 | 2.55 | ||||||||||
| Vested and Settled in Shares |
(2,080,000 | ) | 1.35 | |||||||||
| Vested and Surrendered for Withholding Taxes Payable |
(975,000 | ) | 1.40 | |||||||||
| Canceled / Expired |
(931,000 | ) | 1.37 | |||||||||
|
|
|
|||||||||||
| Outstanding at December 31, 2012 |
11,001,000 | 1.71 | $ | 28,934,000 | ||||||||
| Granted |
4,999,000 | 1.66 | ||||||||||
| Vested and Settled in Shares |
(2,680,000 | ) | 1.49 | |||||||||
| Vested and Surrendered for Withholding Taxes Payable |
(1,812,000 | ) | 1.37 | |||||||||
| Canceled / Expired |
(178,000 | ) | 2.18 | |||||||||
|
|
|
|||||||||||
| Outstanding at December 31, 2013 |
11,330,000 | 1.76 | $ | 23,793,000 | ||||||||
| Granted |
6,085,000 | 1.88 | ||||||||||
| Vested and Settled in Shares |
(1,500,000 | ) | 1.87 | |||||||||
| Vested and Surrendered for Withholding Taxes Payable |
(688,000 | ) | 1.82 | |||||||||
| Canceled / Expired |
(5,025,000 | ) | 1.16 | |||||||||
|
|
|
|||||||||||
| Outstanding at December 31, 2014 |
10,202,000 | 1.28 | $ | 12,845,706 | ||||||||
|
|
|
|||||||||||
Of the 10,202,000 RSUs and Performance Share Awards outstanding at December 31, 2014, 8,185,000 were granted pursuant to the 2009 Incentive Award Plan. The other 2,017,000 RSUs were not granted pursuant to a stock option plan but were “inducement grants.” Of the 11,330,000 RSUs and Performance Share Awards outstanding at December 31, 2013, 1,322,000 and 9,991,000 were granted pursuant to the Company’s 2006 Incentive Award Plan and 2009 Incentive Award Plan, respectively. The other 17,000 RSUs were not granted pursuant to a stock option plan but were “inducement grants.” Of the 11,001,000 RSUs and Performance Share Awards outstanding at December 31, 2012, 1,745,000 and 9,223,000 were granted pursuant to the Company’s 2006 Incentive Award Plan and 2009 Incentive Award Plan, respectively.
As of December 31, 2014, there was $4.9 million of total unrecognized compensation cost related to non-vested share-based compensation arrangements from previously granted RSUs and Performance Share Awards. That cost is expected to be recognized over a weighted-average period of 2.5 years.
The grant date fair value of RSUs and Performance Share Awards that vested during the year ended December 31, 2014, 2013 and 2012 was $4.0 million, $3.9 million and $4.2 million, respectively.
Stock Grants
During the year ended December 31, 2014, the Company granted a total of 140,000 shares of stock to its directors, of which 40,000 shares vested at grant date and were issued, and 100,000 shares were vested at grant date but not issued as of December 31, 2014. This resulted in stock-based compensation expense of $351,000 for the shares granted to the directors. During the year ended December 31, 2013, the Company issued a total of 178,400 shares of stock to its directors, which were fully vested at date of grant. This resulted in stock-based compensation expense of $401,400 for the shares granted to the directors. During the year ended December 31, 2012, the Company issued a total of 259,400 shares of stock which were fully vested at date of grant. Of this amount, 234,400 shares, which were evenly distributed, were granted to the directors and 25,000 shares were granted to a consultant. This resulted in stock-based compensation expense of $401,000 and $52,000 for the shares granted to the directors and consultant, respectively.
127
Table of Contents
2011 LTIP
Some grants under the Rentech Nitrogen Partners, L.P. 2011 Long-Term Incentive Plan (the “2011 LTIP”) are marked-to market at each reporting date. During the years ended December 31, 2014, 2013 and 2012, charges associated with all equity-based grants issued by RNP under the 2011 LTIP were recorded as follows:
| For the Years Ended December 31, |
||||||||||||
| 2014 | 2013 | 2012 | ||||||||||
| (in thousands) | ||||||||||||
| Stock based compensation expense |
$ | 1,283 | $ | 1,460 | $ | 2,827 | ||||||
|
|
|
|
|
|
|
|||||||
Phantom unit transactions during the years ended December 31, 2014, 2013 and 2012 are summarized as follows:
| Number of Shares |
Weighted Average Grant Date Fair Value |
Aggregate Intrinsic Value |
||||||||||
| Outstanding at December 31, 2011 |
163,388 | 18.40 | ||||||||||
| Granted |
54,059 | 34.86 | ||||||||||
| Vested and Settled in Shares |
(42,350 | ) | (15.68 | ) | ||||||||
| Vested and Surrendered for Withholding Taxes Payable |
(20,040 | ) | (18.40 | ) | ||||||||
| Canceled / Expired |
(119 | ) | (18.40 | ) | ||||||||
|
|
|
|||||||||||
| Outstanding at December 31, 2012 |
154,938 | $ | 23.78 | $ | 5,839,626 | |||||||
| Granted |
116,508 | 18.71 | ||||||||||
| Vested and Settled in Shares |
(49,409 | ) | (23.42 | ) | ||||||||
| Vested and Surrendered for Withholding Taxes Payable |
(27,127 | ) | (21.75 | ) | ||||||||
| Canceled / Expired |
(1,278 | ) | (35.14 | ) | ||||||||
|
|
|
|||||||||||
| Outstanding at December 31, 2013 |
193,632 | $ | 20.97 | $ | 3,407,929 | |||||||
| Granted |
160,088 | 10.93 | ||||||||||
| Vested and Settled in Shares |
(83,471 | ) | (20.68 | ) | ||||||||
| Vested and Surrendered for Withholding Taxes Payable |
(35,342 | ) | (20.91 | ) | ||||||||
| Canceled / Expired |
(15,049 | ) | (24.79 | ) | ||||||||
|
|
|
|||||||||||
| Outstanding at December 31, 2014 |
219,858 | $ | 11.33 | $ | 2,310,711 | |||||||
|
|
|
|||||||||||
During the year ended December 31, 2014, RNP issued 160,088 unit-settled phantom units (which entitle the holder to distribution rights during the vesting period) covering RNP’s common units. 142,228 of the phantom units are time-vested awards that vest in three equal annual installments. 5,970 of the phantom units were time-vested awards issued to the directors that vested on the one-year anniversary of the Offering. The phantom unit grants resulted in unit-based compensation expense of $1.1 million for the year ended December 31, 2014.
As of December 31, 2014, there was $2.3 million of total unrecognized compensation cost related to non-vested share-based compensation arrangements from previously granted phantom units. That cost is expected to be recognized over a weighted-average period of 2.5 years.
During the year ended December 31, 2014, RNP issued a total of 11,890 common units which were fully vested at date of grant. The common units were issued to the directors and resulted in unit-based compensation expense of $0.2 million.
Note 19 — Future Minimum Lease Receipts
The Company has certain wood chip processing and wood yard operations agreements, which contain embedded leases. The cost and carrying values of the properties underlying the leases are $86.2 million and $76.3 million, respectively.
128
Table of Contents
The following is a schedule by years of minimum future rentals on non-cancelable operating leases as of December 31, 2014 (in thousands):
| For the Years Ending December 31, |
||||
| 2015 |
$ | 28,887 | ||
| 2016 |
25,201 | |||
| 2017 |
21,392 | |||
| 2018 |
15,280 | |||
| 2019 |
11,425 | |||
|
|
|
|||
| $ | 102,185 | |||
|
|
|
|||
Note 20 — Employee Benefit Plans
Defined Contribution Plans
The Company has a 401(k) plan. Most employees, excluding RNLLC’s union employees, who are at least 18 years of age are eligible to participate in the plan on the first of the month following 60 days of employment and share in the employer matching contribution. The Company is currently matching 100% of the first 3% and 50% of the next 3% of the participant’s salary deferrals. The Company contributed $1.3 million to the plans for the year ended December 31, 2014, $1.2 million for the year ended December 31, 2013 and $1.0 million for the year ended December 31, 2012.
Pension and Postretirement Benefit Plans
Reporting and disclosures related to pension and other postretirement benefit plans require that companies include an additional asset or liability on the balance sheet to reflect the funded status of retirement and other postretirement benefit plans, and a corresponding after-tax adjustment to accumulated other comprehensive income.
RNP has two noncontributory pension plans (the “Pension Plans”), which cover either hourly paid employees represented by collective bargaining agreements in effect at its Pasadena Facility or hourly employees at its Pasadena Facility who have 1,000 hours of service during a year of employment.
RNP has a postretirement benefit plan (the “Postretirement Plan”) for certain employees at its Pasadena Facility. The plan provides a fixed dollar amount to supplement payment of eligible medical expenses. The amount of the supplement under the plan is based on years of service and the type of coverage elected (single or family members and spouses). Participants are eligible for supplements at retirement after age 55 with at least 20 years of service to be paid until the attainment of age 65 or another disqualifying event, if earlier.
The following tables summarize the projected benefit obligation, the assets and the funded status of the Pension Plans and the Postretirement Plan at December 31, 2014 and 2013:
| As of December 31, 2014 | As of December 31, 2013 | |||||||||||||||
| Pension | Postretirement | Pension | Postretirement | |||||||||||||
| (in thousands) | ||||||||||||||||
| Projected benefit obligation |
||||||||||||||||
| Benefit obligation at beginning of year |
$ | 4,505 | $ | 853 | $ | 4,841 | $ | 1,136 | ||||||||
| Service cost |
106 | 35 | 137 | 43 | ||||||||||||
| Interest cost |
213 | 37 | 194 | 43 | ||||||||||||
| Actuarial (gain) loss |
1,125 | 93 | (528 | ) | (233 | ) | ||||||||||
| Actual benefit paid |
(153 | ) | (91 | ) | (139 | ) | (136 | ) | ||||||||
|
|
|
|
|
|
|
|
|
|||||||||
| Benefit obligation at end of year |
5,796 | 927 | 4,505 | 853 | ||||||||||||
|
|
|
|
|
|
|
|
|
|||||||||
| Fair value of plan assets |
||||||||||||||||
| Fair value of plan assets at beginning of year |
4,927 | — | 4,333 | — | ||||||||||||
| Actual return on plan assets |
251 | — | 624 | — | ||||||||||||
| Employer contributions |
— | 91 | 109 | 136 | ||||||||||||
| Actual benefit paid |
(153 | ) | (91 | ) | (139 | ) | (136 | ) | ||||||||
|
|
|
|
|
|
|
|
|
|||||||||
| Fair value of plan assets at end of year |
5,025 | — | 4,927 | — | ||||||||||||
|
|
|
|
|
|
|
|
|
|||||||||
| Funded status at end of year |
(771 | ) | (927 | ) | 422 | (853 | ) | |||||||||
|
|
|
|
|
|
|
|
|
|||||||||
| Amounts recognized in the consolidated balance sheet |
||||||||||||||||
| Noncurrent assets |
$ | $ | — | $ | 422 | $ | — | |||||||||
| Current liabilities |
— | (81 | ) | — | (86 | ) | ||||||||||
| Noncurrent liabilities |
(771 | ) | (846 | ) | — | (767 | ) | |||||||||
|
|
|
|
|
|
|
|
|
|||||||||
| $ | (771 | ) | (927 | ) | $ | 422 | (853 | ) | ||||||||
|
|
|
|
|
|
|
|
|
|||||||||
129
Table of Contents
As of December 31, 2014 and 2013, the accumulated benefit obligation equaled the projected benefit obligation.
The components of net periodic benefit cost and other changes in plan assets and benefit obligations recognized in other comprehensive income are as follows for the years ended December 31, 2014, 2013 and 2012:
| For the Year Ended December 31, 2014 |
For the Year Ended December 31, 2013 |
For the Year Ended December 31, 2012 |
||||||||||||||||||||||
| Pension | Postretirement | Pension | Postretirement | Pension | Postretirement | |||||||||||||||||||
| (in thousands) | ||||||||||||||||||||||||
| Net periodic benefit cost |
||||||||||||||||||||||||
| Service cost |
$ | 107 | $ | 35 | $ | 137 | $ | 43 | $ | 29 | $ | 4 | ||||||||||||
| Interest cost |
213 | 37 | 194 | 43 | 31 | 5 | ||||||||||||||||||
| Expected return on plan assets |
(290 | ) | — | (260 | ) | — | (42 | ) | — | |||||||||||||||
| Amortization of prior service cost |
— | 22 | — | 22 | — | — | ||||||||||||||||||
| Amortization of net gain |
(54 | ) | — | (5 | ) | — | — | — | ||||||||||||||||
| Recognized gain |
— | (16 | ) | — | — | — | — | |||||||||||||||||
|
|
|
|
|
|
|
|
|
|
|
|
|
|||||||||||||
| Net periodic pension costs |
$ | (24 | ) | $ | 78 | $ | 66 | $ | 108 | $ | 18 | $ | 9 | |||||||||||
|
|
|
|
|
|
|
|
|
|
|
|
|
|||||||||||||
| Other changes in plan assets and benefit obligations recognized in other comprehensive income |
||||||||||||||||||||||||
| Net actuarial (gain) loss |
$ | 1,163 | $ | 93 | $ | (893 | ) | $ | (233 | ) | $ | (444 | ) | $ | (54 | ) | ||||||||
| Recognized actuarial gain |
54 | 16 | 5 | — | — | — | ||||||||||||||||||
| Prior service cost |
— | — | — | — | — | 332 | ||||||||||||||||||
| Recognized prior service cost |
— | (22 | ) | — | (22 | ) | — | — | ||||||||||||||||
|
|
|
|
|
|
|
|
|
|
|
|
|
|||||||||||||
| Total recognized in other comprehensive (income) loss |
$ | 1,217 | $ | 87 | $ | (888 | ) | $ | (255 | ) | $ | (444 | ) | $ | 278 | |||||||||
|
|
|
|
|
|
|
|
|
|
|
|
|
|||||||||||||
Accumulated other comprehensive income (loss) at December 31, 2014, 2013 and 2012 consists of the following amounts that have not yet been recognized in net periodic benefit cost:
| As of December 31, 2014 | As of December 31, 2013 | As of December 31, 2012 | ||||||||||||||||||||||
| Pension | Postretirement | Pension | Postretirement | Pension | Postretirement | |||||||||||||||||||
| (in thousands) | ||||||||||||||||||||||||
| Net gain |
$ | (114 | ) | $ | (178 | ) | $ | (1,332 | ) | $ | (287 | ) | $ | (444 | ) | $ | (54 | ) | ||||||
| Prior service cost |
— | 287 | — | 310 | — | 332 | ||||||||||||||||||
|
|
|
|
|
|
|
|
|
|
|
|
|
|||||||||||||
| $ | (114 | ) | $ | 109 | $ | (1,332 | ) | $ | 23 | $ | (444 | ) | $ | 278 | ||||||||||
|
|
|
|
|
|
|
|
|
|
|
|
|
|||||||||||||
The expected portion of the accumulated other comprehensive loss expected to be recognized as a component of net periodic benefit cost in 2015 is $0 for the Pension Plans and $16,000 for the Postretirement Plan.
130
Table of Contents
Weighted average assumptions used to determine benefit obligations:
| As of December 31, 2014 | As of December 31, 2013 | As of December 31, 2012 | ||||||||||||||||||||||
| Pension | Postretirement | Pension | Postretirement | Pension | Postretirement | |||||||||||||||||||
| Discount rate |
4.0 | % | 3.9 | % | 4.8 | % | 4.7 | % | 4.1 | % | 4.0 | % | ||||||||||||
Weighted average assumptions used to determine net pension cost:
| For the Year Ended December 31, 2014 |
For the Year Ended December 31, 2013 |
For the Year Ended December 31, 2012 |
||||||||||||||||||||||
| Pension | Postretirement | Pension | Postretirement | Pension | Postretirement | |||||||||||||||||||
| Discount rate |
4.8 | % | 4.7 | % | 4.1 | % | 4.0 | % | 3.6 | % | 3.6 | % | ||||||||||||
| Expected rate of return on assets |
6.0 | % | N/A | 6.0 | % | N/A | 6.0 | % | N/A | |||||||||||||||
Determination of the Expected Long-Term Rate of Return on Assets
The overall expected long-term rate of return on assets assumption is based on the long-term target asset allocation for plan assets and capital markets return forecasts for asset classes employed. A portion of the asset returns are subject to taxation, so the expected long-term rate of return for these assets is determined on an after-tax basis. The GAAP gain/loss methodology provides that differences between expected and actual returns are recognized over the average future service of employees.
| Postretirement As of December 31, |
||||||||||||
| 2014 | 2013 | 2012 | ||||||||||
| Health care cost trend: initial |
9.00 | % | 7.25 | % | 7.50 | % | ||||||
| Health care cost trend: ultimate |
5.00 | % | 5.00 | % | 5.00 | % | ||||||
| Year ultimate reached |
2025 | 2023 | 2023 | |||||||||
As the Postretirement Plan provides a fixed dollar amount to participants, increasing or decreasing the health care cost trend rate by 1% would not have a material impact on the December 31, 2014 and 2013 obligations.
| As of December 31, 2014 | As of December 31, 2013 | |||||||||||||||
| Target Allocation |
Percentage of Pension Plan Assets 2014 |
Target Allocation |
Percentage of Pension Plan Assets 2013 |
|||||||||||||
| Asset Category |
||||||||||||||||
| Equity securities |
50 | % | 52 | % | 50 | % | 52 | % | ||||||||
| Debt securities |
50 | % | 48 | % | 50 | % | 48 | % | ||||||||
The goals of the Pension Plans’ asset investment strategy are to:
| 1) | Provide benefits to the participants and their beneficiaries and defray the reasonable expenses of administering the Pension Plans. |
| 2) | Contribute the amounts necessary to maintain the Pension Plans on a sound actuarial basis and to satisfy the minimum funding standards established by law. |
| 3) | Invest without distinction between principal and income and in such securities or property, real or personal, wherever situated, including, but not limited to, stocks, common or preferred, bonds and other evidence of indebtedness or ownership, and real estate or any interest therein, taking into consideration the short and long-term financial needs of the Pension Plans. |
The Pension Plans seek to maintain compliance with the Employee Retirement Income Security Act of 1974, as amended, and any applicable regulations and laws.
131
Table of Contents
The pension plan assets are deemed to be Level 2 financial instruments at December 31, 2014 and Level 1 at December 31, 2013. The fair value of the pension plan assets consist of the following at December 31, 2014 and 2013:
| As of December 31, | ||||||||
| 2014 | 2013 | |||||||
| (in thousands) | ||||||||
| Mutual funds — equity |
$ | 2,671 | $ | 2,560 | ||||
| Mutual funds — fixed income |
2,151 | 2,356 | ||||||
| Other |
203 | 11 | ||||||
|
|
|
|
|
|||||
| Fair value of plan assets |
$ | 5,025 | $ | 4,927 | ||||
|
|
|
|
|
|||||
RNP expects to contribute $0 to the Pension Plans and $83,000 to the Postretirement Plan in 2015.
Expected Future Benefit Payments:
| Pension | Postretirement | |||||||
| (in thousands) | ||||||||
| 2015 |
$ | 209 | $ | 83 | ||||
| 2016 |
214 | 65 | ||||||
| 2017 |
226 | 74 | ||||||
| 2018 |
232 | 69 | ||||||
| 2019 |
238 | 53 | ||||||
| 2020-2024 |
1,297 | 240 | ||||||
Executive Severance Payments
In accordance with our former chief executive officer’s employment contract, upon his cessation of employment with the Company in December 2014, he became entitled to severance equal to three times his annual salary, payable over the two-year period after his departure from the Company. This amount was recorded during the year ended December 31, 2014.
Note 21 — Income Taxes
Accounting guidance requires deferred tax assets and liabilities to be recognized for temporary differences between the tax basis and financial reporting basis of assets and liabilities, computed at the expected tax rates for the periods in which the assets or liabilities will be realized, as well as for the expected tax benefit of net operating loss and tax credit carryforwards. A full valuation allowance was recorded against the deferred tax assets at December 31, 2014 and 2013 for the Company’s United States operations.
The realization of deferred income tax assets is dependent on the generation of taxable income in appropriate jurisdictions during the periods in which those temporary differences are deductible. Management considers the scheduled reversal of deferred income tax liabilities, projected future taxable income, and tax planning strategies in determining the amount of the valuation allowance. Based on the level of historical taxable income and projections for future taxable income over the periods in which the deferred income tax assets are deductible, management determines if it is more likely than not that the Company will not fully realize the benefits of these deductible differences in the United States. As of December 31, 2014, the most significant factors considered in determining the realizability of these deferred tax assets were the Company’s profitability over the past three years and the projected future taxable income of the new acquired companies. Management believes that at this point in time, it is more likely than not that the deferred tax assets will not be fully realized. The Company therefore has recorded a valuation allowance against its deferred tax assets at December 31, 2014.
As of December 31, 2014, Fulghum owned 88% of the equity interests in the subsidiaries located in Chile and 87% of the equity interests in the subsidiaries located in Uruguay. Upon acquisition, Fulghum’s management concluded the earnings of these foreign subsidiaries should be taxed at the full United States tax rate and are not permanently reinvested under accounting guidance. As such, the Company provided for a deferred tax liability on the book-tax basis difference through purchase price accounting.
On May 1, 2014, the Company acquired all of the equity interests of NEWP in an asset acquisition, pursuant to the NEWP Purchase Agreement. Upon the closing of the NEWP Acquisition, NEWP became a wholly owned subsidiary of the Company.
132
Table of Contents
The income tax provision (benefit) for continuing operations for the years ended December 31, 2014, 2013 and 2012 was as follows:
| For the Years Ended December 31, |
||||||||||||
| 2014 | 2013 | 2012 | ||||||||||
| (in thousands) | ||||||||||||
| Current: |
||||||||||||
| Federal |
$ | — | $ | 66 | $ | 711 | ||||||
| State |
1,359 | 644 | 3,664 | |||||||||
| Foreign |
459 | 114 | — | |||||||||
|
|
|
|
|
|
|
|||||||
| Total Current |
1,818 | 824 | 4,375 | |||||||||
|
|
|
|
|
|
|
|||||||
| Deferred: |
||||||||||||
| Federal |
$ | (323 | ) | $ | (22,038 | ) | $ | — | ||||
| State |
7 | (5,092 | ) | — | ||||||||
| Foreign |
— | — | — | |||||||||
|
|
|
|
|
|
|
|||||||
| Total Deferred |
(316 | ) | (27,130 | ) | — | |||||||
|
|
|
|
|
|
|
|||||||
| $ | 1,502 | $ | (26,306 | ) | $ | 4,375 | ||||||
|
|
|
|
|
|
|
|||||||
A reconciliation of the income taxes at the federal statutory rate to the effective tax rate for continuing operations is as follows:
| For the Years Ended December 31, |
||||||||||||
| 2014 | 2013 | 2012 | ||||||||||
| (in thousands) | ||||||||||||
| Federal income tax benefit calculated at the federal statutory rate |
$ | (12,065 | ) | $ | (6,667 | ) | $ | 24,431 | ||||
| Impact of foreign earnings |
678 | 669 | — | |||||||||
| State income tax benefit net of federal benefit |
(1,060 | ) | (770 | ) | (859 | ) | ||||||
| Permanent differences, other |
127 | 316 | 357 | |||||||||
| Return to provision |
91 | 467 | — | |||||||||
| Change in state tax rate |
1,144 | — | (1,006 | ) | ||||||||
| Minority interest, net of state tax benefit |
(115 | ) | 685 | (13,124 | ) | |||||||
| Partnership state taxes |
18 | (96 | ) | 303 | ||||||||
| Basis difference in foreign subsidiaries |
103 | 374 | — | |||||||||
| Partnership basis difference |
45 | (1,022 | ) | (3,439 | ) | |||||||
| Change in valuation allowance |
13,044 | (20,330 | ) | (2,288 | ) | |||||||
| Other items |
(508 | ) | 68 | — | ||||||||
|
|
|
|
|
|
|
|||||||
| Income tax expense from continuing operations |
$ | 1,502 | $ | (26,306 | ) | $ | 4,375 | |||||
|
|
|
|
|
|
|
|||||||
The components of the net deferred tax liability and net deferred tax asset as of December 31, 2014 and 2013 are as follows:
| As of December 31, | ||||||||
| 2014 | 2013 | |||||||
| (in thousands) | ||||||||
| Current: |
||||||||
| Accruals for financial statement purposes not allowed for income taxes |
$ | 4,297 | $ | 2,626 | ||||
| Basis difference in prepaid expenses |
(334 | ) | (344 | ) | ||||
| Inventory |
15 | — | ||||||
| Unrealized gain |
(107 | ) | (12 | ) | ||||
| Other items |
(30 | ) | — | |||||
| Valuation allowance |
(1,971 | ) | (1,130 | ) | ||||
|
|
|
|
|
|||||
| Current, net |
1,870 | 1,140 | ||||||
| Long-Term: |
||||||||
| Net operating loss and AMT credit carryforwards |
$ | 69,021 | $ | 55,066 | ||||
| R&D credit carryforward |
6,191 | 6,191 | ||||||
133
Table of Contents
| As of December 31, | ||||||||
| 2014 | 2013 | |||||||
| (in thousands) | ||||||||
| Basis difference relating to intangibles |
(10,644 | ) | (11,336 | ) | ||||
| Basis difference in property, plant and equipment |
(19,971 | ) | (11,421 | ) | ||||
| Stock option exercises |
3,854 | 3,344 | ||||||
| Basis difference in foreign subsidiaries |
(5,962 | ) | (6,142 | ) | ||||
| Basis difference in partnership interest |
(17,877 | ) | (19,051 | ) | ||||
| Other items |
2,610 | 1,652 | ||||||
| Valuation allowance |
(37,072 | ) | (27,574 | ) | ||||
|
|
|
|
|
|||||
| Long-Term, net |
$ | (9,850 | ) | $ | (9,271 | ) | ||
|
|
|
|
|
|||||
| Total deferred tax liabilities, net |
$ | (7,980 | ) | $ | (8,131 | ) | ||
|
|
|
|
|
|||||
The total gross deferred tax assets at December 31, 2014 and 2013 were $86.0 million and $68.9 million, respectively. The total gross deferred tax liabilities at December 31, 2014 and 2013 were $94.0 million and $77.0 million, respectively.
As of December 31, 2014, the Company had the following available carryforwards and tax attributes to offset future taxable income:
| Description |
Amount | Expiration | ||||||
| (in thousands) | ||||||||
| Net Operating Losses – Federal |
$ | 176,735 | 2021 – 2034 | |||||
| Net Operating Losses – States (Post-Apportionment and Pre-tax) |
||||||||
| Alabama |
$ | 676 | 2015 – 2030 | |||||
| California |
12,849 | 2016 – 2032 | ||||||
| Colorado |
5,866 | 2028 – 2035 | ||||||
| Georgia |
1,013 | 2022 – 2030 | ||||||
| Hawaii |
6,216 | 2025 – 2035 | ||||||
| Illinois |
107,595 | 2020 – 2027 | ||||||
| Mississippi |
721 | 2020 – 2035 | ||||||
|
|
|
|||||||
| $ | 134,936 | |||||||
|
|
|
|||||||
| R&D federal credit |
$ | 6,981 | 2027 – 2033 | |||||
| Alternative minimum tax credit |
$ | 1,471 | No Expiration | |||||
Tax Contingencies
Accounting guidance prescribes a recognition threshold and measurement attribute for the financial statement recognition and measurement of a tax position taken or expected to be taken in a tax return. The guidance requires that the Company recognize in its consolidated financial statements, only those tax positions that are “more-likely-than-not” of being sustained as of the adoption date, based on the technical merits of the position. The Company performed a comprehensive review of its material tax positions in accordance with accounting guidance.
A reconciliation of the beginning and ending amounts of unrecognized tax benefits is as follows:
| As of December 31, | ||||||||||||
| 2014 | 2013 | 2012 | ||||||||||
| (in thousands) | ||||||||||||
| Reconciliation of Unrecognized Tax Liability |
||||||||||||
| Balance at beginning of year |
$ | 4,268 | $ | 2,754 | $ | 2,754 | ||||||
| Additions based on tax positions taken during a prior period |
21 | 3,479 | — | |||||||||
| Additions based on tax positions related to the current period |
4 | — | — | |||||||||
| Reductions based on tax positions related to prior years |
(701 | ) | (1,965 | ) | — | |||||||
| Settlements with taxing authorities |
— | — | — | |||||||||
| Lapse of statutes of limitations |
— | — | — | |||||||||
|
|
|
|
|
|
|
|||||||
| Balance at end of year |
$ | 3,592 | $ | 4,268 | $ | 2,754 | ||||||
|
|
|
|
|
|
|
|||||||
134
Table of Contents
The additions based on tax positions taken during a prior period relate to the acquisition of Fulghum and to positions taken with respect to the Company’s foreign subsidiaries in Uruguay and Chile. The Company is indemnified for these positions by the seller in the Fulghum Acquisition. The reduction in the unrecognized tax liability relates to the Company’s state NOLs.
Of the $3.6 million of unrecognized tax benefits, $0.8 million, if recognized, would have an impact on the effective tax rate. The remaining $2.8 million would not have an impact on the effective tax rate as the Company is indemnified by the seller. The Company believes that it is possible that the unrecognized tax benefits will significantly decrease within the next 12 months, but that the reductions would not impact the Company’s effective tax rate. The amount that is expected to decrease relates to the exposures in connection with the foreign subsidiaries of Fulghum mentioned above. The Company expects that one of the uncertain positions related to Fulghum Uruguay will be settled with the Uruguay taxing authorities. The amount of tax related to this position is $0.9 million. The Company and its subsidiaries are subject to the following material taxing jurisdictions: United States federal, California, Colorado, Florida, Georgia, Illinois, Louisiana, Mississippi, New Hampshire and Texas. The tax years that remain open to examination by the United States federal jurisdiction (not including the current year) are years 2011 through 2013; the tax years that remain open to examination by the Arkansas, Florida, Georgia, Illinois, Louisiana, Maine, Massachusetts, Mississippi, New Hampshire, New York, North Carolina, South Carolina and Virginia jurisdictions are years 2011 through 2013; the tax years that remain open to examination (not including the current year) by the California, Colorado and Texas jurisdictions are years 2010 through 2013. As a result of the NEWP Acquisition, the Company is now subject to taxation in New Hampshire and New York in the United States.
In accordance with its accounting policy, the Company recognizes accrued interest and penalties related to unrecognized tax benefits as a component of tax expense. The Company has not accrued any interest and penalties related to uncertain tax positions in the balance sheet or statement of operations as a result of the Company’s net operating loss position.
While management believes the Company has adequately provided for all tax positions, amounts asserted by taxing authorities could materially differ from the Company’s accrued positions as a result of uncertain and complex application of tax regulations. Additionally, the recognition and measurement of certain tax benefits includes estimates and judgment by management and inherently includes subjectivity. Accordingly, additional provisions on federal and state tax-related matters could be recorded in the future as revised estimates are made or the underlying matters are settled or otherwise resolved.
Note 22 — Segment Information
The Company operates in five business segments, as described below. The Pasadena Facility’s operations are included in the Company’s historical operating results only from the closing date of the Agrifos Acquisition, which was November 1, 2012. Fulghum’s operations are included only from the closing date of the Fulghum Acquisition, which was May 1, 2013. NEWP’s operations are included only from the closing date of the NEWP Acquisition, which was May 1, 2014. Results of the energy technologies segment are accounted for as discontinued operations for all periods presented. The Company’s five business segments are:
| • | East Dubuque — The operations of the East Dubuque Facility, which produces primarily ammonia and UAN. |
| • | Pasadena — The operations of the Pasadena Facility, which produces primarily ammonium sulfate. |
| • | Fulghum Fibres — The operations of Fulghum, which provides wood yard operations services and wood fibre processing services, sells wood chips to the pulp, paper and packaging industry, and owns and manages forestland and sells bark to industrial consumers in South America. |
| • | Wood Pellets: Industrial — This segment includes wood pellet projects owned by the Company, currently the Atikokan Project and Wawa Project, and other wood pellet development activities. The wood pellet development activities represent the Company’s personnel costs for employees dedicated to the wood pellet business infrastructure and administration costs and other third party costs. |
| • | Wood Pellets: NEWP — The operations of NEWP, which produces wood pellets for the residential and commercial heating markets. |
135
Table of Contents
The Company’s reportable operating segments have been determined in accordance with the Company’s internal management structure, which is organized based on operating activities. The Company evaluates performance based upon several factors, of which the primary financial measure is segment-operating income.
| For the Years Ended December 31, |
||||||||||||
| 2014 | 2013 | 2012 | ||||||||||
| (in thousands) | ||||||||||||
| Revenues |
||||||||||||
| East Dubuque |
$ | 196,379 | $ | 177,700 | $ | 224,205 | ||||||
| Pasadena |
138,233 | 133,675 | 37,430 | |||||||||
| Fulghum Fibres |
101,849 | 62,974 | — | |||||||||
| Wood Pellets: Industrial |
4,086 | — | — | |||||||||
| Wood Pellets: NEWP |
32,114 | — | — | |||||||||
|
|
|
|
|
|
|
|||||||
| Total revenues |
$ | 472,661 | $ | 374,349 | $ | 261,635 | ||||||
|
|
|
|
|
|
|
|||||||
| Gross profit (loss) |
||||||||||||
| East Dubuque |
$ | 74,785 | $ | 80,883 | $ | 133,543 | ||||||
| Pasadena |
(14,308 | ) | (9,529 | ) | (1,704 | ) | ||||||
| Fulghum Fibres |
12,444 | 12,032 | — | |||||||||
| Wood Pellets: Industrial |
703 | — | — | |||||||||
| Wood Pellets: NEWP |
6,050 | — | — | |||||||||
|
|
|
|
|
|
|
|||||||
| Total gross profit |
$ | 79,674 | $ | 83,386 | $ | 131,839 | ||||||
|
|
|
|
|
|
|
|||||||
| Selling, general and administrative expenses |
||||||||||||
| East Dubuque |
$ | 4,165 | $ | 4,576 | $ | 6,242 | ||||||
| Pasadena |
5,078 | 4,764 | 361 | |||||||||
| Fulghum Fibres |
6,399 | 3,754 | — | |||||||||
| Wood Pellets: Industrial |
12,868 | 5,479 | 1,919 | |||||||||
| Wood Pellets: NEWP |
1,581 | — | — | |||||||||
|
|
|
|
|
|
|
|||||||
| Total segment selling, general and administrative expenses |
$ | 30,091 | $ | 18,573 | $ | 8,522 | ||||||
|
|
|
|
|
|
|
|||||||
| Depreciation and amortization |
||||||||||||
| East Dubuque |
$ | 194 | $ | 191 | $ | 807 | ||||||
| Pasadena |
1,315 | 3,886 | 583 | |||||||||
| Fulghum Fibres |
2,088 | (1,708 | ) | — | ||||||||
| Wood Pellets: Industrial |
139 | 26 | — | |||||||||
| Wood Pellets: NEWP |
81 | — | — | |||||||||
|
|
|
|
|
|
|
|||||||
| Total segment depreciation and amortization recorded in operating expenses |
3,817 | 2,395 | 1,390 | |||||||||
|
|
|
|
|
|
|
|||||||
| East Dubuque |
15,718 | 9,048 | 10,690 | |||||||||
| Pasadena |
7,030 | 4,187 | 380 | |||||||||
| Fulghum Fibres |
7,374 | 4,836 | — | |||||||||
| Wood Pellets: NEWP |
1,886 | — | — | |||||||||
|
|
|
|
|
|
|
|||||||
| Total depreciation and amortization recorded in cost of sales |
$ | 32,008 | $ | 18,071 | $ | 11,070 | ||||||
|
|
|
|
|
|
|
|||||||
| Total segment depreciation and amortization |
$ | 35,825 | $ | 20,466 | $ | 12,460 | ||||||
|
|
|
|
|
|
|
|||||||
| Other operating (income) expenses |
||||||||||||
| East Dubuque |
$ | 537 | $ | 806 | $ | 510 | ||||||
| Pasadena |
27,207 | 30,029 | — | |||||||||
| Fulghum Fibres |
38 | 72 | — | |||||||||
| Wood Pellets: Industrial |
(350 | ) | — | — | ||||||||
| Wood Pellets: NEWP |
— | — | — | |||||||||
|
|
|
|
|
|
|
|||||||
| Total segment other operating expenses |
$ | 27,432 | $ | 30,907 | $ | 510 | ||||||
|
|
|
|
|
|
|
|||||||
| Operating income (loss) |
||||||||||||
| East Dubuque |
$ | 69,888 | $ | 75,310 | $ | 125,984 | ||||||
| Pasadena |
(47,907 | ) | (48,208 | ) | (2,648 | ) | ||||||
| Fulghum Fibres |
3,919 | 9,914 | — | |||||||||
136
Table of Contents
| For the Years Ended December 31, |
||||||||||||
| 2014 | 2013 | 2012 | ||||||||||
| (in thousands) | ||||||||||||
| Wood Pellets: Industrial |
(11,954 | ) | (5,505 | ) | (1,919 | ) | ||||||
| Wood Pellets: NEWP |
4,388 | — | — | |||||||||
|
|
|
|
|
|
|
|||||||
| Total segment operating income (loss) |
$ | 18,334 | $ | 31,511 | $ | 121,417 | ||||||
|
|
|
|
|
|
|
|||||||
| Interest expense |
||||||||||||
| East Dubuque |
$ | 85 | $ | — | $ | 194 | ||||||
| Pasadena |
— | 8 | — | |||||||||
| Fulghum Fibres |
2,590 | 1,755 | — | |||||||||
| Wood Pellets: Industrial |
3 | — | — | |||||||||
| Wood Pellets: NEWP |
304 | — | — | |||||||||
|
|
|
|
|
|
|
|||||||
| Total segment interest expense |
$ | 2,982 | $ | 1,763 | $ | 194 | ||||||
|
|
|
|
|
|
|
|||||||
| Net income (loss) |
||||||||||||
| East Dubuque |
$ | 69,803 | $ | 75,244 | $ | 123,721 | ||||||
| Pasadena |
(47,925 | ) | (48,357 | ) | (2,648 | ) | ||||||
| Fulghum Fibres |
75 | 6,967 | — | |||||||||
| Wood Pellets: Industrial |
(11,616 | ) | (5,180 | ) | (1,919 | ) | ||||||
| Wood Pellets: NEWP |
4,342 | — | — | |||||||||
|
|
|
|
|
|
|
|||||||
| Total segment net income |
$ | 14,679 | $ | 28,674 | $ | 119,154 | ||||||
|
|
|
|
|
|
|
|||||||
| Reconciliation of segment net income to consolidated net income (loss): |
||||||||||||
| Segment net income |
$ | 14,679 | $ | 28,674 | $ | 119,154 | ||||||
| RNP – partnership and unallocated expenses recorded as selling, general and administrative expenses |
(8,768 | ) | (7,945 | ) | (11,773 | ) | ||||||
| RNP – partnership and unallocated income (expenses) recorded as other income (expense) |
4,800 | (1,081 | ) | 232 | ||||||||
| RNP – unallocated interest expense and loss on interest rate swaps |
(18,972 | ) | (14,096 | ) | (2,226 | ) | ||||||
| RNP – income tax benefit (expense) |
— | 303 | (303 | ) | ||||||||
| Corporate and unallocated expenses recorded as selling, general and administrative expenses |
(28,043 | ) | (24,849 | ) | (23,432 | ) | ||||||
| Corporate and unallocated depreciation and amortization expense |
(579 | ) | (596 | ) | (754 | ) | ||||||
| Corporate and unallocated income (expenses) recorded as other income (expense) |
(1,634 | ) | 19 | (2,708 | ) | |||||||
| Corporate and unallocated interest expense |
(380 | ) | (532 | ) | (9,055 | ) | ||||||
| Corporate income tax benefit (expense) |
(866 | ) | 26,747 | (4,072 | ) | |||||||
| Income (loss) from discontinued operations, net of tax |
7,259 | (6,606 | ) | (37,376 | ) | |||||||
|
|
|
|
|
|
|
|||||||
| Consolidated net income (loss) |
$ | (32,504 | ) | $ | 38 | $ | 27,687 | |||||
|
|
|
|
|
|
|
|||||||
| As of December 31, | ||||||||
| 2014 | 2013 | |||||||
| (in thousands) | ||||||||
| Total assets |
||||||||
| East Dubuque |
$ | 186,508 | $ | 175,430 | ||||
| Pasadena |
193,737 | 188,836 | ||||||
| Fulghum Fibres |
197,418 | 188,397 | ||||||
| Wood Pellets: Industrial |
149,021 | 42,089 | ||||||
| Wood Pellets: NEWP |
56,134 | — | ||||||
|
|
|
|
|
|||||
| Total segment assets |
$ | 782,818 | $ | 594,752 | ||||
|
|
|
|
|
|||||
137
Table of Contents
| As of December 31, | ||||||||
| 2014 | 2013 | |||||||
| (in thousands) | ||||||||
| Reconciliation of segment total assets to consolidated total assets: |
||||||||
| Segment total assets |
$ | 782,818 | $ | 594,752 | ||||
| RNP – partnership and other |
34,071 | 42,078 | ||||||
| Corporate and other |
9,279 | 62,090 | ||||||
| Discontinued operations |
1,982 | 4,670 | ||||||
|
|
|
|
|
|||||
| Consolidated total asset |
$ | 828,150 | $ | 703,590 | ||||
|
|
|
|
|
|||||
| For the Years Ended December 31, |
||||||||||||
| 2014 | 2013 | 2012 | ||||||||||
| (in thousands) | ||||||||||||
| Capital expenditures |
||||||||||||
| East Dubuque |
$ | 24,872 | $ | 57,981 | $ | 56,050 | ||||||
| Pasadena |
46,791 | 32,307 | 1,521 | |||||||||
| RNP – partnership and other |
— | — | — | |||||||||
| Fulghum Fibres |
21,683 | 2,244 | — | |||||||||
| Wood Pellets: Industrial |
79,603 | 11,359 | — | |||||||||
| Wood Pellets: NEWP |
125 | — | — | |||||||||
| Corporate and other |
1,437 | 808 | 1,130 | |||||||||
| Discontinued operations |
— | 6 | 430 | |||||||||
|
|
|
|
|
|
|
|||||||
| Total capital expenditures |
$ | 174,511 | $ | 104,705 | $ | 59,131 | ||||||
|
|
|
|
|
|
|
|||||||
The Company’s revenues by geographic area, based on where the customer takes title to the product, were as follows:
| For the Years Ended December 31, |
||||||||||||
| 2014 | 2013 | 2012 | ||||||||||
| (in thousands) | ||||||||||||
| United States |
$ | 425,768 | $ | 352,008 | $ | 261,635 | ||||||
| Canada |
4,086 | — | — | |||||||||
| Other |
42,807 | 22,341 | — | |||||||||
|
|
|
|
|
|
|
|||||||
| Total revenues |
$ | 472,661 | $ | 374,349 | $ | 261,635 | ||||||
|
|
|
|
|
|
|
|||||||
The following table sets forth assets by geographic area:
| As of | ||||||||
| December 31, 2014 |
December 31, 2013 |
|||||||
| (in thousands) | ||||||||
| United States |
$ | 637,271 | $ | 633,886 | ||||
| Canada |
149,021 | 42,089 | ||||||
| Other |
41,858 | 27,615 | ||||||
|
|
|
|
|
|||||
| Total assets |
$ | 828,150 | $ | 703,590 | ||||
|
|
|
|
|
|||||
138
Table of Contents
Note 23 — Net Income (Loss) Per Common Share Attributable To Rentech
| For the Years Ended December 31, |
||||||||||||
| 2014 | 2013 | 2012 | ||||||||||
| Numerator: |
||||||||||||
| Income (loss) from continuing operations attributable to Rentech common shareholders |
$ | (39,269 | ) | $ | 5,074 | $ | 23,376 | |||||
| Less: Dividends and accretion on 2014 Preferred Stock |
3,840 | — | — | |||||||||
| Less: Income from continuing operations allocated to participating securities |
— | 139 | 860 | |||||||||
|
|
|
|
|
|
|
|||||||
| Income (loss) from continuing operations allocated to common shareholders |
$ | (43,109 | ) | $ | 4,935 | $ | 22,516 | |||||
|
|
|
|
|
|
|
|||||||
| Numerator: |
||||||||||||
| Income (loss) from discontinued operations attributable to Rentech common shareholders |
$ | 7,259 | $ | (6,606 | ) | $ | (37,376 | ) | ||||
| Less: Income from discontinued operations allocated to participating securities |
267 | — | — | |||||||||
|
|
|
|
|
|
|
|||||||
| Income (loss) from discontinued operations allocated to common shareholders |
$ | 6,992 | $ | (6,606 | ) | $ | (37,376 | ) | ||||
|
|
|
|
|
|
|
|||||||
| Numerator: |
||||||||||||
| Net income (loss) attributable to Rentech common shareholders |
$ | (32,010 | ) | $ | (1,532 | ) | $ | (14,000 | ) | |||
| Less: Dividends and accretion on 2014 Preferred Stock |
3,840 | — | — | |||||||||
| Less: Income allocated to participating securities |
— | — | — | |||||||||
|
|
|
|
|
|
|
|||||||
| Net income (loss) allocated to common shareholders |
$ | (35,850 | ) | $ | (1,532 | ) | $ | (14,000 | ) | |||
|
|
|
|
|
|
|
|||||||
| Denominator: |
||||||||||||
| Weighted average common shares outstanding |
228,560 | 226,139 | 223,189 | |||||||||
| Effect of dilutive securities: |
||||||||||||
| Warrants |
— | 927 | 920 | |||||||||
| Common stock options |
— | 1,525 | 1,686 | |||||||||
| Restricted stock |
— | 5,112 | 4,729 | |||||||||
|
|
|
|
|
|
|
|||||||
| Diluted shares outstanding |
228,560 | 233,703 | 230,524 | |||||||||
|
|
|
|
|
|
|
|||||||
| Continuing operations |
$ | (0.19 | ) | $ | 0.02 | $ | 0.10 | |||||
|
|
|
|
|
|
|
|||||||
| Discontinued operations |
$ | 0.03 | $ | (0.03 | ) | $ | (0.17 | ) | ||||
|
|
|
|
|
|
|
|||||||
| Basic net income (loss) per common share |
$ | (0.16 | ) | $ | (0.01 | ) | $ | (0.06 | ) | |||
|
|
|
|
|
|
|
|||||||
| Continuing operations |
$ | (0.19 | ) | $ | 0.02 | $ | 0.10 | |||||
|
|
|
|
|
|
|
|||||||
| Discontinued operations |
$ | 0.03 | $ | (0.03 | ) | $ | (0.16 | ) | ||||
|
|
|
|
|
|
|
|||||||
| Diluted net income (loss) per common share |
$ | (0.16 | ) | $ | (0.01 | ) | $ | (0.06 | ) | |||
|
|
|
|
|
|
|
|||||||
For the year ended December 31, 2014, 60.7 million of Rentech’s common stock issuable pursuant to stock options, stock warrants, restricted stock units and preferred stock were excluded from the calculation of diluted income (loss) per share because their inclusion would have been anti-dilutive.
For the year ended December 31, 2013, 3.8 million of Rentech’s common stock issuable pursuant to stock options, stock warrants, and restricted stock units were excluded from the calculation of diluted income (loss) per share because their inclusion would have been anti-dilutive.
139
Table of Contents
For the year ended December 31, 2012, 4.3 million of Rentech’s common stock issuable pursuant to stock options, stock warrants, restricted stock units and convertible debt were excluded from the calculation of diluted income (loss) per share because their inclusion would have been anti-dilutive.
Note 24 — Selected Quarterly Financial Data (Unaudited)
Selected unaudited condensed consolidated financial information for the years ended December 31, 2014 and 2013 is presented in the tables below (in thousands, except per share data).
| First Quarter |
Second Quarter |
Third Quarter |
Fourth Quarter |
|||||||||||||
| For 2014 |
||||||||||||||||
| Revenues |
$ | 84,831 | $ | 139,890 | $ | 125,304 | $ | 122,636 | ||||||||
| Gross profit (loss) |
$ | 17,895 | $ | 31,439 | $ | 12,969 | $ | 17,371 | ||||||||
| Operating income (loss) |
$ | 2,995 | $ | (15,043 | ) | $ | (4,312 | ) | $ | (2,710 | ) | |||||
| Income (loss) from continuing operations |
$ | (4,123 | ) | $ | (21,466 | ) | $ | (10,445 | ) | $ | (3,729 | ) | ||||
| Income (loss) from discontinued operations, net of tax |
$ | (1,471 | ) | $ | (1,567 | ) | $ | (1,242 | ) | $ | 11,539 | |||||
| Net income (loss) |
$ | (5,594 | ) | $ | (23,033 | ) | $ | (11,687 | ) | $ | 7,810 | |||||
| Net (income) loss attributable to noncontrolling interests |
$ | (1,394 | ) | $ | 3,588 | $ | 1,311 | $ | (3,011 | ) | ||||||
| Net income (loss) attributable to Rentech |
$ | (6,988 | ) | $ | (19,445 | ) | $ | (10,376 | ) | $ | 4,799 | |||||
| Net income (loss) per common share allocated to Rentech: |
||||||||||||||||
| Basic: |
||||||||||||||||
| Continuing operations |
$ | (0.02 | ) | $ | (0.08 | ) | $ | (0.05 | ) | $ | (0.04 | ) | ||||
|
|
|
|
|
|
|
|
|
|||||||||
| Discontinued operations |
$ | (0.01 | ) | $ | (0.01 | ) | $ | (0.01 | ) | $ | 0.05 | |||||
|
|
|
|
|
|
|
|
|
|||||||||
| Net income (loss) |
$ | (0.03 | ) | $ | (0.09 | ) | $ | (0.05 | ) | $ | 0.01 | |||||
|
|
|
|
|
|
|
|
|
|||||||||
| Diluted: |
||||||||||||||||
| Continuing operations |
$ | (0.02 | ) | $ | (0.08 | ) | $ | (0.05 | ) | $ | (0.03 | ) | ||||
|
|
|
|
|
|
|
|
|
|||||||||
| Discontinued operations |
$ | (0.01 | ) | $ | (0.01 | ) | $ | (0.01 | ) | $ | 0.05 | |||||
|
|
|
|
|
|
|
|
|
|||||||||
| Net income (loss) |
$ | (0.03 | ) | $ | (0.09 | ) | $ | (0.05 | ) | $ | 0.01 | |||||
|
|
|
|
|
|
|
|
|
|||||||||
| First Quarter |
Second Quarter |
Third Quarter |
Fourth Quarter |
|||||||||||||
| For 2013 |
||||||||||||||||
| Revenues |
$ | 59,564 | $ | 120,061 | $ | 115,657 | $ | 79,067 | ||||||||
| Gross profit (loss) |
$ | 22,719 | $ | 42,273 | $ | 21,144 | $ | (2,750 | ) | |||||||
| Operating income (loss) |
$ | 8,990 | $ | 27,688 | $ | (24,758 | ) | $ | (13,799 | ) | ||||||
| Income (loss) from continuing operations |
$ | 7,679 | $ | 45,802 | $ | (27,136 | ) | $ | (19,701 | ) | ||||||
| Income (loss) from discontinued operations, net of tax |
$ | (6,893 | ) | $ | (1,496 | ) | $ | 3,558 | $ | (1,775 | ) | |||||
| Net income (loss) |
$ | 786 | $ | 44,306 | $ | (23,578 | ) | $ | (21,476 | ) | ||||||
| Net (income) loss attributable to noncontrolling interests |
$ | (6,026 | ) | $ | (11,474 | ) | $ | 8,985 | $ | 6,945 | ||||||
| Net income (loss) attributable to Rentech |
$ | (5,240 | ) | $ | 32,832 | $ | (14,593 | ) | $ | (14,531 | ) | |||||
| Net income (loss) per common share allocated to Rentech: |
||||||||||||||||
| Basic: |
||||||||||||||||
| Continuing operations |
$ | 0.01 | $ | 0.15 | $ | (0.08 | ) | $ | (0.06 | ) | ||||||
|
|
|
|
|
|
|
|
|
|||||||||
| Discontinued operations |
$ | (0.03 | ) | $ | (0.01 | ) | $ | 0.02 | $ | (0.01 | ) | |||||
|
|
|
|
|
|
|
|
|
|||||||||
| Net income (loss) |
$ | (0.02 | ) | $ | 0.14 | $ | (0.06 | ) | $ | (0.06 | ) | |||||
|
|
|
|
|
|
|
|
|
|||||||||
| Diluted: |
||||||||||||||||
| Continuing operations |
$ | 0.01 | $ | 0.14 | $ | (0.08 | ) | $ | (0.06 | ) | ||||||
|
|
|
|
|
|
|
|
|
|||||||||
| Discontinued operations |
$ | (0.03 | ) | $ | (0.01 | ) | $ | 0.02 | $ | (0.01 | ) | |||||
|
|
|
|
|
|
|
|
|
|||||||||
| Net income (loss) |
$ | (0.02 | ) | $ | 0.14 | $ | (0.06 | ) | $ | (0.06 | ) | |||||
|
|
|
|
|
|
|
|
|
|||||||||
140
Table of Contents
The net income during the three months ended December 31, 2014 was primarily attributable to (i) the sale of the Company’s alternative energy technologies, which resulted in a gain of $15.3 million being recorded in discontinued operations; (ii) higher sales prices for ammonia, UAN and ammonium sulfate; and (iii) the Agrifos settlement income of $5.6 million, partially offset by (a) a loss on gas derivatives of $3.1 million; (b) severance costs for a former officer of the Company of $2.0 million; and (c) write-down of inventory of $1.5 million.
The gross loss during the three months ended December 31, 2013 was primarily attributable to (i) turnaround expenses at the East Dubuque Facility of $7.8 million and the Pasadena Facility of $1.7 million; (ii) a write-down of the Pasadena Facility’s inventory of $5.1 million; (iii) fixed operating costs while the East Dubuque Facility was idle of $4.2 million; and (iv) the $1.0 million insurance deductible for the fire which occurred in November 2013 at the East Dubuque Facility.
Note 25 — Subsequent Events
Acquisition
On January 23, 2015, NEWP acquired the assets of Allegheny, which consists of a wood pellet processing facility located in Youngsville, Pennsylvania and $0.3 million of inventory, for $7.2 million. The Company financed the purchase with a five-year, $8.0 million term loan, which amortizes as if it had a seven-year maturity. The term loan has an interest rate of LIBOR plus 2.25 percent, and contains financial covenants that may restrict dividends from NEWP to Rentech. The excess proceeds from the term loan will be used for transaction costs and capital expenditures related to environmental and safety improvements at the Allegheny facility. The acquisition will be accounted for using the acquisition method of accounting, which requires, among other things, that assets acquired and liabilities assumed be recognized at their fair values as of the acquisition date. The Company is unable as of the filing date of this report to provide the amounts recognized as of the acquisition date for the major classes of assets acquired and liabilities assumed.
Distributions
On February 12, 2015, RNP announced a cash distribution to its common unitholders for the period October 1, 2014 through and including December 31, 2014 of $0.30 per common unit which resulted in total distributions in the amount of $11.7 million, including payments to phantom unitholders. RNHI received a distribution of $7.0 million, representing its share of distributions based on its ownership of common units. The cash distribution was paid on February 27, 2015 to unitholders of record at the close of business on February 23, 2015.
Amended and Restated Credit Agreement
On February 12, 2015, RNHI entered into the A&R GSO Credit Agreement. The A&R GSO Credit Agreement consists of three tranches of term loans, all of which mature on April 9, 2019: (i) a $50 million term loan originally drawn on April 16, 2014 (“Tranche A Loans”), (ii) an up to $45 million delayed draw term loan facility (“Tranche B Loans”) and (iii) an up to $18 million delayed draw term loan facility (“Tranche C Loans,” and together with the Tranche A Loans and the Tranche B Loans, the “Loans” ). The Company expects that the Tranche B Loans will be used to fund the development of its wood pellet projects in Ontario, Canada, and that the Tranche C Loans will be used to fund (x) in the event the ammonia converter at the Company’s East Dubuque, Illinois facility fails during the first year after the date of the A&R GSO Credit Agreement, any shortfall in cash distributions made by RNP to the Company resulting from unplanned downtime at the facility and the cost of repairs to the ammonia converter in such period (such funding not to exceed $13 million) and (y) in the event that cash distributions made by RNP to the Company for any quarter during the year ending December 31, 2015 are less than the budgeted amounts by a certain percentage, and such shortfall is due primarily to any combination of lower product prices and higher raw material prices (other than raw material prices which have been locked in through advance purchase or hedging transactions), the amount of such cash shortfall (such funding not to exceed $5 million).
Of the amounts available, $25 million of the Tranche B Loans was drawn on February 12, 2015. The remainder of the Tranche B Loans and the Tranche C Loans must be drawn, if at all, by February 12, 2016. Tranche A Loans under the A&R GSO Credit Agreement bear interest at a rate equal to the greater of (i) LIBOR plus 7.00% and (ii) 8.00% per annum. Tranche B Loans and Tranche C Loans under the A&R GSO Credit Agreement bear interest at a rate equal to the greater of (i) LIBOR plus 9.00% and (ii) 10.00% per annum. In the event the Borrower prepays any of the Loans on or prior to February 12, 2016, subject to certain exceptions, it will be required to pay a prepayment fee equal to 1.00% of the amount of the prepayment.
The Borrower’s obligations under the A&R GSO Credit Agreement are guaranteed by the Company and the Company’s direct and indirect subsidiaries other than RNP, the subsidiaries of RNP and certain other excluded subsidiaries (such subsidiaries guaranteeing obligations under the A&R GSO Credit Agreement, the “Subsidiary Guarantors,” and together with the Company and the Borrower, the “Loan Parties”). The obligations under the A&R GSO Credit Agreement and the guarantees are secured by a lien on substantially all of the Loan Parties’ tangible and intangible property, and by a pledge of all of the shares of stock and limited liability company interests owned by the Loan Parties, of which the Loan Parties now own or later acquire more than a 50% interest, subject to certain exceptions.
141
Table of Contents
The obligations of the Borrower under the A&R GSO Credit Agreement are also secured by 13,796,685 common units of RNP owned by the Borrower, 3,114,439 of which are to be released upon the Borrower’s post-closing delivery of certain other collateral. We expect the 3.1 million units to be released no later than April 2, 2015. The Loans are subject to 2.00% original issue discount at the time of a draw.
The A&R GSO Credit Agreement allows for dividends to be paid to the Company’s shareholders as long as there is no event of default and consent is given by GSO Capital.
Amendment No. 1 to Subscription Agreement
On February 12, 2015, the Company entered into the Subscription Amendment. Among others things, the parties amended the Subscription Agreement as follows:
Call Right. At any time, subject to certain conditions, the Company may elect to repurchase all of the 2014 Preferred Stock the Series E Purchasers originally purchased under the Subscription Agreement (“Purchased Shares”) in exchange for (a) cash of $1,000 per Purchased Share (as adjusted for any stock splits, stock dividends, recapitalizations or the like), plus any accrued and unpaid dividends thereon and (b) warrants exercisable for the number of shares of Common Stock equal to the number of shares of Common Stock into which such Series E Purchaser’s Purchased Shares are convertible (“Repurchase Warrants”). If issued, the Repurchase Warrants will have an exercise price equal to the conversion price of the Purchased Shares (the “Conversion Price”), which is $2.22 per share (subject to appropriate adjustment for stock splits, dividends, combinations, recapitalizations and the like).
Additional Put Right. Upon the occurrence of an “RNP Change of Control,” each Series E Purchaser will have the right to cause the Company to purchase any or all of the outstanding Purchased Shares held by such Series E Purchaser for a price per Purchased Share equal to cash of $1,000 per Purchased Share (as adjusted for any stock splits, stock dividends, recapitalizations or the like), plus all accrued and unpaid dividends thereon. An “RNP Change of Control” generally is defined as (a) an event that constitutes a “Change of Control” as defined in the A&R GSO Credit Agreement that is not already a “Change of Control” under the Articles of Amendment of the Company setting forth the terms of the Purchased Shares, except that upon the repayment in full of the loans under the A&R GSO Credit Agreement, a sale, transfer, conveyance, encumbrance or other disposition of any capital stock or equity interests that constitutes collateral under the A&R GSO Credit Agreement will no longer be an “RNP Change of Control” or (b) any sale, transfer, conveyance, encumbrance (other than encumbrances created by the pledge agreement entered into by DSHC for the benefit of the Series E Purchasers) or other disposition by DSHC of any common units of RNP that are collateral under such pledge agreement to any person.
Amended and Restated Put Option Agreements
On February 12, 2015, DSHC entered into the A&R Put Option Agreements pursuant to which certain rights and obligations of the Put Option Agreements, dated April 9, 2014, among DSHC and each of the Series E Purchasers were amended. Among other things, the definition of a “Put Trigger Event” was expanded to include the failure of the Company to pay for the Purchased Shares under the additional put right upon an RNP Change of Control described above. In addition, the number of common units of RNP securing the obligations of DSHC under the A&R Put Option Agreements has been increased to 9,453,314 common units.
Exploring Strategic Alternatives
On February 17, 2015, RNP announced that its board has initiated a process to explore and evaluate potential strategic alternatives for the Partnership, which may include a sale of the Partnership, a merger with another party, a sale of some or all of its assets, or another strategic transaction. RNP has retained a financial advisor to assist with the strategic review process. There can be no assurance that this strategic review process will result in a transaction. As of December 31, 2014, the assets did not qualify as “held for sale”.
Drax Amendment
On February 25, 2015, the Company entered into an amendment (the “Amendment”) to the Drax Contract between Drax and Rentech’s wholly owned, indirect subsidiary, RTK WP Canada, ULC. The Amendment cancels all wood pellet deliveries in 2014 and reduces the required volume of wood pellets to be delivered to Drax in 2015 to 240,000 tonnes. In exchange for the cancelled deliveries and reduced volume commitments, the Company paid Drax a penalty of approximately $170,000 (which is reflected in the 2014 consolidated financial statements), and provide price reductions totaling approximately $0.9 million on pellet shipments made to Drax in 2015. In the event such shipments are not made, the price reductions will become cash penalties payable to Drax, in addition to other penalties that may be due under the Drax Agreement for such failed deliveries. Also, portions of the original 2015 pellet deliveries are being pushed to future years at 2015 pricing, which is expected to be lower than pricing under the original terms of the contract in those future years.
142
Table of Contents
SCHEDULE I — CONDENSED FINANCIAL INFORMATION (PARENT COMPANY ONLY)
RENTECH, INC.
Condensed Balance Sheets
(Amounts in thousands, except per share data)
| As of December 31, | ||||||||
| 2014 | 2013 | |||||||
| ASSETS | ||||||||
| Current assets |
||||||||
| Cash |
$ | 3,051 | $ | 59,154 | ||||
| Accounts receivable |
510 | — | ||||||
| Prepaid expenses and other current assets |
370 | 938 | ||||||
| Deferred income taxes |
1,366 | 1,126 | ||||||
| Other receivables, net |
3 | 11 | ||||||
|
|
|
|
|
|||||
| Total current assets |
5,300 | 61,229 | ||||||
|
|
|
|
|
|||||
| Property, plant and equipment, net |
1,827 | 830 | ||||||
|
|
|
|
|
|||||
| Construction in progress |
549 | 840 | ||||||
|
|
|
|
|
|||||
| Other assets |
||||||||
| Investment in subsidiaries |
182,317 | 122,492 | ||||||
| Deferred income taxes |
28,127 | 27,125 | ||||||
| Intercompany receivables |
436,328 | 298,394 | ||||||
| Deposits and other assets |
462 | 606 | ||||||
|
|
|
|
|
|||||
| Total other assets |
647,234 | 448,617 | ||||||
|
|
|
|
|
|||||
| Total assets |
$ | 654,910 | $ | 511,516 | ||||
|
|
|
|
|
|||||
| LIABILITIES AND STOCKHOLDERS’ EQUITY | ||||||||
| Current liabilities |
||||||||
| Accounts payable |
$ | 681 | $ | 466 | ||||
| Accrued payroll and benefits |
1,538 | 3,164 | ||||||
| Accrued liabilities |
3,642 | 3,902 | ||||||
| Other |
5,000 | 86 | ||||||
|
|
|
|
|
|||||
| Total current liabilities |
10,861 | 7,618 | ||||||
|
|
|
|
|
|||||
| Long-term liabilities |
||||||||
| Intercompany payables |
424,473 | 334,458 | ||||||
| Other |
681 | 1,484 | ||||||
|
|
|
|
|
|||||
| Total long-term liabilities |
425,154 | 335,942 | ||||||
|
|
|
|
|
|||||
| Total liabilities |
436,015 | 343,560 | ||||||
|
|
|
|
|
|||||
| Commitments and contingencies |
||||||||
| Mezzanine equity |
||||||||
| Series E convertible preferred stock — $10 par value; 100,000 shares authorized, issued and outstanding; 4.5% dividend rate |
95,060 | — | ||||||
|
|
|
|
|
|||||
| Stockholders’ equity |
||||||||
| Preferred stock — $10 par value; 1,000 shares authorized; 90 series A convertible preferred shares authorized and issued; no shares outstanding and $0 liquidation preference |
— | — | ||||||
| Series C participating cumulative preferred stock — $10 par value; 500 shares authorized; no shares issued and outstanding |
— | — | ||||||
| Series D junior participating preferred stock — $10 par value; 45 shares authorized; no shares issued and outstanding |
||||||||
| Common stock — $.01 par value; 450,000 shares authorized; 229,308 and 227,512 shares issued and outstanding at December 31, 2014 and 2013, respectively |
2,293 | 2,275 | ||||||
| Additional paid-in capital |
543,091 | 541,254 | ||||||
| Accumulated deficit |
(417,349 | ) | (385,339 | ) | ||||
| Accumulated other comprehensive loss |
(7,302 | ) | (117 | ) | ||||
|
|
|
|
|
|||||
| Total Rentech stockholders’ equity |
120,733 | 158,073 | ||||||
| Noncontrolling interests |
3,102 | 9,883 | ||||||
|
|
|
|
|
|||||
| Total equity |
123,835 | 167,956 | ||||||
|
|
|
|
|
|||||
| Total liabilities and stockholders’ equity |
$ | 654,910 | $ | 511,516 | ||||
|
|
|
|
|
|||||
143
Table of Contents
RENTECH, INC.
Condensed Statements of Operations
(Amounts in thousands)
| For the Years Ended December 31, |
||||||||||||
| 2014 | 2013 | 2012 | ||||||||||
| Operating expenses |
||||||||||||
| Selling, general and administrative expense |
27,560 | 24,045 | 23,016 | |||||||||
| Depreciation and amortization |
579 | 596 | 754 | |||||||||
| Loss on sale of assets and impairments |
15 | — | — | |||||||||
|
|
|
|
|
|
|
|||||||
| Total operating expenses |
28,154 | 24,641 | 23,770 | |||||||||
|
|
|
|
|
|
|
|||||||
| Other income (expense), net |
||||||||||||
| Interest expense |
(179 | ) | — | (9,055 | ) | |||||||
| Loss on debt extinguishment |
— | — | (2,686 | ) | ||||||||
| Other income (expense), net |
6,077 | 52 | 292 | |||||||||
|
|
|
|
|
|
|
|||||||
| Total other income (expenses), net |
5,898 | 52 | (11,449 | ) | ||||||||
|
|
|
|
|
|
|
|||||||
| Income (loss) before income taxes and equity in loss of subsidiaries |
(22,256 | ) | (24,589 | ) | (35,219 | ) | ||||||
| Equity in income (loss) of subsidiaries |
(10,536 | ) | (2,406 | ) | 63,967 | |||||||
| Income tax benefit (expense) |
288 | 27,033 | (1,061 | ) | ||||||||
|
|
|
|
|
|
|
|||||||
| Net income (loss) |
(32,504 | ) | 38 | 27,687 | ||||||||
| Net (income) loss attributable to noncontrolling interests |
494 | (1,570 | ) | (41,687 | ) | |||||||
| Preferred stock dividends |
(3,840 | ) | — | — | ||||||||
|
|
|
|
|
|
|
|||||||
| Net loss attributable to Rentech common shareholders |
$ | (35,850 | ) | $ | (1,532 | ) | $ | (14,000 | ) | |||
|
|
|
|
|
|
|
|||||||
144
Table of Contents
RENTECH, INC.
Condensed Statements of Cash Flows
(Amounts in thousands)
| For the Years Ended December 31, |
||||||||||||
| 2014 | 2013 | 2012 | ||||||||||
| Net cash from operating activities |
$ | (109,490 | ) | $ | 49,764 | $ | 8,438 | |||||
|
|
|
|
|
|
|
|||||||
| Cash flows from investing activities |
||||||||||||
| Capital expenditures |
(1,418 | ) | (807 | ) | (491 | ) | ||||||
| Payment for acquisitions |
(36,299 | ) | (75,961 | ) | — | |||||||
| Other items |
(568 | ) | (2 | ) | 150 | |||||||
|
|
|
|
|
|
|
|||||||
| Net cash used in investing activities |
(38,285 | ) | (76,770 | ) | (341 | ) | ||||||
|
|
|
|
|
|
|
|||||||
| Cash flows from financing activities |
||||||||||||
| Proceeds from preferred stock, net of discount and issuance costs |
94,495 | — | — | |||||||||
| Repurchase of common stock, including commissions |
— | — | (16,721 | ) | ||||||||
| Payment of stock issuance costs |
(16 | ) | (48 | ) | (40 | ) | ||||||
| Retirement of notes |
— | — | (57,500 | ) | ||||||||
| Special dividends and dividend equivalent |
— | — | (43,301 | ) | ||||||||
| Proceeds from options and warrants exercised |
93 | 298 | 2,730 | |||||||||
| Dividends to preferred stockholders |
(2,900 | ) | — | — | ||||||||
|
|
|
|
|
|
|
|||||||
| Net cash provided by (used in) financing activities |
91,672 | 250 | (114,832 | ) | ||||||||
|
|
|
|
|
|
|
|||||||
| Decrease in cash |
(56,103 | ) | (26,756 | ) | (106,735 | ) | ||||||
| Cash, beginning of period |
59,154 | 85,910 | 192,645 | |||||||||
|
|
|
|
|
|
|
|||||||
| Cash, end of period |
$ | 3,051 | $ | 59,154 | 85,910 | |||||||
|
|
|
|
|
|
|
|||||||
145
Table of Contents
RENTECH, INC.
Condensed Statements of Comprehensive Income (Loss)
(Amounts in thousands)
| For the Years Ended December 31, |
||||||||||||
| 2014 | 2013 | 2012 | ||||||||||
| Net income (loss) |
$ | (32,504 | ) | $ | 38 | $ | 27,687 | |||||
| Other comprehensive income (loss) |
(7,709 | ) | 236 | 172 | ||||||||
|
|
|
|
|
|
|
|||||||
| Comprehensive income (loss) |
$ | (40,213 | ) | $ | 274 | $ | 27,859 | |||||
| Less: net (income) loss attributable to noncontrolling interests |
494 | (1,570 | ) | (41,687 | ) | |||||||
| Less: other comprehensive (income) loss attributable to noncontrolling interests |
524 | (458 | ) | (67 | ) | |||||||
|
|
|
|
|
|
|
|||||||
| Comprehensive loss attributable to Rentech |
$ | (39,195 | ) | $ | (1,754 | ) | $ | (13,895 | ) | |||
|
|
|
|
|
|
|
|||||||
146
Table of Contents
Note 1 — Background
The condensed financial statements represent the financial information required by Securities and Exchange Commission Regulation S-X 5-04 for Rentech, Inc. Regulation S-X 5-04 requires the inclusion of parent company only financial statements if the restricted net assets of consolidated subsidiaries exceed certain thresholds of total consolidated net assets as of the last day of its most recent fiscal year.
The accompanying financial statements have been prepared to present the financial position, results of operations and cash flows of Rentech, Inc. on a stand-alone basis as a holding company. Investments in subsidiaries and other investees are stated at cost plus equity in undistributed earnings from the date of acquisition. These financial statements should be read in conjunction with Rentech, Inc.’s consolidated financial statements.
The parent company’s accounting policies are consistent with those of Rentech. The notes to the consolidated financial statements include disclosures related to commitments and contingencies in Note 15 “Commitment and Contingencies” and Note 21 “Income Taxes”. The notes to the consolidated financial statements also include disclosures related to the Company’s preferred stock in Note 16 “Preferred Stock”. Rentech received dividends from its subsidiary, Rentech Nitrogen Partners, L.P., of $7.2 million, $55.1 million and $71.6 million for the years ended December 31, 2014, 2013 and 2012, respectively.
147
Table of Contents
SCHEDULE II — VALUATION AND QUALIFYING ACCOUNTS
| Balance at Beginning of Period |
Charged to Expense |
Deductions and Write-Offs |
Balance at End of Period |
|||||||||||||
| (in thousands) | ||||||||||||||||
| Year Ended December 31, 2014 |
||||||||||||||||
| Allowance for doubtful accounts |
$ | — | $ | 500 | $ | — | $ | 500 | ||||||||
| Deferred tax valuation account(1) |
$ | 28,704 | $ | — | $ | 9,498 | $ | 38,202 | ||||||||
| Year Ended December 31, 2013 |
||||||||||||||||
| Deferred tax valuation account |
$ | 39,128 | $ | — | $ | (10,424 | ) | $ | 28,704 | |||||||
| Year Ended December 31, 2012 |
||||||||||||||||
| Allowance for doubtful accounts |
$ | 100 | $ | — | $ | (100 | ) | $ | — | |||||||
| Deferred tax valuation account |
$ | 32,018 | $ | — | $ | 7,110 | $ | 39,128 | ||||||||
| Reserve for REN earn-out |
$ | 697 | $ | — | $ | (697 | ) | $ | — | |||||||
| (1) | Includes a valuation allowance of $1,130 attributable to discontinued operations. |
148
Table of Contents
| ITEM 9. | CHANGES IN AND DISAGREEMENTS WITH ACCOUNTANTS ON ACCOUNTING AND FINANCIAL DISCLOSURE |
None.
| ITEM 9A. | CONTROLS AND PROCEDURES |
Evaluation of Disclosure Controls and Procedures
We maintain disclosure controls and procedures, or DCP, that are designed to ensure that information required to be disclosed by us in reports that we file or submit under the Securities Exchange Act of 1934, as amended, or the Exchange Act, is recorded, processed, summarized and reported within the time periods specified in the SEC’s rules and forms, and that such information is accumulated and communicated to our management, including our principal executive officer, or Chief Executive Officer, and principal financial officer, or Chief Financial Officer, as appropriate, to allow for timely decisions regarding required disclosure. In designing and evaluating DCP, management recognizes that any controls and procedures, no matter how well designed and operated, can provide only reasonable assurance of achieving the desired control objectives. Management is required to apply its judgment in evaluating the cost-benefit relationship of possible controls and procedures.
The Company, under the supervision and with the participation of the Company’s management, including the Company’s Chief Executive Officer and Chief Financial Officer, evaluated the effectiveness of the design and operation of the Company’s DCP as of the end of the period covered by this Annual Report. As we previously reported in 2014, management identified material weaknesses in internal control over financial reporting, or ICFR, as described below. See “Part II—Item 9A. Controls and Procedures—Management’s Annual Report on Internal Control Over Financial Reporting” in our Annual Report on Form 10-K/A filed on December 29, 2014. Based on their evaluation, our Chief Executive Officer and Chief Financial Officer concluded that our DCP were not effective as of December 31, 2014.
Management’s Annual Report on Internal Control Over Financial Reporting
Management is responsible for establishing and maintaining adequate ICFR (as defined in Rule 13a-15(f) of the Exchange Act). Our ICFR is designed to provide reasonable assurance regarding the reliability of financial reporting and the preparation of financial statements for external purposes in accordance with generally accepted accounting principles. Our ICFR includes policies and procedures that pertain to the maintenance of records that, in reasonable detail, accurately and fairly reflect the transactions and dispositions of our assets; provide reasonable assurance that transactions are recorded as necessary to permit preparation of financial statements in accordance with generally accepted accounting principles, and that receipts and expenditures are being made only in accordance with authorizations of our management and directors; and provide reasonable assurance regarding prevention or timely detection of unauthorized acquisition, use or disposition of our assets that could have a material effect on our financial statements. Because of its inherent limitations, ICFR may not prevent or detect misstatements. Also, projections of any evaluation of effectiveness to future periods are subject to the risk that controls may become inadequate because of changes in conditions or that the degree of compliance with the policies and procedures may deteriorate. However, these inherent limitations are known features of the financial reporting process, and it is possible to design into the process safeguards to reduce, though not eliminate, the risk.
Management, with the participation of our Chief Executive Officer and Chief Financial Officer, conducted an evaluation of the effectiveness of our ICFR as of December 31, 2014. Management based its assessment on criteria established in Internal Control-Integrated Framework (2013) issued by the Committee of Sponsoring Organizations of the Treadway Commission, or COSO.
As we previously reported in 2014, we identified the following material weaknesses that continue to exist as of December 31, 2014. A material weakness is a deficiency, or combination of deficiencies, in ICFR, such that there is a reasonable possibility that a material misstatement of the annual or interim financial statements will not be prevented or detected on a timely basis.
We did not design and maintain effective internal controls over (i) the review of the cash flow forecasts used in the accounting for long-lived asset recoverability and goodwill impairment, (ii) the determination of the goodwill impairment charge in accordance with generally accepted accounting principles, and (iii) maintaining documentation supporting management’s review of events and changes in circumstances that indicate it is more likely than not that a goodwill impairment has occurred between annual impairment tests. Specifically, with respect to (i) and (ii), we did not design and maintain effective internal controls related to determining the fair value of reporting units for the purpose of performing goodwill impairment testing and documenting management’s review of assumptions used in our cash flow forecasts for long-lived asset recoverability and goodwill impairment.
These control deficiencies did not result in a material misstatement to our consolidated financial statements for the year ended December 31, 2014. However, these control deficiencies, if unremediated, could, in another reporting period, result in a material misstatement to the annual or interim consolidated financial statements that would not be prevented or detected by the controls. Accordingly, our management has determined that these control deficiencies constitute material weaknesses.
As a result of the material weaknesses described above, management concluded we did not maintain effective ICFR as of December 31, 2014 based on the criteria in Internal Control – Integrated Framework (2013) issued by COSO. Accordingly, management has restated its report on ICFR.
149
Table of Contents
Management has excluded our wholly owned subsidiary, New England Wood Pellets (“NEWP”), from its assessment of ICFR as of December 31, 2014 because NEWP was acquired by us in a purchase business combination on May 1, 2014 which did not allow management enough time to make a proper assessment. The total assets and total revenues of NEWP represent approximately 6% and 7%, respectively, of the related consolidated financial statement amounts as of and for the year ended December 31, 2014.
The effectiveness of our internal control over financial reporting as of December 31, 2014 has been audited by PricewaterhouseCoopers LLP, an independent registered public accounting firm, as stated in their report which appears herein.
Plan for Remediation of the Material Weaknesses
We have implemented and are continuing to implement a number of measures to address the material weaknesses identified. Specifically, we are designing additional controls over documentation and review of the inputs and results of our cash flow forecasts and the identification of events and changes in circumstances that may indicate potential impairment of goodwill. These controls are expected to include the implementation of additional review activities by qualified personnel and additional documentation and support of conclusions with regard to accounting for long-lived asset recoverability and goodwill impairment. We are also designing additional controls around identification and documentation relating to accounting for goodwill impairment. These controls are expected to include the implementation of additional review activities by qualified personnel, additional documentation and the development and use of checklists and procedures related to accounting for long-lived asset recoverability and goodwill impairment. We are in the process of implementing our remediation plan, and expect the control weaknesses to be remediated in the coming reporting periods. However, we are unable at this time to estimate when the remediation will be completed.
The process of designing and implementing an effective financial reporting system is a continuous effort that requires us to anticipate and react to changes in our business and the economic and regulatory environments and to expend significant resources to maintain a financial reporting system that is adequate to satisfy our reporting obligations. As we continue to evaluate and take actions to improve our ICFR, we may determine to take additional actions to address control deficiencies or determine to modify certain of the remediation measures described above. We cannot assure you that the measures we have taken to date, or any measures we may take in the future, will be sufficient to remediate the material weaknesses we have identified or avoid potential future material weaknesses.
Changes in Internal Control over Financial Reporting
There were changes in our ICFR during the quarter ended December 31, 2014 that materially affected, or are reasonably likely to materially affect, our ICFR. During the fourth quarter of 2014, we designed and implemented additional controls, including reconciliations of our financial forecasts to third party expert reports and documentation and review of the assumptions in and results of our cash flow forecasts used for the purchase price allocation in the accounting for business combinations. We also designed and implemented additional controls related to goodwill, including reconciliations of our financial forecasts to third party expert reports and reconciliations of carrying value of reporting units to appropriate support.
| ITEM 9B. | OTHER INFORMATION |
Not Applicable.
PART III
| ITEM 10. | DIRECTORS, EXECUTIVE OFFICERS AND CORPORATE GOVERNANCE |
The directors and executive officers of Rentech and their ages and their positions as of February 27, 2015, are as follows:
| Name |
Age | Position(s) | ||||
| Keith B. Forman |
56 | Chief Executive Officer, President and Director | ||||
| Dan J. Cohrs |
62 | Executive Vice President and Chief Financial Officer | ||||
| Sean Ebnet |
48 | Senior Vice President, Wood Fibre | ||||
| Colin M. Morris |
42 | Senior Vice President, General Counsel | ||||
| Jeffrey R. Spain |
49 | Senior Vice President, Finance, Accounting & Administration of Wood Fibre | ||||
| Michael S. Burke(1) |
51 | Director | ||||
| General (ret) Wesley K. Clark(1) |
70 | Director | ||||
| Patrick J. Moore(1) |
60 | Director | ||||
| Douglas I. Ostrover(1) |
52 | Director | ||||
| Ronald M. Sega(1) |
62 | Director | ||||
| Edward M. Stern(1) |
56 | Director | ||||
| Halbert S. Washburn(1) |
54 | Director and Chairman of the Board | ||||
| John A. Williams(1) |
71 | Director | ||||
| (1) | Independent Director. |
150
Table of Contents
Keith B. Forman, Chief Executive Officer, President and Director — Mr. Forman was appointed Chief Executive Officer, President and director of Rentech in December 2014. Mr. Forman was also appointed as the Chief Executive Officer and President of Rentech Nitrogen GP, LLC, the general partner of Rentech Nitrogen Partners, L.P., in December 2014 and was appointed as a director of Rentech Nitrogen GP, LLC in connection with the initial public offering of Rentech Nitrogen Partners, L.P. in November 2011. Since April 2007, Mr. Forman has been a director of Capital Product Partners L.P., a publicly traded shipping limited partnership specializing in the seaborne transportation of oil, refined oil products, chemicals and dry cargoes. Mr. Forman currently serves as the Chairman of its conflicts committee and is a member of its audit committee. Since May of 2011, Mr. Forman has served as a Senior Advisor to Industry Funds Management (IFM). IFM is an Australian based fund investing in infrastructure projects around the world including making investments in energy related infrastructure. Since November of 2013, Mr. Forman has served as a director of Applied Consultants, Inc., a privately held (by Nautic Partners) company with a roster of over 1,500 consulting engineers who work in the midstream pipeline construction and maintenance industry. From November 2007 until March 2010, Mr. Forman served as Partner and Chief Financial Officer of Crestwood Midstream Partners LP, a private investment partnership focused on making equity investments in the midstream energy market. From January 2004 to July 2005, Mr. Forman was Senior Vice President, Finance for El Paso Corporation, a provider of natural gas services. From January 1992 to December 2003, he served as Chief Financial Officer of GulfTerra Energy Partners L.P., a publicly traded master limited partnership, and was responsible for the financing activities of the partnership, including its commercial and investment banking relationships. Mr. Forman received a B.A. degree in economics and political science from Vanderbilt University. Our Board has determined that Mr. Forman brings to our Board accounting, financial and directorial experience, including extensive experience with master limited partnerships, and therefore he should serve our Board.
Dan J. Cohrs, Executive Vice President and Chief Financial Officer — Mr. Cohrs was appointed Executive Vice President and Chief Financial Officer of Rentech in October 2008. Mr. Cohrs has more than 25 years of experience in corporate finance, strategy and planning, and mergers and acquisitions. From April 2008 through September 2008, Mr. Cohrs served as Chief Development and Financial Officer of Agency 3.0, LLC, a private digital advertising and consulting agency in Los Angeles, California and he was a Partner and a Board Member of Agency 3.0, LLC until September 2009. From August 2007 through September 2008, he served as Chief Development & Financial Officer of Skycrest Ventures, LLC, a private investment and consulting firm in Los Angeles that was related to Agency 3.0, LLC. From June 2006 to May 2007, Mr. Cohrs served as a consultant for finance and corporate development, as well as Interim Chief Financial Officer for several months during that period of time for Amp’d Mobile, a private mobile media entertainment company in Los Angeles. From 2003 to 2007, Mr. Cohrs worked as an independent consultant and advised companies regarding financings, investor presentations and business plans. Also from November 2005 to March 2006, Mr. Cohrs served as a Visiting Senior Lecturer at Cornell University’s Johnson School of Management in the area of corporate governance. From May 1998 to June 2003, Mr. Cohrs served as Executive Vice President and Chief Financial Officer of Global Crossing Ltd. Prior to being employed at Global Crossing Ltd., Mr. Cohrs held senior positions in finance and strategy at Marriot Corporation, Northwest Airlines, Inc. and GTE Corporation, a predecessor of Verizon Communications, Inc. Mr. Cohrs earned M.S. and Ph.D. degrees in finance, economics and public policy from Cornell University’s Johnson Graduate School of Management and a B.S. degree in Engineering from Michigan State University. Mr. Cohrs was appointed Chief Financial Officer of Rentech Nitrogen GP, LLC, the general partner of Rentech Nitrogen Partners, L.P., in July 2011.
On June 1, 2007, Amp’d Mobile, Inc. filed a petition for bankruptcy under chapter 11 of title 11 of the United States Code, 11 U.S.C. § 101, et seq., or the Bankruptcy Code, with the United States Bankruptcy Court for the District of Delaware. On January 28, 2002, Global Crossing Ltd., and certain of its direct and indirect subsidiaries, filed a petition for bankruptcy under chapter 11 of title 11 of the Bankruptcy Code with the United States Bankruptcy Court for the Southern District of New York. On April 11, 2005, the SEC, Global Crossing Ltd., Mr. Cohrs (at the relevant time, the Chief Financial Officer of Global Crossing Ltd.) and other members of Global Crossing Ltd.’s senior management reached a settlement related to an SEC investigation regarding alleged violations of the reporting provisions of Section 13(a) of the Exchange Act and the regulations thereunder. The parties to the agreement (other than the SEC) agreed not to cause any violations of such reporting provisions in the future, and in connection with a parallel civil action, Mr. Cohrs agreed to pay a $100,000 civil penalty. In the SEC order, none of the allegations related to fraud, no party admitted liability and no other violations of securities laws were alleged. Also in connection with Global Crossing, Ltd., on July 16, 2004, Mr. Cohrs and the Secretary of the United States Department of Labor entered into a settlement agreement, the relevant restrictions of which expired on July 16, 2009, pursuant to which Mr. Cohrs agreed, among other things, that he would give notice to the Secretary, and if the Secretary objected, then he would not serve in a fiduciary capacity with respect to any plan covered by the Employee Retirement Income Security Act.
151
Table of Contents
Sean Ebnet, Senior Vice President of Wood Fibre — Mr. Ebnet was appointed Senior Vice President of Business Development of Rentech in October 2012, and subsequently retitled to Senior Vice President of Wood Fibre at Rentech on March 2, 2013. Mr. Ebnet is responsible for growing and managing Rentech’s wood fibre business. Mr. Ebnet began his career with the United States Forest Service before moving into the private sector where he worked as a consultant to numerous forest products companies, power utilities and government agencies. From 2000 to 2008, Mr. Ebnet served as an Executive Director of Alternative Energy Investment Group where he was responsible for the screening, research and development of privately funded renewable power projects. From 2008 to 2012, Mr. Ebnet served the British utility Drax Power Ltd. as Director of New Business and spearheaded the company’s transition of the 4,000 MW coal plant into the largest biomass co-firing power station in the world. Mr. Ebnet graduated from the University of Washington with a B.S. degree in Zoology and Environmental Sciences.
Colin M. Morris, Senior Vice President and General Counsel — Mr. Morris has served as Senior Vice President and General Counsel of Rentech since October 2011. From June 2006 to October 2011, Mr. Morris served as Vice President and General Counsel. Mr. Morris practiced corporate and securities law at the Los Angeles office of Latham & Watkins LLP from June 2004 to May 2006. From September 2000 to May 2004, Mr. Morris practiced corporate and securities law in the Silicon Valley office of Wilson, Sonsini, Goodrich and Rosati. Prior to that Mr. Morris practiced corporate and securities law in the Silicon Valley office of Pillsbury Winthrop Shaw Pittman LLP. Mr. Morris received an A.B. degree in government from Georgetown University and a J.D. from the University of California, Berkeley, Boalt Hall School of Law. Mr. Morris was appointed Senior Vice President, General Counsel and Secretary of Rentech Nitrogen GP, LLC, the general partner of Rentech Nitrogen Partners, L.P., in October 2011, and from July 2011 to October 2011, Mr. Morris served as Vice President, General Counsel and Secretary.
Jeffrey R. Spain, Senior Vice President of Finance, Accounting & Administration of Wood Fibre — Mr. Spain joined Rentech in 2011 as Senior Vice President of Finance and Accounting. In December 2014, Mr. Spain was appointed Senior Vice President of Finance, Accounting & Administration for the Wood Fibre group. Mr. Spain’s experience spans over 20 years and includes investment banking, operations management and Chief Financial Officer roles of high growth companies. Mr. Spain’s past employers include Credit Suisse First Boston, Kimberly-Clark Corporation, LeadPoint, Inc. and eNutrition. At LeadPoint, Inc., an internet performance marketing company funded by Redpoint Ventures, Mr. Spain served as its CFO from 2004 until joining Rentech in 2011. Mr. Spain received his Masters of Business Administration from the Anderson Graduate School of Management at UCLA and earned his Bachelor’s degree in finance from Southern Methodist University.
Michael S. Burke, Director — Mr. Burke was appointed as a director of Rentech in March 2007. He serves as chair of the Audit Committee and is a member of the Compensation Committee of Rentech. Mr. Burke was appointed as a director of Rentech Nitrogen GP, LLC in July 2011 and is a member of the Audit Committee of Rentech Nitrogen GP, LLC. Mr. Burke is the Chief Executive Officer and President of AECOM Technology Corporation, or AECOM, a global provider of professional technical and management support services to government and commercial clients. Mr. Burke was appointed chairman of the board of AECOM on March 4, 2015. From October 1, 2011 through March 5, 2014, Mr. Burke served as President of AECOM. From December 2006 through September 2011, Mr. Burke served as Executive Vice President, Chief Financial Officer of AECOM. Mr. Burke joined AECOM as Senior Vice President, Corporate Strategy in October 2005. From 1990 to 2005, Mr. Burke was with the accounting firm, KPMG LLP, where he served in various senior leadership positions, most recently as a Western Area Managing Partner from 2002 to 2005. Mr. Burke also was a member of the board of directors of KPMG from 2000 through 2005. While on the board of directors of KPMG, Mr. Burke served as the Chairman of the Board Process and Governance Committee and a member of the Audit and Finance Committee. Mr. Burke also serves on the boards of directors of various charitable and community organizations. Mr. Burke received a B.S. degree in accounting from the University of Scranton and a J.D. degree from Southwestern University. Our Board has determined that Mr. Burke brings to our Board extensive accounting, financial and business experience, including experience as an executive officer of a public company, and therefore he should serve on our Board.
General (ret) Wesley K. Clark, Director — General (ret) Wesley Clark was appointed as a director of Rentech in December 2010 and currently serves on the Audit Committee. General Clark is an active investment banker and strategic energy consultant in the oil, gas, biofuels, solar and wind industries in the United States, Europe, and Latin America. In 2003 General Clark founded his own strategic consulting firm, Wesley K. Clark and Associates, where he currently serves as Chairman and Chief Executive Officer. From 2000 to 2003 General Clark was a managing director at Stephens, Inc., an investment banking firm based in Arkansas. He acts as a Senior Advisor to the Blackstone Group with a focus in the energy sector. General Clark currently and historically has served on several public and private company boards in the areas of energy, infrastructure and technology. He serves on the board of directors of the following publically traded companies: BNK Petroleum Inc., an energy company focused on the acquisition, exploration and production of large oil and gas reserves; Bankers Petroleum Ltd., a Canadian based oil and gas exploration and production company; Juhl Wind Inc., a wind energy provider; Amaya Gaming, a Canadian company in the electronic gaming industry; Premier Alliance, a business advisory and consulting firm; and Solopower, a company specializing in solar power technology and services. General Clark retired a four star general from the United States Army in 2000, as NATO Supreme Allied Commander, Europe, following a 38 year Army career. He is a recipient of numerous U.S. and foreign awards, including the Presidential Medal of Freedom and Honorary Knighthoods from The United Kingdom and Netherlands. He graduated first in his class from the United States Military Academy at West Point and attended Oxford University as a Rhodes Scholar earning degrees in philosophy, politics and economics. Our Board has determined that General Clark brings to our Board extensive leadership experience, including having held high-ranking positions in the United States Army, and directorial and governance experience as a result of having served on boards of directors of numerous companies in the financial and energy sectors.
152
Table of Contents
Patrick J. Moore, Director — Mr. Moore was appointed as a director of Rentech in April 2014 and currently serves on the Finance Committee. Mr. Moore serves as president and chief executive officer of PJM Advisors, LLC, an investment and advisory firm. From 2002 until 2011, Mr. Moore was chairman and chief executive officer of Smurfit-Stone Container Corporation (formerly Jefferson Smurfit Corporation), a producer of containerboard and corrugated packaging and one of the world’s largest paper recyclers. His 24-year tenure at Smurfit also included service as chief financial officer, vice president and general manager of the company’s Industrial Packaging division, and treasurer. Earlier in his career, Mr. Moore held positions in corporate lending, international banking and corporate administration at Continental Bank in Chicago. Mr. Moore serves on the Board of Directors for Archer Daniels Midland Company, a global food processing and commodities trading company, and Exelis Inc., a global aerospace, defense, information and services company. Mr. Moore also serves on the North American Review Board of American Air Liquide Holdings, Inc. and on the boards of the Metropolitan YMCA of St. Louis, Boys Hope/Girls Hope, St. Louis Zoological Society and the Big Shoulders Fund. Mr. Moore received a Bachelor of Science in business administration from DePaul University. Mr. Moore is one of the two directors elected by the holders of the Series E Preferred Stock. Our Board has determined that Mr. Moore brings to our Board extensive accounting, financial and business experience, including experience as an executive officer of a public company, and therefore he should serve on our Board.
Douglas I. Ostrover, Director — Mr. Ostrover was appointed as a director of Rentech in April 2014 and serves as chairperson of the Finance Committee. Mr. Ostrover is senior managing director of the Blackstone Group and a founder of GSO Capital, an alternative asset management firm and a subsidiary of the Blackstone Group. Prior to co-founding GSO Capital in 2005, Mr. Ostrover held various positions at Credit Suisse First Boston (CSFB). He served as managing director and chairman of the Leveraged Finance Group, and global co-head of the Leveraged Finance Group. Prior to joining CSFB, Mr. Ostrover was managing director in charge of high yield and distressed sales, trading and research at Donaldson, Lufkin & Jenrette. Mr. Ostrover is currently on the Board of Directors of the Michael J. Fox Foundation. Mr. Ostrover received a Bachelor of Arts in economics from the University of Pennsylvania and an MBA from the Stern School of Business of New York University. Mr. Ostrover is one of the two directors elected by the holders of the Series E Preferred Stock. Our Board has determined that Mr. Ostrover brings to our Board extensive financial and business experience, and therefore he should serve on our Board.
Ronald M. Sega, Director — Dr. Sega was appointed as a director of Rentech in December 2007 and serves as chairperson of the Nominating and Corporate Governance Committee. Currently Dr. Sega serves as Director, Systems Engineering Programs and Special Assistant to the Chancellor for Strategic Initiatives at Colorado State University. From 2010 to 2013 he served as Vice President and Enterprise Executive for Energy and the Environment for both Colorado State University (CSU) and The Ohio State University (OSU), two Land-Grant universities engaged in efficient, sustainable development of practical products using natural resources (e.g. land/crops, forests, water, natural gas, etc.) through education, research and outreach. At CSU, he served as chair of the Sustainability, Energy, and Environment Advisory Committee. Dr. Sega also served as chair of the President’s and the Provost’s Council on Sustainability at OSU. Since 2008, Dr. Sega has served as a member of the board of directors of Woodward Inc., a public company that designs, manufactures and services energy control systems and components for aircraft and industrial engines and turbines. From August 2005 to August 2007, Dr. Sega served as Under Secretary for the U.S. Air Force. In that capacity, he oversaw the recruiting, training and equipping of approximately 700,000 people and a budget of approximately $110 billion and was the first senior energy official for the Air Force. Designated as the Department of Defense (DoD) Executive Agent for Space, Dr. Sega developed, coordinated and integrated plans and programs for all Department of Defense space major defense acquisition programs. From August 2001 until July 2005, Dr. Sega was Director of Defense Research and Engineering, Office of the Secretary of Defense, serving as the Chief Technology Officer for the DoD. Dr. Sega worked for NASA from 1990 until 1996 and made two shuttle flights during his career as an astronaut. He serves on several non-profit boards: Alaska Aerospace Corporation, Energy Institute for 21st Century Energy of the U.S. Chamber of Commerce, Air University Board of Visitors, U.S. Army Science Board, and U.S. Space Foundation Board of Directors. Dr. Sega received a B.S. in mathematics and physics from the United States Air Force Academy in 1974, a master of science degree in physics from The Ohio State University in 1975, and a doctorate in electrical engineering from the University of Colorado in 1982. Our Board has determined that Dr. Sega brings to our Board a strong background in sustainability, energy, environment, aerospace, technology research, and operations with significant experience in leadership positions, including those involving responsibility for large budgets, and therefore he should serve on our Board.
Edward M. Stern, Director — Mr. Stern was appointed as a director of Rentech in December 2006 and he currently serves as chairperson of the Compensation Committee. He also serves on the Finance Committee and Nominating and Corporate Governance Committee of our Board. Mr. Stern is the President and Chief Executive Officer of PowerBridge, LLC, or PowerBridge, the leading developer of non-utility, privately financed electric transmission systems in the U.S. PowerBridge has developed, financed, constructed and now operates more than 1300 megawatts of transmission capacity, with a total investment in excess of $1.5 billion. PowerBridge has recently completed the development and construction of a natural gas line and is currently developing several billion dollars of new electric transmission facilities. Mr. Stern has nearly 30 years of experience leading the successful development, financing and operation of major energy and infrastructure projects. Under Mr. Stern’s guidance, PowerBridge developed and built the Neptune Regional Transmission System, completed in 2007, and the Hudson Transmission Project, completed in 2013. Both the Neptune Regional Transmission System and the Hudson Transmission Project are 660 megawatt HVDC underwater and underground electric transmission systems, managed by PowerBridge, that interconnect the PJM energy grid in New Jersey with power grids in New York. Both projects were completed on budget and ahead of
153
Table of Contents
schedule. From 1991 through 2004, Mr. Stern was employed by Enel North America, Inc., the North American subsidiary of the Italian electric utility, Enel SpA, and its predecessor, CHI Energy, Inc., an energy company specializing in renewable energy technologies including hydroelectric projects and wind farms. While at Enel North America, Inc. and CHI Energy, Inc., Mr. Stern served as General Counsel and, commencing in 1999, as President, Director and Chief Executive Officer. Prior to joining CHI, Mr. Stern was a vice president with BayBanks, Inc., a Boston-based $10 billion financial services organization, where for six years he specialized in energy project finance, real estate restructurings and asset management. Mr. Stern also currently serves on the boards of CAN Capital, Inc., a financial services company, and Deepwater Wind, a developer of offshore wind projects and serves on the Advisory Board of Starwood Energy Group Global, LLC, a private equity firm specializing in energy and infrastructure investments. Mr. Stern received B.A., J.D. and M.B.A. degrees from Boston University. He is a member of the Massachusetts Bar and the Federal Energy Bar. Our Board has determined that Mr. Stern brings to our Board significant management and legal experience at energy companies, including substantial project development experience, and his directorial and governance experience as a director at numerous companies, and therefore he should serve on our Board.
Halbert S. Washburn, Director and Chairman of the Board — Mr. Washburn was appointed as a director of Rentech in December 2005, and has served as Chairman of the Board since June 2011. He also serves on the Compensation Committee and Finance Committee of our Board. In July 2011, Mr. Washburn was appointed as a director of Rentech Nitrogen GP, LLC. Mr. Washburn has over 25 years of experience in the energy industry. Since April 2010, Mr. Washburn has been the Chief Executive Officer of BreitBurn GP, LLC, the general partner of BreitBurn Energy Partners LP. From August 2006 until April 2010, he was the co-Chief Executive Officer and served on the board of directors of BreitBurn GP, LLC. In December 2011, he was reappointed as a member of the board of directors of BreitBurn GP, LLC. He has served as the co-President and a director of BreitBurn Energy Corporation since 1988. He also has served as a co-Chief Executive Officer and a director for Pacific Coast Energy Holdings, LLC (formerly BreitBurn Energy Holdings, LLC) and as co-Chief Executive Officer and a director of PCEC (GP), LLC (formerly BEH (GP), LLC). Since September 2013, Mr. Washburn has served on the board of directors of Jones Energy, Inc., a publically traded oil and gas exploration and production company. Mr. Washburn previously served as Chairman on the Executive Committee of the board of directors of the California Independent Petroleum Association. He also served as Chairman of the Stanford University Petroleum Investments Committee and as Secretary and Chairman of the Wildcat Committee. Our Board has determined that Mr. Washburn brings to our Board knowledge of our business, extensive experience in the field of energy and with the MLP structure, including his service as an executive officer and director of several BreitBurn entities, and familiarity with start-up and public energy companies, and therefore he should serve on our Board.
John A. Williams, Director — Mr. Williams was appointed as a director of Rentech in November 2009 and he currently serves on the Audit Committee and the Nominating and Corporate Governance Committee. Mr. Williams has over 40 years of business experience, principally in the real estate and banking industries. Since January 2004, Mr. Williams has served as the Chief Executive Officer, President and Managing Member of Corporate Holdings, LLC, a diversified holdings company, and since November 2004, he has served as Chief Executive Officer and Managing Member of Williams Realty Advisors, LLC, a real estate fund advisor to over $3 billion in assets. Mr. Williams is currently Chairman and Chief Executive Officer of Preferred Apartment Communities, Inc., a real estate investment trust. In 1970, Mr. Williams founded Post Properties, Inc., a developer, owner and manager of upscale multifamily apartment communities in selected markets in the United States. Mr. Williams served as Chief Executive Officer of Post Properties from 1970 until 2002, and he served on its board from inception until 2004. Mr. Williams served as Chairman for Post Properties from inception until February 2003 and Chairman Emeritus from February 2003 until August 2004. Mr. Williams currently serves on the board of directors of the Atlanta Falcons of which he is also a minority owner. He previously served on a variety of boards of directors, including those of NationsBank Corporation, Barnett Banks, Inc. and Crawford & Company. Mr. Williams hold a B.S. degree in industrial management from Georgia Tech. Our Board has determined that Mr. Williams brings to our Board over 40 years of business experience and directorial and governance experience on boards of directors, and therefore he should serve on our Board.
Communications with Directors
Shareholders and other interested parties wishing to communicate with our Board may send a written communication addressed to:
Rentech, Inc.
10877 Wilshire Blvd., 10th Floor
Los Angeles, CA 90024
Attention: Secretary
Our corporate secretary will forward all appropriate communications directly to our Board or to any individual director or directors, depending upon the facts and circumstances outlined in the communication. Any shareholder or other interested party who is interested in contacting only the independent directors or non-management directors as a group or the director who presides over the meetings of the independent directors or non-management directors may also send written communications to the contact above and should state for whom the communication is intended.
154
Table of Contents
Audit Committee and Audit Committee Financial Expert
Our Board has a standing Audit Committee. Our Board has determined that each member of the Audit Committee is “independent” within the meaning of the rules of the SEC and NASDAQ.
The charter of the Audit Committee is available on the Corporate Governance section of our website at http://www.rentechinc.com. Our Board regularly reviews developments in corporate governance and modifies the charter as warranted. Modifications are reflected on our website at the address referenced above. Information contained on our website is not incorporated into and does not constitute a part of this Annual Report on Form-10-K. Our website address referenced above is intended to be an inactive textual reference only and not an active hyperlink to the website.
The Audit Committee has been delegated responsibility for reviewing with the independent auditors the plans and results of the audit engagement; reviewing the adequacy, scope and results of the internal accounting controls and procedures; reviewing the degree of independence of the auditors; reviewing the auditors’ fees; and recommending the engagement of the auditors to our full Board.
The Audit Committee consists of Mr. Burke, Mr. Clark and Mr. Williams. Our Board has determined that Mr. Burke, the Chairman of the Audit Committee, qualifies as an “audit committee financial expert” as defined by the rules of the SEC.
Section 16(a) Beneficial Ownership Reporting Compliance
Section 16(a) of the Securities Exchange Act of 1934, as amended, requires Rentech’s executive officers and directors, and persons who own more than ten percent of a registered class of Rentech’s equity securities, or collectively, “Insiders,” to file initial reports of ownership and reports of changes in ownership with the SEC. Insiders are required by SEC regulations to furnish Rentech with copies of all Section 16(a) forms they file. To our knowledge, based solely on its review of the copies of such reports furnished to us and/or written representations that no other reports were required to be filed during fiscal year 2014, all filing requirements under Section 16(a) applicable to our officers, directors and 10% stockholders were satisfied timely, except in the following instances. Mr. Burke and Mr. Moore failed to report that 992 and 893 shares, respectively, that were granted as compensation for serving on certain Board Committees did not vest on June 30, 2014 as a result of their failure to serve on such Committees in the second quarter of 2014. The corrected form 4s were both filed on July 16, 2014 and reported that fewer shares vested on June 30, 2014 than were originally reported on April 2, 2014. Additionally, Mr. Ebnet had a vesting of 100,000 restricted stock units on September 17, 2014. The vesting of RSUs and withholding of shares to satisfy his tax obligation was properly reported by Mr. Ebnet on a Form 4 filed on September 26, 2014.
Code of Ethics
Rentech has adopted a Code of Business Conduct or Ethics that applies to Rentech’s directors, officers and employees. This code includes a special section entitled “Business Conduct and Ethics for Senior Financial Officers” which applies to the Company’s principal executive officer, principal financial officer, principal accounting officer or controller, and persons performing similar functions. A copy of the Code of Business Conduct or Ethics was filed as an exhibit to Rentech’s annual report on Form 10-K for the fiscal year ended September 30, 2008 and is available on the Corporate Governance Section of our website at www.rentechinc.com. We intend to disclose any amendment to or waiver of our Code of Business Conduct or Ethics either on our website or by filing a Current Report on Form 8-K. Our website address referenced above is not intended to be an active hyperlink, and the contents of our website shall not be deemed to be incorporated herein.
| ITEM 11. | EXECUTIVE COMPENSATION |
Compensation Discussion and Analysis
Executive Summary
This Compensation Discussion and Analysis provides an overview and analysis of our executive compensation program during the fiscal year ended December 31, 2014, or 2014, for our named executive officers, or NEOs. Pay-for-performance is paramount in our executive compensation program, and total compensation for our named executive officers was materially lower in 2014 than 2013 as a result of the Company’s 2014 performance compared to the Company’s 2013 performance (and decreases in our share price from 2013 to 2014). In addition, our executive compensation program resulted in significantly lower bonus awards than in prior years and none of the performance based equity vested due to poor stock price performance. Our executive compensation program is designed to align executive pay with individual performance on both short- and long-term bases; to link executive pay to specific, measurable financial, operational and development achievements intended to create value for shareholders; and to utilize compensation as a tool to attract and retain the high-caliber executives that are critical to our long-term success. The NEO compensation program in 2014 emphasized performance equity compensation, particularly as compared to other companies in our peer group (as discussed below). This was particularly true for our new Chief Executive Officer (“CEO”), who was hired near the end of 2014 and who was granted equity incentive compensation that has a substantial majority of its value contingent on increasing total
155
Table of Contents
shareholder return (“TSR”) over a period of up to four years following the grant date. Further, a majority of the equity compensation provided was contingent on achieving TSR over the next three years, with such contingent equity awards forfeited if our TSR, as determined by reference to the sum of our stock price increase and dividends over such period, does not equal or exceed a minimum of 50% during the three-year period.
2014 Highlights
We endeavor to structure our executive compensation program in a manner that reflects good corporate governance practices and aligns our NEOs’ pay with our performance, both operating and stock price. Pay-for-performance was a critical element of our compensation program for 2014, as demonstrated by the reduction in the overall compensation of our NEOs for 2014 and our increased use of performance based equity. Highlights of our 2014 executive compensation program included the following:
| • | Cash Incentives Linked to Performance Goals. During 2014, our executive officers were eligible to earn bonuses based on the Company’s and the individual executive officers’ achievement of a wide range of challenging, pre-established performance goals (discussed in detail below). The Company’s performance against the pre-established performance goals resulted in significantly lower bonus amounts earned in 2014 than in prior years. |
| • | Approximately 70% of CEO Equity Awards and 100% of Company Equity Awards granted to other NEOs in 2014 are subject to Stringent Performance-Vest Conditions. We believe that our equity compensation program supports long-term performance by aligning the interests of our executives and our stockholders. During 2014, 100% of the Company equity awards granted to named executive officers (other than our new CEO) were subject to rigorous performance-vest conditions requiring the achievement of a target level of TSR (i.e., at least +50%), which provides strong alignment between the interests of our executives and our stockholders. The new CEO’s awards are approximately 70% performance-based stock units (and subject to the achievement of at least +50% TSR) and 30% time-based stock options. |
| • | New CEO’s Cash Compensation is Significantly Below His Peers and is Balanced with Performance-Based Equity Compensation. In connection with our hiring of Mr. Forman as our new CEO in December 2014, we determined to provide him with a base salary equal to $200,000, which is significantly below the median base salary of CEO’s at similar companies and approximately 70% less than the former Chief Executive Officer’s base salary. In addition, Mr. Forman was not eligible for a cash bonus during 2014 and is not eligible for a cash bonus during 2015, meaning that all of his 2014 and 2015 incentive compensation was or will be (as applicable) equity based. Approximately 90% of Mr. Forman’s compensation is derived from a combination of equity awards subject to rigorous performance-vest conditions requiring the achievement of a target level of TSR (i.e., at least +50%) and stock options subject to time-vest conditions, the value of which is directly linked to stock price increase. The sum of Mr. Forman’s 2014 total compensation is slightly below the 25th percentile of similar CEO’s in our peer group, which is well below the median of the CEO’s in the peer group. |
| • | Change in Control Double-Trigger Severance. None of our compensation arrangements provide for any “single trigger” cash payments in connection with a change in control. Rather, change in control related cash severance is paid only if the executive is involuntarily terminated in connection with the change in control. This severance format provides reasonable executive protections while our NEOs negotiate with potential acquirers on behalf of shareholders, while also encouraging executives to remain employed and focus on our post-transaction success. |
| • | Stock Ownership Guidelines. We maintain stock ownership guidelines for our executives officers and non-employee directors, pursuant to which they must accumulate and hold equity of the Company valued at three times (3x) (or six times (6x) in the case of our Chief Executive Officer) their annual base salary (with respect to our executive officers) or their annual cash retainer (with respect to our non-employee directors) within the earlier of (i) five years after the adoption of these guidelines or (ii) five years after becoming an executive officer of the Company (with respect to our executive officers) or five years after joining our Board of Directors (with respect to our non-employee directors). If, after the five year period set forth above, an individual fails to satisfy the above ownership requirements, then he or she will be required to retain 100% of any of our shares acquired through stock option exercise or vesting of any performance stock units, restricted stock units and restricted stock awards (net of shares sold or withheld to satisfy taxes and, in the case of stock options, the exercise price) until such time that he or she meets the ownership requirements. |
| • | Clawback Policy. We maintain a clawback policy pursuant to which, in the event of an accounting restatement due to material non-compliance with any financial reporting requirements under the securities law, we would be entitled to recoup from executive officers all cash bonuses and all contingent equity that would not have been paid if performance had been measured in accordance with the restated financials. |
156
Table of Contents
Pay for Performance
Pay for performance is a key component of our compensation philosophy. Consistent with this focus, our compensation program includes (i) annual performance-based incentives and (ii) long-term equity compensation that is performance-linked both in that its value derives from stock price appreciation and in that 100% of the 2014 long-term Company equity incentive awards granted to our NEOs (other than Mr. Forman) condition vesting on the attainment of challenging three-year TSR performance goals (the target is 100% TSR over three years and the minimum threshold for any vesting of these awards is 50% TSR over this period). For 2014, approximately 32% of our NEOs’ aggregate compensation (excluding Mr. Forman’s compensation) came from variable performance-based pay consisting of performance-based cash bonuses and performance-based restricted stock units.
The below chart, representing the 2014 target total direct compensation (“TDC”) for our former Chief Executive Officer, Mr. Ramsbottom, demonstrates the emphasis on incentive compensation and performance-contingent compensation elements for 2014. The below chart, representing the 2014 target TDC for our Chief Executive Officer, Mr. Forman, also demonstrates the emphasis on incentive compensation and performance-contingent compensation elements for 2014. In setting Mr. Forman’s compensation, the Company intended to minimize his cash compensation and provide the majority of his compensation through performance-based equity awards which vest only if and when multi-year improvements in TSR are achieved. The elements of Mr. Forman’s 2014 TDC are described in greater detail below:
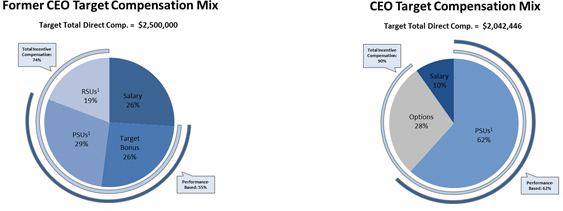
| 1 | “RSUs” refer to time-vesting RSUs, and “PSUs” refer to performance-vesting RSUs, as described below. Equity measures are based on grant date values as set forth in the “Grants of Plan-Based Awards” table below. |
Elements of Compensation
The following table sets forth the key elements of our NEOs’ compensation, along with the primary objectives associated with each element of compensation:
| Compensation Element |
Primary Objective | |
| Base salary | To recognize performance of job responsibilities, provide stable income and attract and retain experienced individuals with superior talent. | |
| Annual incentive compensation | To promote achievement of short-term performance objectives and reward individual contributions to their completion. | |
| Long-term equity incentive awards | To encourage decision-making keyed to long-term performance, align the interests of our NEOs with the interests of our shareholders, encourage the maximization of shareholder value and retain key executives. | |
| Severance and change in control benefits | To encourage the continued attention and dedication of our NEOs and provide reasonable individual security to enable our NEOs to focus on our best interests, particularly when considering strategic alternatives. | |
157
Table of Contents
| Compensation Element |
Primary Objective | |
| Retirement savings (401(k) plan) | To provide an opportunity for tax-efficient savings and with the added economic incentive of employer matching contributions. | |
| Other elements of compensation and perquisites | To attract and retain talented executives in a cost-efficient manner by providing benefits with perceived values that exceed their cost. | |
To serve the foregoing objectives, our overall compensation program is generally designed to be flexible rather than purely formulaic. In alignment with the objectives set forth above, the Company’s Compensation Committee (the “Compensation Committee”) and our Board have generally determined the overall compensation of our NEOs and its allocation among the elements described above, relying on the analyses and advice provided by the Compensation Committee’s compensation consultant. The Compensation Committee has generally made these determinations in executive sessions without our management team present, but has also sought input from our Chief Executive Officer with regard to individual NEO performance and compensation besides his own.
Our compensation decisions for our NEOs with respect to 2014 are discussed in detail below. This discussion is intended to be read in conjunction with the executive compensation tables and related disclosures that follow this Compensation Discussion and Analysis.
Compensation Program Objectives
The following discussion and analysis describes our compensation objectives and policies for each of our NEOs for 2014, who consisted of:
| • | Keith B. Forman, Chief Executive Officer; |
| • | D. Hunt Ramsbottom, former Chief Executive Officer; |
| • | Dan J. Cohrs, Executive Vice President and Chief Financial Officer; |
| • | Sean Ebnet, Senior Vice President – Wood Fibre; |
| • | Colin M. Morris, Senior Vice President, General Counsel and Secretary; and |
| • | Jeffrey R. Spain, Senior Vice President, Finance, Accounting & Administration of Wood Fibre. |
During fiscal year 2014, Mr. Ramsbottom served as our Chief Executive Officer and President through December 9, 2014, and Mr. Forman served as our Chief Executive Officer and President from December 9, 2014 through December 31, 2014.
To succeed in achieving our key operational goals, we need to recruit and retain a highly talented and seasoned team of executive, technical, sales, marketing, operations, financial and other business professionals. As such, our compensation packages are designed to incentivize the achievement of these goals, and to recruit, reward and retain our employees, including our NEOs.
We have focused on building an experienced management team that is capable of managing our day-to-day operations during a period of growth while working to achieve our long-term operational goals. We believe it is important both to retain our key executives, including our NEOs, and to recruit the additional talent we need to expand the Company and attain our organizational objectives. Accordingly, our policy is to hire executives who are not only highly qualified for their positions at our current size, but who also have the skills we believe are necessary to perform their roles at the same high standard if we are successful in our commercial development, and we achieve significantly greater size and complexity.
Each of the key elements of our executive compensation program is discussed in more detail below under “—Core Components of Executive Compensation.”
Compensation Consultant
During 2014, the Compensation Committee engaged Frederic W. Cook & Co., Inc. (“Cook”), as an independent compensation consultant to analyze our existing executive compensation programs, assist with the design of future compensation programs that more closely align our executive officers’ interests with those of our stockholders, and ensure that the levels and types of compensation provided to our executives (including our NEOs) and directors continue to reflect market practices. Cook also assisted our Board and Compensation Committee in creating a compensation package for Mr. Forman when he was hired as our new Chief Executive Officer in December 2014. Cook serves at the discretion of the Compensation Committee and Cook may be terminated by the Compensation
158
Table of Contents
Committee in its discretion. The Compensation Committee has assessed the independence of Cook pursuant to the rules prescribed by the SEC and has concluded that no conflict of interest existed in 2014 or currently exists that would prevent Cook from serving as an independent consultant to the Compensation Committee.
Services Provided With Respect to 2014 Compensation
Services provided by Cook in 2014 included the following:
| • | Analyzing our peer group companies and advising on appropriate changes to such companies so that they align with our business mix and size; |
| • | Reviewing and analyzing officer and non-employee director compensation data and providing analysis with regard to the amounts of such compensation, its alignment with performance, and its consistency with good governance practice; |
| • | Analyzing our compensation components, and incentive designs, to calibrate the compensation opportunities of directors and officers relative to our peer group companies; and |
| • | Advising our Board and the Compensation Committee on the compensation package for the Company’s new Chief Executive Officer. |
Comparison to Market Practices
The Compensation Committee provides levels and elements of executive compensation, including base salaries, target annual incentives as a percentage of salary, total cash compensation, long-term incentives and total direct compensation, based on information gathered from the public filings of our peer group companies as well as industry-specific published survey data (discussed in more detail below).
From September 2013 through June 2014, our peer group was comprised of companies selected in 2013 based on discussions among the members of the Compensation Committee, certain of our executive officers and Cook (the “2013 Peer Group”). In June 2014, the Compensation Committee, certain of our executive officers and Cook reviewed and discussed the composition of the 2013 Peer Group. The discussions considered the manner in which the Company’s business had changed since the 2013 Peer Group was constructed. Based on these discussions, changes were made to our peer group in order to (i) remove nine companies that were no longer appropriate to our peer group based on size, industry and/or market value, and (ii) add nine companies that are more similar to us in terms of industry, revenue and market value. In general, the peers removed were more closely aligned with our alternative energy technologies, a discontinued component of our business, By contrast, the peers added tended to focus on wood-related and paper-related lines of business, which comprise an increasing component of our business. We refer to our current peer group (after giving effect to the changes discussed above) as the “ 2014 Peer Group.”
Our 2013 Peer Group consisted of alternative energy, energy, energy technology, chemical, fertilizer and wood fiber companies, in each case, with (i) annual revenues ranging from $160 million to $1.3 billion and (ii) market values ranging from $170 million to $2.0 billion at the time the peer group was selected. Following are the companies that comprise our 2013 Peer Group:
| ADA-ES, Inc. | KapStone Paper | |
| Advanced Energy Industries | LSB Industries | |
| American Vanguard Corp. | Maxwell Technologies | |
| Balchem Corp. | Minerals Technologies | |
| Clean Energy Fuels Corp. | Neenah Paper | |
| EnerNoc Inc. | Penford Corp. | |
| FutureFuel | REX American Resources | |
| Hawkins Inc. | Wausau Paper | |
| Intrepid Potash | Zoltek |
Our 2014 Peer Group consists of energy, energy technology, chemical, fertilizer and wood fiber companies, in each case, with (i) annual revenues ranging from approximately $265 million to $2.2 billion and (ii) market values ranging from approximately $170 million to $2.9 billion at the time the peer group was selected. Following are the companies that comprise our 2014 Peer Group:
| American Vanguard Corp. | Landec | |
| Arabian Amer. Dev | Minerals Technologies | |
| Balchem Corp. | Neenah Paper | |
| Hawkins Inc. | OMNOVA Sltns | |
| Intrepid Potash | P.H. Glatfelter | |
| KapStone Paper | Penford Corp. | |
| KMG Chemicals | Schweitzer-Mauduit | |
| Koppers Holdings | Wausua Paper | |
| Kronos WW | Zep |
159
Table of Contents
In September 2014, the Compensation Committee conducted a review of compensation data provided by Cook with regard to the levels and types of compensation provided to our NEOs (other than Mr. Forman who was hired by us in December 2014). The information provided by Cook included data gathered from the public filings of our 2014 Peer Group (instead of our 2013 Peer Group). The Compensation Committee considered this data when determining the final incentive awards earned by our NEOs for 2014 under our annual incentive compensation programs and the levels and types of equity awards granted to our NEOs during 2014. We expect to continue to use our New 2014 Peer Group for purposes of assessing our compensation programs through at least 2015.
During its 2014 review, the Compensation Committee reviewed the compensation of our NEOs relative to the 2014 Peer Group with respect to total compensation and for individual components of compensation and determined it was within the desired market range and in line with our compensation philosophy. The study provided by Cook to the Committee found that target total annual cash, which is the sum of base salaries and target bonus opportunities, was generally below the median of similarly situated executives in our 2014 Peer Group companies, including for our former CEO. Our new CEO’s 2015 target annual cash compensation opportunity is the lowest of the CEOs in the Peer Group. A comparison of 2014 long-term equity incentives showed (i) above-median equity award levels for our NEOs (with respect to the 2014 Peer Group), and (ii) that our NEOs’ December 2014 annual awards were weighted considerably more toward performance-based vesting than the equity awards granted to similarly-situated executives of our 2014 Peer Group (i.e., 60% of long-term incentives at Rentech versus about 30% for peer company officers on average). Equity compensation grant values were approximately 45%-50% lower in 2014 than in 2013 for our NEOs (excluding our new CEO Mr. Forman). Resulting target total direct compensation values were, on average, near the median for our NEOs (excluding our new CEO) and was about 10%-15% lower than in 2013.
Core Components of Executive Compensation
Through the Compensation Committee, we design the principal components of our executive compensation program to fulfill one or more of the principles and objectives described above. Compensation of our NEOs consists of the following elements:
| • | Cash compensation comprised of base salary and annual cash incentive compensation; |
| • | Equity incentive compensation; |
| • | Certain severance and change in control benefits; |
| • | Health and welfare benefits and certain limited perquisites and other personal benefits; and |
| • | Retirement savings (401(k)) plan. |
We view each component of our executive compensation program as related but distinct, and we have historically reassessed the total compensation of our NEOs periodically to ensure that overall compensation objectives are met. In addition, in determining the appropriate level for each compensation component, we have considered, but not exclusively relied on, our understanding of the competitive market based on the collective experience of members of the Compensation Committee (and our Chief Executive Officer with regard to the other NEOs), our recruiting and retention goals, our view of internal equity and consistency, the length of service of our executives, our overall financial and operational performance and other relevant considerations.
We have not adopted any formal or informal policies or guidelines for allocating compensation between currently-paid and long-term compensation, between cash and non-cash compensation, or among different forms of non-cash compensation. Generally, we offer a competitive, but balanced, total compensation package that provides the stability of a competitive, fixed income while affording our executives the opportunity to be appropriately rewarded through cash and equity incentives if we attain our goals and perform well over time. However, we are increasingly using performance-based metrics to incentivize our employees and specifically our NEOs.
Each of the primary elements of our executive compensation program is discussed in more detail below. While we have identified particular compensation objectives that each element of executive compensation serves, our compensation programs are intended to be flexible and complementary and to collectively serve all of the executive compensation objectives described above. Accordingly, whether or not specifically mentioned below, we believe that, as a part of our overall executive compensation policy, each individual element, to a greater or lesser extent, serves each of our compensation objectives.
160
Table of Contents
Cash Compensation
We provide our NEOs with cash compensation in the form of base salaries and annual cash incentive awards. Our cash compensation is structured to provide a market-level base salary for our NEOs while creating an opportunity to exceed market levels for total cash compensation if short- and long-term performance exceeds expectations. We believe that this mix appropriately combines the stability of non-variable compensation (in the form of base salary) with variable performance awards (in the form of annual cash incentives) that reward the performance of the Company and individual contributions to the success of the business.
Base Salary
Base salaries for our NEOs were initially set in arm’s-length negotiations during the hiring processes. These base salaries have historically been reviewed annually by the Compensation Committee (with input from our Chief Executive Officer with respect to the other NEOs) and were again reviewed at the end of 2014 for purposes of determining 2015 salaries. Our NEOs are not entitled to any contractual or other formulaic base salary increases. The Compensation Committee determined not to increase our NEOs’ base salaries for 2015. Mr. Forman’s base salary was set in December in connection with his hiring as our Chief Executive Officer and was, at the time Mr. Forman became our Chief Executive Officer, the lowest salary of any CEO in our 2014 Peer Group.
The annual base salary rates for our NEOs during fiscal year 2014 are set forth in the following table:
| Name |
Base Salary ($) | |||
| Keith B. Forman |
200,000 | |||
| D. Hunt Ramsbottom |
650,000 | |||
| Dan J. Cohrs |
464,000 | |||
| Sean Ebnet |
295,000 | |||
| Colin M. Morris |
315,000 | |||
| Jeffrey R. Spain |
291,346 | |||
Annual Incentive Compensation
We maintain an annual incentive program to reward executive officers, including our NEOs, based on our financial and operational performance, achievement of specific milestones related to operation and expansion of our businesses, financing and project development work, and the individual NEO’s relative contributions to the Company’s performance during the year (referred to below as the our “annual incentive program”). We recognize that successful completion of short-term objectives is critical in achieving our planned level of growth and attaining our long-term business objectives. Accordingly, our annual incentive program is designed to reward executives for successfully taking the immediate steps necessary to implement our long-term business strategy.
Annual Incentive Program
During 2014, each of our NEOs (excluding Mr. Forman, whose employment with us commenced in December 2014) was eligible to receive an incentive payment pursuant to our annual incentive program. Under our annual incentive program, cash incentives were determined and paid by reference to (i) the achievement of certain pre-established operational and financial goals and commercial and project development criteria, and (ii) target bonus amounts (as set forth in the NEOs’ respective employment agreements). The goals are weighted based on importance for the year. In the beginning of 2014, as in prior fiscal years, our CEO and other senior officers developed a series of broad objectives for us, which were then reviewed and revised by the Compensation Committee and our Board. Following that review, our Board set the 2014 performance goals for our annual incentive program, but retained discretion based on input from the Compensation Committee (and our Chief Executive Officer with respect to the other NEOs) to increase or decrease annual incentive award payouts to levels as high as 200% of the NEO’s target bonus and as low as zero, in each case, based on performance during the relevant period. The goals were designed to be challenging with no guarantee that any portion of the target award would actually be earned. The 2014 annual incentive awards were targeted for Messrs. Cohrs, Ebnet, Morris and Spain at 60%, 50%, 50% and 40% of their respective base salaries (in accordance with their respective employment agreements where applicable). Mr. Ramsbottom’s 2014 annual incentive award was targeted at 100% of his base salary (in accordance with his employment agreement); however, he was not eligible to receive an annual incentive award payment for 2014 because his employment ceased prior to the end of fiscal year 2014. Payment of annual incentive awards to our NEOs was based on the achievement by us of the specific targets and goals set forth below for the applicable annual incentive program, as well as the performance of the individual executive (and was subject to adjustment as described above). Mr. Forman was not eligible to participate in our 2014 annual incentive program and is not eligible to participate in our 2015 annual incentive program; instead, his incentive compensation consists primarily of performance-based long-term equity incentives.
161
Table of Contents
Annual Incentive Program Performance Goals
The 2014 performance goals applicable to our NEOs (excluding Mr. Forman) under our annual incentive program are set forth below, along with determinations as to the attainment of these goals (parentheticals following the description of each goal provide guidelines indicating the approximate weight given to the attainment of each goal).
| 1. | Goal: Environmental, Health, Safety & Sustainability, or EHS&S, goals, including: |
| • | A continued strong safety record at Rentech’s facilities, including RNP’s facilities, with an OSHA recordable rate below a target rate of 3.5 and fewer than 6.0 reportable environmental release events.* |
Result: Goal not attained. Safety performance was strong during 2014, with an OSHA recordable rate of 2.94 recordable incidents for every 200,000 hours worked at Rentech facilities in fiscal year 2014; however, the Company experienced 6 reportable environmental release events.
| • | Completion of mandated EHS&S training.* |
Result: Goal attained. We completed all required training.
| • | Completion of 80% or more of EHS&S process review action items.* |
Result: Goal attained. We completed required process review action items.
| * | These Goals are not weighted in arriving at the initial award amounts under the annual incentive program, but failure to attain these Goals can result in a reduction of the final pool by up to 20%. |
| 2. | Goal: Operations goals, including: |
| • | Total ammonia production ranging from 350,000 tons to 380,000 tons, targeted at 370,000 tons (5% weight). |
Result: Goal not attained. Total ammonia production for the fiscal year ending December 31, 2014 equaled 327,000 tons.
| • | Total ammonium sulfate production ranging from 640,000 tons to 695,000 tons, targeted at 675,000 tons (5% weight). |
Result: Goal not attained. Total ammonium sulfate production for the fiscal year ending December 31, 2014 equaled 522,000 tons.
| 3. | Goal: Financial achievements, including: |
| • | RNP EBITDA ranging from $100.0 million to $128.0 million, targeted at $102.0 million (10% weight). |
Result: Goal not attained. RNP EBITDA for the year ended December 31, 2014 equaled $65.0 million.
| • | EBITDA for our wood fibre business ranging from $16.0 million to $23.0 million, targeted at $17.0 million (5% weight). |
Result: Goal not attained. EBITDA for our wood fibre business for the year ended December 31, 2014 equaled $3.0 million.
| • | Unallocated corporate S, G&A expense ranging from $21.0 million to $24.6 million (5% weight). |
Result: Goal not attained. Unallocated S,G&A expense for the year ended December 31, 2014 equaled $25.0 million.
| • | Raise capital for our wood fibre business ranging from $60.0 million to $70.0 million, targeted at $65.0 million (5% weight). |
Result: Goal attained. Capital of $100.0 million was raised for our wood fibre business during the year ended December 31, 2014.
| 4. | Goal: Technology achievements, including: |
| • | Close deal to sell alternative energy technologies in a timeframe that results in the achievement of certain EBITDA targets, and the completion of certain milestones towards the first performance payment (5% weight). |
Result: Goal not attained. Alternative energy technologies were sold, but EBITDA targets and performance milestones were not achieved.
| 5. | Goal: Commercial achievements, including: |
| • | Produce wood pellets by summer of 2014 (10% weight). |
Result: Goal not attained. Wood pellets not produced by summer of 2014.
162
Table of Contents
| • | Complete the construction of two wood pellet plants on budget (10% weight). |
Result: Goal not attained. Final construction costs will exceed budget.
| • | Increase production at two wood pellet plants by December 2014 (10% weight). |
Result: Goal not attained. Production was not increased by December 2014.
| • | Complete acquisitions, projects and/or partnerships, including all necessary material definitive agreements, that lead to a wood processing business with a certain annualized run rate (10% weight). |
Result: Goal attained. The Atikokan and Wawa wood pellet plants and the acquisition of New England Wood Pellet, LLC achieved this goal.
| 6. | Goal: Other factors which contribute to the success of Rentech as determined by Rentech’s Compensation Committee and board of directors (20% weight). |
Result: The Compensation Committee did not exercise its discretion to take into account any additional factors which contributed to Rentech’s success or adjust the results of the performance goals.
Final incentive payments for our NEOs were determined by the Compensation Committee based on our performance compared to the set goals under the annual incentive program. Messrs. Cohrs, Ebnet, Morris and Spain received 2014 annual incentive payments equal to approximately 15% of their respective target bonuses based on the performance results described above (or 9%, 8%, 8% and 6% of their respective base salaries). These payments were determined based on the achievement of the formulaic goals set forth above for each NEO with no bonus adjustment based on individual assessment.
Long-Term Equity Incentive Awards
The Compensation Committee and our Board believe that senior executives, including our NEOs, should have an ongoing stake in the success of their employer to closely align their interests with those of its shareholders. The Compensation Committee also believes that equity awards provide meaningful retention and performance incentives that appropriately encourage our executive officers, including our NEOs, to remain employed with us and put forth their best efforts and performance at all times. Accordingly, long-term equity incentive awards covering shares of our common stock have historically been a key component of our compensation program, including during 2014, as these awards create an ownership stake for management that aligns the interests of our NEOs with those of our shareholders and incentivize our NEOs to work toward increasing value for our shareholders. During 2014, we granted equity awards to our NEOs (excluding Messrs. Ramsbottom and Forman) under our 2009 Incentive Award Plan. In addition, RNP granted awards under its 2011 Long-Term Incentive Plan to Messrs. Cohrs, Morris and Spain.
In December 2014, in connection with Mr. Forman’s commencement of employment with us, we granted Mr. Forman a nonqualified stock option and an award of performance-vesting restricted stock units. These awards were provided as an inducement to Mr. Forman’s commencement of employment with us and were granted outside of our 2009 Incentive Award Plan in accordance with applicable stock exchange rules. The aggregate value of Mr. Forman’s 2014 equity awards was above the median of the 2014 Peer Group to compensate for his significantly below-median cash compensation levels in a way that promotes alignment of the CEO’s interests with those of shareholders. However, his total compensation remained below the median of the total compensation of 2014 Peer Group CEOs.
During 2014, in order to promote the share ownership, performance and retention goals described above, we granted performance-vesting restricted stock units (“PSUs”) to our NEOs (except for Mr. Ramsbottom) and, with respect to Mr. Forman only, nonqualified stock options, and RNP granted awards of time-vesting RNP phantom units to Messrs. Cohrs, Morris and Spain. Each PSU and phantom unit confers upon its holder the right to receive one share of our common stock or, in the case of phantom units, one common unit of RNP without payment if such awards vests. Awards were granted at the end of 2014 in order to allow the amounts to be calibrated to reflect total shareholder return performance during the year and performance versus internal goals.
Mr. Ramsbottom’s employment ceased before we and RNP granted equity awards to our and its respective executive officers in respect of 2014 services. Accordingly, Mr. Ramsbottom did not receive grants of equity awards from us or from RNP in respect of his services during 2014. All of our other NEOs, except Mr. Forman, received 100% of their Company equity awards in the form of PSUs which are only earned upon the achievement of challenging future TSR performance criteria. Mr. Forman received approximately 70% of his equity in the form of PSUs and approximately 30% in the form of time-vested stock options. In addition, Messrs. Cohrs, Morris and Spain received time-vested RNP phantom units, which we believe puts a shareholder-oriented emphasis on the shareholder return improvement before NEOs’ awards are earned and paid. The study of peer practice provided by Cook shows that the Company’s mix of performance-based awards to time-based awards is significantly more performance-based than awards granted to the average New 2014 Peer Group company executive officers, which is approximately 45% performance-based and 55% time-based.
163
Table of Contents
Options
The stock option granted to Mr. Forman in 2014 vests and becomes exercisable with respect to one-fourth of the shares subject thereto on the first anniversary of the vesting commencement date, and with respect to one-forty-eighth of the shares subject thereto on each monthly anniversary of the vesting commencement date thereafter, subject to Mr. Forman’s continued service through the applicable vesting date. The stock option is subject to “double trigger” accelerated vesting in full upon a termination of Mr. Forman’s employment with us without “cause” or for “good reason’ (each such term as defined in Mr. Forman’s employment agreement with us), in either case, within two years following a change in control. Any such accelerated vesting is subject to Mr. Forman’s execution and non-revocation of a general release of claims.
PSUs
The PSUs granted to our NEOs (other than Mr. Ramsbottom) in 2014 require both continued service and the attainment of challenging TSR performance criteria as conditions to vesting, thereby providing both retention and enhanced performance incentives. Specifically, the PSUs confer upon the NEOs the right to receive a number of stock-settled PSUs determined based on our TSR over a four-year period commencing on December 14, 2014 or, with respect to Mr. Forman, December 9, 2014 (in either case, the “Vesting Commencement Date”). PSUs are subject to threshold vesting upon the attainment of TSR of at least 50% during the performance period, and are forfeited if this threshold TSR level is not attained. Payout of PSUs at target level requires attainment of TSR of at least 100% during the four-year performance period, and PSUs provide for a maximum payout upon TSR attainment of at least 200% during the performance period.
Each PSU also confers upon its holder the right to dividend equivalent payments for dividends declared over the portion of the performance period during which such PSU is outstanding; however, such dividends are payable only if and when the underlying PSUs vests following TSR achievement (i.e., accumulated dividends are forfeited if the underlying PSUs are not earned based on actual TSR performance). The Compensation Committee determined to grant PSUs that vest based on our TSR achievement because it believes that long-term TSR is a key measure of our performance for our shareholders.
For purposes of the PSUs, TSR is generally calculated as the per share increase in value equal to the sum of (i) our per share stock price increase, with stock price generally calculated as the trailing thirty trading-day stock price average through the date on which TSR is measured (or, if the applicable measurement date is the date on which a change in control of us occurs, the per share change in control transaction proceeds), plus (ii) our aggregate per share dividends, in each case, over the performance period (or relevant portion thereof).
Generally, an amount ranging from (i) 0% to 100% of the target PSUs are eligible to vest on the second anniversary of the Vesting Commencement Date and (ii) 0% to 200% of the target PSUs are eligible to vest on each of third and fourth anniversaries of the Vesting Commencement Date and any date on which a change in control occurs prior to the fourth anniversary of the Vesting Commencement Date, in each case, based on our per share TSR (and the executive’s continued service) through the applicable anniversary or date on which the change in control occurs (each such date, a “measurement date”). The number of PSUs that actually vest on each measurement date is determined based on our per share TSR from the date of grant through the applicable measurement date. With respect to the measurement date occurring on the second anniversary of the Vesting Commencement Date (the “year 2 measurement date”), 100% of the target PSUs will vest upon our attainment of per share TSR at the maximum level (e.g., upon the increase of our per share TSR by 200% through the year 2 measurement date), and zero PSUs will vest if per share TSR is attained at less than the maximum level. The table below (the “PSU Vesting Table”) sets forth the percentage of target PSUs that will vest on the measurement dates occurring on the third and fourth anniversaries of the Vesting Commencement Date (the “year 3 measurement date” and “year 4 measurement date,” respectively) at the threshold, target and maximum levels (e.g., upon the increase of our per share TSR by 50%, 100% and 200%, respectively, through the applicable measurement date):
| TSR at Measurement Date |
Percent of Target PSUs Earned and Vested | |
| TSR increase is less than 50%: |
Zero PSUs | |
| TSR increase equals or exceeds 50%: |
50% of Target PSUs | |
| TSR increase equals or exceeds 100%: |
100% of Target PSUs | |
| TSR increase equals or exceeds 200%: |
200% of Target PSUs |
If we achieve an increase in per share TSR between the achievement levels specified in the above table, then the number of PSUs that will vest on the applicable measurement date will be determined based on straight-line interpolation between the applicable attainment levels.
164
Table of Contents
PSUs will be paid to our NEOs in shares of our stock as and when they are earned and vest, subject to the executive’s continued service through the applicable measurement date. Dividend equivalents that become payable with respect to earned and vested PSUs will generally be paid in cash upon or shortly after vesting of the underlying PSU to which such dividend equivalents relate (only if and when the underlying PSU ultimately vests).
RNP Phantom Units.
During 2014, RNP also granted phantom units, which include distribution equivalent rights for dividends paid by RNP, to each of Messrs. Cohrs, Morris and Spain under its 2011 Long-Term Incentive Plan to compensate these executives for their services as officers of RNP, which is a separate publicly traded fertilizer master limited partnership in which Rentech owns a 59.7% equity stake, and to create incentives aligned with the interests of the unit holders of RNP. These RNP units were considered part of each officer’s total compensation package by the Compensation Committee. The values of these phantom units are included in the figures and tables reported herein. These phantom units vest in annual installments over a three-year period, subject to continued service through the applicable vesting date and, like our equity awards, are intended to provide retention incentives linked to equity value and to encourage equity ownership in order to align the interests of these executives with those of RNP’s unit holders (including the Company). For more information on these phantom unit awards, please see RNP’s Annual Report on Form 10-K for the fiscal year ended December 31, 2014, filed with the SEC on March 16, 2015.
The 2014 PSUs, options and phantom units are subject to accelerated vesting in certain circumstances as described under “—Potential Payments upon Termination or Change-in-Control” below. We believe that the applicable vesting periods provide an important retention incentive, while accelerated vesting (where appropriate) protects executives against forfeiture of their awards in appropriate circumstances and aligns management’s incentives more closely with the interests of our shareholders.
2014 Awards Table
In determining appropriate levels of equity grants for 2014, we considered, among other things, the role(s) and responsibilities of each NEO and the perceived need to reward and retain the NEO. The table below sets forth the 2014 Awards that we and RNP granted to our NEOs during 2014. All grants were made on December 19, 2014, other than the grants to Mr. Forman, which were made on December 30, 2014 in connection with his commencement of employment as our CEO, and the grants of phantom units which were also made on December 30, 2014.
| Name |
Restricted Stock Units | Performance Stock Units(1) | Stock Options | Partnership Phantom Units | ||||||||||||
| Keith B. Forman |
— | 1,008,265 | 1,102,491 | — | ||||||||||||
| D. Hunt Ramsbottom |
— | — | — | — | ||||||||||||
| Dan J. Cohrs |
— | 300,297 | — | 7,554 | ||||||||||||
| Sean Ebnet |
— | 225,130 | — | — | ||||||||||||
| Colin Morris |
— | 184,798 | — | 4,648 | ||||||||||||
| Jeffrey R. Spain |
— | 70,664 | — | 1,877 | ||||||||||||
| (1) | Performance stock units reflect target amounts. |
The table below sets forth the grant date fair values of the 2014 equity awards that we and RNP granted to our NEOs during 2014.
| Grant Date Fair Value | ||||||||||||||||||||
| Name |
Restricted Stock Units |
Performance Stock Units |
Stock Options |
Partnership Phantom Units |
Total | |||||||||||||||
| Keith B. Forman |
$ | — | $ | 1,260,331 | $ | 582,115 | $ | — | $ | 1,842,446 | ||||||||||
| D. Hunt Ramsbottom |
$ | — | $ | — | $ | — | $ | — | $ | — | ||||||||||
| Dan J. Cohrs |
$ | — | $ | 366,362 | $ | — | $ | 74,331 | $ | 440,694 | ||||||||||
| Sean Ebnet |
$ | — | $ | 274,659 | $ | — | $ | — | $ | 274,659 | ||||||||||
| Colin Morris |
$ | — | $ | 225,454 | $ | — | $ | 45,736 | $ | 271,190 | ||||||||||
| Jeffrey R. Spain |
$ | — | $ | 86,210 | $ | — | $ | 18,470 | $ | 104,680 | ||||||||||
165
Table of Contents
Employment Contracts; Severance Benefits
We believe that vulnerability to termination of employment at the senior executive level, both within and outside of the change in control context, creates concern and uncertainty for our NEOs that is appropriately addressed by providing severance protections which enable and encourage these executives to focus their attention on their work duties and responsibilities in all situations. We operate in a volatile and acquisitive industry that heightens this vulnerability in the change-in-control context. Accordingly, in order to attract and retain our key managerial talent, we enter into employment agreements with certain of our NEOs which provide for specified severance payments and benefits in connection with certain qualifying terminations of employment. In addition, we believe that change in control and severance benefits are essential in order to fulfill our objective of attracting and retaining key managerial talent. We are party to employment agreements with each of Messrs. Forman, Cohrs, Ebnet and Morris. Mr. Spain does not have an employment agreement with us. For a description of the specific terms and conditions of each agreement, see “—Narrative Disclosure to Summary Compensation Table and Grants of Plan-Based Awards Table” and “—Potential Payments upon Termination or Change-in-Control” below.
Benefits and Perquisites
We maintain a standard complement of health and retirement benefit plans for our employees, including our NEOs, that provide medical, dental, and vision benefits, flexible spending accounts, a 401(k) savings plan (including an employer-match component), short-term and long-term disability insurance, accidental death and dismemberment insurance and life insurance coverage. These benefits are generally provided to our NEOs on the same terms and conditions as they are provided to our other employees. We believe that these health and retirement benefits comprise key elements of a comprehensive compensation program. Our health benefits help provide stability and peace of mind to our NEOs, thus enabling them to better focus on their work responsibilities, while our 401(k) plan provides a vehicle for tax-preferred retirement savings with additional compensation in the form of an employer match that adds to the overall desirability of our executive compensation package. Our employee benefits programs are designed to be affordable and competitive in relation to the market, as well as compliant with applicable laws and practices. We periodically review and adjust these employee benefits programs as needed based upon regular monitoring of applicable laws and practices in the competitive market.
As part of the compensation package, we also provide our NEOs (other than Mr. Forman) with a monthly car allowance and these executives (other than Messrs. Forman, Ebnet and Spain) also receive reimbursement of certain financial advisor costs. Messrs. Cohrs, Ebnet and Morris are also entitled to company-paid physical examinations. The purpose of these benefits and perquisites is to ensure that our NEOs are able to devote their full business time to our affairs, to project the proper corporate image for Rentech, and to make employment at Rentech attractive at a relatively modest cost for shareholders.
Tax and Accounting Considerations
Section 162(m) of the Internal Revenue Code
Generally, Section 162(m) of the Internal Revenue Code disallows a tax deduction to any publicly-held corporation for any individual remuneration in excess of $1 million paid in any taxable year to its chief executive officer and each of its other named executive officers, other than its chief financial officer. However, remuneration in excess of $1 million may be deducted if it qualifies as “performance-based compensation” within the meaning of the Internal Revenue Code.
Where reasonably practicable, to the extent that the Section 162(m) deduction disallowance becomes applicable to our NEOs, the Compensation Committee may seek to qualify the variable compensation paid to our NEOs for an exemption from such deductibility limitations. As such, in approving the amount and form of compensation for our NEOs, the Compensation Committee will consider all elements of the cost to us of providing such compensation, including the potential impact of Section 162(m) of the Internal Revenue Code. The Compensation Committee may, in its judgment, authorize compensation payments that do not comply with an exemption from the deductibility limit in Section 162(m) of the Internal Revenue Code, as it has under its 2014 annual incentive program, when it believes that such payments are appropriate to attract and retain executive talent.
Section 280G of the Internal Revenue Code
Section 280G of the Internal Revenue Code disallows a tax deduction with respect to excess parachute payments to certain executives of companies which undergo a change in control. In addition, Section 4999 of the Internal Revenue Code imposes a 20% excise tax on the individual with respect to the excess parachute payment. Parachute payments are compensation linked to or triggered by a change in control and may include, but are not limited to, bonus payments, severance payments, certain fringe benefits, and payments and acceleration of vesting from long-term incentive plans including stock options and other equity-based compensation. Excess parachute payments are parachute payments that exceed a threshold determined under Section 280G of the Internal Revenue Code based on the executive’s prior compensation. In approving compensation arrangements for our NEOs in the future, we expect to consider all elements of the cost of providing such compensation, including the potential impact of Section 280G of the Internal Revenue Code. However, we may authorize compensation arrangements that could give rise to loss of deductibility under Section 280G of the Internal Revenue Code and the imposition of excise taxes under Section 4999 of the Internal Revenue Code if we feel that such arrangements are appropriate to attract and retain executive talent.
166
Table of Contents
Under their employment agreements with us, which were not entered into or amended during 2014, Messrs. Cohrs and Morris are, and Mr. Ramsbottom was (prior to his cessation of employment with us) entitled to gross-up payments in the event that any excise taxes are imposed on them. We have historically provided these protections to these senior executives to ensure that they will be properly incentivized in the event of a potential change in control of the Company to maximize shareholder value in a transaction while minimizing concern for potential consequences of the transaction to these executives. The need for such protection is enhanced by our emphasis on performance-based equity compensation, which has higher values if accelerated in connection with a successful transaction than if the equity compensation awards had been time-vested. We have committed not to provide any new tax gross-up rights to any executives that do not currently have such protection.
Section 409A of the Internal Revenue Code
Section 409A of the Internal Revenue Code requires that “nonqualified deferred compensation” be deferred and paid under plans or arrangements that satisfy the requirements of the statute with respect to the timing of deferral elections, timing of payments and certain other matters. Failure to satisfy these requirements can expose employees and other service providers to accelerated income tax liabilities, substantial additional taxes and interest on their vested compensation under such plans. Accordingly, as a general matter, it is our intention to design and administer our compensation and benefit plans and arrangements for all of our employees and other service providers, including our NEOs, so that they are either exempt from, or satisfy the requirements of, Section 409A of the Internal Revenue Code.
Accounting for Stock-Based Compensation
We follow Financial Accounting Standards Board Accounting Standards Codification Topic 718, or ASC Topic 718, for stock-based compensation awards. ASC Topic 718 requires companies to calculate the grant date “fair value” of their stock-based awards using a variety of assumptions. ASC Topic 718 also requires companies to recognize the compensation cost of their stock-based awards in their income statements over the period that an employee is required to render service in exchange for the award. Grants of stock options, restricted stock, RSUs and other equity-based awards under equity incentive award plans have been and will be accounted for under ASC Topic 718. We expect that we will regularly consider the accounting implications of significant compensation decisions, especially in connection with decisions that relate to our equity incentive award plans and programs. As accounting standards change, we may revise certain programs to appropriately align accounting expenses of our equity awards with our overall executive compensation philosophy and objectives.
The Role of Our Shareholder Say-on-Pay Vote
At our annual meeting of shareholders held in July 2014, we provided our shareholders with the opportunity to cast an advisory vote on our executive compensation program, or a “say-on-pay proposal”. A significant majority of the votes cast on our say-on-pay proposal at that meeting (91%) were voted in favor of the proposal. The Compensation Committee believes this affirms our shareholders’ support of our approach to executive compensation, and, accordingly, did not materially change its approach to executive compensation during 2014 in connection with the say-on-pay proposal. However, the Compensation Committee is always open to improving the Company’s compensation governance practices and believes that increasing the amount of Company equity awards that are subject to performance-based vesting to 100% in 2014 and significantly reducing the cash compensation (and increasing the equity-based compensation) of our Chief Executive Officer provide meaningful improvements for shareholders. The Compensation Committee expects to take into consideration the outcome of our shareholders’ future say-on-pay proposal votes when making future compensation decisions for our NEOs. Our Board previously determined to hold a say-on-pay advisory vote on the compensation of our NEOs every three years. Accordingly, we expect that our next say-on-pay proposal will be submitted to shareholders for an advisory vote at our annual meeting of stockholders in 2017.
Compensation Committee Report
The Compensation Committee has reviewed and discussed with management the foregoing Compensation Discussion and Analysis and, based on such review and discussion, the Compensation Committee determined that the Compensation Discussion and Analysis should be included in this proxy statement.
Edward M. Stern, Chairman
Michael S. Burke
Halbert S. Washburn
167
Table of Contents
Summary Compensation Table
The following table summarizes the compensation for the calendar years ended December 31, 2014, 2013 and 2012 for each of our NEOs.
| Name and Principal Position |
Year | Salary ($) |
Bonus ($) |
Stock Awards ($)(1) |
Option Awards ($2) |
Non-Equity Incentive Plan Compensation ($)(3) |
All Other Compensation ($)(4) |
Total ($) |
||||||||||||||||||||||||
| Keith B. Forman, |
2014 | $ | 11,538 | $ | — | $ | 1,260,331 | $ | 582,115 | $ | — | $ | — | $ | 1,853,984 | |||||||||||||||||
| D. Hunt Ramsbottom, |
2014 | $ | 646,154 | $ | — | $ | — | $ | — | $ | — | $ | 57,269 | $ | 703,423 | |||||||||||||||||
| 2013 | $ | 550,000 | $ | — | $ | 1,218,717 | $ | — | $ | 440,000 | $ | 265,074 | $ | 2,473,791 | ||||||||||||||||||
| 2012 | $ | 497,200 | $ | — | $ | 1,398,708 | $ | — | $ | 932,250 | $ | 287,271 | $ | 3,115,429 | ||||||||||||||||||
| Dan J. Cohrs, |
2014 | $ | 463,462 | $ | — | $ | 440,694 | $ | — | $ | 41,760 | $ | 50,233 | $ | 996,149 | |||||||||||||||||
| 2013 | $ | 450,000 | $ | — | $ | 660,145 | $ | — | $ | 216,000 | $ | 169,549 | $ | 1,495,694 | ||||||||||||||||||
| 2012 | $ | 426,575 | $ | — | $ | 599,444 | $ | — | $ | 479,897 | $ | 201,171 | $ | 1,707,087 | ||||||||||||||||||
| Sean Ebnet, |
2014 | $ | 294,423 | $ | — | $ | 274,659 | $ | — | $ | 22,125 | $ | 74,771 | $ | 665,978 | |||||||||||||||||
| 2013 | $ | 266,250 | $ | 30,000 | $ | 856,240 | $ | — | $ | 106,960 | $ | 72,816 | $ | 1,332,266 | ||||||||||||||||||
| Colin M. Morris, |
2014 | $ | 314,423 | $ | — | $ | 271,190 | $ | — | $ | 23,625 | $ | 52,103 | $ | 661,341 | |||||||||||||||||
| 2013 | $ | 300,000 | $ | — | $ | 406,233 | $ | — | $ | 120,000 | $ | 114,228 | $ | 940,461 | ||||||||||||||||||
| 2012 | $ | 288,030 | $ | — | $ | 419,611 | $ | — | $ | 270,028 | $ | 151,555 | $ | 1,129,224 | ||||||||||||||||||
| Jeffrey R. Spain, |
2014 | $ | 290,941 | $ | — | $ | 104,680 | $ | — | $ | 17,481 | $ | 25,484 | $ | 438,586 | |||||||||||||||||
| (1) | Amounts disclosed for 2014 reflect the aggregate grant date fair value of the 2014 PSUs granted to our NEOs and, with respect to Messrs. Cohrs, Morris and Spain, the grant date fair value of 2014 RNP phantom units. All equity award values described in this Note have been calculated in accordance with ASC Topic 718, except for RNP phantom units calculated in accordance with ASC Topic 505. There can be no assurance that awards will vest or that the value upon vesting will approximate the aggregate grant date fair value determined under ASC Topic 718 or ASC Topic 505. We provide information regarding the assumptions used to calculate the value of all of our stock awards made to executive officers in Note 18 to our consolidated financial statements included in this Annual Report. RNP provides information regarding the assumptions used to calculate the value of all RNP unit awards made to executive officers in Note 12 to its consolidated financial statements included in Part II—Item 8 “Financial Statements and Supplementary Data” in its Annual Report on Form 10-K for the fiscal year ended December 31, 2014, filed with the SEC on March 16, 2015. |
| (2) | Mr. Forman received 2014 stock options with full grant-date fair values of $582,115, the value of which has been computed in accordance with ASC Topic 718. There can be no assurance that awards will vest or that the value upon vesting will approximate the aggregate grant date fair value determined under ASC Topic 718. We provide information regarding the assumptions used to calculate the value of all of our options granted to executive officers in Note 18 to our consolidated financial statements included in this Annual Report. |
| (3) | Each of our NEOs (excluding Mr. Forman) participated in our annual incentive program during 2014 and received an annual incentive award based on the achievement of certain financial and other performance criteria and determined by reference to target bonuses set forth in their respective employment agreements. Messrs. Cohrs, Ebnet, Morris and Spain received 2014 annual incentive payments equal to approximately 15% of their respective target bonuses (or 9%, 8%, 8% and 6% of their respective base salaries). Mr. Ramsbottom, whose employment ceased in December 2014, was not eligible to receive an annual incentive payment for 2014. For additional information, please see “Annual Incentive Compensation” above. |
| (4) | Amounts under the “All Other Compensation” column for the year ended December 31, 2014 consist of (i) 401(k) matching contributions of $8,791, $10,344, $11,289, $10,789 and $10,385 for Messrs. Ramsbottom, Cohrs, Ebnet, Morris and Spain, respectively; (ii) perquisites consisting of company-paid auto allowances, company-paid health evaluations, long-term disability and supplemental life insurance, housing allowance and financial and tax planning benefits; and (iii) payments made to Messrs. Ramsbottom, Cohrs, Morris and Spain of $8,364, $4,845, $3,377 and $2,031, respectively, with respect to their outstanding phantom units as a result of RNP’s declaration of cash distributions during 2014, as described in RNP’s Annual Report on Form 10-K for the fiscal year ended December 31, 2014, filed with the SEC on March 16, 2015. The following table identifies and quantifies our NEOs’ perquisites for the calendar year 2014. |
168
Table of Contents
Perquisites
| Name |
Auto Allowance |
Health Evaluations |
Long-Term Disability and Life Insurance |
Housing Allowance |
Financial and Tax Planning |
Total | ||||||||||||||||||
| Keith B. Forman |
— | — | — | — | — | — | ||||||||||||||||||
| D. Hunt Ramsbottom |
13,846 | 3,252 | 1,027 | — | 21,989 | 40,114 | ||||||||||||||||||
| Dan J. Cohrs |
12,000 | — | 1,068 | — | 21,976 | 35,044 | ||||||||||||||||||
| Sean Ebnet |
12,000 | 2,414 | 1,068 | 48,000 | — | 63,482 | ||||||||||||||||||
| Colin Morris |
12,000 | 2,831 | 1,068 | — | 22,038 | 37,937 | ||||||||||||||||||
| Jeffrey R. Spain |
12,000 | — | 1,068 | — | — | 13,068 | ||||||||||||||||||
| (5) | Mr. Forman was appointed as our chief executive officer and president and as chief executive officer of the general partner of RNP effective December 9, 2014. |
| (6) | Effective December 9, 2014, Mr. Ramsbottom ceased to serve as the chief executive officer and president of Rentech and chief executive officer of the general partner of RNP. Mr. Ramsbottom also resigned as a member of the board of directors for both companies, effective December 9, 2014. |
| (7) | Since RNP’s initial public offering in 2011, Messrs. Ramsbottom, Cohrs, Morris and Spain have dedicated a portion of their work time to RNP’s business and affairs. The portion of the compensation included in the Summary Compensation Table with respect to Messrs. Ramsbottom and Cohrs which is allocable to RNP is disclosed in RNP’s Annual Report on Form 10-K for the fiscal year ended December 31, 2014, filed with the SEC on March 16, 2015. In accordance with applicable SEC disclosure rules, the compensation figures attributable to Messrs. Ramsbottom, Cohrs, Morris and Spain in this Summary Compensation Table reflect the full amount of the compensation paid by both Rentech and RNP. The estimated percentage of time allocable to RNP for Messrs. Ramsbottom, Cohrs, Morris and Spain during calendar year 2014 were 45%, 35%, 24% and 24%, respectively. |
169
Table of Contents
Grants of Plan-Based Awards
The following table sets forth information with respect to our NEOs concerning the grant of plan-based awards from our and RNP’s plans during 2014.
| Estimated Possible Payouts Under Non-Equity Incentive Plan Awards |
Estimated Future Payouts Under Equity Incentive Plan Awards |
All Other Stock Awards: Number of Shares of Stock |
All Other Option Awards: Number of Securities Underlying |
Exercise or Base Price of Option |
Grant Date Fair Value of Stock and Option |
|||||||||||||||||||||||||||||||||||||
| Name |
Grant Date |
Threshold ($) |
Target ($) |
Maximum ($) |
Threshold (#) |
Target (#) |
Maximum (#) |
or Units (#)(1)(2) |
Options (#) |
Awards ($/Sh) |
Awards ($)(1)(2) |
|||||||||||||||||||||||||||||||
| Keith B. Forman(7) |
12/30/2014 | — | — | — | — | — | — | — | 1,102,491 | (3) | $ | 1.24 | $ | 582,115 | ||||||||||||||||||||||||||||
| 12/30/2014 | — | — | — | 504,133 | 1,008,265 | 2,016,530 | — | — | — | $ | 1,260,331 | (4) | ||||||||||||||||||||||||||||||
| D. Hunt Ramsbottom |
2014 Annual Non-Equity Incentive | $ | — | $ | 650,000 | $ | 1,300,000 | — | — | — | — | — | — | — | ||||||||||||||||||||||||||||
| Dan J. Cohrs |
12/19/2014 | — | — | — | 150,149 | 300,297 | 600,594 | — | — | — | $ | 366,362 | (5) | |||||||||||||||||||||||||||||
| 12/30/2014 | — | — | — | — | — | — | 7,554 | (6) | — | — | $ | 74,331 | ||||||||||||||||||||||||||||||
| 2014 Annual Non-Equity Incentive | $ | — | $ | 278,400 | $ | 556,800 | — | — | — | — | — | — | — | |||||||||||||||||||||||||||||
| Sean Ebnet |
12/19/2014 | — | — | — | 112,565 | 225,130 | 450,260 | — | — | — | $ | 274,659 | (5) | |||||||||||||||||||||||||||||
| 2014 Annual Non- Equity Incentive | $ | — | $ | 147,500 | $ | 295,000 | — | — | — | — | — | — | — | |||||||||||||||||||||||||||||
| Colin M. Morris |
12/19/2014 | — | — | — | 92,399 | 184,798 | 369,596 | — | — | — | $ | 225,454 | (5) | |||||||||||||||||||||||||||||
| 12/30/2014 | — | — | — | — | — | — | 4,648 | (6) | — | — | $ | 45,736 | ||||||||||||||||||||||||||||||
| 2014 Annual Non- Equity Incentive | $ | — | $ | 157,500 | $ | 315,000 | — | — | — | — | — | — | — | |||||||||||||||||||||||||||||
| Jeffrey R. Spain |
12/19/2014 | — | — | — | 35,332 | 70,664 | 141,328 | — | — | — | $ | 86,210 | (5) | |||||||||||||||||||||||||||||
| 12/30/2014 | — | — | — | — | — | — | 1,877 | (6) | — | — | $ | 18,470 | ||||||||||||||||||||||||||||||
| 2014 Annual Non- Equity Incentive | $ | — | $ | 116,538 | $ | 233,077 | — | — | — | — | — | — | — | |||||||||||||||||||||||||||||
| (1) | All Rentech PSU grants to NEOs (except for the grants to Mr. Forman) were made under Rentech’s Second Amended and Restated 2009 Incentive Award Plan. Amounts reflect the full grant date fair value of Rentech PSUs granted during calendar year 2014, computed in accordance with ASC Topic 718, rather than the amounts paid to or realized by the NEO. We provide information regarding the assumptions used to calculate the fair value of all compensatory equity awards made to executive officers in Note 18 to our consolidated financial statements included in Part II—Item 8 “Financial Statements and Supplementary Data” in this Annual Report. There can be no assurance that awards will vest (and, absent vesting no value will be realized by the executive for the unvested award), or that the value upon vesting will approximate the aggregate grant date fair value determined under ASC Topic 718. |
| (2) | All RNP equity grants were made under the Rentech Nitrogen Partners, L.P. 2011 Long-Term Incentive Plan. Amounts reflect the full grant date fair value of Partnership phantom units granted during calendar year 2014, computed in accordance with ASC Topic 505, rather than the amounts paid to or realized by the NEO. RNP provides information regarding the assumptions used to calculate the fair value of all compensatory equity awards made to executive officers in Note 12 to its consolidated financial statements included in Part II—Item 8 “Financial Statements and Supplementary Data” in its Annual Report on Form 10-K for the fiscal year ended December 31, 2014, filed with the SEC on March 16, 2015. There can be no assurance that awards will vest (and, absent vesting no value will be realized by the executive for the unvested award), or that the value upon vesting will approximate the aggregate grant date fair value determined under ASC Topic 505. |
| (3) | These stock options were granted on December 30, 2014 and vest one-fourth on December 9, 2015, and the balance will vest in substantially equal monthly increments thereafter for the following three years, subject to the executive’s continued employment through the applicable vesting date and further subject to accelerated vesting in connection with the executive’s termination of employment by the employer without cause or by the executive for good reason in connection with a change in control of Rentech. |
170
Table of Contents
| (4) | These PSUs were granted on December 30, 2014, vesting over a four year period based on our level of total shareholder return over such period, subject to the executive’s continued employment through the applicable vesting date and further subject to accelerated vesting in connection with (i) the executive’s termination of employment by the employer without cause or by the executive for good reason in connection with a change in control of Rentech or (ii) a change in control of Rentech. The value of the PSUs reported in this column represents the fair value of these awards based upon the probable outcome of the applicable performance conditions on the grant date. |
| (5) | These PSUs were granted on December 19, 2014, vesting over a four year period based on our level of total shareholder return over such period, subject to the executive’s continued employment through the applicable vesting date and further subject to accelerated vesting in connection with (i) the executive’s termination of employment by the employer without cause or by the executive for good reason in connection with a change in control of Rentech or (ii) a change in control of Rentech. The value of the PSUs reported in this column represents the fair value of these awards based upon the probable outcome of the applicable performance conditions on the grant date. |
| (6) | These RNP phantom units were granted on December 30, 2014 and vest in three substantially equal installments on December 14, 2015, 2016 and 2017, subject to the executive’s continued employment through the applicable vesting date and further subject to accelerated vesting (i) in full upon the executive’s termination of employment by the employer without cause or by the executive for good reason, in either case, within sixty days prior to or eighteen months following a change in control, or (ii) in full upon the executive’s death or disability. |
| (7) | Mr. Forman commenced employment with us in December 2014. Accordingly, he was not eligible to participate in our annual incentive program during 2014. |
Narrative Disclosure to Summary Compensation Table
and Grants of Plan-Based Awards Table
Employment Agreements
The employment arrangements with our NEOs are all “at will” and may be terminated at any time by us, subject to the severance provisions thereof.
Each of Messrs. Forman, Cohrs, Ebnet and Morris are, and Mr. Ramsbottom was (during his employment with Rentech), party to an employment agreement with us. The employment agreements for Messrs. Cohrs, Ebnet and Morris have terms that continue through October 22, 2015, November 3, 2015, and November 3, 2015, respectively, subject in each case to automatic one-year renewals absent 90-days’ advance notice from either party to the contrary. Mr. Forman’s employment agreement does not have a set term and Mr. Spain does not have an employment agreement. Mr. Ramsbottom’s employment agreement terminated in December 2014, when Mr. Ramsbottom ceased to serve as the chief executive officer and president of Rentech.
Under their respective employment agreements, Messrs. Forman, Cohrs, Ebnet and Morris are entitled, respectively, to (i) current base salaries, effective January 1, 2015, of $200,000, $464,000, $295,000, and $315,000, and (ii) in the case of Messrs. Cohrs, Ebnet and Morris, annual incentive bonuses for 2015 targeted at 60%, 50% and 50%, respectively, of the applicable executive’s base salary (with actual bonus eligibility for each executive ranging from zero to twice the applicable target). Mr. Spain’s current base salary is $291,346 and his annual incentive bonus target for 2015 is 40%. Mr. Ramsbottom’s employment agreement provided for a base salary which, during 2014, was $650,000 and an annual incentive bonus targeted at 100% of his base salary (with actual bonus eligibility ranging from zero to twice the applicable target).
The employment agreements entitle our NEOs to certain severance payments upon qualifying terminations of employment. The employment agreements also entitle Messrs. Ramsbottom, Cohrs and Morris to a “gross-up” payment from the Company equal to any excise taxes that the executive incurs by operation of Internal Revenue Code Section 280G (and any taxes on such gross-up payment) in connection with a change in control of the Company, but we note that these gross-up payments are legacy rights and that none of these employment agreements which contain gross-up payments were entered into or amended in any way during 2014. Mr. Ramsbottom’s gross-up provision terminated in connection with his ceasing employment with us. In addition, the employment agreements (other than Mr. Forman’s employment agreement) provide for monthly auto allowances, as well as customary indemnification, health, welfare, retirement and vacation benefits. The agreements also contain customary confidentiality and other restrictive covenants. Each of the executives covered by an employment agreement has also executed a corporate confidentiality and proprietary rights agreement. Though not addressed in the employment agreements, each of our NEOs is entitled to accelerated vesting of certain equity awards in the event of a change in control of the Company. For a discussion of the severance and change-in-control benefits for which our NEOs are eligible under their employment agreements, see “—Potential Payments upon Termination or Change-in-Control” below.
171
Table of Contents
Outstanding Equity Awards at December 31, 2014
The following table sets forth information with respect to our NEOs, concerning the outstanding equity awards from us and RNP as of December 31, 2014. Footnotes to the table describe the generally applicable vesting conditions for each award. For a description of applicable accelerated vesting provisions, see “—Potential Payments upon Termination or Change-in-Control” below.
| Option Awards | Stock Awards | |||||||||||||||||||||||||||||||||||||||
| Name |
Number of Securities Underlying Unexercised Options (#) Exercisable |
Number of Securities Underlying Unexercised Options (#) Unexercisable |
Equity Incentive Plan Awards: Number of Securities Underlying Unexercised Unearned Options (#) |
Option Exercise Price ($) |
Option Expiration Date |
Number of Shares or Units of Stock that have not Vested (#) |
Market Value of Shares or Units of Stock that have not Vested ($) (1) |
Equity Incentive Plan Awards: Number of Unearned Shares, Units or Other Rights that have not Vested (#) |
Equity Incentive Plan Awards: Market or Payout Value of Unearned Shares, Units or Other Rights that have not Vested ($)(1) |
Notes | ||||||||||||||||||||||||||||||
| Keith B. Forman |
— | 1,102,491 | — | $ | 1.24 | 12/30/2019 | — | — | — | — | (2 | ) | ||||||||||||||||||||||||||||
| — | — | — | — | — | — | — | 504,133 | $ | 635,207 | (3 | ) | |||||||||||||||||||||||||||||
| D. Hunt Ramsbottom |
268,733 | — | — | $ | 3.87 | 6/8/2015 | — | — | — | — | (4 | ) | ||||||||||||||||||||||||||||
| 752,567 | — | — | $ | 0.89 | 6/8/2015 | — | — | — | — | (5 | ) | |||||||||||||||||||||||||||||
| Dan J. Cohrs |
442,687 | — | — | $ | 0.89 | 10/4/2020 | — | — | — | — | (5 | ) | ||||||||||||||||||||||||||||
| — | — | — | — | — | 10,564 | $ | 13,311 | — | — | (6 | ) | |||||||||||||||||||||||||||||
| — | — | — | — | — | — | — | 83,004 | $ | 104,585 | (7 | ) | |||||||||||||||||||||||||||||
| — | — | — | — | — | 800 | $ | 8,408 | — | — | (8 | ) | |||||||||||||||||||||||||||||
| — | — | — | — | — | 51,896 | $ | 65,389 | — | — | (9 | ) | |||||||||||||||||||||||||||||
| — | — | — | — | — | — | — | 138,298 | $ | 174,255 | (10 | ) | |||||||||||||||||||||||||||||
| — | — | — | — | — | 5,036 | $ | 52,928 | — | — | (11 | ) | |||||||||||||||||||||||||||||
| — | — | — | — | — | — | — | 150,149 | $ | 189,187 | (3 | ) | |||||||||||||||||||||||||||||
| — | — | — | — | — | 7,554 | $ | 79,393 | — | — | (12 | ) | |||||||||||||||||||||||||||||
| Sean Ebnet |
— | — | — | — | — | 63,872 | $ | 80,479 | — | — | (9 | ) | ||||||||||||||||||||||||||||
| — | — | — | — | — | — | — | 85,107 | $ | 107,234 | (10 | ) | |||||||||||||||||||||||||||||
| — | — | — | — | — | — | — | 112,565 | $ | 141,832 | (3 | ) | |||||||||||||||||||||||||||||
| — | — | — | — | — | 100,000 | $ | 126,000 | — | — | (13 | ) | |||||||||||||||||||||||||||||
| — | — | — | — | — | 133,333 | $ | 168,000 | — | — | (14 | ) | |||||||||||||||||||||||||||||
| Colin M. Morris |
80,631 | — | — | $ | 3.87 | 7/13/2016 | — | — | — | — | (4 | ) | ||||||||||||||||||||||||||||
| 177,075 | — | — | $ | 0.89 | 10/4/2020 | — | — | — | — | (5 | ) | |||||||||||||||||||||||||||||
| — | — | — | — | — | 7,395 | $ | 9,318 | — | — | (6 | ) | |||||||||||||||||||||||||||||
| — | — | — | — | — | — | — | 58,103 | $ | 73,210 | (7 | ) | |||||||||||||||||||||||||||||
| — | — | — | — | — | 560 | $ | 5,886 | — | — | (8 | ) | |||||||||||||||||||||||||||||
| — | — | — | — | — | 31,936 | $ | 40,239 | — | — | (9 | ) | |||||||||||||||||||||||||||||
| — | — | — | — | — | — | — | 85,107 | $ | 107,234 | (10 | ) | |||||||||||||||||||||||||||||
| — | — | — | — | — | 3,099 | $ | 32,570 | — | — | (11 | ) | |||||||||||||||||||||||||||||
| — | — | — | — | — | — | — | 92,399 | $ | 116,423 | (3 | ) | |||||||||||||||||||||||||||||
| — | — | — | — | — | 4,648 | $ | 48,850 | — | — | (12 | ) | |||||||||||||||||||||||||||||
| Jeffrey R. Spain |
80,632 | — | — | $ | 0.92 | 7/28/21 | — | — | — | — | (15 | ) | ||||||||||||||||||||||||||||
| — | — | — | — | — | 7,335 | $ | 9,242 | — | — | (6 | ) | |||||||||||||||||||||||||||||
| — | — | — | — | — | — | — | 13,587 | $ | 17,119 | (7 | ) | |||||||||||||||||||||||||||||
| — | — | — | — | — | 658 | $ | 6,916 | — | — | (8 | ) | |||||||||||||||||||||||||||||
| — | — | — | — | — | 29,012 | $ | 36,555 | — | — | (9 | ) | |||||||||||||||||||||||||||||
| — | — | — | — | — | — | — | 20,045 | $ | 25,257 | (10 | ) | |||||||||||||||||||||||||||||
| — | — | — | — | — | 1,252 | $ | 13,159 | — | — | (11 | ) | |||||||||||||||||||||||||||||
| — | — | — | — | — | — | — | 35,332 | $ | 44,518 | (3 | ) | |||||||||||||||||||||||||||||
| — | — | — | — | — | 1,877 | $ | 19,727 | — | — | (12 | ) | |||||||||||||||||||||||||||||
| (1) | Rentech equity award values were calculated based on the $1.26 closing price of Rentech’s common stock on December 31, 2014 and RNP phantom unit values were calculated based on the $10.51 closing price of RNP’s common units on December 31, 2014. |
| (2) | Represents stock option award granted on December 30, 2014 of which one-fourth will vest on December 9, 2015, and the balance will vest in equal monthly increments thereafter for the following three years, subject to the executive’s continued employment through the applicable vesting date (these options are referred to below as the “2014 Forman Options”). |
| (3) | Represents PSUs granted on December 30, 2014 (with respect to Mr. Forman) and December 19, 2014 (with respect to the other NEOs), vesting over a four year period based on our total shareholder return over the relevant period, subject to the executive’s continued employment through the applicable vesting date, as described in more detail in “—Long-Term Equity Incentive Awards” above (these PSUs are referred to below as the “2014 PSUs”). |
| (4) | Represents a stock option award granted on July 14, 2006 that vested in three equal annual installments on each of July 14, 2007, 2008 and 2009. |
172
Table of Contents
| (5) | Represents stock options granted on October 4, 2010, which vested in three equal annual installments on each of October 4, 2011, 2012 and 2013. |
| (6) | Represents RSUs granted on December 14, 2012, which vest in three equal annual installments on each of December 14, 2013 and 2014, and the remaining unvested one-third of which will vest on December 14, 2015, subject to the executive’s continued employment through the applicable vesting date (these RSUs are referred to below as the “2012 RSUs”). |
| (7) | Represents the threshold number of PSUs granted on December 14, 2012, vesting on each of the first three anniversaries of the grant date based on our total shareholder return over the relevant period, subject to the executive’s continued employment through the applicable vesting date (these PSUs are referred to below as the “2012 PSUs”). |
| (8) | Represents RNP phantom units granted on December 14, 2012, which vested as to one-third on each of December 14, 2013 and 2014, and the remaining unvested one-third of which will vest on December 14, 2015, subject to the executive’s continued employment through the applicable vesting date (these units are referred to below as the “2012 Phantom Units”). |
| (9) | Represents RSUs granted on December 18, 2013, which vested as to one-third on December 14, 2013, and the remaining two-thirds of which will vest in two substantially equal annual installments on December 14, 2015 and 2016, subject to the executive’s continued employment through the applicable vesting date (these RSUs are referred to below as the “2013 RSUs”). |
| (10) | Represents the threshold number of PSUs granted on December 18, 2013, vesting on each of the first three anniversaries of December 14, 2013 based on our total shareholder return over the relevant period, subject to the executive’s continued employment through the applicable vesting date, as described in more detail in “—Long-Term Equity Incentive Awards” above (these PSUs are referred to below as the “2013 PSUs”). |
| (11) | Represents RNP phantom units granted on December 18, 2013, which vested as to one-third on December 14, 2014, and the remaining two-thirds of which will vest in two substantially equal annual installments on December 14, 2015 and 2016, subject to the executive’s continued employment through the applicable vesting date (these units are referred to below as the “2013 Phantom Units”). |
| (12) | Represents RNP phantom units granted on December 30, 2014, vesting in three substantially equal annual installments on December 14, 2015, 2016 and 2017, subject to the executive’s continued employment through the applicable vesting date (these units are referred to below as the “2014 Phantom Units”). |
| (13) | Represents RSUs granted on September 26, 2012, which vested as to one-third on each of September 17, 2013 and 2014, and the remaining unvested one-third of which will vest on September 17, 2015, subject to the executive’s continued employment through the applicable vesting date (these RSUs are referred to below as the “2012 Ebnet RSUs”). |
| (14) | Represents RSUs granted on June 3, 2013, which vested as to one-third on June 3, 2014, and the remaining unvested two-thirds of which will vest in two substantially equal annual installments on June 3, 2015 and 2016, subject to the executive’s continued employment through the applicable vesting date (these RSUs are referred to below as the “2013 Ebnet RSUs”). |
| (15) | Represents stock options granted on July 28, 2011, which vested in one-third installments on each of July 28, 2012, 2013 and 2014. |
Option Exercises, Stock Vested and Units Vested
The following table sets forth information with respect to our NEOs concerning the option exercises and stock vested under our equity plan(s) and the phantom units vested under RNP’s plan during calendar year 2014.
| Option Awards | Stock Awards | Unit Awards | ||||||||||||||||||||||
| Name |
Number of Shares Acquired on Exercise (#) |
Value Realized on Exercise ($) |
Number of Shares Acquired on Vesting (#) |
Value Realized on Vesting ($) (1) |
Number of Units Acquired on Vesting (#) |
Value Realized on Vesting ($) (2) |
||||||||||||||||||
| Keith B. Forman |
— | $ | — | — | $ | — | — | $ | — | |||||||||||||||
| D. Hunt Ramsbottom |
— | $ | — | 351,544 | $ | 508,620 | 17,605 | $ | 198,480 | |||||||||||||||
| Dan J. Cohrs |
— | $ | — | 202,767 | $ | 294,916 | 11,038 | $ | 126,795 | |||||||||||||||
| Sean Ebnet |
— | $ | — | 198,603 | $ | 373,422 | — | $ | — | |||||||||||||||
| Colin M. Morris |
— | $ | — | 134,944 | $ | 196,155 | 8,221 | $ | 95,548 | |||||||||||||||
| Jeffrey R. Spain |
— | $ | — | 90,082 | $ | 128,357 | 5,289 | $ | 61,701 | |||||||||||||||
| (1) | Amounts shown are based on the fair market value of Rentech’s common stock on the applicable vesting date. |
| (2) | Amounts shown are based on the fair market value of RNP’s common units on the applicable vesting date. |
173
Table of Contents
Potential Payments upon Termination or Change-in-Control
Our NEOs (other than Mr. Spain) are entitled to certain payments and benefits upon qualifying terminations of employment and, in certain cases, in connection with a change in control at the Company or at RNP. The following discussion describes the terms and conditions of these payments and benefits and the circumstances in which they will be paid or provided. All severance payments are conditioned upon the executive’s execution of a general release of claims against the Company. In the event that any severance payment to our NEOs is subject to “golden parachute” excise taxes under Internal Revenue Code Section 280G, Messrs. Ramsbottom, Cohrs and Morris are entitled to receive gross-up payments from us for any such excise taxes plus any excise, income or payroll taxes owed on the gross-up payment, although Mr. Ramsbottom’s gross-up provision terminated in connection with his ceasing employment with us.
For purposes of the following discussion, “change in control” refers to a change in control of us or RNP, as follows: with respect to (i) the severance payments and benefits provided to our NEOs pursuant to their respective employment agreements, (ii) the 2014 PSUs, (ii) the 2013 RSUs, (iii) the 2013 PSUs, (iv) the 2012 RSUs, (v) the 2012 PSUs, (vi) in the case of Mr. Forman, the 2014 Forman Options, and (vii) in the case of Mr. Ebnet, the 2013 Ebnet RSUs and the 2012 Ebnet RSUs, a change in control refers to a change in control of us. With respect to (a) the 2014 Phantom Units, (b) the 2013 Phantom Units, and (c) the 2012 Phantom Units, a change in control refers to a change in control of RNP.
Termination Not in Connection with a Change in Control
Under our NEOs’ employment agreements, upon termination of the executive’s employment by us without cause, by the executive with good reason (each as defined in the employment agreements) or, in the case of Mr. Ramsbottom only, due to a non-renewal of his employment term by us, the executives, other than Mr. Spain, are entitled to receive: (i) three times (in the case of Mr. Ramsbottom) or one-time (in the case of the other NEOs, other than Mr. Forman) base salary or, in the case of Mr. Forman, an amount equal to the greater of two times his base salary or $1,000,000 (or $400,000 if such termination occurs on or before June 9, 2015) payable in substantially equal installments over a period of two years (with respect to Messrs. Ramsbottom and Forman) or one year (with respect to the other NEOs); (ii) in the case of our NEOs other than Messrs. Forman, Ramsbottom and Spain, payment of the executive’s target annual bonus on the date that annual bonuses are paid generally for the year in which termination occurs, and (iii) Company-paid continuation health benefits for up to eighteen months following the date of termination. Upon termination of the employment of our NEOs (other than Mr. Forman) due to our non-renewal of their respective employment terms, these NEOs will be entitled to receive an amount equal to one times base salary, payable over the one-year period following termination, and, at our discretion, an annual bonus for the fiscal year preceding the non-renewal. As noted above, Mr. Spain is not party to an employment agreement with us and, accordingly, is not entitled to severance benefits upon qualifying terminations of his employment.
In addition, our NEOs will be entitled to the following enhanced vesting provisions with respect to qualifying terminations occurring outside of the context of a change in control:
| • | The 2014 Phantom Units, 2013 RSUs, 2013 Ebnet RSUs, 2013 Phantom Units, 2012 RSUs, 2012 Ebnet RSUs and 2012 Phantom Units held by the executive will accelerate and vest in full upon a termination of employment due to the applicable executive’s death or disability. |
| • | The 2013 PSUs and 2012 PSUs held by the executive will accelerate and vest upon a termination of employment due to the applicable executive’s death or disability occurring more than sixty days prior to a change in control based on deemed attainment of the performance-vesting conditions applicable to the 2013 PSUs and 2012 PSUs at target levels with respect to any PSUs that are unvested as of the date of such death or disability. |
174
Table of Contents
In connection with Mr. Ramsbottom’s cessation of employment with us in December 2014, he became entitled to receive the severance benefits described above consisting of a cash severance payment totaling three times his base salary (or $1,950,000) payable over a two-year period, plus the payment of his monthly premiums for continued health benefits for up to eighteen months following termination (with an estimated value, based on our costs to provide such coverage, equal to $29,480).
Change in Control (No Termination)
The NEOs are not entitled to any cash payments based solely on the occurrence of a change in control (absent any qualifying termination). In addition, the 2014 Forman Options, 2013 RSUs, 2013 Ebnet RSUs, 2013 Phantom Units, 2012 Ebnet RSUs, 2012 RSUs and 2012 Phantom Units are not impacted by a change in control alone and require a qualifying termination in connection with such change in control to vest. With respect to the 2013 PSUs and 2012 PSUs, the applicable performance period ends upon a change in control, which may, depending upon performance through the change in control, result in the final vesting of awards with respect to which time-vesting requirements were previously satisfied, but performance-vesting requirements were not; however, as of December 31, 2014, none of the PSUs subject to these awards met these criteria and, accordingly, none were eligible for accelerated vesting upon a change in control.
With respect to the 2014 PSUs, if a change in control occurs prior to the year 3 measurement date, then a number of PSUs are eligible to vest on the year 3 measurement based on the per share change in control transaction proceeds, subject to the holder’s continued service through such year 3 measurement date. If, however, the change in control occurs after the year 3 measurement date but prior to the year 4 measurement date, the applicable performance period ends upon the change in control and may, depending the per share change in control transaction proceeds, result in the vesting of such 2014 PSUs (provided that the applicable service-vesting requirements are met). However, as of December 31, 2014, none of the 2014 PSUs met these criteria and, accordingly, none were eligible for accelerated vesting upon a change in control.
Termination in Connection with a Change in Control
If our NEOs with employment agreements terminate employment without cause, for good reason or due to a non-renewal of the applicable employment term by us, in any case, within three months before or two years after a change in control of us, then the terminated executive will receive the severance described above, except that (i) the base salary component of the executive’s severance will be paid in a lump sum and (ii) in the case of our NEOs other than Mr. Forman, if the executive’s actual annual bonus for the year immediately preceding the change in control exceeds his target bonus for the year in which the termination occurs, (A) Mr. Ramsbottom would have been entitled to two times base salary plus the amount of such prior year bonus (instead of three times his base salary) and (B) in the case of the other NEOs, each NEO will receive one times base salary plus the amount of such prior-year bonus (instead of base salary plus target annual bonus). Messrs. Ramsbottom’s, Cohrs’ and Morris’ employment agreements entitle each of these executives to a “gross-up” payment covering all taxes, penalties and interest associated with any “golden parachute” excise taxes that are imposed on the executives by reason of Internal Revenue Code Section 280G in connection with a change in control of us, although Mr. Ramsbottom’s gross-up provision terminated in connection with his ceasing employment with us.
In addition, our NEOs will be entitled to the following enhanced vesting provisions with respect to qualifying terminations occurring in connection with a change in control:
| • | The 2014 Phantom Units, 2013 RSUs, 2013 Ebnet RSUs, 2013 Phantom Units, 2012 RSUs, 2012 Ebnet RSUs and 2012 Phantom Units will vest in full if the executive terminates employment without cause or for good reason, in either case, within sixty days prior to or eighteen months after the change in control. |
| • | The 2013 PSUs and 2012 PSUs will vest on an accelerated basis (to the extent then unvested) based on actual performance levels through the change in control if the executive terminates employment (i) without cause or for good reason, in either case, within sixty days prior to or eighteen months after the change in control, or (ii) due to the executive’s death or disability, in either case, within sixty days prior to, or upon or after the change in control. |
| • | The 2014 Forman Options will vest in full if the executive terminates employment without cause or for good reason, in either case, within two years after the change in control. |
| • | The 2014 PSUs will vest on an accelerated basis (to the extent then unvested) based on the per share change in control transaction proceeds, if the executive terminates employment without cause or for good reason, in either case, within two years after the change in control. |
175
Table of Contents
The following table summarizes the change-in-control and/or severance payments and benefits to which we expect that our NEOs would have become entitled if the relevant event(s) had occurred on December 31, 2014, in accordance with applicable disclosure rules. For purposes of the following table, we have assumed that a change in control of each relevant entity, whether Rentech and/or RNP, occurred on December 31, 2014, in order to provide a complete representation of the payments and benefits that each NEO would have become entitled to receive upon the occurrence of the relevant event(s). The severance benefits that Mr. Ramsbottom became entitled to receive when he ceased his employment with Rentech in December 2014 are described above (rather than in the table below).
| Name |
Benefit |
Termination without Cause or for Good Reason ($) |
Termination due to Non- Renewal ($) |
Termination due to Death/ Disability ($) |
Qualifying Termination in Connection with a Change in Control |
Other Terminations |
||||||||||||||||
| Keith B. Forman |
Cash Severance |
$ | 400,000 | (1) | $ | — | $ | — | $ | 400,000 | (2) | $ | — | |||||||||
| Value of Accelerated Stock Awards(3) |
— | — | — | — | (4) | — | ||||||||||||||||
| Value of Accelerated Option Awards(5) |
— | — | — | 22,050 | (8) | — | ||||||||||||||||
| Value of Healthcare Premiums |
29,480 | (7) | — | — | 29,480 | (7) | — | |||||||||||||||
| Total |
$ | 429,480 | $ | — | $ | — | $ | 451,530 | $ | — | ||||||||||||
| Dan J. Cohrs |
Cash Severance |
$ | 742,400 | (8) | $ | 464,000 | (9) | $ | — | $ | 505,760 | (10) | $ | — | ||||||||
| Value of Accelerated Stock Awards(3) |
— | — | 636,379 | (11) | 78,700 | (12) | — | |||||||||||||||
| Value of Accelerated Units(13) |
— | — | 140,729 | (14) | 140,729 | (15) | — | |||||||||||||||
| Value of Healthcare Premiums |
29,480 | (7) | — | — | 29,480 | (7) | — | |||||||||||||||
| Total |
$ | 771,800 | $ | 464,000 | $ | 777,108 | $ | 754,669 | (16) | $ | — | |||||||||||
| Sean Ebnet |
Cash Severance |
$ | 442,500 | (8) | $ | 295,000 | (9) | — | $ | 317,125 | (10) | — | ||||||||||
| Value of Accelerated Stock Awards(3) |
— | — | 588,947 | (17) | 374,478 | (18) | — | |||||||||||||||
| Value of Healthcare Premiums |
29,480 | (7) | — | — | 29,480 | (7) | — | |||||||||||||||
| Total |
$ | 471,980 | $ | 295,000 | $ | 588,947 | $ | 721,083 | $ | — | ||||||||||||
| Colin M. Morris |
Cash Severance |
$ | 472,500 | (8) | $ | 315,000 | (9) | — | $ | 338,625 | (10) | $ | — | |||||||||
| Value of Accelerated Stock Awards(3) |
— | — | 410,444 | (19) | 49,557 | (20) | — | |||||||||||||||
| Value of Accelerated Units(13) |
— | — | 87,307 | (21) | 87,307 | (22) | — | |||||||||||||||
| Value of Healthcare Premiums |
10,019 | (7) | — | — | 10,019 | (7) | — | |||||||||||||||
| Total |
$ | 482,519 | $ | 315,000 | $ | 497,751 | $ | 485,508 | (16) | $ | — | |||||||||||
| Jeffrey R. Spain |
Cash Severance |
$ | — | $ | — | — | $ | — | $ | — | ||||||||||||
| Value of Accelerated Stock Awards(3) |
— | — | 130,421 | (23) | 45,797 | (24) | — | |||||||||||||||
| Value of Accelerated Units(15) |
— | — | 39,801 | (25) | 39,801 | (26) | — | |||||||||||||||
| Value of Healthcare Premiums |
— | — | — | — | — | |||||||||||||||||
| Total |
$ | — | $ | — | $ | 170,222 | $ | 85,598 | $ | — | ||||||||||||
| (1) | Represents two times Mr. Forman’s annual base salary, payable over the two-year period after his termination date. |
| (2) | Represents two times Mr. Forman’s annual base salary, payable in a lump sum upon termination. |
| (3) | Value of PSUs and RSUs determined by multiplying the number of accelerating PSUs and RSUs by the fair market value of Rentech’s common stock on December 31, 2014 ($1.26). |
| (4) | The 2014 PSUs held by Mr. Forman would be deemed attained based on actual performance as of the date of the change in control. The threshold level of performance criteria applicable to the 2014 PSUs had not been attained as of December 31, 2014, and, accordingly, none of the unvested 2014 PSUs would have vested on an accelerated basis. |
| (5) | Value of options determined by multiplying the fair market value of our common stock on December 31, 2014 ($1.26), less the applicable exercise price, by the number of accelerating options. |
| (6) | Represents the aggregate value of 1,102,491 unvested 2014 Forman Options held by Mr. Forman that would have vested on an accelerated basis if Mr. Forman terminated employment without cause or for good reason on December 31, 2014 and, in either case, such termination occurred within two years after a change in control. |
176
Table of Contents
| (7) | Represents the cost of Company-paid continuation health benefits for eighteen months, based on our estimated costs to provide such coverage. For purposes of continuation health benefits, a “qualifying termination in connection with a change in control” means a termination without cause or for good reason within three months before or two years after a change in control of us. |
| (8) | Represents the executive’s annual base salary, payable over the one-year period after his termination date, plus his target annual incentive bonus. |
| (9) | Represents the executive’s annual base salary, payable over the one-year period after his termination date. |
| (10) | Represents the executive’s annual base salary plus target bonus which equals the prior year’s bonus, payable in a lump sum upon termination. |
| (11) | Represents the aggregate value of 51,896 unvested 2013 RSUs, 276,596 unvested 2013 PSUs, 10,564 unvested 2012 RSUs and 166,007 unvested 2012 PSUs held by Mr. Cohrs that would have vested on an accelerated basis upon Mr. Cohrs’ termination due to death or disability on December 31, 2014. We have assumed for purposes of this calculation that we achieved target performance with respect to the 2013 PSUs and 2012 PSUs on December 31, 2014. |
| (12) | Represents the aggregate value of 51,896 unvested 2013 RSUs and 10,564 unvested 2012 RSUs that would have vested on an accelerated basis if Mr. Cohrs terminated employment without cause or for good reason on December 31, 2014 and, in either case, such termination occurred within 60 days prior to or eighteen months after a change in control of us. The 2014 PSUs, 2013 PSUs and 2012 PSUs would be deemed attained based on actual performance as of the date of the change in control. The threshold level of performance criteria applicable to the 2014 PSUs, 2013 PSUs and 2012 PSUs had not been attained as of December 31, 2014, and, accordingly, none of the unvested 2014 PSUs, 2013 PSUs and 2012 PSUs would have vested on an accelerated basis. |
| (13) | Value of 2014 Phantom Units, 2013 Phantom Units and 2012 Phantom Units determined by multiplying the number of accelerating RNP units by the fair market value of RNP’s common unit on December 31, 2014 ($10.51). |
| (14) | Represents the aggregate value of 7,554 unvested 2014 Phantom Units, 5,036 unvested 2013 Phantom Units and 800 unvested 2012 Phantom Units held by Mr. Cohrs that would have vested on an accelerated basis upon Mr. Cohrs’ termination due to death or disability on December 31, 2014. |
| (15) | Represents the aggregate value of 7,554 unvested 2014 Phantom Units, 5,036 unvested 2013 Phantom Units and 800 unvested 2012 Phantom Units held by Mr. Cohrs that would have vested on an accelerated basis if Mr. Cohrs terminated employment without cause or for good reason on December 31, 2014, in either case, such termination occurred within 60 days prior to or within eighteen months after a change in control. |
| (16) | As of December 31, 2014, no excise taxes would have been imposed by Section 4999 of the Internal Revenue Code on the relevant payments and benefits, meaning that no gross-up obligations would have applied. Accordingly, no gross-up amounts are included in these figures. |
| (17) | Represents the aggregate value of 63,872 unvested 2013 RSUs, 170,213 unvested 2013 PSUs, 133,333 unvested 2013 Ebnet RSUs and 100,000 unvested 2012 Ebnet RSUs held by Mr. Ebnet that would have vested on an accelerated basis upon Mr. Ebnet’s termination due to death or disability on December 31, 2014. We have assumed for purposes of this calculation that we achieved target performance with respect to the 2013 PSUs on December 31, 2014. |
| (18) | Represents the aggregate value of 63,872 unvested 2013 RSUs, 133,333 unvested 2013 Ebnet RSUs and 100,000 unvested 2012 Ebnet RSUs that would have vested on an accelerated basis if Mr. Ebnet terminated employment without cause or for good reason on December 31, 2014 and, in either case, such termination occurred within eighteen months after a change in control of us. The 2014 PSUs and 2013 PSUs would be deemed attained based on actual performance as of the date of the change in control. The threshold level of performance criteria applicable to the 2014 PSUs and 2013 PSUs had not been attained as of December 31, 2014, and, accordingly, none of the unvested 2014 PSUs and 2013 PSUs would have vested on an accelerated basis. |
| (19) | Represents the aggregate value of 31,936 unvested 2013 RSUs, 170,213 unvested 2013 PSUs, 7,395 unvested 2012 RSUs and 116,205 unvested 2012 PSUs held by Mr. Morris that would have vested on an accelerated basis upon Mr. Morris’ termination due to death or disability on December 31, 2014. We have assumed for purposes of this calculation that we achieved target performance with respect to the 2013 PSUs and 2012 PSUs on December 31, 2014. |
177
Table of Contents
| (20) | Represents the aggregate value of 31,936 unvested 2013 RSUs and 7,395 unvested 2012 RSUs that would have vested on an accelerated basis if Mr. Morris terminated employment without cause or for good reason on December 31, 2014 and, in either case, such termination occurred within 60 days prior to or eighteen months after a change in control of us. The 2014 PSUs, 2013 PSUs and 2012 PSUs would be deemed attained based on actual performance as of the date of the change in control. The threshold level of performance criteria applicable to the 2014 PSUs, 2013 PSUs and 2012 PSUs had not been attained as of December 31, 2014, and, accordingly, none of the unvested 2014 PSUs, 2013 PSUs and 2012 PSUs would have vested on an accelerated basis. |
| (21) | Represents the aggregate value of 4,648 unvested 2014 Phantom Units, 3,099 unvested 2013 Phantom Units and 560 unvested 2012 Phantom Units held by Mr. Morris that would have vested on an accelerated basis upon Mr. Morris’ termination due to death or disability on December 31, 2014. |
| (22) | Represents the aggregate value of 4,648 unvested 2014 Phantom Units, 3,099 unvested 2013 Phantom Units and 560 unvested 2012 Phantom Units held by Mr. Morris that would have vested on an accelerated basis if Mr. Morris terminated employment without cause or for good reason on December 31, 2014, in either case, such termination occurred within 60 days prior to or within eighteen months after a change in control. |
| (23) | Represents the aggregate value of 29,012 unvested 2013 RSUs, 40,089 unvested 2013 PSUs, 7,335 unvested 2012 RSUs and 27,173 unvested 2012 PSUs held by Mr. Spain that would have vested on an accelerated basis upon Mr. Spain’s termination due to death or disability on December 31, 2014. We have assumed for purposes of this calculation that we achieved target performance with respect to the 2013 PSUs and 2012 PSUs on December 31, 2014. |
| (24) | Represents the aggregate value of 29,012 unvested 2013 RSUs and 7,335 unvested 2012 RSUs that would have vested on an accelerated basis if Mr. Spain terminated employment without cause or for good reason on December 31, 2014 and, in either case, such termination occurred within 60 days prior to or eighteen months after a change in control of us. The 2014 PSUs, 2013 PSUs and 2012 PSUs would be deemed attained based on actual performance as of the date of the change in control. The threshold level of performance criteria applicable to the 2014 PSUs, 2013 PSUs and 2012 PSUs had not been attained as of December 31, 2014, and, accordingly, none of the unvested 2014 PSUs, 2013 PSUs and 2012 PSUs would have vested on an accelerated basis. |
| (25) | Represents the aggregate value of 1,877 unvested 2014 Phantom Units, 1,252 unvested 2013 Phantom Units and 658 unvested 2012 Phantom Units held by Mr. Spain that would have vested on an accelerated basis upon Mr. Spain’s termination due to death or disability on December 31, 2014. |
| (26) | Represents the aggregate value of 1,877 unvested 2014 Phantom Units, 1,252 unvested 2013 Phantom Units and 658 unvested 2012 Phantom Units held by Mr. Spain that would have vested on an accelerated basis if Mr. Spain terminated employment without cause or for good reason on December 31, 2014, in either case, such termination occurred within 60 days prior to or within eighteen months after a change in control. |
Director Compensation
The following table sets forth compensation information with respect to our non-employee directors during 2014.
| Name |
Fees Earned ($) |
Stock Awards ($)(1)(2) |
Option Awards ($)(3) |
Non-Equity Incentive Plan Compensation ($) |
Change in Pension Value and Nonqualified Deferred Compensation Earnings |
All Other Compensation ($) |
Total ($) |
|||||||||||||||||||||
| Michael S. Burke |
$ | 16,250 | $ | 156,549 | $ | — | — | — | — | $ | 172,799 | |||||||||||||||||
| General Wesley K. Clark |
$ | 11,875 | $ | 134,674 | $ | — | — | — | — | $ | 146,549 | |||||||||||||||||
| Patrick J. Moore |
$ | — | $ | 133,035 | $ | — | — | — | — | $ | 133,035 | |||||||||||||||||
| Douglas I. Ostrover(4) |
$ | — | $ | — | $ | — | — | — | — | $ | — | |||||||||||||||||
| Michael F. Ray(5) |
$ | 11,875 | $ | 11,875 | $ | — | — | — | — | $ | 23,750 | |||||||||||||||||
| Ronald M. Sega |
$ | 12,500 | $ | 137,800 | $ | — | — | — | — | $ | 150,300 | |||||||||||||||||
| Edward M. Stern |
$ | 15,625 | $ | 162,798 | $ | — | — | — | — | $ | 178,423 | |||||||||||||||||
| Halbert S. Washburn |
$ | 18,125 | $ | 175,301 | $ | — | — | — | — | $ | 193,426 | |||||||||||||||||
| John A. Williams |
$ | 10,000 | $ | 140,736 | $ | — | — | — | — | $ | 141,736 | |||||||||||||||||
| Dennis L. Yakobson(5)(6) |
$ | 22,500 | $ | 10,000 | $ | — | — | — | — | $ | 32,500 | |||||||||||||||||
| (1) | Amounts reflect the full grant-date fair value of the 2014 stock grants and 2014 restricted stock unit awards, calculated in accordance with ASC Topic 718. We provide information regarding the assumptions used to calculate the value of all awards made to non-employee directors in Note 18 to our consolidated financial statements in Part II—Item 8 “Financial Statements and Supplementary Data” to this Annual Report. |
178
Table of Contents
| (2) | The number of RSUs held by Messrs. Burke, Clark, Moore, Sega, Stern, Washburn and Williams as of December 31, 2014 was 22,948, 19,462, 19,462, 19,960, 23,944, 25,937 and 20,458, respectively. |
| (3) | The options held by Messrs. Burke, Clark, Moore, Sega, Stern, Washburn and Williams as of December 31, 2014 covered 44,616, 21,501, 20,000, 44,616, 21,501, 44,616 and 28,490 shares, respectively. |
| (4) | Mr. Ostrover has elected not to be compensated for his participation on the board of Rentech. |
| (5) | Messrs. Ray and Yakobson left the Board in April 2014. |
| (6) | Includes consulting fees of $12,500. |
Directors who are our employees do not receive additional compensation for their services on the Board, except that Mr. Forman received compensation for director services provided to RNP during 2014 prior to becoming our Chief Executive Officer on December 9, 2014.
All-Equity Director Compensation Program
Since April 1, 2014, non-employee directors have received no cash compensation for their services on our Board; instead pursuant to Rentech’s director compensation program, all annual retainer fees and committee fees have been paid to our non-employee directors in the form of restricted stock or deferred stock units. The all-equity director compensation program was established to further align the interests of our non-employee directors with those of the Company’s stockholders.
Under the program, each newly elected non-employee member of our Board is granted a fully-vested option to purchase 20,000 shares of our common stock with an exercise price equal to the fair market value of our common stock on the date of grant and a term of five years following the date of grant. Each non-employee director serving immediately following our annual meeting of shareholders also is granted (i) a number of shares of our fully vested common stock or deferred stock units (as elected by the applicable director) obtained by dividing $50,000 by the fair market value of our common stock on the date of grant, rounded up to the nearest 100 shares, and (ii) an RSU or deferred stock unit grant (as elected by the applicable director) obtained by dividing $25,000 by the fair market value of our common stock on the date of grant, rounded up to the nearest 100 shares, vesting on the earlier of the one year anniversary of the date of grant and our annual meeting of shareholders, subject to the director’s continued service on our Board through such date.
Each director also receives an annual equity award of either restricted stock or deferred stock units that has a value equal to the sum of the director’s aggregate compensation for chairing or participating on committees of our Board and for service as a member of our Board during the applicable year (pro-rated for any partial year), as follows:
| Board Service |
||||
| Annual Retainer: |
$ | 40,000 | ||
| Chairman of the Board Additional Annual Retainer: |
$ | 25,000 | ||
| Committee Service |
||||
| Audit Committee: |
||||
| Chair Annual Fee: |
$ | 17,500 | ||
| Committee Member (Non-Chair) Fee: |
$ | 7,500 | ||
| Compensation Committee: |
||||
| Chair Annual Fee: |
$ | 17,500 | ||
| Committee Member (Non-Chair) Fee: |
$ | 7,500 | ||
| Finance Committee: |
||||
| Committee Member Fee: |
$ | 7,500 | ||
| Nominating Committee: |
||||
| Chair Annual Fee: |
$ | 10,000 | ||
| Committee Member (Non-Chair) Fee: |
$ | 5,000 | ||
179
Table of Contents
Each director’s annual equity award will be in the form of restricted stock or deferred stock units, as elected by the applicable director pursuant to the terms and conditions of our director compensation program, and will vest in quarterly installments over a one-year period.
Prior to the adoption of our all-equity director compensation program, our non-employee directors were generally entitled to receive the same levels of compensation for their services on our Board, but such compensation was paid as a mix of both cash and equity awards and our directors were not eligible to make deferral elections with respect to their equity awards.
Directors are also reimbursed for reasonable out-of-pocket expenses incurred in their capacity as directors. No additional fees are paid to directors for attendance at our Board or committee meetings.
Compensation Committee Interlocks and Insider Participation
During 2014, the following individuals served as members of the Compensation Committee: Michael S. Burke, Edward M. Stern, and Halbert S. Washburn. None of these individuals has ever served as our officer or employee or an officer or employee of any of our subsidiaries. None of our executive officers has served as a director or member of the compensation committee of another entity at which an executive officer of such entity is also one of our directors.
Compensation Risk Assessment
We have assessed the compensation policies and practices for our employees and concluded that they do not create risks that are reasonably likely to have a material adverse effect on us. In reaching our conclusion, we considered the following elements of our compensation plans and policies:
| • | The mix of fixed (base salary) and variable (cash annual incentive and equity) compensation, including short-term (cash annual incentive) and long-term (equity) incentives, reduces the significance of any one particular compensation component; |
| • | The mix of various types of equity awards (including RSUs and PSUs) which have different vesting provisions that are based on a variety of factors including stock performance, accomplishment of commercial milestones and time vesting, so that no single event drives long-term compensation; |
| • | The fact that all of our equity awards vest over time (in addition to performance vesting in some circumstances), typically three years, encouraging a long-term view by recipients; |
| • | The fact that the Compensation Committee oversees our equity plans and incentive based bonus awards and has the discretion to reduce or eliminate bonuses based on performance; |
| • | Our formal performance evaluation approach based on quantitative and qualitative performance is used company-wide setting cash and equity incentives; |
| • | We have adopted a clawback policy pursuant to which, in the event of an accounting restatement due to material non-compliance with any financial reporting requirements under the securities law, we will be entitled (but not required) to recoup from executive officers all cash bonuses and all contingent equity that would not have been paid if performance had been measured in accordance with the restated financials. This policy only applies to incentives paid or granted, as applicable, (i) within three years of the date that the accounting restatement is required and (ii) on or after January 1, 2013; and |
| • | We have adopted stock ownership guidelines for our executives officers and non-employee directors, pursuant to which they must accumulate and hold equity of the Company valued at three times (3x) (or six times (6x) in the case of our Chief Executive Officer) their annual base salary (with respect to our executive officers) or their annual cash retainer (with respect to our non-employee directors) within the earlier of (i) five years after the adoption of these guidelines or (ii) five years after becoming an executive officer of the Company (with respect to our executive officers) or five years after joining our Board (with respect to our non-employee directors). If, after the five year period set forth above, an individual fails to satisfy the above ownership requirements, then he or she will be required to retain 100% of any of our shares acquired through stock option exercise or vesting of any performance stock units, restricted stock units and restricted stock awards (net of shares sold or withheld to satisfy taxes and, in the case of stock options, the exercise price) until such time that he or she meets the ownership requirements. |
180
Table of Contents
| ITEM 12. | SECURITY OWNERSHIP OF CERTAIN BENEFICIAL OWNERS AND MANAGEMENT AND RELATED STOCKHOLDER MATTERS |
The following table sets forth certain information regarding beneficial ownership of our common stock as of March 2, 2015 by (i) all owners of record or those who are known to us to beneficially own more than 5% of the issued and outstanding shares of our common stock, (ii) each director and named executive officer, or NEO, identified in the tables under Item 11 “Executive Compensation,” and (iii) by all executive officers and directors as a group:
| Directors and Named Executive Officers(1)(2)(3) Listed in alphabetical order |
Amount and Nature of Beneficially Ownership(4) |
Percentage of Class(5) |
||||||
| Michael S. Burke |
409,625 | * | ||||||
| General Wesley K. Clark |
221,977 | * | ||||||
| Dan J. Cohrs |
1,300,265 | * | ||||||
| Sean Ebnet |
186,388 | * | ||||||
| Keith B. Forman |
— | * | ||||||
| Patrick J. Moore |
59,848 | * | ||||||
| Colin M. Morris |
818,134 | * | ||||||
| Douglas I. Ostrover |
— | * | ||||||
| D. Hunt Ramsbottom(6) |
2,716,969 | 1.2 | ||||||
| Ronald M. Sega |
396,327 | * | ||||||
| Jeffrey R. Spain |
321,350 | * | ||||||
| Edward M. Stern |
453,518 | * | ||||||
| Halbert S. Washburn |
468,328 | * | ||||||
| John A. Williams |
82,222 | * | ||||||
| All directors and executive officers as a group (13 persons) |
4,717,982 | 2.0 | ||||||
| Beneficial Owners of More than 5% |
Amount and Nature of Beneficially Ownership |
Percentage of Class |
||||||
| Funds affiliated with GSO Capital Partners LP(7) |
45,045,045 | 16.4 | ||||||
| Ariel Investments, LLC(8) |
18,857,659 | 8.2 | ||||||
| Overbrook Management Corporation(9) |
17,472,805 | 7.6 | ||||||
| Park West Asset Management, LLC(10) |
15,496,065 | 6.8 | ||||||
| The Vanguard Group(11) |
13,625,485 | 5.9 | ||||||
| * | Less than 1% |
| (1) | Except as otherwise noted and subject to applicable community property laws, each shareholder has sole or shared voting and investment power with respect to the shares beneficially owned. The business address of each director and executive officer is c/o Rentech, Inc., 10877 Wilshire Blvd., 10th Floor, Los Angeles, CA 90024. |
| (2) | If a person has the right to acquire shares of common stock subject to options, time-vesting restricted stock units, or RSUs, or other convertible or exercisable securities within 60 days of March 2, 2015, then such shares (including certain RSUs that are fully vested but will not be yet paid out until the earlier of the recipient’s termination and three years from the applicable award date, subject to any required payment delays arising under applicable tax laws) are deemed outstanding for purposes of computing the percentage ownership of that person, but are not deemed outstanding for purposes of computing the percentage ownership of any other person. The following shares of common stock that may be acquired within 60 days of March 2, 2015 and are included in the table above: |
| • | Michael S. Burke — 44,616 under options and 6,474 RSUs; |
| • | General Wesley K. Clark — 21,501 under options and 4,731 RSUs; |
| • | Dan J. Cohrs — 442,687 under options; |
| • | Patrick J. Moore — 20,000 under options and 4,731 RSUs; |
| • | Colin M. Morris — 257,706 under options; |
| • | D. Hunt Ramsbottom — 1,021,340 under options; |
| • | Ronald M. Sega — 44,616 under options and 4,980 RSUs; |
| • | Jeffrey R. Spain — 80,632 under options; |
| • | Edward M. Stern — 21,501 under options and 6,972 RSUs; |
| • | Halbert S. Washburn — 44,616 under options and 7,968 RSUs; |
181
Table of Contents
| • | John A. Williams — 28,490 under options and 5,229 RSUs; and |
| • | all directors and executive officers as a group — 1,006,365 under options and 41,085 RSUs. |
| (3) | The Security Ownership table above does not include the following: |
(A) Performance-vesting restricted stock units, or PSUs, granted during the year ended December 31, 2014 and held by our NEOs that vest over a four year period based on the level of total shareholder return over such period (the numbers below represent the target number of PSUs that may be issued to the NEOs):
| • | Dan J. Cohrs — 300,297 PSUs; |
| • | Sean Ebnet — 225,130 PSUs; |
| • | Keith B. Forman — 1,008,265 PSUs; |
| • | Colin M. Morris — 184,798 PSUs; and |
| • | Jeffrey R. Spain — 70,664 PSUs. |
PSUs, granted prior to January 1, 2014 and held by our NEOs that vest over a three year period based on the level of total shareholder return over such period (the numbers below represent the target number of PSUs that may be issued to the NEOs):
| • | Dan J. Cohrs — 442,603 PSUs; |
| • | Sean Ebnet — 170,213 PSUs; |
| • | Colin M. Morris — 286,418 PSUs; and |
| • | Jeffrey R. Spain — 67,263 PSUs. |
(B) unvested RSUs and/or options that will vest assuming the continued employment of the officer or director beyond each applicable vesting date:
| • | Michael S. Burke — 16,474 RSUs; |
| • | General Wesley K. Clark — 14,731 RSUs; |
| • | Dan J. Cohrs — 62,459 RSUs; |
| • | Sean Ebnet — 297,205 RSUs; |
| • | Keith B. Forman — 1,102,491 under options; |
| • | Patrick J. Moore — 14,731 RSUs; |
| • | Colin M. Morris — 39,330 RSUs; |
| • | Ronald M. Sega — 14,980 RSUs; |
| • | Jeffrey R. Spain — 36,348 RSUs; |
| • | Edward M. Stern — 16,972 RSUs; |
| • | Halbert S. Washburn — 17,969 RSUs; and |
| • | John A. Williams — 15,229 RSUs. |
| (4) | Information with respect to beneficial ownership is based upon information furnished by each shareholder or contained in filings with the SEC. |
| (5) | Based on 229,421,453 shares of common stock outstanding as of March 2, 2015. |
| (6) | As of December 15, 2014, Mr. Ramsbottom’s last day of employment with Rentech. |
| (7) | Based on information in a Schedule 13D filed with the SEC on February 25, 2015 by GSO Cactus Credit Opportunities Fund LP (“GSO Cactus”), Steamboat Credit Opportunities Master Fund LP (“Steamboat”), GSO Coastline Credit Partners LP (“GSO Coastline”), GSO Aiguille des Grands Montets Fund II LP (“GSO Aiguille”), GSO Special Situations Fund LP (“GSO SSF”), GSO Special Situations Overseas Master Fund Ltd. (“GSO SSOMF”), GSO Palmetto Opportunistic Investment Partners LP (“GSO Palmetto”), GSO Credit A-Partners LP, (“GSO Credit”), GSO Palmetto Opportunistic Associates LLC (“GSO Palmetto OA”), GSO Credit-A Associates LLC (“GSO Credit-A”), GSO Holdings I L.L.C. (“GSO Holdings I”), GSO Capital Partners LP (“GSO Capital Patners LP”), Bennett J. Goodman, J. Albert Smith III, Douglas I. Ostrover, Stephen A. Schwarzman, GSO Advisor Holdings L.L.C. (“GSO Advisor”), Blackstone Holdings I L.P. (“Blackstone Holdings I”), Blackstone Holdings I/II GP Inc. (“Blackstone Holdings I/II”), The Blackstone Group L.P. (“Blackstone Group L.P.”) and Blackstone Group Management L.L.C. (“Blackstone Group LLC”) (together, the “GSO Persons”). GSO Cactus directly holds 9,885.3043 shares of Series E Preferred Stock convertible into approximately 4,452,839 shares of Common Stock, Steamboat directly holds 3,840.2958 shares of Series E Preferred Stock convertible into approximately 1,729,862 shares of Common Stock, GSO Coastline directly holds 3,843.1304 shares of Series E Preferred Stock convertible into approximately 1,731,139 shares of Common Stock, GSO Aiguille directly holds 12,991.4871 shares of Series E Preferred Stock convertible into approximately 5,852,021 shares of Common Stock, GSO Palmetto directly holds 6,666.6667 shares of Series E Preferred Stock convertible into approximately 3,003,003 shares of Common Stock, GSO Credit directly holds 16,121.7415 shares of Series E Preferred Stock convertible into approximately 7,262,045 shares |
182
Table of Contents
| of Common Stock, GSO SSF directly holds 28,751.3742 shares of Series E Preferred Stock convertible into approximately 12,951,069 shares of Common Stock and GSO SSOMF directly holds 17,900.0000 shares of Series E Preferred Stock convertible into approximately 8,063,063 shares of Common Stock. GSO Palmetto OA is the general partner of GSO Palmetto. GSO Credit-A is the general partner of GSO Credit. GSO Holdings I is the managing member of each of GSO Palmetto OA and GSO Credit-A. GSO Capital Partners LP serves as the investment manager of each of GSO Cactus, Steamboat, GSO Coastline, GSO Aiguille, GSO SSF and GSO SSOMF. GSO Advisor is the general partner of GSO Capital Partners LP. Blackstone Holdings I is the sole member of each of GSO Holdings I and GSO Advisor. Blackstone Holdings I/II is the general partner of Blackstone Holdings I. Blackstone Group L.P. is the controlling shareholder of Blackstone Holdings I/II. Blackstone Group LLC is the general partner of Blackstone Group L.P. Blackstone Group LLC is wholly owned by its senior managing directors and controlled by its founder, Stephen A. Schwarzman. In addition, each of Bennett J. Goodman, J. Albert Smith III and Douglas I. Ostrover may be deemed to have shared voting power and/or investment power with respect to the securities held by the GSO Funds. Each of such GSO Persons (other than each of GSO Cactus, Steamboat, GSO Coastline, GSO Aiguille, GSO Palmetto, GSO Credit, GSO SSF and GSO SSOMF (together, the “GSO Partnerships”) to the extent of their respective direct holdings) may be deemed to beneficially own the shares beneficially owned by the GSO Partnerships directly or indirectly controlled by it or him, but each disclaims beneficial ownership of such shares. The principal business office for GSO Capital Partners LP and affiliates is 345 Park Avenue, New York, New York 10154. |
| (8) | Based on information in a Schedule 13G filed by Ariel Investments, LLC, or Ariel, with the SEC on February 13, 2015 for its holdings as of December 31, 2014, Ariel reported that it has sole power to vote 12,962,861 shares, and that it has the sole power to dispose of all 18,857,659 of its shares. Ariel’s principal business office address is 200 East Randolph Drive, Suite 2900, Chicago, IL 60601 |
| (9) | Based on information in a Schedule 13G filed by Overbrook Management Corporation, or Overbrook, and its principals with the SEC on February 12, 2015 for its holdings as of December 31, 2014. Overbrook and its principals reported that they were beneficial owners of 16,537,386 shares, with no sole power to vote or sell the shares, but shared voting power and power to dispose. Overbrook’s principal Andrew Goffe reported beneficial ownership of 17,472,805 with sole voting power and power to dispose 935,419 shares. Overbrook’s principal business office address is 122 East 42nd Street, Suite 2500, New York, New York 10168. |
| (10) | Based on information in a Schedule 13G filed by Park West Asset Management, LLC and its managed funds, or Park West, with the SEC on February 17, 2014 for its holdings as of December 31, 2014, Park West reported that it has sole power to vote and dispose of all 15,496,065 shares. Park West’s principal business office address is 900 Larkspur Landing Circle, Suite 165, Larkspur, CA 94939. |
| (11) | Based on information in a Schedule 13G filed by The Vanguard Group, or Vanguard, with the SEC on February 10, 2015 for its holdings as of December 31, 2014, Vanguard reported that it has sole power to vote 293,515 shares, and that it has the sole power to dispose of 13,345,870 of its shares and the shared power to dispose of 279,615 of its shares. Vanguard’s principal business office address is 100 Vanguard Blvd., Malvem, PA 19355. |
Equity Compensation Plan Information
The following table provides information as of December 31, 2014 with respect to our compensation plans, including individual compensation arrangements, under which our equity securities are authorized for issuance.
| Plan category |
Number of securities to be issued upon exercise of outstanding options, warrants and rights (a) |
Weighted-average exercise price of outstanding options, warrants and rights (b) |
Number of securities remaining available for future issuance under equity compensation plans (excluding securities reflected in column (a)) (c) |
|||||||||
| Equity compensation plans approved by security holders |
11,305,000 | $ | 0.69 | 12,285,000 | ||||||||
| Equity compensation plans not approved by security holders |
3,119,000 | — | — | |||||||||
|
|
|
|
|
|
|
|||||||
| Total |
14,424,000 | $ | 0.69 | 12,285,000 | ||||||||
|
|
|
|
|
|
|
|||||||
The equity securities issued as compensation under shareholder approved compensation plans consist of stock options, RSUs and performance shares. The equity securities issued as compensation without shareholder approval consist of stock options, RSUs and PSUs. The stock options have exercise prices equal to the fair market value of our common stock, as reported by the NYSE MKT (prior to August 13, 2013) or the NASDAQ Stock Market (on or after August 13, 2013), as of the date the securities were granted. The options may be exercised for a term ranging from five to ten years after the date they were granted.
183
Table of Contents
Ownership of Common Units of RNP
On December 30, 2014 each of Messrs. Cohrs, Morris and Spain were granted phantom units of Rentech Nitrogen Partners, L.P., a publicly traded Delaware limited partnership and one of our indirectly majority owned subsidiaries, or RNP, common units in the amounts of 7,554, 4,648 and 1,877, respectively. Such phantom units will vest in three equal parts on each of the next three anniversaries of December 14, 2014. Further, on July 1, 2014, each of Messrs. Burke, Forman and Washburn were granted phantom units of RNP common units in the amounts of 750, 1,490 and 750, respectively. Such phantom units will vest on July 1, 2015. In addition, on July 1, 2014, each of Messrs. Burke, Forman and Washburn were granted RNP common units in the amounts of 1,490, 2,970 and 1,490, respectively.
| ITEM 13. | CERTAIN RELATIONSHIPS AND RELATED TRANSACTIONS, AND DIRECTOR INDEPENDENCE |
Pursuant to its charter, the Audit Committee is responsible for reviewing and approving all related party transactions. While we do not have a formal written policy or procedure for the review, approval or ratification of related party transactions, the Audit Committee must review the material facts of any such transaction and approve that transaction on a case by case basis.
On February 12, 2015, we entered into an amendment to the Subscription Agreement and the A&R GSO Credit Agreement with certain funds managed by or affiliated with GSO Capital, which beneficially own approximately 16.4% of our common stock on an as-converted basis as of March 2, 2015. See “Note 25 — Subsequent Events” to the consolidated financial statements included in “Part II—Item 8. Financial Statements and Supplementary Data” in this report for further information. These transactions were approved by our Board, including all of the members of the Audit Committee, with Messrs. Forman, Ostrover and Moore abstaining from the approval.
| ITEM 14. | PRINCIPAL ACCOUNTANT FEES AND SERVICES |
The following table presents fees billed and expected to be billed for audit fees, audit-related fees, tax fees and other services rendered by PricewaterhouseCoopers LLC for the years ended December 31, 2014 and 2013.
| For the Years Ended December 31, |
||||||||
| 2014 | 2013 | |||||||
| Audit Fees (1) |
$ | 2,418,600 | $ | 1,715,000 | ||||
| Audit-Related Fees (2) |
41,000 | 399,800 | ||||||
| Tax Fees (3) |
497,800 | 435,000 | ||||||
| All Other Fees |
— | — | ||||||
|
|
|
|
|
|||||
| Total |
$ | 2,957,400 | $ | 2,549,800 | ||||
|
|
|
|
|
|||||
| (1) | Represents the aggregate fees billed and expected to be billed for professional services rendered for the audit of Rentech’s and RNP’s consolidated financial statements for the years ended December 31, 2014 and 2013, and for the audit of Rentech’s and RNP’s internal control over financial reporting and reviews of the financial statements included in Rentech’s and RNP’s quarterly reports on Form 10-Q, assistance with Securities Act filings and related matters, consents issued in connection with Securities Act filings, and consultations on financial accounting and reporting standards arising during the course of the audit for the years ended December 31, 2014 and 2013. |
| (2) | Represents fees billed for assurance and related services that are reasonably related to the performance of the audit or review of Rentech’s and RNP’s consolidated financial statements, and are not reported as Audit Fees. |
| (3) | Represents the aggregate fees billed and expected to be billed for Rentech’s 2014 and 2013 tax return and tax consultation regarding various issues including property and sales tax issues, research and development credits and RNP’s structure. |
The Audit Committee is required to pre-approve all audit services and non-audit services (other than de minimis non-audit services as defined by the Sarbanes-Oxley Act of 2002) to be provided by our independent registered public accounting firm. Non-audit services were reviewed with the Audit Committee, which concluded that the provision of such services by PricewaterhouseCoopers LLP were compatible with the maintenance of that firm’s independence in the conduct of its auditing functions. The Audit Committee pre-approved all fees incurred in the years ended December 31, 2014 and 2013.
184
Table of Contents
PART IV
| ITEM 15. | EXHIBITS AND FINANCIAL STATEMENT SCHEDULES |
(a)(1) and (2) Financial Statements and Schedules.
The information required by this Item is included in “Part II — Item 8. Financial Statements and Supplementary Data” of this report.
(b) Exhibits.
See Exhibit Index.
185
Table of Contents
EXHIBIT INDEX
| 2.1* |
Stock Purchase Agreement, dated as of May 1, 2013, among the Company, the Buyer, the Sellers and Anthony M. Hauff, as the Sellers’ representative (incorporated by reference to Exhibit 2.1 to the Current Report on Form 8-K filed by Rentech on May 7, 2013). | |
| 2.2* |
Membership Interest Purchase and Sale Agreement, dated as of February 28, 2014, by and among Rentech, RES and the Buyer (incorporated by reference to Exhibit 2.1 to the Current Report on Form 8-K filed by Rentech on March 6, 2014). | |
| 3.1 |
Amended and Restated Articles of Incorporation, dated April 29, 2005 (incorporated by reference to Exhibit 3(i) to the Quarterly Report on Form 10-Q, for the quarterly period ended March 31, 2005, filed by Rentech on May 9, 2005). | |
| 3.2 |
Articles of Amendment to Amended and Restated Articles of Incorporation of Rentech, Inc. (incorporated by reference to Exhibit 3.1 to the Quarterly Report on Form 10-Q, for the quarterly period ended March 31, 2008, filed by Rentech on May 9, 2008). | |
| 3.3 |
Articles of Amendment to Amended and Restated Articles of Incorporation of Rentech, Inc. (incorporated by reference to Exhibit 3.1 to the Current Report on Form 8-K filed by Rentech on May 22, 2009). | |
| 3.4 |
Articles of Amendment to Amended and Restated Articles of Incorporation of Rentech, Inc., as amended (incorporated by reference to Exhibit 3.1 to the Current Report on Form 8-K filed by Rentech on May 14, 2010). | |
| 3.5 |
Bylaws dated November 30, 2004 (incorporated by reference to Exhibit 3(ii) to the Annual Report on Form 10-K for the year ended September 30, 2004 filed by Rentech on December 9, 2004). | |
| 3.6 |
Articles of Amendment to the Articles of Incorporation of Rentech, Inc. (incorporated by reference to Exhibit 3.1 to the Current Report on Form 8-K filed by Rentech on August 5, 2011). | |
| 3.7 |
Articles of Amendment to Amended and Restated Articles of Incorporation of the Company (incorporated by reference to Exhibit 3.1 to the Current Report on Form 8-K filed by Rentech on April 11, 2014). | |
| 4.1 |
Stock Purchase Warrant, dated September 17, 2004, by and between Rentech, Inc. and Mitchell Technology Investments (incorporated by reference to Exhibit 10.2 to the Current Report on Form 8-K filed by Rentech on September 23, 2004). | |
| 4.2 |
Registration Rights Agreement, dated September 17, 2004, by and between Rentech, Inc. and Mitchell Technology Investments (incorporated by reference to Exhibit 10.3 to Current Report on Form 8-K filed by Rentech on September 23, 2004). | |
| 4.3 |
Tax Benefit Preservation Plan, dated as of August 5, 2011, Rentech, Inc. and Computershare Trust Company, N.A., which includes the Form of Right Certificate as Exhibit B and the Summary of Rights to Purchase Preferred Shares as Exhibit C (incorporated by reference to Exhibit 4.1 to the Current Report on Form 8-K filed by Rentech on August 5, 2011). | |
| 4.4 |
Indenture, dated as April 12, 2013, among Rentech Nitrogen Partners, L.P., Rentech Nitrogen Finance Corporation, the guarantors named therein, Wells Fargo Bank, National Association, as Trustee, and Wilmington Trust, National Association, as Collateral Trustee (incorporated by reference from Exhibit 4.1 to the Current Report on Form 8-K (File No. 001-35334) filed by RNP with the Securities and Exchange Commission on April 16, 2013). | |
| 4.5 |
Forms of 6.5% Second Lien Senior Secured Notes due 2021 (incorporated by reference from Exhibit 4.2 to the Current Report on Form 8-K (File No. 001-35334) filed by RNP with the Securities and Exchange Commission on April 16, 2013). | |
| 4.6 |
Intercreditor Agreement, dated as of April 12, 2013, among Credit Suisse AG, Cayman Islands Branch, as priority lien agent, Wilmington Trust, National Association, as second lien collateral trustee, Rentech Nitrogen Partners, L.P., Rentech Nitrogen Finance Corporation and the subsidiaries of Rentech Nitrogen Partners, L.P. named therein (incorporated by reference from Exhibit 4.3 to the Current Report on Form 8-K (File No. 001-35334) filed by RNP with the Securities and Exchange Commission on April 16, 2013). | |
| 4.7 |
Amendment to Tax Benefit Preservation Plan, dated as of August 1, 2014, between Rentech, Inc. and Computershare Trust Company, N.A., as Rights Agent (incorporated by reference to Exhibit 4.1 to the Current Report on Form 8-K filed by Rentech on August 1, 2014). | |
186
Table of Contents
| 10.1** |
Amended and Restated Employment Agreement by and between Rentech, Inc. and D. Hunt Ramsbottom, Jr. dated December 31, 2008 (incorporated by reference to Exhibit 10.43 to Amendment No. 1 to the Annual Report on Form 10-K/A filed by Rentech on January 28, 2009). | |
| 10.2** |
Amended and Restated Employment Agreement by and between Rentech, Inc. and Sean Ebnet dated July 26, 2013 (incorporated by reference to Exhibit 10.2 to the Annual Report on Form 10-K filed by Rentech on March 17, 2014). | |
| 10.3** |
Employment Agreement by and between Rentech, Inc. and Dan J. Cohrs, dated October 22, 2008 (incorporated by reference to Exhibit 10.21 to the Annual Report on Form 10-K for the year ended September 30, 2008 filed by Rentech on December 15, 2008). | |
| 10.4** |
Employment Agreement by and between Rentech, Inc. and Harold Wright, dated November 3, 2009 (incorporated by reference to Exhibit 10.4 to the Annual Report on Form 10-K filed by Rentech on March 17, 2014). | |
| 10.5** |
Employment Agreement with Colin Morris (incorporated by reference to Exhibit 10.3 to the Current Report on Form 8-K filed by Rentech on November 6, 2009). | |
| 10.6** |
Rentech, Inc. Compensation Plan for Non-Employee Directors (incorporated by reference to Exhibit 10.6 to the Annual Report on Form 10-K for the fiscal year ended September 30, 2010 filed by Rentech on December 14, 2010). | |
| 10.7** |
Form of Stock Option Grant Notice and Stock Option Agreement under 2006 Incentive Award Plan (incorporated by reference to Exhibit 10.1 to the Current Report on Form 8-K filed by Rentech on July 20, 2006). | |
| 10.8** |
2005 Stock Option Plan (incorporated by reference to Exhibit 10.34 to the Quarterly Report on Form 10-Q for the fiscal quarter ended December 31, 2004 filed by Rentech on February 9, 2005). | |
| 10.9** |
Amended and Restated Rentech, Inc. 2006 Incentive Award Plan (incorporated by reference to Exhibit 10.1 to the Current Report on Form 8-K filed by Rentech on March 29, 2007). | |
| 10.10** |
First Amendment to Rentech’s Amended and Restated 2006 Incentive Award Plan (incorporated by reference to Exhibit 10.1 to the Current Report on Form 8-K filed by Rentech on November 6, 2009). | |
| 10.11** |
Rentech, Inc. 2009 Incentive Award Plan (incorporated by reference to Exhibit 10.1 to the Current Report on Form 8-K filed by Rentech on May 22, 2009). | |
| 10.12** |
First Amendment to Rentech’s 2009 Incentive Award Plan (incorporated by reference to Exhibit 10.2 to the Current Report on Form 8-K filed by Rentech on November 6, 2009). | |
| 10.13 |
Distribution Agreement, dated April 26, 2006, by and between Royster-Clark Resources LLC and Rentech Development Corporation (incorporated by reference to Exhibit 10.1 to the Form S-1 (File No. 333-176065) filed by RNP on August 5, 2011). | |
| 10.14 |
Amendment to Distribution Agreement, dated October 13, 2009, among Rentech Energy Midwest Corporation, Rentech Development Corporation and Agrium U.S., Inc. (incorporated by reference to Exhibit 10.2 to the Form S-1 (File No. 333-176065) filed by RNP on August 5, 2011). | |
| 10.15 |
Assignment and Assumption Agreement, dated as of September 29, 2006, by and between Royster-Clark, Inc., Agrium U.S. Inc. and Rentech Development Corporation (incorporated by reference to Exhibit 10.3 to the Form S-1 (File No. 333-176065) filed by RNP on August 5, 2011). | |
| 10.16** |
Amended and Restated 2009 Incentive Award Plan (incorporated by reference to Exhibit 10.1 to the Current Report on Form 8-K filed by Rentech on May 13, 2011). | |
| 10.17 |
Contribution, Conveyance and Assignment Agreement, dated as of November 9, 2011, by and among Rentech, Inc., Rentech Development Corporation, Rentech Nitrogen Holdings, Inc., Rentech Nitrogen GP, LLC, Rentech Nitrogen Partners, L.P. and Rentech Energy Midwest Corporation (incorporated by reference to Exhibit 10.1 to the Current Report on Form 8-K (File No. 001-35334) filed by RNP on November 9, 2011). | |
| 10.18 |
Omnibus Agreement, dated as of November 9, 2011, by and among Rentech, Inc., Rentech Nitrogen GP, LLC and Rentech Nitrogen Partners, L.P. (incorporated by reference to Exhibit 10.2 to the Current Report on Form 8-K (File No. 001-35334) filed by RNP on November 9, 2011). | |
187
Table of Contents
| 10.19 |
Services Agreement, dated as of November 9, 2011, by and among Rentech Nitrogen Partners, L.P., Rentech Nitrogen GP, LLC and Rentech, Inc. (incorporated by reference to Exhibit 10.3 to the Current Report on Form 8-K (File No. 001-35334) filed by RNP on November 9, 2011). | |
| 10.20 |
Indemnification Agreement dated November 9, 2011, by and between Rentech Nitrogen Partners, L.P. and D. Hunt Ramsbottom (all other Indemnification Agreements, which are substantially identical in all material respects, except as to the parties thereto and the dates of execution, are omitted pursuant to Instruction 2 to Item 601 of Regulation S-K) (incorporated by reference to Exhibit 10.42 to the Annual Report on Form 10-K filed by Rentech on December 14, 2011). | |
| 10.21 |
Agreement, dated November 1, 2010, between Northern Illinois Gas Company, d/b/a Nicor Gas Company and Rentech Energy Midwest (incorporated by reference to Exhibit 10.14 to the Form S-1 filed by Rentech Nitrogen Partners, L.P. on August 5, 2011). | |
| 10.22 |
Asset Purchase Agreement, dated as of September 10, 1998, by and between ExxonMobil Corporation (formerly known as Mobil Oil Corporation) and Rentech Nitrogen Pasadena, LLC (formerly known as Agrifos Fertilizer L.P.) (incorporated by reference to Exhibit 10.35 to the Annual Report on Form 10-K for the year ended December 31, 2012 (File No. 001-35334) filed by Rentech Nitrogen Partners, L.P. on March 18, 2013). | |
| 10.23*** |
Marketing Agreement, dated as of March 22, 2011, by and between Interoceanic Corporation and Rentech Nitrogen Pasadena, LLC (Agrifos Fertilizer L.L.C.) (incorporated by reference to Exhibit 10.36 to the Annual Report on Form 10-K for the year ended December 31, 2012 (File No. 001-35334) filed by Rentech Nitrogen Partners, L.P. on March 18, 2013). | |
| 10.24 |
Credit Agreement, dated as of April 12, 2013, among Rentech Nitrogen Partners, L.P. and Rentech Nitrogen Finance Corporation, as borrowers, the other parties thereto that are designated as credit parties from time to time, Credit Suisse AG, Cayman Islands Brach, for itself and as agent for all lenders, the other financial institutions party thereto, as lenders, Credit Suisse Securities (USA) LLC, as sole lead arranger and bookrunner, and BMO Harris Bank, N.A., as syndication agent (incorporated by reference from Exhibit 10.1 to the Quarterly Report on Form 10-Q (File No. 001-35334) filed by RNP with the Securities and Exchange Commission on May 9, 2013). | |
| 10.25 |
Second Amended and Restated 2009 Incentive Award Plan (incorporated by reference to Exhibit 10.1 to the Current Report on Form 8-K filed by Rentech on June 5, 2013). | |
| 10.26 |
Amended and Restated Joint Venture and Operating Agreement of Rentech Graanul, LLC, dated April 30, 2013, by and among the parties specified therein (incorporated by reference to Exhibit 10.2 to the Quarterly Report on Form 10-Q filed by Rentech on August 8, 2013). | |
| 10.27*** |
Agreement for the Sale and Purchase of Biomass, dated April 30, 2013 between Drax Power Limited and RTK WP Canada, ULC (incorporated by reference to Exhibit 10.3 to the Quarterly Report on Form 10-Q filed by Rentech on August 8, 2013). | |
| 10.28*** |
Master Services Agreement, dated April 30, 2013 between RTK WP Canada, ULC and Quebec Stevedoring Company Limited (incorporated by reference to Exhibit 10.4 to the Quarterly Report on Form 10-Q filed by Rentech on August 8, 2013). | |
| 10.29*** |
Credit Agreement dated as of September 23, 2013, among Rentech Nitrogen Holdings, Inc., Credit Suisse AG, Cayman Islands Branch, as administrative agent, and each other lender from time to time party hereto (incorporated by reference to Exhibit 10.38 to the Annual Report on Form 10-K filed by Rentech on March 17, 2014). | |
| 10.30 |
Guaranty Agreement dated as of September 23, 2013 by Rentech, Inc. in favor of Credit Suisse AG, Cayman Islands Branch, as administrative agent for the benefit of the lender parties (incorporated by reference to Exhibit 10.2 to the Quarterly Report on Form 10-Q filed by Rentech on November 7, 2013). | |
| 10.31*** |
Amended and Restated Marketing Agreement, effective as of January 1, 2014, by and between Interoceanic Corporation and Rentech Nitrogen Pasadena, LLC (Agrifos Fertilizer L.L.C.) (incorporated by reference to Exhibit 10.32 to the Annual Report on Form 10-K for the year ended December 31, 2013 (File No. 001-35334) filed by Rentech Nitrogen Partners, L.P. on March 17, 2014). | |
| 10.32 |
Amendment Agreement for the Sale and Purchase of Biomass, dated February 11, 2014 between Drax Power Limited and RTK WP Canada, ULC (incorporated by reference to Exhibit 10.41 to the Annual Report on Form 10-K filed by Rentech on March 17, 2014). | |
| 10.33 |
First Amendment to Credit Agreement, dated as of March 7, 2014, by and among Rentech Nitrogen Partners, L.P., Rentech Nitrogen Finance Corporation, the subsidiary guarantors party hereto, the lenders party hereto and Credit Suisse AG, Cayman Islands Branch, as agent for the lenders. (incorporated by reference to Exhibit 10.33 to the Annual Report on Form 10-K for the year ended December 31, 2013 (File No. 001-35334) filed by Rentech Nitrogen Partners, L.P. on March 17, 2014). | |
188
Table of Contents
| 10.34 |
Subscription Agreement, dated as of April 9, 2014, by and among the Company, the Purchasers and the Purchasers’ Representative thereunder (incorporated by reference to Exhibit 10.1 to the Current Report on Form 8-K filed by Rentech on April 11, 2014). | |
| 10.35 |
Registration Rights Agreement, dated as of April 9, 2014, by and among the Company, the Purchasers and the Purchasers’ Representative (incorporated by reference to Exhibit 10.2 to the Current Report on Form 8-K filed by Rentech on April 11, 2014). | |
| 10.36 |
Form of Put Option Agreement, dated as of April 9, 2014, by and between DSHC and each Purchaser (incorporated by reference to Exhibit 10.3 to the Current Report on Form 8-K filed by Rentech on April 11, 2014). | |
| 10.37 |
Pledge Agreement, dated as of April 9, 2014, by and among DSHC, the Purchasers, and Credit Suisse AG Cayman Islands Branch (incorporated by reference to Exhibit 10.4 to the Current Report on Form 8-K filed by Rentech on April 11, 2014). | |
| 10.38 |
Term Loan Credit Agreement, dated as of April 9, 2014, among Rentech Nitrogen Holdings, Inc., the Lenders party thereto, and Credit Suisse AG Cayman Islands Branch (incorporated by reference to Exhibit 10.5 to the Current Report on Form 8-K filed by Rentech on April 11, 2014). | |
| 10.39 |
Guaranty Agreement, dated as of April 9, 2014, by the Company in favor of Credit Suisse AG Cayman Islands Branch (incorporated by reference to Exhibit 10.6 to the Current Report on Form 8-K filed by Rentech on April 11, 2014). | |
| 10.40 |
Pledge Agreement, dated as of April 9, 2014, by and between Rentech Nitrogen Holdings, Inc. and Credit Suisse AG, Cayman Islands Branch (incorporated by reference to Exhibit 10.7 to the Current Report on Form 8-K filed by Rentech on April 11, 2014). | |
| 10.41 |
Settlement Agreement, dated as of April 9, 2014, by and among the Company and each of the Investors identified therein (incorporated by reference to Exhibit 10.8 to the Current Report on Form 8-K filed by Rentech on April 11, 2014). | |
| 10.42 |
Credit Agreement, dated as of July 22, 2014, among Rentech Nitrogen Partners, L.P. and Rentech Nitrogen Finance Corporation, as borrowers, Rentech Nitrogen LLC, Rentech Nitrogen Pasadena Holdings, LLC and Rentech Nitrogen Pasadena, LLC, as subsidiary guarantors, and General Electric Capital Corporation, as administrative agent, GE Capital Markets, Inc. as sole lead arranger and bookrunner, and the other lender parties thereto (incorporated by reference to Exhibit 10.1 to the Current Report on Form 8-K filed by RNP on July 25, 2014). | |
| 10.43 |
Waiver to Term Loan Credit Agreement and Guaranty Agreement, dated as of August 14, 2014, among Rentech Nitrogen Holdings, Inc., the Lenders party thereto, and Credit Suisse AG Cayman Islands Branch (incorporated by reference to Exhibit 10.1 to the Current Report on Form 8-K filed by Rentech on August 18, 2014). | |
| 10.44 |
First Amendment to Credit Agreement, dated as of August 13, 2014, among Rentech Nitrogen Partners, L.P. and Rentech Nitrogen Finance Corporation, as borrowers, Rentech Nitrogen LLC, Rentech Nitrogen Pasadena Holdings, LLC and Rentech Nitrogen Pasadena, LLC, as subsidiary guarantors, and General Electric Capital Corporation, as agent, and the lenders parties thereto (incorporated by reference to Exhibit 10.1 to the Current Report on Form 8-K filed by RNP on August 18, 2014). | |
| 10.45 |
Letter Agreement Re: MIPSA Purchase Price, dated as of August 28, 2014, between Rentech, Inc. and Sunshine Kaidi New Energy Group Co., Ltd. (incorporated by reference to Exhibit 10.4 to the Quarterly Report on Form 10-Q filed by Rentech on November 10, 2014). | |
| 10.46 |
Letter Agreement Re: MIPSA Closing Date, dated as of September 30, 2014, between Rentech, Inc. and Sunshine Kaidi New Energy Group Co., Ltd. (incorporated by reference to Exhibit 10.5 to the Quarterly Report on Form 10-Q filed by Rentech on November 10, 2014). | |
| 10.47** |
Employment Agreement, entered into as of December 30, 2014 and effective as of December 9, 2014, by and between Rentech, Inc. and Keith B. Forman (incorporated by reference to Exhibit 10.1 to the Current Report on Form 8-K/A filed by Rentech, Inc. and the Partnership on January 6, 2015). | |
| 10.48** |
Inducement Total Shareholder Return Performance Share Award entered into as of December 30, 2014 by and between Rentech, Inc. and Keith B. Forman (incorporated by reference to Exhibit 10.2 to the Current Report on Form 8-K/A filed by Rentech, Inc. and the Partnership on January 6, 2015). | |
189
Table of Contents
| 10.49** |
Inducement Stock Option Grant Notice and Stock Option Agreement entered into as of December 30, 2014 by and between Rentech, Inc. and Keith B. Forman (incorporated by reference to Exhibit 10.3 to the Current Report on Form 8-K/A filed by Rentech, Inc. and the Partnership on January 6, 2015). | |
| 10.50 |
First Amendment to Second Amended and Restated Rentech, Inc. 2009 Incentive Award Plan, effective as of July 1, 2014 (incorporated by reference to Exhibit 10.1 to Current Report on Form 8-K filed by Rentech, Inc. on July 2, 2014). | |
| 10.51 |
Amendment No. 1 to the Subscription Agreement, dated as of February 12, 2015, by and among the Company, the Purchasers and the Purchasers’ Representative thereunder (incorporated by reference to Exhibit 10.1 to Current Report on Form 8-K filed by Rentech, Inc. on February 19, 2015). | |
| 10.52 |
Amended and Restated Registration Rights Agreement, dated as of February 12, 2015, by and among the Company, the Purchasers and the Purchasers’ Representative (incorporated by reference to Exhibit 10.2 to Current Report on Form 8-K filed by Rentech, Inc. on February 19, 2015). | |
| 10.53 |
Form of Amended and Restated Put Option Agreement, dated as of February 12, 2015, by and between DSHC, LLC and each Purchaser (incorporated by reference to Exhibit 10.3 to Current Report on Form 8-K filed by Rentech, Inc. on February 19, 2015). | |
| 10.54 |
Amended and Restated Term Loan Credit Agreement, dated as of February 12, 2015, among Rentech Nitrogen Holdings, Inc., the Lenders party thereto, and Credit Suisse AG, Cayman Islands Branch (incorporated by reference to Exhibit 10.4 to Current Report on Form 8-K filed by Rentech, Inc. on February 19, 2015). | |
| 10.55 |
Amended and Restated Guaranty Agreement, dated as of February 12, 2015, by the Company in favor of Credit Suisse AG, Cayman Islands Branch (incorporated by reference to Exhibit 10.5 to Current Report on Form 8-K filed by Rentech, Inc. on February 19, 2015). | |
| 14 |
Code of Ethics (incorporated by reference to Exhibit 14 to the Annual Report on Form 10-K for the fiscal year ended September 30, 2008 filed by Rentech on December 15, 2008). | |
| 21 |
Subsidiaries of Rentech, Inc. | |
| 23.1 |
Consent of Independent Registered Public Accounting Firm. | |
| 31.1 |
Certification of Chief Executive Officer Pursuant to Rule 13a-14 or Rule 15d-14(a). | |
| 31.2 |
Certification of Chief Financial Officer pursuant to Rule 13a-14 or Rule 15d-14(a). | |
| 32.1 |
Certification of Chief Executive Officer pursuant to 18 U.S.C. Section 1350. | |
| 32.2 |
Certification of Chief Financial Officer pursuant to 18 U.S.C. Section 1350. | |
| 101 |
The following financial information from the Company’s Annual Report on Form 10-K for the year ended December 31, 2014 formatted in Extensible Business Reporting Language, or XBRL, includes: (i) the Consolidated Balance Sheets, (ii) the Consolidated Statements of Operations, (iii) the Consolidated Statements of Stockholders’ Equity, (iv) the Consolidated Statements of Cash Flows and (v) the Notes to Consolidated Financial Statements, detailed tagged. | |
| * | Schedules and exhibits have been omitted from this Exhibit pursuant to Item 601(b)(2) of Regulation S-K and are not filed herewith. The Company agrees to furnish supplementally a copy of the omitted schedules and exhibits to the Securities and Exchange Commission upon request. |
| ** | Management contract or compensatory plan or arrangement. |
| *** | Certain portions of this Exhibit have been omitted and filed separately under an application for confidential treatment. |
190
Table of Contents
SIGNATURES
Pursuant to the requirements of Section 13 or 15(d) of the Securities Exchange Act of 1934, the registrant has duly caused this report to be signed on its behalf by the undersigned, thereunto duly authorized.
| RENTECH, INC. |
| /s/ Keith B. Forman |
| Keith B. Forman, |
| Chief Executive Officer and President |
Date: March 16, 2015
Pursuant to the requirements of the Securities Exchange Act of 1934, this report has been signed below by the following persons on behalf of the registrant and in the capacities and on the dates indicated.
| /s/ Keith B. Forman |
| Keith B. Forman, |
| Chief Executive Officer, President and Director (principal executive officer) |
Date: March 16, 2015
| /s/ Dan J. Cohrs |
| Dan J. Cohrs, |
| Executive Vice President and Chief Financial Officer (principal financial officer) |
Date: March 16, 2015
| /s/ Jeffrey R. Spain |
| Jeffrey R. Spain, |
| Senior Vice President, Finance, Accounting & Administration (principal accounting officer) |
Date: March 16, 2015
| /s/ Michael S. Burke |
| Michael S. Burke, |
| Director |
Date: March 16, 2015
| /s/ Wesley K. Clark |
| Wesley K. Clark, |
| Director |
Date: March 16, 2015
| /s/ Patrick J. Moore |
| Patrick J. Moore, |
| Director |
Date: March 16, 2015
| /s/ Douglas I. Ostrover |
| Douglas I. Ostrover, |
| Director |
191
Table of Contents
Date: March 16, 2015
| /s/ Ronald M. Sega |
| Ronald M. Sega, |
| Director |
Date: March 16, 2015
| /s/ Edward M. Stern |
| Edward M. Stern, |
| Director |
Date: March 16, 2015
| /s/ Halbert S. Washburn |
| Halbert S. Washburn, |
| Chairman and Director |
Date: March 16, 2015
| /s/ John A. Williams |
| John A. Williams, |
| Director |
Date: March 16, 2015
192