Attached files
| file | filename |
|---|---|
| EXCEL - IDEA: XBRL DOCUMENT - PAM TRANSPORTATION SERVICES INC | Financial_Report.xls |
| EX-31.2 - EXHIBIT 31.2 - PAM TRANSPORTATION SERVICES INC | ex31-2.htm |
| EX-21.1 - EXHIBIT 21.1 - PAM TRANSPORTATION SERVICES INC | ex21-1.htm |
| EX-23.1 - EXHIBIT 23.1 - PAM TRANSPORTATION SERVICES INC | ex23-1.htm |
| EX-31.1 - EXHIBIT 31.1 - PAM TRANSPORTATION SERVICES INC | ex31-1.htm |
| EX-32.1 - EXHIBIT 32.1 - PAM TRANSPORTATION SERVICES INC | ex32-1.htm |
UNITED STATES
SECURITIES AND EXCHANGE COMMISSION
Washington, D.C. 20549
FORM 10-K
|
☒ |
Annual Report Pursuant to Section 13 or 15(d) of the Securities Exchange Act of 1934 |
For the Fiscal Year Ended December 31, 2014
or
|
☐ |
Transition Report Pursuant to Section 13 or 15(d) of the Securities Exchange Act of 1934 |
For the transition period from ________to________
Commission File No. 0-15057

P.A.M. TRANSPORTATION SERVICES, INC.
(Exact name of registrant as specified in its charter)
|
Delaware |
71-0633135 | |
|
(State or other jurisdiction of incorporation or organization) |
(I.R.S. Employer Identification No.) |
297 West Henri De Tonti Blvd, Tontitown, Arkansas 72770
(Address of principal executive offices) (Zip Code)
(479) 361-9111
Registrant's telephone number, including area code
Securities registered pursuant to section 12(b) of the Act:
|
Title of each class |
Name of each exchange on which registered | |
|
Common Stock, $.01 par value |
NASDAQ Global Market |
Securities registered pursuant to section 12(g) of the Act: None
Indicate by check mark if the registrant is a well-known seasoned issuer, as defined in Rule 405 of the Securities Act.
|
Yes ☐ |
|
No ☑ |
Indicate by check mark if the registrant is not required to file reports pursuant to Section 13 or Section 15(d) of the Act.
|
Yes ☐ |
|
No ☑ |
Indicate by check mark whether the registrant (1) has filed all reports required to be filed by Section 13 or 15(d) of the Securities Exchange Act of 1934 during the preceding 12 months (or for such shorter period that the registrant was required to file such reports), and (2) has been subject to such filing requirements for the past 90 days.
|
Yes ☑ |
|
No ☐ |
Indicate by check mark whether the registrant has submitted electronically and posted on its corporate website, if any, every Interactive Data File required to be submitted and posted pursuant to Rule 405 of Regulation S-T (§232.405 of this chapter) during the preceding 12 months (or for such shorter period that the registrant was required to submit and post such files).
|
Yes ☑ |
|
No ☐ |
Indicate by check mark if disclosure of delinquent filers pursuant to Item 405 of Regulation S-K (§229.405 of this chapter) is not contained herein, and will not be contained, to the best of the registrant’s knowledge, in definitive proxy or information statements incorporated by reference in Part III of this Form 10-K or any amendment to this Form 10-K. ☐
Indicate by check mark whether the registrant is a large accelerated filer, an accelerated filer, a non-accelerated filer, or a smaller reporting company. See the definitions of “large accelerated filer,” “accelerated filer” and “smaller reporting company” in Rule 12b-2 of the Exchange Act.
|
Large accelerated filer ☐ |
Accelerated filer ☑ |
||
|
Non-accelerated filer ☐ |
Smaller reporting company ☐ |
Indicate by check mark whether the registrant is a shell company (as defined in Rule 12b-2 of the Act).
|
Yes ☐ |
|
No ☑ |
The aggregate market value of the common stock of the registrant held by non-affiliates of the registrant computed by reference to the average of the closing bid and ask prices of the common stock as of the last business day of the registrant's most recently completed second quarter was $89,915,646. Solely for the purposes of this response, executive officers, directors and beneficial owners of more than five percent of the registrant’s common stock are considered the affiliates of the registrant at that date.
The number of shares outstanding of the registrant’s common stock, as of February 23, 2015: 7,427,115 shares of $.01 par value common stock.
DOCUMENTS INCORPORATED BY REFERENCE
Portions of the registrant’s definitive Proxy Statement for its Annual Meeting of Stockholders to be held on April 28, 2015, are incorporated by reference in answer to Part III of this report. Such proxy statement will be filed with the Securities and Exchange Commission within 120 days of the Registrant’s fiscal year ended December 31, 2014.
FORWARD-LOOKING STATEMENTS
This Annual Report on Form 10-K (this “Report”) contains forward-looking statements, including statements about our operating and growth strategies, our expected financial position and operating results, industry trends, our capital expenditure and financing plans and similar matters. Such forward-looking statements are found throughout this Report, including under Item 1, Business, Item 1A, Risk Factors, Item 7, Management’s Discussion and Analysis of Financial Condition and Results of Operations, and Item 7A, Quantitative and Qualitative Disclosures About Market Risk. In those and other portions of this Report, the words “believe,” “may,” “will,” “estimate,” “continue,” “anticipate,” “intend,” “expect,” “project” and similar expressions, as they relate to us, our management, and our industry are intended to identify forward-looking statements. We have based these forward-looking statements largely on our current expectations and projections about future events and financial trends affecting our business. Actual results may differ materially. Some of the risks, uncertainties and assumptions that may cause actual results to differ from these forward-looking statements are described under the headings “Risk Factors,” “Management’s Discussion and Analysis of Financial Condition and Results of Operations,” and “Quantitative and Qualitative Disclosures About Market Risk.”
All forward-looking statements attributable to us, or to persons acting on our behalf, are expressly qualified in their entirety by this cautionary statement.
We undertake no obligation to publicly update or revise any forward-looking statements, whether as a result of new information, future events or otherwise. In light of these risks and uncertainties, the forward-looking events and circumstances discussed in this Report might not transpire.
P.A.M. TRANSPORTATION SERVICES, INC.
FORM 10-K
For the fiscal year ended December 31, 2014
TABLE OF CONTENTS
|
PART I |
Page | |
|
Item 1 |
Business |
1 |
|
Item 1A |
Risk Factors |
8 |
|
Item 1B |
Unresolved Staff Comments |
16 |
|
Item 2 |
Properties |
17 |
|
Item 3 |
Legal Proceedings |
17 |
|
Item 4 |
Mine Safety Disclosures |
18 |
|
PART II |
||
|
Item 5 |
Market for Registrant's Common Equity, Related Stockholder Matters and Issuer Purchases of Equity Securities |
18 |
|
Item 6 |
Selected Financial Data |
21 |
|
Item 7 |
Management's Discussion and Analysis of Financial Condition and Results of Operations |
22 |
|
Item 7A |
Quantitative and Qualitative Disclosures About Market Risk |
35 |
|
Item 8 |
Financial Statements and Supplementary Data |
36 |
|
Item 9 |
Changes in and Disagreements with Accountants on Accounting and Financial Disclosure |
68 |
|
Item 9A |
Controls and Procedures |
68 |
|
Item 9B |
Other Information |
70 |
|
PART III |
||
|
Item 10 |
Directors, Executive Officers and Corporate Governance |
70 |
|
Item 11 |
Executive Compensation |
70 |
|
Item 12 |
Security Ownership of Certain Beneficial Owners and Management and Related Stockholder Matters |
70 |
|
Item 13 |
Certain Relationships and Related Transactions, and Director Independence |
71 |
|
Item 14 |
Principal Accounting Fees and Services |
71 |
|
PART IV |
||
|
Item 15 |
Exhibits, Financial Statement Schedules |
71 |
|
SIGNATURES |
74 | |
|
EXHIBIT INDEX |
75 |
PART I
Item 1. Business.
Unless the context otherwise requires, all references in this Annual Report on Form 10-K to “P.A.M.,” the “Company,” “we,” “our,” or “us” mean P.A.M. Transportation Services, Inc. and its subsidiaries.
We are a truckload dry van carrier transporting general commodities throughout the continental United States, as well as in certain Canadian provinces. We also provide transportation services in Mexico under agreements with Mexican carriers. Our freight consists primarily of automotive parts, expedited goods, consumer goods, such as general retail store merchandise, and manufactured goods, such as heating and air conditioning units.
P.A.M. Transportation Services, Inc. is a holding company incorporated under the laws of the State of Delaware in June 1986. We conduct operations through the following wholly owned subsidiaries: P.A.M. Transport, Inc., T.T.X., LLC, P.A.M. Cartage Carriers, LLC, Overdrive Leasing, LLC, P.A.M. Logistics Services, Inc., Choctaw Express, LLC, Choctaw Brokerage, Inc., Transcend Logistics, Inc., Decker Transport Co., LLC, East Coast Transport and Logistics, LLC, S & L Logistics, Inc., and P.A.M. International, Inc. Our operating authorities are held by P.A.M. Transport, Inc., P.A.M. Cartage Carriers, LLC, Choctaw Express, LLC, Choctaw Brokerage, Inc., T.T.X., LLC, Decker Transport Co., LLC, and East Coast Transport and Logistics, LLC. Effective on January 1, 2010, the operations of most of the Company’s operating subsidiaries were consolidated under the P.A.M. Transport, Inc. name in an effort to more clearly reflect the Company’s scope and available service offerings.
We are headquartered and maintain our primary terminal, maintenance facilities, and our corporate and administrative offices in Tontitown, Arkansas, which is located in northwest Arkansas, a major center for the trucking industry and where the support services (including warranty repair services) for most major truck and trailer equipment manufacturers are readily available.
Segment Financial Information
The Company's operations are all in the motor carrier segment and are aggregated into a single reporting segment in accordance with the aggregation criteria under Generally Accepted Accounting Principles (“GAAP”).
Operations
Our operations can generally be classified into truckload services or brokerage and logistics services. Truckload services include those transportation services in which we utilize company owned trucks or owner-operator owned trucks for the pickup and delivery of freight. The brokerage and logistics services consists of services such as transportation scheduling, routing, mode selection, transloading and other value added services related to the transportation of freight which may or may not involve the use of company owned or owner-operator owned equipment. Both our truckload operations and our brokerage and logistics operations have similar economic characteristics and are impacted by virtually the same economic factors as discussed elsewhere in this Report. Truckload services operating revenues, before fuel surcharges represented 92.5%, 92.6% and 91.8% of total operating revenues for the years ended December 31, 2014, 2013 and 2012, respectively. The remaining operating revenues, before fuel surcharge for the same periods were generated by brokerage and logistics services, representing 7.5%, 7.4%, and 8.2%, respectively.
Approximately 56% of the Company's revenues are derived from domestic shipments while approximately 44% of our revenues are derived from freight originating from or destined to locations in Mexico or Canada.
Business and Growth Strategy
Our strategy focuses on the following elements:
Providing a Full Suite of Complimentary Truckload Transportation Solutions. Our objective is to provide our customers with a comprehensive solution to their truckload transportation needs. Our asset-based service offerings consist of dedicated, expedited, regional, automotive, and long-haul truckload services with non-asset based supply chain management, logistics and brokerage solutions rounding out our service offerings. Our range of service offerings also include our complete range of asset-based and non-asset based services to Mexico and Canada.
Developing Customer Relationships within High Density Traffic Lanes. We strive to maximize utilization and increase revenue per truck while minimizing our time and empty miles between loads. In this regard, we seek to provide equipment to our customers in defined regions and disciplined traffic lanes. This strategy enables us to:
|
• |
maintain more consistent equipment capacity; |
|
• |
provide a high level of service to our customers, including time-sensitive delivery schedules; |
|
• |
attract and retain drivers; and |
|
• |
maintain a sound safety record as drivers travel familiar routes. |
Providing Superior and Flexible Customer Service. Our wide range of services includes expedited services, dedicated fleet services, logistics services, time-definite delivery, two-person driving teams, cross-docking and consolidation programs, specialized trailers, international services to Mexico and Canada, and Internet-based customer access to delivery status. These services allow us to quickly and reliably respond to the diverse needs of our customers, and provide an advantage in securing new business.
Many of our customers depend on us to make delivery on a time-definite basis, meaning that parts or raw materials are scheduled for delivery as they are needed on a manufacturer’s production line. The need for this service is a product of modern manufacturing and assembly methods that are designed to decrease inventory levels and handling costs. Such requirements place a premium on the freight carrier’s delivery performance and reliability.
Employing Stringent Cost Controls. Throughout our organization, emphasis is placed on gaining efficiency in our processes with the primary goals of decreasing costs and improving customer satisfaction. Maintaining a high level of efficiency and prioritizing our focus on improvements allows us to minimize the number of non-driving personnel we employ and positively influence other overhead costs. Expenses are intensely scrutinized for opportunities for elimination, reduction or to further leverage our purchasing power to achieve more favorable pricing.
Industry
According to the American Trucking Association’s “American Trucking Trends 2013” report, the trucking industry transported approximately 68.5% of the total volume of freight transported in the United States during 2012, which equates to 9.4 billion tons and approximately $642 billion in revenue. The truckload industry is highly fragmented and is impacted by several economic and business factors, many of which are beyond the control of individual carriers. The state of the economy, coupled with equipment capacity levels, can impact freight rates. Volatility of various operating expenses, such as fuel and insurance, make the predictability of profit levels uncertain. Availability, attraction, retention and compensation of drivers also affect operating costs, as well as equipment utilization. In addition, the capital requirements for equipment, coupled with potential uncertainty of used equipment values, impact the ability of many carriers to expand their operations. The current operating environment is characterized by the following:
|
• |
Intense competition for freight; |
|
• |
Price increases by truck and trailer equipment manufacturers; |
|
• |
Volatile fuel costs; and |
|
• |
In recent years, many less profitable or undercapitalized carriers have been forced to consolidate or to exit the industry. |
Competition
The trucking industry is highly competitive and includes thousands of carriers, none of which dominates the market in which the Company operates. The Company's market share is less than 1% and we compete primarily with other irregular route medium- to long-haul truckload carriers, with private carriage conducted by our existing and potential customers, and, to a lesser extent, with the railroads. We compete on the basis of quality of service and delivery performance, as well as price. Many of the other irregular route long-haul truckload carriers have substantially greater financial resources, own more equipment or carry a larger total volume of freight as compared to the Company.
Marketing and Significant Customers
Our marketing emphasis is directed to that portion of the truckload market which is generally service-sensitive, as opposed to being solely price competitive. We seek to become a “core carrier” for our customers in order to maintain high utilization and capitalize on recurring revenue opportunities. Our marketing efforts are diversified and designed to gain access to dedicated, expedited, regional, automotive, and long-haul opportunities (including those in Mexico and Canada) and to expand supply chain solutions offerings.
Our marketing efforts are conducted by a sales staff of nine employees who are located in our major markets and supervised from our headquarters. These individuals work to improve profitability by maintaining an even flow of freight traffic (taking into account the balance between originations and destinations in a given geographical area), high utilization, and minimizing movement of empty equipment.
Our five largest customers, for which we provide carrier services covering a number of geographic locations, accounted for approximately 48%, 43% and 39% of our total revenues in 2014, 2013 and 2012, respectively. General Motors Company accounted for approximately 20%, 21% and 17% of our revenues in 2014, 2013 and 2012, respectively. Another large customer, Chrysler, accounted for approximately 14%, 12% and 12% of our revenues in 2014, 2013 and 2012, respectively.
We also provide transportation services to other manufacturers who are suppliers for automobile manufacturers. Approximately 48%, 46% and 37% of our revenues were derived from transportation services provided to the automobile industry during 2014, 2013 and 2012, respectively.
Revenue Equipment
At December 31, 2014, our truck fleet consists of 1,761 trucks, which includes 421 trucks leased under operating leases and 325 owner-operator trucks. At December 31, 2014, our trailer fleet consists of 4,919 trailers, which includes 141 trailers leased under operating leases. Our company-owned trucks and leased trucks are late model, well-maintained, premium trucks, which we believe help to attract and retain drivers, maximize fuel efficiency, promote safe operations, minimize maintenance and repair costs, and improve customer service by minimizing service interruptions caused by breakdowns. We evaluate our equipment purchasing decisions based on factors such as initial cost, useful life, warranty terms, expected maintenance costs, fuel economy, driver comfort, customer needs, manufacturer support, and resale value.
We contract with owner-operators to provide greater flexibility in responding to fluctuations in consumer demand. Owner-operators provide their own trucks and are contractually responsible for all associated expenses, including financing costs, fuel, maintenance, insurance, and taxes, among other things. They are also responsible for maintaining compliance with the Federal Motor Carrier Safety Administration regulations.
During 1999, the U.S. Environmental Protection Agency (“EPA”) mandated a three-phase strategy to reduce engine emissions from heavy-duty vehicles through a combination of advanced emissions control technologies and diesel fuel with a reduced sulfur content. The first phase (Phase I) mandated new engine emission standards for all model year 2004 heavy-duty trucks; however, through agreements with heavy-duty diesel engine manufacturers, the effective date was accelerated to October 1, 2002. Since October 1, 2002, all newly manufactured truck engines had to comply with the new engine emission standards. As of December 31, 2014, the Company-owned and leased truck fleet does not contain any trucks with the older Phase I engines.
In the second phase (Phase II), effective January 1, 2007, the EPA mandated a new set of more stringent emission standards for vehicles powered by diesel fuel engines manufactured in 2007 through 2009. As of December 31, 2014, our Company-owned and leased truck fleet consisted of fewer than 20 trucks with engines that comply with the Phase II emission standards (Phase II trucks) and are either leased to third parties or are in process of being sold. As compared to trucks powered by the Phase I engines, the trucks powered by the Phase II compliant diesel engines had a significantly higher purchase price and as a result, our depreciation expense increased over time as we replaced Phase I trucks with Phase II trucks.
During the third phase (Phase III), which was effective in 2010, final emission standards became effective. During 2014, the Company took delivery of approximately 300 trucks, all of which contained engines compliant with the Phase III emission standards. As of December 31, 2014, substantially all of our Company-owned and leased truck fleet consisted of trucks with engines that comply with the Phase III emission standards (Phase III trucks). During 2015, the Company expects to take delivery of 750 additional Phase III trucks. To date, Phase III trucks have shown increased fuel efficiency as compared to either the Phase I or Phase II truck fuel efficiency, however, Phase III trucks have a significant purchase price premium as compared to the purchase price of the Phase I and Phase II trucks, and as a result, our depreciation and lease expense per truck has increased. We expect that the costs to replace older trucks will continue to increase due to both an increase in new truck purchase prices and in maintenance costs as the engines become more complex to meet future EPA regulations. To the extent we are unable to offset these anticipated increased costs with rate increases charged to customers or offsetting cost savings in other areas, our results of operations will be adversely affected.
Technology
We have installed Qualcomm display units in all of our trucks. The Qualcomm system is a satellite-based global positioning and communications system that allows fleet managers to communicate directly with drivers. Drivers can provide location, status and updates directly to our computer system which increases productivity and convenience. This system provides us with accurate estimated time of arrival information, which optimizes load selection and service levels to our customers.
Our information systems manage the data provided by the Qualcomm devices to provide us with real-time information regarding the location, status and load assignment of our trucks, which permits us to better meet delivery schedules, respond to customer inquiries and match equipment with the next available load. Our system also provides real-time information electronically to our customers regarding the status of freight shipments and anticipated arrival times. This system provides our customers flexibility and convenience by extending supply chain visibility through electronic data interchange, the Internet and e-mail.
Maintenance
We have a strictly enforced comprehensive preventive maintenance program for our trucks and trailers. Inspections and various levels of preventive maintenance are performed at set intervals on both trucks and trailers. A maintenance and safety inspection is performed on all vehicles each time they return to a terminal.
Our trucks carry full warranty coverage for at least three years or 375,000 miles. Extended truck warranties can be negotiated with the truck manufacturer and manufacturers of major components, such as engine, transmission and differential manufacturers, for up to four years or 500,000 miles. Our trailers carry full warranties by the manufacturer for up to 5 years with certain components covered for up to ten years.
Employees
At December 31, 2014, we employed 2,911 persons, of whom 2,334 were drivers, 195 were employed in maintenance, 180 were employed in operations, 33 were employed in marketing, 105 were employed in safety and personnel, and 64 were employed in general administration and accounting. None of our employees are represented by a collective bargaining unit, and we believe that our employee relations are good.
Drivers
At December 31, 2014, we utilized 2,334 company drivers in our operations. We also had 325 owner-operators under contract who were compensated on a per mile basis. Our drivers are compensated on the basis of miles driven, loading and unloading, extra stops, and layovers in transit. Drivers can earn bonuses by recruiting other qualified drivers who become employed by us, and both cash and non-cash prizes are awarded for achieving certain miles per gallon goals. All of our drivers are recruited, screened, drug tested and participate in our driver training program. Our driver training program stresses the importance of safety and reliable, on-time delivery. Drivers are required to report to their driver managers daily and at the earliest possible moment when any condition occurs en route that might delay their scheduled delivery time.
Owner-operators are utilized through a contract with us to supply one or more tractors and drivers for our use. Owner-operators must pay their own tractor expenses, fuel, maintenance, insurance, and driver costs. They must meet and operate within our guidelines with respect to safety. We have a lease-purchase program whereby we offer owner-operators the opportunity to lease a tractor, with the option to purchase the tractor at the end of the lease term. We believe our lease-purchase program has contributed to our ability to attract and retain owner operators. At December 31, 2014, approximately 87 owner-operators were leasing 104 tractors in this program.
In addition to strict application screening and drug testing, before being permitted to operate a vehicle, our drivers must undergo classroom instruction on our policies and procedures, safety techniques as taught by the Smith System of Defensive Driving, and the proper operation of equipment, and must pass both written and road tests. Instruction in defensive driving and safety techniques continues after hiring, with seminars at several of our terminals. At December 31, 2014, we employed 84 persons on a full-time basis in our driver recruiting, training and safety instruction programs.
Intense competition in the trucking industry for qualified drivers has resulted in additional expense to recruit and retain an adequate supply of drivers, and has had a negative impact on the industry. Our operations have also been impacted and from time to time we have experienced under-utilization and increased expenses due to a shortage of qualified drivers. We place a high priority on the recruitment and retention of an adequate supply of qualified drivers.
Available Information
The Company maintains a website where additional information concerning its business can be found. The address of that website is www.pamtransport.com. The Company makes available free of charge on its Internet website its Annual Report on Form 10-K, quarterly reports on Form 10-Q, current reports on Form 8-K, and amendments to those reports filed or furnished pursuant to Section 13(a) or 15(d) of the Securities Exchange Act of 1934 (the “Exchange Act”) as soon as reasonably practicable after it electronically files or furnishes such materials to the Securities and Exchange Commission.
Seasonality
Our revenues do not exhibit a significant seasonal pattern due primarily to our varied customer mix. Operating expenses can be somewhat higher in the winter months primarily due to decreased fuel efficiency and increased maintenance costs associated with inclement weather. In addition, the automobile plants for which we transport a large amount of freight typically utilize scheduled shutdowns in July and December and the volume of automotive freight we ship is reduced during such scheduled plant shutdowns.
Regulation
We are a common and contract motor carrier regulated by various United States federal and state, Canadian provincial, and Mexican federal agencies. These regulatory agencies have broad powers, generally governing matters such as authority to engage in motor carrier operations, motor carrier registration, driver hours-of-service (“HOS”), drug and alcohol testing of drivers, and safety, size, and weight of transportation equipment. The primary regulatory agencies affecting the Company’s operations include the Federal Motor Carrier Safety Administration (“FMCSA”), the Pipeline and Hazardous Materials Safety Agency, and the Surface Transportation Board, which are all agencies within the U.S. Department of Transportation (“DOT”). We believe that we are in compliance in all material respects with applicable regulatory requirements relating to our business and operate with a “satisfactory” rating (the highest of three rating categories) from the DOT. In addition, we are subject to compliance with cargo-security and transportation regulations issued by the Transportation Security Administration, a component department within the U.S. Department of Homeland Security. To the extent that we conduct operations outside the United States, we are subject to the Foreign Corrupt Practices Act, which generally prohibits U.S. companies and their intermediaries from offering bribes to foreign officials for the purpose of obtaining or retaining favorable treatment.
In 2004, the FMCSA issued updated rules related to driver HOS limits that became effective October 1, 2005 (the "2005 Rules"). In July 2007, a federal appeals court vacated certain provisions of the 2005 Rules relating to the expansion of the daily driving limit from 10 hours to 11 hours, and the "34-hour restart," which allowed drivers to restart calculations of the weekly on-duty time limits after the driver had at least 34 consecutive hours off duty. The court indicated that, in addition to other reasons, it vacated these two provisions because the FMCSA failed to provide adequate data supporting its decision to increase the daily driving limit and provide for the 34-hour restart provision. In November 2008, following the submission of additional data by FMCSA and a series of appeals and related court rulings, the FMCSA published its final rule, which retained the 11 hour daily driving limit and the 34-hour restart provision. Safety advocacy groups continued to challenge the final rule and in an effort to end litigation by these groups, the FMCSA agreed to propose new rules by July 26, 2011. During December 2010, the FMCSA released the proposed new rules for public comment which included provisions that would shorten allowable daily driving time from 11 hours to 10 hours and also require that drivers take two nights of rest during the 34-hour restart provision. The proposed rules, which were generally not well received by either safety advocacy groups or by the trucking industry, were finalized and published by the FMCSA in December 2011. The final rule, effective July 1, 2013, retained the 11 hour daily driving limit but restricted the use of the 34-hour restart provision to once every seven days and the 34-hour period must include two periods between 1:00 a.m. and 5:00 a.m. and requires drivers to take a 30-minute off duty break after driving 8 hours. During 2012, both the American Trucking Association and safety advocacy groups had filed petitions with the D.C. U.S. Circuit Court of Appeals requesting the court to review the FMCSA’s final rule. Oral arguments began on March 15, 2013 and a final ruling was issued August 2, 2013. The final ruling upheld the HOS rules effective July 1, 2013 with the exception of vacating the 30-minute off duty break for short haul truck drivers. Effective December 16, 2014, in response to the Consolidated and Further Continuing Appropriations Act, 2015, (the “Appropriations Act”), the FMCSA suspended the requirements regarding the restart of a driver’s 60- or 70-hour limit which drivers were required to comply with beginning July 1, 2013. The restart provisions have no force or effect from the date of enactment of the Appropriations Act through the period of suspension, and such provisions are replaced with the previous restart provisions in effect on June 30, 2013. This allows a 34 hour re-start to begin immediately after 34 hours of rest without previous restrictions. Although the final HOS rules have made an impact on the utilization of our equipment and our drivers’ productivity, they have not had a significant negative impact on our operations.
During February 2012, the FMCSA announced its intent to continue to pursue a rule that would require all interstate motor carriers to install electronic on-board recorders (“EOBRs”) to monitor compliance with HOS regulations. The FMCSA’s previous efforts in 2011 to implement a rule requiring EOBRs were successfully challenged in court and the rule was vacated in August 2011 as the court ruled that the FMCSA failed to directly address the potential for harassment of vehicle operators. The vacated rule applied to phase one of a two-phase rule implementation process whereby implementation of phase one would require EOBR use only by habitual HOS regulation violators while phase two would require EOBR use by all motor carriers. The FMCSA refers to these two-phases as EOBR 1 and EOBR 2, respectively. Under EOBR 1, any motor carrier found to have a HOS regulation violation rate of 10% or greater would be required to install EOBRs on all of its commercial motor vehicles for a period of two years. The final rule related to EOBR 1 was published in April 2010 and, prior to being vacated, was to be effective for any single compliance review completed on or after June 4, 2012. Under EOBR 2, all motor carriers required to maintain HOS record keeping would be required to use EOBRs to monitor their drivers' compliance with HOS requirements. Motor carriers would have three years after the effective date of the EOBR 2 final rule to comply with these requirements. As of December 31, 2014, the Company is not subject to any requirement that EOBRs be installed on any of its trucks; however all the Company’s trucks currently have EOBRs installed.
During 2010, the FMCSA also implemented its “Compliance, Safety, Accountability” program (“CSA”), formerly known as “Comprehensive Safety Analysis 2010” or “CSA 2010”. The stated goal under CSA is to achieve a greater reduction in large truck and bus crashes, injuries and fatalities, while maximizing the resources of the FMCSA and its state partners. Since the 1970s, federal and state enforcement agencies, in partnership with the motor carrier industry, have progressively reduced the commercial vehicle related fatality crash rate. Under CSA, the FMCSA uses a comprehensive measurement system of all safety-based violations found during roadside inspections, weighing such violations by their relationship to crash risk. CSA data analysis expands on the previous system utilized by the FMCSA and covers more behavioral areas specifically linked to crash risk such as unsafe or fatigued driving, driver fitness, controlled substances, crash history, vehicle maintenance, and improper loading. Safety performance information is accumulated to assess the safety performance of both carriers and drivers. This expanded methodology for determining a carrier's DOT safety rating may have an adverse effect on our DOT safety rating. We currently have a satisfactory DOT rating, which is the highest available rating. A conditional or unsatisfactory DOT safety rating could adversely affect our business because some of our customer contracts may require a satisfactory DOT safety rating, and a conditional or unsatisfactory rating could negatively impact or restrict our operations.
Our motor carrier operations are also subject to environmental laws and regulations, including laws and regulations dealing with underground fuel storage tanks, the transportation of hazardous materials and other environmental matters, and our operations involve certain inherent environmental risks. We maintain one bulk fuel storage above ground tank and fuel island. Our operations involve the risks of fuel spillage or seepage, environmental damage, and hazardous waste disposal, among others. We have instituted programs to monitor and control environmental risks and assure compliance with applicable environmental laws. As part of our safety and risk management program, we periodically perform internal environmental reviews so that we can achieve environmental compliance and avoid environmental risk. We transport a minimum amount of environmentally hazardous substances and, to date, have experienced no significant claims for hazardous materials shipments. If we should fail to comply with applicable regulations, we could be subject to substantial fines or penalties and to civil and criminal liability.
Company operations conducted in industrial areas, where truck terminals and other industrial activities are conducted, and where groundwater or other forms of environmental contamination have occurred, potentially expose us to claims that we contributed to the environmental contamination.
We believe we are currently in material compliance with applicable laws and regulations and that the cost of compliance has not materially affected results of operations.
In addition to environmental regulations directly affecting our business, we are also subject to the effects of the new truck engine design requirements implemented by the EPA. See "Revenue Equipment" above.
Item 1A. Risk Factors.
Set forth below, and elsewhere in this Report and in other documents we file with the SEC, are risks and uncertainties that could cause our actual results to differ materially from the results contemplated by the forward-looking statements contained in this Report.
Our business is subject to general economic and business factors that are largely beyond our control, any of which could have a material adverse effect on our operating results.
Our business is dependent upon a number of general economic and business factors that may adversely affect our results of operations. These factors include significant increases or rapid fluctuations in fuel prices, excess capacity in the trucking industry, surpluses in the market for used equipment, interest rates, fuel taxes, license and registration fees, insurance premiums, self-insurance levels, and difficulty in attracting and retaining qualified drivers and independent contractors.
We operate in a highly competitive and fragmented industry, and our business may suffer if we are unable to adequately address any downward pricing pressures or other factors that may adversely affect our ability to compete with other carriers.
Further, we are affected by recessionary economic cycles and downturns in customers’ business cycles, particularly in market segments and industries, such as the automotive industry, where we have a significant concentration of customers. Economic conditions may also adversely affect our customers and their ability to pay for our services.
Deterioration in the United States and world economies could exacerbate any difficulties experienced by our customers and suppliers in obtaining financing, which, in turn, could materially and adversely impact our business, financial condition, results of operations and cash flows.
Numerous competitive factors could impair our ability to operate at an acceptable profit. These factors include, but are not limited to, the following:
|
• |
we compete with many other truckload carriers of varying sizes and, to a lesser extent, with less-than-truckload carriers and railroads, some of which have more equipment and greater capital resources than we do; |
|
• |
some of our competitors periodically reduce their freight rates to gain business, especially during times of reduced growth rates in the economy, which may limit our ability to maintain or increase freight rates, maintain our margins or maintain significant growth in our business; |
|
• |
many customers reduce the number of carriers they use by selecting so-called “core carriers” as approved service providers, and in some instances we may not be selected; |
|
• |
many customers periodically accept bids from multiple carriers for their shipping needs, and this process may depress freight rates or result in the loss of some of our business to competitors; |
|
• |
the trend toward consolidation in the trucking industry may create other large carriers with greater financial resources and other competitive advantages relating to their size and with whom we may have difficulty competing; |
|
• |
advances in technology require increased investments to remain competitive, and our customers may not be willing to accept higher freight rates to cover the cost of these investments; |
|
• |
competition from Internet-based and other logistics and freight brokerage companies may adversely affect our customer relationships and freight rates; and |
|
• |
economies of scale that may be passed on to smaller carriers by procurement aggregation providers may improve their ability to compete with us. |
We are highly dependent on our major customers, the loss of one or more of which could have a material adverse effect on our business.
A significant portion of our revenue is generated from our major customers. For 2014, our top five customers, based on revenue, accounted for approximately 48% of our revenue, and our two largest customers, General Motors Company and Chrysler, accounted for approximately 20% and 14% of our revenue, respectively. We also provide transportation services to other manufacturers who are suppliers for automobile manufacturers. As a result, the concentration of our business within the automobile industry is greater than the concentration in a single customer. Approximately 48% of our revenues for 2014 were derived from transportation services provided to the automobile industry.
Generally, we do not have long-term contractual relationships with our major customers, and we cannot assure that our customer relationships will continue as presently in effect. A reduction in or termination of our services by our major customers could have a material adverse effect on our business and operating results.
We may be adversely impacted by fluctuations in the price and availability of diesel fuel.
Diesel fuel represents a significant operating expense for the Company and we do not currently hedge against the risk of diesel fuel price increases. An increase in diesel fuel prices or diesel fuel taxes, or any change in federal or state regulations that results in such an increase, could have a material adverse effect on our operating results to the extent we are unable to recoup such increases from customers in the form of increased freight rates or through fuel surcharges. Historically, we have been able to offset, to a certain extent, diesel fuel price increases through fuel surcharges to our customers, but we cannot be certain that we will be able to do so in the future. We continuously monitor the components of our pricing, including base freight rates and fuel surcharges, and address individual account profitability issues with our customers when necessary. While we have historically been able to adjust our pricing to help offset changes to the cost of diesel fuel through changes to base rates and/or fuel surcharges, we cannot be certain that we will be able to do so in the future.
Difficulty in attracting drivers could affect our profitability and ability to grow.
Periodically, the transportation industry experiences difficulty in attracting and retaining qualified drivers, including independent contractors, resulting in intense competition for drivers. We have from time to time experienced under-utilization and increased expenses due to a shortage of qualified drivers. If we are unable to attract drivers when needed or contract with independent contractors when needed, we could be required to further adjust our driver compensation packages, increase driver recruiting efforts, or let trucks sit idle, any of which could adversely affect our growth and profitability.
If we are unable to retain our key employees, our business, financial condition and results of operations could be harmed.
We are highly dependent upon the services of our key employees and executive officers. The loss of any of their services could have a material adverse effect on our operations and future profitability. We must continue to develop and retain a core group of managers if we are to realize our goal of expanding our operations and continuing our growth. We cannot assure that we will be able to do so.
Ongoing insurance and claims expenses could significantly reduce our earnings.
Our future insurance and claims expenses might exceed historical levels, which could reduce our earnings. The Company is self insured for health and workers’ compensation insurance coverage up to certain limits. If medical costs continue to increase, or if the severity or number of claims increase, and if we are unable to offset the resulting increases in expenses with higher freight rates, our earnings could be materially and adversely affected.
Purchase price increases for new revenue equipment and/or decreases in the value of used revenue equipment could have an adverse effect on our results of operations, cash flows and financial condition.
During the last decade, the purchase price of new revenue equipment has increased significantly as equipment manufacturers recover increased materials costs and engine design costs resulting from compliance with increasingly stringent EPA engine emission standards. The final phase of the new EPA engine design requirements were effective in 2010; however, additional EPA emission mandates in the future could result in higher purchase prices of revenue equipment which could result in higher than anticipated depreciation expenses. If we were unable to offset any such increase in expenses with freight rate increases, our cash flows and results of operations could be adversely affected. If the market prices for used revenue equipment declines, we could incur substantial losses upon disposition of our revenue equipment which could adversely affect our results of operations and financial condition.
We have significant ongoing capital requirements that could affect our liquidity and profitability if we are unable to generate sufficient cash from operations or obtain sufficient financing on favorable terms.
The trucking industry is capital intensive. If we are unable to generate sufficient cash from operations in the future, we may have to limit our growth, enter into unfavorable financing arrangements, or operate our revenue equipment for longer periods, any of which could have a material adverse effect on our profitability.
We have a substantial amount of debt, which could restrict our growth, place us at a competitive disadvantage or otherwise materially adversely affect our financial health. Our substantial debt levels could have important consequences such as the following:
|
• |
impair our ability to obtain additional future financing for working capital, capital expenditures, acquisitions or general corporate expenses; |
|
• |
limit our ability to use operating cash flow in other areas of our business due to the necessity of dedicating a substantial portion of these funds for payments on our indebtedness; |
|
• |
limit our flexibility in planning for, or reacting to, changes in our business and the industry in which we operate; |
|
• |
make it more difficult for us to satisfy our obligations; |
|
• |
increase our vulnerability to general adverse economic and industry conditions; and |
|
• |
place us at a competitive disadvantage compared to our competitors. |
Our ability to make scheduled payments on, or to refinance, our debt and other obligations will depend on our financial and operating performance, which, in turn, is subject to our ability to implement our strategic initiatives, prevailing economic conditions and certain financial, business and other factors beyond our control. If our cash flow and capital resources are insufficient to fund our debt service and other obligations, we may be forced to reduce or delay expansion plans and capital expenditures, sell material assets or operations, obtain additional capital or restructure our debt. We cannot provide any assurance that our operating performance, cash flow and capital resources will be sufficient to pay our debt obligations when they become due. We also cannot provide assurance that we would be able to dispose of material assets or operations or restructure our debt or other obligations if necessary or, even if we were able to take such actions, that we could do so on terms that are acceptable to us.
Disruptions in the credit markets may adversely affect our business, including the availability and cost of short-term funds for liquidity requirements and our ability to meet long-term commitments, which could adversely affect our results of operations, cash flows and financial condition.
If cash from operations is not sufficient, we may be required to rely on the capital and credit markets to meet our financial commitments and short-term liquidity needs. Disruptions in the capital and credit markets, as have been experienced during recent years, could adversely affect our ability to draw on our bank revolving credit facility. Our access to funds under the credit facility is dependent on the ability of banks to meet their funding commitments. A bank may not be able to meet their funding commitments if they experience shortages of capital and liquidity or if they experience excessive volumes of borrowing requests from other borrowers within a short period of time.
Longer term disruptions in the capital and credit markets as a result of uncertainty, changing or increased regulation, reduced alternatives, or failures of significant financial institutions could adversely affect our access to liquidity needed for our business. Any disruption could require us to take measures to conserve cash until the markets stabilize or until alternative credit arrangements or other funding for our business needs can be arranged, which could adversely affect our growth and profitability.
We operate in a highly regulated industry and increased costs of compliance with, or liability for violation of, existing or future regulations could have a material adverse effect on our business.
The DOT and various state agencies exercise broad powers over our business, generally governing such activities as authorization to engage in motor carrier operations, safety, and financial reporting. We may also become subject to new or more restrictive regulations relating to fuel emissions, drivers’ hours of service, and ergonomics. Compliance with such regulations could substantially impair equipment productivity and increase our operating expenses.
The EPA adopted new emission control regulations, which required progressive reductions in exhaust emissions from diesel engines through 2010. In order to partially offset the costs of compliance with the new EPA engine design requirements, manufacturers have increased new equipment prices and eliminated or sharply reduced the price of repurchase or trade-in commitments. If new equipment prices continue to increase, or if the price of repurchase commitments by equipment manufacturers were to decrease more than anticipated, we may be required to increase our depreciation and financing costs and/or retain some of our equipment longer, which may result in an increase in maintenance expenses. To the extent we are unable to offset any such increases in expenses with rate increases or cost savings, our results of operations would be adversely affected. If our fuel or maintenance expenses were to increase as a result of our use of the new, EPA-compliant engines, and we are unable to offset such increases with fuel surcharges or higher freight rates, our results of operations would be adversely affected. Further, our business and operations could be adversely impacted if we experience problems with the reliability of the new engines. Although we have not experienced any significant reliability issues with these engines to date, the expenses associated with the trucks containing these engines have been slightly elevated, primarily as a result of higher depreciation expense due to increased purchase prices.
During 2010, the FMCSA implemented its “Compliance, Safety, Accountability” program (“CSA”), formerly known as “Comprehensive Safety Analysis 2010” or “CSA 2010”. CSA is an enforcement and compliance initiative that provides for driver standards in addition to the carrier standards previously in place. Under CSA, the methodology for determining a carrier's DOT safety rating has been expanded to include the on-road safety performance of the carrier's drivers. As a result of these new regulations, including the expanded methodology for determining a carrier's DOT safety rating, there may be an adverse effect on our DOT safety rating. We currently have a satisfactory DOT rating, which is the highest available rating. A conditional or unsatisfactory DOT safety rating could adversely affect our business because some of our customer contracts may require a satisfactory DOT safety rating, and a conditional or unsatisfactory rating could negatively impact or restrict our operations.
During December 2011, the FMCSA published final HOS rules which included changes that placed limits on the 34-hour restart provision and added required driver breaks. These final HOS rules have made an impact on the utilization of our equipment and our drivers’ productivity however, they have not had a significant negative impact on our operations.
We are subject to certain risks arising from doing business in Mexico.
As we continue to grow our business in Mexico, we are subject to greater risks of doing business internationally, including fluctuations in foreign currencies, changes in the economic strength of Mexico, difficulties in enforcing contractual obligations and intellectual property rights, burdens of complying with a wide variety of international and U.S. export and import laws, and social, political, and economic instability. We also face additional risks associated with our Mexico business, including potential restrictive trade policies and imposition of duties, taxes, or government royalties imposed by the Mexican government. If we are unable to address business concerns related to our international operations in a timely and cost efficient manner, our financial position, results of operations or cash flows could be adversely affected.
A determination by regulators that owner-operators are employees, rather than independent contractors, could expose us to various liabilities and additional costs.
Tax and other regulatory authorities often seek to assert that independent contractors in the transportation service industry, such as our owner-operators, are employees rather than independent contractors. There can be no assurance that these interpretations and tax laws that consider these persons independent contractors will not change or that these authorities will not successfully assert this position. If our owner-operators are determined to be our employees, that determination could materially increase our exposure under a variety of federal and state tax, workers’ compensation, unemployment benefits, labor, employment and tort laws, as well as our potential liability for employee benefits. In addition, such changes may be applied retroactively, and if so, we may be required to pay additional amounts to compensate for prior periods. Any of the above increased costs would adversely affect our business and operating results.
Our results of operations may be affected by seasonal factors.
Our productivity may decrease during the winter season when severe winter weather impedes operations. Also, some shippers may reduce their shipments after the winter holiday season. At the same time, operating expenses may increase and fuel efficiency may decline due to engine idling during periods of inclement weather. Harsh weather conditions generally also result in higher accident frequency, increased freight claims, and higher equipment repair expenditures.
Our business may be disrupted by natural disasters and severe weather conditions causing supply chain disruptions.
Natural disasters such as earthquakes, tsunamis, hurricanes, tornadoes, floods or other adverse weather and climate conditions, whether occurring in the United States or abroad, could disrupt our operations or the operations of our customers or could damage or destroy infrastructure necessary to transport products as part of the supply chain. Specifically, these events may damage or destroy or assets, disrupt fuel supplies, increase fuel costs, disrupt freight shipments or routes, and affect regional economies. As a result, these events could make it difficult or impossible for us to provide logistics and transportation services; disrupt or prevent our ability to perform functions at the corporate level; and/or otherwise impede our ability to continue business operations in a continuous manner consistent with the level and extent of business activities prior to the occurrence of the unexpected event, which could adversely affect our business and results of operations or make our results more volatile.
We may incur additional operating expenses or liabilities as a result of potential future requirements to address climate change issues.
As global warming issues become more prevalent, federal, state and local governments as well as some of our customers, are beginning to respond to these issues. This increased focus on sustainability may result in new legislation or regulations and customer requirements that could negatively affect us as we may incur additional costs or be required to make changes to our operations in order to comply with any new regulations or customer requirements. Legislation or regulations that potentially impose restrictions, caps, taxes, or other controls on emissions of greenhouse gases such as carbon dioxide, a by-product of burning fossil fuels such as those used in the Company’s trucks, could adversely affect our operations and financial results. More specifically, legislative or regulatory actions related to climate change could adversely impact the Company by increasing our fuel costs and reducing fuel efficiency and could result in the creation of substantial additional capital expenditures and operating costs in the form of taxes, emissions allowances, or required equipment upgrades. Any of these factors could impair our operating efficiency and productivity and result in higher operating costs. In addition, revenues could decrease if we are unable to meet regulatory or customer sustainability requirements. These additional costs, changes in operations, or loss of revenues could have a material adverse effect on our business, financial condition and results of operations.
Our operations are subject to various environmental laws and regulations, the violation of which could result in substantial fines or penalties.
We are subject to various environmental laws and regulations dealing with the handling of hazardous materials, underground fuel storage tanks, and discharge and retention of storm-water. We operate in industrial areas, where truck terminals and other industrial activities are located, and where groundwater or other forms of environmental contamination could occur. In prior years, we also maintained bulk fuel storage and fuel islands at two of our facilities. Our operations may involve the risks of fuel spillage or seepage, environmental damage, and hazardous waste disposal, among others. If we are involved in a spill or other accident involving hazardous substances, or if we are found to be in violation of applicable laws or regulations, it could have a materially adverse effect on our business and operating results. If we should fail to comply with applicable environmental regulations, we could be subject to substantial fines or penalties and to civil and criminal liability.
If our employees were to unionize, our operating costs would increase and our ability to compete would be impaired.
None of our employees is currently represented by a collective bargaining agreement. However, we can offer no assurance that our employees will not unionize in the future, particularly if legislation is passed that facilitates unionization. If our employees were to unionize, our operating costs would increase and our profitability could be adversely affected.
Our information technology systems are subject to certain risks that are beyond our control.
We depend on the proper functioning and availability of our information systems, including communications and data processing systems, in operating our business. Although we have implemented redundant systems and network security measures, our information technology remains susceptible to outages, computer viruses, break-ins and similar disruptions that may inhibit our ability to provide services to our customers and the ability of our customers to access our systems. This may result in the loss of customers or a reduction in demand for our services, which could adversely affect our growth and profitability.
We have substantial fixed costs and, as a result, our operating income fluctuates disproportionately with changes in our net sales.
A significant portion of our expenses are fixed costs that that neither increase nor decrease proportionately with sales. There can be no assurance that we would be able to reduce our fixed costs proportionately in response to a decline in our sales and therefore our competitiveness could be significantly impacted. As a result, a decline in our sales would result in a higher percentage decline in our income from operations and net income.
Our financial results may be adversely impacted by potential future changes in accounting practices.
Future changes in accounting standards or practices, and related legal and regulatory interpretations of those changes, may adversely impact public companies in general, the transportation industry or our operations specifically. New accounting standards or requirements, such as a conversion from U.S. Generally Accepted Accounting Principles to International Financial Reporting Standards, could change the way we account for, disclose and present various aspects of our financial position, results of operations or cash flows and could be costly to implement.
Our business may be harmed by terrorist attacks, future war or anti-terrorism measures.
In order to prevent terrorist attacks, federal, state and municipal authorities have implemented and continue to follow various security measures, including checkpoints and travel restrictions on large trucks. Our international operations in Canada and Mexico may be affected significantly if there are any disruptions or closures of border traffic due to security measures. Such measures may have costs associated with them, which, in connection with the transportation services we provide, we or our owner-operators could be forced to bear. In addition, war or risk of war also may have an adverse effect on the economy. A decline in economic activity could adversely affect our revenue or restrict our future growth. Instability in the financial markets as a result of terrorism or war also could affect our ability to raise capital. In addition, the insurance premiums charged for some or all of the coverage currently maintained by us could increase dramatically or such coverage could be unavailable in the future.
We may be unable to successfully integrate businesses we acquire into our operations.
Integrating businesses we acquire may involve unanticipated delays, costs or other operational or financial problems. Successful integration of the businesses we acquire depends on a number of factors, including our ability to transition acquired companies to our management information systems. In integrating businesses we acquire, we may not achieve expected economies of scale or profitability or realize sufficient revenues to justify our investment. We also face the risk that an unexpected problem at one of the companies we acquire will require substantial time and attention from senior management, diverting management’s attention from other aspects of our business. We cannot be certain that our management and operational controls will be able to support us as we grow.
The Chairman of our board of directors holds a controlling interest in us; therefore, the influence of our public shareholders over significant corporate actions is limited, and we are not subject to certain corporate governance standards that apply to other publicly traded companies.
Matthew T. Moroun, the Chairman of our Board of Directors, and a trust of which Mr. Moroun is a co-trustee together, own approximately 58.2% of our outstanding common stock. As a result, Mr. Moroun has the power to:
|
• |
control all matters submitted to our shareholders; |
|
• |
elect our directors; |
|
• |
adopt, extend or remove any anti-takeover provisions that are available to us; and |
|
• |
exercise control over our business, policies and affairs. |
This concentration of ownership could limit the price that some investors might be willing to pay for shares of our common stock, and our ability to engage in significant transactions, such as a merger, acquisition or liquidation, will require the consent of Mr. Moroun. Conflicts of interest could arise between us and Mr. Moroun, and any conflict of interest may be resolved in a manner that does not favor us. Accordingly, Mr. Moroun could cause us to enter into transactions or agreements of which our other shareholders would not approve or make decisions with which they may disagree. Because of Mr. Moroun’s level of ownership, we have elected to be treated as a controlled company in accordance with the rules of the NASDAQ Stock Market. Accordingly, we are not required to comply with NASDAQ Stock Market rules which would otherwise require a majority of our Board to be comprised of independent directors and require our Board to have a compensation committee and a nominating and corporate governance committee comprised of independent directors.
Mr. Moroun may continue to retain control of us for the foreseeable future and may decide not to enter into a transaction in which shareholders would receive consideration for our common stock that is much higher than the then-current market price of our common stock. In addition, Mr. Moroun could elect to sell a controlling interest in us to a third-party and our other shareholders may not be able to participate in such transaction or, if they are able to participate in such a transaction, such shareholders may receive less than the then-current fair market value of their shares. Any decision regarding ownership of us that Mr. Moroun may make at some future time will be in his absolute discretion, subject to applicable laws and fiduciary duties.
Our stock trading volume may not provide adequate liquidity for investors.
Although shares of our common stock are traded on the NASDAQ Global Market, the average daily trading volume in our common stock is less than that of other larger transportation and logistics companies. A public trading market having the desired characteristics of depth, liquidity and orderliness depends on the presence in the marketplace of a sufficient number of willing buyers and sellers of the common stock at any given time. This presence depends on the individual decisions of investors and general economic and market conditions over which we have no control. Given the daily average trading volume of our common stock, significant sales of the common stock in a brief period of time, or the expectation of these sales, could cause a decline in the price of our common stock. Additionally, low trading volumes may limit a stockholder’s ability to sell shares of our common stock.
We currently do not intend to pay future dividends on our common stock.
We currently do not anticipate paying future cash dividends on our common stock. We anticipate that we will retain all of our future earnings, if any, for use in the development and expansion of our business and for general corporate purposes. Any determination to pay future dividends and other distributions in cash, stock, or property by the Company in the future will be at the discretion of our Board of Directors and will be dependent on then-existing conditions, including our financial condition and results of operations and contractual restrictions. Therefore, you should not rely on future dividend income from shares of our common stock.
Item 1B. Unresolved Staff Comments.
None.
Item 2. Properties.
Our executive offices and primary terminal facilities, which we own, are located in Tontitown, Arkansas. These facilities are located on approximately 49.3 acres and consist of 114,403 square feet of office space and maintenance and storage facilities.
Our subsidiaries lease facilities in Indianapolis, Indiana; Romulus, Michigan; North Jackson, Ohio; Tahlequah, Oklahoma; El Paso, Texas; and Monterrey, Mexico. Our terminal facilities in Irving and Laredo, Texas; North Little Rock, Arkansas; and Willard, Ohio are owned. The leased facilities are leased primarily on contractual terms typically ranging from one to five years. As of December 31, 2014, the following table provides a summary of the ownership and types of activities conducted at each location:
|
Location |
Own/ Lease |
Dispatch Office |
Maintenance Facility |
Safety Training |
|
Tontitown, Arkansas |
Own |
Yes |
Yes |
Yes |
|
North Little Rock, Arkansas |
Own |
No |
Yes |
Yes |
|
Indianapolis, Indiana |
Lease |
No |
Yes |
No |
|
Romulus, Michigan |
Lease |
No |
Yes |
No |
|
Columbia, Mississippi |
Own |
No |
No |
No |
|
North Jackson, Ohio |
Lease |
Yes |
Yes |
Yes |
|
Willard, Ohio |
Own |
Yes |
Yes |
No |
|
Tahlequah, Oklahoma |
Lease |
No |
No |
No |
|
El Paso, Texas |
Lease |
No |
No |
No |
|
Irving, Texas |
Own |
Yes |
Yes |
Yes |
|
Laredo, Texas |
Own |
Yes |
Yes |
Yes |
|
Monterrey, Mexico |
Lease |
No |
No |
No |
We also have access to trailer drop and relay stations in various other locations across the country. We lease certain of these facilities on a month-to-month basis from affiliates of our largest stockholder.
We believe that all of the properties that we own or lease are suitable for their purposes and adequate to meet our needs.
Item 3. Legal Proceedings.
The nature of our business routinely results in litigation, primarily involving claims for personal injuries and property damage incurred in the transportation of freight. We believe that all such routine litigation is adequately covered by insurance and that adverse results in one or more of those cases would not have a material adverse effect on our financial statements.
We are a defendant in a collective-action lawsuit which was filed on August 22, 2013, in the United States District Court for the Western District of Arkansas. The plaintiffs, who are current and former drivers and who worked for the Company during the period of August 22, 2010, through the date of the filing, allege claims for unpaid wages under the Fair Labor Standards Act and the Arkansas Minimum Wage Law. The complaint alleges that the Company failed to pay newly hired drivers minimum wage during orientation, training, and while traveling during normal business hours and that the Company failed to pay all drivers when working on assignment for more than 24 hours. The plaintiffs seek to enjoin the Company from continuing its current pay practices related to the allegations. They also seek actual damages, liquidated damages equal to accrual damages, court costs, and legal fees. The Company has reached a preliminary settlement with the plaintiffs in the amount of $3,950,000 and accordingly, has reserved this amount, along with estimated settlement costs, in the accompanying 2014 financial statements. Should the settlement not be approved by the court, further negotiations may take place to reach a different settlement or the case may continue on to trial. Management has determined that any losses under this claim will not be covered by existing insurance policies.
Item 4. Mine Safety Disclosures.
Not applicable.
PART II
Item 5. Market for Registrant’s Common Equity, Related Stockholder Matters and Issuer Purchases of Equity Securities.
Our common stock is traded on the NASDAQ Global Market under the symbol PTSI. The following table sets forth, for the quarters indicated, the range of the high and low sales prices per share for our common stock as reported on the NASDAQ Global Market.
Fiscal Year Ended December 31, 2014
|
High |
Low |
|||||||
|
First Quarter |
$ | 23.00 | $ | 17.83 | ||||
|
Second Quarter |
29.01 | 19.46 | ||||||
|
Third Quarter |
40.19 | 27.66 | ||||||
|
Fourth Quarter |
54.74 | 33.71 | ||||||
Fiscal Year Ended December 31, 2013
|
High |
Low |
|||||||
|
First Quarter |
$ | 11.57 | $ | 9.30 | ||||
|
Second Quarter |
11.74 | 8.85 | ||||||
|
Third Quarter |
17.82 | 10.00 | ||||||
|
Fourth Quarter |
20.99 | 15.59 | ||||||
As of February 23, 2015, there were approximately 99 holders of record of our common stock.
Dividends
The Company paid cash dividends of $1.00 per common share during each of the months of April 2012 and December 2012. No other dividends have been paid during any year prior to 2012 or during 2013 or 2014. Future dividend policy and the payment of dividends, if any, will be determined by the Board of Directors in light of circumstances then existing, including our earnings, financial condition and other factors deemed relevant by the Board of Directors. Currently, the Company does not intend to pay dividends in the foreseeable future.
Repurchases of Equity Securities by the Issuer
The Company’s stock repurchase program has been extended and expanded several times, most recently in May 2014, when the Board of Directors reauthorized 500,000 shares of common stock for repurchase under the initial September 2011 authorization. Following the reauthorization, the Company repurchased 33,341 shares of its common stock during the remainder of 2014 under this repurchase program.
On December 2, 2014, the Company announced a Dutch auction tender offer (the “2014 tender offer”) to repurchase up to 640,000 shares of its common stock, par value $0.01 per share, subject to the terms and conditions described in the 2014 tender offer pursuant to the Board of Directors approval on November 25, 2014. Subject to certain limitations and legal requirements, the Company could purchase up to an additional 2% of its outstanding shares which totaled 160,000 shares. The 2014 tender offer began on the date of the announcement, December 2, 2014 and expired on December 30, 2014.
Through the 2014 tender offer, the Company’s shareholders had the opportunity to tender some or all of their shares at a price within the range of $46.00 to $50.00 per share. Upon expiration of the offer, the Company accepted for purchase a total of 571,865 shares at a price of $50.00 per share, for a total purchase price of approximately $28.7 million, including fees and commission. The purchases were settled on January 6, 2015. The Company accounted for the repurchase of these shares as treasury stock on the Company’s consolidated balance sheet as of December 31, 2014.
On December 2, 2013, the Company announced a Dutch auction tender offer (the “2013 tender offer”) to repurchase up to 600,000 shares of its common stock, par value $0.01 per share, subject to the terms and conditions described in the 2013 tender offer pursuant to the Board of Directors approval on November 27, 2013. Subject to certain limitations and legal requirements, the Company could purchase up to an additional 2% of its outstanding shares which totaled 173,000 shares. The 2013 tender offer began on the date of the announcement, December 2, 2013 and expired on December 30, 2013.
Through the 2013 tender offer, the Company’s shareholders had the opportunity to tender some or all of their shares at a price within the range of $19.00 to 21.00 per share. Upon expiration of the offer, the Company accepted for purchase a total of 675,000 shares at a price of $20.50 per share, for a total purchase price of approximately $13.9 million, including fees and commission. The purchases were settled on January 6, 2014. The Company accounted for the repurchase of these shares as treasury stock on the Company’s consolidated balance sheet as of December 31, 2013.
The following table summarizes the Company's common stock repurchases during the fourth quarter of 2014. No shares were purchased during the quarter other than through the tender offer described above. All purchases were made by or on behalf of the Company and not by any “affiliated purchaser”.
|
Period |
Total number of shares purchased |
Average price paid per share |
Total number of shares purchased as part of publicly announced plans or programs |
Maximum number of shares that may yet be purchased under the plans or programs |
||||||||||||
|
October 1-31, 2014 |
- | $ | - | - | 466,659 | |||||||||||
|
November 1-30, 2014 |
- | - | - | 466,659 | ||||||||||||
|
December 1-31, 2014 |
571,865 | 50.00 | 571,865 | 466,659 | ||||||||||||
|
Total |
571,865 | $ | 50.00 | 571,865 | ||||||||||||
Securities Authorized for Issuance Under Equity Compensation Plans
See Part III, Item 12, “Security Ownership of Certain Beneficial Owners and Management and Related Stockholder Matters” of this Annual Report for a presentation of compensation plans under which equity securities of the Company are authorized for issuance.
Performance Graph
Set forth below is a line graph comparing the yearly percentage change in the cumulative total stockholder return on our common stock against the cumulative total return of the NASDAQ OMX Index for the NASDAQ Stock Market (U.S. companies) and the NASDAQ OMX Index for the NASDAQ Trucking and Transportation Stocks for the period of five years commencing December 31, 2009 and ending December 31, 2014. The graph assumes that the value of the investment in our common stock and in each index was $100 on December 31, 2009 and that all dividends were reinvested.
COMPARISON OF CUMULATIVE TOTAL RETURN AMONG OUR COMMON STOCK,
THE NASDAQ OMX INDEX FOR THE NASDAQ STOCK MARKET (U.S. COMPANIES)
AND THE NASDAQ TRUCKING AND TRANSPORTATION STOCKS INDEX THROUGH DECEMBER 31, 2014
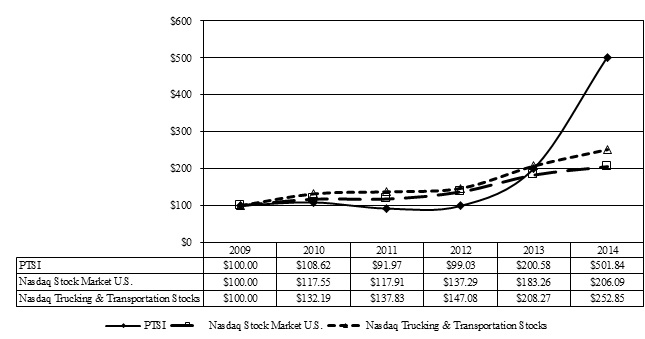
Item 6. Selected Financial Data.
The following selected financial and operating data should be read in conjunction with the Consolidated Financial Statements and notes thereto included elsewhere in this Report.
|
Year Ended December 31, |
||||||||||||||||||||
|
2014 |
2013 |
2012 |
2011 |
2010 |
||||||||||||||||
|
(in thousands, except per share amounts) |
||||||||||||||||||||
|
Statement of Operations Data: |
||||||||||||||||||||
|
Operating revenues: |
||||||||||||||||||||
|
Operating revenues, before fuel surcharge |
$ | 316,584 | $ | 313,117 | $ | 297,698 | $ | 284,178 | $ | 282,524 | ||||||||||
|
Fuel surcharge |
94,353 | 89,696 | 82,935 | 75,065 | 49,470 | |||||||||||||||
|
Total operating revenues |
410,937 | 402,813 | 380,633 | 359,243 | 331,994 | |||||||||||||||
|
Operating expenses: |
||||||||||||||||||||
|
Salaries, wages and benefits |
108,371 | 107,037 | 108,866 | 110,037 | 105,143 | |||||||||||||||
|
Operating supplies and expenses |
126,875 | 137,268 | 155,392 | 168,567 | 132,582 | |||||||||||||||
|
Rent and purchased transportation |
90,831 | 85,226 | 54,011 | 30,126 | 47,054 | |||||||||||||||
|
Depreciation |
36,296 | 39,088 | 38,298 | 34,163 | 27,035 | |||||||||||||||
|
Insurance and claims |
20,274 | 14,586 | 13,744 | 13,070 | 12,820 | |||||||||||||||
|
Other |
9,871 | 8,956 | 7,585 | 8,525 | 7,900 | |||||||||||||||
|
(Gain) loss on sale or disposal of property |
(4,591 | ) | (854 | ) | (166 | ) | 98 | (337 | ) | |||||||||||
|
Total operating expenses |
387,927 | 391,307 | 377,730 | 364,586 | 332,197 | |||||||||||||||
|
Operating income (loss) |
23,010 | 11,506 | 2,903 | (5,343 | ) | (203 | ) | |||||||||||||
|
Non-operating income |
2,099 | 1,540 | 3,288 | 1,551 | 852 | |||||||||||||||
|
Interest expense |
(2,897 | ) | (3,375 | ) | (2,596 | ) | (1,798 | ) | (2,252 | ) | ||||||||||
|
Income (loss) before income taxes |
22,212 | 9,671 | 3,595 | (5,590 | ) | (1,603 | ) | |||||||||||||
|
Income tax expense (benefit) |
8,721 | 3,756 | 1,416 | (2,733 | ) | (948 | ) | |||||||||||||
|
Net income (loss) |
$ | 13,491 | $ | 5,915 | $ | 2,179 | $ | (2,857 | ) | $ | (655 | ) | ||||||||
|
Earnings (loss) per common share: |
||||||||||||||||||||
|
Basic |
$ | 1.69 | $ | 0.68 | $ | 0.25 | $ | (0.32 | ) | $ | (0.07 | ) | ||||||||
|
Diluted |
$ | 1.68 | $ | 0.68 | $ | 0.25 | $ | (0.32 | ) | $ | (0.07 | ) | ||||||||
|
Average common shares outstanding – Basic |
7,990 | 8,662 | 8,700 | 9,056 | 9,415 | |||||||||||||||
|
Average common shares outstanding – Diluted (1) |
8,034 | 8,682 | 8,702 | 9,056 | 9,415 | |||||||||||||||
|
Cash dividends declared per common share |
$ | - | $ | - | $ | 2.00 | $ | - | $ | - | ||||||||||
|
|
(1) |
Diluted income per share for 2014, 2013, and 2012 assumes the exercise of stock options to purchase an aggregate of 71,990, 92,496, and 2,776 shares of common stock, respectively. |
|
At December 31, |
||||||||||||||||||||
|
2014 |
2013 |
2012 |
2011 |
2010 |
||||||||||||||||
| (in thousands) | ||||||||||||||||||||
|
Balance Sheet Data: |
|
|||||||||||||||||||
|
Total assets |
$ | 324,605 | $ | 329,302 | $ | 317,669 | $ | 279,093 | $ | 264,340 | ||||||||||
|
Long-term debt, excluding current portion |
52,293 | 70,366 | 78,583 | 44,135 | 17,201 | |||||||||||||||
|
Stockholders' equity |
99,985 | 115,946 | 122,195 | 137,477 | 147,948 | |||||||||||||||
|
Year Ended December 31, |
||||||||||||||||||||
|
2014 |
2013 |
2012 |
2011 |
2010 |
||||||||||||||||
|
Operating Data: |
||||||||||||||||||||
|
Operating ratio (1) |
92.7 | % | 96.3 | % | 99.0 | % | 101.9 | % | 100.1 | % | ||||||||||
|
Average number of truckloads per week |
5,674 | 6,120 | 5,704 | 5,586 | 6,054 | |||||||||||||||
|
Average miles per trip |
729 | 675 | 693 | 687 | 625 | |||||||||||||||
|
Total miles traveled (in thousands) |
209,990 | 209,837 | 200,765 | 195,081 | 192,139 | |||||||||||||||
|
Average miles per truck |
117,868 | 116,256 | 114,071 | 110,215 | 110,236 | |||||||||||||||
|
Average revenue, before fuel surcharge per truck per day |
$ | 700 | $ | 683 | $ | 666 | $ | 632 | $ | 639 | ||||||||||
|
Average revenue, before fuel surcharge per loaded mile |
$ | 1.50 | $ | 1.49 | $ | 1.49 | $ | 1.49 | $ | 1.35 | ||||||||||
|
Empty mile factor |
6.8 | % | 7.3 | % | 8.7 | % | 8.3 | % | 6.3 | % | ||||||||||
|
At end of period: |
||||||||||||||||||||
|
Total company-owned/leased trucks |
1,761 | (2) | 1,837 | (3) | 1,800 | (4) | 1,770 | (5) | 1,768 | (6) | ||||||||||
|
Average age of company-owned trucks (in years) |
1.58 | 1.52 | 1.63 | 2.62 | 3.24 | |||||||||||||||
|
Total company-owned/leased trailers |
4,919 | (7) | 5,170 | (8) | 4,943 | (9) | 4,696 | (10) | 4,632 | (11) | ||||||||||
|
Average age of company-owned trailers (in years) |
5.19 | 6.34 | 6.99 | 7.09 | 6.21 | |||||||||||||||
|
Number of employees |
2,911 | 3,022 | 3,031 | 2,764 | 2,658 | |||||||||||||||
__________
(1) Total operating expenses, net of fuel surcharge as a percentage of operating revenues, before fuel surcharge;
(2) Includes 325 owner operator trucks; (3) Includes 357 owner operator trucks; (4) Includes 220 owner operator trucks;
(5) Includes 79 owner operator trucks; (6) Includes 28 owner operator trucks; (7) Includes 141 leased trailers;
(8) Includes 91 leased trailers; (9) Includes 36 leased trailers; (10) Includes 53 leased trailers; (11) Includes 50 leased trailers.
The Company paid cash dividends of $1.00 per common share during each of the months of April 2012 and December 2012.
Item 7. Management’s Discussion and Analysis of Financial Condition and Results of Operations.
Business Overview
The Company's administrative headquarters are in Tontitown, Arkansas. From this location we manage operations conducted through our wholly owned subsidiaries based in various locations around the United States, Mexico, and Canada. The operations of these subsidiaries can generally be classified into either truckload services or brokerage and logistics services. Truckload services include those transportation services in which we utilize company owned trucks or owner-operator owned trucks. Brokerage and logistics services consist of services such as transportation scheduling, routing, mode selection, transloading and other value added services related to the transportation of freight which may or may not involve the usage of company owned or owner-operator owned equipment. Both our truckload operations and our brokerage/logistics operations have similar economic characteristics and are impacted by virtually the same economic factors as discussed elsewhere in this Report. All of the Company's operations are in the motor carrier segment.
For both operations, substantially all of our revenue is generated by transporting freight for customers and is predominantly affected by the rates per mile received from our customers, equipment utilization, and our percentage of non-compensated miles. These aspects of our business are carefully managed and efforts are continuously underway to achieve favorable results. Truckload services revenues, excluding fuel surcharges, represented 92.5%, 92.6% and 91.8% of total revenues, excluding fuel surcharges for the twelve months ended December 31, 2014, 2013 and 2012, respectively.
The main factors that impact our profitability on the expense side are costs incurred in transporting freight for our customers. Currently, our most challenging costs include fuel, driver recruitment, training, wage and benefit costs, independent broker costs (which we record as purchased transportation), insurance, and maintenance and capital equipment costs.
In discussing our results of operations we use revenue, before fuel surcharge (and operating supplies and expense, net of fuel surcharge), because management believes that eliminating the impact of this sometimes volatile source of revenue allows a more consistent basis for comparing our results of operations from period to period. During 2014, 2013 and 2012, approximately $94.4 million, $89.7 million and $82.9 million, respectively, of the Company's total revenue was generated from fuel surcharges. We also discuss certain changes in our expenses as a percentage of revenue, before fuel surcharge, rather than absolute dollar changes. We do this because we believe the high variable cost nature of certain expenses makes a comparison of changes in expenses as a percentage of revenue more meaningful than absolute dollar changes.
Results of Operations - Truckload Services
The following table sets forth, for truckload services, the percentage relationship of expense items to operating revenues, before fuel surcharges, for the periods indicated. Operating supplies and expenses are shown net of fuel surcharges.
|
Years Ended December 31, |
||||||||||||
|
2014 |
2013 |
2012 |
||||||||||
|
Operating revenues, before fuel surcharge |
100.0 | % | 100.0 | % | 100.0 | % | ||||||
|
Operating expenses: |
||||||||||||
|
Salaries, wages and benefit |
36.8 | 36.7 | 39.7 | |||||||||
|
Operating supplies and expenses, net of fuel surcharge |
11.1 | 16.4 | 26.5 | |||||||||
|
Rent and purchased transportation |
23.5 | 21.9 | 11.3 | |||||||||
|
Depreciation |
12.4 | 13.5 | 14.0 | |||||||||
|
Insurance and claims |
6.9 | 5.0 | 5.0 | |||||||||
|
Other |
3.3 | 3.1 | 2.7 | |||||||||
|
Gain on sale or disposal of property |
(1.6 | ) | (0.3 | ) | 0.0 | |||||||
|
Total operating expenses |
92.4 | 96.3 | 99.2 | |||||||||
|
Operating income |
7.6 | 3.7 | 0.8 | |||||||||
|
Non-operating income |
0.7 | 0.5 | 1.2 | |||||||||
|
Interest expense |
(1.0 | ) | (1.1 | ) | (0.9 | ) | ||||||
|
Income before income taxes |
7.3 | % | 3.1 | % | 1.1 | % | ||||||
2014 Compared to 2013
For the year ended December 31, 2014, truckload services revenue, before fuel surcharges, increased 0.9% to $292.7 million as compared to $290.1 million for the year ended December 31, 2013. The increase is related primarily to an increase in equipment utilization, an increase in the average rate charged to customers and a reduction in uncompensated miles. Although the average number of trucks declined from 1,804 during 2013 to 1,781 during 2014, the number of miles traveled increased from 209.8 million miles during 2013 to 210.0 million miles during 2014 as a result of an increase in the average number of miles traveled each work day from 458 miles per truck during 2013 to 464 miles per truck during 2014. The average rate charged per total mile during 2014 increased $0.01 as compared to the average rate charged during 2013. The average percentage of uncompensated miles declined from 7.3% of total miles for 2013 to 6.8% of total miles during 2014.
Salaries, wages and benefits increased from 36.7% of revenues, before fuel surcharges, during 2013 to 36.8% of revenues, before fuel surcharges, during 2014. The increase related primarily to an increase in non-driver wages paid during 2014 as compared to non-driver wages paid during 2013. The number of non-driver employees increased from an average of 530 during 2013 to an average of 580 during 2014 as a result of increasing our operations staff to provide increased service to our drivers and maintenance staff in order to more efficiently maintain our equipment and manage maintenance costs. Partially offsetting the increase was a decrease in costs associated with workers’ compensation benefits during 2014 as compared to 2013.
Operating supplies and expenses decreased from 16.4% of revenues, before fuel surcharges, during 2013 to 11.1% of revenues, before fuel surcharges, during 2014. The decrease relates primarily to a decrease in the average surcharge-adjusted fuel price paid per gallon of diesel fuel and to an increase in the average miles-per-gallon (“mpg”) experienced during 2014 as compared to 2013. The average surcharge-adjusted fuel price paid per gallon of diesel fuel decreased as a result of more favorable fuel surcharge arrangements made with customers and to an increase in the number of owner operators in our fleet. Fuel surcharge collections can fluctuate significantly from period to period as they are generally based on changes in fuel prices from period to period so that during periods of rising fuel prices fuel surcharge collections increase while fuel surcharge collections decrease during periods of falling fuel prices. Fuel surcharge revenue generated from transportation services performed by owner operators is reflected as a reduction in net operating supplies and expenses, while fuel surcharges paid to owner operators for their services is reported along with their base rate of pay in the Rent and purchased transportation category. These categorizations have the effect of reducing our net operating supplies and expenses while increasing the Rent and purchased transportation category, as discussed below. The average mpg experienced increased during 2014 as compared to the mpg experienced during 2013 as a result of replacing older trucks with newer trucks, which are more fuel efficient. The decrease also relates to a decrease in amounts paid for equipment maintenance costs during 2014 as compared to amounts paid during 2013 as a result of replacing older equipment with new equipment. Partially offsetting this decrease is an increase in amounts paid for driver recruiting and driver training schools during 2014 as compared to amounts paid during 2013. The increase in driver recruiting and training costs are a result of heightened competition for qualified drivers as industry demand has increased and increased regulations have forced some drivers to exit the profession.
Rent and purchased transportation increased from 21.9% of revenues, before fuel surcharges, during 2013 to 23.5% of revenues, before fuel surcharges, during 2014. This increase relates primarily to lease payments associated with the lease of 421 trucks, as discussed below. This increase was partially offset by a decrease in driver lease expense as a result of fewer miles being driven by owner operators during 2014 as compared to 2013.
Depreciation decreased from 13.5% of revenues, before fuel surcharges, during 2013 to 12.4% of revenues, before fuel surcharges, during 2014. The decrease relates primarily to a decrease in the average number of company-owned trucks as a result of a leasing arrangement entered into during the first quarter of 2014 for the lease of 147 trucks, including 97 company-owned trucks which were sold to a third party and then leased back to the Company. During the remainder of 2014, the Company entered into lease agreements for the lease of an additional 274 trucks and as of December 31, 2014, the Company’s fleet consists of 421 leased trucks. The lease payments associated with these leases are reported in the Rents and purchased transportation category.
Insurance and claims increased from 5.0% of revenues, before fuel surcharges, during 2013 to 6.9% of revenues, before fuel surcharges, during 2014. This increase relates primarily to an estimated amount reserved during 2014 for the anticipated settlement of a lawsuit, which claims that the Company was in violation of minimum wage laws with regard to certain activities performed by employee driver as mentioned in the section “Legal Proceedings” in Item 3 of this Report, as well as an increase in amounts expensed for litigation costs associated with other claims. The increase also relates to increases in the amount paid for physical damage insurance premiums during 2014 as compared to 2013 due to an increase in the value of the equipment covered as a result of replacing older equipment with new equipment and to obtaining physical damage coverage on our trailers effective during the fourth quarter of 2013.
Other expenses increased from 3.1% of revenues, before fuel surcharges, during 2013 to 3.3% of revenues, before fuel surcharges, during 2014. The increase relates primarily to an increase in amounts expensed for legal fees.
The truckload services division operating ratio, which measures the ratio of operating expenses, net of fuel surcharges, to operating revenues, before fuel surcharges, improved to 92.4% for 2014 from 96.3% for 2013.
Non-operating income increased from 0.5% of revenues, before fuel surcharges, during 2013 to 0.7% of revenues, before fuel surcharges, during 2014. The components of this category consist primarily of dividends earned and gains or losses on the Company’s investments in marketable equity securities. The increase relates primarily to an increase in the amount of gains recognized during 2014 as compared to 2013 on the Company’s investments in marketable equity securities.
2013 Compared to 2012
For the year ended December 31, 2013, truckload services revenue, before fuel surcharges, increased 6.1% to $290.1 million as compared to $273.4 million for the year ended December 31, 2012. The increase related primarily to an increase in the number of miles traveled, a reduction in uncompensated miles, and an increase in the average rate charged to customers. The number of miles traveled increased from 200.8 million miles during 2012 to 209.8 million miles during 2013 primarily as a result of an increase in the average number of trucks in service, which increased from 1,760 during 2012 to 1,804 during 2013. The average percentage of uncompensated miles declined from 8.7% of total miles during 2012 to 7.3% of total miles during 2013. The average rate charged per total mile during 2013 increased $0.02 as compared to the average rate charged during 2012. Also contributing to the increase was an increase in equipment utilization as the Company continues to replace older trucks, which generally have a higher probability for mechanical problems which could disrupt en route service thereby reducing route efficiency.
Salaries, wages and benefits decreased from 39.7% of revenues, before fuel surcharges, during 2012 to 36.7% of revenues, before fuel surcharges, during 2013. The decrease related primarily to a decrease in Company driver wages paid during 2013 as compared to Company driver wages paid during 2012. Our driver pool consists of both company drivers and third-party owner operators. Company drivers are employees of the Company and perform services in company-owned equipment while owner-operator drivers provide services, under contract, using their own equipment. While each group is generally compensated on a per-mile basis, owner-operator payments are classified in the Company’s financial statements under the Rent and purchased transportation category. The percentage-based decrease in Salaries, wages and benefits resulted from a decrease in the proportion of total miles driven by company drivers during 2013 in comparison to the proportion of total miles driven by company drivers during 2012. This proportional decrease was the result of an increase in the average number of owner operators under contract from 149 during 2012 to 322 during 2013 and a corresponding decrease in the average number of company drivers. On a dollar basis, total salaries, wages and benefits decreased from $108.4 million during 2012 to $106.4 million during 2013. Partially offsetting the decrease was an increase in costs associated with workers’ compensation benefits during the 2013 as compared to 2012.
Operating supplies and expenses decreased from 26.5% of revenues, before fuel surcharges, during 2012, to 16.4% of revenues, before fuel surcharges, during 2013. The decrease related primarily to a decrease in the average surcharge-adjusted fuel price paid per gallon of diesel fuel and to an increase in the average miles-per-gallon (“mpg”) experienced during 2013 as compared to 2012. The average surcharge-adjusted fuel price paid per gallon of diesel fuel decreased as a result of more favorable fuel surcharge arrangements made with customers and to an increase in the number of owner operators in our fleet. Fuel surcharge collections can fluctuate significantly from period to period as they are generally based on changes in fuel prices from period to period so that during periods of rising fuel prices fuel surcharge collections increase while fuel surcharge collections decrease during periods of falling fuel prices. Fuel surcharge revenue generated from transportation services performed by owner operators is reflected as a reduction in net operating supplies and expenses, while fuel surcharges paid to owner operators for their services is reported along with their base rate of pay in the Rent and purchased transportation category. These categorizations have the effect of reducing our net operating supplies and expenses while increasing the Rent and purchased transportation category, as discussed above. The average mpg experienced increased during 2013 as compared to the mpg experienced during 2012 as a result of replacing older trucks with newer trucks, which are more fuel efficient. The decrease was also related to a decrease in amounts paid for equipment maintenance costs during 2013 as compared to amounts paid during 2012 as a result of replacing older equipment with new equipment. Partially offsetting this decrease was an increase in amounts paid for driver training schools during 2013 as compared to amounts paid during 2012. The increase in driver training and recruiting costs are a result of heightened competition for qualified drivers as industry demand has increased and increased regulations have forced some drivers to exit the profession. In addition, the decrease related to a decrease in amounts paid for equipment registration fees from $5.0 million during 2012 to $4.9 million during 2013.
Rent and purchased transportation increased from 11.3% of revenues, before fuel surcharges, during 2012 to 21.9% of revenues, before fuel surcharges, during 2013. The increase relates primarily to an increase in driver lease expense as the average number of owner operators under contract increased from 149 during 2012 to 322 during 2013. The increase in costs in this category, as they relate to the increase in owner operators, are partially offset by a decrease in other cost categories, such as repairs and fuel, which are generally borne by the owner operator.
Depreciation decreased from 14.0% of revenues, before fuel surcharges, during 2012 to 13.5% of revenues, before fuel surcharges, during 2013. The percentage-based decrease related primarily to the interaction of the fixed-cost characteristic of depreciation expense with an increase in revenues for the periods compared.
Other expenses increased from 2.7% of revenues, before fuel surcharges, during 2012 to 3.1% of revenues, before fuel surcharges, during 2013. The increase related primarily to an increase in amounts expensed for uncollectible revenue, professional services, and for other supplies and expenses.
The truckload services division operating ratio, which measures the ratio of operating expenses, net of fuel surcharges, to operating revenues, before fuel surcharges, improved to 96.3% for 2013 from 99.2% for 2012.
Non-operating income decreased from 1.2% of revenues, before fuel surcharges, during 2012, to 0.5% of revenues, before fuel surcharges, during 2013. The components of this category consist primarily of dividends earned and gains or losses on the Company’s investments in marketable equity securities. The decrease related primarily to a decrease in the amount of gains recognized between the periods on the Company’s investments in marketable equity securities.
Results of Operations - Logistics and Brokerage Services
The following table sets forth, for logistics and brokerage services, the percentage relationship of expense items to operating revenues, before fuel surcharges, for the periods indicated. Brokerage service operations occur specifically in certain divisions; however, brokerage operations occur throughout the Company in similar operations having substantially similar economic characteristics. Rent and purchased transportation, which includes costs paid to third party carriers, are shown net of fuel surcharges.
|
Years Ended December 31, |
||||||||||||
|
2014 |
2013 |
2012 |
||||||||||
|
Operating revenues, before fuel surcharge |
100.0 | % | 100.0 | % | 100.0 | % | ||||||
|
Operating expenses: |
||||||||||||
|
Salaries, wages and benefits |
2.7 | 2.6 | 1.8 | |||||||||
|
Operating supplies and expenses |
0.0 | 0.0 | 0.0 | |||||||||
|
Rent and purchased transportation |
93.0 | 94.3 | 95.2 | |||||||||
|
Depreciation |
0.0 | 0.0 | 0.0 | |||||||||
|
Insurance and claims |
0.4 | 0.0 | 0.0 | |||||||||
|
Other |
0.4 | 0.4 | 0.3 | |||||||||
|
Gain on sale or disposal of property |
0.0 | 0.0 | 0.0 | |||||||||
|
Total operating expenses |
96.5 | 97.3 | 97.3 | |||||||||
|
Operating income |
3.5 | 2.7 | 2.7 | |||||||||
|
Non-operating income |
0.1 | 0.1 | 0.2 | |||||||||
|
Interest expense |
(0.2 | ) | (0.3 | ) | (0.2 | ) | ||||||
|
Income before income taxes |
3.4 | % | 2.5 | % | 2.7 | % | ||||||
2014 Compared to 2013
For the year ended December 31, 2014, logistics and brokerage services revenues, before fuel surcharges, increased 3.6% to $23.9 million as compared to $23.0 million for the year ended December 31, 2013. The increase was primarily the result of an increase in the brokered load rates during 2014 as compared to 2013.
Rent and purchased transportation decreased from 94.3% of revenues, before fuel surcharges, in 2013 to 93.0% of revenues, before fuel surcharges, in 2014. The decrease relates to a decrease in amounts charged by third party logistics and brokerage service providers.
Insurance and claims increased to 0.4% of revenues, before fuel surcharges, in 2014 compared to 2013. This increase relates primarily to an estimated amount reserved during 2014 for the anticipated settlement of a lawsuit, which claims that the Company was in violation of minimum wage laws with regard to certain activities performed by employee drivers as mentioned in the section “Legal Proceedings” in Item 3 of this Report, as well as an increase in amounts expensed for litigation costs associated with other claims.
The logistics and brokerage services division operating ratio, which measures the ratio of operating expenses, net of fuel surcharges, to operating revenues, before fuel surcharges, improved to 96.5% for 2014 from 97.3% for 2013.
2013 Compared to 2012
For the year ended December 31, 2013, logistics and brokerage services revenues, before fuel surcharges, decreased 5.1% to $23.0 million as compared to $24.3 million for the year ended December 31, 2012. The decrease was primarily the result of a decrease in the brokered load rates during 2013 as compared to 2012.
Salaries, wages and benefits increased from 1.8% of revenues, before fuel surcharges, in 2012 to 2.6% of revenues, before fuel surcharges, in 2013. The increase resulted from an increase in the number of employees assigned to the logistics and brokerage services division.
Rent and purchased transportation decreased from 95.2% of revenues, before fuel surcharges, in 2012 to 94.3% of revenues, before fuel surcharges, in 2013. The decrease related to a decrease in amounts charged by third party logistics and brokerage service providers.
The logistics and brokerage services division operating ratio, which measures the ratio of operating expenses, net of fuel surcharges, to operating revenues, before fuel surcharges, remained unchanged at 97.3% for 2013 and 2012.
Results of Operations - Combined Services
2014 Compared to 2013
Income tax expense was approximately $8.7 million in 2014 resulting in an effective rate of 39.3%, as compared to an income tax expense of approximately $3.8 million in 2013 resulting in an effective rate of 38.8%. The effective tax rate differs from the statutory rate primarily due to the existence of partially non-deductible meal and incidental expense per-diem payments to company drivers. Per-diem payments may cause a significant difference in the Company’s effective tax rate from period-to-period as the proportion of non-deductible expenses to pre-tax net income increases or decreases.
In determining whether a tax asset valuation allowance is necessary, management, in accordance with the provisions of Accounting Standards Codification (“ASC”) 740-10-30, weighs all available evidence, both positive and negative to determine whether, based on the weight of that evidence, a valuation allowance is necessary. If negative conditions exist which indicate a valuation allowance might be necessary, consideration is then given to what effect the future reversals of existing taxable temporary differences and the availability of tax strategies might have on future taxable income to determine the amount, if any, of the required valuation allowance. As of December 31, 2014, management determined that the future reversals of existing taxable temporary differences and available tax strategies would generate sufficient future taxable income to realize its tax assets and therefore a valuation allowance was not necessary.
The Company recognizes a tax benefit from an uncertain tax position only if it is more likely than not that the position will be sustained on examination by taxing authorities, based on the technical merits of the position. As of December 31, 2014, an adjustment to the Company’s consolidated financial statements for uncertain tax positions has not been required as management believes that the Company’s tax positions taken in income tax returns filed or to be filed are supported by clear and unambiguous income tax laws. The Company recognizes interest and penalties related to uncertain income tax positions, if any, in income tax expense. During 2014 and 2013, the Company has not recognized or accrued any interest or penalties related to uncertain income tax positions.
The Company and its subsidiaries are subject to U.S. and Canadian federal income tax laws as well as the income tax laws of multiple state jurisdictions. The major tax jurisdictions in which we operate generally provide for a deficiency assessment statute of limitation period of three years and as a result, the Company’s tax years 2011 and forward remain open to examination in those jurisdictions.
The combined net income for all divisions was $13.5 million, or 4.3% of revenues, before fuel surcharge, for 2014 as compared to the combined net income for all divisions of $5.9 million or 1.9% of revenues, before fuel surcharge, for 2013. The increase in net income resulted in an increase in diluted earnings per share to $1.68 for 2014 from a diluted earnings per share of $0.68 for 2013.
2013 Compared to 2012
Income tax expense was approximately $3.8 million in 2013 resulting in an effective rate of 38.8%, as compared to an income tax expense of approximately $1.4 million in 2012 resulting in an effective rate of 39.4%. The effective tax rate differs from the statutory rate primarily due to the existence of partially non-deductible meal and incidental expense per-diem payments to company drivers. Per-diem payments may cause a significant difference in the Company’s effective tax rate from period-to-period as the proportion of non-deductible expenses to pre-tax net income increases or decreases.
In determining whether a tax asset valuation allowance is necessary, management, in accordance with the provisions of ASC 740-10-30, weighs all available evidence, both positive and negative to determine whether, based on the weight of that evidence, a valuation allowance is necessary. If negative conditions exist which indicate a valuation allowance might be necessary, consideration is then given to what effect the future reversals of existing taxable temporary differences and the availability of tax strategies might have on future taxable income to determine the amount, if any, of the required valuation allowance. As of December 31, 2013, management determined that the future reversals of existing taxable temporary differences and available tax strategies would generate sufficient future taxable income to realize its tax assets and therefore a valuation allowance was not necessary.
As of December 31, 2013, there were no significant unrecognized tax benefits and an adjustment to the Company’s consolidated financial statements for uncertain tax positions was not required as management believes that the Company’s significant tax positions taken in income tax returns filed or to be filed are supported by clear and unambiguous income tax laws.
The Company and its subsidiaries are subject to U.S. and Canadian federal income tax laws as well as the income tax laws of multiple state jurisdictions. The major tax jurisdictions in which we operate generally provide for a deficiency assessment statute of limitation period of three years and as a result, the Company’s tax years 2010 and forward remain open to examination in those jurisdictions. During 2013, the Company has not recognized or accrued any interest or penalties related to uncertain income tax positions and does not believe it is reasonably possible that our unrecognized tax benefits will significantly change within the next twelve months.
The combined net income for all divisions was $5.9 million, or 1.9% of revenues, before fuel surcharge, for 2013 as compared to the combined net income for all divisions of $2.2 million or 0.7% of revenues, before fuel surcharge, for 2012. The increase in net income resulted in an increase in diluted earnings per share to $0.68 for 2013 from a diluted earnings per share of $0.25 for 2012.
Quarterly Results of Operations
The following table presents selected consolidated financial information for each of our last eight fiscal quarters through December 31, 2014. The information has been derived from unaudited consolidated financial statements that, in the opinion of management, reflect all adjustments, consisting of normal recurring adjustments, necessary for a fair presentation of the quarterly information.
|
Quarter Ended |
||||||||||||||||||||||||||||||||
|
Mar. 31, 2014 |
June 30, 2014 |
Sept. 30, 2014 |
Dec. 31, 2014 |
Mar. 31, 2013 |
June 30, 2013 |
Sept. 30, 2013 |
Dec. 31, 2013 |
|||||||||||||||||||||||||
|
(unaudited) |
||||||||||||||||||||||||||||||||
|
(in thousands, except earnings per share data) |
||||||||||||||||||||||||||||||||
|
Operating revenues |
$ | 97,820 | $ | 104,343 | $ | 107,059 | $ | 101,715 | $ | 99,982 | $ | 104,408 | $ | 101,878 | $ | 96,545 | ||||||||||||||||
|
Total operating expenses |
94,975 | 95,754 | 98,609 | 98,589 | 100,234 | 99,402 | 97,194 | 94,477 | ||||||||||||||||||||||||
|
Operating income (loss) |
2,845 | 8,589 | 8,450 | 3,126 | (252 | ) | 5,006 | 4,684 | 2,068 | |||||||||||||||||||||||
|
Net income (loss) |
1,357 | 4,945 | 5,057 | 2,132 | (456 | ) | 2,682 | 2,393 | 1,296 | |||||||||||||||||||||||
|
Income (loss) per common share: |
||||||||||||||||||||||||||||||||
|
Basic |
$ | 0.17 | $ | 0.62 | $ | 0.63 | $ | 0.27 | $ | (0.05 | ) | $ | 0.31 | $ | 0.28 | $ | 0.15 | |||||||||||||||
|
Diluted |
$ | 0.17 | $ | 0.62 | $ | 0.63 | $ | 0.27 | $ | (0.05 | ) | $ | 0.31 | $ | 0.28 | $ | 0.15 | |||||||||||||||
Liquidity and Capital Resources
Our business has required, and will continue to require, a significant investment in new revenue equipment. Our primary sources of liquidity have been funds provided by operations, proceeds from the sales of revenue equipment, issuances of equity securities, and borrowings under our lines of credit, installment notes, and investment margin account.
During 2014, we generated $55.3 million in cash from operating activities compared to $43.2 million and $33.6 million in 2013 and 2012, respectively. Investing activities used less than $0.1 million in cash during 2014 compared to $44.3 million and $72.6 million in 2013 and 2012, respectively. The cash used for investing activities in all three years related primarily to the purchase of revenue equipment such as trucks and trailers or related equipment such as auxiliary power units. Financing activities used $28.7 million in cash during 2014 compared to $1.8 million in cash provided during 2013 and $39.3 million in cash provided during 2012. See the Consolidated Statements of Cash Flows in Item 8 of this Report.
Our primary use of funds is for the purchase of revenue equipment. We typically use installment notes, our existing lines of credit on an interim basis, proceeds from the sale or trade of equipment, and cash flows from operations, to finance capital expenditures and repay long-term debt. During 2014 and 2013, we utilized cash on hand, installment notes, and our lines of credit to finance revenue equipment purchases of approximately $26.7 million and $70.2 million, respectively.
Occasionally we finance the acquisition of revenue equipment through installment notes with fixed interest rates and terms ranging from 36 to 60 months. At December 31, 2014, the Company’s subsidiaries had combined outstanding indebtedness under such installment notes of $95.2 million. These installment notes are payable in monthly installments, ranging from 36 monthly installments to 60 monthly installments, at a weighted average interest rate of 2.66%. At December 31, 2013, the Company’s subsidiaries had combined outstanding indebtedness under such installment notes of $110.5 million. These installment notes were payable in 36 monthly installments at a weighted average interest rate of 2.91%.
In order to maintain our truck and trailer fleet count it is often necessary to purchase replacement units and place them in service before trade units are removed from service. The timing of this process often requires the Company to pay for new units without any reduction in price for trade units. In this situation, the Company later receives payment for the trade units as they are delivered to the equipment vendor and have passed vendor inspection. During the twelve months ended December 31, 2014 and 2013, the Company received approximately $15.3 million and $16.3 million, respectively, for units delivered for trade.
During 2014, the Company negotiated an increase in its revolving line of credit from $35.0 million to $40.0 million. Amounts outstanding under the line bear interest at LIBOR (determined as of the first day of each month) plus 1.50% (1.65% at December 31, 2014), are secured by our trade accounts receivable and mature on July 1, 2016. At December 31, 2014, outstanding advances on the line were approximately $1.1 million, which consisted entirely of letters of credit totaling $1.1 million, with availability to borrow $38.9 million.
Cash and cash equivalents increased from $1.2 million at December 31, 2013 to $27.6 million at December 31, 2014. The increase relates primarily to cash generated from operating activities and to the sale of trucks which were replaced with leased trucks that did not require an immediate cash purchase outflow.
Trade accounts receivable decreased from $58.5 million at December 31, 2013 to $53.0 million at December 31, 2014. The decrease relates primarily to amounts collected in excess of freight revenue and fuel surcharge revenue generated, which flows through the accounts receivable account, during 2014 as compared to amounts collected during 2013, which lagged amounts generated for freight revenue and fuel surcharge revenue.
Accounts receivable-other increased from $3.7 million at December 31, 2013 to $11.5 million at December 31, 2014. The increase relates primarily to an increase in amounts held with the Company’s third-party qualified intermediary. The Company contracts with a third-party qualified intermediary in order to accomplish tax-deferred, like-kind exchanges related to its revenue equipment. Under the program, dispositions of eligible trucks or trailers and acquisitions of replacement trucks or trailers are made in a form whereby any associated tax gains related to the disposal are deferred. To qualify for like-kind exchange treatment, we exchange, through our qualified intermediary, eligible trucks or trailers being disposed with trucks or trailers being acquired. Amounts held by the Company’s third-party qualified intermediary are dependent on the timing and extent of the Company’s revenue equipment sales and/or purchase activities which can fluctuate significantly from period-to-period.
Prepaid expenses and deposits increased from $6.6 million at December 31, 2013 to $10.1 million at December 31, 2014. The increase relates to the payment of truck and trailer registration fees of $2.2 million and approximately $1.3 million of insurance premiums which were paid in advance in December 2014. These prepayments will be amortized over 2015. There were no corresponding payments made during December of 2013.
Marketable equity securities at December 31, 2014 increased approximately $3.9 million as compared to December 31, 2013. The increase was primarily related to purchases of new securities of approximately $4.3 million and changes in market value of approximately $0.4 million offset by the cost of securities sold of approximately $0.8 million. At December 31, 2014, the remaining marketable equity securities have a combined cost basis of approximately $14.4 million and a combined fair market value of approximately $24.9 million. The Company has developed a strategy to invest in securities from which it expects to receive dividends that qualify for favorable tax treatment, as well as appreciate in value. The Company anticipates that increases in the market value of the investments combined with dividend payments will exceed interest rates paid on borrowings for the same period. During 2014, the Company had net unrealized pre-tax gains of approximately $0.4 million and received dividends of approximately $0.8 million. The holding term of these securities depends largely on the general economic environment, the equity markets, borrowing rates and the Company's cash requirements.
Revenue equipment, at December 31, 2014, which generally consists of trucks, trailers, and revenue equipment accessories such as Qualcomm™ satellite tracking units and auxiliary power units, decreased approximately $42.8 million as compared to December 31, 2013. The decrease relates primarily to a decrease in the number of company-owned trucks due to the replacement of 421 company-owned trucks during 2014 with leased trucks.
Accounts payable at December 31, 2014 increased approximately $13.7 million as compared to December 31, 2013. The increase was primarily related to an increase in the amount accrued for purchases of treasury stock through Dutch Auctions. At December 31, 2014, the Company accrued approximately $28.7 million, including fees and commissions, for the repurchase of shares through the 2014 tender offer compared to approximately $13.9 million, including fees and commissions, for the repurchase of shares through the 2013 tender offer at December 31 2013. The increase was also related to an increase in amounts accrued for third party brokerage companies of approximately $1.4 million at December 31, 2014 as compared to December 31, 2013. These increases were partially offset by a decrease in bank drafts outstanding in excess of the bank balance of approximately $3.2 million at December 31, 2014 as compared to December 31, 2013.
Accrued expenses and other liabilities at December 31, 2014 increased approximately $5.0 million as compared to December 31, 2013. The increase is primarily related to a $4.1 million accrual for the anticipated settlement, including settlement costs, of a lawsuit which claims that the Company was in violation of minimum wage laws with regard to certain activities performed by employee drivers. The increase was also related to a $1.7 million increase in margin account borrowings which are secured by the Company’s investments in marketable equity securities. The Company periodically uses this margin account for the purchase of marketable equity securities and as a source of short-term liquidity. This increase was partially offset by a decrease of $0.8 million in workers’ compensation claims.
Current maturities of long term-debt and long-term debt fluctuations are reviewed on an aggregate basis as the classification of amounts in each category are typically affected merely by the passage of time. Current maturities of long-term debt and long-term debt, on an aggregate basis at December 31, 2014, decreased approximately $15.3 million as compared to December 31, 2013. The decrease was related to additional borrowings received during 2014 net of the principal portion of scheduled installment note payments made during 2014.
For 2015, we expect to purchase 450 new trucks and 1,400 new trailers while continuing to sell or trade equipment that has reached the end of its cycle, which we expect to result in net capital expenditures of approximately $64.5 million. We also expect to continue to replace approximately 300 Company-owned trucks with leased trucks during 2015. Management believes we will be able to finance our near term needs for working capital over the next twelve months, as well as acquisitions of revenue equipment during such period, with cash balances, cash flows from operations, and borrowings believed to be available from financing sources. We will continue to have significant capital requirements over the long-term, which may require us to incur debt or seek additional equity capital. The availability of additional capital will depend upon prevailing market conditions, the market price of our common stock and several other factors over which we have limited control, as well as our financial condition and results of operations. Nevertheless, based on our anticipated future cash flows and sources of financing that we expect will be available to us, we do not expect that we will experience any significant liquidity constraints in the foreseeable future.
Contractual Obligations and Commercial Commitments
The following table sets forth the Company's contractual obligations and commercial commitments as of December 31, 2014:
| Payments due by period | ||||||||||||||||||||
|
(in thousands) |
||||||||||||||||||||
|
Total |
Less than 1 year |
1 to 3 Years |
3 to 5 Years |
More than 5 Years |
||||||||||||||||
|
Long-term debt (1) |
$ | 110,848 | $ | 45,468 | $ | 49,768 | $ | 15,612 | $ | - | ||||||||||
|
Operating leases (2) |
23,254 | 8,844 | 14,153 | 257 | - | |||||||||||||||
|
Total |
$ | 134,102 | $ | 54,312 | $ | 63,921 | $ | 15,869 | $ | - | ||||||||||
|
(1) |
Including interest. |
|
(2) |
Represents equipment, building, facilities, and drop yard operating leases. |
Off-Balance Sheet Arrangements
During 2014, the Company entered into operating leases for the lease of 421 trucks. These leases do not require any residual value guarantees; however, the trucks must meet certain normal wear and tear conditions at the end of the lease term upon return to the lessor.
The trucks held under operating leases are not carried on our balance sheet and the respective lease payments are reflected in our consolidated statement of operations as a component of the caption “Rents and purchased transportation”. Rent expense related to the trucks under the operating lease agreements totaled approximately $4.4 million for the year ended December 31, 2014.
Insurance
With respect to physical damage for trucks and trailers, cargo loss, and auto liability, the Company maintains insurance coverage to protect it from certain business risks. These policies are with various carriers and have per occurrence deductibles of $7,500, $2,500, $10,000, and $2,500 respectively. The Company maintains workers’ compensation coverage in Arkansas, Ohio, Oklahoma, Mississippi, and Florida with a $500,000 self-insured retention and a $500,000 per occurrence excess policy. The Company has elected to opt out of workers' compensation coverage in Texas and is providing coverage through the P.A.M. Texas Injury Plan. The Company has reserved for estimated losses to pay such claims as well as claims incurred but not yet reported. The Company has not experienced any adverse trends involving differences in claims experienced versus claims estimates for workers’ compensation claims. Letters of credit aggregating approximately $1.1 million and certificates of deposit totaling $300,000 are held by banks as security for workers’ compensation claims. The Company self insures for employee health claims with a stop loss of $325,000 per covered employee per year and estimates its liability for claims incurred but not reported.
Inflation
Inflation has an impact on most of our operating costs. Over the past three years, the effect of inflation has been minimal.
Adoption of Accounting Policies
See “Item 8. Financial Statements and Supplementary Data, Note 1 to the Consolidated Financial Statements - Recent Accounting Pronouncements.”
Critical Accounting Policies
The preparation of financial statements in accordance with accounting principles generally accepted in the United States of America requires management to adopt accounting policies and make significant judgments and estimates that impact the amounts reported in our consolidated financial statements and accompanying notes. Therefore, the reported amounts of assets, liabilities, revenue, expenses, and associated disclosures of contingent assets and liabilities are affected by judgments and estimates. In many cases, there are alternative assumptions, policies, or estimation techniques that could be used. Management evaluates its assumptions, policies, and estimates on an ongoing basis, utilizing historical experience, and other methods considered reasonable in the particular circumstances. Nevertheless, actual results may differ significantly from our estimates and assumptions, and it is possible that materially different amounts would be reported using differing estimates or assumptions. Management considers our critical accounting policies to be those that require more significant judgments and estimates when we prepare our consolidated financial statements. Our critical accounting policies include the following:
Accounts receivable and allowance for doubtful accounts. Accounts receivable are presented in the Company’s consolidated financial statements net of an allowance for estimated uncollectible amounts. Management estimates this allowance based upon an evaluation of the aging of our customer receivables and historical write-offs, as well as other trends and factors surrounding the credit risk of specific customers. The Company continually updates the history it uses to make these estimates so as to reflect the most recent trends, factors and other information available. In order to gather information regarding these trends and factors, the Company also performs ongoing credit evaluations of its customers. Customer receivables are considered to be past due when payment has not been received by the invoice due date. Write-offs occur when we determine an account to be uncollectible and could differ from the allowance estimate as a result of a number of factors, including unanticipated changes in the overall economic environment or factors and risks surrounding a particular customer. Management believes its methodology for estimating the allowance for doubtful accounts to be reliable; however, additional allowances may be required if the financial condition of our customers were to deteriorate and could have a material effect on the Company’s consolidated financial statements.
Depreciation of trucks and trailers. Depreciation of trucks and trailers is calculated by the straight-line method over the assets estimated useful life, which range from three to 12 years, down to an estimated salvage value at the end of the assets estimated useful life. Management must use its judgment in the selection of estimated useful lives and salvage values for purposes of this calculation. In some cases, the Company has agreements in place with certain manufacturers whereby salvage values are guaranteed by the manufacturer. In other cases, where salvage values are not guaranteed, estimates of salvage value are based on the expected market values of equipment at the time of disposal.
The depreciation of trucks and trailers over their estimated useful lives and the determination of any salvage value also require management to make judgments about future events. Therefore, the Company’s management periodically evaluates whether changes to estimated useful lives or salvage values are necessary to ensure these estimates accurately reflect the economic reality of the assets. This periodic evaluation may result in changes in the estimated lives and/or salvage values used by the Company to depreciate its assets, which can affect the amount of periodic depreciation expense recognized and, ultimately, the gain or loss on the disposal of an asset. Future changes in our estimated useful life or salvage value estimates, or fluctuations in market value that is not reflected in current estimates, could have a material effect on the Company’s consolidated financial statements.
Impairment of long-lived assets. Long-lived assets are reviewed for impairment in accordance with Topic ASC 360, “Property, Plant, and Equipment”. This authoritative guidance provides that whenever there are certain significant events or changes in circumstances the value of long-lived assets or groups of assets must be tested to determine if their value can be recovered from their future cash flows. In the event that undiscounted cash flows expected to be generated by the asset are less than the carrying amount, the asset or group of assets must be evaluated for impairment. Impairment exists if the carrying value of the asset exceeds its fair value.
Significantly all of the Company’s cash flows from operations are generated by trucks and trailers, and as such, the cost of other long-lived assets are funded by those operations. Therefore, management tests for the recoverability of all of the Company’s long-lived assets as a single group at the entity level and examines the forecasted future cash flows generated by trucks and trailers, including their eventual disposition, to determine if those cash flows exceed the carrying value of the long-lived assets. Forecasted cash flows are estimated using assumptions about future operations. To the extent that facts and circumstances change in the future, our estimates of future cash flows may also change either positively or negatively. In light of the increase in the Company’s market capitalization during 2014 and net operating profits of the Company for the years ended December 31, 2014 and 2013, no impairment indicators existed which required management to test the Company’s long-lived assets for recoverability as of December 31, 2014. As such, no impairment losses were recorded during 2014.
Claims accruals. The Company is self-insured for health and workers' compensation benefits up to certain stop-loss limits. Such costs are accrued based on known claims and an estimate of incurred, but not reported (IBNR) claims. IBNR claims are estimated using historical lag information and other data either provided by outside claims administrators or developed internally. Actual claims payments may differ from management’s estimates as a result of a number of factors, including evaluation of severity, increases in legal or medical costs, and other case-specific factors. The actual claims payments are charged against the Company’s recorded accrued claims liabilities and have been reasonable with respect to the estimates of the liabilities made under the Company’s methodology. However, the estimation process is generally subjective, and to the extent that future actual results materially differ from original estimates made by management, adjustments to recorded accruals may be necessary which could have a material effect on the Company’s consolidated financial statements. Based upon our 2014 health and workers' compensation expenses, a 10% increase in both claims incurred and IBNR claims, would increase our annual health and workers' compensation expenses by $0.8 million.
Revenue recognition. Revenue is recognized in full upon completion of delivery to the receiver's location. For freight in transit at the end of a reporting period, the Company recognizes revenue pro rata based on relative transit time completed as a portion of the estimated total transit time. Expenses are recognized as incurred.
Income Taxes. The Company’s deferred tax assets and liabilities represent items that will result in taxable income or a tax deduction in future years for which the Company has already recorded the related tax expense or benefit in its consolidated statements of operations. Deferred tax accounts arise as a result of timing differences between when items are recognized in the Company’s consolidated financial statements compared to when they are recognized in the Company’s tax returns. In establishing the Company’s deferred income tax assets and liabilities, management makes judgments and interpretations based on the enacted tax laws and published tax guidance that are applicable to its operations. Deferred income tax assets and liabilities are measured using enacted tax rates expected to apply to taxable income in the years in which those temporary differences are expected to be recovered or settled.
In determining whether a tax asset valuation allowance is necessary, management, in accordance with the provisions of ASC 740-10-30, weighs all available evidence, both positive and negative to determine whether, based on the weight of that evidence, a valuation allowance is necessary. If negative conditions exist which indicate a valuation allowance might be necessary, consideration is then given to what effect the future reversals of existing taxable temporary differences and the availability of tax strategies might have on future taxable income to determine the amount, if any, of the required valuation allowance. Significant management judgment is required as it relates to future taxable income, future capital gains, tax settlements, valuation allowances, and the Company’s ability to utilize tax loss and credit carryforwards. As of December 31, 2014, management determined that the future reversals of existing taxable temporary differences and available tax strategies would generate sufficient future taxable income to realize its tax assets and therefore a valuation allowance was not necessary.
Management believes that future tax consequences have been adequately provided for based on the current facts and circumstances and current tax law. However, should current circumstances change or the Company’s tax positions be challenged, different outcomes could result which could have a material effect on the Company’s consolidated financial statements.
Item 7A. Quantitative and Qualitative Disclosures about Market Risk.
Our primary market risk exposures include equity price risk, interest rate risk, commodity price risk (the price paid to obtain diesel fuel for our trucks), and foreign currency exchange rate risk. The potential adverse impact of these risks are discussed below.
The following sensitivity analyses do not consider the effects that an adverse change may have on the overall economy nor do they consider additional actions we may take to mitigate our exposure to such changes. Actual results of changes in prices or rates may differ materially from the hypothetical results described below.
Equity Price Risk
We hold certain actively traded marketable equity securities which subjects the Company to fluctuations in the fair market value of its investment portfolio based on current market price. The recorded value of marketable equity securities increased to $24.9 million at December 31, 2014 from $21.0 million at December 31, 2013. The increase includes additional purchases of $4.3 million, and an increase in fair market value, net of write-downs, of approximately $0.4 million during 2014. A 10% decrease in the market price of our marketable equity securities would cause a corresponding 10% decrease in the carrying amounts of these securities, or approximately $2.5 million. For additional information with respect to the marketable equity securities, see Note 3 to our consolidated financial statements.
Interest Rate Risk
Our line of credit bears interest at a floating rate equal to LIBOR plus a fixed percentage. Accordingly, changes in LIBOR, which are affected by changes in interest rates, will affect the interest rate on, and therefore our costs under, the line of credit. Assuming $1.0 million of variable rate debt was outstanding under our line of credit for a full fiscal year, a hypothetical 100 basis point increase in LIBOR would result in approximately $10,000 of additional interest expense.
Commodity Price Risk
Prices and availability of all petroleum products are subject to political, economic and market factors that are generally outside of our control. Accordingly, the price and availability of diesel fuel, as well as other petroleum products, can be unpredictable. Because our operations are dependent upon diesel fuel, significant increases in diesel fuel costs could materially and adversely affect our results of operations and financial condition. Based upon our 2014 fuel consumption, a 10% increase in the average annual price per gallon of diesel fuel would increase our annual fuel expenses by approximately $8.9 million.
Foreign Currency Exchange Rate Risk
We are exposed to foreign currency exchange rate risk related to the activities of our branch office located in Mexico. Currently, we do not hedge our exchange rate exposure through any currency forward contracts, currency options, or currency swaps as all of our revenues, and substantially all of our expenses and capital expenditures, are transacted in U.S. dollars. However, certain operating expenditures and capital purchases related to our Mexico branch office are incurred within or exposed to fluctuations in the exchange rate between the U.S. Dollar and the Mexican peso. Based on 2014 expenditures denominated in pesos, a 10% increase in the exchange rate would increase our annual operating expenses by approximately $71,000.
Item 8. Financial Statements and Supplementary Data.
The following statements are filed with this report:
Report of Independent Registered Public Accounting Firm – Grant Thornton LLP
Consolidated Balance Sheets - December 31, 2014 and 2013
Consolidated Statements of Operations - Years ended December 31, 2014, 2013 and 2012
Consolidated Statements of Comprehensive Income - Years ended December 31, 2014, 2013 and 2012
Consolidated Statements of Stockholders’ Equity - Years ended December 31, 2014, 2013 and 2012
Consolidated Statements of Cash Flows - Years ended December 31, 2014, 2013 and 2012
Notes to Consolidated Financial Statements
REPORT OF INDEPENDENT REGISTERED PUBLIC ACCOUNTING FIRM
Board of Directors and Stockholders
P.A.M. Transportation Services, Inc.
We have audited the accompanying consolidated balance sheets of P.A.M. Transportation Services, Inc. (a Delaware corporation) and subsidiaries (the “Company”) as of December 31, 2014 and 2013, and the related consolidated statements of operations, comprehensive income, stockholders’ equity, and cash flows for each of the three years in the period ended December 31, 2014. These financial statements are the responsibility of the Company’s management. Our responsibility is to express an opinion on these financial statements based on our audits.
We conducted our audits in accordance with the standards of the Public Company Accounting Oversight Board (United States). Those standards require that we plan and perform the audit to obtain reasonable assurance about whether the financial statements are free of material misstatement. An audit includes examining, on a test basis, evidence supporting the amounts and disclosures in the financial statements. An audit also includes assessing the accounting principles used and significant estimates made by management, as well as evaluating the overall financial statement presentation. We believe that our audits provide a reasonable basis for our opinion.
In our opinion, the consolidated financial statements referred to above present fairly, in all material respects, the financial position of P.A.M. Transportation Services, Inc. and subsidiaries as of December 31, 2014 and 2013, and the results of their operations and their cash flows for each of the three years in the period ended December 31, 2014 in conformity with accounting principles generally accepted in the United States of America.
We also have audited, in accordance with the standards of the Public Company Accounting Oversight Board (United States), the Company’s internal control over financial reporting as of December 31, 2014, based on criteria established in the 2013 Internal Control—Integrated Framework issued by the Committee of Sponsoring Organizations of the Treadway Commission (COSO), and our report dated March 16, 2015 expressed an unqualified opinion thereon.
/s/ GRANT THORNTON LLP
Tulsa, Oklahoma
March 16, 2015
P.A.M. TRANSPORTATION SERVICES, INC. AND SUBSIDIARIES
CONSOLIDATED BALANCE SHEETS
DECEMBER 31, 2014 AND 2013
|
(in thousands, except share and per share data) |
||||||||
|
2014 |
2013 |
|||||||
| ASSETS | ||||||||
|
CURRENT ASSETS: |
||||||||
|
Cash and cash equivalents |
$ | 27,649 | $ | 1,172 | ||||
|
Accounts receivable—net: |
||||||||
|
Trade, less allowance of $1,611 and $1,477, respectively |
52,983 | 58,484 | ||||||
|
Other |
11,469 | 3,660 | ||||||
|
Inventories |
1,306 | 1,498 | ||||||
|
Prepaid expenses and deposits |
10,110 | 6,621 | ||||||
|
Marketable equity securities |
24,895 | 20,975 | ||||||
|
Income taxes refundable |
507 | 230 | ||||||
|
Total current assets |
128,919 | 92,640 | ||||||
|
PROPERTY AND EQUIPMENT: |
||||||||
|
Land |
4,924 | 4,924 | ||||||
|
Structures and improvements |
16,165 | 16,001 | ||||||
|
Revenue equipment |
279,079 | 321,862 | ||||||
|
Office furniture and equipment |
9,257 | 7,684 | ||||||
|
Total property and equipment |
309,425 | 350,471 | ||||||
|
Accumulated depreciation |
(116,178 | ) | (116,246 | ) | ||||
|
Net property and equipment |
193,247 | 234,225 | ||||||
|
OTHER ASSETS |
2,439 | 2,437 | ||||||
|
TOTAL ASSETS |
$ | 324,605 | $ | 329,302 | ||||
(Continued)
See notes to consolidated financial statements.
CONSOLIDATED BALANCE SHEETS
DECEMBER 31, 2014 AND 2013
|
(in thousands, except share and per share data) |
||||||||
|
2014 |
2013 |
|||||||
| LIABILITIES AND STOCKHOLDERS' EQUITY | ||||||||
|
CURRENT LIABILITIES: |
||||||||
|
Accounts payable |
$ | 41,695 | $ | 27,970 | ||||
|
Accrued expenses and other liabilities |
27,517 | 22,502 | ||||||
|
Current maturities of long-term debt |
42,908 | 40,103 | ||||||
|
Deferred income taxes—current |
2,951 | 2,651 | ||||||
|
Total current liabilities |
115,071 | 93,226 | ||||||
|
Long-term debt—less current portion |
52,293 | 70,366 | ||||||
|
Deferred income taxes—less current portion |
57,125 | 49,764 | ||||||
|
Other long-term liabilities |
131 | - | ||||||
|
Total liabilities |
224,620 | 213,356 | ||||||
|
COMMITMENTS AND CONTINGENCIES (Note 15) |
||||||||
|
STOCKHOLDERS’ EQUITY |
||||||||
|
Preferred stock, $.01 par value, 10,000,000 shares authorized; none issued |
- | - | ||||||
|
Common stock, $.01 par value, 40,000,000 shares authorized; 11,474,096 and 11,391,464 shares issued; 7,423,115 and 7,983,539 shares outstanding at December 31, 2014 and December 31, 2013, respectively |
115 | 114 | ||||||
|
Additional paid-in capital |
79,926 | 78,811 | ||||||
|
Accumulated other comprehensive income |
6,402 | 6,160 | ||||||
|
Treasury stock, at cost; 4,050,981 and 3,407,925 shares at December 31, 2014 and December 31, 2013, respectively |
(82,501 | ) | (51,691 | ) | ||||
|
Retained earnings |
96,043 | 82,552 | ||||||
|
Total stockholders’ equity |
99,985 | 115,946 | ||||||
|
TOTAL LIABILITIES AND STOCKHOLDERS' EQUITY |
$ | 324,605 | $ | 329,302 | ||||
(Concluded)
See notes to consolidated financial statements.
P.A.M. TRANSPORTATION SERVICES, INC. AND SUBSIDIARIES
CONSOLIDATED STATEMENTS OF OPERATIONS
YEARS ENDED DECEMBER 31, 2014, 2013 AND 2012
|
(in thousands, except per share data) |
||||||||||||
|
2014 |
2013 |
2012 |
||||||||||
|
OPERATING REVENUES: |
||||||||||||
|
Revenue, before fuel surcharge |
$ | 316,584 | $ | 313,117 | $ | 297,698 | ||||||
|
Fuel surcharge |
94,353 | 89,696 | 82,935 | |||||||||
|
Total operating revenues |
410,937 | 402,813 | 380,633 | |||||||||
|
OPERATING EXPENSES AND COSTS: |
||||||||||||
|
Salaries, wages and benefits |
108,371 | 107,037 | 108,866 | |||||||||
|
Operating supplies and expenses |
126,875 | 137,268 | 155,392 | |||||||||
|
Rents and purchased transportation |
90,831 | 85,226 | 54,011 | |||||||||
|
Depreciation |
36,296 | 39,088 | 38,298 | |||||||||
|
Insurance and claims |
20,274 | 14,586 | 13,744 | |||||||||
|
Other |
9,871 | 8,956 | 7,585 | |||||||||
|
Gain on disposition of equipment |
(4,591 | ) | (854 | ) | (166 | ) | ||||||
|
Total operating expenses and costs |
387,927 | 391,307 | 377,730 | |||||||||
|
OPERATING INCOME |
23,010 | 11,506 | 2,903 | |||||||||
|
NON-OPERATING INCOME |
2,099 | 1,540 | 3,288 | |||||||||
|
INTEREST EXPENSE |
(2,897 | ) | (3,375 | ) | (2,596 | ) | ||||||
|
INCOME BEFORE INCOME TAXES |
22,212 | 9,671 | 3,595 | |||||||||
|
FEDERAL & STATE INCOME TAX EXPENSE: |
||||||||||||
|
Current |
1,209 | 159 | 51 | |||||||||
|
Deferred |
7,512 | 3,597 | 1,365 | |||||||||
|
Total federal & state income tax expense |
8,721 | 3,756 | 1,416 | |||||||||
|
NET INCOME |
$ | 13,491 | $ | 5,915 | $ | 2,179 | ||||||
|
EARNINGS PER COMMON SHARE: |
||||||||||||
|
Basic |
$ | 1.69 | $ | 0.68 | $ | 0.25 | ||||||
|
Diluted |
$ | 1.68 | $ | 0.68 | $ | 0.25 | ||||||
|
AVERAGE COMMON SHARES OUTSTANDING: |
||||||||||||
|
Basic |
7,990 | 8,662 | 8,700 | |||||||||
|
Diluted |
8,034 | 8,682 | 8,702 | |||||||||
|
DIVIDENDS DECLARED PER COMMON SHARE |
$ | - | $ | - | $ | 2.00 | ||||||
See notes to consolidated financial statements.
P.A.M. TRANSPORTATION SERVICES, INC. AND SUBSIDIARIES
CONSOLIDATED STATEMENTS OF COMPREHENSIVE INCOME
YEARS ENDED DECEMBER 31, 2014, 2013 AND 2012
|
(in thousands) |
||||||||||||
|
2014 |
2013 |
2012 |
||||||||||
|
NET INCOME |
$ | 13,491 | $ | 5,915 | $ | 2,179 | ||||||
|
Other comprehensive income (loss), net of tax: |
||||||||||||
|
Reclassification adjustment for realized gains on marketable securities included in net income (1) |
(630 | ) | (215 | ) | (1,009 | ) | ||||||
|
Reclassification adjustment for unrealized losses on marketable securities included in net income (2) |
1 | 18 | 44 | |||||||||
|
Changes in fair value of marketable securities (3) |
871 | 2,122 | 495 | |||||||||
|
COMPREHENSIVE INCOME |
$ | 13,733 | $ | 7,840 | $ | 1,709 | ||||||
_______________
(1) Net of deferred income taxes of $(385), $(131) and $(618), respectively.
(2) Net of deferred income taxes of $0, $11 and $27, respectively.
(3) Net of deferred income taxes of $533, $1,298 and $304, respectively.
See notes to consolidated financial statements.
P.A.M. TRANSPORTATION SERVICES, INC. AND SUBSIDIARIES
CONSOLIDATED STATEMENTS OF STOCKHOLDERS’ EQUITY
YEARS ENDED DECEMBER 31, 2014, 2013 AND 2012
|
(in thousands, except per share data) |
||||||||||||||||||||||||||||
|
Common Stock Shares / Amount |
Additional Paid-In Capital |
Accumulated Other Comprehensive Income |
Treasury Stock |
Retained Earnings |
Total |
|||||||||||||||||||||||
|
BALANCE— January 1, 2012 |
8,696 | $ | 114 | $ | 78,036 | $ | 4,705 | $ | (37,239 | ) | $ | 91,861 | $ | 137,477 | ||||||||||||||
|
Net loss |
2,179 | 2,179 | ||||||||||||||||||||||||||
|
Other comprehensive income, net of tax of $(287) |
(470 | ) | (470 | ) | ||||||||||||||||||||||||
|
Exercise of stock options-shares issued including tax benefits |
6 | 60 | 60 | |||||||||||||||||||||||||
|
Dividends on common stock, $2 per share |
(17,403 | ) | (17,403 | ) | ||||||||||||||||||||||||
|
Share-based compensation |
352 | 352 | ||||||||||||||||||||||||||
|
BALANCE— December 31, 2012 |
8,702 | 114 | 78,448 | 4,235 | (37,239 | ) | 76,637 | 122,195 | ||||||||||||||||||||
|
Net income |
5,915 | 5,915 | ||||||||||||||||||||||||||
|
Other comprehensive income, net of tax of $ 1,178 |
1,925 | 1,925 | ||||||||||||||||||||||||||
|
Exercise of stock options-shares issued including tax benefits |
7 | 46 | 46 | |||||||||||||||||||||||||
|
Treasury stock repurchases |
(725 | ) | (14,452 | ) | (14,452 | ) | ||||||||||||||||||||||
|
Share-based compensation |
317 | 317 | ||||||||||||||||||||||||||
|
BALANCE— December 31, 2013 |
7,984 | 114 | 78,811 | 6,160 | (51,691 | ) | 82,552 | 115,946 | ||||||||||||||||||||
|
Net income |
13,491 | 13,491 | ||||||||||||||||||||||||||
|
Other comprehensive income, net of tax of $ 149 |
242 | 242 | ||||||||||||||||||||||||||
|
Exercise of stock options-shares issued including tax benefits |
77 | 1 | 845 | 846 | ||||||||||||||||||||||||
|
Restricted stock issued |
5 | |||||||||||||||||||||||||||
|
Treasury stock repurchases |
(643 | ) | (30,810 | ) | (30,810 | ) | ||||||||||||||||||||||
|
Share-based compensation |
270 | 270 | ||||||||||||||||||||||||||
|
BALANCE— December 31, 2014 |
7,423 | $ | 115 | $ | 79,926 | $ | 6,402 | $ | (82,501 | ) | $ | 96,043 | $ | 99,985 | ||||||||||||||
See notes to consolidated financial statements.
P.A.M. TRANSPORTATION SERVICES, INC. AND SUBSIDIARIES
CONSOLIDATED STATEMENTS OF CASH FLOWS
YEARS ENDED DECEMBER 31, 2014, 2013 AND 2012
|
(in thousands) |
||||||||||||
|
2014 |
2013 |
2012 |
||||||||||
|
OPERATING ACTIVITIES: |
||||||||||||
|
Net income |
$ | 13,491 | $ | 5,915 | $ | 2,179 | ||||||
|
Adjustments to reconcile net income to net cash provided by operating activities: |
||||||||||||
|
Depreciation |
36,296 | 39,088 | 38,298 | |||||||||
|
Bad debt expense |
456 | 424 | 191 | |||||||||
|
Stock compensation—net of excess tax benefits |
270 | 317 | 346 | |||||||||
|
Sale leaseback deferred gain amortization |
(205 | ) | - | - | ||||||||
|
Provision for deferred income taxes |
7,512 | 3,597 | 1,365 | |||||||||
|
Reclassification of other than temporary impairment in marketable equity securities |
1 | 29 | 70 | |||||||||
|
Recognized gain on marketable equity securities |
(1,040 | ) | (601 | ) | (2,362 | ) | ||||||
|
Gain on sale or disposal of equipment |
(4,591 | ) | (854 | ) | (166 | ) | ||||||
|
Changes in operating assets and liabilities: |
||||||||||||
|
Accounts receivable |
5,109 | (8,873 | ) | (3,313 | ) | |||||||
|
Prepaid expenses, deposits, inventories, and other assets |
(3,299 | ) | 4,918 | (426 | ) | |||||||
|
Income taxes refundable |
(277 | ) | 124 | (115 | ) | |||||||
|
Trade accounts payable |
(1,555 | ) | (2,802 | ) | (3,369 | ) | ||||||
|
Accrued expenses and other liabilities |
3,085 | 1,888 | 927 | |||||||||
|
Net cash provided by operating activities |
55,253 | 43,170 | 33,625 | |||||||||
|
INVESTING ACTIVITIES: |
||||||||||||
|
Purchases of property and equipment |
(28,588 | ) | (71,520 | ) | (98,046 | ) | ||||||
|
Proceeds from disposition of equipment |
38,902 | 27,304 | 21,190 | |||||||||
|
Changes in restricted cash |
(7,873 | ) | (120 | ) | (215 | ) | ||||||
|
Sales of marketable equity securities |
1,720 | 857 | 4,554 | |||||||||
|
Purchases of marketable equity securities, net of return of capital |
(4,210 | ) | (838 | ) | (77 | ) | ||||||
|
Net cash used in investing activities |
(49 | ) | (44,317 | ) | (72,594 | ) | ||||||
|
FINANCING ACTIVITIES: |
||||||||||||
|
Borrowings under line of credit |
469,918 | 422,324 | 445,224 | |||||||||
|
Repayments under line of credit |
(469,918 | ) | (427,741 | ) | (449,135 | ) | ||||||
|
Borrowings of long-term debt |
42,979 | 41,593 | 72,991 | |||||||||
|
Repayments of long-term debt |
(58,247 | ) | (33,208 | ) | (23,152 | ) | ||||||
|
Borrowings under margin account |
4,351 | 999 | 15,948 | |||||||||
|
Repayments under margin account |
(2,645 | ) | (1,693 | ) | (5,237 | ) | ||||||
|
Repurchases of common stock |
(16,011 | ) | (508 | ) | - | |||||||
|
Stock compensation excess tax benefits |
- | - | 6 | |||||||||
|
Dividends paid |
- | - | (17,403 | ) | ||||||||
|
Exercise of stock options |
846 | 46 | 54 | |||||||||
|
Net cash (used in) provided by financing activities |
(28,727 | ) | 1,812 | 39,296 | ||||||||
|
NET INCREASE IN CASH AND CASH EQUIVALENTS |
26,477 | 665 | 327 | |||||||||
|
CASH AND CASH EQUIVALENTS—Beginning of year |
1,172 | 507 | 180 | |||||||||
|
CASH AND CASH EQUIVALENTS—End of year |
$ | 27,649 | $ | 1,172 | $ | 507 | ||||||
|
SUPPLEMENTAL DISCLOSURES OF CASH FLOW INFORMATION— |
||||||||||||
|
Cash paid during the period for: |
||||||||||||
|
Interest |
$ | 2,946 | $ | 3,417 | $ | 2,558 | ||||||
|
Income taxes |
$ | 1,486 | $ | 77 | $ | 174 | ||||||
|
NONCASH INVESTING AND FINANCING ACTIVITIES— |
||||||||||||
|
Purchases of revenue equipment included in accounts payable |
$ | 1,079 | $ | 598 | $ | 2,794 | ||||||
|
Purchases of common stock included in accrued expenses and other liabilities |
$ | 28,743 | $ | 13,944 | $ | - | ||||||
See notes to consolidated financial statements.
P.A.M. TransportATION SERVICES, INC. AND SUBSIDIARIES
NOTES TO CONSOLIDATED FINANCIAL STATEMENTS
YEARS ENDED DECEMBER 31, 2014, 2013 AND 2012
|
1. |
ACCOUNTING POLICIES |
Description of Business and Principles of Consolidation–P.A.M. Transportation Services, Inc. (the “Company”), through its subsidiaries, operates as a truckload transportation and logistics company.
The consolidated financial statements include the accounts of the Company and its wholly owned operating subsidiaries: P.A.M. Transport, Inc., P.A.M. Cartage Carriers, LLC, Overdrive Leasing, LLC, Choctaw Express, LLC, Decker Transport Co., LLC, T.T.X., LLC, Transcend Logistics, Inc., and East Coast Transport and Logistics, LLC. The following subsidiaries were inactive during all periods presented: P.A.M. International, Inc., P.A.M. Logistics Services, Inc., Choctaw Brokerage, Inc., and S & L Logistics, Inc.
Use of Estimates–The preparation of financial statements in conformity with accounting principles generally accepted in the United States of America requires management to make estimates and assumptions that affect the reported amounts of assets and liabilities, disclosure of any contingent assets and liabilities at the financial statement date and reported amounts of revenue and expenses during the reporting period. The Company periodically reviews these estimates and assumptions. The Company's estimates were based on its historical experience and various other assumptions that management believes to be reasonable under the circumstances. Actual results could differ from those estimates.
Cash and Cash Equivalents–The Company considers all highly liquid investments with a maturity of three months or less when purchased to be cash equivalents. At times cash held at banks may exceed FDIC insured limits.
Accounts Receivable and Allowance for Doubtful Accounts–Accounts receivable are presented in the Company’s consolidated financial statements net of an allowance for estimated uncollectible amounts. Management estimates this allowance based upon an evaluation of the aging of our customer receivables and historical write-offs, as well as other trends and factors surrounding the credit risk of specific customers. The Company continually updates the history it uses to make these estimates so as to reflect the most recent trends, factors and other information available. In order to gather information regarding these trends and factors, the Company also performs ongoing credit evaluations of its customers. Customer receivables are considered to be past due when payment has not been received by the invoice due date. Write-offs occur when management determines an account to be uncollectible and could differ from the allowance estimate as a result of a number of factors, including unanticipated changes in the overall economic environment or factors and risks surrounding a particular customer. Management believes its methodology for estimating the allowance for doubtful accounts to be reliable however, additional allowances may be required if the financial condition of our customers were to deteriorate, and could have a material effect on the Company’s consolidated financial statements in future periods.
Bank Overdrafts–The Company classifies bank overdrafts in current liabilities as an accounts payable and does not offset other positive bank account balances located at the same or other financial institutions. Bank overdrafts generally represent checks written that have not yet cleared the Company’s bank accounts. The majority of the Company’s bank accounts are zero balance accounts that are funded at the time items clear against the account by drawings against a line of credit, therefore the outstanding checks represent bank overdrafts. Because the recipients of these checks have generally not yet received payment, the Company continues to classify bank overdrafts as accounts payable. Bank overdrafts are classified as changes in accounts payable in the cash flows from operating activities section of the Company’s Consolidated Statement of Cash Flows. There were no bank overdrafts as of December 31, 2014. Bank overdrafts as of December 31, 2013 were approximately $3,179,000.
Accounts Receivable Other–The components of accounts receivable other consist primarily of amounts representing company driver advances, owner-operator advances, equipment manufacturer warranties, and restricted cash. Advances receivable from company drivers as of December 31, 2014 and 2013, were approximately $486,000 and $707,000, respectively. Restricted cash consists of cash proceeds from the sale of trucks and trailers under our like-kind exchange (“LKE”) tax program. See Note 11, “Federal and State Income Taxes,” for a discussion of the Company’s LKE tax program. We classify restricted cash as a current asset within “Accounts receivable-other” as the exchange process must be completed within 180 days in order to qualify for income tax deferral treatment. The changes in restricted cash balances are reflected as an investing activity in our Consolidated Statements of Cash Flows as they relate to the sales and purchases of revenue equipment.
Marketable Equity Securities–Marketable equity securities are classified by the Company as either available for sale or trading. Securities classified as available for sale are carried at market value with unrealized gains and losses recognized in accumulated other comprehensive income in the statements of stockholders’ equity. Securities classified as trading are carried at market value with unrealized gains and losses recognized in the statements of operations. Realized gains and losses are computed utilizing the specific identification method.
Impairment of Long-Lived Assets–The Company reviews its long-lived assets for impairment whenever events or changes in circumstances indicate that the carrying amount of a long-lived asset may not be recoverable. An impairment loss would be recognized if the carrying amount of the long-lived asset is not recoverable, and it exceeds its fair value. For long-lived assets classified as held and used, if the carrying value of the long-lived asset exceeds the sum of the future net undiscounted cash flows, it is not recoverable.
Property and Equipment–Property and equipment is recorded at historical cost, less accumulated depreciation. For financial reporting purposes, the cost of such property is depreciated principally by the straight-line method. For tax reporting purposes, accelerated depreciation or applicable cost recovery methods are used. Depreciation is recognized over the estimated asset life, considering the estimated salvage value of the asset. Such salvage values are based on estimates using expected market values for used equipment and the estimated time of disposal which, in many cases include guaranteed residual values by the manufacturers. Gains and losses are reflected in the year of disposal. The following is a table reflecting estimated ranges of asset useful lives by major class of depreciable assets:
|
Asset Class |
Estimated Asset Life (in years) |
|||
|
Service vehicles |
3-5 | |||
|
Office furniture and equipment |
3-7 | |||
|
Revenue equipment |
3-12 | |||
|
Structure and improvements |
5-40 | |||
The Company’s management periodically evaluates whether changes to estimated useful lives and/or salvage values are necessary to ensure its estimates accurately reflect the economic use of the assets. During 2014, management determined that an adjustment to the estimated useful lives or salvage values of trucks or trailers was not necessary based on such an evaluation.
During 2013, management adjusted the estimated useful lives and salvage values of certain trucks based on such an evaluation. These changes resulted in a decrease in depreciation expense of approximately $550,000 during 2013. This reduction in depreciation expense increased the Company’s 2013 reported net income by approximately $340,000 ($0.04 per diluted share).
During 2012, management adjusted the estimated useful lives and salvage values of certain trucks based on such an evaluation. These changes resulted in a decrease in depreciation expense of approximately $450,000 during 2012. This reduction in depreciation expense increased the Company’s 2012 reported net income by approximately $300,000 ($0.03 per diluted share).
Prepaid Tires–Tires purchased with revenue equipment are capitalized as a cost of the related equipment. Replacement tires are included in prepaid expenses and deposits and are amortized over a 24-month period. Amounts paid for the recapping of tires are expensed when incurred.
Advertising Expense–Advertising costs are expensed as incurred and totaled approximately $683,000, $662,000 and $685,000 for the years ended December 31, 2014, 2013 and 2012, respectively.
Repairs and Maintenance–Repairs and maintenance costs are expensed as incurred.
Self-Insurance Liability–A liability is recognized for known health, workers’ compensation, cargo damage, property damage and auto liability damage claims. An estimate of the incurred but not reported claims for each type of liability is made based on historical claims made, estimated frequency of occurrence, and considering changing factors that contribute to the overall cost of insurance.
Income Taxes–The Company applies the asset and liability method of accounting for income taxes, under which deferred taxes are determined based on the temporary differences between the financial statement and tax basis of assets and liabilities using tax rates expected to be in effect during the years in which the basis differences reverse. A valuation allowance is recorded when it is more likely than not that some or all of the deferred tax assets will not be realized.
The application of income tax law to multi-jurisdictional operations such as those performed by the Company, are inherently complex. Laws and regulations in this area are voluminous and often ambiguous. As such, we may be required to make subjective assumptions and judgments regarding our income tax exposures. Interpretations of and guidance surrounding income tax laws and regulations may change over time which could cause changes in our assumptions and judgments that could materially affect amounts recognized in the consolidated financial statements.
We recognize the impact of tax positions in our financial statements. These tax positions must meet a more-likely-than-not recognition threshold to be recognized and tax positions that previously failed to meet the more-likely-than-not threshold are recognized in the first subsequent financial reporting period in which that threshold is met. Previously recognized tax positions that no longer meet the more-likely-than-not threshold are derecognized in the first subsequent financial reporting period in which that threshold is no longer met. We recognize potential accrued interest and penalties related to unrecognized tax benefits within the consolidated statements of income as income tax expense.
In determining whether a tax asset valuation allowance is necessary, management, in accordance with the provisions of ASC 740-10-30, weighs all available evidence, both positive and negative to determine whether, based on the weight of that evidence, a valuation allowance is necessary. If negative conditions exist which indicate a valuation allowance might be necessary, consideration is then given to what effect the future reversals of existing taxable temporary differences and the availability of tax strategies might have on future taxable income to determine the amount, if any, of the required valuation allowance. As of December 31, 2014, management determined that the future reversals of existing taxable temporary differences and available tax strategies would generate sufficient future taxable income to realize its tax assets and therefore a valuation allowance was not necessary.
Revenue Recognition–Revenue is recognized in full upon completion of delivery to the receiver’s location. For freight in transit at the end of a reporting period, the Company recognizes revenue pro rata based on relative transit time completed as a portion of the estimated total transit time. Expenses are recognized as incurred.
Share-Based Compensation–The Company estimates the fair value of stock option awards on the option grant date using the Black-Scholes pricing model and recognizes compensation for stock option awards expected to vest on a straight-line basis over the requisite service period for the entire award. Forfeitures are estimated at grant date based on historical experience. For additional information with respect to share-based compensation, see Note 12 to our consolidated financial statements.
Earnings Per Share–The Company computes basic earnings per share (“EPS”) by dividing net income (loss) available to common stockholders by the weighted average number of common shares outstanding during the period. Diluted EPS includes the potential dilution that could occur from stock-based awards and other stock-based commitments using the treasury stock or the as if converted methods, as applicable. The difference between the Company's weighted-average shares outstanding and diluted shares outstanding is due to the dilutive effect of stock options for all periods presented. See Note 13 for computation of diluted EPS.
Fair Value Measurements–Certain financial assets and liabilities are measured at fair value within the financial statements on a recurring basis. Fair value is defined as the exchange price that would be received for an asset or paid to transfer a liability (an exit price) in the principal or most advantageous market for the asset or liability in an orderly transaction between market participants on the measurement date. The fair value hierarchy requires an entity to maximize the use of observable inputs and minimize the use of unobservable inputs when measuring fair value. For additional information with respect to fair value measurements, see Note 16 to our consolidated financial statements.
Reporting Segments–The Company's operations are all in the motor carrier segment and are aggregated into a single reporting segment in accordance with the aggregation criteria under Generally Accepted Accounting Principles (“GAAP”). The Company provides truckload transportation services as well as brokerage and logistics services to customers throughout the United States and portions of Canada and Mexico. Truckload transportation services revenues, excluding fuel surcharges, represented 92.5%, 92.6% and 91.8% of total revenues, excluding fuel surcharges, for the twelve months ended December 31, 2014, 2013 and 2012, respectively. Remaining revenues, excluding fuel surcharges, for each respective year were generated by brokerage and logistics services.
Concentrations of Credit Risk–The Company performs ongoing credit evaluations and generally does not require collateral from its customers. The Company maintains reserves for potential credit losses. In view of the concentration of the Company’s revenues and accounts receivable among a limited number of customers within the automobile industry, the financial health of this industry is a factor in the Company’s overall evaluation of accounts receivable.
Subsequent Events–We have evaluated subsequent events for recognition and disclosure through the date these financial statements were filed with the United States Securities and Exchange Commission and concluded that no subsequent events or transactions have occurred that require recognition or disclosure in our financial statements.
Foreign Currency Transactions– The functional currency of the Company’s foreign branch office in Mexico is the U.S. dollar. The Company remeasures the monetary assets and liabilities of this branch office, which are maintained in the local currency ledgers, at the rates of exchange in effect at the end of the reporting period. Revenues and expenses recorded in the local currency during the period are remeasured using average exchange rates for each period. Non-monetary assets and liabilities are remeasured using historical rates. Any resulting exchange gain or loss from the remeasurement process are included in non-operating income in the Company’s consolidated statements of operations.
Recent Accounting Pronouncements– In April 2014, the Financial Accounting Standards Board (“FASB”) issued Accounting Standards Update (“ASU”) No. 2014-08 (“ASU 2014-08”), Reporting Discontinued Operations and Disclosures of Disposals of Components of an Entity. ASU 2014-08 changes the criteria for determining which disposals can be presented as discontinued operations and modifies the related disclosure requirements. Under the new guidance, a disposal of a component of an entity or a group of components of an entity is required to be reported in discontinued operations if the disposal represents a strategic shift that has (or will have) a major effect on an entity’s operations and financial results and is disposed of or classified as held for sale. The standard also introduces several new disclosures. The guidance applies prospectively to new disposals and new classifications of disposal groups as held for sale after the effective date. ASU 2014-08 is effective for annual and interim periods beginning after December 15, 2014, with early adoption permitted. The adoption of this guidance had no impact on the Company’s financial condition, results of operations, or cash flows.
In May 2014, the FASB issued ASU No. 2014-09, (“ASU 2014-09”), Revenue from Contracts with Customers. The objective of ASU 2014-19 is to establish a single comprehensive model for entities to use in accounting for revenue arising from contracts with customers and will supersede most of the existing revenue recognition guidance, including industry-specific guidance. The core principle of ASU 2014-09 is that an entity recognizes revenue to depict the transfer of promised goods or services to customers in an amount that reflects the consideration to which the entity expects to be entitled in exchange for those goods or services. In applying the new guidance, an entity will (1) identify the contract(s) with a customer; (2) identify the performance obligations in the contract; (3) determine the transaction price; (4) allocate the transaction price to the contract’s performance obligations; and (5) recognize revenue when (or as) the entity satisfies a performance obligation. ASU 2014-09 applies to all contracts with customers except those that are within the scope of other topics in the FASB Accounting Standards Codification. The new guidance is effective for annual reporting periods (including interim periods within those periods) beginning after December 15, 2016 for public companies. Early adoption is not permitted. Entities have the option of using either a full retrospective or modified approach to adopt ASU 2014-09. The adoption of this guidance is not expected to have a significant impact on the Company’s financial condition, results of operations, or cash flows.
In June 2014, the FASB issued ASU 2014-12, (“SSU 2014-12”), Stock Compensation - Accounting for Share-Based Payments When the Terms of an Award Provide That a Performance Target Could Be Achieved after the Requisite Service Period. The amendments in this update require performance targets that could be achieved after the requisite service period be treated as performance conditions that affect the vesting of the award. ASU 2014-12 is effective for annual and interim periods beginning after December 15, 2015, with early adoption permitted. The adoption of this guidance is not expected to have a significant impact on the Company’s financial condition, results of operations, or cash flows.
|
2. |
TRADE ACCOUNTS RECEIVABLE |
The Company's receivables result primarily from the sale of transportation and logistics services. The Company performs ongoing credit evaluations of its customers and generally does not require collateral for accounts receivable. Accounts receivable, which consist of both billed and unbilled receivables, are presented net of an allowance for doubtful accounts. Accounts outstanding longer than contractual payment terms are considered past due and are reviewed individually for collectability. Accounts receivable balances consist of the following components as of December 31, 2014 and 2013:
|
2014 |
2013 |
|||||||
|
(in thousands) |
||||||||
|
Billed |
$ | 49,302 | $ | 50,168 | ||||
|
Unbilled |
5,292 | 9,793 | ||||||
|
Allowance for doubtful accounts |
(1,611 | ) | (1,477 | ) | ||||
|
Total accounts receivable—net |
$ | 52,983 | $ | 58,484 | ||||
An analysis of changes in the allowance for doubtful accounts for the years ended December 31, 2014, 2013, and 2012 follows:
|
2014 |
2013 |
2012 |
||||||||||
|
(in thousands) |
||||||||||||
|
Balance—beginning of year |
$ | 1,477 | $ | 1,157 | $ | 2,074 | ||||||
|
Provision for bad debts |
456 | 424 | 191 | |||||||||
|
Charge-offs |
(322 | ) | (104 | ) | (1,108 | ) | ||||||
|
Balance—end of year |
$ | 1,611 | $ | 1,477 | $ | 1,157 | ||||||
|
3. |
MARKETABLE EQUITY SECURITIES |
The Company accounts for its marketable securities in accordance with ASC Topic 320, Investments-Debt and Equity Securities. ASC Topic 320 requires companies to classify their investments as trading, available-for-sale or held-to-maturity. The Company’s investments in marketable securities are classified as either trading or available-for-sale and consist of equity securities. Management determines the appropriate classification of these securities at the time of purchase and re-evaluates such designation as of each balance sheet date. The cost of securities sold is based on the specific identification method and interest and dividends on securities are included in non-operating income.
Marketable equity securities classified as available-for-sale are carried at fair value, with the unrealized gains and losses, net of tax, included as a component of accumulated other comprehensive income (loss) in stockholders’ equity. Realized gains and losses, declines in value judged to be other-than-temporary on available-for-sale securities, and increases or decreases in value on trading securities, if any, are included in the determination of net income. A quarterly evaluation is performed in order to judge whether declines in value below cost should be considered temporary and when losses are deemed to be other-than-temporary. Several factors are considered in this evaluation process including the severity and duration of the decline in value, the financial condition and near-term outlook for the specific issuer and the Company’s ability to hold the securities.
For the years ended December 31, 2014, 2013 and 2012, the evaluation resulted in impairment charges of approximately $1,000, $29,000 and $70,000, respectively, being reported in the Company’s non-operating income in its statements of operations.
The following table sets forth cost, market value and unrealized gain on equity securities classified as available-for-sale and equity securities classified as trading as of December 31, 2014 and 2013.
|
2014 |
2013 |
|||||||
|
(in thousands) |
||||||||
|
Available-for-sale securities |
||||||||
|
Fair market value |
$ | 24,592 | $ | 20,810 | ||||
|
Cost |
14,272 | 10,881 | ||||||
|
Unrealized gain |
$ | 10,320 | $ | 9,929 | ||||
|
Trading securities |
||||||||
|
Fair market value |
$ | 303 | $ | 165 | ||||
|
Cost |
157 | 157 | ||||||
|
Unrealized gain |
$ | 146 | $ | 8 | ||||
|
Total |
||||||||
|
Fair market value |
$ | 24,895 | $ | 20,975 | ||||
|
Cost |
14,429 | 11,038 | ||||||
|
Unrealized gain |
$ | 10,466 | $ | 9,937 | ||||
The following table sets forth the gross unrealized gains and losses on the Company’s marketable securities that are classified as available-for-sale as of December 31, 2014 and 2013.
|
2014 |
2013 |
|||||||
|
(in thousands) |
||||||||
|
Available-for-sale securities |
||||||||
|
Gross unrealized gains |
$ | 10,710 | $ | 9,946 | ||||
|
Gross unrealized losses |
390 | 17 | ||||||
|
Net unrealized gains |
$ | 10,320 | $ | 9,929 | ||||
As of December 31, 2014 and 2013, the total net unrealized gains, net of deferred income taxes, in accumulated other comprehensive income was approximately $6,402,000 and $6,160,000, respectively.
For the years ended December 31, 2014 and 2013, the Company had net unrealized gains in market value on securities classified as available-for-sale of approximately $237,000 and $1,897,000, net of deferred income taxes, respectively.
For the years ended December 31, 2014, 2013 and 2012, the Company recognized dividends of approximately $896,000, $781,000, and $838,000 in non-operating income in its statements of operations, respectively.
As of December 31, 2014, the Company's marketable securities that are classified as trading had gross recognized gains of approximately $146,000 and had no gross recognized losses. As of December 31, 2013, the Company's marketable securities that were classified as trading had gross recognized gains of approximately $8,000 and had no gross recognized losses.
The following table shows recognized gains (losses) in market value for securities classified as trading during 2014, 2013 and 2012.
|
2014 |
2013 |
2012 |
||||||||||
|
(in thousands) |
||||||||||||
|
Trading securities |
||||||||||||
|
Recognized gain (loss) at beginning of period |
$ | 8 | $ | (26 | ) | $ | (16 | ) | ||||
|
Recognized gain (loss) at end of period |
146 | 8 | (26 | ) | ||||||||
|
Change in net recognized gain (loss) |
$ | 138 | $ | 34 | $ | (10 | ) | |||||
During 2014 and 2013, there were no reclassifications of marketable securities between trading and available for sale.
The following table shows the Company’s realized gains during 2014, 2013 and 2012 on certain securities which were held as available-for-sale. The cost of securities sold is based on the specific identification method and interest and dividends on securities are included in non-operating income.
|
2014 |
2013 |
2012 |
||||||||||
|
(in thousands) |
||||||||||||
|
Realized gains |
||||||||||||
|
Sale proceeds |
$ | 1,720 | $ | 857 | $ | 4,554 | ||||||
|
Cost of securities sold |
818 | 290 | 2,183 | |||||||||
|
Realized gains |
$ | 902 | $ | 567 | $ | 2,371 | ||||||
|
Realized gains, net of taxes |
$ | 546 | $ | 346 | $ | 1,437 | ||||||
The following table shows the Company’s investments’ approximate gross unrealized losses and related fair value of securities in a loss position at December 31, 2014 and 2013. As of December 31, 2014 and 2013, there were no investments that had been in a continuous unrealized loss position for twelve months or longer.
|
2014 |
2013 |
|||||||||||||||
|
(in thousands) |
||||||||||||||||
|
Unrealized |
Unrealized |
|||||||||||||||
|
Fair Value |
Losses |
Fair Value |
Losses |
|||||||||||||
|
Equity securities – Available for sale |
$ | 3,961 | $ | 390 | $ | 397 | $ | 17 | ||||||||
|
Equity securities – Trading |
- | - | - | - | ||||||||||||
|
Totals |
$ | 3,961 | $ | 390 | $ | 397 | $ | 17 | ||||||||
The market value of the Company’s equity securities are periodically used as collateral against any outstanding margin account borrowings. As of December 31, 2014 and 2013, the Company had outstanding borrowings of $11,723,000 and $10,017,000 under its margin account, respectively. The weighted average interest rate on margin account borrowings was 0.76% as of December 31, 2014 and 2013.
|
4. |
ACCRUED EXPENSES AND OTHER LIABILITIES |
Accrued expenses and other liabilities at December 31 are summarized as follows:
|
2014 |
2013 |
|||||||
|
(in thousands) |
||||||||
|
Payroll |
$ | 1,954 | $ | 3,252 | ||||
|
Accrued vacation |
1,687 | 1,766 | ||||||
|
Taxes—other than income |
2,309 | 2,232 | ||||||
|
Interest |
61 | 110 | ||||||
|
Driver escrows |
1,584 | 1,395 | ||||||
|
Margin account borrowings |
11,723 | 10,017 | ||||||
|
Self-insurance claims |
7,975 | 3,730 | ||||||
|
Deferred equipment gain – current portion |
224 | - | ||||||
|
Total accrued expenses and other liabilities |
$ | 27,517 | $ | 22,502 | ||||
|
5. |
CLAIMS LIABILITIES |
With respect to physical damage for trucks, trailers, cargo loss and auto liability, the Company maintains insurance coverage to protect it from certain business risks. These policies are with various carriers and have per occurrence deductibles of $7,500, $2,500, $10,000 and $2,500, respectively. Prior to October 1, 2013, the Company elected to self-insure for physical damage to trailers. Effective October 1, 2013, the Company began insuring trailers for physical damage with a $2,500 deductible per occurrence. The Company maintains workers’ compensation coverage in Arkansas, Ohio, Oklahoma, Mississippi, and Florida with a $500,000 self-insured retention and a $500,000 per occurrence excess policy. The Company has elected to opt out of workers' compensation coverage in Texas and is providing coverage through the P.A.M. Texas Injury Plan. The Company has accrued for estimated losses to pay such claims as well as claims incurred but not yet reported. The Company has not experienced any adverse trends involving differences in claims experienced versus claims estimates for workers’ compensation claims. Letters of credit aggregating approximately $1,101,000 and certificates of deposit totaling $300,000 are held by banks as security for workers’ compensation claims. The Company self-insures for employee health claims with a stop loss of $325,000 per covered employee per year and estimates its liability for claims outstanding and claims incurred but not reported.
|
6. |
LONG-TERM DEBT |
Long-term debt at December 31, consists of the following:
|
2014 |
2013 |
|||||||
|
(in thousands) |
||||||||
|
Line of credit with a bank—due July 1, 2016, and collateralized by accounts receivable (1) |
$ | - | $ | - | ||||
|
Equipment financing (2) |
95,201 | 110,469 | ||||||
|
Total long-term debt |
95,201 | 110,469 | ||||||
|
Less current maturities |
(42,908 | ) | (40,103 | ) | ||||
|
Long-term debt—net of current maturities |
$ | 52,293 | $ | 70,366 | ||||
|
(1) |
Line of credit agreement with a bank provides for maximum borrowings of $40.0 million and contains certain restrictive covenants that must be maintained by the Company on a consolidated basis. Borrowings on the line of credit are at an interest rate of LIBOR as of the first day of the month plus 1.50% (1.65% at December 31, 2014) and are secured by our trade accounts receivable. Monthly payments of interest are required under this agreement. Also, under the terms of the agreement the Company must have a debt to equity ratio of no more than 3.00:1. The Company was in compliance with all provisions under this agreement throughout 2014. |
|
(2) |
Equipment financings consist of installment obligations for revenue equipment purchases, payable in various monthly installments with various maturity dates through December 2019, at a weighted average interest rate of 2.66% as of December 31, 2014 and collateralized by revenue equipment. |
The Company has provided letters of credit to third parties totaling approximately $1,101,000 at December 31, 2014. The letters are held by these third parties to assist such parties in collection of any amounts due by the Company should the Company default in its commitments to the parties.
Scheduled annual maturities on long-term debt outstanding at December 31, 2014, are:
|
(in thousands) |
||||
|
2015 |
$ | 42,908 | ||
|
2016 |
26,779 | |||
|
2017 |
9,995 | |||
|
2018 |
9,363 | |||
|
2019 |
6,156 | |||
|
Total |
$ | 95,201 | ||
|
7. |
CAPITAL STOCK |
The Company's authorized capital stock consists of 40,000,000 shares of common stock, par value $.01 per share, and 10,000,000 shares of preferred stock, par value $.01 per share. At December 31, 2014, there were 11,474,096 shares of our common stock issued and 7,423,115 shares outstanding. At December 31, 2013, there were 11,391,464 shares of our common stock issued and 7,983,539 shares outstanding. No shares of our preferred stock were issued or outstanding at December 31, 2014 or 2013.
Common Stock
The holders of our common stock, subject to such rights as may be granted to any preferred stockholders, elect all directors and are entitled to one vote per share. All shares of common stock participate equally in dividends when and as declared by the Board of Directors and in net assets on liquidation. The shares of common stock have no preference, conversion, exchange, preemptive or cumulative voting rights.
Preferred Stock
Preferred stock may be issued from time to time by our Board of Directors, without stockholder approval, in such series and with such preferences, conversion or other rights, voting powers, restrictions, limitations as to dividends, qualifications or other provisions, as may be fixed by the Board of Directors in the resolution authorizing their issuance. The issuance of preferred stock by the Board of Directors could adversely affect the rights of holders of shares of common stock; for example, the issuance of preferred stock could result in a class of securities outstanding that would have certain preferences with respect to dividends and in liquidation over the common stock, and that could result in a dilution of the voting rights, net income per share and net book value of the common stock. As of December 31, 2014, we have no agreements or understandings for the issuance of any shares of preferred stock.
Treasury Stock
In November 2014, our Board of Directors authorized the repurchase of up to 640,000 shares of our common stock through a Dutch auction tender offer (the “2014 tender offer”). Subject to certain limitations and legal requirements, the Company could repurchase up to an additional 2% of its outstanding shares which totaled 160,000 shares. The 2014 tender offer began on the date of the announcement, December 2, 2014 and expired on December 30, 2014. Through this tender offer, the Company’s shareholders had the opportunity to tender some or all of their shares at a price within the range of $46.00 to $50.00 per share. Upon expiration, 571,865 shares were tendered through this offer at a final purchase price of $50.00 per share for a total purchase price of approximately $28.7 million, including fees and commission and was settled on January 6, 2015. The Company accounted for the repurchase of these shares as treasury stock on the Company’s consolidated balance sheet as of December 31, 2014.
In November 2013, our Board of Directors authorized the repurchase of up to 600,000 shares of our common stock through a Dutch auction tender offer (the “2013 tender offer”). Subject to certain limitations and legal requirements, the Company could repurchase up to an additional 2% of its outstanding shares which totaled 173,000 shares. The 2013 tender offer began on the date of the announcement, December 2, 2013 and expired on December 30, 2013. Through this tender offer, the Company’s shareholders had the opportunity to tender some or all of their shares at a price within the range of $19.00 to 21.00 per share. Upon expiration, 675,000 shares were tendered through this offer at a final purchase price of $20.50 per share for a total purchase price of approximately $13.9 million, including fees and commission and was settled on January 6, 2014. The Company accounted for the repurchase of these shares as treasury stock on the Company’s consolidated balance sheet as of December 31, 2013.
In May 2014, our Board of Directors reauthorized 500,000 shares of common stock for repurchase under the initial September 2011 authorization. Following the reauthorization, the Company repurchased 33,341 shares of its common stock during the remainder of 2014 under this repurchase program. Prior to the reauthorization, and under the initial September 2011 authorization, the Company had repurchased 224,000 shares of its common stock during 2011, 50,325 shares of its common stock during 2013 and 37,850 shares of its common stock during 2014. The Company did not repurchase any additional shares during 2012.
The Company accounts for Treasury stock using the cost method and as of December 31, 2014, 4,050,981 shares were held in the treasury at an aggregate cost of approximately $82,501,000.
|
8. |
COMPREHENSIVE INCOME (LOSS) |
Comprehensive income (loss) was comprised of net income (loss) plus or minus market value adjustments related to marketable securities. The following table summarizes the changes in accumulated balances of other comprehensive income for the years ended December 31, 2014 and 2013:
|
Unrealized gains and losses on available-for-sale securities |
||||
|
(in thousands) |
||||
|
Balance at January 1, 2013, net of tax of $2,592 |
$ | 4,235 | ||
|
Other comprehensive income before reclassifications, net of tax of $1,298 |
2,122 | |||
|
Amounts reclassified from accumulated other comprehensive income, net of tax of $(120) |
(197 | ) | ||
|
Net other comprehensive income |
1,925 | |||
|
Balance at December 31, 2013, net of tax of $3,770 |
6,160 | |||
|
Other comprehensive income before reclassifications, net of tax of $533 |
871 | |||
|
Amounts reclassified from accumulated other comprehensive income, net of tax of $(385) |
(629 | ) | ||
|
Net other comprehensive income |
242 | |||
|
Balance at December 31, 2014, net of tax of $3,918 |
$ | 6,402 | ||
The following table provides details about reclassifications out of accumulated other comprehensive income for the years ended December 31, 2014 and 2013:
| Details about Accumulated Other |
Amounts Reclassified from Accumulated Other Comprehensive Income (a) |
Statement of Operations | |||||||
|
Comprehensive Income Component |
2014 |
2013 |
Classification | ||||||
|
(in thousands) |
|||||||||
|
Unrealized gains and losses on available-for-sale securities: |
|||||||||
|
Realized gain on sale of securities |
$ | 1,015 | $ | 346 | Non-operating income | ||||
|
Impairment expense |
(1 | ) | (29 | ) | Non-operating income | ||||
|
Total before tax |
1,014 | 317 | Income before income taxes | ||||||
|
Tax expense |
(385 | ) | (120 | ) | Income tax expense | ||||
|
Total after tax |
$ | 629 | $ | 197 | Net income | ||||
|
(a) Amounts in parentheses indicate debits to profit/loss |
|
9. |
SIGNIFICANT CUSTOMERS AND INDUSTRY CONCENTRATION |
In 2014, 2013 and 2012, two customers, who are in the automobile manufacturing industry, accounted for 34%, 33% and 28% of revenues, respectively. The Company also provides transportation services to other manufacturers who are suppliers for automobile manufacturers including suppliers for the Company’s largest customer. As a result, concentration of the Company’s business within the automobile industry is significant. Of the Company’s revenues for 2014, 2013 and 2012, 48%, 46% and 37%, respectively, were derived from transportation services provided to the automobile manufacturing industry. Accounts receivable from the two largest customers totaled approximately $22,965,000 and $28,290,000 at December 31, 2014 and 2013, respectively.
|
10. |
DIVIDENDS |
In March 2012, the Board declared a cash dividend of $1.00 per common share. This dividend was paid in cash on April 9, 2012 to stockholders of record at the close of business on March 30, 2012. In December 2012, the Board declared a cash dividend of $1.00 per common share. This dividend was paid in cash on December 28, 2012 to stockholders of record at the close of business on December 17, 2012. The Company currently intends to retain future earnings to finance the growth, development and expansion of its business and does not anticipate paying cash dividends in the future. Any future determination to pay dividends will be at the discretion of the Board and will depend on the Company’s financial condition, results of operations, capital requirements, any legal or contractual restrictions on the payment of dividends, and other factors the Board deems relevant.
|
11. |
FEDERAL AND STATE INCOME TAXES |
Under GAAP, deferred income taxes reflect the net tax effects of temporary differences between the carrying amounts of assets and liabilities for financial reporting purposes and for income tax reporting purposes.
Significant components of the Company’s deferred tax liabilities and assets at December 31 are as follows:
|
2014 |
2013 |
|||||||||||||||
|
(in thousands) |
||||||||||||||||
|
Current |
Long-Term |
Current |
Long-Term |
|||||||||||||
|
Deferred tax liabilities: |
||||||||||||||||
|
Property and equipment |
$ | - | $ | 64,341 | $ | - | $ | 73,099 | ||||||||
|
Unrealized gains on securities |
3,918 | - | 3,769 | - | ||||||||||||
|
Prepaid expenses and other |
3,837 | - | 2,498 | - | ||||||||||||
|
Total deferred tax liabilities |
7,755 | 64,341 | 6,267 | 73,099 | ||||||||||||
|
Deferred tax assets: |
||||||||||||||||
|
Allowance for doubtful accounts |
612 | - | 561 | - | ||||||||||||
|
Alternative minimum tax credit carryforward |
- | 1,206 | - | 318 | ||||||||||||
|
QAFMV tax credit carryforward |
- | 864 | - | 864 | ||||||||||||
|
New hire tax credit |
- | 124 | - | 124 | ||||||||||||
|
Compensated absences |
564 | - | 594 | - | ||||||||||||
|
Self-insurance allowances |
2,592 | - | 1,027 | - | ||||||||||||
|
Share-based compensation |
- | 579 | - | 702 | ||||||||||||
|
Goodwill |
- | 28 | - | 37 | ||||||||||||
|
Marketable equity securities |
686 | - | 767 | - | ||||||||||||
|
Net operating loss carryover |
- | 4,392 | - | 21,255 | ||||||||||||
|
Capital loss carryover |
339 | - | 667 | - | ||||||||||||
|
Non-competition agreement |
- | 23 | - | 30 | ||||||||||||
|
Other |
11 | - | - | 5 | ||||||||||||
|
Total deferred tax assets |
4,804 | 7,216 | 3,616 | 23,335 | ||||||||||||
|
Net deferred tax liability |
$ | 2,951 | $ | 57,125 | $ | 2,651 | $ | 49,764 | ||||||||
The reconciliation between the effective income tax rate and the statutory Federal income tax rate for the years ended December 31, 2014, 2013 and 2012 is presented in the following table:
|
2014 |
2013 |
2012 |
||||||||||||||||||||||
|
(in thousands) |
||||||||||||||||||||||||
|
Amount |
Percent |
Amount |
Percent |
Amount |
Percent |
|||||||||||||||||||
|
Income tax at the statutory federal rate |
$ | 7,552 | 34.0 | $ | 3,288 | 34.0 | $ | 1,222 | 34.0 | |||||||||||||||
|
Nondeductible expenses |
154 | 0.7 | 127 | 1.3 | 138 | 3.8 | ||||||||||||||||||
|
State income taxes/other—net of federal benefit |
1,015 | 4.6 | 341 | 3.6 | 56 | 1.6 | ||||||||||||||||||
|
Total income tax expense |
$ | 8,721 | 39.3 | $ | 3,756 | 38.9 | $ | 1,416 | 39.4 | |||||||||||||||
The provision for income taxes consisted of the following:
|
2014 |
2013 |
2012 |
||||||||||
|
(in thousands) |
||||||||||||
|
Current: |
||||||||||||
|
Federal |
$ | 814 | $ | 124 | $ | - | ||||||
|
State |
395 | 35 | 51 | |||||||||
| 1,209 | 159 | 51 | ||||||||||
|
Deferred: |
||||||||||||
|
Federal |
6,111 | 2,909 | 1,166 | |||||||||
|
State |
1,401 | 688 | 199 | |||||||||
| 7,512 | 3,597 | 1,365 | ||||||||||
|
Total income tax expense |
$ | 8,721 | $ | 3,756 | $ | 1,416 | ||||||
The Company has alternative minimum tax credits of approximately $1,206,000 at December 31, 2014, which have no expiration date under the current federal income tax laws and general business credits of approximately $988,000 which begin to expire after the year 2030. The Company also has net operating loss carryovers for federal income purposes of approximately $11,571,000 which begin to expire after the year 2030.
In determining whether a tax asset valuation allowance is necessary, management, in accordance with the provisions of ASC 740-10-30, weighs all available evidence, both positive and negative to determine whether, based on the weight of that evidence, a valuation allowance is necessary. If negative conditions exist which indicate a valuation allowance might be necessary, consideration is then given to what effect the future reversals of existing taxable temporary differences and the availability of tax strategies might have on future taxable income to determine the amount, if any, of the required valuation allowance. As of December 31, 2014 and 2013, management determined that the future reversals of existing taxable temporary differences and available tax strategies would generate sufficient future taxable income to realize its tax assets and therefore a valuation allowance was not necessary.
The Company recognizes a tax benefit from an uncertain tax position only if it is more likely than not that the position will be sustained on examination by taxing authorities, based on the technical merits of the position. As of December 31, 2014, an adjustment to the Company’s consolidated financial statements for uncertain tax positions has not been required as management believes that the Company’s tax positions taken in income tax returns filed or to be filed are supported by clear and unambiguous income tax laws. The Company recognizes interest and penalties related to uncertain income tax positions, if any, in income tax expense. During 2014 and 2013, the Company has not recognized or accrued any interest or penalties related to uncertain income tax positions.
The Company and its subsidiaries are subject to U.S. and Canadian federal income tax laws as well as the income tax laws of multiple state jurisdictions. The major tax jurisdictions in which the Company operates generally provide for a deficiency assessment statute of limitation period of three years and as a result, the Company’s tax years 2011 and forward remain open to examination in those jurisdictions.
The Company contracts with a third-party qualified intermediary in order to maintain a like-kind exchange tax program. Under the program, dispositions of eligible trucks or trailers and acquisitions of replacement trucks or trailers are made in a form whereby any associated tax gains related to the disposal are deferred. To qualify for like-kind exchange treatment, we exchange, through our qualified intermediary, eligible trucks or trailers being disposed with trucks or trailers being acquired that allows us to generally carryover the tax basis of the trucks or trailers sold. The program is expected to result in a significant deferral of federal and state income taxes. Under the program, the proceeds from the sale of eligible trucks or trailers carry a Company-imposed restriction for the acquisition of replacement trucks or trailers. These proceeds may be disqualified under the program at any time and at the Company’s sole discretion; however, income tax deferral would not be available for any sale for which the Company disqualifies the related proceeds. At December 31, 2014, the Company had $8,496,000 of restricted cash held by the third-party qualified intermediary. At December 31, 2013, the Company had $623,000 of restricted cash held by the third-party qualified intermediary. Restricted cash is accounted for in “Accounts receivable-other”.
|
12. |
STOCK-BASED COMPENSATION |
The Company maintains a stock option plan under which incentive stock options, nonqualified stock options and other stock awards may be granted. On March 2, 2006, the Company’s Board of Director’s adopted, and stockholders later approved, the 2006 Stock Option Plan (the “2006 Plan”). Under the 2006 Plan 750,000 shares were reserved for the issuance of stock options to directors, officers, key employees and others. The option exercise price under the 2006 Plan is the fair market value of the stock on the date the option is granted. The fair market value is determined by the closing price of the Company’s common stock, on its primary exchange, on the same date that the option is granted. On March 13, 2014, the Company’s Board of Directors adopted and on May 29, 2014, our shareholders approved, the 2014 Amended and Restated Stock Option and Incentive Plan (the “2014 Plan”) which replaced the 2006 Plan. The shares which remained reserved under the 2006 Plan were transferred to the 2014 Plan and are reserved for the issuance of stock awards to directors, officers, key employees, and others. Stock option exercise price under the 2014 Plan is the fair market value of the stock on the date the option is granted. The restricted stock purchase price under the 2014 Plan shall not be less than 85% of the fair market value of the Company’s common stock on the date the award is made. The fair market value is determined by the average of the highest and lowest sales prices for a share of the Company’s common stock, on its primary exchange, on the same date that the option or award is granted.
Outstanding nonqualified stock options at December 31, 2014, must be exercised within either five or ten years from the date of grant. Nonqualified stock options granted to members of the Company’s Board of Directors vest immediately while nonqualified stock options issued to employees vest in increments of 20% each year.
In November 2014, the Board of Directors granted 9,500 restricted shares of the Company’s stock to certain key employees. This restricted stock award has a grant date fair value of $42.65, based on the closing price of the Company’s stock on the date of grant, of which 20% of the award vested immediately and the remaining award vests in increments of 20% each year for the next four years.
In March 2014, 3,024 shares of common stock were granted to non-employee directors under the 2014 Plan. This stock award has a grant date fair value of $19.88 per share, based on the closing price of the Company’s stock on the date of grant and vests immediately.
In May 2012, the Company granted to certain key employees, 104,000 nonqualified stock options. The exercise price for these awards was fixed at the grant date and was equal to the fair market value of the stock on that date. These nonqualified stock options vest in increments of 20% each year.
In November 2010, the Company granted to certain key employees, 50,000 nonqualified stock options and 64,000 performance-based variable nonqualified stock options. The exercise price for these awards was fixed at the grant date and was equal to the fair market value of the stock on that date. The nonqualified stock options vest in increments of 20% each year. The performance-based nonqualified stock options were eligible to be earned in four quarterly installments and one annual installment with vesting to occur in increments of 20% each year for any options earned. In order to meet the performance criteria, certain quarterly and annual “operating ratio” results must have been achieved during 2011. During 2011, 4,442 performance-based variable nonqualified stock options were earned with vesting beginning during the third quarter of 2012. The remaining 59,558 performance-based variable nonqualified stock options expired as the related performance criteria was not met.
During 2014, there were no grants of nonqualified stock options. At December 31, 2014, 361,000 shares were available for granting future options or restricted stock.
The grant date fair value of stock and stock options vested during 2014, 2013 and 2012 was approximately $263,000, $346,000 and $268,000, respectively. Total pre-tax stock-based compensation expense, recognized in Salaries, wages and benefits was approximately $270,000 during 2014 and includes approximately $60,000 recognized as a result of the grant of 504 shares of stock to each non-employee director during the first quarter of 2014 and approximately $94,000 recognized as a result of the grant of 9,500 shares of stock to certain key employees during the fourth quarter of 2014. The Company recognized a total income tax benefit of approximately $106,000 related to stock-based compensation expense during 2014. The recognition of stock-based compensation expense decreased diluted and basic income per common share by approximately $0.02 during 2014. As of December 31, 2014, the Company had stock-based compensation plans with total unvested stock-based compensation expense of approximately $541,000 which is being amortized on a straight-line basis over the remaining vesting period. As a result, the Company expects to recognize approximately $197,000 in additional compensation expense related to unvested option awards during 2015, $167,000 in additional compensation expense related to unvested option awards during 2016, $109,000 in additional compensation expense related to unvested option awards during 2017 and $68,000 in additional compensation expense related to unvested option awards during 2018.
Total pre-tax stock-based compensation expense, recognized in Salaries, wages and benefits was approximately $317,000 during 2013 and included approximately $179,000 recognized as a result of the annual grant of 5,000 stock options to each non-employee director during the first quarter of 2013. The Company recognized a total income tax benefit of approximately $123,000 related to stock-based compensation expense during 2013. The recognition of stock-based compensation expense decreased diluted earnings per common share and basic earnings per common share by approximately $0.02 and $0.03, respectively during 2013. At December 31, 2013, the Company had stock-based compensation plans with total unvested stock-based compensation expense of approximately $518,000.
Total pre-tax stock-based compensation expense, recognized in Salaries, wages and benefits was approximately $352,000 during 2012 and included approximately $199,000 recognized as a result of the annual grant of 5,000 stock options to each non-employee director during the first quarter of 2012. The Company recognized a total income tax benefit of approximately $139,000 related to stock-based compensation expense during 2012. The recognition of stock-based compensation expense decreased diluted and basic income per common share by approximately $0.02 during 2012. At December 31, 2012, the Company had stock-based compensation plans with total unvested stock-based compensation expense of approximately $749,000.
Transactions in stock options under these plans are summarized as follows:
|
Shares Under Option |
Weighted- Average Exercise Price |
|||||||
|
Outstanding—January 1, 2012: |
180,942 | $ | 16.50 | |||||
|
Granted |
139,000 | 10.96 | ||||||
|
Exercised |
(6,000 | ) | 9.04 | |||||
|
Canceled |
(78,500 | ) | 22.64 | |||||
|
Outstanding—December 31, 2012: |
235,442 | $ | 11.38 | |||||
|
Granted |
35,000 | 10.44 | ||||||
|
Exercised |
(7,257 | ) | 10.94 | |||||
|
Canceled |
(99,087 | ) | 11.71 | |||||
|
Outstanding—December 31, 2013: |
164,098 | $ | 10.99 | |||||
|
Granted |
- | - | ||||||
|
Exercised |
(77,708 | ) | 10.88 | |||||
|
Canceled |
(42 | ) | 11.22 | |||||
|
Outstanding—December 31, 2014: |
86,348 | $ | 11.09 | |||||
|
Options exercisable—December 31, 2014: |
38,239 | $ | 11.28 | |||||
The fair value of the Company’s stock options was estimated at the date of grant using a Black-Scholes-Merton (“BSM”) option-pricing model using the following assumptions:
|
2013 |
2012 |
|||||||
|
Dividend yield |
0% | 0% | ||||||
|
Volatility range |
62.69% | 57.88%—65.89% | ||||||
|
Risk-free rate range |
0.61% | 0.64%—1.09% | ||||||
|
Expected life (in years) |
4.3% | 4.2—6.5% | ||||||
|
Fair value of options (per share) |
$5.13 | $5.54—6.06 | ||||||
There were no options granted during 2014.
The Company does not anticipate paying any additional dividends in the foreseeable future. The estimated volatility is based on the historical volatility of our stock. The risk free rate for the periods within the expected life of the option is based on the U.S. Treasury yield curve in effect at the time of grant. The expected life of the options was calculated based on the historical exercise behavior.
Information related to the Company’s option activity as of December 31, 2014, and changes during the year then ended is presented below:
|
Shares Under Option |
Weighted- Average Exercise Price |
Weighted- Average Remaining Contractual Term |
Aggregate Intrinsic Value* |
|||||||||||||
|
(per share) |
(in years) |
|||||||||||||||
|
Outstanding at January 1, 2014 |
164,098 | $ | 10.99 | |||||||||||||
|
Granted |
- | - | ||||||||||||||
|
Exercised |
(77,708 | ) | 10.88 | |||||||||||||
|
Canceled/forfeited/expired |
(42 | ) | 11.22 | |||||||||||||
|
Outstanding at December 31, 2014 |
86,348 | $ | 11.09 | 5.3 | $ | 3,518,524 | ||||||||||
|
Fully vested and exercisable at December 31, 2014 |
38,239 | $ | 11.28 | 2.8 | $ | 1,551,088 | ||||||||||
|
___________________________ |
|
* The intrinsic value of a stock option is the amount by which the market value of the underlying stock exceeds the exercise price of the option. The per share market value of our common stock, as determined by the closing price on December 31, 2014, was $51.84. |
The weighted-average grant-date fair value of options granted during the years 2013 and 2012 was $5.13 and $5.96 per share, respectively. There were no options granted during 2014. The weighted-average grant-date fair value of options either canceled, forfeited, or expired during the years 2014, 2013 and 2012 was $6.34, $5.92 and $8.88 per share, respectively.
The total intrinsic value of options exercised during the years ended December 31, 2014, 2013 and 2012, was approximately $1,355,000, $53,000 and $15,000, respectively.
A summary of the status of the Company’s nonvested options and restricted stock as of December 31, 2014 and changes during the year ended December 31, 2014, is presented below:
Stock Options:
|
Number of Options |
Weighted- Average Grant Date Fair Value |
|||||||
|
Nonvested at January 1, 2014 |
68,039 | $ | 6.11 | |||||
|
Granted |
- | - | ||||||
|
Canceled/forfeited/expired |
(25 | ) | 6.34 | |||||
|
Vested |
(19,905 | ) | 6.15 | |||||
|
Nonvested at December 31, 2014 |
48,109 | $ | 6.10 | |||||
Restricted Shares:
|
Number of Shares |
Weighted- Average Grant Date Fair Value (1) |
|||||||
|
Nonvested at January 1, 2014 |
9,500 | $ | 18.17 | |||||
|
Granted |
12,524 | 37.15 | ||||||
|
Canceled/forfeited/expired |
(9,500 | ) | 18.17 | |||||
|
Vested |
(4,924 | ) | 28.67 | |||||
|
Nonvested at December 31, 2014 |
7,600 | $ | 42.65 | |||||
__________________________
|
(1) |
The weighted-average grant date fair value was based on the closing price of the Company’s stock on the date of the grant. |
The number, weighted average exercise price and weighted average remaining contractual life of options outstanding as of December 31, 2014 and the number and weighted average exercise price of options exercisable as of December 31, 2014 is as follows:
|
Exercise Price |
Shares Under Outstanding Options |
Weighted- Average Remaining Contractual Term |
Shares Under Exercisable Options |
|||||||||||
|
(in years) |
||||||||||||||
| $10.44 | 15,000 | 3.2 | 15,000 | |||||||||||
| $10.90 | 6,000 | 2.4 | 6,000 | |||||||||||
| $10.90 | 41,400 | 7.4 | - | |||||||||||
| $11.22 | 11,948 | 5.9 | 5,239 | |||||||||||
| $11.54 | 4,000 | 2.2 | 4,000 | |||||||||||
| $11.75 | 4,000 | 1.2 | 4,000 | |||||||||||
| $14.32 | 4,000 | 0.2 | 4,000 | |||||||||||
| 86,348 | 5.3 | 38,239 | ||||||||||||
Cash received from option exercises totaled approximately $846,000, $46,000 and $54,000 during the years ended December 31, 2014, 2013 and 2012, respectively. The Company issues new shares upon option exercise.
|
13. |
EARNINGS PER SHARE |
Basic earnings per common share was computed by dividing net income by the weighted average number of shares outstanding during the period. Diluted earnings per common share was calculated as follows:
|
For the Year Ended December 31, |
||||||||||||
|
2014 |
2013 |
2012 |
||||||||||
|
(in thousands, except per share data) |
||||||||||||
|
Net income |
$ | 13,491 | $ | 5,915 | $ | 2,179 | ||||||
|
Basic weighted average common shares outstanding |
7,990 | 8,662 | 8,700 | |||||||||
|
Dilutive effect of common stock equivalents |
44 | 20 | 2 | |||||||||
|
Diluted weighted average common shares outstanding |
8,034 | 8,682 | 8,702 | |||||||||
|
Basic earnings per share |
$ | 1.69 | $ | 0.68 | $ | 0.25 | ||||||
|
Diluted earnings per share |
$ | 1.68 | $ | 0.68 | $ | 0.25 | ||||||
Average options outstanding to purchase 14,915 and 227,199 shares of common stock for December 31, 2013 and 2012, respectively, were not included in the computation of diluted earnings per share because to do so would have an anti-dilutive effect.
|
14. |
BENEFIT PLAN |
The Company sponsors a benefit plan for the benefit of all eligible employees. The plan qualifies under Section 401(k) of the Internal Revenue Code thereby allowing eligible employees to make tax-deductible contributions to the plan. The plan provides for employer matching contributions of 50% of each participant’s voluntary contribution up to 3% of the participant’s compensation and vests at the rate of 20% each year until fully vested after five years. Total employer matching contributions to the plan were approximately $162,000, $188,000 and $193,000 in 2014, 2013 and 2012, respectively.
|
15. |
COMMITMENTS AND CONTINGENCIES |
Other than the lawsuit discussed below, the Company is not a party to any pending legal proceedings which management believes to be material to the Consolidated financial statements of the Company. The Company maintains liability insurance against risks arising out of the normal course of its business.
We are a defendant in a collective-action lawsuit which was filed on August 22, 2013, in the United States District Court for the Western District of Arkansas. The plaintiffs, who are current and former drivers and who worked for the Company during the period of August 22, 2010, through the date of the filing, allege claims for unpaid wages under the Fair Labor Standards Act and the Arkansas Minimum Wage Law. The complaint alleges that the Company failed to pay newly hired drivers minimum wage during orientation, training, and while traveling during normal business hours and that the Company failed to pay all drivers when working on assignment for more than 24 hours. The plaintiffs seek to enjoin the Company from continuing its current pay practices related to the allegations. They also seek actual damages, liquidated damages equal to accrual damages, court costs, and legal fees. The Company has reached a preliminary settlement with the plaintiffs in the amount of $3,950,000 and accordingly, has reserved this amount, along with estimated settlement costs, in the accompanying 2014 consolidated financial statements. Should the settlement not be approved by the court, further negotiations may take place to reach a different settlement or the case may continue on to trial. Management has determined that any losses under this claim will not be covered by existing insurance policies.
During 2014, the Company’s subsidiaries entered into operating leases for the lease of 421 trucks. Revenue equipment held under operating leases is not carried on our balance sheet and the respective lease payments are reflected in our consolidated statement of operations as a component of the Rents and purchased transportation category.
Leases for revenue equipment and certain premises under non-cancellable operating leases expire at various dates through 2019. Future minimum lease payments related to these non-cancellable leases at December 31, 2014 are as follows:
| (in thousands) | ||||
|
2015 |
$ | 8,844 | ||
|
2016 |
8,915 | |||
|
2017 |
5,238 | |||
|
2018 |
206 | |||
|
2019 and thereafter |
51 | |||
|
Total |
$ | 23,254 | ||
Total rental expense, net of amounts reimbursed for the years ended December 31, 2014, 2013 and 2012 was approximately $6,239,000, $1,572,000, and $1,555,000, respectively.
|
16. |
FAIR VALUE OF FINANCIAL INSTRUMENTS |
Our financial instruments consist of cash and cash equivalents, marketable equity securities, accounts receivable, trade accounts payable, and borrowings.
The Company adopted guidance effective January 1, 2008 for financial assets and liabilities measured on a recurring basis. This guidance defines fair value as the exchange price that would be received for an asset or paid to transfer a liability (an exit price) in the principal or most advantageous market for the asset or liability in an orderly transaction between market participants on the measurement date and also establishes a fair value hierarchy which requires an entity to maximize the use of observable inputs and minimize the use of unobservable inputs when measuring fair value. The standard describes three levels of inputs that may be used to measure fair value:
|
Level 1: |
|
Quoted market prices in active markets for identical assets or liabilities. |
|
|
|
|
|
Level 2: |
|
Inputs other than Level 1 inputs that are either directly or indirectly observable such as quoted prices for similar assets or liabilities in active markets; quoted prices for identical or similar assets or liabilities in markets that are not active; inputs other than quoted prices that are observable; or other inputs not directly observable, but derived principally from, or corroborated by, observable market data. |
|
Level 3: |
|
Unobservable inputs that are supported by little or no market activity. |
The Company utilizes the market approach to measure fair value for its financial assets and liabilities. The market approach uses prices and other relevant information generated by market transactions involving identical or comparable assets or liabilities.
At December 31, 2014, the following items are measured at fair value on a recurring basis:
|
Total |
Level 1 |
Level 2 |
Level 3 |
|||||||||||||
|
(in thousands) |
||||||||||||||||
|
Marketable equity securities |
$ | 24,895 | $ | 24,895 | - | - | ||||||||||
During 2014 and 2013, there were no transfers of marketable securities between levels of fair value measurement.
The Company’s investments in marketable equity securities are recorded at fair value based on quoted market prices. The carrying value of cash and cash equivalents, accounts receivable, trade accounts payable, and accrued liabilities approximate fair value due to their short maturities.
The carrying amount for the line of credit approximates fair value because the line of credit interest rate is adjusted frequently.
For long-term debt other than the lines of credit, the fair values are estimated using discounted cash flow analyses, based on the Company’s current incremental borrowing rates for similar types of borrowing arrangements. The carrying values and estimated fair values of this other long-term debt at December 31, 2014 and 2013 are summarized as follows:
|
2014 |
2013 |
|||||||||||||||
|
Carrying Value |
Estimated Fair Value |
Carrying Value |
Estimated Fair Value |
|||||||||||||
|
(in thousands) |
||||||||||||||||
|
Long-term debt |
$ | 95,201 | $ | 95,326 | $ | 110,469 | $ | 110,373 | ||||||||
The Company has not elected the fair value option for any of our financial instruments.
|
17. |
RELATED PARTY TRANSACTIONS |
In the normal course of business, transactions for transportation and repair services, property leases and other services are conducted between the Company and companies affiliated with a major stockholder. The Company recognized approximately $13,253,000, $10,350,000 and $3,298,000 in operating revenue and approximately $1,440,000, $1,303,000 and $1,313,000 in operating expenses in 2014, 2013 and 2012, respectively. In addition, also in the normal course of business, the Company sold tractors to an affiliated company owned by a major stockholder for approximately $750,000 during 2014.
The Company purchased physical damage, auto liability, and general liability insurance through an unaffiliated insurance broker which was written by an insurance company affiliated with a major stockholder. Premiums paid for physical damage coverage were approximately $2,597,000, $2,036,000 and $1,590,000 for 2014, 2013 and 2012, respectively. Premiums paid for auto liability coverage during 2014, 2013 and 2012 were approximately $9,464,000, $9,461,000 and $9,235,000, respectively. Premiums paid for general liability coverage during 2014, 2013 and 2012 were approximately $22,000 each year. Beginning in 2012, the Company secured coverage for workers’ compensation insurance under the same arrangement. Premiums paid for workers’ compensation coverage during 2014, 2013, and 2012 were approximately $267,000, $254,000 and $84,000, respectively.
Amounts owed to the Company by these affiliates were approximately $2,598,000 and $3,852,000 at December 31, 2014 and 2013, respectively. Of the accounts receivable at December 31, 2014, approximately $2,544,000 represents freight transportation, approximately $42,000 represents revenue resulting from maintenance performed in the Company’s maintenance facilities and charges paid by the Company to third parties on behalf of their affiliate and charged back at the amount paid, and approximately $12,000 represents property lease charges. Amounts representing prepaid insurance premiums at December 31, 2014 were approximately $1,624,000. There were no amounts representing prepaid insurance premiums as of December 31, 2013. Amounts payable to affiliates at December 31, 2014 and 2013 were approximately $971,000 and $303,000 respectively.
|
18. |
QUARTERLY RESULTS OF OPERATIONS (UNAUDITED) |
The tables below present quarterly financial information for 2014 and 2013:
|
2014 |
||||||||||||||||
|
Three Months Ended |
||||||||||||||||
|
March 31 |
June 30 |
September 30 |
December 31 |
|||||||||||||
|
(in thousands, except per share data) |
||||||||||||||||
|
Operating revenues |
$ | 97,820 | $ | 104,343 | $ | 107,059 | $ | 101,715 | ||||||||
|
Operating expenses and costs |
94,975 | 95,754 | 98,609 | 98,589 | ||||||||||||
|
Operating income |
2,845 | 8,589 | 8,450 | 3,126 | ||||||||||||
|
Non-operating income |
272 | 259 | 594 | 974 | ||||||||||||
|
Interest expense |
862 | 743 | 632 | 660 | ||||||||||||
|
Income tax expense |
898 | 3,160 | 3,355 | 1,308 | ||||||||||||
|
Net income |
$ | 1,357 | $ | 4,945 | $ | 5,057 | $ | 2,132 | ||||||||
|
Net income per common share: |
||||||||||||||||
|
Basic |
$ | 0.17 | $ | 0.62 | $ | 0.63 | $ | 0.27 | ||||||||
|
Diluted |
$ | 0.17 | $ | 0.62 | $ | 0.63 | $ | 0.27 | ||||||||
|
Average common shares outstanding: |
||||||||||||||||
|
Basic |
7,985 | 7,992 | 7,993 | 7,988 | ||||||||||||
|
Diluted |
8,033 | 8,035 | 8,032 | 8,027 | ||||||||||||
|
2013 |
||||||||||||||||
|
Three Months Ended |
||||||||||||||||
|
March 31 |
June 30 |
September 30 |
December 31 |
|||||||||||||
|
(in thousands, except per share data) |
||||||||||||||||
|
Operating revenues |
$ | 99,982 | $ | 104,408 | $ | 101,878 | $ | 96,545 | ||||||||
|
Operating expenses and costs |
100,234 | 99,402 | 97,194 | 94,477 | ||||||||||||
|
Operating income (loss) |
(252 | ) | 5,006 | 4,684 | 2,068 | |||||||||||
|
Non-operating income |
283 | 289 | 130 | 838 | ||||||||||||
|
Interest expense |
815 | 880 | 846 | 834 | ||||||||||||
|
Income tax expense (benefit) |
(328 | ) | 1,733 | 1,575 | 776 | |||||||||||
|
Net income (loss) |
$ | (456 | ) | $ | 2,682 | $ | 2,393 | $ | 1,296 | |||||||
|
Net income (loss) per common share: |
||||||||||||||||
|
Basic |
$ | (0.05 | ) | $ | 0.31 | $ | 0.28 | $ | 0.15 | |||||||
|
Diluted |
$ | (0.05 | ) | $ | 0.31 | $ | 0.28 | $ | 0.15 | |||||||
|
Average common shares outstanding: |
||||||||||||||||
|
Basic |
8,688 | 8,658 | 8,654 | 8,649 | ||||||||||||
|
Diluted |
8,688 | 8,659 | 8,663 | 8,683 | ||||||||||||
Item 9. Changes in and Disagreements with Accountants on Accounting and Financial Disclosure.
None.
Item 9A. Controls and Procedures.
Evaluation of Disclosure Controls and Procedures
Our management, with the participation of our chief executive officer and chief financial officer, evaluated the effectiveness of our disclosure controls and procedures pursuant to Rule 13a-15 under the Securities Exchange Act of 1934, as amended (the “Exchange Act”). In designing and evaluating the disclosure controls and procedures, management recognizes that any controls and procedures, no matter how well designed and operated, can provide only reasonable assurance of achieving the desired control objectives. In addition, the design of disclosure controls and procedures must reflect the fact that there are resource constraints and that management is required to apply its judgment in evaluating the benefits of possible controls and procedures relative to their costs.
Based on management’s evaluation, our chief executive officer and chief financial officer concluded that, as of December 31, 2014, our disclosure controls and procedures are designed at a reasonable assurance level and are effective to provide reasonable assurance that information we are required to disclose in reports that we file or submit under the Exchange Act is recorded, processed, summarized and reported within the time periods specified in Securities and Exchange Commission rules and forms, and that such information is accumulated and communicated to our management, including our chief executive officer and chief financial officer, as appropriate, to allow timely decisions regarding required disclosure.
Changes in Internal Control Over Financial Reporting
We regularly review our system of internal control over financial reporting and make changes to our processes and systems to improve controls and increase efficiency, while ensuring that we maintain an effective internal control environment. Changes may include such activities as implementing new, more efficient systems, consolidating activities, and migrating processes.
There were no changes in our internal control over financial reporting that occurred during the last quarter of the period covered by this Annual Report on Form 10-K that have materially affected, or are reasonably likely to materially affect, our internal control over financial reporting.
Management’s Report on Internal Control Over Financial Reporting
Our management is responsible for establishing and maintaining adequate internal control over financial reporting, as defined in Exchange Act Rule 13a-15(f). Management conducted an evaluation of the effectiveness of our internal control over financial reporting based on the framework in the 2013 Internal Control—Integrated Framework issued by the Committee of Sponsoring Organizations of the Treadway Commission. Based on this evaluation, management concluded that our internal control over financial reporting was effective as of December 31, 2014. Management reviewed the results of its assessment with our Audit Committee. The effectiveness of our internal control over financial reporting as of December 31, 2014 has been audited by Grant Thornton LLP, an independent registered public accounting firm, as stated in its report which is included below.
REPORT OF INDEPENDENT REGISTERED PUBLIC ACCOUNTING FIRM
Board of Directors and Stockholders
P.A.M. Transportation Services, Inc.
We have audited the internal control over financial reporting of P.A.M. Transportation Services, Inc. (a Delaware corporation) and subsidiaries (the “Company”) as of December 31, 2014, based on criteria established in the 2013 Internal Control—Integrated Framework issued by the Committee of Sponsoring Organizations of the Treadway Commission (COSO). The Company’s management is responsible for maintaining effective internal control over financial reporting and for its assessment of the effectiveness of internal control over financial reporting, included in the accompanying Management’s Report on Internal Control Over Financial Reporting. Our responsibility is to express an opinion on the Company’s internal control over financial reporting based on our audit.
We conducted our audit in accordance with the standards of the Public Company Accounting Oversight Board (United States). Those standards require that we plan and perform the audit to obtain reasonable assurance about whether effective internal control over financial reporting was maintained in all material respects. Our audit included obtaining an understanding of internal control over financial reporting, assessing the risk that a material weakness exists, testing and evaluating the design and operating effectiveness of internal control based on the assessed risk, and performing such other procedures as we considered necessary in the circumstances. We believe that our audit provides a reasonable basis for our opinion.
A company’s internal control over financial reporting is a process designed to provide reasonable assurance regarding the reliability of financial reporting and the preparation of financial statements for external purposes in accordance with generally accepted accounting principles. A company’s internal control over financial reporting includes those policies and procedures that (1) pertain to the maintenance of records that, in reasonable detail, accurately and fairly reflect the transactions and dispositions of the assets of the company; (2) provide reasonable assurance that transactions are recorded as necessary to permit preparation of financial statements in accordance with generally accepted accounting principles, and that receipts and expenditures of the company are being made only in accordance with authorizations of management and directors of the company; and (3) provide reasonable assurance regarding prevention or timely detection of unauthorized acquisition, use, or disposition of the company’s assets that could have a material effect on the financial statements.
Because of its inherent limitations, internal control over financial reporting may not prevent or detect misstatements. Also, projections of any evaluation of effectiveness to future periods are subject to the risk that controls may become inadequate because of changes in conditions, or that the degree of compliance with the policies or procedures may deteriorate.
In our opinion, the Company maintained, in all material respects, effective internal control over financial reporting as of December 31, 2014, based on criteria established in the 2013 Internal Control—Integrated Framework issued by COSO.
We also have audited, in accordance with the standards of the Public Company Accounting Oversight Board (United States), the consolidated financial statements of the Company as of and for the year ended December 31, 2014, and our report dated March 16, 2015 expressed an unqualified opinion on those financial statements.
/s/ GRANT THORNTON LLP
Tulsa, Oklahoma
March 16, 2015
Item 9B. Other Information.
None.
PART III
Portions of the information required by Part III of Form 10-K are, pursuant to General Instruction G (3) of Form 10-K, incorporated by reference from our definitive proxy statement to be filed pursuant to Regulation 14A for our Annual Meeting of Stockholders to be held on April 28, 2015. We will, within 120 days of the end of our fiscal year, file with the Securities and Exchange Commission a definitive proxy statement pursuant to Regulation 14A.
Item 10. Directors, Executive Officers and Corporate Governance.
The information presented under the captions “Election of Directors”, “Executive Officers”, “Section 16(a) Beneficial Ownership Reporting Compliance”, “Corporate Governance – Code of Ethics”, “Corporate Governance – Director Nominating Process” and “Corporate Governance – Board Committees,” in the proxy statement is incorporated here by reference.
Item 11. Executive Compensation.
The information presented under the captions “Executive Compensation”, “Corporate Governance – Compensation Committee Interlocks and Insider Participation”, and “Compensation Committee Report” in the proxy statement is incorporated here by reference.
Item 12. Security Ownership of Certain Beneficial Owners and Management and Related Stockholder Matters.
The information presented under the caption “Security Ownership of Certain Beneficial Owners and Management” in the proxy statement is incorporated here by reference.
Equity Compensation Plan Information
The following table summarizes, as of December 31, 2014, information about compensation plans under which equity securities of the Company are authorized for issuance:
|
Plan Category |
Number of securities to be issued upon exercise of outstanding options, warrants and rights |
Weighted-average exercise price of outstanding options, warrants and rights |
Number of securities remaining available for future issuance under equity compensation plans |
|||||||||
|
Equity Compensation Plans approved by Security Holders |
93,948 | $ | 11.09 | (1) | 361,076 | |||||||
|
Equity Compensation Plans not approved by Security Holders |
-0- | -0- | -0- | |||||||||
|
Total |
93,948 | $ | 11.09 | 361,076 | ||||||||
|
(1) |
Excludes shares of restricted stock, which do not require the payment of an exercise price. |
Item 13. Certain Relationships and Related Transactions, and Director Independence.
The information presented under the captions “Transactions with Related Persons” and “Corporate Governance – Director Independence” in the proxy statement is incorporated here by reference.
Item 14. Principal Accounting Fees and Services.
The information presented under the caption “Independent Public Accountants – Principal Accountant Fees and Services” in the proxy statement is incorporated here by reference.
PART IV
Item 15. Exhibits, Financial Statement Schedules.
|
(a) |
Financial Statements and Schedules. |
|
|
(1) |
Financial Statements: See Part II, Item 8 hereof. |
| Report of Independent Registered Public Accounting Firm - Grant Thornton LLP | ||
| Consolidated Balance Sheets - December 31, 2014 and 2013 | ||
| Consolidated Statements of Operations - Years ended December 31, 2014, 2013 and 2012 | ||
| Consolidated Statements of Comprehensive Income - Years ended December 31, 2014, 2013 and 2012 | ||
| Consolidated Statements of Stockholders’ Equity - Years ended December 31, 2014, 2013 and 2012 | ||
| Consolidated Statements of Cash Flows - Years ended December 31, 2014, 2013 and 2012 | ||
| Notes to Consolidated Financial Statements | ||
| (2) | Financial Statement Schedules. | |
| All schedules for which provision is made in the applicable accounting regulations of the SEC are omitted as the required information is inapplicable, or because the information is presented in the consolidated financial statements or related notes. |
(3) Exhibits.
The following exhibits are filed with or incorporated by reference into this Report. The exhibits which are denominated by an asterisk (*) were previously filed as a part of, and are hereby incorporated by reference from either (i) the Form S-1 Registration Statement under the Securities Act of 1933, as filed with the Securities and Exchange Commission on July 30, 1986, Registration No. 33-7618, as amended on August 8, 1986, September 3, 1986 and September 10, 1986 (“1986 S-1”); (ii) the Quarterly Report on Form 10-Q for the quarter ended June 30, 1994 (“6/30/94 10-Q”); (iii) the Quarterly Report on Form 10-Q for the quarter ended June 30, 1995 (“6/30/95 10-Q”); (iv) the Quarterly Report on Form 10-Q for the quarter ended September 30, 1996 (“9/30/96 10-Q”); (v) the Quarterly Report on Form 10-Q for the quarter ended March 31, 2002 (“3/31/02 10-Q”); (vi) the Form 8-K filed on May 31, 2006 (“5/31/06 8-K”); (vii) the Form 8-K filed on December 11, 2007 (“12/11/07 8-K”); (viii) the Annual Report on Form 10-K for the year ended December 31, 2007 (“2007 10-K”); (ix) the Form 8-K filed on July 16, 2009 (“7/16/09 8-K”); (x) Form 8-K filed on December 3, 2010 (“12/03/10 8-K”); or (xi) the Schedule 14A filed on April 23, 2014.
|
Exhibit # |
Description of Exhibit | |
|
*3.1 |
Amended and Restated Certificate of Incorporation of the Registrant (Exh. 3.1, 3/31/02 10-Q) | |
|
*3.2 |
Amended and Restated By-Laws of the Registrant (Exh. 3.2, 12/11/07 8-K) | |
|
*4.1 |
Specimen Stock Certificate (Exh. 4.1, 1986 S-1) | |
|
*4.2 |
Loan Agreement dated July 26, 1994 among First Tennessee Bank National Association, Registrant and P.A.M. Transport, Inc. together with Promissory Note (Exh. 4.1, 6/30/94 10-Q) | |
|
*4.2.1 |
Security Agreement dated July 26, 1994 between First Tennessee Bank National Association and P.A.M. Transport, Inc. (Exh. 4.2, 6/30/94 10-Q) | |
|
*4.3 |
First Amendment to Loan Agreement dated June 27, 1995 by and among P.A.M. Transport, Inc., First Tennessee Bank National Association and P.A.M. Transportation Services, Inc., together with Promissory Note in the principal amount of $2,500,000 (Exh. 4.1.1, 6/30/95 10-Q) | |
|
*4.3.1 |
First Amendment to Security Agreement dated June 28, 1995 by and between P.A.M. Transport, Inc. and First Tennessee Bank National Association (Exh. 4.2.2, 6/30/95 10-Q) | |
|
*4.3.2 |
Security Agreement dated June 27, 1995 by and between Choctaw Express, Inc. and First Tennessee Bank National Association (Exh. 4.1.3, 6/30/95 10-Q) | |
|
*4.3.3 |
Guaranty Agreement of P.A.M. Transportation Services, Inc. dated June 27, 1995 in favor of First Tennessee Bank National Association $10,000,000 line of credit (Exh. 4.1.4, 6/30/95 10-Q) | |
|
*4.4 |
Second Amendment to Loan Agreement dated July 3, 1996 by P.A.M. Transport, Inc., First Tennessee Bank National Association and P.A.M. Transportation Services, Inc., together with Promissory Note in the principal amount of $5,000,000 (Exh. 4.1.1, 9/30/96 10-Q) | |
|
*4.4.1 |
Second Amendment to Security Agreement dated July 3, 1996 by and between P.A.M. Transport, Inc. and First Tennessee National Bank Association (Exh. 4.1.2, 9/30/96 10-Q) | |
|
*4.4.2 |
First Amendment to Security Agreement dated July 3, 1996 by and between Choctaw Express, Inc. and First Tennessee Bank National Association (Exh. 4.1.3, 9/30/96 10-Q) | |
|
*4.4.3 |
Security Agreement dated July 3, 1996 by and between Allen Freight Services, Inc. and First Tennessee Bank National Association (Exh. 4.1.4, 9/30/96 10-Q) | |
|
*4.5 |
Fourth Amendment to Loan Agreement dated July 26, 1994 among First Tennessee Bank National Association, Registrant and P.A.M. Transport, Inc. together with Promissory Note (Exh. 4.6, 2007 10-K) |
|
*10.1 |
(1) |
Employment Agreement between the Registrant and Daniel H. Cushman, dated June 29, 2009 (Exh. 10.2, 7/16/09 8-K) |
|
*10.2 |
(1) |
2006 Stock Option Plan (Exh. 10.1, 5/31/06 8-K) |
|
*10.3 |
(1) |
Form of Non-Qualified Stock Option Agreement for Non-Employee Director stock options that are granted under the 2006 Stock Option Plan (Exh. 10.2, 5/31/06 8-K) |
|
*10.4 |
(1) |
Incentive Compensation Plan (Exh. 10.3, 7/16/09 8-K) |
|
*10.5 |
(1) |
Consulting Agreement between the Registrant and Manuel J. Moroun, dated December 6, 2007 (Exh. 10.10, 2007 10-K) |
|
*10.6 |
(1) |
Form of Stock Option Agreement based on performance schedule and granted under the 2006 Stock Option Plan (Exh. 10.1, 12/03/10 8-K) |
|
*10.7 |
(1) |
Form of Stock Option Agreement granted under the 2006 Stock Option Plan (Exh. 10.2, 12/03/10 8-K) |
|
*10.8 |
(1) |
2014 Amended and Restated Stock Option and Incentive Plan (Appendix A, 4/23/14 DEF 14A) |
|
21.1 |
Subsidiaries of the Registrant | |
|
23.1 |
Consent of Grant Thornton LLP | |
|
31.1 |
Rule 13a-14(a) Certification of Principal Executive Officer | |
|
31.2 |
Rule 13a-14(a) Certification of Principal Financial Officer | |
|
32.1 |
Section 1350 Certifications of Chief Executive Officer and Chief Financial Officer | |
|
101.INS |
XBRL Instance Document | |
|
101.SCH |
XBRL Taxonomy Extension Schema Document | |
|
101.CAL |
XBRL Taxonomy Extension Calculation Linkbase Document | |
|
101.DEF |
XBRL Taxonomy Extension Definition Linkbase Document | |
|
101.LAB |
XBRL Taxonomy Extension Label Linkbase Document | |
|
101.PRE |
XBRL Taxonomy Extension Presentation Linkbase Document | |
|
(1) Management contract or compensatory plan or arrangement. | ||
SIGNATURES
Pursuant to the requirements of Section 13 or 15(d) of the Securities Exchange Act of 1934, the registrant has duly caused this report to be signed on its behalf by the undersigned, thereunto duly authorized.
|
P.A.M. TRANSPORTATION SERVICES, INC. |
|||
|
Dated: March 13, 2015 |
By: |
/s/ Daniel H. Cushman |
|
|
DANIEL H. CUSHMAN |
|||
|
President and Chief Executive Officer |
|||
|
(principal executive officer) |
|||
|
Pursuant to the requirements of the Securities Exchange Act of 1934, this report has been signed below by the following persons on behalf of the registrant and in the capacities and on the dates indicated. |
|||
|
Dated: March 13, 2015 |
By: |
/s/ Frederick P. Calderone |
|
|
FREDERICK P. CALDERONE, Director |
|||
|
Dated: March 13, 2015 |
By: |
/s/ Daniel H. Cushman |
|
|
DANIEL H. CUSHMAN |
|||
|
President and Chief Executive Officer, Director |
|||
|
(principal executive officer) |
|||
|
Dated: March 13, 2015 |
By: |
/s/ W. Scott Davis |
|
|
W. SCOTT DAVIS, Director |
|||
|
Dated: March 13, 2015 |
By: |
/s/ Norman E. Harned |
|
|
NORMAN E. HARNED, Director |
|||
|
Dated: March 13, 2015 |
By: |
/s/ Franklin H. McLarty |
|
|
FRANKLIN H. MCLARTY, Director |
|||
|
Dated: March 13, 2015 |
By: |
/s/ Manuel J. Moroun |
|
|
MANUEL J. MOROUN, Director |
|||
|
Dated: March 13, 2015 |
By: |
/s/ Matthew T. Moroun |
|
|
MATTHEW T. MOROUN, Director and Chairman of the Board |
|||
|
Dated: March 13, 2015 |
By: |
/s/ Daniel C. Sullivan |
|
|
DANIEL C. SULLIVAN, Director |
|||
|
Dated: March 13, 2015 |
By: |
/s/ Allen W. West |
|
|
ALLEN W. WEST |
|||
|
Vice President-Finance, Chief Financial Officer, |
|||
|
Secretary and Treasurer |
|||
|
(principal financial and accounting officer) |
|||
EXHIBIT INDEX
The following exhibits are filed with or incorporated by reference into this Report. The exhibits which are denominated by an asterisk (*) were previously filed as a part of, and are hereby incorporated by reference from either (i) the Form S-1 Registration Statement under the Securities Act of 1933, as filed with the Securities and Exchange Commission on July 30, 1986, Registration No. 33-7618, as amended on August 8, 1986, September 3, 1986 and September 10, 1986 (“1986 S-1”); (ii) the Quarterly Report on Form 10-Q for the quarter ended June 30, 1994 (“6/30/94 10-Q”); (iii) the Quarterly Report on Form 10-Q for the quarter ended June 30, 1995 (“6/30/95 10-Q”); (iv) the Quarterly Report on Form 10-Q for the quarter ended September 30, 1996 (“9/30/96 10-Q”); (v) the Quarterly Report on Form 10-Q for the quarter ended March 31, 2002 (“3/31/02 10-Q”); (vi) the Form 8-K filed on May 31, 2006 (“5/31/06 8-K”); (vii) the Form 8-K filed on December 11, 2007 (“12/11/07 8-K”); (viii) the Annual Report on Form 10-K for the year ended December 31, 2007 (“2007 10-K”); (ix) the Form 8-K filed on July 16, 2009 (“7/16/09 8-K”); (x) Form 8-K filed on December 3, 2010 (“12/03/10 8-K”); or (xi) the Schedule 14A filed on April 23, 2014.
|
Exhibit # |
Description of Exhibit | |
|
*3.1 |
Amended and Restated Certificate of Incorporation of the Registrant (Exh. 3.1, 3/31/02 10-Q) | |
|
*3.2 |
Amended and Restated By-Laws of the Registrant (Exh. 3.2, 12/11/07 8-K) | |
|
*4.1 |
Specimen Stock Certificate (Exh. 4.1, 1986 S-1) | |
|
*4.2 |
Loan Agreement dated July 26, 1994 among First Tennessee Bank National Association, Registrant and P.A.M. Transport, Inc. together with Promissory Note (Exh. 4.1, 6/30/94 10-Q) | |
|
*4.2.1 |
Security Agreement dated July 26, 1994 between First Tennessee Bank National Association and P.A.M. Transport, Inc. (Exh. 4.2, 6/30/94 10-Q) | |
|
*4.3 |
First Amendment to Loan Agreement dated June 27, 1995 by and among P.A.M. Transport, Inc., First Tennessee Bank National Association and P.A.M. Transportation Services, Inc., together with Promissory Note in the principal amount of $2,500,000 (Exh. 4.1.1, 6/30/95 10-Q) | |
|
*4.3.1 |
First Amendment to Security Agreement dated June 28, 1995 by and between P.A.M. Transport, Inc. and First Tennessee Bank National Association (Exh. 4.2.2, 6/30/95 10-Q) | |
|
*4.3.2 |
Security Agreement dated June 27, 1995 by and between Choctaw Express, Inc. and First Tennessee Bank National Association (Exh. 4.1.3, 6/30/95 10-Q) | |
|
*4.3.3 |
Guaranty Agreement of P.A.M. Transportation Services, Inc. dated June 27, 1995 in favor of First Tennessee Bank National Association $10,000,000 line of credit (Exh. 4.1.4, 6/30/95 10-Q) | |
|
*4.4 |
Second Amendment to Loan Agreement dated July 3, 1996 by P.A.M. Transport, Inc., First Tennessee Bank National Association and P.A.M. Transportation Services, Inc., together with Promissory Note in the principal amount of $5,000,000 (Exh. 4.1.1, 9/30/96 10-Q) | |
|
*4.4.1 |
Second Amendment to Security Agreement dated July 3, 1996 by and between P.A.M. Transport, Inc. and First Tennessee National Bank Association (Exh. 4.1.2, 9/30/96 10-Q) | |
|
*4.4.2 |
First Amendment to Security Agreement dated July 3, 1996 by and between Choctaw Express, Inc. and First Tennessee Bank National Association (Exh. 4.1.3, 9/30/96 10-Q) | |
|
*4.4.3 |
Security Agreement dated July 3, 1996 by and between Allen Freight Services, Inc. and First Tennessee Bank National Association (Exh. 4.1.4, 9/30/96 10-Q) | |
|
*4.5 |
Fourth Amendment to Loan Agreement dated July 26, 1994 among First Tennessee Bank National Association, Registrant and P.A.M. Transport, Inc. together with Promissory Note (Exh. 4.6, 2007 10-K) | |
|
*10.1 |
(1) |
Employment Agreement between the Registrant and Daniel H. Cushman, dated June 29, 2009 (Exh. 10.2, 7/16/09 8-K) |
|
*10.2 |
(1) |
2006 Stock Option Plan (Exh. 10.1, 5/31/06 8-K) |
|
*10.3 |
(1) |
Form of Non-Qualified Stock Option Agreement for Non-Employee Director stock options that are granted under the 2006 Stock Option Plan (Exh. 10.2, 5/31/06 8-K) |
|
*10.4 |
(1) |
Incentive Compensation Plan (Exh. 10.3, 7/10/09 8-K) |
|
*10.5 |
(1) |
Consulting Agreement between the Registrant and Manuel J. Moroun, dated December 6, 2007 (Exh. 10.10, 2007 10-K) |
|
*10.6 |
(1) |
Form of Stock Option Agreement based on performance schedule and granted under the 2006 Stock Option Plan (Exh. 10.1, 12/03/10 8-K) |
|
*10.7 |
(1) |
Form of Stock Option Agreement granted under the 2006 Stock Option Plan (Exh. 10.2, 12/03/10 8-K) |
|
*10.8 |
(1) |
2014 Amended and Restated Stock Option and Incentive Plan (Appendix A, 4/23/14 DEF 14A) |
|
21.1 |
Subsidiaries of the Registrant | |
|
23.1 |
Consent of Grant Thornton LLP | |
|
31.1 |
Rule 13a-14(a) Certification of Principal Executive Officer | |
|
31.2 |
Rule 13a-14(a) Certification of Principal Financial Officer | |
|
32.1 |
Section 1350 Certifications of Chief Executive Officer and Chief Financial Officer | |
|
101.INS |
XBRL Instance Document | |
|
101.SCH |
XBRL Taxonomy Extension Schema Document | |
|
101.CAL |
XBRL Taxonomy Extension Calculation Linkbase Document | |
|
101.DEF |
XBRL Taxonomy Extension Definition Linkbase Document | |
|
101.LAB |
XBRL Taxonomy Extension Label Linkbase Document | |
|
101.PRE |
XBRL Taxonomy Extension Presentation Linkbase Document | |
|
(1) Management contract or compensatory plan or arrangement. | ||
- 76 -