Attached files
| file | filename |
|---|---|
| EXCEL - IDEA: XBRL DOCUMENT - DAWSON GEOPHYSICAL CO | Financial_Report.xls |
| EX-31.1 - EX-31.1 - DAWSON GEOPHYSICAL CO | a15-5087_1ex31d1.htm |
| EX-23.1 - EX-23.1 - DAWSON GEOPHYSICAL CO | a15-5087_1ex23d1.htm |
| EX-32.2 - EX-32.2 - DAWSON GEOPHYSICAL CO | a15-5087_1ex32d2.htm |
| EX-3.1 - EX-3.1 - DAWSON GEOPHYSICAL CO | a15-5087_1ex3d1.htm |
| EX-32.1 - EX-32.1 - DAWSON GEOPHYSICAL CO | a15-5087_1ex32d1.htm |
| EX-21.1 - EX-21.1 - DAWSON GEOPHYSICAL CO | a15-5087_1ex21d1.htm |
| EX-3.2 - EX-3.2 - DAWSON GEOPHYSICAL CO | a15-5087_1ex3d2.htm |
| EX-31.2 - EX-31.2 - DAWSON GEOPHYSICAL CO | a15-5087_1ex31d2.htm |
UNITED STATES
SECURITIES AND EXCHANGE COMMISSION
Washington, D.C. 20549
FORM 10-K
|
x |
ANNUAL REPORT PURSUANT TO SECTION 13 OR 15(d) OF THE SECURITIES EXCHANGE ACT OF 1934 |
For the fiscal year ended December 31, 2014
|
o |
TRANSITION REPORT PURSUANT TO SECTION 13 OR 15(d) OF THE SECURITIES EXCHANGE ACT OF 1934 |
For the transition period from to .
Commission File Number 001-32472
DAWSON GEOPHYSICAL COMPANY
(Exact name of registrant as specified in its charter)
|
Texas |
|
74-2095844 |
|
(State or other jurisdiction of incorporation or organization) |
|
(I.R.S. Employer Identification No.) |
|
|
|
|
|
508 West Wall, Suite 800, Midland, Texas |
|
79701 |
|
(Address of principal executive offices) |
|
(Zip Code) |
Registrant’s telephone number, including area code: (432) 684-3000
Securities registered pursuant to Section 12(b) of the Act:
|
Common Stock, par value $0.01 per share |
|
The NASDAQ Stock Market LLC |
|
(Title of Class) |
|
(Name of exchange on which registered) |
Securities registered pursuant to Section 12(g) of the Act: None
Indicate by check mark if the registrant is a well-known seasoned issuer, as defined in Rule 405 of the Securities Act. Yes o No x
Indicate by check mark if the registrant is not required to file reports pursuant to Section 13 or Section 15(d) of the Act. Yes o No x
Indicate by check mark whether the registrant: (1) has filed all reports required to be filed by Section 13 or 15 (d) of the Securities Exchange Act of 1934 during the preceding 12 months (or for such shorter period that the registrant was required to file such reports), and (2) has been subject to such filing requirements for the past 90 days. Yes x No o
Indicate by check mark whether the registrant has submitted electronically and posted on its corporate Website, if any, every Interactive Data File required to be submitted and posted pursuant to Rule 405 of Regulation S-T (§232.405 of this chapter) during the preceding 12 months (or for such shorter period that the registrant was required to submit and post such files). Yes x No o
Indicate by check mark if disclosure of delinquent filers pursuant to Item 405 of Regulation S-K (§229.405) is not contained herein, and will not be contained, to the best of Registrant’s knowledge, in definitive proxy or information statements incorporated by reference in Part III of this Form 10-K or any amendment to this Form 10-K. x
Indicate by check mark whether the registrant is a large accelerated filer, an accelerated filer, a non-accelerated filer, or a smaller reporting company. See the definitions of “large accelerated filer,” “accelerated filer” and “smaller reporting company” in Rule 12b-2 of the Exchange Act.
Large accelerated filer o Accelerated filer x Non-accelerated filer o Smaller reporting company o
Indicate by check mark whether the registrant is a shell company (as defined in Rule 12b-2 of the Exchange Act). Yes o No x
The aggregate market value of the voting and non-voting common equity held by non-affiliates computed by reference to the price at which the common equity was last sold as of the last business day of the Registrant’s most recently completed second fiscal quarter was $86,822,325.
Number of shares of Common Stock outstanding as of March 6, 2015: 21,692,447
Documents incorporated by reference
Listed below are documents, parts of which are incorporated herein by reference, and the part of this report into which the document is incorporated:
Proxy statement for the 2015 annual meeting of shareholders — Part III
EXPLANATORY NOTE
This report is the Annual Report on Form 10-K for the fiscal year ended December 31, 2014 of Dawson Geophysical Company, which was formerly known as TGC Industries, Inc. (“Legacy TGC”), prior to the consummation on February 11, 2015 of the strategic business combination described below.
On February 11, 2015, Legacy TGC completed its previously announced strategic business combination with Dawson Operating Company, which was formerly known as Dawson Geophysical Company (“Legacy Dawson”), pursuant to which Riptide Acquisition Corp., a wholly-owned subsidiary of Legacy TGC, merged with and into Legacy Dawson, with Legacy Dawson continuing after the merger as the surviving entity and a wholly-owned subsidiary of Legacy TGC (the “Merger”). As a result of the Merger, the former shareholders of Legacy Dawson received shares of Legacy TGC common stock representing approximately 66% of the outstanding common shares of the post-merger combined company, and Legacy TGC’s shareholders retained approximately 34% of the outstanding common shares of the post-merger combined company. In connection with the Merger, Legacy Dawson changed its name to “Dawson Operating Company” and Legacy TGC changed its name to “Dawson Geophysical Company.”
Although this Annual Report on Form 10-K is filed by post-combination Dawson Geophysical Company, except as otherwise specifically noted herein, the financial statements, other financial information and the business information set forth herein generally speak only as to Legacy TGC and its pre-combination subsidiaries, including Eagle Canada, Inc., as of and for the three years ended December 31, 2014, which period pre-dates the February 11, 2015 consummation of the strategic business combination between Legacy TGC and Legacy Dawson. This Annual Report on Form 10-K does not include the financial results of pre-combination Legacy Dawson and its subsidiaries for such periods. Accordingly, except as otherwise specifically noted herein, references herein to “Legacy TGC,” the “Company,” “we,” “us,” or “our” refer only to Legacy TGC and its pre-combination subsidiaries and not to Legacy Dawson and its pre-combination subsidiaries.
Beginning with the Quarterly Report on Form 10-Q for the quarter ending March 31, 2015, post-combination Dawson Geophysical Company will report on a consolidated basis representing the combined operations of Legacy TGC and Legacy Dawson and their respective subsidiaries. The quarter ending March 31, 2015 will be the first quarterly reporting period following the combination of Legacy TGC and Legacy Dawson, which was consummated on February 11, 2015. Because Legacy Dawson was deemed the accounting acquirer under accounting principles generally accepted in the United States, the historical financial statements of Legacy Dawson will be treated as the historical financial statements of the combined company and will be reflected in post-combination Dawson Geophysical Company’s future quarterly and annual reports.
In addition, supplemental information concerning the business and properties of post-combination Dawson Geophysical Company (representing the combined operations of Legacy TGC and Legacy Dawson and their respective subsidiaries) will be included in its Form 8-K/A to be filed on or before April 30, 2015.
PART I
Information Regarding Forward-Looking Statements
This Form 10-K includes “forward-looking statements” as defined in Section 27A of the Securities Act of 1933, as amended, and Section 21E of the Securities Exchange Act of 1934, as amended, which reflect our view with respect to future events. We base these forward-looking statements on our current expectations and projections about future events. These forward-looking statements are subject to risks, uncertainties, and assumptions about us, including:
· dependence upon energy industry spending for seismic data acquisition services;
· changes in economic conditions;
· the unpredictable nature of forecasting weather;
· the potential for contract delay or cancellation;
· the potential for fluctuations in oil and natural gas prices; and
· the availability of capital resources.
We use the words “may,” “will,” “can,” “could,” “should,” “expect,” “anticipate,” “estimate,” “believe,” “target,” “continue,” “intend,” “plan,” “budget,” and other similar words to identify forward-looking statements. You should read statements that contain these words carefully because they discuss future expectations, contain projections of results of operations or of our financial condition, and/or state other “forward-looking” information. We do not undertake any obligation to update or revise publicly any forward-looking statements, except as required by law. These statements also involve risks and uncertainties that could cause our actual results or financial condition to differ materially from our expectations in this Form 10-K.
We believe that it is important to communicate our expectations of future performance to our investors. However, events may occur in the future that we are unable to accurately predict or over which we have no control. When considering our forward-looking statements, you should keep in mind the risk factors and other cautionary statements contained in this Form 10-K and other factors noted throughout this Form 10-K. There are many risks, uncertainties, and events that may cause our actual results to differ materially from those contained in any forward-looking statement. Please read the section entitled “Risk Factors” for a discussion of certain risks of our business and an investment in our common stock.
ITEM 1. BUSINESS.
Completion of Acquisition
On February 11, 2015, pursuant to the previously announced Agreement and Plan of Merger, dated October 8, 2014 (the “Merger Agreement”), by and among the Company, Legacy Dawson and Merger Sub, Merger Sub was merged with and into Legacy Dawson, with Legacy Dawson continuing after the merger as the surviving entity and a wholly-owned subsidiary of the Company (the “Merger”). At the effective time of the Merger, without any action on the part of any shareholder, each issued and outstanding share of Legacy Dawson’s common stock, par value $0.331/3 per share (the “Legacy Dawson Common Stock”), including shares underlying Legacy Dawson’s outstanding equity awards, was converted into the right to receive 1.760 shares of common stock of the Company, par value $0.01 per share (the “Company Common Stock”), after giving effect to a 1-for-3 reverse stock split of the issued and outstanding Company Common Stock which occurred immediately prior to the Merger (the “Reverse Stock Split”). In connection with the Merger, Legacy Dawson changed its name to “Dawson Operating Company” and the Company changed its name to “Dawson Geophysical Company.” All shares and per share amounts in this Form 10-K have been retrospectively adjusted to give effect to the Reverse Stock Split.
General
At December 31, 2014 and prior to the Merger, our Company, a Texas corporation, and our wholly-owned subsidiary, Eagle Canada, Inc., a Delaware corporation, were primarily engaged in the geophysical service business of conducting three-dimensional (“3-D”) surveys for clients in the oil and gas business. Following the Merger, our Company’s principal business office is located at 508 West Wall, Suite 800, Midland, Texas 79701 (Telephone: 432-684-3000), and our internet address is www.dawson3d.com. We make available free of charge on our website our annual reports on Form 10-K, quarterly reports on Form 10-Q, and current reports on Form 8-K as soon as reasonably practicable after filing or furnishing such information with the Securities and Exchange Commission.
In April of 1980, Supreme Industries, Inc. (“Supreme”), formerly ESI Industries, Inc., formed a wholly-owned subsidiary, Tidelands Geophysical Co., Inc. (“Tidelands”) that acquired certain equipment, instruments, and related supplies from a Houston-based corporation that was engaged in the business of conducting seismic, gravity, and magnetic surveys under contracts for oil and natural gas companies. On June 30, 1986, the Boards of Directors of Supreme and Tidelands approved a spin-off of substantially all of the shares of Tidelands owned by Supreme which were distributed as a stock dividend to Supreme’s security holders. In July of 1986, our name was changed from “Tidelands Geophysical Co., Inc.” to “TGC Industries, Inc.” As described above, we completed the Merger with Legacy Dawson on February 11, 2015, and in connection with the Merger, our name was changed to “Dawson Geophysical Company.”
Overview
We are a leading provider of seismic data acquisition services throughout the continental United States and Canada. As of December 31, 2014, we operated eight seismic crews consisting of three crews in the United States and five crews in Canada. These seismic crews supply seismic data primarily to companies engaged in the exploration and development of oil and natural gas on land and in land-to-water transition areas. Seismic acquisition services of our wholly-owned subsidiary, Eagle Canada, Inc. (“Eagle Canada”) are also used by the potash mining industry in Canada, and Eagle Canada has particular expertise through its heliportable capabilities. Our customers rely on seismic data to identify areas where subsurface conditions are favorable for the accumulation of existing hydrocarbons, to optimize the development and production of hydrocarbon reservoirs, to better delineate existing oil and natural gas fields, and to augment reservoir management techniques.
We acquire geophysical data using the latest in 3-D survey techniques. We introduce acoustic energy into the ground by using vibration equipment or dynamite detonation, depending on the surface terrain and subsurface requirements. The reflected energy, or echoes, is received through geophones, converted into a digital signal at a multi-channel recording unit, and then transmitted to a central recording vehicle. Subsurface requirements dictate the number of channels necessary to perform our services. With our state-of-the-art seismic equipment, including computer technology and multiple channels, we acquire, on a cost effective basis, immense volumes of seismic data that, when processed and interpreted, produce more precise images of the earth’s subsurface. Our customers then use our seismic data to generate 3-D geologic models that help reduce finding costs and improve recovery rates from existing wells.
The operations of Legacy Dawson are substantially similar to those of our Company, except that Legacy Dawson’s historical annual revenues have been approximately twice as large as those of our Company, Legacy Dawson has in-house trucking and data processing capabilities and has had a larger presence than us in the United States, and our Company has in-house dynamite energy source drilling service capabilities and has had a larger presence than Legacy Dawson in Canada. As of December 31, 2014, Legacy Dawson employed over 1,079 persons, of which approximately 928 were engaged in providing energy sources and acquiring data, operating in the lower 48 states of the United States and Canada.
The Industry
Technological advances in seismic equipment and computing allow the seismic industry to acquire and process, on a cost-effective basis, immense volumes of seismic data which produce precise images of the earth’s subsurface. The latest accepted method of seismic data acquisition, processing, and the subsequent interpretation of the processed data is the 3-D seismic method. Geophysicists use computer workstations to interpret 3-D data volumes, identify subsurface anomalies, and generate a geologic model of subsurface features.
3-D seismic data are used in the exploration and development of new reserves and enable oil and natural gas companies to better delineate existing fields and to augment their reservoir management techniques. Benefits of incorporating high resolution 3-D seismic surveys into exploration and development programs include reducing drilling risk, decreasing oil and natural gas finding costs, and increasing the efficiencies of reservoir location, delineation, and management. In order to meet the requirements necessary to fully realize the benefits of 3-D seismic data, there is an increasing demand for improved data quality with greater subsurface resolution.
Currently, the seismic data acquisition industry is made up of a number of companies divided into two groups. The first group is made up of three publicly-traded companies with long operating histories that field numerous crews and work in a number of different regions and terrain. This group includes us, SAExploration Holdings, Inc., or SAE, and CGG (which recently sold its North American onshore seismic contract acquisition business to Geokinetics, Inc., or Geokinetics). The second group is made up of Geokinetics, Global Geophysical Services, Inc., or Global Geophysical, Tesla Exploration, Ltd., or Tesla, Breckenridge Geophysical Inc., or Breckenridge, Paragon Geophysical Services, Inc., or Paragon, LoneStar Geophysical Surveys, or LoneStar, and smaller companies which generally run one or two seismic crews and often specialize in specific regions or types of operations.
We provide our seismic data acquisition services primarily to onshore oil and natural gas exploration and development companies for use in the onshore drilling and production of oil and natural gas in the continental United States and Canada. The main factors influencing demand for seismic data acquisition services in our industry are the level of drilling activity by oil and natural gas companies and the sizes of such companies’ exploration and development budgets, which, in turn, depend largely on current and anticipated future crude oil and natural gas prices and depletion rates.
Equipment and Crews
During 2011 and 2012, an increase in the demand for seismic services allowed for an expansion of the Company’s crew count from eleven crews at December 31, 2010, to twelve crews at December 31, 2011, and to fourteen crews at December 31, 2012. Demand for seismic services softened beginning early in 2013 and remained soft throughout 2014. As a result we decreased our crew count in 2013 and ended 2013 and 2014 with eight crews.
In January of 2012, we purchased an additional 14,200 channels of GSR equipment financed by existing cash and a note payable to a commercial bank. In April of 2012, the Company purchased seven new INOVA vibration vehicles with existing cash. Also in April of 2012, the Company purchased 13,000 channels of GSR equipment financed partially with existing cash and partially by a note payable to a commercial bank. In October of 2012, we purchased 8,000 stations of 3-channel GSX wireless recording system along with all peripheral equipment. GSX wireless recording systems are the most current GSR wireless recording systems available. The purchase of the OYO Geospace GSX recording system equipment was financed partially with existing cash and partially by a note payable to a commercial bank. Beginning early in 2013, we experienced a softening in demand for seismic services and, as a result, the Company adopted a maintenance capital expenditures program curtailing large equipment purchases for the duration of the year and continuing into 2014. In September 2014, we purchased a 10,500-channel INOVA Hawk seismic data acquisition system financed with a note payable to a commercial bank. INOVA Hawk wireless recording systems are among the most current wireless recording systems available.
As of December 31, 2014, we owned equipment for 16 land-based seismic data acquisition crews and 73 vibration vehicles. Each crew consists of approximately 40 to 80 technicians with associated vehicles, geophones, a seismic recording system, energy sources, cables, and a variety of other equipment. Each ARAM crew has one central recording vehicle which captures seismic data. The GSR, GSX and INOVA Hawk crews utilize a recorder to manage the data acquisition while the individual system captures and holds the data until they are placed in the Data Transfer Module. The data is then transferred to a CD-ROM or data tape which is delivered to a data processing center selected by the customer.
In addition to the Legacy TGC equipment referenced above, as of December 31, 2014, Legacy Dawson owned approximately 157 vibrator energy source units, approximately 179,000 recording channels and sixteen central recording systems. Of the sixteen recording systems Legacy Dawson owned at December 31, 2014, seven were Geospace Technologies GSR cable-less recording systems, eight were ARAM ARIES cable-based recording systems, and one was a Wireless Seismic RT System 2 system. During the quarter ended December 31, 2014, Legacy Dawson operated eight to ten data acquisition crews. Each crew consisted of approximately forty to one hundred technicians, twenty-five or more vehicles with off-road capabilities, up to 100,000 geophones, a seismic recording system, energy sources, electronic cables and a variety of other equipment.
Capital Expenditures
We believe that it is essential to take advantage of advances in seismic technology and to commit capital to purchase and update our equipment cost-effectively. Purchasing and updating seismic equipment and technology involves a commitment to capital spending. We also tie our capital expenditures closely to demand for our services. As a result, due to the continuing softening in demand for seismic services beginning early in 2013, the Company adopted a maintenance capital expenditures program curtailing large equipment purchases for the duration of 2013 and, with the exception of the INOVA Hawk seismic data acquisition system purchase disclosed earlier, continuing through 2014. During the year ended December 31, 2014, we made capital expenditures of approximately $7,955,000, which includes the INOVA Hawk system purchase and maintenance of existing equipment. During the year ended December 31, 2013, we made capital expenditures of approximately $2,475,000, primarily to maintain existing equipment. During the year ended December 31, 2012, capital expenditures of approximately $57,108,000 were used to acquire, maintain, and replace seismic equipment and vehicles. Major purchases in 2012 included our fourth GSR System with 7,200 channels, our fifth GSR System with 7,000 channels, our sixth GSR System with 13,000 channels, some of which were added to existing systems, an 8,000 station 3-channel GSX wireless recording system, and seven new INOVA vibration vehicles. These major investments should continue to bring us the benefits of these new technologies.
Customers
Our customers are major and independent oil and natural gas exploration and development companies. The services we provide to our customers vary according to the size and needs of each customer. Our services are marketed by supervisory and executive personnel who contact customers to determine their needs and respond to customer inquiries regarding the availability of crews. Contacts are based principally upon professional relationships developed over a number of years.
During 2014, our two largest customers accounted for approximately 18% and 11% of revenues, respectively. During 2013, our largest customer accounted for approximately 12% of revenues. During 2012, our largest customer accounted for approximately 16% of revenues. At December 31, 2014 and December 31, 2013, our backlog was approximately $37 million and $52 million, respectively. We filled our 2013 backlog during fiscal 2014, and anticipate filling our 2014 backlog during fiscal year 2015. Due to our backlog and the Merger, we would not expect the loss of any single customer would have a material adverse effect on the operations of the newly combined company.
In order to avoid potential conflicts of interest with our customers, we do not participate in oil and natural gas ventures. The results of a seismic survey conducted for a customer belong to that customer. All of our customers’ information is maintained in strictest confidence.
Domestic and Foreign Operations
We derived our revenue from domestic and foreign sources. Total revenues for the year ended December 31, 2014 were approximately $118,848,000, of which $68,371,000 were earned in the United States and $50,477,000 were earned in Canada. Total revenues for the year ended December 31, 2013 were approximately $134,535,000, of which $86,519,000 were earned in the United States and $48,016,000 were earned in Canada. Total revenues for the year ended December 31, 2012 were approximately $196,317,000, of which $124,856,000 were earned in the United States and $71,461,000 were earned in Canada.
Long-lived assets as of December 31, 2014 were approximately $48,792,000, with $18,621,000 located in the United States and $30,171,000 located in Canada. Long-lived assets as of December 31, 2013 were approximately $63,107,000, with $20,148,000 located in the United States and $42,959,000 located in Canada. Long-lived assets as of December 31, 2012 were approximately $89,386,000, with $32,390,000 located in the United States and $56,996,000 located in Canada.
Contracts
Our contracts are obtained either through competitive bidding or as a result of customer negotiations. Our services are conducted under general service agreements for seismic data acquisition services which define certain obligations for us and for our customers. A supplemental agreement setting forth the terms of a specific project, which may be canceled by either party upon 30 days’ advance written notice, is entered into for every project. We currently operate under supplemental agreements that are either “turnkey” agreements providing for a fixed fee to be paid to us for each unit of data acquired or “term” agreements providing for a fixed hourly, daily, or monthly fee during the term of the project or projects.
Competition
The acquisition of seismic data for the oil and natural gas industry is a highly competitive business. Contracts for such services generally are awarded on the basis of price quotations, crew experience, and the availability of crews to perform in a timely manner, although factors other than price, such as crew safety, performance history, and technological and operational expertise, are often determinative. Our competition includes publicly traded competitors, such as CGG (which recently sold its North American onshore seismic contract acquisition business to Geokinetics) and SAE. Our other major competitors include Geokinetics, Global Geophysical, Tesla, Breckenridge, Paragon and LoneStar. In addition to these previously named companies, we also compete for projects from time to time with smaller seismic companies which operate in local markets with only one or two crews.
Employees
As of December 31, 2014, we employed a total of 745 full-time employees, of which 39 consisted of management, sales, and administrative personnel with the remainder being crew and crew support personnel. We believe our relationship with our employees to be satisfactory.
Operating Risks and Insurance
Our business is subject to the hazards inherent in conducting seismic data acquisition activities in hostile environments with dangerous machinery, and in some instances explosives. These activities can cause personal injury or loss of life, damage to or destruction of property, equipment, the environment, and marine life, and suspension of operations.
In addition, we could be subject to personal injury or real property damage claims in the normal operation of our business. Such claims may not be covered by the indemnification provisions in our general service agreements to the extent that the damage is due to our negligence or intentional misconduct.
We do not carry insurance against certain risks that we could experience such as business interruption resulting from equipment maintenance or weather delays. We obtain insurance against certain property and personal casualty risks and other risks when such insurance is available and when our management considers it advisable to do so. As of December 31, 2014, our insurance coverage consists of employers’ liability with limits of $1,000,000 per accident and $2,000,000 in the aggregate, commercial general liability of $1,000,000 per accident and $2,000,000 in the aggregate, pollution liability of $1,000,000 per accident and $2,000,000 in the aggregate, automobile liability with a $1,000,000 combined single limit, and a $20,000,000 umbrella policy. Our general service agreements require us to have specific amounts of insurance. Management believes that the Company’s insurance coverage is adequate. There can be no assurance, however, that any insurance obtained by us will be adequate to cover any losses or liabilities, or that this insurance will continue to be available or available on terms which are acceptable to us. Liabilities for which we are not insured, or which exceed the policy limits of our applicable insurance, could have a material adverse effect on us.
ITEM 1A. RISK FACTORS
Any investment in our common stock involves a high degree of risk. You should carefully consider the risks and uncertainties described below and the other information included in this Form 10-K before purchasing our common stock. Although the risks described below are the risks that we believe are material, they are not the only risks relating to our business, our industry and our common stock. Additional risks and uncertainties, including those that are not yet identified or that we currently believe are immaterial, may also adversely affect our business, financial condition or results of operations. If any of the events described below occur, our business and financial results could be materially and adversely affected. The market price of our common stock could decline due to any of these risks, perhaps significantly, and you could lose part or all of your investment. Unless the context indicates otherwise, references in this Item 1A to “we,” “us,” “our” or the “Company” when used in a historical context, refer to the Company and its consolidated subsidiaries prior to the closing of the Merger, and when used in the present tense or prospectively, refer to the combined company and its subsidiaries, including Legacy Dawson, following the Merger.
Company Risks
We may fail to realize the anticipated benefits of the Merger, which could adversely affect the value of our common stock.
The success of the Merger will depend, in part, on our ability to manage effectively the businesses of Legacy TGC and Legacy Dawson and realize the anticipated benefits from the combination of Legacy TGC and Legacy Dawson. We believe that these anticipated benefits, which include the expansion of Legacy TGC’s geographic diversity, an increase in utilization rates due to an expanded order book and the ability to enhance efficiencies because of logistical improvements, are achievable. However, it is possible that we will not be able to achieve these benefits fully, or at all, or will not be able to achieve them within the anticipated timeframe. Prior to the completion of the Merger, Legacy TGC and Legacy Dawson operated independently, and there can be no assurance that their businesses can be integrated successfully. If our expectations as to the benefits of the Merger turn out to be incorrect, or we are not able to successfully integrate the businesses of Legacy TGC and Legacy Dawson for any other reason, our financial and operating results and the value of our common stock (including the stock issued as Merger consideration) may be adversely affected.
While certain key employees of Legacy TGC and Legacy Dawson have entered into employment agreements with us that became effective at the effective time of the Merger, it is possible that the integration process could result in the loss of other key Legacy TGC or Legacy Dawson employees, as well as disrupt our ongoing business or cause inconsistencies in our standards, controls, procedures and policies. Specific issues that must be addressed in order to realize the anticipated benefits of the Merger include, among other things:
· integrating Legacy TGC’s and Legacy Dawson’s strategies, cultures and operations;
· retaining existing Legacy TGC and Legacy Dawson clients and suppliers;
· adopting best practices across the combined entity and harmonizing our operating practices, employee development and compensation programs, internal controls and other policies, procedures and processes;
· integrating Legacy TGC’s and Legacy Dawson’s corporate, administrative and information technology infrastructure; and
· managing any tax costs or inefficiencies associated with integration.
In addition, at times, the attention of certain members of our management and the resources of our company may be focused on business aspects related to the Merger and the integration of the businesses of Legacy TGC and Legacy Dawson and may be diverted from day-to-day business operations.
We may incur losses.
Legacy TGC reported net loss of approximately $9,528,000 for the year ended December 31, 2014, compared to a net loss of approximately $6,316,000 for the year ended December 31, 2013, and net income of approximately $15,672,000 for the year ended December 31, 2012. Additionally, Legacy Dawson reported a net loss of approximately $12,620,000 for its fiscal year ended September 30, 2014, compared to a net income of approximately $10,480,000 and $11,113,000 for its fiscal years ended September 30, 2013 and 2012, respectively. Legacy TGC also reported net income for 2011, net loss for 2010 and net income for 2009 and 2008, and Legacy Dawson reported net loss for its fiscal years 2011 and 2010 and net income for its fiscal years 2009 and 2008.
Our ability to be profitable in the future will depend on many factors beyond our control, but primarily on the level of demand for land-based seismic data acquisition services by oil and natural gas exploration and development companies. Even if we do achieve profitability, we may not be able to sustain or increase profitability on a quarterly or annual basis.
Our revenues and operating results can be expected to fluctuate from period to period.
Our revenues, operating results, and profitability may fluctuate from period to period. These fluctuations are attributable to the level of new business in a particular period, the timing of the initiation, progress or cancellation of significant projects, higher revenues and expenses on our dynamite contracts, and costs we incur to train new crews we may add in the future to meet increased customer demand. Fluctuations in our operating results may also be affected by other factors that are outside of our control such as permit delays, weather delays and crew productivity. Oil and natural gas prices continued to be volatile during the year ended December 31, 2014, and have resulted in significant demand fluctuations for our services. There can be no assurance of future oil and gas price levels or stability. Our operations in Canada are also seasonal as a result of the thawing season and we have historically experienced limited Canadian activity for the second and third calendar quarters of each year. The demand for our services will be adversely affected by a significant reduction in oil and natural gas prices and by climate change legislation or material changes to U.S. energy policy. Because our business has high fixed costs, the negative effect of one or more of these factors could trigger wide variations in our operating revenues, EBITDA margin, and profitability from quarter-to-quarter, which these factors render quarter-to-quarter comparisons unreliable as an indicator of performance. Due to the factors discussed above, you should not expect sequential growth in our quarterly revenues and profitability.
We face intense competition in our business from companies with greater financial resources.
The seismic data acquisition services industry is a highly competitive business in the continental U.S. and Canada. Our competitors include companies with financial resources that are significantly greater than our own as well as companies of comparable and smaller size. In addition, the barriers to entry in the seismic industry are not prohibitive, and it would not be difficult for seismic companies outside of the U.S. to enter the U.S. market and compete with us.
Our clients could delay, reduce or cancel their service contracts with us on short notice, which may lead to lower than expected demand and revenues.
Our order book reflects client commitments at levels we believe are sufficient to maintain operations on our existing crews for the indicated periods. However, our clients can delay, reduce or cancel their service contracts with us on short notice. In addition, the timing of the origination and completion of projects and when projects are awarded and contracted for is also uncertain. As a result, our order book as of any particular date may not be indicative of actual demand and revenues for any succeeding fiscal period.
Our profitability is determined, in part, by the utilization level and productivity of our crews and is affected by numerous external factors that are beyond our control.
Our revenue is determined, in part, by the contract price we receive for our services, the level of utilization of our data acquisition crews and the productivity of these crews. Crew utilization and productivity is partly a function of external factors, such as client cancellation or delay of projects, or operating delays from inclement weather, obtaining land access rights and other factors, over which we have no control. If our crews encounter operational difficulties or delays on any data acquisition survey, our results of operations may vary, and in some cases, may be adversely affected.
We are subject to Canadian foreign currency exchange rate risk.
We conduct business in Canada which subjects us to foreign currency exchange rate risk. Our results of operations and our cash flows could be impacted by changes in foreign currency exchange rates.
Capital requirements for our operations are large. If we are unable to finance these requirements, we may not be able to maintain our competitive advantage.
Seismic data acquisition and data processing technologies historically have progressed rather rapidly, and we expect this trend to continue. In order to remain competitive, we must continue to invest additional capital to maintain, upgrade and expand our seismic data acquisition capabilities. Our working capital requirements remain high, primarily due to the expansion of our infrastructure in response to client demand for cable-less recording systems and more recording channels, which has increased as the industry strives for improved data quality with greater subsurface resolution images. Our sources of working capital are limited. We have historically funded our working capital requirements with cash generated from operations, cash reserves and borrowings from commercial banks. Recently, we have funded some of our capital expenditures through equipment term loans and capital leases. In the past, we have also funded our capital expenditures and other financing needs through public equity offerings. If we were to expand our operations at a rate exceeding operating cash flow, if current demand or pricing of geophysical services were to decrease substantially or if technical advances or competitive pressures required us to acquire new equipment faster than our cash flow could sustain, additional financing could be required. If we were not able to obtain such financing or renew our existing revolving line of credit when needed, our failure could have a negative impact on our ability to pursue expansion and maintain our competitive advantage.
Technological change in our business creates risks of technological obsolescence and requirements for future capital expenditures. If we are unable to keep up with these technological advances, we may not be able to compete effectively.
Seismic data acquisition technologies historically have steadily improved and progressed, and we expect this progression to continue. Our strategy had been to upgrade our seismic data acquisition equipment on a regular basis to maintain our competitive position, however, Legacy TGC has had a maintenance capital expenditures policy in place since 2013. We are in a capital intensive industry and have limitations on our ability to obtain the financing necessary to enable us to purchase state-of-the-art equipment. Certain of our competitors may be able to purchase newer equipment when we may not be able to do so.
We rely on a limited number of key suppliers for specific seismic services and equipment.
We depend on a limited number of third parties to supply us with specific seismic services and equipment. From time to time, increased demand for seismic data acquisition services has decreased the available supply of new seismic equipment, resulting in extended delivery dates on orders of new equipment. Any delay in obtaining equipment could delay our deployment of additional crews and restrict the productivity of existing crews, adversely affecting our business and results of operation. In addition, any adverse change in the terms of our suppliers’ arrangements could affect our results of operations.
Some of our suppliers may also be our competitors. If competitive pressures were to become such that our suppliers would no longer sell to us, we would not be able to easily replace the technology with equipment that communicates effectively with our existing technology, thereby impairing our ability to conduct our business.
Inclement weather may adversely affect our ability to complete projects and could therefore adversely affect our results of operations.
Our seismic data acquisition operations could be adversely affected by inclement weather conditions. Delays associated with weather conditions could adversely affect our results of operations. For example, weather delays could affect our operations on a particular project or an entire region and could lengthen the time to complete data acquisition projects. In addition, even if we negotiate weather protection provisions in our contracts, we may not be fully compensated by our clients for the delay caused by the inclement weather.
We are dependent on our management team and key employees, and the loss of any of them could harm our business.
We have limited management depth. The result of the loss, whether by death, departure or illness, of our President and Chief Executive Officer or other senior executives could have a material adverse effect on the ability of management to continue operations at the same level of efficiency.
We extend credit to our customers without requiring collateral, and a default by a customer could have a material adverse effect on our operating revenues.
We perform ongoing credit evaluations of our customers’ financial conditions and, generally, require no collateral from our customers. It is possible that one or more of our clients will become financially distressed, which could cause them to default on their obligations to us and could reduce the client’s future need for seismic services provided by us. Our concentration of clients may also increase our overall exposure to these credit risks. A default in payment from one of our large customers could have a material adverse effect on our operating revenues for the period involved.
Certain of our core assets are pledged as collateral for short term notes and other obligations that require large monthly payments.
Certain assets that are critical to Legacy TGC’s operations, including 7,200 channels of GSR equipment acquired in 2012, two GSX Systems with a total of 13,000 channels acquired in 2012, an 8,000 station GSX system acquired in 2012 and a 10,500 channel INOVA Hawk system purchased in 2014 are pledged as collateral to commercial banks and could be subject to foreclosure in the event that we default on our indebtedness having 36 to 60 month terms. As of December 31, 2014, Legacy TGC had debt obligations covering the purchase of this equipment that require monthly payments between approximately $128,000 and $216,000. These debt obligations mature at various dates ranging from June of 2015 to September of 2017. At December 31, 2014, Legacy Dawson had three outstanding notes payable to commercial banks in the aggregate amount of $8,577,000 that were secured by a security interest in its accounts receivable, equipment and related collateral. In addition, as of December 31, 2014, Legacy Dawson had obligations of $10,227,000 with respect to 112 vehicles leased under capital leases with Enterprise Fleet Management. Any decline in our operations could inhibit our ability to make these substantial monthly payments. In view of the short terms of these notes, a failure to make the monthly payments on these notes could cause our lenders to foreclose quickly on the assets securing these notes. The foreclosure on certain of our core assets securing these notes could severely limit our ability to continue operations.
Our results of operations could be adversely affected by asset impairments.
We periodically review our portfolio of equipment and our intangible assets for impairment. In connection with the Merger, we expect to record intangibles associated with the combination of Legacy TGC and Legacy Dawson that we anticipate will be a significant asset on our consolidated balance sheet. Future events, including our financial performance, sustained decreases in oil and natural gas prices, reduced demand for our services, our market valuation or the market valuation of comparable companies, loss of a significant client’s business, failure to realize the benefits of the Merger, or strategic decisions, could cause us to conclude that impairment indicators exist and that the asset values associated with our equipment or our intangibles, if any, must be impaired. If we are forced to impair our equipment or intangibles these noncash asset impairments could negatively affect our results of operations in a material manner in the period in which they are recorded, and the larger the amount of any impairment that may be taken, the greater the impact such impairment would have on our results of operations.
We may be subject to liability claims that are not covered by our insurance.
Our business is subject to the general risks inherent in land-based seismic data acquisition activities. Our activities are often conducted in remote areas under dangerous conditions including the detonation of dynamite. These operations are subject to risks of injury to personnel and damage to equipment. Our crews are mobile, and equipment and personnel are subject to vehicular accidents. These risks could cause us to experience equipment losses, injuries to our personnel, and interruptions in our business.
In addition, we could be subject to personal injury or real property damage claims in the normal operation of our business. Such claims may not be covered under the indemnification provisions contained in our general service agreements to the extent that the damage is due to our negligence or intentional misconduct.
We do not carry insurance against certain risks that could cause losses, including business interruption resulting from equipment maintenance or weather delays. See “Item 1. Business — Operating Risks and Insurance”.
Our general service agreements require us to have specific amounts of insurance. There can be no assurance, however, that any insurance obtained by us will be adequate to cover all losses or liabilities or that this insurance will continue to be available or available on terms which are acceptable to us. Liabilities for which we are not insured, or which exceed the policy limits of our applicable insurance, could have a materially adverse effect on us.
We may be held liable for the actions of our subcontractors.
We often work as the general contractor on seismic data acquisition surveys and, consequently, engage a number of subcontractors to perform services and provide products. While we obtain contractual indemnification and insurance covering the acts of these subcontractors and require the subcontractors to obtain insurance for our benefit, we could be held liable for the actions of these subcontractors. In addition, subcontractors may cause injury to our personnel or damage to our property that is not fully covered by insurance.
We are subject to the requirements of Section 404 of the Sarbanes-Oxley Act. If we are unable to maintain compliance with Section 404, or if the costs related to maintaining compliance are significant, our profitability, stock price, and results of operations and financial condition could be materially adversely affected.
If we are unable to maintain adequate internal controls in accordance with Section 404, as such standards are amended, supplemented, or modified from time to time, we may not be able to ensure that we have effective internal controls over financial reporting on an ongoing basis in accordance with Section 404. Failure to achieve and maintain effective internal controls could have a material adverse effect on our stock price. In addition, a material weakness in the effectiveness of our internal control over financial reporting could result in an increased chance of fraud and the loss of customers, reduce our ability to obtain financing, and/or require additional expenditures to comply with these requirements, each of which could negatively impact our business, profitability, and financial condition.
Industry Risks
We derive nearly all of our revenues from companies in the oil and natural gas exploration and development industry, a historically cyclical industry, with levels of activity that are significantly affected by the levels and volatility of oil and natural gas prices.
Demand for our services depends upon the level of expenditures by oil and natural gas companies for exploration, production, development and field management activities, which depend, in part, on oil and natural gas prices. Significant fluctuations in oil and natural gas exploration activities and oil and natural gas prices have adversely affected the demand for our services and our results of operations in the past and would continue to do so if the level of such exploration activities and the prices for oil and natural gas were to decline in the future. In addition to the market prices of oil and natural gas, the willingness of our clients to explore, develop and produce depends largely upon prevailing industry conditions that are influenced by numerous factors over which our management has no control, including general economic conditions and the availability of credit. Any prolonged reduction in the overall level of exploration and development activities, whether resulting from changes in oil and natural gas prices or otherwise, could adversely impact us in many ways by negatively affecting:
· our revenues, cash flows, and profitability;
· our ability to maintain or increase our borrowing capacity;
· our ability to obtain additional capital to finance our business and the cost of that capital; and
· our ability to attract and retain skilled personnel whom we would need in the event of an upturn in the demand for our services.
Worldwide political, economic, and military events have contributed to oil and natural gas price volatility and are likely to continue to do so in the future. Depending on the market prices of oil and natural gas, oil and natural gas exploration and development companies may cancel or curtail their capital expenditure and drilling programs, thereby reducing demand for our services. Oil and natural gas prices have been highly volatile historically and, we believe, will continue to be so in the future. Many factors beyond our control affect oil and natural gas prices including:
· the cost of exploring for, producing, and delivering oil and natural gas;
· the discovery rate of new oil and natural gas reserves;
· the rate of decline of existing and new oil and natural gas reserves;
· available pipeline and other oil and natural gas transportation capacity;
· the ability of oil and natural gas companies to raise capital and debt financing;
· actions by OPEC (the Organization of Petroleum Exporting Countries);
· political instability in the Middle East and other major oil and natural gas producing regions;
· economic conditions in the United States and elsewhere;
· domestic and foreign tax policy;
· domestic and foreign energy policy including the ever increasing emphasis on alternative sources of energy;
· weather conditions in the United States and elsewhere;
· the pace adopted by foreign governments for the exploration, development, and production of their national reserves;
· the price of foreign imports of oil and natural gas;
· the overall supply and demand for oil and natural gas; and
· an economic downturn could adversely affect our revenues and cash flows if our customers and/or potential customers, become unable to pay, or must delay payment of, amounts owing to the Company because such customers are not successful in generating revenues or are precluded from securing necessary financing.
The high fixed costs of our operations could result in operating losses.
Companies within our industry are typically subject to high fixed costs which consist primarily of depreciation (a non-cash item) and maintenance expenses associated with seismic data acquisition and equipment and crew costs. In addition, ongoing maintenance capital expenditures, as well as new equipment investment, can be significant. As a result, any extended periods of significant downtime or low productivity caused by reduced demand, weather interruptions, equipment failures, permit delays, or other causes could result in operating losses.
We and our customers may be adversely affected by an economic downturn.
An economic downturn could have a material adverse effect on our financial results and proposed plan of operations and could lead to further significant fluctuations in the demand for and pricing of oil and gas. Reduced demand and pricing pressures could adversely affect the financial condition and results of operations of our customers and their ability to purchase our services. We are not able to predict the timing, extent, and duration of the economic cycles in the markets in which we operate.
Our operations are subject to delays related to obtaining land access rights of way from third parties which could affect our results of operations.
Our seismic data acquisition operations could be adversely affected by our inability to obtain timely right of way usage from both public and private land and/or mineral owners. We cannot begin surveys on property without obtaining permits from governmental entities as well as the permission of the private landowners who own the land being surveyed. In recent years, it has become more difficult, costly and time-consuming to obtain access rights of way as drilling activities have expanded into more populated areas. Additionally, while landowners generally are cooperative in granting access rights, some have become more resistant to seismic and drilling activities occurring on their property. In addition, governmental entities do not always grant permits within the time periods expected. Delays associated with obtaining such rights of way could negatively affect our results of operations.
Our business is subject to government regulation that may adversely affect our future operations.
Our operations are subject to a variety of federal, state, and provincial and local laws and regulations, including laws and regulations relating to the protection of the environment and archeological sites and those that may result from climate change legislation. Canadian operations have been historically cyclical due to governmental restrictions on seismic acquisition during certain periods. As a result, there is a risk that there will be a significant amount of unused equipment during those periods. We are required to expend financial and managerial resources to comply with such laws and related permit requirements in our operations, and we anticipate that we will continue to be required to do so in the future. Although such expenditures historically have not been material to us, the fact that such laws or regulations change frequently makes it impossible for us to predict the cost or impact of such laws and regulations on our future operations. The adoption of laws and regulations that have the effect of reducing or curtailing exploration and development activities by energy companies could also adversely affect our operations by reducing the demand for our services.
Current and future legislation or regulation relating to climate change or hydraulic fracturing could negatively affect the exploration and production of oil and gas and adversely affect demand for our services.
In response to concerns suggesting that emissions of certain gases, commonly referred to as “greenhouse gases” (GHG) (including carbon dioxide and methane) may be contributing to global climate change, legislative and regulatory measures to address the concerns are in various phases of discussion or implementation at the national and state levels. At least one-half of the states, either individually or through multi-state regional initiatives, have already taken legal measures intended to reduce GHG emissions, primarily through the planned development of GHG emission inventories and/or GHG cap and trade programs. Although various climate change legislative measures have been under consideration by the U.S. Congress, it is not possible at this time to predict whether or when Congress may act on climate change legislation. The U.S. Environmental Protection Agency (the “EPA”) has promulgated a series of rulemakings and taken other actions that the EPA states will result in the regulation of GHG as “air pollutants” under the existing federal Clean Air Act. Furthermore, in 2010, EPA regulations became effective that require monitoring and reporting of GHG emissions on an annual basis, including extensive GHG monitoring and reporting requirements. While this new rule does not control GHG emission levels from any facilities, it will cause covered facilities to incur monitoring and reporting costs. Moreover, lawsuits have been filed seeking to require individual companies to reduce GHG emissions from their operations. These and other lawsuits relating to GHG emissions may result in decisions by state and federal courts and agencies that could impact our operations.
This increasing governmental focus on global warming may result in new environmental laws or regulations that may negatively affect us, our suppliers and our clients. This could cause us to incur additional direct costs in complying with any new environmental regulations, as well as increased indirect costs resulting from our clients, suppliers or both incurring additional compliance costs that get passed on to us. Moreover, passage of climate change legislation or other federal or state legislative or regulatory initiatives that regulate or restrict emissions of GHG may curtail production and demand for fossil fuels such as oil and gas in areas where our clients operate and thus adversely affect future demand for our services. Reductions in our revenues or increases in our expenses as a result of climate control initiatives could have adverse effects on our business, financial position, results of operations and prospects.
Hydraulic fracturing is an important and commonly used process in the completion of oil and gas wells. Hydraulic fracturing involves the injection of water, sand and chemical additives under pressure into rock formations to stimulate gas production. Due to public concerns raised regarding potential impacts of hydraulic fracturing on groundwater quality, legislative and regulatory efforts at the federal level and in some states have been initiated to require or make more stringent the permitting and compliance requirements for hydraulic fracturing operations. At the federal level, a bill was introduced in Congress in March 2011 entitled, the “Fracturing Responsibility and Awareness of Chemicals Act,” or the “FRAC Act,” that would amend the federal Safe Drinking Water Act, or the “SDWA,” to repeal an exemption from regulation for hydraulic fracturing. If the FRAC Act or similar legislation in the next Congress were enacted, the definition of “underground injection” in the SDWA would be amended to encompass hydraulic fracturing activities. Such a provision could require hydraulic fracturing operations to meet permitting and financial assurance requirements, adhere to certain construction specifications, fulfill monitoring, reporting, and recordkeeping obligations and meet plugging and abandonment requirements. The FRAC Act also proposes to require the reporting and public disclosure of chemicals used in the fracturing process, which could make it easier for third parties opposing the hydraulic fracturing process to initiate legal proceedings based on allegations that specific chemicals used in the fracturing process could adversely affect groundwater. In early 2010, the EPA indicated in a website posting that it intended to regulate hydraulic fracturing under the SDWA and require permitting for any well where hydraulic fracturing was conducted with the use of diesel as an additive. While industry groups have challenged the EPA’s website posting as improper rulemaking, the Agency’s position, if upheld, could require additional permitting. In addition, the EPA has commenced a study of the potential adverse effects that hydraulic fracturing may have on water quality and public health, and a committee of the U.S. House of Representatives has commenced its own investigation into hydraulic fracturing practices. These legislative and regulatory initiatives imposing additional reporting obligations on, or otherwise limiting, the hydraulic fracturing process could make it more difficult or costly to complete natural gas wells. Shale gas cannot be economically produced without extensive fracturing. In the event such legislation is enacted, demand for our seismic acquisition services may be adversely affected.
Risks Related To Our Common Stock
Our common stock has experienced, and may continue to experience, price volatility and low trading volume.
Our stock price is subject to significant volatility. Overall market conditions, including a decline in oil and natural gas prices and other risks and uncertainties described in this “Risk Factors” section and elsewhere in this Form 10-K, could cause the market price of our common stock to fall. The high and low sales prices of our common stock for the year ended December 31, 2014, were $22.35 and $5.79, respectively, as adjusted for our 1-for-3 Reverse Stock Split on February 11, 2015.
Our common stock is listed on the Nasdaq Global Select Market under the symbol “DWSN.” However, daily trading volumes for our common stock are, and may continue to be, relatively small compared to many other publicly traded securities. For example, during 2014 our daily trading volume was as low as 2,266 shares, as adjusted for our 1-for-3 Reverse Stock Split on February 11, 2015. It may be difficult for you to sell your shares in the public market at any given time at prevailing prices, and the price of our common stock may, therefore, be volatile.
Certain provisions of our amended and restated certificate of formation may make it difficult for a third party to acquire us in the future or may adversely impact your ability to obtain a premium in connection with a future change of control transaction.
Our amended restated certificate of formation, as amended, contains provisions that require the approval of holders of 80% of our issued and outstanding shares before we may merge or consolidate with or into another corporation or entity or sell all or substantially all of our assets to another corporation or entity. Additionally, if we increase the size of our board from the current eight directors to nine directors, we could by resolution of the board of directors stagger the directors’ terms, and our directors could not be removed without approval of holders of 80% of our issued and outstanding shares. These provisions could discourage or impede a tender offer, proxy contest or other similar transaction involving control of us.
In addition, our board of directors has the right to issue preferred stock upon such terms and conditions as it deems to be in our best interest. The terms of such preferred stock may adversely impact the dividend and liquidation rights of our common shareholders without the approval of our common shareholders.
If the price of our common stock falls below $5.00 per share, it may be considered a low-priced stock and may be subject to regulations that limit or restrict the potential market for the stock.
Our common stock may be considered a low priced stock pursuant to rules promulgated under the Securities Exchange Act of 1934, as amended (the “Exchange Act”), if it falls below a price of $5.00 per share. Under these rules, broker-dealers participating in transactions in low priced securities must first deliver a risk disclosure document which describes the risks associated with such stock, the broker-dealer’s duties, the customer’s rights and remedies, and certain market and other information, and make a suitability determination approving the customer for low priced stock transactions based on the customer’s financial situation, investment experience and objectives. Broker-dealers must also disclose these restrictions in writing and provide monthly account statements to the customer, and obtain specific written consent of the customer. With these restrictions, the likely effect of designation as a low price stock would be to decrease the willingness of broker-dealers to make a market for our common stock, to decrease the liquidity of the stock and to increase the transaction costs of sales and purchase of such stocks compared to other securities. As of March 9, 2015, our common stock was quoted at a closing sales price of $5.04 per share and we cannot guarantee that our common stock will continue to trade at a price greater than $5.00 per share.
We paid our first cash dividend in 2012 but did not pay a cash dividend in 2013 or 2014 and may not pay cash dividends on our common stock in the foreseeable future, and therefore only appreciation of the price of our common stock may provide a return to shareholders.
We paid our first cash dividend in December 2012 but did not pay a cash dividend in 2013 or 2014 and may not pay cash dividends on our common stock in the foreseeable future. While there are currently no restrictions prohibiting us from paying dividends to our shareholders, it is at the discretion of the board of directors whether we pay any cash dividends on our common stock and depends on our financial condition, results of operations, capital and legal requirements and other factors deemed relevant by the board of directors. On May 14, 2013 and May 14, 2012, we paid 5% stock dividends to our shareholders. No cash or stock dividends were declared or paid in 2014.
ITEM 1B. UNRESOLVED STAFF COMMENTS.
None
ITEM 2. DESCRIPTION OF PROPERTY.
Our Houston sales office is in a 1,711-square foot facility. The monthly rent is currently $3,707. Our corporate office in Plano, Texas was increased from 8,523 square feet to 10,137 square feet of office space in March of 2012. The monthly rent is currently $15,628. We leased an 800-square foot facility in Oklahoma City, Oklahoma, as a sales office on a month-to-month basis, and the monthly rent was $665. This office was closed on October 31, 2013. In October of 2014, we leased a 1,094 foot facility in Oklahoma City, Oklahoma, as a sales office and the monthly rent is $1,550. We lease a 400-square foot facility in Pratt, Kansas, as a permit office on a month-to-month basis, and the current monthly rent is $500. In October 2012, we expanded our Denison, Texas repair warehouse facility with the addition of a third 10,000-square foot building. The Denison, Texas, facility consists of one 5,000-square foot building, three 10,000-square foot adjacent buildings, and an outdoor storage area of approximately 60,500 square feet. The monthly rent is currently $14,438. We lease a 915-square foot office facility in Midland, Texas, as a sales office with a monthly rent of $1,373. We lease 3,030 square feet of office space located in Calgary, Alberta. The monthly rent is currently $11,147. In addition, Eagle Canada leases a 7,423-square foot facility, also located in Calgary, Alberta, that is used as a shop and warehouse. The monthly rent is currently $8,681. We also lease a storage and parking area near the Eagle Canada shop and warehouse. The monthly rent is currently $4,386. The Company is not responsible for insuring these facilities. The conditions of these facilities are good, and we believe that these properties are suitable and adequate for our foreseeable needs.
In connection with the Merger, effective February 11, 2015, we transitioned our principal executive office to Legacy Dawson’s headquarters, a 34,570 square foot leased property in Midland, Texas, which we acquired in the Merger. The monthly rent is currently $40,332. We also acquired a 61,402 square foot property in Midland, Texas that we own that is used as a field office, equipment and fabrication facility and maintenance and repair shop. We are in the process of consolidating a number of our sales offices.
ITEM 3. LEGAL PROCEEDINGS.
On December 22, 2014, Legacy Dawson received a letter dated December 18, 2014 from legal counsel for a purported shareholder of Legacy Dawson demanding that the Legacy Dawson board of directors prior to the Merger (the “Legacy Dawson Board”) take appropriate legal action against the members of the Legacy Dawson Board. The letter alleges conflicts of interest on the part of certain officers and directors of Legacy Dawson in connection with the Merger, Legacy Dawson disclosure deficiencies with respect to the Merger and the negotiations leading to the merger agreement and breaches of fiduciary duties by such persons in connection with such matters. The letter also demanded that Legacy Dawson make various corrective disclosures concerning the Merger.
On January 7, 2015, Andrew Speese, through his attorney, filed a purported shareholder class action and derivative suit on behalf of himself and Legacy Dawson’s other shareholders in the United States District Court for the Western District of Texas (Midland/Odessa Division), against the Company, Legacy Dawson, the members of the Legacy Dawson Board and Merger Sub. The lawsuit alleges, among other things, that the Legacy Dawson Board breached their fiduciary duties to the Legacy Dawson shareholders in connection with the strategic business combination with us, and that our registration statement dated November 6, 2014, as subsequently amended, and our prospectus filed on December 31, 2014, contain material omissions and materially misleading statements. The complaint sought to enjoin the Company, Legacy Dawson and Merger Sub from taking any actions that would allow the consummation of the strategic business combination contemplated by the Merger Agreement, or, now that the strategic business combination is consummated, a judgment for damages.
In addition, on January 8, 2015, Legacy Dawson received a letter dated January 7, 2015 from legal counsel for Andrew Speese with respect to the lawsuit described above demanding that the Legacy Dawson Board take legal action to remedy alleged breaches of fiduciary duties in connection with the strategic business combination and to recover damages caused by such alleged breaches.
The Legacy Dawson Board formed a Special Litigation Committee, which committee is authorized to retain independent legal counsel, to investigate the claims in the demand letters described above and to determine whether any of the derivative claims should be pursued. That committee is continuing to function following the consummation of the Merger.
We have filed a motion to dismiss the class action claims and we intend to vigorously defend against each of the actions described above.
The Company is a defendant in various other legal actions that arose or may arise out of the normal course of business. In our opinion, none of these actions has or will result in any significant loss to us.
ITEM 4. MINE SAFETY DISCLOSURES.
None.
PART II
ITEM 5. MARKET FOR REGISTRANT’S COMMON EQUITY, RELATED STOCKHOLDER MATTERS, AND ISSUER PURCHASES OF EQUITY SECURITIES.
Market Prices
On April 18, 2005, we began trading on the NYSE Amex (formerly the American Stock Exchange) (“AMEX”) under the trading symbol “TGE,” and on November 6, 2007, our stock began trading on NASDAQ under the symbol “TGE.” As a result of the Merger, our common stock ceased to trade under the symbol “TGE” at the close of market on February 11, 2015. On February 12, 2015, our stock began trading on a combined company basis under the symbol “DWSN.”
The following table shows the high and low sales prices reported for our common stock on NASDAQ during 2014 and 2013, as adjusted for the 1-for-3 Reverse Stock Split effected February 11, 2015. On December 27, 2012, the Company paid its first cash dividend of $0.45 per common share to shareholders of record at the close of business on December 17, 2012. The Company did not pay a cash dividend in 2013 or 2014. On May 14, 2013 and on May 14, 2012 the Company paid 5% stock dividends to shareholders of record at the close of business on April 30, 2013 and April 30, 2012, respectively. No cash or stock dividends were declared or paid in 2014. All prior share and per share amounts have been restated to reflect the stock dividends.
|
|
|
2014 |
|
2013 |
| ||||||||
|
|
|
High |
|
Low |
|
High |
|
Low |
| ||||
|
|
|
|
|
|
|
|
|
|
| ||||
|
1st quarter |
|
$ |
22.35 |
|
$ |
16.98 |
|
$ |
31.29 |
|
$ |
24.15 |
|
|
2nd quarter |
|
18.36 |
|
12.72 |
|
29.88 |
|
23.16 |
| ||||
|
3rd quarter |
|
17.28 |
|
11.07 |
|
30.03 |
|
22.50 |
| ||||
|
4th quarter |
|
11.76 |
|
5.79 |
|
24.90 |
|
18.93 |
| ||||
The number of shareholders of record of our common stock as of March 6, 2015 was approximately 273. Due to the number of shares held in nominee or street name, we believe that there are a significantly greater number of beneficial owners of our common stock. On March 9, 2015 our common stock was quoted at a closing sales price of $5.04.
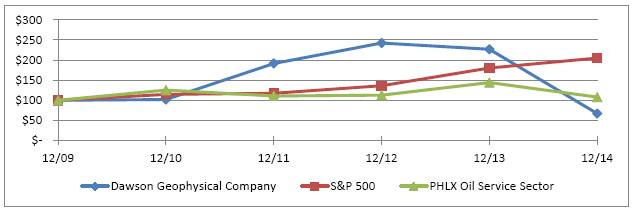
Performance Graph
The following graph is not “soliciting material,” is not deemed filed with the Securities and Exchange Commission, and is not to be incorporated by reference into any of the Company’s filings under the Securities Act of 1933, as amended, or the Securities Exchange Act of 1934, as amended, respectively.
The following graph sets forth the five-year cumulative total shareholder return, which assumes reinvestment of dividends, of a $100 investment beginning in our common stock, a peer group made up of companies in the Philadelphia Oil Service Sector Index, and the S&P 500 Stock Index. The Philadelphia Oil Service Sector Index consists of far larger companies that provide a variety of services as compared to the land-based geophysical services provided by the Company.
Indexed Total Return
12/31/2009 — 12/31/2014
ITEM 6. SELECTED FINANCIAL DATA.
The following selected financial data should be read in conjunction with Item 7, “Management’s Discussion and Analysis of Financial Condition and Results of Operations,” and the Company’s financial statements and notes thereto included in Item 8, “Financial Statements and Supplementary Data.” A cash dividend of $0.45 per common share was declared and paid in December 2012. No cash dividends were declared in any of the remaining four years shown below:
|
|
|
Year Ended December 31, |
| |||||||||||||
|
|
|
2014 |
|
2013 |
|
2012 |
|
2011 |
|
2010 |
| |||||
|
|
|
(In thousands, except per share amounts) |
| |||||||||||||
|
Statement of Income Data: |
|
|
|
|
|
|
|
|
|
|
| |||||
|
|
|
|
|
|
|
|
|
|
|
|
| |||||
|
Revenues |
|
$ |
118,848 |
|
$ |
134,535 |
|
$ |
196,317 |
|
$ |
151,029 |
|
$ |
108,319 |
|
|
|
|
|
|
|
|
|
|
|
|
|
| |||||
|
Net income (loss) |
|
$ |
(9,528 |
) |
$ |
(6,316 |
) |
$ |
15,672 |
|
$ |
10,833 |
|
$ |
(1,223 |
) |
|
|
|
|
|
|
|
|
|
|
|
|
| |||||
|
Net Income (loss) per common share - basic |
|
$ |
(1.30 |
) |
$ |
(0.87 |
) |
$ |
2.19 |
|
$ |
1.53 |
|
$ |
(0.18 |
) |
|
|
|
|
|
|
|
|
|
|
|
|
| |||||
|
Net Income (loss) per common share - diluted |
|
$ |
(1.30 |
) |
$ |
(0.87 |
) |
$ |
2.15 |
|
$ |
1.51 |
|
$ |
(0.18 |
) |
|
|
|
|
|
|
|
|
|
|
|
|
| |||||
|
Weighted average number of common shares outstanding - basic |
|
7,322 |
|
7,281 |
|
7,171 |
|
7,072 |
|
7,056 |
| |||||
|
|
|
|
|
|
|
|
|
|
|
|
| |||||
|
Weighted average number of common shares outstanding - diluted |
|
7,322 |
|
7,281 |
|
7,299 |
|
7,183 |
|
7,056 |
| |||||
|
|
|
|
|
|
|
|
|
|
|
|
| |||||
|
Total assets |
|
$ |
85,122 |
|
$ |
98,302 |
|
$ |
142,028 |
|
$ |
99,881 |
|
$ |
87,615 |
|
|
|
|
|
|
|
|
|
|
|
|
|
| |||||
|
Long-term debt, less current maturities |
|
$ |
5,642 |
|
$ |
7,385 |
|
$ |
16,298 |
|
$ |
6,956 |
|
$ |
6,021 |
|
|
|
|
|
|
|
|
|
|
|
|
|
| |||||
|
Shareholders’ equity |
|
$ |
57,062 |
|
$ |
69,131 |
|
$ |
77,986 |
|
$ |
63,720 |
|
$ |
52,863 |
|
|
|
|
|
|
|
|
|
|
|
|
|
| |||||
|
Cash dividends declared per common share |
|
$ |
— |
|
$ |
— |
|
$ |
0.45 |
|
$ |
— |
|
$ |
— |
|
ITEM 7. MANAGEMENT’S DISCUSSION AND ANALYSIS OF FINANCIAL CONDITION AND RESULTS OF OPERATION.
The following discussion and analysis should be read in conjunction with our financial statements and related notes thereto included elsewhere in this Form 10-K. Portions of this document that are not statements of historical or current fact are forward-looking statements that involve risk and uncertainties, such as statements of our plans, objectives, expectations, and intentions. The cautionary statements made in this Form 10-K should be read as applying to all related forward-looking statements wherever they appear in this Form 10-K. Our actual results could differ materially from those anticipated in the forward-looking statements. Factors that could cause our actual results to differ materially from those anticipated include those discussed in “Business,” “Information Regarding Forward-Looking Statements,” and “Risk Factors.”
Material Transaction
On February 11, 2015, Dawson Geophysical Company, which was formerly known as TGC Industries, Inc. (“Legacy TGC” or the “Company”), completed its previously announced strategic business combination with Dawson Operating Company, which was formerly known as Dawson Geophysical Company (“Legacy Dawson”), pursuant to which Riptide Acquisition Corp., a wholly-owned subsidiary of Legacy TGC, merged with and into Legacy Dawson, with Legacy Dawson continuing after the merger as the surviving entity and a wholly-owned subsidiary of Legacy TGC (the “Merger”). As a result of the Merger, the former shareholders of Legacy Dawson received shares of Legacy TGC common stock representing approximately 66% of the outstanding common shares of the post-merger combined company, and Legacy TGC’s shareholders retained approximately 34% of the outstanding common shares of the post-merger combined company. In connection with the Merger, Legacy Dawson changed its name to “Dawson Operating Company” and Legacy TGC changed its name to “Dawson Geophysical Company.”
This Item 7 discusses the financial condition and results of operations of the Company as of and for the year ended December 31, 2014, excluding Legacy Dawson except as otherwise specifically noted herein. Where appropriate, however, management has included a discussion regarding how it believes the Merger may impact various aspects of the combined company’s future financial condition and/or results of operations. Unless the context indicates otherwise, all references in this Item 7 to “Legacy TGC,” the “Company,” “we,” “us,” or “our” refer to the Company and its subsidiaries other than Legacy Dawson and its subsidiaries.
Executive Overview
We are a leading provider of seismic data acquisition services throughout the continental United States and Canada. We supply seismic data to companies engaged in the exploration and development of oil and natural gas on land and in land-to-water transition areas. Our customers rely on seismic data to identify areas where subsurface conditions are favorable for the accumulation of existing hydrocarbons, to optimize the development and production of hydrocarbon reservoirs, to better delineate existing oil and natural gas fields, and to augment reservoir management techniques.
We acquire geophysical data using the latest in 3-D survey techniques. We introduce acoustic energy into the ground by using vibration equipment or dynamite detonation, depending on the surface terrain and subsurface requirements. The reflected energy, or echoes, is received through geophones, converted into a digital signal at a multi-channel recording unit, and then transmitted to a central recording vehicle. Subsurface requirements dictate the number of channels necessary to perform our services. With our state-of-the-art seismic equipment, including computer technology and multiple channels, we acquire, on a cost-effective basis, immense volumes of seismic data that when processed and interpreted produce more precise images of the earth’s subsurface. Our customers then use our seismic data to generate 3-D geologic models that help reduce finding costs and improve recovery rates from existing wells.
Currently, the seismic data acquisition industry is made up of a number of companies divided into two groups. The first group is made up of three publicly-traded companies with long operating histories that field numerous crews and work in a number of different regions and terrain. This group includes us, SAExploration Holdings, Inc., or SAE, and CGG (which recently sold its North American onshore seismic contract acquisition business to Geokinetics, Inc., or Geokinetics). The second group is made up of Geokinetics, Global Geophysical Services, Inc., or Global Geophysical, Tesla Exploration, Ltd., or Tesla, Breckenridge Geophysical Inc., or Breckenridge, Paragon Geophysical Services, Inc., or Paragon, LoneStar Geophysical Surveys, or LoneStar, and smaller companies which generally run one or two seismic crews and often specialize in specific regions or types of operations.
We provide our seismic data acquisition services primarily to onshore oil and natural gas exploration and development companies for use in the onshore drilling and production of oil and natural gas in the continental United States and Canada. The main factors influencing demand for seismic data acquisition services in our industry are the level of drilling activity by oil and natural gas companies and the sizes of such companies’ exploration and development budgets, which, in turn, depend largely on current and anticipated future crude oil and natural gas prices and depletion rates.
Our customers are major and independent oil and natural gas exploration and development companies. The services we provide to our customers vary according to the size and needs of each customer. Our services are marketed by supervisory and executive personnel who contact customers to determine their needs and respond to customer inquiries regarding the availability of crews. Contacts are based principally upon professional relationships developed over a number of years.
The acquisition of seismic data for the oil and natural gas industry is a highly competitive business. Contracts for such services generally are awarded on the basis of price quotations, crew experience, and the availability of crews to perform in a timely manner, although factors other than price, such as crew safety, performance history, and technological and operational expertise, are often determinative. Our competition includes publicly traded competitors, such as CGG (which recently sold its North American onshore seismic contract acquisition business to Geokinetics) and SAE. Our other major competitors include Geokinetics, Global Geophysical, Tesla, Breckenridge, Paragon and LoneStar. In addition to these previously named companies, we also compete for projects from time to time with smaller seismic companies which operate in local markets with only one or two crews.
Results of Operations
Year Ended December 31, 2014, Compared to Year Ended December 31, 2013
Revenues. Our revenues were $118,847,754 for the year ended December 31, 2014, compared to $134,534,540 for the same period of 2013, a decrease of 11.7%. This decrease was primarily due to the softening in the seismic market that began in early 2013, our operation of fewer crews in the United States and Canada during the twelve months ended December 31, 2014 compared to the same period of 2013, and the adverse winter weather conditions in parts of the United States and Canada during the first quarter of 2014. We operated four crews in the United States during the first and second quarters of 2014, added one crew during the third quarter ended September 30, 2014, and idled two crews during the fourth quarter, ending the quarter with three crews in the United States for the quarter ended December 31, 2014. In Canada, we operated six crews for most of this year’s first quarter and ended the first quarter with four crews. By late-April, all Canadian crews had been shut down following the end of the winter season. We added one crew in Canada in the beginning of June for summer work, but that crew worked intermittently during the third quarter. During the fourth quarter we added crews in Canada for the winter season, ending the quarter with five crews. This compares with our operation of nine crews in the United States and six crews in Canada during the first quarter of 2013. We began the second quarter of 2013 with eight crews operating in the United States and ended the quarter with two crews, and began the third quarter of 2013 with three crews operating in the United States and ended the quarter with five crews. In Canada, we began the second quarter of 2013 operating six crews and ended the quarter operating two crews. In the third quarter of 2013, we operated three crews in Canada for short term work at the beginning of the quarter but had no crews operating in Canada by the end of the quarter. We started and ended the fourth quarter of 2013 operating three crews in Canada.
Cost of services. Our cost of services was $101,582,377 for the year ended December 31, 2014, compared to $107,675,356 for the same period of 2013, a decrease of 5.7%. As a percentage of revenues, cost of services was 85.5% for the year ended December 31, 2014, compared to 80.0% for the same period of 2013. This decrease in cost of services was primarily attributable to our operation of fewer crews in the United States and Canada as discussed above. The decrease was partially offset by costs incurred due to adverse winter weather conditions in parts of the United States and Canada during the first quarter of this year and an increase in shot-hole work, which carries higher costs and lower margins than vibroseis work, in the United States during the third quarter.
Selling, general, and administrative expenses. SG&A expenses were $11,660,137 for the year ended December 31, 2014, compared to $9,593,068 for the same period of 2013, an increase of 21.5%. This increase was primarily attributable to transaction costs of $1,760,919 incurred with respect to the Merger. SG&A expense as a percentage of revenues was 9.8% for the year ended December 31, 2014, and 7.1% for the year ended December 31, 2013.
Depreciation and amortization expense. Depreciation and amortization expense was $19,152,286 for the year ended December 31, 2014, compared to $24,644,190 for the same period of 2013, a decrease of 22.3%. This decrease was primarily attributable to our maintenance capital expenditures policy adopted early in the first quarter of 2013. Depreciation and amortization expense as a percentage of revenues was 16.1% for the year ended December 31, 2014, compared to 18.3% for the same period of 2013.
Loss from operations. Loss from operations was $13,547,046 for the year ended December 31, 2014, compared to loss from operations of $7,378,074 for the year ended December 31, 2013. This loss increase was primarily attributable to a decrease in revenues from fielding fewer crews in the United States and Canada and an increase, as a percentage of revenues, in cost of services and SG&A expenses. EBITDA decreased $11,660,876 to $5,605,240 for the year ended December 31, 2014, from $17,266,116 for the same period of 2013, a decrease of 67.5%. This decrease was a result of the factors discussed above. For a definition of EBITDA, a reconciliation of EBITDA to net loss and a discussion of EBITDA, please refer to the section entitled “EBITDA” found below.
Interest expense. Interest expense was $677,718 for the year ended December 31, 2014, compared to $1,091,476 for the same period of 2013, a decrease of 37.9%. This decrease was primarily attributable to our pay off of three notes payable for purchases of seismic acquisition equipment during 2013 and 2014.
Income tax benefit. Income tax benefit was $4,696,434 for the year ended December 31, 2014, compared to $2,153,509 for the same period of 2013. The income tax benefit for the year ended December 31, 2014, at a rate of 33.0%, and the income tax benefit for the year ended December 31, 2013 were due primarily to our losses before income taxes. See Note H of Notes to Financial Statements.
Year Ended December 31, 2013, Compared to Year Ended December 31, 2012
Revenues. Our revenues were $134,534,540 for the year ended December 31, 2013, compared to $196,317,215 for the same period of 2012, a decrease of 31.5%. Revenues for the 12 months ended December 31, 2013 decreased due to the softening in the seismic market that began early in 2013, our operation of fewer crews in the U.S. and Canada during the second, third, and fourth quarters of 2013 as compared to the same period of 2012, and severe weather conditions in many or our key markets in the U.S. and Canada during the fourth quarter of 2013. In 2013 in the U.S., we operated nine crews in the first quarter, began the second quarter operating nine crews and ended the second quarter operating two crews. We started the third quarter with three crews and ended the quarter operating five crews which we continued operating during the fourth quarter of 2013. In Canada, we operated six crews in the first quarter of 2013, began the second quarter operating six crews, and ended the quarter operating two crews. We operated no crews in Canada during the third quarter of 2013 and started and ended the fourth quarter operating three crews. This compares to 2012 when we operated eight seismic crews in the U.S. during the first and second quarters, added a ninth crew in the third quarter, and continued operating nine crews during the fourth quarter of 2012. We operated seven seismic crews in Canada during the first quarter, two crews during the second quarter, the equivalent of 1.5 crews during the third quarter, and five crews during the fourth quarter of 2012.
Cost of services. Our cost of services was $107,675,356 for the year ended December 31, 2013, compared to $135,279,937 for the same period of 2012, a decrease of 20.4%. This decrease is attributable to operating fewer crews. When a crew is shut down, several key crew members continue as paid employees of the Company (to retain their skill sets), and the majority of the crew is laid off without pay. As a percentage of revenues, cost of services was 80.0% for the year ended December 31, 2013, and 68.9% for the year ended December 31, 2012. This increase was primarily attributable to costs we incurred as we idled several crews in the U.S. in the second and third quarters due to the softening in the seismic market, adverse weather conditions in the U.S. and Canada, an increase in higher cost shot-hole work, and land permitting issues in Canada in the fourth quarter of 2013.
Selling, general, and administrative expenses. SG&A expenses were $9,593,068 for the year ended December 31, 2013, compared to $8,755,270 for the same period of 2012, an increase of 9.6%. This increase was primarily attributable to personnel additions and an increase in share-based compensation expense. SG&A expense as a percentage of revenues was 7.1% for the year ended December 31, 2013, and 4.5% for the year ended December 31, 2012, reflecting the decrease in revenues in 2013.
Depreciation and amortization expense. Depreciation and amortization expense was $24,644,190 for the year ended December 31, 2013, compared to $25,502,597 for the same period of 2012, a decrease of 3.4%. This decrease was primarily attributable to our maintenance capital expenditures policy adopted early in the first quarter of 2013. Depreciation and amortization expense as a percentage of revenues was 18.3% for the year ended December 31, 2013, compared to 13.0% for the same period of 2012 reflecting the decline in revenues in 2013.
Income (loss) from operations. Loss from operations was $7,378,074 for the year ended December 31, 2013, compared to income from operations of $26,779,411 for the year ended December 31, 2012. The decrease was attributable to idling of several crews in the U.S. in the second and third quarters of 2013 due to the softening in the seismic market, adverse weather conditions in the U.S. and Canada, an increase in shot-hole work which carries higher costs and lower margins than vibroseis work and land permitting issues in Canada in the fourth quarter of 2013.
EBITDA decreased $35,015,892 to $17,266,116 for the 12 months ended December 31, 2013, from $52,282,008 for the same period of 2012, a decrease of 67.0%. This decrease was primarily a result of our net loss of $6,316,041 for 2013 compared to net income of $15,671,879 for the same period in 2012, and related decrease in income tax expense. For a definition of EBITDA, a reconciliation of EBITDA to net income, and a discussion of EBITDA, refer to the section entitled “EBITDA” found below.
Interest expense. Interest expense was $1,091,476 for the year ended December 31, 2013, compared to $1,222,454 for the same period of 2012, a decrease of 10.7%. This decrease was primarily attributable to our pay off in 2013 of three notes payable incurred for the purchase of seismic equipment.
Income tax (benefit) expense. Income tax benefit was $2,153,509 for the year ended December 31, 2013, compared to income tax expense of $9,885,078 for the same period of 2012. This decrease was attributable to the net loss in 2013 as compared to net income in 2012. Income tax benefit for the year ended December 31, 2013 reflects the impact of state taxes, net of federal benefit, and permanent tax differences, including share based compensation. See Note H of Notes to Financial Statements.
EBITDA
EBITDA is a non-GAAP financial measure that we define as net income (loss) plus interest expense, income tax expense (benefit), and depreciation and amortization expense. We use EBITDA as a supplemental financial measure to assess:
· the financial performance of our assets without regard to financing methods, capital structures, taxes, or historical cost basis;
· our liquidity and operating performance over time and in relation to other companies that own similar assets and that we believe calculate EBITDA in a manner similar to us; and
· the ability of our assets to generate cash sufficient for us to pay potential interest expenses.
We also understand that such data is used by investors to assess our performance. However, EBITDA is not a measure of operating income, operating performance, or liquidity presented in accordance with U.S. Generally Accepted Accounting Principles (“GAAP”). When assessing our operating performance or our liquidity, you should not consider this data in isolation or as a substitute for our net income, cash flow from operating activities, or other cash flow data calculated in accordance with GAAP. EBITDA excludes some, but not all, items that affect net income and operating income, and these measures may vary among other companies. Therefore, EBITDA as presented below may not be comparable to similarly titled measures of other companies. Further, the results presented by EBITDA cannot be achieved without incurring the costs that the measure excludes: interest, taxes, depreciation, and amortization.
The following table reconciles our EBITDA to our net income (loss):
|
|
|
Year Ended |
| |||||||
|
|
|
2014 |
|
2013 |
|
2012 |
| |||
|
Net income (loss) |
|
$ |
(9,528,330 |
) |
$ |
(6,316,041 |
) |
$ |
15,671,879 |
|
|
Depreciation and amortization expense |
|
19,152,286 |
|
24,644,190 |
|
25,502,597 |
| |||
|
Interest expense |
|
677,718 |
|
1,091,476 |
|
1,222,454 |
| |||
|
Income tax expense (benefit) |
|
(4,696,434 |
) |
(2,153,509 |
) |
9,885,078 |
| |||
|
EBITDA |
|
$ |
5,605,240 |
|
$ |
17,266,116 |
|
$ |
52,282,008 |
|
Liquidity and Capital Resources
Liquidity
Cash flows from operating activities.
Net cash provided by operating activities was $9,255,375 for the year ended December 31, 2014, compared to $22,969,342 for the same period of 2013. The $13,713,967 decrease was principally attributable to a higher net loss, decreases in depreciation expense and prepaid federal and state income taxes, which were partially offset by increases in trade accounts receivable, trade accounts payable, and billings in excess of cost and estimated earnings on uncompleted contracts.
Working capital decreased $5,226,142 to $12,482,021 as of December 31, 2014, from the December 31, 2013 working capital of $17,708,163. This decrease was primarily due to decreases of $4,767,223 in cash, $3,909,198 in prepaid federal and state income taxes, increases of $3,666,450 in trade accounts payable and $3,797,882 in billings in excess of cost and estimated earnings on uncompleted contracts, partially offset by a $8,828,351 increase in trade accounts receivable and a $1,137,929 decrease in current maturities of notes payable.
Cash flows used in investing activities.
Net cash used in investing activities was $963,976 for the year ended December 31, 2014, and $667,498 for the year ended December 31, 2013. This $296,478 increase was due to a decrease in proceeds from the sale of property and equipment of $765,761 partially offset by a decrease in capital expenditures of $469,283.
Cash flows used in financing activities.
Net cash used in financing activities was $13,039,683 for the year ended December 31, 2014, and $14,996,672 for the year ended December 31, 2013. The $1,956,989 decrease was due primarily to a decrease in principal payments on notes payable of $1,684,600 and $533,286 in principal payments on capital lease obligations.
Capital expenditures.
During the year ended December 31, 2014, we acquired $7,954,973 of vehicles and equipment including the purchase in September 2014 of a 10,500-channel INOVA Hawk seismic data acquisition system and replacing and purchasing additional vehicles and equipment. We financed these acquisitions by using a $6,096,173 note payable to a commercial bank to finance the INOVA Hawk system disclosed above, $1,379,395 of cash on hand and by incurring $479,405 in capital lease obligations from a vehicle leasing company. We do not budget for our capital expenditures. Early during the year ended December 31, 2013 we adopted a maintenance capital expenditures program and incurred capital expenditures of $2,474,865, primarily to maintain existing equipment. During the year ended December 31, 2012, capital expenditures of $57,107,732 were used to acquire seismic equipment and vehicles, replace similar equipment and vehicles, and to purchase our fourth and fifth GSR systems consisting of a total of 14,200 channels and related equipment, our sixth GSR system with 13,000 channels, our first next-generation 3-channel GSX system with 8,000 stations, and seven new INOVA vibration vehicles. Cash of $31,970,418, notes of $22,201,800 from a commercial bank, and capital lease obligations from a vehicle leasing company of $2,935,514 were used to finance these acquisitions. This major investment has allowed us to benefit from new technology while primarily remaining in a maintenance capital expenditures policy since 2013.
Capital Resources
Historically, we have relied on cash generated from operations, short-term borrowings from commercial banks and equipment lenders, and loans from directors to fund our working capital requirements and capital expenditures.
The Company has a revolving line of credit agreement with a commercial bank. The borrowing limit under the revolving line of credit agreement is $5,000,000 and was renewed on September 16, 2013, and again on September 16, 2014. The revolving line of credit agreement expires on September 16, 2015. Our obligations under this agreement are secured by a security interest in our accounts receivable. Interest on the outstanding amount under the line of credit loan agreement is payable monthly at the greater of the prime rate of interest or five percent. As of December 31, 2014, and since its inception, we have had no borrowings outstanding under the line of credit loan agreement.
At December 31, 2014, the Company had four outstanding notes payable to commercial banks for equipment purchases. The notes have interest rates between 3.50% and 4.60%, are due in monthly installments between $128,363 and $215,863 plus interest, have a total outstanding balance of $12,072,454, and are collateralized by equipment. One note payable with an interest rate of 4.50% and monthly payments of $187,934 including interest was paid off in 2014. Three notes payable with interest rates between 5.00% and 6.35% and monthly payments between $50,170 and $82,950 plus interest were paid off in 2013. These notes were collateralized by equipment.
At December 31, 2014, Legacy Dawson had three outstanding notes payable to commercial banks for equipment purchases. Legacy Dawson’s obligations under the notes are secured by a security interest in its accounts receivable, equipment and related collateral. Interest on one of the notes, with a total outstanding balance of $1,435,000 as of December 31, 2014, accrues at an annual rate equal to either the 30-day London Interbank Offered Rate, plus two and one-quarter percent, or the Prime Rate, minus three-quarters percent, as Legacy Dawson directs monthly, subject to an interest rate floor of 3.75%. Interest on the other two notes, with a total outstanding balance of $7,142,000 as of December 31, 2014, accrues at an annual fixed rate between 3.16% and 3.84%. In addition, as of December 31, 2014, Legacy Dawson had obligations of $10,227,000 with respect to 112 vehicles leased under capital leases with Enterprise Fleet Management.
The Company had, at December 31, 2014, two outstanding notes payable to finance companies for corporate insurance. The notes have interest rates between 4.09% and 4.95%, are due in monthly installments between $14,674 and $326,366 including interest, and have a total outstanding balance of $449,308.
Our Houston sales office is in a 1,711-square foot facility. The monthly rent is currently $3,707. Our corporate office in Plano, Texas was increased from 8,523 square feet to 10,137 square feet of office space in March of 2012. The monthly rent is currently $15,628. We leased an 800-square foot facility in Oklahoma City, Oklahoma, as a sales office on a month-to-month basis, and the monthly rent was $665. This office was closed on October 31, 2013. In October of 2014, we leased a 1,094 foot facility in Oklahoma City, Oklahoma, as a sales office and the monthly rent is $1,550. We lease a 400-square foot facility in Pratt, Kansas, as a permit office on a month-to-month basis, and the current monthly rent is $500. In October of 2012, we expanded our Denison, Texas repair warehouse facility with the addition of a third 10,000-square foot building. The Denison, Texas, facility consists of one 5,000-square foot building, three 10,000-square foot adjacent buildings, and an outdoor storage area of approximately 60,500 square feet. The monthly rent is currently $14,438. We lease a 915-square foot office facility in Midland, Texas, as a sales office with a monthly rent of $1,373. We lease 3,030 square feet of office space located in Calgary, Alberta. The monthly rent is currently $11,147. In addition, Eagle Canada leases a 7,423-square foot facility, also located in Calgary, Alberta, that is used as a shop and warehouse. The monthly rent is currently $8,681. We also lease a storage and parking area near the Eagle Canada shop and warehouse. The monthly rent is currently $4,386. The Company is not responsible for insuring these facilities. The conditions of these facilities are good, and we believe that these properties are suitable and adequate for our foreseeable needs.
In connection with the Merger, effective February 11, 2015, we transitioned our principal executive office to Legacy Dawson’s headquarters, a 34,570 square foot leased property in Midland, Texas, which we acquired in the Merger. The monthly rent is currently $40,332. We also acquired a 61,402 square foot property in Midland, Texas that we own that is used as a field office, equipment and fabrication facility and maintenance and repair shop. We are in the process of consolidating a number of our sales offices.
Contractual Obligations
The following table summarizes payments due in specific periods related to our contractual obligations as of December 31, 2014:
|
|
|
Payments Due by Period |
| |||||||||||||
|
|
|
|
|
Within |
|
|
|
|
|
After |
| |||||
|
Contractual Obligations (1) |
|
Total |
|
1 Year |
|
1-2 Years |
|
3-5 Years |
|
5 Years |
| |||||
|
|
|
(In thousands) |
|
|
|
|
|
|
|
|
| |||||
|
Operating lease obligations |
|
$ |
2,720 |
|
$ |
1,145 |
|
$ |
1,076 |
|
$ |
499 |
|
$ |
— |
|
|
Debt obligations |
|
$ |
12,522 |
|
$ |
7,297 |
|
$ |
3,573 |
|
$ |
1,652 |
|
$ |
— |
|
|
Capital lease obligations |
|
$ |
1,216 |
|
$ |
799 |
|
$ |
275 |
|
$ |
142 |
|
$ |
— |
|
|
Total |
|
$ |
16,458 |
|
$ |
9,241 |
|
$ |
4,924 |
|
$ |
2,293 |
|
$ |
— |
|
(1) The contractual obligations described in the table above are solely those of Legacy TGC as of December 31, 2014. Legacy Dawson also had outstanding contractual obligations as of such date, certain of which are described elsewhere in this Item 7.
We believe that our capital resources, including our short-term investments, funds available under our line of credit loan agreement, and cash flow from operations, are adequate to meet our current operational needs. Although we anticipate that our capital expenditures will increase as a result of the Merger, we believe that we will be able to finance our 2015 capital expenditures through cash flow from our and Legacy Dawson’s operations, borrowings from commercial lenders, the funds available under our and Legacy Dawson’s line of credit loan agreement. However, our ability to satisfy working capital requirements, meet debt repayment obligations, and fund future capital requirements will depend principally upon our future operating performance which is subject to the risks inherent in our business.
Off-Balance Sheet Arrangements
As of December 31, 2014, we had no off-balance sheet arrangements.
Critical Accounting Policies
The preparation of our financial statements in conformity with GAAP requires us to make certain assumptions and estimates that affect the reported amounts of assets and liabilities at the date of our financial statements and the reported amounts of revenues and expenses during the reporting period. Because of the use of assumptions and estimates inherent in the reporting process, actual results could differ from those estimates.
Revenue Recognition
Seismic Surveys
The Company provides seismic data acquisition survey services to its customers under general service agreements which define certain obligations for the Company and for its customers. We typically enter into a supplemental agreement setting forth the terms of each project, which may be canceled by either party upon 30 days’ advance written notice. These supplemental agreements are either “turnkey” agreements providing for a fixed fee to be paid for each unit of seismic data acquired or “term” agreements providing for a fixed hourly, daily, or monthly fee during the term of the project. Under both types of agreements, the Company recognizes revenues when services have been performed and revenue is realizable. Services are defined as the commencement of data acquisition. Revenues are deemed realizable when earned according to the terms of the contracts. Under turnkey agreements, the total number of units of seismic data to be gathered is set forth in the agreement. Revenue under turnkey agreements is recognized on a per unit of seismic data acquired rate as services are performed. Revenue under term agreements is recognized on a per unit of time worked rate as services are performed based on the time worked rate provided in the term agreement. In the event of a canceled contract, revenue is recognized and the client is billed for services performed to the date of contract cancellation. When it becomes evident that the estimates of total costs to be incurred on a contract will exceed the total estimates of revenue to be earned, an estimated loss is recognized in the period in which the loss is identifiable. The asset “Cost and estimated earnings in excess of billings on uncompleted contracts” represents cost incurred on turnkey agreements in excess of billings on those agreements. The liability “Billings in excess of costs and estimated earnings on uncompleted contracts” represents billings on turnkey agreements in excess of cost on those agreements.
Accumulated Other Comprehensive Income
Comprehensive income is a measure of income which includes both net income and other comprehensive income or loss. Other comprehensive income or loss results from items deferred from recognition in the statement of earnings, which consists solely of foreign currency translation adjustments. Accumulated other comprehensive income (loss) is presented on the Company’s consolidated balance sheet as a part of shareholder’s equity. In addition, the Company reports comprehensive income and its components in a separate statement of comprehensive income.
Foreign currency translation income or loss represents changes in foreign currency rates used to translate the assets, liabilities, revenues and expenses of the Company’s international subsidiary from the local currency. These changes in foreign currency rates may never be realized or may only be partially realized upon the ultimate disposition, if any, of the international subsidiary. The Company’s foreign investment is considered permanent in nature as there are no plans in the foreseeable future for divestiture.
Business Combinations
We allocate the purchase price of acquired companies to the tangible assets acquired, liabilities assumed, and intangible assets acquired, based on their estimated fair values. The excess of the purchase price over these fair values is recorded as goodwill. We engage independent third-party appraisal firms to assist us in determining the fair values of assets acquired and liabilities assumed. Such valuations require management to make significant estimates and assumptions.
Allowance for Doubtful Accounts
We prepare our allowance for doubtful accounts receivable based on our past experience of historical write-offs, our current customer base, and our review of past due accounts. The inherent volatility of the energy industry’s business cycle can cause swift and unpredictable changes in the financial stability of our customers. In 2014, an allowance of $557,867 was deemed necessary. In 2013, and 2012, no allowances were necessary.
Impairment of Long-lived Assets
We review long-lived assets for impairment when triggering events occur suggesting deterioration in the assets’ recoverability or fair value. Recognition of an impairment charge is required if future expected net cash flows are insufficient to recover the carrying value of the asset. Our forecast of future cash flows used to perform impairment analysis includes estimates of future revenues and profitability based on our historical results and analysis of future oil and natural gas prices which are fundamental to assessing demand for our services. If we are unable to achieve these cash flows, our estimates will be revised which could result in an impairment charge for the period of revision.
Depreciable Lives of Property, Plant, and Equipment
Our property, plant, and equipment are capitalized at historical cost and depreciated over the useful life of the asset. Our estimate of this useful life is based on circumstances that exist in the seismic industry and information available at the time of the purchase of the asset. The technology of the equipment used to gather data in the seismic industry has historically evolved such that obsolescence does not occur quickly. As circumstances change and new information becomes available, these estimates could change. We amortize these capitalized items using the straight-line method. Capital assets are depreciated over their useful lives ranging from one to seven years, depending on the classification of the asset.
Tax Accounting
We account for our income taxes in accordance with the recognition of amounts of taxes payable or refundable for the current year and an asset and liability approach in recognizing the amount of deferred tax liabilities and assets for the future tax consequences of events that have been recognized in our financial statements or tax returns. We determine deferred taxes by identifying the types and amounts of existing temporary differences, measuring the total deferred tax asset or liability using the applicable tax rate, and reducing the deferred tax asset by a valuation allowance if, based on available evidence, it is more likely than not that some portion or all of the deferred tax assets will not be realized. Our methodology for recording income taxes requires judgment regarding assumptions and the use of estimates, including determining our annual effective tax rate and the valuation of deferred tax assets, which can create a variance between actual results and estimates and could have a material impact on our provision or benefit for income taxes.
Share-Based Compensation
We recognize the fair value of the stock-based compensation awards, including stock options and restricted stock, as wages in the consolidated statements of earnings on a straight-line basis over the vesting period of the related stock options or restricted stock awards. This has resulted in the recognition of compensation expense, relative to stock-based awards, in wages in the consolidated statements of earnings of approximately $689,000 or approximately $0.09 per share for the year ended December 31, 2014, and $973,000 or approximately $0.13 per share for the year ended December 31, 2013.
Shares of restricted stock were issued to employees of the Company under the 2006 Stock Awards Plan as follows: 6,000 in August of 2007; 3,333 in June of 2008; 1,666 in July of 2009; 1,666 in May of 2010; 8,443 in November of 2011; 7,173 in December of 2011; 2,000 in January of 2012; 71,041 in August of 2012; 2,000 in February of 2013, and 5,000 shares in January 2014. In June of 2013, 15,000 shares were rescinded from the August 2012 grant, and 10,000 shares were issued in their place. In addition, stock options were issued to employees of the Company under the 2006 Stock Awards Plan as follows: 111,666 in October of 2008; 45,000 in November of 2009; 5,000 in November of 2011, and 118,333 in July of 2014. No incentive stock options were granted to employees in 2010, 2012, or 2013. As of December 31, 2014, there was approximately $353,000 of unrecognized compensation expense related to our share-based compensation plan.
Recently Issued Accounting Pronouncements
In July 2013, the Financial Accounting Standards Board (“FASB”) issued Accounting Standards Update (“ASU”) No. 2013-11, Income Taxes (Topic 740) - Presentation of an Unrecognized Tax Benefit When a Net Operating Loss Carryforward, a Similar Tax Loss, or a Tax Credit Carryforward Exists (“ASU 2013-11”). ASU 2013-11 clarifies the balance sheet presentation of an unrecognized tax benefit and was issued to resolve the diversity in practice that had developed in the absence any specific U.S. generally accepted accounting principles (“U.S. GAAP”). ASU 2013-11 is applicable to all entities that have an unrecognized tax benefit due to a net operating loss carryforward, a similar tax loss, of a tax credit carryforward. The ASU is effective for fiscal years, and interim periods within those years, beginning after December 15, 2013, and does not create any new disclosure requirements. The Company adopted ASU 2013-11 on January 1, 2014, and it did not have a significant effect on its consolidated financial statements.
In May 2014, the FASB issued ASU No. 2014-09, Revenue (Topic 606) - Revenue from Contracts with Customers (“ASU 2014-09”). ASU 2014-09 supersedes nearly all existing revenue recognition guidance under U.S. GAAP and establishes a comprehensive revenue recognition standard for virtually all industries, including those that previously followed industry-specific guidance. The revenue standard’s core principle is built on the contract between a vendor and a customer for the provision of goods and services. It attempts to depict the exchange of rights and obligations between the parties in the pattern of revenue recognition based on the consideration to which the vendor is entitled. Three basic transition methods are available—full retrospective, retrospective with certain practical expedients, and a cumulative effect approach. Under the third alternative, an entity would apply the new revenue standard only to contracts that are incomplete under legacy U.S. GAAP at the date of initial application (i.e., January 1, 2017) and recognize the cumulative effect of the new standard as an adjustment to the opening balance of retained earnings. That is, prior years would not be restated and additional disclosures would be required to enable users of the financial statements to understand the impact of adopting the new standard in the current year compared to prior years that are presented under legacy U.S. GAAP. ASU 2014-09 is effective for annual periods beginning after December 15, 2016, including interim periods therein. Early adoption is prohibited. The Company will adopt ASU 2014-09 on January 1, 2017. The Company will begin evaluating the impact of our pending adoption of ASU 2014-09 on our consolidated financial statements and has not yet determined the method by which it will adopt the standard in 2017.
In August 2014, the FASB issued ASU No. 2014-15, Presentation of Financial Statements - Going Concern (Subtopic 205-40) (“ASU 2014-15”). ASU 2014-15 provides guidance on management’s responsibility to evaluate whether there is substantial doubt about an entity’s ability to continue as a going concern and in certain circumstances to provide related footnote disclosures. ASU 2014-15 is effective for the annual period ending after December 15, 2016, and for annual and interim periods thereafter. Early adoption is permitted. The Company is currently evaluating the new guidance, however it does not expect any impact on its consolidated financial statements.
Effect of Inflation
We do not believe that inflation has had a material effect on our business, results of operations, or financial condition during the past three years.
ITEM 7A. QUANTITATIVE AND QUALITATIVE DISCLOSURES ABOUT MARKET RISK
We have not entered into any hedging agreements or swap agreements. Our principal market risk is the risk related to the concentration of our customers in the oil and natural gas industry. Since our customers are involved in the oil and natural gas industry, there may be a positive or a negative effect on our exposure to credit risk in that our customers may be similarly affected by changes in economic and industry conditions. For the year ended December 31, 2014, our largest two customers accounted for approximately 18% and 11% of revenues. For the year ended December 31, 2013, our largest customer accounted for approximately 12% of revenues. For the year ended December 31, 2012, our largest customer accounted for approximately 16% of revenues.
We are exposed to foreign currency exchange risk, primarily through our operations in Canada. Certain transactions in Canada are exposed to economic losses in the event of adverse changes in the currency exchange rate. If the Canadian Dollar appreciates with respect to the U.S. Dollar, our costs in Canada may increase. Currently, we do not use derivative financial instruments to offset the risk of foreign currency.
For further information see “Item 7. Management’s Discussion and Analysis of Financial Condition and Results of Operations,” and “Item 1A. Risk Factors.”
ITEM 8. FINANCIAL STATEMENTS AND SUPPLEMENTARY DATA.
Consolidated Financial Statements
December 31, 2014, 2013, and 2012
CONTENTS
|
29 | |
|
|
|
|
30 | |
|
|
|
|
Consolidated Financial Statements |
|
|
|
|
|
31 | |
|
|
|
|
33 | |
|
|
|
|
34 | |
|
|
|
|
35 | |
|
|
|
|
36 | |
|
|
|
|
37 |
Report of Independent Registered Public Accounting Firm
Board of Directors and Shareholders
Dawson Geophysical Company (formerly known as TGC Industries, Inc.) and Subsidiaries
We have audited the accompanying consolidated balance sheets of Dawson Geophysical Company and Subsidiaries (the “Company”) as of December 31, 2014 and 2013, and the related consolidated statements of operations, comprehensive income (loss), shareholders’ equity, and cash flows for each of the years in the three-year period ended December 31, 2014. The Company’s management is responsible for these consolidated financial statements. Our responsibility is to express an opinion on these consolidated financial statements based on our audits.
We conducted our audits in accordance with the standards of the Public Company Accounting Oversight Board (United States). Those standards require that we plan and perform the audit to obtain reasonable assurance about whether the consolidated financial statements are free of material misstatement. An audit includes examining, on a test basis, evidence supporting the amounts and disclosures in the consolidated financial statements. An audit also includes assessing the accounting principles used and significant estimates made by management, as well as evaluating the overall financial statement presentation. We believe that our audits provide a reasonable basis for our opinion.
In our opinion, the consolidated financial statements referred to above present fairly, in all material respects, the consolidated financial position of Dawson Geophysical Company and Subsidiaries as of December 31, 2014 and 2013, and the consolidated results of their operations and their cash flows for each of the years in the three-year period ended December 31, 2014 in conformity with accounting principles generally accepted in the United States of America.
We also have audited, in accordance with the standards of the Public Company Accounting Oversight Board (United States), Dawson Geophysical Company and Subsidiaries’ internal control over financial reporting as of December 31, 2014, based on criteria established in Internal Control-Integrated Framework (2013) issued by the Committee of Sponsoring Organizations of the Treadway Commission (COSO), and our report dated March 16, 2015 expressed an unqualified opinion on the effectiveness of the Company’s internal control over financial reporting.
/s/ LANE GORMAN TRUBITT, PLLC
Dallas, Texas
March 16, 2015
Report of Independent Registered Public Accounting Firm
Board of Directors and Shareholders
Dawson Geophysical Company (formerly known as TGC Industries, Inc.) and Subsidiaries
We have audited Dawson Geophysical Company and Subsidiaries’ (the “Company”) internal control over financial reporting as of December 31, 2014, based on criteria established in Internal Control—Integrated Framework (2013) issued by the Committee of Sponsoring Organizations of the Treadway Commission (COSO). The Company’s management is responsible for maintaining effective internal control over financial reporting, and for its assessment of the effectiveness of internal control over financial reporting, included in the accompanying Management’s Report on Internal Control over Financial Reporting. Our responsibility is to express an opinion on the Company’s internal control over financial reporting based on our audit.
We conducted our audit in accordance with the standards of the Public Company Accounting Oversight Board (United States). Those standards require that we plan and perform the audit to obtain reasonable assurance about whether effective internal control over financial reporting was maintained in all material respects. Our audit of internal control over financial reporting included obtaining an understanding of internal control over financial reporting, assessing the risk that a material weakness exists, and testing and evaluating the design and operating effectiveness of internal control based on the assessed risk. Our audit also included performing such other procedures as we considered necessary in the circumstances. We believe that our audit provides a reasonable basis for our opinion.
A company’s internal control over financial reporting is a process designed to provide reasonable assurance regarding the reliability of financial reporting and the preparation of financial statements for external purposes in accordance with generally accepted accounting principles. A company’s internal control over financial reporting includes those policies and procedures that (1) pertain to the maintenance of records that (1) pertain to the maintenance of records that, in reasonable detail, accurately and fairly reflect the transactions and dispositions of the assets of the company; (2) provide reasonable assurance that transactions are recorded as necessary to permit preparation of financial statements in accordance with generally accepted accounting principles, and that receipts and expenditures of the company are being made only in accordance with authorizations of management and directors of the company; and (3) provide reasonable assurance regarding prevention or timely detection of unauthorized acquisition, use, or disposition of the company’s assets that could have a material effect on the financial statements.
Because of its inherent limitations, internal control over financial reporting may not prevent or detect misstatements. Also, projections of any evaluation of effectiveness to future periods are subject to the risk that controls may become inadequate because of changes in conditions, or that the degree of compliance with the policies or procedures may deteriorate.
In our opinion, Dawson Geophysical Company and Subsidiaries maintained, in all material respects, effective internal control over financial reporting as of December 31, 2014, based on criteria established in Internal Control—Integrated Framework (2013) issued by the Committee of Sponsoring Organizations of the Treadway Commission (COSO).
We have also audited, in accordance with the standards of the Public Company Accounting Oversight Board (United States), the consolidated balance sheets of Dawson Geophysical Company and Subsidiaries as of December 31, 2014 and 2013, and the related consolidated statements of operations, comprehensive income (loss), shareholders’ equity and cash flows for each of the years in the three-year period ended December 31, 2014 and our report dated March 16, 2015 expressed an unqualified opinion on those consolidated financial statements.
/s/ LANE GORMAN TRUBITT, PLLC
Dallas, Texas
March 16, 2015
TGC Industries, Inc. and Subsidiaries
December 31,
|
|
|
2014 |
|
2013 |
| ||
|
ASSETS |
|
|
|
|
| ||
|
|
|
|
|
|
| ||
|
CURRENT ASSETS |
|
|
|
|
| ||
|
|
|
|
|
|
| ||
|
Cash and cash equivalents |
|
$ |
11,363,151 |
|
$ |
16,130,374 |
|
|
Trade accounts receivable, net of allowance for doubtful accounts of $557,867 and $0 in each period, respectively |
|
19,570,763 |
|
10,742,412 |
| ||
|
Cost and estimated earnings in excess of billings on uncompleted contracts |
|
2,039,894 |
|
2,312,947 |
| ||
|
Prepaid expenses and other |
|
1,926,630 |
|
1,808,411 |
| ||
|
Prepaid federal and state income tax |
|
— |
|
3,909,198 |
| ||
|
|
|
|
|
|
| ||
|
Total current assets |
|
34,900,438 |
|
34,903,342 |
| ||
|
|
|
|
|
|
| ||
|
PROPERTY AND EQUIPMENT - at cost |
|
|
|
|
| ||
|
|
|
|
|
|
| ||
|
Machinery and equipment |
|
185,461,746 |
|
185,405,886 |
| ||
|
Automobiles and trucks |
|
13,280,760 |
|
14,272,341 |
| ||
|
Furniture and fixtures |
|
481,866 |
|
486,700 |
| ||
|
Leasehold improvements |
|
14,994 |
|
14,994 |
| ||
|
|
|
199,239,366 |
|
200,179,921 |
| ||
|
Less accumulated depreciation and amortization |
|
(150,447,400 |
) |
(137,072,725 |
) | ||
|
|
|
48,791,966 |
|
63,107,196 |
| ||
|
|
|
|
|
|
| ||
|
LONG-TERM DEFERRED TAX ASSETS |
|
1,154,500 |
|
— |
| ||
|
|
|
|
|
|
| ||
|
Goodwill |
|
201,530 |
|
201,530 |
| ||
|
Other assets |
|
73,900 |
|
89,470 |
| ||
|
|
|
275,430 |
|
291,000 |
| ||
|
|
|
|
|
|
| ||
|
Total assets |
|
$ |
85,122,334 |
|
$ |
98,301,538 |
|
The accompanying notes are an integral part of these statements.
TGC Industries, Inc. and Subsidiaries
CONSOLIDATED BALANCE SHEETS — Continued
December 31,
|
|
|
2014 |
|
2013 |
| ||
|
|
|
|
|
|
| ||
|
LIABILITIES AND SHAREHOLDERS’ EQUITY |
|
|
|
|
| ||
|
|
|
|
|
|
| ||
|
CURRENT LIABILITIES |
|
|
|
|
| ||
|
|
|
|
|
|
| ||
|
Trade accounts payable |
|
$ |
7,764,269 |
|
$ |
4,097,819 |
|
|
Accrued liabilities |
|
1,715,507 |
|
2,585,993 |
| ||
|
Billings in excess of costs and estimated earnings on uncompleted contracts |
|
4,451,102 |
|
653,220 |
| ||
|
Federal and state income taxes payable |
|
391,579 |
|
— |
| ||
|
Current maturities of notes payable |
|
7,296,950 |
|
8,434,879 |
| ||
|
Current portion of capital lease obligations |
|
799,010 |
|
1,423,268 |
| ||
|
|
|
|
|
|
| ||
|
Total current liabilities |
|
22,418,417 |
|
17,195,179 |
| ||
|
|
|
|
|
|
| ||
|
NOTES PAYABLE, less current maturities |
|
5,224,812 |
|
6,483,112 |
| ||
|
|
|
|
|
|
| ||
|
CAPITAL LEASE OBLIGATIONS, less current portion |
|
417,369 |
|
901,707 |
| ||
|
|
|
|
|
|
| ||
|
LONG-TERM DEFERRED TAX LIABILITY |
|
— |
|
4,590,739 |
| ||
|
|
|
|
|
|
| ||
|
SHAREHOLDERS’ EQUITY |
|
|
|
|
| ||
|
|
|
|
|
|
| ||
|
Preferred stock, $1.00 par value; 4,000,000 shares authorized; issued - none |
|
— |
|
— |
| ||
|
|
|
|
|
|
| ||
|
Common stock, $0.01 par value; 35,000,000 shares authorized; 7,380,780 and 7,363,374 shares issued and outstanding in each period, respectively |
|
73,808 |
|
73,634 |
| ||
|
|
|
|
|
|
| ||
|
Additional paid-in capital |
|
32,498,425 |
|
31,655,929 |
| ||
|
|
|
|
|
|
| ||
|
Retained earnings |
|
32,229,185 |
|
41,757,515 |
| ||
|
|
|
|
|
|
| ||
|
Treasury stock, at cost; 48,445 shares in each period |
|
(1,251,099 |
) |
(1,251,099 |
) | ||
|
|
|
|
|
|
| ||
|
Accumulated other comprehensive income (loss) - foreign currency translation adjustments |
|
(6,488,583 |
) |
(3,105,178 |
) | ||
|
|
|
57,061,736 |
|
69,130,801 |
| ||
|
|
|
|
|
|
| ||
|
Total liabilities and shareholders’ equity |
|
$ |
85,122,334 |
|
$ |
98,301,538 |
|
The accompanying notes are an integral part of these statements
TGC Industries, Inc. and Subsidiaries
CONSOLIDATED STATEMENTS OF OPERATIONS
Years Ended December 31,
|
|
|
2014 |
|
2013 |
|
2012 |
| |||
|
|
|
|
|
|
|
|
| |||
|
Revenue |
|
$ |
118,847,754 |
|
$ |
134,534,540 |
|
$ |
196,317,215 |
|
|
|
|
|
|
|
|
|
| |||
|
Cost and expenses |
|
|
|
|
|
|
| |||
|
Cost of services |
|
101,582,377 |
|
107,675,356 |
|
135,279,937 |
| |||
|
Selling, general and administrative |
|
11,660,137 |
|
9,593,068 |
|
8,755,270 |
| |||
|
Depreciation and amortization expense |
|
19,152,286 |
|
24,644,190 |
|
25,502,597 |
| |||
|
|
|
132,394,800 |
|
141,912,614 |
|
169,537,804 |
| |||
|
|
|
|
|
|
|
|
| |||
|
Income (loss) from operations |
|
(13,547,046 |
) |
(7,378,074 |
) |
26,779,411 |
| |||
|
|
|
|
|
|
|
|
| |||
|
Interest expense |
|
677,718 |
|
1,091,476 |
|
1,222,454 |
| |||
|
|
|
|
|
|
|
|
| |||
|
Income (loss) before income taxes |
|
(14,224,764 |
) |
(8,469,550 |
) |
25,556,957 |
| |||
|
|
|
|
|
|
|
|
| |||
|
Income tax expense (benefit): |
|
|
|
|
|
|
| |||
|
Current |
|
1,048,805 |
|
1,155,204 |
|
9,525,543 |
| |||
|
Deferred |
|
(5,745,239 |
) |
(3,308,713 |
) |
359,535 |
| |||
|
Income tax expense (benefit): |
|
(4,696,434 |
) |
(2,153,509 |
) |
9,885,078 |
| |||
|
|
|
|
|
|
|
|
| |||
|
Net income (loss) |
|
$ |
(9,528,330 |
) |
$ |
(6,316,041 |
) |
$ |
15,671,879 |
|
|
|
|
|
|
|
|
|
| |||
|
Net income (loss) per common share: |
|
|
|
|
|
|
| |||
|
|
|
|
|
|
|
|
| |||
|
Basic |
|
$ |
(1.30 |
) |
$ |
(0.87 |
) |
$ |
2.19 |
|
|
Diluted |
|
$ |
(1.30 |
) |
$ |
(0.87 |
) |
$ |
2.15 |
|
|
|
|
|
|
|
|
|
| |||
|
Weighted average number of shares outstanding: |
|
|
|
|
|
|
| |||
|
|
|
|
|
|
|
|
| |||
|
Basic |
|
7,322,358 |
|
7,280,527 |
|
7,171,212 |
| |||
|
Diluted |
|
7,322,358 |
|
7,280,527 |
|
7,299,458 |
| |||
The accompanying notes are an integral part of these statements
TGC Industries, Inc. and Subsidiaries
Consolidated Statements of Comprehensive Income (Loss)
Years Ended December 31,
|
|
|
2014 |
|
2013 |
|
2012 |
| |||
|
|
|
|
|
|
|
|
| |||
|
Net income (loss) |
|
$ |
(9,528,330 |
) |
$ |
(6,316,041 |
) |
$ |
15,671,879 |
|
|
|
|
|
|
|
|
|
| |||
|
Other comprehensive income (loss): |
|
|
|
|
|
|
| |||
|
Unrealized gain (loss) on foreign currency translation adjustments |
|
(3,383,405 |
) |
(3,926,881 |
) |
714,576 |
| |||
|
|
|
|
|
|
|
|
| |||
|
Comprehensive income (loss) |
|
$ |
(12,911,735 |
) |
$ |
(10,242,922 |
) |
$ |
16,386,455 |
|
The accompanying notes are an integral part of these statements
TGC Industries, Inc. and Subsidiaries
CONSOLIDATED STATEMENTS OF SHAREHOLDERS’ EQUITY
|
|
|
|
|
|
|
|
|
|
|
|
|
Accumulated |
|
|
| ||||||
|
|
|
|
|
|
|
Additional |
|
|
|
|
|
Other |
|
|
| ||||||
|
|
|
Common Stock |
|
Paid-in |
|
Retained |
|
Treasury |
|
Comprehensive |
|
|
| ||||||||
|
|
|
Shares |
|
Amount |
|
Capital |
|
Earnings |
|
Stock |
|
Income (Loss) |
|
Total |
| ||||||
|
|
|
|
|
|
|
|
|
|
|
|
|
|
|
|
| ||||||
|
Balances at December 31, 2011 |
|
6,449,478 |
|
$ |
64,495 |
|
$ |
28,305,911 |
|
$ |
35,499,541 |
|
$ |
(257,394 |
) |
$ |
107,127 |
|
$ |
63,719,680 |
|
|
5% common stock dividend |
|
323,997 |
|
3,240 |
|
(4,390 |
) |
— |
|
— |
|
— |
|
(1,150 |
) | ||||||
|
Cash dividend |
|
— |
|
— |
|
— |
|
(3,097,864 |
) |
— |
|
— |
|
(3,097,864 |
) | ||||||
|
Issuance of restricted common stock |
|
73,041 |
|
730 |
|
(730 |
) |
— |
|
— |
|
— |
|
— |
| ||||||
|
Exercise of stock options |
|
64,316 |
|
643 |
|
810,352 |
|
— |
|
(433,615 |
) |
— |
|
377,380 |
| ||||||
|
Amortization of unearned compensation restricted stock awards |
|
— |
|
— |
|
317,110 |
|
— |
|
— |
|
— |
|
317,110 |
| ||||||
|
Amortization of compensation cost of unvested stock options |
|
— |
|
— |
|
283,950 |
|
— |
|
— |
|
— |
|
283,950 |
| ||||||
|
Foreign currency translation adjustments |
|
— |
|
— |
|
— |
|
— |
|
— |
|
714,576 |
|
714,576 |
| ||||||
|
Net income |
|
— |
|
— |
|
— |
|
15,671,879 |
|
— |
|
— |
|
15,671,879 |
| ||||||
|
Balances at December 31, 2012 |
|
6,910,832 |
|
69,108 |
|
29,712,203 |
|
48,073,556 |
|
(691,009 |
) |
821,703 |
|
77,985,561 |
| ||||||
|
5% common stock dividend |
|
346,075 |
|
3,461 |
|
(4,400 |
) |
— |
|
— |
|
— |
|
(939 |
) | ||||||
|
Issuance (rescindment) of restricted common stock |
|
(3,000 |
) |
(30 |
) |
273,097 |
|
— |
|
— |
|
— |
|
273,067 |
| ||||||
|
Exercise of stock options |
|
109,467 |
|
1,095 |
|
975,385 |
|
— |
|
(560,090 |
) |
— |
|
416,390 |
| ||||||
|
Amortization of unearned compensation restricted stock awards |
|
— |
|
— |
|
492,692 |
|
— |
|
— |
|
— |
|
492,692 |
| ||||||
|
Amortization of compensation cost of unvested stock options |
|
— |
|
— |
|
206,952 |
|
— |
|
— |
|
— |
|
206,952 |
| ||||||
|
Foreign currency translation adjustments |
|
— |
|
— |
|
— |
|
— |
|
— |
|
(3,926,881 |
) |
(3,926,881 |
) | ||||||
|
Net income (loss) |
|
— |
|
— |
|
— |
|
(6,316,041 |
) |
— |
|
— |
|
(6,316,041 |
) | ||||||
|
Balances at December 31, 2013 |
|
7,363,374 |
|
73,634 |
|
31,655,929 |
|
41,757,515 |
|
(1,251,099 |
) |
(3,105,178 |
) |
69,130,801 |
| ||||||
|
Issuance of restricted common stock, net of retirements |
|
2,753 |
|
28 |
|
70,768 |
|
— |
|
— |
|
— |
|
70,796 |
| ||||||
|
Forfeiture of stock options |
|
— |
|
— |
|
(622 |
) |
— |
|
— |
|
— |
|
(622 |
) | ||||||
|
Exercise of stock options |
|
14,653 |
|
146 |
|
154,408 |
|
— |
|
— |
|
— |
|
154,554 |
| ||||||
|
Amortization of unearned compensation restricted stock awards |
|
— |
|
— |
|
358,678 |
|
— |
|
— |
|
— |
|
358,678 |
| ||||||
|
Amortization of compensation cost of unvested stock options |
|
— |
|
— |
|
259,264 |
|
— |
|
— |
|
— |
|
259,264 |
| ||||||
|
Foreign currency translation adjustments |
|
— |
|
— |
|
— |
|
— |
|
— |
|
(3,383,405 |
) |
(3,383,405 |
) | ||||||
|
Net income (loss) |
|
— |
|
— |
|
— |
|
(9,528,330 |
) |
— |
|
— |
|
(9,528,330 |
) | ||||||
|
Balances at December 31, 2014 |
|
7,380,780 |
|
$ |
73,808 |
|
$ |
32,498,425 |
|
$ |
32,229,185 |
|
$ |
(1,251,099 |
) |
$ |
(6,488,583 |
) |
$ |
57,061,736 |
|
The accompanying notes are an integral part of these statements
TGC Industries, Inc. and Subsidiaries
CONSOLIDATED STATEMENTS OF CASH FLOWS
Years Ended December 31,
|
|
|
2014 |
|
2013 |
|
2012 |
| |||
|
Cash flows from operating activities |
|
|
|
|
|
|
| |||
|
Net income (loss) |
|
$ |
(9,528,330 |
) |
$ |
(6,316,041 |
) |
$ |
15,671,879 |
|
|
Adjustments to reconcile net income (loss) to net cash provided by operating activities: |
|
|
|
|
|
|
| |||
|
Depreciation and amortization |
|
19,152,286 |
|
24,644,190 |
|
25,502,597 |
| |||
|
Gain on disposal of property and equipment |
|
(242,265 |
) |
(676,422 |
) |
(1,069,766 |
) | |||
|
Stock-based compensation |
|
688,115 |
|
972,711 |
|
601,059 |
| |||
|
Deferred income taxes |
|
(5,745,239 |
) |
(3,308,713 |
) |
359,535 |
| |||
|
Bad debt expense |
|
557,867 |
|
— |
|
— |
| |||
|
Changes in operating assets and liabilities |
|
|
|
|
|
|
| |||
|
Trade accounts receivable |
|
(9,889,349 |
) |
24,086,780 |
|
(16,021,574 |
) | |||
|
Cost and estimated earnings in excess of billings on uncompleted contracts |
|
271,933 |
|
3,950,483 |
|
(1,121,420 |
) | |||
|
Prepaid expenses and other |
|
3,033,527 |
|
3,230,777 |
|
2,820,516 |
| |||
|
Prepaid federal and state income tax |
|
3,788,568 |
|
(3,777,853 |
) |
78,268 |
| |||
|
Other assets |
|
12,624 |
|
3,755 |
|
(17,991 |
) | |||
|
Trade accounts payable |
|
3,800,394 |
|
(9,439,503 |
) |
4,328,707 |
| |||
|
Accrued liabilities |
|
(859,640 |
) |
(2,856,390 |
) |
2,911,755 |
| |||
|
Billings in excess of cost and estimated earnings on uncompleted contracts |
|
3,797,882 |
|
(3,068,487 |
) |
2,814,863 |
| |||
|
Federal and state income tax payable |
|
417,002 |
|
(4,475,945 |
) |
2,424,634 |
| |||
|
Net cash provided by operating activities |
|
9,255,375 |
|
22,969,342 |
|
39,283,062 |
| |||
|
|
|
|
|
|
|
|
| |||
|
Cash flows from investing activities |
|
|
|
|
|
|
| |||
|
Capital expenditures |
|
(1,379,395 |
) |
(1,848,678 |
) |
(31,970,418 |
) | |||
|
Proceeds from sale of property and equipment |
|
415,419 |
|
1,181,180 |
|
1,704,722 |
| |||
|
Net cash used in investing activities |
|
(963,976 |
) |
(667,498 |
) |
(30,265,696 |
) | |||
|
|
|
|
|
|
|
|
| |||
|
Cash flows from financing activities |
|
|
|
|
|
|
| |||
|
Principal payments on notes payable |
|
(11,657,862 |
) |
(13,342,462 |
) |
(11,338,097 |
) | |||
|
Principal payments on capital lease obligations |
|
(1,536,375 |
) |
(2,069,661 |
) |
(2,081,176 |
) | |||
|
Proceeds from exercise of stock options |
|
154,554 |
|
416,390 |
|
377,381 |
| |||
|
Purchase of treasury shares |
|
— |
|
— |
|
— |
| |||
|
Payment of dividends |
|
— |
|
(939 |
) |
(3,099,014 |
) | |||
|
Net cash used in financing activities |
|
(13,039,683 |
) |
(14,996,672 |
) |
(16,140,906 |
) | |||
|
Net increase (decrease) in cash and cash equivalents |
|
(4,748,284 |
) |
7,305,172 |
|
(7,123,540 |
) | |||
|
|
|
|
|
|
|
|
| |||
|
Effect of exchange rates on cash |
|
(18,939 |
) |
210,958 |
|
(7,775 |
) | |||
|
|
|
|
|
|
|
|
| |||
|
Cash and cash equivalents at beginning of year |
|
16,130,374 |
|
8,614,244 |
|
15,745,559 |
| |||
|
|
|
|
|
|
|
|
| |||
|
Cash and cash equivalents at end of year |
|
$ |
11,363,151 |
|
$ |
16,130,374 |
|
$ |
8,614,244 |
|
|
|
|
|
|
|
|
|
| |||
|
Supplemental cash flow information |
|
|
|
|
|
|
| |||
|
Interest paid |
|
$ |
677,718 |
|
$ |
1,129,581 |
|
$ |
1,222,454 |
|
|
Income taxes paid (received) |
|
$ |
(3,052,418 |
) |
$ |
9,474,481 |
|
$ |
7,022,640 |
|
|
|
|
|
|
|
|
|
| |||
|
Noncash investing and financing activities |
|
|
|
|
|
|
| |||
|
Capital lease obligations incurred |
|
$ |
479,405 |
|
$ |
626,187 |
|
$ |
2,935,514 |
|
|
Financed equipment purchase |
|
$ |
6,096,173 |
|
$ |
— |
|
$ |
22,201,800 |
|
|
Financed insurance premiums |
|
$ |
3,171,195 |
|
$ |
3,237,881 |
|
$ |
3,050,024 |
|
|
Restricted stock awards to employees, net of cancellations |
|
$ |
100,200 |
|
$ |
25,440 |
|
$ |
1,334,014 |
|
|
Stock awards to employees |
|
$ |
— |
|
$ |
— |
|
$ |
— |
|
|
Treasury shares issued for stock options exercised |
|
$ |
— |
|
$ |
560,090 |
|
$ |
433,615 |
|
The accompanying notes are an integral part of these statements
TGC Industries, Inc. and Subsidiaries
NOTES TO CONSOLIDATED FINANCIAL STATEMENTS
December 31, 2014, 2013, and 2012
NOTE A — NATURE OF OPERATIONS/BASIS OF PRESENTATION
The Company (as defined below) is engaged in the geophysical services business and primarily conducts seismic surveys and sells gravity data to companies engaged in exploration in the oil and gas industry in the U.S. and Canada.
Material Transaction
On February 11, 2015, pursuant to the previously announced Agreement and Plan of Merger, dated October 8, 2014 (the “Merger Agreement”), by and among TGC Industries, Inc. (“Legacy TGC” or the “Company”), Dawson Geophysical Company (“Legacy Dawson”), and Riptide Acquisition Corp., a wholly-owned subsidiary of the Company (“Merger Sub”), merged with and into Legacy Dawson, with Legacy Dawson continuing after the merger as the surviving entity and a wholly-owned subsidiary of the Company. At the effective time of the Merger (the “Effective Time”), without any action on the part of any shareholder, each issued and outstanding share of Legacy Dawson’s common stock, par value $0.331/3 per share (the “Legacy Dawson Common Stock”), including shares underlying Legacy Dawson’s outstanding equity awards, was converted into the right to receive 1.760 shares of common stock of the Company, par value $0.01 per share (the “Company Common Stock”), after giving effect to a 1-for-3 reverse stock split of the issued and outstanding Company Common Stock which occurred immediately prior to the Merger (the “Reverse Stock Split”). In connection with the Merger, Legacy Dawson changed its name to “Dawson Operating Company” and Legacy TGC changed its name to “Dawson Geophysical Company.” These financial statements represent only the financial condition and the results of operations for Legacy TGC as of and for the three years ended December 31, 2014 and do not include the financial results of Legacy Dawson.
Reverse Stock Split
All share and per share amounts of common stock have been retrospectively adjusted to give effect to the Reverse Stock Split effected on February 11, 2015, including those amounts included in the consolidated financial statements, which have been adjusted for all periods to give retroactive effect to the Reverse Stock Split.
NOTE B - SUMMARY OF SIGNIFICANT ACCOUNTING POLICIES
Principles of Consolidation
The Consolidated Financial Statements include the accounts of TGC Industries, Inc. and its wholly-owned subsidiaries prior to the Merger. We have eliminated all significant intercompany accounts and transactions.
Business Combinations
We record acquisitions using the purchase method of accounting and, accordingly, have included the results of operations of acquired businesses in our consolidated results from the date of each acquisition. We allocate the purchase price of our acquisitions to the tangible assets, liabilities, and intangible assets acquired based on their estimated fair values. The excess purchase price over those fair values is recorded as goodwill. The fair value assigned to assets acquired is based on valuations provided by independent consultants and using management’s estimates and assumptions.
Foreign Currency
The functional currency of the Company’s international subsidiary is the local currency. Local currency assets and liabilities are translated at the rates of exchange on the balance sheet date, and local currency revenues and expenses are translated at average rates of exchange during the period. The resulting translation adjustments are recorded directly into a separate component of shareholders’ equity and represents the only component of accumulated other comprehensive income (loss).
TGC Industries, Inc. and Subsidiaries
NOTES TO CONSOLIDATED FINANCIAL STATEMENTS
December 31, 2014, 2013, and 2012
NOTE B - SUMMARY OF SIGNIFICANT ACCOUNTING POLICIES - CONTINUED
Cash Equivalents
The Company considers all highly liquid investments with original maturity dates of three months or less to be cash equivalents. The Company maintains its accounts at financial institutions located in Texas and Alberta, Canada. The Texas bank accounts are insured by the Federal Deposit Insurance Corporation up to $250,000. The Alberta bank accounts are insured by the Canadian Depository Insurance Corporation up to $100,000 Canadian.
Trade Accounts Receivable
Trade accounts receivable are recorded in accordance with terms and amounts as specified in the related contracts on an ongoing basis. The Company evaluates the collectability of accounts receivable on a specific account basis using a combination of factors including the age of the outstanding balances, evaluation of the customer’s financial condition, and discussions with relevant Company personnel and with the customers directly. An allowance for doubtful accounts or direct write-off is recorded when it is determined that the receivable may not be collected, depending on the facts known and the probability of collection of the outstanding amount.
Property and Equipment
Property and equipment are stated at cost. Depreciation and amortization are provided using the straight-line method over the estimated useful lives of the individual assets ranging from 1 to 7 years. The depreciation expense on assets acquired under capital leases is included with depreciation expense on owned assets. Expenditures for major renewals and betterments that extend the useful lives of property and equipment are capitalized. Expenditures for maintenance and repairs are charged to expense as incurred.
Long-Lived Assets
Long-lived assets held and used by the Company are reviewed for impairment whenever events or changes in circumstances indicate that the carrying amount of an asset may not be recoverable. For the purposes of evaluating the recoverability of long-lived assets, the recoverability test is performed using undiscounted cash flows estimated to be generated by those assets. Long-lived assets as of December 31, 2014 were approximately $48,792,000, with $18,621,000 located in the United States and $30,171,000 located in Canada. Long-lived assets as of December 31, 2013 were approximately $63,107,000, with $20,148,000 located in the United States and $42,959,000 located in Canada. Long-lived assets as of December 31, 2012 were approximately $89,386,000, with $32,390,000 located in the United States and $56,996,000 located in Canada. No impairment charge was necessary at December 31, 2014, 2013, and 2012.
Income Taxes
Deferred tax assets and liabilities are recognized for the future tax consequences attributable to differences between financial statement carrying amounts of existing assets and liabilities and their respective tax bases, in accordance with Accounting Standards Codification Topic 740 (“Topic 740”). Deferred tax assets and liabilities are measured using enacted tax rates expected to be applied to taxable income in the years in which those temporary differences are expected to be recovered or settled. The effect on deferred tax assets and liabilities of a change in tax rates is recognized in income in the period that includes the enactment date. Deferred tax expense or benefit is the result of changes in deferred tax assets and liabilities. The components of the deferred tax assets and liabilities are individually classified as current or non-current based on their characteristics. Deferred tax assets are reduced by a valuation allowance when, in the opinion of management, it is more likely than not that some portion or all of the deferred tax assets will not be realized.
Topic 740 prescribes a recognition threshold and measurement attribute for the financial statement recognition and measurement of a tax position taken or expected to be taken in a tax return. In accordance with Topic 740, the Company recognizes in its financial statements the impact of a tax position if that position is “more likely than not” to be sustained on audit, based on the technical merits of the position. The Company’s estimate of the potential outcome of any uncertain tax issue is subject to management’s assessment of relevant risks, facts, and circumstances existing at that time. Topic 740 also provides guidance on derecognition, classification, interest and penalties, accounting in interim periods, and disclosure. Interest and penalties related to unrecognized tax benefits, if any, are recorded as income tax expense. See Note H for further information.
TGC Industries, Inc. and Subsidiaries
NOTES TO CONSOLIDATED FINANCIAL STATEMENTS
December 31, 2014, 2013, and 2012
NOTE B - SUMMARY OF SIGNIFICANT ACCOUNTING POLICIES — CONTINUED
Revenue Recognition
Seismic Surveys
The Company provides seismic data acquisition survey services to its customers under general service agreements which define certain obligations for the Company and for its customers. The Company typically enters into a supplemental agreement setting forth the terms of each project, which may be canceled by either party upon 30 days’ advance written notice. These supplemental agreements are either “turnkey” agreements providing for a fixed fee to be paid for each unit of seismic data acquired or “term” agreements providing for a fixed hourly, daily, or monthly fee during the term of the project. Under both types of agreements, the Company recognizes revenues when services have been performed and revenue is realizable. Services are defined as the commencement of data acquisition. Revenues are deemed realizable when earned according to the terms of the contracts. Under turnkey agreements, the total number of units of seismic data to be gathered is set forth in the agreement. Revenue under turnkey agreements is recognized on a per unit of seismic data acquired rate as services are performed. Revenue under term agreements is recognized on a per unit of time worked rate as services are performed based on the time worked rate provided in the term agreement. In the event of a canceled contract, revenue is recognized and the client is billed for services performed to the date of contract cancellation. When it becomes evident that the estimates of total costs to be incurred on a contract will exceed the total estimates of revenue to be earned, an estimated loss is recognized in the period in which the loss is identifiable. The asset “Cost and estimated earnings in excess of billings on uncompleted contracts” represents cost incurred on turnkey agreements in excess of billings on those agreements. The liability “Billings in excess of costs and estimated earnings on uncompleted contracts” represents billings on turnkey agreements in excess of cost on those agreements.
Accumulated Other Comprehensive Income
Comprehensive income is a measure of income which includes both net income and other comprehensive income or loss. Other comprehensive income or loss results from items deferred from recognition in the statement of operations, which consists solely of foreign currency translation adjustments. Accumulated other comprehensive income (loss) is presented on the Company’s consolidated balance sheet as a part of shareholder’s equity. In addition, the Company reports comprehensive income (loss) and its components in a separate statement of comprehensive income (loss).
Foreign currency translation income or loss represents changes in foreign currency rates used to translate the assets, liabilities, revenues and expenses of the Company’s international subsidiary from the local currency. These changes in foreign currency rates may never be realized or may only be partially realized upon the ultimate disposition, if any, of the international subsidiary. The Company’s foreign investment is considered permanent in nature as there are no plans in the foreseeable future for divestiture.
Reclassifications
Certain reclassifications have been made to the 2013 financial statements to conform to the 2014 presentation.
Share-Based Compensation
The Company has two stock-based compensation plans, which are described more fully in Note G. The Company recognizes the fair value of the share-based compensation awards as wages in the Statements of Operations on a straight-line basis over the vesting period. As a result, during the years ended December 31, 2014, 2013, and 2012, the Company recognized compensation expense for unvested stock options of $259,264, $206,952, and $283,950, respectively, and unvested restricted stock of $358,679, $492,692, and $317,110, respectively.
TGC Industries, Inc. and Subsidiaries
NOTES TO CONSOLIDATED FINANCIAL STATEMENTS
December 31, 2014, 2013, and 2012
NOTE B - SUMMARY OF SIGNIFICANT ACCOUNTING POLICIES — CONTINUED
No incentive stock options were granted during the years ended December 31, 2013 and 2012. For the year ended December 31, 2014, the fair value of the option grant was estimated on the date of the grant using the Binomial Lattice option pricing model with the following assumptions used for the outstanding grants: risk-free interest rate of 1.04%; expected dividend yield of 0.0%; expected life of 5.0 years; and expected volatility of 45.0%.
Financial Instruments
The Company’s financial instruments recorded on the consolidated balance sheet include cash and cash equivalents, accounts receivable, accounts payable, and debt. The carrying amounts of cash and cash equivalents, accounts receivable, and accounts payable approximate fair value because of the short-term nature of these items. The carrying amounts of debt obligations approximate fair value due to their relative short-term maturities and their contract rates which approximate market.
Earnings Per Share
Basic earnings per common share are based upon the weighted average number of shares of common stock outstanding. Diluted earnings per share are based upon the weighted average number of common shares outstanding and, when dilutive, common shares issuable for stock options, warrants, and convertible securities.
All share and per share amounts for the years ended December 31, 2014, 2013, and 2012, have been adjusted to reflect 5% stock dividends paid May 14, 2013 and May 14, 2012 to shareholders of record as of April 30, 2013, and April 30, 2012, respectively, and the 1-for-3 Reverse Stock Split effected February 11, 2015. No stock dividends were declared or paid during the year ended December 31, 2014.
Use of Estimates
The preparation of consolidated financial statements in accordance with accounting principles generally accepted in the United States of America requires management to make estimates and assumptions that affect the reported amounts of assets and liabilities and disclosure of contingent assets and liabilities at the date of the financial statements and the reported amounts of revenues and expenses during the reporting period. Actual results could differ from those estimates.
Recent Accounting Standards
In July 2013, the Financial Accounting Standards Board (“FASB”) issued Accounting Standards Update (“ASU”) No. 2013-11, Income Taxes (Topic 740) - Presentation of an Unrecognized Tax Benefit When a Net Operating Loss Carryforward, a Similar Tax Loss, or a Tax Credit Carryforward Exists (“ASU 2013-11”). ASU 2013-11 clarifies the balance sheet presentation of an unrecognized tax benefit and was issued to resolve the diversity in practice that had developed in the absence any specific U.S. generally accepted accounting principles (“U.S. GAAP”). ASU 2013-11 is applicable to all entities that have an unrecognized tax benefit due to a net operating loss carryforward, a similar tax loss, of a tax credit carryforward. ASU 2013-11 is effective for fiscal years, and interim periods within those years, beginning after December 15, 2013, and does not create any new disclosure requirements. The Company adopted ASU 2013-11 on January 1, 2014, and it did not have a significant effect on its consolidated financial statements.
In May 2014, the FASB issued ASU No. 2014-09, Revenue (Topic 606) - Revenue from Contracts with Customers (“ASU 2014-09”). ASU 2014-09 supersedes nearly all existing revenue recognition guidance under U.S. GAAP and establishes a comprehensive revenue recognition standard for virtually all industries, including those that previously followed industry-specific guidance. The revenue standard’s core principle is built on the contract between a vendor and a customer for the provision of goods and services. It attempts to depict the exchange of rights and obligations between the parties in the pattern of revenue recognition based on the consideration to which the vendor is entitled. Three basic transition methods are available—full retrospective, retrospective with certain practical expedients, and a cumulative effect approach. Under the third alternative, an entity would apply the new revenue standard only to contracts that are incomplete under legacy U.S. GAAP at the date of initial application (i.e., January 1, 2017) and recognize the cumulative effect of the new standard as an adjustment to the opening balance of
TGC Industries, Inc. and Subsidiaries
NOTES TO CONSOLIDATED FINANCIAL STATEMENTS
December 31, 2014, 2013, and 2012
NOTE B - SUMMARY OF SIGNIFICANT ACCOUNTING POLICIES — CONCLUDED
retained earnings. That is, prior years would not be restated and additional disclosures would be required to enable users of the financial statements to understand the impact of adopting the new standard in the current year compared to prior years that are presented under legacy U.S. GAAP. ASU 2014-09 is effective for annual periods beginning after December 15, 2016, including interim periods therein. Early adoption is prohibited. The Company will adopt ASU 2014-09 on January 1, 2017. The Company will begin evaluating the impact of our pending adoption of ASU 2014-09 on our consolidated financial statements and has not yet determined the method by which it will adopt the standard in 2017.
In August 2014, the FASB issued ASU No. 2014-15, Presentation of Financial Statements - Going Concern (Subtopic 205-40) (“ASU 2014-15”). ASU 2014-15 provides guidance on management’s responsibility to evaluate whether there is substantial doubt about an entity’s ability to continue as a going concern and in certain circumstances to provide related footnote disclosures. ASU 2014-15 is effective for the annual period ending after December 15, 2016, and for annual and interim periods thereafter. Early adoption is permitted. The Company is currently evaluating the new guidance, however it does not expect any impact on its consolidated financial statements.
NOTE C — COSTS, BILLINGS, AND ESTIMATED EARNINGS ON UNCOMPLETED CONTRACTS
The components of uncompleted contracts are as follows at December 31:
|
|
|
2014 |
|
2013 |
| ||
|
Costs incurred on uncompleted contracts and estimated earnings |
|
$ |
2,326,653 |
|
$ |
2,476,716 |
|
|
Less billings to date |
|
(4,737,861 |
) |
(816,989 |
) | ||
|
|
|
$ |
(2,411,208 |
) |
$ |
1,659,727 |
|
The components of uncompleted contracts are reflected in the consolidated balance sheets as follows at December 31:
|
|
|
2014 |
|
2013 |
| ||
|
Costs and estimated earnings in excess of billings on uncompleted contracts |
|
$ |
2,039,894 |
|
$ |
2,312,947 |
|
|
Billings in excess of costs and estimated earnings on uncompleted contracts |
|
(4,451,102 |
) |
(653,220 |
) | ||
|
|
|
$ |
(2,411,208 |
) |
$ |
1,659,727 |
|
TGC Industries, Inc. and Subsidiaries
NOTES TO CONSOLIDATED FINANCIAL STATEMENTS
December 31, 2014, 2013, and 2012
NOTE D - ACCRUED LIABILITIES
Accrued liabilities consist of the following at December 31:
|
|
|
2014 |
|
2013 |
| ||
|
Compensation and payroll taxes |
|
$ |
817,888 |
|
$ |
1,091,191 |
|
|
Accrued sales and use tax |
|
(322,543 |
) |
56,486 |
| ||
|
Insurance |
|
144,228 |
|
40,193 |
| ||
|
Accrued interest |
|
35,000 |
|
35,000 |
| ||
|
Other |
|
1,040,934 |
|
1,363,123 |
| ||
|
|
|
$ |
1,715,507 |
|
$ |
2,585,993 |
|
NOTE E - DEBT
Line of Credit
In September 2013 and again in September 2014, the Company renewed its revolving line of credit allowing the Company to borrow, repay, and re-borrow, from time to time, up to $5,000,000. Interest on the outstanding amount under the line of credit loan agreement is payable monthly at the greater of the prime rate of interest or five percent. The credit loan agreement is secured by a security interest in the Company’s accounts receivable. As of December 31, 2014, and since its inception, the Company has not had any borrowings outstanding under the line of credit loan agreement. The line of credit expires September 16, 2015.
Notes Payable
Notes payable consists of the following at December 31:
|
|
|
2014 |
|
2013 |
| ||
|
Notes payable to commercial banks |
|
|
|
|
| ||
|
Four outstanding notes payable as of 12/31/2014 with interest between 3.5% and 4.6%, due in monthly installments between $128,363 and $215,863 plus interest; collateralized by equipment |
|
$ |
12,072,454 |
|
$ |
14,416,225 |
|
|
|
|
|
|
|
| ||
|
Notes payable to finance companies for insurance |
|
|
|
|
| ||
|
Two outstanding notes payable as of 12/31/2014 with interest between 4.09% and 4.95%, due in monthly installments between $14,674 and $326,366 including interest |
|
449, 308 |
|
501,766 |
| ||
|
|
|
$ |
12,521,762 |
|
$ |
14,917,991 |
|
|
Less current maturities |
|
(7,296,950 |
) |
(8,434,879 |
) | ||
|
|
|
$ |
5,224,812 |
|
$ |
6,483,112 |
|
Aggregate annual maturities of notes payable at December 31, 2014 are as follows:
|
Year Ending |
|
|
| |
|
2015 |
|
$ |
7,296,950 |
|
|
2016 |
|
3,572,428 |
| |
|
2017 |
|
1,652,384 |
| |
|
2018 |
|
— |
| |
|
|
|
$ |
12,521,762 |
|
TGC Industries, Inc. and Subsidiaries
NOTES TO CONSOLIDATED FINANCIAL STATEMENTS
December 31, 2014, 2013, and 2012
NOTE F — LEASES
Capital Lease Obligations
The Company leases vehicles and certain specialized seismic equipment under leases classified as capital leases. The following is a schedule showing the future minimum lease payments under capital leases by years and the present value of the minimum lease payments as of December 31, 2014:
|
Year Ending |
|
|
| |
|
2015 |
|
$ |
847,430 |
|
|
2016 |
|
293,176 |
| |
|
2017 |
|
146,417 |
| |
|
2018 |
|
— |
| |
|
Total minimum lease payments required |
|
1,287,023 |
| |
|
Less: Amount representing interest |
|
(70,644 |
) | |
|
Present value of minimum lease payments |
|
1,216,379 |
| |
|
Less current maturities |
|
(799,010 |
) | |
|
|
|
$ |
417,369 |
|
The net book value of the capital assets leased was approximately $1,626,000 and $2,954,000 as of December 31, 2014, and 2013, respectively. Total accumulated depreciation for fixed assets under capital lease with remaining obligations was approximately $3,349,000 and $4,020,000 as of December 31, 2014 and 2013, respectively. Interest rates on these leases range from 4.58% to 8.17%.
Operating Lease Obligations
At December 31, 2014, the Company leased six offices and two warehouse facilities under operating leases that expire at various dates between April 2014 and October 2018 with one lease on a month-to-month basis. One of the office facilities, used by the Company as its corporate headquarters, is located in Plano, Texas. One of the office facilities, used by Eagle Canada, is located in Calgary, Alberta. The warehouse facilities, used as warehouse and equipment repair facilities, are located in Denison, Texas, and Calgary, Alberta. Three office facilities are used as sales offices and are located in Houston, Texas, Midland, Texas, and Oklahoma City, Oklahoma. The remaining office facility, located in Pratt, Kansas, is used as a permitting office. Rent expense for these facilities for the years ended December 31, 2014, 2013, and 2012 was approximately $720,000, $750,000, and $700,000, respectively.
The following is a schedule by years of future minimum rental payments required under the operating leases as of December 31, 2014:
|
2015 |
|
$ |
1,145,359 |
|
|
2016 |
|
1,075,513 |
| |
|
2017 |
|
394,019 |
| |
|
2018 and thereafter |
|
104,934 |
| |
|
Total minimum payments required |
|
$ |
2,719,825 |
|
TGC Industries, Inc. and Subsidiaries
NOTES TO CONSOLIDATED FINANCIAL STATEMENTS
December 31, 2014, 2013, and 2012
NOTE G — SHAREHOLDERS’ EQUITY
Net Income (Loss) Per Share
The following is a reconciliation of net income (loss) and weighted average common shares outstanding for purposes of calculating basic and diluted net income (loss) per share:
|
|
|
December 31, |
| |||||||
|
|
|
2014 |
|
2013 |
|
2012 |
| |||
|
|
|
|
|
|
|
|
| |||
|
Numerator: |
|
|
|
|
|
|
| |||
|
Net income (loss) |
|
$ |
(9,528,330 |
) |
$ |
(6,316,041 |
) |
$ |
15,671,879 |
|
|
|
|
|
|
|
|
|
| |||
|
Denominator: |
|
|
|
|
|
|
| |||
|
Basic - weighted average common shares outstanding |
|
7,322,358 |
|
7,280,527 |
|
7,171,212 |
| |||
|
|
|
|
|
|
|
|
| |||
|
Effect of Dilutive Securities: |
|
|
|
|
|
|
| |||
|
Stock options |
|
— |
|
— |
|
128,246 |
| |||
|
|
|
7,322,358 |
|
7,280,527 |
|
7,299,458 |
| |||
|
|
|
|
|
|
|
|
| |||
|
Basic net income (loss) per share |
|
$ |
(1.30 |
) |
$ |
(0.87 |
) |
$ |
2.19 |
|
|
Diluted net income (loss) per share |
|
$ |
(1.30 |
) |
$ |
(0.87 |
) |
$ |
2.15 |
|
Outstanding options that were not included in the diluted calculation because their effect would be anti-dilutive totaled 279,756, 152,576 and 14,790 for the years ended December 31, 2014, 2013 and 2012, respectively.
All share and per share amounts have been adjusted to reflect 5% stock dividends paid May 14, 2013, and May 14, 2012, to shareholders of record as of April 30, 2013, and April 30, 2012 and the 1-for-3 Reverse Stock Split effected February 11, 2015.
Share-Based Compensation Plans
As of December 31, 2014, the Company had in effect a 2006 stock award plan (the “2006 Plan”). At the June 11, 2010 Annual Meeting of Shareholders, the shareholders approved an increase of 666,667 shares of common stock for issuance under the 2006 Plan. This increased the total aggregate number of shares of common stock under the 2006 Plan to 1,000,000 shares. The 2006 Plan provides for the granting of stock options, common stock, and restricted stock. The 2006 Plan is administered by a committee of the Board of Directors (the “Committee”). Currently the Committee is comprised of three directors. Any stock options granted under the 2006 Plan will be exercisable as set forth in the option agreements pursuant to which they are issued, but in no event will stock options be exercisable after the expiration of five (5) years from the date of grant. Outstanding options, under the 2006 Plan at December 31, 2014, have vesting periods ranging from the date of grant to the third annual anniversary of the grant.
During 2014, 180,833 options were granted, and 53,654 options were exercised or canceled under the 2006 Plan. During 2013, 39,203 options were granted, and 130,577 options were exercised or canceled under the 2006 Plan. During 2012, 47,867 options were granted, and 81,481 options were exercised or canceled under the 2006 Plan. Restricted stock consists of shares that are transferred by the Company to a participant, but are subject to substantial risk of forfeiture and to restrictions on their sale or other transfer by the participant. Any restricted stock granted or issued under the 2006 Plan will vest as set forth in the restricted stock agreement pursuant to which it was issued or granted. The provisions of the restricted stock agreements need not be the same with respect to each participant. In November of 2011, December of 2011, January of 2012, August of 2012, February 1, 2013 and June 25, 2013, the Committee granted 8,443, 7,173, 2,000, 71,041, 2,000 and 10,000 shares of restricted stock, respectively. On April 30, 2013, the Committee rescinded 15,000 shares of restricted stock previously granted in August of 2012. The shares of restricted stock were issued in the names of the grantees and had restrictive legends prohibiting their sales prior to vesting. Vesting periods, for restricted stock issued to date, range from at grant date to the third annual anniversary of the grant. Upon vesting, a new certificate is issued for the vested portion without the restrictive legend.
TGC Industries, Inc. and Subsidiaries
NOTES TO CONSOLIDATED FINANCIAL STATEMENTS
December 31, 2014, 2013, and 2012
NOTE G — SHAREHOLDERS’ EQUITY — CONTINUED
During the years ended December 31, 2014, 2013, and 2012, the Company recognized compensation expense associated with the restricted stock of $358,678, $492,692, and $317,110, respectively. During the years ended December 31, 2014, 2013, and 2012, no unamortized deferred stock-based compensation was related to any employee that left the Company.
During the years ended December 31, 2014, 2013, and 2012, the Company recognized compensation expense associated with unvested options of $259,264, $206,952, and $283,950, respectively.
The following table summarizes activity under the 2006 Plan:
|
|
|
|
|
Weighted |
| |
|
|
|
Shares under |
|
Average |
| |
|
|
|
Option |
|
exercise price |
| |
|
|
|
|
|
|
| |
|
Balance at December 31, 2011 |
|
277,565 |
|
$ |
11.91 |
|
|
Granted |
|
47,867 |
|
$ |
20.58 |
|
|
Exercised |
|
(64,316 |
) |
$ |
12.60 |
|
|
Canceled |
|
(17,166 |
) |
$ |
26.82 |
|
|
Balance at December 31, 2012 |
|
243,950 |
|
$ |
12.48 |
|
|
Granted |
|
39,204 |
|
$ |
22.83 |
|
|
Exercised |
|
(109,468 |
) |
$ |
8.91 |
|
|
Canceled |
|
(21,110 |
) |
$ |
19.83 |
|
|
Balance at December 31, 2013 |
|
152,576 |
|
$ |
15.93 |
|
|
Granted |
|
180,833 |
|
$ |
11.79 |
|
|
Exercised |
|
(14,652 |
) |
$ |
10.56 |
|
|
Canceled |
|
(39,001 |
) |
$ |
10.86 |
|
|
Balance at December 31, 2014 |
|
279,756 |
|
$ |
14.25 |
|
The following information applies to options outstanding and exercisable at December 31, 2014:
|
|
|
|
|
|
|
Weighted |
|
|
| |
|
|
|
|
|
|
|
average |
|
|
| |
|
|
|
|
|
|
|
remaining |
|
Weighted |
| |
|
|
|
Range of |
|
Number |
|
contractual |
|
average |
| |
|
|
|
Exercise prices |
|
outstanding |
|
life (in years) |
|
exercise price |
| |
|
Outstanding options |
|
$11.79 — $21.54 |
|
279,756 |
|
3.93 |
|
$ |
14.25 |
|
|
Exercisable options |
|
$11.79 — $21.54 |
|
133,505 |
|
3.22 |
|
$ |
16.94 |
|
TGC Industries, Inc. and Subsidiaries
NOTES TO CONSOLIDATED FINANCIAL STATEMENTS
December 31, 2014, 2013, and 2012
NOTE H - INCOME TAXES
The income tax provision (benefit) charged to continuing operations for the years ended December 31, 2014, 2013, and 2012, was as follows:
|
|
|
2014 |
|
2013 |
|
2012 |
| |||
|
|
|
|
|
|
|
|
| |||
|
Current: |
|
|
|
|
|
|
| |||
|
U.S. federal |
|
$ |
— |
|
$ |
— |
|
$ |
3,947,400 |
|
|
Foreign |
|
1,191,079 |
|
949,207 |
|
5,313,874 |
| |||
|
State and local |
|
(142,274 |
) |
205,997 |
|
264,269 |
| |||
|
|
|
1,048,805 |
|
1,155,204 |
|
9,525,543 |
| |||
|
Deferred expense (benefit) |
|
(5,745,239 |
) |
(3,308,713 |
) |
359,535 |
| |||
|
|
|
$ |
(4,696,434 |
) |
$ |
(2,153,509 |
) |
$ |
9,885,078 |
|
The components of the Company’s income (loss) before income tax expense attributable to domestic and foreign operations amounted to $(17,774,883) and $3,550,119, respectively, for the year ended December 31, 2014. The components of the Company’s income before income tax expense attributable to domestic and foreign operations amounted to $(12,635,002) and $4,165,452, respectively, for the year ended December 31, 2013. The components of the Company’s income before income tax expense attributable to domestic and foreign operations amounted to $6,018,971 and $19,537,986, respectively, for the year ended December 31, 2012. The income tax provision differs from the amount of income tax determined by applying the U.S. federal income tax rate (34% for 2014, 34% for 2013, and 35% for 2012) to pretax income (loss) from continuing operations for the years ended December 31, 2014, 2013, and 2012, due to the following:
|
|
|
2014 |
|
2013 |
|
2012 |
| |||
|
Computed “expected” tax expense |
|
$ |
(4,836,420 |
) |
$ |
(2,879,647 |
) |
$ |
8,944,935 |
|
|
Increase (decrease) in income taxes resulting from: |
|
|
|
|
|
|
| |||
|
Reduction in deferred assets |
|
(281,432 |
) |
— |
|
— |
| |||
|
Nondeductible expenses and other |
|
515,923 |
|
590,180 |
|
768,652 |
| |||
|
State and local taxes, net of federal benefit |
|
(94,505 |
) |
135,958 |
|
171,491 |
| |||
|
|
|
$ |
(4,696,434 |
) |
$ |
(2,153,509 |
) |
$ |
9,885,078 |
|
Net deferred tax liabilities consist of the following components as of December 31, 2014 and 2013:
|
|
|
2014 |
|
2013 |
| ||
|
Deferred tax assets |
|
|
|
|
| ||
|
Foreign tax credits |
|
$ |
1,611,329 |
|
$ |
244,898 |
|
|
Net operating loss carry forwards |
|
3,940,285 |
|
61,139 |
| ||
|
Other |
|
199,821 |
|
88,911 |
| ||
|
Total deferred tax assets |
|
5,751,435 |
|
394,948 |
| ||
|
Deferred tax liability |
|
|
|
|
| ||
|
Property, equipment, and intangible asset |
|
(4,596,935 |
) |
(4,985,687 |
) | ||
|
Total deferred tax assets (liabilities) |
|
$ |
1,154,500 |
|
$ |
(4,590,739 |
) |
TGC Industries, Inc. and Subsidiaries
NOTES TO CONSOLIDATED FINANCIAL STATEMENTS
December 31, 2014, 2013, and 2012
NOTE H - INCOME TAXES - CONCLUDED
The components giving rise to the net deferred tax items described above have been included in the accompanying balance sheets as of December 31, 2014 and 2013, as follows:
|
|
|
2014 |
|
2013 |
| ||
|
Noncurrent assets |
|
$ |
1,154,500 |
|
$ |
— |
|
|
Noncurrent (liabilities) |
|
— |
|
(4,590,739 |
) | ||
|
|
|
$ |
1,154,500 |
|
$ |
(4,590,739 |
) |
As of December 31, 2014, the Company has U.S. net operating loss carry forwards for U.S. federal income tax purposes of approximately $12,400,000. These net operating losses are available to offset future federal taxable income, if any, and expire from 2027 through 2034. The amount of net operating loss carry forwards that may reduce federal income taxes in any given year are subject to annual limitations and taxable income requirements. The foreign tax credit of $1,611,000 expires during the years ranging from 2022-2024.
The Company files a U.S. consolidated federal income tax return for operating activities in the U.S. and Canada. The Company also files federal and local tax returns in Canada, as well as state tax returns in a number of state and local jurisdictions in the U.S. The Company’s U.S. federal income tax returns filed for 2011 through 2013 are subject to audit by the IRS. The Company’s income tax returns filed in Canada for 2011 through 2013 remain subject to examination by Canadian authorities. As of December 31, 2014 and 2013, the Company had no unrecognized tax benefits within its provision for income taxes.
NOTE I - 401(k) PLAN
The Company has a 401(k) salary deferral plan which covers all employees who have reached the age of 21 years and have been employed by the Company for at least one year. The covered employees may elect to have an amount deducted from their wages for investment in the retirement plan. The Company makes contributions to the plan equal to 50% of each participant’s salary reduction contributions to the plan up to 6% of the participant’s compensation. The Company’s matching contribution to the plan was approximately $183,000, $158,000, and $113,000, for the years ended December 31, 2014, 2013, and 2012, respectively.
NOTE J - CONCENTRATION OF CREDIT RISK
The Company sells its geophysical services primarily to large independent oil and gas companies operating in the U.S. and Canada. The Company performs ongoing credit evaluations of its customers’ financial condition and, generally, requires no collateral from its customers.
During the year ended December 31, 2014, the Company’s two largest customers accounted for approximately 18% and 11% of revenues, and during the years ended December 31, 2013, and 2012, the Company’s largest customers accounted for approximately 12% and 16% of revenues, respectively. As of December 31, 2014, four customers accounted for 26%, 12%, 10% and 10% of outstanding accounts receivable. As of December 31, 2013, three customers accounted for 27%, 16% and 15% of outstanding accounts receivable. As of December 31, 2012, two customers accounted for 29% and 23% of outstanding accounts receivable. During 2014, one vendor represented 20% of our purchases. During 2013, no vendor represented over 10% of our purchases. During 2012, one vendor represented 12% of our purchases.
NOTE K - CONTINGENCIES
In conducting its activities, the Company from time to time is the subject of various claims arising from the ordinary course of business. In the opinion of management, it is remote that these claims will be material to the Company’s results of operations and liquidity.
TGC Industries, Inc. and Subsidiaries
NOTES TO CONSOLIDATED FINANCIAL STATEMENTS
December 31, 2014, 2013, and 2012
NOTE L — QUARTERLY FINANCIAL DATA — (UNAUDITED)
The following is a summary of the unaudited quarterly financial information for the two years ended December 31, 2014 and 2013 (in thousands, except per share amounts):
|
|
|
Three Months Ended |
| ||||||||||
|
2014 |
|
March 31 |
|
June 30 |
|
September 30 |
|
December 31 |
| ||||
|
|
|
|
|
|
|
|
|
|
| ||||
|
Revenues |
|
$ |
48,801 |
|
$ |
18,237 |
|
$ |
26,095 |
|
$ |
25,715 |
|
|
Income (loss) from operations |
|
7,197 |
|
(6,434 |
) |
(5,973 |
) |
(8,337 |
) | ||||
|
Net income (loss) |
|
4,280 |
|
(4,032 |
) |
(4,009 |
) |
(5,767 |
) | ||||
|
Net income (loss) per basic share |
|
0.57 |
|
(0.54 |
) |
(0.54 |
) |
(0.79 |
) | ||||
|
Net income (loss) per diluted share |
|
0.57 |
|
(0.54 |
) |
(0.54 |
) |
(0.79 |
) | ||||
|
|
|
Three Months Ended |
| ||||||||||
|
2013 |
|
March 31 |
|
June 30 |
|
September 30 |
|
December 31 |
| ||||
|
|
|
|
|
|
|
|
|
|
| ||||
|
Revenues |
|
$ |
63,204 |
|
$ |
31,487 |
|
$ |
21,115 |
|
$ |
18,728 |
|
|
Income (loss) from operations |
|
10,905 |
|
(5,620 |
) |
(5,827 |
) |
(6,836 |
) | ||||
|
Net income (loss) |
|
6,351 |
|
(4,004 |
) |
(3,952 |
) |
(4,712 |
) | ||||
|
Net income (loss) per basic share |
|
0.87 |
|
(0.55 |
) |
(0.55 |
) |
(0.64 |
) | ||||
|
Net income (loss) per diluted share |
|
0.87 |
|
(0.55 |
) |
(0.55 |
) |
(0.64 |
) | ||||
NOTE M — SUBSEQUENT EVENT
On February 11, 2015, pursuant to the previously announced Merger Agreement, Merger Sub was merged with and into Legacy Dawson with Legacy Dawson continuing after the Merger as the surviving entity and a wholly-owned subsidiary of the Company. At the Effective Time, without any action on the part of any shareholder, each issued and outstanding share of Legacy Dawson Common Stock, including shares underlying Legacy Dawson’s outstanding equity awards, was converted into the right to receive 1.760 shares of common stock of the Company Common Stock, after giving effect to the Reverse Stock Split. In connection with the Merger, Legacy Dawson changed its name to “Dawson Operating Company” and the Company changed its name to “Dawson Geophysical Company.” As a result of the Merger, the former shareholders of Legacy Dawson received shares of Company Common Stock representing approximately 66% of the outstanding shares of the Company after the Merger and the Company’s shareholders retained approximately 34% of the outstanding shares of Company Common Stock after the Merger.
Beginning with the Quarterly Report on Form 10-Q for the quarter ending March 31, 2015, post-combination Dawson Geophysical Company will report on a consolidated basis representing the combined operations of Legacy TGC and Legacy Dawson and their respective subsidiaries. The quarter ending March 31, 2015 will be the first quarterly reporting period following the combination of Legacy TGC and Legacy Dawson, which was consummated on February 11, 2015. Because Legacy Dawson was deemed the accounting acquirer under U.S. GAAP, the historical financial statements of Legacy Dawson will be treated as the historical financial statements of the combined company in post-combination Dawson Geophysical Company’s future reports.
ITEM 9. CHANGES IN AND DISAGREEMENTS WITH ACCOUNTANTS ON ACCOUNTING AND FINANCIAL DISCLOSURE.
Not Applicable.
ITEM 9A. CONTROLS AND PROCEDURES.
Disclosure Controls and Procedures
The Company maintains controls and procedures designed to ensure that it is able to collect the information it is required to disclose in the reports it files with the Securities and Exchange Commission (the “SEC”), and to process, summarize, and disclose this information within the time periods specified in the rules of the SEC. Based on an evaluation of the Company’s disclosure controls and procedures (as such term is defined in Rules 13a-15(e) and 15d-15(e) under the Exchange Act) as of the end of the period covered by this report conducted by the Company’s management, with the participation of the Chief Executive and Chief Financial Officers, the Chief Executive and Chief Financial Officers believe that these controls and procedures are effective to ensure that the Company is able to record, process, summarize, and report information required to be included in reports filed or submitted under the Exchange Act, within the required time period. There were no changes in the Company’s internal control over financial reporting during the year ended December 31, 2014, that have materially affected, or are reasonably likely to materially affect, the Company’s internal control over financial reporting.
Management’s Report on Internal Control over Financial Reporting
Management of the Company is responsible for establishing and maintaining adequate internal control over financial reporting as defined in Rule 13a-15(f) under the Exchange Act.
Because of its inherent limitations, internal control over financial reporting may not prevent or detect misstatements. Projections of any evaluation of effectiveness to future periods are subject to the risk that controls may become inadequate because of changes in conditions or that the degree of compliance with the policies or procedures may deteriorate. All internal control systems, no matter how well designed, have inherent limitations. Therefore, even those systems determined to be effective can provide only reasonable assurance with respect to financial statement preparation and presentation.
Management assessed the effectiveness of the Company’s internal control over financial reporting as of December 31, 2014. In making this assessment, management used the criteria set forth by the Committee of Sponsoring Organizations of the Treadway Commission (COSO) in Internal Control — Integrated Framework (2013). Based on our assessment, we believe that, as of December 31, 2014, the Company’s internal control over financial reporting is effective based on those criteria.
The effectiveness of internal control over financial reporting as of December 31, 2014, has been audited by Lane Gorman Trubitt, PLLC, the independent registered public accounting firm which audited the Company’s consolidated financial statements. Lane Gorman Trubitt, PLLC’s attestation report on effectiveness of the Company’s internal control over financial reporting appears in their Report of Independent Registered Public Accounting Firm.
ITEM 9B. OTHER INFORMATION.
Not Applicable.
PART III
ITEM 10. DIRECTORS, EXECUTIVE OFFICERS AND CORPORATE GOVERNANCE.
The information required by Item 10 of Form 10-K is hereby incorporated by reference from the earlier filed of: (i) an amendment to this annual report on Form 10-K or (ii) the Company’s definitive proxy statement which will be filed pursuant to Regulation 14A within 120 days after the Company’s year end for the year covered by this report.
ITEM 11. EXECUTIVE COMPENSATION.
The information required by Item 11 of Form 10-K is hereby incorporated by reference from the earlier filed of: (i) an amendment to this annual report on Form 10-K or (ii) the Company’s definitive proxy statement which will be filed pursuant to Regulation 14A within 120 days after the Company’s year end for the year covered by this report.
ITEM 12. SECURITY OWNERSHIP OF CERTAIN BENEFICIAL OWNERS AND MANAGEMENT AND RELATED STOCKHOLDER MATTERS.
The information required by Item 12 of Form 10-K is hereby incorporated by reference from the earlier filed of: (i) an amendment to this annual report on Form 10-K or (ii) the Company’s definitive proxy statement which will be filed pursuant to Regulation 14A within 120 days after the Company’s year end for the year covered by this report.
ITEM 13. CERTAIN RELATIONSHIPS AND RELATED TRANSACTIONS, AND DIRECTOR INDEPENDENCE.
The information required by Item 13 of Form 10-K is hereby incorporated by reference from the earlier filed of: (i) an amendment to this annual report on Form 10-K or (ii) the Company’s definitive proxy statement which will be filed pursuant to Regulation 14A within 120 days after the Company’s year end for the year covered by this report.
ITEM 14. PRINCIPAL ACCOUNTING FEES AND SERVICES.
The information required by Item 14 of Form 10-K is hereby incorporated by reference from the earlier filed of: (i) an amendment to this annual report on Form 10-K or (ii) the Company’s definitive proxy statement, which will be filed pursuant to Regulation 14A within 120 days after the Company’s year end for the year covered by this report.
PART IV
ITEM 15. EXHIBITS AND FINANCIAL STATEMENT SCHEDULES.
(a) The following documents are filed as a part of this report:
(1) Financial Statements included in Item 8 herein.
(2) Financial Statement Schedules included in Item 8 herein:
All schedules for which provision is made in the applicable accounting regulations of the Securities and Exchange Commission are not required under the related instructions or are inapplicable and therefore, have been omitted.
(3) Exhibits: The information required by this Item 15(a)(3) is set forth in the Index to Exhibits accompanying this Annual Report on Form 10-K.
SIGNATURES
Pursuant to the requirements of Section 13 or 15(d) of the Securities Exchange Act of 1934, the registrant has duly caused this report to be signed on its behalf by the undersigned, thereunto duly authorized.
|
|
DAWSON GEOPHYSICAL COMAPNY | |
|
|
|
|
|
|
|
|
|
Date: March 16, 2015 |
By: |
/s/ Stephen C. Jumper |
|
|
|
Stephen C. Jumper |
|
|
|
President and Chief Executive Officer |
Pursuant to the requirements of the Securities Exchange Act of 1934, this report has been signed below by the following persons on behalf of the registrant and in the capacities and on the dates indicated.
|
Date: March 16, 2015 |
By: |
/s/ Stephen C. Jumper |
|
|
|
Stephen C. Jumper |
|
|
|
President, Chief Executive Officer and |
|
|
|
Chairman of the Board |
|
|
|
(Principal Executive Officer) |
|
|
|
|
|
Date: March 16, 2015 |
By: |
/s/ Wayne A. Whitener |
|
|
|
Wayne A. Whitener |
|
|
|
Vice Chairman and Director |
|
|
|
|
|
Date: March 16, 2015 |
By: |
/s/ James K. Brata |
|
|
|
James K. Brata |
|
|
|
Executive Vice President and |
|
|
|
Chief Financial Officer |
|
|
|
(Principal Financial and Accounting Officer) |
|
|
|
|
|
Date: March 16, 2015 |
By: |
/s/ William J. Barrett |
|
|
|
William J. Barrett |
|
|
|
Director |
|
|
|
|
|
Date: March 16, 2015 |
By: |
/s/ Craig W. Cooper |
|
|
|
Craig W. Cooper |
|
|
|
Director |
|
|
|
|
|
Date: March 16, 2015 |
By: |
/s/ Gary M. Hoover, Ph.D. |
|
|
|
Gary M. Hoover, Ph. D. |
|
|
|
Director |
|
|
|
|
|
Date: March 16, 2015 |
By: |
/s/ Allen T. McInnes, Ph.D. |
|
|
|
Allen T. McInnes, Ph. D. |
|
|
|
Director |
|
|
|
|
|
Date: March 16, 2015 |
By: |
/s/ Ted R. North |
|
|
|
Ted R. North |
|
|
|
Director |
|
|
|
|
|
Date: March 16, 2015 |
By: |
/s/ Mark A. Vander Ploeg |
|
|
|
Mark A. Vander Ploeg |
|
|
|
Director |
INDEX TO EXHIBITS
|
EXHIBIT |
|
DESCRIPTION |
|
|
|
|
|
#2.1 |
|
Agreement and Plan of Merger, dated October 8, 2014, by and among Dawson Operating Company (f/k/a Dawson Geophysical Company), the Registrant and Riptide Acquisition Corp., filed as Exhibit 2.1 to the Registrant’s Current Report on Form 8-K, filed on October 9, 2014, and incorporated herein by reference. |
|
|
|
|
|
*3.1 |
|
Amended and Restated Certificate of Formation, as amended February 11, 2015. |
|
|
|
|
|
*3.2 |
|
Bylaws, as amended February 11, 2015. |
|
|
|
|
|
4.1 |
|
Form of Specimen Stock Certificate, filed as Exhibit 4.1 to the Registrant’s Current Report on Form 8-K, filed on February 11, 2015, and incorporated herein by reference. |
|
|
|
|
|
10.1 |
|
Amended and Restated Loan and Security Agreement by and between the Registrant and Sovereign Bank, dated September 16, 2009, filed as Exhibit 10.1 to the Registrant’s Current Report on Form 8-K, filed on September 22, 2009 (File No. 001-32472), and incorporated herein by reference. |
|
|
|
|
|
10.2 |
|
Amended and Restated Promissory Note, by and between the Registrant and Sovereign Bank, dated September 16, 2009, filed as Exhibit 10.2 to the Registrant’s Current Report on Form 8-K, filed on September 22, 2009 (File No. 001-32472), and incorporated herein by reference. |
|
|
|
|
|
10.3 |
|
Amendment to Amended and Restated Loan and Security Agreement and Amended and Restated Promissory Note by and between the Registrant and Sovereign Bank, dated September 16, 2010, filed as Exhibit 10.1 to the Registrant’s Form 10-Q for the quarterly period ended September 30, 2010, and incorporated herein by reference. |
|
|
|
|
|
10.4 |
|
Third Amendment to Amended and Restated Loan and Security Agreement and Amendment to Amended and Restated Promissory Note, by and between the Registrant and Sovereign Bank, dated September 16, 2011, filed as Exhibit 10.1 to the Registrant’s Current Report on Form 8-K, filed on September 22, 2011, and incorporated herein by reference. |
|
|
|
|
|
10.5 |
|
Fourth Amendment to Amended and Restated Loan and Security Agreement by and between the Registrant and Sovereign Bank, dated January 26, 2012, filed as Exhibit 10.1 to the Registrant’s Quarterly Report on Form 10-Q for the quarterly period ended September 30, 2012, and incorporated herein by reference. |
|
|
|
|
|
10.6 |
|
Fifth Amendment to Amended and Restated Loan and Security Agreement by and between the Registrant and Sovereign Bank, dated September 16, 2012, filed as Exhibit 10.2 to the Registrant’s Quarterly Report on Form 10-Q for the quarterly period ended September 30, 2012, and incorporated herein by reference. |
|
|
|
|
|
10.7 |
|
Sixth Amendment to Amended and Restated Loan and Security Agreement, by and between the Registrant and Sovereign Bank, dated as of October 11, 2012, filed as Exhibit 10.1 to the Registrant’s Form 10-Q for the quarterly period ended September 30, 2013, and incorporated herein by reference |
|
|
|
|
|
10.8 |
|
Seventh Amendment to Amended and Restated Loan and Security Agreement and Amendment to Amended and Restated Promissory Note, by and between the Registrant and Sovereign Bank, dated as of September 16, 2013, filed as Exhibit 10.2 to the Registrant’s Form 10-Q for the quarterly period ended September 30, 2013, and incorporated herein by reference. |
|
|
|
|
|
10.9 |
|
Eighth Amendment to Amended and Restated Loan and Security Agreement and Amendment to Amended and Restated Promissory Note, by and between the Registrant and Sovereign Bank, dated September 16, 2014, filed as Exhibit 10.1 to the Registrant’s Current Report on Form 8-K, filed on September 19, 2014, and incorporated herein by reference. |
|
+10.10 |
|
The Executive Nonqualified “Excess” Plan Adoption Agreement, filed as Exhibit 10.1 to the Registrant’s Current Report on Form 8-K, filed on January 8, 2013, and incorporated herein by reference. |
|
|
|
|
|
+10.11 |
|
The Executive Nonqualified Excess Plan Document, filed as Exhibit 10.2 to the Registrant’s Current Report on Form 8-K filed on January 8, 2013, and incorporated herein by reference. |
|
|
|
|
|
+10.12 |
|
Form of Indemnification Agreement entered with directors and executive officers, filed as Exhibit 10.1 to the Registrant’s Current Report on Form 8-K, filed on October 9, 2014, and incorporated herein by reference. |
|
|
|
|
|
+10.13 |
|
Employment Agreement, dated October 8, 2014, by and between the Registrant and Stephen C. Jumper, filed as Exhibit 10.5 to the Registrant’s Current Report on Form 8-K, filed on October 9, 2014, and incorporated herein by reference. |
|
|
|
|
|
+10.14 |
|
Employment Agreement, dated October 8, 2014, by and between the Registrant and Wayne A. Whitener, filed as Exhibit 10.2 to the Registrant’s Current Report on Form 8-K, filed on October 9, 2014, and incorporated herein by reference. |
|
|
|
|
|
+10.15 |
|
Employment Agreement, dated October 8, 2014, by and between the Registrant and C. Ray Tobias, filed as Exhibit 10.6 to the Registrant’s Current Report on Form 8-K, filed on October 9, 2014, and incorporated herein by reference. |
|
|
|
|
|
+10.16 |
|
Employment Agreement, dated October 8, 2014, by and between the Registrant and Daniel G. Winn, filed as Exhibit 10.4 to the Registrant’s Current Report on Form 8-K, filed on October 9, 2014, and incorporated herein by reference. |
|
|
|
|
|
+10.17 |
|
Employment Agreement, dated October 8, 2014, by and between the Registrant and James K. Brata, filed as Exhibit 10.3 to the Registrant’s Current Report on Form 8-K, filed on October 9, 2014, and incorporated herein by reference. |
|
|
|
|
|
+10.18 |
|
Employment Agreement, dated October 8, 2014, by and between the Registrant and Christina W. Hagan, filed as Exhibit 10.7 to the Registrant’s Current Report on Form 8-K, filed on October 9, 2014, and incorporated herein by reference. |
|
|
|
|
|
+10.19 |
|
Employment Agreement, dated October 8, 2014, by and between the Registrant and James W. Thomas, filed as Exhibit 10.8 to the Registrant’s Current Report on Form 8-K, filed on October 9, 2014, and incorporated herein by reference. |
|
|
|
|
|
+10.20 |
|
Amended and Restated Dawson Geophysical Company 2006 Stock and Performance Incentive Plan, filed as Exhibit 10.1 to the Registrant’s Current Report on Form 8-K, filed on February 11, 2015, and incorporated herein by reference. |
|
|
|
|
|
+10.21 |
|
Form of Restricted Stock Agreement for the 2006 Plan, filed as Exhibit 10.3 to Dawson Operating Company’s (f/k/a Dawson Geophysical Company) Quarterly Report on Form 10-Q, filed on February 11, 2008 (File No. 001-34404), and incorporated herein by reference. |
|
|
|
|
|
+10.22 |
|
Form of Restricted Stock Agreement for the 2006 Plan, filed as Exhibit 10.5 to Dawson Operating Company’s (f/k/a Dawson Geophysical Company) Annual Report on Form 10-K, filed on December 11, 2013 (File No. 001-34404), and incorporated herein by reference. |
|
|
|
|
|
+10.23 |
|
Form of Restricted Stock Unit Agreement for the 2006 Plan, filed as Exhibit 10.5 to Dawson Operating Company’s (f/k/a Dawson Geophysical Company) Annual Report on Form 10-K, filed on December 11, 2013 (File No. 001-34404), and incorporated herein by reference. |
|
|
|
|
|
+10.24 |
|
Form of Stock Option Agreement for the 2006 Plan, filed as Exhibit 10.4 to Dawson Operating Company’s (f/k/a Dawson Geophysical Company) Quarterly Report on Form 10-Q, filed on February 11, 2008 (File No. 001-34404), and incorporated herein by reference. |
|
+10.25 |
|
Form of Stock Option Agreement for the 2006 Plan, filed as Exhibit 10.9 to Dawson Operating Company’s (f/k/a Dawson Geophysical Company) Annual Report on Form 10-K, filed on December 11, 2013 (File No. 001-34404), and incorporated herein by reference. |
|
|
|
|
|
+10.26 |
|
Dawson Geophysical 2014 Annual Incentive Plan, filed as Exhibit 10.1 to Dawson Operating Company’s (f/k/a Dawson Geophysical Company) Current Report on Form 8-K, filed on November 25, 2013 (File No. 001-34404), and incorporated herein by reference. |
|
|
|
|
|
10.27 |
|
Form of Master Geophysical Data Acquisition Agreement, filed as Exhibit 10.10 to Dawson Operating Company’s (f/k/a Dawson Geophysical Company) Annual Report on Form 10-K, filed on December 5, 2012 (File No. 001-34404), and incorporated herein by reference. |
|
|
|
|
|
10.28 |
|
Form of Supplemental Agreement to Master Geophysical Data Acquisition Agreement, filed as Exhibit 10.11 to Dawson Operating Company’s (f/k/a Dawson Geophysical Company) Annual Report on Form 10-K, filed on December 5, 2012 (File No. 001-34404), and incorporated herein by reference. |
|
|
|
|
|
10.29 |
|
Revolving Line of Credit and Term Loan Agreement, dated as of June 2, 2013, between Dawson Operating Company (f/k/a Dawson Geophysical Company) and Western National Bank, filed as Exhibit 10.1 to Dawson Operating Company’s (f/k/a Dawson Geophysical Company) Current Report on Form 8-K, filed on June 26, 2013 (File No. 001-34404), and incorporated herein by reference. |
|
|
|
|
|
10.30 |
|
Security Agreement, dated as of June 2, 2013, between Dawson Operating Company (f/k/a Dawson Geophysical Company) and Western National Bank, filed as Exhibit 10.2 to Dawson Operating Company’s (f/k/a Dawson Geophysical Company) Current Report on Form 8-K, filed on June 26, 2013 (File No. 001-34404), and incorporated herein by reference. |
|
|
|
|
|
10.31 |
|
Multiple Advance Term Note Agreement, dated as of May 11, 2012, between Dawson Operating Company (f/k/a Dawson Geophysical Company) and Western National Bank, filed as Exhibit 10.1 to Dawson Operating Company’s (f/k/a Dawson Geophysical Company) Quarterly Report on Form 10-Q, filed on August 9, 2012 (File No. 001-34404), and incorporated herein by reference. |
|
|
|
|
|
10.32 |
|
Security Agreement, dated as of May 11, 2012, between Dawson Operating Company (f/k/a Dawson Geophysical Company) and Western National Bank, filed as Exhibit 10.2 to Dawson Operating Company’s (f/k/a Dawson Geophysical Company) Quarterly Report on Form 10-Q, filed on August 9, 2012 (File No. 001-34404), and incorporated herein by reference. |
|
|
|
|
|
10.33 |
|
Multiple Advance Term Note Agreement, dated as of December 2, 2013, between Dawson Operating Company (f/k/a Dawson Geophysical Company) and Western National Bank, filed as Exhibit 10.1 to Dawson Operating Company’s (f/k/a Dawson Geophysical Company) Current Report on Form 8-K, filed on December 10, 2013 (File No. 001-34404), and incorporated herein by reference. |
|
|
|
|
|
10.34 |
|
Security Agreement, dated as of December 2, 2013, between Dawson Operating Company (f/k/a Dawson Geophysical Company) and Western National Bank, filed as Exhibit 10.2 to Dawson Operating Company’s (f/k/a Dawson Geophysical Company) Current Report on Form 8-K, filed on December 10, 2013 (File No. 001-34404), and incorporated herein by reference. |
|
|
|
|
|
*21.1 |
|
Subsidiaries of the Registrant. |
|
|
|
|
|
*23.1 |
|
Consent of Lane Gorman Trubitt, PLLC, independent registered public accountants to incorporation of report by reference. |
|
|
|
|
|
*31.1 |
|
Certification of Chief Executive Officer pursuant to 18 U.S.C. Section 1350, as adopted pursuant to Section 302 of the Sarbanes-Oxley Act of 2002. |
|
|
|
|
|
*31.2 |
|
Certification of Chief Financial Officer pursuant to 18 U.S.C. Section 1350, as adopted pursuant to Section 302 of the Sarbanes-Oxley Act of 2002. |
|
*32.1 |
|
Certification of Chief Executive Officer pursuant to 18 U.S.C. Section 1350, as adopted pursuant to Section 906 of the Sarbanes-Oxley Act of 2002. |
|
|
|
|
|
*32.2 |
|
Certification of Chief Financial Officer pursuant to 18 U.S.C. Section 1350, as adopted pursuant to Section 906 of the Sarbanes-Oxley Act of 2002. |
|
|
|
|
|
101.INS* |
|
XBRL Instance Document. |
|
|
|
|
|
101.SCH* |
|
XBRL Taxonomy Extension Schema Document. |
|
|
|
|
|
101.CAL* |
|
XBRL Taxonomy Extension Calculation Linkbase Document. |
|
|
|
|
|
101.DEF* |
|
XBRL Taxonomy Extension Definition Linkbase Document. |
|
|
|
|
|
101.LAB* |
|
XBRL Taxonomy Extension Labels Linkbase Document. |
|
|
|
|
|
101.PRE* |
|
XBRL Taxonomy Extension Presentation Linkbase Document. |
* Filed herewith.
+ Management contract or compensatory plan or arrangement.