Attached files
| file | filename |
|---|---|
| EXCEL - IDEA: XBRL DOCUMENT - Alliance HealthCare Services, Inc | Financial_Report.xls |
| EX-31.1 - EXHIBIT 31.1 - Alliance HealthCare Services, Inc | aiq-12312014xex311.htm |
| EX-23.1 - EXHIBIT 23.1 - Alliance HealthCare Services, Inc | aiq-12312014xex231.htm |
| EX-31.2 - EXHIBIT 31.2 - Alliance HealthCare Services, Inc | aiq-12312014xex312.htm |
| EX-32 - EXHIBIT 32 - Alliance HealthCare Services, Inc | aiq-12312014xex32.htm |
UNITED STATES
SECURITIES AND EXCHANGE COMMISSION
Washington, D.C. 20549
FORM 10-K
ý | ANNUAL REPORT PURSUANT TO SECTION 13 OR 15(d) OF | |
THE SECURITIES EXCHANGE ACT OF 1934
For the fiscal year ended: December 31, 2014
OR
¨ | TRANSITION REPORT PURSUANT TO SECTION 13 OR 15(d) OF | |
THE SECURITIES EXCHANGE ACT OF 1934
For the transition period from to
Commission File Number: 1-16609
ALLIANCE HEALTHCARE SERVICES, INC.
(Exact name of registrant as specified in its charter)
DELAWARE | 33-0239910 | |
(State or other jurisdiction of incorporation or organization) | (IRS Employer Identification Number) | |
100 Bayview Circle, Suite 400, Newport Beach, California 92660
(Address of principal executive office)
Registrant’s telephone number, including area code: (949) 242-5300
Securities registered pursuant to Section 12(b) of the Act:
Title of Each Class | Name of Each Exchange on Which Registered | |
Common Stock, Par Value $0.01 | NASDAQ Stock Market, LLC | |
Securities registered pursuant to Section 12(g) of the Act:
None
Indicate by check mark if the registrant is a well-known seasoned issuer, as defined in Rule 405 of the Securities Act. Yes ¨ No ý
Indicate by check mark if the registrant is not required to file reports pursuant to Section 13 or Section 15(d) of the Act. Yes ¨ No ý
Indicate by check mark whether the registrant (1) has filed all reports required to be filed by Section 13 or 15(d) of the Securities Exchange Act of 1934 during the preceding 12 months (or for such shorter period that the registrant was required to file such reports), and (2) has been subject to such filing requirements for the past 90 days. Yes ý No ¨
Indicate by check mark whether the registrant has submitted electronically and posted on its corporate Web site, if any, every Interactive Data File required to be submitted and posted pursuant to Rule 405 of Regulation S-T during the preceding 12 months (or for such shorter period that the registrant was required to submit and post such files). Yes ý No ¨
Indicate by check mark if disclosure of delinquent filers pursuant to Item 405 of Regulation S-K is not contained herein, and will not be contained, to the best of registrant’s knowledge, in definitive proxy or information statements incorporated by reference in Part III of this Form 10-K or any amendment to this Form 10-K. ¨
Indicate by check mark whether the registrant is a large accelerated filer, an accelerated filer, a non-accelerated filer, or a smaller reporting company. See the definitions of “large accelerated filer,” “accelerated filer” and “smaller reporting company” in Rule 12b-2 of the Exchange Act.
Large accelerated filer | ¨ | Accelerated filer | ý |
Non-accelerated filer | ¨ (Do not check if a smaller reporting company) | Smaller reporting company | ¨ |
Indicate by check mark whether the registrant is a shell company (as defined in Rule 12b-2 of the Act). Yes ¨ No ý
The aggregate market value of the voting and non-voting common equity held by non-affiliates of the registrant as of June 30, 2014, based upon the closing price of the Common Stock as reported by The NASDAQ Stock Market, LLC on such date, was $129.1 million.
The number of shares outstanding of Common Stock, $.01 par value, as of March 12, 2015 was 10,748,109 shares.
Documents Incorporated by Reference
The registrant’s definitive proxy statement for the Annual Meeting of Stockholders, to be filed within 120 days of December 31, 2014 is incorporated by reference into Part III of this Annual Report on Form 10-K to the extent stated herein.
PART I
Cautionary Statement Regarding Forward-looking Statements
This Annual Report on Form 10-K, including Item 1, Business; Item 1A, Risk Factors; and Item 7, Management’s Discussion and Analysis of Financial Condition and Results of Operations, particularly in the section entitled Liquidity and Capital Resources, and elsewhere in this Annual Report on Form 10-K, includes “forward-looking statements” within the meaning of the safe harbor provisions of the Private Securities Litigation Reform Act of 1995.
In some cases you can identify these statements by forward-looking words, such as “may,” “will,” “should,” “expect,” “plan,” “anticipate,” “believe,” “estimate,” “predict,” “seek,” “intend” and “continue” or similar words. Forward-looking statements may also use different phrases. Forward-looking statements address, among other things, our future expectations, projections of our future results of operations or of our financial condition and other forward-looking information and include statements related to the Company’s improvement plan, including its efforts to stabilize and grow the Radiology Division, grow the Radiation Oncology Division, and increase organizational efficiency through the Journey to Excellence and Project Phoenix initiative, as well as expected annualized savings.
Statements regarding the following subjects, among others, are forward-looking by their nature:
(a) future legislation and other healthcare regulatory reform actions, and the effect of that legislation and other regulatory actions on our business,
(b) our expectations with respect to future radiology services and radiation oncology volumes and revenues,
(c) the effect of seasonality on our business,
(d) expectations with respect to capital expenditures in 2015,
(e) the effect of recent accounting pronouncements on our results of operations and cash flows or financial position,
(f) our business and strategic plans, including the effect of growth and cost-cutting initiatives,
(g) our compliance with legal and regulatory requirements,
(h) compliance with our debt covenants,
(i) unrecognized tax benefits and the adequacy of our tax provisions, and
(j) our belief regarding the sufficiency of our cash and cash equivalents to meet our working capital, capital expenditure and other cash needs.
We believe it is important to communicate our expectations to our investors. There may be events in the future, however, that we are unable to predict accurately or that we do not fully control that cause actual results to differ materially from those expressed or implied by our forward-looking statements, including:
• | our high degree of leverage and our ability to service our debt; |
• | factors affecting our leverage, including interest rates; |
• | the risk that the counterparties to our interest rate swap agreements fail to satisfy their obligations under those agreements; |
• | our ability to obtain financing; |
• | the effect of operating and financial restrictions in our debt instruments; |
• | the accuracy of our estimates regarding our capital requirements; |
• | intense levels of competition and overcapacity in our industry; |
• | changes in the rates or methods of third-party reimbursements for diagnostic imaging and radiation oncology services; |
• | fluctuations or unpredictability of our revenues, including as a result of seasonality; |
• | changes in the healthcare regulatory environment; |
• | our ability to keep pace with technological developments within our industry; |
• | the growth or decline in the market for MRI and other services; |
• | the disruptive effect of natural disasters, including weather; |
2
• | adverse changes in general domestic and worldwide economic conditions and instability and disruption of credit and equity markets; |
• | our ability to successfully integrate acquisitions; and |
• | other factors discussed under Risk Factors in this Annual Report on Form 10-K and that are otherwise described or updated from time to time in our SEC reports. |
This Annual Report on Form 10-K includes statistical data that we obtained from public industry publications. These publications generally indicate that they have obtained their information from sources believed to be reliable but they do not guarantee the accuracy and completeness of their information. Although we believe that the publications are reliable, we have not independently verified their data.
3
ITEM 1. | BUSINESS |
General
We are a leading national provider of advanced outpatient diagnostic and radiation therapy services, based upon annual revenue and number of systems deployed. Our principal sources of revenue are derived from providing magnetic resonance imaging (“MRI”) and positron emission tomography/computed tomography (“PET/CT”) services through our Radiology Division and radiation oncology services through our Radiation Oncology Division. Unless the context otherwise requires, the words “we,” “us,” “our,” “Company” or “Alliance” as used in this Annual Report on Form 10-K refers to Alliance HealthCare Services, Inc. and our direct and indirect subsidiaries. We provide radiology and therapeutic services primarily to hospitals and other healthcare providers on a shared-service and full-time service basis. We also provide services through fixed-site imaging centers, primarily to hospitals or health systems. Our radiology services normally include the use of our imaging systems, technologists to operate the systems, equipment maintenance and upgrades and management of day-to-day shared-service and fixed-site diagnostic imaging operations. We also provide non scan-based services, which include only the use of our imaging systems under a short-term contract. We operate our radiation oncology business through our wholly owned subsidiary, Alliance Oncology, LLC, which we sometimes refer to as our Radiation Oncology Division. This division includes a wide range of services for cancer patients covering initial consultation, preparation for treatment, simulation of treatment, actual radiation oncology delivery, therapy management and follow-up care. Our services include the use of our linear accelerators or stereotactic radiosurgery systems, therapists to operate those systems, administrative staff, equipment maintenance and upgrades, and management of day-to-day operations.
MRI, PET/CT and radiation oncology services generated 41%, 31% and 21% of our revenue, respectively, for the year ended December 31, 2014 and 42%, 32% and 17% of our revenue, respectively, for the year ended December 31, 2013. Our remaining revenue was comprised of other modality diagnostic imaging services revenue, primarily computed tomography (“CT”), professional radiology services, and management contract revenue. We had 505 diagnostic imaging and radiation oncology systems, including 258 MRI systems (of which 19 are operating leases), 124 PET/CT systems (of which 9 are operating leases), and 48 radiation oncology systems, and served over 1,000 clients in 43 states at December 31, 2014. We operated 117 fixed-site imaging centers (one in an unconsolidated joint venture), which constitute systems installed in hospitals or other medical buildings on or near hospital campuses, including modular buildings, systems installed inside medical groups’ offices, parked mobile systems, and free-standing fixed-site imaging centers, which include systems installed in a medical office building, ambulatory surgical center, or other retail space at December 31, 2014. Of the 117 fixed-site imaging centers, 85 were MRI fixed-site imaging centers, 19 were PET/CT fixed-site imaging centers, 13 were other modality fixed-site imaging centers and one was in an unconsolidated joint venture. We also operated 31 radiation oncology centers and stereotactic radiosurgery facilities (including one radiation oncology center as an unconsolidated joint venture) at December 31, 2014.
Revenues from fixed-site imaging centers and radiation oncology centers can be structured as either “wholesale” or “retail” revenues. We generated approximately 80% of our revenues for the years ended December 31, 2013 and 2014 by providing services to hospitals and other healthcare providers, which we refer to as “wholesale” revenues. We typically generate our wholesale revenues from contracts that require our clients to pay us based on the number of scans or treatments we perform on patients on our clients’ behalf, although some pay us a flat fee for a period of time regardless of the number of scans or treatments we perform. Wholesale payments are due to us independent of our clients’ receipt of retail reimbursement from third-party payors, although receipt of reimbursement from third-party payors may affect demand for our services. We typically deliver our services for a set number of days per week through exclusive, long-term contracts with hospitals and other healthcare providers. The initial terms of these contracts average approximately three years in length for mobile imaging services and approximately five to 10 years in length for fixed-site imaging arrangements. Our contracts for radiation oncology services average approximately 10 to 20 years in length. These contracts often contain automatic renewal provisions and certain contracts have cancellation clauses if the hospital or other healthcare provider purchases its own system. We price our contracts based on the type of system used, the scan or treatment volume, and the number of ancillary services provided. Competitive pressures also affect our pricing.
We generated approximately 20% of our revenues for the years ended December 31, 2014 and 2013 by providing services directly to patients from our sites located at or near hospitals or other healthcare provider facilities, which we refer to as “retail” revenues. We generate our revenue from these sites from direct billings to patients or their third-party payors, including Medicare, and we record this revenue net of contractual discounts and other arrangements for providing services at discounted prices. We typically receive a higher price per scan, or treatment, under retail billing than we do under wholesale billing.
Our clients contract with us to provide radiology and radiation oncology services to:
• | take advantage of our extensive radiology and radiation oncology service line management experience; |
4
• | avoid capital investment and financial risk associated with the purchase of their own systems; |
• | provide access to diagnostic imaging, radiation oncology and other services for their patients when the demand for these services does not justify the purchase of dedicated, full-time systems; |
• | benefit from upgraded imaging and radiation oncology systems and technology without direct capital expenditures; |
• | eliminate the need to recruit, train and manage qualified technologists or therapists and oncologists; |
• | make use of our ancillary services; and |
• | gain access to services under our regulatory and licensing approvals when they do not have these approvals. |
We were incorporated in the state of Delaware on May 27, 1987.
Significant 2014 Corporate Events
In March 2014, we entered into an arrangement to be affiliated with The Medical University of South Carolina ("MUSC"), a top academic health science center, to strengthen and expand MUSC’s Hollings Cancer Center as the radiation therapy market leader in Charleston, South Carolina. Through this long-term affiliation, we began work with Hollings Cancer Center and its affiliated physicians to deliver market and operational support, as well as management services for the entire radiation therapy department. This encompasses Hollings’ inpatient, outpatient, and satellite locations where radiation therapy treatments are performed and comprises all current radiation therapy services, including an arrangement to evaluate and expand Hollings’ presence throughout the region. The expansion of MUSC’s Hollings Cancer Center includes multiple new radiation therapy and radiosurgery technologies and equipment, new physics and radiation treatment systems—providing cutting-edge radiation therapy and stereotactic radiosurgery treatment advancements for cancer patients in the South Carolina region.
In May 2014, as part of our strategic RAD360TM vision to help hospitals and healthcare providers optimize their radiology service line, we acquired the assets of Vertical Health Solutions, Inc., doing business as OnPoint Medical Diagnostics, a healthcare IT start-up providing medical imaging quality assurance technologies. The acquisition added to our full-service radiology capabilities, while expanding OnPoint’s existing pool of big data aggregation technology platform. OnPoint is currently implemented in several hospitals and imaging centers in various states, benefiting from more than 250 diagnostic imaging systems that continually send performance data to OnPoint's cloud-based software, which automates the quality control process, allowing hospitals and imaging providers to manage every scanner in their facilities in a fraction of the time required to manually complete the quality control process. OnPoint’s abilities include real-time dashboards, analytics, and results trending that automate the quality control measures required for accreditation by the American College of Radiology. By identifying preventative maintenance opportunities before they impact clinical results and eliminating manual processes and measurements, radiology service providers achieve greater efficiency and control over their equipment, operations, costs, and profitability.
In November 2014, we invested $14.4 million, net of cash received, to acquire 50% controlling equity interest in the formation of a joint venture between Charleston Area Medical Center (CAMC) and Charleston Radiation Therapy Consultants, which will establish a new, state-of-the-art radiation therapy department at the CAMC Cancer Center that will utilize the latest in cancer technologies and treatments. In addition, Alliance Oncology has assumed full operational responsibility for the existing radiation oncology units at multiple locations in the Charleston, West Virginia area.
Industry Overview
Radiology is a medical specialty that employs the use of imaging to diagnose disease visualized within the human body. Radiology services are delivered through providing diagnostic imaging services, which are noninvasive procedures that generate representations of the internal anatomy and convert them to film or digital media. Diagnostic imaging systems facilitate the early diagnosis of diseases and disorders, often minimizing the cost and amount of care required and reducing the need for costly and invasive diagnostic procedures. MRI and PET/CT services have historically comprised the majority of our radiology revenue. Radiation oncology is the practice of delivering ionizing radiation therapy to treat malignant and benign disease processes under the direction of a radiation oncologist. The market of radiation oncology providers is highly fragmented with approximately 70% of services performed in hospitals.
MRI
MRI technology involves the use of high-strength magnetic fields to produce computer-processed cross-sectional images of the body. Due to its superior image quality, MRI is the preferred imaging technology for evaluating soft tissue and organs, including the brain, spinal cord and other internal anatomy. With advances in MRI technology, MRI is increasingly being used for new applications such as imaging of the heart, chest and abdomen. MRI can detect conditions like multiple sclerosis, tumors, strokes, infections, and injuries to the spine, joints, ligaments, and tendons, among others. Unlike X-Rays and CT, which are other diagnostic imaging technologies, MRI does not expose patients to potentially harmful radiation.
5
MRI technology was first patented in 1974, and MRI systems first became commercially available in 1983. Since then, manufacturers have offered increasingly sophisticated MRI systems and related software to increase the speed of each scan and improve image quality. Magnet strengths are measured in tesla, and MRI systems typically use magnets with strengths ranging from 0.2 to 3.0 tesla. The 1.0 and 1.5 tesla strengths are generally considered optimal because they are strong enough to produce relatively fast scans but are not so strong as to create discomfort for most patients. Manufacturers have worked to gradually enhance other components of the machines to make them more versatile. Many of the hardware and software systems in recently manufactured machines are modular and can be upgraded for much lower costs than purchasing new systems.
The MRI industry has historically experienced growth as a result of:
• | recognition of MRI as a cost-effective, noninvasive diagnostic tool; |
• | superior soft-tissue image quality of MRI versus that of other diagnostic imaging technologies; |
• | wider physician acceptance and availability of MRI technology; |
• | growth in the number of MRI applications; |
• | MRI’s safety when compared to other diagnostic imaging technologies, because it does not use potentially harmful radiation; and |
• | increased overall demand for healthcare services, including radiology services, for the aging population. |
PET, PET/CT and CT
Positron emission tomography ("PET") is a nuclear medicine procedure that produces images of the body’s metabolic and biologic functions. PET can provide earlier detection of certain cancers, coronary diseases or neurologic problems than other diagnostic imaging systems. It is also useful for the monitoring of these conditions. PET can detect the presence of disease at an early stage. The ability of PET technology to measure metabolic activity assists in the identification of lesions and the assessment of organ health. A growing body of clinical research supports PET as a diagnostic tool for cancer diagnosis, staging, and treatment monitoring. Early detection of these conditions enables a broader range of treatments. The expansion of Centers for Medicare & Medicaid Services (“CMS”) coverage has driven the growth of PET. Since 1998, CMS has expanded coverage of PET procedures to include the diagnosis, staging, and restaging of lung, esophageal, colorectal, breast, head and neck cancers, lymphoma, and melanoma. Additionally, Medicare covers the use of PET scans for the diagnosis and treatment of dementia and neurodegenerative diseases, as well as for brain, cervical, ovarian, pancreatic, small lung cell, and testicular cancers. Under CMS’s current national coverage determination, PET is covered for the detection of pre-treatment metastases in newly diagnosed cervical cancer, as well as for brain, ovarian, pancreatic, small cell lung, and testicular cancers, where provided as part of certain types of clinical trials. In April 2009, CMS adopted a coverage framework that replaces the four-part diagnosis, staging, restaging and monitoring categories with a two-part framework. This new framework differentiates fluorodeoxyglucose (“FDG”) PET imaging used to inform the initial treatment strategy from other uses to guide subsequent treatment strategies after the completion of initial treatment. This change applies to all national coverage determinations that address coverage of FDG PET for oncologic conditions.
In CT imaging, a computer analyzes the information received from an X-Ray beam to produce multiple cross-sectional images of a particular organ or area of the body. CT imaging is used to detect tumors and other conditions affecting bones and internal organs.
A PET/CT system fuses together the results of a PET and CT scan at the scanner level. The PET portion of the scan detects the metabolic signal of cancer cells and the CT portion of the scan provides a detailed image of the internal anatomy that reveals the location, size and shape of abnormal cancerous growths.
Other Diagnostic Imaging Services
Other diagnostic imaging technologies include: nuclear medicine or gamma camera, ultrasound, mammography, bone densitometry and general X-Ray.
Radiation Oncology
Radiation oncology is the medical practice of delivering radiation therapy under the direction of a trained physician, a radiation oncologist. Radiation oncology uses ionizing radiation to most commonly treat cancer, along with non-malignant conditions. In general, radiation therapy is delivered in daily treatments over a period that varies from a single day (single treatment) to many weeks (40 or more treatments). Ionizing radiation damages a cell's DNA and other vital macromolecules that the cell and the body then has to repair. Cancer cells are less able to repair the DNA and macromolecules damage than are normal healthy cells, which usually can repair the damage in the first 4-6 hours after an individual treatment. Over the period during and after the radiation therapy is delivered in one or more daily radiation therapy treatments, the cancer cells are preferentially destroyed while normal cells are able to recover. Eventually, the cancer cells within the irradiated volume are
6
reduced in number and eradicated while the normal surrounding tissue survives-effecting a cure, or control of the disease in that treated volume.
We estimate that approximately 60% of all newly diagnosed cancer patients today will be treated with some form of radiation therapy for their cancer therapy, throughout their life time. Radiation therapy often is used together with other oncology treatments such as chemotherapy and surgery. A typical radiation oncology department provides a wide range of services for cancer patients. These include: initial consultation; preparation for treatment; imaging, planning, and simulation for the treatment; delivery of radiation therapy treatments; management of the total course of therapy; and follow-up care. A number of different technologies can deliver the radiation, including linear accelerators and radioactive isotopes.
Our radiation oncology business offers the following treatment options:
• | Conventional beam therapy (“CBT”). CBT is the least sophisticated, but the most established form of radiation therapy delivered by a linear accelerator. It is the simplest form to deliver, using two dimensional planning, and is typically reserved for use in patients where high precision and conformality of the radiation therapy is not required or when a cure is not envisioned (palliative care). |
• | 3-D conformal radiation therapy (“3D-CRT”). 3D-CRT uses three dimensional imaging data and three dimensional treatment planning to more accurately and effectively plan and deliver linear accelerator radiation treatments. It is the most common form of technology used in practices and may be supplanted by IMRT or in conjunction with IGRT when the specific case requires a higher level of precision or conformality. |
• | Intensity modulated radiation therapy (“IMRT”). IMRT entails the use of hundreds to thousands of beams or beamlets of radiation delivered by a linear accelerator whose intensity is adjusted individually during that actual daily treatment delivery to allow the radiation that is delivered to conform as closely as possible to the three dimensional volume of the tumor and simultaneously reduce the dose to neighboring normal healthy tissues. It requires extremely sophisticated and time consuming treatment planning to determine what beam's shapes and orientations should be used and what their intensities should be to provide the optimal patient treatment based on the patient's anatomy of their normal tissues and the targeted tumor volume. Extensive treatment quality assurance is required to insure that all the beams are modulated and delivered correctly. |
• | Image guided radiation therapy (“IGRT”). IGRT uses a number of different types of imaging technologies to localize precisely the patient and the tumor target volume at the time of each treatment delivery to ensure that the radiation is delivered to the correct location. IGRT is not a radiation treatment in and of itself; it is used in support of advanced forms of treatment delivery such as 3D-CRT, IMRT, stereotactic body radiotherapy and stereotactic radiosurgery. |
• | Stereotactic radiosurgery (“SRS”) and Stereotactic Body Radiotherapy (“SBRT”). Originally developed for intracranial applications (SRS) but now being used in a range of extracranial applications (SBRT) such as spine, lung, liver, prostate, and other disease sites, SRS/SBRT delivers a very high dose of radiation in one to five treatments as opposed to the 10 to 40 treatments used for 3D-CRT, IMRT and IGRT. SRS/SBRT needs to be as precisely planned for and delivered as possible because a very high dose of radiation therapy is delivered in five or fewer treatments and results in a more potent dose effect that destroys all cells, cancer and normal alike, that reside within the targeted volume; this results in a “surgical ablative” response to the treated volume. SRS/SBRT is delivered with a range of advanced technologies such as the CyberKnife®, Gamma Knife®, BrainLab™, Novalis-Tx™, TrueBeam STx™, Trilogy™, VERO, TomoTherapy®, Elekta Infinity™ and Axesse™. |
• | Low dose rate brachytherapy (“LDR”). LDR allows the radiation oncologist to treat cancer by delivering the dose of radiation from the “inside out.” Radioactive isotopes encased in a metal jacket the size of a grain of rice (“seeds”) are implanted directly in the tumor through needles, with the seeds permanently left in place, or left in place temporarily within catheters (thin hollow tubes) and removed with the catheters when treatment is completed. The radioactive isotopes decay over time (days to years) to an inert form and in the process gradually release ionizing radiation, called gamma rays, which are generally of low energy and thus deposit their therapy over short distances thereby treating the cancer over time (hours to days). |
• | High dose rate brachytherapy (“HDR”). Like LDR, HDR allows the radiation oncologist to treat cancer by delivering the dose of radiation from the “inside out.” Unlike LDR, HDR utilizes temporary seeds, made of radioactive isotopes, that deliver a much higher dose of radiation over a much shorter period of time. These seeds are inserted and removed several times, over several minutes, one to two times per day, for 1-30 treatments delivered over 1-45 days, through catheters that are left in place for the entire course of care and then removed when the treatment course is completed. |
Radiology and Radiation Oncology Settings
We typically provide radiology services and radiation oncology services in one of the following settings:
7
• | Outsourced. Imaging systems, largely located in mobile trailers but also provided in fixed facilities, provide services to a hospital or clinic on a shared-service or full-time basis. Generally, the hospital or clinic contracts with the radiology service provider to perform scans of its patients, and that hospital or clinic, instead of a third-party payor, pays the radiology service provider directly. |
• | Hospitals and clinics. Imaging and/or radiation oncology systems are located in a hospital or clinic. These systems are primarily used by patients of the hospital or clinic, and the hospital or clinic bills third-party payors, such as health insurers, including Medicare or Medicaid. |
• | Independent centers. Systems are located in permanent facilities not generally owned by hospitals or clinics. These centers depend upon physician referrals for their patients and generally do not maintain dedicated, contractual relationships with hospitals or clinics. Typically these centers are in markets in which strategic hospital partners are not available, but services are still needed. Like hospitals and clinics, these centers bill third-party payors for their services. |
All of our radiation oncology services are provided in a hospital setting or at an independent radiation oncology center.
Our Competitive Strengths
Comprehensive radiology and radiation oncology solutions
We offer our clients a comprehensive radiology and radiation oncology solution, as well as ancillary services, such as marketing support, quality patient care programs, education, training, billing assistance and cost optimization management. In many cases, we provide services under our regulatory and licensing approvals for clients who lack that authority. We believe that a comprehensive service solution is an important factor when potential clients select a radiology or radiation oncology provider.
Deep relationships which allow us better opportunities to expand our service offerings.
We have relationships with more than 1,000 hospitals and healthcare providers in 43 states throughout the nation. This national footprint enabled us to leverage our position as a trusted partner to healthcare providers to expand our services beyond radiology and into radiation oncology, transforming us into a more complete outsourced service partner to our clients.
A leading national provider of shared-service and fixed-site MRI and PET/CT services
We are a leading national provider of shared-service and fixed-site MRI and PET/CT services, based on annual revenue and number of diagnostic imaging systems deployed. As of December 31, 2014, we had 258 MRI systems and 124 PET/CT systems in operation. Our size allows us to achieve operating, sourcing and administrative efficiencies, including (i) the ability to maximize utilization through efficient deployment of our mobile systems and (ii) equipment and medical supply sourcing savings and favorable maintenance contracts from equipment manufacturers and other suppliers.
Exclusive, long-term contracts with a diverse client base
We primarily generate revenues from exclusive, long-term contracts with hospitals and other healthcare providers. These contracts average approximately three years in length for mobile services, approximately five to 10 years in length for fixed-site arrangements and approximately 10 to 20 years in length for radiation oncology contracts. During the year ended December 31, 2014, no single client accounted for more than 3% of our revenue.
Reduced reimbursement risk
For the year ended December 31, 2014, we generated approximately 80% of our revenues by billing hospitals and other healthcare providers rather than billing patients or other third-party payors directly. These payments are due to us regardless of the clients’ receipt of payment from patients or reimbursement from third-party payors, including commercial payors, Medicare and Medicaid. Importantly, this contrasts with the vast majority of other diagnostic imaging and radiation oncology providers, who typically collect directly from patients and third-party payors and are therefore directly exposed to reimbursement cuts and higher experiences of bad debt. Our wholesale model reduces our exposure to patient bad debt, as evidenced by our bad debt expense of only 0.6% of revenues for the year ended December 31, 2014. Further, our short-term exposure to Medicare reimbursement cuts is limited because we received only approximately 4% of our imaging revenues directly from Medicare for the year ended December 31, 2014.
Significant cash flow generation
We have generated significant cash flows and have maintained attractive earnings from revenue less cost of revenue, excluding depreciation and amortization, and selling, general and administrative expenses over a sustained period of time. We attribute our strong cash flows and margins to: (1) comprehensive radiology and radiation oncology solutions, (2) the
8
substantial value proposition for customers, (3) the strength of our customer relationships, (4) the largely wholesale nature of our revenues and (5) our economies of scale.
Experienced management team
Our senior management team consists of professionals with significant experience within the hospital and healthcare services industry. Our experienced management team includes six senior executive officers who average approximately 25 years of industry experience.
Advanced MRI, PET/CT, and radiation oncology systems
Our technologically advanced imaging systems can perform high quality scans more rapidly and can be used for a wider variety of imaging applications than less advanced systems. Moreover, technological change in this field is gradual and most of our systems can be upgraded with software and hardware enhancements, which should allow us to continue to provide advanced technology without replacing entire systems. Our radiation oncology services use advanced radiation oncology technology, including IGRT, IMRT and SRS.
Our Services
We provide our outsourced imaging services, as of December 31, 2014, on the following bases:
• | Shared Service. We offered 58% of our systems on a part-time basis. These systems are located in mobile trailers that we transport to our clients’ locations. We schedule deployment of these mobile systems so that multiple clients can share use of the same system. The typical shared-service contract has a term of approximately three years. |
• | Full-Time Service. We offered 29% of our systems on a full-time, long-term basis. These systems are located in either mobile units or buildings located at or near a hospital or clinic. We provide full-time service systems for the exclusive use of a particular hospital or clinic. We typically offer full-time services under contracts that range from five to 10 years in length. Our relationships with our higher-volume shared-service clients have, from time to time, evolved into full-time arrangements. |
• | Interim and Rental Services. We offered 14% of our systems to clients on an unstaffed basis. These systems are located in mobile trailers that we transport to our clients’ locations. These clients may be unable to maintain the extra capacity to accommodate periods of peak demand for imaging services or may require temporary assistance until they can develop permanent imaging service centers at or near their facilities. Generally, we do not provide technologists to operate our systems in these arrangements. |
We offer all of our radiation oncology services on a full-time, long-term basis.
Our Strategy
We are committed to executing on the three critical elements to drive our long-term growth. The three critical elements that we have defined to drive Alliance's continued success are:
• | to increase the competitive intensity within our core mobile and supplemental radiology service while transforming our radiology business into the outsource partner of choice for hospitals and health systems looking to optimize their radiology service line through the Rad360TM program |
• | accelerate the growth in radiation oncology services by investing in business development resources |
• | build upon our launch of a new interventional services division, with a particular focus on interventional pain management |
• | to drive a performance based culture, enabling us to deliver efficient, low cost solutions to our customers and capture market share through effective sales and marketing programs. |
Increase the competitive intensity within our core mobile and supplemental radiology service while transforming our radiology solutions through the Rad360TM program
Our Radiology Division has proactively defined and developed a plan to grow radiology services, which we will execute on through further development and refinement of our value proposition, or Alliance Rad 360TM.
We believe we are a leading partner to hospitals for the services we provide. Our traditional core model is well received and has a proven track record of success. Alliance is building on the success of this model by creating a comprehensive suite of capabilities in operating inpatient and outpatient radiology services that we believe will make us indispensable to our
9
customers, and open our opportunities to encompass the entire radiology services market. To that end, Alliance Imaging has transitioned to become Alliance Radiology, which better describes our ability to be a complete radiology services outsource provider. We will continue to offer the traditional services for which Alliance is well known, however, our expanded offerings are being designed to maximize the profitability of the radiology service line for our hospital customers. We intend to help augment the performance of radiology departments by offering expert consulting and value-added services such as- strategy and analytics, demand generation, market intelligence, staff recruiting and training, understanding referral patterns, exam appropriateness and diagnostic quality, as well as best-in-class operational excellence initiatives and efficiencies.
In order to best understand our customer specific needs, we undertook extensive market and customer segmentation work, which we have used to tailor the value proposition to different types, or segments, of hospital customers. Additionally, we are strategically forming relationships and aligning ourselves with hospital systems that are positioned for long-term success in the industry, including system-wide relationships, to augment our portfolio of regional and community-based providers. We believe that our Alliance RAD360TM strategy will allow us to grow with these hospitals operators, providing a 360 degree view of Radiology Services and the expertise to diagnose, plan, execute, measure and deliver improvement. We have also expanded our business model to include focus on joint ventures, multi-modality centers and operating full radiology departments.
To support the growth of radiology services, we have divided the sales and business development function into three teams with an executive leading each team. The first team is focused on driving new, high-quality sales opportunities within our radiology business more quickly, the second team is dedicated to improving contract renewals and expanding services with existing customers, and the third team is focused on driving growth through the RAD360TM specific strategic initiatives. Some of our sales initiatives include assessing talent and staffing levels, new training programs and next-generation sales force management program development, which includes defining new sales and renewals processes, metrics and redesigned reporting. We are focused on continuing to improve sales management and sales support infrastructure to increase the pace of new business and retain current customers through renewals. We believe a strengthened sales force will enable us to further diversify our business, pursue growth in low market share territories and focus on converting mature mobile customers to fixed-sites. We believe that the ability of our sales force to effectively cross-sell our radiology and radiation oncology services will provide us with future growth and margin enhancement.
Finally, in conjunction with our refined sales and business development strategy, we have launched a process to revamp our core marketing processes. This initiative includes new training programs for our account executives, identifying core metrics and dashboards to be monitored against, developing territory plans and implementing a national marketing program, which includes new messaging, collateral and content management. Additionally, we are refocusing the Radiology Division's marketing footprint by identifying locations with high probability for success given macro factors, contractual factors and renewal priorities.
Accelerate the growth in radiation oncology services by investing in business development resources
Radiation oncology is an established, growing form of treatment that has exhibited strong operating margins and a strong return on investment for us to date. Radiation oncology represents a significant opportunity for us, as we believe PET/CT technology is increasingly used for the early detection of cancer and approximately 50-60% of new cancer cases are treated with radiation oncology each year. Our Radiation Oncology Division has grown significantly over the past few years through both de-novo development and strategic acquisitions. For example, through the acquisition of US Radiosurgery in 2011, we added eight stereotactic radiosurgery facilities and during 2012 we opened three de-novo SRS facilities. In 2014, we partnered with Hollings Cancer Center of the Medical University of South Carolina, which encompasses Hollings’ inpatient, outpatient, and satellite locations where radiation therapy treatments are performed and comprises all current radiation therapy services, including future expansion of Hollings’ presence throughout the region. Also in 2014, we partnered with Charleston Area Medical Center, which sees more patients than any other cancer center in the state. As of December 31, 2014, we operated 31 radiation oncology centers (one in an unconsolidated joint venture), including 18 in dedicated SRS facilities.
We plan to continue to grow and expand our Radiation Oncology Division by fully integrating our spectrum of care offerings, with an emphasis on becoming a fully-integrated oncology partner and driving industry-leading volume growth. The Radiation Therapy market is poised for continued growth as the population ages, and as better technology and improved care coordination provides an enhanced patient experience. Further, a publicly issued market survey of radiation therapy providers noted that approximately one-third of U.S. Healthcare facilities plan to acquire or replace radiation therapy equipment over the next three years, and Alliance Oncology will capitalize on this opportunity to partner with hospitals. We intend to find the best solution to address customer needs and become indispensable to our customers, with an emphasis on opportunities in the SRS segment. Hospitals partner with AO in order to deliver leading operational performance, shift capital risk, develop strategic marketing plans to capture patient volumes, create capacity to add cutting-edge technology to provide optimal treatment options for patients, increase ancillary hospital services and to take advantage of our reputation for clinical excellence. Relative
10
to our sales strategy, we are creating metrics and pricing tools, and performing extensive market assessments to drive appropriate investment decisions. Lastly, we are aligning the incentive plans of our business development team to growth initiatives that exhibit stronger returns on capital, as well as assessing appropriate support levels needed to drive the sales strategy.
In pursuit of our company-wide initiative to monitor performance of existing customers and centers more effectively, in 2012 we undertook a performance assessment of our Radiation Oncology Division, including its existing facilities and partnerships. As a result of this analysis, we developed specific action plans for each center based on the review. Action plans included initiatives to focus on driving volume growth and increased marketing efforts. Additionally, we created specific action plans for improvement or divestiture for under-performing sites with targeted dates of completion. We implemented these action plans effectively, and sold or closed 11 of our radiation oncology centers during 2012 and the beginning of 2013. We continue to be focused on driving volume growth and efficiency plans at our existing centers.
Drive a Performance Based Culture, enabling us to deliver efficient, low cost solutions to our customers and capture market share through effective sales and marketing programs
We have executed on a company-wide transformation project to take advantage of organizational efficiencies across the entire organization, and have now developed a culture of performance improvement related to efficiency and cost management, which we call “Driving a Performance Based Culture.” These efforts have improved efficiency and quality of service while reducing costs and maximizing the internal and external customer service levels we provide. This cultural discipline stretches across the Radiology and Radiation Oncology clinical service lines as well as other areas of the organization, including sales, business development and the corporate support functions, by establishing a framework for company-wide excellence. During 2012 and 2013 we achieved over $40 million in total savings company-wide by executing on cost efficiency initiatives in our services lines and corporate functions.
We continue to invest significantly in leadership development, talent management and performance, training, incentives and recognition. Additionally, we have invested in our recruiting team to develop our recruiting organization, upgrade talent in key positions through active program management and develop recruiting scoreboards. We believe these investments are necessary to sustain and ensure our success in the long-term.
Most importantly, we are dedicated to the highest level of patient care standards and clinical quality. We strive to provide a variety of solutions designed to meet the needs of our clients by developing new surveying tools for both patients and clients. These surveying tools provide performance-driven data that enables us to improve levels of satisfaction for all of our clinical services. As a result of these efforts, we have achieved the highest levels of accreditation. We were the first national provider of shared-imaging services to be awarded accreditation by The Joint Commission on Accreditation of Healthcare Organizations, or JCAHO, in 1998. All of our sites and centers are currently accredited by The Joint Commission (formerly known as JCAHO) or certified by the American College of Radiology. Further, the “Exceeding Patient Expectations” Award was has been awarded to Alliance since 2007, a distinction only 5% of Healthcare organizations surveyed by Avatar share.
In 2014 we significantly expanded our Business Development team to more accurately convey the depth and breadth of our radiology expertise in providing full, end-to-end radiology services and business/operational lifecycle solution designed to improve the financial and competitive position of a hospital’s radiology service line and outpatient imaging centers while creating a better patient experience. which now includes Alliance RAD360™.
Contracts and Payment
Our typical MRI and PET/CT contract is exclusive, averages approximately three years in length for mobile services and five to 10 years in length for fixed-site imaging center arrangements, and often includes an automatic renewal provision. Most of our contracts require a fee for each scan we perform. With other contracts, we bill clients on a fixed-fee basis for a period of time, regardless of the number of scans performed. These fee levels are affected primarily by the type of imaging system provided, scan volume and the number of ancillary services provided. Our typical radiation oncology contract is exclusive, averages approximately 10 to 20 years in length and often includes an automatic renewal provision.
Wholesale payments under our contracts are due to us independent of our clients’ receipt of retail reimbursement from third-party payors. We generated approximately 80% of our revenues for the year ended December 31, 2014 by providing these services to hospitals and other healthcare providers. To a lesser extent, we generate our revenues from direct billings to patients or their medical payors. We generated approximately 20% of our revenues for the year ended December 31, 2014 by providing services directly to patients or their medical payors. We typically reserve the right to reduce a client’s number of service days or terminate an unprofitable contract.
Systems
11
As of December 31, 2014, we had 457 diagnostic imaging and 48 radiation oncology systems, substantially all of which we own. Our diagnostic imaging division utilizes 258 MRI systems, 124 PET/CT systems, 27 CT systems, 13 ultrasound systems and 35 other imaging systems. Our radiation oncology division utilizes 18 SRS systems, 19 LINAC, 7 CT systems and 2 other oncology systems. We operated 117 fixed-site imaging centers (one in an unconsolidated joint venture), which are classified into three categories. The first category is hospital-based fixed-site imaging centers, which includes systems installed in hospitals or other buildings on hospital campuses, including modular buildings. The second category is physician-based fixed-site imaging centers, which includes systems installed inside medical groups’ offices, most of which are owned by hospitals. The third category is free-standing fixed-site imaging centers, which includes systems installed in a medical office building, ambulatory surgical center, or other retail space. Of the consolidated fixed-site imaging centers, 82 were hospital-based fixed-site imaging centers, 28 were physician-based fixed-site imaging centers, and 7 were free-standing fixed-site imaging centers. Of the 117 fixed-site imaging centers we operated at December 31, 2014, 85 were MRI fixed-site imaging centers, 19 were PET/CT fixed-site imaging centers, and thirteen were other modality fixed-site imaging centers. We have made significant investments in our systems in an effort to ensure that we maintain the newest, most advanced imaging systems that meet our clients’ needs. Moreover, because we can upgrade most of our current MRI and PET/CT systems, we believe we have reduced the potential for technological obsolescence. We also operated 31 radiation oncology centers and stereotactic radiosurgery facilities (including one radiation oncology center in an unconsolidated joint venture) at December 31, 2014.
We purchase our imaging and radiation oncology systems from major medical equipment manufacturers, primarily General Electric Medical Systems, Siemens Medical Systems, Philips Medical Systems, Varian Medical Systems, Elekta and Accuray, Inc. Generally, we contract with clients for new or expanded services before we order new imaging systems. This practice reduces our system utilization risk. As one of the largest commercial purchasers of MRI, PET/CT, and SRS systems in the United States, we believe we receive relatively attractive pricing for equipment and service contracts from these equipment manufacturers.
Regional Structure / Segments
We divide our imaging operations into east and west geographic regions. None of our revenues for the years ended December 31, 2014, 2013 and 2012 were derived from business outside the United States. We believe we will continue to benefit from our regional managers’ direct contact with and knowledge of the markets we serve, which allows us to address the specific needs of each local operating environment. Each region continues to market, manage and staff the operation of its imaging systems and is run as a separate profit center responsible for its own revenues, expenses and overhead. To complement this regional arrangement, we continue to have standardized contracts, operating policies and other procedures that we implement nationwide in an effort to ensure quality, consistency and efficiency across all regions. We run radiation oncology as a separate profit center responsible for its own revenues, expenses and overhead, and we manage it on a national basis. For the purposes of Financial Accounting Standards Board (“FASB”) Accounting Standards Codification (“ASC”) 280, “Segment Reporting,” we have two reportable segments, Radiology and Radiation Oncology, based on similar economic and other characteristics. See Note 17 of the Notes to the Consolidated Financial Statements for financial information about our segments.
System Management and Maintenance
We actively manage deployment of our imaging systems to increase their utilization through the coordinated transportation of our mobile systems using 144 power units, which are large trucks that pull the trailers, or coaches, that house and transport our mobile systems. We examine client requirements, route patterns, travel times, fuel costs and system availability in our deployment process. We currently schedule our shared-service MRI and PET/CT systems for as little as one-half day and up to seven days per week at any particular client, with an average usage of 1.5 days per week per client. Drivers typically move the systems at night and activate them upon arrival at each client location so that the systems are operational when our technologists arrive.
Timely, effective maintenance is essential for achieving high utilization rates of our systems. Typically, we contract with the original equipment manufacturers, or OEMs, for comprehensive maintenance programs on our systems to minimize the period of time the equipment is unavailable. System repair typically takes less than one day but could take longer, depending upon the nature of the repair. During the warranty period and maintenance contract term, we receive guarantees related to equipment operation and availability.
Sales and Marketing
As of December 31, 2014, our national sales and business development force and sales support staff consisted of 39 members. These team members consult with new hospital clients and support our current customers to continue our current relationship and help identify new opportunities to expand their business with us. The sales force is organized nationally under
12
leadership in each of the Radiology and Radiation Oncology Divisions. The Radiology Division is under the oversight of three executives, one who focuses on driving new sales, one who leads the initiative to expand our current relationships and one who focuses on certain strategic initiatives. The Radiation Oncology Division is under the oversight of the division president and one other executive. Some of our executive officers and other senior vice presidents also spend a portion of their time participating in contract negotiations. As of December 31, 2014, we also had an executive leading the market organization, with 45 marketing representatives who are focused on increasing the number of patients scanned or treated on our systems by educating physicians and radiation oncologists about our new imaging and radiation oncology applications and service capabilities and also by capturing additional market share.
Competition
The markets for diagnostic imaging and radiation oncology services are highly fragmented and have few national service providers. We believe that the key competitive factors affecting our business include:
• | the quality and reliability of service; |
• | the quality and type of equipment available; |
• | the availability of types of imaging, radiation oncology and ancillary services; |
• | the availability of imaging center locations and flexibility of scheduling; |
• | pricing; |
• | the knowledge and service quality of technologists; |
• | the ability to obtain regulatory approvals; |
• | the ability to establish and maintain relationships with healthcare providers and referring physicians; and |
• | access to capital. |
We are, and expect to continue to be, subject to competition in our targeted markets from businesses offering diagnostic imaging and radiation oncology services, including existing and developing technologies. Many companies are engaged in the shared-service and fixed-site imaging market, including two national competitors and many smaller regional competitors. These competitors include RadNet, Inc., Center for Diagnostic Imaging (which purchased InSight Health Services Corp. in 2012), Diagnostic Imaging Group, American Radiology Services and several smaller regional competitors, including Medquest, Inc., Shared Medical Services, Kings Medical Company Inc. and DMS Health Group. We also face numerous competitors in the radiation oncology market, including Radiation Therapy Services, Inc., Vantage Oncology, Inc., US Oncology, Inc. (a subsidiary of McKesson Corporation since December 30, 2010) and many other smaller regional competitors. While we believe that we had a greater number of diagnostic imaging systems in operation and also had greater revenue from diagnostic imaging services during the year ended December 31, 2014 than our principal competitors, some of our competitors may, in either the diagnostic imaging or radiation oncology businesses, now or in the future have access to greater resources than we do.
In addition to direct competition from other imaging and radiation oncology providers, we compete with independent imaging centers and referring physicians with diagnostic imaging systems in their own offices, as well as with original equipment manufacturers ("OEMs") that aggressively sell or lease imaging systems to healthcare providers for full-time installation. In recent years, we have seen an increase in direct sales by OEMs of systems to some of our clients. OEMs typically target our higher scan volume clients. These sales efforts by OEMs have resulted in an overcapacity of systems in the marketplace, especially for medical groups that add imaging capacity within their practice settings. This situation has caused an increase in the number of our higher scan volume clients deciding not to renew their contracts. We typically replace these higher volume scan clients with lower volume clients. Our MRI revenues decreased during the year ended December 31, 2014 compared to 2013, primarily as a result of pricing pressures. We believe that MRI revenues will continue to decline in future years.
In all of our businesses, we may also experience greater competition in states that currently have certificate-of-need (“CON”) laws if those laws are repealed, thereby reducing barriers to entry in those states.
Employees
As of December 31, 2014, we had 1,582 employees, of whom 1,358 were trained diagnostic imaging technologists, therapists, patient coordinators, other clinical and technical support staff or drivers. In addition, we use independent contractor drivers for some long-haul and rural routes. We believe we have good relationships with our employees.
Seasonality
We experience seasonality in the revenues and margins generated for our services. First and fourth quarter revenues are typically lower than those from the second and third quarters. First quarter revenues are affected primarily by inclement
13
weather, typically resulting in fewer patients being scanned or treated during the period. Fourth quarter revenues are affected by holiday and client and patient vacation schedules, resulting in fewer scans or treatments during the period.
Regulation
Our business is subject to extensive federal and state government regulation. This includes the federal Anti-Kickback Law and similar state anti-kickback laws, the Stark Law and similar state laws affecting physician referrals, the federal False Claims Act, the Health Insurance Portability and Accountability Act of 1996, as amended by the Health Information Technology for Economic and Clinical Health Act of 2009, or HITECH Act, and similar state laws addressing privacy and security, state unlawful practice of medicine and fee splitting laws and state certificate of need ("CON") laws. Although we believe that our operations materially comply with the laws governing our industry, it is possible that non-compliance with existing laws or the adoption of new laws or interpretations of existing laws could adversely affect our financial performance.
Fraud and Abuse Laws; Physician Referral Prohibitions
The healthcare industry is subject to extensive federal and state regulation relating to licensure, conduct of operations, ownership of facilities, addition of facilities and services and payment for services.
In particular, the federal Anti-Kickback Law prohibits persons from knowingly and willfully soliciting, receiving, offering or providing remuneration, directly or indirectly, to induce either the referral of an individual, or the furnishing, recommending, or arranging for a good or service, for which payment may be made under a federal healthcare program such as the Medicare and Medicaid programs. The definition of “remuneration” has been broadly interpreted to include anything of value, including for example gifts, discounts, the furnishing of supplies or equipment, credit arrangements, payments of cash, waivers of payments, ownership interests, and providing anything at less than its fair market value. In addition, there is no one generally accepted definition of intent for purposes of finding a violation of the Anti-Kickback Law. For instance, one court has stated that an arrangement will violate the Anti-Kickback Law where any party has the intent to unlawfully induce referrals. In contrast, another court has opined that a party must engage in the proscribed conduct with the specific intent to disobey the law to be found in violation of the Anti-Kickback Law. The lack of uniform interpretation of the Anti-Kickback Law makes compliance with the law difficult. Moreover, recent health care reform legislation has strengthened these laws. For example, the Patient Protection and Affordable Care Act, as amended by the Health Care and Education Affordability Reconciliation Act (collectively, the “PPACA”), among other things, amends the intent requirement of the federal anti-kickback and criminal health care fraud statutes; a person or entity no longer needs to have actual knowledge of these statutes or specific intent to violate them. In addition, the PPACA provides that the government may assert that a claim including items or services resulting from a violation of the federal anti-kickback statute constitutes a false or fraudulent claim for purposes of the false claims statutes. The penalties for violating the Anti-Kickback Law can be severe. These sanctions include criminal penalties and civil sanctions, including fines, imprisonment and possible exclusion from the Medicare and Medicaid programs.
The Anti-Kickback Law is broad, and it prohibits many arrangements and practices that are lawful in businesses outside of the healthcare industry. Recognizing that the Anti-Kickback Law is broad and may technically prohibit many innocuous or beneficial arrangements within the healthcare industry, the U.S. Department of Health and Human Services, or DHHS, issued regulations in July 1991, which the DHHS has referred to as “safe harbors.” These safe harbor regulations set forth certain provisions that, if met in form and substance, will assure healthcare providers and other parties that they will not be prosecuted under the federal Anti-Kickback Law. Additional safe harbor provisions providing similar protections have been published intermittently since 1991. Our arrangements with physicians, physician practice groups, hospitals and other persons or entities who are in a position to refer may not fully meet the stringent criteria specified in the various safe harbors. Although full compliance with these provisions ensures against prosecution under the federal Anti-Kickback Law, the failure of a transaction or arrangement to fit within a specific safe harbor does not necessarily mean that the transaction or arrangement is illegal or that prosecution under the federal Anti-Kickback Law will be pursued. In addition, the Office of Inspector General of the DHHS, or OIG, issued a Special Advisory Bulletin on Contractual Joint Ventures in April 2003. The OIG Bulletin stated the DHHS's concerns regarding the legality of certain joint contractual arrangements between providers and suppliers of health care items or services. The OIG Bulletin identified characteristics of arrangements the OIG may consider suspect, and focused on arrangements in which a healthcare provider expands into a related service, through a joint contractual arrangement with an existing supplier of the related service, to service the healthcare provider's existing patient population. The OIG noted that such arrangements may be suspect when the provider contracts out all or nearly all aspects of the new venture, including the management, to the existing supplier, and provides only an existing patient base. In the OIG Bulletin, the OIG asserted that the provider's return on its investment in such circumstances may be viewed as remuneration for the referral of the provider's federal health care program patients to the supplier, and thus may violate the Anti-Kickback Law.
14
Although some of our arrangements may not fall within a safe harbor, we believe that such business arrangements do not violate the Anti-Kickback Law because we are careful to structure them to reflect fair market value and ensure that the reasons underlying our decision to enter into a business arrangement comport with reasonable interpretations of the Anti-Kickback Law. Even though we continuously strive to comply with the requirements of the Anti-Kickback Law, liability under the Anti-Kickback Law may still arise because of the intentions or actions of the parties with whom we do business. In addition, we may have Anti-Kickback Law liability based on arrangements established by the entities we have acquired if any of those arrangements involved an intention or actions to exchange remuneration for referrals covered by the Anti-Kickback Law. While we are not aware of any such intentions or actions, we have only limited knowledge regarding the intentions or actions underlying those arrangements. Conduct and business arrangements that do not fully satisfy one of these safe harbor provisions may result in increased scrutiny by government enforcement authorities such as the OIG.
Many states have adopted laws similar to the federal Anti-Kickback Law. Some of these state prohibitions apply to referral of patients for healthcare services reimbursed by any source, not only the Medicare and Medicaid programs. Although we believe that we comply with both federal and state anti-kickback laws, any finding of a violation of these laws could subject us to criminal and civil penalties or possible exclusion from federal or state healthcare programs. Such penalties would adversely affect our financial performance and our ability to operate our business.
In addition, the Ethics in Patient Referral Act of 1989, commonly referred to as the federal physician self-referral prohibition or Stark Law, prohibits physician referrals of Medicare and Medicaid patients for certain designated health services (including MRI and other diagnostic imaging services) to an entity if the physician or an immediate family member has any financial arrangement with the entity and no statutory or regulatory exception applies. The Stark Law also prohibits the entity from billing for any such prohibited referral. Initially, the Stark Law applied only to clinical laboratory services and regulations applicable to clinical laboratory services were issued in 1995. Earlier that same year, the Stark Law's self-referral prohibition expanded to additional goods and services, including MRI and other imaging services. In 1998, CMS (formerly known as the Health Care Financing Administration), published proposed rules for the remaining designated health services, including MRI and other imaging services, and in January 2001, CMS published the first phase of the final rule covering the designated health services. Phase one of the final rule became effective on January 4, 2002, except for a provision relating to certain physician payment arrangements, which became effective July 26, 2004. CMS released phase two of the Stark Law final rule as a final rule which became effective on July 26, 2004. On September 5, 2007, CMS released phase three of the Stark Law final rule which became effective on December 4, 2007. Finally, on August 19, 2008, CMS finalized additional changes to the Stark Law, which became effective on October 1, 2009.
A person who engages in a scheme to circumvent the Stark Law's referral prohibition may be fined for each such arrangement or scheme. In addition, any person who presents or causes to be presented a claim to the Medicare or Medicaid program in violation of the Stark Law is subject to civil monetary penalties per bill submission, an assessment of up to three times the amount claimed, and possible exclusion from participation in federal healthcare programs. Bills submitted in violation of the Stark Law may not be paid by Medicare or Medicaid, and any person collecting any amounts with respect to any such prohibited bill is obligated to refund such amounts.
Several states in which we operate have enacted or are considering legislation that prohibits physician self-referral arrangements or requires physicians to disclose any financial interest they may have with a healthcare provider to their patients when referring patients to that provider. Possible sanctions for violating these state law physician self-referral and disclosure requirements include loss of license and civil and criminal sanctions. State laws vary from jurisdiction to jurisdiction and have been interpreted by the courts or regulatory agencies infrequently.
We believe our operations comply with these federal and state physician self-referral prohibition laws. We do not believe we have established any arrangements or schemes involving any service of ours which would violate the Stark Law or the prohibition against schemes designed to circumvent the Stark Law, or any similar state law prohibitions. Because we have financial arrangements with physicians and possibly their immediate family members, and because we may not be aware of all the financial arrangements such physicians and their immediate family members may have with entities to which they refer patients, we rely on physicians and their immediate family members to avoid making prohibited referrals to us in violation of the Stark Law and similar state laws. If we receive a prohibited referral which is not permitted under an exception to the Stark Law and applicable state law, our submission of a bill for the referral could subject us to sanctions under the Stark Law and applicable state law. Any sanctions imposed on us under the Stark Law or any similar state laws could adversely affect our financial results and our ability to operate our business.
The Health Insurance Portability and Accountability Act of 1996, or HIPAA, created federal statutes to prevent healthcare fraud and false statements relating to healthcare matters. The healthcare fraud statute prohibits knowingly and willfully executing a scheme to defraud any healthcare benefit program, including private payors. A violation of this statute is a felony and may result in fines, imprisonment or exclusion from government sponsored programs such as the Medicare and Medicaid
15
programs. The false statements statute prohibits knowingly and willfully falsifying, concealing or covering up a material fact or making any materially false, fictitious or fraudulent statement in connection with the delivery of or payment for healthcare benefits, items or services. A violation of this statute is a felony and may result in fines or imprisonment or exclusion from government sponsored programs.
Both federal and state government agencies are continuing heightened and coordinated civil and criminal enforcement efforts. As part of announced enforcement agency work plans, the federal government will continue to scrutinize, among other things, the billing practices of hospitals and other providers of healthcare services. For instance, as enacted by Congress on January 1, 2013, the American Taxpayer Relief Act of 2012, or ATRA, increases the amount of time DHHS may use to recover Medicare overpayments to providers from three to five years. The federal government also has increased funding to fight healthcare fraud, and it is coordinating its enforcement efforts among various agencies, such as the U.S. Department of Justice, or DOJ, the OIG, and state Medicaid fraud control units. Moreover, we expect there will continue to be federal and state laws and/or regulations, proposed and implemented, that could impact our operations and business. The extent to which future legislation or regulations, if any, relating to health care fraud abuse laws and/or enforcement, may be enacted or what effect such legislation or regulation would have on our business remains uncertain. We believe that the healthcare industry will continue to be subject to increased government scrutiny and investigations.
Federal False Claims Act
Another trend affecting the healthcare industry is the increased use of the federal False Claims Act and, in particular, actions under the False Claims Act's “whistleblower” provisions. Those provisions allow a private individual to bring actions on behalf of the government alleging that the defendant has defrauded the federal government. After the individual has initiated the lawsuit, the government must decide whether to intervene in the lawsuit and to become the primary prosecutor. If the government declines to join the lawsuit, then the individual may choose to pursue the case alone, in which case the individual's counsel will have primary control over the prosecution, although the government must be kept apprised of the progress of the lawsuit. Whether or not the federal government intervenes in the case, it will receive the majority of any recovery. If the litigation is successful, the individual is entitled to no less than 15%, but no more than 30%, of whatever amount the government recovers. The percentage of the individual's recovery varies, depending on whether the government intervened in the case and other factors. Recently, the number of suits brought against healthcare providers by private individuals has increased dramatically. In addition, various states are considering or have enacted laws modeled after the federal False Claims Act. Under the Deficit Reduction Act of 2005, or DRA, states are being encouraged to adopt false claims acts similar to the federal False Claims Act, which establish liability for submission of fraudulent claims to the State Medicaid program and contain whistleblower provisions. Even in instances when a whistleblower action is dismissed with no judgment or settlement, we may incur substantial legal fees and other costs relating to an investigation. Future actions under the False Claims Act may result in significant fines and legal fees, which would adversely affect our financial performance and our ability to operate our business.
When an entity is determined to have violated the federal False Claims Act, it may be liable for damages and civil penalties. Liability arises, primarily, when an entity knowingly submits a false claim for reimbursement to the federal government. Simple negligence should not give rise to liability, but submitting a claim with reckless disregard of its truth or falsity could result in substantial civil liability.
Although simple negligence should not give rise to liability, the government or a whistleblower may attempt and could succeed in imposing liability on us for a variety of previous or current failures, including for example:
• | Failure to comply with the many technical billing requirements applicable to our Medicare and Medicaid business. |
• | Failure to comply with Medicare requirements concerning the circumstances in which a hospital, rather than we, must bill Medicare for diagnostic imaging services we provide to outpatients treated by the hospital. |
• | Failure of our hospital clients to accurately identify and report our reimbursable and allowable services to Medicare. |
• | Failure to comply with the Anti-Kickback Law or Stark Law. |
• | Failure to comply with the prohibition against billing for services ordered or supervised by a physician who is excluded from any federal healthcare programs, or the prohibition against employing or contracting with any person or entity excluded from any federal healthcare programs. |
• | Failure to comply with the Medicare physician supervision requirements for the services we provide, or the Medicare documentation requirements concerning such physician supervision. |
• | The past conduct of the companies we have acquired. |
On May 20, 2009, President Obama signed into law the Fraud Enforcement and Recovery Act of 2009 (“FERA”), which greatly expanded the types of entities and conduct subject to the False Claims Act. Further, the PPACA requires Medicare providers, suppliers, and other entities to report and return any overpayment of Medicare or Medicaid funds within 60 days of
16
identifying the overpayment or face potential False Claims Act liability. In February 2012, CMS proposed a rule enacting the 60-day reporting requirement that would also create a 10-year “lookback period,” requiring providers and suppliers to report and return overpayments identified within 10 years of the date the overpayment was received. The proposed rule, if enacted, could require us to expand our recordkeeping, compliance and reporting processes to comply with the rule's requirements. We strive to ensure that we meet applicable billing requirements. However, the costs of defending claims under the False Claims Act, as well as sanctions imposed under the Act, could significantly affect our financial performance.
Health Insurance Portability and Accountability Act of 1996
In addition to creating the new federal statutes discussed above, HIPAA, as amended by the HITECH Act and updated by the January 2013 Omnibus Rule, also establishes uniform standards governing the conduct of certain electronic health care transactions and protecting the security and privacy of individually identifiable health information maintained or transmitted by certain covered entities, including health care providers, health plans and health care clearinghouses. HITECH and the Omnibus Final Rule significantly expanded HIPAA's privacy and security requirements. Among other things, HITECH and the Omnibus Final Rule make HIPAA's privacy and security standards directly applicable to "business associates," which are independent contractors or agents of covered entities that create, receive, maintain, or transmit PHI in connection with providing a service for or on behalf of a covered entity. As a covered entity, we must comply with the Standards for Privacy of Individually Identifiable Health Information, which restrict our use and disclosure of certain individually identifiable health information. We have been required to comply with the Privacy Standards since April 14, 2003. We must also comply with the Standards for Electronic Transactions, which establish standards for common health care transactions, such as claims information, plan eligibility, payment information and the use of electronic signatures. We have been required to comply with these standards since October 16, 2003. We must also comply with the Security Standards, which require us to implement security measures to protect the security and integrity of certain electronic health information. We have been required to comply with these standards since April 21, 2005. One other standard relevant to our use of medical information has been promulgated under HIPAA. CMS has published a final rule, which required us to adopt Unique Health Identifiers for use in filing and processing health care claims and other transactions by May 23, 2007. The American Recovery and Reinvestment Act of 2009, commonly referred to as the economic stimulus package signed into law on February 17, 2009, included the HITECH Act, which dramatically expanded, among other things, (1) the scope of HIPAA to apply directly to “business associates,” or independent contractors who receive or obtain protected health information (“PHI”) in connection with providing a service to the covered entity, (2) substantive security and privacy obligations, including new federal security breach notification requirements to affected individuals and DHHS and potentially media outlets, of breaches of unsecured PHI, (3) restrictions on marketing communications and a prohibition on covered entities or business associates from receiving remuneration in exchange for PHI, and (4) the civil and criminal penalties that may be imposed for HIPAA violations, increasing the annual cap in penalties from $25,000 to $1.5 million per year. We believe that we are in compliance with all of the applicable HIPAA and HITECH standards, rules and regulations. If we fail to comply with these standards, we could be subject to criminal penalties and civil sanctions.
In addition to federal regulations issued under HIPAA, some states have enacted privacy and security statutes or regulations that, in some cases, are more stringent than those issued under HIPAA, including the laws of the state of California. In those cases it may be necessary to modify our operations and procedures to comply with the more stringent state laws, which may entail significant and costly changes for us. Similarly, it is possible that private plaintiffs may bring state tort law claims alleging that HIPAA establishes the standard for duty of care. We believe that we are in compliance with such state laws and regulations. However, if we fail to comply with applicable state laws and regulations, we could be subject to additional sanctions.
Unlawful Practice of Medicine and Fee Splitting
The marketing and operation of our business is subject to some states' laws prohibiting the practice of medicine by non-physicians. We believe that our imaging operations do not involve the practice of medicine because all professional medical services relating to our imaging operations, including the interpretation of scans and related diagnoses, are separately provided by licensed physicians not employed by us. Some states also have laws that prohibit any fee-splitting arrangement between a physician and a referring person or entity that would provide for remuneration paid to the referral source on the basis of revenues generated from referrals by the referral source. We believe that our operations do not violate these state laws with respect to fee splitting.
Certificate-of-Need Laws
In some states, a CON or similar regulatory approval is required before the acquisition of high-cost capital items, including diagnostic imaging or radiation oncology systems or provision of diagnostic imaging or radiation oncology services
17
by us or our clients. CON regulations may limit or preclude us from providing diagnostic imaging or radiation oncology services or systems. Revenue from states with CON regulations represented a substantial portion of our total revenue for the year ended December 31, 2014.
CON laws were enacted to contain rising healthcare costs, prevent the unnecessary duplication of health resources, and increase patient access for health services. In practice, CON laws have prevented hospitals and other providers who have been unable to obtain a CON from acquiring new machines or offering new services. Our current contracts will remain in effect even if the CON states in which we operate modify their programs. However, a significant increase in the number of states regulating our business through CON or similar programs could adversely affect us. Conversely, repeal of existing CON regulations or defunding of CON programs in jurisdictions where we have obtained a CON, or CON exemption, also could adversely affect us by allowing competitors to enter our markets. CON laws are the subject of continuing legislative activity.
Reimbursement
We derive most of our revenues directly from healthcare providers, primarily from acute care hospitals, with whom we contract to provide services to their patients. We generated approximately 80% of our revenues for the year ended December 31, 2014, by providing services to hospitals and other healthcare providers. Some of our revenues come from third-party payors, including government programs such as the Medicare and Medicaid programs, that we bill directly. In the year ended December 31, 2014, we derived 20% of our revenues from direct billings to patients and their third-party payors. Services for which we submit direct billings for Medicare and Medicaid patients are paid on a fee schedule basis, and patients are responsible for deductibles and coinsurance.
With respect to our retail business, for services for which we bill Medicare directly, we are paid under the Medicare Physician Fee Schedule, which is updated on an annual basis. Under the Medicare statutory formula, payments under the Physician Fee Schedule would have decreased for the past several years if Congress had failed to intervene. In the past, when the application of the statutory formula resulted in lower payment, Congress has passed interim legislation to prevent the reductions. For 2013, the Centers for Medicare & Medicaid Services ("CMS") projected an aggregate rate reduction of 26.5% from 2012 payment rates if Congress failed to intervene. This reduction was delayed by the enactment of the ATRA on January 2, 2013, which allowed for the continuation of 2012 physician payment rates by adopting a 0% update through December 31, 2013.
For 2014, CMS estimated that the statutory formula would result in a 20.1% reduction in physician payment rates if Congress failed to intervene. On December 26, 2013, President Obama signed into law the Bipartisan Budget Act of 2013 (“2013 Budget Act”), which replaced the payment reduction scheduled to take effect on January 1, 2014, with a 0.5% increase in physician payment rates for the period beginning January 1, 2014, and ending on March 31, 2014. On April 1, 2014, the physician payment rates enacted under the 2013 Budget Act were extended through December 31, 2014, and a zero percent update from 2014 payment rates was enacted for the period beginning January 1, 2014 and ending on March 31, 2015, under the Protecting Access to Medicare Act of 2014 (“PAMA”). There also have been a number of legislative initiatives to develop a permanent revision to the statutory formula. If Congress fails to extend the existing rates beyond the current March 31, 2015 deadline, CMS estimates that the statutory formula will result in a 21.2% reduction to physician payment rates. The failure by Congress to intervene with another extension or otherwise revise the statutory formula for future years to prevent substantial reductions to physician payment levels will adversely affect our revenues and results of operations.
Also with respect to our retail business, for services furnished on or after July 1, 2010, CMS began implementing a 50% reduction in reimbursement for multiple images on contiguous body parts, as mandated by the PPACA. Beginning January 1, 2011, CMS applied the same reduction to certain CT and CT angiography, MRI and MR angiography, and ultrasound services furnished to the same patient in the same session, regardless of the imaging modality, and not limited to contiguous body areas. CMS projected that this expanded policy would reduce payment for 20% more services than the prior multiple procedure payment reduction policy, and would primarily reduce payments for radiology services and to freestanding diagnostic imaging centers, such as our retail business. For 2012, CMS extended this policy to the physician reviews of these imaging services by implementing a 25% multiple procedure reduction to the professional payments to the specialties of radiology and interventional radiology. In addition, beginning in 2013, CMS expanded the 25% multiple-procedure reduction policy to certain other nuclear medicine and cardiovascular diagnostic procedures. To date, these multiple procedure payment reductions have not had a material effect on our retail revenues, and at this time, we do not believe that these multiple procedure payment reductions will have a material effect on our future retail revenues.
Other recent legislative and regulatory updates to the Physician Fee Schedule included reduced payment rates for certain diagnostic services using equipment costing more than $1 million through revisions to usage assumptions from the previous 50% usage rate to a 90% usage rate. This change began in 2010 with a planned four-year phase-in period for MRI and CT
18
scans, but not for radiation therapy and other therapeutic equipment. The PPACA superseded CMS's assumed usage rate for such equipment and, beginning on January 1, 2011, CMS instituted a 75% usage rate. Also in 2011, CMS expanded the list of services to which the higher equipment usage rate assumption applies to include certain diagnostic CTA and MRA procedures using similar CT and MRI scanners that cost more than $1 million. Through enactment of the ATRA, Congress increased the usage rate assumption from 75% to 90% for fee schedules to be developed for 2014 and subsequent years. We currently estimate that the new usage assumptions for MRI and CT scans under the ATRA will not have a material adverse effect on our future retail revenues.
Effective January 1, 2011, CMS made further adjustments to the Physician Fee Schedule so that specialties that have a higher proportion of the payment rate attributable to operating expenses such as equipment and supplies, which include radiation oncology, will experience an increase in aggregate payments. In addition, as a result of adjustments to codes identified to be misvalued, radiation oncology specialties and suppliers providing the technical component of diagnostic tests are among the entities that will experience decreases in aggregate payment. Some of these changes are being transitioned over time; for 2013, CMS estimated aggregate payment reductions of 7% in radiation oncology, 3% in radiology, 3% in nuclear medicine, 7% for suppliers providing the technical component of diagnostic tests and 9% for radiation therapy centers. A portion of the payment reduction to radiation oncology and radiation therapy centers stems from revisions to the operating expenses and procedure time allotted to perform Intensity Modulated Radiation Therapy ("IMRT") and Stereotactic Body Radiotherapy ("SBRT"). CMS is also undertaking a review of procedure times allotted to other radiation oncology treatments. At this time, we do not believe that these regulatory changes will have a material effect on our future retail revenues.
In the Physician Fee Schedule for 2014, CMS made additional revisions to the formula it uses to account for physician time and practice expenses when calculating updates to the Physician Fee Schedule. CMS's revisions include changes to the Medicare Economic Index formula, which have the effect of redistributing some practice expense payment to the physician time component. This policy change, combined with the 90% usage rate assumption described above and various other adjustments for the 2014 Physician Fee Schedule, are projected to result in an aggregate payment increase of 1% in radiation oncology, no change to payments for nuclear medicine, and aggregate payment reductions of 2% in radiology, 11% for suppliers providing the technical component of diagnostic tests, and 1% for radiation therapy centers. In the Physician Fee Schedule for 2015, CMS adopted changes to payment policies that are projected to result in an aggregate payment increase of 1% for radiation therapy centers; no aggregate payment change for providers of nuclear medicine and radiation oncology; an aggregate payment reduction of 1% in radiology; and an aggregate payment reduction of 2% for suppliers providing the technical component of diagnostic tests. In addition, for 2015, the American Medical Association (“AMA”) updated, revised, and deleted certain procedure codes related to radiation oncology that will change how radiation therapy services are reported and billed. CMS declined to adopt the new and revised codes in 2015, but it plans to address the codes and related changes to reimbursement for radiation oncology services in the proposed 2016 Physician Fee Schedule. The use by Medicare and other payors of new and revised radiation oncology codes could result in payment reductions for these services. At this time, we do not believe that the final 2014 or 2015 regulatory changes will have a material effect on our future retail revenues.
In addition to annual updates to the Physician Fee Schedule, as indicated above, CMS also publishes regulatory changes to the hospital outpatient prospective payment system (“HOPPS”) on an annual basis. These payments are bundled amounts received by our hospital clients for hospital outpatient services related to MRI scans, PET/CT scans and SRS treatments. Recent adjustments to the HOPPS payments for these procedures have not had a material adverse effect on our revenue and earnings in 2011, 2012, 2013 or 2014.
Beginning on April 1, 2013, the ATRA required CMS to equalize the HOPPS payment associated with Cobalt 60-based SRS treatments to the payment amount for the less-expensive, linac-based SRS treatment. In the final HOPPS rule for 2014, CMS equalized payments for the treatments by establishing a single new payment level derived from CMS claims data for both treatments, which resulted in a payment increase for linac-based treatments and a payment decrease for Cobalt 60-based treatments beginning January 1, 2014. In addition, beginning in 2014, CMS utilized newly-available data to revise its estimate of hospitals' costs of providing CT and MRI services, which are used to calculate Medicare payments to hospitals for these services. The use of such data could result in payment reductions for CT and MRI procedures performed in the outpatient departments of our hospital clients. At this time, we do not believe that these changes will have a material adverse effect on our future revenues; however, we cannot predict the effect of future rate reductions on our future revenues or business.
Over the past few years, the growth rate of MRI industry wide scan volumes has slowed in part due to weak hospital volumes as reported by several investor-owned hospital companies, additional patient-related cost-sharing programs and an increasing trend of third-party payors intensifying their utilization management efforts, for example, through benefit managers who require prior authorizations to control the growth rate of imaging services generally. We expect that these trends will continue. One recent initiative to potentially reduce utilization of certain imaging services is the Medicare Imaging Demonstration ("MID"), which was a two-year demonstration project designed to collect data regarding physician use of
19
advanced diagnostic imaging services. This information would be used to determine the appropriateness of services by developing medical specialty guidelines for advanced imaging procedures within three designated modalities (MRI, CT and nuclear medicine). On February 2, 2011, CMS announced that it selected five participants for the demonstration project. The data collection portion of the demonstration concluded on April 1, 2012, and the 18-month intervention portion of the demonstration then went into effect, during which time the appropriateness of a physician's order for diagnostic imaging services was considered at the time the order was entered into the decision support systems being tested. The MID concluded on September 30, 2013, and a report to Congress summarizing the results of the demonstration was published in April 2014. The report compared the appropriateness of orders by physicians during the baseline period and during the demonstration, and found that greater use of the decision support system (“DSS”) did not have a material effect on the likelihood of appropriately ordering advanced diagnostic imaging, nor a substantial impact on the volume of advanced imaging utilization. The report did not recommend expanding the use of appropriateness criteria for advanced imaging to a broader Medicare population at this time.
In addition, the PAMA requires CMS, in conjunction with medical specialty societies, to adopt appropriate use criteria (“AUC”) for certain advanced diagnostic imaging services by November 15, 2015. Beginning in 2017, CMS must establish a program that promotes the use of AUC by requiring physicians who order and furnish advanced diagnostic imaging services to consult and report compliance with the AUC. Advanced imaging services ordered by certain physicians who do not adhere to the AUC will be subject to prior authorization for applicable imaging services provided to Medicare beneficiaries beginning in 2020.
We cannot predict the full impact of the PPACA and other recent and future legislative enactments on our business. The reform law substantially changed the way health care is financed by both governmental and private insurers. Although certain provisions may negatively affect payment rates for certain imaging services, the PPACA also extended coverage to an estimated 26 million previously uninsured people, which may result in an increase in the demand for our services. Other legislative changes have been proposed and adopted since the PPACA was enacted, which also may impact our business. On August 2, 2011, the President signed into law the Budget Control Act of 2011 (“BCA”), which, among other things, created the Joint Select Committee on Deficit Reduction to recommend proposals in spending reductions to Congress. The Joint Select Committee did not achieve its targeted deficit reduction of at least $1.2 trillion for the years 2013 through 2021, triggering the legislation's automatic reduction to several government programs. These reductions include aggregate reductions to Medicare payments to providers of up to 2% per fiscal year, which were scheduled to go into effect on January 2, 2013. The enactment of the ATRA delayed the imposition of the automatic cuts until March 1, 2013. On March 1, 2013, the President signed an executive order implementing the automatic budget reductions. Pursuant to that order, payments to Medicare providers for services furnished on or after April 1, 2013 were reduced by 2%. The impact to our revenue related to this 2% reduction was approximately $0.4 million in 2014 and is anticipated to be $0.4 million in 2015. The 2013 Budget Act extended the 2% reduction in payments to Medicare providers by another two years (through 2023), and subsequent legislation extended the cuts through 2024. Unless Congress acts to repeal or revise the automatic budget cuts enacted by the BCA, this payment reduction will continue. The PAMA also included a new quality incentive payment policy that, beginning January 1, 2016, will reduce Medicare payments for certain CT services paid under the Physician Fee Schedule or HOPPS that are furnished using equipment that does not meet certain dose optimization and management standards. The full effect of the PPACA, BCA, ATRA and PAMA on our business is uncertain, and it is not clear whether other legislative changes will be adopted or how those changes would affect the demand for our services.
Payments to us by third-party payors depend substantially upon each payor's coverage and reimbursement policies. Third-party payors may impose limits on coverage or reimbursement for diagnostic imaging services, including denying reimbursement for tests that do not follow recommended diagnostic procedures. Coverage policies also may be expanded to reflect emerging technologies. Because unfavorable coverage and reimbursement policies have and may continue to constrict the profit margins of the hospitals and clinics we bill directly, we have and may continue to need to lower our fees to retain existing clients and attract new ones. If coverage is limited or reimbursement rates are inadequate, a healthcare provider might find it financially unattractive to own diagnostic imaging or radiation oncology systems, yet beneficial to purchase our services. It is possible that third-party coverage and reimbursement policies will affect the need or prices for our services in the future, which could significantly affect our financial performance and our ability to conduct our business.
Environmental, Health and Safety Laws
We are subject to federal, state and local regulations governing the storage, use, transport and disposal of materials and waste products, including biohazardous and radioactive wastes. Our PET service and some of our other imaging services require the use of radioactive materials. While this material has a short half-life, meaning it quickly breaks down into inert, or non-radioactive substances, using such materials presents the risk of accidental environmental contamination and physical injury. Although we believe that our safety procedures for storing, handling, transporting and disposing of these hazardous
20
materials comply with the standards prescribed by law and regulation, we cannot completely eliminate the risk of accidental contamination or injury from those hazardous materials. We maintain professional liability insurance that covers such matters with coverage that we believe is consistent with industry practice and appropriate in light of the risks attendant to our business. However, in the event of an accident, we could be held liable for any damages that result, and any liability could exceed the limits or fall outside the coverage of our insurance. We may not be able to maintain insurance on acceptable terms, or at all. We could incur significant costs and the diversion of our management's attention to comply with current or future environmental laws and regulations. We have not had material expenses related to environmental, health and safety laws or regulations to date.
How to Obtain Our SEC Filings
All reports we file with the SEC are available free of charge via EDGAR through the SEC website at www.sec.gov. We also provide copies of our current reports on Form 8-K, Annual Report on Form 10-K, Quarterly Reports on Form 10-Q, proxy statement and amendments to those documents at no charge to investors upon request and make electronic copies of those reports available through our website at www.alliancehealthcareservices-us.com as soon as reasonably practicable after filing those materials with the SEC. The information found on, or otherwise accessible through, our website is not incorporated by reference into, nor does it form a part of, this Annual Report on Form 10-K or any other document that we file with the SEC.
Our Investor Relations Department can be contacted at Alliance HealthCare Services, Inc., 100 Bayview Circle, Suite 400, Newport Beach, California 92660, Attn: Investor Relations, tel: (949) 242-5300.
Executive Officers of the Registrant
Set forth below is information regarding our executive officers, including their principal occupations for the past five years and their ages as of March 12, 2015. There are no family relationships between any of our executive officers and any other executive officer or board member. Our board of directors elects our executive officers, who serve at the discretion of our board of directors.
Name | Age | Present Position | |||
Percy C. Tomlinson | 53 | Chief Executive Officer | |||
Howard K. Aihara | 51 | Executive Vice President and Chief Financial Officer | |||
Richard W. Johns | 57 | Executive Vice President, General Counsel and Secretary | |||
Richard A. Jones | 51 | President, Alliance Radiology | |||
Gregory E. Spurlock | 53 | President, Alliance Oncology | |||
Percy C. Tomlinson became Chief Executive Officer in October 2013. Mr. Tomlinson has more than 25 years of diverse executive management and leadership experience, serving in a variety of roles, most recently as the Chief Executive Officer of Midwest Dental, from 2012 until joining us. Previously, he spent 10 years with the Center for Diagnostic Imaging, Inc. (CDI) in several senior roles including Chief Executive Officer from 2011 to 2012, President, and Chief Operating Officer from 2005 to 2011 and Senior Vice President and Chief Financial Officer from 2002 to 2005.
Howard K. Aihara has served as our Executive Vice President and Chief Financial Officer since December 2005. Mr. Aihara joined us in September 2000 as our Vice President and Corporate Controller. From 1997 until September 2000, he was vice president, finance, for UniMed Management Company, a physician practice management company in Burbank, California. From 1995 through 1997, he was executive director and corporate controller for AHI Healthcare Systems, Inc. of Downey, California. AHI was a publicly traded physician practice management company. Mr. Aihara began his career at Ernst & Young LLP and is a certified public accountant (inactive).
Richard W. Johns has served as our Executive Vice President, General Counsel and Secretary since February 1, 2012. Mr. Johns has had a legal career spanning over 30 years providing legal services to a variety of healthcare clients based in the United States and Europe. From 2010 to 2012, he was General Counsel at LaVie Care Centers, a national long-term care company with revenues in excess of $1 billion annually and approximately 19,000 employees caring for 13,000 residents. Prior to his role with LaVie Care Centers, from 2009 to 2010, Mr. Johns maintained his own law practice serving various healthcare clients in the United States and Europe, and from 1998 to 2008 served as a partner with the internationally recognized firm of Foley & Lardner, where he was instrumental in developing a national healthcare practice. Mr. Johns began his legal career working with various law firms in the Washington, D.C. area and holds a Juris Doctor degree from the University of Southern California.
21
Richard A. Jones was appointed to Executive Vice President of the Radiology Division in August 2011 and was promoted to President of the Radiology Division in June 2012. He has been with Alliance since 1996, originally serving as Regional Operations Manager, then Vice President of Business Development, then Vice President of Operations for the North zone, then Senior Vice President of the North zone, and then as Senior Vice President of Operations. Before joining Alliance, Mr. Jones held a number of leadership roles in hospitals and the commercial healthcare sector.
Gregory E. Spurlock was appointed President of Alliance Oncology in April 2013. He initially joined Alliance Oncology as Chief Administrative Officer in April 2011, as part of the company’s acquisition of US Radiosurgery and was later promoted to Senior Vice President of Business Development and Contract Operations in June of 2012. In his current role, Mr. Spurlock oversees all aspects of Alliance Oncology’s SRS facilities and radiation therapy centers. Mr. Spurlock's career has been focused on ancillary services, physician relationships and facility development. Mr. Spurlock joined US Radiosurgery in 2004 and held various executive leadership positions with the company and its affiliates from 2004 until its acquisition by Alliance in 2011, including Chief Operating Officer of US Radiosurgery, Executive Vice President of NeoSpine, and Chief Executive Officer of Imaging One, LLC. Prior to 2004, Mr. Spurlock also held the role of Executive Director at Tennessee Orthopaedic Alliance and at the Kerlan-Jobe Orthopaedic Clinic in Los Angeles.
ITEM 1A. | RISK FACTORS |
You should carefully consider the risks described below before investing in our publicly-traded securities. If any of these risks actually occurs, our business, financial condition or results of operations will likely suffer. In that event, the trading price of our common stock could decline, and you could lose all or part of your investment. Some of the statements in this Item 1A are “forward-looking statements” within the meaning of the safe harbor provisions of the Private Securities Litigation Reform Act of 1995. See “Cautionary Statement Regarding Forward-looking Statements” on page 1.
We have described the risk factors in the following related groups:
• | risks related to government regulation of our business; |
• | other risks related to our business; |
• | risks related to our governance and stock exchange listing; and |
• | risks related to our debt. |
Risks Related to Government Regulation of Our Business
Changes in the rates or methods of third-party reimbursements for diagnostic imaging and radiation oncology services could result in reduced demand for our services or create downward pressure, which could cause our revenues to decline and harm our financial position.
We derived approximately 20% of our 2014 revenues from direct billings to patients and third-party payors such as Medicare, Medicaid or private health insurance companies. Changes in the rates or methods of reimbursement for the services we provide could have a significant negative effect on those revenues. Moreover, our healthcare provider clients on whom we depend for the majority of our revenues generally rely on reimbursement from third-party payors. If we or our clients receive decreased reimbursements as a result of various governmental efforts to reduce healthcare costs as described in detail in Item 1, Business-Regulation and Reimbursement, these decreases could result in a reduced demand for our services or downward pricing pressures, which could have a material adverse effect on our results of operation and financial position.
With respect to our retail business, for services for which we bill Medicare directly, we are paid under the Medicare Physician Fee Schedule, which is updated on an annual basis. Under the Medicare statutory formula, payments under the fee schedule would have decreased for the past several years if Congress had failed to intervene. In the past, when the application of the statutory formula resulted in lower payment, Congress has passed interim legislation to prevent the reductions in payments. If Congress fails to intervene as it has done in the past to prevent the implementation of payment reductions through either another temporary measure or a permanent revision to the statutory formula, the resulting decrease in payment will adversely affect our revenues and results of operations.
We cannot predict the individual and collective effect on our business of the changes described above, but they could negatively affect parts of our business or our entire operations, which could harm our financial performance and condition.
Complying with federal and state regulations is an expensive and time-consuming process, and any failure to comply could result in substantial penalties.
22
We are directly or indirectly through our clients subject to extensive regulation by both the federal government and the states in which we conduct our business, including the federal Anti-Kickback Law and similar state anti-kickback laws, the Stark Law and similar state laws affecting physician referrals, the federal False Claims Act, HIPAA, as amended by the HITECH Act, and similar state laws addressing privacy and security, state unlawful practice of medicine and fee splitting laws, state CON laws, the Medicare and Medicaid statutes and regulations, and requirements for handling biohazardous and radioactive materials and wastes.
Both federal and state government agencies have heightened and coordinated civil and criminal enforcement efforts as part of numerous ongoing investigations of healthcare companies, as well as their executives and managers. These investigations relate to a wide variety of matters, including referral and billing practices. The OIG and the DOJ have, from time to time, established national enforcement initiatives that focus on specific billing practices or other suspected areas of abuse. Some of our activities could become the subject of governmental investigations or inquiries.
If our operations are found to be in violation of any of the laws and regulations to which we or our clients are subject, we may be subject to the applicable penalty associated with the violation, including civil and criminal penalties, damages, fines and the curtailment of our operations. Any penalties, damages, fines or curtailment of our operations, individually or in the aggregate, could adversely affect our ability to operate our business and our financial results. Our risk of being found in violation of these laws and regulations is increased by the fact that many of them have not been fully interpreted by the regulatory authorities or the courts, and their provisions are open to a variety of interpretations. Any action against us for violation of these laws or regulations, even if we successfully defend against it, could cause us to incur significant legal expenses and divert management's attention from the operation of our business. For a more detailed discussion of the various state and federal regulations to which we are subject, see Item 1, Business-Regulation, Reimbursement and Environmental, Health and Safety Laws.
Federal and state anti-kickback and anti-self-referral laws may adversely affect our operations and income.
Various federal and state laws govern financial arrangements among health care providers. The federal Anti-Kickback Law prohibits the knowing and willful offer, payment, solicitation or receipt of any form of remuneration in return for, or to induce, the referral of Medicare, Medicaid or other federal healthcare program patients, or in return for, or to induce, the purchase, lease or order of items or services that are covered by Medicare, Medicaid or other federal healthcare programs. Many state laws also prohibit the solicitation, payment or receipt of remuneration in return for, or to induce, the referral of patients in private as well as government programs. Violation of these laws may result in substantial civil or criminal penalties and/or exclusion from participation in federal or state healthcare programs. We believe that we are operating in compliance with applicable laws and believe that our arrangements with providers would not be found to violate the federal and state anti-kickback laws. However, these laws could be interpreted in a manner that could have an adverse effect on our operations.
The Stark Law prohibits a physician from referring Medicare or Medicaid patients to any entity for certain designated health services (including MRI and other diagnostic imaging services) if the physician has a prohibited financial relationship with that entity, unless an exception applies. Although we believe that our operations do not violate the Stark Law, our activities may be challenged. If a challenge to our activities is successful, it could have an adverse effect on our operations. In addition, legislation may be enacted in the future that further addresses Medicare and Medicaid fraud and abuse or that imposes additional requirements or burdens on us.
A number of states in which we operate have adopted a form of anti-kickback law and/or Stark Law. The scope of these laws and the interpretations of them vary from state to state and are enforced by state courts and regulatory authorities, each with broad discretion. A determination of liability under the laws described in this risk factor could result in fines and penalties and restrictions on our ability to operate in these jurisdictions.
In addition, under the DRA, states are encouraged to adopt false claims acts, similar to the federal False Claims Act, which establish liability for submission of fraudulent claims to the state Medicaid program and contain qui tam or whistleblower provisions. States enacting such false claims statutes will receive an increased percentage of any recovery from a state Medicaid judgment or settlement. Adoption of new false claims statutes in states where we operate may impose additional requirements or burdens on us.
Healthcare reform legislation and regulations could adversely affect our operations or limit the prices we can charge for our services, which would reduce our revenues and harm our operating results.
In addition to extensive existing government healthcare regulation, there have been and continue to be numerous initiatives at the federal and state levels for reforms affecting the payment for and availability of healthcare services, including proposals that would significantly limit reimbursement under the Medicare and Medicaid programs. Limitations on reimbursement amounts and other cost containment pressures have in the past resulted in a decrease in the revenue we receive
23
for each scan we perform, which would reduce our revenues and hard our operating results. For a more detailed discussion of the various state and federal legislation and regulations to which we are subject, see Item 1, Business-Regulation and -Reimbursement.
The application or repeal of state certificate of need regulations could harm our business and financial results.
Some states require a CON or similar regulatory approval prior to the acquisition of high-cost capital items, including diagnostic imaging and radiation oncology systems or provision of diagnostic imaging and radiation therapy services by us or our clients. A majority of the 43 states in which we operate require a CON, and more states may adopt similar licensure frameworks in the future. In many cases, a limited number of these certificates are available in a given state. If we are unable to obtain the applicable certificate or approval or additional certificates or approvals necessary to expand our operations, these regulations may limit or preclude our operations in the relevant jurisdictions.
Conversely, states in which we have obtained a CON may repeal existing CON regulations or liberalize exemptions from the regulations. The repeal of CON regulations or defunding of CON programs in states in which we have obtained a CON or CON exemption would lower barriers to entry for competition in those states and could adversely affect our business.
If we fail to comply with various licensure, certification and accreditation standards, we may be subject to loss of licensure, certification or accreditation, which would adversely affect our operations.
All of the states in which we operate require the imaging technologists and radiation therapists who operate systems to be licensed or certified. Also, each of our retail sites must continue to meet various requirements to receive payments from the Medicare program. In addition, we are currently accredited by The Joint Commission, an independent, non-profit organization that accredits various types of healthcare providers such as hospitals, nursing homes and providers of diagnostic imaging services. In the healthcare industry, various types of organizations are accredited to meet certain Medicare certification requirements, expedite third-party payments and fulfill state licensure requirements. Some managed care providers prefer to contract with accredited organizations. Any lapse in our licenses, certifications or accreditations or those of our technologists, or the failure of any of our retail sites to satisfy the necessary requirements under Medicare could adversely affect our operations and financial results.
We cannot predict the full extent of recent legislative changes on our business, and their effects may harm our financial performance and our stockholder value.
Recent healthcare reform laws, in particular the Patient Protection and Affordable Care Act ("PPACA"), substantially changed the way health care is financed by both governmental and private insurers. For example, certain provisions may negatively affect payment rates for some imaging and radiation oncology services. A number of states have opted out of participation in the PPACA, which reduces the number of previously uninsured people who can participate in the program. Other legislative changes have been proposed and adopted since the PPACA was enacted. On August 2, 2011, the President signed into law the BCA, which, among other things, created the Joint Select Committee on Deficit Reduction to recommend proposals in spending reductions to Congress. The Joint Select Committee did not achieve its targeted deficit reduction of at least $1.2 trillion for the years 2013 through 2021, triggering the legislation's automatic reduction to several government programs. These reductions include aggregate reductions to Medicare payments to providers of up to 2% per fiscal year. The enactment of the ATRA of 2012 on January 2, 2013, delayed the imposition of these automatic cuts until March 1, 2013. On March 1, 2013, the President signed an executive order implementing the automatic reductions. Pursuant to that order, payments to Medicare providers for services furnished on or after April 1, 2013 were reduced by 2%. The impact to our revenue related to this 2% reduction was approximately $0.4 million in 2014 and is anticipated to be $0.4 million in 2015. The 2013 Budget Act extended the 2% reduction in payments to Medicare providers by another two years (through 2023), and subsequent legislation extended the cuts through 2024. Unless Congress acts to repeal or revise the automatic budget cuts enacted by the BCA, this payment reduction will continue. The PAMA also included a new quality incentive payment policy that, beginning January 1, 2016, will reduce Medicare payments for certain CT services paid under the Physician Fee Schedule or HOPPS that are furnished using equipment that does not meet certain dose optimization and management standards. The full effect of the PPACA, BCA, ATRA and PAMA on our business is uncertain, and it is not clear whether other legislative changes will be adopted or how those changes would affect the demand for our services.
Other Risks Related to Our Business
Our MRI and PET/CT scan volumes were lower in 2014 than in 2013, and a continued decline in the volumes could have a material adverse effect on the demand for our services and/or our future revenues.
We believe the reductions we experienced in our 2014 MRI and PET/CT scan volumes resulted from lower authorization rates by insurance carriers for our diagnostic imaging services, as well as sustained unemployment rates, the number of under-
24
insured or uninsured patients, the reported decline in physician office visits, hospitals adding imaging services directly to enhance hospital profitability and other conditions arising from the global economic conditions described below. We believe that demand for MRI and PET/CT scans from our shared-service operations will continue to decline in future periods as a result of these factors. If we are unable to arrest and reverse these declines, our financial performance and condition will suffer.
We experience competition from other medical diagnostic and radiation oncology companies and equipment manufacturers, and this competition, as well as overcapacity to meet demand for medical diagnostic and radiation oncology services, could adversely affect our revenues and our business.
The market for diagnostic imaging and radiation oncology services and systems is competitive. In addition to direct competition from other imaging and radiation oncology providers, we compete with independent imaging centers and referring physicians with diagnostic imaging systems in their own offices, as well as with OEMs that aggressively sell or lease imaging or radiation oncology systems to healthcare providers for full-time installation. Some of our competitors may now or in the future have access to greater resources than we do or may be less burdened with debt and contribute to overcapacity to meet the demand for our services. If we are unable to compete successfully with this diverse group of competitors, particularly if overall MRI usage declines, our client base will decline and our business and financial condition will suffer.
Our revenues may fluctuate or be unpredictable, which may adversely affect our financial results.
The amount and timing of revenues that we may derive from our business will fluctuate based on:
• | the effects of governmental laws, regulations and reimbursement policies on payments to us and to third-party payors; |
• | variations in the rate at which our clients renew their contracts with us; |
• | the extent to which our mobile shared-service clients become full-time clients; |
• | competitive factors; |
• | trends in healthcare treatment and reimbursement by government and private insurance; |
• | overall revenue trends; |
• | changes in the number of days of service we can offer with respect to a given system due to equipment malfunctions or the seasonal factors discussed below; |
• | the mix of wholesale and retail billing for our services; and |
• | the overall United States economy and the economy in the particular areas where we provide our services. |
In addition, we experience seasonality in the sale of our services. First and fourth quarter revenues are typically lower than those from the second and third quarters. First quarter revenues are affected primarily by inclement weather, typically resulting in fewer patients being scanned or treated during the period. Fourth quarter revenues are affected by holiday and client and patient vacation schedules, resulting in fewer scans or treatments during the period. Due to the fixed nature of our costs, the variability in margins is higher than the variability in revenues. As a result, our revenues may vary significantly from quarter to quarter, and our quarterly results have been and may in the future be below market expectations. We also experience fluctuations in revenues due to general economic conditions, including recession or economic slowdown. We may not be able to reduce our expenses, including our debt service obligations, quickly enough to respond to these declines in revenue, which would make our business difficult to operate and would harm our financial results.
We may be unable to renew or maintain our client contracts, which would harm our business and financial results.
When our clients' contracts with us expire, those clients may cease using our imaging services and purchase or lease their own imaging systems or use our competitors' imaging systems. During the year ended December 31, 2014, we continued to experience a rate of contract terminations similar to 2013 levels partially due to stepped up efforts to renew existing contracts and due to the ability of some of our clients to exercise early termination clauses and otherwise discontinue service before maturity. Additionally, marketing, sales and attractive financing alternatives offered by OEMs to our clients may impact our ability to renew or maintain client contracts in 2014 and beyond. As a result of these and other factors, our MRI and PET/CT revenues for 2014 declined compared to 2013 levels. If our clients do not renew or maintain their contracts as we expect, our business will suffer. It is not always possible to obtain replacement clients quickly. Historically, many replacement clients have been smaller facilities that have a lower number of scans and generate less revenue than the clients we lost. We also run the risk of being unable to renew or maintain our client contracts in our Radiation Oncology Division.
Pressure to control healthcare costs could have a negative effect on our results.
One of the principal objectives of managed care organizations, such as health maintenance organizations and preferred provider organizations, is to control the cost of healthcare services. Healthcare providers participating in managed care plans may be influenced to refer patients seeking imaging services or radiation therapy to certain providers depending on the plan in
25
which a covered patient is enrolled. The expansion of health maintenance organizations, preferred provider organizations and other managed care organizations within the geographic areas we cover could have a negative effect on the utilization and pricing of our services, because these organizations may exert greater control over patients' access to services of the type we offer, the selections of the provider of those services and reimbursement rates for those services.
We may be unable to maintain our imaging and radiation oncology systems effectively or generate revenue when our systems are not working.
Timely, effective service is essential to maintaining our reputation and high utilization rates on our imaging and radiation oncology systems. Repairs to one of our systems can take up to two weeks and result in a loss of revenue. Our warranties and maintenance contracts do not fully compensate us for loss of revenue when our systems are not working. The principal components of our cost of revenues include depreciation; amortization; compensation paid to technologists, therapists, drivers and other clinical staff; system maintenance costs; insurance; medical supplies; system transportation; technologists' travel costs; and professional costs related to the delivery of radiation therapy and professional radiology interpretation services. Because the majority of these expenses are fixed, a reduction in the number of scans or treatments performed due to out-of-service equipment will result in lower revenues and margins. Equipment manufacturers repair our equipment, and they may not be able to perform repairs or supply needed parts in a timely manner. Therefore, if we experience greater than anticipated system malfunctions or if we are unable to promptly obtain the service necessary to keep our systems functioning effectively, our revenues could decline and our ability to provide services would be harmed.
Harsh weather conditions may limit our ability to maximize the utilization of our diagnostic imaging and radiation oncology equipment, which may reduce our revenue.
Harsh weather conditions can adversely affect our operations and financial condition. To the extent severe weather patterns affect the regions in which we operate, potential patients may find it difficult to travel to our centers and we may have difficulty moving our mobile systems along their scheduled routes. As a result, we could experience a decrease in equipment utilization, scan volume and revenues during that period.
Natural disasters could adversely affect our business and operations.
Our corporate headquarters is located in California and we currently operate in various geographic regions across 43 states. Consequently, we are subject to varying risks for natural disaster, including draught, hurricanes, blizzards, floods, earthquakes and tornados. Depending on its severity, a natural disaster could damage our facilities and systems or prevent potential patients from traveling to our centers. Damage to our equipment or any interruption in our business would adversely affect our financial condition and could result in the loss of the capital invested in the damaged facilities or systems or anticipated future cash flows from those facilities or systems.
Adverse changes in general domestic and worldwide economic conditions and instability and disruption of credit markets could adversely affect our operating results, financial condition or liquidity.
We are subject to risks arising from adverse changes in general domestic and global economic conditions, including recession or economic slowdown and disruption of credit markets. Global market and economic conditions continue to be very challenging with tight credit conditions and slow or negative economic growth in most major economies generally expected to continue in 2014 and possibly beyond. These conditions, combined with volatile oil prices, declining business and consumer confidence, increased unemployment, increased tax rates and governmental budget deficits and debt levels have contributed to volatility of unprecedented levels in our business. We believe our MRI and PET/CT scan volumes were reduced during 2014 due to an increase in the number of under-insured or uninsured patients, the reported decline in physician office visits, hospitals adding imaging services to enhance hospital profitability and other conditions arising from the global economic conditions described above. We cannot quantify the effect these conditions might have on our future revenues or business, although we believe that MRI scans will continue to decline in 2015. If we are unable to arrest and reverse these declines, our financial performance and condition will suffer.
As a result of these market conditions, the cost and availability of credit has been and may continue to be adversely affected by illiquid credit markets and wider credit spreads. Concern about the stability of the markets generally and the strength of counterparties specifically has led many lenders and institutional investors to reduce, and in some cases cease to provide, funding to borrowers. Continued turbulence in the United States and international markets and economies may adversely affect our liquidity and financial condition and the liquidity and financial condition of our customers. If these market conditions continue, they may limit our ability to timely access the capital markets to meet liquidity needs, resulting in adverse effects on our financial condition and results of operations.
26
We may not receive payment from some of our healthcare provider clients because of their financial circumstances.
Some of our healthcare provider clients do not have significant financial resources, liquidity or access to capital. If these clients experience financial difficulties, they may be unable to pay us for the services that we provide. We have experienced, and expect to continue to experience, write-offs of accounts receivable from healthcare provider clients that become insolvent, file for bankruptcy or are otherwise unable to pay amounts owed to us. A significant deterioration in general or local economic conditions could have a material adverse effect on the financial health of some of our healthcare provider clients. As a result, we may have to increase the amounts of accounts receivable that we write-off, which would adversely affect our financial condition and results of operations.
Technological change in our industry could reduce the demand for our services and require us to incur significant costs to upgrade our equipment.
We operate in a competitive, capital intensive and high fixed-cost industry. The development of new technologies or refinements of existing ones might make our existing systems technologically or economically obsolete, or reduce the need or demand for our systems. Numerous companies currently manufacture MRI and PET/CT, radiation oncology and other diagnostic imaging systems. Competition among manufacturers for a greater share of the MRI, PET/CT and other diagnostic imaging systems market has resulted in and likely will continue to result in technological advances in the speed and imaging capacity of these new systems, including the new ultra-high field MRI systems and 256-slice CT systems. Consequently, the obsolescence of our systems may be accelerated. In the future, to the extent we are unable to generate sufficient cash from our operations or obtain additional funds through bank financing or the issuance of equity or debt securities, we may be unable to maintain a competitive equipment base. In addition, advancing technology may enable hospitals, physicians or other service providers to perform procedures without the assistance of service providers such as ourselves. As a result, we may not be able to maintain our competitive position in our targeted regions or expand our business.
Because a high percentage of our operating expenses are fixed, a relatively small decrease in revenues could have a significant negative effect on our financial results.
A high percentage of our expenses are fixed, meaning they do not vary significantly with the increase or decrease in revenues. Those expenses include debt service and capital lease payments, rent payments, payroll, maintenance, insurance and vehicle operation costs. As a result, a relatively small reduction in the prices we charge for our services or in our procedure volumes could have a disproportionate negative effect on our financial results.
We may be subject to professional liability risks, which could be costly and could negatively affect our business and financial results.
We may be subject to professional liability claims. There is a risk of harm to a patient during an MRI if the patient has certain types of metal implants or cardiac pacemakers within his or her body. Although patients are screened to safeguard against this risk, screening may nevertheless fail to identify the hazard.
In response to recent press reports concerning the risk of significant, sometimes fatal, errors in radiation therapy, especially relating to linear radiation, accreditation of facilities and the establishment of a national error reporting database are under consideration. In addition, various trade organizations have called for quality improvement measures and the establishment of the nation's first central database for the reporting of errors involving linear particle accelerators and CT scanners. Federal legislation in these areas is under consideration and a Congressional hearing was held in February 2010. We are not aware of any actions taken after the hearing. In addition, on September 29, 2010, California enacted a law that requires hospitals and clinics to record radiation doses for CT scans, which became effective July 1, 2012, and to report any overdoses to patients, their doctors and the California Department of Public Health. Effective July 1, 2013, the new California law requires all facilities that furnish CT services to be accredited by an organization approved by CMS, the Medical Board of California or the California Department of Public Health. Other states have considered similar legislation and enacted regulations to implement additional record keeping, education, or oversight requirements relate to CT services. We cannot assure you that the cost of complying with any new regulations will not be substantive, that the negative publicity concerning these errors will not adversely affect our business, or that these types of errors will not occur with our services.
We maintain professional liability insurance with coverage that we believe is consistent with industry practice and appropriate in light of the risks attendant to our business. Nevertheless, any claim made against us could be costly to defend against, result in a substantial damage award against us and divert the attention of our management from our operations, which could have an adverse effect on our financial performance. It is also possible that our insurance coverage will not continue to be available at acceptable costs or on favorable terms.
27
Loss of key executives and failure to attract qualified managers and sales persons could limit our growth and negatively affect our operations.
Our senior management team has extensive experience in our industry. We believe that they are instrumental in guiding our business, instituting valuable performance and quality monitoring, and driving innovation. Accordingly, our future performance is substantially dependent upon the services of our senior management team and our ability to attract talented executives as and when needed. In particular, we depend upon Tom Tomlinson, our Chief Executive Officer, and Division Presidents, for their skills, experience, and knowledge of our company and industry contacts. We do not have key employee insurance policies covering any of our management team. The loss of Mr. Tomlinson and divisional leadership, or other members of our management team could have a material adverse effect on our business, results of operations or financial condition.
We require field managers and sales persons with experience in our industry to operate and sell our services for diagnostic imaging and radiation oncology. We cannot predict the availability of qualified field managers and sales persons or the compensation levels that will be required to hire and retain them. The loss of the services of any member of our senior management or our inability to hire qualified field managers and sales persons at compensation levels that are economically reasonable to us could adversely affect our ability to operate and grow our business.
Many of the states in which we operate do not enforce agreements that prohibit a former employee from competing with a former employer. As a result, many of our employees whose employment is terminated are free to compete with us, subject to prohibitions on the use of confidential information and, depending on the terms of the employee's employment agreement, on solicitation of existing employees and customers. A former executive, field or sales manager or other key employee who joins one of our competitors could use the relationships he or she established while our employee and the industry knowledge he or she acquired during that tenure to enhance the new employer's ability to compete with us.
Loss of, and failure to attract, qualified employees, technologists and other clinical staff could limit our growth and negatively affect our operations.
Our future success depends on our continuing ability to identify, hire, develop, motivate and retain highly skilled personnel for all areas of our organization. Competition in our industry for qualified employees is intense. In particular, there is a very high demand for qualified technologists who are necessary to operate our systems, particularly PET/CT technologists. We may not be able to hire and retain a sufficient number of technologists, therapists, physicists and dosimetrists, and we expect that our costs for the salaries and benefits of these employees will continue to increase for the foreseeable future because of the industry's competitive demand for their services. Our continued ability to compete effectively depends on our ability to attract new employees and to retain and motivate our existing employees.
Our PET/CT services and some of our other imaging services require the use of radioactive materials, which could subject us to regulation-related costs and delays and potential liabilities for injuries or violations of environmental, health and safety laws and regulations.
Our PET/CT services and some of our other imaging services require radioactive materials. While these radioactive materials have a short half-life-meaning it quickly breaks down into inert or non-radioactive substances-storage, transportation, use and disposal of these materials present the risk of accidental environmental contamination and physical injury. We are subject to federal, state and local regulations governing storage, transportation, handling and disposal of these materials and waste products. In spite of our safety procedures for storing, transporting, handling and disposing of these hazardous materials, we cannot completely eliminate the risk of accidental contamination or injury from those hazardous materials. We maintain professional liability insurance with coverage that we believe is consistent with industry practice and appropriate in light of the risks attendant to our business. In the event of an accident, however, we could be held liable for any damages that result, and any liability could exceed the limits or fall outside the coverage of our insurance. We may not be able to maintain insurance on acceptable terms, or at all. We could incur significant costs and the diversion of our management's attention to comply with current or future environmental, health and safety laws and regulations.
We may not be able to achieve the expected benefits from future acquisitions, which would adversely affect our financial condition and results.
We have historically relied on acquisitions as a method of expanding our business. In addition, we will consider future acquisitions as opportunities arise and our financial performance permits. If we do not successfully integrate acquisitions, we may not realize anticipated operating advantages and cost savings. The integration of companies that have previously operated separately involves a number of risks, including:
28
• | demands on management related to the increase in our size after an acquisition; |
• | the diversion of management's attention from the management of daily operations to the integration of operations; |
• | difficulties in the assimilation and retention of employees; |
• | potential adverse effects on operating results; and |
• | challenges in retaining clients. |
We may not be able to maintain the levels of operating efficiency that acquired companies have achieved or might achieve separately. Successful integration of each of their operations will depend upon our ability to manage those operations and to eliminate redundant and excess costs. Because of difficulties in combining operations, we may not be able to achieve the cost savings and other size-related benefits that we hoped to achieve after these acquisitions, which would harm our financial condition and operating results.
High fuel costs can harm our operations and financial performance.
Fuel costs constitute a significant portion of our mobile operating expenses, through diesel fuel for our tractor fleet and mileage reimbursement for our team members. Historically, fuel costs have been subject to wide price fluctuations based on geopolitical issues and supply and demand. Fuel availability is also affected by demand for home heating oil, diesel, gasoline and other petroleum products, as well as overall economic conditions. Because of the effect of these events on the price and availability of fuel, we cannot predict the cost and future availability of fuel with any degree of certainty. In the event of a fuel supply shortage or further increases in fuel prices, we might be forced to curtail our scheduled mobile services. Sustained high fuel costs will harm our financial condition and results of operations.
Insurance costs and claims expenses could adversely affect our earnings.
The transportation aspect of our business is exposed to costs for claims related to property damage claims by others; personal injury; damage to our mobile systems resulting from accidents, vandalism or theft; and workers' compensation. We carry insurance to minimize these exposures. Insurance costs have varied over the past five years, reflecting the level of our operations, the insurance environment for our industry, our claim experience and our self-retained (deductible) level.
We are also responsible for claim expenses within our self-retained (deductible) levels for liability and workers' compensation claims. We maintain insurance to cover claims and expense in excess of our deductible levels with insurance companies that we consider financially sound. Although we believe our aggregate insurance limits are sufficient to cover reasonably expected claims, it is possible that one or more claims could exceed those limits and adversely affect our operating results. If the number or severity of claims within our deductible levels increases, or if we are required to accrue or pay additional amounts because the claims prove to be more severe than our original assessment, our operating results would be adversely affected.
Our transportation operations are regulated, and failure to comply or increased costs of compliance with existing or future regulations could have a material adverse effect on our business.
The transportation aspect of our business is subject to legislative and regulatory changes that can affect our operations and financial performance. Our trucking operations and those of the trucking companies and independent contractors with whom we engage are subject to regulation by the Department of Transportation, or DOT, and various state, local, and foreign governmental agencies, which govern such activities as authorization to engage in motor carrier operations, handling of hazardous materials, safety ratings, insurance requirements, vehicle weight and size, and emissions restrictions. We are also periodically audited by the DOT and other state and federal authorities to ensure that we comply with safety, required licenses, hours-of-service, clean truck regulations, and other rules and regulations.
New governmental laws and regulations, or changes to existing laws and regulations, could affect our transportation operations. Any additional measures that may be required by future laws and regulations or changes to existing laws and regulations may require us to make changes to our operating practices and may result in additional costs which, if we are unable to pass through to our clients, could have an adverse effect on our financial performance.
Risks Related to Our Governance and Stock Exchange Listing
Funds managed by Oaktree Capital Management, LLC and MTS Health Investors, LLC beneficially own the majority of our outstanding shares of common stock and are therefore able to exert significant influence over us, including with respect to change of control transactions.
29
As of December 31, 2014, funds managed by Oaktree Capital Management, LLC and MTS Health Investors, LLC (collectively, the “Investor Parties”) beneficially owned approximately 50.7% of our outstanding shares of common stock. So long as they beneficially own at least 35% of our outstanding shares of common stock, the Investor Parties will have the right to designate three of the members of our board of directors. As a result of their ownership of our common stock and their right to designate three directors, the Investor Parties have the ability to exert significant influence on our management and operations, as well as control the outcome of matters requiring stockholder approval, including approving mergers, consolidations or sales of all or substantially all of our assets, election of directors and advisory votes, including advisory votes related to our executive pay practices and appointment of independent registered auditors. This concentration of ownership and voting power may have the effect of delaying or preventing a merger, consolidation, sale of assets or other similar transaction that involves a third party.
Because of the equity ownership of the Investor Parties, we are considered a “controlled company” for purposes of the National Association of Securities Dealers Automated Quotations: Global Market ("NASDAQ") listing requirements. As such, we are exempt from the requirement that the majority of our board of directors meet the standards of independence established by the NASDAQ and we are exempt from the requirement that we have a separate Compensation Committee comprised entirely of directors who meet those independence standards. Although we do not currently intend to rely upon the exemption available for controlled companies, we may choose to use the exemption at any time that we remain a controlled company. The NASDAQ independence standards are intended to ensure that directors who meet the independence standards are free of any conflicting interest with management that could influence their actions as directors. It is possible that the interests of the Investor Parties may in some circumstances conflict with our interests or the interests of our other stockholders.
Possible volatility in our stock price could negatively affect us and our stockholders.
The trading price of our common stock has fluctuated significantly in the past. During the period from January 1, 2012 through December 31, 2014, the trading price of our common stock fluctuated from a high of $34.15 per share to a low of $3.65 per share. The price of our common stock could also be subject to wide fluctuations in the future as a result of a number of other factors, including the following:
• | changes in expectations as to future financial performance or buy/sell recommendations of securities analysts; |
• | our, or a competitor's, announcement of new products or services, or significant acquisitions, strategic partnerships, joint ventures or capital commitments; and |
• | the operating and stock price performance of other comparable companies. |
In addition, the securities markets in the United States have experienced significant price and volume fluctuations. These fluctuations often have been unrelated to the operating performance of companies in these markets. Broad market and industry factors may lead to volatility in the price of our common stock, regardless of our operating performance. Moreover, our stock has limited trading volume, and this illiquidity may increase the volatility of our stock price.
In the past, following periods of volatility in the market price of an individual company's securities, securities class action litigation often has been instituted against that company. The institution of similar litigation against us could result in substantial costs and a diversion of management's attention and resources, which could negatively affect our business, results of operations or financial condition.
Provisions of the Delaware General Corporation Law and our organizational documents may discourage an acquisition of us.
In the future, we could become the subject of an unsolicited takeover attempt. Although an unsolicited takeover could be in the best interests of our stockholders, our organizational documents and the General Corporation Law of the State of Delaware both contain provisions that will impede the removal of directors and may discourage another party from making a proposal to acquire us. For example, the provisions:
• | permit the board of directors to increase its own size and fill the resulting vacancies; |
• | provide for a board composed of three classes of directors with each class serving a staggered three-year term; |
• | authorize the issuance of additional shares of preferred stock in one or more series without a stockholder vote; and |
• | establish an advance notice procedure for stockholder proposals to be brought before an annual meeting of our stockholders, including proposed nominations of persons for election to the board of directors. |
30
Moreover, these provisions can only be amended by the vote of 66 2/3 or more of our outstanding shares entitled to vote. Furthermore, we are subject to Section 203 of the Delaware General Corporation Law, which could have the effect of delaying or preventing a change in control.
Risks Related to Our Debt
Our substantial debt could restrict our operations and make us more vulnerable to adverse economic conditions.
We are highly leveraged. As of December 31, 2014, we had $507.3 million of outstanding debt, excluding letters of credit, and approximately $43.5 million was available for borrowing under our revolving credit facility. Our substantial debt could have important consequences for our stockholders. For example, it requires us to dedicate a substantial portion of our cash flow from operations to payments on our debt, thereby reducing the availability of our cash flow to fund working capital, capital expenditures and acquisitions and for other general corporate purposes. In addition, our debt could:
• | increase our vulnerability to economic downturns and competitive pressures in our industry; |
• | place us at a competitive disadvantage compared to our competitors that have less debt in relation to cash flow; |
• | limit our flexibility in planning for, or reacting to, changes in our business and our industry; and |
• | limit our ability to borrow additional funds on terms that are satisfactory to us or at all. |
Our credit agreement contains restrictions on our ability to incur additional debt and engage in business activities and requirements that we maintain specified financial ratios. If we cannot comply with these covenants, we may be in default under these agreements.
Our credit agreement contains affirmative and negative covenants that restrict, among other things, our ability to:
• | incur additional debt; |
• | sell assets; |
• | create liens or other encumbrances; |
• | make certain payments and dividends; or |
• | merge or consolidate. |
In addition, the credit agreement also contains a leverage ratio covenant requiring the Company to maintain a maximum total debt to consolidated adjusted EBITDA expense that ranges from 4.95 to 1.00 to 4.30 to 1.00. For the period ended December 31, 2014, the Credit Agreement requires a maximum leverage ratio of not more than 4.90 to 1.00, decreasing to 4.85 to 1.00 for the period ended March 31, 2015, 4.80 to 1.00 for the period ended June 30, 2015, 4.75 to 1.00 for the period ended September 30, 2015, and 4.55 to 1.00 for the period ended December 31, 2015.
.
All of these restrictions could affect our ability to operate our business and may limit our ability to take advantage of potential business opportunities as they arise. A failure to comply with these covenants and restrictions would permit the relevant creditors to declare all amounts borrowed under the relevant borrowing, together with accrued interest and fees, to be immediately due and payable. If the debt under the credit facility is accelerated, we may not have sufficient assets to repay amounts due under the credit facility or on other debt then outstanding. If we are unable to refinance our debt, we could become subject to bankruptcy proceedings, and you may lose all or a portion of your investment because of the priority of the claims of certain of our creditors on our assets.
If there is a default under the agreements governing our material debt, the value of our assets may not be sufficient to repay our creditors.
Our property and equipment, which make up a significant portion of our tangible assets, had a net book value of $149.3 million as of December 31, 2014 and $169.8 million as of December 31, 2013. The book value of these assets should not be relied on as a measure of realizable value for such assets. The realizable value may be lower than net book value. The value of our assets in the event of liquidation will depend upon market and economic conditions, the availability of buyers and similar factors. A sale of these assets in a bankruptcy or similar proceeding would likely be made under duress, which would reduce the amounts recovered. Furthermore, such a sale could occur when other companies in our industry also are distressed, which might increase the supply of similar assets and further reduce the amounts that could be recovered. Our goodwill and other intangible assets had a net book value of $179.8 million as of December 31, 2014 and $158.8 million as of December 31, 2013. These assets primarily consist of the excess of the acquisition cost over the fair market value of the net assets acquired in purchase transactions, customer contracts and costs to obtain certificates of need. The value of goodwill and other intangible
31
assets will continue to depend significantly upon the success of our business as a going concern and the growth in future cash flows. As a result, in the event of a default under the agreements governing our material debt or any bankruptcy or dissolution, the realizable value of these assets will likely be substantially lower and may be insufficient to satisfy the claims of our creditors.
The financial condition of our assets will likely deteriorate during any period of financial distress preceding a sale of our assets. In addition, much of our assets consist of illiquid assets that may have to be sold at a substantial discount in an insolvency situation. Accordingly, the proceeds of any such sale of our assets may not be sufficient to satisfy, and may be substantially less than, amounts due to our creditors.
Despite current debt levels, we and our subsidiaries may still be able to incur substantially more debt, which could increase the risks described above.
We and our subsidiaries may be able to incur substantial additional debt in the future. The terms of our credit agreement permit us or our subsidiaries to incur additional debt, subject to certain restrictions. In addition, as of December 31, 2014, our credit facility permitted additional borrowings of up to approximately $43.5 million under our revolving credit facility subject to the covenants contained in our credit facility. If we add new debt to our or our subsidiaries' current debt levels, the risks discussed above could intensify.
If we are unable to generate or borrow sufficient cash to make payments on our debt or to refinance our debt on acceptable terms when it matures, our financial condition would be materially harmed, our business could fail and you may lose all of your investment.
Our ability to make scheduled payments on or to refinance our obligations at maturity will depend on our financial and operating performance, which will be affected by economic, financial, competitive, business and other factors, some of which are beyond our control. As a result of the recent global market and economic conditions, the cost and availability of credit and equity capital have been severely affected. We cannot assure you that our business will generate sufficient cash flow from operations or that future borrowings will be available to us in an amount sufficient to enable us to service our debt or to fund our other liquidity needs. If we are unable to meet our debt obligations or fund our other liquidity needs, we may need to restructure or refinance all or a portion of our debt on or before maturity or sell certain of our assets. We cannot assure you that we will be able to restructure or refinance any of our debt on commercially reasonable terms, if at all, which could cause us to default on our debt obligations and impair our liquidity. Any refinancing of our debt could be at higher interest rates and may require us to comply with more onerous covenants, which could further restrict our business operations.
Increases in interest rates could adversely affect our financial condition.
An increase in prevailing interest rates would have an effect on the interest rates charged on our variable rate debt, which rise and fall upon changes in interest rates. As of December 31, 2014, approximately $494.3 million of our debt was at variable interest rates. If prevailing interest rates or other factors result in higher interest rates, the increased interest expense would adversely affect our cash flow and our ability to service our debt. If interest rates are higher when our debt becomes due, we may be forced to borrow at the higher rates.
As a protection against rising interest rates, we may enter into agreements such as interest rate swaps, caps, floors and other interest rate exchange contracts. These agreements, however, carry the risks that the other parties to the agreements may not perform or that the agreements could be unenforceable. In the fourth quarter of 2013, we entered into five interest rate cap agreements to avoid unplanned volatility in the income statement due to changes in the London Interbank Offered Rate ("LIBOR") interest rate environment. These agreements, which mature in December 2019, have a total notional amount of $250.0 million and were designated as cash flow hedges of future cash interest payments associated with a portion of our variable rate bank debt. Under these arrangements, we have purchased a cap on LIBOR at 2.50%.
ITEM 1B. | UNRESOLVED STAFF COMMENTS |
Not applicable.
ITEM 2. | PROPERTIES |
We lease approximately 40,596 square feet of space in Newport Beach, California for our executive and principal administrative offices. We lease 7,985 square feet of space in Nashville, Tennessee for our Alliance Oncology executive and
32
administrative offices. We also lease 19,979 square feet of space in Canton, Ohio for our retail billing and scheduling operations. We lease 16,243 square feet of space for a large regional office in Andover, Massachusetts, in addition to other small regional offices we lease throughout the country. We also lease a 11,200 square foot operations warehouse in Fontana, California and a 9,000 square foot operations warehouse in Childs, Pennsylvania, which are used for the Radiology Division.
ITEM 3. | LEGAL PROCEEDINGS |
From time to time we are involved in routine litigation and regulatory matters incidental to the conduct our business. We believe that resolution of such matters will not have a material adverse effect on our consolidated results of operations or financial position.
In June 2012, Pacific Coast Cardiology (“PCC”) d/b/a Pacific Coast Imaging, Emanuel Shaoulian, MD, Inc., and Michael M. Radin, MD, Inc. filed a lawsuit in California state court against us and other defendants. The complaint asserted a number of claims related to our decision not to purchase PCC in 2010, and also separately sought a determination regarding an amount we contend was owed to us by PCC pursuant to a previous contractual arrangement. In July 2014, we entered into a settlement agreement for an amount that is not material to our financial position, results of operations or cash flows, for which we had previously recorded an accrual. The Court approved the settlement on August 11, 2014.
On November 9, 2012, U.S. Radiosurgery, LLC (“USR”) a subsidiary of the Company, received a grand jury subpoena issued by the United States Attorney's Office for the Middle District of Tennessee seeking documents related to USR and its financial relationships with physicians and other healthcare providers. The federal government has informed us that this matter has been closed.
On March 27, 2013, we were served with a lawsuit filed in U.S. District Court for the Northern District of Mississippi by Superior MRI Services, Inc. The plaintiff is an alleged successor in interest to a former local competitor, P&L Contracting, Inc. Plaintiff alleges we disregarded Mississippi Certificate of Need ("CON") rules and regulations by operating without obtaining the appropriate authority, and is seeking in excess of $1.0 million in damages as well as requesting injunctive relief. In January 2014, the District Court dismissed plaintiff’s complaint on a number of procedural and substantive grounds. The plaintiff subsequently appealed the District Court’s ruling to the Fifth Circuit Court of Appeals. On February 18, 2015, the Fifth Circuit Court of Appeals affirmed the District Court’s dismissal, thereby, effectively concluding this case in Alliance’s favor.
On June 14, 2013, Alliance Oncology, LLC, our subsidiary, filed a complaint against Harvard Vanguard Medical Associates, Inc. (“HVMA”) in the United States District Court for the District of Massachusetts, including several claims seeking damages resulting from HVMA’s early termination of a long-term services agreement between the two companies. HVMA filed an answer to Alliance Oncology’s complaint on August 27, 2013. Without specifying its alleged damages, HVMA also asserted several counterclaims in its answer. We filed our answer to HVMA’s counterclaims on October 4, 2013, and we intend to vigorously defend against the claims asserted. Litigation is currently ongoing through the discovery process. We have not recorded an expense related to any potential damages in connection with this matter because any potential loss is not probable or reasonably estimable at this time.
ITEM 4. | MINE SAFETY DISCLOSURES |
Not applicable.
PART II
ITEM 5. | MARKET FOR REGISTRANT'S COMMON EQUITY, RELATED STOCKHOLDER MATTERS, AND ISSUER PURCHASES OF EQUITY SECURITIES |
Beginning February 11, 2013, our common stock has been traded on the NASDAQ Global Market under the symbol “AIQ.” Prior to February 11, 2013, our common stock was traded on the New York Stock Exchange (“NYSE”). The high and low sales prices as reported on the NYSE are set forth below for the respective time periods. As of March 12, 2015, there were 17 stockholders of record of our common stock and approximately 2,100 beneficial holders of our common stock.
The table below illustrates per share price ranges for each quarter during 2013 and 2014:
33
2014 | 2013 | |||||||||||||||
High | Low | High | Low | |||||||||||||
First Quarter | $ | 33.81 | $ | 26.24 | $ | 7.77 | $ | 6.31 | ||||||||
Second Quarter | $ | 34.15 | $ | 26.91 | $ | 16.21 | $ | 7.95 | ||||||||
Third Quarter | $ | 29.83 | $ | 22.61 | $ | 27.69 | $ | 15.89 | ||||||||
Fourth Quarter | $ | 25.12 | $ | 19.14 | $ | 31.61 | $ | 20.44 | ||||||||
We have never paid any cash dividends on our common stock and have no current plans to do so. We intend to retain available cash to operate our business, including capital expenditures, future acquisitions and debt repayment. Our credit agreement restricts the payment of cash dividends on our common stock. See Item 7, Management’s Discussion and Analysis of Financial Condition and Results of Operations—Liquidity and Capital Resources.
SECURITIES AUTHORIZED FOR ISSUANCE UNDER EQUITY COMPENSATION PLANS
Our stockholders have previously approved all stock option plans under which our common stock is reserved for issuance. The following table provides summary information as of December 31, 2014 for all of our stock option plans:
Number of shares of Common Stock to be issued upon exercise of outstanding options | Weighted-average exercise price of outstanding options | Number of shares of Common Stock remaining available for future issuance (excluding shares reflected in column 1) | ||||||||
Stock option plans approved by shareholders | 633,898 | $ | 21.39 | 532,457 | ||||||
Stock option plans not approved by shareholders | — | — | — | |||||||
633,898 | $ | 21.39 | 532,457 | |||||||
STOCK PERFORMANCE GRAPH
The following graph sets forth the cumulative return on our common stock from December 31, 2009 through December 31, 2014, as compared to the cumulative return of the S&P 500 Index and the cumulative return of the S&P Healthcare Index. The graph assumes that $100 was invested on December 31, 2009 in each of (1) our common stock, (2) the S&P 500 Index and (3) the S&P Healthcare Index and that all dividends (if applicable) were reinvested.
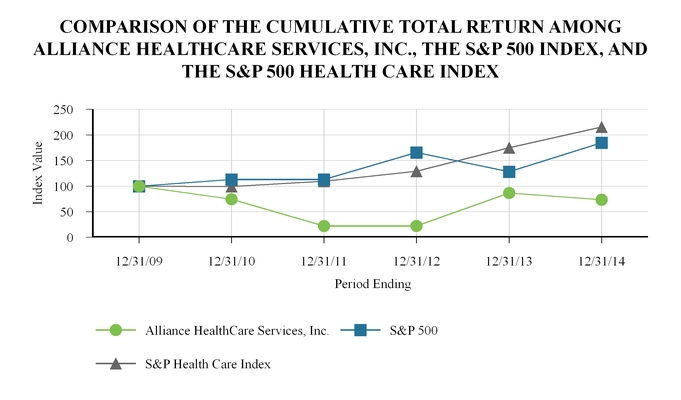
34
12/31/2009 | 12/31/2010 | 12/31/2011 | 12/31/2012 | 12/31/2013 | 12/31/2014 | |||||||||||||
Alliance HealthCare Services, Inc. | 100.00 | 74.26 | 22.07 | 22.35 | 86.65 | 73.52 | ||||||||||||
S&P 500 | 100.00 | 112.78 | 112.78 | 165.76 | 127.90 | 184.64 | ||||||||||||
S&P Healthcare Index | 100.00 | 99.25 | 109.35 | 129.04 | 174.88 | 215.49 | ||||||||||||
This graph and the accompanying text are not “soliciting material,” are not deemed filed with the SEC and are not to be incorporated by reference in any filing by us under the Securities Act of 1933, as amended, or the Securities Exchange Act of 1934, as amended, whether made before or after the date hereof and irrespective of any general incorporation language in any such filing.
35
ITEM 6. | SELECTED FINANCIAL DATA |
The selected consolidated financial data shown below has been taken or derived from the audited consolidated financial statements of the Company and should be read in conjunction with Item 7, Management’s Discussion and Analysis of Financial Condition and Results of Operations and our consolidated financial statements and related notes included in this Annual Report on Form 10-K (in thousands, except per share data).
Year Ended December 31, | ||||||||||||||||||||
2010 | 2011 | 2012 | 2013 | 2014 | ||||||||||||||||
Consolidated Statements of Operations Data: | ||||||||||||||||||||
Revenues | $ | 478,855 | $ | 493,651 | $ | 472,258 | $ | 448,831 | $ | 436,387 | ||||||||||
Costs and expenses: | ||||||||||||||||||||
Cost of revenues, excluding depreciation and amortization | 264,725 | 279,751 | 253,225 | 239,397 | 237,420 | |||||||||||||||
Selling, general and administrative expenses | 67,110 | 77,140 | 76,022 | 80,215 | 79,903 | |||||||||||||||
Transaction costs | 2,439 | 3,429 | 994 | 465 | 2,344 | |||||||||||||||
Severance and related costs | 1,002 | 3,991 | 2,226 | 1,658 | 2,517 | |||||||||||||||
Impairment charges | 42,095 | 167,792 | — | 13,031 | 308 | |||||||||||||||
Loss on extinguishment of debt | — | — | — | 26,018 | — | |||||||||||||||
Depreciation expense | 92,321 | 89,974 | 79,333 | 66,319 | 54,971 | |||||||||||||||
Amortization expense | 12,439 | 16,444 | 15,861 | 10,973 | 7,880 | |||||||||||||||
Interest expense and other, net | 51,203 | 49,789 | 54,101 | 39,170 | 24,693 | |||||||||||||||
Other (income) and expense, net | (590 | ) | 2,203 | 3,036 | (1,945 | ) | (1,823 | ) | ||||||||||||
Total costs and expenses | 532,744 | 690,513 | 484,798 | 475,301 | 408,213 | |||||||||||||||
Income (loss) before income taxes, earnings from unconsolidated investees and noncontrolling interest | (53,889 | ) | (196,862 | ) | (12,540 | ) | (26,470 | ) | 28,174 | |||||||||||
Income tax expense (benefit) | (20,799 | ) | (38,242 | ) | (6,710 | ) | (12,398 | ) | 7,327 | |||||||||||
Earnings from unconsolidated investees | (4,327 | ) | (3,516 | ) | (4,667 | ) | (5,630 | ) | (4,654 | ) | ||||||||||
Net income (loss) | (28,763 | ) | (155,104 | ) | (1,163 | ) | (8,442 | ) | 25,501 | |||||||||||
Less: Net income attributable to noncontrolling interest | (3,890 | ) | (5,008 | ) | (10,775 | ) | (13,041 | ) | (14,883 | ) | ||||||||||
Net income (loss) attributable to Alliance HealthCare Services, Inc. | $ | (32,653 | ) | $ | (160,112 | ) | $ | (11,938 | ) | $ | (21,483 | ) | $ | 10,618 | ||||||
Earnings (loss) per common share attributable to Alliance HealthCare Services, Inc.: | ||||||||||||||||||||
Basic (1) | $ | (3.09 | ) | $ | (15.07 | ) | $ | (1.12 | ) | $ | (2.02 | ) | $ | 1.00 | ||||||
Diluted | $ | (3.09 | ) | $ | (15.07 | ) | $ | (1.12 | ) | $ | (2.02 | ) | $ | 0.98 | ||||||
Weighted average number of shares of common stock and common stock equivalents: | ||||||||||||||||||||
Basic (1) | 10,556 | 10,626 | 10,624 | 10,634 | 10,669 | |||||||||||||||
Diluted | 10,556 | 10,626 | 10,624 | 10,634 | 10,836 | |||||||||||||||
Consolidated Balance Sheet Data (at end of period): | ||||||||||||||||||||
Cash and cash equivalents | $ | 97,162 | $ | 44,190 | $ | 39,977 | $ | 34,702 | $ | 33,033 | ||||||||||
Total assets | 816,201 | 663,094 | 560,141 | 489,847 | 500,885 | |||||||||||||||
Long-term debt, including current maturities | 653,265 | 643,483 | 558,635 | 529,674 | 507,289 | |||||||||||||||
Stockholders’ equity (deficit) | 13,659 | (104,911 | ) | (116,293 | ) | (136,617 | ) | (111,480 | ) | |||||||||||
(1) Share and per share amounts have been retroactively adjusted to reflect our one-for-five reverse stock split effective as of December 26, 2012. | ||||||||||||||||||||
36
ITEM 7. | MANAGEMENT’S DISCUSSION AND ANALYSIS OF FINANCIAL CONDITION AND RESULTS OF OPERATIONS |
Overview
We are a leading national provider of advanced outpatient diagnostic imaging and radiation therapy services, based upon annual revenue and number of imaging systems deployed and radiation oncology centers operated. Our principal sources of revenue are derived from providing magnetic resonance imaging (“MRI”), positron emission tomography/computed tomography (“PET/CT”) through our Radiology Division and radiation oncology services through our Radiation Oncology Division. Unless the context otherwise requires, the words “we,” “us,” “our,” “Company” or “Alliance” as used in this Annual Report on Form 10-K refer to Alliance HealthCare Services, Inc. and our direct and indirect subsidiaries. We provide imaging and therapeutic services primarily to hospitals and other healthcare providers on a shared-service and full-time service basis. We also provide services through fixed-site imaging centers, primarily to hospitals or health systems. Our imaging services normally include the use of our imaging systems, technologists to operate the systems, equipment maintenance and upgrades and management of day-to-day shared-service and fixed-site diagnostic imaging operations. We also provide non scan-based services, which include only the use of our imaging systems under a short-term contract. We have leveraged our leadership in MRI, PET/CT and radiology services to expand into radiation oncology, including stereotactic radiosurgery. We operate our radiation oncology business through our wholly owned subsidiary, Alliance Oncology, LLC, which we sometimes refer to as our Radiation Oncology Division. This division includes a wide range of services for cancer patients covering initial consultation, preparation for treatment, simulation of treatment, actual radiation oncology delivery, therapy management and follow-up care. Our services include the use of our linear accelerators or stereotactic radiosurgery systems, therapists to operate those systems, administrative staff, equipment maintenance and upgrades, and management of day-to-day operations.
MRI, PET/CT and radiation oncology services generated 41%, 31% and 21% of our revenue, respectively, for the year ended December 31, 2014 and 42%, 32% and 17% of our revenue, respectively, for the year ended December 31, 2013. Our remaining revenue was comprised of other modality diagnostic imaging services revenue, primarily computed tomography (“CT”) and management contract revenue, and in 2013, also includes revenue from professional radiology services, which we sold in December 2013. We had 505 diagnostic imaging and radiation oncology systems, including 258 MRI systems (of which 19 are operating leases) and 124 PET/CT systems (of which 9 are operating leases), and served over 1,000 clients in 43 states at December 31, 2014. We operated 117 fixed-site imaging centers (one in an unconsolidated joint venture), which constitute systems installed in hospitals or other medical buildings on or near hospital campuses, including modular buildings, systems installed inside medical groups’ offices, parked mobile systems, and free-standing fixed-site imaging centers, which include systems installed in a medical office building, ambulatory surgical center, or other retail space at December 31, 2014. Of the 117 fixed-site imaging centers, 85 were MRI fixed-site imaging centers, 19 were PET/CT fixed-site imaging centers, thirteen were other modality fixed-site imaging centers and one was in an unconsolidated joint venture. We also operated 31 radiation oncology centers and stereotactic radiosurgery facilities (including one radiation oncology center as an unconsolidated joint venture) at December 31, 2014.
Revenues from fixed-site imaging centers and radiation oncology centers can be structured as either “wholesale” or “retail” revenues. We generated approximately 80% of our revenues for the years ended December 31, 2014 and 2013 by providing services to hospitals and other healthcare providers, which we refer to as “wholesale” revenues. We typically generate our wholesale revenues from contracts that require our clients to pay us based on the number of scans or treatments we perform on patients on our clients’ behalf, although some pay us a flat fee for a period of time regardless of the number of scans or treatments we perform. Wholesale payments are due to us independent of our clients’ receipt of retail reimbursement from third-party payors, although receipt of reimbursement from third-party payors may affect demand for our services. We typically deliver our services for a set number of days per week through exclusive, long-term contracts with hospitals and other healthcare providers. The initial terms of these contracts average approximately three years in length for mobile imaging services and approximately five to 10 years in length for fixed-site imaging arrangements. Our contracts for radiation oncology services average approximately 10 to 20 years in length. These contracts often contain automatic renewal provisions and certain contracts have cancellation clauses if the hospital or other healthcare provider purchases its own system. We price our contracts based on the type of system used, the scan volume, and the number of ancillary services provided. Competitive pressures also affect our pricing.
We generated approximately 20% of our revenues for the years ended December 31, 2014 and 2013, respectively, by providing services directly to patients from our sites located at or near hospitals or other healthcare provider facilities, which we refer to as “retail” revenues. We generate our revenue from these sites from direct billings to patients or their third-party payors, including Medicare, and we record this revenue net of contractual discounts and other arrangements for providing services at discounted prices. We typically receive a higher price per scan or treatment under retail billing than we do under wholesale billing.
37
Our revenues, whether for wholesale or retail arrangements, are dependent directly or indirectly on third-party payor reimbursement policies, including Medicare. Please see Item 1, Business-Reimbursement for a more detailed explanation of how we bill and receive payment for our services.
Over the past few years, the growth rate of PET/CT and MRI industry wide scan volumes has slowed in part due to weak hospital volumes as reported by several investor-owned hospital companies, additional patient-related cost-sharing programs and an increasing trend of third-party payors intensifying their utilization management efforts, for example, through benefit managers who require prior authorizations to control the growth rate of imaging services generally. We expect that these trends will continue. One recent initiative to potentially reduce utilization of certain imaging services is the Medicare Imaging Demonstration, which is a two-year demonstration project designed to collect data regarding physician use of advanced diagnostic imaging services. This information would be used to determine the appropriateness of services by developing medical specialty guidelines for advanced imaging procedures within three designated modalities (MRI, CT and nuclear medicine). On February 2, 2011, CMS announced that it selected five participants for the demonstration project. The data collection portion of the demonstration concluded on April 1, 2012, and the 18-month intervention portion of the demonstration then went into effect, during which time the appropriateness of a physician's order for diagnostic imaging services was considered at the time the order was entered into the decision support systems being tested. The MID concluded on September 30, 2013, and a report to Congress summarizing the results of the demonstration was published in April 2014. The report compared the appropriateness of orders by physicians during the baseline period and during the demonstration, and found that greater use of the decision support system (“DSS”) did not have a material effect on the likelihood of appropriately ordering advanced diagnostic imaging, nor a substantial impact on the volume of advanced imaging utilization. The report did not recommend expanding the use of appropriateness criteria for advanced imaging to a broader Medicare population at this time.
In addition, the PAMA requires CMS, in conjunction with medical specialty societies, to adopt appropriate use criteria (“AUC”) for certain advanced diagnostic imaging services by November 15, 2015. Beginning in 2017, CMS must establish a program that promotes the use of AUC by requiring physicians who order and furnish advanced diagnostic imaging services to consult and report compliance with the AUC. Advanced imaging services ordered by certain physicians who do not adhere to the AUC will be subject to prior authorization for applicable imaging services provided to Medicare beneficiaries beginning in 2020.
Factors Affecting our Results of Operations
Pricing
Continued expansion of health maintenance organizations, preferred provider organizations and other managed care organizations have influence over the pricing of our services because these organizations can exert greater control over patients' access to our services and reimbursement rates for accessing those services.
Scan and treatment volume
The principal components of our cost of revenues include compensation paid to technologists, therapists, drivers and other clinical staff; system maintenance costs; insurance; medical supplies; system transportation; team members’ travel costs; and professional costs related to the delivery of radiation therapy and professional radiology interpretation services. Because a majority of these expenses are fixed, increased revenues as a result of higher scan and treatment volumes per system significantly improves our margins while lower scan and treatment volumes result in lower margins.
Selling, general and administrative expenses
The principal components of selling, general and administrative expenses are sales and marketing costs, corporate overhead costs, provision for doubtful accounts, and share-based payment.
Noncontrolling interest and earnings
We record noncontrolling interest and earnings from unconsolidated investees related to our consolidated and unconsolidated subsidiaries, respectively. These subsidiaries primarily provide shared-service and fixed-site diagnostic imaging and radiation therapy services.
Third-party payor reimbursement rates and policies
We experience seasonality in the revenues and margins generated for our services. First and fourth quarter revenues are typically lower than those from the second and third quarters. First quarter revenue is affected primarily by fewer calendar days and inclement weather, typically resulting in fewer patients being scanned or treated during the period. Fourth quarter revenues
38
are affected by holiday and client and patient vacation schedules, resulting in fewer scans or treatments during the period. The variability in margins is higher than the variability in revenues due to the fixed nature of our costs. We also experience fluctuations in our revenues and margins due to acquisition activity and general economic conditions, including recession or economic slowdown.
Results of Operations
The following table shows our consolidated statements of operations as a percentage of revenues for each of the years ended December 31:
2012 | 2013 | 2014 | ||||
Revenues | 100.0 | % | 100.0 | % | 100.0 | % |
Costs and expenses: | ||||||
Cost of revenues, excluding depreciation and amortization | 53.6 | 53.3 | 54.4 | |||
Selling, general and administrative expenses | 16.2 | 17.9 | 18.3 | |||
Transaction costs | 0.2 | 0.1 | 0.5 | |||
Severance and related costs | 0.5 | 0.4 | 0.6 | |||
Impairment charges | — | 2.9 | 0.1 | |||
Loss on extinguishment of debt | — | 5.8 | — | |||
Depreciation expense | 16.8 | 14.8 | 12.6 | |||
Amortization expense | 3.4 | 2.4 | 1.8 | |||
Interest expense and other, net | 11.5 | 8.7 | 5.7 | |||
Other (income) and expense, net | 0.6 | (0.4 | ) | (0.4 | ) | |
Total costs and expenses | 102.7 | 105.9 | 93.5 | |||
(Loss) income before income taxes, earnings from unconsolidated investees and noncontrolling interest | (2.7 | ) | (5.9 | ) | 6.5 | |
Income tax (benefit) expense | (1.4 | ) | (2.8 | ) | 1.7 | |
Earnings from unconsolidated investees | (1.0 | ) | (1.3 | ) | (1.1 | ) |
Net (loss) income | (0.2 | ) | (1.9 | ) | 5.8 | |
Less: Net income attributable to noncontrolling interest, net of tax | (2.3 | ) | (2.9 | ) | (3.4 | ) |
Net (loss) income attributable to Alliance HealthCare Services, Inc. | (2.5 | )% | (4.8 | )% | 2.4 | % |
The table below provides MRI statistical information for the years ended December 31:
2012 | 2013 | 2014 | |||||||||
MRI statistics | |||||||||||
Average number of total systems | 265.8 | 256.3 | 249.2 | ||||||||
Average number of scan-based systems | 222.7 | 214.2 | 206.9 | ||||||||
Scans per system per day (scan-based systems) | 8.46 | 8.40 | 8.58 | ||||||||
Total number of scan-based MRI scans | 494,739 | 476,305 | 475,044 | ||||||||
Price per scan | $ | 359.50 | $ | 352.67 | $ | 339.84 | |||||
The table below provides PET/CT statistical information for each of the years ended December 31:
2012 | 2013 | 2014 | |||||||||
PET/CT statistics | |||||||||||
Average number of systems | 112.1 | 105.4 | 105.1 | ||||||||
Scans per system per day | 5.62 | 5.57 | 5.32 | ||||||||
Total number of PET/CT scans | 157,496 | 147,941 | 137,313 | ||||||||
Price per scan | $ | 964 | $ | 954 | $ | 943 | |||||
39
The table below provides Radiation oncology statistical information for each of the years ended December 31:
2012 | 2013 | 2014 | ||||||
Radiation oncology statistics | ||||||||
Linac treatments | 83,013 | 63,014 | 82,215 | |||||
Stereotactic radiosurgery patients | 2,450 | 2,713 | 3,100 | |||||
Following are the components of revenue (in millions) for each of the years ended December 31:
2012 | 2013 | 2014 | |||||||||
MRI revenue | $ | 196.1 | $ | 187.2 | $ | 180.8 | |||||
PET/CT revenue | 154.8 | 145.0 | 133.2 | ||||||||
Radiation oncology revenue | 83.2 | 77.9 | 92.9 | ||||||||
Other modalities and other revenue | 38.2 | 38.7 | 29.4 | ||||||||
Total | $ | 472.3 | $ | 448.8 | $ | 436.4 | |||||
Year ended December 31, | |||||||||||
2012 | 2013 | 2014 | |||||||||
Total fixed-site imaging center revenue (in millions) | $ | 121.5 | $ | 116.2 | $ | 109.2 | |||||
Year Ended December 31, 2014 Compared to Year Ended December, 2013
Revenue decreased $12.4 million, or 2.8%, to $436.4 million in 2014 compared to $448.8 million in 2013 due to net decreases in PET/CT and MRI revenue of $18.2 million and other revenues of $9.3 million, mostly attributed to the sale of our professional radiology services business in December 2013. These decreases were partially offset by an increase in radiation oncology revenue of $15.1 million, due to an overall increase in patient volume and number of treatments performed while our new joint venture partnerships with the Medical University of South Carolina and Charleston Area Medical Center also contributed to the growth in oncology revenue.
PET/CT revenue in 2014 decreased $11.8 million, or 8.1%, compared to 2013 due to a decrease in total PET/CT scan volumes and a reduction in the average price per PET/CT scan. Total PET/CT scan volumes decreased 7.2% to 137,313 scans in 2014 from 147,941 scans in 2013, and the average price per PET/CT scan decreased to $943 per scan in 2014 compared to $954 per scan in 2013. The average number of PET/CT systems in service remained approximately the same at 105.1 systems in 2014 from 105.4 systems in 2013. Scans per system per day decreased 4.5% to 5.32 scans per system per day in 2014 from 5.57 scans per system per day in 2013.
MRI revenue decreased $6.4 million in 2014, or 3.4%, compared to 2013. Scan-based MRI revenue decreased $6.5 million in 2014, or 3.9%, compared to 2013, to $161.4 million in 2014 from $168.0 million in 2013. The decrease in
scan-based MRI revenue was primarily due to year-over-year decreases in the average price per MRI scan and average number
of scan-based systems in service. The average price per MRI scan decreased to $339.84 per scan in 2014 from $352.67 per scan in 2013. The average number of scan-based systems in service decreased to 206.9 systems in 2014 from 214.2 systems in 2013. Average scans per system per day increased 2.1% in 2014 compared to 2013, from 8.40 scans per system per day in 2013 to 8.58 in 2014. Scan-based MRI scan volume decreased 0.3% to 475,044 scans in 2014 from 476,305 scans in 2013. Non scan-based MRI revenue increased $0.1 million in 2014 compared to 2013. Included in the revenue totals above are fixed-site imaging center revenues, which decreased $7.0 million, or 6.0%, to $109.2 million in 2014 from $116.2 million in 2013.
Radiation oncology revenue increased $15.1 million, or 19.3%, to $92.9 million in 2014 compared to $77.9 million in 2013, primarily due to a 30.5% year-over-year increase in the number of Linac treatments performed in 2014, compared to 2013, and a 14.3% increase in the number of SRS patients we treated. These results include revenue from the strategic affiliation with the Medical University of South Carolina and the Charleston Area Medical Center in West Virginia, which commenced in the first and fourth quarters of 2014, respectively.
40
At December 31, 2014, we had 258 MRI systems and 124 PET/CT systems, including 19 MRI systems and nine PET/CT systems on operating leases as a result of our sale and lease transaction that occurred in the fourth quarter of 2012. We had 263 MRI systems and 122 PET and PET/CT systems at December 31, 2013. We operated 117 fixed-site imaging centers (including one unconsolidated investee) at December 31, 2014, compared to 125 fixed-site imaging centers (including one in unconsolidated investee) at December 31, 2013. We operated 31 radiation oncology centers (including one unconsolidated investee) at December 31, 2014, compared to 28 radiation oncology centers (including one unconsolidated investee) at December 31, 2013.
Cost of revenues, excluding depreciation and amortization, decreased $2.0 million, or 0.8%, to $237.4 million in 2014 compared to $239.4 million in 2013. The decrease in cost of revenues is primarily due to a $7.5 million, or 43.6% decrease in outside medical services expense due to lower radiology fees related to the sale of our professional radiology services business. Costs related to medical supplies decreased $1.0 million, or 5.1%, due to lower PET/CT scan volumes. These decreases were partially offset by an increase in compensation and related employee expenses of $5.4 million, or 5.2%, and an increase in maintenance and related costs of $1.7 million, or 3.2% due to our aging fleet of radiology equipment. All other cost
of revenues, excluding depreciation and amortization, decreased $0.5 million, or (1.1)%. Cost of revenues, as a percentage of
revenue, remained relatively stable at 54.4% in 2014 compared to 53.3% in 2013.
Selling, general and administrative expenses decreased $0.3 million, or 0.4%, to $79.9 million in 2014 compared to $80.2 million in 2013. The majority of this decrease in selling, general and administrative expenses was due to a reduction in professional services of $1.6 million, or 11.9%, resulting from consulting and recruiting costs in the prior year to support the enhanced value proposition initiative. The provision for doubtful accounts decreased $0.8 million, or 22.2%, during 2014. The provision for doubtful accounts as a percentage of revenue was 0.6% and 0.8% in 2014 and 2013, respectively. Compensation and related employee expenses increased $1.6 million, or 3.3%, as a result of overall salary increases and an increase in headcount. Non-cash stock-based compensation expense was $1.5 million in both 2013 and 2014. All other selling, general and administrative expenses increased $0.4 million, or 3.2%. Selling, general and administrative expenses as a percentage of revenue were 18.3% and 17.9% in 2014 and 2013, respectively.
For the year ended December 31, 2014, in accordance with ASC 350, the Company performed its annual impairment test in the fourth quarter for goodwill and intangible assets with indefinite lives, using financial information as of September 30, 2014. From this analysis, the Company concluded that no impairment was present in its long-lived assets or intangible assets with definite useful lives. Additionally, an impairment charge of $0.3 was recorded in 2014 primarily due to the writing off of our equity investment an oncology treatment center upon the site's closure in 2014. Prior to the site's closure, we recorded an impairment charge in the fourth quarter of 2013 related to the pending expiration of our non-compete agreement with the related oncology physician. As negotiation efforts to renew the non-compete agreement were unsuccessful, we appropriately revalued all intangible assets specifically related to the single location originally purchased with a group of assets in 2011. The impairment charge in 2013 totaled $3.4 million, and was comprised of various assets including a physicians' referral network, trademarks, and professional services agreement, which were all written down to zero value.
In 2013, we recorded total impairment charges of $13.0 million. Specifically, we recognized an impairment charge of $4.5 million related to the closure of an imaging site location in August 2013, which was originally purchased in a group of assets acquired in 2007. Upon acquisition, we recorded both tangible and intangible assets including physician referral networks, non-compete agreements, certificates of need and goodwill. In late 2012, the term of a non-compete agreement ended causing a decline in revenue, ultimately resulting in the imaging site closure. Based on this triggering event, we deemed it appropriate to perform a valuation analysis of the remaining intangible assets related to the original acquisition. We applied the excess earnings method under the income approach to value the physician referral networks, and applied the beneficial earnings method under the income approach, and the guideline transaction method under the market approach to value the certificates of need.
Also in 2013, we impaired our intangible assets related to our professional services business as a result of our decision that our professional radiology services business did not align with the long-term strategic direction of the Radiology Division, and divested of our professional radiology services business in the fourth quarter of 2013. This triggering event resulted in revaluing intangible assets related to the professional services business at $1.5 million after recognizing an impairment charge of approximately $5.1 million related to the intangible assets in 2013. We based the carrying value of these intangible assets on the selling price we received in the sale transaction for the assets related to our professional services business. All other assets related to the divestiture of the professional services business were immaterial.
Severance and related costs increased $0.9 million, or 51.8%, to $2.5 million in 2014 compared to $1.7 million in 2013, due to the departure of an executive officer during the first half of 2014.
41
Transaction costs increased $1.9 million, or 404.1%, to $2.3 million in 2014 compared to $0.5 million in 2013 due to expenses incurred related to various acquisitions in 2014, including our joint venture partnership with Charleston Area Medical Center in West Virginia, which provides oncology treatment for patients at multiple locations throughout the state.
Depreciation expense decreased $11.3 million, or 17.1%, to $55.0 million in 2014 compared to $66.3 million in 2013 due to the year over year increase in the number of units in our fleet that are fully depreciated along with our decision to upgrade units we currently own as an alternative to purchasing new equipment.
Amortization expense decreased $3.1 million, or 28.2%, to $7.9 million in 2014 compared to $11.0 million in 2013. This decrease is primarily due to lower amortization charges related to intangible assets that were impaired or written off in the latter half of 2013.
Interest expense and other, net decreased $14.5 million, or 37.0%, to $24.7 million in 2014 compared to $39.2 million in 2013, primarily due to the redemption in December 2013 of the remaining outstanding principal amount of our 8% Notes due 2016 with funds borrowed under our new credit agreement and cash on hand. The interest rate pertaining to the amount borrowed under the incremental term loan to redeem the 8% Notes conforms to the rates discussed below in "Liquidity and Capital Resources".
Income tax expense was $7.3 million in 2014 compared to a $12.4 million tax benefit in 2013. Our effective tax rates differed from the federal statutory rate principally as a result of state income taxes and permanent non-deductible tax items.
Earnings from unconsolidated investees decreased $1.0 million, or 17.3%, to $4.7 million in 2014 compared to $5.6 million in 2013.
Net income attributable to noncontrolling interest increased $1.8 million, or 14.1%, to $14.9 million in 2014 compared to $13.0 million in 2013. The increase is mostly attributed to improved net income we derived from our joint venture partners, and to a lesser degree, the addition of three new joint ventures in 2014.
Net income attributable to Alliance HealthCare Services, Inc. was $10.6 million, or $0.98 per share on a diluted basis, in 2014 compared to a net loss of $21.5 million, or ($2.02) per share on a diluted basis, in 2013.
Year Ended December 31, 2013 Compared to Year Ended December, 2012
Revenue decreased $23.4 million, or 5.0%, to $448.8 million in 2013 compared to $472.3 million in 2012 due to a net decrease in PET/CT, MRI and other imaging revenues of $18.1 million, and a decrease in radiation oncology revenue of $5.3 million. Of the $23.4 million decrease in revenue, $13.6 million is related to the strategic reduction of our customer base in 2012 and $9.8 million primarily relates to weakness in outpatient healthcare volumes and pricing, which occurred across our industry.
PET/CT revenue in 2013 decreased $9.8 million, or 6.3%, compared to 2012 due to our increased efforts in identifying and eliminating unprofitable customers and a reduction in the average price per PET/CT scan, which decreased to $954 per scan in 2013 compared to $964 per scan in 2012. The average number of PET/CT systems in service decreased to 105.4 systems in 2013 from 112.1 systems in 2012. Total PET/CT scan volumes decreased 6.1% to 147,941 scans in 2013 from 157,496 scans in 2012. Scans per system per day decreased 0.9% to 5.57 scans per system per day in 2013 from 5.62 scans per system per day in 2012.
MRI revenue decreased $8.9 million in 2013, or 4.5%, compared to 2012. Scan-based MRI revenue decreased $9.9 million in 2013, or 5.6%, compared to 2012, to $168.0 million in 2013 from $177.9 million in 2012. The decrease in scan-based MRI revenue was primarily due to our increased efforts in identifying and eliminating unprofitable customers throughout 2012, and a reduction in the average price per MRI scan, which decreased to $352.67 per scan in 2013 from $359.50 per scan in 2012. The average number of scan-based systems in service decreased to 214.2 systems in 2013 from 222.7 systems in 2012. Average scans per system per day remained consistent in 2013 compared to 2012 decreasing only 0.7% to 8.40 in 2013 from 8.46 in 2012. Scan-based MRI scan volume decreased 3.7% to 476,305 scans in 2013 from 494,739 scans in 2012. Non scan-based MRI revenue increased $1.0 million in 2013 compared to 2012. Included in the revenue totals above are fixed-site imaging center revenues, which decreased $5.3 million, or 4.4%, to $116.2 million in 2013 from $121.5 million in 2012.
Radiation oncology revenue decreased $5.3 million, or 6.4%, to $77.9 million in 2013 compared to $83.2 million in 2012, primarily due to the decision to terminate or sell eight unprofitable centers throughout 2012 and one in the first quarter of 2013. This decrease was partially offset by increased revenue related to an increase in the number of SRS patients we treated.
42
The total impact to revenue from these closures is estimated to be $6.9 million. Other modalities and other revenue increased $0.6 million, or 1.5%, to $38.7 million in 2013 compared to $38.2 million in 2012.
At December 31, 2013, we had 263 MRI systems and 122 PET/CT systems, including 19 MRI systems and nine PET/CT systems on operating leases as a result of our sale and lease transaction that occurred in the fourth quarter of 2012. We had 267 MRI systems and 119 PET and PET/CT systems at December 31, 2012. We operated 125 fixed-site imaging centers (including one unconsolidated investee) at December 31, 2013, compared to 128 fixed-site imaging centers (including one in unconsolidated investee) at December 31, 2012. We operated 28 radiation oncology centers (including one unconsolidated investee) at December 31, 2013, compared to 29 radiation oncology centers (including one unconsolidated investee) at December 31, 2012.
Cost of revenues, excluding depreciation and amortization, decreased $13.8 million, or 5.5%, to $239.4 million in 2013 compared to $253.2 million in 2012. Compensation and related employee expenses decreased $5.7 million, or 5.2%, primarily as a result of a decrease in employee headcount. Outside medical services decreased $5.7 million, or 25.1%, primarily due to lower radiology and radiation oncologist payments, and lower consultant fees. Maintenance and related costs decreased $4.0 million, or 7.1%, due to a decrease in service costs related to the decrease in the number of MRI, PET/CT and radiation oncology systems in operation, and a reduction in service contract costs incurred on our asset base. Renegotiating with service contract providers and medical supply vendors is one of our cost reduction initiatives. Site fees decreased $0.9 million, or 14.3%, primarily due to a decrease in the number of our oncology center sites. Medical supplies decreased $0.7 million, or 3.5%, primarily as a result of sourcing contract savings on the radiopharmaceutical that is used as a component of PET/CT scans and less scans year over year. These decreases to cost of revenues were partially offset by a $7.1 million increase in expense for equipment leases in connection with the sale and lease transaction that occurred during the fourth quarter of 2012. All other cost of revenues, excluding depreciation and amortization, decreased $3.8 million or 10.6% due to cost reduction initiatives company-wide. Cost of revenues, as a percentage of revenue, decreased to 53.3% in 2013 from 53.6% in 2012 as a result of the factors described above.
Selling, general and administrative expenses increased $4.2 million, or 5.5%, to $80.2 million in 2013 compared to $76.0 million in 2012. The majority of this increase in selling, general and administrative expenses was due to compensation and related employee expenses increasing $2.1 million, or 4.6%, as a result of an increase in headcount to invest in our sales, business development, and marketing teams. Professional services expense increased $0.9 million, or 7.1%, due to a $1.8 million decrease to professional services expense in 2012 related to the Medical Outsourcing Services, LLC arbitration award that provided for reimbursement of legal expenses, partially offset by an increase in consulting fees related to performance management and sales improvement initiatives in 2013. Non-cash stock-based compensation expense increased $0.8 million from $0.7 million in 2012 to $1.5 million in 2013 due to the forfeiture of unvested awards of former executives in 2012. The provision for doubtful accounts increased $0.5 million, or 18.9%, during 2013. The provision for doubtful accounts as a percentage of revenue was 0.8% and 0.6% in 2013 and 2012, respectively. All other selling, general and administrative expenses decreased $0.1 million, or 1.0%. Selling, general and administrative expenses as a percentage of revenue were 17.9% and 16.1% in 2013 and 2012, respectively.
In 2013, we recorded total impairment charges of $13.0 million. Specifically, we recognized an impairment charge of $4.5 million related to the closure of an imaging site location in August 2013, which was originally purchased in a group of assets acquired in 2007. Upon acquisition, we recorded both tangible and intangible assets including physician referral networks, non-compete agreements, certificates of need and goodwill. In late 2012, the term of a non-compete agreement ended causing a decline in revenue, ultimately resulting in the imaging site closure. Based on this triggering event, we deemed it appropriate to perform a valuation analysis of the remaining intangible assets related to the original acquisition. We applied the excess earnings method under the income approach to value the physician referral networks, and applied the beneficial earnings method under the income approach, and the guideline transaction method under the market approach to value the certificates of need.
Also in 2013, we impaired our intangible assets related to our professional services business as a result of our decision that our professional radiology services business did not align with the long-term strategic direction of the Radiology Division, and divested of our professional radiology services business in the fourth quarter of 2013. This triggering event resulted in revaluing intangible assets related to the professional services business at $1.5 million after recognizing an impairment charge of approximately $5.1 million related to the intangible assets in 2013. We based the carrying value of these intangible assets on the selling price we received in the sale transaction for the assets related to our professional services business. All other assets related to the divestiture of the professional services business were immaterial.
In the fourth quarter of 2013, we recorded an impairment charge related to the pending expiration of one of our non-compete agreements with the affiliated oncology physician. Negotiation efforts to renew the non-compete agreement were unsuccessful, and we appropriately revalued all intangible assets specifically related to the single location originally purchased
43
with a group of assets in 2011. The impairment charge totaled $3.4 million comprised of assets including a physicians' referral network, trademarks, and professional services agreement, which were all written down to zero value.
Severance and related costs decreased $0.6 million, or 25.5%, to $1.7 million in 2013 compared to $2.2 million in 2012, due to ongoing cost savings and efficiency initiatives.
Transaction costs decreased $0.5 million, or 53.2%, to $0.5 million in 2013 compared to $1.0 million in 2012.
Depreciation expense decreased $13.0 million, or 16.4%, to $66.3 million in 2013 compared to $79.3 million in 2012 due to a decrease in our capital expenditures in part due to the decision to upgrade units we currently own as an alternative to purchasing new equipment, and a decrease in the total number of units we own and centers we operate. Depreciation expense also decreased as a result of our sale and lease transaction that occurred in the fourth quarter of 2012.
Amortization expense decreased $4.9 million, or 30.8%, to $11.0 million in 2013 compared to $15.9 million in 2012 due to a lower intangible asset base caused by impairments taken throughout 2013.
Interest expense and other, net decreased $14.9 million, or 27.6%, to $39.2 million in 2013 compared to $54.1 million in 2012, primarily due to our lower average debt balances resulting from the $74.5 million in debt repayments made during the fourth quarter of 2012, and the $15.0 million repayment made in the first quarter of 2013. Interest expense was also positively impacted by the refinancing of our term loan in June 2013, whereby our interest rate decreased to LIBOR plus 3.25%, compared to LIBOR plus 5.25%, and lowered our LIBOR floor from 2% to 1%. In addition, we redeemed all $190.0 million of our 8% Notes with funds borrowed under our new credit agreement and cash on-hand. The interest rate pertaining to the amount borrowed under the incremental term loan to redeem the Notes conforms to the rates previously discussed above.
Income tax benefit was $12.4 million in 2013 compared to $6.7 million in 2012. Our effective tax rates differed from the federal statutory rate principally as a result of state income taxes and permanent non-deductible tax items.
Earnings from unconsolidated investees increased $1.0 million, or 20.6%, to $5.6 million in 2013 compared to $4.7 million in 2012.
Net income attributable to noncontrolling interest increased $2.3 million, or 21.0%, to $13.0 million in 2013 compared to $10.8 million in 2012.
Net loss attributable to Alliance HealthCare Services, Inc. was $21.5 million, or ($2.02) per share on a diluted basis, in 2013 compared to $11.9 million, or ($1.12) per share on a diluted basis, in 2012.
Adjusted EBITDA
Adjusted EBITDA is not a measure of financial performance under generally accepted accounting principles in the United States, or “GAAP.” We believe that, in addition to GAAP metrics, this non-GAAP metric is a useful measure for investors, for a variety of reasons. Our management regularly communicates Adjusted EBITDA and their interpretation of such results to our board of directors. We also compare actual periodic Adjusted EBITDA against internal targets as a key factor in determining cash incentive compensation for executives and other employees, largely because we view Adjusted EBITDA results as indicative of how our diagnostic imaging and radiation oncology businesses are performing and are being managed.
We define Adjusted EBITDA, as net income (loss) before: interest expense, net of interest income; income taxes; depreciation expense; amortization expense; net income (loss) attributable to noncontrolling interests; non-cash share-based compensation; severance and related costs; restructuring charges; fees and expenses related to acquisitions, costs related to debt financing, legal matter expenses, non-cash impairment charges, and other non-cash charges included in other (income) expense, net, which includes non-cash losses on sales of equipment.
The presentation of a non-GAAP metric does not imply that the reconciling items presented are non-recurring, infrequent or unusual. In general, non-GAAP metrics have certain limitations as analytical financial measures and are used in conjunction with GAAP results to evaluate our operating performance and by considering independently the economic effects of the items that are, or are not, reflected in non-GAAP metrics. We compensate for such limitations by providing GAAP-based disclosures concerning the excluded items in our financial disclosures. As a result of these limitations, and because non-GAAP metrics may not be directly comparable to similarly titled measures reported by other companies, however, the non-GAAP metrics are not an alternative to the most directly comparable GAAP measure, or as an alternative to any other GAAP measure of operating performance.
Adjusted EBITDA in 2014 decreased $11.7 million, or 7.9% to $135.8 million, from $147.4 million in 2013. This was primarily driven by both scan volume and pricing pressure in our PET/CT business. This was partially offset by an increase of
44
Adjusted EBIDTA related to our Oncology Division from our new partnerships with MUSC and Charleston Area Medical Center.
Adjusted EBITDA in 2013 totaled $147.4 million, a decrease of 4.5% compared to $154.4 million for full year 2012. Excluding the effects of a $6.7 million reduction to our Adjusted EBITDA in 2013 related to a sale/leaseback transaction that occurred in November 2012, and excluding a $2.2 million increase to Adjusted EBITDA in 2012 from the favorable outcome of a legal settlement, Adjusted EBITDA in 2013 increased 1.2% in 2013 compared to 2012.
Year Ended December 31, | |||||||||||
2012 | 2013 | 2014 | |||||||||
Net (loss) income attributable to Alliance HealthCare Services, Inc. | $ | (11,938 | ) | $ | (21,483 | ) | $ | 10,618 | |||
Income tax (benefit) expense | (6,710 | ) | (12,398 | ) | 7,327 | ||||||
Interest expense and other, net | 54,101 | 39,170 | 24,693 | ||||||||
Amortization expense | 15,861 | 10,973 | 7,880 | ||||||||
Depreciation expense | 79,333 | 66,319 | 54,971 | ||||||||
Share-based payment (included in selling, general and administrative expenses) | 724 | 1,487 | 1,515 | ||||||||
Severance and related costs | — | — | 2,517 | ||||||||
Noncontrolling interest in subsidiaries | 10,775 | 13,041 | 14,883 | ||||||||
Restructuring charges (Note 3) | 6,715 | 7,182 | 2,602 | ||||||||
Transaction costs | 494 | 465 | 2,344 | ||||||||
Impairment charges | — | 13,031 | 308 | ||||||||
Loss on extinguishment of debt | — | 26,018 | — | ||||||||
Legal settlements | 4,793 | 3,067 | 5,587 | ||||||||
Other non-cash charges (included in other income and expense, net) | 248 | 549 | 510 | ||||||||
Adjusted EBITDA | $ | 154,396 | $ | 147,421 | $ | 135,755 | |||||
Liquidity and Capital Resources
Our primary source of liquidity is cash provided by operating activities. We generated $100.6 million, $86.5 million and $103.1 million of cash flow from operating activities in 2014, 2013 and 2012, respectively. Our ability to generate cash flow is affected by numerous factors, including demand for MRI, PET/CT, other diagnostic imaging and radiation oncology services. Our ability to generate cash flow from operating activities is also dependent upon the collections of our accounts receivable. The provision for doubtful accounts decreased by $0.8 million in 2014 compared to 2013 and increased by $0.5 million in 2013 compared to 2012. Our number of days of revenue outstanding for our accounts receivable remained at 53 days as of December 31, 2014, 2013 and 2012. We believe this number is comparable to other diagnostic imaging and radiation oncology providers. As of December 31, 2014, we had $43.5 million of available borrowings under our revolving line of credit, net of $2.0 million outstanding on the revolving line of credit and $4.5 million outstanding in letters of credit.
We used cash of $58.7 million, $24.6 million and $0.6 million for investing activities in 2014, 2013 and 2012, respectively. Investing activities in 2014 included $32.2 million for the purchase of capital assets, net cash of $9.2 million was used for deposits on equipment and other capital projects not yet in service, cash of $16.0 million was used in acquisition related activites primarily for our investment in the Charleston Area Medical Center, and net cash of $2.8 million was due to a net increase in notes receivable. This use of cash was offset by $1.6 million of proceeds from the sale of assets. In 2013, purchases of capital assets totaled $27.0 million offset by $3.2 million on proceeds from the sale of assets. In 2012, purchases of capital assets totaled $37.6 million offset by $37.5 million on proceeds from sales of assets, of which $30.0 is attributed to the sale of certain imaging assets, which were then leased from the purchasers, under competitive terms. The entire $30 million in proceeds from the sale and lease transactions was used to make a one-time payment to permanently reduce borrowings outstanding under the term loan facility.
As in 2014, we may continue to use cash for acquisitions in the future. Other than acquisitions, our primary use of capital resources is to fund capital expenditures. We spend capital:
45
• | to purchase new systems; |
• | to replace less advanced systems with new systems; |
• | to upgrade MRI, PET/CT and radiation oncology systems; and |
• | to upgrade our corporate infrastructure, primarily in information technology. |
Capital expenditures totaled $32.2 million, $27.0 million, and $37.6 million in 2014, 2013 and 2012, respectively. During 2014, we purchased 16 MRI, CT and PET/CT systems, twelve other modality systems, and six radiation oncology system. In addition, we upgraded various MRI, PET/CT and radiation oncology equipment, and traded-in or sold a total of 22 systems during 2014. We expect to purchase additional systems in 2015 and finance substantially all of these purchases with our available cash, cash from operating activities and equipment leases. We expect capital expenditures to total approximately $80 to $90 million in 2015 based on strategic partnerships and planned expansion of our imaging and radiation oncology divisions, which will require significant investment, and capital to maintain our portfolio of assets.
At December 31, 2014, we had cash and cash equivalents of $33.0 million. Available cash and cash equivalents are held in accounts managed by third-party financial institutions and consist of invested cash and cash in our operating accounts. The invested cash is invested in interest-bearing funds managed by third-party financial institutions. To date, we have experienced no loss or lack of access to our invested cash or cash equivalents; however, we cannot assure that access to our invested cash and cash equivalents will not be affected by adverse conditions in the financial markets.
At December 31, 2014, we had $26.7 million in our accounts with third-party financial institutions that exceed the Federal Deposit Insurance Corporation (“FDIC”) insurance limits. While we monitor daily the cash balances in our operating accounts and adjust the cash balances as appropriate, these cash balances could be adversely affected if the underlying financial institutions fail or could be subject to other adverse conditions in the financial markets. To date, we have experienced no loss or lack of access to cash in our operating accounts.
We believe that, based on current levels of operations, our cash flow from operating activities, together with other available sources of liquidity, including borrowings available under our revolving line of credit, will be sufficient over the next one to two years to fund anticipated capital expenditures and potential acquisitions and make required payments of principal and interest on our debt and other contracts. As of December 31, 2014, we are in compliance with all covenants contained in our Credit Agreement, and expect that we will be in compliance with these covenants for the remainder of 2015.
On February. 18, 2015, we consummated our new partnership with The Pain Center of Arizona, PC (TPC), specializing in the diagnosis and treatment of chronic pain disorders. TPC currently operates 12 locations statewide. As a part of the transaction, we gained an ownership interest in TPC’s affiliated billing and collection company. We acquired a 59% ownership stake for approximately $27.0 million in cash and our proportion of assumed debt of approximately $2.9 million. The terms of the agreement also include a potential future earn out provision due to TPC in the event TPC's financial performance meets certain milestones.
If our remaining ability to borrow under our Credit Agreement is insufficient for our capital requirements, we will be required to seek additional sources of financing, including issuing equity, which may be dilutive to our current stockholders, or incurring additional debt. Our ability to incur additional debt is subject to the restrictions in our existing credit facility. We cannot assure that the restrictions contained in the Credit Agreement will permit us to borrow the funds that we need to finance our operations, or that additional debt will be available to us on commercially reasonable terms or at all. If we are unable to obtain funds sufficient to finance our capital requirements, we may have to forgo opportunities to expand our business.
On October 22, 2012, we entered into an amendment to our then-existing credit agreement. As part of the amendment, we raised $30.0 million from the sale of certain imaging assets, which we then leased from the purchasers under competitive terms. The $30.0 million in proceeds from the sale and lease transactions was used in its entirety to permanently reduce borrowings outstanding under the then-existing term loan facility. As a result, we incur $8.0 million of annual rent expense in connection with the sale and lease transaction. The $30.0 million in proceeds from the sale-lease transaction discussed above together with $44.5 million of our existing cash was used to make a total payment of $74.5 million to permanently reduce borrowings outstanding under the then-existing term loan facility in 2012.
On June 3, 2013, we replaced our existing credit facility with a new senior secured credit agreement with Credit Suisse AG, Cayman Islands Branch, as administrative agent, and the other lenders party thereto (the “Credit Agreement”). The Credit Agreement consists of (i) a $340.0 million, six-year term loan facility, (ii) a $50.0 million, five-year revolving loan facility, including a $20.0 million sublimit for letters of credit, (iii) uncommitted incremental loan facilities of $100.0 million of revolving or term loans, plus an additional amount if our pro forma leverage ratio is less than or equal to 3.25, subject to receipt of lender commitments and satisfaction of specified conditions, and (iv) an $80.0 million delayed draw term loan facility,
46
which was required to be drawn within thirty days of June 3, 2013 and used for the redemption of our 8% Senior Notes due 2016 (the “Notes”) in the original aggregate principal amount of $190.0 million.
On July 3, 2013 the delayed draw term loan facility was utilized together with other available funds, of which the proceeds were used to redeem $80.0 million in aggregate principal amount of our outstanding Notes. The delayed draw term loan facility converted into, and matched the terms of, the new $340.0 million term loan facility.
Borrowings under the Credit Agreement bear interest through maturity at a variable rate based upon, at our option, either the London interbank offered rate ("LIBOR") or the base rate (which is the highest of the administrative agent’s prime rate, one-half of 1.00% in excess of the overnight federal funds rate, and 1.00% in excess of the one-month LIBOR rate), plus, in each case, an applicable margin. With respect to the term loan facilities, the applicable margin for LIBOR loans is 3.25% per annum, and with respect to the revolving loan facilities, the applicable margin for LIBOR loans ranges, based on the applicable leverage ratio, from 3.00% to 3.25% per annum, in each case, with a LIBOR floor of 1.00%. The applicable margin for base rate loans under the term loan facilities is 2.25% per annum and under the revolving loan facility ranges, based on the applicable leverage ratio, from 2.00% to 2.25% per annum. Prior to the refinancing of the term loan facilities, the applicable margin for base rate loans was 4.25% per annum and the applicable margin for revolving loans was 5.25% per annum, with a LIBOR floor of 2.00%. We are required to pay a commitment fee which ranges, based on the applicable leverage ratio, from 0.375% to 0.50% per annum on the undrawn portion available under the revolving loan facility and variable per annum fees with respect to outstanding letters of credit.
During the first five and three-quarter years after the closing date, and including the full amount of the delayed draw term loan facility, we were required to make quarterly amortization payments of the term loans in the amount of $1.05 million. We are also required to make mandatory prepayments of term loans under the Credit Agreement, subject to specified exceptions, from excess cash flow (as defined in the Credit Agreement), and with the proceeds of asset sales, debt issuances and specified other events.
Obligations under the Credit Agreement are guaranteed by substantially all our direct and indirect domestic subsidiaries. The obligations under the Credit Agreement and the guarantees are secured by a lien on substantially all tangible and intangible property, and by a pledge of all of the shares of stock and limited liability company interests of our direct and indirect domestic subsidiaries, of which we now own or later acquire more than a 50% interest, subject to limited exceptions.
In addition to other covenants, the Credit Agreement places limits on our ability, including our subsidiaries, to declare dividends or redeem or repurchase capital stock, prepay, redeem or purchase debt, incur liens and engage in sale-leaseback transactions, make loans and investments, incur additional indebtedness, amend or otherwise alter debt and other material agreements, engage in mergers, acquisitions and asset sales, transact with affiliates and alter the business we and our subsidiaries conduct.
The Credit Agreement also contains a leverage ratio covenant requiring us to maintain a maximum ratio of consolidated total debt to consolidated adjusted EBITDA that ranges from 4.95 to 1.00 to 4.30 to 1.00. At December 31, 2014, the Credit Agreement requires a maximum leverage ratio of not more than 4.90 to 1.00. The Credit Agreement eliminated the interest coverage ratio covenant which we were subject to maintain prior to the refinancing. Failure to comply with the covenants in the Credit Agreement could permit the lenders under the Credit Agreement to declare all amounts borrowed under the Credit Agreement, together with accrued interest and fees, to be immediately due and payable, and to terminate all commitments under the Credit Agreement. As of December 31, 2014, our ratio of consolidated total debt to Consolidated Adjusted EBITDA calculated pursuant to the Credit Agreement was 3.61 to 1.00.
As a result of the transaction, we recognized a loss on extinguishment totaling $17.1 million resulting from the write-off of unamortized deferred financing costs and the discount related to the former credit facility. As of December 31, 2014, there was $480.7 million outstanding under the term loan facility and $2.0 million in borrowings under the revolving credit facility.
On July 3, 2013, as a result of the $80.0 million redemption in principal amount of our Notes and pursuant to the terms of the indenture governing the Notes, we immediately incurred $1.5 million of expense related to unamortized deferred costs and associated discount, as well as $3.2 million for the related call premium.
In September 2013, we repurchased $8.8 million in principal amount of our Notes in privately negotiated transactions. We immediately incurred $0.2 million of expense related to unamortized deferred costs and associated discount, as well as $0.3 million for the related call premium.
On October 11, 2013, the Company entered into an amendment to the Credit Agreement with Credit Suisse AG, Cayman Islands Branch, as administrative agent, and the other lenders party thereto (the “First Amendment”). Pursuant to the First Amendment, the Company raised $70 million in incremental term loan commitments to repurchase the remaining outstanding Notes. On December 2, 2013, the Company borrowed $70 million of incremental term loans, and with such proceeds plus borrowings under its revolving line of credit and cash on hand, completed the redemption of its outstanding Notes on December 4, 2013. With the completion of this transaction including the redemption in full of the Notes, the Company expects
47
to save approximately $5 million in cash interest on an annualized basis. As a result of this transaction, we recognized a loss on extinguishment totaling $3.8 million including $1.7 million of expense related to unamortized deferred costs and associated discount, as well as $2.0 million for the related call premium.
The incremental term loans were funded at 99.0% of principal amount and will mature on the same date as the existing term loan facility under the Company’s credit facility on June 3, 2019. Upon funding, the incremental term loans were converted to match all the terms of existing term loans. Interest on the incremental term loan is calculated, at the Company’s option, at a base rate plus a 2.25% margin or LIBOR plus a 3.25% margin, subject to a 1.00% LIBOR floor.
During the first five and one half years after the closing date for the incremental term loan, the quarterly amortization payments of all term loans under the credit facility has increased to $1.23 million from the previous amount of $1.05 million.
Our obligations under the incremental term loans are guaranteed by substantially all our direct and indirect domestic subsidiaries. The obligations under the incremental term loan and the guarantees are secured by a lien on substantially all of the our tangible and intangible property, and by a pledge of all of the shares of stock and limited liability company interests of our direct and indirect domestic subsidiaries, of which we own or later acquire more than a 50% interest, subject to limited exceptions.
In the first quarter of 2010, the Company entered into three interest rate cap agreements, in accordance with Company policy, to avoid unplanned volatility in the income statement due to changes in the LIBOR interest rate environment. The interest rate cap agreements, matured in February 2014 with a total notional amount of $150,000 and were de-designated as cash flow hedges associated with the Company’s variable rate bank debt in the fourth quarter of 2013.
In the second quarter of 2011, the Company acquired two interest rate swap agreements (the “USR Swaps”) as part of the acquisition of USR. One of the USR Swaps, which matures in October 2015, had a notional amount of $871 as of December 31, 2014. Under the terms of this agreement, the Company receives one-month LIBOR and pays a fixed rate of 5.71%. The net effect of the hedge is to record interest expense at a fixed rate of 8.71%, as the underlying debt incurred interest based on one-month LIBOR plus 3.00%. The other USR Swap, which matured in April 2014. As a result of the acquisition of USR, the USR Swaps were de-designated, hedge accounting was terminated and all further changes in the fair market value of these swaps are being recorded in interest expense and other, net.
In the fourth quarter of 2012, the Company entered into an interest rate swap agreement in connection with equipment financing. The swap, which matures in December 2017, had a notional amount of $3,236 as of December 31, 2014. Under the terms of this agreement, the Company receives one-month LIBOR plus 2.50% and pays a fixed rate of 3.75%. The net effect of the hedge is to convert interest expense to a fixed rate of 3.75%, as the underlying debt incurred interest based on one-month LIBOR plus 2.50%.
In the first quarter of 2013, the Company entered into an interest rate swap agreement in connection with equipment financing. The swap, which matures in April 2018, had a notional amount of $2,930 as of December 31, 2014. Under the terms of this agreement, the Company receives one-month LIBOR plus 2.00% and pays a fixed rate of 2.873%. The net effect of the hedge is to convert interest expense to a fixed rate of 2.873%, as the underlying debt incurred interest based on one-month LIBOR plus 2.00%.
In the fourth quarter of 2013, the Company entered into five interest rate cap agreements ("2013 Caps"), in accordance with Company policy, to avoid unplanned volatility in the income statement due to changes in the LIBOR interest rate environment. The 2013 Caps, which mature in December 2016, had a notional amount of $250,000 and were designated as cash flow hedges of future cash interest payments associated with a portion of the Company’s variable rate bank debt. Under these arrangements, the Company has purchased a cap on LIBOR at 2.50%. The Company paid $815 to enter into the caps, which is being amortized through interest expense and other, net over the life of the agreements.
In the fourth quarter of 2014, the Company entered into an interest rate swap agreement in connection with equipment financing. The swap, which matures in November 2019, had a notional amount of $1,691 as of December 31, 2014. Under the terms of this agreement, the Company receives one-month LIBOR and pays a fixed rate of 1.3427%. The net effect of the hedge is to convert interest expense to a fixed rate of 1.3427%, as the underlying debt incurred interest based on one-month LIBOR.
48
The maturities of our long-term debt, including interest, future payments under our operating leases and binding equipment purchase commitments as of December 31, 2014 are as follows:
Contractual Obligations | 2015 | 2016 | 2017 | 2018 | 2019 | Thereafter | Total | ||||||||||||||||||||
Term Loan | $ | 4.9 | $ | 4.9 | $ | 4.9 | $ | 4.9 | $ | 463.2 | $ | — | $ | 482.8 | |||||||||||||
Revolving Line of Credit | — | — | 2.0 | — | — | — | 2.0 | ||||||||||||||||||||
Equipment Loans | 11.3 | 7.1 | 4.1 | 1.8 | 1.3 | 0.4 | 26.0 | ||||||||||||||||||||
Operating Leases | 14.4 | 12.9 | 3.5 | 2.7 | 2.1 | 7.9 | 43.4 | ||||||||||||||||||||
Letters of Credit | — | 4.5 | — | — | — | — | 4.5 | ||||||||||||||||||||
Equipment Purchase Commitments | — | — | — | — | — | — | — | ||||||||||||||||||||
Total Contractual Obligation Payments | 30.6 | 29.4 | 14.5 | 9.4 | 466.6 | 8.3 | 558.7 | ||||||||||||||||||||
Less Amount Representing Interest | (0.7 | ) | (0.4 | ) | (0.2 | ) | (0.1 | ) | — | — | (1.4 | ) | |||||||||||||||
Future Contractual Obligations | $ | 29.9 | $ | 29.0 | $ | 14.3 | $ | 9.3 | $ | 466.6 | $ | 8.3 | $ | 557.3 | |||||||||||||
We have omitted our liability for self-insurance and unrecognized tax benefits of $3.7 million and $0.3 million, respectively, at December 31, 2014 from the above table because we cannot determine with certainty when either or of these liabilities will be settled. Although we believe that it is reasonably possible that the amount of these liabilities will change in the next twelve months, we do not expect the change will have a material impact on our consolidated financial statements.
We believe that, based on current levels of operations, our cash flow from operating activities, together with other available sources of liquidity, including borrowings available under our revolving line of credit, will be sufficient over the next two years to fund anticipated capital expenditures and potential acquisitions and make required payments of principal and interest on our debt and other contracts. Under current tax law, we expect to utilize all of our federal net operating loss carryforwards (“NOLs”) by 2015, and therefore anticipate being in a tax paying position with respect to a portion of our taxable income in 2014, and for all taxable income generated beyond 2015. We may require or choose to obtain additional financing. Our ability to obtain additional financing will depend, among other things, on our financial condition and operating performance, as well as the condition of the capital markets at the time we seek financing. We cannot assure you that additional financing will be available to us on favorable terms when required, or at all. If we raise additional funds through the issuance of equity, equity-linked or debt securities, those securities may have rights, preferences or privileges senior to the rights of our common stock, and our stockholders may experience dilution. If we need to raise additional funds in the future and are unable to do so or obtain additional financing on acceptable terms in the future, we may have to limit planned activities or sell assets to obtain liquidity. We may also from time to time seek to repurchase, redeem, or retire our outstanding indebtedness through cash purchases and exchange offers in open market transactions, privately negotiated purchases or otherwise. Those repurchases, redemptions or retirements, if any, will depend on prevailing market conditions, our liquidity requirements and capital resources, contractual restrictions and other factors. The amounts involved may be material.
Off-Balance Sheet Arrangements
See Item 7A “Quantitative and Qualitative Disclosures about Market Risk.”
We periodically enter into guarantees and other similar arrangements as part of transactions in the ordinary course of business. We describe these arrangements in Note 12 of the Notes to the Consolidated Financial Statements.
Critical Accounting Policies
The preparation of financial statements in conformity with accounting principles generally accepted in the United States of America requires management to make estimates and assumptions that affect the amounts reported in the financial statements and accompanying notes. Actual results could differ from those estimates. The significant accounting policies that we believe are the most critical to aid in fully understanding and evaluating our reported financial results include the following:
Revenue Recognition
We derive the majority of our revenue directly from healthcare providers, primarily for imaging and radiation oncology services. To a lesser extent, we generate revenues from direct billings to patients or their medical payors, and we record these revenues net of contractual discounts and other arrangements for providing services at less than established patient billing rates. Revenues from direct patient billing amounted to approximately 20%, 20% and 19% of revenues in the years ended December 31, 2014, 2013 and 2012, respectively. We continuously monitor collections from direct patient billings and compare these collections to revenue, net of contractual discounts, recorded at the time of service. While these contractual discounts
49
have historically been within our expectations and the provisions established, an inability to accurately estimate contractual discounts in the future could have a material adverse effect on our operating results. Because the price is predetermined, we recognize all revenues when we deliver the imaging service and collectability is reasonably assured, which is based upon contract terms with healthcare providers and negotiated rates with third-party payors and patients.
Accounts Receivable
We provide shared and single-user diagnostic imaging and radiation oncology equipment and technical support services to the healthcare industry and directly to patients on an outpatient basis. Substantially all of our accounts receivable are due from hospitals, other healthcare providers and health insurance providers, including Medicare, located throughout the United States. Services are generally provided under long-term contracts with hospitals and other healthcare providers or directly to patients, and generally collateral is not required. We generally collect receivables within industry norms for third-party payors. We continuously monitor collections from our clients and maintain an allowance for estimated credit losses based upon any specific client collection issues that we have identified and our historical experience. Although those credit losses have historically been within our expectations and the provisions established, an inability to accurately estimate credit losses in the future could have a material adverse effect on our operating results.
Goodwill and Long-Lived Assets
ASC 350 requires that goodwill and intangible assets with indefinite useful lives not be amortized, but instead be tested for impairment at least annually at the reporting unit level. In addition, ASC 350 defines a reporting unit as an operating segment or one level below an operating segment (also known as a component). A component of an operating segment is a reporting unit under ASC 350 if the component constitutes a business for which discrete financial information is available and reviewed by management. We have evaluated ASC 350 and concluded there are two operating segments: the Radiology Division and the Oncology Division. The Radiology Division is further divided into two components (East and West zones), while the Oncology Division operating segment is comprised of a single component. We have assessed that each component listed above meets the definition of a reporting unit, based on the conclusions that each component constitutes a business, discrete financial information is available for each component, and management regularly reviews the results of such financial information.
In accordance with ASC 350, we have selected to perform an annual impairment test in the fourth quarter for goodwill and intangible assets with indefinite lives, using financial information as of September 30, or more frequently if an event occurs or circumstances change that would more likely than not reduce the fair value of a reporting unit below its carrying amount. Such indicators include a sustained significant decline in our market capitalization or a significant decline in our expected future cash flows due to changes in company-specific factors or the broader business climate. When such an event or change in circumstances occurs, consideration is given to the potential impact on the fair value of the reporting unit and the amount by which the fair value exceeds the carrying value as of the date of the last impairment test.
Determining whether impairment has occurred is a two-step process. First, for each reporting unit we compare its estimated fair value with its net book value. If the estimated fair value significantly exceeds its net book value, goodwill is deemed not to be impaired, and no further testing is necessary. If the estimated fair value does not significantly exceed its net book value, we then perform a second test to calculate the amount of impairment, if any. To determine the amount of any impairment, we determine the implied fair value of goodwill. Specifically, we determine the fair value of all of the assets and liabilities of the reporting unit, including any unrecognized intangible assets, in a hypothetical calculation that yields the implied fair value of goodwill. If the implied fair value of goodwill is less than the recorded goodwill, we record an impairment charge for the difference.
The impairment analysis in Step 2 utilizes two primary approaches to calculate the fair value of the reporting unit: the discounted cash flow (“DCF”) method and the Guideline Public Company (“GPC”) method.
Under the DCF method, value is measured as the present worth of anticipated future net cash flows generated by a business. In a multi-period model, net cash flows attributable to a business are forecast for an appropriate period and then discounted to present value using an appropriate discount rate. In a single-period model, net cash flow or earnings for a normalized period are capitalized to reach a determination of present value. The methods, key assumptions, degree of uncertainty associated with the key assumptions and the potential events or changes in circumstances that could reasonably be expected to negatively affect the key assumptions with respect to the reporting unit are the estimated future net cash flows generated, and the discount rate applied to capture the associated risks. The ability to achieve anticipated future net cash flows is subject to numerous assumptions and risks, including company-specific risks such as the ability to maintain and grow revenues, maintain or improve operating margins, control costs and anticipate working capital requirements. The anticipated future net cash flows are also dependent on industry-level factors, such as the impact of the Patient Protection and Affordable
50
Care Act of 2010 on patient volumes and cost reimbursement levels and continued availability of qualified doctors and other medical professionals who are necessary to staff our operations, among other potential impacts.
Under the GPC method, value is estimated by comparing the subject company to similar companies with publicly traded ownership interests. Guideline companies are selected based on comparability to the subject company, and valuation multiples are calculated and applied to subject company operating data. The key assumption used in connection with the GPC method focuses on identifying guideline companies that operate in the same (or similar) line of business as the reporting units, with the same (or similar) operating characteristics. Eligible companies were selected based on Global Industry Classification Standard codes, Standard Industrial Classification codes, company descriptions, and industry affiliations. Proceeding the analysis of the observed guideline public company multiples, certain of those multiples are utilized to apply against the relevant financial metrics of the reporting unit. Considered factors include relative risk, profitability, and growth considerations of the reporting unit relative to the guideline companies. Value estimates for the reporting unit involve using multiples of market value of invested capital excluding cash to revenue and earnings before interest, income taxes, depreciation and amortization ("EBITDA"). Valuations derived using the GPC method rely on information primarily obtained from available industry market data and publicly available filings with the Securities and Exchange Commission ("SEC").
ASC 350 also requires intangible assets with definite useful lives to be amortized over their respective estimated useful lives to their estimated residual values and reviewed for impairment in accordance with ASC 360, “Property, Plant, and Equipment.” For additional information, see Note 6 of the Notes to the Consolidated Financial Statements.
In 2014 and 2013, we concluded in Step 1 that the fair value of each reporting unit significantly exceeded its carrying value, indicating no goodwill or indefinite-lived intangible asset impairment was present.
The 2012 annual impairment test in Step 1 yielded a fair value of the Oncology reporting unit that exceeded its carrying value of $140.2 million by approximately 4%, and was therefore considered at risk of impairment. Based on the 2012 goodwill impairment analysis, the Oncology Division was not impaired. There were no other reporting units that were at risk of impairment in 2012.
Goodwill and intangible assets with indefinite lives are allocated to three reporting units, which are aggregated into the Imaging and Radiation Oncology segments. Goodwill represented $57.0 million of $489.8 million of total assets as of December 31, 2013. Goodwill represented $63.9 million of $500.9 million of total assets as of December 31, 2014. Imaging segment goodwill totaled $42.2 million as of December 31, 2013 and 2014, respectively, and Radiation Oncology segment goodwill totaled $14.8 million and $21.7 million as of December 31, 2013 and 2014, respectively.
See Notes 6 and 7of the Notes to the Consolidated Financial Statements for further information.
The determination of fair value of our reporting units requires significant estimates and assumptions. These estimates and assumptions primarily include earnings and required capital projections, discount rates, terminal growth rates, and operating income for each reporting unit and the weighting assigned to the results of each of the valuation methods described above. Changes in certain assumptions could have a significant impact on the goodwill impairment assessment. We evaluated the significant assumptions used to determine the estimated fair values of each reporting unit, both individually and in the aggregate, and concluded they are reasonable. However, if weak market conditions continue for an extended period or the operating results of any of our reporting units decline substantially compared to projected results, we could determine that we need to record additional impairment charges.
Deferred Income Taxes
Deferred income tax assets and liabilities are determined based on the temporary differences between the financial reporting and tax bases of assets and liabilities, applying enacted statutory tax rates in effect for the year in which the differences are expected to reverse. Future income tax benefits are recognized only to the extent that the realization of such benefits is considered to be more likely than not. We regularly review our deferred income tax assets for recoverability and establish a valuation allowance based on historical taxable income, projected future taxable income and the expected timing of the reversals of existing temporary differences. If we are unable to generate sufficient future taxable income, or if there is a material change in the actual effective income tax rates or time period within which the underlying temporary differences become taxable or deductible, we could be required to significantly increase our valuation allowance, resulting in a substantial increase in our effective tax rate.
Recent Accounting Pronouncements
For a discussion of recent accounting pronouncements, please refer to Note 2 of the Notes to Consolidated Financial Statements.
51
ITEM 7A. | QUANTITATIVE AND QUALITATIVE DISCLOSURES ABOUT MARKET RISK |
We provide our services exclusively in the United States and receive payment for our services exclusively in United States dollars. As a result, our financial results are unlikely to be affected by factors such as changes in foreign currency exchange rates or weak economic conditions in foreign markets.
Our interest expense is sensitive to changes in the general level of interest rates in the United States, particularly because the majority of our indebtedness bears interest at variable rates. The recorded carrying amount of our long-term debt under our credit facility approximates fair value because those borrowings have variable rates that reflect currently available terms and conditions for similar debt. To decrease the risk associated with interest rate increases, we have entered into multiple interest rate swap and cap agreements for a portion of our variable rate debt. These swaps and caps are designated as cash flow hedges of variable future cash flows associated with our long-term debt.
For information about our swap activities, please see Item 7, Management's Discussion and Analysis of Financial Condition and Results of Operations-Liquidity and Capital Resources.
The swaps expose us to credit risk if the counterparties to the agreements do not or cannot meet their obligations. The notional amount is used to measure interest to be paid or received and does not represent the amount of exposure to credit loss. The loss would be limited to the amount that would have been received, if any, over the remaining life of the 2010 swaps. On a quarterly basis, the counterparties are evaluated for non-performance risk. See Note 11 of the Notes to the Consolidated Financial Statements for additional details.
Our interest income is sensitive to changes in the general level of interest rates in the United States, particularly because the majority of our investments are in cash equivalents. We maintain our cash equivalents in financial instruments with original maturities of 90 days or less. Cash and cash equivalents are invested in interest bearing funds managed by third party financial institutions. At December 31, 2014, we had cash and cash equivalents of $33.0 million, of which $26.7 million was held in accounts that are with third party financial institutions that exceed the FDIC insurance limits.
The recorded carrying amounts of cash and cash equivalents approximate fair value due to their short-term maturities.
The table below provides information about our financial instruments that are sensitive to changes in interest rates. For long-term debt obligations, the table presents principal cash flows and related weighted-average interest rates by expected (contractual) maturity dates. All amounts are in United States dollars.
Expected Maturity as of December 31, 2014 | ||||||||||||||||||||||||
2015 | 2016 | 2017 | 2018 | 2019 | Thereafter | Total | Fair Value | |||||||||||||||||
(dollars in millions) | ||||||||||||||||||||||||
Liabilities: | ||||||||||||||||||||||||
Long-term debt: | ||||||||||||||||||||||||
Fixed rate | $ | 5.1 | $ | 4.3 | $ | 1.3 | $ | 1.1 | $ | 1.0 | $ | 0.3 | $ | 13.0 | $ | 13.9 | ||||||||
Average interest rate | 4.89 | % | 4.38 | % | 3.73 | % | 3.73 | % | 3.14 | % | 2.29 | % | 3.69 | % | 3.69 | % | ||||||||
Variable rate | $ | 10.4 | $ | 7.4 | $ | 9.5 | $ | 5.5 | $ | 463.5 | $ | — | $ | 496.4 | $ | 496.6 | ||||||||
Average interest rate | 3.13 | % | 3.66 | % | 3.81 | % | 3.98 | % | 4.25 | % | — | % | 4.20 | % | 4.20 | % | ||||||||
52
ITEM 8. | FINANCIAL STATMENTS AND SUPPLEMENTARY DATA |
ALLIANCE HEALTHCARE SERVICES, INC.
INDEX TO CONSOLIDATED FINANCIAL STATEMENTS
Report of Independent Registered Public Accounting Firm | 53 | |
Consolidated Financial Statements | ||
Consolidated Balance Sheets | 54 | |
Consolidated Statements of Operations and Comprehensive Income (Loss) | 55 | |
Consolidated Statements of Cash Flows | 56 | |
Consolidated Statements of Stockholders’ Equity (Deficit) | 59 | |
Notes to Consolidated Financial Statements | 60 | |
53
REPORT OF INDEPENDENT REGISTERED PUBLIC ACCOUNTING FIRM
To the Board of Directors and Stockholders of
Alliance HealthCare Services, Inc.
Newport Beach, California
We have audited the accompanying consolidated balance sheets of Alliance HealthCare Services, Inc. and subsidiaries (the “Company”) as of December 31, 2014 and 2013, and the related consolidated statements of operations and comprehensive income (loss), cash flows, and stockholders’ equity (deficit) for each of the three years in the period ended December 31, 2014. Our audits also included the consolidated financial statement schedule listed in the index at Item 15. These consolidated financial statements and the consolidated financial statement schedule are the responsibility of the Company’s management. Our responsibility is to express an opinion on these consolidated financial statements and the consolidated financial statement schedule based on our audits.
We conducted our audits in accordance with the standards of the Public Company Accounting Oversight Board (United States). Those standards require that we plan and perform the audit to obtain reasonable assurance about whether the consolidated financial statements are free of material misstatement. An audit includes examining, on a test basis, evidence supporting the amounts and disclosures in the consolidated financial statements. An audit also includes assessing the accounting principles used and significant estimates made by management, as well as evaluating the overall financial statement presentation. We believe that our audits provide a reasonable basis for our opinion.
In our opinion, such consolidated financial statements present fairly, in all material respects, the financial position of Alliance HealthCare Services, Inc. and subsidiaries as of December 31, 2014 and 2013, and the results of their operations and their cash flows for each of the three years in the period ended December 31, 2014, in conformity with accounting principles generally accepted in the United States of America. Also, in our opinion, such consolidated financial statement schedule, when considered in relation to the basic consolidated financial statements taken as a whole, presents fairly, in all material respects, the information set forth therein.
We have also audited, in accordance with the standards of the Public Company Accounting Oversight Board (United States), the Company’s internal control over financial reporting as of December 31, 2014, based on the criteria established in Internal Control — Integrated Framework (2013) issued by the Committee of Sponsoring Organizations of the Treadway Commission and our report dated March 16, 2015 expressed an unqualified opinion on the Company’s internal control over financial reporting.
/s/ Deloitte & Touche LLP
Costa Mesa, California
March 16, 2015
54
ALLIANCE HEALTHCARE SERVICES, INC.
CONSOLIDATED BALANCE SHEETS
(in thousands, except per share and share amounts)
December 31, | |||||||
2013 | 2014 | ||||||
ASSETS | |||||||
Current assets: | |||||||
Cash and cash equivalents | $ | 34,702 | $ | 33,033 | |||
Accounts receivable, net of allowance for doubtful accounts of $5,158 in 2013 and $4,055 in 2014 | 63,713 | 62,503 | |||||
Deferred income taxes | 21,849 | 16,834 | |||||
Prepaid expenses | 7,553 | 12,527 | |||||
Other receivables | 2,796 | 5,686 | |||||
Total current assets | 130,613 | 130,583 | |||||
Equipment, at cost | 824,103 | 827,638 | |||||
Less accumulated depreciation | (654,350 | ) | (678,291 | ) | |||
Equipment, net | 169,753 | 149,347 | |||||
Goodwill | 56,975 | 63,864 | |||||
Other intangible assets, net | 101,801 | 115,930 | |||||
Deferred financing costs, net | 9,873 | 8,119 | |||||
Other assets | 20,832 | 33,042 | |||||
Total assets | $ | 489,847 | $ | 500,885 | |||
LIABILITIES AND STOCKHOLDERS’ DEFICIT | |||||||
Current liabilities: | |||||||
Accounts payable | $ | 11,990 | $ | 12,109 | |||
Accrued compensation and related expenses | 21,166 | 19,808 | |||||
Accrued interest payable | 1,645 | 3,154 | |||||
Other accrued liabilities | 22,002 | 26,542 | |||||
Current portion of long-term debt | 15,066 | 15,512 | |||||
Total current liabilities | 71,869 | 77,125 | |||||
Long-term debt, net of current portion | 514,608 | 491,777 | |||||
Other liabilities | 4,714 | 6,623 | |||||
Deferred income taxes | 35,273 | 36,840 | |||||
Total liabilities | 626,464 | 612,365 | |||||
Commitments and contingencies (Note 12) | |||||||
Stockholders’ deficit: | |||||||
Preferred stock, $0.01 par value; 1,000,000 shares authorized and no shares issued and outstanding | — | — | |||||
Common stock, $0.01 par value; 100,000,000 shares authorized; shares issued and outstanding - 10,667,136 at December 31, 2013 and 10,713,658 at December 31, 2014 | 524 | 107 | |||||
Less: treasury stock, at cost - 144,921 December 31, 2013 and 157,973 December 31, 2014 | (2,998 | ) | (3,138 | ) | |||
Additional paid-in capital | 23,521 | 27,653 | |||||
Accumulated comprehensive loss | (82 | ) | (351 | ) | |||
Accumulated deficit | (204,709 | ) | (194,091 | ) | |||
Total stockholders’ deficit attributable to Alliance HealthCare Services, Inc. | (183,744 | ) | (169,820 | ) | |||
Noncontrolling interest | 47,127 | 58,340 | |||||
Total stockholders’ deficit | (136,617 | ) | (111,480 | ) | |||
Total liabilities and stockholders’ deficit | $ | 489,847 | $ | 500,885 | |||
See accompanying notes.
55
ALLIANCE HEALTHCARE SERVICES, INC.
CONSOLIDATED STATEMENTS OF OPERATIONS
AND COMPREHENSIVE INCOME (LOSS)
(in thousands, except per share amounts)
Year Ended December 31, | |||||||||||
2012 | 2013 | 2014 | |||||||||
Revenues | $ | 472,258 | $ | 448,831 | $ | 436,387 | |||||
Costs and expenses: | |||||||||||
Cost of revenues, excluding depreciation and amortization | 253,225 | 239,397 | 237,420 | ||||||||
Selling, general and administrative expenses | 76,022 | 80,215 | 79,903 | ||||||||
Transaction costs | 994 | 465 | 2,344 | ||||||||
Severance and related costs | 2,226 | 1,658 | 2,517 | ||||||||
Impairment charges | — | 13,031 | 308 | ||||||||
Loss on extinguishment of debt | — | 26,018 | — | ||||||||
Depreciation expense | 79,333 | 66,319 | 54,971 | ||||||||
Amortization expense | 15,861 | 10,973 | 7,880 | ||||||||
Interest expense and other, net | 54,101 | 39,170 | 24,693 | ||||||||
Other expense and (income), net | 3,036 | (1,945 | ) | (1,823 | ) | ||||||
Total costs and expenses | 484,798 | 475,301 | 408,213 | ||||||||
(Loss) income before income taxes, earnings from unconsolidated investees, and noncontrolling interest | (12,540 | ) | (26,470 | ) | 28,174 | ||||||
Income tax (benefit) expense | (6,710 | ) | (12,398 | ) | 7,327 | ||||||
Earnings from unconsolidated investees | (4,667 | ) | (5,630 | ) | (4,654 | ) | |||||
Net (loss) income | (1,163 | ) | (8,442 | ) | 25,501 | ||||||
Less: Net income attributable to noncontrolling interest | (10,775 | ) | (13,041 | ) | (14,883 | ) | |||||
Net (loss) income attributable to Alliance HealthCare Services, Inc. | $ | (11,938 | ) | $ | (21,483 | ) | $ | 10,618 | |||
Comprehensive (loss) income, net of taxes: | |||||||||||
Net (loss) income attributable to Alliance HealthCare Services, Inc. | $ | (11,938 | ) | $ | (21,483 | ) | $ | 10,618 | |||
Unrealized (loss) gain on hedging transactions, net of taxes | (234 | ) | 634 | (269 | ) | ||||||
Comprehensive (loss) income, net of taxes: | $ | (12,172 | ) | $ | (20,849 | ) | $ | 10,349 | |||
(Loss) income per common share attributable to Alliance HealthCare Services, Inc.: | |||||||||||
Basic | $ | (1.12 | ) | $ | (2.02 | ) | $ | 1.00 | |||
Diluted | $ | (1.12 | ) | $ | (2.02 | ) | $ | 0.98 | |||
Weighted-average number of shares of common stock and common stock equivalents: | |||||||||||
Basic | 10,624 | 10,634 | 10,669 | ||||||||
Diluted | 10,624 | 10,634 | 10,836 | ||||||||
See accompanying notes.
56
ALLIANCE HEALTHCARE SERVICES, INC.
CONSOLIDATED STATEMENTS OF CASH FLOWS
(in thousands)
Year Ended December 31, | |||||||||||
2012 | 2013 | 2014 | |||||||||
Operating activities: | |||||||||||
Net (loss) income | $ | (1,163 | ) | $ | (8,442 | ) | $ | 25,501 | |||
Adjustments to reconcile net (loss) income to net cash provided by operating activities: | |||||||||||
Provision for doubtful accounts | 2,871 | 3,415 | 2,634 | ||||||||
Share-based payment | 730 | 1,487 | 1,515 | ||||||||
Depreciation and amortization | 95,194 | 77,292 | 62,851 | ||||||||
Amortization of deferred financing costs | 4,006 | 3,052 | 1,926 | ||||||||
Accretion of discount on long-term debt | 1,690 | 1,013 | 447 | ||||||||
Adjustment of derivatives to fair value | 46 | (21 | ) | 342 | |||||||
Distributions more than undistributed earnings from investees | 41 | 337 | 591 | ||||||||
Deferred income taxes | (7,030 | ) | (12,486 | ) | 6,582 | ||||||
Loss (gain) on sale of assets | 2,087 | (1,391 | ) | (565 | ) | ||||||
Loss on extinguishment of debt | — | 26,018 | — | ||||||||
Impairment charges | — | 13,031 | 308 | ||||||||
Excess tax benefit from share-based payment arrangements | — | — | (623 | ) | |||||||
Changes in operating assets and liabilities, net of the effects of acquisitions: | |||||||||||
Accounts receivable | 5,510 | (4,808 | ) | (1,424 | ) | ||||||
Prepaid expenses | 1,384 | (2,475 | ) | (5,064 | ) | ||||||
Other receivables | 403 | 1,672 | (114 | ) | |||||||
Other assets | 896 | 2,990 | (1,852 | ) | |||||||
Accounts payable | (3,729 | ) | (4,281 | ) | 953 | ||||||
Accrued compensation and related expenses | 4,277 | (1,315 | ) | (1,358 | ) | ||||||
Accrued interest payable | (1,501 | ) | (3,436 | ) | 1,509 | ||||||
Income taxes payable | (252 | ) | — | 31 | |||||||
Other accrued liabilities | (2,317 | ) | (5,130 | ) | 6,439 | ||||||
Net cash provided by operating activities | 103,143 | 86,522 | 100,629 | ||||||||
Investing activities: | |||||||||||
Equipment purchases | (37,564 | ) | (27,048 | ) | (32,236 | ) | |||||
Increase in deposits on equipment | (2,968 | ) | (193 | ) | (9,228 | ) | |||||
Acquisitions, net of cash received | — | — | (16,043 | ) | |||||||
Decrease (increase) in cash from escrow | 2,496 | (475 | ) | — | |||||||
Increase in notes receivable | — | — | (2,776 | ) | |||||||
Proceeds from sale of assets | 37,450 | 3,156 | 1,557 | ||||||||
Net cash used in investing activities | (586 | ) | (24,560 | ) | (58,726 | ) | |||||
Financing activities: | |||||||||||
Principal payments on equipment debt | (13,566 | ) | (14,233 | ) | (10,368 | ) | |||||
Proceeds from equipment debt | 6,526 | 4,846 | 4,527 | ||||||||
Principal payments on term loan facility | (83,515 | ) | (342,710 | ) | (4,900 | ) | |||||
Proceeds from term loan facility | — | 487,200 | — | ||||||||
Principal payments on revolving loan facility | — | — | (45,000 | ) | |||||||
Proceeds from revolving loan facility | — | 19,000 | 28,000 | ||||||||
57
Principal payments on senior notes | — | (190,000 | ) | — | |||||||
Payments of debt issuance costs | (3,235 | ) | (16,522 | ) | — | ||||||
Purchase of derivative instruments | — | (815 | ) | — | |||||||
Payments of contingent consideration | (1,797 | ) | — | — | |||||||
Noncontrolling interest in subsidiaries | (11,035 | ) | (14,409 | ) | (16,089 | ) | |||||
Equity investment in subsidiaries | — | — | (691 | ) | |||||||
Excess tax benefit from share-based payment arrangements | — | — | 623 | ||||||||
Proceeds from shared-based payment arrangements | — | 527 | 466 | ||||||||
Purchase of treasury stock | (148 | ) | (121 | ) | (140 | ) | |||||
Net cash used in financing activities | (106,770 | ) | (67,237 | ) | (43,572 | ) | |||||
Net decrease in cash and cash equivalents | (4,213 | ) | (5,275 | ) | (1,669 | ) | |||||
Cash and cash equivalents, beginning of period | 44,190 | 39,977 | 34,702 | ||||||||
Cash and cash equivalents, end of period | $ | 39,977 | $ | 34,702 | $ | 33,033 | |||||
Supplemental disclosure of cash flow information: | |||||||||||
Interest paid | $ | 50,355 | $ | 35,495 | $ | 21,037 | |||||
Income taxes paid, net of refunds | $ | 760 | $ | 2,463 | $ | 6,504 | |||||
Supplemental disclosure of non-cash investing and financing activities: | |||||||||||
Net book value of assets exchanged | $ | 5,434 | $ | 5 | $ | — | |||||
Capital lease obligations related to the purchase of equipment | $ | 4,017 | $ | — | $ | 1,725 | |||||
Comprehensive (loss) gain from hedging transactions, net of taxes | $ | (234 | ) | $ | 634 | $ | (269 | ) | |||
Equipment purchases in accounts payable | $ | 282 | $ | 560 | $ | 834 | |||||
Contingent consideration for acquisitions | $ | (308 | ) | $ | — | $ | — | ||||
Noncontrolling interest (disposed) assumed in connection with acquisitions (Note 2) | $ | (1,254 | ) | $ | — | $ | 13,014 | ||||
Debt related to purchase of equipment | $ | — | $ | — | $ | 3,183 | |||||
Adjustment to equity of noncontrolling interest | $ | — | $ | — | $ | 1,700 | |||||
See accompanying notes.
58
ALLIANCE HEALTHCARE SERVICES, INC.
CONSOLIDATED STATEMENTS OF STOCKHOLDERS' EQUITY (DEFICIT)
(in thousands, except share amounts)
Stockholders’ Equity (Deficit) Attributable to | |||||||||||||||||||||||||||||
Common Stock | Treasury Stock | Additional Paid-In Capital | Accumulated Comprehensive Income (Loss) | Retained Earnings (Accumulated Deficit) | Alliance HealthCare Services, Inc. | Non-controlling Interest | Total Stockholders’ Equity (Deficit) | ||||||||||||||||||||||
Shares | Amount | Shares | Amount | ||||||||||||||||||||||||||
Balance at December 31, 2011 | 10,663,868 | 527 | (116,196 | ) | (2,729 | ) | 20,269 | (950 | ) | (171,288 | ) | (154,171 | ) | 49,260 | (104,911 | ) | |||||||||||||
Forfeit of restricted stock | (106,340 | ) | (4 | ) | — | — | — | — | — | (4 | ) | — | (4 | ) | |||||||||||||||
Issuance of restricted stock | 57,544 | 1 | — | — | — | — | — | 1 | — | 1 | |||||||||||||||||||
Purchase of treasury stock | — | — | (23,832 | ) | (148 | ) | — | — | — | (148 | ) | — | (148 | ) | |||||||||||||||
Share-based payment | — | — | — | — | 733 | — | — | 733 | — | 733 | |||||||||||||||||||
Unrealized gain on hedging transaction, net of tax | — | — | — | — | — | 234 | — | 234 | — | 234 | |||||||||||||||||||
Noncontrolling interest disposed in connection with acquisition | — | — | — | — | 505 | — | — | 505 | — | 505 | |||||||||||||||||||
Net contributions (distributions) | — | — | — | — | — | — | — | — | (11,540 | ) | (11,540 | ) | |||||||||||||||||
Net (loss) income | — | — | — | — | — | — | (11,938 | ) | (11,938 | ) | 10,775 | (1,163 | ) | ||||||||||||||||
Balance at December 31, 2012 | 10,615,072 | 524 | (140,028 | ) | (2,877 | ) | 21,507 | (716 | ) | (183,226 | ) | (164,788 | ) | 48,495 | (116,293 | ) | |||||||||||||
Exercise of stock options | 31,679 | — | — | — | 527 | — | — | 527 | — | 527 | |||||||||||||||||||
Forfeit of restricted stock | (7,334 | ) | — | — | — | — | — | — | — | — | — | ||||||||||||||||||
Issuance of restricted stock | 27,719 | — | — | — | — | — | — | — | — | — | |||||||||||||||||||
Purchase of treasury stock | — | — | (4,893 | ) | (121 | ) | — | — | — | (121 | ) | — | (121 | ) | |||||||||||||||
Share-based payment | — | — | — | — | 1,487 | — | — | 1,487 | — | 1,487 | |||||||||||||||||||
Unrealized gain on hedging transaction, net of tax | — | — | — | — | — | 634 | — | 634 | — | 634 | |||||||||||||||||||
Net contributions (distributions) | — | — | — | — | — | — | — | — | (14,409 | ) | (14,409 | ) | |||||||||||||||||
Net (loss) income | — | — | — | — | — | — | (21,483 | ) | (21,483 | ) | 13,041 | (8,442 | ) | ||||||||||||||||
Balance at December 31, 2013 | 10,667,136 | 524 | (144,921 | ) | (2,998 | ) | 23,521 | (82 | ) | (204,709 | ) | (183,744 | ) | 47,127 | (136,617 | ) | |||||||||||||
Exercise of stock options | 72,794 | 1 | — | — | 466 | — | — | 467 | — | 467 | |||||||||||||||||||
Forfeit of restricted stock | (26,272 | ) | — | — | — | — | — | — | — | — | — | ||||||||||||||||||
Purchase of treasury stock | — | — | (13,052 | ) | (140 | ) | — | — | — | (140 | ) | — | (140 | ) | |||||||||||||||
Share-based payment | — | — | — | — | 1,515 | — | — | 1,515 | — | 1,515 | |||||||||||||||||||
Share-based payment income tax benefit | — | — | — | — | 82 | — | — | 82 | — | 82 | |||||||||||||||||||
Unrealized loss on hedging transaction, net of tax | — | — | — | — | — | (269 | ) | — | (269 | ) | — | (269 | ) | ||||||||||||||||
Noncontrolling interest disposed in connection with acquisition | — | — | — | — | 1,651 | — | — | 1,651 | — | 1,651 | |||||||||||||||||||
Net contributions (distributions) | — | — | — | — | — | — | — | — | (3,670 | ) | (3,670 | ) | |||||||||||||||||
Other | — | (418 | ) | — | — | 418 | — | — | — | — | — | ||||||||||||||||||
Net (loss) income | — | — | — | — | — | — | 10,618 | 10,618 | 14,883 | 25,501 | |||||||||||||||||||
Balance at December 31, 2014 | 10,713,658 | 107 | (157,973 | ) | (3,138 | ) | 27,653 | (351 | ) | (194,091 | ) | (169,820 | ) | 58,340 | (111,480 | ) | |||||||||||||
See accompanying notes.
59
ALLIANCE HEALTHCARE SERVICES, INC.
NOTES TO CONSOLIDATED FINANCIAL STATEMENTS
December 31, 2014
(Dollars in thousands, except per share and share amounts)
1. Description of the Company and Basis of Financial Statement Presentation
Description of the Company Alliance HealthCare Services, Inc. and its subsidiaries (the “Company”) provide diagnostic imaging services and therapeutic services primarily to hospitals and other healthcare providers on a shared-service and full-time service basis. The Company also provides services through fixed-sites, primarily to hospitals or health systems. The Company’s services normally include the use of its systems, technologists, therapists and other clinical staff to operate the systems, equipment maintenance and upgrades and management of day-to-day shared-service and fixed-site diagnostic imaging and radiation oncology operations. The Company also offers ancillary services including marketing support, education, training and billing assistance. The Company operates entirely within the United States and is one of the largest providers of shared service and fixed-site magnetic resonance imaging (“MRI”) and positron emission tomography/computed tomography (“PET/CT”) services in the country. The Company also operates 31 radiation oncology centers at December 31, 2014. For the year ended December 31, 2014, MRI, PET/CT and radiation oncology services generated 41%, 31% and 21% of the Company’s revenue, respectively.
Principles of Consolidation and Basis of Financial Statement Presentation The accompanying audited consolidated financial statements of the Company include the assets, liabilities, revenues and expenses of all majority-owned subsidiaries over which the Company exercises control. Intercompany transactions have been eliminated. The Company records noncontrolling interest related to its consolidated subsidiaries which are not wholly owned. Investments in non-consolidated investees over which it exercises significant influence but does not control are accounted for under the equity method. The consolidated financial statements have been prepared in accordance with accounting principles generally accepted in the United States of America (“generally accepted accounting principles", or "GAAP").
Reverse Stock Split On December 26, 2012, the Company executed a 1-for-5 reverse stock split. All share and per share information for all periods presented herein gives effect to the reverse stock split.
2. Summary of Significant Accounting Policies
Cash and Cash Equivalents The Company classifies short-term investments with original maturities of three months or less as cash equivalents.
Accounts Receivable The Company provides shared and single-user diagnostic imaging and radiation oncology equipment and technical support services to the healthcare industry and directly to patients on an outpatient basis. Substantially all of the Company’s accounts receivable are due from hospitals, other healthcare providers and health insurance providers, including Medicare, located throughout the United States. A substantial portion of the Company’s services are provided pursuant to long-term contracts with hospitals and other healthcare providers or directly to patients. Accounts receivable are typically collected within industry norms for third-party payors. Estimated credit losses are provided for in the consolidated financial statements.
Concentration of Credit Risk Financial instruments which potentially subject the Company to a concentration of credit risk principally consist of cash, cash equivalents and accounts receivable. The Company invests available cash in cash equivalents and money market securities of high-credit-quality financial institutions. Cash and cash equivalents in excess of federally insured limits decreased from $28,171 at December 31, 2013 to $26,740 at December 31, 2014. At December 31, 2013 and 2014, the Company’s accounts receivable were primarily from clients in the healthcare industry and third-party payors. To reduce credit risk, the Company performs periodic credit evaluations of its clients, but does not generally require advance payments or collateral. Credit losses to clients in the healthcare industry have not been material. The provision for doubtful accounts was 0.6% of revenues in 2012, 0.8% of revenues in 2013 and 0.6% of revenues in 2014.
Equipment The majority of our major medical equipment is stated at cost and is depreciated using the straight-line method over an initial estimated life of three to 10 years to an estimated residual value, between five and 10 percent of original cost. If the Company continues to operate the equipment beyond its initial estimated life, the residual value is then depreciated to a nominal salvage value over 1.5 to 3 years.
Routine maintenance and repairs are charged to expense as incurred. Major repairs and purchased software and hardware upgrades, which extend the life of or add value to the equipment, are capitalized and depreciated over the remaining useful life.
60
With the exception of a relatively small dollar amount of office furniture, office equipment, computer equipment, software and leasehold improvements, substantially all of the property owned by the Company relates to diagnostic imaging and radiation oncology equipment, power units and mobile trailers used in business operations.
Goodwill and Intangible Assets Accounting Standards Codification (“ASC”) 350, “Intangibles-Goodwill and Other,” requires that goodwill and intangible assets with indefinite useful lives not be amortized, but instead be tested for impairment at least annually at the reporting unit level. In addition, ASC 350 defines a reporting unit as an operating segment or one level below an operating segment (also known as a component). A component of an operating segment is a reporting unit under ASC 350 if the component constitutes a business for which discrete financial information is available and reviewed by management. The Company has evaluated ASC 350 and concluded there are two operating segments: the Radiology Division and the Oncology Division. The Radiology Division is further divided into two components (East and West zones), while the Oncology Division operating segment is comprised of a single component. The Company has assessed that each component listed above meets the definition of a reporting unit, based on the conclusions that each component constitutes a business, discrete financial information is available for each component, and management regularly reviews the results of such financial information.
In accordance with ASC 350, the Company has selected to perform an annual impairment test in the fourth quarter for goodwill and intangible assets with indefinite lives, using financial information as of September 30, or more frequently if an event occurs or circumstances change that would more likely than not reduce the fair value of a reporting unit below its carrying amount. Such indicators include a sustained significant decline in our market capitalization or a significant decline in expected future cash flows due to changes in company-specific factors or the broader business climate. When such an event or change in circumstances occurs, consideration is given to the potential impact on the fair value of the reporting unit and the amount by which the fair value exceeds the carrying value as of the date of the last impairment test.
Determining whether impairment has occurred is a two-step process. First, for each reporting unit, the Company compares its estimated fair value with its net book value. If the estimated fair value exceeds its net book value, goodwill is deemed not to be impaired, and no further testing is necessary. If the estimated fair value does not exceed its net book value, the Company then performs a second test to calculate the amount of impairment, if any. To determine the amount of any impairment, the Company determines the implied fair value of goodwill. Specifically, the Company determines the fair value of all of the assets and liabilities of the reporting unit, including any unrecognized intangible assets, in a hypothetical calculation that yields the implied fair value of goodwill. If the implied fair value of goodwill is less than the recorded goodwill, the Company records an impairment charge for the difference.
The impairment analysis in Step 2 utilizes two primary approaches to calculate the fair value of the reporting unit: the discounted cash flow (“DCF”) method and the Guideline Public Company (“GPC”) method.
Under the DCF method, value is measured as the present worth of anticipated future net cash flows generated by a business. In a multi-period model, net cash flows attributable to a business are forecast for an appropriate period and then discounted to present value using an appropriate discount rate. In a single-period model, net cash flow or earnings for a normalized period are capitalized to reach a determination of present value. The methods, key assumptions, degree of uncertainty associated with the key assumptions and the potential events or changes in circumstances that could reasonably be expected to negatively affect the key assumptions with respect to the reporting unit are the estimated future net cash flows generated, and the discount rate applied to capture the associated risks. The ability to achieve anticipated future net cash flows is subject to numerous assumptions and risks, including company-specific risks such as the ability to maintain and grow revenues, maintain or improve operating margins, control costs and anticipate working capital requirements. The anticipated future net cash flows are also dependent on industry-level factors, such as the impact of the Patient Protection and Affordable Care Act of 2010 on patient volumes and cost reimbursement levels and continued availability of qualified doctors and other medical professionals who are necessary to staff the Company's operations, among other potential impacts.
Under the GPC method, value is estimated by comparing the subject company to similar companies with publicly traded ownership interests. Guideline companies are selected based on comparability to the subject company, and valuation multiples are calculated and applied to subject company operating data. The key assumption used in connection with the GPC method focuses on identifying guideline companies that operate in the same (or similar) line of business as the reporting units, with the same (or similar) operating characteristics. Eligible companies are selected based on Global Industry Classification Standard codes, Standard Industrial Classification codes, company descriptions, and industry affiliations. Proceeding the analysis of the observed guideline public company multiples, certain of those multiples are utilized to apply against the relevant financial metrics of the reporting unit. Considered factors include relative risk, profitability, and growth considerations of the reporting unit relative to the guideline companies. Value estimates for the reporting unit involve using multiples of market value of invested capital excluding cash to revenue and earnings before interest, income taxes, depreciation and amortization ("EBITDA"). Valuations derived using the GPC method rely on information primarily obtained from available industry market data and publicly available filings with the Securities and Exchange Commission ("SEC").
61
In both 2013 and 2014, the respective annual impairment tests yielded individual fair values for each reporting unit that substantially exceeded their respective carrying values and were not considered at risk of impairment.
The 2012 annual impairment test in Step 1 yielded a fair value of the Oncology reporting unit that exceeded its carrying value of $140.2 million by approximately 4%, and was therefore considered at risk of impairment. Based on the 2012 goodwill impairment analysis, the Oncology Division was not impaired. There were no other reporting units that were at risk of impairment in 2012.
Goodwill and intangible assets with indefinite lives are allocated to three reporting units, which are aggregated into the Imaging and Radiation Oncology segments. Goodwill represented $56,975 of $489,847 of total assets as of December 31, 2013. Goodwill represented $63,864 of $500,885 of total assets as of December 31, 2014. Imaging segment goodwill totaled $42,166 as of December 31, 2013 and 2014, and Radiation Oncology segment goodwill totaled $14,809 as of December 31, 2013 and $21,698 as of December 31, 2014. The increase in goodwill related to our Radiation Oncology segment was due to our new partnership with Charleston Area Medical Center that commenced in November of 2014.
ASC 350 also requires intangible assets with definite useful lives to be amortized over their respective estimated useful lives to their estimated residual values and reviewed for impairment in accordance with ASC 360, “Property, Plant, and Equipment.” For additional information, see Note 6 of the Notes to the Consolidated Financial Statements.
Impairment of Long-Lived Assets The Company accounts for long-lived assets in accordance with the provisions of ASC 360. ASC 360 requires that long-lived assets be reviewed for impairment whenever events or changes in circumstances indicate that the carrying amount of an asset may not be recoverable. Recoverability of assets to be held and used is measured by a comparison of the carrying amount of an asset to undiscounted future net cash flows expected to be generated by the asset. If the carrying amount of an asset exceeds its estimated undiscounted future cash flows, an impairment charge is recognized by the amount by which the carrying amount of the asset exceeds the fair value of the asset. Assets to be disposed of are reported at the lower of the carrying amount or fair value less costs to sell.
Revenue Recognition The majority of the Company’s revenues are derived directly from healthcare providers and are primarily for imaging and radiation oncology services. To a lesser extent, revenues are generated from direct billings to third-party payors or patients which are recorded net of contractual discounts and other arrangements for providing services at less than established patient billing rates. Revenues from billings to third-party payors and patients amounted to approximately 19%, 20% and 20% of revenues for the years ended December 31, 2012, 2013 and 2014, respectively. No single customer accounted for more than 3% of consolidated revenues in each of the years ended December 31, 2012, 2013 and 2014. The Company recognizes revenue in accordance with ASC 605, “Revenue.” As the price is predetermined, all revenues are recognized at the time the delivery of service has occurred and collectability is reasonably assured which is based upon contract terms with healthcare providers and negotiated rates with third party payors and patients. The Company also records revenue from management services that it performs based upon management service contracts with predetermined pricing. Revenues from these services amounted to approximately 2% of total revenue for the three years ended December 31, 2012, 2013 and 2014. These revenues are recorded in the period in which the service is performed and collections of the billed amounts are reasonably assured in accordance with ASC 605.
Share-Based Payment ASC 718, “Compensation—Stock Compensation” requires that the fair value at the grant date resulting from all share-based payment transactions be recognized in the financial statements. Further, ASC 718 requires entities to apply a fair-value based measurement method in accounting for these transactions. This value is recorded over the vesting period. Under ASC 718, the Company records in its consolidated statements of operations and comprehensive income (loss), compensation cost for stock options and restricted stock awarded to its employees and non-affiliated directors.
Derivatives The Company accounts for derivative instruments and hedging activities in accordance with the provisions of ASC 815, “Derivatives and Hedging.” On the date the Company enters into a derivative contract, management may designate the derivative as a hedge of the identified exposure. The Company formally documents all relationships between hedging instruments and hedged items, as well as the risk-management objective and strategy for undertaking various hedge transactions. In this documentation, the Company specifically identifies the firm commitment or forecasted transaction that has been designated as a hedged item and states how the hedging instrument is expected to hedge the risks related to the hedged item. The Company formally measures effectiveness of its hedging relationships, both at the hedge inception and on an ongoing basis, in accordance with its risk management policy. The Company would discontinue hedge accounting prospectively (i) if it is determined that the derivative is no longer effective in offsetting the change in the cash flows of a hedged item, (ii) when the derivative expires or is sold, terminated or exercised, (iii) because it is probable that the forecasted transaction will not occur, (iv) because a hedged firm commitment no longer meets the definition of a firm commitment, or (v) if management determines that designation of the derivative as a hedge instrument is no longer appropriate. The Company’s derivatives are recorded on the balance sheet at their fair value. For derivatives accounted for as cash flow hedges, any unrealized gains or losses on fair
62
value are included in comprehensive income (loss), net of tax, assuming perfect effectiveness. Any ineffectiveness is recognized in earnings.
Income Taxes The provision for income taxes is determined in accordance with ASC 740, “Income Taxes.” Deferred tax assets and liabilities are determined based on the temporary differences between the financial reporting and tax bases of assets and liabilities, applying enacted statutory tax rates in effect for the year in which the differences are expected to reverse. Future income tax benefits are recognized only to the extent that the realization of such benefits is considered to be more likely than not. The Company regularly reviews its deferred tax assets for recoverability and establishes a valuation allowance, when it is more likely than not that such deferred tax assets will not be recoverable, based on historical taxable income, projected future taxable income, and the expected timing of the reversals of existing temporary differences.
Fair Values of Financial Instruments The carrying amount reported in the Consolidated Balance Sheets for cash and cash equivalents approximates fair value based on the short-term maturity of these instruments. The carrying amounts reported in the Consolidated Balance Sheets for accounts receivable and accounts payable approximate fair value based on the short-term nature of these accounts. The carrying amount reported in the Consolidated Balance Sheets for long-term debt under the Company’s Credit Agreement (as discussed in Note 5 of the Notes to the Consolidated Financial Statements) approximates fair value, as these borrowings have variable rates that reflect currently available terms, credit spreads and conditions for similar debt. As of December 31, 2014, the fair value of the Company’s equipment loans was equal to the carrying amount reported on the Consolidated Balance Sheets of $24,620 as of December 31, 2014. The fair value of the equipment loans was estimated using discounted cash flow analyses, based on the Company’s current borrowing rates for similar types of equipment loans.
Self-Insurance The Company has purchased large deductible insurance policies for its workers’ compensation, auto liability, general liability, and professional liability exposures. The Company currently retains the first $250 of loss for workers’ compensation and auto liability and $100 for general and professional liability.
The Company’s policy is to accrue amounts equal to the actuarially estimated costs to settle open claims of insureds, as well as an estimate of the cost of insured claims that have been incurred but not reported. The Company develops information about the size of the ultimate claims based on historical experience, current industry information and actuarial analysis, and evaluates the estimates for claim loss exposure on an annual basis. Assets and liabilities are are reported in gross amounts in other non-current assets and in current and non-current liabilities.
The Company believes that adequate provision has been made in the Financial Statements for these liabilities. The most significant assumptions used in the estimation process include determining the trend in costs, the expected cost of claims incurred but not reported and the expected costs to settle or pay damage awards with respect to unpaid claims. Recorded liabilities are based upon estimates, and while management believes that the estimates of loss are reasonable, the ultimate liability may be in excess of or less than the recorded amounts. Due to the inherent volatility of actuarially determined loss estimates, it is reasonably possible that the Company could experience changes in estimated losses that could be material to net income. If the Company’s actual liability exceeds its estimates of loss, its future earnings, cash flows and financial condition would be adversely affected.
Use of Estimates The preparation of consolidated financial statements in conformity with accounting principles generally accepted in the United States of America requires management to make estimates and assumptions that affect the amounts reported in the consolidated financial statements and accompanying notes. Actual results could differ from those estimates.
Comprehensive Income (Loss) The Company reports comprehensive income (loss) in accordance with ASC 220, “Comprehensive Income.” For the years ended December 31, 2012, 2013 and 2014, the Company has entered into multiple interest rate cap agreements and interest rate swap agreements, as discussed in Note 11 of the Notes to the Consolidated Financial Statements. Assuming perfect effectiveness, any unrealized gains and losses related to the swaps and caps that qualify for cash flow hedge accounting are classified as a component of comprehensive income (loss), net of any tax. Any ineffectiveness is recognized in earnings.
Segment Reporting In accordance with ASC 280, “Segment Reporting,” and based on the nature of the financial information that is received by the chief operating decision maker (“CODM”), the Company operates in two reportable segments, Imaging and Radiation Oncology. Each of these segments, on a stand-alone basis, provide and make available their respective medical services in similar settings, and operate within a singular regulatory environment. Further, management assesses our segment operations and each segments' degree of efficiency and performance based on this structure of financial reporting, and primarily makes operating decisions from these reportable segment results.
63
Recent Accounting Pronouncements — Income Taxes In July 2013, the Financial Accounting Standards Board ("FASB") issued Accounting Standards Update ("ASU") number 2013-11, "Income Taxes (Topic 740): Presentation of an Unrecognized Tax Benefit When a Net Operating Loss Carryforward, a Similar Tax Loss, or a Tax Credit Carryforward Exists - a consensus of the FASB Emerging Issues Task Force". ASU 2013-11 generally requires, with some exceptions, an entity to present its unrecognized tax benefits as it relates to its net operating loss carryforwards, similar tax losses, or tax credit carryforwards, as a reduction of deferred tax assets when settlement in this regard is available under the tax law of the applicable taxing jurisdiction as of the balance sheet reporting date. The adoption of ASU 2013-11 in 2014 did not affect the Company's results of operations, cash flows, or financial position.
Derivatives and Hedging In July 2013, the FASB issued ASU number 2013-10, “Derivatives and Hedging (Topic 815)— Inclusion of the Fed Funds Effective Swap Rate (or Overnight Index Swap Rate) as a Benchmark Interest Rate for Hedge Accounting Purposes.” ASU 2013-10 permits the use of the Fed Funds Effective Swap Rate as a U.S. benchmark interest rate for hedge accounting purposes. The ASU also removes the restriction on using different benchmark rates for similar hedges. ASU No. 2013-10 is effective for qualifying new or redesignated hedging relationships entered into on or after July 17, 2013. The adoption of ASU 2013-10 did not affect the Company's results of operations, cash flows, or financial position.
Discontinued Operations In April 2014, the FASB issued ASU number 2014-08, "Presentation of Financial Statements (Topic 205) and Property, Plant and Equipment (Topic 360): Reporting Discontinued Operations and Disclosures of Disposals of Components of an Entity," that raises the threshold for disposals to qualify as discontinued operations and allows companies to have significant continuing involvement with and continuing cash flows from or to the discontinued operation. It also requires additional disclosures for discontinued operations and new disclosures for individually material disposal transactions that do not meet the definition of a discontinued operation. This guidance will be effective for fiscal years beginning after December 15, 2014, and early adoption is permitted. The Company does not expect the adoption of the guidance will have a material impact on the Company's consolidated financial statements.
Revenue Recognition In May 2014, the FASB issued ASU number 2014-09, “Revenue from Contracts with Customers (Topic 606)" — to clarify and converge the revenue recognition principles under U.S. GAAP and International Financial Reporting Standards and to develop guidance that would streamline and enhance revenue recognition requirements while also providing a more robust framework for addressing revenue issues. ASU 2014-09 outlines a single comprehensive model for entities to use in accounting for revenue arising from contracts with customers and supersedes most current revenue recognition guidance, including industry specific guidance. Key provisions of the ASU involve a 5-step model specific to recognizing revenue derived from customer contracts. In addition, ASU 2014-09 provides implementation guidance on several other important topics, including the accounting for certain revenue-related costs. The adoption of ASU 2014-09 is effective for publicly traded business entities for annual reporting periods beginning after December 15, 2016, including interim reporting periods within that reporting period. Earlier application is not permitted. The Company is assessing the impact, if any, that the adoption of ASU 2014-09 may have on the Company's results of operations, cash flows, or financial position.
Going Concern In August 2014, the FASB issued ASU number 2014-15, "Presentation of Financial Statements—Going Concern (Subtopic 205-40)". Under U.S. GAAP, a going concern is presumed unless and until an entity’s liquidation becomes imminent. When an entity’s liquidation becomes imminent, financial statements should be prepared under the liquidation basis of accounting in accordance with Subtopic 205-30, "Presentation of Financial Statements—Liquidation Basis of Accounting." However, there may be conditions or events that raise substantial doubt about an entity’s ability to continue as a going concern, even if liquidation is not imminent. In those situations, financial statements should continue to be prepared under the going concern basis of accounting. ASU 2014-15 provides guidance about management’s responsibility to evaluate whether there is substantial doubt about an entity’s ability to continue as a going concern and to determine whether to disclose information about relevant conditions and events. ASU 2014-15 is effective for annual periods ending after December 15, 2016, and for annual periods and interim periods thereafter. Early application is permitted. The Company is assessing the impact, if any, that the adoption of ASU 2014-15 may have on the Company's results of operations, cash flows, or financial position.
3. Transactions
Disposition of Radiology 24/7, LLC and 24/7 Radiology
In the second quarter of 2010, the Company purchased a majority of the outstanding membership interests of Radiology 24/7, LLC (“RAD 24/7”), a teleradiology services company providing primarily final, subspecialty professional radiology interpretation services and outsourced staffing services for MRI, PET/CT, computed tomography ("CT"), mammography, X-Ray and other imaging modalities and also preliminary radiology interpretation services nationwide. In April 2011, RAD 24/7 purchased some of the assets from 24/7 Radiology (“24/7 RAD”), a professional radiology services company providing both
64
preliminary and final professional radiology interpretation services for MRI, CT, ultrasound, X-Ray and other imaging modalities.
In 2013, in accordance with ASC 350, the Company impaired its intangible assets related to its professional services business as a result of its decision that its professional radiology services business did not align with the long-term strategic direction of the Radiology Division, and divested of its professional radiology services business in the fourth quarter of 2013. This triggering event resulted in revaluing intangible assets related to the professional services business at $1,525 after recognizing an impairment charge of $5,107 related to the intangible assets in 2013. All other assets related to the divestiture of the professional services business were immaterial.
Restructuring Plan
On August 4, 2011, the Company’s board of directors approved a restructuring plan that included a significant organizational restructure and a cost savings and efficiency initiative. The Company initiated this restructuring plan in the third quarter of 2011. During the year ended December 31, 2012, the Company recorded $6,715 related to restructuring charges, of which the Company recorded $3,502 in Selling, general and administrative expenses; $2,226 in Severance and related costs; and $987 in Cost of revenues, excluding depreciation and amortization. As of December 31, 2012, substantially all restructuring reserves had been paid.
During the year ended December 31, 2013, the Company recorded $7,182 related to restructuring charges, of which the Company recorded $4,990 in Selling, general and administrative expenses; $1,658 in Severance and related costs; and $534 in Cost of revenues, excluding depreciation and amortization.
During the year ended December 31, 2014, the Company recorded $2,602 related to restructuring charges, of which the Company recorded $1,162 in Selling, general and administrative expenses; $180 in Severance and related costs; and $1,440 in Cost of revenues, excluding depreciation and amortization.
Amendment No. 2 to 2009 Credit Facility
On October 22, 2012, the Company and its lenders entered into Amendment No. 2 to the amended 2009 Credit Facility. In connection with the execution of Amendment No. 2, the Company raised $30,000 from the sale of certain imaging assets, which the Company then leased from purchasers under competitive terms. The $30,000 in proceeds from the sale and lease transactions was combined with $44,500 of cash on hand to make a total payment of $74,500 to permanently reduce borrowings outstanding under the term loan facility. The Company incurs $8,000 of annual rent payments in connection with the sale and lease transactions that extends through the end of 2016.
Senior Secured Term Loan Refinancing
On June 3, 2013, the Company replaced its existing credit facility with a new senior secured credit agreement with Credit Suisse AG, Cayman Islands Branch, as administrative agent, and the other lenders party thereto (the “Credit Agreement”). The Credit Agreement consists of (i) a $340,000, six-year term loan facility, (ii) a $50,000, five-year revolving loan facility, including a $20,000 sublimit for letters of credit, (iii) uncommitted incremental loan facilities of $100,000 of revolving or term loans, plus an additional amount if our pro forma leverage ratio is less than or equal to 3.25, subject to receipt of lender commitments and satisfaction of specified conditions, and (iv) an $80,000 delayed draw term loan facility, which was required to be drawn within thirty days of June 3, 2013 and used for the redemption of $80,000 in aggregate principal amount of the Company's $190,000 of 8% Senior Notes due 2016 (the “Notes”).
On July 3, 2013, the delayed draw term loan facility was utilized together with other available funds, of which the proceeds were used to redeem $80,000 of the Company's outstanding Notes. The delayed draw term loan facility converted into, and matched the terms of, the new $340,000 term loan facility. If any of the Notes remain outstanding on September 1, 2016, then the maturity date of all loans under the Credit Agreement will be September 1, 2016.
Borrowings under the Credit Agreement bear interest through maturity at a variable rate based upon, at the Company's option, either the London interbank offered rate ("LIBOR") or the base rate (which is the highest of the administrative agent’s prime rate, one-half of 1.00% in excess of the overnight federal funds rate, and 1.00% in excess of the one-month LIBOR rate), plus, in each case, an applicable margin. With respect to the term loan facilities, the applicable margin for LIBOR loans is 3.25% per annum, and with respect to the revolving loan facilities, the applicable margin for LIBOR loans ranges, based on the applicable leverage ratio, from 3.00% to 3.25% per annum, in each case, with a LIBOR floor of 1.00%. The applicable margin for base rate loans under the term loan facilities is 2.25% per annum and under the revolving loan facility ranges, based on the applicable leverage ratio, from 2.00% to 2.25% per annum. Prior to the refinancing of the term loan facilities, the applicable margin for base rate loans was 4.25% per annum and the applicable margin for revolving loans was 5.25% per annum, with a LIBOR floor of 2.00%. The Company is required to pay a commitment fee which ranges, based on the applicable leverage ratio, from 0.375% to 0.50% per annum on the undrawn portion available under the revolving loan facility and variable per annum fees with respect to outstanding letters of credit.
65
During the first five and three-quarter years after the closing date, and including the full amount of the delayed draw term loan facility, the Company was required to make quarterly amortization payments of the term loans in the amount of $1,050. The Company is also required to make mandatory prepayments of term loans under the Credit Agreement, subject to specified exceptions, from excess cash flow (as defined in the Credit Agreement), and with the proceeds of asset sales, debt issuances and specified other events.
Obligations under the Credit Agreement are guaranteed by substantially all the Company's direct and indirect domestic subsidiaries. The obligations under the Credit Agreement and the guarantees are secured by a lien on substantially all tangible and intangible property, and by a pledge of all of the shares of stock and limited liability company interests of the Company's direct and indirect domestic subsidiaries, of which the Company now owns or later acquires more than a 50% interest, subject to limited exceptions.
In addition to other covenants, the Credit Agreement places limits on the ability of the Company and its subsidiaries to declare dividends or redeem or repurchase capital stock, prepay, redeem or purchase debt, incur liens and engage in sale-leaseback transactions, make loans and investments, incur additional indebtedness, amend or otherwise alter debt and other material agreements, engage in mergers, acquisitions and asset sales, transact with affiliates and alter the business conducted by the Company and its subsidiaries.
The Credit Agreement also contains a leverage ratio covenant requiring the Company to maintain a maximum ratio of consolidated total debt to consolidated adjusted EBITDA expense that ranges from 4.95 to 1.00 to 4.30 to 1.00. At December 31, 2014, the Credit Agreement requires a maximum leverage ratio of not more than 4.90 to 1.00. The Credit Agreement eliminated the interest coverage ratio covenant which the Company was subject to maintain prior to the refinancing. Failure to comply with the covenants in the Credit Agreement could permit the lenders under the Credit Agreement to declare all amounts borrowed under the Credit Agreement, together with accrued interest and fees, to be immediately due and payable, and to terminate all commitments under the Credit Agreement.
As a result of the transaction, the Company recognized a loss on extinguishment totaling $17,069 resulting from the write-off of unamortized deferred financing costs and the discount related to the former credit facility. As of December 31, 2014, there was $480,669 outstanding under the term loan of the Credit Agreement and $2,000 borrowings under the new revolving credit facility. As of December 31, 2014, the Company’s ratio of consolidated total debt to Consolidated Adjusted EBITDA calculated pursuant to the Credit Agreement was 3.61 to 1.00.
8% Senior Notes Repurchase
On July 3, 2013, as a result of the Company's $80,000 redemption in principal amount of its Notes and pursuant to the terms of the indenture governing the Notes, the Company immediately incurred $1,522 of expense related to unamortized deferred costs and associated discount, as well as $3,200 for the related call premium.
In September 2013, the Company repurchased $8,772 in principal amount of its Notes in privately negotiated transactions. The Company immediately incurred $160 of expense related to unamortized deferred costs and associated discount, as well as $251 for the related call premium.
Incremental Term Loan
On October 11, 2013, the Company entered into an amendment to the Credit Agreement with Credit Suisse AG, Cayman Islands Branch, as administrative agent, and the other lenders party thereto (the “First Amendment”). Pursuant to the First Amendment, the Company raised $70,000 in incremental term loan commitments to repurchase the remaining Notes. On December 2, 2013, the Company borrowed $70,000 of incremental term loans, and with such proceeds plus borrowings under its revolving line of credit and cash on hand, completed the redemption of all of its outstanding Notes on December 4, 2013. With the completion of this transaction including the redemption in full of the Notes, the Company estimates savings of approximately $5,000 in cash interest on an annualized basis.
The incremental term loan was funded at 99.0% of principal amount and will mature on the same date as the existing term loan under the Company’s credit facility on June 3, 2019. Upon funding, the incremental term loans were converted to match all the terms of existing term loans. Interest on the incremental term loan is calculated, at the Company’s option, at a base rate plus a 2.25% margin or LIBOR plus a 3.25% margin, subject to a 1.00% LIBOR floor.
During the first five and one half years after the closing date for the incremental term loan, the quarterly amortization payments of all term loans under the credit facility has increased to $1,225 from the previous amount of $1,050.
The Company’s obligations under the incremental term loans are guaranteed by substantially all of the Company’s direct and indirect domestic subsidiaries. The obligations under the incremental term loan and the guarantees are secured by a lien on substantially all of the Company’s tangible and intangible property, and by a pledge of all of the shares of stock and limited
66
liability company interests of the Company’s direct and indirect domestic subsidiaries, of which the Company now owns or later acquires more than a 50% interest, subject to limited exceptions.
As a result of the transaction, the Company recognized a loss on extinguishment totaling $3,817 including $1,721 of expense related to unamortized deferred costs and associated discount, as well as $2,025 for the related call premium.
Acquisition of Charleston Area Radiation Therapy Centers
In November 2014, the Company invested $14,414, net of cash received, to acquire 50% equity in the formation of a joint venture between Charleston Area Medical Center ("CAMC") and Charleston Radiation Therapy Consultants, which will establish a new, state-of-the-art radiation therapy department at the CAMC Cancer Center that will utilize the latest in cancer technologies and treatments. In addition, Alliance Oncology has assumed full operational responsibility for the existing radiation oncology units at multiple locations in the Charleston, West Virginia area. In accordance with ASC 810, "Consolidation", the Company has determined that consolidation of this joint venture is appropriate. As a result of the Company's ability to consolidate the joint venture, it recorded goodwill of $6,889 and intangible assets of $21,747, of which $11,547 is attributed to the necessary Certificate of Need ("CON"). The goodwill recorded largely represents other intangible assets that do not qualify for separate recognition, including existing patients of the hospital and the solid record of patient care that CAMC has established in the local community.
The Company recognized revenues and net earnings of $1,768 and $899, respectively, in its 2014 Consolidated Statement of Operations and Comprehensive Income (Loss) and believes the revenues and expenses attributed to CAMC are immaterial to its 2014 consolidated results of operations, financial position, or cash flows..
4. Share-Based Payment
The Company has adopted ASC 718, “Compensation—Stock Compensation,” and has elected to follow the alternative transition method as described in ASC 718 for computing its beginning additional paid-in capital pool. In addition, the Company treats the tax deductions from stock options as being realized when they reduce taxes payable in accordance with the principles and timing under the relevant tax law.
Stock Option Plans and Awards
In November 1999, the Company adopted an employee stock option plan (as amended and restated, the “1999 Equity Plan”) pursuant to which options and awards with respect to a total of 2,205,000 shares have become available for grant. As of December 31, 2014, a total of 532,457 shares remained available for grant under the 1999 Equity Plan. Options are granted with exercise prices equal to the fair value of the Company’s common stock at the date of grant. All options have 10-year terms. Options granted after January 1, 2008 are typically time based and vest in equal traunches over three or four years. During the years ended December 31, 2013 and 2014, there were no options in which vesting was accelerated. Prior to January 1, 2008, stock options granted under the 1999 Equity Plan to employees were always time vesting options, which vest 5% in the first year, 20% in the second year and 25% in years three through five.
The Company uses the Black-Scholes option pricing model to value the compensation expense associated with share-based payment awards. The fair value of each option award is estimated on the date of grant using the Black-Scholes option pricing model using the assumptions presented in the table below. In addition, forfeitures are estimated when recognizing compensation expense and the estimate of forfeitures will be adjusted over the requisite service period to the extent that actual forfeitures differ, or are expected to differ, from such estimates. Changes in estimated forfeitures will be recognized through a cumulative catch-up adjustment in the period of change and will also impact the amount of compensation expense to be recognized in future periods.
The following weighted average assumptions were used in the estimated grant date fair value calculations for stock option awards:
Year Ended December 31, | ||||||||
2012 | 2013 | 2014 | ||||||
Risk free interest rate | 0.97 | % | 1.52 | % | 1.83 | % | ||
Expected dividend yield | — | % | — | % | — | % | ||
Expected stock price volatility | 62.4 | % | 65.1 | % | 66.3 | % | ||
Average expected life (in years) | 6.01 | 6.00 | 6.00 | |||||
67
Through March 31, 2012, the expected stock price volatility rates are based on the historical volatility of the Company’s common stock and peer implied volatility. The average expected life, representing the weighted-average period of time that options or awards granted are expected to be outstanding, is calculated using the simplified method described in ASC 718, as the Company did not have sufficient historical exercise data to provide a reasonable basis upon which to estimate the expected terms and experienced a change in the types of employees that receive share grants. Beginning with the second quarter of 2012, the Company changed its calculation methodology for its stock price volatility and average expected life, which are now based on its own historical data. The risk free interest rates have been, and continue to be, based on the United States Treasury yield curve in effect at the time of grant for periods corresponding with the expected life of the option or award.
The following table summarizes the Company’s stock option activity:
Number of Shares | Weighted- Average Exercise Price | Weighted- Average Remaining Contractual Term | Aggregate Intrinsic Value | |||||||||
Outstanding at January 1, 2012 | 730,416 | $ | 32.16 | |||||||||
Granted | 487,500 | $ | 5.54 | |||||||||
Exercised | — | — | ||||||||||
Canceled | (450,420 | ) | $ | 26.36 | ||||||||
Outstanding at December 31, 2012 | 767,496 | $ | 18.57 | |||||||||
Granted | 156,302 | $ | 23.83 | |||||||||
Exercised | (31,679 | ) | $ | 16.85 | ||||||||
Canceled | (88,502 | ) | $ | 31.80 | ||||||||
Outstanding at December 31, 2013 | 803,617 | $ | 20.83 | |||||||||
Granted | 47,323 | $ | 28.97 | |||||||||
Exercised | (72,794 | ) | $ | 6.31 | ||||||||
Canceled | (144,248 | ) | $ | 14.00 | ||||||||
Outstanding at December 31, 2014 | 633,898 | $ | 21.39 | 5.79 | $ | 4,163 | ||||||
Vested and expected to vest in the future at December 31, 2014 | 619,569 | $ | 21.36 | 5.81 | $ | 4,117 | ||||||
Exercisable at December 31, 2014 | 435,999 | $ | 21.85 | 5.20 | $ | 3,115 | ||||||
The following table summarizes information about all the stock options outstanding at December 31, 2014:
Options Outstanding | Exercise Price Range | Remaining Contractual Term | Options Exercisable | Exercise Price | ||||||||||||
100,000 | $4.85 | – | $4.93 | 7.42 | 100,000 | $ | 4.85 | |||||||||
64,334 | $4.94 | – | $5.70 | 7.09 | 40,000 | $ | 5.70 | |||||||||
84,002 | $5.96 | – | $6.29 | 7.01 | 52,669 | $ | 6.20 | |||||||||
56,196 | $6.30 | – | $23.60 | 4.29 | 30,940 | $ | 17.41 | |||||||||
77,340 | $23.61 | – | $28.63 | 3.38 | 75,800 | $ | 28.22 | |||||||||
33,074 | $28.64 | – | $28.92 | 9.08 | 0 | |||||||||||
102,952 | $28.93 | – | $30.27 | 8.75 | 20,590 | $ | 29.14 | |||||||||
24,800 | $30.28 | – | $39.92 | 2.09 | 24,800 | $ | 36.86 | |||||||||
47,800 | $39.93 | – | $41.58 | 4.01 | 47,800 | $ | 40.30 | |||||||||
43,400 | $41.59 | – | $61.75 | 1.40 | 43,400 | $ | 54.60 | |||||||||
633,898 | $4.85 | – | $61.75 | 5.20 | 435,999 | $ | 21.85 | |||||||||
The weighted average grant date fair value of options granted during the years ended December 31, 2012, 2013 and 2014 was $3.15 per share, $14.17 per share and $17.56 per share, respectively. There were no options exercised during 2012. The total intrinsic value of options exercised during the year ended December 31, 2013 was $204. The total intrinsic value of options exercised during the year ended December 31, 2014 was $1,630. The total cash received from employees as a result of stock option exercises was $527 and $466 for the years ended December 31, 2013 and 2014, respectively.
68
The following table summarizes the Company’s unvested stock option activity:
Shares | Weighted-Average Grant-Date Fair Value | |||||
Unvested at December 31, 2013 | 376,024 | $ | 8.10 | |||
Granted | 47,323 | 17.56 | ||||
Vested | (105,244 | ) | 7.95 | |||
Canceled | (120,204 | ) | 4.85 | |||
Unvested at December 31, 2014 | 197,899 | $ | 12.13 | |||
At December 31, 2014, the total unrecognized fair value share-based payment related to unvested stock options granted to both employees and non-employees was $1,612, which is expected to be recognized over a remaining weighted-average period of 2.12 years. The valuation model applied in this calculation utilizes highly subjective assumptions that could potentially change over time, including the expected forfeiture rate and performance targets. Therefore, the amount of unrecognized share-based payment noted above does not necessarily represent the value that will ultimately be realized by the Company in the Consolidated Statements of Operations and Comprehensive Income (loss). The total fair value of shares vested during the years ended December 31, 2012, 2013 and 2014 was $1,546, $1,064 and $837, respectively.
Stock Awards
The 1999 Equity Plan, as amended and restated, permits the award of restricted stock, restricted stock units, stock bonus awards and performance-based stock awards (collectively referred to as “stock awards”). During 2011, awards to certain employees of the Company either cliff vest after one year, or three years, provided that the employee remains continuously employed through the issuance date, or cliff vest after one year provided that the employee meets certain performance criteria and remains continuously employed through the issuance date. During 2012, awards to certain employees either cliff vest after one year, or vest annually in 33.3% increments over three years. During 2013, awards to certain employees vested immediately upon the date of grant, or cliff vest after one year provided that the employee remains continuously employed through the issuance date. There were no stock awards granted to employees in 2014.
For the year ended December 31, 2012, the Company recorded share-based payment related to stock awards of $(601). The expense reversal in 2012 was mostly due to the forfeiture of 85,000 unvested shares granted in 2010 to two now-former executive officers. Prior to the forfeiture of the grants, total expense recorded was $1,675, which all reversed during 2012. For the year ended December 31, 2013, the Company recorded share-based payment related to stock awards of $562. For the year ended December 31, 2014, the Company recorded share-based payment related to stock awards of $1,515.
Twenty-five thousand restricted stock units ("RSU") were granted to executive management in the third quarter of 2014, which vest based upon achieving certain market performance conditions. Specifically, the Company's closing stock price per common share must equal or exceed a value of $40.00 per share for 10 consecutive days between the dates of January 1, 2015 and April 21, 2017. If these conditions are not achieved before April 21, 2017, these RSUs will expire. In accordance with ASC 718, expense related to restricted stock units that vest based on achieving a market condition should not be recognized until the derived vesting period has been met, and at such time the derived vesting period becomes the requisite service period. Since the market condition is only able to be achieved on or after January 1, 2015, the derived service period has not yet began as of September 30, 2014. Based on this guidance, the Company has not recognized any expense related to these RSUs during the nine months ended September 30, 2014.
The following table summarizes the Company’s unvested restricted stock activity:
69
Shares | Weighted-Average Grant-Date Fair Value | |||||
Unvested at December 31, 2011 | 273,308 | |||||
Granted to employees | 38,075 | |||||
Granted to non-employee directors | 19,469 | |||||
Vested | (119,968 | ) | ||||
Canceled | (106,340 | ) | ||||
Unvested at December 31, 2012 | 104,544 | |||||
Granted to employees | 14,100 | |||||
Granted to non-employee directors | 13,619 | |||||
Vested | (54,038 | ) | ||||
Canceled | (7,334 | ) | ||||
Unvested at December 31, 2013 | 70,891 | $ | 7.01 | |||
Granted to employees | — | $ | — | |||
Granted to non-employee directors | 32,959 | $ | 20.99 | |||
Vested | (44,619 | ) | $ | 28.62 | ||
Canceled | (26,272 | ) | $ | 6.36 | ||
Unvested at December 31, 2014 | 32,959 | $ | 20.99 | |||
At December 31, 2014, the total unrecognized fair value share-based payment related to stock awards granted to unaffiliated directors was $692, which is expected to be recognized over a remaining weighted-average period of 1.00 year. At December 31, 2014, there was no unrecognized fair value share-based payment related to stock awards granted to employees. The unaffiliated directors, excluding the Chairman of the Board, each receive a restricted stock award on December 31, 2014 and each December 31 thereafter (the “Grant Date”) of the number of shares of common stock having a value equal to $140, rounded down to the nearest whole share, and calculated using the average share price of the Company’s stock over the 15-day period preceding the Grant Date. Such restricted stock awards fully vest one year after the Grant Date based on the continued service of the non-employee director through the vesting date. The Chairman of the Board, Mr. Buckelew, is entitled to restricted stock having a value equal $138 as compensation for a service period of one year, for the 24 month period following his resignation as the Company's CEO. The number of shares of common stock Mr. Buckelew receives has a value equal to $138, rounded down to the nearest whole share, and is calculated using the closing share price of the Company’s stock on December 31. The valuation model applied in this calculation utilizes highly subjective assumptions that could potentially change over time, including the expected forfeiture rate. Therefore, the amount of unrecognized share-based payment noted above does not necessarily represent the amount that will ultimately be realized by the Company in the Consolidated Statements of Operations and Comprehensive (loss).
Directors' Compensation Program
In 2012 and 2013, under the compensation program for non-employee directors in effect during 2012 and 2013, non-employee directors earned an annual fee of $40 for their services as directors. In addition, each Unaffiliated Director (board members who are not affiliated with Oaktree or MTS) received a restricted stock unit award on December 31, 2012 and 2013 for the number of shares of the Company's Common Stock having a value equal to $40, using the average share price of the Company's Common Stock over the 15-day period preceding the grant date. These restricted stock unit awards vest on the first anniversary of their respective date of grant contingent upon the Unaffiliated Directors continued service to the Company through that date. In addition, each Unaffiliated Director received additional annual cash compensation of $40, paid in equal quarterly installments, for serving on the Board during 2012 and 2013. Beginning October 1, 2013, the Chairman of the Board, Mr. Buckelew, is entitled to restricted stock units having a value equal $138 as compensation for each service period of one year, for the 24 month period following his resignation as the Company's CEO. The number of units Mr. Buckelew receives has a value equal to $138, divided by the closing share price of the Company’s stock on December 31, rounded down to the nearest whole share. On December 31, 2012 and 2013, each Oaktree/MTS Director, who are considered affiliated directors, received additional cash compensation of $80, for serving on the Board during 2013. Also during 2012 and 2013, non-employee directors who served as members of our Audit Committee received an additional $15, and the non-employee director who served as Chairman of the Audit Committee received an additional $30. In 2012 and 2013, non-employee directors who served as members of the Nominating Committee, Compensation Committee and Strategy & Finance Committee received an
70
additional $5, and the non-employee director who served as Chairman of the Strategy and Finance Committee received an additional $25. In 2012 and 2013, non-employee directors were reimbursed for travel expenses related to their Board service.
In 2014, under the revised compensation program for non-employee directors in effect during 2014, non-employee directors earned an annual fee of $40 for their services as directors. In addition, each Unaffiliated Director will receive a restricted stock unit award on December 31 for the number of shares of our Common Stock having a value equal to $140, using the average share price of our Common Stock over the 15-day period preceding the grant date. These restricted stock unit awards vest on the first anniversary of their respective date of grant contingent upon the Unaffiliated Director's continued service to the Company through that date. In addition to the annual $40 fee for all non-employee directors, each Affiliated Director receives additional annual cash compensation of $140, paid in one annual installment, for serving on the Board during 2014. The Chairman of the Board and other committee chairs' and members' compensation program remains unaltered from the above discussion.
For the years ended December 31, 2012, 2013 and 2014 the Company recorded director fees of $490, $634, and $1,695, respectively. For cash payment elections of Phantom Shares in the Director Deferred Compensation Plan, an increase (decrease) to other accrued liabilities is recorded for the difference between the current fair market value and the original issuance price of the Phantom Shares. For the issuance of common stock elections of Phantom Shares, an increase is made to APIC when director's fees are recorded. All cash elections are accrued in other accrued liabilities until payment is due and payable. At December 31, 2013 and 2014, $268 and $268, respectively, was included in other accrued liabilities relating to the Director Deferred Compensation Plan.
5. Fair Value of Financial Instruments
The Company used the following methods and assumptions in estimating fair value disclosure for financial instruments:
Cash and cash equivalents The carrying amounts reported in the Consolidated Balance Sheets approximate fair value due to the short-term maturity or variable rates of these instruments.
Debt The carrying amount of variable-rate borrowings at December 31, 2013 and 2014 approximates fair value estimates based on current market rates and credit spreads for similar debt instruments.
Derivative instruments Fair value was determined based on the income approach and standard valuation techniques to convert future amounts to a single present amount and approximates the net gains and losses that would have been realized if the contracts had been settled at each period-end.
The estimated fair values of the Company’s financial instruments are as follows:
As of December 31, | |||||||||||||||
2013 | 2014 | ||||||||||||||
Carrying Value | Fair Value | Carrying Value | Fair Value | ||||||||||||
Cash and cash equivalents | $ | 34,702 | $ | 34,702 | $ | 33,033 | $ | 33,033 | |||||||
Fixed-rate debt | 25,552 | 25,552 | 13,015 | 13,878 | |||||||||||
Variable-rate debt | 504,122 | 504,122 | 494,274 | 494,354 | |||||||||||
Derivative instruments - asset position | 811 | 811 | 228 | 228 | |||||||||||
Derivative instruments - liability position | 104 | 104 | 46 | 46 | |||||||||||
ASC 820, “Fair Value Measurement,” applies to all assets and liabilities that are being measured and reported at fair value on a recurring basis. ASC 820 requires disclosure that establishes a framework for measuring fair value in generally accepted accounting principles by establishing a hierarchy for ranking the quality and reliability of the information used to determine fair values. The statement requires that assets and liabilities carried at fair value will be classified and disclosed in one of the following three categories:
Level 1 | Quoted market prices in active markets for identical assets or liabilities. | |
Level 2 | Observable market based inputs or unobservable inputs, including identical securities in inactive markets or similar securities in active markets that are corroborated by market data. | |
Level 3 | Unobservable inputs that are not corroborated by market data. | |
None of the Company’s instruments has transferred from one level to another.
71
The following table summarizes the valuation of the Company’s financial instruments that are reported at fair value on a recurring basis by the above ASC 820 pricing levels as of December 31, 2013:
Total | Quoted market prices in active markets (Level 1) | Significant other observable inputs (Level 2) | Significant unobservable inputs (Level 3) | ||||||||||||
Cash and cash equivalents | $ | 34,702 | $ | 34,702 | $ | — | $ | — | |||||||
Interest rate contracts - asset position | 811 | 811 | |||||||||||||
Interest rate contracts - liability position | 104 | — | 104 | — | |||||||||||
The following table summarizes the valuation of the Company’s financial instruments that are reported at fair value on a recurring basis by the above ASC 820 pricing levels as of December 31, 2014:
Total | Quoted market prices in active markets (Level 1) | Significant other observable inputs (Level 2) | Significant unobservable inputs (Level 3) | ||||||||||||
Cash and cash equivalents | $ | 33,033 | $ | 33,033 | $ | — | $ | — | |||||||
Interest rate contracts - asset position | 228 | 228 | |||||||||||||
Interest rate contracts - liability position | 46 | — | 46 | — | |||||||||||
The Company’s derivative instruments are primarily pay-fixed, receive-variable interest rate swaps and caps based on the LIBOR swap rate. The Company has elected to use the income approach to value these derivatives, using observable Level 2 market expectations at measurement date and standard valuation techniques to convert future amounts to a single present amount assuming that participants are motivated, but not compelled to transact. Level 2 inputs for interest rate swap and cap valuations are limited to quoted prices for similar assets or liabilities in active markets (specifically futures contracts on LIBOR for the first two years) and inputs other than quoted prices that are observable for the asset or liability (specifically LIBOR cash and swap rates at commonly quoted intervals and implied volatilities for options). ASC 820, “Fair Value Measurement,” states that the fair value measurement of an asset or liability must reflect the nonperformance risk of the entity and the counterparty. Therefore, the impact of the counterparty’s creditworthiness and the Company’s creditworthiness has also been factored into the fair value measurement of the derivative instruments. For additional information please see Note 9 of the Notes to the Consolidated Financial Statements.
Disclosures for Non-Financial Assets Measured at Fair Value on a Non-Recurring Basis
The Company also measures the fair value of certain assets on a non-recurring basis, generally on an annual basis, or when events or changes in circumstances indicate that the carrying amount of the assets may not be recoverable. These assets include goodwill, intangible assets, long-lived assets and investments in unconsolidated investees.
For the year ended December 31, 2012, the Company performed its annual impairment test in the fourth quarter and concluded that it was not necessary to record asset impairment charges related to goodwill, long-lived assets, or definite and indefinite lived intangibles.
In the third quarter of 2013, in accordance with ASC 350, “Intangibles—Goodwill and Other,” the Company recorded an impairment charge of $4,529 related to the closure of an imaging site location in August 2013, which was originally purchased in a group of assets acquired in 2007. Upon acquisition, the Company recorded both tangible and intangible assets including physician referral networks, non-compete agreements, certificates of need and goodwill. In late 2012, the term of a non-compete agreement ended causing a decline in revenue, ultimately resulting in the imaging site closure. Based on this triggering event, the Company deemed it appropriate to perform a valuation analysis of the remaining intangible assets related to the original acquisition. The Company applied the excess earnings method under the income approach to value the physician referral networks, and applied the beneficial earnings method under the income approach, and the guideline transaction method under the market approach to value the certificates of need. The Company categorized this fair value determination as Level 3 (unobservable) in the fair value hierarchy.
In 2013, in accordance with ASC 350, the Company impaired its intangible assets related to its professional services business as a result of its decision that its professional radiology services business did not align with the long-term strategic direction of the Radiology Division, and divested of its professional radiology services business in the fourth quarter of 2013. This triggering event resulted in revaluing intangible assets related to the professional services business at $1,525 after recognizing an impairment charge of approximately $5,107 related to the intangible assets in 2013. The Company based the carrying value of these intangible assets on the selling price (categorized as Level 3 in the fair value hierarchy) the Company
72
received in the sale transaction for the assets related to its professional services business. All other assets related to the divestiture of the professional services business were immaterial.
In the fourth quarter of 2013, in accordance with ASC 350, the Company recorded an impairment charge related to the pending expiration of one of its non-compete agreements with the affiliated oncology physician. Negotiation efforts to renew the non-compete agreement were unsuccessful, and the Company appropriately revalued all intangible assets specifically related to the single location originally purchased with a group of assets in 2011. The impairment charge totaled $3,395 comprised of assets including a physicians' referral network, trademarks, and professional services agreement, which were all written down to zero value.The Company categorized this fair value determination as Level 3 (unobservable) in the fair value hierarchy.
For the year ended December 31, 2013, the Company recorded total impairment charges of $13,031, comprised of $10,031 related to definite lived intangible assets and $3,000 related to indefinite lived intangible assets. For further discussion related to impairment charges taken in 2013, see Note 6 of the Notes to the Consolidated Financial Statements.
For the year ended December 31, 2014, in accordance with ASC 350, the Company performed its annual impairment test in the fourth quarter for goodwill and intangible assets with indefinite lives, using financial information as of September 30, 2014. From this analysis, the Company concluded that no impairment was present in its long-lived assets or intangible assets with definite useful lives. Additionally, impairment charges totaling $308 were recorded in 2014 primarily due to the write off of the Company's equity investment in the oncology site location upon the site's closure in 2014.
In November 2014, the Company invested $14,414, net of cash received, to acquire 50% equity in the formation of a joint venture between CAMC and Charleston Radiation Therapy Consultants. As a result of the Company's ability to consolidate the joint venture, it recorded goodwill of $6,889 and intangible assets of $21,747, of which $11,547 is attributed to the necessary Certificate of Need ("CON") and $10,200 for the value of its trademarks and service agreement.
6. Impairment Charges
In 2012, in accordance with ASC 350, the Company performed its annual impairment test in the fourth quarter for goodwill and intangible assets with indefinite lives, using financial information as of September 30, 2012. The Company concluded that no impairment was present in its long-lived assets or intangible assets with definite useful lives.
In the third quarter of 2013, in accordance with ASC 350, the Company recorded an impairment charge of $4,529 to revalue intangible assets to an estimated fair value of $7,458 related to the closure of an imaging site location in August 2013, which was originally purchased in a group of assets acquired in 2007. Upon acquisition, the Company recorded both tangible and intangible assets including physician referral networks, non-compete agreements, certificates of need and goodwill. In late 2012, the term of a non-compete agreement ended causing a decline in revenue, ultimately resulting in the imaging site closure. Based on this triggering event, the Company deemed it appropriate to perform a valuation analysis of the remaining intangible assets related to the original acquisition. Based on current year performance to project revenues and earnings to estimate future cash flows, the Company applied the excess earnings method under the income approach to value the physician referral networks, and applied the beneficial earnings method under the income approach. The guideline transaction method under the market approach was used to value the certificates of need. The Company categorized this fair value determination as Level 3 (unobservable) in the fair value hierarchy, as described in Note 5 of the Notes to the Consolidated Financial Statements.
In 2013, in accordance with ASC 350, the Company impaired its intangible assets related to its professional services business as a result of its decision that its professional radiology services business did not align with the long-term strategic direction of the Radiology Division, and divested of its professional radiology services business in the fourth quarter of 2013. This triggering event resulted in revaluing intangible assets related to the professional services business at $1,525 after recognizing an impairment charge of approximately $5,107 related to the intangible assets in 2013. The Company based the carrying value of these intangible assets on the selling price (categorized as Level 3 in the fair value hierarchy, as described in Note 5) the Company received in the sale transaction for the assets related to its professional services business. All other assets related to the divestiture of the professional services business were immaterial.
In the fourth quarter of 2013, in accordance with ASC 350, the Company recorded an impairment charge related to the pending expiration of one of its non-compete agreements with the affiliated oncology physician. Negotiation efforts to renew the non-compete agreement were unsuccessful, and the Company appropriately revalued all intangible assets specifically related to the single location originally purchased with a group of assets in 2011. The impairment charge totaled $3,395 comprised of assets including a physicians' referral network, trademarks, and professional services agreement, which were all
73
written down to zero value. The Company categorized this fair value determination as Level 3 (unobservable) in the fair value hierarchy, as described in Note 5 of the Notes to the Consolidated Financial Statements.
For the year ended December 31, 2014, in accordance with ASC 350, the Company performed its annual impairment test in the fourth quarter for goodwill and intangible assets with indefinite lives, using financial information as of September 30, 2014. From this analysis, the Company concluded that no impairment was present in its long-lived assets or intangible assets with definite useful lives. Additionally, impairment charges totaling $308 were recorded in 2014 primarily due to the write off of the Company's equity investment in an oncology site location upon the site's closure in 2014.
7. Goodwill and Intangible Assets
Changes in the carrying amount of goodwill are as follows:
Balance at January 1, 2013 | $ | 56,493 | |
Goodwill acquired during the period | — | ||
Impairment charges | — | ||
Adjustments to goodwill during the period | 482 | ||
Balance at December 31, 2013 | 56,975 | ||
Goodwill acquired during the period | 6,889 | ||
Impairment charges | — | ||
Adjustments to goodwill during the period | — | ||
Balance at December 31, 2014 | $ | 63,864 | |
Gross goodwill | $ | 238,108 | |
Accumulated impairment charges | (174,244 | ) | |
Balance at December 31, 2014 | $ | 63,864 | |
Intangible assets consisted of the following:
December 31, 2013 | December 31, 2014 | ||||||||||||||||||||||
Gross Carrying Amount | Accumulated Amortization | Intangible Assets, net | Gross Carrying Amount | Accumulated Amortization | Intangible Assets, net | ||||||||||||||||||
Amortizing intangible assets: | |||||||||||||||||||||||
Customer contracts | $ | 152,629 | $ | (86,584 | ) | $ | 66,045 | $ | 162,089 | $ | (93,617 | ) | $ | 68,472 | |||||||||
Other | 26,197 | (20,868 | ) | 5,329 | 26,241 | (21,758 | ) | 4,483 | |||||||||||||||
Total amortizing intangible assets | $ | 178,826 | $ | (107,452 | ) | $ | 71,374 | $ | 188,330 | $ | (115,375 | ) | $ | 72,955 | |||||||||
Intangible assets not subject to amortization | 30,427 | 42,975 | |||||||||||||||||||||
Total other intangible assets | $ | 101,801 | $ | 115,930 | |||||||||||||||||||
The Company uses the estimated useful life to amortize customer contracts, which is a weighted-average of 15 years. Other intangible assets subject to amortization are estimated to have a weighted-average useful life of six years. Amortization expense for intangible assets subject to amortization was $10,973 and $7,880 for the years ended December 31, 2013 and 2014, respectively. The intangible assets not subject to amortization represent certificates of need and regulatory authority rights which have indefinite useful lives.
Estimated annual amortization expense for each of the fiscal years ending December 31, is presented below:
2015 | 7,676 | |
2016 | 6,674 | |
2017 | 6,236 | |
2018 | 5,875 | |
2019 | 5,391 | |
Thereafter | 41,103 | |
74
8. Other Accrued Liabilities
Other accrued liabilities consisted of the following:
December 31, 2013 | December 31, 2014 | ||||||
Accrued systems rental and maintenance costs | $ | 1,488 | $ | 1,586 | |||
Accrued site rental fees | 999 | 992 | |||||
Accrued property and sales taxes payable | 10,253 | 9,276 | |||||
Accrued self-insurance expense | 1,635 | 2,276 | |||||
Deferred gain on sale of equipment | 319 | 312 | |||||
Other accrued expenses | 7,308 | 12,100 | |||||
Total | $ | 22,002 | $ | 26,542 | |||
9. Long-Term Debt and Senior Subordinated Credit Facility
Long-term debt consisted of the following:
December 31, 2013 | December 31, 2014 | ||||||
Term loan facility | $ | 487,725 | $ | 482,825 | |||
Discount on term loan facility | (2,603 | ) | (2,156 | ) | |||
Revolving credit facility | 19,000 | 2,000 | |||||
Equipment debt | 25,552 | 24,620 | |||||
Long-term debt, including current portion | 529,674 | 507,289 | |||||
Less current portion | 15,066 | 15,512 | |||||
Long-term debt | $ | 514,608 | $ | 491,777 | |||
2009 Credit Facility
In December 2009, the Company entered into a senior secured credit agreement (the "2009 Credit Facility") comprised of a $460,000 term loan ("the 2009 Term Loan") maturing in June 2016 and a $120,000 revolving facility maturing in December 2014. The Company used the proceeds to retire $351,600 of its previous term loan. Borrowings under the 2009 Term Loan were issued at 98.0% of par, with the discount to par being amortized to interest expense and other, net through the maturity date of the loan.
On September 27, 2011, the Company entered into Amendment No. 1 to the 2009 Credit Facility increasing the Company's quarterly amortization payments on the term loan facility and the Company's annual excess cash flow sweep percentage. Additionally, the Company agreed to an increase in margins on its borrowings under the amended 2009 Credit Facility. On October 22, 2012, the Company and its lenders entered into Amendment No. 2 to the amended 2009 Credit Facility. The minimum ratio of consolidated Adjusted EBITDA less minority interest expense to consolidated interest expense was unchanged.
In connection with the execution of Amendment No. 2, the Company raised $30,000 from the sale of certain imaging assets, which the Company then leased from purchasers under competitive terms. The $30,000 in proceeds from the sale and lease transactions, was combined with $44,500 of cash on hand to make a total payment of $74,500 to permanently reduce borrowings outstanding under the amended 2009 Term Loan.
8% Senior Notes In December 2009, the Company completed a cash tender offer (the “2009 Tender Offer”) for any and all of its outstanding 71/4% Notes issued in December of 2004, and issued $190,000 of 8.0% senior notes due in 2016 in a transaction that was exempt from the registration requirements of the Securities Act of 1933, as amended. The Company used the proceeds from this transaction, its term loan facility and existing cash to complete the 2009 Tender Offer. The Notes were issued at 98.7% of par, with the discount to par being amortized to interest expense and other, net through the maturity date of the notes.
Senior Secured Term Loan Refinancing
75
On June 3, 2013, the Company replaced its existing credit facility with a new senior secured credit agreement with Credit Suisse AG, Cayman Islands Branch, as administrative agent, and the other lenders party thereto (the “Credit Agreement”). The Credit Agreement consists of (i) a $340,000, six-year term loan facility, (ii) a $50,000, five-year revolving loan facility, including a $20,000 sublimit for letters of credit, (iii) uncommitted incremental loan facilities of $100,000 of revolving or term loans, plus an additional amount if our pro forma leverage ratio is less than or equal to 3.25, subject to receipt of lender commitments and satisfaction of specified conditions, and (iv) an $80,000 delayed draw term loan facility, which was required to be drawn within thirty days of June 3, 2013 and used for the redemption of the Company's $190,000 of Notes.
On July 3, 2013 the delayed draw term loan facility was utilized, of which the proceeds were used to redeem $80,000 in aggregate principal amount of the Company's outstanding 8% Senior Notes that were originally issued in December 2009 as a cash tender offer for any and all of its outstanding 71/4% Notes originally issued in December of 2004. The delayed draw term loan facility converted into, and matched the terms of, the new $340,000 term loan facility. If any of the Notes remain outstanding on September 1, 2016, then the maturity date of all loans under the Credit Agreement will be September 1, 2016.
Borrowings under the Credit Agreement bear interest through maturity at a variable rate based upon, at the Company's option, either the LIBOR or the base rate (which is the highest of the administrative agent’s prime rate, one-half of 1.00% in excess of the overnight federal funds rate, and 1.00% in excess of the one-month LIBOR rate), plus, in each case, an applicable margin. With respect to the term loan facilities, the applicable margin for LIBOR loans is 3.25% per annum, and with respect to the revolving loan facilities, the applicable margin for LIBOR loans ranges, based on the applicable leverage ratio, from 3.00% to 3.25% per annum, in each case, with a LIBOR floor of 1.00%. The applicable margin for base rate loans under the term loan facilities is 2.25% per annum and under the revolving loan facility ranges, based on the applicable leverage ratio, from 2.00% to 2.25% per annum. Prior to the refinancing of the term loan facilities, the applicable margin for base rate loans was 4.25% per annum and the applicable margin for revolving loans was 5.25% per annum, with a LIBOR floor of 2.00%. The Company is required to pay a commitment fee which ranges, based on the applicable leverage ratio, from 0.375% to 0.50% per annum on the undrawn portion available under the revolving loan facility and variable per annum fees with respect to outstanding letters of credit.
During the first five and three-quarter years after the closing date, and including the full amount of the delayed draw term loan facility, the Company will be required to make quarterly amortization payments of the term loans in the amount of $1,050. The Company is also required to make mandatory prepayments of term loans under the Credit Agreement, subject to specified exceptions, from excess cash flow (as defined in the Credit Agreement), and with the proceeds of asset sales, debt issuances and specified other events.
Obligations under the Credit Agreement are guaranteed by substantially all the Company's direct and indirect domestic subsidiaries. The obligations under the Credit Agreement and the guarantees are secured by a lien on substantially all tangible and intangible property, and by a pledge of all of the shares of stock and limited liability company interests of the Company's direct and indirect domestic subsidiaries, of which the Company now owns or later acquires more than a 50% interest, subject to limited exceptions.
In addition to other covenants, the Credit Agreement places limits on the ability of the Company and its subsidiaries to declare dividends or redeem or repurchase capital stock, prepay, redeem or purchase debt, incur liens and engage in sale-leaseback transactions, make loans and investments, incur additional indebtedness, amend or otherwise alter debt and other material agreements, engage in mergers, acquisitions and asset sales, transact with affiliates and alter the business conducted by the Company and its subsidiaries.
The Credit Agreement also contains a leverage ratio covenant requiring the Company to maintain a maximum ratio of consolidated total debt to consolidated adjusted EBITDA expense that ranges from 4.95 to 1.00 to 4.30 to 1.00. At December 31, 2014, the Credit Agreement requires a maximum leverage ratio of not more than 4.90 to 1.00. The Credit Agreement eliminated the interest coverage ratio covenant which the Company was subject to maintain prior to the refinancing. Failure to comply with the covenants in the Credit Agreement could permit the lenders under the Credit Agreement to declare all amounts borrowed under the Credit Agreement, together with accrued interest and fees, to be immediately due and payable, and to terminate all commitments under the Credit Agreement.
As a result of the debt refinancing transaction, the Company recognized a loss on extinguishment totaling $17,069 resulting from the write-off of unamortized deferred financing costs and the discount related to the former credit facility.
As of December 31, 2013, there was $485,122 outstanding under the term loan facility, $19,000 in borrowings under the new revolving credit facility, and $4,901 letters of credit outstanding. As of December 31, 2013, the Company’s ratio of consolidated total debt to Consolidated Adjusted EBITDA calculated pursuant to the Credit Agreement was 3.59 to 1.00.
8% Senior Notes Repurchase
76
On July 3, 2013, as a result of the Company's $80,000 redemption in principal amount of its Notes and pursuant to the terms of the indenture governing the Notes, the Company immediately incurred $1,522 of expense related to unamortized deferred costs and associated discount, as well as $3,200 for the related call premium.
In September 2013, the Company repurchased $8,772 in principal amount of its Notes in privately negotiated transactions. The Company immediately incurred $160 of expense related to unamortized deferred costs and associated discount, as well as $251 for the related call premium.
Incremental Term Loan
On October 11, 2013, the Company entered into an amendment to the Credit Agreement with Credit Suisse AG, Cayman Islands Branch, as administrative agent, and the other lenders party thereto (the “First Amendment”). Pursuant to the First Amendment, the Company raised $70,000 in incremental term loan commitments to repurchase the remaining Notes. On December 2, 2013, the Company borrowed $70,000 of incremental term loans, and with such proceeds plus borrowings under its revolving line of credit and cash on hand, completed the redemption of all its outstanding Notes on December 4, 2013.
The incremental term loan was funded at 99.0% of principal amount and will mature on the same date as the existing term loan under the Company’s credit agreement on June 3, 2019. Upon funding, the incremental term loans were converted to match all the terms of existing term loans. Interest on the incremental term loan is calculated, at the Company’s option, at a base rate plus a 2.25% margin or LIBOR plus a 3.25% margin, subject to a 1.00% LIBOR floor.
During the first five and one half years after the closing date for the incremental term loan, the quarterly amortization payments of all term loans under the credit agreement has increased to $1,225 from the previous amount of $1,050.
The Company’s obligations under the incremental term loans are guaranteed by substantially all of the Company’s direct and indirect domestic subsidiaries. The obligations under the incremental term loan and the guarantees are secured by a lien on substantially all of the Company’s tangible and intangible property, and by a pledge of all of the shares of stock and limited liability company interests of the Company’s direct and indirect domestic subsidiaries, of which the Company now owns or later acquires more than a 50% interest, subject to limited exceptions.
As a result of the transaction, the Company recognized a loss on extinguishment totaling $3,817 including $1,721 of expense related to unamortized deferred costs and associated discount, as well as $2,025 for the related call premium.
As of December 31, 2014, our ratio of consolidated total debt to Consolidated Adjusted EBITDA calculated pursuant to the Credit Agreement was 3.61 to 1.00.
The maturities of long-term debt as of December 31, 2014 are as follows:
Bank Credit Facilities | ||||||||||||
Term Loan | Revolving Credit Facility | Equipment Loans | Total | |||||||||
Year ending December 31: | ||||||||||||
2015 | 4,900 | — | 10,593 | 15,493 | ||||||||
2016 | 4,900 | — | 6,769 | 11,669 | ||||||||
2017 | 4,900 | 2,000 | 3,956 | 10,856 | ||||||||
2018 | 4,900 | — | 1,708 | 6,608 | ||||||||
2019 | 463,225 | — | 1,290 | 464,515 | ||||||||
Thereafter | — | — | 304 | 304 | ||||||||
$ | 482,825 | $ | 2,000 | $ | 24,620 | $ | 509,445 | |||||
10. (Loss) Income Per Common Share
Basic net loss per share is computed utilizing the two-class method and is calculated based on the weighted-average number of common shares outstanding during the periods presented, excluding unvested restricted stock units which do not contain nonforfeitable rights to dividend and dividend equivalents.
Diluted net loss per share is computed using the weighted-average number of common and common equivalent shares outstanding during the periods utilizing the two-class method for stock options, unvested restricted stock and unvested restricted stock units. Potentially dilutive securities are not considered in the calculation of net loss per share as their impact would be anti-dilutive.
77
The following table sets forth the computation of basic and diluted loss per share (amounts in thousands, except per share amounts):
Year Ended December 31, | |||||||||||
2012 | 2013 | 2014 | |||||||||
Numerator: | |||||||||||
Net (loss) income attributable to Alliance HealthCare Services, Inc. | $ | (11,938 | ) | $ | (21,483 | ) | $ | 10,618 | |||
Denominator: | |||||||||||
Weighted-average shares-basic | 10,624 | 10,634 | 10,669 | ||||||||
Effect of dilutive securities: | |||||||||||
Employee stock options | — | — | 167 | ||||||||
Weighted-average shares-diluted | 10,624 | 10,634 | 10,836 | ||||||||
(Loss) income per common share attributable to Alliance HealthCare Services, Inc.: | |||||||||||
Basic | $ | (1.12 | ) | $ | (2.02 | ) | $ | 1.00 | |||
Diluted | $ | (1.12 | ) | $ | (2.02 | ) | $ | 0.98 | |||
Stock options excluded from the computation of diluted per share amounts: | |||||||||||
Weighted-average shares for which the exercise price exceeds average market price of common stock | 757 | 176 | 337 | ||||||||
Average exercise price per share that exceeds average market price of common stock | $ | 17.72 | $ | 35.02 | $ | 34.75 | |||||
11. Derivatives
The Company accounts for derivative instruments and hedging activities in accordance with the provisions of ASC 815, “Derivatives and Hedging.” Management generally designates derivatives in a hedge relationship with the identified exposure on the date the Company enters into a derivative contract, as disclosed below. The Company has only executed derivative instruments that are economic hedges of exposures that can qualify in hedge relationships under ASC 815. The Company formally documents all relationships between hedging instruments and hedged items, as well as the risk-management objective and strategy for undertaking various hedge transactions. In this documentation, the Company specifically identifies the firm commitment or forecasted transaction that has been designated as a hedged item and states how the hedging instrument is expected to hedge the risks related to the hedged item. The Company formally assesses effectiveness of its hedging relationships, both at the hedge inception and on an ongoing basis, then measures and records ineffectiveness. The Company would discontinue hedge accounting prospectively (i) if it is determined that the derivative is no longer effective in offsetting change in the cash flows of a hedged item, (ii) when the derivative expires or is sold, terminated or exercised, (iii) because it is probable that the forecasted transaction will not occur, or (iv) if management determines that designation of the derivative as a hedge instrument is no longer appropriate. The Company’s derivatives are recorded on the balance sheet at their fair value. For additional information please see Note 5 of the Notes to the Consolidated Financial Statements. For derivatives accounted for as cash flow hedges, any effective unrealized gains or losses on fair value are included in comprehensive income (loss), net of tax, and any ineffective gains or losses are recognized in income immediately. Amounts recorded in comprehensive income (loss) are reclassified to earnings when the hedged item impacts earnings.
Cash Flow Hedges
Interest Rate Cash Flow Hedges
The Company has entered into multiple interest rate swap and cap agreements to hedge the future cash interest payments on portions of its variable rate bank debt. At December 31, 2013 and 2014, the Company had interest rate swap and cap agreements to hedge approximately $260,315 and $258,729 of its variable rate bank debt, respectively, or 49.1% and 51.0% of total debt, respectively. Over the next twelve months, the Company expects to reclassify $106 from accumulated other comprehensive income (loss) to interest expense and other, net.
In the first quarter of 2010, the Company entered into three interest rate cap agreements, in accordance with Company policy, to avoid unplanned volatility in the income statement due to changes in the LIBOR interest rate environment. The interest rate cap agreements, matured in February 2014 with a total notional amount of $150,000 and were de-designated as cash flow hedges associated with the Company’s variable rate bank debt in the fourth quarter of 2013.
78
In the second quarter of 2011, the Company acquired two interest rate swap agreements (the “USR Swaps”) as part of the acquisition of USR. One of the USR Swaps, which matures in October 2015, had a notional amount of $871 as of December 31, 2014. Under the terms of this agreement, the Company receives one-month LIBOR and pays a fixed rate of 5.71%. The net effect of the hedge is to record interest expense at a fixed rate of 8.71%, as the underlying debt incurred interest based on one-month LIBOR plus 3.00%. The other USR Swap matured in April 2014. As a result of the acquisition of USR, the USR Swaps were de-designated, hedge accounting was terminated and all further changes in the fair market value of these swaps are being recorded in interest expense and other, net.
In the fourth quarter of 2012, the Company entered into an interest rate swap agreement in connection with equipment financing. The swap, which matures in December 2017, had a notional amount of $3,236 as of December 31, 2014. Under the terms of this agreement, the Company receives one-month LIBOR plus 2.50% and pays a fixed rate of 3.75%. The net effect of the hedge is to convert interest expense to a fixed rate of 3.75%, as the underlying debt incurred interest based on one-month LIBOR plus 2.50%.
In the first quarter of 2013, the Company entered into an interest rate swap agreement in connection with equipment financing. The swap, which matures in April 2018, had a notional amount of $2,930 as of December 31, 2014. Under the terms of this agreement, the Company receives one-month LIBOR plus 2.00% and pays a fixed rate of 2.873%. The net effect of the hedge is to convert interest expense to a fixed rate of 2.873%, as the underlying debt incurred interest based on one-month LIBOR plus 2.00%.
In the fourth quarter of 2013, the Company entered into five interest rate cap agreements ("2013 Caps"), in accordance with Company policy, to avoid unplanned volatility in the income statement due to changes in the LIBOR interest rate environment. The 2013 Caps, which mature in December 2016, had a notional amount of $250,000 and were designated as cash flow hedges of future cash interest payments associated with a portion of the Company’s variable rate bank debt. Under these arrangements, the Company has purchased a cap on LIBOR at 2.50%. The Company paid $815 to enter into the caps, which is being amortized through interest expense and other, net over the life of the agreements.
In the fourth quarter of 2014, the Company entered into an interest rate swap agreement in connection with equipment financing. The swap, which matures in November 2019, had a notional amount of $1,691 as of December 31, 2014. Under the terms of this agreement, the Company receives one-month LIBOR and pays a fixed rate of 1.34%. The net effect of the hedge is to convert interest expense to a fixed rate of 1.34%, as the underlying debt incurred interest based on one-month LIBOR.
Quantitative information about the Company’s derivatives’ impact on performance and operations is provided below:
Asset Derivatives | |||||||||
Fair Value as of December 31, | |||||||||
Balance Sheet Location | 2013 | 2014 | |||||||
Derivatives designated as hedging instruments | |||||||||
Interest rate contracts | Other assets | $ | 811 | $ | 228 | ||||
Liability Derivatives | |||||||||
Fair Value as of December 31, | |||||||||
Balance Sheet Location | 2013 | 2014 | |||||||
Derivatives not designated as hedging instruments | |||||||||
Interest rate contracts | Other liabilities | $ | 46 | $ | 10 | ||||
Derivatives designated as hedging instruments | |||||||||
Interest rate contracts | Other liabilities | $ | 58 | $ | 36 | ||||
The Effect of Designated Derivative Instruments on the Statement of Operations
For the Year Ended December 31, 2013
79
Derivatives in Cash Flow Hedging Relationships | Amount of Gain (Loss) Recognized in OCI on Derivatives (Effective Portion) | Location of Gain (Loss) Reclassified from Accumulated OCI into Income (Effective Portion) | Amount of Gain (Loss) Reclassified from Accumulated OCI into Income (Effective Portion) | Location of Gain (Loss) Recognized in Income on Derivatives (Ineffective Portion) | Amount of Gain (Loss) Recognized in Income on Derivatives (Ineffective Portion) | ||||||||||
Interest rate contracts | $ | 30 | Interest expense and other, net | $ | (1,014 | ) | Interest expense and other, net | $ | — | ||||||
Total | $ | 30 | $ | (1,014 | ) | $ | — | ||||||||
The Effect of Non-Designated Derivative Instruments on the Statement of Operations
For the Year Ended December 31, 2013
Derivatives in Cash Flow Hedging Relationships | Location of Gain (Loss) Recognized in Income on Derivatives | Amount of Gain (Loss) Recognized in Income on Derivatives | |||
Interest rate contracts | Interest expense and other, net | $ | (7 | ) | |
The Effect of Designated Derivative Instruments on the Statement of Operations
For the Year Ended December 31, 2014
Derivatives in Cash Flow Hedging Relationships | Amount of Gain (Loss) Recognized in OCI on Derivatives (Effective Portion) | Location of Gain (Loss) Reclassified from Accumulated OCI into Income (Effective Portion) | Amount of Gain (Loss) Reclassified from Accumulated OCI into Income (Effective Portion) | Location of Gain (Loss) Recognized in Income on Derivatives (Ineffective Portion) | Amount of Gain (Loss) Recognized in Income on Derivatives (Ineffective Portion) | ||||||||||
Interest rate contracts | $ | (552 | ) | Interest expense and other, net | $ | (109 | ) | Interest expense and other, net | $ | (2 | ) | ||||
Total | $ | (552 | ) | $ | (109 | ) | $ | (2 | ) | ||||||
The Effect of Non-Designated Derivative Instruments on the Statement of Operations
For the Year Ended December 31, 2014
Derivatives in Cash Flow Hedging Relationships | Location of Gain (Loss) Recognized in Income on Derivatives | Amount of Gain (Loss) Recognized in Income on Derivatives | |||
Interest rate contracts | Interest expense and other, net | $ | (2 | ) | |
12. Commitments and Contingencies
The Company has maintenance contracts with its equipment vendors for substantially all of its diagnostic imaging and radiation oncology equipment. The contracts are between one and five years from inception and extend through the year 2016, but may be canceled by the Company under certain circumstances. The Company's total contract payments for the years ended December 31, 2012, 2013 and 2014 were $48,911, $39,209 and $38,860, respectively. At December 31, 2014, the Company had binding equipment purchase commitments totaling $30,731.
80
The Company leases office and warehouse space and certain equipment under non-cancelable operating leases. The office and warehouse leases generally call for minimum monthly payments plus maintenance and inflationary increases. The future minimum payments under such leases are as follows:
Year ending December 31: | |||
2015 | $ | 14,383 | |
2016 | 12,870 | ||
2017 | 3,489 | ||
2018 | 2,655 | ||
2019 | 2,087 | ||
Thereafter | 7,920 | ||
$ | 43,404 | ||
The Company's total rental expense, which includes short-term equipment rentals, for the years ended December 31, 2012, 2013 and 2014 was $9,643, $15,760 and $16,814, respectively.
The Company has applied the disclosure provisions of ASC 460, “Guarantees,” to its agreements that contain guarantee or indemnification clauses. These disclosure provisions expand those required by ASC 440, “Commitments,” and ASC 450, “Contingencies,” by requiring a guarantor to disclose certain types of guarantees, even if the likelihood of requiring the guarantor's performance is remote. The following is a description of arrangements in which the Company is the guarantor or indemnifies a party.
In the normal course of business, the Company has made certain guarantees and indemnities, under which it may be required to make payments to a guaranteed or indemnified party, in relation to certain transactions. The Company indemnifies other parties, including customers, lessors, and parties to other transactions with the Company, with respect to certain matters. The Company has agreed to hold the other party harmless against losses arising from certain events as defined within the particular contract, which may include, for example, litigation or claims arising from a breach of representations or covenants. In addition, the Company has entered into indemnification agreements with its executive officers and directors and the Company's bylaws contain similar indemnification obligations. Under these arrangements, the Company is obligated to indemnify, to the fullest extent permitted under applicable law, its current or former officers and directors for various amounts incurred with respect to actions, suits or proceedings in which they were made, or threatened to be made, a party as a result of acting as an officer or director.
It is not possible to determine the maximum potential amount under these indemnification agreements due to the limited history of prior indemnification claims and the unique facts and circumstances involved in each particular agreement.
Historically, payments made related to these indemnifications have been immaterial. At December 31, 2014, the Company has determined that no liability is necessary related to these guarantees and indemnities.
In connection with the acquisition of Medical Outsourcing Services, LLC (“MOS”) in the third quarter of 2008, the Company subsequently identified a Medicare billing practice related to a portion of MOS's retail billing operations that raised compliance issues under Medicare reimbursement guidelines. The practice was in place before the acquisition and was discontinued when the Company became aware of it. In accordance with the corporate compliance program, the Company entered into discussions with representatives of the federal government to advise it of the issue and seek guidance on appropriate next steps.
In June 2010, the Company commenced arbitration proceedings against the former owners of MOS related to the Medicare billing matter, in addition to certain other indemnification issues. In the arbitration, the Company asserted claims of fraud and breach of representations and warranties.
On December 29, 2011, the Company received notice of an award by the arbitration panel, which awarded the Company $2,527 in damages for breach of contract claims, plus prejudgment interest at 9% under New York law from July 29, 2008 (which interest continues to accrue until the award is paid in full); $255 for two other indemnification claims; $1,453 for attorneys’ fees and expenses; and $110 for arbitration expenses. The award also provides that approximately $1,300 of a remaining indemnification cap created in connection with the acquisition is available for future indemnification claims, including with respect to the potential government claim discussed above, and must be satisfied by the former owners of MOS. On January 25, 2012, one of the former owners of MOS paid $665 to the Company, and on February 17, 2012, the same owner released $592 to the Company from amounts held in an indemnification escrow related to the acquisition. On January 25, 2012, the Company filed an action in the United States District Court for the Northern District of Illinois to confirm the award as a judgment against the other former owner of MOS that has refused to satisfy its obligations under the award.
81
In the first quarter of 2013, the former owners of MOS paid $1,198 which amount represented the remaining amount of the indemnification cap created in connection with the acquisition. This amount was in addition to $5,300 the Company already recovered from the former owners of MOS in connection with the arbitration award against them. With these final payments totaling $1,198, the former owners of MOS have now fully satisfied their obligations to the Company under the arbitration award. Following receipt of the final payments from the former owners of MOS, the Company then entered into a settlement agreement to resolve the government's investigation of the Medicare billing practices engaged in by MOS prior to the acquisition. Under the terms of the settlement agreement, the Company paid $2,400 to the government, which amount was paid primarily from the funds recovered in the arbitration from the former owners of MOS.
In June 2012, Pacific Coast Cardiology (“PCC”) d/b/a Pacific Coast Imaging, Emanuel Shaoulian, MD, Inc., and Michael M. Radin, MD, Inc. filed a lawsuit in California state court against the Company and other defendants. The complaint asserted a number of claims related to managements decision not to purchase PCC in 2010, and also separately sought a determination regarding an amount the Company contends was owed to us by PCC pursuant to a previous contractual arrangement. In July 2014, the Company entered into a settlement agreement for an amount that is not material to its consolidated results of operations, financial position, or cash flows, for which it had previously recorded an accrual. The Court approved the settlement on August 11, 2014.
On November 9, 2012, U.S. Radiosurgery, LLC (“USR”) a subsidiary of the Company, received a grand jury subpoena issued by the United States Attorney's Office for the Middle District of Tennessee seeking documents related to USR and its financial relationships with physicians and other healthcare providers. The federal government has informed the Company that this matter has been closed.
On March 27, 2013, the Company was served with a lawsuit filed in U.S. District Court for the Northern District of Mississippi by Superior MRI Services, Inc. The plaintiff is an alleged successor in interest to a former local competitor, P&L Contracting, Inc. Plaintiff alleges the Company disregarded Mississippi CON rules and regulations by operating without obtaining the appropriate authority, and is seeking in excess of $1,000 in damages as well as requesting injunctive relief. In January 2014, the District Court dismissed plaintiff’s complaint on a number of procedural and substantive grounds. The plaintiff subsequently appealed the District Court’s ruling to the Fifth Circuit Court of Appeals. On February 18, 2015, the Fifth Circuit Court of Appeals affirmed the District Court’s dismissal, thereby, effectively concluding this case in Alliance’s favor.
On June 14, 2013, Alliance Oncology, LLC, a subsidiary of the Company, filed a complaint against Harvard Vanguard Medical Associates, Inc. (“HVMA”) in the United States District Court for the District of Massachusetts, including several claims seeking damages resulting from HVMA’s early termination of a long-term services agreement between the two companies. HVMA filed an answer to Alliance Oncology’s complaint on August 27, 2013. Without specifying its alleged damages, HVMA also asserted several counterclaims in its answer. The Company filed its answer to HVMA’s counterclaims on October 4, 2013, and intends to vigorously defend against the claims asserted. The Company has not recorded an expense related to any potential damages in connection with this matter because any potential loss is not probable or reasonably estimable at this time.
The Company from time to time is involved in routine litigation and regulatory matters incidental to the conduct of its business. The Company believes that resolution of such matters will not have a material adverse effect on its consolidated results of operations, financial position, or cash flows.
13. 401(k) Savings Plan
Under the Company's 401(k) Savings Plan (the “Plan”), all employees who are over 21 years of age are eligible to participate after attaining three months of service. Employees may contribute between 1% and 25% of their annual compensation, subject to Internal Revenue Code limitations. For the years ended December 31, 2012 and 2013, the Company did not match any employee contributions to the Plan. In 2014, the Company accrued $492 to the Plan for employee services rendered in 2014, which will be contributed in 2015. The Company may also make discretionary contributions depending on profitability. No discretionary contributions were made in 2012, 2013 and 2014.
14. Income Taxes
The income tax (benefit) expense shown in the Consolidated Statements of Operations and Comprehensive Income (Loss) consists of the following:
82
Year Ended December 31, | ||||||||||||
2012 | 2013 | 2014 | ||||||||||
Current: | ||||||||||||
Federal | $ | 951 | $ | 92 | $ | 239 | ||||||
State | 7 | 228 | 334 | |||||||||
Total current | 958 | 320 | 573 | |||||||||
Deferred: | ||||||||||||
Federal | (6,709 | ) | (10,681 | ) | 5,858 | |||||||
State | (959 | ) | (2,037 | ) | 896 | |||||||
Total deferred | (7,668 | ) | (12,718 | ) | 6,754 | |||||||
Total income tax (benefit) expense | $ | (6,710 | ) | $ | (12,398 | ) | $ | 7,327 | ||||
Significant components of the Company’s net deferred tax assets (liabilities) at December 31 are as follows:
2013 | 2014 | |||||||
Basis differences in equipment | $ | (37,531 | ) | $ | (29,107 | ) | ||
Basis differences in intangible assets | 13,679 | 2,479 | ||||||
Net operating losses | 8,683 | 5,672 | ||||||
Accounts receivable | 1,916 | 1,671 | ||||||
State income taxes | 324 | 623 | ||||||
Accruals not currently deductible for income tax purposes | 9,450 | 8,057 | ||||||
Basis differences associated with acquired investments | (14,390 | ) | (14,308 | ) | ||||
Other | 4,445 | 4,907 | ||||||
Total deferred taxes | (13,424 | ) | (20,006 | ) | ||||
Valuation allowance | — | — | ||||||
Net deferred taxes | $ | (13,424 | ) | $ | (20,006 | ) | ||
Current deferred tax asset | $ | 21,849 | $ | 16,834 | ||||
Noncurrent deferred tax liability | (35,273 | ) | (36,840 | ) | ||||
Net deferred taxes | $ | (13,424 | ) | $ | (20,006 | ) | ||
A reconciliation of expected total income tax (benefit) expense, computed using the federal statutory rate on income is as follows:
Year Ended December 31, | ||||||||||||
2012 | 2013 | 2014 | ||||||||||
U.S. Federal tax benefit at statutory rates | $ | (4,386 | ) | $ | (9,265 | ) | $ | 9,861 | ||||
State income taxes, net of federal benefit | (619 | ) | (1,175 | ) | 800 | |||||||
Earnings from unconsolidated investees | 1,633 | 1,971 | 1,629 | |||||||||
Noncontrolling interest | (3,771 | ) | (4,564 | ) | (5,209 | ) | ||||||
Other | 433 | 635 | 246 | |||||||||
Income tax (benefit) expense | $ | (6,710 | ) | $ | (12,398 | ) | $ | 7,327 | ||||
As of December 31, 2014, the Company had net operating loss ("NOL") carryforwards of approximately $13,969 and $13,170 for federal and state income tax purposes, respectively. These loss carryforwards will expire at various dates from 2015 through 2031. As of December 31, 2014, the Company also had alternative minimum tax credit carryforwards of $4,674 with no expiration date.
As of December 31, 2014, the Company has provided a liability for $269 of unrecognized tax benefits related to various federal and state income tax matters. The tax-effected amount that would reduce the Company’s effective income tax rate if recognized is $229.
A reconciliation of the beginning and ending amount of unrecognized tax benefits is as follows:
83
2012 | 2013 | 2014 | ||||||||||
Unrecognized tax benefits at January 1 | $ | 652 | $ | 428 | $ | 287 | ||||||
Increases for positions taken in current year | 58 | 41 | 64 | |||||||||
Increases for positions taken in a prior year | — | — | 31 | |||||||||
Decreases for positions taken in a prior year | (20 | ) | (15 | ) | — | |||||||
Decreases for lapses in the applicable statute of limitations | (262 | ) | (167 | ) | (113 | ) | ||||||
Decreases for settlements with taxing authorities | — | — | — | |||||||||
Unrecognized tax benefits at December 31 | $ | 428 | $ | 287 | $ | 269 | ||||||
The Company recognizes accrued interest and penalties related to unrecognized tax benefits in income tax expense. As of December 31, 2014, the Company had approximately $12 in accrued interest and penalties related to unrecognized tax benefits.
The Company is subject to United States federal income tax as well as income tax of multiple state tax jurisdictions. The Company is currently open to audit under the statute of limitations by the Internal Revenue Service for the years ended December 31, 2011 through 2014. The Company’s and its subsidiaries’ state income tax returns are open to audit under the applicable statutes of limitations for the years ended December 31, 2010 through 2014. The Company does not anticipate a significant change to the total amount of unrecognized tax benefits within the next 12 months.
15. Related-Party Transactions
On April 16, 2007, Oaktree and MTS purchased 4,900,301 shares of the Company’s common stock. Upon completion of the transaction, Oaktree and MTS owned in the aggregate approximately 49.7% of the outstanding shares of common stock of the Company. At December 31, 2014, Oaktree and MTS owned in the aggregate approximately 50.5% of the outstanding shares of common stock of the Company. The Company does not pay management fees to Oaktree and MTS for their financial advisory services to the Company.
Revenues from management agreements with unconsolidated equity investees were $9,194, $9,564 and $9,134 during the years ended December 31, 2012, 2013 and 2014, respectively. The Company provides services as part of its ongoing operations for and on behalf of the unconsolidated equity investees, which are included in the management agreement revenue, who reimburse the Company for the actual amount of the expenses incurred. The Company records the expenses as cost of revenues and the reimbursement as revenue in its Consolidated Statements of Operations and Comprehensive Income (Loss). For the years ended December 31, 2012, 2013 and 2014, the amounts of the revenues and expenses were $7,457, $7,781 and $7,320, respectively.
On June 3, 2013, the Company replaced its existing credit facility with a new senior secured credit agreement with Credit Suisse AG, Cayman Islands Branch, as administrative agent, and the other lenders party thereto (the “Credit Agreement”). Of the other lenders, Oaktree funded approximately $40,476 of the $340,000 six-year term loan facility. In addition, as of July 3, 2013, Oaktree funded approximately $9,524 of the $80,000 delayed draw.
On October 11, 2013, the Company obtained commitments from its current lenders with respect to a $70,000 incremental term loan under its Credit Agreement. On December 2, 2013, the Company borrowed $70,000 of incremental term loans, and with such proceeds plus borrowings under its revolving line of credit and cash on hand, completed the redemption of all its outstanding Notes on December 4, 2013. Oaktree funded $10,000 of the $70,000 incremental term loan.
16. Investments in Unconsolidated Investees
The Company has direct ownership in three unconsolidated investees at December 31, 2014. The Company owns between 15% and 50% of these investees, and provides management services under agreements with three of these investees, expiring at various dates through 2025. All of these investees are accounted for under the equity method since the Company does not exercise control over the operations of these investees.
At December 31, 2013 and 2014, the Company has a total investment of $7,722 and $7,130, respectively, in its unconsolidated investees, which is in other assets on the Company's Consolidated Balance Sheets.
Set forth below are certain financial data for Alliance-HNI, LLC and Subsidiaries, one of the Company’s unconsolidated investees:
84
December 31, 2013 | December 31, 2014 | ||||||
Balance Sheet Data: | |||||||
Current assets | $ | 4,650 | $ | 4,721 | |||
Noncurrent assets | 9,732 | 9,257 | |||||
Current liabilities | 2,810 | 2,773 | |||||
Noncurrent liabilities | 2,757 | 3,272 | |||||
Year Ended December 31, | |||||||||||
2012 | 2013 | 2014 | |||||||||
Operating Results: | |||||||||||
Revenues | $ | 17,959 | $ | 17,635 | $ | 16,812 | |||||
Expenses | 10,090 | 9,055 | 9,879 | ||||||||
Net income | 7,869 | 8,580 | 6,933 | ||||||||
Earnings from unconsolidated investee | 3,735 | 4,480 | 3,467 | ||||||||
Set forth below are certain financial data for the aggregate of the Company’s unconsolidated investees, including Alliance-HNI, LLC and Subsidiaries:
December 31, 2013 | December 31, 2014 | ||||||
Balance Sheet Data: | |||||||
Current assets | $ | 7,188 | $ | 8,687 | |||
Noncurrent assets | 11,058 | 10,108 | |||||
Current liabilities | 3,569 | 3,760 | |||||
Noncurrent liabilities | 3,382 | 3,395 | |||||
Year Ended December 31, | |||||||||||
2012 | 2013 | 2014 | |||||||||
Combined Operating Results: | |||||||||||
Revenues | $ | 27,228 | $ | 27,614 | $ | 27,735 | |||||
Expenses | 14,607 | 12,721 | 13,597 | ||||||||
Net income | 12,621 | 14,893 | 14,138 | ||||||||
Earnings from unconsolidated investees | 4,667 | 5,630 | 4,654 | ||||||||
17. Segment Information
Operating segments are defined as components of an enterprise about which separate financial information is available that is evaluated regularly by the chief operating decision maker (“CODM”) in deciding how to allocate resources and in assessing performance. In accordance with ASC 280, “Segment Reporting,” and based on the nature of the financial information that is received by the CODM, the Company operates in two operating segments, which are also its two reportable segments, Imaging and Radiation Oncology, based on similar economic and other characteristics. Each of these segments, on a stand-alone basis, provide and make available their respective medical services in similar settings, and operate within a singular regulatory environment. Further, management assesses our segment operations and each segments' degree of efficiency and performance based on this structure of financial reporting, and primarily makes operating decisions from these reportable segment results.
The Radiology segment is comprised of diagnostic imaging services including MRI, PET/CT and other imaging services. The Radiation Oncology segment is comprised of radiation oncology services. All intercompany revenues, expenses, payables and receivables are eliminated in consolidation and are not reviewed when evaluating segment performance. Each segment’s performance is evaluated based on Revenue, Segment Income and Net Income. The accounting policies of the segments are the
85
same as those described in the summary of significant accounting policies in Note 2 of the notes to the Consolidated Financial Statements.
The following table summarizes the Company’s revenue by segment:
Year Ended December 31, | |||||||||||
2012 | 2013 | 2014 | |||||||||
Revenue | |||||||||||
Radiology | $ | 389,086 | $ | 370,968 | $ | 343,463 | |||||
Radiation Oncology | 83,172 | 77,863 | 92,924 | ||||||||
Total | $ | 472,258 | $ | 448,831 | $ | 436,387 | |||||
The following are components of revenue:
Year Ended December 31, | |||||||||||
2012 | 2013 | 2014 | |||||||||
Revenue | |||||||||||
MRI revenue | $ | 196,073 | $ | 187,207 | $ | 180,814 | |||||
PET/CT revenue | 154,849 | 145,027 | 133,224 | ||||||||
Radiation Oncology revenue | 83,172 | 77,863 | 92,924 | ||||||||
Other modalities and other revenue | 38,164 | 38,734 | 29,425 | ||||||||
Total | $ | 472,258 | $ | 448,831 | $ | 436,387 | |||||
Segment income represents net income (loss) before income taxes; interest expense and other, net; amortization expense; depreciation expense; share-based payment; severance and related costs; noncontrolling interest in subsidiaries; restructuring charges; transaction costs; impairment charges and other non-cash charges. Segment income is the most frequently used measure of each segment’s performance and is commonly used in setting performance goals. The following table summarizes the Company’s segment income:
Year Ended December 31, | |||||||||||
2012 | 2013 | 2014 | |||||||||
Segment income | |||||||||||
Radiology | $ | 134,798 | $ | 128,247 | $ | 104,681 | |||||
Radiation Oncology | 36,719 | 34,752 | 41,846 | ||||||||
Corporate / Other | (17,121 | ) | (15,578 | ) | (10,772 | ) | |||||
Total | $ | 154,396 | $ | 147,421 | $ | 135,755 | |||||
The reconciliation of Net (loss) income to total segment income is shown below:
86
Year Ended December 31, | |||||||||||
2012 | 2013 | 2014 | |||||||||
Net (loss) income attributable to Alliance HealthCare Services, Inc. | $ | (11,938 | ) | $ | (21,483 | ) | $ | 10,618 | |||
Income tax (benefit) expense | (6,710 | ) | (12,398 | ) | 7,327 | ||||||
Interest expense and other, net | 54,101 | 39,170 | 24,693 | ||||||||
Amortization expense | 15,861 | 10,973 | 7,880 | ||||||||
Depreciation expense | 79,333 | 66,319 | 54,971 | ||||||||
Share-based payment (included in selling, general and administrative expenses) | 724 | 1,487 | 1,515 | ||||||||
Severance and related costs | — | — | 2,517 | ||||||||
Noncontrolling interest in subsidiaries | 10,775 | 13,041 | 14,883 | ||||||||
Restructuring charges (Note 3) | 6,715 | 7,182 | 2,602 | ||||||||
Transaction costs | 494 | 465 | 2,344 | ||||||||
Impairment charges | — | 13,031 | 308 | ||||||||
Loss on extinguishment of debt | — | 26,018 | — | ||||||||
Legal settlements | 4,793 | 3,067 | 5,587 | ||||||||
Other non-cash charges (included in other income and expense, net) | 248 | 549 | 510 | ||||||||
Total segment income | $ | 154,396 | $ | 147,421 | $ | 135,755 | |||||
Net (loss) income for the Radiology and Radiation Oncology segments does not include charges for interest expense, net of interest income, income taxes or certain selling, general and administrative expenses. These costs are charged against the Corporate / Other segment. The following table summarizes the Company’s net income (loss) by segment:
Year Ended December 31, | |||||||||||
2012 | 2013 | 2014 | |||||||||
Net (loss) income | |||||||||||
Radiology | $ | 50,173 | $ | 56,881 | $ | 55,903 | |||||
Radiation Oncology | 9,358 | 6,048 | 16,242 | ||||||||
Corporate / Other | (71,469 | ) | (84,412 | ) | (61,527 | ) | |||||
Total | $ | (11,938 | ) | $ | (21,483 | ) | $ | 10,618 | |||
The following table summarizes the Company’s identifiable assets by segment:
As of December 31, | |||||||||||
2012 | 2013 | 2014 | |||||||||
Identifiable assets | |||||||||||
Radiology | $ | 282,906 | $ | 240,317 | $ | 229,141 | |||||
Radiation Oncology | 176,353 | 158,216 | 182,880 | ||||||||
Corporate / Other | 100,882 | 91,314 | 88,864 | ||||||||
Total | $ | 560,141 | $ | 489,847 | $ | 500,885 | |||||
The following table summarizes the Company’s goodwill by segment:
87
Radiology | Radiation Oncology | Corporate / Other | Total | ||||||||||||
Balance at January 1, 2013 | $ | 41,684 | $ | 14,809 | $ | — | $ | 56,493 | |||||||
Goodwill acquired during the period | — | — | — | — | |||||||||||
Impairment charges | — | — | — | — | |||||||||||
Adjustments to goodwill during the period | 482 | — | — | 482 | |||||||||||
Balance at December 31, 2013 | $ | 42,166 | $ | 14,809 | $ | — | $ | 56,975 | |||||||
Goodwill acquired during the period | — | 6,889 | — | 6,889 | |||||||||||
Impairment charges | — | — | — | — | |||||||||||
Adjustments to goodwill during the period | — | — | — | — | |||||||||||
Balance at December 31, 2014 | $ | 42,166 | $ | 21,698 | $ | — | $ | 63,864 | |||||||
Gross goodwill | $ | 196,508 | $ | 41,600 | $ | — | $ | 238,108 | |||||||
Accumulated impairment charges | (154,342 | ) | (19,902 | ) | — | (174,244 | ) | ||||||||
Balance at December 31, 2014 | $ | 42,166 | $ | 21,698 | $ | — | $ | 63,864 | |||||||
Capital expenditures in the Radiology, Radiation Oncology and Corporate segments were $19,696, $14,337 and $3,531 respectively for the year ended December 31 ,2012, $21,288, $762, and $4,998 respectively, for the year ended December 31, 2013, and $18,211, $3,944, and $10,081 respectively, for the year ended December 31, 2014.
88
18. Subsequent Events
On February. 18, 2015, the Company consummated its new partnership with The Pain Center of Arizona, PC (TPC), specializing in the diagnosis and treatment of chronic pain disorders. TPC currently operates 12 locations statewide. As a part of the transaction, the Company gained an ownership interest in TPC’s affiliated billing and collection company. The Company acquired a 59% ownership stake for approximately $27,000 in cash and its proportion of assumed debt of approximately $2,900. The terms of the agreement also include a potential future earn out provision due to TPC in the event TPC's financial performance meets certain milestones.
19. Quarterly Financial Data (Unaudited)
The following table sets forth selected unaudited quarterly information for the Company’s last eight fiscal quarters derived from the Company’s interim financial statements. Such financial statements have been prepared on the same basis as the Consolidated Financial Statements and all necessary adjustments (which consisted only of normal recurring adjustments) have been included to present fairly the results of such periods when read in conjunction with the Consolidated Financial Statements and related notes included elsewhere herein.
Quarter Ended | ||||||||||||||||
Mar. 31, | Jun. 30, | Sep. 30, | Dec. 31, | |||||||||||||
2013 | 2013 | 2013 | 2013 | |||||||||||||
Revenues | $ | 110,382 | $ | 114,418 | $ | 113,375 | $ | 110,656 | ||||||||
Cost of revenues, excluding depreciation and amortization | 60,639 | 60,094 | 59,701 | 58,963 | ||||||||||||
Loss before income taxes, earnings from unconsolidated investees and noncontrolling interest | (1,460 | ) | (18,058 | ) | (2,407 | ) | (4,545 | ) | ||||||||
Net income (loss) | 412 | (9,455 | ) | 1,332 | (731 | ) | ||||||||||
Net loss attributable to Alliance HealthCare Services, Inc. | (2,418 | ) | (12,964 | ) | (2,070 | ) | (4,031 | ) | ||||||||
Loss per common share attributable to Alliance HealthCare Services, Inc.: | ||||||||||||||||
Basic | $ | (0.23 | ) | $ | (1.22 | ) | $ | (0.19 | ) | $ | (0.38 | ) | ||||
Diluted | $ | (0.23 | ) | $ | (1.22 | ) | $ | (0.19 | ) | $ | (0.38 | ) | ||||
Quarter Ended | ||||||||||||||||
Mar. 31, | Jun. 30, | Sep. 30, | Dec. 31, | |||||||||||||
2014 | 2014 | 2014 | 2014 | |||||||||||||
Revenues | $ | 105,365 | $ | 111,238 | $ | 110,137 | $ | 109,647 | ||||||||
Cost of revenues, excluding depreciation and amortization | 56,940 | 59,627 | 59,401 | 61,452 | ||||||||||||
Income before income taxes, earnings from unconsolidated investees and noncontrolling interest | 5,489 | 7,380 | 9,583 | 5,722 | ||||||||||||
Net income | 4,980 | 6,820 | 7,854 | 5,847 | ||||||||||||
Net income attributable to Alliance HealthCare Services, Inc. | 1,931 | 2,784 | 4,011 | 1,892 | ||||||||||||
Income per common share attributable to Alliance HealthCare Services, Inc.: | ||||||||||||||||
Basic | $ | 0.18 | $ | 0.26 | $ | 0.37 | $ | 0.19 | ||||||||
Diluted | $ | 0.18 | $ | 0.26 | $ | 0.37 | $ | 0.17 | ||||||||
The Company experiences seasonality in the revenues and margins generated for its services. First and fourth quarter revenues are typically lower than those from the second and third quarters. First quarter revenue is affected primarily by fewer calendar days and inclement weather, typically resulting in fewer patients being scanned or treated during the period. Fourth quarter revenues are affected by holiday and client and patient vacation schedules, resulting in fewer scans or treatments during the period. The variability in margins is higher than the variability in revenues due to the fixed nature of our costs. The Company also experiences fluctuations in the revenues and margins generated due to acquisition activity and general economic conditions, including recession or economic slowdown. For information regarding impairment charges recorded in 2013 and 2014, see Note 6 of the Notes to the Consolidated Financial Statements.
Item 9. | CHANGES IN AND DISAGREEMENTS WITH ACCOUNTANTS ON ACCOUNTING AND FINANCIAL DISCLOSURE. |
89
None.
ITEM 9A. | CONTROLS AND PROCEDURES |
We maintain disclosure controls and procedures that are designed to ensure that information required to be disclosed in our Exchange Act reports is recorded, processed, summarized and reported within the time periods specified in the SEC’s rules and forms, and that such information is accumulated and communicated to our management, including our Chief Executive Officer and Chief Financial Officer, as appropriate, to allow timely decisions regarding required disclosure. In designing and evaluating the disclosure controls and procedures, management recognized that any controls and procedures, no matter how well designed and operated, can provide only reasonable assurance of achieving the desired control objectives, and management necessarily was required to apply its judgment in evaluating the cost-benefit relationship of possible controls and procedures. Also, we have investments in certain unconsolidated entities. As we do not control or manage these entities, our disclosure controls and procedures with respect to such entities are more limited than those we maintain with respect to our consolidated subsidiaries. These unconsolidated entities are not considered material to our consolidated financial position or results of operations.
As required by SEC Rule 13a-15(b), we carried out an evaluation, under the supervision and with the participation of our management, including our Chief Executive Officer and Chief Financial Officer, of the effectiveness of the design and operation of our disclosure controls and procedures as of the end of the period covered by this report. Based on the foregoing, our Chief Executive Officer and Chief Financial Officer concluded that, as of the end of the period covered by this report, our disclosure controls and procedures were effective at the reasonable assurance level.
90
Management’s Report on Internal Control Over Financial Reporting
Internal control over financial reporting refers to the process designed by, or under the supervision of, our Chief Executive Officer and Chief Financial Officer, and effected by our management and other personnel, with oversight from our board of directors, to provide reasonable assurance regarding the reliability of financial reporting and the preparation of financial statements for external purposes in accordance with generally accepted accounting principles, and includes those policies and procedures that:
(1) | Pertain to the maintenance of records that in reasonable detail accurately and fairly reflect the transactions and dispositions of the assets of the Company; |
(2) | Provide reasonable assurance that transactions are recorded as necessary to permit preparation of financial statements in accordance with generally accepted accounting principles, and that receipts and expenditures of the Company are being made only in accordance with authorizations of managements and directors of the Company; and |
(3) | Provide reasonable assurance regarding prevention or timely detection of unauthorized acquisition, use or disposition of the Company’s assets that could have a material effect on the financial statements. |
Internal control over financial reporting cannot provide absolute assurance of achieving financial reporting objectives because of its inherent limitations. Internal control over financial reporting is a process that involves human diligence and compliance and is subject to lapses in judgment and breakdowns resulting from human failures. Internal control over financial reporting also can be circumvented by collusion or improper management override. Because of such limitations, there is a risk that material misstatements may not be prevented or detected on a timely basis by internal control over financial reporting. However, these inherent limitations are known features of the financial reporting process. Therefore, it is possible to design into the process safeguards to reduce, though not eliminate, this risk. Management is responsible for establishing and maintaining adequate internal control over financial reporting for the Company.
Management has used the framework set forth in the report entitled Internal Control—Integrated Framework (2013) published by the Committee of Sponsoring Organizations (“COSO”) of the Treadway Commission to evaluate the effectiveness of the Company’s internal control over financial reporting. Management has concluded that the Company’s internal control over financial reporting was effective as of December 31, 2014. Our internal control over financial reporting as of December 31, 2014, has been audited by Deloitte & Touche LLP, an independent registered accounting firm, as stated in their report which is included herein.
Changes in Internal Control Over Financial Reporting
Management has determined that, as of December 31, 2014, there has been no change in our internal control over financial reporting during the last fiscal quarter then ended that has materially affected, or is reasonably likely to materially affect, our internal control over financial reporting.
91
REPORT OF INDEPENDENT REGISTERED PUBLIC ACCOUNTING FIRM
To the Board of Directors and Stockholders of
Alliance HealthCare Services, Inc.
Newport Beach, California
We have audited the internal control over financial reporting of Alliance HealthCare Services, Inc. and subsidiaries (the “Company”) as of December 31, 2014, based on criteria established in Internal Control — Integrated Framework (2013) issued by the Committee of Sponsoring Organizations of the Treadway Commission. The Company’s management is responsible for maintaining effective internal control over financial reporting and for its assessment of the effectiveness of internal control over financial reporting, included in the accompanying Management’s Report on Internal Control Over Financial Reporting. Our responsibility is to express an opinion on the Company’s internal control over financial reporting based on our audit.
We conducted our audit in accordance with the standards of the Public Company Accounting Oversight Board (United States). Those standards require that we plan and perform the audit to obtain reasonable assurance about whether effective internal control over financial reporting was maintained in all material respects. Our audit included obtaining an understanding of internal control over financial reporting, assessing the risk that a material weakness exists, testing and evaluating the design and operating effectiveness of internal control based on the assessed risk, and performing such other procedures as we considered necessary in the circumstances. We believe that our audit provides a reasonable basis for our opinion.
A company’s internal control over financial reporting is a process designed by, or under the supervision of, the company’s principal executive and principal financial officers, or persons performing similar functions, and effected by the company’s board of directors, management, and other personnel to provide reasonable assurance regarding the reliability of financial reporting and the preparation of financial statements for external purposes in accordance with accounting principles generally accepted in the United States of America ("generally accepted accounting principles"). A company’s internal control over financial reporting includes those policies and procedures that (1) pertain to the maintenance of records that, in reasonable detail, accurately and fairly reflect the transactions and dispositions of the assets of the company; (2) provide reasonable assurance that transactions are recorded as necessary to permit preparation of financial statements in accordance with generally accepted accounting principles, and that receipts and expenditures of the company are being made only in accordance with authorizations of management and directors of the company; and (3) provide reasonable assurance regarding prevention or timely detection of unauthorized acquisition, use, or disposition of the company’s assets that could have a material effect on the financial statements.
Because of the inherent limitations of internal control over financial reporting, including the possibility of collusion or improper management override of controls, material misstatements due to error or fraud may not be prevented or detected on a timely basis. Also, projections of any evaluation of the effectiveness of the internal control over financial reporting to future periods are subject to the risk that the controls may become inadequate because of changes in conditions, or that the degree of compliance with the policies or procedures may deteriorate.
In our opinion, the Company maintained, in all material respects, effective internal control over financial reporting as of December 31, 2014, based on the criteria established in Internal Control — Integrated Framework (2013) issued by the Committee of Sponsoring Organizations of the Treadway Commission.
We have also audited, in accordance with the standards of the Public Company Accounting Oversight Board (United States), the consolidated financial statements and the consolidated financial statement schedule as of and for the year ended December 31, 2014 of the Company, and our report dated March 16, 2015, expressed an unqualified opinion on those consolidated financial statements and the consolidated financial statement schedule.
/s/ Deloitte & Touche LLP |
Costa Mesa, California |
March 16, 2015 |
92
ITEM 9B. | OTHER INFORMATION |
None.
93
PART III
ITEM 10. | DIRECTORS, EXECUTIVE OFFICERS AND CORPORATE GOVERNANCE |
The information required by Item 10 of Form 10-K, other than that relating to identification of our executive officers, will be included in our 2015 definitive proxy statement and is incorporated herein by reference. The information required by Item 10 of Form 10-K relating to identification of our executive officers is incorporated by reference from Item 1 of this Annual Report on Form 10-K.
ITEM 11. | EXECUTIVE COMPENSATION |
The information required by Item 11 of Form 10-K will be included in our 2015 definitive proxy statement and is incorporated herein by reference.
ITEM 12. | SECURITY OWNERSHIP OF OF CERTAIN BENEFICIAL OWNERS AND MANAGEMENT AND RELATED STOCKHOLDERS |
The information required by Item 12 of Form 10-K with respect to security ownership of certain beneficial owners and management will be included in our 2015 definitive proxy statement and is incorporated herein by reference.
The information required by Item 12 of Form 10-K with respect to securities authorized for issuance under equity compensation plans is incorporated by reference from Item 5 of this Annual Report on Form 10-K.
ITEM 13. | CERTAIN RELATIONSHIPS AND RELATED TRANSACTIONS, AND DIRECTOR INDEPENDENCE |
The information required by Item 13 of Form 10-K will be included in our 2015 definitive proxy statement and is incorporated herein by reference.
ITEM 14. | PRINCIPAL ACCOUNTING FEES AND SERVICES |
The information required by Item 14 of Form 10-K will be included in our 2015 definitive proxy statement and is incorporated herein by reference.
94
PART IV
ITEM 15. | EXHIBITS AND FINANCIAL STATEMENT SCHEDULES |
(a) | The following documents are filed as part of this Form 10-K: |
1 | Financial Statements: |
A listing of the Consolidated Financial Statements of Alliance HealthCare Services, Inc., related notes and Report of Independent Registered Public Accounting Firm is set forth in Item 8 of this report on Form 10-K.
2 | Financial Statement Schedules: |
The following Financial Statement Schedule for the years ended December 31, 2014, 2013 and 2012 is set forth on page 111 of this report on Form 10-K:
Schedule II—Valuation and Qualifying Accounts
All other schedules have been omitted because the required information is not present or is not present in amounts sufficient to require submission of the schedule, or because the information required is included in the Consolidated Financial Statements and related notes for the years ended December 31, 2014, 2013 and 2012.
3 | Index to Exhibits: |
95
Exhibit No. | Description | ||
3.1 | Amended and Restated Certificate of Incorporation of Alliance. (Filed as Exhibit 3.1 to the Company’s Quarterly Report on Form 10-Q (File No. 001-16609) with the SEC on August 14, 2001) | ||
3.1.1 | Certificate of Amendment to Amended and Restated Certificate of Incorporation of Alliance. (Filed as Exhibit 3.1 to the Company’s Current Report on Form 8-K (File No. 001-16609) with the SEC on February 17, 2009) | ||
3.1.2 | Certificate of Amendment to the Amended and Restated Certificate of Incorporation of Alliance HealthCare Services, Inc. (Filed as Exhibit 3.1 to the Company’s Current Report on Form 8-K (File No. 001-16609) with the SEC on December 12, 2012) | ||
3.2 | Amended and Restated By-laws of Alliance. (Filed as Exhibit 3.2 to the Company’s Quarterly Report on Form 10-Q (File No. 001-16609) with the SEC on August 14, 2001) | ||
3.2.1 | Certain Amended and Restated Provisions of the By-laws of Alliance. (Filed as Exhibit 3.1 to the Company’s Current Report on Form 10-Q (File No. 001-16609) with the SEC on December 20, 2007) | ||
4.1 | Specimen certificate for shares of common stock, $.01 par value, of Alliance. (Filed as Exhibit 4.3 to the Company’s Quarterly Report on Form 10-Q (File No. 001-16609) with the SEC on August 14, 2001) | ||
4.2 | Indenture, including the form of Note, dated as of December 1, 2009, with respect to the 8% Senior Notes due 2016, between Alliance HealthCare Services, Inc., as issuer, and The Bank of New York Mellon Trust Company, N.A., as trustee. (Filed as Exhibit 4.3 to the Company’s Current Report on Form 8-K (File No. 001-16609) with the SEC on December 4, 2009) | ||
10.1* | The 1999 Equity Plan for Employees of Alliance and Subsidiaries, as amended and restated. (Filed as Appendix A to the Company’s Proxy Statement on Form DEF 14A (File No. 001-16609) with the SEC on April 17, 2009) | ||
10.2* | Form of non-qualified stock option agreement under the 1999 Equity Plan for Employees of Alliance and Subsidiaries, as amended and restated. (Filed as Exhibit 10.25 to Amendment No. 1 to the Company’s Registration Statement on Form S-4/A (File No. 333-60682) with the SEC on June 14, 2001) | ||
10.3* | Alliance Directors’ Deferred Compensation Plan, as amended and restated. (Filed as Exhibit 10.3 to the Company’s Current Report on Form 8-K (File No. 001-16609) with the SEC on December 20, 2007) | ||
10.4 | Form of Stockholder’s Agreement. (Filed as Exhibit 10.21 to the Company’s Registration Statement on Form S-4 (File No. 333-60682) with the SEC on May 10, 2001) | ||
10.5* | Form of Indemnification Agreement. (Filed as Exhibit 10.27 to the Company’s Registration Statement on Form S-1 (File No. 333-64322) with the SEC on July 2, 2001) | ||
10.6* | Employment Agreement dated as of December 1, 2005 between Alliance and Howard K. Aihara. (Filed as Exhibit 10.34 to the Company’s Annual Report on Form 10-K (File No. 001-16609) with the SEC on March 16, 2006) | ||
10.7* | Agreement Not to Compete dated as of December 1, 2005 between Alliance and Howard K. Aihara. (Filed as Exhibit 10.35 to the Company’s Annual Report on Form 10-K (File No. 001-16609) with the SEC on March 16, 2006) | ||
10.8* | Form of Restricted Stock Award Agreement under the 1999 Equity Plan for Employees of Alliance and Subsidiaries, as amended and restated. (Filed as Exhibit 10.22 to the Company’s Annual Report on Form 10-K (File No. 001-16609) with the SEC on March 16, 2007) | ||
10.9* | Form of Restricted Stock Unit Award Grant Notice and Restricted Stock Unit Award Agreement (Directors) under the 1999 Equity Plan for Employees of Alliance and Subsidiaries, as amended and restated. (Filed as Exhibit 10.2 to the Company’s Current Report on Form 8-K (File No. 001-16609) with the SEC on December 20, 2007) | ||
10.10* | Form of Stock Bonus Award Agreement under the 1999 Equity Plan for Employees of Alliance and Subsidiaries, as amended and restated. (Filed as Exhibit 10.23 to the Company’s Annual Report on Form 10-K (File No. 001-16609) with the SEC on March 16, 2007) | ||
10.11 | Governance and Standstill Agreement, dated as of March 16, 2007, among Alliance Imaging, Inc., OCM Principal Opportunities Fund IV, LP., and MTS Health Investors II, L.P. (Filed as Exhibit 10.1 to the Company’s Current Report on Form 8-K (File No. 001-16609) with the SEC on March 22, 2007) | ||
10.12* | Form of Executive Severance Agreement. (Filed as Exhibit 10.2 to the Company’s Current Report on Form 8-K (File No. 001-16609) with the SEC on March 22, 2007) | ||
96
Exhibit No. | Description | ||
10.13* | Amendment of Employment Agreement, dated as of April 16, 2007, between Howard K. Aihara and Alliance Imaging, Inc. (Filed as Exhibit 10.4 to the Company’s Current Report on Form 8-K (File No. 001-16609) with the SEC on April 20, 2007) | ||
10.14* | New form of non-qualified stock option agreement under the 1999 Equity Plan for Employees of Alliance and Subsidiaries, as amended and restated. (Filed as Exhibit 10.35 to the Company’s Annual Report on Form 10-K (File No. 001-16609) with the SEC on March 12, 2008 | ||
10.15* | Form of Restricted Stock Award Agreement under the 1999 Equity Plan for Employees of Alliance and Subsidiaries, as amended and restated (For Director Awards Only). (Filed as Exhibit 10.34 to the Company’s Annual Report on Form 10-K (File No. 001-16609) with the SEC on March 10, 2009) | ||
10.16* | Amendment to the Alliance Imaging, Inc. Directors’ Deferred Compensation Plan, as amended and restated. (Filed as Exhibit 10.35 to the Company’s Annual Report on Form 10-K (File No. 001-16609) with the SEC on March 10, 2009) | ||
10.17* | Second Amendment of Employment Agreement, dated as of December 9, 2008, between Howard K. Aihara and Alliance Imaging, Inc. (Filed as Exhibit 10.37 to the Company’s Annual Report on Form 10-K (File No. 001-16609) with the SEC on March 10, 2009) | ||
10.18* | Form of Amendment of Executive Severance Agreement. (Filed as Exhibit 10.38 to the Company’s Annual Report on Form 10-K (File No. 001-16609) with the SEC on March 10, 2009) | ||
10.19 | Credit Agreement, dated as of June 3, 2013, among Alliance HealthCare Services, Inc., Credit Suisse AG, Cayman Islands Branch, as administrative agent and the lenders party thereto. (Filed as Exhibit 10.22 to the Company’s Quarterly Report on Form 10-Q (File No. 001-16609) with the SEC on August 7, 2013) | ||
10.20 | Amendment No. 1 to Credit Agreement, dated as of October 11, 2013, among Alliance HealthCare Services, Inc., Credit Suisse AG, Cayman Islands Branch, as administrative agent and the lenders party thereto. (Filed as Exhibit 10.1 to the Company’s Current Report on Form 8-K (File No. 001-16609) with the SEC on October 16, 2013) | ||
10.21 | Incremental Term Loan Commitment Agreement, dated October 11, 2013, by and among the Company, Credit Suisse AG, Cayman Islands Branch, as administrative agent and other lenders party thereto.(Incorporated by reference to exhibits filed in response to Item 9.01(d), “Exhibits” of the Company’s Current Report on Form 8-K, dated October 16, 2013 (File No. 001-16609) | ||
10.22* | Form of Letter Agreement Evidencing Retention Bonus Arrangements with Executive Officers, dated as of January 31, 2012, with schedule of individual bonus amounts. (Filed as Exhibit 10.27 to the Company’s Annual Report on Form 10-K (File No. 001-16609) with the SEC on March 15, 2012) | ||
10.23* | Schedule of 2012 Executive Officer Compensation.(1) | ||
10.24* | Schedule of Non-Employee Director Compensation.(1) | ||
10.25* | Offer Letter, dated as of May 31, 2012, between Larry C. Buckelew and Alliance HealthCare Services Inc. (Filed as Exhibit 10.30 to the Company’s Quarterly Report on Form 10-Q (File No. 001-16609) with the SEC on August 7, 2012) | ||
10.26* | Offer Letter, dated as of May 31, 2012, between Michael J. Shea and Alliance HealthCare Services Inc. (Filed as Exhibit 10.31 to the Company’s Quarterly Report on Form 10-Q (File No. 001-16609) with the SEC on August 7, 2012) | ||
10.27* | Offer Letter, dated as of July 29, 2013, between Percy C. Tomlinson and Alliance HealthCare Services Inc. (Filed as Exhibit 99.1 to the Company’s Current Report on Form 8-K (File No. 001-16609) with the SEC on August 2, 2013) | ||
10.28* | Executive Severance Agreement, dated October 1, 2013, between Percy C. Tomlinson and Alliance HealthCare Services, Inc. (Filed as Exhibit 99.2 to the Company’s Current Report on Form 8-K (File No. 001-16609) with the SEC on August 2, 2013) | ||
10.29* | Form of Restricted Stock Unit Award Agreement under the 1999 Equity Plan for Employees of Alliance and Subsidiaries (1) | ||
97
Exhibit No. | Description | ||
21.1 | Subsidiaries of the Registrant.(Incorporated by reference to the exhibit filed in response to Item 15(a)(3), “Exhibits” of the Company’s Annual Report on Form 10-K for the year ended December 31, 2006 (File No. 001-16609). | ||
23.1 | Consent of Independent Registered Public Accounting Firm.(1) | ||
31 | Certifications of Chief Executive Officer and Chief Financial Officer pursuant to Section 302 of the Sarbanes-Oxley Act of 2002.(1) | ||
32 | Certifications of Chief Executive Officer and Chief Financial Officer pursuant to Section 906 of the Sarbanes-Oxley Act of 2002.(1) | ||
101 | The following materials from Alliance’s Annual Report on Form 10-K for the year ended December 31, 2014, formatted in eXtensible Business Reporting Language (XBRL): (a) Consolidated Balance Sheets at December 31, 2014 and December 31, 2013; (b) Consolidated Statements of Operations and Comprehensive Income (Loss) for the years ended December 31, 2014, 2013 and 2012; (c) Consolidated Statements of Cash Flows for the years ended December 31, 2014, 2013 and 2012; (d) Consolidated Statements of Changes in Shareholders' Equity (Deficit); and (e) Notes to Consolidated Financial Statements.(1) | ||
_________________
(1) | Filed herewith. |
* | Management contract or compensatory plan or arrangement. |
98
SIGNATURES
Pursuant to the requirements of Section 13 or 15(d) of the Securities Exchange Act of 1934, the registrant has duly caused this report to be signed on its behalf by the undersigned, thereunto duly authorized.
ALLIANCE HEALTHCARE SERVICES, INC. | |||
March 16, 2015 | By: | /s/ PERCY C. TOMLINSON | |
Percy C. Tomlinson | |||
Chief Executive Officer (Principal Executive Officer) | |||
Pursuant to the requirements of the Securities Exchange Act of 1934, this report has been signed below by the following persons on behalf of the registrant and in the capacities indicated on March 16, 2015.
POWER OF ATTORNEY
KNOW ALL PERSONS BY THESE PRESENTS, that each person whose signature appears below constitutes and appoints Percy C. Tomlinson and Richard W. Johns, and each of them, with full power to act without the other, such person’s true and lawful attorneys-in-fact and agents, with full power of substitution and resubstitution, for him and in his name, place and stead, in any and all capacities, to sign this Annual Report on Form 10-K and any and all amendments thereto, and to file the same, with exhibits and schedules thereto, and other documents in connection therewith, with the Securities and Exchange Commission, granting unto said attorneys-in-fact and agents, and each of them, full power and authority to do and perform each and every act and thing necessary or desirable to be done in and about the premises, as fully to all intents and purposes as he might or could do in person, hereby ratifying and confirming all that said attorneys-in-fact and agents, or any of them, or their or his substitute or substitutes, may lawfully do or cause to be done by virtue hereof.
99
Signature | Title | |
/s/ PERCY C. TOMLINSON | ||
Percy C. Tomlinson | Chief Executive Officer (Principal Executive Officer) | |
/S/ HOWARD K. AIHARA | ||
Howard K. Aihara | Executive Vice President and Chief Financial Officer (Principal Financial Officer and Principal Accounting Officer) | |
/S/ LARRY C. BUCKELEW | ||
Larry C. Buckelew | Chairman of the Board of Directors | |
/S/ SCOTT A. BARTOS | ||
Scott A. Bartos | Director | |
/S/ AARON A. BENDIKSON | ||
Aaron A. Bendikson | Director | |
/S/ NEIL F. DIMICK | ||
Neil F. Dimick | Director | |
/S/ MICHAEL P. HARMON | ||
Michael P. Harmon | Director | |
/S/ CURTIS S. LANE | ||
Curtis S. Lane | Director | |
/S/ EDWARD L. SAMEK | ||
Edward L. Samek | Director | |
/S/ PAUL S. VIVIANO | ||
Paul S. Viviano | Director | |
100
ALLIANCE HEALTHCARE SERVICES, INC. AND SUBSIDIARIES
SCHEDULE II—VALUATION AND QUALIFYING ACCOUNTS
(Dollars in thousands)
Balance at Beginning of Period | Additions Charged to Expense | Deductions (Bad Debt Write-offs, net of Recoveries) | Balance at End of Period | |||||||||||||
Year ended December 31, 2014 | ||||||||||||||||
Allowance for Doubtful Accounts | $ | 5,158 | $ | 2,634 | $ | (3,737 | ) | $ | 4,055 | |||||||
Year ended December 31, 2013 | ||||||||||||||||
Allowance for Doubtful Accounts | $ | 5,317 | $ | 3,415 | $ | (3,574 | ) | $ | 5,158 | |||||||
Year ended December 31, 2012 | ||||||||||||||||
Allowance for Doubtful Accounts | $ | 7,914 | $ | 2,871 | $ | (5,468 | ) | $ | 5,317 | |||||||
101