Attached files
| file | filename |
|---|---|
| EXCEL - IDEA: XBRL DOCUMENT - Zoe's Kitchen, Inc. | Financial_Report.xls |
| EX-23.1 - EXHIBIT 23.1 - Zoe's Kitchen, Inc. | ex231pwcconsent.htm |
| EX-32.1 - EXHIBIT 32.1 - Zoe's Kitchen, Inc. | ex321906certification.htm |
| EX-31.2 - EXHIBIT 31.2 - Zoe's Kitchen, Inc. | ex312cfo302certification.htm |
| EX-31.1 - EXHIBIT 31.1 - Zoe's Kitchen, Inc. | ex311ceo302certification.htm |
UNITED STATES
SECURITIES AND EXCHANGE COMMISSION
Washington, D.C. 20549
FORM 10-K |
(Mark One)
þ ANNUAL REPORT PURSUANT TO SECTION 13 OR 15(d) OF THE SECURITIES EXCHANGE ACT OF 1934
For the fiscal year ended December 29, 2014
or
o TRANSITION REPORT PURSUANT TO SECTION 13 OR 15(d) OF THE SECURITIES EXCHANGE ACT OF 1934
For the transition period from to
Commission File No. 001-36411
ZOE'S KITCHEN, INC. (Exact name of registrant as specified in its charter) |
Delaware | 51-0653504 | |
(State or other jurisdiction of incorporation or organization) | (IRS Employer Identification No.) | |
5760 State Highway 121, Suite 250 Plano, Texas | 75024 | |
(Address of principal executive offices) | (Zip Code) | |
Registrant’s telephone number, including area code: (214) 436-8765 | ||
Securities registered pursuant to Section 12(b) of the Act: | ||
Title of each class | Name of each exchange on which registered | |
Common Stock, par value $0.01 per share | New York Stock Exchange | |
Securities registered pursuant to Section 12(g) of the Act: None | ||
Indicate by check mark if the registrant is a well-known seasoned issuer, as defined in Rule 405 of the Securities Act. Yes o No þ
Indicate by check mark if the registrant is not required to file reports pursuant to Section 13 or Section 15(d) of the Act. Yes o No þ
Indicate by check mark whether the registrant: (1) has filed all reports required to be filed by Section 13 or 15(d) of the Securities Exchange Act of 1934 during the preceding 12 months (or for such shorter period that the registrant was required to file such reports), and (2) has been subject to such filing requirements for the past 90 days. Yes þ No o
Indicate by check mark whether the registrant has submitted electronically and posted on its corporate Web site, if any, every Interactive Data File required to be submitted and posted pursuant to Rule 405 of Regulation S-T (§232.405 of this chapter) during the preceding 12 months (or for such shorter period that the registrant was required to submit and post such files). Yes þ No o
Indicate by check mark if disclosure of delinquent filers pursuant to Item 405 of Regulation S-K (§229.405 of this chapter) is not contained herein, and will not be contained, to the best of registrant’s knowledge, in definitive proxy or information statements incorporated by reference in Part III of this Form 10-K or any amendment to this Form 10-K. o
Indicate by check mark whether the registrant is a large accelerated filer, an accelerated filer, a non-accelerated filer, or a smaller reporting company. See the definitions of “large accelerated filer,” “accelerated filer” and “smaller reporting company” in Rule 12b-2 of the Exchange Act.
Large accelerated filer o | Accelerated filer o | |||
Non-accelerated filer þ | (Do not check if a smaller reporting company) | Smaller reporting company o | ||
Indicate by check mark whether the registrant is a shell company (as defined in Rule 12b-2 of the Exchange Act). Yes o No þ
As of July 14, 2014, the aggregate market value of the registrant's outstanding common equity held by non-affiliates was $265 million, based on the closing price of the registrant's common stock on such date, the last trading day of the registrant's most recently completed second fiscal quarter. For purposes of this calculation, shares of common stock held by each executive officer and director and by holders of more than 5% of the outstanding common stock have been excluded since those persons may under certain circumstances be deemed to be affiliates. This determination of affiliate status is not necessarily a conclusive determination for other purposes.
As of March 11, 2015, there were 19,292,246 shares of common stock outstanding, par value of $0.01 per share outstanding.
DOCUMENTS INCORPORATED BY REFERENCE
Part III hereof incorporates certain information by reference from the registrant's definitive proxy statement for its 2015 annual meeting of shareholders, which will be filed no later than 120 days after the close of the registrant's fiscal year ended December 29, 2014.
TABLE OF CONTENTS
PART I | |||
Page | |||
Item 1. | |||
Item 1A. | |||
Item 1B. | |||
Item 2. | |||
Item 3. | |||
Item 4. | |||
PART II | |||
Item 5. | |||
Item 6. | |||
Item 7. | |||
Item 7A. | |||
Item 8. | |||
Item 9. | |||
Item 9A. | |||
Item 9B. | |||
PART III | |||
Item 10. | |||
Item 11. | |||
Item 12. | |||
Item 13. | |||
Item 14. | |||
PART IV | |||
Item 15. | |||
Signatures | |||
Exhibits | |||
PART I
Item 1. Business
Our Company
Born in the Mediterranean. Raised in the South. Bringing Mediterranean Mainstream.
Zoës Kitchen is a fast growing, fast-casual restaurant concept serving a distinct menu of fresh, wholesome, Mediterranean-inspired dishes delivered with Southern hospitality. Founded in 1995 by Zoë and Marcus Cassimus in Birmingham, Alabama, Zoës Kitchen is a natural extension of Zoë Cassimus' lifetime passion for cooking Mediterranean meals for family and friends. Since opening our first restaurant, we have never wavered from our commitment to make our food fresh daily and to serve our customers in a warm and welcoming environment.
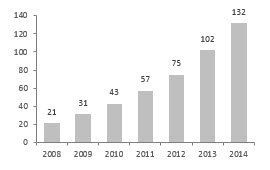
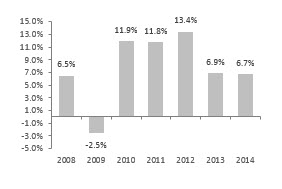
We believe our brand delivers on our customers' desire for freshly-prepared food and convenient, unique and high-quality experiences. We have grown from 21 restaurants across seven states, including five franchised locations, as of December 29, 2008 to 132 restaurants across 15 states, including three franchised locations, as of December 29, 2014, representing a CAGR of 36%. Our Company-owned restaurants have generated 20 consecutive fiscal quarters of positive comparable restaurant sales growth, due primarily to increases in customer traffic, which we believe demonstrates our growing brand equity. We have grown our Company-owned restaurant average unit volumes ("AUVs") from approximately $1.1 million in 2009 to approximately $1.5 million in 2014, representing an increase of 32.4% over that time period. Our growth in comparable restaurant sales since 2009 has allowed us to invest significant amounts of capital to drive growth through the opening of new restaurants and the hiring of personnel required to support our growth plans.
Total Restaurants at End of Fiscal Year | Comparable Restaurant Sales Growth | Average Unit Volumes (Dollars in thousands) | ||
 |  |  | ||
Our Concept
Delivering Goodness in the Communities We Serve.
The word "zoë," which means "life" in Greek, is embraced in every aspect of the Zoës Kitchen culture and is a key component of our concept. Our mission is to "deliver goodness from the inside out" by: (i) offering a differentiated menu of simple, tasty and fresh Mediterranean cuisine complemented with several Southern staples; (ii) extending genuine Southern hospitality with personality, including food delivered to your table; (iii) providing an inviting, cosmopolitan, casual-chic environment in our restaurants; and (iv) delivering an outstanding catering experience for business and social events. Our menu offers meals made generally from scratch using produce, proteins and other ingredients that are predominantly preservative- and additive-free, including our appetizers, soups, salads, and kabobs. We believe our team members are a reflection of our customers — educated, active and passionate — and embrace our culture of providing engaging, attentive service, which we believe helps drive brand advocacy. We believe we deliver a compelling value proposition by offering flavorful food that our customers feel good about eating and providing friendly customer service in an inviting atmosphere, all for an average per-customer spend of $9.98 in 2014. Our food, including both hot and cold items, is well suited for catering to a variety of business and social occasions, and we believe our strong catering offering is a significant competitive differentiator that generates consumer trial of our menu and provides additional opportunities for existing customers to enjoy our food off-premise. For 2014, catering represented approximately 16% of our revenue.
We believe we provide an emotional connection to our target customer — educated, affluent women and their families — who represent approximately 70% of our customer visits, based on internal estimates and third-party data. We promote our brand as an extension of our customers' own kitchens by offering meals inspired by family recipes which reminds them of food they may have prepared at home, while allowing them to spend extra time with family and friends to fuel a balanced and active lifestyle. We
4
believe our menu is appealing during both lunch and dinner, resulting in a balanced day-part mix of approximately 60% lunch and 40% dinner (excluding catering) for 2014.
Our Strengths
Live Mediterranean. Live Zoës!
We believe the following strengths differentiate us and serve as the foundation for our continued growth.
Our Food—Simple. Tasty. Fresh! We believe the Zoës Kitchen experience is driven by providing simple, tasty and fresh Mediterranean food at a compelling value to our customers. High-quality ingredients serve as the foundation of Zoës Kitchen. We prepare our food by utilizing traditional Mediterranean preparation methods such as grilling and baking. Our menu is a reflection of traditional Mediterranean cuisine, offering an abundance of fresh fruits, vegetables and herbs, grains, olive oil and lean proteins. We believe the variety on our menu allows people with different preferences to enjoy a meal together.
• | Simple. Our food is simply prepared and made to order in our scratch kitchens. Our cooking philosophy is rooted in rich traditions that celebrate food, rather than in fads or trends. From our hummus varieties, made fresh daily and served with warm pita bread, to our flavorful salads and kabobs, we serve real food. By real food, we mean food made from simple ingredients, such as raw vegetables, fruits and legumes. We serve food the way it was prepared 100 years ago — raw, grilled or baked. Our goodness is created through the careful selection of quality, wholesome ingredients, time-honored preparations inspired by Mediterranean culinary traditions, family recipes that have been passed down for generations and delivering balanced meals. |
• | Tasty. True to our heritage, the flavors in our menu are born in the Mediterranean and raised in the South. Inspired by family recipes and Zoë Cassimus' simple, fresh-from-the-garden sensibility, our menu features Mediterranean cuisine complemented with several Southern staples. We offer our customers wholesome, flavorful items such as our chicken, steak and salmon kabobs and chicken and spinach roll-ups (tortillas stuffed with feta cheese, grilled chicken, sundried tomatoes and spinach), each of which is served with a choice of a side item such as braised rosemary white beans, rice pilaf, pasta salad, roasted vegetables or seasonal fruit. Our culinary team delivers flavorful new menu additions with seasonal ingredients allowing our customers to "Live Mediterranean." One example is our Mediterranean Quinoa Salad where quinoa is combined with broccoli, tomatoes, onions and feta cheese to deliver a nutritious entrée packed with flavor. Our commitment to fresh food, combined with our traditional Mediterranean cooking philosophy, results in food options that are full of flavor. |
• | Fresh. We seek to provide customers with flavorful menu offerings that align with our customers' lifestyles. Fresh ingredients are delivered to our kitchens, and team members wash, cut and prepare food in our kitchens daily. We utilize grilling as the predominant method of cooking our food, and there are no microwaves or fryers in our restaurants. We cater to a variety of dietary needs by offering vegetarian, vegan, gluten-free and our calorie conscious Simply 500™ menu selections. We aim to provide food that makes our customers feel good about themselves and their decision to choose Zoës Kitchen. |
Differentiated Fast-Casual Lifestyle Brand with a Desirable and Loyal Customer Base. We believe the Zoës Kitchen brand reflects our customers' desire for convenient, unique and enjoyable experiences and their commitment to family, friends and enjoying every moment. We seek to deliver on these desires and to provide goodness to both the mind and the body by fueling our customers' active lifestyle with nutritious food that makes them feel great from the inside out. We believe we are an aspirational brand with broad appeal that our customers embrace as a reflection of their desired self-image — active, vibrant, sophisticated, genuine, caring and passionate, which results in customer advocacy and repeat visits. Based on third-party surveys, we estimate that approximately 94% of our surveyed customers intend to recommend Zoës Kitchen. We seek to strengthen our brand through grassroots marketing programs and the use of social media and technology aimed at building long-term relationships with our customers and inspiring lifelong brand advocates.
We provide a welcoming environment, attracting customers from a variety of demographic groups. We believe our combination of menu offerings, ambience and location is designed to appeal to educated and affluent women, who along with their families, represent approximately 70% of our customer visits. Our female customers generally lead active lifestyles, have an average annual household income of over $100,000 and a majority of them are college educated. We believe this demographic represents a highly-desirable customer base with strong influence on a family's mealtime decision-making and are strong brand advocates. We also believe they appreciate the authenticity of our brand and the quality of our menu offerings, admire that we are still cooking meals inspired by family recipes and feel good about the food they provide to themselves and their families when choosing Zoës Kitchen. Additionally, we believe our attractive demographic mix, high repeat visit rate and our ability to draw an average of approximately 2,500 customers to each of our restaurants per week makes us a desirable tenant to landlords and developers of lifestyle centers seeking to drive traffic to complementary retail businesses.
5
Delivering a Contemporary Mediterranean Experience with Southern Hospitality. We strive to provide an inviting and enjoyable customer experience through the atmosphere of our restaurants and the friendliness of our team members. Our restaurants, highlighted by our distinct Zoës Kitchen stripes drawn from the color palette of many seaside Mediterranean neighborhoods, are designed to be warm, welcoming and full of energy. Each of our restaurants has a unique layout to optimize the available space with consistent design cues that strive to balance the richness of dark wood with contemporary, colorful and cosmopolitan casual-chic décor. Our patios, a core feature of our restaurants, are an authentic part of both our Southern and Mediterranean heritage and we believe they provide a relaxing and welcoming dining environment. We invite the community to be a part of each restaurant by showcasing local items such as artwork by the children of our customers. Overall, we seek to create an environment that welcomes casual conversations, family moments or quick exchanges as our customers eat and enjoy a break from their busy schedules.
True to our Southern heritage, we aim to deliver hospitality and attentive service whether our customers choose to dine-in, take-out or host a catered event. Our team members are a reflection of our customers — educated, active and passionate. They are the heart and soul of what we call "Southern hospitality with personality" — making sure our customers feel as welcome as they are well fed. Our team members are trained to deliver personalized service and maintain a clean and inviting atmosphere that fosters a pleasant dining experience. We offer modified table service where, after ordering at the counter, our customers' food is served at their table on china with silverware. Our team members routinely check on them throughout the meal and then bus their table, all without the expectation of receiving a tip. We believe the atmosphere of our restaurants and the dedication of our team members encourages repeat visits, inspires advocacy and drives increased sales.
Diverse Revenue Mix Provides Multiple Levers for Growth. We believe our differentiated menu of both hot and cold food enables our customers to utilize our restaurant for multiple occasions throughout the day. We had a balanced day-part mix of approximately 60% lunch and 40% dinner (excluding catering), and our catering business represented approximately 16% of revenue, in each case, for 2014. We view catering as our third day-part, which helps to increase AUVs and brand awareness by introducing our concept to new customers through trial. We believe we effectively serve both small and large groups in our restaurants, as well as outside of our restaurants with our catering and home meal replacement alternatives, including our Zoës Fresh Take™ grab-and-go coolers and our Mediterranean Family Meals options. In addition, we also serve beer and wine in a majority of our restaurants. We believe the breadth of our offerings provides us multiple levers to continue to drive growth.
Attractive Unit Economic Model with Proven Portability. Our sophisticated, predictive site selection strategy and flexible new restaurant model have resulted in growth in markets of varying sizes as we have expanded our restaurant base utilizing in-line, end-cap and free-standing restaurant formats. We believe our strong performance across a variety of geographic areas and steady AUV growth are validation of our concept's portability. For 2014, our top 20 performing restaurants were spread across seven different states. We have experienced consistent AUV growth across all of our restaurant vintages.
Our restaurant model is designed to generate strong cash flow, attractive restaurant-level financial results and high returns on invested capital. We believe our unit economic model provides a return on investment that is attractive to investors and supports further use of cash flow to grow our restaurant base. Our new restaurant investment model targets an average cash build-out cost of approximately $750,000, net of tenant allowances, AUVs of $1.3 million and cash-on-cash returns in excess of 30% by the end of the third full year of operation. On average, new restaurants opened since the beginning of 2009 have exceeded these AUV and cash-on-cash return targets within the third year of operations. Additionally, since the majority of our restaurant base was built in 2009 or after, we believe our restaurants are well maintained and will likely require minimal additional capital expenditures in the near term, allowing a majority of our cash flow to be available for investment in new restaurant development and other growth initiatives.
Experienced Management Team. Our strategic vision and results-driven culture are directed by our senior management team under the leadership of Kevin Miles, who guided the growth of our Company from 22 to 132 restaurants. Mr. Miles joined Zoës Kitchen in 2009 as Executive Vice President of Operations. In 2011, he was promoted to President and Chief Operating Officer, and in 2012, he was promoted to Chief Executive Officer. Mr. Miles is a fast-casual industry veteran with over 20 years of relevant experience including leadership roles at La Madeleine French Bakery and Café, Baja Fresh Mexican Grill and Pollo Campero. He directs a team of dedicated and progressive leaders who are focused on executing our business plan and implementing our growth strategy. We believe our experienced management team is a key driver of our restaurant growth and positions us well for long-term growth.
Our Growth Strategies
Bringing Mediterranean Mainstream. We plan to execute the following strategies to continue to enhance our brand awareness and grow our revenue and achieve profitability.
6
Grow Our Restaurant Base. We have expanded our restaurant base from 21 restaurants in seven states in 2008 to 132 restaurants in 15 states as of December 29, 2014. We opened 30 in 2014 and we plan to open 31 to 33 Company-owned restaurants in 2015. We believe we are in the early stages of our growth story and estimate a long-term total restaurant potential in the United States in excess of 1,600 locations. We utilize a sophisticated site selection process using proprietary methods to identify target markets and expansion opportunities within those markets. Based on this analysis, we believe there is substantial development opportunity in both new and existing markets. We expect to double our restaurant base in approximately four years.
Increase Comparable Restaurant Sales. We have consistently demonstrated strong comparable restaurant sales growth, and we intend to generate future comparable restaurant sales growth with an emphasis on the following goals:
• | Heighten brand awareness to drive new customer traffic. We utilize a marketing strategy founded on inspiring brand advocacy rather than simply capturing customers through traditional tactics such as limited time offers. Our highly-targeted marketing strategy seeks to generate brand loyalty and promote advocacy by appealing to customers' emotional needs: (i) their passion for wholesome and flavorful food; (ii) their desire for simple solutions to make life more convenient; (iii) their focus on choices as a reflection of self; and (iv) their desire to be a guest at their own party. We have a long history of generating new traffic growth at our restaurants through the application of targeted advertising messages, local restaurant-level marketing and the word-of-mouth of our existing customers to build brand recognition in the markets we serve. |
• | Increase existing customer frequency. We believe we will be able to continue to increase customer frequency by consistently providing fresh Mediterranean cuisine at a compelling value. We intend to explore new menu additions by drawing upon the rich heritage and flavors of 21 Mediterranean countries and family recipes to enhance our offerings and encourage frequency. We will continue to explore ways to increase the number of occasions (lunch, dinner and catering) and the flexibility of dining options (dine-in, to-go/take home, call-in and online) for our customers to consume our food. We also plan to capitalize on the increasing demand for convenient, high-quality home meal replacement alternatives by expanding the food options in our Zoës Fresh Take™ grab-and-go coolers and Mediterranean Family Meals menu offerings, which include a salad, entrée and side items offered for approximately $30. |
• | Grow our catering business. Our management team has developed innovative solutions, loyalty programs and a dedicated team of sales professionals to enhance our catering offering. We believe our strong catering offering is a significant competitive differentiator and generates consumer trial of our brand as well as provides our existing customers additional ways to enjoy our food off-premise. We offer catering solutions for both business and social occasions, and we believe our hot and cold menu offerings differentiate our catering business as our food is portable and conducive to travel. We are focused on making catering easier for our customers, which we believe helps to promote brand advocacy by allowing customers to be a guest at their own party. We offer social catering solutions designed for our core customers' life events, including Zoës Party Packs, which are bundled catering packages for birthday parties, baby and bridal showers, sporting and outdoor events, girls night out and family gatherings. |
Improve Margins and Leverage Infrastructure. We have invested in our business, and we believe our corporate infrastructure can support a restaurant base greater than our existing footprint. As we continue to grow, we expect to drive greater efficiencies in our supply chain and leverage our technology and existing support infrastructure. Additionally, we believe we will be able to optimize labor costs at existing restaurants as our restaurant base matures and AUVs increase and leverage corporate costs over time to enhance margins as general and administrative expenses grow at a slower rate than our restaurant base and revenues.
Site Development and Expansion
Site Selection Process
We consider site selection and real estate development to be critical to our long-term success and devote significant resources to create predictable and successful new restaurant results. We have developed a targeted site evaluation and acquisition process incorporating management's experience as well as comprehensive data collection, analysis and interpretation. Our in-house real estate team has over 50 years of combined experience with brands such as Chipotle, Panera, Pei Wei, Starbucks and P.F. Chang's.
When making site selection decisions, we use sophisticated analytical tools designed to uncover key demographic and psychographic characteristics in addition to site specific characteristics, such as visibility, access, signage and traffic patterns, which we believe drive successful restaurant placement. We also consider factors, including daytime population characteristics and residential density, which impact our catering and dine-in businesses. On the ground research is also an important part of the site evaluation process. This includes evaluation of customer traffic patterns, future development in the market, retail synergy and the competitive restaurant landscape. We believe our disciplined process and in-depth analysis, coupled with the development experience of our management team, has contributed to our growth over the last six years.
7
Our sophisticated, predictive site selection strategy and flexible new restaurant model have resulted in growth in markets of varying sizes as we have expanded our restaurant base. We are able to utilize in-line, end-cap and free-standing restaurant formats to penetrate markets with a combination of suburban and urban restaurant locations. Additionally, we believe our target demographic and high repeat visit rate makes us a desirable tenant for landlords and developers seeking to attract consumers to their developments. We believe these factors provide our concept a great deal of flexibility in securing optimal real estate locations.
Our real estate process is governed by our internal Development Committee, which is composed of senior management including our Vice President of Development. The Development Committee meets periodically to review new site opportunities and to approve new locations. New sites are identified by our real estate team interfacing with local broker networks in each market. Once a location has been approved by our Development Committee, we begin a design process to align the characteristics and feel of the location to the trade area.
Expansion Strategy
While we continue to be positioned for additional restaurant growth in existing markets, expansion into new territories will be vital to executing our growth strategy. We employ a hub and spoke method to expansion whereby certain markets are denoted as hubs based on total market potential and geographic spacing. Surrounding spoke markets are subsequently developed as hub markets are penetrated and have reached sufficient brand awareness.
Expansion into new markets is triggered through the ongoing evaluation of existing market penetration with a goal of maintaining a deep pipeline of top-tier development opportunities. Our approach to identifying new markets for development is robust and systematic, providing an objective review of each market under consideration. Criteria for evaluating market expansion opportunities includes depth of target customer, geographic positioning relative to current restaurant base, estimated restaurant potential, projected unit economics, availability of premier site locations and competition penetration, among other things.
Restaurant Design
Restaurant design is handled by our in-house construction executives interfacing with outsourced vendor relationships. This approach permits us to maintain control over our design process without adding unnecessary headcount. Our restaurant size averages approximately 2,750 square feet. The dining area of a typical restaurant can seat approximately 80 people, with patios that seat approximately 30 people. We believe the atmosphere of our restaurants creates a warm, inviting environment where friends and family can gather for occasions of all types, encourages repeat visits, inspires brand advocacy and drives increased sales across day-parts.
Construction
Each new restaurant typically requires an annual cash build-out cost of approximately $750,000, net of tenant allowances, but this figure could be materially higher or lower depending on the market, restaurant size and condition of the premises upon landlord delivery. We generally construct restaurants in third-party leased retail space but also construct free-standing buildings on leased properties. In the future, we intend to continue converting existing third-party leased retail space or constructing new restaurants in the majority of circumstances. For additional information regarding our leases, see "Item 2 - Properties."
Restaurant Management and Operations
We refer to our approach to management and operations as "progressive and aggressive," and endeavor to run our company to create a superior customer experience by putting people first (both employees and customers).
Talent Acquisition and Training. Our ability to grow our restaurant base depends on hiring and investing in the growth of great talent, and acquiring and training our team members effectively is a significant focus for our company. We aim to hire people with a high desire to serve and please, that embrace the Zoës Kitchen culture and are a reflection of our customers: active, passionate and full of life. We employ an extensive screening process for our managers, including both behavioral and working interviews. Once hired, employees participate in a six week in-restaurant management training program, and all of our incumbent managers have been through this process. Each quarter we have approximately 30 new manager-in-training candidates at one of our 14 training restaurants, which are located across various geographic regions. This pipeline assures us that future growth can be supported and that every new Zoës Kitchen location is staffed with managers that are trained in both our brand and our standards.
We embrace technology and use it extensively to communicate with our employees. Our proprietary Lifeworks platform is designed to engage employees and create real connections, allowing both hourly and salaried employees to learn, connect and collaborate. Specific techniques like "gamification" and community generated content keep employees engaged. Our entire training process is now paperless, with online videos replacing traditional operating manuals. Lifeworks encourages interaction between employees across markets, helping to preserve culture, develop connections and share knowledge as we continue to
8
grow. Lifeworks also includes a learning methodology that embraces community generated content, allowing employees to make a tangible impact on the business, which we believe ultimately empowers them to deliver a superior customer experience.
Restaurant Management and Employees. Each restaurant typically is staffed with a restaurant manager, an assistant manager and as many as 20 to 30 team members. We cross-train our employees in an effort to create a depth of competency in our critical restaurant functions. Consistent with our emphasis on customer interaction, we encourage our restaurant managers and team members to welcome and interact with customers throughout the day. To lead our restaurant management teams, we have Regional Operators (each of whom is responsible for between two and twelve restaurants), as well as Regional Vice Presidents (each of whom is responsible for between seven and nine regions). To prepare for our restaurant growth and staffing needs, we train approximately 30 managers per quarter.
Food Preparation and Quality. We operate scratch kitchens, where food is prepared and cooked on site. We do not utilize pre-cooked proteins in our restaurants and do not use microwaves or fryers. We are committed to the hand-preparation of our food, including details like cutting fruit and vegetables in store and hand-crumbling feta cheese each morning because we believe that customers can taste the difference. We believe adhering to these standards is a competitive advantage for our Company and we have developed processes and procedures to train our employees on the techniques required to effectively operate a scratch kitchen.
Food safety is a top priority and we dedicate substantial resources, including our supply chain team and quality assurance teams, to help ensure that our customers enjoy safe, quality food products. We have taken various steps to mitigate food quality and safety risks, including having personnel focused on this goal together with our supply chain team. Our restaurants undergo third-party food safety reviews, internal safety audits and routine health inspections. We also consider food safety and quality assurance when selecting our distributors and suppliers.
Restaurant Marketing
Our marketing efforts seek to build brand awareness and increase sales through a variety of customer interactions and marketing initiatives. We focus our marketing strategy on highlighting our ability to provide customers with real food, which we believe directly impacts their psyche and delivers positive long-term emotional connections. By real food, we mean food made from simple ingredients like raw vegetables, fruits and legumes. We serve food the way it was prepared 100 years ago—raw, grilled, or baked. We utilize community-based restaurant marketing, as well as digital, social and traditional media tools, to highlight our competitive strengths, including our varied and healthful menu offerings and the value we offer our customers.
• | Shared, Earned, Owned. We believe our approach to social marketing is unique in that we seek to develop a relationship with each community member online, a reflection of our approach inside our restaurants. Across our social channels, including Facebook, Pinterest, Instagram and Twitter, we reach approximately 174,200 users combined, which allows us to connect directly to our customers and to keep them informed about new menu offerings, promotions and events and build online relationships. In addition, customers can opt into our e-mail marketing program or download our custom mobile LIFE app, which combined consists of approximately 447,000 unique members. Our mobile app includes customer engagement, customer satisfaction measurement and mobile ordering capabilities. Integrating these solutions has enabled us to reach a significant number of people in a timely and targeted fashion at a fraction of the cost of traditional media. We believe that our customers are experienced internet users and will use social media to make dining decisions, share meaningful content or advocate for brands they enjoy. Our media tools also include advertising in local and regional print media, targeted direct mail aimed at delivering trial in new markets and highly targeted cross promotions with like-minded brands. |
• | Local Restaurant Marketing. We believe we differentiate our business through a strategic, community-based approach to building brand awareness and customer loyalty. We refer to this internally as "Delivering Goodness." We use a wide range of local marketing initiatives to increase the frequency of and occasions for visits, and to encourage people to "Live Mediterranean." We empower our restaurant managers to selectively organize events to bring new customers into our restaurants. Additionally, we engage in a variety of promotional activities, such as contributing food, time and money to charitable, civic and cultural programs, in order to give back to the communities we serve and increase public awareness and appreciation of our restaurants and our employees. For example, in May 2013 we launched a campaign sponsoring Zoe Romano to run the Tour de France, to drive awareness and raise funds for the World Pediatric Project. Additionally, since our founding in 1995, our restaurants have partnered with local schools and children's groups to display children's art at our restaurants as part of our Zoës Kitchen Celebrates Children! Artwork Program. The art is available for sale to the public as a donation, with proceeds from sales going directly to the participating school or organization. |
9
• | New Menu Introductions. We focus efforts on new menu offerings to broaden our appeal to customers and further substantiate our position as a leading brand in Mediterranean cuisine. We believe these additions deliver prompt consumer action, resulting in more immediate increases in customer traffic. |
• | Creating New Dining Opportunities. We focus on ways we can serve customers at different times and in new places. Our Mediterranean Family Meals have been a popular item allowing customers to quickly feed their family a balanced meal at a great value. In addition, we offer group options like Zoës Party Packs for eight to ten where customers can enjoy bundled items designed for birthday parties, baby and bridal showers, sporting and outdoor events, girls' nights and family gatherings. We market this new offering in a variety of ways, including in-restaurant posters, integrated social media campaigns and direct marketing to current catering customers. |
• | Internal Marketing. We believe our employees are one of our best marketing assets. We invest time, energy and resources towards education on our brand and developing long-term brand advocates from each employee. These employees help propagate the mission of "Delivering Goodness" and promote key points of differentiation. |
Suppliers
Maintaining a high degree of quality in our restaurants depends in part on our ability to acquire fresh ingredients and other necessary supplies that meet our specifications from reliable suppliers. We carefully select suppliers based on quality and their understanding of our brand, and we seek to develop mutually beneficial long-term relationships with them. We work closely with our suppliers and use a mix of forward, fixed and formula pricing protocols. We have tried to increase, in some cases, the number of suppliers for our ingredients, which we believe can help mitigate pricing volatility, and we monitor industry news, trade issues, weather, crises and other world events that may affect supply prices.
We contract with multiple suppliers including Sysco Corporation ("Sysco"), one of the largest distributors of food and related products to the U.S. food service industry. In 2014, our Sysco spend was a substantial amount of our cost of sales. Our remaining food supplies are distributed by other distributors under separate contracts. Our distributors deliver supplies to our restaurants approximately two to four times per week.
We negotiate pricing and volume terms directly with certain suppliers, distributors and Sysco. Poultry represented approximately 16% of our total cost of sales for 2014. We are subject to weekly market fluctuations under our current pricing agreements, with respect to poultry. Beef represented approximately 9% of our total costs of sales for 2014. Produce and paper products represented approximately 21% and 13%, respectively, of our total cost of sales for 2014. Feta cheese represented approximately 4% of our total cost of sales for 2014. We have pricing agreements that reset annually, with respect to feta cheese. We have identified secondary suppliers for many of our significant products, and we believe we would be able to source our product requirements from different suppliers if necessary.
Competition
We compete in the restaurant industry, primarily in the fast-casual segment but also with restaurants in other segments. We face significant competition from a wide variety of restaurants, convenience stores, grocery stores and other outlets on a national, regional and local level. We believe that we compete primarily based on product quality, restaurant concept, ambience, service, location, convenience, value perception and price. Our competition continues to intensify as competitors increase the breadth and depth of their product offerings and open new restaurants. Additionally, we compete with local and national fast-casual restaurant concepts, specialty restaurants and other retail concepts for prime restaurant locations.
Seasonality
Seasonal factors and the timing of holidays cause our revenue to fluctuate from quarter to quarter. Our sales per restaurant is typically lower in the first and fourth quarters due to reduced winter and holiday traffic and higher in the second and third quarters. Adverse weather conditions during our most favorable months or periods may also affect customer traffic. In addition, we have outdoor seating at all of our restaurants, and the effects of adverse weather may impact the use of these areas and may negatively impact our revenues.
Intellectual Property and Trademarks
We own a number of trademarks and service marks registered or pending with the U.S. Patent and Trademark Office ("PTO"). We have registered the following marks with the PTO: Zoës Kitchen; Zoe's Kitchen; Simple. Tasty. Fresh!; Zoës Fresh Take; Eat Smart Eat Fresh; and Simply 500. We also have certain trademarks pending in in the U.S. and certain foreign countries as well. In addition, we have registered the Internet domain name www.zoeskitchen.com. The information on, or that can be accessed through, our website is not part of this report.
10
An important part of our intellectual property strategy is the monitoring and enforcement of our rights in markets in which our restaurants currently exist or markets which we intend to enter in the future. We also monitor trademark registers to oppose the applications to register confusingly similar trademarks or to limit the expansion of the scope of goods and services covered by existing similar trademarks. We enforce our rights through a number of methods, including the issuance of cease-and-desist letters or making infringement claims in federal court.
We believe that our trademarks, service marks and other intellectual property rights have significant value and are important to the marketing of our brand, and it is our policy to protect and defend vigorously our rights to such intellectual property. However, we cannot predict whether steps taken to protect such rights will be adequate. See "Item 1A - Risk Factors—Risks Related to Our Business and Industry—We may not be able to adequately protect our intellectual property, which could harm the value of our brand and adversely affect our business."
Governmental Regulation and Environmental Matters
We and our franchisees are subject to extensive and varied federal, state and local government regulation, including regulations relating to public and occupational health and safety, sanitation and fire prevention. We operate each of our restaurants in accordance with standards and procedures designed to comply with applicable codes and regulations. However, an inability to obtain or retain health department or other licenses would adversely affect our operations. Although we have not experienced, and do not anticipate, any significant difficulties, delays or failures in obtaining required licenses, permits or approvals, any such problem could delay or prevent the opening of, or adversely impact the viability of, a particular restaurant or group of restaurants.
In addition, in order to develop and construct restaurants, we must comply with applicable zoning, land use and environmental regulations. Such regulations have not had a material effect on our operations to date, but more stringent and varied requirements of local governmental bodies could delay or even prevent construction and increase development costs for new restaurants. We are also required to comply with the accessibility standards mandated by the United States American with Disabilities Act (the "ADA"), which generally prohibits discrimination in accommodation or employment based on disability. We may in the future have to modify restaurants, by adding access ramps or redesigning certain architectural fixtures for example, to provide service to or make reasonable accommodations for disabled persons. While these expenses could be material, our current expectation is that any such actions will not require us to expend substantial funds.
Less than 1% of our revenues is attributable to the sale of alcoholic beverages. Alcoholic beverage control regulations require each of our restaurants to apply to a state authority and, in certain locations, county or municipal authorities for a license that must be renewed annually and may be revoked or suspended for cause at any time. Alcoholic beverage control regulations relate to numerous aspects of daily operations of our restaurants, including the minimum age of patrons and employees, hours of operation, advertising, trade practices, wholesale purchasing, other relationships with alcohol manufacturers, wholesalers and distributors, inventory control and handling, storage and dispensing of alcoholic beverages. We are also subject in certain states to "dram shop" statutes, which generally provide a person injured by an intoxicated person the right to recover damages from an establishment that wrongfully served alcoholic beverages to the intoxicated person. We carry liquor liability coverage as part of our existing comprehensive general liability insurance.
In addition, we are subject to the U.S. Fair Labor Standards Act, the U.S. Immigration Reform and Control Act of 1986, the Occupational Safety and Health Act and various other federal and state laws governing similar matters including minimum wages, overtime, workplace safety and other working conditions. We may also be subject to lawsuits from our employees, the U.S. Equal Employment Opportunity Commission or others alleging violations of federal and state laws regarding workplace and employment matters, discrimination and similar matters, and we have been party to such matters in the past. We are also subject to various laws and regulations relating to our current and any future franchise operations.
The Patient Protection and Affordable Care Act of 2010 (the "PPACA"), enacted in March 2010, requires chain restaurants with 20 or more locations in the United States operating under the same name and offering substantially the same menus to publish the total number of calories of standard menu items on menus and menu boards, along with a statement that puts this calorie information in the context of a total daily calorie intake. A number of states, counties and cities have also enacted menu labeling laws requiring multi-unit restaurant operators to disclose certain nutritional information to customers, or have enacted legislation restricting the use of certain types of ingredients in restaurants. Many of these requirements are inconsistent or are interpreted differently from one jurisdiction to another. While our ability to adapt to consumer preferences is a strength of our concepts, the effect of such labeling requirements on consumer choices, if any, is unclear at this time.
There is also a potential for increased regulation of certain food establishments in the United States, where compliance with a Hazard Analysis and Critical Control Policies ("HACCP") approach may now be required. HACCP refers to a management system in which food safety is addressed through the analysis and control of potential hazards from production, procurement and handling, to manufacturing, distribution and consumption of the finished product. Many states have required restaurants to develop and implement HACCP Systems and the United States government continues to expand the sectors of the food industry
11
that must adopt and implement HACCP programs. For example, the Food Safety Modernization Act (the "FSMA"), signed into law in January 2011, granted the FDA new authority regarding the safety of the entire food system, including through increased inspections and mandatory food recalls. Although our current restaurants are specifically exempted from or not directly implicated by some of these new requirements, we anticipate that the new requirements may impact our industry. Additionally, our suppliers may initiate or otherwise be subject to food recalls that may impact the availability of certain products, result in adverse publicity or require us to take actions that could be costly for us or otherwise harm our business.
We are also subject to laws and regulations relating to information security, privacy, cashless payments, gift cards and consumer credit, protection and fraud, and any failure or perceived failure to comply with these laws and regulations could harm our reputation or lead to litigation, which could adversely affect our financial condition.
We are subject to federal, state and local environmental laws and regulations concerning waste disposal, pollution, protection of the environment, and the presence, discharge, storage, handling, release and disposal of, or exposure to, hazardous or toxic substances ("environmental laws"). These environmental laws can provide for significant fines and penalties for non-compliance and liabilities for remediation, sometimes without regard to whether the owner or operator of the property knew of, or was responsible for, the release or presence of the hazardous or toxic substances. Third-parties may also make claims against owners or operators of properties for personal injuries and property damage associated with releases of, or actual or alleged exposure to, such substances. We are not aware of any environmental laws that will materially affect our earnings or competitive position, or result in material capital expenditures relating to our restaurants. However, we cannot predict what environmental laws will be enacted in the future, how existing or future environmental laws will be administered, interpreted or enforced, or the amount of future expenditures that we may need to make to comply with, or to satisfy claims relating to, environmental laws. It is possible that we will become subject to environmental liabilities at our properties, and any such liabilities could materially affect our business, financial condition or results of operations.
Management Information Systems
All of our restaurants use computerized point-of-sale and back-office systems created based on leading edge technology, which we believe are scalable to support our future growth plans. These point-of-sale computers are designed specifically for the restaurant industry. The system provides a touch screen interface, a graphical order confirmation display and integrated, high-speed credit card and gift card processing. The point-of-sale system is used to collect daily transaction data, which generates information about daily sales, product mix and average check that we actively analyze. All products sold and prices at our restaurants are programmed into the system from our home office.
Our in-restaurant back office computer system is designed to assist in the management of our restaurants and provide labor and food cost management tools. These tools provide home office and restaurant operations management quick access to detailed business data and reduces restaurant managers' time spent on administrative needs. The system provides our restaurant managers the ability to submit orders electronically with our distribution network. The system also supplies sales, bank deposit and variance data to our accounting department on a daily basis. We use this data to generate daily sales information and weekly consolidated reports regarding sales and other key measures, as well as preliminary weekly detailed profit and loss statements for each location with final reports following the end of each period.
Employees
As of December 29, 2014, we had 3,070 employees, including 94 home office and regional personnel, 273 restaurant level managers and assistant managers and 2,703 hourly employees. None of our employees are unionized or covered by a collective bargaining agreement, and we consider our current employee relations to be good.
Franchising
As of December 29, 2014, we had three franchised restaurants in one state. Our franchise arrangements grant third-parties a license to establish and operate a restaurant using our systems and our trademarks in a given area. The franchisee pays us for the ideas, strategy, marketing, operating system, training, purchasing power and brand recognition. Franchised restaurants must be operated in compliance with our methods, standards and specifications, regarding menu items, ingredients, materials, supplies, services, fixtures, furnishings, décor and signs.
Available Information
We are subject to the information and periodic and current reporting requirements of the Exchange Act, and, in accordance therewith, we file periodic and current reports, proxy statements and other information with the SEC. Such periodic and current reports, proxy statements and other information will be available to the public on the SEC's website at www.sec.gov and free of charge through our website at www.zoeskitchen.com. To receive copies of public records not posted to the SEC's website at prescribed rates, you may complete an online form at www.sec.gov, send a fax to (202) 772-9337 or submit a written request to
12
the SEC, Office of FOIA/PA Operations, 100 F Street, N.E., Washington, D.C. 20549. Please call the SEC at 1-800-SEC-0330 for further information. Please note that our website address is provided as an inactive textual reference only. The information contained on, or accessible through, our website is not part of this report and is therefore not incorporated by reference.
13
Item 1A. Risk Factors
Special Note Regarding Forward-Looking Statements.
This report contains forward-looking statements within the meaning of the Private Securities Litigation Reform Act of 1995 that involve risks and uncertainties, including but not limited to the risks and uncertainties discussed under "Item 1A - Risk Factors," "Item 7 - Management’s Discussion and Analysis of Financial Condition and Results of Operations" and "Item 1 - Business." In some cases, you can identify forward-looking statements by terms such as "may," "might," "will," "objective," "intend," "should," "could," "can," "would," "expect," "believe," "design," "estimate," "predict," "potential," "plan" or the negative of these terms, and similar expressions intended to identify forward-looking statements. These statements involve known and unknown risks, uncertainties and other factors that may cause our actual results, performance or achievements to be materially different from any future results, performances or achievements expressed or implied by the forward-looking statements. We discuss these risks, uncertainties and other factors in greater detail below. These statements reflect our current views with respect to future events and are based on currently available operating, financial and competitive information. Unless required by United States federal securities laws, we do not intend to update any of these forward-looking statements to reflect circumstances or events that occur after the statement is made.
Risks Related to Our Business and Industry
Our long-term success is highly dependent on our ability to open new restaurants and is subject to many unpredictable factors.
One of the key means of achieving our growth strategy will be through opening new restaurants and operating those restaurants on a profitable basis. We expect this to be the case for the foreseeable future. In 2014, we opened 30 Company-owned restaurants and we plan to open 31 to 33 Company-owned restaurants in 2015. We may not be able to open new restaurants as quickly as planned. In the past, we have experienced delays in opening some restaurants, including due to the landlord's failure to turn over the premises to us on a timely basis. Such delays could happen again in future restaurant openings. Delays or failures in opening new restaurants could materially and adversely affect our growth strategy and our business, financial condition and results of operations. As we operate more restaurants, our rate of expansion relative to the size of our restaurant base will eventually decline.
In addition, one of our biggest challenges is locating and securing an adequate supply of suitable new restaurant sites in our target markets. Competition for those sites is intense, and other restaurant and retail concepts that compete for those sites may have unit economic models that permit them to bid more aggressively for those sites than we can. There is no guarantee that a sufficient number of suitable sites will be available in desirable areas or on terms that are acceptable to us in order to achieve our growth plan. Our ability to open new restaurants also depends on other factors, including:
• | negotiating leases with acceptable terms; |
• | identifying, hiring and training qualified employees in each local market; |
• | timely delivery of leased premises to us from our landlords and punctual commencement of our build-out construction activities; |
• | managing construction and development costs of new restaurants, particularly in competitive markets; |
• | obtaining construction materials and labor at acceptable costs, particularly in urban markets; |
• | unforeseen engineering or environmental problems with leased premises; |
• | generating sufficient funds from operations or obtaining acceptable financing to support our future development; |
• | securing required governmental approvals, permits and licenses (including construction permits and liquor licenses) in a timely manner and responding effectively to any changes in local, state or federal laws and regulations that adversely affect our costs or ability to open new restaurants; and |
• | avoiding the impact of inclement weather, natural disasters and other calamities. |
Our progress in opening new restaurants from quarter to quarter may occur at an uneven rate. If we do not open new restaurants in the future according to our current plans, the delay could materially adversely affect our business, financial condition and results of operations.
We intend to develop new restaurants in our existing markets, expand our footprint into adjacent markets and selectively enter into new markets. However, there are numerous factors involved in identifying and securing an appropriate site, including, but not limited to: identification and availability of suitable locations with the appropriate population demographics, traffic patterns, local retail and business attractions and infrastructure that will drive high levels of customer traffic and sales per restaurant; consumer tastes in new geographic locations and acceptance of our restaurant concept; financial conditions affecting developers and potential landlords, such as the effects of macro-economic conditions and the credit market, which could lead to these parties delaying or canceling development projects (or renovations of existing projects), in turn reducing the number of appropriate
14
locations available; developers and potential landlords obtaining licenses or permits for development projects on a timely basis; anticipated commercial, residential and infrastructure development near our new restaurants; and availability of acceptable lease arrangements.
We may not be able to successfully develop critical market presence for our brand in new geographical markets, as we may be unable to find and secure attractive locations, build name recognition or attract new customers. If we are unable to fully implement our development plan, our business, financial condition and results of operations could be materially adversely affected.
Our expansion into new markets may present increased risks.
We plan to open restaurants in markets where we have little or no operating experience. Restaurants we open in new markets may take longer to reach expected sales and profit levels on a consistent basis and may have higher construction, occupancy or operating costs than restaurants we open in existing markets, thereby affecting our overall profitability. New markets may have competitive conditions, consumer tastes and discretionary spending patterns that are more difficult to predict or satisfy than our existing markets. We may need to make greater investments than we originally planned in advertising and promotional activity in new markets to build brand awareness. We may find it more difficult in new markets to hire, motivate and keep qualified employees who share our vision, passion and culture. We may also incur higher costs from entering new markets if, for example, we assign regional managers to manage comparatively fewer restaurants than in more developed markets. As a result, these new restaurants may be less successful or may achieve target AUVs at a slower rate. If we do not successfully execute our plans to enter new markets, our business, financial condition and results of operations could be materially adversely affected.
Changes in economic conditions and adverse weather and other unforeseen conditions could materially affect our ability to maintain or increase sales at our restaurants or open new restaurants.
The restaurant industry depends on consumer discretionary spending. The United States in general or the specific markets in which we operate may suffer from depressed economic activity, recessionary economic cycles, higher fuel or energy costs, low consumer confidence, high levels of unemployment, reduced home values, increases in home foreclosures, investment losses, personal bankruptcies, reduced access to credit or other economic factors that may affect consumer discretionary spending. Traffic in our restaurants could decline if consumers choose to dine out less frequently or reduce the amount they spend on meals while dining out. Negative economic conditions might cause consumers to make long-term changes to their discretionary spending behavior, including dining out less frequently on a permanent basis. In addition, given our geographic concentrations in the South, South-East and Mid-Atlantic regions of the United States, economic conditions in those particular areas of the country could have a disproportionate impact on our overall results of operations, and regional occurrences such as local strikes, terrorist attacks, increases in energy prices, adverse weather conditions, tornadoes, earthquakes, hurricanes, floods, droughts, fires or other natural or man-made disasters could materially adversely affect our business, financial condition and results of operations. Adverse weather conditions may also impact customer traffic at our restaurants, and, in more severe cases, cause temporary restaurant closures, sometimes for prolonged periods. All of our restaurants have outdoor seating, and the effects of adverse weather may impact the use of these areas and may negatively impact our revenues. If restaurant sales decrease, our profitability could decline as we spread fixed costs across a lower level of sales. Reductions in staff levels, asset impairment charges and potential restaurant closures could result from prolonged negative restaurant sales, which could materially adversely affect our business, financial condition and results of operations.
New restaurants, once opened, may not be profitable, and the increases in average restaurant sales and comparable restaurant sales that we have experienced in the past may not be indicative of future results.
Some of our restaurants open with an initial start-up period of higher than normal sales volumes, which subsequently decrease to stabilized levels. Typically, our new restaurants have stabilized sales after approximately 12 to 24 weeks of operation, at which time the restaurant's sales typically begin to grow on a consistent basis. However, we cannot assure you that this will occur for future restaurant openings. In new markets, the length of time before average sales for new restaurants stabilize is less predictable and can be longer as a result of our limited knowledge of these markets and consumers' limited awareness of our brand. New restaurants may not be profitable and their sales performance may not follow historical patterns. In addition, our average restaurant sales and comparable restaurant sales may not increase at the rates achieved over the past several years. Our ability to operate new restaurants profitably and increase average restaurant sales and comparable restaurant sales will depend on many factors, some of which are beyond our control, including:
• | consumer awareness and understanding of our brand; |
• | general economic conditions, which can affect restaurant traffic, local labor costs and prices we pay for the food products and other supplies we use; |
• | changes in consumer preferences and discretionary spending; |
• | competition, either from our competitors in the restaurant industry or our own restaurants; |
15
• | temporary and permanent site characteristics of new restaurants; |
• | changes in government regulation; and |
• | other unanticipated increases in costs, any of which could give rise to delays or cost overruns. |
If our new restaurants do not perform as planned, our business and future prospects could be harmed. In addition, if we are unable to achieve our expected average restaurant sales, our business, financial condition and results of operations could be adversely affected.
Our sales growth and ability to achieve profitability could be adversely affected if comparable restaurant sales are less than we expect.
The level of comparable restaurant sales, which represent the change in year-over-year sales for restaurants open for at least 18 full periods, will affect our sales growth and will continue to be a critical factor affecting our ability to generate profits because the profit margin on comparable restaurant sales is generally higher than the profit margin on new restaurant sales. Our ability to increase comparable restaurant sales depends in part on our ability to successfully implement our initiatives to build sales. It is possible such initiatives will not be successful, that we will not achieve our target comparable restaurant sales growth or that the change in comparable restaurant sales could be negative, which may cause a decrease in sales growth and ability to achieve profitability that would materially adversely affect our business, financial condition and results of operations. See "Item 7 - Management's Discussion and Analysis of Financial Condition and Results of Operations—Key Measures We Use to Evaluate Our Performance—Comparable Restaurant Sales Growth."
Our failure to manage our growth effectively could harm our business and operating results.
Our growth plan includes a significant number of new restaurants. Our existing restaurant management systems, administrative staff, financial and management controls and information systems may be inadequate to support our planned expansion. Those demands on our infrastructure and resources may also adversely affect our ability to manage our existing restaurants. Managing our growth effectively will require us to continue to enhance these systems, procedures and controls and to hire, train and retain managers and team members. We may not respond quickly enough to the changing demands that our expansion will impose on our management, restaurant teams and existing infrastructure which could harm our business, financial condition and results of operations.
We believe our culture, from the restaurant-level up through management, is an important contributor to our growth. As we grow, however, we may have difficulty maintaining our culture or adapting it sufficiently to meet the needs of our operations. Among other important factors, our culture depends on our ability to attract, retain and motivate employees who share our enthusiasm and dedication to our concept. Historically, qualified individuals have been in short supply and our inability to attract and retain them would limit the success of our new restaurants, as well as our existing restaurants. Our business, financial condition and results of operations could be materially adversely affected if we do not maintain our infrastructure and culture as we grow.
We have experienced net losses in the past, and we may experience net losses in the future.
We experienced net losses of $10.0 million, $3.7 million and $0.3 million in 2014, 2013 and 2012, respectively. We may experience net losses in the future, and we cannot assure you that we will achieve profitability in future periods.
Our ability to use our net operating loss carryforwards and certain other tax attributes will be limited.
As of December 29, 2014, we had federal net operating loss carryforwards of $13.7 million and state net operating loss carryforwards of $12.7 million. Under Sections 382 and 383 of the Internal Revenue Code of 1986, as amended, or the Code, if a corporation undergoes an "ownership change," the corporation's ability to use its pre-change net operating loss carryforwards and other pre-change tax attributes to offset its post-change income may be limited. In general, an "ownership change" generally occurs if there is a cumulative change in our ownership by "5-percent shareholders" that exceeds 50 percentage points over a rolling three-year period. Similar rules may apply under state tax laws. We have experienced ownership changes as a result of our IPO and follow-on offerings completed on August 19, 2014 and November 19, 2014. As a result of our ownership changes, if we earn net taxable income, our ability to use our pre-change net operating loss carryforwards, or other pre-change tax attributes, to offset U.S. federal and state taxable income will be subject to limitations. Currently, we do not anticipate these limitations having a significant impact on our future ability to utilize net operating losses. Those net operating loss carryforwards resulted in a deferred tax asset of $5.2 million at December 29, 2014. A full valuation allowance of $9.3 million is recorded against the net deferred tax assets, exclusive of indefinite-lived intangibles, including these carryforwards.
The planned rapid increase in the number of our restaurants may make our future results unpredictable.
In 2014, we opened 30 Company-owned restaurants, and we plan to open 31 to 33 Company-owned restaurants in 2015. We intend to continue to increase the number of our restaurants in the next several years. This growth strategy and the substantial
16
investment associated with the development of each new restaurant may cause our operating results to fluctuate and be unpredictable or adversely affect our profits. Our future results depend on various factors, including successful selection of new markets and restaurant locations, local market acceptance of our restaurants, consumer recognition of the quality of our food and willingness to pay our prices, the quality of our operations and general economic conditions. In addition, as has happened when other restaurant concepts have tried to expand, we may find that our concept has limited appeal in new markets or we may experience a decline in the popularity of our concept in the markets in which we operate. Newly opened restaurants or our future markets and restaurants may not be successful or our system-wide average restaurant sales may not increase at historical rates, which could materially adversely affect our business, financial condition and results of operations.
Opening new restaurants in existing markets may negatively affect sales at our existing restaurants.
The consumer target area of our restaurants varies by location, depending on a number of factors, including population density, other local retail and business attractions, area demographics and geography. As a result, the opening of a new restaurant in or near markets in which we already have restaurants could adversely affect sales at these existing restaurants. Existing restaurants could also make it more difficult to build our consumer base for a new restaurant in the same market. Our core business strategy does not entail opening new restaurants that we believe will materially affect sales at our existing restaurants, but we may selectively open new restaurants in and around areas of existing restaurants that are operating at or near capacity to effectively serve our customers. Sales cannibalization between our restaurants may become significant in the future as we continue to expand our operations and could affect our sales growth, which could, in turn, materially adversely affect our business, financial condition and results of operations.
We face significant competition from other restaurant companies, and our inability to compete effectively may affect our traffic, sales and restaurant contribution.
The restaurant industry is intensely competitive with many well-established companies that compete directly and indirectly with us. We compete in the restaurant industry with national, regional and locally-owned limited service restaurants and full-service restaurants. We face competition from the casual dining, quick-service and fast-casual segments of the restaurant industry. These segments are highly competitive with respect to, among other things, taste, price, food quality and presentation, service, location and the ambience and condition of each restaurant. Our competition includes a variety of locally owned restaurants and national and regional chains offering dine-in, carry-out, delivery and catering services. Many of our competitors have existed longer and have a more established market presence with substantially greater financial, marketing, personnel and other resources than we do. Among our competitors are a number of multi-unit, multi-market fast-casual restaurant concepts, some of which are expanding nationally. As we expand, we will face competition from these concepts as well as new competitors that strive to compete with our market segments. For example, additional competitive pressures come from the deli sections and in-store cafés of grocery store chains, as well as from convenience stores and online meal preparation sites. These competitors may have, among other things, lower operating costs, better locations, better facilities, better management, more effective marketing and more efficient operations. Additionally, we face the risk that new or existing competitors will copy our business model, menu options, presentation or ambiance, among other things.
Several of our competitors compete by offering menu items that are specifically identified as organic, GMO free or healthier for consumers. Many of our quick-service restaurant competitors offer lower-priced menu options. Any inability to successfully compete with the restaurants in our markets will place downward pressure on our customer traffic and may prevent us from increasing or sustaining our revenues and profitability. Consumer tastes, nutritional and dietary trends, traffic patterns and the type, number and location of competing restaurants often affect the restaurant business, and our competitors may react more efficiently and effectively to those conditions. Our sales could decline due to changes in popular tastes, "fad" food regimens, such as low carbohydrate diets, and media attention on new restaurants. If we are unable to continue to compete effectively, our traffic, sales and restaurant contribution could decline and our business, financial condition and results of operations would be adversely affected.
Damage to our reputation could negatively impact our business, financial condition and results of operations.
Our growth is dependent in part upon our ability to maintain and enhance the value of our brand, consumers' connection to our brand and positive relationships with our franchisees. We believe we have built our reputation on the high-quality of our food, service and staff, as well as on our culture and the ambience in our restaurants, and we must protect and grow the value of our brand to continue to be successful in the future. Any incident that erodes consumer affinity for our brand could significantly reduce its value and damage our business. For example, our brand value could suffer and our business could be adversely affected if customers perceive a reduction in the quality of our food, service or staff, or an adverse change in our culture or ambience, or otherwise believe we have failed to deliver a consistently positive experience.
We may be adversely affected by news reports or other negative publicity regardless of their accuracy, regarding food quality issues, public health concerns, illness, safety, injury, customer complaints or litigation, health inspection scores, integrity of our or
17
our suppliers' food processing, employee relationships or government or industry findings concerning our restaurants, restaurants operated by other foodservice providers or others across the food industry supply chain. The risks associated with such negative publicity cannot be completely eliminated or mitigated and may materially harm our results of operations and result in damage to our brand. For multi-location food service businesses such as ours, the negative impact of adverse publicity relating to one restaurant or a limited number of restaurants may extend far beyond the restaurants or franchises involved to affect some or all of our other restaurants or franchises. The risk of negative publicity is particularly great with respect to our franchised restaurants because we are limited in the manner in which we can regulate them, especially on a real-time basis. A similar risk exists with respect to unrelated food service businesses, if consumers associate those businesses with our own operations.
Additionally, employee claims against us based on, among other things, wage and hour violations, discrimination, harassment or wrongful termination may also create negative publicity that could adversely affect us and divert our financial and management resources that would otherwise be used to benefit the future performance of our operations. A significant increase in the number of these claims or an increase in the number of successful claims could materially adversely affect our business, financial condition and results of operations. Consumer demand for our products and our brand's value could diminish significantly if any such incidents or other matters create negative publicity or otherwise erode consumer confidence in us or our products, which would likely result in lower sales and could materially adversely affect our business, financial condition and results of operations.
Also, there has been a marked increase in the use of social media platforms and similar devices, including weblogs (blogs), social media websites, Twitter and other forms of Internet-based communications which allow individuals access to a broad audience of consumers and other interested persons. The availability of information on social media platforms is virtually immediate as is its impact. Many social media platforms immediately publish the content their subscribers and participants can post, often without filters or checks on accuracy of the content posted. The opportunity for dissemination of information, including inaccurate information, is seemingly limitless and readily available. Information concerning our company may be posted on such platforms at any time. Information posted may be adverse to our interests or may be inaccurate, each of which may harm our performance, prospects or business. The harm may be immediate without affording us an opportunity for redress or correction. Such platforms also could be used for dissemination of trade secret information, compromising valuable company assets. In summary, the dissemination of information online could harm our business, prospects, financial condition and results of operations, regardless of the information's accuracy.
Governmental regulation may adversely affect our ability to open new restaurants or otherwise adversely affect our business, financial condition and results of operations.
We are subject to various federal, state and local regulations, including those relating to building and zoning requirements and those relating to the preparation and sale of food. The development and operation of restaurants depends to a significant extent on the selection and acquisition of suitable sites, which are subject to zoning, land use, environmental, traffic and other regulations and requirements. Our restaurants are also subject to state and local licensing and regulation by health, alcoholic beverage, sanitation, food and occupational safety and other agencies. We may experience material difficulties or failures in obtaining the necessary licenses, approvals or permits for our restaurants, which could delay planned restaurant openings or affect the operations at our existing restaurants. In addition, stringent and varied requirements of local regulators with respect to zoning, land use and environmental factors could delay or prevent development of new restaurants in particular locations.
We are subject to the ADA and similar state laws that give civil rights protections to individuals with disabilities in the context of employment, public accommodations and other areas, including our restaurants. We may in the future have to modify restaurants by adding access ramps or redesigning certain architectural fixtures, for example, to provide service to or make reasonable accommodations for disabled persons. The expenses associated with these modifications could be material.
Our operations are also subject to the U.S. Occupational Safety and Health Act, which governs worker health and safety, the U.S. Fair Labor Standards Act, which governs such matters as minimum wages and overtime, and a variety of similar federal, state and local laws that govern these and other employment law matters. We may also be subject to lawsuits from our employees, the U.S. Equal Employment Opportunity Commission or others alleging violations of federal and state laws regarding workplace and employment matters, discrimination and similar matters, and we have been party to such matters in the past. In addition, federal, state and local proposals related to changes in minimum wages, paid sick leave or similar matters could, if implemented, materially adversely affect our business, financial condition and results of operations.
There is also a potential for increased regulation of certain food establishments in the United States, where compliance with a HACCP approach would be required. HACCP refers to a management system in which food safety is addressed through the analysis and control of potential hazards from production, procurement and handling, to manufacturing, distribution and consumption of the finished product. Many states have required restaurants to develop and implement HACCP Systems, and the United States government continues to expand the sectors of the food industry that must adopt and implement HACCP programs. For example, the FSMA, signed into law in January 2011, granted the FDA new authority regarding the safety of the entire food system, including through increased inspections and mandatory food recalls. Although restaurants are specifically exempted from
18
or not directly implicated by some of these new requirements, we anticipate that the new requirements may impact our industry. Additionally, our suppliers may initiate or otherwise be subject to food recalls that may impact the availability of certain products, result in adverse publicity or require us to take actions that could be costly for us or otherwise impact our business.
The impact of current laws and regulations, the effect of future changes in laws or regulations that impose additional requirements and the consequences of litigation relating to current or future laws and regulations, or our inability to respond effectively to significant regulatory or public policy issues, could increase our compliance and other costs of doing business and, therefore, have an adverse effect on our results of operations. Failure to comply with the laws and regulatory requirements of federal, state and local authorities could result in, among other things, revocation of required licenses, administrative enforcement actions, fines and civil and criminal liability. In addition, certain laws, including the ADA, could require us to expend significant funds to make modifications to our restaurants if we failed to comply with applicable standards. Compliance with the aforementioned laws and regulations can be costly and can increase our exposure to litigation or governmental investigations or proceedings.
Legislation and regulations requiring the display and provision of nutritional information for our menu offerings, and new information or attitudes regarding diet and health could result in changes in regulations and consumer consumption habits that could adversely affect our results of operations.
Regulations and consumer eating habits may change as a result of new information or attitudes regarding diet and health or new information regarding the adverse health effects of consuming certain menu offerings. Such changes may include federal, state and local regulations that impact the ingredients and nutritional content of the food and beverages we offer. The growth of our restaurant operations is dependent, in part, upon our ability to effectively respond to changes in any consumer health regulations and our ability to adapt our menu offerings to trends in food consumption. If consumer health regulations or consumer eating habits change significantly, we may choose or be required to modify or delete certain menu items, which may adversely affect the attractiveness of our restaurants to new or returning customers. We may also experience higher costs associated with the implementation of those changes. To the extent we are unwilling or unable to respond with appropriate changes to our menu offerings, it could materially affect consumer demand and have an adverse impact on our business, financial condition and results of operations.
Such changes have also resulted in, and may continue to result in, laws and regulations requiring us to disclose the nutritional content of our food offerings, and they have resulted, and may continue to result in, laws and regulations affecting permissible ingredients and menu offerings. For example, a number of states, counties and cities have enacted menu labeling laws requiring multi-unit restaurant operators to disclose to consumers certain nutritional information, or have enacted legislation restricting the use of certain types of ingredients in restaurants. These requirements may be different or inconsistent with requirements under the PPACA, which establishes a uniform, federal requirement for certain restaurants to post nutritional information on their menus. Specifically, the PPACA requires chain restaurants with 20 or more locations operating under the same name and offering substantially the same menus to publish the total number of calories of standard menu items on menus and menu boards, along with a statement that puts this calorie information in the context of a total daily calorie intake. While we disclose the nutritional value and calorie count of our menu items on our website and upon request, these inconsistencies could be challenging for us to comply with in an efficient manner. Additionally, we use Healthy Dining, a third-party nutritional group to evaluate the nutritional value and calorie count of our menu items. If Healthy Dining's evaluation report is inaccurate or incomplete, we may fail to comply with PPACA or other consumer health regulations. The PPACA also requires covered restaurants to provide to consumers, upon request, a written summary of detailed nutritional information for each standard menu item, and to provide a statement on menus and menu boards about the availability of this information upon request. An unfavorable report on, or reaction to, our menu ingredients, the size of our portions or the nutritional content of our menu items could negatively influence the demand for our offerings.
Compliance with current and future laws and regulations regarding the ingredients and nutritional content of our menu items may be costly and time-consuming. We cannot predict the impact of the new nutrition labeling requirements under the PPACA until final regulations are promulgated. The risks and costs associated with nutritional disclosures on our menus could also impact our operations, particularly given differences among applicable legal requirements and practices within the restaurant industry with respect to testing and disclosure, ordinary variations in food preparation among our own restaurants, and the need to rely on the accuracy and completeness of nutritional information obtained from third-party suppliers.
We may not be able to effectively respond to changes in consumer health perceptions or our ability to successfully implement the nutrient content disclosure requirements and to adapt our menu offerings to trends in eating habits. The imposition of menu labeling laws could materially adversely affect our business, financial condition and results of operations, as well as our position within the restaurant industry in general.
19
Food safety and foodborne illness concerns could have an adverse effect on our business.
We cannot guarantee that our internal controls and training will be fully effective in preventing all food safety issues at our restaurants, including any occurrences of foodborne illnesses such as salmonella, E. coli and hepatitis A. Our quality assurance, health and sanitation internal controls and conditions are inspected by a third-party on a quarterly basis. If the third-party inspector fails to report unsafe or unsanitary conditions or insufficient internal controls, we cannot guarantee that our internal controls will be fully effective in preventing all food safety issues. In addition, there is no guarantee that our franchise restaurants will maintain the high levels of internal controls and training we require at our Company-owned restaurants. Furthermore, we and our franchisees rely on third-party vendors, making it difficult to monitor food safety compliance and increasing the risk that foodborne illness would affect multiple locations rather than a single restaurant. Some foodborne illness incidents could be caused by third-party vendors and transporters outside of our control. New illnesses resistant to our current precautions may develop in the future, or diseases with long incubation periods could arise, that could give rise to claims or allegations on a retroactive basis. One or more instances of foodborne illness in any of our restaurants or markets or related to food products we sell could negatively affect our restaurant sales nationwide if highly publicized on national media outlets or through social media. This risk exists even if it were later determined that the illness was wrongly attributed to us or one of our restaurants. A number of other restaurant chains have experienced incidents related to foodborne illnesses that have had a material adverse effect on their operations. The occurrence of a similar incident at one or more of our restaurants, or negative publicity or public speculation about an incident, could materially adversely affect our business, financial condition and results of operations.
Compliance with environmental laws may negatively affect our business.
We are subject to federal, state and local laws and regulations concerning waste disposal, pollution, protection of the environment, and the presence, discharge, storage, handling, release and disposal of, and exposure to, hazardous or toxic substances. These environmental laws provide for significant fines and penalties for noncompliance and liabilities for remediation, sometimes without regard to whether the owner or operator of the property knew of, or was responsible for, the release or presence of hazardous toxic substances. Third parties may also make claims against owners or operators of properties for personal injuries and property damage associated with releases of, or actual or alleged exposure to, such hazardous or toxic substances at, on or from our restaurants. Environmental conditions relating to releases of hazardous substances at prior, existing or future restaurant sites could materially adversely affect our business, financial condition and results of operations. Further, environmental laws, and the administration, interpretation and enforcement thereof, are subject to change and may become more stringent in the future, each of which could materially adversely affect our business, financial condition and results of operations.
We rely heavily on certain vendors, suppliers and distributors, which could adversely affect our business.
Our ability to maintain consistent price and quality throughout our restaurants depends in part upon our ability to acquire specified food products and supplies in sufficient quantities from third-party vendors, suppliers and distributors at a reasonable cost. We contract with multiple suppliers including Sysco, one of the largest distributors of food and related products to the U.S. food service industry. In 2014, our Sysco spend was a substantial amount of our cost of sales. Our remaining food supplies are distributed by other distributors under separate contracts. We do not control the businesses of our vendors, suppliers and distributors, and our efforts to specify and monitor the standards under which they perform may not be successful. Furthermore, certain food items are perishable, and we have limited control over whether these items will be delivered to us in appropriate condition for use in our restaurants. If any of our vendors or other suppliers are unable to fulfill their obligations to our standards, or if we are unable to find replacement providers in the event of a supply or service disruption, we could encounter supply shortages and incur higher costs to secure adequate supplies, which could materially adversely affect our business, financial condition and results of operations.
In addition, we use various third-party vendors to provide, support and maintain most of our management information systems. We also outsource certain accounting, payroll and human resource functions to business process service providers. The failure of such vendors to fulfill their obligations could disrupt our operations. Additionally, any changes we may make to the services we obtain from our vendors, or new vendors we employ, may disrupt our operations. These disruptions could materially adversely affect our business, financial condition and results of operations.
Changes in food and supply costs or failure to receive frequent deliveries of fresh food ingredients and other supplies could adversely affect our business, financial condition or results of operations.
Our profitability depends in part on our ability to anticipate and react to changes in food and supply costs, and our ability to maintain our menu depends in part on our ability to acquire ingredients that meet our specifications from reliable suppliers. Our menu offerings rely on local suppliers to provide fresh foods. Shortages or interruptions in the availability of certain supplies caused by unanticipated demand, problems in production or distribution, food contamination, inclement weather or other conditions could adversely affect the availability, quality and cost of our ingredients, which could harm our operations. Any increase in the prices of the food products most critical to our menu, such as fresh produce, feta cheese and chicken, could
20
adversely affect our operating results. Although we try to manage the impact that these fluctuations have on our operating results, we remain susceptible to increases in food costs as a result of factors beyond our control, such as general economic conditions, seasonal fluctuations, weather conditions, demand, food safety concerns, generalized infectious diseases, product recalls and government regulations. For example, higher gas and diesel prices have in some cases resulted in the imposition of surcharges on the delivery of commodities to our distributors, which they have generally passed on to us to the extent permitted under our arrangements with them.
If any of our distributors or suppliers performs inadequately, or our distribution or supply relationships are disrupted for any reason, our business, financial condition, results of operations or cash flows could be adversely affected. Although we often enter into contracts for the purchase of food products and supplies, we do not have long-term contracts for the purchase of all of such food products and supplies. As a result, we may not be able to anticipate or react to changing food costs by adjusting our purchasing practices or menu prices, which could cause our operating results to deteriorate. If we cannot replace or engage distributors or suppliers who meet our specifications in a short period of time, that could increase our expenses and cause shortages of food and other items at our restaurants, which could cause a restaurant to remove items from its menu. If that were to happen, affected restaurants could experience significant reductions in sales during the shortage or thereafter, if customers change their dining habits as a result. Our focus on a limited menu would make the consequences of a shortage of a key ingredient more severe. In addition, because we provide moderately priced food, we may choose not to, or may be unable to, pass along commodity price increases to consumers. These potential changes in food and supply costs could materially adversely affect our business, financial condition and results of operations.
The effect of changes to healthcare laws in the United States may increase the number of employees who choose to participate in our healthcare plans, which may significantly increase our healthcare costs and negatively impact our financial results.
In 2010, the PPACA was signed into law in the United States to require health care coverage for many uninsured individuals and expand coverage to those already insured. We currently offer and subsidize a portion of comprehensive healthcare coverage, primarily for our salaried employees. Starting in 2015, the healthcare reform law requires us to offer healthcare benefits to all full-time employees (including full-time hourly employees) that meet certain minimum requirements of coverage and affordability, or face penalties. In offering such benefits, we may incur substantial additional expense. If the benefits we elect to offer do not meet the applicable requirements, then we may incur penalties and potential liability. The healthcare reform law also requires individuals to obtain coverage or face individual penalties, so employees who are currently eligible but elect not to participate in our healthcare plans may find it more advantageous to participate in the future. It is also possible that by making changes or failing to make changes in the healthcare plans offered by us we will become less competitive in the market for our labor. Finally, implementing the requirements of healthcare reform is likely to impose additional administrative costs on us. While the costs and other effects of these new healthcare requirements cannot be determined with certainty, they may significantly increase our healthcare coverage costs and could materially adversely affect our, business, financial condition and results of operations.
Changes in employment laws may adversely affect our business.
Various federal and state labor laws govern the relationship with our employees and affect operating costs. These laws include employee classification as exempt/non-exempt for overtime and other purposes, minimum wage requirements, unemployment tax rates, workers' compensation rates, immigration status and other wage and benefit requirements. Significant additional government-imposed increases in the following areas could materially affect our business, financial condition, operating results or cash flow:
• | minimum wages; |
• | mandatory health benefits; |
• | vacation accruals; |
• | paid leaves of absence, including paid sick leave; and |
• | tax reporting. |
In addition, various states in which we operate are considering or have already adopted new immigration laws or enforcement programs, and the U.S. Congress and Department of Homeland Security from time to time consider and may implement changes to federal immigration laws, regulations or enforcement programs as well. Some of these changes may increase our obligations for compliance and oversight, which could subject us to additional costs and make our hiring process more cumbersome, or reduce the availability of potential employees. Although we require all workers to provide us with government-specified documentation evidencing their employment eligibility, some of our employees may, without our knowledge, be unauthorized workers. We currently participate in the "E-Verify" program, an Internet-based, free program run by the United States government to verify employment eligibility, in states in which participation is required. However, use of the "E-Verify" program does not guarantee that we will properly identify all applicants who are ineligible for employment. Unauthorized workers are subject to deportation and may subject us to fines or penalties, and if any of our workers are found to be unauthorized we could experience
21
adverse publicity that negatively impacts our brand and may make it more difficult to hire and keep qualified employees. Termination of a significant number of employees who were unauthorized employees may disrupt our operations, cause temporary increases in our labor costs as we train new employees and result in additional adverse publicity. We could also become subject to fines, penalties and other costs related to claims that we did not fully comply with all recordkeeping obligations of federal and state immigration compliance laws. These factors could materially adversely affect our business, financial condition and results of operations.
Unionization activities or labor disputes may disrupt our operations and affect our profitability.
Although none of our employees are currently covered under collective bargaining agreements, our employees may elect to be represented by labor unions in the future. If a significant number of our employees were to become unionized and collective bargaining agreement terms were significantly different from our current compensation arrangements, it could adversely affect our business, financial condition and results of operations. In addition, a labor dispute involving some or all of our employees may harm our reputation, disrupt our operations and reduce our revenues, and resolution of disputes may increase our costs.
As an employer, we may be subject to various employment-related claims, such as individual or class actions or government enforcement actions relating to alleged employment discrimination, employee classification and related withholding, wage-hour, labor standards or healthcare and benefit issues. Such actions, if brought against us and successful in whole or in part, may affect our ability to compete or could materially adversely affect our business, financial condition and results of operations.
If we face labor shortages or increased labor costs, our growth and operating results could be adversely affected.
Labor is a primary component in the cost of operating our restaurants. If we face labor shortages or increased labor costs because of increased competition for employees, higher employee turnover rates, increases in the federal, state or local minimum wage or other employee benefits costs (including costs associated with health insurance coverage), then our operating expenses could increase and our growth could be adversely affected. In addition, our growth depends in part upon our ability to attract, motivate and retain a sufficient number of well-qualified restaurant operators and management personnel, as well as a sufficient number of other qualified employees, including customer service and kitchen staff, to keep pace with our expansion schedule. Qualified individuals needed to fill these positions are in short supply in some geographic areas. In addition, restaurants have traditionally experienced relatively high employee turnover rates. Although we have not yet experienced significant problems in recruiting or retaining employees, our ability to recruit and retain such individuals may delay the planned openings of new restaurants or result in higher employee turnover in existing restaurants, which could have a material adverse effect on our business, financial condition and results of operations.
If we are unable to continue to recruit and retain sufficiently qualified individuals, our business and our growth could be adversely affected. Competition for these employees could require us to pay higher wages, which could result in higher labor costs. In addition, some of our employees are paid at rates related to the U.S. federal minimum wage, and increases in the minimum wage would increase our labor costs. Further, costs associated with workers' compensation are rising, and these costs may continue to rise in the future. We may be unable to increase our menu prices in order to pass these increased labor costs on to consumers, in which case our margins would be negatively affected, which could materially adversely affect our business, financial condition and results of operations.
We depend on the services of key executives, the loss of which could materially harm our business.
Our senior executives have been instrumental in setting our strategic direction, operating our business, identifying, recruiting and training key personnel, identifying expansion opportunities and arranging necessary financing. Losing the services of any of these individuals could materially adversely affect our business until a suitable replacement is found. We believe that these individuals cannot easily be replaced with executives of equal experience and capabilities. We also do not maintain any key man life insurance policies for any of our employees.
Health concerns arising from outbreaks of viruses may have an adverse effect on our business.
The United States and other countries have experienced, or may experience in the future, outbreaks of neurological diseases or other diseases or viruses, such as norovirus, influenza and H1N1. If a virus is transmitted by human contact, our employees or customers could become infected, or could choose, or be advised, to avoid gathering in public places, any one of which could materially adversely affect our business, financial condition and results of operations.
We may not be able to generate sufficient cash flow or raise capital on acceptable terms to meet our future needs.
Developing our business will require significant capital in the future. To meet our capital needs, we expect to rely on our cash flow from operations, credit facility and potential third-party financings. Third-party financings in the future may not, however, be available on terms favorable to us, or at all. Our ability to obtain funding will be subject to various factors, including general
22
market conditions, our operating performance, the market's perception of our growth potential, lender sentiment and our ability to incur debt in compliance with other contractual restrictions, such as financial covenants under our credit facility and future debt documents.
Additionally, our ability to fund planned expenditures for our growth plans will depend on our ability to generate cash in the future. If our business does not achieve the levels of profitability or generate the amount of cash that we anticipate or if we expand faster than anticipated, we may need to seek additional debt or equity financing to operate and expand our business.
We believe that cash and cash equivalents and expected cash flow from operations are adequate to fund our debt service requirements, operating lease obligations, capital expenditures and working capital obligations for the next fiscal year. However, our ability to continue to meet these requirements and obligations will depend on, among other things, our ability to achieve anticipated levels of revenue and cash flow from operations and our ability to manage costs and working capital successfully. Additionally, our cash flow generation ability is subject to general economic, financial, competitive, legislative and regulatory factors and other factors that are beyond our control. We cannot assure you that our business will generate cash flow from operations in an amount sufficient to enable us to fund our liquidity needs. Further, our capital requirements may vary materially from those currently planned if, for example, our revenues do not reach expected levels or we have to incur unforeseen capital expenditures and make investments to maintain our competitive position. If this is the case, we may seek alternative financings, such as selling additional debt or equity securities, and we cannot assure you that we will be able to do so on favorable terms, if at all. Our inability to raise capital could impede our growth or otherwise require us to forego growth opportunities and could materially adversely affect our business, financial condition and results of operations.
Our marketing programs may not be successful.
We believe our brand is critical to our business. We incur costs and expend other resources in our marketing efforts to raise brand awareness and attract and retain customers. These initiatives may not be successful, resulting in expenses incurred without the benefit of higher revenues. Additionally, some of our competitors have greater financial resources, which enable them to spend significantly more than we are able to on marketing and advertising. Should our competitors increase spending on marketing and advertising or our marketing funds decrease for any reason, or should our advertising and promotions be less effective than our competitors, there could be a material adverse effect on our results of operations and financial condition.
We have limited control over our franchisees, and any franchisees could take actions that could harm our business.
Franchisees are independent contractors and are not our employees, and we do not exercise control over their day-to-day operations. We provide training and support to franchisees, but the quality of franchised restaurant operations may be diminished by any number of factors beyond our control. We cannot be certain that our franchisees will have the business acumen or financial resources necessary to operate successful franchises in their franchise areas in a manner consistent with our standards and requirements, or that they will hire and train qualified managers and other restaurant personnel. If franchisees do not meet our standards and requirements, our image and reputation, and the image and reputation of other franchisees, may suffer materially and system-wide sales could decline significantly. State franchise laws may limit our ability to terminate or modify these franchise arrangements.
Franchisees, as independent business operators, may from time to time disagree with us and our strategies regarding the business or our interpretation of our, and their, rights and obligations under franchise and development agreements. This may lead to disputes with our franchisees in the future. These disputes may divert the attention of our management and our franchisees from operating our restaurants and affect our image and reputation and our ability to attract franchisees in the future, which could materially adversely affect our business, financial condition and results of operations.
We and our franchisees are also subject to laws and regulations relating to information security, privacy, cashless payments, gift cards and consumer credit, protection and fraud and any failure or perceived failure to comply with these laws and regulations could harm our reputation or lead to litigation, which could adversely affect our financial condition.
A franchisee bankruptcy could have a substantial negative impact on our ability to collect payments due under such franchisee's franchise arrangements. In a franchisee bankruptcy, the bankruptcy trustee may reject its franchise arrangements pursuant to Section 365 under the United States bankruptcy code, in which case there would be no further royalty payments from such franchisee, and there can be no assurance as to the proceeds, if any, that may ultimately be recovered in a bankruptcy proceeding of such franchisee in connection with a damage claim resulting from such rejection.
In addition, we have repurchased several of our franchises over the past four years. These acquisitions involve numerous risks and uncertainties including increased costs, integration challenges, potential labor issues, the assumption of unexpected liabilities, and distractions to senior management. The anticipated benefits of these buyback transactions may not be realized in full or at all, or may take longer than we expect.
23
We are subject to all of the risks associated with leasing space subject to long-term, non-cancelable leases.
We do not own any real property. Payments under our operating leases account for a significant portion of our operating expenses and we expect the new restaurants we open in the future will similarly be leased. Our leases generally have an initial term of ten years and generally include two five-year renewal options at increased rates. All of our leases require a fixed annual rent, although some require the payment of additional rent if restaurant sales exceed a negotiated amount. Generally, our leases are "net" leases, which require us to pay all of the cost of insurance, taxes, maintenance and utilities. We generally cannot cancel these leases. Additional sites that we lease are likely to be subject to similar long-term non-cancelable leases. If an existing or future restaurant is not profitable, and we decide to close it, we may nonetheless be committed to perform our obligations under the applicable lease including, among other things, paying the base rent for the balance of the lease term. In addition, as each of our leases expires, we may fail to negotiate renewals, either on commercially acceptable terms or at all, which could cause us to pay increased occupancy costs or to close restaurants in desirable locations. These potential increased occupancy costs and closed restaurants could materially adversely affect our business, financial condition and results of operations.
The impact of negative economic factors, including the availability of credit, on our landlords and surrounding tenants could negatively affect our financial results.
Negative effects on our existing and potential landlords due to the inaccessibility of credit and other unfavorable economic factors may, in turn, adversely affect our business and results of operations. If our landlords are unable to obtain financing or remain in good standing under their existing financing arrangements, they may be unable to provide construction contributions, or to satisfy other lease covenants to us, and may also be subject to foreclosure proceedings by mortgagees. In addition, if our landlords are unable to obtain sufficient credit to continue to properly manage their retail sites, we may experience a drop in the level of quality of such retail centers. Our development of new restaurants may also be adversely affected by the negative financial situations of developers and potential landlords. Landlords may try to delay or cancel recent development projects (as well as renovations of existing projects) due to the instability in the credit markets and recent declines in consumer spending, which could reduce the number of appropriate locations available that we would consider for our new restaurants. Furthermore, the failure of landlords to obtain licenses or permits for development projects on a timely basis, which is beyond our control, may negatively impact our ability to implement our development plan.
We may not be able to adequately protect our intellectual property, which could harm the value of our brand and adversely affect our business.
Our intellectual property is material to our business. Our ability to implement our business plan successfully depends in part on our ability to further build brand recognition using our trademarks, service marks, trade dress and other proprietary intellectual property, including our name and logos and the unique ambience of our restaurants. While it is our policy to protect and defend vigorously our rights to our intellectual property, we cannot predict whether steps taken by us to protect our intellectual property rights will be adequate to prevent misappropriation of these rights or the use by others of restaurant features based upon, or otherwise similar to, our concept. It may be difficult for us to prevent others from copying elements of our concept and any litigation to enforce our rights will likely be costly and may not be successful. Although we believe that we have sufficient rights to all of our trademarks and service marks, we may face claims of infringement that could interfere with our ability to market our restaurants and promote our brand. Any such litigation may be costly and divert resources from our business. Moreover, if we are unable to successfully defend against such claims, we may be prevented from using our trademarks or service marks in the future and may be liable for damages, which in turn could materially adversely affect our business, financial condition and results of operations.
We also rely on trade secrets and proprietary know-how to protect our brand. Our methods of safeguarding this information may not be adequate. Moreover, we may face claims of misappropriation or infringement of third parties' rights that could interfere with our use of this information. Defending these claims may be costly and, if unsuccessful, may prevent us from continuing to use this proprietary information in the future and may result in a judgment or monetary damages. We do maintain confidentiality agreements with all of our team members and most of our suppliers. Even with respect to the confidentiality agreements we have, we cannot assure you that those agreements will not be breached, that they will provide meaningful protection, or that adequate remedies will be available in the event of an unauthorized use or disclosure of our proprietary information. If competitors independently develop or otherwise obtain access to our trade secrets or proprietary know-how, the appeal of our restaurants could be reduced and our business could be harmed.
We may incur costs resulting from breaches of security of confidential consumer information related to our electronic processing of credit and debit card transactions.
The majority of our restaurant sales are by credit or debit cards. Other restaurants and retailers have experienced security breaches in which credit and debit card information has been stolen. We may in the future become subject to claims for purportedly fraudulent transactions arising out of the actual or alleged theft of credit or debit card information, and we may also be subject to
24
lawsuits or other proceedings relating to these types of incidents. In addition, most states have enacted legislation requiring notification of security breaches involving personal information, including credit and debit card information. Any such claim or proceeding could cause us to incur significant unplanned expenses, which could have an adverse impact on our financial condition and results of operations. Further, adverse publicity resulting from these allegations may have a material adverse effect on us and our restaurants.
We rely heavily on information technology, and any material failure, weakness, interruption or breach of security could prevent us from effectively operating our business.
We rely heavily on information systems, including point-of-sale processing in our restaurants, for management of our supply chain, payment of obligations, collection of cash, credit and debit card transactions and other processes and procedures. Our ability to efficiently and effectively manage our business depends significantly on the reliability and capacity of these systems. Our operations depend upon our ability to protect our computer equipment and systems against damage from physical theft, fire, power loss, telecommunications failure or other catastrophic events, as well as from internal and external security breaches, viruses and other disruptive problems. The failure of these systems to operate effectively, maintenance problems, upgrading or transitioning to new platforms, expanding our systems as we grow or a breach in security of these systems could result in delays in customer service and reduce efficiency in our operations. Remediation of such problems could result in significant, unplanned capital investments.
Changes to estimates related to our property, fixtures and equipment or operating results that are lower than our current estimates at certain restaurant locations may cause us to incur impairment charges on certain long-lived assets, which may adversely affect our results of operations.
In accordance with accounting guidance as it relates to the impairment of long-lived assets, we make certain estimates and projections with regard to individual restaurant operations, as well as our overall performance, in connection with our impairment analyses for long-lived assets. When impairment triggers are deemed to exist for any location, the estimated undiscounted future cash flows are compared to its carrying value. If the carrying value exceeds the undiscounted cash flows, an impairment charge equal to the difference between the carrying value and the fair value is recorded. The projections of future cash flows used in these analyses require the use of judgment and a number of estimates and projections of future operating results. If actual results differ from our estimates, additional charges for asset impairments may be required in the future. If future impairment charges are significant, our reported operating results would be adversely affected.
We could be party to litigation that could adversely affect us by distracting management, increasing our expenses or subjecting us to material money damages and other remedies.
Our customers occasionally file complaints or lawsuits against us alleging we caused an illness or injury they suffered at or after a visit to our restaurants, or that we have problems with food quality or operations. We are also subject to a variety of other claims arising in the ordinary course of our business, including personal injury claims, contract claims and claims alleging violations of federal and state law regarding workplace and employment matters, equal opportunity, harassment, discrimination and similar matters, and we could become subject to class action or other lawsuits related to these or different matters in the future. In recent years, a number of restaurant companies have been subject to such claims, and some of these lawsuits have resulted in the payment of substantial damages by the defendants. Regardless of whether any claims against us are valid, or whether we are ultimately held liable, claims may be expensive to defend and may divert time and money away from our operations and hurt our performance. A judgment in excess of our insurance coverage for any claims could materially and adversely affect our financial condition and results of operations. Any adverse publicity resulting from these allegations may also materially and adversely affect our reputation or prospects, which in turn could materially adversely affect our business, financial condition and results of operations.
We are subject to state and local "dram shop" statutes, which may subject us to uninsured liabilities. These statutes generally allow a person injured by an intoxicated person to recover damages from an establishment that wrongfully served alcoholic beverages to the intoxicated person. Because a plaintiff may seek punitive damages, which may not be fully covered by insurance, this type of action could have an adverse impact on our financial condition and results of operations. A judgment in such an action significantly in excess of, or not covered by, our insurance coverage could adversely affect our business, financial condition and results of operations. Further, adverse publicity resulting from any such allegations may adversely affect us and our restaurants taken as a whole.
In addition, the restaurant industry has been subject to a growing number of claims based on the nutritional content of food products sold and disclosure and advertising practices. We may also be subject to this type of proceeding in the future and, even if we are not, publicity about these matters (particularly directed at the quick-service or fast-casual segments of the industry) may harm our reputation and could materially adversely affect our business, financial condition and results of operations.
25
Our current insurance may not provide adequate levels of coverage against claims.
Our current insurance policies may not be adequate to protect us from liabilities that we incur in our business. Additionally, in the future, our insurance premiums may increase, and we may not be able to obtain similar levels of insurance on reasonable terms, or at all. Any substantial inadequacy of, or inability to obtain insurance coverage could materially adversely affect our business, financial condition and results of operations. While we have enhanced our existing directors' and officers' insurance, we may not be able to maintain adequate coverage at a reasonable cost now or in the future. Failure to maintain adequate directors' and officers' insurance would likely adversely affect our ability to attract and retain qualified officers and directors. Furthermore, there are types of losses we may incur that cannot be insured against or that we believe are not economically reasonable to insure. Such losses could have a material adverse effect on our business and results of operations.
Failure to obtain and maintain required licenses and permits or to comply with alcoholic beverage or food control regulations could lead to the loss of our liquor and food service licenses and, thereby, harm our business.
The restaurant industry is subject to various federal, state and local government regulations, including those relating to the sale of food and alcoholic beverages. Such regulations are subject to change from time to time. The failure to obtain and maintain these licenses, permits and approvals could adversely affect our operating results. Typically, licenses must be renewed annually and may be revoked, suspended or denied renewal for cause at any time if governmental authorities determine that our conduct violates applicable regulations. Difficulties or failure to maintain or obtain the required licenses and approvals could adversely affect our existing restaurants and delay or result in our decision to cancel the opening of new restaurants, which would adversely affect our business.
Alcoholic beverage control regulations generally require our restaurants to apply to a state authority and, in certain locations, county or municipal authorities for a license that must be renewed annually and may be revoked or suspended for cause at any time. Alcoholic beverage control regulations relate to numerous aspects of daily operations of our restaurants, including minimum age of patrons and employees, hours of operation, advertising, trade practices, wholesale purchasing, other relationships with alcohol manufacturers, wholesalers and distributors, inventory control and handling, storage and dispensing of alcoholic beverages. Any future failure to comply with these regulations and obtain or retain licenses could adversely affect our business, financial condition and results of operations.
Failure to establish and maintain effective internal controls in accordance with Section 404 of the Sarbanes-Oxley Act could have a material adverse effect on our business and stock price.
As a publicly traded company, we are required to comply with the SEC's rules implementing Section 302 and 404 of the Sarbanes-Oxley Act, which requires management to certify financial and other information in our quarterly and annual reports and provide an annual management report on the effectiveness of internal controls over financial reporting. Though we are required to disclose changes made in our internal controls and procedures on a quarterly basis, we will not be required to make our first annual assessment of our internal control over financial reporting pursuant to Section 404 until 2015. Pursuant to the JOBS Act, our independent registered public accounting firm will not be required to attest to the effectiveness of our internal control over financial reporting until the later of the year following the filing of this report with the SEC or the date we are no longer an emerging growth company, which may be up to five full fiscal years following our IPO.
To comply with the requirements of being a public company, we may need to undertake various actions, such as implementing new internal controls and procedures and hiring additional accounting or internal audit staff. In addition, we may identify material weaknesses in our internal control over financial reporting that we may not be able to remediate in time to meet the applicable deadline imposed upon us for compliance with the requirements of Section 404. In connection with the audit of our financial statements for the year ended December 29, 2014, we concluded the previously identified material weaknesses related to a lack of adequate information technology policies and procedures, sufficient accounting resources, segregation of duties and a lack of adequate accounting policies and procedures have been adequately remediated.
If we identify weaknesses in our internal control over financial reporting, are unable to comply with the requirements of Section 404 in a timely manner or to assert that our internal control over financial reporting is effective, or if our independent registered public accounting firm is unable to express an opinion as to the effectiveness of our internal control over financial reporting, investors may lose confidence in the accuracy and completeness of our financial reports and the market price of our common stock could be negatively affected, and we could become subject to investigations by the New York Stock Exchange on which our securities are listed, the SEC or other regulatory authorities, which could require additional financial and management resources.
Changes to accounting rules or regulations may adversely affect our results of operations.
Changes to existing accounting rules or regulations may impact our future results of operations or cause the perception that we are more highly leveraged. Other new accounting rules or regulations and varying interpretations of existing accounting rules or
26
regulations have occurred and may occur in the future. For instance, accounting regulatory authorities have indicated that they may begin to require lessees to capitalize operating leases in their financial statements in the next few years. If adopted, such change would require us to record significant capital lease obligations on our balance sheet and make other changes to our financial statements. This and other future changes to accounting rules or regulations could materially adversely affect our business, financial condition and results of operations.
We spend significant resources in developing new product offerings, some of which may not be successful.
We invest in continually developing new potential product offerings as well as in marketing and advertising our new products. Our new product offerings may not be well-received by consumers and may not be successful, which could materially adversely affect our results of operations.
Risks Related to Ownership of Our Common Stock
Our quarterly operating results may fluctuate significantly and could fall below the expectations of securities analysts and investors due to seasonality and other factors, some of which are beyond our control, resulting in a decline in our stock price.
Our quarterly operating results may fluctuate significantly because of several factors, including:
• | the timing of new restaurant openings and related expenses; |
• | restaurant operating costs for our newly-opened restaurants, which are often materially greater during the first several months of operation than thereafter; |
• | labor availability and costs for hourly and management personnel; |
• | profitability of our restaurants, especially in new markets; |
• | increases and decreases in AUVs and comparable restaurant sales; |
• | impairment of long-lived assets and any loss on restaurant closures; |
• | macroeconomic conditions, both nationally and locally; |
• | negative publicity relating to the consumption of seafood or other products we serve; |
• | changes in consumer preferences and competitive conditions; |
• | expansion to new markets; |
• | increases in infrastructure costs; and |
• | fluctuations in commodity prices. |
Seasonal factors and the timing of holidays also cause our revenue to fluctuate from quarter to quarter. Our revenue per restaurant is typically lower in the first and fourth quarters due to reduced winter and holiday traffic and higher in the second and third quarters. As a result of these factors, our quarterly and annual operating results and comparable restaurant sales may fluctuate significantly. Accordingly, results for any one quarter are not necessarily indicative of results to be expected for any other quarter or for any year and comparable restaurant sales for any particular future period may decrease. In the future, operating results may fall below the expectations of securities analysts and investors. In that event, the price of our common stock would likely decrease.
The price of our common stock may be volatile and you may lose all or part of your investment.
Although we have listed our common stock on the New York Stock Exchange, given our growth strategy and stage of development, we cannot assure you that an active trading market will be sustained in the future. If an active trading market is not sustained, you may have difficulty selling any shares of our common stock, and the value of such shares may be materially impaired. Additionally, the market price of our common stock could fluctuate significantly. Those fluctuations could be based on various factors in addition to those otherwise described in this report, including those described under "Risks Related to Our Business and Industry" and the following:
• | our operating performance and the performance of our competitors or restaurant companies in general; |
• | the public's reaction to our press releases, our other public announcements and our filings with the SEC; |
• | changes in earnings estimates or recommendations by research analysts who follow us or other companies in our industry; |
• | global, national or local economic, legal and regulatory factors unrelated to our performance; |
• | future sales of our common stock by our officers, directors and significant stockholders; |
• | the arrival or departure of key personnel; and |
• | other developments affecting us, our industry or our competitors. |
As we operate in a single industry, we are especially vulnerable to these factors to the extent that they affect our industry or our products. In the past, securities class action litigation has often been initiated against companies following periods of volatility in
27
their stock price. This type of litigation could result in substantial costs and divert our management's attention and resources, and could also require us to make substantial payments to satisfy judgments or to settle litigation.
Future sales of our common stock, or the perception that such sales may occur, could depress our common stock price.
Sales of a substantial number of shares of our common stock in the public market, or the perception that such sales may occur, could depress the market price of our common stock. Our amended and restated certificate of incorporation authorizes us to issue up to 135,000,000 shares of common stock, of which 19,292,246 shares are outstanding as of the date hereof and 521,470 shares are issuable upon the exercise of outstanding stock options and 6,666 shares are issuable upon the vesting of restricted stock units. We have 1,905,799 shares of common stock reserved for issuance under our 2014 Omnibus Incentive Plan. Our share price could drop significantly if the holders of our shares sell them or are perceived by the market as intending to sell them. In the future, we may also issue common stock or other securities if we need to raise additional capital. The number of new shares of our common stock issued in connection with raising additional capital could constitute a material portion of the then outstanding shares of our common stock and dilute our current shareholders.
If securities or industry analysts do not publish research or publish inaccurate or unfavorable research about our business, our stock price and trading volume could decline.
The trading market for our common stock depends in part on the research and reports that securities or industry analysts publish about us or our business. If one or more of these analysts ceases coverage of us or fails to publish reports on us regularly, demand for our common stock could decrease, which could cause our stock prices and trading volume to decline. Moreover, if one or more of the analysts who cover us downgrades our common stock or publishes inaccurate or unfavorable research about our business, our stock price would likely decline.
We do not intend to pay dividends for the immediate future.
We may retain future earnings, if any, for future operations, expansion and debt repayment and have no current plans to pay any cash dividends for the immediate future. Any future determination to declare and pay cash dividends will be at the discretion of our Board of Directors and will depend on, among other things, our financial condition, results of operations, cash requirements, contractual restrictions and such other factors as our Board of Directors deems relevant. Our ability to pay dividends is limited by covenants in our current credit facility. As a result, you may not receive any return on an investment in our common stock unless you sell our common stock for a price greater than that which you paid for it.
Provisions in our charter documents and Delaware law may delay or prevent our acquisition by a third party, even if the acquisition would be beneficial to our stockholders, and could make it more difficult for you to change our management.
Our amended and restated certificate of incorporation and bylaws, and Delaware law, contain several provisions that may make it more difficult for a third party to acquire control of us without the approval of our Board of Directors. For example, we have a classified Board of Directors with three-year staggered terms, which could delay the ability of stockholders to change membership of a majority of our Board of Directors. These provisions may make it more difficult or expensive for a third party to acquire a majority of our outstanding equity interests. These provisions also may delay, prevent or deter a merger, acquisition, tender offer, proxy contest or other transaction that might otherwise result in our stockholders receiving a premium over the market price for their common stock.
We will incur increased costs as a result of being a public company.
As a newly public company, we are incurring significant legal, accounting and other expenses that we did not incur as a private company. These costs will increase after we are no longer an emerging growth company as defined under the JOBS Act. In addition, new and changing laws, regulations and standards relating to corporate governance and public disclosure, including the Dodd-Frank Wall Street Reform and Consumer Protection Act and the rules and regulations promulgated and to be promulgated thereunder, as well as under the Sarbanes-Oxley Act and the JOBS Act, have created uncertainty for public companies and increased costs and time that boards of directors and management must devote to complying with these rules and regulations. The Sarbanes-Oxley Act and related rules of the SEC and the New York Stock Exchange regulate corporate governance practices of public companies. We expect compliance with these rules and regulations to increase our legal and financial compliance costs and lead to a diversion of management time and attention from revenue generating activities.
We are an emerging growth company and, as a result of the reduced disclosure and governance requirements applicable to emerging growth companies, our common stock may be less attractive to investors.
We are an emerging growth company, as defined in the JOBS Act, and we are eligible to take advantage of certain exemptions from various reporting requirements applicable to other public companies, but not to emerging growth companies, including, but not limited to, an exemption from the auditor attestation requirement of Section 404 of the Sarbanes-Oxley Act, reduced
28
disclosure about executive compensation arrangements pursuant to the rules applicable to smaller reporting companies and no requirement to seek non-binding advisory votes on executive compensation or golden parachute arrangements. We have elected to adopt these reduced disclosure requirements. We may take advantage of these provisions until we are no longer an emerging growth company. We will remain an emerging growth company until the earlier of (1) the last day of the fiscal year (a) following the fifth anniversary of the completion of our IPO, or (b) in which we have total annual gross revenue of at least $1.0 billion, (2) being deemed to be a large accelerated filer, which means the market value of our common stock that is held by non-affiliates exceeds $700 million as of the prior end of our second fiscal quarter, and (3) the date on which we have issued more than $1.0 billion in non-convertible debt during the prior three-year period.
In addition, Section 107 of the JOBS Act also provides that an emerging growth company can take advantage of the extended transition period provided in Section 7(a)(2)(B) of the Securities Act for complying with new or revised accounting standards. An emerging growth company can therefore delay the adoption of certain accounting standards until those standards would otherwise apply to private companies. However, we "opted out" of such extended transition period and, as a result, we will comply with new or revised accounting standards on the relevant dates on which adoption of such standards is required for non-emerging growth companies. Section 107 of the JOBS Act provides that our decision to opt out of the extended transition period for complying with new or revised accounting standards is irrevocable.
We cannot predict if investors will find our common stock less attractive as a result of our taking advantage of these exemptions. If some investors find our common stock less attractive as a result of our choices, there may be a less active trading market for our common stock and our stock price may be more volatile.
Claims for indemnification by our directors and officers may reduce our available funds to satisfy successful third-party claims against us and may reduce the amount of money available to us.
Our amended and restated certificate of incorporation and bylaws provide that we will indemnify our directors and officers, in each case to the fullest extent permitted by Delaware law. In addition, we have entered and expect to continue to enter into agreements to indemnify our directors, executive officers and other employees as determined by our Board of Directors. Under the terms of the indemnification agreements with our director nominees and amended indemnification agreements with each of our directors and officers, we are required to indemnify each of our directors and officers, to the fullest extent permitted by the laws of the state of Delaware, if the basis of the indemnitee's involvement was by reason of the fact that the indemnitee is or was a director or officer of the Company or any of its subsidiaries or was serving at the Company's request in an official capacity for another entity. We must indemnify our officers and directors against all reasonable fees, expenses, charges and other costs of any type or nature whatsoever, including any and all expenses and obligations paid or incurred in connection with investigating, defending, being a witness in, participating in (including on appeal), or preparing to defend, be a witness or participate in any completed, actual, pending or threatened action, suit, claim or proceeding, whether civil, criminal, administrative or investigative, or establishing or enforcing a right to indemnification under the indemnification agreement. The indemnification agreements also require us, if so requested, to advance within 30 days of such request all reasonable fees, expenses, charges and other costs that such director or officer incurred, provided that such person will return any such advance if it is ultimately determined that such person is not entitled to indemnification by us. Any claims for indemnification by our directors and officers may reduce our available funds to satisfy successful third-party claims against us and may reduce the amount of money available to us.
29
Item 1B. Unresolved Staff Comments
None.
30
Item 2. Properties
As of December 29, 2014, we and our franchisees operated 132 restaurants in 15 states. We operate a variety of restaurant formats, including in-line, end-cap and free-standing restaurants located in markets of varying sizes. Our restaurants are on average approximately 2,750 square feet. We lease the property for our corporate headquarters and all of the properties on which we operate restaurants.
The map and chart below show the locations of our restaurants as of December 29, 2014:
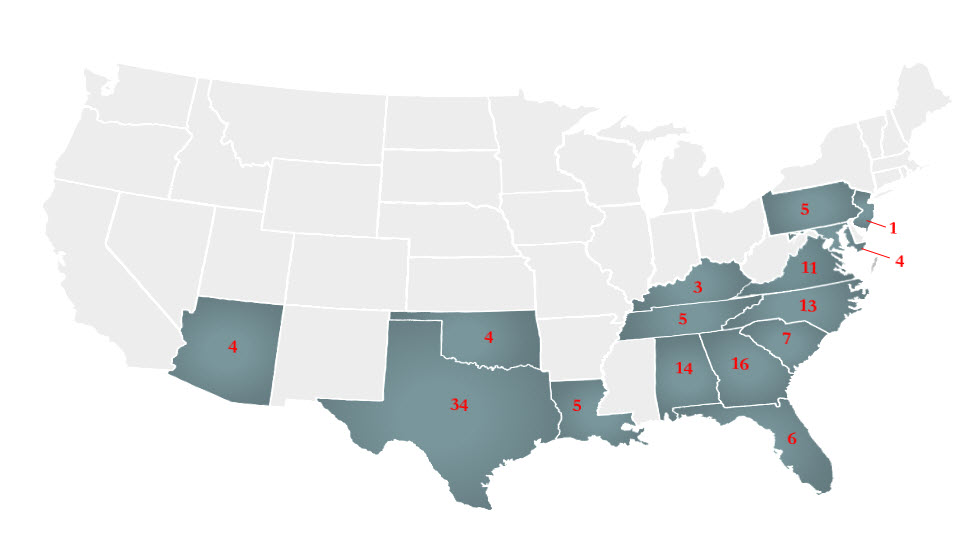
State | Company-Owned | Franchise | Total | ||||||
Alabama | 14 | — | 14 | ||||||
Arizona | 4 | — | 4 | ||||||
Florida | 6 | — | 6 | ||||||
Georgia | 16 | — | 16 | ||||||
Kentucky | — | 3 | 3 | ||||||
Louisiana | 5 | — | 5 | ||||||
Maryland | 4 | — | 4 | ||||||
New Jersey | 1 | — | 1 | ||||||
North Carolina | 13 | — | 13 | ||||||
Oklahoma | 4 | — | 4 | ||||||
Pennsylvania | 5 | — | 5 | ||||||
South Carolina | 7 | — | 7 | ||||||
Tennessee | 5 | — | 5 | ||||||
Texas | 34 | — | 34 | ||||||
Virginia | 11 | — | 11 | ||||||
Total | 129 | 3 | 132 | ||||||
31
We are obligated under non-cancelable leases for our restaurants and our central support office. Our restaurant leases generally have initial terms of 10 years with two or more five-year options. Our restaurant leases generally have renewal options and generally require us to pay a proportionate share of real estate taxes, insurance, common area maintenance charges and other operating costs. Some restaurant leases provide for contingent rental payments based on sales thresholds, although we generally do not expect to pay significant contingent rent on these properties based on the thresholds in those leases.
Item 3. Legal Proceedings
On October 31, 2014, Forsyth Consulting, Inc. ("Forsyth"), a former music vendor for the Company, filed a complaint against the Company in the Circuit Court of Jefferson County, Alabama alleging breach of contract with respect to its prior music service contract. We have removed the action to federal court and, on December 19, 2014, we filed a counterclaim in the United States District Court for the Northern District of Alabama, alleging breach of contract and tortious interference with business relations claims against Forsyth. The Company believes that Forsyth's claims are without merit and intends to vigorously pursue this action.
We are currently involved in various claims and legal actions that arise in the ordinary course of our business, including claims resulting from employment related matters. None of these claims, most of which are covered by insurance, has had a material effect on us, and as of the date of this report, other than as set forth above, we are not party to any material pending legal proceedings and are not aware of any claims that could have a material adverse effect on our business, financial condition, results of operations or cash flows. However, a significant increase in the number of these claims or an increase in amounts owing under successful claims could materially and adversely affect our business, financial condition, results of operations or cash flows.
Item 4. Mine Safety Disclosures
Not applicable.
32
PART II
Item 5. Market for Registrant's Common Equity, Related Stockholder Matters and Issuer Purchases of Equity Securities
Our common stock has traded on the New York Stock Exchange (the "NYSE") under the symbol "ZOES" since it began trading on April 11, 2014. Our initial public offering was priced at $15.00 per share on April 10, 2014. The following table sets forth, for the periods indicated, the high and low sales prices per share of our common stock as reported on the NYSE:
Common Stock Price Range | ||||||||
High | Low | |||||||
Fiscal Year 2014 | ||||||||
First quarter (April 11, 2014 - April 21, 2014) | $ | 31.43 | $ | 23.73 | ||||
Second quarter (April 22, 2014 - July 14, 2014) | $ | 35.59 | $ | 25.68 | ||||
Third quarter (July 15, 2014 - October 6, 2014) | $ | 32.87 | $ | 27.09 | ||||
Fourth quarter (October 7, 2014 - December 29, 2014) | $ | 38.42 | $ | 28.10 | ||||
On March 10, 2015, the closing price per share of our common stock on NYSE was $33.02 and there were approximately 22 stockholders of record of our common stock.
Performance Graph
The following performance graph compares the quarterly dollar change in the cumulative shareholder return on our common stock with the cumulative total returns of the NYSE Composite Index and the S&P 600 Restaurants Index. This graph assumes a $100 investment in our common stock on April 11, 2014 (the date when our common stock first started trading) and in each for the forgoing indices on April 11, 2014, and assumes the reinvestment of dividends, if any. The indices are included for comparative purposes only. They do not necessarily reflect management's opinion that such indices are an appropriate measure of the relative performance of our common stock. This graph is furnished and not "filed" with the Securities and Exchange Commission and it is not "soliciting material", and should not be incorporated by reference in any of our filings under the Securities Act of 1933, as amended, or the Securities Exchange Act of 1934, as amended, whether made before or after the date hereof and irrespective of any general incorporation language in such filing.
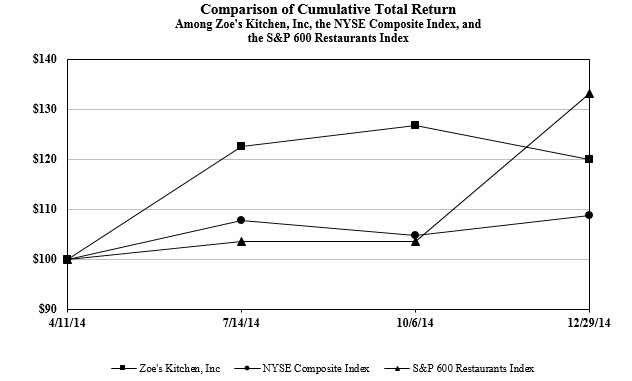
33
Dividends
No dividends have been declared or paid on the shares of our common stock. We do not expect to pay cash dividends to our shareholders in the immediate future. We expect to retain future earnings, if any, for future operations, expansion and debt repayment and have no current plans to pay any cash dividends for the immediate future. Any future determination to declare and pay cash dividends will be at the discretion of our Board of Directors and will depend on, among other things, our financial condition, results of operations, cash requirements, contractual restrictions in our credit facility, and such other factors as our Board of Directors deems relevant. See "Item 7 - Management’s Discussion and Analysis of Financial Condition and Results of Operations" for additional information regarding our financial condition.
34
Item 6. Selected Consolidated Financial Data
The following table presents our selected historical consolidated financial data and certain other financial data. The historical consolidated balance sheet data as of December 29, 2014 and December 30, 2013 and the consolidated statement of operations and consolidated statement of cash flows data for the years ended December 29, 2014, December 30, 2013 and December 31, 2012 have been derived from our historical audited consolidated financial statements, which are included elsewhere in this report. The consolidated balance sheet data as of December 31, 2012, December 26, 2011 and December 27, 2010 and the consolidated statement of operations and consolidated statement of cash flow data for the year ended December 26, 2011 and December 27, 2010 have been derived from our historical audited consolidated financial statements, which are not included in this report.
We operate on a 52- or 53-week fiscal year that ends on the last Monday of the calendar year. All fiscal years presented herein consist of 52 weeks, with the exception of the fiscal year ended December 31, 2012, which consisted of 53 weeks. Our first fiscal quarter consists of 16 weeks, and each of our second, third and fourth fiscal quarters consists of 12 weeks, except for a 53-week year when the fourth quarter has 13 weeks. We refer to our fiscal years as 2014, 2013, 2012, 2011 and 2010.
The consolidated financial data and other financial data presented below should be read in conjunction with the section entitled "Management's Discussion and Analysis of Financial Condition and Results of Operations," and our audited consolidated financial statements and the related notes thereto included elsewhere in this report. Our historical consolidated financial data may not be indicative of our future performance.
35
Fiscal Year Ended | ||||||||||||||||||||
December 29, 2014 | December 30, 2013 | December 31, 2012 | December 26, 2011 | December 27, 2010 | ||||||||||||||||
(Dollars in thousands, except per share data) | ||||||||||||||||||||
Consolidated Statement of Operations Data: | ||||||||||||||||||||
Revenue: | ||||||||||||||||||||
Restaurant sales | $ | 171,256 | $ | 115,748 | $ | 78,966 | $ | 49,193 | $ | 31,497 | ||||||||||
Franchise and royalty fees | 477 | 637 | 758 | 984 | 810 | |||||||||||||||
Total revenue | 171,733 | 116,385 | 79,724 | 50,177 | 32,308 | |||||||||||||||
Operating Expenses: | ||||||||||||||||||||
Restaurant Operating Costs: | ||||||||||||||||||||
Cost of sales (excluding depreciation and amortization) | 56,843 | 38,063 | 25,845 | 15,756 | 10,406 | |||||||||||||||
Labor | 48,300 | 32,810 | 21,567 | 13,424 | 8,587 | |||||||||||||||
Store operating expenses | 31,919 | 21,780 | 14,610 | 9,596 | 5,975 | |||||||||||||||
General and administrative expenses | 26,744 | 13,171 | 8,969 | 6,384 | 5,344 | |||||||||||||||
Depreciation | 8,900 | 5,862 | 3,779 | 2,840 | 1,805 | |||||||||||||||
Amortization | 1,573 | 1,601 | 1,091 | 585 | 557 | |||||||||||||||
Pre-opening costs | 2,109 | 1,938 | 917 | 806 | 544 | |||||||||||||||
Loss (gain) from disposal of equipment | 144 | 175 | 240 | (4 | ) | 289 | ||||||||||||||
Total operating expenses | 176,532 | 115,400 | 77,018 | 49,387 | 33,507 | |||||||||||||||
Income (loss) from operations | (4,799 | ) | 985 | 2,706 | 790 | (1,199 | ) | |||||||||||||
Other Expenses: | ||||||||||||||||||||
Interest expense, net | 3,535 | 4,019 | 2,337 | 1,248 | 720 | |||||||||||||||
Loss on extinguishment of debt | 978 | — | — | — | — | |||||||||||||||
Loss on interest cap | 6 | 25 | — | — | — | |||||||||||||||
Bargain purchase gain from acquisitions | — | — | — | (541 | ) | — | ||||||||||||||
Total other expenses | 4,519 | 4,044 | 2,337 | 707 | 720 | |||||||||||||||
Income (loss) before provision for income taxes | (9,318 | ) | (3,059 | ) | 369 | 83 | (1,919 | ) | ||||||||||||
Provision for income taxes | 699 | 656 | 622 | 110 | 554 | |||||||||||||||
Net loss | $ | (10,017 | ) | $ | (3,715 | ) | $ | (253 | ) | $ | (27 | ) | $ | (2,472 | ) | |||||
Net loss per share:(1) | ||||||||||||||||||||
Basic | $ | (0.58 | ) | $ | (0.30 | ) | $ | (0.02 | ) | $ | — | $ | (0.20 | ) | ||||||
Diluted | $ | (0.58 | ) | $ | (0.30 | ) | $ | (0.02 | ) | $ | — | $ | (0.20 | ) | ||||||
Weighted average shares outstanding:(1) | ||||||||||||||||||||
Basic | 17,410 | 12,561 | 12,561 | 12,561 | 12,561 | |||||||||||||||
Diluted | 17,410 | 12,561 | 12,561 | 12,561 | 12,561 | |||||||||||||||
Consolidated Statement of Cash Flows Data: | ||||||||||||||||||||
Net cash provided by operating activities | $ | 17,753 | $ | 10,924 | $ | 7,796 | $ | 4,764 | $ | 3,780 | ||||||||||
Net cash used in investing activities | (40,080 | ) | (28,242 | ) | (21,283 | ) | (13,519 | ) | (8,028 | ) | ||||||||||
Net cash provided by financing activities | 50,568 | 16,017 | 15,130 | 7,600 | 3,468 | |||||||||||||||
36
December 29, 2014 | December 30, 2013 | December 31, 2012 | December 26, 2011 | December 27, 2010 | ||||||||||||||||
(Dollars in thousands) | ||||||||||||||||||||
Balance Sheet Data: | ||||||||||||||||||||
Cash and cash equivalents | $ | 29,390 | $ | 1,149 | $ | 2,450 | $ | 807 | $ | 1,962 | ||||||||||
Property and equipment, net | 103,945 | 78,629 | 48,215 | 31,472 | 19,937 | |||||||||||||||
Total assets | 178,661 | 120,064 | 90,716 | 66,937 | 53,214 | |||||||||||||||
Total debt(2) | 23,568 | 61,650 | 38,201 | 19,028 | 8,643 | |||||||||||||||
Total stockholders' equity | 121,269 | 33,579 | 37,220 | 37,347 | 37,184 | |||||||||||||||
Fiscal Year Ended | ||||||||||||||||||||
December 29, 2014 | December 30, 2013 | December 31, 2012 | December 26, 2011 | December 27, 2010 | ||||||||||||||||
(Dollars in thousands) | ||||||||||||||||||||
Other Operating Data: | ||||||||||||||||||||
Company-owned restaurants at end of period | 129 | 94 | 67 | 48 | 32 | |||||||||||||||
Franchise restaurants at end of period | 3 | 8 | 8 | 9 | 11 | |||||||||||||||
Company-owned: | ||||||||||||||||||||
Average unit volume | $ | 1,501 | $ | 1,470 | $ | 1,421 | $ | 1,299 | $ | 1,209 | ||||||||||
Comparable restaurant sales growth | 6.7 | % | 6.9 | % | 13.4 | % | 11.8 | % | 11.9 | % | ||||||||||
Restaurant contribution(3) | $ | 34,194 | $ | 23,095 | $ | 16,945 | $ | 10,418 | $ | 6,529 | ||||||||||
as a percentage of restaurant sales | 20.0 | % | 20.0 | % | 21.5 | % | 21.2 | % | 20.7 | % | ||||||||||
Adjusted EBITDA(4) | $ | 16,005 | $ | 10,899 | $ | 9,153 | $ | 5,440 | $ | 2,411 | ||||||||||
as a percentage of revenue | 9.3 | % | 9.4 | % | 11.5 | % | 10.8 | % | 7.5 | % | ||||||||||
Capital expenditures | $ | 31,102 | $ | 28,267 | $ | 15,462 | $ | 10,959 | $ | 8,028 | ||||||||||
(1) Net loss per common share gives effect to (i) the distribution of 12,561,414 shares of our common stock previously held by Zoe's Investors, LLC to its members in connection with the IPO, (ii) the 125,614.14-for-1 stock split of our common stock, which was effected in connection with the IPO; and (iii) the issuance of 6,708,332 shares of our common stock in the IPO, as if each of these events had occurred on December 28, 2010. See Note 14 of our consolidated financial statements.
(2) Includes interest-bearing debt, residual value obligations and deemed landlord financing, as applicable.
(3) Restaurant contribution is defined as restaurant sales less restaurant operating costs which are cost of sales, labor, and store operating expenses.
.
(4) EBITDA is defined as net loss before interest, income taxes and depreciation and amortization.
Adjusted EBITDA is defined as EBITDA plus equity-based compensation expense, bargain purchase gain from acquisitions, management and consulting fees, asset disposals, closure costs, loss on interest cap and restaurant impairment, loss on extinguishment of debt, non-capitalized offering related expenses, executive relocation expenses, and pre-opening costs. Adjusted EBITDA is intended as a supplemental measure of our performance that is not required by, or presented in accordance with, GAAP. We believe that EBITDA and Adjusted EBITDA provide useful information to management and investors regarding certain financial and business trends relating to our financial condition and operating results. Our management uses EBITDA and Adjusted EBITDA (i) as a factor in evaluating management's performance when determining incentive compensation and (ii) to evaluate the effectiveness of our business strategies.
We believe that the use of EBITDA and Adjusted EBITDA provides an additional tool for investors to use in evaluating ongoing operating results and trends and in comparing the Company's financial measures with other fast-casual restaurants, which may present similar non-GAAP financial measures to investors. In addition, you should be aware when evaluating EBITDA and Adjusted EBITDA that in the future we may incur expenses similar to those excluded when calculating these measures. Our presentation of these measures should not be construed as an inference that our future results will be unaffected by unusual or non-recurring items. Our computation of Adjusted EBITDA may not be comparable to other similarly titled measures computed by other companies, because all companies do not calculate Adjusted EBITDA in the same fashion.
Our management does not consider EBITDA or Adjusted EBITDA in isolation or as an alternative to financial measures determined in accordance with GAAP. The principal limitation of EBITDA and Adjusted EBITDA is that they exclude significant expenses and income that are required by GAAP to be recorded in the Company's financial statements. Some of these limitations are:
• | Adjusted EBITDA does not reflect our cash expenditures, or future requirements, for capital expenditures or contractual commitments; |
• | Adjusted EBITDA does not reflect changes in, or cash requirements for, our working capital needs; |
• | Adjusted EBITDA does not reflect the interest expense, or the cash requirements necessary to service interest or principal payments, on our debts; |
• | although depreciation and amortization are non-cash charges, the assets being depreciated and amortized will often have to be replaced in the future, and Adjusted EBITDA does not reflect any cash requirements for such replacements; |
37
• | equity-based compensation expense is and will remain a key element of our overall long-term incentive compensation package, although we exclude it as an expense when evaluating our ongoing operating performance for a particular period; |
• | Adjusted EBITDA does not reflect the impact of certain cash charges resulting from matters we consider not to be indicative of our ongoing operations; and |
• | other companies in our industry may calculate Adjusted EBITDA differently than we do, limiting its usefulness as a comparative measure. |
Because of these limitations, EBITDA and Adjusted EBITDA should not be considered in isolation or as a substitute for performance measures calculated in accordance with GAAP. We compensate for these limitations by relying primarily on our GAAP results and using EBITDA and Adjusted EBITDA only supplementally. You should review the reconciliation of net loss to EBITDA and Adjusted EBITDA below and not rely on any single financial measure to evaluate our business.
The following table reconciles net loss to EBITDA and Adjusted EBITDA for the fiscal years 2014, 2013, 2012, 2011 and 2010:
Fiscal Year Ended | ||||||||||||||||||||
December 29, 2014 | December 30, 2013 | December 31, 2012 | December 26, 2011 | December 27, 2010 | ||||||||||||||||
(Dollars in thousands) | ||||||||||||||||||||
Adjusted EBITDA: | ||||||||||||||||||||
Net loss, as reported | $ | (10,017 | ) | $ | (3,715 | ) | $ | (253 | ) | $ | (27 | ) | $ | (2,472 | ) | |||||
Depreciation and amortization | 10,473 | 7,463 | 4,870 | 3,426 | 2,362 | |||||||||||||||
Interest expense | 3,535 | 4,019 | 2,337 | 1,248 | 720 | |||||||||||||||
Provision for income taxes | 699 | 656 | 622 | 110 | 554 | |||||||||||||||
EBITDA | 4,690 | 8,423 | 7,576 | 4,757 | 1,163 | |||||||||||||||
Asset disposals, closure costs, loss on interest cap and restaurant impairment(a) | 150 | 200 | 240 | (4 | ) | 289 | ||||||||||||||
Management and consulting fees(b) | 113 | 264 | 295 | 232 | 122 | |||||||||||||||
Equity-based compensation expense | 6,332 | 74 | 125 | 190 | 293 | |||||||||||||||
Loss on extinguishment of debt | 978 | — | — | — | — | |||||||||||||||
Pre-opening costs(c) | 2,109 | 1,938 | 917 | 806 | 544 | |||||||||||||||
Offering related expenses(d) | 1,463 | — | — | — | — | |||||||||||||||
Executive relocation expenses(e) | 170 | — | — | — | — | |||||||||||||||
Bargain purchase gain from acquisitions(f) | — | — | — | (541 | ) | — | ||||||||||||||
Adjusted EBITDA | $ | 16,005 | $ | 10,899 | $ | 9,153 | $ | 5,440 | $ | 2,411 | ||||||||||
(a) Represents costs related to impairment of long-lived assets, gain or loss on disposal of property and equipment, loss on interest cap and restaurant closure expenses.
(b) Represents fees payable to Brentwood pursuant to the Corporate Development and Administrative Services Agreement and fees paid to Greg Dollarhyde pursuant to the Consulting Agreement. The Corporate Development and Administrative Services Agreement and the Consulting Agreement were terminated prior to the completion of the IPO.
(c) Represents expenses directly associated with the opening of new restaurants that are incurred prior to opening, including pre-opening rent.
(d) Represents fees and expenses that were incurred, but not capitalized, in relation to our IPO completed on April 16, 2014, a follow-on offering completed on August 19, 2014 and a follow-on offering completed on November 19, 2014.
(e) Represents costs associated with the relocation packages of one of our executives.
(f) Represents the excess of the fair value of net assets acquired over the purchase price related to our acquisitions of the Houston franchise restaurants.
38
Item 7. Management's Discussion and Analysis of Financial Condition and Results of Operations
The following discussion summarizes the significant factors affecting our consolidated operating results, financial condition, liquidity and cash flows as of and for the periods presented below. The following discussion and analysis should be read in conjunction with "Item 6 - Selected Consolidated Financial Data" and our audited consolidated financial statements and the related notes included in "Item 8 - Financial Statements and Supplementary Data".
In addition to historical information, this discussion and analysis contains forward-looking statements based on current expectations that involve risks, uncertainties and assumptions, such as our plans, objectives, expectations, and intentions set forth under "Item 1A - Risk Factors." Our actual results and the timing of events may differ materially from those anticipated in these forward-looking statements as a result of various factors, including those set forth in "Item 1A - Risk Factors" and elsewhere in this report.
Overview
Zoës Kitchen is a fast growing, fast-casual restaurant concept serving a distinct menu of fresh, wholesome, Mediterranean-inspired dishes delivered with Southern hospitality. Founded in 1995 by Zoë and Marcus Cassimus in Birmingham, Alabama, Zoës Kitchen is a natural extension of Zoë Cassimus' lifetime passion for cooking Mediterranean meals for family and friends. Since opening our first restaurant, we have never wavered from our commitment to make our food fresh daily and to serve our customers in a warm and welcoming environment. We believe our brand delivers on our customers' desire for freshly-prepared food, convenient, unique and high-quality experiences and their commitment to family, friends and enjoying every moment.
Growth Strategies and Outlook
We plan to execute the following strategies to continue to enhance our brand awareness, grow our revenue and achieve profitability:
• | grow our restaurant base; |
• | increase our comparable restaurant sales; and |
• | improve our margins and leverage infrastructure. |
We have expanded our restaurant base from 21 restaurants in seven states in 2008 to 132 restaurants in 15 states as of December 29, 2014. We opened 30 Company-owned restaurants in 2014, and we plan to open 31 to 33 Company-owned restaurants in 2015. We expect to double our restaurant base in the next four years. To increase comparable restaurant sales, we plan to heighten brand awareness to drive new customer traffic, increase existing customer frequency and grow our catering business. We believe we are well positioned for future growth with a developed infrastructure capable of supporting a restaurant base that is greater than our existing footprint. Additionally, we believe we have an opportunity to optimize costs and enhance our profitability as we benefit from economies of scale.
Key Events
Franchise Acquisitions. Since the beginning of 2009, we have acquired eleven franchise restaurants. In November 2011, we acquired three franchise restaurants in Houston, Texas; in August 2012, we acquired three franchise restaurants in South Carolina, with two restaurants located in Columbia and one restaurant in Greenville; in January 2014, we acquired two franchise restaurants, with one located in Mobile, Alabama and one located in Destin, Florida; and in November 2014, we acquired three franchise restaurants and two sites under development in Louisiana.
Initial Public Offering. On April 16, 2014, we completed our IPO of 6,708,332 shares of common stock at a price to the public of $15.00 per share, which included 874,999 shares of common stock sold to the underwriters pursuant to their over-allotment option. After underwriters discounts and commissions and offering expenses, we received net proceeds from the offering of approximately $91.0 million. A portion of these proceeds were used to repay the entire amount of then existing outstanding borrowings under our Term Loan and Line of Credit (the "2011 Credit Facility"). We used the remainder of the IPO proceeds to support our growth, primarily through opening new restaurants and for working capital and general corporate expenses.
As a result of the IPO and the repayment of our outstanding debt, we have benefited from savings on interest expense and certain management fees that we incurred as a private company, but we also incurred incremental costs as a public company. Incremental public company costs include legal, accounting, insurance and other compliance costs. We will continue to use our operating cash flows to fund capital expenditures to support restaurant growth, as well as to invest in our existing restaurants, infrastructure and information technology. See "Liquidity and Capital Resources."
Further, in connection with the IPO, we incurred $6.1 million of equity-based compensation expenses, which includes $4.9 million related to accelerated vesting of outstanding equity awards at the closing of the IPO and $1.2 million related to stock
39
options granted at the closing of the IPO. The financial impact of the IPO will affect the comparability of our post-IPO financial performance to our pre-IPO financial performance.
Follow-On Offerings. On August 19, 2014, we completed a follow-on offering of 5,175,000 shares of the Company's common stock at a price of $30.25 per share, which included 675,000 shares sold to the underwriters pursuant to their over-allotment option. All of these shares were offered by the selling stockholders, except for 94,100 shares offered by the Company, the proceeds of which were used by the Company to repurchase the same number of shares from certain of its officers. We did not receive any net proceeds from the offering.
On November 19, 2014, we completed a follow-on offering of 4,370,000 shares of the Company's common stock at a price of $32.00 per share, which included 570,000 shares sold to the underwriters pursuant to their over-allotment option. All of these shares were offered by the selling stockholders. We did not receive any proceeds from the offering.
Key Measures We Use to Evaluate Our Performance
In assessing the performance of our business, we consider a variety of performance and financial measures. The key measures for determining how our business is performing are restaurant sales, comparable restaurant sales growth, AUVs, restaurant contribution, number of new restaurant openings and Adjusted EBITDA.
Restaurant Sales
Restaurant sales represents sales of food and beverages in Company-owned restaurants. Several factors affect our restaurant sales in any given period including the number of restaurants in operation and per restaurant sales.
Comparable Restaurant Sales Growth
Comparable restaurant sales refers to year-over-year sales comparisons for the comparable Company-owned restaurant base. We define the comparable restaurant base to include those restaurants open for 18 periods or longer. As of December 29, 2014, December 30, 2013 and December 31, 2012, there were 81, 55 and 40 restaurants, respectively, in our comparable Company-owned restaurant base. This measure highlights performance of existing restaurants, as the impact of new Company-owned restaurant openings is excluded.
Comparable restaurant sales growth is generated by an increase in customer traffic or changes in per-customer spend. Per-customer spend can be influenced by changes in menu prices and/or the mix and number of items sold per check.
Measuring our comparable restaurant sales allows us to evaluate the performance of our existing restaurant base. Various factors impact comparable restaurant sales, including:
• | consumer recognition of our brand and our ability to respond to changing consumer preferences; |
• | overall economic trends, particularly those related to consumer spending; |
• | our ability to operate restaurants effectively and efficiently to meet consumer expectations; |
• | pricing; |
• | customer traffic; |
• | per-customer spend and average check amount; |
• | marketing and promotional efforts; |
• | local competition; |
• | trade area dynamics; |
• | introduction of new menu items; and |
• | opening of new restaurants in the vicinity of existing locations. |
Consistent with common industry practice, we present comparable restaurant sales on a calendar-adjusted basis that aligns current year sales weeks with comparable periods in the prior year, regardless of whether they belong to the same fiscal period or not. Since opening new Company-owned restaurants will be a significant component of our revenue growth, comparable restaurant sales is only one measure of how we evaluate our performance.
40
The following table shows our quarterly comparable restaurant sales growth since 2012:
Fiscal 2012 | Fiscal 2013 | Fiscal 2014 | ||||||||||||||||||||||||||||||||||
Q1 | Q2 | Q3 | Q4 | Q1 | Q2 | Q3 | Q4 | Q1 | Q2 | Q3 | Q4 | |||||||||||||||||||||||||
Comparable Restaurant Sales Growth | 14.1 | % | 15.0 | % | 12.5 | % | 12.1 | % | 10.4 | % | 5.5 | % | 7.7 | % | 3.8 | % | * | 5.7 | % | 7.5 | % | 5.9 | % | 7.8 | % | |||||||||||
Comparable Restaurants | 32 | 34 | 35 | 40 | 43 | 50 | 52 | 55 | 63 | 70 | 78 | 81 | ||||||||||||||||||||||||
* Adjusting for a calendar shift related to the 53rd week in 2012, comparable restaurant sales would increase in the fourth quarter of 2013 from 3.8% to 7.0%.
Average Unit Volumes (AUVs)
AUVs consist of the average sales of all Company-owned restaurants that have been open for a trailing 52-week period or longer. For purposes of AUV calculations, the fifty-third week in 2012 has been excluded. AUVs allow management to assess changes in consumer traffic and per-customer spending patterns at our restaurants.
Restaurant Contribution
Restaurant contribution is defined as restaurant sales less restaurant operating costs, which are cost of sales, labor and store operating expenses. We expect restaurant contribution to increase in proportion to the number of new Company-owned restaurants we open and our comparable restaurant sales growth. Fluctuations in restaurant contribution margin can also be attributed to those factors discussed below for the components of restaurant operating costs.
Number of New Restaurant Openings
The number of Company-owned restaurant openings reflects the number of restaurants opened during a particular reporting period. Before we open new Company-owned restaurants, we incur pre-opening costs. Some of our restaurants open with an initial start-up period of higher than normal sales volumes, which subsequently decrease to stabilized levels. Typically, our new restaurants have stabilized sales after approximately 12 to 24 weeks of operation, at which time the restaurant's sales typically begin to grow on a consistent basis. In new markets, the length of time before average sales for new restaurants stabilize is less predictable and can be longer as a result of our limited knowledge of these markets and consumers' limited awareness of our brand. New restaurants may not be profitable, and their sales performance may not follow historical patterns. The number and timing of restaurant openings has had, and is expected to continue to have, an impact on our results of operations. The following table shows the growth in our Company-owned and franchise restaurant base for the fiscal years ended December 29, 2014, December 30, 2013 and December 31, 2012:
Fiscal Year Ended | |||||||||
December 29, 2014 | December 30, 2013 | December 31, 2012 | |||||||
Company-Owned Restaurant Base | |||||||||
Beginning of period | 94 | 67 | 48 | ||||||
Openings | 30 | 27 | 16 | ||||||
Franchisee acquisitions | 5 | — | 3 | ||||||
Restaurants at end of period | 129 | 94 | 67 | ||||||
Franchise Restaurant Base | |||||||||
Beginning of period | 8 | 8 | 9 | ||||||
Openings | — | — | 2 | ||||||
Franchisee acquisitions | (5 | ) | — | (3 | ) | ||||
Restaurants at end of period | 3 | 8 | 8 | ||||||
Total restaurants | 132 | 102 | 75 | ||||||
Key Financial Definitions
Revenue. Restaurant sales represent sales of food and beverages in Company-owned restaurants, net of promotional allowances and employee meals. Restaurant sales in a given period are directly impacted by the number of operating weeks in the period, the number of restaurants we operate and comparable restaurant sales growth. Royalty and Franchise fees represent royalty income from franchisees and initial franchise fees.
41
Cost of sales. Cost of sales consists primarily of food, beverage and packaging costs. The components of cost of sales are variable in nature, change with sales volume and are influenced by menu mix and subject to increases or decreases based on fluctuations in commodity costs.
Labor. Labor includes all restaurant-level management and hourly labor costs, including salaries, wages, benefits and bonuses, payroll taxes and other indirect labor costs.
Store operating expenses. Store operating expenses include all other restaurant-level operating expenses, such as supplies, utilities, repairs and maintenance, travel costs, credit card fees, recruiting, delivery service, restaurant-level marketing costs, security and occupancy expenses.
General and administrative expenses. General and administrative expenses include expenses associated with corporate and regional functions that support the development and operations of restaurants, including compensation and benefits, travel expenses, stock compensation costs, legal and professional fees, advertising costs, information systems, corporate office rent and other related corporate costs.
Depreciation. Depreciation consists of depreciation of fixed assets, including equipment and capitalized leasehold improvements.
Amortization. Amortization consists of amortization of certain intangible assets including franchise agreements, trademarks, reacquired rights and favorable leases.
Pre-opening costs. Pre-opening costs consist of expenses incurred prior to opening a new restaurant and are made up primarily of manager salaries, relocation costs, supplies, recruiting expenses, employee payroll and training costs. Pre-opening costs also include occupancy costs recorded during the period between date of possession and the restaurant opening date.
Loss (gain) from disposal of equipment. Loss (gain) from disposal of equipment is composed of the loss on disposal of assets related to retirements and replacements of leasehold improvements or equipment and impairment charges. These losses are related to normal disposals in the ordinary course of business, along with disposals related to selected restaurant remodeling activities.
Interest expense. Interest expense includes cash and imputed non-cash charges related to our deemed landlord financing, non-cash charges related to our residual value obligations, amortization of debt issue costs as well as cash payments and accrued charges related to the 2011 Credit Facility. On April 16, 2014, we repaid all outstanding borrowings under the 2011 Credit Facility with a portion of the proceeds from our IPO and subsequently terminated our 2011 Credit Facility.
Loss on extinguishment of debt. Loss on extinguishment of debt consist of the write-off of unamortized loan costs and other fees, following the repayment of the 2011 Credit Facility.
Provision for income taxes. Provision for income taxes represents federal, state and local current and deferred income tax expense.
42
Consolidated Results of Operations
The following table summarizes key components of our results of operations for the periods indicated as a percentage of our total revenue, except for the components of restaurant operating costs, which are expressed as a percentage of restaurant sales.
Fiscal Year Ended | |||||||||
December 29, 2014 | December 30, 2013 | December 31, 2012 | |||||||
Revenue: | |||||||||
Restaurant sales | 99.7 | % | 99.5 | % | 99.0 | % | |||
Franchise and royalty fees | 0.3 | % | 0.5 | % | 1.0 | % | |||
Total revenue | 100.0 | % | 100.0 | % | 100.0 | % | |||
Restaurant operating costs (1): | |||||||||
Cost of sales (excluding depreciation and amortization) | 33.2 | % | 32.9 | % | 32.7 | % | |||
Labor | 28.2 | % | 28.3 | % | 27.3 | % | |||
Store operating expenses | 18.6 | % | 18.8 | % | 18.5 | % | |||
General and administrative expenses | 15.6 | % | 11.3 | % | 11.3 | % | |||
Depreciation | 5.2 | % | 5.0 | % | 4.7 | % | |||
Amortization | 0.9 | % | 1.4 | % | 1.4 | % | |||
Pre-opening costs | 1.2 | % | 1.7 | % | 1.2 | % | |||
Loss from disposal of equipment | 0.1 | % | 0.2 | % | 0.3 | % | |||
Total operating expenses | 102.8 | % | 99.2 | % | 96.6 | % | |||
Income (loss) from operations | (2.8 | )% | 0.8 | % | 3.4 | % | |||
Other expenses: | |||||||||
Interest expense, net | 2.1 | % | 3.5 | % | 2.9 | % | |||
Loss on extinguishment of debt | 0.6 | % | — | — | |||||
Loss on interest cap | 0.0 | % | 0.0 | % | — | ||||
Total other expenses | 2.6 | % | 3.5 | % | 2.9 | % | |||
Income (loss) before provision (benefit) for income taxes | (5.4 | )% | (2.6 | )% | 0.5 | % | |||
Provision for income taxes | 0.4 | % | 0.6 | % | 0.8 | % | |||
Net loss | (5.8 | )% | (3.2 | )% | (0.3 | )% | |||
(1) As a percentage of restaurant sales. | |||||||||
43
Fifty-two Weeks Ended December 29, 2014 Compared to Fifty-two Weeks Ended December 30, 2013
The following table presents selected consolidated comparative results of operations from our audited condensed consolidated financial statements for the fifty-two weeks ended December 29, 2014 compared to the fifty-two weeks ended December 30, 2013:
Fiscal Year Ended | |||||||||||||||
Increase / (Decrease) | |||||||||||||||
December 29, 2014 | December 30, 2013 | ||||||||||||||
Dollars | Percentage | ||||||||||||||
(Dollars in thousands) | |||||||||||||||
Consolidated Statement of Operations Data: | |||||||||||||||
Revenue: | |||||||||||||||
Restaurant sales | $ | 171,256 | $ | 115,748 | $ | 55,508 | 48.0 | % | |||||||
Royalty fees | 477 | 637 | (160 | ) | (25.1 | )% | |||||||||
Total revenue | 171,733 | 116,385 | 55,348 | 47.6 | % | ||||||||||
Operating expenses: | |||||||||||||||
Restaurant operating costs: | |||||||||||||||
Cost of sales (excluding depreciation and amortization) | 56,843 | 38,063 | 18,780 | 49.3 | % | ||||||||||
Labor | 48,300 | 32,810 | 15,490 | 47.2 | % | ||||||||||
Store operating expenses | 31,919 | 21,780 | 10,139 | 46.6 | % | ||||||||||
General and administrative expenses | 26,744 | 13,171 | 13,573 | 103.1 | % | ||||||||||
Depreciation | 8,900 | 5,862 | 3,038 | 51.8 | % | ||||||||||
Amortization | 1,573 | 1,601 | (28 | ) | (1.7 | )% | |||||||||
Pre-opening costs | 2,109 | 1,938 | 171 | 8.8 | % | ||||||||||
Loss from disposal of equipment | 144 | 175 | (31 | ) | (17.7 | )% | |||||||||
Total operating expenses | 176,532 | 115,400 | 61,132 | 53.0 | % | ||||||||||
Income (loss) from operations | (4,799 | ) | 985 | (5,784 | ) | (587.2 | )% | ||||||||
Other expenses: | |||||||||||||||
Interest expense, net | 3,535 | 4,019 | (484 | ) | (12.0 | )% | |||||||||
Loss on extinguishment of debt | 978 | — | 978 | 100 | % | ||||||||||
Loss on interest cap | 6 | 25 | (19 | ) | (76 | )% | |||||||||
Total other expenses | 4,519 | 4,044 | 475 | 11.7 | % | ||||||||||
Loss before provision for income taxes | (9,318 | ) | (3,059 | ) | (6,259 | ) | 204.6 | % | |||||||
Provision for income taxes | 699 | 656 | 43 | 6.6 | % | ||||||||||
Net loss | $ | (10,017 | ) | $ | (3,715 | ) | $ | (6,302 | ) | 169.6 | % | ||||
44
Restaurant sales. The following table summarizes the growth in restaurant sales from 2013 to 2014:
(in thousands) | Net Sales | ||
Restaurant sales for 2013 | $ | 115,748 | |
Incremental restaurant sales increase due to: | |||
Comparable restaurant sales | 6,804 | ||
Restaurants not in comparable restaurant base | 48,704 | ||
Restaurant sales for 2014 | $ | 171,256 | |
Restaurant sales increased by $55.5 million, or 48.0%, in 2014 compared to 2013. Restaurants not in the comparable restaurant base accounted for $48.7 million of this increase. The balance of the growth was due to an increase in comparable restaurant sales of $6.8 million, or 6.7%, in 2014, comprised primarily of increased customer traffic at our comparable restaurants.
Royalty fees. Royalty fees decreased by $0.2 million, or 25.1%, in 2014 compared to 2013. The decrease was primarily attributable to the acquisition of the Destin and Mobile franchise restaurants in January 2014 and the acquisition of the Louisiana franchise restaurants in November 2014, which resulted in lower royalty fees in 2014.
Cost of sales. Cost of sales increased $18.8 million in 2014 compared to 2013, due primarily to the increase in restaurant sales. As a percentage of restaurant sales, cost of sales increased from 32.9% in 2013 to 33.2% in 2014. This increase was primarily driven by food cost inflation with higher costs of beef, seafood and dairy, partially offset by lower costs of dry goods and a minimal price increase.
Labor. Labor increased by $15.5 million in 2014 compared to 2013, due primarily to 30 new Company-owned restaurants opening in 2014. As a percentage of restaurant sales, labor decreased from 28.3% in 2013 to 28.2% in 2014. The decrease in labor percentage was driven by leverage from increased sales and improved management of hourly labor in 2014.
Store operating expenses. Store operating expenses increased by $10.1 million in 2014 compared to 2013, due primarily to 30 new Company-owned restaurants opening in 2014. As a percentage of restaurant sales, store operating expense decreased from 18.8% in 2013 to 18.6% in 2014. The decrease in store operating expenses percentage was driven by leverage from increased sales.
General and administrative expenses. General and administrative expenses increased by $13.6 million in 2014 compared to 2013. As a percentage of revenue, general and administrative expenses increased from 11.3% in 2013 to 15.6% in 2014. The increase was primarily driven by a $6.3 million increase in equity-based compensation expense primarily due to the accelerated vesting of stock and stock options as of the date of the IPO and $1.0 million of additional accounting expense. Other costs increased primarily due to costs associated with supporting an increased number of restaurants, the relocation of our corporate office and incremental public company costs.
Depreciation. Depreciation increased by $3.0 million in 2014 compared to 2013, due primarily to 30 new Company-owned restaurants opening in 2014. As a percentage of revenue, depreciation increased from 5.0% in 2013 to 5.2% in 2014, due to slightly higher build-out costs and accelerated depreciation related to the home office relocation.
Amortization. Amortization remained flat in 2014 compared to 2013. In 2013 we had accelerated amortization of franchise agreement intangibles related to the Destin and Mobile franchise acquisition which occured in January 2014. In 2014, we had accelerated amortization of franchise agreement intangibles related to the acquisition of three franchise restaurants in Louisiana.
Pre-opening costs. Pre-opening costs increased by $0.2 million in 2014 compared to 2013, due primarily to 30 new Company-owned restaurants opening in 2014 compared to 27 new Company-owned restaurants.
Loss from disposal of equipment. Loss from disposal of equipment remained flat in 2014 compared to 2013.
Interest expense. Interest expense decreased by $0.5 million in 2014 compared to 2013, due primarily to interest from deemed landlord financing increasing by $0.8 million offset by lower interest after repaying all outstanding borrowings under the 2011 Credit Facility on April 16, 2014.
Provision for income taxes. Provision for income taxes remained flat at $0.7 million in 2013 and 2014. Tax expense typically remains relatively constant as it primarily reflects the accrual of income tax expense related to a valuation allowance in connection with the tax amortization of the Company’s goodwill that was not available to offset existing deferred tax assets. Due to the uncertain timing of the reversal of this temporary difference, it cannot be considered as a source of future taxable income
45
for purposes of determining a valuation allowance; therefore the related future tax liability associated with this temporary difference cannot offset deferred tax assets. The comparison of our effective tax rate between periods is significantly impacted by the level of pre-tax income (loss) earned and projected for the year, which in the current year is primarily impacted by additional expenses incurred as a result of our IPO in April 2014 and the follow-on offerings completed in August 2014 and November 2014 and a few other operational expenses noted above.
Fifty-Two Weeks Ended December 30, 2013 Compared to Fifty-Three Weeks Ended December 31, 2012
The following table presents selected consolidated comparative results of operations from our audited condensed consolidated financial statements for the fifty-two weeks ended December 30, 2013 compared to the fifty-three weeks ended December 31, 2012:
Fiscal Year Ended | |||||||||||||||
Increase / (Decrease) | |||||||||||||||
December 30, 2013 | December 31, 2012 | ||||||||||||||
Dollars | Percentage | ||||||||||||||
(Dollars in thousands) | |||||||||||||||
Consolidated Statement of Operations Data: | |||||||||||||||
Revenue: | |||||||||||||||
Restaurant sales | $ | 115,748 | $ | 78,966 | $ | 36,782 | 46.6 | % | |||||||
Franchise and royalty fees | 637 | 758 | (121 | ) | (16.0 | )% | |||||||||
Total revenue | 116,385 | 79,724 | 36,661 | 46.0 | % | ||||||||||
Operating expenses: | |||||||||||||||
Restaurant operating costs: | |||||||||||||||
Cost of sales (excluding depreciation and amortization) | 38,063 | 25,845 | 12,218 | 47.3 | % | ||||||||||
Labor | 32,810 | 21,567 | 11,243 | 52.1 | % | ||||||||||
Store operating expenses | 21,780 | 14,610 | 7,170 | 49.1 | % | ||||||||||
General and administrative expenses | 13,171 | 8,969 | 4,202 | 46.9 | % | ||||||||||
Depreciation | 5,862 | 3,779 | 2,083 | 55.1 | % | ||||||||||
Amortization | 1,601 | 1,091 | 510 | 46.7 | % | ||||||||||
Pre-opening costs | 1,938 | 917 | 1,021 | 111.3 | % | ||||||||||
Loss from disposal of equipment | 175 | 240 | (65 | ) | (27.1 | )% | |||||||||
Total operating expenses | 115,400 | 77,018 | 38,382 | 49.8 | % | ||||||||||
Income from operations | 985 | 2,706 | (1,721 | ) | (63.6 | )% | |||||||||
Other expenses: | |||||||||||||||
Interest expense | 4,019 | 2,337 | 1,682 | 72.0 | % | ||||||||||
Loss on interest cap | 25 | — | 25 | * | |||||||||||
Total other expenses | 4,044 | 2,337 | 1,707 | 73.0 | % | ||||||||||
Income (loss) before provision for income taxes | (3,059 | ) | 369 | (3,428 | ) | * | |||||||||
Provision for income taxes | 656 | 622 | 34 | 5.5 | % | ||||||||||
Net loss | $ | (3,715 | ) | $ | (253 | ) | $ | (3,462 | ) | 1,368.4 | % | ||||
*Not meaningful.
(1) | Our fiscal year consists of 52- or 53-weeks ending on the last Monday of December. All fiscal years presented are 52 weeks, with the exception of Fiscal 2012 which consisted of 53 weeks. |
46
Restaurant sales. The following table summarizes the growth in restaurant sales from 2012 to 2013:
(in thousands) | Net Sales | ||
Restaurant sales for 2012 | $ | 78,966 | |
Incremental restaurant sales increase due to: | |||
Comparable restaurant sales | 4,760 | ||
Restaurants not in comparable restaurant base | 32,022 | ||
Restaurant sales for 2013 | $ | 115,748 | |
Restaurant sales increased by $36.8 million, or 46.6%, in 2013 compared to 2012. Restaurants not in the comparable restaurant base accounted for $32.0 million of this increase. The balance of the growth was due to an increase in comparable restaurant sales of $4.8 million, or 6.9%, in 2013, comprised primarily of increased customer traffic at our comparable restaurants.
Franchise and royalty fees. Franchise and royalty fees decreased by $0.1 million, or 16.0%, in 2013 compared to 2012. The decrease was primarily attributable to the acquisition of the South Carolina franchise restaurants in August 2012, which resulted in lower royalty fees in 2013. In additions, two new franchise restaurants opened in 2012 compared to no new franchise restaurant openings in 2013.
Cost of sales. Cost of sales increased $12.2 million in 2013 compared to 2012, due primarily to the increase in restaurant sales. As a percentage of restaurant sales, cost of sales increased from 32.7% in 2012 to 32.9% in 2013. This increase was primarily driven by food cost inflation with higher costs of beef, poultry and produce, partially offset by a minimal price increase.
Labor. Labor increased by $11.2 million in 2013 compared to 2012, due primarily to 27 new Company-owned restaurants opening in 2013. As a percentage of restaurant sales, labor increased from 27.3% in 2012 to 28.3% in 2013. The increase in labor percentage was driven by an increase in average pay rates and staffing and training levels in new Company-owned restaurant openings in 2013.
Store operating expenses. Store operating expenses increased by $7.2 million in 2013 compared to 2012, due primarily to 27 new Company-owned restaurants opening in 2013. As a percentage of restaurant sales, store operating expense increased from 18.5% in 2012 to 18.8% in 2013. The increase in store operating expenses was primarily attributable to a programmatic increase in maintenance costs.
General and administrative expenses. General and administrative expenses increased by $4.2 million in 2013 compared to 2012, due to costs associated with supporting an increased number of restaurants, the relocation of our corporate office, and expenses related to preparing for a public offering. As a percentage of revenue, general and administrative expenses remained flat at 11.3% in 2012 and 2013. General and administrative expenses includes $0.1 million and $0.1 million of equity-based compensation expense in 2013 and 2012, respectively, and $0.3 million and $0.3 million of management and consulting fees in 2013 and 2012, respectively.
Depreciation. Depreciation increased by $2.1 million in 2013 compared to 2012, due primarily to 27 new Company-owned restaurants opening in 2013. As a percentage of revenue, depreciation increased from 4.7% in 2012 to 5.0% in 2013, due to slightly higher build-out costs.
Amortization. Amortization increased by $0.5 million in 2013 compared to 2012, due primarily to the increased amortization of the reacquired rights intangible asset created by the August 2012 acquisition of the South Carolina franchise restaurants. In addition, we have recognized $0.2 million of accelerated amortization of franchise agreement intangible assets related to executing a letter of intent to purchase two franchise restaurants in Destin, Florida and Mobile, Alabama.
Pre-opening costs. Pre-opening costs increased by $1.0 million in 2013 compared to 2012, due primarily to 27 new Company-owned restaurants opening in 2013 compared to 16 new Company-owned restaurants and the acquisition of three franchise restaurants in 2012.
Loss from disposal of equipment. Loss from disposal of equipment decreased by $0.1 million in 2013 compared to 2012.
Interest expense. Interest expense increased by $1.7 million in 2013 compared to 2012, due primarily to $0.9 million in incremental interest expense under our 2011 Credit Facility to fund our capital expenditures. An increase in deemed landlord financing created an additional $0.8 million in interest expense.
47
Provision for income taxes. Provision for income taxes increased from $0.6 million in 2012 to $0.7 million in 2013. Tax expense remains relatively constant as it primarily reflects the accrual of income tax expense related to a valuation allowance in connection with the tax amortization of the Company's goodwill that was not available to offset existing deferred tax assets. Due to the uncertain timing of the reversal of this temporary difference, it cannot be considered as a source of future taxable income for purposes of determining a valuation allowance; therefore the deferred tax liability cannot offset deferred tax assets.
Adjusted EBITDA
EBITDA is defined as net loss before interest, income taxes and depreciation and amortization.
Adjusted EBITDA is defined as EBITDA plus equity-based compensation expense, bargain purchase gain from acquisitions, management and consulting fees, asset disposals, closure costs, loss on interest cap and restaurant impairment, loss on extinguishment of debt, non- capitalized offering related expenses, executive relocation expenses and pre-opening costs. Adjusted EBITDA is intended as a supplemental measure of our performance that is not required by, or presented in accordance with GAAP. We believe that EBITDA and Adjusted EBITDA provide useful information to management and investors regarding certain financial and business trends relating to our financial condition and operating results. Our management uses EBITDA and Adjusted EBITDA (i) as a factor in evaluating management's performance when determining incentive compensation and (ii) to evaluate the effectiveness of our business strategies.
We believe that the use of EBITDA and Adjusted EBITDA provides an additional tool for investors to use in evaluating ongoing operating results and trends and in comparing the Company's financial measures with other fast-casual restaurants, which may present similar non-GAAP financial measures to investors. In addition, you should be aware when evaluating EBITDA and Adjusted EBITDA that in the future we may incur expenses similar to those excluded when calculating these measures. Our presentation of these measures should not be construed as an inference that our future results will be unaffected by unusual or non-recurring items. Our computation of Adjusted EBITDA may not be comparable to other similarly titled measures computed by other companies, because all companies do not calculate Adjusted EBITDA in the same fashion.
Our management does not consider EBITDA or Adjusted EBITDA in isolation or as an alternative to financial measures determined in accordance with GAAP. The principal limitation of EBITDA and Adjusted EBITDA is that they exclude significant expenses and income that are required by GAAP to be recorded in the Company's financial statements. Some of these limitations are:
• | Adjusted EBITDA does not reflect our cash expenditures, or future requirements, for capital expenditures or contractual commitments; |
• | Adjusted EBITDA does not reflect changes in, or cash requirements for, our working capital needs; |
• | Adjusted EBITDA does not reflect the interest expense, or the cash requirements necessary to service interest or principal payments, on our debts; |
• | although depreciation and amortization are non-cash charges, the assets being depreciated and amortized will often have to be replaced in the future, and Adjusted EBITDA does not reflect any cash requirements for such replacements; |
• | equity-based compensation expense is and will remain a key element of our overall long-term incentive compensation package, although we exclude it as an expense when evaluating our ongoing operating performance for a particular period; |
• | Adjusted EBITDA does not reflect the impact of certain cash charges resulting from matters we consider not to be indicative of our ongoing operations; and |
• | other companies in our industry may calculate Adjusted EBITDA differently than we do, limiting its usefulness as a comparative measure. |
Because of these limitations, EBITDA and Adjusted EBITDA should not be considered in isolation or as a substitute for performance measures calculated in accordance with GAAP. We compensate for these limitations by relying primarily on our GAAP results and using EBITDA and Adjusted EBITDA only supplementally. You should review the reconciliation of net loss to EBITDA and Adjusted EBITDA below and not rely on any single financial measure to evaluate our business.
48
The following table reconciles net loss to EBITDA and Adjusted EBITDA for 2014, 2013 and 2012:
Fiscal Year Ended | ||||||||||||
December 29, 2014 | December 30, 2013 | December 31, 2012 | ||||||||||
(Dollars in thousands) | ||||||||||||
Adjusted EBITDA: | ||||||||||||
Net loss, as reported | $ | (10,017 | ) | $ | (3,715 | ) | $ | (253 | ) | |||
Depreciation and amortization | 10,473 | 7,463 | 4,870 | |||||||||
Interest expense, net | 3,535 | 4,019 | 2,337 | |||||||||
Provision for income taxes | 699 | 656 | 622 | |||||||||
EBITDA | 4,690 | 8,423 | 7,576 | |||||||||
Asset disposals, closure costs, loss on interest cap and restaurant impairment (a) | 150 | 200 | 240 | |||||||||
Management and consulting fees (b) | 113 | 264 | 295 | |||||||||
Equity-based compensation expense | 6,332 | 74 | 125 | |||||||||
Loss on extinguishment of debt | 978 | — | — | |||||||||
Pre-opening costs (c) | 2,109 | 1,938 | 917 | |||||||||
Offering related expenses (d) | 1,463 | — | — | |||||||||
Executive relocation expenses (e) | 170 | — | — | |||||||||
Adjusted EBITDA | $ | 16,005 | $ | 10,899 | $ | 9,153 | ||||||
(a) Represents costs related to impairment of long-lived assets, gain or loss on disposal of property and equipment, loss on interest cap and restaurant closure expenses.
(b) Represents fees payable to Brentwood pursuant to the Corporate Development and Administrative Services Agreement and fees paid to Greg Dollarhyde pursuant to the Consulting Agreement. The Corporate Development and Administrative Services Agreement and the Consulting Agreement were terminated prior to the completion of our IPO.
(c) Represents expenses directly associated with the opening of new restaurants that are incurred prior to opening, including pre-opening rent.
(d) Represents fees and expenses that were incurred, but not capitalized, in relation to our IPO completed on April 16, 2014, a follow-on offering completed on August 19, 2014 and a follow-on offering completed on November 19, 2014.
(e) Represents costs associated with the relocation packages of one of our executives.
Liquidity and Capital Resources
Potential Impacts of Market Conditions on Capital Resources
We have continued to experience positive trends in consumer traffic and increases in comparable restaurant sales, operating cash flows and restaurant contribution margin. However, the restaurant industry continues to be challenged, and uncertainty exists as to the sustainability of these favorable trends. We have continued to implement various cost savings initiatives, including savings in our food costs through waste reduction and efficiency initiatives in our supply chain and labor costs. We have developed new menu items to appeal to consumers and used marketing campaigns to promote these items.
We believe that cash and cash equivalents and expected cash flow from operations are adequate to fund our operating lease obligations, capital expenditures and working capital obligations for the next 13 periods. However, our ability to continue to meet these requirements and obligations will depend on, among other things, our ability to achieve anticipated levels of revenue and cash flow from operations and our ability to manage costs and working capital successfully. See "Item 1A - Risk Factors—Risks Related to Our Business and Industry."
Summary of Cash Flows
Our primary sources of liquidity and cash flows are operating cash flows and cash on hand. We use this to fund capital expenditures for new Company-owned restaurant openings, reinvest in our existing restaurants, invest in infrastructure and information technology and maintain working capital. Our working capital position benefits from the fact that we generally collect cash from sales to customers the same day, or in the case of credit or debit card transactions, within several days of the related sale, and we typically have at least 20 days to pay our vendors.
The material changes in working capital from 2013 to 2014 were comprised of a $29.1 million increase in current assets and a $1.2 million increase in current liabilities. The increase in current assets was primarily due to $91.0 million in net proceeds from the sales of common stock in our IPO offset by a $56.1 million increase in net payments on the 2011 credit Facility which was repaid in full following the IPO, as well as cash used to acquire five franchises. The increase in current liabilities was due
49
primarily to an increase in accrued expenses and other of $3.7 million, which was primarily driven by the addition of 30 new Company-owned restaurants as well as higher accrued purchases for stores to be opened in early 2015 offset by a $1.9 million decrease in current maturities of long-term debt after the repayment of the 2011 Credit Facility.
Fiscal Year Ended(1) | ||||||||||||
December 29, 2014 | December 30, 2013 | December 31, 2012 | ||||||||||
(Dollars in thousands) | ||||||||||||
Consolidated Statement of Cash Flows Data: | ||||||||||||
Net cash provided by operating activities | $ | 17,753 | $ | 10,924 | $ | 7,796 | ||||||
Net cash used in investing activities | (40,080 | ) | (28,242 | ) | (21,283 | ) | ||||||
Net cash provided by financing activities | 50,568 | 16,017 | 15,130 | |||||||||
(1) | Our fiscal year consists of 52- or 53-weeks ending on the last Monday of December. All fiscal years presented are 52 weeks, with the exception of Fiscal 2012 which consisted of 53 weeks. |
Cash Flows Provided by Operating Activities
Net cash provided by operating activities increased from $10.9 million in 2013 to $17.8 million in 2014. Cash flow provided by changes in operating assets and liabilities increased by $3.1 million, primarily due to an increase of $2.0 million in deferred rent and due to new Company-owned restaurant openings and increased tenant improvement collections in 2014. In addition, we had increased restaurant contribution offset by increased general and administrative expenses.
Net cash provided by operating activities increased from $7.8 million in 2012 to $10.9 million in 2013. Cash flow provided by changes in operating assets and liabilities increased by $3.8 million, primarily due to an increase of $1.0 million in accrued expenses and other relating to an increase in the number of restaurants under construction. Additionally, deferred rent increased $2.1 million due to new Company-owned restaurant openings and increased tenant improvement collections in 2013. These increases were offset by a decrease in restaurant contribution and increased general and administrative expenses.
Cash Flows Used in Investing Activities
Net cash used in investing activities increased from $28.2 million in 2013 to $40.1 million in 2014. The increase was primarily due to construction costs for 30 new Company-owned restaurants opened in 2014 compared to 27 new Company-owned restaurants opened in 2013, as well as capital expenditures for future restaurant openings, maintaining our existing restaurants and certain other projects. In addition, we acquired five franchise restaurants in 2014.
Net cash used in investing activities increased from $21.3 million in 2012 to $28.2 million in 2013. The increase was primarily due to construction costs for 27 new Company-owned restaurants opened in 2013 compared to 16 new Company-owned restaurants and the acquisition of three franchise restaurants in 2012, as well as capital expenditures for future restaurant openings, maintaining our existing restaurants and certain other projects. This increase was offset by the acquisition of the South Carolina franchise restaurants in 2012.
Cash Flows Provided by Financing Activities
Cash flows provided by financing activities increased from $16.0 million in 2013 to $50.6 million in 2014, primarily due to $91.0 million in net proceeds from the sale of common stock in our IPO offset by a $56.1 million increase in the change in net payments on the 2011 Credit Facility which was repaid in full following the IPO.
Cash flows provided by financing activities increased from $15.1 million in 2012 to $16.0 million in 2013, primarily due to a $0.6 million increase in the change in proceeds from deemed landlord financing due to increased tenant improvement collections related to restaurants that we have been deemed the accounting owner of and an increase of $0.3 million in loan origination costs.
Credit Facility
On April 16, 2014, we repaid all outstanding borrowings under the 2011 Credit Facility with a portion of the proceeds from our IPO and subsequently terminated the 2011 Credit Facility. The 2011 Credit Facility was entered into on September 23, 2011, as subsequently amended through the date of termination, by and among Zoe’s Kitchen USA, LLC, the other credit parties thereto, General Electric Capital Corporation, as Agent, and the other financial institutions party thereto, as lenders. Under the 2011 Credit Facility, we had total outstanding borrowings under the term loan of $38.5 million and $2.9 million under the revolving line of credit as of December 31, 2013. In conjunction with amendments to the 2011 Credit Facility, we incurred and capitalized $0.3 million of loan costs during the fifty-two weeks ended December 31, 2013.
50
On February 6, 2015, we entered into a credit facility with Wells Fargo Bank, National Association (the "2015 Credit Facility"). The 2015 Credit Facility consists of a revolving loan commitment in the aggregate amount of $20.0 million, together with an incremental revolving credit commitment up to an aggregate amount of $30.0 million. The 2015 Credit Facility has a five year term and matures on February 6, 2020. Revolving credit loans thereunder bear interest, at the Company’s election, at either the base rate plus an applicable margin, or LIBOR plus an applicable margin.
The 2015 Credit Facility includes specific financial covenants such as a leverage ratio and an interest coverage ratio. We are also subject to other customary covenants, including limitations on additional borrowings, dividend payments and acquisitions.
Each domestic subsidiary of the Company unconditionally guarantees all existing and future indebtedness and liabilities arising under the 2015 Credit Facility. The 2015 Credit Facility is unsecured and includes customary representations, warranties and covenants. As of the date hereof, the Company has no indebtedness under this 2015 Credit Facility and has no intention of incurring any indebtedness thereunder in 2015.
Contractual Obligations
The following table presents our commitments and contractual obligations as of December 29, 2014, as well as our long-term obligations:
Payments Due by Period | ||||||||||||||||||||
Total | Less than 1 year | Between 1-3 years | Between 3-5 years | More than 5 years | ||||||||||||||||
(Dollars in thousands) | ||||||||||||||||||||
Operating lease obligations(1) | $ | 190,721 | $ | 10,107 | $ | 20,831 | $ | 21,365 | $ | 138,418 | ||||||||||
Deemed landlord financing(2) | 59,359 | 2,929 | 6,004 | 6,337 | 44,089 | |||||||||||||||
Total | $ | 250,080 | $ | 13,036 | $ | 26,835 | $ | 27,702 | $ | 182,507 | ||||||||||
(1) | Includes base lease terms and certain optional renewal periods that are included in the lease term in accordance with accounting guidance related to leases. |
(2) | Includes base lease terms and certain optional renewal periods for restaurant locations where we have been deemed to be the accounting owner of the landlord's shell that are included in the lease term in accordance with accounting guidance related to leases. |
Off-Balance Sheet Arrangements
At December 29, 2014, we did not have any off-balance sheet arrangements, except for restaurant leases.
51
Critical Accounting Policies and Estimates
Our discussion and analysis of operating results and financial condition are based upon our financial statements. The preparation of our financial statements in accordance with GAAP requires us to make estimates and assumptions that affect the reported amounts of assets, liabilities, revenues, expenses and related disclosures of contingent assets and liabilities. We base our estimates on past experience and other assumptions that we believe are reasonable under the circumstances, and we evaluate these estimates on an ongoing basis. Our critical accounting policies are those that materially affect our financial statements and involve difficult, subjective or complex judgments by management. Although these estimates are based on management's best knowledge of current events and actions that may impact us in the future, actual results may be materially different from the estimates. We believe the following critical accounting policies are affected by significant judgments and estimates used in the preparation of our consolidated financial statements and that the judgments and estimates are reasonable.
Leases
We lease space for various restaurant locations under long-term non-cancelable operating leases from unrelated third parties. Most of our leases are classified as operating leases under ASC 840—Leases. Rent expense, including rent-free periods if applicable, is recognized on a straight-line basis over the lease term.
The lease term for all types of leases begins on the date we become legally obligated for the rent payments or we take possession of the building or land, whichever is earlier. The lease term includes cancelable option periods where failure to exercise such options would result in an economic penalty.
In some cases, the asset we will lease requires construction to ready the space for its intended use, and in certain cases, we have involvement with the construction of leased assets. The construction period begins when we execute our lease agreement with the property owner and continues until the space is substantially complete and ready for its intended use. In accordance with ASC 840-40-55, we must consider the nature and extent of our involvement during the construction period, and in some cases, our involvement results in us being considered the accounting owner of the construction project; in such cases, we capitalize the landlord's construction costs, including the value of costs incurred up to the date we execute our lease (e.g., our portion of any costs of the building "shell") and costs incurred during the remainder of construction period, as such costs are incurred. Additionally, ASC 840-40-55 requires us to recognize a financing obligation for construction costs incurred by the landlord. One example of involvement that results in Zoës Kitchen being considered the accounting owner is a case where Zoës Kitchen leases a "cold shell."
Once construction is complete, we are required to perform a sale-leaseback analysis pursuant to ASC 840-40 to determine if we can remove the landlord's assets and associated financing obligations from the consolidated balance sheet. In certain leases, we maintain various forms of "continuing involvement" in the property, thereby precluding us from derecognizing the asset and associated financing obligations following the construction completion. In those cases, we will continue to account for the asset as if we are the legal owner, and the financing obligation similar to other debt, until the lease expires or is modified to remove the continuing involvement that prohibits derecognition. Once de-recognition is permitted we would be required to account for the lease as either operating or capital in accordance with ASC 840.
We determined that we were the accounting owner of a total of 35 and 31 leased buildings as a result of the application of build-to-suit lease application as of December 29, 2014 and December 30, 2013, respectively. There were six of these buildings under construction as of both December 29, 2014 and December 30, 2013. In order to prevent Zoës Kitchen from being deemed the accounting owner for future leases or ensuring that those that do so will qualify for de-recognition once construction is complete, we are taking measures to ensure that our lease language does not include any forms of continuing involvement.
In conjunction with these leases, we also record deemed landlord financing equal to the total construction costs incurred by the landlord prior to turning the property over to us. These building lease obligations will be settled through a combination of periodic cash rental payments and the return of the leased property at the expiration of the lease. Application of this accounting model means that, at the end of the expected occupancy period, which may include lease renewal periods, any remaining obligation in excess of the depreciated carrying value of the fixed asset will be recognized as a non-cash gain on derecognition of the property and extinguishment of the obligation. We do not report rent expense for the properties which are deemed owned for accounting purposes. Rather, rental payments required under the lease are considered debt service and applied to the deemed landlord financing and interest expense.
Deferred Rent
Certain leases contain annual escalation clauses based on fixed escalation terms. The excess of cumulative rent expense (recognized on a straight-line basis) over cumulative rent payments made on leases with fixed escalation terms is recognized as deferred rent liability in the accompanying balance sheets. Also included in deferred rent are lease incentives provided by landlords upon entering into leases, often related to landlord payments for tenant improvements that we commonly negotiate
52
when opening new restaurants to help fund the build-out costs. These costs typically include general construction to alter the layout of the restaurant, leasehold improvements, and other miscellaneous items. We capitalize our leasehold improvements and record a deferred liability for the amount of cash received from the landlord, which is amortized on a straight-line basis over the lease term as defined above. The amortization of the deferred liability related to these tenant improvements is recorded as a reduction of rent expense.
If the improvements made to the property are considered landlord assets we do not record either an asset or liability unless the overall arrangement is within the scope of ASC 840-40-55 as discussed under Leases. For leases where we are considered to be the owner of the construction project and receive tenant improvement allowances, we record these amounts received as a borrowing under the deemed landlord financing liability.
Lease term is determined at lease inception and includes the initial term of the lease plus any renewal periods that are reasonably assured to occur. The lease term begins when we have the right to control the use of the property.
Additionally, certain of our operating leases contain clauses that provide additional contingent rent based on a percentage of sales greater than certain specified target amounts. We recognize contingent rent expense provided the achievement of that target is considered probable.
Revenue Recognition
We recognize revenue when food and beverage products are sold. Revenue is reported net of sales and use taxes collected from customers and remitted to government taxing authorities. We sell gift cards which do not have an expiration date and do not deduct non-usage fees from outstanding gift card balances. Gift card revenue is recognized when the gift card is redeemed by the customer or when it is determined that the likelihood of the gift card being redeemed is remote and there is no legal obligation to remit the unredeemed gift cards to the relevant jurisdiction. We recognize gift card breakage as revenue by applying our estimate of the rate of gift card breakage over the period of estimated performance. These estimates are based on customers' historical redemption rates and patterns.
Franchise Fee and Royalty Accounting
We recognize initial franchise fee revenues when substantial performance of all franchisor obligations has been achieved. Substantial performance is achieved when we have no remaining obligation or intent to refund any cash or to forgive any unpaid notes or receivables from franchisees; have performed substantially all of the initial services required by the license agreement; and have met all other material conditions or obligations. The commencement of operations by the franchisee indicates substantial performance has occurred. If substantial performance of our obligations has not been completed, recognition as revenue of such amounts received is deferred until all material services or conditions have been satisfied by us. In addition, monthly royalties are recognized as revenue when earned.
Valuation of Goodwill, Long-Lived and Other Intangible Assets
Goodwill represents the excess of the purchase price of the acquired businesses over the fair value of the assets acquired and liabilities assumed resulting from the acquisition. In accordance with the provisions of ASC 350—Intangibles—Goodwill and Other, goodwill and indefinite lived intangible assets acquired in a purchase business combination are not amortized, but instead tested for impairment at least annually or more frequently should an event occur or circumstances indicate that the carrying amount may be impaired. Such events or circumstances may be a significant change in business climate, economic and industry trends, legal factors, negative operating performance indicators, significant competition, changes in strategy or disposition of a reporting unit or a portion thereof. For purposes of applying ASC 350, we have identified a single reporting unit, as that term is defined in ASC 350, to which goodwill is attributable. We prepared our annual impairment testing of goodwill on the last day of the fiscal year and determined that the fair value of our reporting unit containing goodwill substantially exceeded its carrying value as of December 29, 2014, the most recent impairment test.
Goodwill impairment testing is a two-step test. The first step identifies potential impairment by comparing the fair value of a reporting unit with its carrying amount, including goodwill. If the fair value exceeds its carrying amount, goodwill is not considered impaired and the second step of the test is unnecessary. If the carrying amount of a reporting unit's goodwill exceeds its fair value, the second step measures the impairment loss, if any. The second step compares the implied fair value of goodwill with the carrying amount of that goodwill. The implied fair value of goodwill is determined in the same manner as the amount of goodwill recognized in a business combination. If the carrying amount of goodwill exceeds the implied fair value of that goodwill, an impairment loss is recognized in an amount equal to that excess.
The fair value of the reporting unit is estimated using a combination of market earnings multiples and discounted cash flow methodologies. This requires significant judgments including estimation of future cash flows, which is dependent on internal forecasts, estimation of the long-term rate of growth of our business, the useful life over which cash flows will occur and
53
determination of our weighted average cost of capital. Changes in these estimates and assumptions could materially affect the determination of fair value and/or goodwill impairment.
A trade name is considered to be an important element associated with the sales appeal of certain products and services. The trade name distinguishes goods and services from competitors, indicates the source of the goods and services, and serves as an indication of the quality of the product. Our trade name consists of various protected words, symbols, and designs that help identify our products and services such as the "Zoës Kitchen" trademark. This capitalized cost is being amortized on a straight-line basis over its estimated useful life of 20 years.
Changes in projections or estimates, a deterioration of operating results and the related cash flow effect or a significant increase in the discount rate or decrease in the royalty rate could decrease the estimated fair value of goodwill and other intangibles and result in impairments. We assess potential impairments of our long-lived assets in accordance with the provisions of ASC 360—Property, Plant and Equipment. An impairment review is performed whenever events or changes in circumstances indicate that the carrying value of the assets may not be recoverable. Factors considered by us include, but are not limited to: significant underperformance relative to expected historical or projected future operating results; significant changes in the manner of use of the acquired assets or the strategy for the overall business; significant negative industry or economic trends.
We recognized no impairment losses during the years ended December 29, 2014, December 30, 2013 and December 31, 2012.
Insurance Reserves
Beginning with our new insurance policy period, on September 27, 2014, we self-insure a portion of our expected losses under our worker's compensation insurance program. To limit our exposure to losses, we maintain stop-loss coverage through third-party insurers. Insurance liabilities representing estimated costs to settle reported claims and incurred but not recorded are included in accrued expenses and other.
Equity-Based Compensation Expense
In connection with the IPO, we adopted the 2014 Omnibus Incentive Plan (the “2014 Incentive Plan”), which provides for grants of stock options, stock appreciation rights, restricted stock, other stock-based awards and other cash-based awards available to directors, officers and other employees of us and our subsidiaries, as well as others performing consulting or advisory services to us. The number of shares of common stock available for issuance under the 2014 Incentive Plan may not exceed 1,905,799.
We measure equity-based awards granted to our employees at fair value on the grant date and recognize the corresponding compensation expense for those awards, net of estimated forfeitures, over the requisite service period, which is generally the vesting period of the respective award. The straight-line method is applied to all awards with service conditions, while the graded-vesting method is applied to all awards with both service and performance conditions.
We recognize compensation expense only for the portion of awards that are expected to vest. In developing a forfeiture rate estimate, we have considered our historical experience to estimate pre-vesting forfeitures for service based awards. The impact of a forfeiture rate adjustment will be recognized in full in the period of adjustment, and if the actual forfeiture rate is materially different from our estimate, we may be required to record adjustments to equity-based compensation expense in future periods. These assumptions represent our best estimates, but involve inherent uncertainties and the application of our judgment. As a result, if factors change and we use significantly different assumptions or estimates, our equity-based compensation expense could be materially impacted in that period.
Upon the exercise of stock options, we issue new shares and do not expect to repurchase such shares in the following annual period.
Prior to the IPO, certain of our employees had been granted Class B units in Zoe’s Investors, LLC ("Zoe's Investors"), which was our parent company, pursuant to Zoe's Investors' limited liability company agreement. As these awards had been granted to employees of the Company, which was a consolidated subsidiary of Zoe’s Investors, the related compensation expense was reflected in the Company’s consolidated financial statements prior to the IPO. Awards granted during 2012 and 2013 are identical to those granted in and prior to 2011 with the exception of a provision that the employee forfeits the 2012 and 2013 awards, vested or unvested, if they terminate their employment with the Company for any reason.
Income Tax
We recognize deferred tax assets and liabilities for the expected future tax consequences or events that have been included in the financial statements or tax returns. We are also required to record a valuation allowance against any deferred tax assets, if it is more likely than not that all or some of the deferred tax assets will not be realized. The determination is based upon our analysis of existing deferred tax assets, expectations of our ability to utilize these tax attributes through a review of historical and projected
54
taxable income and establishment of tax strategies. If we are not able to implement the necessary tax strategies and our future taxable income is reduced, the amount of tax assets considered realizable could be reduced in the near term.
We only record tax benefits for positions that we believe are more likely than not of being sustained under audit examination based solely on the technical merits of the associated tax position. The amount of tax benefit recognized in the financial statements for any position are measured based on the largest amount of the tax benefit that we believe is greater than fifty percent likelihood of being realized upon ultimate settlement.
Tax liabilities are adjusted as new, previously unknown information becomes available. Due to the inherent uncertainty involved in estimation of tax liability, actual payment could be materially different from the estimated liability. These differences will impact the amount of income tax expense recorded in the period in which they are determined. Although we consider tax liabilities recorded for the years ended December 29, 2014, December 30, 2013 and December 31, 2012 to be appropriate, the ultimate resolution of such matters could have a potentially material favorable or unfavorable impact on our consolidated financial statements.
JOBS Act
On April 5, 2012, the JOBS Act was enacted. Section 107 of the JOBS Act provides that an emerging growth company can take advantage of the extended transition period provided in Section 7(a)(2)(B) of the Securities Act for complying with new or revised accounting standards. In other words, an emerging growth company can delay the adoption of certain accounting standards until those standards would otherwise apply to private companies. We have irrevocably elected not to avail ourselves of this extended transition period with respect to such accounting standards. As a result, we have and will continue to adopt new or revised accounting standards on the relevant dates on which adoption of such standards is required for other public companies.
We have relied upon certain reduced reporting requirements provided by the JOBS Act. Subject to certain conditions set forth in the JOBS Act, as an emerging growth company, we are not be required to, among other things, (i) provide an auditor's attestation report on our systems of internal controls over financial reporting pursuant to Section 404, (ii) provide all of the compensation disclosure that may be required of non-emerging growth public companies under the Dodd-Frank Wall Street Reform and Consumer Protection Act, (iii) comply with any requirement that may be adopted by the Public Company Accounting Oversight Board regarding mandatory audit firm rotation or a supplement to the auditor's report providing additional information about the audit and the financial statements (auditor discussion and analysis), and (iv) disclose certain executive compensation-related items such as the correlation between executive compensation and performance and comparisons of the Chief Executive Officer's compensation to median employee compensation. These exemptions will apply until we no longer meet the requirements of being an emerging growth company. We will remain an emerging growth company until the earlier of (1) the last day of the fiscal year (a) following the fifth anniversary of the completion of our IPO, or (b) in which we have total annual gross revenue of at least $1.0 billion, (2) being deemed to be a large accelerated filer, which means the market value of our common stock that is held by non-affiliates exceeds $700 million as of the last business day of our prior second fiscal quarter, and (3) the date on which we have issued more than $1.0 billion in non-convertible debt during the prior three-year period.
55
Item 7A. Quantitative and Qualitative Disclosures about Market Risk
Commodity Price Risks
We are also exposed to commodity price risks. Many of the ingredients we use to prepare our food, as well as our packaging materials, are commodities or ingredients that are affected by the price of other commodities, exchange rates, foreign demand, weather, seasonality, production, availability and other factors outside our control. We work closely with our suppliers and use a mix of forward pricing protocols under which we agree with our supplier on fixed prices for deliveries at some time in the future, fixed pricing protocols under which we agree on a fixed price with our supplier for the duration of that protocol, and formula pricing protocols under which the prices we pay are based on a specified formula related to the prices of the goods, such as spot prices. However, a majority of the dollar value of goods purchased by us is effectively at spot prices. Generally our pricing protocols with suppliers can remain in effect for periods ranging from one to 18 months, depending on the outlook for prices of the particular ingredient. We have tried to increase, where necessary, the number of suppliers for our ingredients, which we believe can help mitigate pricing volatility, and we follow industry news, trade issues, exchange rates, weather, crises and other world events that may affect our ingredient prices. Increases in ingredient prices could adversely affect our results if we choose for competitive or other reasons not to increase menu prices at the same rate at which ingredient costs increase, or if menu price increases result in customer resistance.
Interest Rate Risk
We are exposed to interest rate risk through fluctuations of interest rates on our investments and debt, as applicable. Changes in interest rates affect the interest income we earn, and therefore impact our cash flows and results of operations. As of December 29, 2014, we had $30.1 million in investments and interest-bearing cash accounts that earned a weighted average interest rate of 0.44%.
Inflation
The primary inflationary factors affecting our operations are food, labor costs, energy costs and materials used in the construction of new restaurants. Increases in the minimum wage directly affect our labor costs. Many of our leases require us to pay taxes, maintenance, repairs, insurance and utilities, all of which are generally subject to inflationary increases. Finally, the cost of constructing our restaurants is subject to inflationary increases in the costs of labor and material. Over the past five years, inflation has not significantly affected our operating results.
56
Item 8. Financial Statements and Supplementary Data
Information with respect to this Item is set forth beginning on page F-1. See "Item 15 - Exhibits and Financial Schedule" below.
Item 9. Changes in and Disagreements with Accountants on Accounting and Financial Disclosure
None.
Item 9A. Controls and Procedures
Disclosure Controls and Procedures
Our management carried out an evaluation, under the supervision and with the participation of our principal executive officer and principal financial officer, of the effectiveness of the design and operation of our disclosure controls and procedures (as defined in Rule 13a-15(e) of the Exchange Act, as amended) as of the end of the period covered by this Annual Report on Form 10-K. Based on this evaluation, our principal executive officer and principal financial officer concluded that our disclosure controls and procedures were effective as of December 29, 2014, the end of the period covered by this Annual Report on Form 10-K.
The design of any system of control is based upon certain assumptions about the likelihood of future events, and there can be no assurance that any design will succeed in achieving its stated objectives under all future events, no matter how remote, or that the degree of compliance with the policies or procedures may not deteriorate. Because of its inherent limitations, disclosure controls and procedures may not prevent or detect all misstatements. Accordingly, even effective disclosure controls and procedures can provide only reasonable assurance of achieving their control objectives. In addition, the design of disclosure controls and procedures must reflect the fact that there are resource constraints and that management is required to apply its judgment in evaluating the benefits of possible controls and procedures relative to their costs
Management's Report on Internal Control Over Financial Reporting
This Annual Report on Form 10-K does not include a report of management’s assessment regarding internal control over financial reporting (as defined in Rule 13a-l5(f) of the Exchange Act) or an attestation report of our independent registered public accounting firm due to a transition period established by the rules of the SEC for newly public companies.
Remediation of Previously Reported Material Weakness
For the fiscal quarter ended October 6, 2014, it was concluded that a material weakness existed in our internal control over financial reporting. This weakness related to the lack of adequately documented accounting policies and procedures. We have subsequently completed all necessary documentation as well as related training. Based on the measures taken and implemented, management has tested the newly implemented control activities and found them to be effective and has concluded that this material weakness has been remediated as of December 29, 2014.
Changes in Internal Control over Financial Reporting
As described in subsection “Remediation of Previously Reported Material Weakness” above, there were changes in our internal control over financial reporting during the fiscal quarter ended December 29, 2014 that have materially affected, or are reasonably likely to materially affect, our internal control over financial reporting.
Item 9B. Other Information
None.
57
PART III
The information required by Items 10, 11, 12, 13 and 14 will be furnished (and are hereby incorporated by reference) by an amendment hereto or pursuant to a definitive proxy statement pursuant to Regulation 14A that will contain such information.
58
PART IV
Item 15. Exhibits, Financial Statement Schedules
(a) Financial Statements
Refer to Index to Financial Statements appearing on page F-1.
(b) Financial Statement Schedules
No financial statement schedules are provided because the information called for is not required or is shown in the financial statements or the notes thereto.
(c) Exhibits
The exhibits listed on the accompanying Exhibit Index are filed or incorporated by reference as part of this report.
59
SIGNATURES
Pursuant to the requirements of the Securities Exchange Act of 1934, this report has been signed below by the following persons on behalf of the registrant and in the capacities and on the dates indicated below.
ZOE'S KITCHEN, INC.
Name | Title | Date |
/s/ Kevin Miles | ||
Kevin Miles | Director, President and Chief Executive Officer | March 13, 2015 |
/s/ Jason Morgan | ||
Jason Morgan | Chief Financial Officer (Principal Financial Officer) | March 13, 2015 |
/s/ James Besch | ||
James Besch | Vice President of Accounting and Controller (Principal Accounting Officer) | March 13, 2015 |
/s/ Rahul Aggarwal | ||
Rahul Aggarwal | Director | March 13, 2015 |
/s/ William M. Barnum, Jr. | ||
William M. Barnum, Jr. | Director | March 13, 2015 |
/s/ Anthony U. Choe | ||
Anthony U. Choe | Director | March 13, 2015 |
/s/Thomas Baldwin | ||
Thomas Baldwin | Director | March 13, 2015 |
/s/ Sue Collyns | ||
Sue Collyns | Director | March 13, 2015 |
/s/ Greg Dollarhyde | ||
Greg Dollarhyde | Chairman of the Board, Director | March 13, 2015 |
60
Exhibit Index
Exhibit No. | Description | |
3.1 | Amended and Restated Certificate of Incorporation of Zoe's Kitchen, Inc. (incorporated by reference to our registration statement on Form S-8 (File No. 333-196507) filed with the Commission on June 4, 2014) | |
3.2 | Amended and Restated Bylaws of Zoe's Kitchen, Inc. (incorporated by reference to our registration statement on Form S-8 (File No. 333-196507) filed with the Commission on June 4, 2014) | |
10.1 | Zoe's Kitchen, Inc. 2014 Omnibus Incentive Plan (incorporated by reference to our registration statement on Form S-8 (File No. 333-196507) filed with the Commission on June 4, 2014) | |
10.2 | Form of Area Development Agreement (incorporated by reference to our registration statement on Form S-1 (File No. 333-194457) initially filed with the Commission on March 10, 2014, as amended) | |
10.3 | Form of Franchise Agreement (incorporated by reference to our registration statement on Form S-1 (File No. 333-194457) initially filed with the Commission on March 10, 2014, as amended) | |
10.4 | Registration Rights Agreement, dated as of April 9, 2014, as amended, by and among Zoe's Investors, LLC, Zoe's Kitchen, Inc., Zoe's Kitchen USA, LLC, Brentwood Associates Private Equity IV, L.P. and certain of its other stockholders (incorporated by reference to our registration statement on Form S-1 (File No. 333-194457) initially filed with the Commission on March 10, 2014) | |
10.5 | Form of Indemnification Agreement between Zoe's Kitchen, Inc. and each of its directors and executive officers (incorporated by reference to our registration statement on Form S-1 (File No. 333-194457) initially filed with the Commission on March 31, 2014) | |
10.6 | Credit Agreement dated February 6, 2015, by and among Zoe’s Kitchen, Inc., as borrower, the subsidiaries of Zoe’s Kitchen, Inc., as guarantors, and Wells Fargo Bank, National Association, as administrative agent, swingline lender, issuing lender, sole lead arranger and sole bookrunner (incorporated by reference to our Form 8-K (File No. 001-36411) filed with the Commission on February 10, 2015) | |
10.7 | Form of Zoe's Kitchen, Inc. Non-Employee Director Compensation Policy (incorporated by reference to our registration statement on Form S-1 (File No. 333-194457) initially filed with the Commission on March 10, 2014, as amended) | |
10.8 | Form of Restricted Stock Unit Agreement Pursuant to the Zoe's Kitchen, Inc. 2014 Omnibus Incentive Plan (incorporated by reference to our registration statement on Form S-1 (File No. 333-194457) initially filed with the Commission on March 10, 2014, as amended) | |
10.9 | Form of Nonqualified Stock Option Agreement Pursuant to the Zoe's Kitchen, Inc. 2014 Omnibus Incentive Plan (incorporated by reference to our registration statement on Form S-1 (File No. 333-194457) initially filed with the Commission on March 10, 2014, as amended) | |
10.10 | Form of Director Restricted Stock Unit Agreement Pursuant to the Zoe's Kitchen, Inc. 2014 Omnibus Incentive Plan (incorporated by reference to our registration statement on Form S-1 (File No. 333-194457), initially filed with the Commission on March 10, 2014, as amended) | |
10.11 | Form of Restricted Stock Agreement Pursuant to the Zoe's Kitchen, Inc. 2014 Omnibus Incentive Plan (File No. 333-194457), initially filed with the Commission on March 10, 2014, as amended) | |
10.12 | Form of Stock Appreciation Rights Agreement Pursuant to the Zoe's Kitchen, Inc. 2014 Omnibus Incentive Plan (File No. 333-194457), initially filed with the Commission on March 10, 2014, as amended) | |
21.1 | List of Subsidiaries of Zoe's Kitchen, Inc. (incorporated by reference to our registration statement on Form S-1 (File No. 333-199900), filed with the Commission on November 6, 2014) | |
23.1* | Consent of PricewaterhouseCoopers LLP | |
31.1* | Certification of Chief Executive Officer pursuant to Section 302 of the Sarbanes-Oxley Act of 2002 | |
31.2* | Certification of Chief Financial Officer pursuant to Section 302 of the Sarbanes-Oxley Act of 2002 | |
32.1* | Certification of Chief Executive Officer and Chief Financial Officer pursuant to 18 U.S.C. Section 1350, as adopted pursuant to Section 906 of the Sarbanes- Oxley Act of 2002 | |
61
Exhibit No. | Description | |
101.INS* | XBRL Instance Document | |
101.SCH* | XBRL Taxonomy Extension Schema Document | |
101.CAL* | XBRL Taxonomy Extension Calculation Linkbase Document | |
101.DEF* | XBRL Taxonomy Extension Definition Linkbase Document | |
101.LAB* | XBRL Taxonomy Extension Label Linkbase Document | |
101.PRE* | XBRL Taxonomy Extension Presentation Linkbase Document | |
* Filed herewith
62
Zoe's Kitchen, Inc. and Subsidiaries
Index To Consolidated Financial Statements
Page | ||
Consolidated Financial Statements | ||
F-1
Report of Independent Registered Public Accounting Firm
To the Board of Directors and Stockholders of Zoe’s Kitchen, Inc.
In our opinion, the accompanying consolidated balance sheets and the related consolidated statements of operations, of stockholders’ equity, and of cash flows present fairly, in all material respects, the financial position of Zoe’s Kitchen, Inc. and its subsidiaries at December 29, 2014 and December 30, 2013, and the results of their operations and their cash flows for each of the three years in the period ended December 29, 2014 in conformity with accounting principles generally accepted in the United States of America. These financial statements are the responsibility of the Company’s management. Our responsibility is to express an opinion on these financial statements based on our audits. We conducted our audits of these statements in accordance with the standards of the Public Company Accounting Oversight Board (United States). Those standards require that we plan and perform the audit to obtain reasonable assurance about whether the financial statements are free of material misstatement. An audit includes examining, on a test basis, evidence supporting the amounts and disclosures in the financial statements, assessing the accounting principles used and significant estimates made by management, and evaluating the overall financial statement presentation. We believe that our audits provide a reasonable basis for our opinion.
/s/ PricewaterhouseCoopers LLP
Dallas, Texas
March 13, 2015
F-2
Zoe's Kitchen, Inc and Subsidiaries
Consolidated Balance Sheets
December 29, 2014 and December 30, 2013
(in thousands, except share and per share data)
2014 | 2013 | |||||||
Assets | ||||||||
Current assets: | ||||||||
Cash and cash equivalents | $ | 29,390 | $ | 1,149 | ||||
Trade accounts receivable, net of allowance for doubtful accounts, of $12 at December 29, 2014 and $13 at December 30, 2013 | 678 | 583 | ||||||
Other accounts receivable | 1,164 | 1,187 | ||||||
Inventory | 1,295 | 914 | ||||||
Prepaid expenses and other | 1,168 | 745 | ||||||
Total current assets | 33,695 | 4,578 | ||||||
Property and equipment, net | 103,945 | 78,629 | ||||||
Goodwill | 29,528 | 23,334 | ||||||
Intangibles, net | 11,206 | 11,207 | ||||||
Loan costs, net | 16 | 1,035 | ||||||
Deposits | 271 | 247 | ||||||
Other long-term assets | — | 1,034 | ||||||
Total long-term assets | 144,966 | 115,486 | ||||||
Total assets | $ | 178,661 | $ | 120,064 | ||||
Liabilities and Stockholders' Equity | ||||||||
Current liabilities: | ||||||||
Current maturities of long-term debt | $ | — | $ | 1,925 | ||||
Accounts payable | 6,131 | 6,672 | ||||||
Accrued expenses and other | 10,175 | 6,462 | ||||||
Total current liabilities | 16,306 | 15,059 | ||||||
Long-term liabilities: | ||||||||
Long-term debt | — | 39,475 | ||||||
Deemed landlord financing | 23,266 | 19,893 | ||||||
Deferred rent | 13,701 | 8,156 | ||||||
Deferred income taxes | 3,784 | 3,524 | ||||||
Residual value obligations, net | 302 | 357 | ||||||
Other long-term liabilities | 33 | 21 | ||||||
Total long-term liabilities | 41,086 | 71,426 | ||||||
Total liabilities | 57,392 | 86,485 | ||||||
Commitments and Contingencies (Note 12) | ||||||||
Stockholders' equity: | ||||||||
Common stock, $0.01 par value, 135,000,000 shares authorized as of December 29, 2014 and December 30, 2013; 19,292,246 and 12,561,414 shares issued, outstanding as of December 29, 2014 and December 30, 2013, respectively | 193 | 126 | ||||||
Additional paid-in capital | 142,714 | 45,074 | ||||||
Accumulated deficit | (21,638 | ) | (11,621 | ) | ||||
Total stockholders' equity | 121,269 | 33,579 | ||||||
Total liabilities and stockholders' equity | $ | 178,661 | $ | 120,064 | ||||
The accompanying notes are an integral part of these consolidated financial statements.
F-3
Zoe's Kitchen, Inc and Subsidiaries
Consolidated Statements of Operations
Years Ended December 29, 2014, December 30, 2013 and December 31, 2012
(in thousands, except per share data)
2014 | 2013 | 2012 | ||||||||||
Revenue: | ||||||||||||
Restaurant sales | $ | 171,256 | $ | 115,748 | $ | 78,966 | ||||||
Franchise and royalty fees | 477 | 637 | 758 | |||||||||
Total revenue | 171,733 | 116,385 | 79,724 | |||||||||
Restaurant operating costs: | ||||||||||||
Cost of sales (excluding depreciation and amortization) | 56,843 | 38,063 | 25,845 | |||||||||
Labor | 48,300 | 32,810 | 21,567 | |||||||||
Store operating expenses | 31,919 | 21,780 | 14,610 | |||||||||
General and administrative expenses | 26,744 | 13,171 | 8,969 | |||||||||
Depreciation | 8,900 | 5,862 | 3,779 | |||||||||
Amortization | 1,573 | 1,601 | 1,091 | |||||||||
Pre-opening costs | 2,109 | 1,938 | 917 | |||||||||
Loss from disposal of equipment | 144 | 175 | 240 | |||||||||
Total operating expenses | 176,532 | 115,400 | 77,018 | |||||||||
Income (loss) from operations | (4,799 | ) | 985 | 2,706 | ||||||||
Other expenses: | ||||||||||||
Interest expense, net | 3,535 | 4,019 | 2,337 | |||||||||
Loss on extinguishment of debt | 978 | — | — | |||||||||
Loss on interest cap | 6 | 25 | — | |||||||||
Total other expenses | 4,519 | 4,044 | 2,337 | |||||||||
Income (loss) before provision for income taxes | (9,318 | ) | (3,059 | ) | 369 | |||||||
Provision for income taxes | 699 | 656 | 622 | |||||||||
Net loss | $ | (10,017 | ) | $ | (3,715 | ) | $ | (253 | ) | |||
Net loss per share, basic and diluted | $ | (0.58 | ) | $ | (0.30 | ) | $ | (0.02 | ) | |||
Weighted average shares outstanding, basic and diluted | 17,410 | 12,561 | 12,561 | |||||||||
The accompanying notes are an integral part of these consolidated financial statements.
F-4
Zoe's Kitchen, Inc and Subsidiaries
Consolidated Statement of Stockholders' Equity
Years Ended December 29, 2014, December 30, 2013 and December 31, 2012
(in thousands)
Common Stock | Additional Paid-in Capital | Accumulated Deficit | Total Stockholders' Equity | |||||||||||||
Balances at December 26, 2011 | 126 | 44,875 | (7,653 | ) | 37,348 | |||||||||||
Equity-based compensation | — | 125 | — | 125 | ||||||||||||
Net loss | — | — | (253 | ) | (253 | ) | ||||||||||
Balances at December 31, 2012 | 126 | 45,000 | (7,906 | ) | 37,220 | |||||||||||
Equity-based compensation | — | 74 | — | 74 | ||||||||||||
Net loss | — | — | (3,715 | ) | (3,715 | ) | ||||||||||
Balances at December 30, 2013 | 126 | 45,074 | (11,621 | ) | 33,579 | |||||||||||
Issuance of common stock in connection with the IPO, net of transaction expenses | 67 | 90,970 | — | 91,037 | ||||||||||||
Equity-based compensation | — | 6,332 | — | 6,332 | ||||||||||||
Proceeds from exercise of stock options | — | 338 | — | 338 | ||||||||||||
Net loss | — | — | (10,017 | ) | (10,017 | ) | ||||||||||
Balances at December 29, 2014 | $ | 193 | $ | 142,714 | $ | (21,638 | ) | $ | 121,269 | |||||||
The accompanying notes are an integral part of these consolidated financial statements.
F-5
Zoe's Kitchen, Inc and Subsidiaries
Consolidated Statements of Cash Flows
Years Ended December 29, 2014, December 30, 2013 and December 31, 2012
(in thousands)
2014 | 2013 | 2012 | ||||||||||
Cash flows from operating activities: | ||||||||||||
Net loss | $ | (10,017 | ) | $ | (3,715 | ) | $ | (253 | ) | |||
Adjustments to reconcile net loss to net cash provided by operating activities: | ||||||||||||
Depreciation | 8,900 | 5,862 | 3,779 | |||||||||
Amortization of intangible assets | 1,573 | 1,601 | 1,091 | |||||||||
Equity-based compensation | 6,332 | 74 | 125 | |||||||||
Deferred income taxes | 606 | 594 | 547 | |||||||||
Amortization of loan costs | 77 | 205 | 120 | |||||||||
Bad debt expense | 11 | 11 | 13 | |||||||||
Loss from disposal of equipment | 144 | 175 | 240 | |||||||||
Loss on extinguishment of debt | 978 | — | — | |||||||||
Accretion of deemed landlord financing | 219 | 262 | 114 | |||||||||
Changes in operating assets and liabilities: | ||||||||||||
Trade accounts receivable | (106 | ) | (199 | ) | 66 | |||||||
Other accounts receivable | 23 | (130 | ) | (678 | ) | |||||||
Inventory | (347 | ) | (257 | ) | (179 | ) | ||||||
Prepaid expenses and other | (555 | ) | (63 | ) | (121 | ) | ||||||
Accounts payable | 1,279 | 1,307 | 1,033 | |||||||||
Accrued expenses and other | 3,235 | 1,810 | 656 | |||||||||
Deferred rent | 5,401 | 3,387 | 1,243 | |||||||||
Net cash provided by operating activities | 17,753 | 10,924 | 7,796 | |||||||||
Cash flows from investing activities: | ||||||||||||
Purchase of property and equipment | (31,102 | ) | (28,267 | ) | (15,462 | ) | ||||||
Acquisition purchase price, net of cash acquired | (9,136 | ) | — | (5,834 | ) | |||||||
Proceeds from sale of property and equipment | 158 | 25 | 13 | |||||||||
Net cash used in investing activities | (40,080 | ) | (28,242 | ) | (21,283 | ) | ||||||
Cash flows from financing activities: | ||||||||||||
Proceeds from line of credit | 7,900 | 15,650 | 15,373 | |||||||||
Payments on long-term debt | (49,300 | ) | (938 | ) | (686 | ) | ||||||
Proceeds from issuance of common stock, net of underwriter fees | 96,314 | — | — | |||||||||
Payment of costs associated with initial public offering | (2,538 | ) | (6 | ) | — | |||||||
Purchase of common stock | (2,733 | ) | — | — | ||||||||
Proceeds from deemed landlord financing | 603 | 1,595 | 1,019 | |||||||||
Proceeds from exercise of common stock | 338 | — | — | |||||||||
Payment of loan acquisition fees | (16 | ) | (284 | ) | (576 | ) | ||||||
Net cash provided by financing activities | 50,568 | 16,017 | 15,130 | |||||||||
Net change in cash and cash equivalents | 28,241 | (1,301 | ) | 1,643 | ||||||||
Cash and cash equivalents: | ||||||||||||
Beginning of year | 1,149 | 2,450 | 807 | |||||||||
End of year | $ | 29,390 | $ | 1,149 | $ | 2,450 | ||||||
F-6
Supplemental disclosure of cash flow information | ||||||||||||
Cash paid for interest related to long-term debt | $ | 812 | $ | 2,039 | $ | 1,229 | ||||||
Cash paid for interest related to deemed landlord financing | 2,750 | 1,668 | 981 | |||||||||
Non-cash residual value lease obligations | 38 | 107 | 103 | |||||||||
Non-cash deemed landlord financing | 2,550 | 6,850 | 3,250 | |||||||||
Change in accrued purchases of property and equipment | (691 | ) | 1,323 | 1,243 | ||||||||
Non-cash costs associated with initial public offering | — | 1,018 | — | |||||||||
Non-cash landlord improvements | 224 | — | — | |||||||||
The accompanying notes are an integral part of these consolidated financial statements.
F-7
Zoe's Kitchen, Inc and Subsidiaries
Notes to Consolidated Financial Statements
December 29, 2014, December 30, 2013 and December 31, 2012
1. Nature of Operations and Summary of Significant Accounting Policies
Nature of Operations
Zoe’s Kitchen, Inc. (the "Company", "Zoës", "we" or "us"), primarily develops and operates fast-casual restaurants serving a distinct menu of freshly prepared Mediterranean-inspired dishes. As of December 29, 2014, we operated 129 Company-owned restaurants and three franchise restaurants in 15 states across the United States. We have determined that we have one operating and reportable segment. All of our revenues are derived in the United States. All of our assets are located in the United States.
On April 16, 2014, we completed an initial public offering (the "IPO") of 6,708,332 shares of common stock at a price to the public of $15.00 per share, which included 874,999 shares sold to the underwriters pursuant to their over-allotment option. All share and per share data have been retroactively restated in the accompanying financial statements to give effect to a 125,614.14:1 stock split, which became effective on April 14, 2014. After underwriter discounts and commissions and offering expenses, we received net proceeds from the offering of approximately $91.0 million. A portion of these proceeds were used to repay all of the outstanding borrowings under the 2011 Credit Facility (as defined herein, see Note 7).
On August 19, 2014, we completed a follow-on offering of 5,175,000 shares of common stock at a public offering price of $30.25 per share, which included 675,000 shares sold to the underwriters pursuant to their over-allotment option. All of the shares in the offering were offered by selling stockholders, except for 94,100 shares offered by us, the proceeds of which were used to repurchase the same number of shares from certain of our officers at the public offering price per share. We did not receive any net proceeds from the sale of shares of common stock by the selling stockholders. The repurchased shares were constructively retired as we do not intend to reissue the shares within a reasonable period of time.
On November 19, 2014, we completed a follow-on offering of 4,370,000 shares of common stock at a price of $32.00 per share, which included 570,000 shares sold to the underwriters pursuant to their over-allotment option. All of the shares in the offering were offered by the selling stockholders. We did not receive any proceeds from the offering.
Principles of Consolidation
The consolidated financial statements include the accounts of the Company and its wholly owned subsidiaries, Zoe's Kitchen USA, LLC and Soho Franchising, LLC. All intercompany accounts and transactions have been eliminated in consolidation. The consolidated financial statements presented herein reflect our financial position, results of operations, cash flows and changes in equity in conformity with accounting principles generally accepted in the United States or "GAAP."
Use of Estimates
The preparation of financial statements in conformity with GAAP requires management to make estimates and assumptions, such as valuation of long-lived, definite and indefinite-lived assets, estimated useful lives of assets, the reasonably assured lease terms of operating leases, the construction costs of leases where the Company is considered the owner during and after the construction period, allowance for doubtful accounts, the fair value of equity-based compensation, the calculation of self-insurance reserves and deferred tax valuation allowances, that affect the reported amounts of assets and liabilities and disclosure of contingent assets and liabilities at the date of the financial statements and the reported amounts of revenues and expenses during the reporting period. Actual results could differ from those estimates.
Fiscal Year
We operate on a 52- or 53-week fiscal year that ends on the last Monday of the calendar year. All fiscal years presented herein consist of 52 weeks, with the exception of the fiscal year ended December 31, 2012, which consists of 53 weeks.
Revision
In 2014, we identified certain errors in the December 30, 2013 consolidated balance sheet relating to our deferred tax balances. To correct for this, we have revised the December 30, 2013 consolidated balance sheet to increase our current deferred tax asset (included in prepaid expenses and other) and our non-current deferred tax liability by $0.1 million. Further, we have concluded that these errors are not material individually or in the aggregate to any prior reporting periods.
F-8
Net Loss per Share
Basic net loss per share is calculated by dividing net loss by the weighted average shares outstanding during the period, without consideration of common stock equivalents. Diluted net loss per share is calculated by adjusting weighted average shares outstanding for the dilutive effect of common stock equivalents outstanding for the period, determined using the treasury-stock method. See Note 14 for discussion of stock split.
Revenue Recognition — Restaurant Sales
We recognize restaurant sales when food and beverage products are sold. Restaurant sales are reported net of sales tax collected from customers.
Gift Cards
Revenues from the sale of gift cards are deferred and recognized when redeemed. Deferred gift card revenue is included in accrued liabilities in our consolidated balance sheets. Our gift cards do not have an expiration date and we do not deduct non-usage fees from outstanding gift card balances. We recognize gift card breakage revenue by applying our estimate of the rate of gift card breakage over the estimated period of redemption. These estimates are based on our historical redemptions. We recognize breakage revenues exclusive of amounts subject to state unclaimed property laws.
We recognized gift card breakage in restaurant sales of $0.2 million and $0.3 million during the years ended December 29, 2014 and December 30, 2013. We did not recognize any gift card breakage during the year ended December 31, 2012. The amount recorded in 2013 includes breakage income related to gift cards sold since 2008.
Franchise Fee and Royalty Accounting
We recognize franchise fee revenues when substantial performance of all franchisor obligations has been achieved. Substantial performance is achieved when the following conditions have been met: 1) we have no remaining obligation or intent to refund any cash or to forgive any unpaid notes or receivables from franchisees; 2) we have performed substantially all of the initial services required by the license agreement; and 3) we have met all other material conditions or obligations. The commencement of operations by the franchisee indicates substantial performance has occurred. If substantial performance of our obligations has not been completed, recognition as revenue of such amounts received is deferred until all material services or conditions have been satisfied by us. In addition, monthly royalties are recognized as revenue when earned.
Cash and Cash Equivalents
We consider all highly liquid investments purchased with an original maturity of three months or less to be cash equivalents.
During the year, cash balances may exceed the federally insured limits at the banks where we maintain our deposits. We do not believe we are exposed to any significant credit risk on cash and cash equivalents.
Accounts Receivable
Trade accounts receivable, net of allowance for doubtful accounts, consists primarily of receivables from catering on-account sales, credit card sales receivables and royalty fee receivables. Other accounts receivable consists primarily of tenant allowances due from landlords. Management determines the allowance for doubtful accounts based on historical losses and current economic conditions. On a continuing basis, management analyzes delinquent receivables, and once these receivables are determined to be uncollectible, they are written off either against an existing allowance account or as a direct charge to the consolidated statement of operations.
Inventory
Inventory consists primarily of food, beverage, and paper products. All inventories are recorded at the lower of cost, as determined on a first-in, first-out (FIFO) method, or market.
Property and Equipment
Property and equipment are stated at cost, less accumulated depreciation. Expenditures for improvements and renewals that extend the useful lives are capitalized. Upon sale, retirement, or other disposition of these assets, the costs and related accumulated depreciation are removed from the respective accounts and any gain or loss on the disposition is included in our consolidated statement of operations. Maintenance and repair costs are expensed as incurred. Depreciation is calculated using the straight-line method based on the following estimated lives:
F-9
Building under deemed landlord financing | 39 years | |
Leasehold improvements | 7 - 20 years | |
Furniture and fixtures | 7 years | |
Automotive equipment | 4 - 5 years | |
Computer equipment | 3 - 5 years | |
Machinery and equipment | 5 years | |
Leasehold improvements are depreciated over the shorter of the lease term of the respective leases, or the estimated useful life of the asset.
Goodwill
Goodwill represents the excess of the cost of the business acquired over the fair value of its net assets at the date of acquisition. We account for goodwill under Accounting Standards Codification ("ASC") 350, Intangibles — Goodwill and Other, which requires that goodwill and indefinite lived intangible assets are not amortized but tested for impairment at least annually or more frequently if events or changes in circumstances indicate that the asset might be impaired. For purposes of applying ASC 350, we have identified a single reporting unit, as that term is defined in ASC 350, to which goodwill is attributable.
We performed our annual impairment testing of goodwill as of the last day of the fiscal year. The fair value of our reporting unit was estimated primarily using the expected present value of future cash flows, using estimates, judgments and assumptions that management believes were appropriate in the circumstances.
Trade Name
A trade name is considered to be an important element associated with the sales appeal of certain products and services. The trade name distinguishes goods and services from competitors, indicates the source of the goods and services, and serves as an indication of the quality of the product. Our trade name consists of various protected words, symbols, and designs that help identify our products and services such as the "Zoës Kitchen" trademark. This capitalized cost is being amortized on a straight-line basis over an estimated useful life of 20 years.
Franchise Agreements
We capitalize the fair value of franchise agreements and amortize on a straight-line basis over the estimated useful life. Following the purchase of the Mobile, Alabama, Destin, Florida and Louisiana stores in 2014 from our franchisees, we no longer have franchise agreements recorded as of December 29, 2014.
Favorable Leases
A leasehold interest represents the future lease obligations under the in-place contractual lease terms that are either above or below market value. The value of acquired leases that were determined to be favorable to market rents are capitalized and amortized on a straight-line basis over the lease term from the date of acquisition.
Reacquired Rights
Reacquired rights intangible assets arise from our franchise acquisitions. We amortize these reacquired rights on a straight-line basis over the remaining terms of the original franchise agreements.
Impairment of Long-Lived Assets
We evaluate impairment of long-lived assets whenever events or changes in circumstances indicate that the net carrying amounts may not be recoverable. We compare estimated undiscounted cash flows from operating activities to the carrying value of related assets for the individual restaurants. If the sum of the estimated undiscounted cash flows is less than the carrying value, an impairment loss would be recognized for the difference between the carrying value and the estimated fair value of the assets based on the discounted future cash flows of the assets using a rate that approximates our weighted average cost of capital.
We recognized no impairment losses during the years ended December 29, 2014, December 30, 2013 and December 31, 2012.
Loan Costs
Loan costs are amortized on a straight-line basis over the remaining life of the debt as a component of interest expense. GAAP requires that the effective yield method be used to amortize loan financing costs; however, the effect of using the straight-line method is not materially different from the results that would have been obtained under the effective yield method. At
F-10
December 29, 2014 loan costs were $0.02 million related to the 2015 Credit Facility as described in our subsequent events (see Note 15). As of December 30, 2013 loan costs were $1.0 million, net of accumulated amortization of $0.7 million.
Sales Taxes
Sales taxes are imposed by state, county, and city governmental authorities, collected from customers and remitted to the appropriate governmental agency. Our accounting policy is to record the sales taxes collected as a liability on our books and then remove the liability when the sales tax is remitted. There is no impact on the consolidated statement of operations as restaurant sales are recorded net of sales tax.
Deferred Rent
Certain leases contain annual escalation clauses based on fixed escalation terms. The excess of cumulative rent expense (recognized on the straight-line basis) over cumulative rent payments made on leases with fixed escalation terms is recognized as deferred rent liability in the accompanying balance sheets. Also included in deferred rent are tenant improvements that we commonly negotiate when opening new restaurants to help fund build-out costs. These costs typically include general construction to alter the layout of the restaurant and leasehold improvements. When we are the beneficiary of each of the improvements, we capitalize the assets and record a deferred liability for the amount of cash received from the landlord, which is amortized on a straight-line basis over the lease term as defined below. If the landlord is deemed to be the owner of leasehold improvements purchased with such allowances, neither an asset nor a liability is recorded by us. The amortization of the deferred liability related to these tenant improvements is recorded as a reduction of rent expense. Tenant improvement allowances, net of amortization, totaled $7.9 million and $4.0 million as of December 29, 2014 and December 30, 2013, respectively. For leases where we are considered to be the owner of the construction project and receive tenant improvement allowances, we record these amounts received as a component of the deemed landlord financing liability. See Note 10.
Lease term is determined at lease inception and includes the initial term of the lease plus any renewal periods that are reasonably assured to occur. The lease term begins when we have the right to control the use of the property.
Additionally, certain of our operating leases contain clauses that provide additional contingent rent based on a percentage of sales greater than certain specified target amounts. We recognize contingent rent expense provided the achievement of that target is considered probable.
Insurance Reserves
Beginning with our new insurance policy period, on September 27, 2014, we self-insure a portion of our expected losses under our worker's compensation insurance program. To limit our exposure to losses, we maintain stop-loss coverage through third-party insurers. Insurance liabilities representing estimated costs to settle reported claims and incurred but not recorded are included in accrued expenses and other.
Advertising Costs
Advertising costs are expensed as incurred and are included in general and administrative and store operating expenses on the consolidated statement of operations. Advertising costs for the years ended December 29, 2014, December 30, 2013 and December 31, 2012 were $0.07 million, $0.04 million and $0.01 million, respectively.
Pre-opening Costs
Pre-opening costs primarily consist of new employee training, initial print materials, marketing, payroll expenses and rent incurred in connection with new restaurant openings and are expensed as incurred. For the years ended December 29, 2014, December 30, 2013 and December 31, 2012, pre-opening costs were $2.1 million, $1.9 million and $0.9 million, respectively.
Fair Value of Financial Instruments
The carrying amounts of our financial instruments, which include accounts receivable, accounts payable, and other accrued expenses, approximate their fair values due to their short maturities. The carrying amount of our previously existing long-term debt approximates its fair value due to the variable component of the interest rate.
Income Taxes
We use the liability method of accounting for income taxes in accordance with Financial Accounting Standards Board ("FASB") ASC 740, Income Taxes. Under this method, a deferred tax asset or liability is recognized for the estimated future tax effects attributable to temporary differences between the financial statement basis and the tax basis of assets and liabilities as well as tax credit carryforwards. Deferred tax assets and liabilities are measured using enacted tax rates expected to apply to taxable income in the years in which those temporary differences are expected to be recovered or settled. The effect on deferred tax assets and
F-11
liabilities of a change in tax rates is recognized in the period of the change. We and our subsidiaries file a consolidated federal income tax return.
Significant judgment is required in evaluating our uncertain tax positions and determining our provision for income taxes. We assess the income tax position and record the liabilities for all years subject to examination based upon management's evaluation of the facts, circumstances, and information available at the reporting date.
Comprehensive Income (Loss)
Comprehensive income (loss) is defined as the change in equity of a business enterprise during a period from transactions and other events and circumstances from non-owner sources. Comprehensive loss is the same as net loss for all periods presented. Therefore, a separate statement of comprehensive loss is not included in the accompanying consolidated financial statements.
Variable Interest Entities
In accordance with ASC 810, Consolidation, we apply the guidance related to variable interest entities ("VIE"), which defines the process for how an enterprise determines which party consolidates a VIE as primarily a qualitative analysis. The enterprise that consolidates the VIE (the primary beneficiary) is defined as the enterprise with (1) the power to direct activities of the VIE that most significantly affect the VIE's economic performance and (2) the obligation to absorb losses of the VIE or the right to receive benefits from the VIE. We do not possess any ownership interests in franchise entities or other affiliates. The franchise agreements are designed to provide the franchisee with key decision-making ability to enable it to oversee its operations and to have a significant impact on the success of the franchise, while our decision-making rights are related to protecting our brand. Based upon our analysis of all the relevant facts and considerations of the franchise entities and other affiliates, we have concluded that these entities are not variable interest entities and they have not been consolidated as of the fiscal year ended December 29, 2014 or fiscal year ended December 30, 2013.
Recently Issued Accounting Standards
In February 2015, the Financial Accounting Standards Board ("FASB") issued Accounting Standards Update ("ASU") No. 2015-02, "Consolidation: Amendments to the Consolidation Analysis." This update improves targeted areas of the consolidation guidance and reduces the number of consolidation models. This update is effective for annual and interim periods in fiscal years beginning after December 15, 2015, with early adoption permitted. The adoption of ASU 2015-02 is not expected to have a material impact on our consolidated financial position or results of operations.
In August 2014, the FASB issued ASU No. 2014-15, "Presentation of Financial Statements - Going Concern: Disclosures of Uncertainties about an Entity's Ability to Continue as a Going Concern." This update requires management of the Company to evaluate whether there is substantial doubt about the Company's ability to continue as a going concern. This update is effective for the annual period after December 15, 2016, and for annual and interim periods thereafter. The adoption of ASU 2014-15 is not expected to have a material impact on our consolidated financial position or results of operations.
In May 2014, the FASB issued ASU No. 2014-09, "Revenue from Contracts with Customers." This update was issued to replace the current revenue recognition guidance, creating a more comprehensive revenue model. This update is effective in fiscal periods beginning after December 15, 2016 and early application is not permitted. We are currently evaluating the impact of the adoption of ASU 2014-09 on our consolidated financial position or results of operations.
In April 2014, the FASB issued ASU No. 2014-08, "Reporting Discontinued Operations and Disclosures of Disposals of Components of an Entity." This ASU raises the threshold for a disposal to qualify as a discontinued operation and requires new disclosures of both discontinued operations and certain other disposals that do not meet the definition of a discontinued operation. This update is effective in fiscal periods beginning after December 15, 2014. The adoption of ASU 2014-08 is not expected to have a material impact on our consolidated financial position or results of operations.
F-12
2. Business Combination
On November 10, 2014, we purchased from one of our franchisees three franchise restaurants in Louisiana, two restaurants under development and area development rights in Louisiana, which will allow for us to further expand our Company-owned operations in this market. The purchase price for the acquisition was $8.0 million in cash. Simultaneous to the acquisition, we repaid $0.06 million to the Louisiana franchisee, which resulted in a decrease of our unearned franchise fees. The acquired restaurants contributed revenues of approximately $0.6 million from the date of the acquisition through December 29, 2014. Goodwill recorded in connection with the acquisition was attributable to synergies expected to arise from cost saving opportunities as well as future expected cash flows. The allocation of the purchase price to the estimated fair value of the assets acquired and liabilities assumed at the acquisition date is as follows (in thousands):
Cash | $ | 2 | ||
Inventory | 19 | |||
Prepaid rent | 20 | |||
Property, plant and equipment | 1,242 | |||
Deposits | 10 | |||
Favorable leases | 356 | |||
Reacquired rights | 1,125 | |||
Goodwill | 5,302 | |||
Accrued expenses | (50 | ) | ||
Royalties payable | (33 | ) | ||
Total purchase price | $ | 7,993 | ||
The pro forma impact of the acquisition and the current period results are not presented as it is not considered material to our consolidated financial statements
On January 8, 2014, we acquired two franchise restaurants in Mobile, Alabama and Destin, Florida from one of our franchisees which will allow for us to expand our Company-owned operations to these markets. The purchase price for the acquisition was $1.1 million in cash. The acquired restaurants contributed revenues of approximately $2.5 million from the date of acquisition through December 29, 2014. Goodwill recorded in connection with the acquisition was attributable to synergies expected to arise from cost saving opportunities as well as future expected cash flows. The allocation of the purchase price to the estimated fair value of the assets acquired and liabilities assumed at the acquisition date is as follows (in thousands):
Cash | $ | 2 | ||
Inventory | 15 | |||
Property, plant and equipment | 167 | |||
Reacquired rights | 91 | |||
Goodwill | 892 | |||
Accounts payable | (3 | ) | ||
Royalties payable | (17 | ) | ||
Total purchase price | $ | 1,147 | ||
The pro forma impact of the acquisition and the current period results are not presented as it is not considered material to our consolidated financial statements.
On August 6, 2012, we acquired three South Carolina franchise restaurants for $5.8 million in cash. Simultaneous to the acquisition, we repaid $0.2 million to the South Carolina franchisee, which resulted in a decrease of our unearned franchise fees. As a result of this acquisition, we gained control of the three restaurants and expanded our Company-owned operations into South Carolina. The acquired restaurants contributed revenues of approximately $1.9 million from the date of acquisition to December 31, 2012. Goodwill recorded in connection to the acquisition was attributable to synergies expected to arise from cost saving opportunities as well as future expected cash flows. The allocation of the purchase price to the estimated fair value of the assets acquired and liabilities assumed at the acquisition date is as follows:
F-13
Cash | $ | 2 | ||
Deposits | 11 | |||
Accounts receivable | 5 | |||
Inventory | 38 | |||
Property, plant and equipment | 753 | |||
Prepaid rent | 15 | |||
Reacquired rights | 2,869 | |||
Goodwill | 2,184 | |||
Accounts payable | (12 | ) | ||
Royalties payable | (28 | ) | ||
Total purchase price | $ | 5,837 | ||
The pro forma impact of the acquisition is not presented, as it is not considered material to our consolidated financial statements.
3. Property and Equipment
Property and equipment consists of the following at December 29, 2014 and December 30, 2013:
2014 | 2013 | |||||||
Buildings under deemed landlord financing | $ | 18,700 | $ | 16,150 | ||||
Leasehold improvements | 73,096 | 50,587 | ||||||
Machinery and equipment | 17,596 | 12,399 | ||||||
Furniture and fixtures | 3,948 | 2,669 | ||||||
Automobiles | 3,141 | 2,282 | ||||||
Computer equipment | 4,825 | 3,395 | ||||||
Construction in progress | 6,047 | 6,257 | ||||||
Total Property and equipment, gross | 127,353 | 93,739 | ||||||
Less: Accumulated depreciation | (23,408 | ) | (15,110 | ) | ||||
Total Property and equipment, net | $ | 103,945 | $ | 78,629 | ||||
Depreciation expense was $8.9 million, $5.9 million and $3.8 million for the years ended December 29, 2014, December 30, 2013 and December 31, 2012, respectively.
As a result of the application of build-to-suit lease guidance contained in ASC 840, Leases, we have determined that we are the accounting owner of a total of 35 and 31 landlord shell buildings under deemed landlord financing as of December 29, 2014 and December 30, 2013, respectively. There are six of these buildings under construction as of both December 29, 2014 and December 30, 2013. We have recorded these as buildings under deemed landlord financing in the table above. We capitalize the landlord's estimated construction costs of the shell building. See Note 10 for additional information.
We capitalize internal payroll and travel costs directly related to the successful development, design and construction of our new restaurants. Capitalized internal payroll and travel costs were $0.3 million, $0.2 million and $0.06 million for the years ended December 29, 2014, December 30, 2013 and December 31, 2012, respectively.
We capitalize interest incurred on funds used to construct Company-owned restaurants. We amortize over the estimated useful life of the related assets. Capitalized interest totaled $0.04 million, $0.2 million and $0.09 million for the years ended December 29, 2014, December 30, 2013 and December 31, 2012, respectively.
F-14
4. Goodwill
The following is a reconciliation of the beginning and ending balances of the Company's goodwill at December 29, 2014 and December 30, 2013:
2014 | 2013 | |||||||
Beginning Balance | $ | 23,334 | $ | 23,334 | ||||
Acquisition of Louisiana Franchise | 5,302 | — | ||||||
Acquisition of Destin and Mobile Franchise | 892 | — | ||||||
Ending Balance | $ | 29,528 | $ | 23,334 | ||||
5. Intangible Assets
Intangible assets are summarized in the following table as of December 29, 2014 and December 30, 2013:
2014 | ||||||||||||
Gross Carrying Amount | Accumulated Amortization | Net | ||||||||||
Trade name | $ | 10,000 | $ | (3,583 | ) | $ | 6,417 | |||||
Favorable leases | 464 | (109 | ) | 355 | ||||||||
Reacquired rights | 6,712 | (2,278 | ) | 4,434 | ||||||||
Total intangible assets | $ | 17,176 | $ | (5,970 | ) | $ | 11,206 | |||||
2013 | ||||||||||||
Gross Carrying Amount | Accumulated Amortization | Net | ||||||||||
Trade name | $ | 10,000 | $ | (3,083 | ) | $ | 6,917 | |||||
Franchise agreements | 644 | (471 | ) | 173 | ||||||||
Favorable leases | 109 | (92 | ) | 17 | ||||||||
Reacquired rights | 5,495 | (1,395 | ) | 4,100 | ||||||||
Total intangible assets | $ | 16,248 | $ | (5,041 | ) | $ | 11,207 | |||||
Estimated amortization expense for the five succeeding years and the aggregate thereafter is:
Trade Name | Favorable Leases | Reacquired Rights | Total | |||||||||||||
2015 | 500 | 29 | 1,113 | 1,642 | ||||||||||||
2016 | 500 | 23 | 1,083 | 1,606 | ||||||||||||
2017 | 500 | 23 | 955 | 1,478 | ||||||||||||
2018 | 500 | 23 | 548 | 1,071 | ||||||||||||
2019 | 500 | 23 | 353 | 876 | ||||||||||||
Thereafter | 3,917 | 234 | 382 | 4,533 | ||||||||||||
Total | $ | 6,417 | $ | 355 | $ | 4,434 | $ | 11,206 | ||||||||
F-15
6. Accrued Expenses and Other
Accrued expenses and other consisted of the following at December 29, 2014 and December 30, 2013:
2014 | 2013 | |||||||
Accrued payroll and payroll taxes | $ | 3,935 | $ | 2,417 | ||||
Accrued capital purchases | 1,604 | 1,185 | ||||||
Sales tax payable | 1,061 | 805 | ||||||
Gift certificate payable | 896 | 600 | ||||||
Other accrued expenses | 2,679 | 1,455 | ||||||
Total accrued expenses and other | $ | 10,175 | $ | 6,462 | ||||
7. Bank Line of Credit and Term Loan
On April 16, 2014, we repaid all outstanding borrowings under our existing term loan and line of credit (the "2011 Credit Facility") and as of December 29, 2014 the 2011 Credit Facility was terminated. As of December 30, 2013 there was $38.5 million outstanding under the term loan and $2.9 million under the revolving line of credit. As of December 30, 2013, our interest rate for the term loan and line of credit was calculated based on the 1-month LIBOR (with a floor of 1.0%) plus 4.25%.
We incurred and capitalized $0.3 million of loan costs in the year ended December 30, 2013 related to the 2011 Credit Facility. These costs were written off upon the repayment of our outstanding borrowings under the 2011 Credit Facility in 2014.
8. Residual Value Obligations
We have residual value obligations associated with leased vehicles for individual restaurant locations. We have pre-paid for each of the vehicles. We then amortize the residual value obligation to the assets residual value by the end of the lease term. Each of the assets is recorded at the net present value of the initial payment made plus the assets residual value using a 6.50% discount rate. The residual value obligations recorded as capital leases were $0.3 million and $0.4 million for the years ended December 29, 2014 and December 30, 2013, respectively.
9. Income Taxes
Our income tax provision for the years ended December 29, 2014, December 30, 2013 and December 31, 2012 consists of the following:
2014 | 2013 | 2012 | ||||||||||
Current | ||||||||||||
Federal | $ | — | $ | — | $ | — | ||||||
State | 93 | 62 | 75 | |||||||||
Subtotal Current | 93 | 62 | 75 | |||||||||
Deferred | ||||||||||||
Federal | 569 | 545 | 511 | |||||||||
State | 37 | 49 | 36 | |||||||||
Subtotal Deferred | 606 | 594 | 547 | |||||||||
Total income tax provision | $ | 699 | $ | 656 | $ | 622 | ||||||
F-16
Total income tax expense differed from the amount which would have been provided by applying the statutory federal income tax rate of 35% to earnings before taxes as follows:
2014 | 2013 | 2012 | ||||||||||
Income tax expense (benefit) at federal statutory rate | $ | (3,277 | ) | $ | (1,071 | ) | $ | 129 | ||||
State income taxes | (238 | ) | (120 | ) | 87 | |||||||
Increase in valuation allowance | 2,323 | 2,747 | 284 | |||||||||
Equity-based compensation | 1,701 | 26 | 48 | |||||||||
Deferred taxes | 147 | (880 | ) | 57 | ||||||||
Meals and entertainment | 43 | 25 | 17 | |||||||||
Other permanent items | — | (71 | ) | — | ||||||||
Total income tax provision | $ | 699 | $ | 656 | $ | 622 | ||||||
Significant components of our deferred tax assets and liabilities at December 29, 2014 and December 30, 2013 are as follows:
2014 | 2013 | |||||||
Current: | ||||||||
Deferred tax assets: | ||||||||
Allowance for doubtful accounts | $ | 4 | $ | 5 | ||||
Deferred revenue (1) | 341 | 244 | ||||||
Valuation allowance (1) | (166 | ) | (119 | ) | ||||
Deferred tax liabilities: | ||||||||
Deferred rent | 396 | — | ||||||
Net deferred tax assets (liabilities), current (1) | (217 | ) | 130 | |||||
Non-current: | ||||||||
Deferred tax assets: | ||||||||
Net operating loss (1) | $ | 5,246 | $ | 4,222 | ||||
Landlord contributions (1) | 4,456 | 2,753 | ||||||
Deferred rent | 1,398 | — | ||||||
Stock compensation | 517 | — | ||||||
Deemed landlord financing (1) | 7,395 | 6,364 | ||||||
Charitable contributions | 92 | 75 | ||||||
Interest rate cap | — | 10 | ||||||
Valuation allowance (1) | (9,104 | ) | (6,832 | ) | ||||
Deferred tax liabilities: | ||||||||
Goodwill | 4,001 | 3,395 | ||||||
Other identifiable intangibles | 156 | 246 | ||||||
Property and equipment (1) | 9,627 | 6,475 | ||||||
Net deferred tax liabilities, non-current (1) | 3,784 | 3,524 | ||||||
Total net deferred tax liabilities (1) | $ | 4,001 | $ | 3,394 | ||||
(1) In 2014, we identified certain errors in the December 30, 2013 balance sheet relating to our deferred tax balances. The above denoted captions were impacted. Current deferred tax assets increased $0.1 million with deferred revenue increasing $0.2 million with an offsetting $0.1 million in valuation allowance. Non-current deferred tax assets decreased $0.2 million primarily due to a decrease in net operating loss of $1.8 million and deemed landlord financing of $1.2 million offset by an increase in landlord contributions of $2.8 million. Non-current deferred tax liabilities decreased $0.1 million due to a decrease in deferred rent of $0.6 million (resulting in a zero balance) offset by an increase in property and equipment of $0.5 million. We have concluded that these errors are not material individually or in the aggregate to any prior reporting periods. | ||||||||
F-17
We have classified the current net deferred tax asset as a component of prepaid expenses and other in our Consolidated Balance Sheets. ASC 740 requires that we reduce our deferred income tax assets by a valuation allowance if, based on the weight of the available evidence, it is more likely than not that all or a portion of a deferred tax asset will not be realized. The ultimate realization of deferred tax assets is dependent upon the generation of future taxable income during the periods in which those temporary differences are deductible. We have established a valuation allowance of $9.3 million and $6.9 million as of December 29, 2014 and December 30, 2013, respectively, against our net deferred tax assets due to the fact that it is not more likely than not that there will be sufficient taxable income in the future when the temporary differences are deductible.
A rollforward of activity in the valuation allowances follows:
Balance at December 26, 2011 | $ | 3,916 | ||
Addition to valuation allowance | 284 | |||
Deductions | — | |||
Balance at December 31, 2012 | 4,200 | |||
Addition to valuation allowance | 2,747 | |||
Deductions | — | |||
Balance at December 30, 2013 | 6,947 | |||
Addition to valuation allowance | 2,323 | |||
Deductions | — | |||
Balance at December 29, 2014 | $ | 9,270 | ||
We have recorded a full valuation allowance for the net amount of the deferred tax assets which are in excess of the indefinite-lived intangible asset deferred tax liabilities. The indefinite-lived intangible asset deferred tax liability in the amount of $4.0 million and $3.4 million as of December 29, 2014 and December 30, 2013, respectively, related to the book-tax basis difference in goodwill has not been netted against the deferred tax assets due to the uncertainty inherent in the reversal of this deferred tax liability.
At December 29, 2014, we have unused federal and state net operating loss carryforwards of $13.7 million and $12.7 million, respectively. Such losses expire in various amounts at varying times through 2034. Of these amounts, we have approximately $0.4 million of federal and state NOL carryforwards related to excess stock compensation that will be recorded in additional paid in capital when realized as a reduction in taxes payable. These NOL carryforwards result in a deferred tax asset of $5.2 million and $4.2 million at December 29, 2014 and December 30, 2013, respectively. A valuation allowance is recorded against the net deferred tax assets, exclusive of indefinite-lived intangibles discussed above, including these carryforwards. We file income tax returns, which can be periodically audited by various federal and state jurisdictions. We are generally no longer subject to federal or state income examinations for years prior to fiscal year 2009.
10. Leases
We lease space for various restaurant locations under long-term non-cancelable operating leases from unrelated third parties. Most of our leases are classified as operating leases under ASC 840. Rent expense, including rent-free periods if applicable, is recognized on a straight-line basis over the lease term. The lease term for all types of leases begins on the date we become legally obligated for the rent payments or we take possession of the building or land, whichever is earlier. The lease term includes cancelable option periods where failure to exercise such options would result in an economic penalty.
In some cases, the asset we will lease requires construction to ready the space for its intended use, and in certain cases, we have involvement with the construction of leased assets. The construction period begins when we execute our lease agreement with the property owner and continues until the space is substantially complete and ready for its intended use. In accordance with ASC 840-40-55, we must consider the nature and extent of our involvement during the construction period, and in some cases, our involvement results in us being considered the accounting owner of the construction project. One example of involvement that results in the Company being considered the accounting owner is a case where we lease a "cold shell." By adding an HVAC unit, we are deemed to have participated in the construction of the landlord asset. In such cases, we capitalize the landlord's construction costs, including the value of costs incurred up to the date we execute our lease (e.g., the building "shell") and costs incurred during the remainder of construction period, as such costs are incurred. Additionally, ASC 840-40-55 requires us to recognize a financing obligation for construction costs incurred by the landlord. Once construction is complete, we are required to perform a sale-leaseback analysis pursuant to ASC 840-40 to determine if we can remove the landlord's assets and associated financing obligations from the consolidated balance sheet. In certain leases, we maintain various forms of "continuing
F-18
involvement" in the property, thereby precluding us from derecognizing the asset and associated financing obligations following the construction completion. In those cases, we will continue to account for the landlord's asset as if we are the legal owner, and the financing obligation, similar to other debt, until the lease expires or is modified to remove the continuing involvement that prohibits de-recognition. Once de-recognition is permitted we would be required to account for the lease as either operating or capital in accordance with ASC 840.
We determined that we were the accounting owner of a total of 35 and 31 leased buildings as a result of the application of build-to-suit lease application as of December 29, 2014 and December 30, 2013, respectively. There were six of these buildings under construction as of both December 29, 2014 and December 30, 2013.
The future minimum rental payments required under these leases, including those accounted for as deemed landlord financing, during the next five years and thereafter in the aggregate, are as follows:
Deemed landlord financing | Operating leases | |||||||
2015 | 2,929 | 10,107 | ||||||
2016 | 2,973 | 10,410 | ||||||
2017 | 3,031 | 10,421 | ||||||
2018 | 3,117 | 10,519 | ||||||
2019 | 3,220 | 10,846 | ||||||
Thereafter | 44,089 | 138,418 | ||||||
Total | $ | 59,359 | $ | 190,721 | ||||
Rent expense charged to operations under our operating leases on a straight-line basis was $9.7 million, $6.9 million and $4.4 million for the years ended December 29, 2014, December 30, 2013 and December 31, 2012, respectively. Rent expense incurred prior to restaurant openings is included in pre-opening costs on the consolidated statement of operations in the amount of $0.6 million, $0.6 million and $0.3 million for the years ended December 29, 2014, December 30, 2013 and December 31, 2012, respectively.
Deemed landlord financing obligations totaled $23.3 million and $19.9 million for the years ended December 29, 2014 and December 30, 2013, respectively.
11. Related Party Transactions
Corporate Development and Administrative Services Agreement
Zoe's Investors entered into a Corporate Development and Administrative Services Agreement with Brentwood Private Equity IV, LLC ("Brentwood"), an owner of membership interests in Zoe's Investors, our sole shareholder as of December 30, 2013. Under the terms of the agreement, Brentwood provided assistance in the corporate development activities and our business growth efforts. As consideration for services provided, we provided reimbursement for business expenses related to performance of this agreement and an annual consulting fee based on Adjusted EBITDA as defined in the agreement. During the years ended December 29, 2014, December 30, 2013 and December 31, 2012, we expensed approximately $0.1 million, $0.2 million and $0.2 million respectively, related to this agreement. The Brentwood agreement was terminated prior to our IPO. In addition, three persons associated with Brentwood currently serve on our Board of Directors.
Repurchase of shares
In connection with our follow-on offering completed on August 19, 2014, we repurchased 94,100 shares of our common stock from certain of our officers at a price per share equal to the net proceeds per share in the offering. We did not receive net proceeds from the offering.
F-19
12. Commitments and Contingencies
Franchise Agreement
Our franchise agreement, which requires the franchisees to remit continuing royalty fees at a specified percentage of the franchisee's gross sales revenue, provides that we as franchisor, or its authorized representative, will: (a) provide franchisee with written schedules of all foods, food products, beverages, and other items for sale, and the furniture, fixtures, supplies and equipment necessary and required for the operation of the restaurant; (b) provide franchisee with a list of approved suppliers for the products and services necessary and required for the restaurant; (c) upon the reasonable written request of franchisee, render reasonable advisory services by telephone or in writing pertaining to the operation of the restaurant; (d) provide franchisee with a sample of the standard Zoës Kitchen menu, and any modifications to the menu; (e) loan franchisee a copy of the System's operating manual and any supplements to the manual that may be published by us; and, (f) provide franchisee the opportunity to participate in group purchasing programs that we may use, develop, sponsor or provide on terms and conditions determined solely by us. In addition, as a condition to the commencement of business by the franchisee, the franchisee must attend and successfully complete our training program.
Litigation
We are currently involved in various claims and legal actions that arise in the ordinary course of our business, including claims resulting from employment related matters. None of these claims, most of which are covered by insurance, has had a material effect on us, and as of the date of this report, other than as set forth above, we are not party to any material pending legal proceedings and are not aware of any claims that could have a material adverse effect on our business, financial condition, results of operations or cash flows. However, a significant increase in the number of these claims or an increase in amounts owing under successful claims could materially and adversely affect our business, financial condition, results of operations or cash flows.
On October 31, 2014, Forsyth Consulting, Inc. ("Forsyth"), a former music vendor for the Company, filed a complaint against the Company in the Circuit Court of Jefferson County, Alabama alleging breach of contract with respect to its prior music service contract. We have removed the action to federal court and, on December 19, 2014, we filed a counterclaim in the United States District Court for the Northern District of Alabama, alleging breach of contract and tortious interference with business relations claims against Forsyth. The Company believes that Forsyth's claims are without merit and intends to vigorously pursue this action.
13. Equity-based Compensation
In connection with the IPO, we adopted the 2014 Omnibus Incentive Plan (the “2014 Incentive Plan”), which provides for grants of stock options, stock appreciation rights, restricted stock, other stock-based awards and other cash-based awards available to directors, officers and other employees of us and our subsidiaries, as well as others performing consulting or advisory services to us. The number of shares of common stock available for issuance under the 2014 Incentive Plan may not exceed 1,905,799.
The following table summarizes our stock option plan activity (in thousands, except share and per share data):
Number of units | Weighted-average exercise price | ||||||
Outstanding at December 30, 2013 | — | $ | — | ||||
Granted | 554,340 | 16.54 | |||||
Forfeited | (10,370 | ) | 15.00 | ||||
Exercised | (22,500 | ) | 15.00 | ||||
Outstanding at December 29, 2014 | 521,470 | $ | 16.64 | ||||
Shares | Weighted-average exercise price per share | Weighted-average remaining years of contractual life | Aggregate intrinsic value | ||||||||||
Outstanding | 521,470 | $ | 16.64 | 9.4 | $ | 6,829 | |||||||
Vested and expected to vest | 488,753 | 16.51 | 9.3 | 6,456 | |||||||||
Exercisable | 227,500 | 15.00 | 9.3 | 3,326 | |||||||||
F-20
The following table reflects the weighted-average assumptions utilized in the Black-Scholes option-pricing model to value the stock options granted in the fifty-two weeks ended December 29, 2014:
Expected volatility (1) | 34.98% | |
Risk-free rate of return | 1.78% | |
Expected life (in years) (2) | 5.1 | |
Dividend yield | 0% | |
Fair value per share at date of grant | $5.74 | |
(1) Expected volatility was based on competitors within the industry.
(2) Expected life was calculated using the simplified method, which is an average of the contractual term of the option and its ordinary vesting period, as we do not have sufficient historical data for determining the expected term of our stock option awards.
There were 250,000 stock options granted, included in the table above, that vested immediately upon completion of the IPO and the remainder of the options will vest in four equal annual installments following the date of the grant with a contractual term of 10 years.
We issued 6,666 restricted stock units in the year ended December 29, 2014, which will vest in three equal annual installments following the date of the grant. The were no vested or forfeited restricted stock units in the year ended December 29, 2014.
Prior to the IPO, certain of our employees had been granted Class B units in Zoe’s Investors, LLC ("Zoe's Investors"), which was our parent company, pursuant to that entity’s limited liability company agreement. As these awards had been granted to employees of the Company, which was a consolidated subsidiary of Zoe’s Investors, the related compensation expense was reflected in the Company’s consolidated financial statements prior to the IPO. Awards granted during 2012 and 2013 are identical to those granted in and prior to 2011 with the exception of a provision that the employee forfeits the 2012 and 2013 awards, vested or unvested, if they terminate their employment with the Company for any reason. There was no compensation expense related to the 2012 and 2013 awards prior to the IPO. In connection with the IPO, any awards granted by Zoe's Investors were converted into common stock.
We recognized as a component of general and administrative expenses $6.3 million, $0.1 million and $0.1 million of equity-based compensation expense related to these awards in years ended December 29, 2014, December 30, 2013 and December 31, 2012, respectively. Of the total equity-based compensation recognized for the year ended December 29, 2014, $4.9 million is related to accelerated vesting of outstanding equity awards at the IPO and $1.2 million is related to stock options granted at the date of the IPO. As of December 29, 2014, total unrecognized compensation expense related to non-vested stock awards, including an estimate for pre-vesting forfeitures, was $1.8 million, which is expected to be recognized over a weighted-average period of 3.5 years.
14. Net Loss per Share
Basic net loss per share is calculated by dividing net loss by the weighted average shares outstanding during the period, without consideration of common stock equivalents. Diluted net loss per share is calculated by adjusting weighted average shares outstanding for the dilutive effect of common stock equivalents outstanding for the period, determined using the treasury-stock method.
On April 16, 2014, we completed our IPO, giving effect to a 125,614.14:1 stock split, which became effective on April 14, 2014. All share and per share data have been retroactively restated to reflect the stock split. All share amounts throughout these financial statement have been adjusted as applicable.
The following table presents the computation of basic and diluted net loss per share for the period indicated (in thousands, except per share data):
2014 | 2013 | 2012 | ||||||||||
Historical net loss per share: | ||||||||||||
Net loss | $ | (10,017 | ) | $ | (3,715 | ) | $ | (253 | ) | |||
Weighted average shares outstanding, basic and diluted | 17,410 | 12,561 | 12,561 | |||||||||
Net loss per share, basic and diluted | $ | (0.58 | ) | $ | (0.30 | ) | $ | (0.02 | ) | |||
F-21
During the fifty-two weeks ended December 29, 2014, 162,900 stock options and 2,718 restricted stock units were excluded from the diluted earnings per share calculation because their inclusion would have been anti-dilutive.
15. Subsequent Events
On February 6, 2015, we entered into a credit facility with Wells Fargo Bank, National Association (the "2015 Credit Facility"). The 2015 Credit Facility consists of a revolving loan commitment in the aggregate amount of $20 million, together with an incremental revolving credit commitment up to an aggregate amount of $30.0 million. The 2015 Credit Facility has a five year term and matures on February 6, 2020. Revolving credit loans thereunder bear interest, at the Company’s election, at either the base rate plus an applicable margin, or LIBOR plus an applicable margin. The base rate consists of the highest of the prime rate, the federal funds rate plus 0.50% and LIBOR plus 1%. The applicable margin and associated loan commitment fee consists of two pricing levels based on the Company’s consolidated total debt ratio. If this debt ratio is greater than or equal to 2.50 to 1, then the unused commitment fee is 0.150% per annum, and the applicable margin is LIBOR plus 1.50% or the base rate plus 0.50%. If this debt ratio is less than 2.50 to 1.00, then the unused commitment fee is 0.125% per annum and the applicable margin is LIBOR plus 1.00% or the base rate.
The 2015 Credit Facility includes specific financial covenants such as a leverage ratio and an interest coverage ratio. We are also subject to other customary covenants, including limitations on additional borrowings, dividend payments and acquisitions.
Each domestic subsidiary of the Company unconditionally guarantees all existing and future indebtedness and liabilities arising under the 2015 Credit Facility. The 2015 Credit Facility is unsecured and includes customary representations, warranties and covenants. As of the date hereof, the Company has no indebtedness under the 2015 Credit Facility as of the date of this report.
16. Quarterly Financial Data (unaudited)
The following tables set forth certain unaudited consolidated financial information for each of the four quarters in 2014 and 2013 (in thousands, except per share data):
Quarter Ended | ||||||||||||||||||||||||||||||||
December 29, 2014 | October 6, 2014 | July 14, 2014 | April 21, 2014 | December 30, 2013 | October 7, 2013 | July 15, 2013 | April 22, 2013 | |||||||||||||||||||||||||
Total revenue | $ | 40,014 | $ | 43,565 | $ | 41,888 | $ | 46,266 | $ | 28,676 | $ | 29,144 | $ | 27,186 | $ | 31,379 | ||||||||||||||||
Income (loss) from operations | (810 | ) | 875 | 1,616 | (6,480 | ) | (1,577 | ) | 1,223 | 1,243 | 96 | |||||||||||||||||||||
Net income (loss) | (1,596 | ) | 448 | 1,119 | (9,988 | ) | (3,098 | ) | 351 | 423 | (1,391 | ) | ||||||||||||||||||||
Net income (loss) per share, basic | $ | (0.08 | ) | $ | 0.02 | $ | 0.06 | $ | (0.76 | ) | $ | (0.25 | ) | $ | 0.03 | $ | 0.03 | $ | (0.11 | ) | ||||||||||||
Net income (loss) per share, diluted | $ | (0.08 | ) | $ | 0.02 | $ | 0.06 | $ | (0.76 | ) | $ | (0.25 | ) | $ | 0.03 | $ | 0.03 | $ | (0.11 | ) | ||||||||||||
Weighted average shares outstanding, basic | 19,275 | 19,270 | 19,270 | 13,220 | 12,561 | 12,561 | 12,561 | 12,561 | ||||||||||||||||||||||||
Weighted average shares outstanding, diluted | 19,275 | 19,502 | 19,478 | 13,220 | 12,561 | 12,561 | 12,561 | 12,561 | ||||||||||||||||||||||||
F-22