Attached files
| file | filename |
|---|---|
| EXCEL - IDEA: XBRL DOCUMENT - TerraForm Power NY Holdings, Inc. | Financial_Report.xls |
| EX-32 - EXHIBIT 32 - TerraForm Power NY Holdings, Inc. | terraform-123114xexhibit32.htm |
| EX-31.2 - EXHIBIT 31.2 - TerraForm Power NY Holdings, Inc. | terraform-123114xexhibit312.htm |
| EX-31.1 - EXHIBIT 31.1 - TerraForm Power NY Holdings, Inc. | terraform-123114xexhibit31.htm |
UNITED STATES
SECURITIES AND EXCHANGE COMMISSION
Washington, D.C. 20549
______________________________________________________________
FORM 10-K
______________________________________________________________
(Mark One)
x | ANNUAL REPORT PURSUANT TO SECTION 13 OR 15(d) OF THE SECURITIES EXCHANGE ACT OF 1934 |
For the Fiscal Year ended December 31, 2014
OR
o | TRANSITION REPORT PURSUANT TO SECTION 13 OR 15(d) OF THE SECURITIES EXCHANGE ACT OF 1934 |
For the transition period from to
Commission File Number: 001-36542
______________________________________________________________
TerraForm Power, Inc.
(Exact name of registrant as specified in its charter)
______________________________________________________________
Delaware | 46-4780940 | |
(State or other jurisdiction of incorporation or organization) | (I. R. S. Employer Identification No.) | |
7550 Wisconsin Avenue, 9th Floor, Bethesda, Maryland | 20814 | |
(Address of principal executive offices) | (Zip Code) | |
240-762-7700
(Registrant’s telephone number, including area code)
Securities registered pursuant to Section 12(b) of the Act:
Title of Each Class | Name of Exchange on Which Registered | |
Common Stock, Class A, par value $0.01 | NASDAQ Stock Market LLC | |
Securities registered pursuant to Section 12(g) of the Act:
None
______________________________________________________________
Indicate by check mark if the registrant is a well-known seasoned issuer, as defined by Rule 405 of the Securities Act. o Yes x No
Indicate by check mark if the registrant is not required to file reports pursuant to Section 13 or Section 15(d) of the Act. o Yes x No
Indicate by check mark whether the registrant: (1) has filed all reports required to be filed by Section 13 or 15(d) of the Securities Exchange Act of 1934 during the preceding 12 months (or for such shorter period that the registrant was required to file such reports), and (2) has been subject to such filing requirements for the past 90 days. x Yes o No
Indicate by check mark whether the registrant has submitted electronically and posted on its corporate Web site, if any, every Interactive Data File required to be submitted and posted pursuant to Rule 405 of Regulation S-T (§232.405 of this chapter) during the preceding 12 months (or for such shorter period that the registrant was required to submit and post such files). Yes x No o
Indicate by check mark if disclosure of delinquent filers pursuant to Item 405 of Regulation S-K (§229.405 of this chapter) is not contained herein, and will not be contained, to the best of the registrant's knowledge, in definitive proxy or information statements incorporated by reference in Part III of this Form 10-K or any amendment to this Form 10-K. o
Indicate by check mark whether the registrant is a large accelerated filer, an accelerated filer, a non-accelerated filer or a smaller reporting company. See the definitions of “large accelerated filer,” “accelerated filer,” and “smaller reporting company” in
Rule 12b-2 of the Exchange Act.
Large accelerated filer | o | Accelerated filer | o | |||
Non-accelerated filer | x (Do not check if a smaller reporting company) | Smaller reporting company | o | |||
Indicate by check mark whether the registrant is a shell company (as defined in Rule 12b-2 of the Exchange Act). Yes o No x
The registrant completed its initial public offering of its Class A common stock on July 23, 2014. The registrant was not a public company as of the last business day of its most recently completed second fiscal quarter and therefore cannot calculate the aggregate market value of its voting and non-voting common equity held by non-affiliates as of such date.
As of March 9, 2015, there were 56,017,984 shares of Class A common stock outstanding, 62,726,654 shares of Class B common stock outstanding, and 5,840,000 shares of Class B1 common stock outstanding.
Table of Contents
Page | ||
Item 1. | ||
Item 1A. | ||
Item 1B. | ||
Item 2. | ||
Item 3. | ||
Item 4. | ||
Item 5. | ||
Item 6. | ||
Item 7. | ||
Item 7A. | ||
Item 8. | ||
Item 9. | ||
Item 9A. | ||
Item 9B. | ||
Item 10. | ||
Item 11. | ||
Item 12. | ||
Item 13. | ||
Item 14. | ||
Item 15. | ||
CAUTIONARY STATEMENT CONCERNING FORWARD-LOOKING STATEMENTS
Certain statements, other than purely historical information, including estimates, projections, statements related to our business plans, objectives and expected operating results, and the assumptions upon which those statements are based are forward-looking statements within the meaning of the federal securities laws including, without limitation, our expectation that our liquidity will be sufficient to fund our operations for the next twelve months. These forward-looking statements are identified by the use of terms and phrases such as "anticipate," "believe," "could," "estimate," "expect," "intend," "may," "plan," "predict," "project," "will" and similar terms and phrases, including references to assumptions. However, these words are not the exclusive means of identifying such statements. Although we believe that our plans, intentions, and expectations reflected in or suggested by such forward-looking statements are reasonable, we cannot assure you that we will achieve those plans, intentions, or expectations. All forward-looking statements are subject to risks and uncertainties that may cause actual results to differ materially from those that we expected.
Important factors that could cause actual results to differ materially from our expectations, or cautionary statements, are listed below and further disclosed under the section entitled Item 1A. Risk Factors:
• | our ability to integrate the First Wind assets and realize the anticipated benefits of the First Wind acquisition; |
• | counterparties' to our offtake agreements willingness and ability to fulfill their obligations under such agreements; |
• | price fluctuations, termination provisions and buyout provisions related to our offtake agreements; |
• | our ability to enter into contracts to sell power on acceptable terms as our offtake agreements expire; |
• | delays or unexpected costs during the completion of construction of certain projects we intend to acquire; |
• | our ability to successfully identify, evaluate and consummate acquisitions; |
• | government regulation, including compliance with regulatory and permit requirements and changes in market rules, rates, tariffs and environmental laws; |
• | operating and financial restrictions placed on us and our subsidiaries related to agreements governing our indebtedness and other agreements of certain of our subsidiaries and project-level subsidiaries generally and in our New Revolver; |
• | our ability to borrow additional funds and access capital markets, as well as our substantial indebtedness and the possibility that we may incur additional indebtedness going forward; |
• | our ability to compete against traditional and renewable energy companies; |
• | hazards customary to the power production industry and power generation operations such as unusual weather conditions, catastrophic weather-related or other damage to facilities, unscheduled generation outages, maintenance or repairs, interconnection problems or other developments, environmental incidents, or electric transmission constraints and the possibility that we may not have adequate insurance to cover losses as a result of such hazards; |
• | our ability to expand into new business segments or new geographies; and |
• | our ability to operate our businesses efficiently, manage capital expenditures and costs tightly, manage risks related to international operations and generate earnings and cash flow from our asset-based businesses in relation to our debt and other obligations. |
The forward-looking statements included herein are made only as of the date hereof. We undertake no obligation to publicly update or revise any forward-looking statement as a result of new information, future events or otherwise, except as otherwise required by law.
GLOSSARY OF TERMS
When the following terms and abbreviations appear in the text of this report, they have the meanings indicated below:
CAFD | Cash available for distribution | |
Call Right Projects | Qualifying projects from SunEdison's development pipeline required to be offered to us by SunEdison under the Support Agreement and the Intercompany Agreement, as applicable | |
COD | Commercial operations date | |
Distribution Forbearance Period | The period beginning on the date of the closing of the IPO (as defined below) and ending on the later of March 31, 2015 or the date that the Completed CAFD Contribution amount exceeds the CAFD Forbearance Threshold, as those terms are defined in the amended and restated operating agreement of Terra LLC | |
Distribution Forbearance Provisions | The limitations on distributions on the Class B units under the amended and restated operating agreement of Terra LLC during the Distribution Forbearance Period | |
ITC | Investment tax credit | |
PPA | As applicable, Power Purchase Agreement, Energy Hedge Contract and/or REC or SREC Contract | |
Projected FTM | Projected future twelve months | |
PTC | Production tax credit | |
QF | Qualifying small power production facility | |
REC | Renewable energy certificate or SREC | |
SREC | Solar renewable energy certificate | |
PART I
Item 1. Business.
Overview
We are a dividend growth-oriented company formed to own and operate contracted clean power generation assets acquired from SunEdison, Inc. and its consolidated subsidiaries, or "SunEdison," and third parties. Our business objective is to acquire assets with high-quality contracted cash flows, primarily from owning solar and wind generation assets serving utility, commercial and residential customers. Over time, we intend to acquire other clean power generation assets, including natural gas and hydro-electricity facilities, as well as hybrid energy solutions that enable us to provide contracted power on a 24/7 basis. We believe the renewable power generation segment is growing more rapidly than other power generation segments due in part to the emergence in various energy markets of “grid parity,” which is the point at which renewable energy sources can generate electricity at a cost equal to or lower than prevailing electricity prices. We expect retail electricity prices to continue to rise due to the increasing cost of producing electricity from fossil fuels caused by required investments in generation facilities and transmission and distribution infrastructure and increasing regulatory costs, among other factors. Our portfolio consists of solar and wind projects located in the United States, Canada, the United Kingdom, and Chile with an aggregate nameplate capacity of 1,507.3 MW as of February 20, 2015.
We were formed under the name SunEdison Yieldco, Inc. on January 15, 2014, as a wholly owned indirect subsidiary of SunEdison. The name change from SunEdison Yieldco, Inc. to TerraForm Power, Inc., the "Company" or "TerraForm Power," became effective on May 22, 2014. Following our initial public offering on July 23, 2014, or "IPO," TerraForm Power became a holding company with its sole asset an equity interest in TerraForm Power LLC, or "Terra LLC." TerraForm Power is the managing member of Terra LLC, and operates, controls and consolidates the business affairs of Terra LLC.
6
The diagram below depicts our organizational structure as of February 20, 2015:
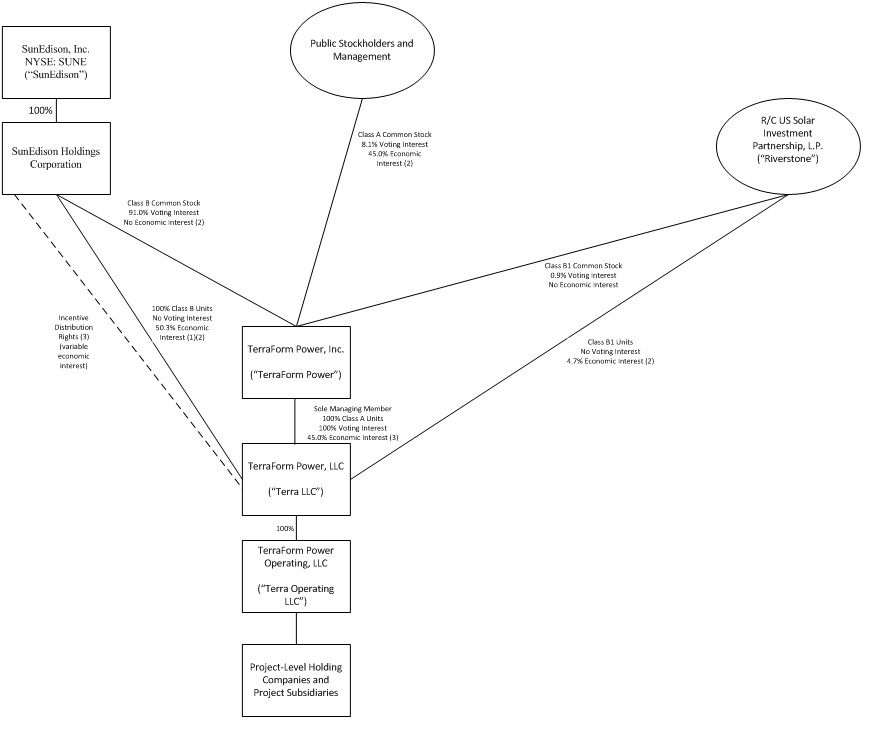
—————
(1) | SunEdison’s economic interest is subject to certain limitations on distributions to holders of Class B units during the Subordination Period and the Distribution Forbearance Period. In the future, SunEdison may receive Class B1 units and Class B1 common stock in connection with a reset of the incentive distribution right, or “IDR,” target distribution levels or sales of projects to Terra LLC. |
(2) | The economic interest of holders of Class A units, Class B units and Class B1 units, and, in turn, holders of shares of Class A common stock, is subject to the right of holders of the IDRs to receive a portion of distributions after certain distribution thresholds are met. |
(3) | IDRs represent a variable interest in distributions by Terra LLC and therefore cannot be expressed as a fixed percentage interest. All of our IDRs are currently issued to SunEdison Holdings Corporation, which is a wholly owned subsidiary of SunEdison. In connection with a reset of the target distribution levels, holders of IDRs will be entitled to receive newly-issued Class B1 units of Terra LLC and shares of our Class B1 common stock. |
7
Growth of Our Portfolio
The following table provides an overview of the growth of our portfolio from our IPO through February 20, 2015:
Weighted Average Remaining Duration of PPA (Years) | |||||||||
Nameplate Capacity (MW) (1) | Number of Sites | ||||||||
Description | |||||||||
Portfolio at IPO | 807.6 | 230 | 20 | ||||||
Acquisition of: | |||||||||
Hudson Energy | 25.3 | 101 | 15 | ||||||
Fairwinds and Crundale | 50.0 | 2 | 15 | ||||||
Capital Dynamics | 77.6 | 42 | 19 | ||||||
DG 2014 Portfolio 1 | 23.1 | 19 | 20 | ||||||
DG 2015 Portfolio 2 | 2.6 | 2 | 20 | ||||||
First Wind | 521.1 | 16 | 10 | ||||||
Total Portfolio as of February 20, 2015 (2) | 1,507.3 | 412 | 16 | ||||||
——————
(1) Nameplate capacity for solar generation facilities represents the maximum generating capacity at standard test conditions of a facility (in direct current, "dc") multiplied by our percentage ownership of that facility (disregarding any equity interests held by any non-controlling member or lessor under any sale-leaseback financing or any non-controlling interests in a partnership). Nameplate capacity for wind facilities represents the manufacturer’s maximum nameplate generating capacity of each turbine (in alternating current, "ac") multiplied by the number of turbines at a facility multiplied by our anticipated percentage ownership of that facility (disregarding any equity interests held by any tax equity investor or lessor under any sale-leaseback financing or any non-controlling interests in a partnership). Generating capacity may vary based on a variety of factors discussed elsewhere in this report.
(2) Includes 27.4 MW of solar generation facilities that are under construction.
For additional information regarding each of our solar generation facilities and wind power plants in our portfolio, see Item 2. Properties.
Our Mission
We intend to create value for our shareholders by achieving the following objectives:
• | acquiring, owning and operating clean power generation assets with long-term contracted cash flows with creditworthy counterparties; |
• | creating an attractive investment opportunity for dividend growth-oriented investors; |
• | creating a leading global clean power generation asset platform, with the capability to increase the cash flow and value of the assets over time; and |
• | gaining access to a broad investor base with a more competitive cost of capital that accelerates our long-term growth and acquisition strategy. |
Our Business Strategy
Our primary business objective is to increase the cash dividends we pay to our shareholders over time. Our strategy for achieving this objective includes the following:
Focus on long-term contracted clean power generation assets. Our portfolio has, and we expect any projects that we acquire from SunEdison or third parties will have, long-term PPAs with creditworthy counterparties. We own and operate long-term contracted clean power generation assets with proven technologies, low operating risk and stable cash flows. We believe industry trends will support significant growth opportunities for long-term contracted power in the clean power generation segment as various markets around the world reach grid parity.
Grow our business through acquisitions of contracted operating assets. We intend to acquire additional contracted clean power generation assets from SunEdison and third parties to increase our cash available for distribution. As of February 20, 2015, we have the option to acquire 3.4 GW of Call Right Projects from SunEdison as well as the right of first offer for six years with respect to certain other projects (the "ROFO Projects"). In addition, we expect to have significant opportunities to continue
8
to acquire other clean power generation assets from third-party developers, independent power producers and financial investors. We believe our knowledge of the market, third-party relationships, operating expertise and access to capital will provide us with a competitive advantage in acquiring new assets.
Attractive asset classes. Our current focus is on the solar and wind energy segments because we believe they are currently the fastest growing segments of the clean power generation industry and offer attractive opportunities to own assets and deploy long-term capital due to the predictability of their cash flow. In particular, we believe the solar and wind segments are attractive because there is no associated fuel cost risk and the relevant technologies have become highly reliable. We also believe the declining levelized costs of energy for solar and wind projects will enable these asset classes to continue to add additional MW of completed solar generation facilities and wind power plants to our portfolio and enable us to gain market share. Solar generation facilities and wind power plants also have an expected life which can exceed 30 years. In addition, the solar generation facilities and wind power plants in or to be added to our portfolio generally operate under long-term PPAs with terms of up to 25 years.
Focus on core markets with favorable investment attributes. We intend to focus on growing our portfolio through investments in markets with (i) creditworthy PPA counterparties; (ii) high clean energy demand growth rates; (iii) low political risk, stable market structures and well-established legal systems; (iv) grid parity or the potential to reach grid parity in the near term and (v) favorable government policies to encourage renewable energy power generation facilities. We believe we will have ample opportunities to acquire high-quality contracted power generation facilities in markets with these attributes. While our current focus is on solar and wind generation facilities in the United States, Canada, the United Kingdom and Chile, we will selectively consider acquisitions of contracted clean generation sources in other countries.
Maintain sound financial practices. We intend to maintain our commitment to disciplined financial policies and a balanced capital structure. Our financial practices include (i) a risk and credit policy focused on transacting with creditworthy counterparties, (ii) a financing policy focused on achieving an optimal capital structure through various capital formation alternatives to minimize interest rate and refinancing risks, and (iii) a dividend policy that is based on distributing the cash available for distribution generated by our project portfolio (after deducting appropriate reserves for our working capital needs and the prudent conduct of our business). Our initial dividend was established based on our targeted payout ratio of approximately 85% of projected cash available for distribution.
Our Competitive Strengths
We believe our key competitive strengths include:
Scale and diversity. Our portfolio provides us with significant diversification in terms of market segment, counterparty and geography. Our portfolio as of February 20, 2015 includes both solar generation facilities and wind power plants with an aggregate of 1,507.3 MW of nameplate capacity, consisting of 1,223.4 MW of nameplate capacity from utility-scale power plants and 283.9 MW of nameplate capacity of commercial, industrial, government and residential customers. Of the solar generation facilities and wind power plants in our portfolio, no single power generation facility accounts for more than 20% of our total MW nameplate capacity. Our diversification reduces our operating risk profile and our reliance on any single market or segment. We believe our scale and geographic diversity improve our business development opportunities through enhanced industry relationships, reputation and understanding of regional power market dynamics. Over time, as we continue to acquire projects and power generation assets from SunEdison and third parties, we expect to become further diversified.
Stable, high-quality cash flow. Our portfolio of solar generation facilities and wind power plants provides us with a stable, predictable cash flow profile, as will the Call Right Projects we have the option to acquire from SunEdison and the clean power generations assets we acquire from third parties in the future. We sell the electricity, green attributes, and other ancillary services generated by our solar generation facilities and wind power plants under long-term PPAs and related agreements with creditworthy counterparties. The weighted average (based on MW) remaining life of our PPAs is approximately 16 years, as of February 20, 2015. The weighted average credit rating (based on nameplate capacity) of the counterparties to the PPAs for the solar generation facilities and wind power plants in our portfolio is A-/A3, which includes only those counterparties that are rated by S&P, Moody’s, or both (representing approximately 90% of the total MW of our portfolio). Based on our current portfolio, we do not expect to pay significant federal income taxes for at least the next several years.
Newly constructed portfolio. We benefit from a portfolio of relatively newly constructed assets, with most of the solar generation facilities and wind power plants in our portfolio having achieved commercial operations within the past three years. The solar generation facilities and wind power plants in our portfolio and the Call Right Projects we have the option to acquire from SunEdison utilize proven and reliable technologies primarily provided by leading equipment manufacturers and, as a result, we expect to achieve high generation availability and predictable maintenance capital expenditures.
9
Relationship with SunEdison. We believe our relationship with SunEdison provides us with significant benefits, including the following:
• | Strong asset development and acquisition track record. As of December 31, 2014, SunEdison has constructed or acquired solar power generation assets with an aggregate nameplate capacity of 2.4 GW and was constructing additional solar power generation assets expected to have an aggregate nameplate capacity of approximately 467 MW. SunEdison has been one of the top five developers and installers of solar energy facilities in the world in each of the past four years based on megawatts installed. In addition, SunEdison had a 5.1 GW pipeline of development stage solar projects as of December 31, 2014. SunEdison’s operating history demonstrates its organic project development capabilities and its ability to work with third-party developers and asset owners in our target markets. We believe SunEdison’s relationships, knowledge and employees will continue to facilitate our ability to acquire operating solar generation facilities and wind power plants from SunEdison and unaffiliated third parties in our target markets. |
• | Project financing experience. We believe SunEdison has demonstrated a successful track record of sourcing long duration capital to fund project acquisitions, development and construction. Since 2005, SunEdison has raised long-term, non-recourse project and tax equity financing for hundreds of projects. We expect that we will continue to realize significant benefits from SunEdison’s financing and structuring expertise as well as their relationships with financial institutions and other providers of capital. |
• | Management and operations expertise. We have access to the significant resources of SunEdison to support the growth strategy of our business. As of December 31, 2014, SunEdison had over 5.0 GW of projects under management across 20 countries. In addition, SunEdison maintains four renewable energy operation centers to service assets under management. SunEdison’s operational and management experience helps ensure that our facilities are monitored and maintained to maximize their cash generation. We will also benefit from First Wind’s operational and management expertise as the First Wind team has joined SunEdison. Up to the date of the First Wind acquisition (as defined below), First Wind Holdings, LLC (together with its subsidiaries, "First Wind") had constructed or acquired wind power generation assets with an aggregate nameplate capacity of 1.5 GW and, as of December 31, 2014, was constructing additional wind power generation assets expected to have an aggregate nameplate capacity of approximately 348 MW. |
Dedicated management team. Under the Management Services Agreement, SunEdison has provided us with a dedicated team of professionals to serve as our executive officers and other key officers. Our officers have considerable experience in developing, acquiring and operating clean power generation assets, with an average of over nine years of experience in the sector. For example, our President and Chief Executive Officer served as the President of SunEdison’s solar energy business from November 2009 to March 2013. Our management team also has access to the other significant management resources of SunEdison to support the operational, financial, legal and regulatory aspects of our business.
Recent Events
Equity Offerings
Initial Public Offering
On July 23, 2014, we closed our IPO of 23,074,750 shares of our Class A common stock, including 3,009,750 shares sold pursuant to the underwriters' overallotment option. Concurrently with our IPO, we completed a private placement (the "IPO Private Placement") of an aggregate of 2,600,000 shares of our Class A common stock at the IPO price to Altai Capital Master Fund, Ltd. ("Altari") and Everstream Opportunities Fund I, LLC ("Everstream"). In addition, on July 23, 2014, as consideration for the acquisition of the Mt. Signal power plant from Silver Ridge Power, LLC ("Silver Ridge Power") at an aggregate purchase price of $292.0 million, Terra LLC issued to Silver Ridge Power 5,840,000 Class B units (and we issued a corresponding number of shares of Class B common stock) and 5,840,000 Class B1 units (and we issued a corresponding number of shares of Class B1 common stock). Silver Ridge Power distributed the Class B shares and units to SunEdison and the Class B1 shares and units to R/C US Solar Investment Partnership, L.P. ("Riverstone"), the owners of Silver Ridge Power.
We received $533.5 million of net proceeds from our IPO (including the net proceeds from the underwriters exercise in full of their option to purchase additional shares), after deducting underwriting discounts, commissions and offering expenses. We received $65.0 million of net proceeds from the IPO Private Placements. We used $159.2 million of these net proceeds to repurchase Class B common stock and Class B units from SunEdison.
10
Acquisition Private Placement
On November 26, 2014, we completed the sale of a total of 11,666,667 shares of our Class A common stock in a private placement (the “Acquisition Private Placement”) to certain eligible investors for a net purchase price of $337.8 million. We used the net proceeds to repay a portion of amounts outstanding under our Term Loan among other things. In connection with the Acquisition Private Placement, we entered into a registration rights agreement with the purchasers pursuant to which we filed a registration statement with the SEC covering the resale of the purchased shares. The registration statement for these shares became effective on January 8, 2015.
Follow-on Public Offering
On January 22, 2015, we completed the sale of a total of 13,800,000 shares of our Class A common stock to the public in a registered offering including 1,800,000 shares sold pursuant to the underwriters’ overallotment option (the "Follow-on Public Offering"). We received net proceeds of $390.6 million from the offering, $50.9 million of which we used to repurchase Class B common stock and Class B units from SunEdison and the remainder of which we used to pay for part of the purchase price of the First Wind assets (as described below) and to repay remaining amounts outstanding under our Term Loan among other things.
Acquisitions
Acquisition of Hudson Energy
On November 4, 2014, we acquired the operating portfolio of Hudson Energy Solar Corporation, a solar generation facility developer that owned and operated solar assets for schools, residential, and commercial and industrial customers. The purchase price was $32.8 million, net of acquired cash, and the assumption of $24.5 million of project-level debt. The portfolio we acquired consists of operational distributed generation facilities located in Massachusetts, New Jersey and Pennsylvania that have a total nameplate capacity of 25.3 MW. The acquisition was funded with cash on hand.
Acquisition of Fairwinds and Crundale
On November 4, 2014, we completed the acquisition of two Call Right Projects, Fairwinds and Crundale, from SunEdison. The two utility-scale solar generation facilities, with a total nameplate capacity of 50.0 MW, are located in the United Kingdom and achieved commercial operations in September 2014 and October 2014, respectively. The purchase price was $32.2 million in cash and the assumption of $63.7 million of project-level debt. We expect to repay all of the outstanding project-level debt in the second quarter of 2015. Fairwinds and Crundale were our first Call Right Project acquisitions from SunEdison. This acquisition was funded with cash on hand.
Acquisition of Capital Dynamics
On December 18, 2014, we completed the acquisition of 77.6 MW of operating solar generation facilities located in California, Massachusetts, New Jersey, New York and Pennsylvania from Capital Dynamics U.S. Solar Energy Fund, L.P. and its affiliates (the “Capital Dynamics Acquisition”). The purchase price for the Capital Dynamics Acquisition was $256.7 million, net of acquired cash, and was funded through borrowings under our Term Loan.
Distributed Generation Acquisitions
In December 2014, we acquired the DG 2014 Portfolio 1 and the DG 2015 Portfolio 2, consisting of 25.7 MW of solar generation facilities valued at $50.6 million, from subsidiaries of SunEdison in a series of transactions. The acquired facilities were Call Right Projects.
Acquisition of First Wind
On January 29, 2015, we completed the acquisition from First Wind of 521.1 MW of operating power assets, including 500.0 MW of utility-scale wind power plants and 21.1 MW of solar generation facilities, located in Maine, New York, Hawaii, Vermont and Massachusetts. In addition, SunEdison purchased First Wind's development platform, pipeline and projects in development, including over 1.6 GW of wind and solar generation assets to which we have been granted call rights pursuant to the Intercompany Agreement, as described below. The total consideration paid by us was $830.0 million, net of acquired cash, plus additional expenses incurred through the refinancing of certain existing indebtedness, the termination of certain swaps, and debt breakage fees. The acquisition was funded with the net proceeds from the Green Bond offering on January 28, 2015 and the Follow-on Public Offering.
11
In connection with the First Wind acquisition, we and SunEdison entered into an agreement (the "Intercompany Agreement") which sets forth an agreement among the parties with respect to, among other things, (i) contributions between, and allocations among, the parties and their respective affiliates of certain costs, expenses, indemnity payments and purchase price adjustments under the purchase and sale agreement for the First Wind acquisition and certain excess capital expenditures and operation and maintenance costs for operating power plants following the closing of the First Wind acquisition; (ii) the grant by SunEdison to us of certain additional Call Right Projects; and (iii) the modification of certain terms of the Interest Payment Agreement.
Green Bond Offering and Long-term Debt Refinancing
Green Bond Offering
On January 28, 2015, through our indirect subsidiary, TerraForm Power Operating, LLC ("Terra Operating LLC") we issued $800.0 million of 5.875% senior notes due 2023 at a price of 99.214% (the "Senior Notes"). We used the net proceeds from the offering, together with a portion of the net proceeds from the Follow-on Public Offering, to fund the full purchase price of the First Wind acquisition.
The Senior Notes are senior obligations of Terra Operating LLC and are guaranteed by Terra LLC and each of Terra Operating LLC's existing and future subsidiaries that guarantee our New Revolver (as defined herein), subject to certain exceptions.
Term Loan and Revolving Credit Facility Refinancing
On January 28, 2015, we repaid our existing term loan facility (the "Term Loan") in full and replaced our existing revolving credit facility (the "Revolver") with a new $550.0 million revolving credit facility (the "New Revolver"). The New Revolver is available for revolving loans and letters of credit. Terra Operating LLC is permitted to increase commitments under the New Revolver by $175.0 million to a total of $725.0 million in the aggregate, subject to customary closing conditions. The New Revolver matures on the five-year anniversary of the closing date of such facility. Each of Terra Operating LLC’s existing and subsequently acquired or organized domestic restricted subsidiaries (excluding non-recourse subsidiaries) and Terra LLC are or will become guarantors under the New Revolver.
Our Portfolio
Our portfolio consists of solar generation facilities and wind power plants located in the United States and its unincorporated territories, Canada, the United Kingdom and Chile with total nameplate capacity of 1,507.3 MW as of February 20, 2015. These power generation facilities generally have long-term PPAs with creditworthy counterparties. Our PPAs have a weighted average (based on MW) remaining life of 16 years. We intend to further expand and diversify our current portfolio by acquiring utility-scale, distributed and residential assets located in the United States, Canada, the United Kingdom, Chile and certain other jurisdictions, each of which we expect will also have a long-term PPA with a creditworthy counterparty. Growth in our portfolio will be driven by our relationship with SunEdison, including access to its project pipeline, and by our access to unaffiliated third party developers and owners of clean generation assets in our core markets.
12
The following tables list our solar generation facilities and wind power plants that comprise our portfolio as of February 20, 2015:
Facility Name | Location | Facility Type | COD (1) | Nameplate Capacity (MW) (2) | # of Sites | Counterparty | Counterparty Credit Rating(3) | Weighted Average Remaining Duration of PPA (Years) (4) | ||
Distributed Generation: | ||||||||||
CD DG Portfolio | U.S. | Solar | 2011-Q4 2014 | 77.6 | 42 | Various utilities and commercial and governmental entities | A-, A3 | 19 | ||
U.S. Projects 2014 | U.S. | Solar | Q2 2014-Q1 2015 | 45.4 | 41 | Various utilities, municipalities and commercial entities | A+, A1 | 20 | ||
HES Portfolio | U.S. | Solar | 2011-Q2 2014 | 25.3 | 101 | Various commercial, residential and governmental entities | A+, A1 | 15 | ||
DG 2014 Portfolio 1 | U.S. | Solar | Q4 2014-Q2 2015 | 23.1 | 19 | Various commercial and governmental entities | A+, A1 | 20 | ||
MA Solar | U.S | Solar | 2014 | 21.1 | 4 | Various municipalities and universities | A+, A1 | 24 | ||
Summit Solar Projects | U.S. | Solar | 2007-Q3 2014 | 19.6 | 50 | Various commercial and governmental entities | A, A2 | 13 | ||
Summit Solar Projects | Canada | Solar | 2011-2013 | 3.8 | 7 | Ontario Power Authority | A-, Aa2 | 17 | ||
Enfinity | U.S. | Solar | 2011-Q4 2013 | 15.7 | 16 | Various commercial, residential and governmental entities | A, A2 | 17 | ||
U.S. Projects 2009-2013 | U.S. | Solar | 2009-Q4 2013 | 15.3 | 73 | Various commercial and governmental entities | BBB+, Baa1 | 15 | ||
California Public Institutions | U.S. | Solar | Q4 2013-Q3 2014 | 13.5 | 5 | State of California Department of Corrections and Rehabilitation | A+, A3 | 19 | ||
MA Operating | U.S. | Solar | 2012-Q4 2013 | 12.2 | 4 | Various municipalities | A+, A1 | 19 | ||
SunE Solar Fund X | U.S. | Solar | 2010-2011 | 8.8 | 12 | Various utilities, municipalities and commercial entities | AA, Aa2 | 16 | ||
DG 2015 Portfolio 2 | U.S. | Solar | Q1 2015 | 2.6 | 2 | Various municipalities | AA-, Aa3 | 20 | ||
Distributed Generation Subtotal | 283.9 | 376 | 18 | |||||||
13
Facility Name | Location | Facility Type | COD (1) | Nameplate Capacity (MW) (2) | # of Sites | Counterparty | Counterparty Credit Rating(3) | Weighted Average Remaining Duration of PPA (Years) (4) | ||
Utility-scale: | ||||||||||
Mt. Signal | U.S. | Solar | Q2 2014 | 265.8 | 1 | San Diego Gas & Electric | A, A1 | 24 | ||
Regulus Solar | U.S. | Solar | Q4 2014 | 81.6 | 1 | Southern California Edison | BBB+, A2 | 20 | ||
North Carolina Portfolio | U.S. | Solar | Q4 2014-Q1 2015 | 26.4 | 4 | Duke Energy Progress | BBB+, A1 | 15 | ||
Atwell Island | U.S. | Solar | Q1 2013 | 23.5 | 1 | Pacific Gas & Electric Company | BBB, A3 | 23 | ||
Nellis (5) | U.S. | Solar | 2007 | 14.0 | 1 | U.S. Government (PPA); Nevada Power Company (RECs) | AA+, Aaa, BBB+, Baa2 | 13 | ||
Alamosa | U.S. | Solar | 2007 | 8.2 | 1 | Xcel Energy | A-, A3 | 13 | ||
CalRENEW-1 | U.S. | Solar | 2010 | 6.3 | 1 | Pacific Gas & Electric Company | BBB, A3 | 15 | ||
Marsh Hill | Canada | Solar | Q2 2015 | 18.7 | 1 | Ontario Power Authority | A-, Aa2 | 20 | ||
SunE Perpetual Lindsay | Canada | Solar | Q4 2014 | 15.5 | 1 | Ontario Power Authority | A-, Aa2 | 20 | ||
Stonehenge Q1 | U.K. | Solar | Q1 2014 | 41.2 | 3 | Statkraft AS | A-, Baa1 | 14 | ||
Fairwinds and Crundale | U.K. | Solar | Q4 2014 | 50.0 | 2 | Statkraft AS | A-, Baa1 | 15 | ||
Stonehenge Operating | U.K. | Solar | Q1 2013-Q2 2013 | 23.6 | 3 | Total Gas & Power Limited | NR, NR | 13 | ||
Says Court | U.K. | Solar | Q1 2014 | 19.8 | 1 | Statkraft AS | A-, Baa1 | 14 | ||
Crucis Farm | U.K. | Solar | Q3 2014 | 16.1 | 1 | Statkraft AS | A-, Baa1 | 14 | ||
Norrington | U.K. | Solar | Q2 2014 | 11.2 | 1 | Statkraft AS | A-, Baa1 | 14 | ||
CAP (6) | Chile | Solar | Q1 2014 | 101.6 | 1 | Compania Minera del Pacifico, S.A. | BBB-, NR | 19 | ||
Cohocton | U.S | Wind | 2009 | 125.0 | 1 | Citigroup Energy | A-, Baa2 | 6 | ||
Rollins | U.S | Wind | 2011 | 60.0 | 1 | Central Maine Power; Bangor Hydro Electric | BBB+, A3; NR, NR | 17 | ||
Stetson I | U.S | Wind | 2009 | 57.0 | 1 | Exelon Generation Company | BBB, Baa2 | 5 | ||
Mars Hill | U.S | Wind | 2007 | 42.0 | 1 | New Brunswick Power | A+, Aa2 | 1 | ||
Sheffield | U.S | Wind | 2011 | 40.0 | 1 | City of Burlington; Vermont Electric Cooperative; Washington Electric Cooperative | NR, NR; NR,NR, NR; NR, | 17 | ||
Bull Hill | U.S | Wind | 2012 | 34.5 | 1 | NSTAR | A-, Baa1 | 13 | ||
Kaheawa Wind Power I | U.S | Wind | 2006 | 30.0 | 1 | Maui Electric Company | BBB-, NR | 12 | ||
Kahuku | U.S | Wind | 2011 | 30.0 | 1 | Hawaiian Electric Company | BBB-, Baa1 | 16 | ||
Stetson II | U.S | Wind | 2010 | 25.5 | 1 | Exelon Generation Company; Harvard University | BBB, Baa2; NR, NR | 11 | ||
Kaheawa Wind Power II | U.S | Wind | 2012 | 21.0 | 1 | Maui Electric Company | BBB-, NR | 18 | ||
Steel Winds I | U.S | Wind | 2007 | 20.0 | 1 | Morgan Stanley Capital Group | A-, Baa2 | 5 | ||
U.S | Wind | 2012 | 15.0 | 1 | Morgan Stanley Capital Group | A-, Baa2 | 5 | |||
Utility-scale Subtotal | 1,223.4 | 36 | 16 | |||||||
Total Owned as of February 20, 2015 | 1,507.3 | 412 | 16 | |||||||
Total Owned as of December 31, 2014 | 986.2 | 396 | 19 | |||||||
Acquired Subsequent to December 31, 2014 | 521.1 | 16 | 10 | |||||||
Total Owned as of February 20, 2015 | 1,507.3 | 412 | 16 | |||||||
———
(1) Represents actual or anticipated COD, as applicable, unless otherwise indicated.
14
(2) Nameplate capacity for solar generation facilities represents the maximum generating capacity at standard test conditions of a facility (in dc) multiplied by our percentage ownership of that facility (disregarding any equity interests held by any tax equity investor or lessor under sale leaseback financing or of any non-controlling interests in a partnership). Nameplate capacity for wind facilities represents the manufacturer’s maximum nameplate generating capacity of each turbine (in ac) multiplied by the number of turbines at a facility multiplied by our anticipated percentage ownership of that facility (disregarding any equity interests held by any tax equity investor or lessor under any sale-leaseback financing or of any non-controlling interests in a partnership). Generating capacity may vary based on a variety of factors discussed elsewhere in this report.
(3) For our distributed generation solar facilities with one counterparty and for our utility-scale power plants, the counterparty credit rating reflects the counterparty's or guarantor's issuer credit ratings issued by S&P and Moody's. For distributed generation solar facilities with more than one counterparty, the counterparty credit rating represents a weighted average (based on nameplate capacity) credit rating of the power generation asset's counterparties that are rated by S&P, Moody's or both. The percentage of counterparties (based on nameplate capacity) that are rated by S&P, Moody’s or both of each of our distributed generation projects is as follows:
• | CD DG Portfolio: 99% |
• | U.S. Projects 2014: 82% |
• | HES Portfolio: 54% |
• | DG 2014 Portfolio 1: 59% |
• | Summit Solar Projects (U.S.): 21% |
• | Summit Solar Projects (Canada): 100% |
• | Enfinity: 85% |
• | U.S. Projects 2009-2013: 35% |
• | California Pacific Institutions: 100% |
• | MA Operating: 100% |
• | SunE Solar Fund X: 89% |
• | DG 2015 Portfolio 2: 38% |
• | MA Solar: 39% |
(4) Calculated as of February 20, 2015. For distributed generation solar facilities, the number represents a weighted average (based on nameplate capacity) remaining duration. For Nellis, the number represents the remaining duration of the REC contract.
(5) The REC contract for the Nellis plant, which represents over 90% of the expected revenues, has a remaining duration of approximately 13 years. The PPA of the Nellis plant has an indefinite term subject to one-year reauthorizations.
(6) For Compania Minera del Pacifico, the PPA counterparty has the right, under certain circumstances, to purchase up to 40% of the project equity from us pursuant to a predetermined purchase price formula.
Call Right Projects
As of February 20, 2015, we have the option to acquire 3.4 GW of Call Right Projects. We entered into the Support Agreement with SunEdison in connection with our IPO, which requires SunEdison to offer us additional qualifying projects from its development pipeline by the end of 2016 that are projected to generate an aggregate of at least $175.0 million of cash available for distribution, during the first 12 months following the qualifying project’s respective COD. As of February 20, 2015, the Call Right Projects that are specifically identified pursuant to the Support Agreement have a total nameplate capacity of 1.8 GW. In addition, in connection with the First Wind acquisition, we entered into an Intercompany Agreement with SunEdison, pursuant to which we have been granted additional call rights with respect to certain projects in the First Wind pipeline, which are expected to represent an additional 1.6 GW of wind and solar generation assets. These additional Call Right Projects pursuant to the Intercompany Agreement do not count towards SunEdison's $175.0 million CAFD commitment.
As of December 31, 2014, SunEdison reported 467 MW of renewable energy projects under construction and
a 5.1 GW development stage pipeline of renewable energy projects. We expect to continue to benefit from the growth of SunEdison's project pipeline through the Call Right Projects we have been granted the option to acquire pursuant to the Support Agreement and the Intercompany Agreement. The following table summarizes the Call Right Projects that are identified pursuant to the Support Agreement and the Intercompany Agreement as of February 20, 2015:
15
Project Name | Location | Project Type | Estimated Acquisition Date (1) | Nameplate Capacity (MW) (2) | # of Sites | |||||||
U.K. projects #1-13 | U.K. | Solar | Q1 2015 - Q2 2015 | 181.9 | 13 | |||||||
U.S. DG 2015 projects | U.S. | Solar | Q1 2015 - Q4 2015 | 126.5 | 136 | |||||||
Ontario 2015 projects | Canada | Solar | Q2 2015 - Q2 2016 | 15.1 | 42 | |||||||
U.S. Western project #1 | U.S. | Solar | Q2 2016 | 156.0 | 1 | |||||||
U.S. AP North Lake I | U.S. | Solar | Q2 2015 | 24.1 | 1 | |||||||
U.S. Bluebird | U.S. | Solar | Q2 2015 | 7.7 | 1 | |||||||
Chile project #1 | Chile | Solar | Q4 2015 | 41.7 | 1 | |||||||
Seven Sisters | U.S. | Solar | Q3 2015 | 22.6 | 7 | |||||||
U.S. River Mountains Solar | U.S. | Solar | Q2 2016 | 18.0 | 1 | |||||||
U.S. DG 2016 projects | U.S. | Solar | Q1 2016 - Q4 2016 | 107.3 | 28 | |||||||
Chile project #2 | Chile | Solar | Q1 2016 | 94.0 | 1 | |||||||
U.S. Kingfisher | U.S. | Solar | Q4 2015 | 8.2 | 1 | |||||||
U.S. Island project #1 | U.S. | Solar | Q2 2016 | 68.0 | 1 | |||||||
U.S. Utah project #1 | U.S. | Solar | Q3 2016 | 163.0 | 2 | |||||||
U.S. Southwest project #1 | U.S. | Solar | Q3 2016 | 99.2 | 1 | |||||||
U.S. California project #1 | U.S. | Solar | Q3 2016 | 55.1 | 1 | |||||||
Four Brothers | U.S. | Solar | Q4 2016 | 419.2 | 4 | |||||||
Tenaska Imperial Solar Energy Center West | U.S. | Solar | Q4 2016 | 72.5 | 1 | |||||||
Kawailoa Solar | U.S. | Solar | Q4 2016 | 65.3 | 1 | |||||||
Waipio | U.S. | Solar | Q4 2016 | 64.2 | 1 | |||||||
U.S. California project #2 | U.S. | Solar | Q4 2016 | 46.2 | 1 | |||||||
Mililani Solar I | U.S. | Solar | Q4 2016 | 27.3 | 1 | |||||||
Mililani Solar II | U.S. | Solar | Q4 2016 | 20.1 | 1 | |||||||
U.S. California projects #3-4 | U.S. | Solar | 2016-2019 | 527.6 | 2 | |||||||
South Plains | U.S. | Wind | Q4 2015 | 200.0 | 1 | |||||||
South Plains II | U.S. | Wind | Q4 2015 | 150.0 | 1 | |||||||
Oakfield | U.S. | Wind | Q4 2015 | 147.6 | 1 | |||||||
Bingham | U.S. | Wind | Q4 2016 | 184.8 | 1 | |||||||
Hancock | U.S. | Wind | Q4 2016 | 51.0 | 1 | |||||||
Route 66 II | U.S. | Wind | 2017 | 100.0 | 1 | |||||||
Weaver | U.S. | Wind | 2017 | 72.6 | 1 | |||||||
Rattlesnake | U.S. | Wind | 2017 | 62.0 | 1 | |||||||
Bowers | U.S. | Wind | 2017 | 48.0 | 1 | |||||||
Total Call Rights Projects | 3,446.7 | 259 | ||||||||||
Total 2015 Projects | 925.2 | 205 | ||||||||||
Total 2016 Projects | 2,238.9 | 50 | ||||||||||
Total 2017 Projects | 282.6 | 4 | ||||||||||
Total Call Right Projects | 3,446.7 | 259 | ||||||||||
————
(1) | Represents date of anticipated acquisition. The acquisition date is subject to change, including to preserve the project’s eligibility for federal governmental incentives including ITCs or PTCs. |
(2) | Nameplate capacity for solar projects represents the maximum generating capacity at standard test conditions of a facility (in dc) multiplied by our percentage ownership of that facility (disregarding any equity interests held by any tax equity investor or lessor under any sale-leaseback financing or any non-controlling interests in a partnership). Nameplate capacity for wind facilities represents the manufacturer’s maximum nameplate generating capacity of each turbine (in ac) multiplied by the number of turbines at a facility multiplied by our anticipated percentage ownership of that facility (disregarding any equity interests held by any tax equity investor or lessor under any sale-leaseback financing or any non-controlling interests in a partnership) .Generating capacity may vary based on a variety of factors discussed elsewhere in this report. |
16
Seasonality
The amount of electricity our solar power generation facilities produce is dependent in part on the amount of sunlight, or irradiation, where the assets are located. Because shorter daylight hours in winter months results in less irradiation, the generation of particular assets will vary depending on the season. Additionally, to the extent more of our power generation facilities are located in either the northern or southern hemisphere, overall generation of our entire solar asset portfolio could be impacted by seasonality. While we expect seasonal variability to occur, we expect aggregate seasonal variability to decrease if geographic diversity of our portfolio between the northern and southern hemisphere increases. We expect our current solar portfolio’s power generation to be at its lowest during the fourth quarter of each year as our assets are geographically concentrated in the northern hemisphere. Therefore, we expect our fourth quarter solar revenue generation to be lower than other quarters.
Similarly, the electricity produced and revenues generated by a wind energy project depend heavily on wind conditions, which are variable and difficult to predict. Operating results for projects vary significantly from period to period depending on the windiness during the periods in question. Because our wind power plants are located in geographies with different profiles, there is some flattening of the seasonal variability associated with each individual power plant’s generation, and we expect that as the fleet expands the effect of such wind resource variability may be favorably impacted, although we cannot guarantee that we will purchase or develop wind projects that will achieve such results in part or at all. Historically, our wind production is greater in the first and fourth quarters which can partially offset the lower solar revenue expected to be generated in the fourth quarter. We intend to reserve a portion of our cash available for distribution and maintain a revolving credit facility in order to, among other things, facilitate the payment of dividends to our stockholders. As a result, we do not expect seasonality to have a material effect on the amount of our quarterly dividends.
Competition
Power generation is a capital-intensive business with numerous industry participants. We compete to acquire new solar generation facilities and wind power plants with renewable energy developers who retain renewable energy power generation asset ownership, independent power producers, financial investors and certain utilities. We compete to supply energy to our potential customers with utilities and other providers of distributed generation. We compete with other solar and wind developers, independent power producers and financial investors based on our competitive cost of capital, development expertise, pipeline, global footprint and brand reputation. We believe that we compete favorably with our competitors based on these factors in the regions we service. To the extent we re-contract power generation facilities upon termination of a PPA or sell electricity into the merchant power market, we compete with traditional utilities primarily based on low cost of capital, generation located at customer sites, operations and management expertise, price (including predictability of price), green attributes of power, the ease by which customers can switch to electricity generated by our solar generation facilities and wind power plants and our open architecture approach to working within the industry, which facilitates collaboration and power generation asset acquisitions.
Environmental Matters
We are subject to environmental laws and regulations in the jurisdictions in which we own and operate solar generation facilities and wind power plants. These laws and regulations generally require that governmental permits and approvals be obtained both before construction and during operation of these power generation assets. We incur costs in the ordinary course of business to comply with these laws, regulations and permit requirements. While we do not expect that the costs of compliance to generally have a material impact on our business, financial condition or results of operations, it is possible that as the size of our portfolio grows we may become subject to new or modified regulatory regimes that may impose unanticipated requirements on our business as a whole that were not anticipated with respect to any individual project. We also do not anticipate material capital expenditures for environmental controls for our solar generation facilities and wind power plants in the next several years. These laws and regulations frequently change and often become more stringent, or subject to more stringent interpretation or enforcement, and therefore future changes could require us to incur materially higher costs which could have a material adverse impact on our financial performance or results of operations.
Regulatory Matters
With the exception of the Mt. Signal, Regulus and certain of the power plants we acquired as part of the First Wind acquisition, all of the U.S. renewable energy solar generation facilities and wind power plants in our portfolio are QFs as defined under the Public Utilities Regulatory Policies Act of 1978, as amended ("PURPA"). Depending upon the power production capacity of the renewable energy power generation asset in question, our QFs and their immediate project company owners may be entitled to various exemptions from ratemaking and certain other regulatory provisions of the Federal Power Act, as amended ("FPA"), from the books and records access provisions of the Public Utilities Holding Company Act of 2005, as amended ("PUHCA"), and from state organizational and financial regulation of electric utilities.
17
All of the solar generation facility companies that we own outside of the United States are Foreign Utility Companies, as defined in PUHCA. They are exempt from state organizational and financial regulation of electric utilities and from most provisions of PUHCA and FPA.
The owners of each of the Mt. Signal project (the "Mt. Signal ProjectCo"), the Regulus project (the "Regulus ProjectCo") and certain of our wind projects are Exempt Wholesale Generator ("EWGs") as defined in PUHCA (the "EWG ProjectCos"). Status as an EWG exempts them and us (for purposes of our ownership of each such company) from the federal books and access provisions of PUHCA. Each of the Mt. Signal ProjectCo, the Regulus ProjectCo and the EWG ProjectCos has obtained “market-based rate authorization” and associated blanket authorizations and waivers from the Federal Energy Regulation Commission ("FERC") under the FPA, which allows it to sell electric energy, capacity and ancillary services at wholesale at negotiated, market-based rates, instead of cost-of-service rates, as well as waivers of, and blanket authorizations under, certain FERC regulations that are commonly granted to market based rate sellers, including blanket authorizations to issue securities.
The project company owners of all U.S. solar generation facilities or wind power plants acquired by us that have a net power production capacity greater than 20 MW (AC) will similarly need to obtain market-based rate authorization prior to commencement of the sales of test energy from their power generation facilities.
Under Section 203 of the FPA, pre-approval by FERC is generally required for any direct or indirect acquisition of control over, or merger or consolidation with, a “public utility” or in certain circumstances an “electric utility company,” as such terms are used for purposes of FPA Section 203. FERC generally presumes that the acquisition of direct or indirect voting power of 10% or more in an entity results in a change in control of such entity. Violation of Section 203 can result in civil or criminal liability under the FPA, including civil penalties of up to $1 million per day per violation, and the possible imposition of other sanctions by FERC, including the potential voiding of an acquisition made without prior authorization under Section 203. Depending upon the circumstances, liability for violation of FPA Section 203 may attach to a public utility, the parent holding company of a public utility or an electric utility company, or to an acquiror of the voting securities of such holding company or its public utility or electric utility company subsidiaries.
Our renewable energy solar generation facilities and wind power plants are also subject to compliance with the mandatory reliability standards developed by the North American Electric Reliability Corporation and approved by FERC under the FPA. In the United Kingdom, Canada and Chile, we are also generally subject to the regulations of the relevant energy regulatory agencies applicable to all producers of electricity including, in certain cases, the relevant feed-in tariff ("FIT") regulations (including the FIT rates); however we are generally not subject to regulation as a traditional public utility, i.e., regulation of our financial organization and rates other than FIT rates.
As the size of our portfolio grows we may become subject to new or modified regulatory regimes that may impose unanticipated requirements on our business as a whole that were not anticipated with respect to any individual project. For example, the NERC rules impose fleetwide cyber security requirements regarding electronic and physical access to generating facilities in order to protect system reliability; such requirements expand in scope after the point at which a single owner has more than 1,500 MW of reliability assets under its control. Such future changes in our regulatory status or the makeup of our fleet could require us to incur materially higher costs which could have a material adverse impact on our financial performance or results of operations.
Government Incentives
Each of the United States, Canada, the United Kingdom and Chile has established various incentives and financial mechanisms to reduce the cost of solar and wind energy and to accelerate the adoption of solar and wind energy. These incentives include tax credits, cash grants, tax abatements, rebates and RECs or green certificates and net energy metering
programs. These incentives help catalyze private sector investments in solar energy and efficiency measures. Set forth below is a summary of the various programs and incentives that we expect will apply to our business.
United States
Federal Government Support for Renewable Energy
The federal government provides an uncapped investment tax credit, or “Federal ITC,” that allows a taxpayer to claim a credit of 30% of qualified expenditures for a residential or commercial solar generation facility that is placed in service on or before December 31, 2016. This credit is scheduled to be reduced to 10% for assets placed in service on or after January 1, 2017. Wind power plants that began construction prior to the end of 2014 are eligible for the 30% Federal ITC or, in lieu of the Federal
18
ITC, a Federal PTC based upon the amount of electricity produced at the facility that is sold to an unrelated person. The Federal PTC rate for 2014 is $0.023/kWh. The federal government also provides accelerated depreciation for eligible power generation facilities. Based on our portfolio of assets, we will benefit from Federal ITC, Federal PTC and an accelerated tax depreciation schedule, and we will rely on financing structures that monetize a substantial portion of these benefits and provide financing for our solar generation facilities at the lowest cost of capital.
State Government Support for Renewable Energy
Many states offer a personal and/or corporate investment or production tax credit for renewable power generation facilities, which is additive to the Federal ITC. Further, more than half of the states, and many local jurisdictions, have established property tax incentives for renewable power generation facilities that include exemptions, exclusions, abatements and credits. We expect that certain of our solar generation facilities and wind power plants will be financed with a tax equity financing structure, whereby the tax equity investor is a member holding equity in the limited liability company that directly or indirectly owns the solar generation facility or wind power plant and receives the benefits of various tax credits.
Many state governments, utilities, municipal utilities and co-operative utilities offer a rebate or other cash incentive for the installation and operation of a renewable power generation facility for energy efficiency measures. Capital costs or “up-front” rebates provide funds to solar customers based on the cost, size or expected production of a customer’s solar and wind power generation facility. Performance-based incentives provide cash payments to a system owner based on the energy generated by their solar generation facility during a pre-determined period, and they are paid over that time period. Some states also have established FIT programs that are a type of performance-based incentive where the system owner-producer is paid a set rate for the electricity their system generates over a set period of time.
Forty-three states have a regulatory policy known as net metering. Net metering typically allows our customers to interconnect their on-site solar generation facilities to the utility grid and offset their utility electricity purchases by receiving a bill credit at the utility’s retail rate for energy generated by their solar generation facility in excess of electric load that is exported to the grid. At the end of the billing period, the customer simply pays for the net energy used or receives a credit at the retail rate if more energy is produced than consumed. Some states require utilities to provide net metering to their customers until the total generating capacity of net metered systems exceeds a set percentage of the utilities’ aggregate customer peak demand.
Some of our power generation assets in Massachusetts participate in what is known as Virtual Net Metering. Virtual Net Metering in Massachusetts enables solar generation facilities to be sited remotely from the customer’s meter and still receive a credit against their monthly electricity bill. We bill the customer at a fixed rate or for a percentage of the credit they received which is derived from the G-1 electricity tariff. In addition, multiple customers may be designated as credit recipients from a power generation facility, provided they are all within the same Local Distribution Company service territory and load zone. The Virtual Net Metering structure provides a material electricity offtaker credit enhancement for our solar generation facilities and wind power plants by creating the ability to sell to hundreds of entities that are located remotely from the power generation facility location within the required area. The authority for Virtual Net Metering in Massachusetts was established by the Green Communities Act of 2007 and would require a change in law to repeal the program.
Many states also have adopted procurement requirements for renewable energy production. Twenty-nine states have adopted a renewable portfolio standard that requires regulated utilities to procure a specified percentage of total electricity delivered to customers in the state from eligible renewable energy sources, such as solar and wind power generation facilities, by a specified date. To prove compliance with such mandates, utilities must surrender RECs. System owners often are able to sell RECs to utilities directly or in REC markets.
Renewables portfolio standard ("RPS") programs and targets have been a key driver of the expansion of solar and wind power and will continue to drive solar and wind power installations in many areas of the United States. In addition to the 37 states with RPS programs, ten other states had non-binding goals supporting renewable energy.
Canada
Federal Government Support for Renewable Energy
While provincial governments have jurisdiction over their respective intra-provincial electricity markets, from 2007 to 2011 the Canadian federal government supported the development of renewable energy through its ecoENERGY for Renewable Power program, which resulted in a total of 104 power generation facilities qualifying for funds, and will represent cash incentives of approximately CAD 1.4 billion over 14 years and encouraged an aggregate of approximately 4,500 MW of new
19
renewable energy generating capacity. The program is now fully subscribed, and the Canadian federal government has not signaled an intention to renew it.
Provincial Government Support for Renewable Energy
Provincial governments have been active in promoting renewable energy in general and solar power in particular through RPS as well as through requests for proposal ("RFPs") and FIT programs for renewable energy. Several provinces are currently preparing new RFPs for renewable energy. Current provincial targets for renewable energy in those provinces with stated targets are outlined below.
Ontario. In 2009, the Green Energy and Green Economy Act, 2009 was passed into law and the Ontario Power Authority launched its FIT program, which offers stable prices under long-term contracts for electricity generation from renewable energy. In November 2010, the Ontario Ministry of Energy released the draft Supply Mix Directive and Long Term Energy Plan. Ontario, one of our markets, has been a leader in supporting the development of renewable energy through the Long Term Energy Plan, which calls for 10,700 MW of renewable energy generating capacity (excluding small-scale hydroelectricity power) by 2018. Ontario was also the first jurisdiction in North America to introduce a FIT program, which has resulted in contracts being executed for approximately 4,546 MW of electricity generating capacity as of January 31, 2013. These new contract awards under the FIT program, along with previously-awarded PPAs, suggests Ontario is close to meeting its current RPS by 2015, provided that all of the currently-contracted projects are successfully developed, financed and constructed.
In April and July of 2012, the Ontario Ministry of Energy implemented version 2.0 of the FIT program, which, among other things, reduced contract prices for new solar generation facilities, limited the acceptance of applications to specific application windows, and prioritized projects based upon project type (community participation, Aboriginal participation, public infrastructure participation), municipal and Aboriginal support, project readiness and electricity system benefit. The revisions to the FIT program do not affect FIT contracts issued prior to October 31, 2011. Prices under the FIT program will be reviewed annually, with prices established in November that will take effect January 1 of the following year. Such price changes do not affect previously issued FIT contracts but, rather, only FIT contracts to be entered into subsequent to the price change. The revisions may, however, make power generation facility economics less attractive (because of the PPA price reduction) and by granting priority points or status to certain types of power generation facilities, may make it more difficult to obtain PPAs in the future.
The FIT program was further renewed by the Ontario Ministry of Energy for FIT 3 (123 MW) awarded in summer 2014 and FIT 3 Extension (100 MW) awarded in December 2014. The FIT program is committed to three further rounds of contracts including 200 MW in 2015, 150 MW in 2016 and another 150 MW in 2017. Post 2017 the Ontario Ministry of Energy has expressed their intention to transition the FIT program to a net-metering program. For 2014-2017 the program is “SmallFIT” meaning power generation facilities from 10 kW to 500 kWac. There is also a “microFIT” program for power generation facilities under 10 kW. The SmallFIT program still offers 20 year Power Purchase Agreements with the Government of Ontario’s energy authority (the Ontario Power Authority merged with the Independent Electricity System Operator in January 2015). SmallFIT contracted rates ($/kWh) are set for the 20 year period. There are different prices for different power generation facility sizes and technologies (ex. ground mounted solar and rooftop solar have different rates, and within those two technologies power generation facilities under 100 kWac have a higher rate than power generation facilities from 100- 500kWac). FIT rate reductions and any modification to program rules are transparent and occur after stakeholder consultation.
On June 12, 2013, December 16, 2013, March 31, 2014, and November 7, 2014, the Ontario Ministry of Energy directed the Ontario Power Authority to develop a new competitive process for the procurement of renewable energy power generation facilities larger than 500 kW. On November 17, 2014 (as amended on December 5, 2014), the Ontario Power Authority issued a draft Request for Proposals for Procurement of up to 565 MW of New Large Renewable Energy Projects, or “LRP I RFP”. The LRP I RFP, seeks proposals for up to 300 MW of On-Shore Wind, 140 MW of Solar, 50 MW of Bioenergy and 75 MW of Waterpower. As of December 2014, the proposed timing of the LRP I RFP calls for proposal submissions to occur in June 2015. Following the LRP I RFP, the Ontario Power Authority plans to issue a further Request for Proposals (LRP II RFP) in Spring/Summer 2016.
Other Provinces. Provincial support for renewable energy in other provinces includes the following objectives:
• | British Columbia: To achieve energy self-sufficiency by 2016 with at least 93% of net electricity generation from clean or renewable sources. |
• | New Brunswick: To generate 10% of net electricity generation from new renewable sources by 2016. |
• | Nova Scotia: To generate 25% and 40% of net electricity generation from new (post-2001) sources of renewable energy by 2015 and 2020, respectively. |
20
United Kingdom
Renewables Obligation
In the United Kingdom, a RPS based on the Renewables Obligation Order 2009, or "RO," supports renewable electricity generation by placing an obligation on licensed electricity suppliers to submit renewables obligation certificates, or "ROCs," each year or else pay a buy-out price (or a combination of the two). The program closes to new generating stations on March 31, 2017 (subject to any applicable grace period). Suppliers source ROCs from renewable electricity generators. The program is designed to minimize the risk of oversupply of ROCs on the market and to provide stable prices. The Office of Gas and Electricity Markets administers the program and awards ROCs according to the generating facility’s metered output. A generator is awarded different amounts of ROCs for each MWh of generation depending on the technology used and the date the relevant facility is commissioned. ROCs are tradable commodities whose price is agreed by selling ROCs through online auctions or by the generator and its offtaker in the relevant power purchase or offtake agreement.
The U.K. government has a policy not to modify the ROC banding levels for projects after they are accredited, for the lifetime of their 20 year support under the RO. This is referred to as ‘grandfathering’. Under the current legislation, the ground-mounted solar photovoltaic, or "PV," banding level applicable for projects connected during the fiscal year ending March 2014, 2015, 2016 and 2017 is 1.6 ROCs per MWh, 1.4 ROCs per MWh, 1.3 ROCs per MWh and 1.2 ROCs per MWh, respectively.
However, the U.K. government has decided to close the RO across Great Britain to new solar PV capacity above 5 MW with effect from April 1, 2015, both to new stations and to additional capacity, where the station is, or would become, above 5 MW. This is subject to certain “grace periods” (e.g. a 12 month extension after the closure date of April 1, 2015, during which a project can get accredited under the RO if certain criteria are satisfied). The legislation in relation to these proposals is currently in draft form but expected to come into force on 1 April 2015.
Solar PV installations above 5 MW in size will still be eligible to apply for support under the new Contracts for Difference program and projects of 5 MW or below will continue to be eligible for support under either the RO (up to March 31, 2017) or small-scale FIT program as discussed below.
Contracts for Difference
On October 2, 2014, the United Kingdom Department of Energy & Climate Change, or "DECC," published the final budget notice in relation to the first allocation round for Contracts for Difference, which is the new regulatory regime for supporting low-carbon generation as part of the U.K. government’s Electricity Market Reform program. Projects will be competing in an auction process for a Contract for Difference against those projects and technology types within the same budgetary group. A Contract for Difference is a contract with a U.K. government-owned company to pay or be paid the difference between the prevailing market reference price for electricity and an agreed "strike price". The strike price is set by auction and there is a prescribed budget available in each annual allocation round. For the first allocation round, solar PV will be competing with the other “established technologies” - i.e. energy from waste with combined heat and power, or "CHP," hydro (>5 MW and <50 MW), landfill gas, sewage gas and onshore wind projects above 5 MW in size.
Feed-in Tariffs
FITs are an alternative subsidy program which support renewable electricity generation by requiring certain licensed electricity suppliers to make generation and export payments in respect of certain kinds of renewable electricity generation facilities of up to 5 MW in size. Generation payments are a fixed payment by the relevant electricity supplier to the FIT generator for every kWh generation by the facility. Export payments are a fixed payment by the relevant electricity supplier to the FIT generator for every kWh exported to the local or national grid (although electricity can alternatively be sold into the market). FITs for newly accredited solar PV generating stations are granted for 20 years. The policy of “grandfathering” ensures that solar generating stations should continue to receive the FIT for which they were first accredited for the duration of their FIT support (indexed). Prior to accreditation, the FIT generation payment is subject to degression, which is a mechanism to control FITs costs.
21
Levy Exemption Certificates
Certain renewable generators, including solar facilities, are also eligible to receive levy exemptions certificates, or “LECs,” in respect of the Climate Change Levy, a tax on U.K. business energy use. A LEC is only transferable together with the electricity to which it relates.
Long-Term Visibility of Support
While the ROCs and FIT support levels decrease over time for new projects due to anticipated reductions in the cost of installations, an objective from DECC has been to seek to create stability in the market for investors and to create a long-term sustainable regulatory framework. This is illustrated by the policy of grandfathering, the long duration of ROCs and FIT support levels and mechanisms such as banding reviews, degression and the Levy Control Framework (i.e. the U.K. spending cap on levy-funded energy policies), which are designed to ensure that levels of support for renewables are sustainable.
Chile
Chile has two major electricity grids, the Central Interconnected System and the Greater Northern Interconnected System. Each of these two main grids has its own independent system operator and market administrator, a Centro de Despacho Económico de Carga, or “CDEC,” and is subject to the oversight of the Comisión Nacional de Energía, or “CNE.” The main functions of the CDEC include ensuring an adequate supply of electricity into the system, providing efficient and economical dispatch of power generation facilities and ensuring that the most efficient electricity generation available to meet demand is dispatched to customers.
In 2008, the Chilean government enacted law No. 20257, the Renewable and Non-Conventional Energy Law, which promotes the use of non-conventional renewable energy, or "NCRE," sources and defines the different types of technologies qualified as NCRE sources. For the period from 2010 to 2014, that law requires generation companies to supply 5% of their total contractual obligations entered into after August 31, 2007 with NCRE sources. The requirement to supply electricity with NCRE sources will increase by 0.5% annually until 2024, when the requirement will reach 10% of total contractual obligations. A generation company can meet this requirement by developing its own NCRE generation capacity (such as wind, solar, biomass, geothermal or small hydroelectric technology), purchasing from other generators generating NCREs in excess of their legal requirements during the preceding year or paying the applicable fines for non-compliance. A modification of law No. 20257 was enacted by law No. 20698 in October 2013 establishing new goals of NCRE for all supply contracts signed after July 2013. The new goals, which are expressed as a percentage of contracted energy supply, will be 5% by 2013, with annual increases of 1%, to reach 12% in 2020, and later that year, more substantial annual increases to reach 20% in 2025.
The current penalty for non-compliance is approximately (i) $30 per MWh of deficit with respect to such generator’s NCRE generation obligation, as certified as of March 1 of the following year, and (ii) $46 per MWh of deficit with respect to such generator’s NCRE generation obligation, if within the following three year period after the non-compliance referred in (i) above, such generator still does not comply with its NCRE generation obligations under the law.
In early 2012, the Chilean government approved net-metering regulations that would allow systems of up to 100 kW to connect to the grid. Residential customers in the Central Interconnected System already pay approximately $0.20USD per kWh, and with generation from PV systems not subject to the country’s value-added tax, or "VAT," power generation facility economics are favorable for early adopters.
Financial Information about Segments
We have one reportable segment, Solar Energy, that includes our entire portfolio of solar generation facility assets, determined based on the “management” approach. This approach designates the internal reporting used by management for making decisions and assessing performance as the source of the reportable segments. Corporate expenses include general and administrative expenses, acquisition costs, formation and offering related fees and expenses, interest expense on corporate indebtedness and stock-based compensation. All operating revenues, net for the year ended December 31, 2014 were earned by our reportable segment from external customers in the United States and its unincorporated territories, Canada, the United Kingdom and Chile. All operating revenue for the years ended December 31, 2013 and 2012 were from customers located in the United States and Puerto Rico.
22
Customer Concentration
For the year ended December 31, 2014, San Diego Gas & Electric and Compania Minera del Pacifico accounted for 31% and 18%, respectively, of our consolidated operating revenues, net.
Employees
The Company does not have any employees. The personnel that manage our operations are employees of SunEdison and their services are provided to the Company's under the Management Services Agreement.
Geographic Information
The following table reflects operating revenues, net for the years ended December 31, 2014, 2013 and 2012 by geographic location:
Year Ended | ||||||||||||
(In thousands) | December 31, 2014 | December 31, 2013 | December 31, 2012 | |||||||||
United States and Puerto Rico | $ | 86,210 | $ | 17,469 | $ | 15,694 | ||||||
Chile | 23,130 | — | — | |||||||||
United Kingdom | 15,890 | — | — | |||||||||
Canada | 634 | — | — | |||||||||
Total Operating Revenues, net | $ | 125,864 | $ | 17,469 | $ | 15,694 | ||||||
Long-lived assets consist of property and equipment, net and intangible assets, net all of which are attributable to the Company's one reportable segment. The following table is a summary of long-lived assets by geographic area:
As of December 31, 2014 | As of December 31, 2013 | |||||||
(In thousands) | ||||||||
United States and Puerto Rico | $ | 2,053,483 | $ | 250,927 | ||||
Chile | 189,221 | 167,313 | ||||||
United Kingdom | 319,833 | 10,804 | ||||||
Canada | 126,939 | 912 | ||||||
Total long-lived assets, net | 2,689,476 | 429,956 | ||||||
Current assets | 612,404 | 106,358 | ||||||
Other non-current assets | 76,138 | 30,563 | ||||||
Total assets | $ | 3,378,018 | $ | 566,877 | ||||
Available Information
We make available free of charge through our website (http://www.terraform.com) the reports we file with the SEC, including our annual reports on Form 10-K, quarterly reports on Form 10-Q, current reports on Form 8-K and amendments to those reports filed or furnished pursuant to Section 13(a) or 15(d) of the Securities Exchange Act of 1934, as soon as reasonably practicable after we electronically file such material with, or furnish it to, the SEC. The SEC maintains an internet site containing these reports and proxy and information statements at http://www.sec.gov. Any materials we file can be read and copied online at that site or at the SEC's Public Reference Room at 100 F Street, NE, Washington DC 20549, on official business days during the hours of 10:00 am and 3:00 pm. Information on the operation of the Public Reference Room can be obtained by calling the SEC at 1-800-SEC-0330.
23
Item 1A. Risk Factors.
Risks Related to our Business
Integrating the assets we acquired in the First Wind acquisition may be more difficult, costly or time consuming than expected and the anticipated benefits of the First Wind acquisition may not be realized.
The success of the First Wind acquisition, including anticipated benefits, will depend, in part, on our ability to successfully combine and integrate the assets we acquired with our existing operations. The acquisition of the wind power plants represents a substantial change in the nature of our business, and we may not be able to adapt to such change in a timely manner, or at all. Any difficulties we have in integrating the First Wind assets could materially and adversely affect our business, financial condition, results of operations and cash flows.
Counterparties to our PPAs may not fulfill their obligations or may seek to terminate the PPA early, which could result in a material adverse impact on our business, financial condition, results of operations and cash flows.
All but a minor portion of the electric power generated by our current portfolio of solar generation facilities and wind power plants is sold under long-term PPAs with public utilities or commercial, industrial or government end-users or is hedged pursuant to hedge agreements with investment banks and creditworthy counterparties. Call Right Projects we acquire will also have long-term PPAs. Certain of the PPAs associated with solar generation facilities and wind power plants in our portfolio allow the offtake purchaser to terminate the PPA in the event certain operating thresholds or performance measures are not achieved within specified time periods or, in certain instances, by payment of an early termination fee. If a PPA was terminated or if, for any reason, any purchaser of power under these contracts is unable or unwilling to fulfill their related contractual obligations or refuses to accept delivery of power delivered thereunder, and if we are unable to enter a new PPA on acceptable terms in a timely fashion or at all, it could have a material adverse effect on our business, financial condition, results of operations and cash flows.
A portion of the revenues under the PPAs for our U.K. projects are subject to price adjustments after a period of time. If the market price of electricity decreases and we are otherwise unable to negotiate more favorable pricing terms, our business, financial condition, results of operations and cash flows may be materially and adversely affected.
The PPAs for the U.K. projects in our portfolio have fixed electricity prices for a specified period of time (typically four years), after which such electricity prices are subject to an adjustment based on the market price at the time of the adjustment. While the PPAs with price adjustments specify a minimum price, the minimum price is significantly below the initial fixed price. A decrease in the market price of electricity, including due to lower prices for traditional fossil fuels, could result in a decrease in the pricing under such contracts if the fixed-price period has expired, unless we are able to negotiate more favorable pricing terms. Any decrease in the price payable to us under our PPAs could materially and adversely affect our business, financial condition, results of operations and cash flow.
Certain of our PPAs allow the offtake purchaser to buy out a portion of the project upon the occurrence of certain events, in which case we will need to find suitable replacement power generation facilities to invest in.
Certain of the PPAs for power generation plants in our portfolio or that we may acquire in the future allow the offtake purchaser to purchase all or a portion of the applicable project from us. If the offtake purchaser exercises its right to purchase all or a portion of the project, we would need to reinvest the proceeds from the sale in one or more power generation facilities with similar economic attributes in order to maintain our cash available for distribution. If we were unable to locate and acquire suitable replacement power generation facilities in a timely fashion it could have a material adverse effect on our results of operations and cash available for distribution.
Most of our PPAs do not include inflation-based price increases.
In general, our PPAs do not contain inflation-based price increase provisions. To the extent that the countries in which we conduct our business experience high rates of inflation, thereby increasing our operating costs in those countries, we may not be able to generate sufficient revenues to offset the effects of inflation, which could materially and adversely affect our business, financial condition, results of operations and cash flow.
24
A material drop in the retail price of utility-generated electricity or electricity from other sources could increase competition for new PPAs, limiting our ability to attract new customers and adversely affecting our growth.
Decreases in the retail prices of electricity supplied by utilities or other clean energy sources would harm our ability to offer competitive pricing and could harm our ability to sign new customers. The price of electricity from utilities could decrease for a number of reasons, including:
• | the construction of a significant number of new power generation plants, including nuclear, coal, natural gas or renewable energy facilities; |
• | the construction of additional electric transmission and distribution lines; |
• | a reduction in the price of natural gas, including as a result of new drilling techniques or a relaxation of associated regulatory standards; |
• | energy conservation technologies and public initiatives to reduce electricity consumption; and |
• | the development of new clean energy technologies that provide less expensive energy. |
A shift in the timing of peak rates for utility-supplied electricity to a time of day when solar energy generation is less efficient could make solar and wind energy less competitive and reduce demand. If the retail price of energy available from utilities were to decrease, we would be at a competitive disadvantage in negotiating new PPAs and therefore we may be unable to attract new customers and our growth would be limited.
Certain of our PPAs and project-level financing arrangements include provisions that would permit the counterparty to terminate the contract or accelerate maturity in the event SunEdison ceases to control or own, directly or indirectly, a majority of our company.
Certain of our PPAs and project-level financing arrangements contain change in control provisions that provide the counterparty with a termination right or the ability to accelerate maturity in the event of a change of control without the counterparty's consent. These provisions are triggered in the event SunEdison ceases to own, directly or indirectly, capital stock representing more than 50% of the voting power (which is equal to approximately 9% ownership) of all of our capital stock outstanding on such date, or, in some cases, if SunEdison ceases to be the majority owner, directly or indirectly, of the applicable project subsidiary. As a result, if SunEdison ceases to control, or in some cases, own a majority of TerraForm Power, the counterparties could terminate such contracts or accelerate the maturity of such financing arrangements. The termination of any of our PPAs or the acceleration of the maturity of any of our project-level financing could have a material adverse effect on our business, financial condition, results of operations and cash flow.
We may not be able to replace expiring PPAs with contracts on similar terms. If we are unable to replace an expired distributed generation PPA with an acceptable new contract, we may be required to remove the solar or wind energy assets from the site or, alternatively, we may sell the assets to the site host.
We may not be able to replace an expiring PPA with a contract on equivalent terms and conditions, including at prices that permit operation of the related facility on a profitable basis. If we are unable to replace an expiring PPA with an acceptable new power generation facility revenue contract, the affected site may temporarily or permanently cease operations. In the case of a distributed generation power generation facility that ceases operations, the PPA terms generally require that we remove the assets, including fixing or reimbursing the site owner for any damages caused by the assets or the removal of such assets. The cost of removing a significant number of distributed generation power generation facilities could be material. Alternatively, we may agree to sell the assets to the site owner, but the terms and conditions, including price, that we would receive in any sale, and the sale price may not be sufficient to replace the revenue previously generated by the power generation facility.
Wind plants located in Maine have experienced curtailment issues which may adversely affect revenues.
The Stetson and Rollins wind power plants have experienced significant curtailment starting in February 2012 due to a combination of construction on the Maine Power Reliability Project ("MPRP") a large transmission upgrade project affecting generation and transmission throughout Maine and adjoining areas, and transmission export limits at Keane Road. These power plants in the aggregate have had curtailment of approximately 58 GWh for each of 2014 and 2013, respectively, attributable in the aggregate to each of the MPRP and Keane Road. We currently expect the MPRP to be completed in 2015, although it may not be able to be completed on this timeline or at all. We are also currently pursuing several different solutions that may help to eliminate the Keane Road issue in 2015 or 2016. However, such solutions may not ameliorate or eliminate the Keane Road curtailment issues, which could have a material adverse effect on our business, financial condition, results of operations and cash flow and our ability to pay dividends to holders of our Class A common stock.
25
The growth of our business depends on locating and acquiring interests in additional, attractive clean energy power generation facilities from SunEdison and unaffiliated third parties at favorable prices.
Our primary business strategy is to acquire clean energy power generation facilities that are operational from both SunEdison and third parties. We may also, in limited circumstances, acquire clean energy projects that are pre-operational. The following factors, among others, could affect the availability of attractive power generation facilities to grow our business:
• | competing bids for a power generating facility, including from companies that may have substantially greater capital and other resources than we do; |
• | fewer third-party acquisition opportunities than we expect, which could result from, among other things, available power generation facilities having less desirable economic returns or higher risk profiles than we believe suitable for our business plan and investment strategy; |
• | SunEdison’s failure to complete the development of the Call Right Projects or any of the other projects in its development pipeline, which could result from, among other things, permitting challenges, failure to procure the requisite financing, equipment or interconnection, or an inability to satisfy the conditions to effectiveness of project agreements such as PPAs, which could limit our acquisition opportunities under the Support Agreement or the Intercompany Agreement; and |
• | our failure to exercise our rights under the Support Agreement or the Intercompany Agreement to acquire assets from SunEdison. |
We will not be able to achieve our target compound annual growth rate of CAFD per unit unless we are able to acquire additional clean energy power generation facilities at favorable prices.
Our acquisition strategy exposes us to substantial risk.
The acquisition of power generation facilities is subject to substantial risk, including the failure to identify material problems during due diligence (for which we may not be indemnified post-closing), the risk of over-paying for assets (or not making acquisitions on an accretive basis), the ability to obtain or retain customers and, if the power generation facilities are in new markets, the risks of entering markets where we have limited experience. While we perform due diligence on prospective acquisitions, we may not be able to discover all potential operational deficiencies in such power generation facilities. In addition, our expectations for the operating performance of newly constructed power generation facilities and projects under construction are based on assumptions and estimates made without the benefit of operating history. However, the ability of these power generation facilities to meet our performance expectations is subject to the risks inherent in newly constructed power generation facilities and the construction of such facilities, including, but not limited to, degradation of equipment in excess of our expectations, system failures and outages. Future acquisitions may not perform as expected or the returns from such acquisitions may not support the financing utilized to acquire them or maintain them. Furthermore, integration and consolidation of acquisitions requires substantial human, financial and other resources and may divert management’s attention from our existing business concerns, disrupt our ongoing business or not be successfully integrated. As a result, the consummation of acquisitions may have a material adverse effect on our business, financial condition, results of operations and cash flows.
We may not be able to effectively identify or consummate any future acquisitions on favorable terms, or at all. Additionally, even if we consummate acquisitions on terms that we believe are favorable, such acquisitions may in fact result in a decrease in cash available for distribution to holders of our Class A common stock.
Future acquisition opportunities for renewable energy power generation facilities are limited. While SunEdison has granted us the option to purchase the Call Right Projects and a right of first offer with respect to the ROFO Projects, we will compete with other companies for future acquisition opportunities. This may increase our cost of making acquisitions or cause us to refrain from making acquisitions at all. Some of our competitors are much larger than us with substantially greater resources. These companies may be able to pay more for acquisitions and may be able to identify, evaluate, bid for and purchase a greater number of assets than our resources permit.
In addition, if we are unable to reach agreement with SunEdison regarding the pricing of certain Call Right Projects, our acquisition opportunities may be more limited than we currently expect. If SunEdison’s development of new projects slows, we also may have fewer opportunities to purchase projects from SunEdison. If we are unable to identify and consummate future acquisitions, it will impede our ability to execute our growth strategy and limit our ability to increase the amount of dividends paid to holders of our Class A common stock.
26
Even if we consummate acquisitions that we believe will be accretive to CAFD per unit, those acquisitions may in fact result in a decrease in CAFD per unit as a result of incorrect assumptions in our evaluation of such acquisitions, unforeseen consequences or other external events beyond our control. Furthermore, if we consummate any future acquisitions, our capitalization and results of operations may change significantly, and stockholders will generally not have the opportunity to evaluate the economic, financial and other relevant information that we will consider in determining the application of these funds and other resources.
Our ability to grow and make acquisitions with cash on hand may be limited by our cash dividend policy.
Our dividend policy is to cause Terra LLC to distribute approximately 85% of CAFD each quarter and to rely primarily upon external financing sources, including the issuance of debt and equity securities and, if applicable, borrowings under our New Revolver, to fund our acquisitions and growth capital expenditures. We may be precluded from pursuing otherwise attractive acquisitions if the projected short-term cash flow from the acquisition or investment is not adequate to service the capital raised to fund the acquisition or investment. As such, our growth may not be as fast as that of businesses that reinvest their available cash to expand ongoing operations.
Our indebtedness could adversely affect our financial condition and ability to operate our business, including restricting our ability to pay cash dividends or react to changes in the economy or our industry.
Our substantial debt could have important negative consequences on our financial condition, including:
• | increasing our vulnerability to general economic and industry conditions; |
• | requiring a substantial portion of our cash flow from operations to be dedicated to the payment of principal and interest on our indebtedness, thereby reducing our ability to pay dividends to holders of our Class A common stock or to use our cash flow to fund our operations, capital expenditures and future business opportunities; |
• | limiting our ability to enter into or receive payments under long-term power sales or fuel purchases which require credit support; |
• | limiting our ability to fund operations or future acquisitions; |
• | restricting our ability to make certain distributions with respect to our capital stock and the ability of our subsidiaries to make certain distributions to us, in light of restricted payment and other financial covenants in our credit facilities and other financing agreements; |
• | exposing us to the risk of increased interest rates because certain of our borrowings, which may include borrowings under our New Revolver, are at variable rates of interest; |
• | limiting our ability to obtain additional financing for working capital, including collateral postings, capital expenditures, debt service requirements, acquisitions and general corporate or other purposes; and |
• | limiting our ability to adjust to changing market conditions and placing us at a competitive disadvantage compared to our competitors who have less debt. |
Our New Revolver and Senior Notes contain financial and other restrictive covenants that limit our ability to return capital to stockholders or otherwise engage in activities that may be in our long-term best interests. Our inability to satisfy certain financial covenants could prevent us from paying cash dividends, and our failure to comply with those and other covenants could result in an event of default which, if not cured or waived, may entitle the related lenders to demand repayment or enforce their security interests, which could have a material adverse effect on our business, financial condition, results of operations and cash flow. In addition, failure to comply with such covenants may entitle the related lenders to demand repayment and accelerate all such indebtedness.
The agreements governing our project-level financing contain, and we expect project financings incurred or assumed on future projects we acquire to contain, financial and other restrictive covenants that limit our project subsidiaries’ ability to make distributions to us or otherwise engage in activities that may be in our long-term best interests. The project-level financing agreements generally prohibit distributions from the project entities to us unless certain specific conditions are met, including the satisfaction of certain financial ratios. Our inability to satisfy certain financial covenants may prevent cash distributions by the particular project(s) to us and our failure to comply with those and other covenants could result in an event of default which, if not cured or waived may entitle the related lenders to demand repayment or enforce their security interests, which could have a material adverse effect on our business, results of operations and financial condition. In addition, failure to comply with such covenants may entitle the related lenders to demand repayment and accelerate all such indebtedness. If we are unable to make distributions from our project-level subsidiaries, it would likely have a material adverse effect on our ability to pay dividends to holders of our Class A common stock.
27
If our subsidiaries default on their obligations under their project-level indebtedness, this may constitute an event of default under our New Revolver, and we may be required to make payments to lenders to avoid such default or to prevent foreclosure on the collateral securing the project-level debt. If we are unable to or decide not to make such payments, we would lose certain of our solar and wind energy generation facilities upon foreclosure.
Our subsidiaries incur, and we expect will in the future incur, various types of project-level indebtedness. Non-recourse debt is repayable solely from the applicable project’s revenues and is secured by the project’s physical assets, major contracts, cash accounts and, in many cases, our ownership interest in the project subsidiary. Limited recourse debt is debt where we have provided a limited guarantee, and recourse debt is debt where we have provided a full guarantee, which means if our subsidiaries default on these obligations, we will be liable directly to those lenders, although in the case of limited recourse debt only to the extent of our limited recourse obligations. To satisfy these obligations, we may be required to use amounts distributed by our other subsidiaries as well as other sources of available cash, reducing our cash available to execute our business plan and pay dividends to holders of our Class A common stock. In addition, if our subsidiaries default on their obligations under non-recourse financing agreements this may, under certain circumstances, result in an event of default under our New Revolver, allowing our lenders to foreclose on their security interests.
Even if that is not the case, we may decide to make payments to prevent the lenders of these subsidiaries from foreclosing on the relevant collateral. Such a foreclosure could result in our losing our ownership interest in the subsidiary or in some or all of its assets. The loss of our ownership interest in one or more of our subsidiaries or some or all of their assets could have a material adverse effect on our business, financial condition, results of operations and cash flow.
If we are unable to renew letter of credit facilities our business, financial condition, results of operations and cash flow may be materially adversely affected.
Our New Revolver includes a letter of credit facility to support project-level contractual obligations. This letter of credit facility will need to be renewed as of January 27, 2020, at which time we will need to satisfy applicable financial ratios and covenants. If we are unable to renew our letters of credit as expected or if we are only able to replace them with letters of credit under different facilities on less favorable terms, we may experience a material adverse effect on our business, financial condition, results of operations and cash flow. Furthermore, the inability to provide letters of credit may constitute a default under certain project-level financing arrangements, restrict the ability of the project-level subsidiary to make distributions to us and/or reduce the amount of cash available at such subsidiary to make distributions to us.
Our ability to raise additional capital to fund our operations may be limited.
Our primary business strategy is to acquire clean energy power generation facilities that are operational from SunEdison and from unaffiliated third parties. We do not expect to have sufficient amounts of cash on hand to fund all such acquisition costs. As a result, we will need to arrange additional financing to finance a portion of such acquisitions. Our ability to arrange additional financing, either at the corporate level or at a non-recourse project-level subsidiary, may be limited. Additional financing, including the costs of such financing, will be dependent on numerous factors, including:
• | general economic and capital market conditions; |
• | credit availability from banks and other financial institutions; |
• | investor confidence in us, our partners, SunEdison, as our principal stockholder (on a combined voting basis), and manager under the Management Services Agreement, and the regional wholesale power markets; |
• | our financial performance and the financial performance of our subsidiaries; |
• | our level of indebtedness and compliance with covenants in debt agreements; |
• | maintenance of acceptable project credit ratings or credit quality, including maintenance of the legal and tax structure of the project-level subsidiary upon which the credit ratings may depend; |
• | cash flow; and |
• | provisions of tax and securities laws that may impact raising capital. |
We may not be successful in obtaining additional financing for these or other reasons. Furthermore, we may be unable to refinance or replace project-level financing arrangements or other credit facilities on favorable terms or at all upon the expiration or termination thereof. Our failure, or the failure of any of our projects, to obtain additional capital or enter into new or replacement financing arrangements when due may constitute a default under such existing indebtedness and may have a material adverse effect on our business, financial condition, results of operations and cash flow.
28
Our ability to generate revenue from certain utility-scale solar and wind energy power plants depends on having interconnection arrangements and services.
If the interconnection or transmission agreement of a clean energy power plant we own or acquire is terminated for any reason, we may not be able to replace it with an interconnection or transmission arrangement on terms as favorable as the existing arrangement, or at all, or we may experience significant delays or costs in to securing a replacement. If a transmission network to which one or more of our existing power plants or a power plant we acquire is connected experiences “down time,” the affected project may lose revenue and be exposed to non-performance penalties and claims from its customers. The owners of the network will not usually compensate electricity generators for lost income due to down time. These factors could materially affect our ability to forecast operations and negatively affect our business, results of operations, financial condition and cash flow.
We cannot predict whether transmission facilities will be expanded in specific markets to accommodate competitive access to those markets. In addition, certain of our operating facilities’ generation of electricity may be physically or economically curtailed without compensation due to transmission limitations, reducing our revenues and impairing our ability to capitalize fully on a particular facility’s generating potential. Such curtailments could have a material adverse effect on our business, financial condition, results of operations and cash flow. Furthermore, economic congestion on the transmission grid (for instance, a positive price difference between the location where power is put on the grid by a project and the location where power is taken off the grid by the project’s customer) in certain of the bulk power markets in which we operate may occur and we may be deemed responsible for those congestion costs. If we were liable for such congestion costs, our financial results could be adversely affected.
We face competition from traditional and renewable energy companies.
The solar and wind energy industries, and the broader renewable energy industry, are highly competitive and continually evolving, as market participants strive to distinguish themselves within their markets and compete with large incumbent utilities and new market entrants. We believe that our primary competitors are the traditional incumbent utilities that supply energy to our potential customers under highly regulated rate and tariff structures. We compete with these traditional utilities primarily based on price, predictability of price and the ease with which customers can switch to electricity generated by our solar generation facilities and wind power plants. If we cannot offer compelling value to our customers based on these factors, then our business will not grow. Traditional utilities generally have substantially greater financial, technical, operational and other resources than we do, and as a result may be able to devote more resources to the research, development, promotion and sale of their products or respond more quickly to evolving industry standards and changes in market conditions than we can. Traditional utilities could also offer other value-added products or services that could help them to compete with us even if the cost of electricity they offer is higher than ours. In addition, the source of a majority of traditional utilities’ electricity is non-solar and non-renewable, which may allow them to sell electricity more cheaply than electricity generated by our solar generation facilities, wind power plants, and other types of clean power generation facilities we acquire.
We also face risks that traditional utilities could change their volumetric-based (i.e., cents per kWh) rate and tariff structures to make distributed solar generation less economically attractive to their retail customers. Currently, net metering programs are utilized in 43 states to support the growth of distributed generation solar by requiring traditional utilities to reimburse certain of their retail customers for the excess power they generate at the level of the utilities’ retail rates rather than the rates at which those utilities buy power at wholesale. In Arizona, the state has allowed its largest traditional utility, Arizona Public Service, to assess a surcharge on customers with solar generation facilities for their use of the utility’s grid, based on the size of the customer’s solar generation facility. This surcharge will reduce the economic returns for the excess electricity that the solar generation facilities produce. These types of changes or other types of changes that could reduce or eliminate the economic benefits of net-metering could be implemented in other states, which could significantly change the economic benefits of solar energy as perceived by traditional utilities’ retail customers.
We also face competition in the energy efficiency evaluation and upgrades market and we expect to face competition in additional markets as we introduce new energy-related products and services. As the solar and wind industries grow and evolve, we will also face new competitors who are not currently in the market. Our failure to adapt to changing market conditions and to compete successfully with existing or new competitors will limit our growth and will have a material adverse effect on our business and prospects.
29
There are a limited number of purchasers of utility-scale quantities of electricity, which exposes us and our utility-scale projects to additional risk.
Since the transmission and distribution of electricity is either monopolized or highly concentrated in most jurisdictions, there are a limited number of possible purchasers for utility-scale quantities of electricity in a given geographic location, including transmission grid operators, state and investor-owned power companies, public utility districts and cooperatives. As a result, there is a concentrated pool of potential buyers for electricity generated by our plants and projects, which may restrict our ability to negotiate favorable terms under new PPAs and could impact our ability to find new customers for the electricity generated by our generation facilities should this become necessary. Furthermore, if the financial condition of these utilities and/or power purchasers deteriorated or the RPS programs, climate change programs or other regulations to which they are currently subject and that compel them to source renewable energy supplies change, demand for electricity produced by our plants could be negatively impacted.
In addition, provisions in our power sale arrangements may provide for the curtailment of delivery of electricity for various operational reasons at no cost to the power purchaser, including to prevent damage to transmission systems and for system emergencies, force majeure, safety, reliability, maintenance and other operational reasons. Such curtailment would reduce revenues earned by us at no cost to the purchaser including, in addition to certain of the general types noted above, events in which energy purchases would result in costs greater than those which the purchaser would incur if it did not make such purchases but instead generated an equivalent amount of energy (provided that such curtailment is due to operational reasons and does not occur solely as a consequence of purchaser’s filed avoided energy cost being lower than the agreement rates or purchasing less-expensive energy from another facility). In Hawaii, where several of our wind power plants are located, purchasers are required to take reasonable steps to minimize the number and duration of curtailment events, and that such curtailments will generally be made in reverse chronological order based upon Hawaii utility commission approval (which is beneficial to older projects such as our Kaheawa Wind Power I, or "KWP I"), such curtailments could still occur and reduce revenues to our Hawaii wind projects. If we cannot enter into power sale arrangements on terms favorable to us, or at all, or if the purchaser under our power sale arrangements were to exercise its curtailment or other rights to reduce purchases or payments under such arrangements, our revenues and our decisions regarding development of additional projects may be adversely affected.
A significant deterioration in the financial performance of the retail industry could materially adversely affect our distributed generation business.
The financial performance of our distributed generation business depends in part upon the continued viability and financial stability of our customers in the retail industry, such as medium and large independent retailers and distribution centers. If the retail industry is materially and adversely affected by an economic downturn, increase in inflation or other factors, one or more of our largest customers could encounter financial difficulty, and possibly, bankruptcy. If one or more of our largest customers were to encounter financial difficulty or declare bankruptcy, they may reduce their PPA payments to us or stop them altogether.
Our hedging activities may not adequately manage our exposure to commodity and financial risk, which could result in significant losses or require us to use cash collateral to meet margin requirements, each of which could have a material adverse effect on our business, financial condition, results of operations and liquidity, which could impair our ability to execute favorable financial hedges in the future.
Certain of our wind assets are party to financial swaps or other hedging arrangements. We may also acquire additional assets with similar hedging arrangements in the future. Under the terms of the existing financial swaps, certain wind projects are not obligated to physically deliver or purchase electricity. Instead, they receive payments for specified quantities of electricity based on a fixed-price and are obligated to pay the counterparty the market price for the same quantities of electricity. These financial swaps cover quantities of electricity that we estimated are highly likely to be produced. As a result, gains or losses under the financial swaps are designed to be offset by decreases or increases in a project’s revenues from spot sales of electricity in liquid markets. However, the actual amount of electricity a project generates from operations may be materially different from our estimates for a variety of reasons, including variable wind conditions and wind turbine availability. If a project does not generate the volume of electricity covered by the associated swap contract, we could incur significant losses if electricity prices in the market rise substantially above the fixed-price provided for in the swap. If a project generates more electricity than is contracted in the swap, the excess production will not be hedged and the related revenues will be exposed to market-price fluctuations.
We sometimes seek to sell forward a portion of our RECs or other environmental attributes to fix the revenues from those attributes and hedge against future declines in prices of RECs or other environmental attributes. If our projects do not
30
generate the amount of electricity required to earn the RECs or other environmental attributes sold forward or if for any reason the electricity we generate does not produce RECs or other environmental attributes for a particular state, we may be required to make up the shortfall of RECs or other environmental attributes through purchases on the open market or make payments of liquidated damages. Further, current market conditions may limit our ability to hedge sufficient volumes of our anticipated RECs or other environmental attributes, leaving us exposed to the risk of falling prices for RECs or other environmental attributes. Future prices for RECs or other environmental attributes are also subject to the risk that regulatory changes will adversely affect prices.
While we currently own only solar and wind energy generation facilities plants (and associated interconnecting transmission facilities), in the future we may decide to further expand our acquisition strategy to include other types of energy or transmission projects. To the extent that we expand our operations to include new business segments, our business operations may suffer from a lack of experience, which may materially and adversely affect our business, financial condition, results of operations and cash flow.
We have limited experience in energy generation operations. As a result of this lack of experience, we may be prone to errors if we expand our projects beyond such energy projects other than solar and wind. With no direct training or experience in these areas, our management may not be fully aware of the many specific requirements related to working in industries beyond solar energy generation. Additionally, we may be exposed to increased operating costs, unforeseen liabilities or risks, and regulatory and environmental concerns associated with entering new sectors of the power generation industry, which could have an adverse impact on our business as well as place us at a competitive disadvantage relative to more established non-solar energy market participants. Our operations, earnings and ultimate financial success could suffer irreparable harm due to our management’s lack of experience in these industries.
Operation of power generation facilities involves significant risks and hazards that could have a material adverse effect on our business, financial condition, results of operations and cash flow. We may not have adequate insurance to cover these risks and hazards.
The ongoing operation of our facilities involves risks that include the breakdown or failure of equipment or processes or performance below expected levels of output or efficiency due to wear and tear, latent defect, design error or operator error or force majeure events, among other things. Operation of our facilities also involves risks that we will be unable to transport our product to our customers in an efficient manner due to a lack of transmission capacity. Unplanned outages of generating units, including extensions of scheduled outages, occur from time to time and are an inherent risk of our business. Unplanned outages typically increase our operation and maintenance expenses and may reduce our revenues as a result of generating and selling less power or require us to incur significant costs as a result of obtaining replacement power from third parties in the open market to satisfy our forward power sales obligations.
Our inability to efficiently operate our solar energy assets and our wind assets, manage capital expenditures and costs and generate earnings and cash flow from our asset-based businesses could have a material adverse effect on our business, financial condition, results of operations and cash flow. While we maintain insurance, obtain warranties from vendors and obligate contractors to meet certain performance levels, the proceeds of such insurance, warranties or performance guarantees may not cover our lost revenues, increased expenses or liquidated damages payments should we experience equipment breakdown or non-performance by contractors or vendors.
Power generation involves hazardous activities, including delivering electricity to transmission and distribution systems. In addition to natural risks such as earthquake, flood, lightning, hurricane and wind, other hazards, such as fire, structural collapse and machinery failure are inherent risks in our operations. These and other hazards can cause significant personal injury or loss of life, severe damage to and destruction of property, plant and equipment and contamination of, or damage to, the environment and suspension of operations. The occurrence of any one of these events may result in our being named as a defendant in lawsuits asserting claims for substantial damages, including for environmental cleanup costs, personal injury and property damage and fines and/or penalties. We maintain an amount of insurance protection that we consider adequate but we cannot provide any assurance that our insurance will be sufficient or effective under all circumstances and against all hazards or liabilities to which we may be subject. Furthermore, our insurance coverage is subject to deductibles, caps, exclusions and other limitations. A loss for which we are not fully insured could have a material adverse effect on our business, financial condition, results of operations or cash flow. Further, due to rising insurance costs and changes in the insurance markets, we cannot provide any assurance that our insurance coverage will continue to be available at all or at rates or on terms similar to those presently available. Any losses not covered by insurance could have a material adverse effect on our business, financial condition, results of operations and cash flow.
31
Our business is subject to substantial governmental regulation and may be adversely affected by changes in laws or regulations, as well as liability under, or any future inability to comply with, existing or future regulations or other legal requirements.
Our business is subject to extensive federal, state and local laws and regulations in the countries in which we operate. Compliance with the requirements under these various regulatory regimes may cause us to incur significant costs, and failure to comply with such requirements could result in the shutdown of the non-complying facility or, the imposition of liens, fines and/or civil or criminal liability.
With the exception of Mt. Signal, Regulus, and certain wind projects, all of the U.S. Projects in our portfolio are QFs as defined under PURPA. Depending upon the power production capacity of the project in question, our QFs and their immediate project company owners may be entitled to various exemptions from ratemaking and certain other regulatory provisions of the FPA, from the books and records access provisions of PUHCA, and from state organizational and financial regulation of electric utilities.
Each of the Mt. Signal ProjectCo, the Regulus ProjectCo and the wind project company owners are an EWG which exempts it and us (for purposes of our ownership of each such company) from the federal books and access provisions of PUHCA. The projects owned by certain of the EWG ProjectCos are QFs and in one instance the EWG ProjectCo that owns such projects may receive exemptions from regulation as a “public utility” under certain provisions of the FPA. However, the Mt. Signal ProjectCo, the Regulus ProjectCo and the EWG Project Cos are subject to regulation for most purposes as “public utilities” under the FPA, including regulation of their rates and their issuances of securities. Each of the Mt. Signal ProjectCo, the Regulus ProjectCo and the EWG ProjectCos has obtained “market-based rate authorization” and associated blanket authorizations and waivers from FERC under the FPA, which allows it to sell electric energy, capacity and ancillary services at wholesale at negotiated, market-based rates, instead of cost-of-service rates, as well as waivers of, and blanket authorizations under, certain FERC regulations that are commonly granted to market based rate sellers, including blanket authorizations to issue securities.
The failure of the project company owners of our QFs to maintain available exemptions under PURPA may result in their becoming subject to significant additional regulatory requirements. In addition, the failure of the Mt. Signal ProjectCo, the Regulus ProjectCo, the EWG ProjectCos, or other project company owners of our QFs to comply with applicable regulatory requirements may result in the imposition of penalties as discussed further in Item 1. Business - Regulatory Matters.
In particular, the Mt. Signal ProjectCo, the Regulus ProjectCo, the EWG ProjectCos, and any of the other owners of our project companies that obtain market-based rate authority from FERC under the FPA are or will be subject to certain market behavior rules as established and enforced by FERC, and if they are determined to have violated those rules, will be subject to potential disgorgement of profits associated with the violation, penalties, and suspension or revocation of their market-based rate authority. If such entities were to lose their market-based rate authority, they would be required to obtain FERC’s acceptance of a cost-of-service rate schedule for wholesale sales of electric energy, capacity and ancillary services and could become subject to significant accounting, record-keeping, and reporting requirements that are imposed on FERC-regulated public utilities with cost-based rate schedules.
Substantially all of our assets are also subject to the rules and regulations applicable to power generators generally, in particular the reliability standards of NERC or similar standards in Canada, the United Kingdom and Chile. If we fail to comply with these mandatory reliability standards, we could be subject to sanctions, including substantial monetary penalties, increased compliance obligations and disconnection from the grid.
The regulatory environment for electric generation in the United States has undergone significant changes in the last several years due to state and federal policies affecting the wholesale and retail power markets and the creation of incentives for the addition of large amounts of new renewable generation and demand response resources. These changes are ongoing and we cannot predict the ultimate effect that the changing regulatory environment will have on our business. In addition, in some of these markets, interested parties have proposed material market design changes, as well as made proposals to re-regulate the markets or require divestiture of electric generation assets by asset owners or operators to reduce their market share. If competitive restructuring of the electric power markets is reversed, discontinued or delayed, our business prospects and financial results could be negatively impacted.
32
Laws, governmental regulations and policies supporting renewable energy, and specifically solar and wind energy (including tax incentives), could change at any time, including as a result of new political leadership, and such changes may materially adversely affect our business and our growth strategy.
Renewable generation assets currently benefit from various federal, state and local governmental incentives. In the United States, these incentives include ITCs, PTCs, loan guarantees, RPS programs and modified accelerated cost-recovery system of depreciation. For example, the IRS Code provides an ITC of 30% of the cost-basis of an eligible resource, including solar energy facilities placed in service prior to the end of 2016, which percentage is currently scheduled to be reduced to 10% for solar generation facilities placed in service after December 31, 2016. The U.S. Congress could reduce the ITC to below 30% prior to the end of 2016, reduce the ITC to below 10% for periods after 2016 or replace the expected 10% ITC with an untested production tax credit of an unknown amount. Any reduction in the ITC could materially and adversely affect our business, financial condition, results of operations and cash flow. PTCs, which are federal income tax credits related to the quantity of renewable energy produced and sold during a taxable year, or ITCs in lieu of PTCs, are available only for wind power plants that began construction on or prior to December 31, 2014. PTCs and accelerated tax depreciation benefits generated by operating projects can be monetized by entering into tax equity financing agreements with investors that can utilize the tax benefits, which have been a key financing tool for wind power plants. The growth of our wind energy business may be dependent on the U.S. Congress further extending the expiration date of, renewing or replacing PTCs, without which the market for tax equity financing for wind projects would likely cease to exist. Recent legislative efforts to extend or renew PTCs have failed, and we cannot assure that current or any subsequent efforts to further extend, renew or replace PTCs will be successful. Any failure to extend, renew or replace PTCs could materially and adversely affect our business, financial condition, results of operations and cash flow.
Many U.S. states have adopted RPS programs mandating that a specified percentage of electricity sales come from eligible sources of renewable energy. If the RPS requirements are reduced or eliminated, it could lead to fewer future power contracts or lead to lower prices for the sale of power in future power contracts, which could have a material adverse effect on our future growth prospects. Such material adverse effects may result from decreased revenues, reduced economic returns on certain project company investments, increased financing costs and/or difficulty obtaining financing.
Renewable energy sources in Canada benefit from federal and provincial incentives, such as RPS programs, accelerated cost recovery deductions allowed for tax purposes, the availability of off-take agreements through RPS and the Ontario FIT program, and other commercially oriented incentives. Renewable energy sources in the United Kingdom benefit from renewable obligation certificates, climate change levy exemption certificates, embedded benefits and contracts for difference. Renewable energy sources in Chile benefit from an RPS program. Any adverse change to, or the elimination of, these incentives could have a material adverse effect on our business and our future growth prospects.
If any of the laws or governmental regulations or policies that support renewable energy, including solar energy, change, or if we are subject to new and burdensome laws or regulations, such changes may have a material adverse effect on our business, financial condition, results of operations and cash flow.
We have a limited operating history and as a result we may not operate on a profitable basis.
We have a relatively new portfolio of assets, including several projects that have only recently commenced operations or that we expect will commence operations in the near future, and a limited operating history on which to base an evaluation of our business and prospects. Our prospects must be considered in light of the risks, expenses and difficulties frequently encountered by companies in their early stages of operation, particularly in a rapidly evolving industry such as ours. We cannot assure you that we will be successful in addressing the risks we may encounter, and our failure to do so could have a material adverse effect on our business, financial condition, results of operations and cash flow.
Maintenance, expansion and refurbishment of power generation facilities involve significant risks that could result in unplanned power outages or reduced output.
Our facilities may require periodic upgrading and improvement. Any unexpected operational or mechanical failure, including failure associated with breakdowns and forced outages, and any decreased operational or management performance, could reduce our facilities’ generating capacity below expected levels, reducing our revenues and jeopardizing our ability to pay dividends to holders of our Class A common stock at forecasted levels or at all. Degradation of the performance of our solar generation facilities and wind power plants provided for in the related PPAs may also reduce our revenues. Unanticipated capital expenditures associated with maintaining, upgrading or repairing our facilities may also reduce profitability.
33
We may also choose to refurbish or upgrade our facilities based on our assessment that such activity will provide adequate financial returns and key assumptions underpinning a decision to make such an investment may prove incorrect, including assumptions regarding construction costs, timing, available financing and future power prices. This could have a material adverse effect on our business, financial condition, results of operations and cash flow.
Moreover, spare parts for wind turbines and solar facilities and key pieces of equipment may be hard to acquire or unavailable to us. Sources of some significant spare parts and other equipment are located outside of North America. If we were to experience a shortage of or inability to acquire critical spare parts we could incur significant delays in returning facilities to full operation, which could negatively impact our business financial condition, results of operations and cash flow.
Our KWP II project is required under its PPA to install and maintain a battery energy storage system, the manufacturer of which is in bankruptcy and no longer supplies batteries to any customers. If we are unable to source acceptable replacement batteries, this could result in a default under, or termination of, KWP II’s PPA.
Our Kaheawa Wind Power II ("KWP II") project is required under its PPA to install and maintain a battery energy storage system (“BESS”). The manufacturer of the BESS is in bankruptcy and is no longer providing replacement batteries and other components for the BESS. We are sourcing replacement batteries from a new supplier, but such replacement batteries may not be sufficient for the system to operate as designed or may not be available in the quantities or at an economical price. Our Kahuku project had a similar BESS that was required to be operated under its PPA, but the BESS was destroyed in a fire. The project installed a D-Var system as a replacement for the BESS under the Kahuku project PPA, which has been operating as designed. If the BESS system at KWP II was damaged or could no longer operate, a D-Var could not be used at the KWP II project as a replacement to the BESS due to technical constraints, and another replacement system may not be compatible or available at a price that would allow the project to operate economically. Failure to maintain the battery system constitutes a default under KWP II’s PPA and could result in the termination of KWP II’s PPA, which could negatively impact our business financial condition, results of operations and cash flow.
Certain of the wind projects use equipment originally produced and supplied by Clipper Windpower, LLC, or its affiliates ("Clipper") which no longer manufactures, warrants or services the wind turbine it produced. If Clipper equipment experiences defects in the future, we may not be able to obtain replacement components and will need to self-fund the correction or replacement of such equipment.
The Cohocton, Kahuku, Sheffield, and Steel Winds I and II projects operate ninety-two Liberty turbines (230 MW) supplied by Clipper. Since initial deployment, Clipper has announced and remediated various defects affecting the Liberty turbines deployed by us and by other customers, which resulted in prolonged downtime for turbines at various projects. Moreover, Clipper no longer manufactures, warrants or services the Liberty turbines or other wind equipment it produced.
Beginning in 2012, we engaged in a number of litigation and arbitration proceedings with Clipper concerning the performance of the Liberty turbines. On February 12, 2013, all such disputes were settled pursuant to a Settlement, Release and Operation and Maintenance ("O&M") Transition Agreement among certain of our and Clipper entities (the “Settlement Agreement”). Pursuant to the Settlement Agreement, we have, among other things, released Clipper of all of its warranty obligations with respect to the equipment supplied by Clipper, and the obligations under the related operation and maintenance contracts, and we have been granted by Clipper a non-exclusive, royalty-free, perpetual, irrevocable license to make, improve and modify any Clipper-supplied equipment and to create derivative works from such equipment.
As a result, if Clipper equipment experiences defects in the future, we will not have the benefit of a manufacturer’s warranty on such original equipment, may not be able to obtain replacement components and will need to self-fund the correction or replacement of such equipment, which could negatively impact our business financial condition, results of operations and cash flow.
SunEdison and other developers of solar energy projects and other clean energy projects depend on a limited number of suppliers of solar panels, inverters, module turbines, towers and other system components and turbines and other equipment associated with wind energy facilities. Any shortage, delay or component price change from these suppliers could result in construction or installation delays, which could affect the number of projects we are able to acquire in the future.
There have also been periods of industry-wide shortage of key components, including solar panels and wind turbines, in times of rapid industry growth. The manufacturing infrastructure for some of these components has a long lead time, requires significant capital investment and relies on the continued availability of key commodity materials, potentially resulting in an inability to meet demand for these components. In addition, the United States government has imposed tariffs on solar cells manufactured in China. Based on determinations by the United States government, the applicable anti-dumping tariff rates
34
range from approximately 8% to 239%. To the extent that United States market participants experience harm from Chinese pricing practices, an additional tariff of approximately 15%-16% will be applied. If SunEdison or other unaffiliated third parties purchase solar panels containing cells manufactured in China, our purchase price for projects would reflect the tariff penalties mentioned above. A shortage of key commodity materials could also lead to a reduction in the number of projects that we may have the opportunity to acquire in the future, or delay or increase the costs of acquisitions.
We may incur unexpected expenses if the suppliers of components in our energy projects default in their warranty obligations.
The solar panels, inverters, modules and other system components utilized in our solar energy projects are generally covered by manufacturers’ warranties, which typically range from 5 to 20 years. When purchasing wind turbines, the purchaser will enter into warranty agreements with the manufacturer which typically expire within two to five years after the turbine delivery date. In the event any such components fail to operate as required, we may be able to make a claim against the applicable warranty to cover all or a portion of the expense associated with the faulty component. However, these suppliers could cease operations and no longer honor the warranties, which would leave us to cover the expense associated with the faulty component. Our business, financial condition, results of operations and cash flow could be materially adversely affected if we cannot make claims under warranties covering our projects.
We are subject to environmental, health and safety laws and regulations and related compliance expenditures and liabilities.
Our assets are subject to numerous and significant federal, state, local and foreign laws, and other requirements governing or relating to the the environment. Our facilities could experience incidents, malfunctions and other unplanned events, such as spills of hazardous materials that may result in personal injury, penalties and property damage. In addition, certain environmental laws may result in liability, regardless of fault, concerning contamination at a range of properties, including properties currently or formerly owned, leased or operated by us and properties where we disposed of, or arranged for disposal of, waste and other hazardous materials. As such, the operation of our facilities carries an inherent risk of environmental liabilities, and may result in our involvement from time to time in administrative and judicial proceedings relating to such matters. While we have implemented environmental management programs designed to continually improve environmental, health and safety performance, we cannot assure you that such liabilities including significant required capital expenditures, as well as the costs for complying with environmental laws and regulations, will not have a material adverse effect on our business, financial condition, results of operations and cash flow.
Harming of protected species can result in curtailment of wind project operations.
The operation of energy projects can adversely affect endangered, threatened or otherwise protected animal species. Wind projects, in particular, involve a risk that protected species will be harmed, as the turbine blades travel at a high rate of speed and may strike flying animals (birds or bats) that happen to travel into the path of spinning blades.
Our wind power plants are known to strike and kill bats and birds, and occasionally strike and kill endangered or protected species, including protected golden or bald eagles. As a result, we will attempt to observe all industry guidelines and governmentally recommended best practices to avoid harm to protected species, such as avoiding structures with perches, avoiding guy wires that may kill birds or bats in flight, or avoiding lighting that may attract protected species at night. In addition, we will attempt to reduce the attractiveness of a site to predatory birds by site maintenance (e.g., by mowing or removal of animal and bird carcasses).
Where possible, we will obtain permits for incidental take of protected species. We hold such permits for some of our wind projects, particularly in Hawaii, where several species are endangered and protected by law. We are currently in discussions with the U.S. Fish & Wildlife Service ("USF&WS") about obtaining incidental take permits for bald and golden eagles at locations with low to moderate risk of such events. We are also discussing with USF&WS amending the incidental take permits for certain wind projects in Hawaii, where observed endangered species mortality has exceeded prior estimates and may exceed permit limits on such takings.
Excessive taking of protected species can result in requirements to implement mitigation strategies, including curtailment of operations. Our wind projects in Hawaii, several of which hold incidental take permits to authorize the incidental taking of small numbers of protected species, are subject to curtailment (i.e., reduction in operations) if excessive taking of protected species is detected through monitoring. At some of the projects in Hawaii, curtailment has been implemented, but not at levels that materially reduce electricity generation or revenues. Such curtailments (to protect bats) have reduced nighttime operation and limited operation to times when wind speeds are high enough to prevent bats from flying into a project’s blades. Based on continuing concerns about species other than bats, however, additional curtailments are possible at those locations.
35
We cannot guarantee that such curtailments will not have a material adverse effect on our business, financial condition, results of operations and cash flow.
Risks that are beyond our control, including but not limited to acts of terrorism or related acts of war, natural disasters, hostile cyber intrusions, theft or other catastrophic events, could have a material adverse effect on our business, financial condition, results of operations and cash flow.
Our solar generation facilities, wind power plants, or those that we otherwise acquire in the future, may be targets of terrorist activities that could cause environmental repercussions and/or result in full or partial disruption of the facilities’ ability to generate electricity. Hostile cyber intrusions, including those targeting information systems as well as electronic control systems used at the generating plants and for the related distribution systems, could severely disrupt business operations and result in loss of service to customers, as well as create significant expense to repair security breaches or system damage.
Furthermore, certain of our projects are located in active earthquake zones. The occurrence of a natural disaster, such as an earthquake, drought, flood or localized extended outages of critical utilities or transportation systems, or any critical resource shortages, affecting us could cause a significant interruption in our business, damage or destroy our facilities or those of our suppliers or the manufacturing equipment or inventory of our suppliers.
Additionally, certain of our power generation assets and equipment are at risk for theft and damage. For example, we are at risk for copper wire theft, especially at our international projects, due to an increased demand for copper in the United States and internationally. Theft of copper wire or solar panels can cause significant disruption to our operations for a period of months and can lead to operating losses at those locations. Damage to wind turbine equipment may also occur, either through natural events such as lightning strikes that damage blades or inground electrical systems used to collect electricity from turbines, or through vandalism, such as gunshots into towers or other generating equipment. Such damage can cause disruption of operations for unspecified periods which may lead to operating losses at those locations.
Any such terrorist acts, environmental repercussions or disruptions, natural disasters or theft incidents could result in a significant decrease in revenues or significant reconstruction, remediation or replacement costs, beyond what could be recovered through insurance policies, which could have a material adverse effect on our business, financial condition, results of operations and cash flow.
Our use and enjoyment of real property rights for our projects may be adversely affected by the rights of lienholders and leaseholders that are superior to those of the grantors of those real property rights to us.
Solar and wind projects generally are and are likely to be located on land occupied by the project pursuant to long-term easements and leases. The ownership interests in the land subject to these easements and leases may be subject to mortgages securing loans or other liens (such as tax liens) and other easement and lease rights of third parties (such as leases of oil or mineral rights) that were created prior to the project’s easements and leases. As a result, the project’s rights under these easements or leases may be subject, and subordinate, to the rights of those third parties. We perform title searches and obtain title insurance to protect ourselves against these risks. Such measures may, however, be inadequate to protect us against all risk of loss of our rights to use the land on which the wind projects are located, which could have a material adverse effect on our business, financial condition and results of operations.
Current or future litigation or administrative proceedings could have a material adverse effect on our business, financial condition and results of operations.
We have and continue to be involved in legal proceedings, administrative proceedings, claims and other litigation that arise in the ordinary course of business of operating our solar generation facilities and wind power plants. In. Individuals and interest groups may sue to challenge the issuance of a permit for a solar generation facility or wind power plant. In addition, a project may be subject to legal proceedings or claims contesting the operation of the wind projects. Unfavorable outcomes or developments relating to these proceedings, such as judgments for monetary damages, injunctions or denial or revocation of permits, could have a material adverse effect on our business, financial condition and results of operations. In addition, settlement of claims could adversely affect our financial condition and results of operations.
International operations subject us to political and economic uncertainties.
Our portfolio consists of solar and wind projects located in the United States and its unincorporated territories, Canada, the United Kingdom and Chile. In addition, since solar energy generation and other forms of clean energy are in the early stages of development and the industry is evolving rapidly, we could decide to expand into other international markets. As
36
a result, our activities are and will be subject to significant political and economic uncertainties that may adversely affect our operating and financial performance. These uncertainties include, but are not limited to:
• | the risk of a change in renewable power pricing policies, possibly with retroactive effect; |
• | measures restricting the ability of our facilities to access the grid to deliver electricity at certain times or at all; |
• | the macroeconomic climate and levels of energy consumption in the countries where we have operations; |
• | the comparative cost of other sources of energy; |
• | changes in taxation policies and/or the regulatory environment in the countries in which we have operations, including reductions to renewable power incentive programs; |
• | the imposition of currency controls and foreign exchange rate fluctuations; |
• | high rates of inflation; |
• | protectionist and other adverse public policies, including local content requirements, import/export tariffs, increased regulations or capital investment requirements; |
• | changes to land use regulations and permitting requirements; |
• | risk of nationalization or other expropriation of private enterprises and land; |
• | difficulty in timely identifying, attracting and retaining qualified technical and other personnel; |
• | difficulty competing against competitors who may have greater financial resources and/or a more effective or established localized business presence; |
• | difficulties with, and extra-normal costs of, recruiting and retaining local individuals skilled in international business operations; |
• | difficulty in developing any necessary partnerships with local businesses on commercially acceptable terms; and |
• | being subject to the jurisdiction of courts other than those of the United States, which courts may be less favorable to us. |
These uncertainties, many of which are beyond our control, could have a material adverse effect on our business, financial condition, results of operations and cash flow.
Changes in foreign withholding taxes could adversely affect our results of operations.
We conduct a portion of our operations in Canada, the United Kingdom and Chile, and may in the future expand our business into other foreign countries. We are subject to risks that foreign countries may impose additional withholding taxes or otherwise tax our foreign income. Currently, distributions of earnings and other payments, including interest, to us from our foreign projects could constitute ordinary dividend income taxable to the extent of our earnings and profits, which may be subject to withholding taxes imposed by the jurisdiction in which such entities are formed or operating. Any such withholding taxes will reduce the amount of after-tax cash we can receive. If those withholding taxes are increased, the amount of after-tax cash we receive will be further reduced.
We are exposed to foreign currency exchange risks because certain of our solar energy projects are located in foreign countries.
We generate a portion of our revenues and incur a portion of our expenses in currencies other than U.S. dollars. Changes in economic or political conditions in any of the countries in which we operate could result in exchange rate movement, new currency or exchange controls or other restrictions being imposed on our operations or expropriation. Because our financial results are reported in U.S. dollars, if we generate revenue or earnings in other currencies, the translation of those results into U.S. dollars can result in a significant increase or decrease in the amount of those revenues or earnings. To the extent that we are unable to match revenues received in foreign currencies with costs paid in the same currency, exchange rate fluctuations in any such currency could have an adverse effect on our profitability. Our debt service requirements are primarily in U.S. dollars even though a percentage of our cash flow is generated in other foreign currencies and therefore significant changes in the value of such foreign currencies relative to the U.S. dollar could have a material adverse effect on our financial condition and our ability to meet interest and principal payments on debts denominated in U.S. dollars. In addition to currency translation risks, we incur currency transaction risks whenever we or one of our projects enter into a purchase or sales transaction using a currency other than the local currency of the transacting entity.
Given the volatility of exchange rates, we cannot assure you that we will be able to effectively manage our currency transaction and/or translation risks. It is possible that volatility in currency exchange rates will have a material adverse effect on our financial condition or results of operations. We expect to experience economic losses and gains and negative and positive impacts on earnings as a result of foreign currency exchange rate fluctuations, particularly as a result of changes in the value of the Canadian dollar, the British pound and other currencies. We expect that our revenues denominated in non-U.S. dollar currencies will continue to increase in future periods.
37
Additionally, although a portion of our revenues and expenses are denominated in foreign currency, we will pay dividends to holders of our Class A common stock in U.S. dollars. The amount of U.S. dollar denominated dividends paid to our holders of our Class A common stock will therefore be exposed to currency exchange rate risk. Although we intend to enter into hedging arrangements to help mitigate some of this exchange rate risk, these arrangements may not be sufficient. Changes in the foreign exchange rates could have a material adverse effect on our results of operations and may adversely affect the amount of cash dividends paid by us to holders of our Class A common stock.
Our international operations require us to comply with anti-corruption laws and regulations of the United States government and various non-U.S. jurisdictions.
Doing business in multiple countries requires us and our subsidiaries to comply with the laws and regulations of the United States government and various non-U.S. jurisdictions. Our failure to comply with these rules and regulations may expose us to liabilities. These laws and regulations may apply to us, our subsidiaries, individual directors, officers, employees and agents, and those of SunEdison, and may restrict our operations, trade practices, investment decisions and partnering activities. In particular, our non-U.S. operations are subject to United States and foreign anti-corruption laws and regulations, such as the Foreign Corrupt Practices Act of 1977, as amended ("FCPA"). The FCPA prohibits United States companies and their officers, directors, employees and agents acting on their behalf from corruptly offering, promising, authorizing or providing anything of value to foreign officials for the purposes of influencing official decisions or obtaining or retaining business or otherwise obtaining favorable treatment. The FCPA also requires companies to make and keep books, records and accounts that accurately and fairly reflect transactions and dispositions of assets and to maintain a system of adequate internal accounting controls. As part of our business, we deal with state-owned business enterprises, the employees and representatives of which may be considered foreign officials for purposes of the FCPA. As a result, business dealings between our or SunEdison’s employees and any such foreign official could expose our company to the risk of violating anti-corruption laws even if such business practices may be customary or are not otherwise prohibited between our company and a private third party. Violations of these legal requirements are punishable by criminal fines and imprisonment, civil penalties, disgorgement of profits, injunctions, debarment from government contracts as well as other remedial measures. We have established policies and procedures designed to assist us and our personnel in complying with applicable United States and non-U.S. laws and regulations; however, we cannot assure you that these policies and procedures will completely eliminate the risk of a violation of these legal requirements, and any such violation (inadvertent or otherwise) could have a material adverse effect on our business, financial condition and results of operations.
In the future, we may acquire certain assets in which we have limited control over management decisions and our interests in such assets may be subject to transfer or other related restrictions.
We may seek to acquire additional assets in the future in which we own less than a majority of the related interests in the assets. In these investments, we will seek to exert a degree of influence with respect to the management and operation of assets in which we own less than a majority of the interests by negotiating to obtain positions on management committees or to receive certain limited governance rights, such as rights to veto significant actions. However, we may not always succeed in such negotiations, and we may be dependent on our co-venturers to operate such assets. Our co-venturers may not have the level of experience, technical expertise, human resources management and other attributes necessary to operate these assets optimally. In addition, conflicts of interest may arise in the future between us and our stockholders, on the one hand, and our co-venturers, on the other hand, where our co-venturers’ business interests are inconsistent with our interests and those of our stockholders. Further, disagreements or disputes between us and our co-venturers could result in litigation, which could increase our expenses and potentially limit the time and effort our officers and directors are able to devote to our business.
The approval of co-venturers also may be required for us to receive distributions of funds from assets or to sell, pledge, transfer, assign or otherwise convey our interest in such assets, or for us to acquire SunEdison’s interests in such co-ventures as an initial matter. Alternatively, our co-venturers may have rights of first refusal or rights of first offer in the event of a proposed sale or transfer of our interests in such assets. These restrictions may limit the price or interest level for our interests in such assets, in the event we want to sell such interests.
We may not be able to renew our sale-leasebacks on similar terms. If we are unable to renew a sale-leaseback on acceptable terms we may be required to remove the solar energy assets from the project site subject to the sale-leaseback transaction or, alternatively, we may be required to purchase the solar energy assets from the lessor at unfavorable terms.
Provided the lessee is not in default, customary end of lease term provisions for sale-leaseback transactions obligate the lessee to (i) renew the sale-leaseback assets at fair market value, (ii) purchase the solar energy assets at fair market value or (iii) return the solar energy assets to the lessor. The cost of acquiring or removing a significant number of solar energy assets
38
could be material. Further, we may not be successful in obtaining the additional financing necessary to purchase such solar energy assets from the lessor. Failure to renew our sale-leaseback transactions as they expire may have a material adverse effect on our business, financial condition, results of operations and cash flow.
The accounting treatment for many aspects of our solar energy business, and the wind energy business, is complex and any changes to the accounting interpretations or accounting rules governing our solar energy business or wind energy business could have a material adverse effect on our U.S. GAAP reported results of operations and financial results.
The accounting treatment for many aspects of our solar energy business and wind energy business is complex, and our future results could be adversely affected by changes in the accounting treatment applicable to our solar and wind energy businesses. In particular, any changes to the accounting rules regarding the following matters may require us to change the manner in which we operate and finance our business:
• | revenue recognition and related timing; |
• | intra-company contracts; |
• | operation and maintenance contracts; |
• | joint venture accounting, including the consolidation of joint venture entities and the inclusion or exclusion of their assets and liabilities on our balance sheet; |
• | long-term vendor agreements; and |
• | foreign holding company tax treatment. |
Negative public or community response to energy projects could adversely affect construction of our projects.
Negative public or community response to solar, wind and other clean energy projects, could adversely affect our ability to acquire and operate our projects. Our experience is that such opposition subsides over time after projects are completed and are operating, but there are cases where opposition, disputes and even litigation continue into the operating period and could lead to curtailment of a project or other project modifications.
The seasonality of our operations may affect our liquidity.
We will need to maintain sufficient financial liquidity to absorb the impact of seasonal variations in energy production or other significant events. Our principal sources of liquidity are cash generated from our operating activities, the cash retained by us for working capital purposes out of the gross proceeds of the two equity offerings and Senior Notes offering we made in January 2015 as well as our borrowing capacity under our New Revolver. Our quarterly results of operations may fluctuate significantly for various reasons, mostly related to economic incentives and weather patterns.
For instance, the amount of electricity our solar generation facilities produce is dependent in part on the amount of sunlight, or irradiation, where the assets are located. Because shorter daylight hours in winter months results in less irradiation, the generation of particular assets will vary depending on the season. The electricity produced and revenues generated by a wind power plant depend heavily on wind conditions, which are variable and difficult to predict. Operating results for projects vary significantly from period to period depending on the windiness during the periods in question. Additionally, to the extent more of our power generation assets are located in the northern or southern hemisphere, overall generation of our entire asset portfolio could be impacted by seasonality. Further, time-of-day pricing factors vary seasonally which contributes to variability of revenues. We expect our portfolio of power generation assets to generate the lowest amount of electricity during the fourth quarter. However, we expect aggregate seasonal variability to decrease if geographic diversity of our portfolio between the northern and southern hemisphere increases.
In addition, in Canada, the construction of solar generation facilities may be concentrated during the second half of the calendar year, largely due to periodic reductions of the applicable minimum FIT and the fact that the coldest winter months are January through March, which impacts the amount of construction that occurs. In the United States, customers will sometimes make purchasing decisions towards the end of the year in order to take advantage of tax credits or for other budgetary reasons. If we fail to adequately manage the fluctuations in the timing of our projects, our business, financial condition or results of operations could be materially affected. The seasonality of our energy production may create increased demands on our working capital reserves and borrowing capacity under our New Revolver during periods where cash generated from operating activities are lower. In the event that our working capital reserves and borrowing capacity under our New Revolver are insufficient to meet our financial requirements, or in the event that the restrictive covenants in our New Revolver restrict our access to such facilities, we may require additional equity or debt financing to maintain our solvency. Additional equity or debt financing may not be available when required or available on commercially favorable terms or on terms that are otherwise satisfactory to us, in which event our financial condition may be materially adversely affected.
39
The production of wind energy depends heavily on suitable wind conditions. If wind conditions are unfavorable or below our estimates, our electricity production, and therefore our revenue, may be substantially below our expectations.
The electricity produced and revenues generated by a wind power plant depend heavily on wind conditions, which are variable and difficult to predict. Operating results for projects vary significantly from period to period depending on the windiness during the periods in question. We have based our decisions about which sites to develop in part on the findings of long-term wind and other meteorological studies conducted in the proposed area, which measure the wind’s speed, prevailing direction and seasonal variations. Actual wind conditions at these sites, however, may not conform to the measured data in these studies and may be affected by variations in weather patterns, including any potential impact of climate change. Therefore, the electricity generated by our projects may not meet our anticipated production levels or the rated capacity of the turbines located there, which could adversely affect our business, financial condition and results of operations. In some quarters the wind resources at our operating projects, while within the range of our long-term estimates, have varied from the averages we expected. If the wind resources at a project are below the average level we expect, our rate of return for the project would be below our expectations and we would be adversely affected. Projections of wind resources also rely upon assumptions about turbine placement, interference between turbines and the effects of vegetation, land use and terrain, which involve uncertainty and require us to exercise considerable judgment. We or our consultants may make mistakes in conducting these wind and other meteorological studies. Any of these factors could cause our development sites to have less wind potential than we expected, or to cause us develop our sites in ways that do not optimize their potential, which could cause the return on our investment in these projects to be lower than expected.
If our wind energy assessments turn out to be wrong, our business could suffer a number of material adverse consequences, including:
• | our energy production and sales may be significantly lower than we predict; |
• | our hedging arrangements may be ineffective or more costly; |
• | we may not produce sufficient energy to meet our commitments to sell electricity or RECs and, as a result, we may have to buy electricity or RECs on the open market to cover our obligations or pay damages; and |
• | our projects may not generate sufficient cash flow to make payments of principal and interest as they become due on the notes and our project‑related debt, and we or First Wind Holdings may have difficulty obtaining financing for future projects. |
Changes in tax laws may limit the current benefits of solar and wind energy investment.
We face risks related to potential changes in tax laws that may limit the current benefits of solar and wind energy investment. As discussed in Item 1. Business - Government Incentives, government incentives provide significant support for renewable energy sources such as solar and wind energy, and a decrease in these tax benefits could increase the costs of investment in solar and wind energy. For example, in 2013 the Czech Republic and Spain announced retroactive taxes for solar energy producers. If these types of changes are enacted in other countries as well, the costs of solar energy may increase.
Additionally, we receive grant payments for specified energy property from the U.S. Department of the Treasury in lieu of tax credits pursuant to Section 1603 Grant. As a condition to claiming a Section 1063 Grant, we are required to maintain compliance with the terms of the Section 1603 program for a period of five years beginning on the date the eligible solar and wind energy property is placed in service. Failure to maintain compliance with the requirements of Section 1603 could result in recapture of all or a part of the amounts received under a Section 1603 Grant, plus interest.
The Company is an "emerging growth company" and may elect in future SEC filings to comply with reduced public company reporting requirements, which could make the Company's Class A common stock less attractive to stockholders.
We are an “emerging growth company,” as defined in the Jumpstart Our Business Startups Act, or the “JOBS Act.” For as long as we continue to be an emerging growth company, we may choose to take advantage of exemptions from various public company reporting requirements. These exemptions include, but are not limited to, (i) not being required to comply with the auditor attestation requirements of Section 404 of the Sarbanes-Oxley Act, (ii) reduced disclosure obligations regarding executive compensation in our periodic reports, proxy statements and registration statements, and (iii) exemptions from the requirements of holding a nonbinding advisory vote on executive compensation and stockholder approval of any golden parachute payments not previously approved. We have elected to take advantage of certain of the reduce disclosure obligations regarding financial statements and executive compensation. In addition, Section 107(b) of the JOBS Act also provides that an emerging growth company can take advantage of the extended transition period provided in Section 7(a)(2)(B) of the Securities Act for complying with new or revised accounting standards. In other words, an emerging growth company can delay the adoption of certain accounting standards until those standards would otherwise apply to private companies. We are choosing to
40
"opt in" to such extended transition period election under Section 107(b). Therefore we are electing to delay adoption of new or revised accounting standards, and as a result, we may choose not to comply with new or revised accounting standards on the relevant dates on which adoption of such standards is required for non-emerging growth companies. As a result of such election, our financial statements may not be comparable to the financial statements of other public companies.
We could be an emerging growth company for up to five years after the first sale of our common equity securities pursuant to an effective registration statement under the Securities Act, which such fifth anniversary will occur in 2019. However, if certain events occur prior to the end of such five-year period, including if we become a "large accelerated filer," our annual gross revenues exceed $1.0 billion or we issue more than $1.0 billion of non-convertible debt in any three-year period, we would cease to be an emerging growth company prior to the end of such five-year period. We have taken advantage of certain of the reduced disclosure obligations regarding financial statements and executive compensation and may elect to take advantage of other reduced burdens in future filings. As a result, the information that we provide to holders of our Class A common stock may be different than you might receive from other public reporting companies in which they hold equity interests. We cannot predict if investors will find our Class A common stock less attractive as a result of our reliance on these exemptions. If some investors find our Class A common stock less attractive as a result of any choice we make to reduce disclosure, there may be a less active trading market for our Class A common stock and the price for our Class A common stock may be more volatile.
If we are deemed to be an investment company, we may be required to institute burdensome compliance requirements and our activities may be restricted, which may make it difficult for us to complete strategic acquisitions or affect combinations.
If we are deemed to be an investment company under the Investment Company Act of 1940, or the "Investment Company Act," our business would be subject to applicable restrictions under the Investment Company Act, which could make it impractical for us to continue our business as contemplated.
We believe our company is not an investment company under Section 3(b)(1) of the Investment Company Act because we are primarily engaged in a non-investment company business, and we intend to conduct our operations so that we will not be deemed an investment company. However, if we were to be deemed an investment company, restrictions imposed by the Investment Company Act, including limitations on our capital structure and our ability to transact with affiliates, could make it impractical for us to continue our business as contemplated.
We incur increased costs as a result of being a publicly traded company.
As a public company, we incur additional legal, accounting and other expenses that have not been reflected in our Predecessor's historical financial statements. In addition, rules implemented by the SEC and the NASDAQ Global Select Market have imposed various requirements on public companies, including establishment and maintenance of effective disclosure and financial controls and changes in corporate governance practices. Our management and other personnel need to devote a substantial amount of time to these compliance initiatives. These rules and regulations result in our incurring legal and financial compliance costs and will make some activities more time-consuming and costly.
Our legal, accounting and other expenses relating to being a publicly traded company will be paid by SunEdison under the Management Services Agreement without a fee for 2014, and with the relevant service fees for 2015, 2016 and 2017 capped at $4.0 million, $7.0 million, and $9.0 million, respectively. The Management Services Agreement does not have a fixed term, but may be terminated by us in certain circumstances, including upon the earlier to occur of (i) the five-year anniversary of the date of the agreement and (ii) the end of any 12-month period ending on the last day of a calendar quarter during which we generated cash available for distribution in excess of $350 million. Following the termination of the Management Services Agreement we will be required to pay for these expenses directly.
41
Our failure to achieve and maintain effective internal control over financial reporting in accordance with Section 404 of the Sarbanes-Oxley Act as a public company could have a material adverse effect on our business and share price.
Prior to completion of our IPO on July 23, 2014, we had not operated as a public company and had not had to independently comply with Section 404(a) of the Sarbanes-Oxley Act. We are required to meet these standards in the course of preparing our financial statements as of and for the year ended December 31, 2015, and our management is required to report on the effectiveness of our internal control over financial reporting for such year. Additionally, once we are no longer an emerging growth company, as defined by the JOBS Act, our independent registered public accounting firm will be required pursuant to Section 404(b) of the Sarbanes-Oxley Act to attest to the effectiveness of our internal control over financial reporting on an annual basis. The rules governing the standards that must be met for our management to assess our internal control over financial reporting are complex and require significant documentation, testing and possible remediation.
Internal control over financial reporting is a process designed to provide reasonable assurance regarding the reliability of financial reporting and the preparation of financial statements in accordance with generally accepted accounting principles. We are currently in the process of reviewing, documenting and testing our internal control over financial reporting, but we are not currently in compliance with, and we cannot be certain when we will be able to implement the requirements of Section 404(a). We may encounter problems or delays in implementing any changes necessary to make a favorable assessment of our internal control over financial reporting. In addition, we may encounter problems or delays in completing the implementation of any requested improvements and receiving a favorable attestation in connection with the attestation to be provided by our independent registered public accounting firm after we cease to be an emerging growth company. If we cannot favorably assess the effectiveness of our internal control over financial reporting, or if our independent registered public accounting firm is unable to provide an unqualified attestation report on our internal controls after we cease to be an emerging growth company, investors could lose confidence in our financial information and the price of our Class A common stock could decline.
A material weakness is a deficiency, or combination of deficiencies, in internal control, such that there is a reasonable possibility that a material misstatement of the entity’s financial statements will not be prevented, or detected and corrected on a timely basis. A significant deficiency is a deficiency, or combination of deficiencies, in internal control that is less severe than a material weakness, yet important enough to merit attention by those charged with governance. The existence of any material weakness or significant deficiency would require management to devote significant time and incur significant expense to remediate any such material weaknesses or significant deficiencies and management may not be able to remediate any such material weaknesses or significant deficiencies in a timely manner. The existence of any material weakness in our internal control over financial reporting could also result in errors in our financial statements that could require us to restate our financial statements, cause us to fail to meet our reporting obligations and cause shareholders to lose confidence in our reported financial information, all of which could materially and adversely affect our business and share price.
Risks Related to our Relationship with SunEdison
SunEdison is our controlling stockholder and exercises substantial influence over TerraForm Power, and we are highly dependent on SunEdison.
SunEdison beneficially owns all of our outstanding Class B common stock. Each share of our outstanding Class B common stock entitles SunEdison to 10 votes on all matters presented to our stockholders. As a result of its ownership of our Class B common stock, SunEdison possesses approximately 91% of the combined voting power of our stockholders even though SunEdison only owns 50% of total shares outstanding (inclusive of Class A common stock, Class B common stock and Class B1 common stock). SunEdison has expressed its intention to maintain a controlling interest in us going forward. As a result of this ownership, SunEdison has a substantial influence on our affairs and its voting power will constitute a large percentage of any quorum of our stockholders voting on any matter requiring the approval of our stockholders. Such matters include the election of directors, the adoption of amendments to our amended and restated certificate of incorporation and bylaws and approval of mergers or sale of all or substantially all of our assets. This concentration of ownership may also have the effect of delaying or preventing a change in control of our company or discouraging others from making tender offers for our shares, which could prevent stockholders from receiving a premium for their shares. In addition, SunEdison, for so long as it and its controlled affiliates possess a majority of the combined voting power, has the power to appoint all of our directors. SunEdison also has a right to specifically designate up to two additional directors to our board of directors until such time as SunEdison and its controlled affiliates cease to own shares representing a majority voting power in us. SunEdison may cause corporate actions to be taken even if its interests conflict with the interests of our other stockholders (including holders of our Class A common stock).
Furthermore, we depend on the management and administration services provided by or under the direction of SunEdison under the Management Services Agreement. Other than personnel designated as dedicated to us, SunEdison
42
personnel and support staff that provide services to us under the Management Services Agreement are not required to, and we do not expect that they will, have as their primary responsibility the management and administration of our business or act exclusively for us. Under the Management Services Agreement, SunEdison has the discretion to determine which of its employees, other than the designated TerraForm Power personnel, will perform assignments required to be provided to us under the Management Services Agreement. Any failure to effectively manage our operations or to implement our strategy could have a material adverse effect on our business, financial condition, results of operations and cash flow. The Management Services Agreement will continue in perpetuity, until terminated in accordance with its terms. The non-compete provisions of the Management Services Agreement will survive termination indefinitely. In addition, in connection with its financing activities, SunEdison has pursued and may pursue various transactions that may impact us or the value of our Class A common stock, including pledges of our common stock held by SunEdison or its affiliates to secure debt or other obligations. SunEdison has pledged the shares of Class B common stock that it owns to its lenders under its credit facilities. If the lenders foreclose on these shares, the market price of our shares of Class A common stock could be materially adversely affected." In addition, SunEdison may enter into agreements with financing entities for the construction and operation of Class Right Projects that could include obligations by us to purchase Call Right Projects in certain limited circumstances.
The Support Agreement provides us the option to purchase additional solar projects that have Projected FTM CAFD of at least $75.0 million from the completion of our IPO through the end of 2015 and $100.0 million during 2016, representing aggregate additional Projected FTM CAFD of $175.0 million. The Support Agreement also provides us a right of first offer with respect to the ROFO Projects. Additionally, we depend upon SunEdison for the provision of management and administration services at all of our facilities. Any failure by SunEdison to perform its requirements under these arrangements or the failure by us to identify and contract with replacement service providers, if required, could adversely affect the operation of our facilities and have a material adverse effect on our business, financial condition, results of operations and cash flow.
The departure of some or all of SunEdison’s employees, particularly executive officers or key employees, could prevent us from achieving our objectives.
Our growth strategy relies on our and SunEdison’s executive officers and key employees for their strategic guidance and expertise in the selection of projects that we may acquire in the future. Because the solar energy industry and wind energy industry are relatively new, there is a scarcity of experienced executives and employees in these industries and the clean energy industry more widely. Our future success will depend on the continued service of these individuals. SunEdison has experienced departures of key professionals and personnel in the past and may do so in the future, and we cannot predict the impact that any such departures will have on our ability to achieve our objectives. The departure of a significant number of SunEdison’s professionals or a material portion of its employees who perform services for us or on our behalf, or the failure to appoint qualified or effective successors in the event of such departures, could have a material adverse effect on our ability to achieve our objectives. The Management Services Agreement does not require SunEdison to maintain the employment of any of its professionals or, except with respect to the dedicated TerraForm Power personnel, to cause any particular professional to provide services to us or on our behalf and SunEdison may terminate the employment of any professional.
Our organizational and ownership structure may create significant conflicts of interest that may be resolved in a manner that is not in our best interests or the best interests of holders of our Class A common stock and that may have a material adverse effect on our business, financial condition, results of operations and cash flow.
Our organizational and ownership structure involves a number of relationships that may give rise to certain conflicts of interest between us and holders of our Class A common stock, on the one hand, and SunEdison, on the other hand. We have entered into the Management Services Agreement with SunEdison. Our executive officers are employees of SunEdison and certain of them will continue to have equity interests in SunEdison and, accordingly, the benefit to SunEdison from a transaction between us and SunEdison will proportionately inure to their benefit as holders of equity interests in SunEdison. SunEdison is a related party under the applicable securities laws governing related party transactions and may have interests which differ from our interests or those of holders of our Class A common stock, including with respect to the types of acquisitions made, the timing and amount of dividends by TerraForm Power, the reinvestment of returns generated by our operations, the use of leverage when making acquisitions and the appointment of outside advisors and service providers. Any material transaction between us and SunEdison (including the acquisition of the Call Right Projects and any ROFO Projects) are subject to our related party transaction policy, which will require prior approval of such transaction by our Corporate Governance and Conflicts Committee. Those of our executive officers who continue to have economic interests in SunEdison may be conflicted when advising our Corporate Governance and Conflicts Committee or otherwise participating in the negotiation or approval of such transactions. These executive officers have significant project- and industry-specific expertise that could prove beneficial to our Corporate Governance and Conflicts Committee’s decision-making process and the absence of such strategic guidance could have a material adverse effect on the Corporate Governance and Conflicts Committee’s ability to evaluate any such transaction. Furthermore, the creation of our Corporate Governance and Conflicts Committee and our
43
related party transaction approval policy may not insulate us from derivative claims related to related party transactions and the conflicts of interest described in this risk factor. Regardless of the merits of such claims, we may be required to expend significant management time and financial resources in the defense thereof. Additionally, to the extent we fail to appropriately deal with any such conflicts, it could negatively impact our reputation and ability to raise additional funds and the willingness of counterparties to do business with us, all of which could have a material adverse effect on our business, financial condition, results of operations and cash flow.
The holder or holders of our IDRs may elect to cause Terra LLC to issue Class B1 units to it or them in connection with a resetting of target distribution levels related to the IDRs, without the approval of our Corporate Governance and Conflicts Committee or the holders of Terra LLC’s units, us as manager of Terra LLC, or our board of directors (or any committee thereof). This could result in lower distributions to holders of our Class A common stock.
The holder or holders of a majority of the IDRs (currently SunEdison through a wholly owned subsidiary) have the right, if the Subordination Period has expired and if we have made cash distributions in excess of the then-applicable Third Target Distribution for each of the prior four consecutive fiscal quarters, to reset the initial target distribution levels at higher levels based on Terra LLC’s cash distribution levels at the time of the exercise of the reset election. The right to reset the target distribution levels may be exercised without the approval of the holders of Terra LLC’s units, us, as manager of Terra LLC, or our board of directors (or any committee thereof). Following a reset election, a baseline distribution amount will be calculated as an amount equal to the average cash distribution per Class A unit, Class B1 unit and Class B unit for the two consecutive fiscal quarters immediately preceding the reset election (such amount is referred to as the “Reset Minimum Quarterly Distribution”), and the target distribution levels will be reset to correspondingly higher levels based on percentage increases above the Reset Minimum Quarterly Distribution.
In connection with the reset election, the holders of the IDRs will receive Terra LLC Class B1 units and shares of our Class B1 common stock. Therefore, the reset of the IDRs will dilute existing stockholders’ ownership. This dilution of ownership may cause dilution of future distributions per share as a higher percentage of distributions per share would go to SunEdison or a future owner of the IDRs if the IDRs are sold.
We anticipate that SunEdison would exercise this reset right in order to facilitate acquisitions or internal growth projects that would not be sufficiently accretive to cash distributions without such conversion. However, it is possible that SunEdison (or another holder) could exercise this reset election at a time when Terra LLC is experiencing declines in aggregate cash distributions or is expected to experience declines in its aggregate cash distributions. In such situations, the holder of the IDRs may desire to be issued Class B1 units rather than retain the right to receive incentive distributions based on the initial target distribution levels. As a result, a reset election may cause the Company (which holds all of Terra LLC’s Class A units), and, in turn, holders of our Class A common stock to experience a reduction in the amount of cash distributions that they would have otherwise received had Terra LLC not issued new Class B1 units to the holders of the IDRs in connection with resetting the target distribution levels.
The IDRs may be transferred to a third party without the consent of holders of Terra LLC’s units, us, as manager of Terra LLC, or our board of directors (or any committee thereof).
SunEdison may not sell, transfer, exchange, pledge (other than as collateral under its credit facilities) or otherwise dispose of the IDRs to any third party (other than its controlled affiliates) until after it has satisfied its $175.0 million aggregate Projected FTM CAFD commitment to us in accordance with the Support Agreement. SunEdison has pledged the IDRs as collateral under its existing credit agreement and a margin loan agreement, but the IDRs may not be transferred upon foreclosure until after SunEdison has satisfied its Projected FTM CAFD commitment to us. After that period, SunEdison may transfer the IDRs to a third party at any time without the consent of the holders of Terra LLC’s units, us, as manager of Terra LLC, or our board of directors (or any committee thereof). However, SunEdison has granted us a right of first refusal with respect to any proposed sale of IDRs to a third party (other than its controlled affiliates), which we may exercise to purchase the IDRs proposed to be sold on the same terms offered to such third party at any time within 30 days after we receive written notice of the proposed sale and its terms. If SunEdison transfers the IDRs to a third party, SunEdison would not have the same incentive to grow our business and increase quarterly distributions to holders of Class A common stock over time. For example, a transfer of IDRs by SunEdison could reduce the likelihood of SunEdison accepting offers made by us relating to assets owned by SunEdison, as it would have less of an economic incentive to grow our business, which in turn would impact our ability to grow our portfolio.
44
If we incur material tax liabilities, distributions to holders of our Class A common stock may be reduced, without any corresponding reduction in the amount of distributions paid to SunEdison or other holders of the IDRs, Class B units and Class B1 units.
We are entirely dependent upon distributions we receive from Terra LLC in respect of the Class A units held by us for payment of our expenses and other liabilities. We must make provisions for the payment of our income tax liabilities, if any, before we can use the cash distributions we receive from Terra LLC to make distributions to our Class A common stockholders. If we incur material tax liabilities, our distributions to holders of our Class A common stock may be reduced. However, the cash available to make distributions to the holders of the Class B units and IDRs issued by Terra LLC (all of which are currently held by SunEdison), or to the holders of any Class B1 units that may be issued by Terra LLC in connection with an IDR reset or otherwise, will not be reduced by the amount of our tax liabilities. As a result, if we incur material tax liabilities, distributions to holders of our Class A common stock may be reduced, without any corresponding reduction in the amount of distributions paid to SunEdison or other holders of the IDRs, Class B units and Class B1 units of Terra LLC.
Our ability to terminate the Management Services Agreement early will be limited.
The Management Services Agreement provides that we may terminate the agreement upon 30 days prior written notice to SunEdison upon the occurrence of any of the following: (i) SunEdison defaults in the performance or observance of any material term, condition or covenant contained therein in a manner that results in material harm to us and the default continues unremedied for a period of 30 days after written notice thereof is given to SunEdison; (ii) SunEdison engages in any act of fraud, misappropriation of funds or embezzlement that results in material harm to us; (iii) SunEdison is grossly negligent in the performance of its duties under the agreement and such negligence results in material harm to us; (iv) upon the happening of certain events relating to the bankruptcy or insolvency of SunEdison; (v) upon the earlier to occur of the five-year anniversary of the date of the agreement and the end of any 12-month period ending on the last day of a calendar quarter during which we generated cash available for distribution in excess of $350.0 million; (vi) on such date as SunEdison and its affiliates no longer beneficially hold more than 50% of the voting power of our capital stock; and (v) upon the date that SunEdison experiences a change in control. Furthermore, if we request an amendment to the scope of services provided by SunEdison under the Management Services Agreement and we are not able to agree with SunEdison as to a change to the service fee resulting from a change in the scope of services within 180 days of the request, we will be able to terminate the agreement upon 30 days’ prior notice to SunEdison.
We will not be able to terminate the agreement for any other reason, and the agreement continues in perpetuity until terminated in accordance with its terms. The Management Services Agreement includes non-compete provisions that prohibit us from engaging in certain activities competitive with SunEdison’s power project development and construction business. These non-compete provisions will survive termination indefinitely. If SunEdison’s performance does not meet the expectations of investors, and we are unable to terminate the Management Services Agreement, the market price of our Class A common stock could suffer.
If SunEdison terminates the Management Services Agreement or defaults in the performance of its obligations under the agreement we may be unable to contract with a substitute service provider on similar terms, or at all.
We will rely on SunEdison to provide us with management services under the Management Services Agreement and will not have independent executive, senior management or other personnel. The Management Services Agreement provides that SunEdison may terminate the agreement upon 180 days prior written notice of termination to us if we default in the performance or observance of any material term, condition or covenant contained in the agreement in a manner that results in material harm to SunEdison and the default continues unremedied for a period of 30 days after written notice of the breach is given to us. If SunEdison terminates the Management Services Agreement or defaults in the performance of its obligations under the agreement, we may be unable to contract with a substitute service provider on similar terms or at all, and the costs of substituting service providers may be substantial. In addition, in light of SunEdison’s familiarity with our assets, a substitute service provider may not be able to provide the same level of service due to lack of preexisting synergies. If we cannot locate a service provider that is able to provide us with substantially similar services as SunEdison does under the Management Services Agreement on similar terms, it would likely have a material adverse effect on our business, financial condition, results of operation and cash flow.
SunEdison may offer certain Call Right Projects to third parties or remove Call Right Projects identified in the Support Agreement and we must still agree on a number of additional matters covered by the Support Agreement.
Pursuant to the Support Agreement, SunEdison has provided us with the right, but not the obligation, to purchase for cash certain solar generation facilities from its project pipeline with aggregate Projected FTM CAFD (as defined below) of at
45
least $175.0 million by the end of 2016. The Support Agreement identifies certain such facilities, which we believe will collectively satisfy a majority of the total Projected FTM CAFD commitment. SunEdison may, however, remove a project from the Call Right Project list effective upon notice to us, if, in its reasonable discretion, a project is unlikely to be successfully completed. In that case, SunEdison will be required to replace such project with one or more additional reasonably equivalent projects that have a similar economic profile. Additionally, in connection with the First Wind acquisition, we entered into the Intercompany Agreement with SunEdison, under which we were granted additional call rights with respect to certain power plants in the First Wind pipeline, which represent an additional 1.6 GW of wind and solar generation assets. These additional Call Right Projects under the Intercompany Agreement do not go towards satisfying SunEdison’s $175.0 million CAFD commitment. As of February 20, 2015, the total nameplate capacity of the power plants to which we have call rights under both the Intercompany Agreement and the Support Agreement is 3.4 GW.
The Support Agreement also provides that SunEdison is required to offer us additional qualifying Call Right Projects from its pipeline on a quarterly basis until we have acquired Call Right Projects that are projected to generate the specified minimum amount of Projected FTM CAFD for each of the periods covered by the Support Agreement. These additional Call Right Projects must satisfy certain criteria, include being subject to a fully-executed PPA with a counterparty that, in our reasonable discretion, is creditworthy. The price for each Call Right Project will be the fair market value. The Support Agreement provides that we will work with SunEdison to mutually agree on the fair market value and Projected FTM CAFD of each Call Right Project within a reasonable time after it is added to the list of identified Call Right Projects. If we are unable to agree on the fair market value or Projected FTM CAFD for a project within 90 calendar days after it is added to the list (or such shorter period as will still allow us to complete the call right exercise process), we or SunEdison, upon written notice from either party, will engage a third-party advisor to determine the disputed item so that such material economic terms reflect common practice in the relevant market. The other economic terms with respect to our purchase of a Call Right Project will also be determined by mutual agreement or, if we are unable to reach agreement, by a third-party advisor. We may not achieve all of the expected benefits from the Support Agreement if we are unable to mutually agree with SunEdison with respect to these matters. Until the price for a Call Right Project is agreed or determined, in the event SunEdison receives a bona fide offer for a Call Right Project from a third party, we have the right to match the price offered by such third party and acquire such Call Right Project on the terms SunEdison could obtain from the third party. In addition, our effective remedies under the Support Agreement may also be limited in the event that a material dispute with SunEdison arises under the terms of the Support Agreement.
In addition, SunEdison has agreed to grant us a right of first offer on any of the ROFO Projects that it determines to sell or otherwise transfer during the six-year period following the completion of our IPO. Under the terms of the Support Agreement, SunEdison agrees to negotiate with us in good faith, for a period of 30 days, to reach an agreement with respect to any proposed sale of a ROFO Project for which we have exercised our right of first offer before it may sell or otherwise transfer such ROFO Project to a third party. However, SunEdison will not be obligated to sell any of the ROFO Projects and, as a result, we do not know when, if ever, any ROFO Projects will be offered to us. Furthermore, in the event that SunEdison elects to sell ROFO Projects, SunEdison will not be required to accept any offer we make and may choose to sell the assets to a third party or not sell the assets at all.
The liability of SunEdison is limited under our arrangements with it and we have agreed to indemnify SunEdison against claims that it may face in connection with such arrangements, which may lead it to assume greater risks when making decisions relating to us than it otherwise would if acting solely for its own account.
Under the Management Services Agreement, SunEdison will not assume any responsibility other than to provide or arrange for the provision of the services described in the Management Services Agreement in good faith. In addition, under the Management Services Agreement, the liability of SunEdison and its affiliates will be limited to the fullest extent permitted by law to conduct involving bad faith, fraud, willful misconduct or gross negligence or, in the case of a criminal matter, action that was known to have been unlawful. In addition, we have agreed to indemnify SunEdison to the fullest extent permitted by law from and against any claims, liabilities, losses, damages, costs or expenses incurred by an indemnified person or threatened in connection with our operations, investments and activities or in respect of or arising from the Management Services Agreement or the services provided by SunEdison, except to the extent that the claims, liabilities, losses, damages, costs or expenses are determined to have resulted from the conduct in respect of which such persons have liability as described above. These protections may result in SunEdison tolerating greater risks when making decisions than otherwise would be the case, including when determining whether to use leverage in connection with acquisitions. The indemnification arrangements to which SunEdison is a party may also give rise to legal claims for indemnification that are adverse to us or holders of our Class A common stock.
46
Risks Inherent in an Investment in TerraForm Power, Inc.
We may not be able to continue paying comparable or growing cash dividends to holders of our Class A common stock in the future.
The amount of our cash available for distribution principally depends upon the amount of cash we generate from our operations, which will fluctuate from quarter to quarter based on, among other things:
• | our ability to integrate the First Wind assets and realize the anticipated benefits of the First Wind acquisition; |
• | counterparties’ to our offtake agreements willingness and ability to fulfill their obligations under such agreements; |
• | price fluctuations, termination provisions and buyout provisions related to our offtake agreements; |
• | our ability to enter into contracts to sell power on acceptable terms as our offtake agreements expire; |
• | delays or unexpected costs during the completion of construction of certain projects we intend to acquire; |
• | our ability to successfully identify, evaluate and consummate acquisitions; |
• | government regulation, including compliance with regulatory and permit requirements and changes in market rules, rates, tariffs and environmental laws; |
• | operating and financial restrictions placed on us and our subsidiaries related to agreements governing our indebtedness and other agreements of certain of our subsidiaries and project-level subsidiaries generally and in our New Revolver; |
• | our ability to borrow additional funds and access capital markets, as well as our substantial indebtedness and the possibility that we may incur additional indebtedness going forward; |
• | our ability to compete against traditional and renewable energy companies; |
• | hazards customary to the power production industry and power generation operations such as unusual weather conditions, catastrophic weather-related or other damage to facilities, unscheduled generation outages, maintenance or repairs, interconnection problems or other developments, environmental incidents, or electric transmission constraints and the possibility that we may not have adequate insurance to cover losses as a result of such hazards; |
• | our ability to expand into new business segments or new geographies; and |
• | our ability to operate our businesses efficiently, manage capital expenditures and costs tightly, manage risks related to international operations and generate earnings and cash flow from our asset-based businesses in relation to our debt and other obligations. |
As a result of all these factors, we cannot guarantee that we will have sufficient cash generated from operations to pay a specific level of cash dividends to holders of our Class A common stock. Furthermore, holders of our Class A common stock should be aware that the amount of cash available for distribution depends primarily on our cash flow, and is not solely a function of profitability, which is affected by non-cash items. We may incur other expenses or liabilities during a period that could significantly reduce or eliminate our cash available for distribution and, in turn, impair our ability to pay dividends to holders of our Class A common stock during the period. Because we are a holding company, our ability to pay dividends on our Class A common stock is limited by restrictions on the ability of our subsidiaries to pay dividends or make other distributions to us, including restrictions under the terms of the agreements governing project-level financing. Our project-level financing agreements prohibit distributions to us unless certain specific conditions are met, including the satisfaction of financial ratios. Our New Revolver also restricts our ability to declare and pay dividends if an event of default has occurred and is continuing or if the payment of the dividend would result in an event of default.
To the extent we issue additional equity securities in connection with any acquisitions or growth capital expenditures, the payment of dividends on these additional equity securities may increase the risk that we will be unable to maintain or increase our per share dividend. There are no limitations in our amended and restated certificate of incorporation (other than a specified number of authorized shares) on our ability to issue equity securities, including securities ranking senior to our common stock. The incurrence of bank borrowings or other debt by Terra Operating, LLC or by our project-level subsidiaries to finance our growth strategy will result in increased interest expense and the imposition of additional or more restrictive covenants which, in turn, may impact the cash distributions we distribute to holders of our Class A common stock.
Terra LLC’s cash available for distribution will likely fluctuate from quarter to quarter, in some cases significantly, due to seasonality. As result, we may cause Terra LLC to reduce the amount of cash it distributes to its members in a particular quarter to establish reserves to fund distributions to its members in future periods for which the cash distributions we would normally receive from Terra LLC would otherwise be insufficient to fund our quarterly dividend. If we fail to cause Terra LLC to establish sufficient reserves, we may not be able to maintain our quarterly dividend with respect to a quarter adversely affected by seasonality.
Finally, dividends to holders of our Class A common stock will be paid at the discretion of our board of directors. Our board of directors may decrease the level of or entirely discontinue payment of dividends.
47
We are a holding company and our only material asset is our interest in Terra LLC, and we are accordingly dependent upon distributions from Terra LLC and its subsidiaries to pay dividends and taxes and other expenses.
TerraForm Power is a holding company and has no material assets other than its ownership of membership interests in Terra LLC, a holding company that will have no material assets other than its interest in Terra Operating LLC, whose sole material assets are the solar generation facilities and wind power plants that comprise our portfolio and the projects that we subsequently acquire. TerraForm Power, Terra LLC and Terra Operating LLC have no independent means of generating revenue. We intend to cause Terra Operating LLC’s subsidiaries to make distributions to Terra Operating LLC and, in turn, make distributions to Terra LLC, and, Terra LLC, in turn, to make distributions to TerraForm Power in an amount sufficient to cover all applicable taxes payable and dividends, if any, declared by us. To the extent that we need funds to pay a quarterly cash dividend to holders of our Class A common stock or otherwise, and Terra Operating LLC or Terra LLC is restricted from making such distributions under applicable law or regulation or is otherwise unable to provide such funds (including as a result of Terra Operating LLC’s operating subsidiaries being unable to make distributions), it could materially adversely affect our liquidity and financial condition and limit our ability to pay dividends to holders of our Class A common stock.
Market interest rates may have an effect on the value of our Class A common stock.
One of the factors that influences the price of shares of our Class A common stock will be the effective dividend yield of such shares (i.e., the yield as a percentage of the then market price of our shares) relative to market interest rates. An increase in market interest rates, which are currently at low levels relative to historical rates, may lead prospective purchasers of shares of our Class A common stock to expect a higher dividend yield. If market interest rates increase and we are unable to increase our dividend in response, including due to an increase in borrowing costs, insufficient cash available for distribution or otherwise, investors may seek alternative investments with higher yield, which would result in selling pressure on, and a decrease in the market price of, our Class A common stock. As a result, the price of our Class A common stock may decrease as market interest rates increase.
The market price and marketability of our shares may from time to time be significantly affected by numerous factors beyond our control, which may adversely affect our ability to raise capital through future equity financings.
The market price of our shares may fluctuate significantly. Many factors that are beyond our control may significantly affect the market price and marketability of our shares and may adversely affect our ability to raise capital through equity financings. These factors include, but are not limited to, the following:
• | price and volume fluctuations in the stock markets generally; |
• | significant volatility in the market price and trading volume of securities of registered investment companies, business development companies or companies in our sectors, which may not be related to the operating performance of these companies; |
• | changes in our earnings or variations in operating results; |
• | changes in regulatory policies or tax law; |
• | operating performance of companies comparable to us; and |
• | loss of funding sources. |
We are a “controlled company,” controlled by SunEdison, whose interest in our business may be different from ours or the holders of our Class A common stock.
Each share of our Class B common stock entitles SunEdison or its controlled affiliates to 10 votes on matters presented to our stockholders generally. SunEdison owns all of our Class B common stock. Therefore, SunEdison will control a majority of the vote on all matters submitted to a vote of the stockholders, including the election of our directors, for the foreseeable future even if its ownership of our Class B common stock represents less than 50% of the outstanding Class A common stock, Class B common stock and Class B1 common stock on a combined basis. As a result, we are and will likely continue to be considered a “controlled company” for the purposes of the NASDAQ Global Select Market listing requirements. As a “controlled company,” we are permitted to opt out of the NASDAQ Global Select Market listing requirements that require (i) a majority of the members of our board of directors to be independent, (ii) that we establish a compensation committee and a nominating and governance committee, each comprised entirely of independent directors, and (iii) an annual performance evaluation of the nominating and governance and compensation committees. We rely on exceptions with respect to having a majority of independent directors, establishing a compensation committee or nominating committee and annual performance evaluations of such committees.
48
The NASDAQ Global Select Market listing requirements are intended to ensure that directors who meet the independence standard are free of any conflicting interest that could influence their actions as directors. As further described above in “-Risks Related to our Relationship with SunEdison,” it is possible that the interests of SunEdison may in some circumstances conflict with our interests and the interests of holders of our Class A common stock. Should SunEdison’s interests differ from those of other stockholders, the other stockholders may not have the same protections afforded to stockholders of companies that are subject to all of the corporate governance rules for publicly-listed companies. Our status as a controlled company could make our Class A common stock less attractive to some investors or otherwise harm our stock price.
Provisions of our charter documents or Delaware law could delay or prevent an acquisition of us, even if the acquisition would be beneficial to holders of our Class A common stock, and could make it more difficult to change management.
Provisions of our amended and restated certificate of incorporation and bylaws may discourage, delay or prevent a merger, acquisition or other change in control that holders of our Class A common stock may consider favorable, including transactions in which such stockholders might otherwise receive a premium for their shares. This is because these provisions may prevent or frustrate attempts by stockholders to replace or remove members of our management. These provisions include:
• | a prohibition on stockholder action through written consent once SunEdison ceases to hold a majority of the combined voting power of our common stock; |
• | a requirement that special meetings of stockholders be called upon a resolution approved by a majority of our directors then in office; |
• | the right of SunEdison as the holder of our Class B common stock, to appoint up to two additional directors to our board of directors; |
• | advance notice requirements for stockholder proposals and nominations; and |
• | the authority of the board of directors to issue preferred stock with such terms as the board of directors may determine. |
Section 203 of the Delaware General Corporation Law, or the “DGCL,” prohibits a publicly held Delaware corporation from engaging in a business combination with an interested stockholder (generally a person that together with its affiliates owns or within the last three years has owned 15% of voting stock), for a period of three years after the date of the transaction in which the person became an interested stockholder, unless the business combination is approved in a prescribed manner. As a result of these provisions in our charter documents and Delaware law, the price investors may be willing to pay in the future for shares of our Class A common stock may be limited.
Additionally, in order to ensure compliance with Section 203 of the FPA, our amended and restated certificate of incorporation prohibits any person from acquiring, without prior FERC authorization or the written consent of our board of directors, in purchases other than secondary market transactions (i) an amount of our Class A or Class B1 common stock that, after giving effect to such acquisition, would allow such purchaser together with its affiliates (as understood for purposes of FPA Section 203) to exercise 10% or more of the total voting power of the outstanding shares of our Class A, Class B and Class B1 common stock in the aggregate, or (ii) an amount of our Class A common stock or Class B1 common stock as otherwise determined by our board of directors sufficient to allow such purchaser together with its affiliates to exercise control over our company. Any acquisition of our Class A common stock or Class B1 common stock in violation of this prohibition shall not be effective to transfer record, beneficial, legal or any other ownership of such common stock, and the transferee shall not be entitled to any rights as a stockholder with respect to such common stock (including, without limitation, the right to vote or to receive dividends with respect thereto). Any acquisition of 10% or greater voting power or a change of control with respect to us or any of our solar and wind generation project companies could require prior authorization from FERC under Section 203 the FPA. Furthermore, a “holding company” (as defined in PUHCA) and its “affiliates” (as defined in PUHCA) may be subject to restrictions on the acquisition of our Class A common stock or Class B1 common stock in secondary market transactions to which other acquirors are not subject. A purchaser of our securities which is a “holding company” or an “affiliate” or “associate company” of such a “holding company” (as defined in PUHCA) should seek their own legal counsel to determine whether a given purchase of our securities may require prior FERC approval.
Investors may experience dilution of their ownership interest due to the future issuance of additional shares of our Class A common stock.
We are in a capital intensive business, and may not have sufficient funds to finance the growth of our business, future acquisitions or to support our projected capital expenditures. As a result, we may require additional funds from further equity or debt financings, including tax equity financing transactions or sales of preferred shares or convertible debt to complete future acquisitions, expansions and capital expenditures and pay the general and administrative costs of our business. In the future, we may issue our previously authorized and unissued securities, resulting in the dilution of the ownership interests of purchasers of
49
our Class A common stock offered hereby. Under our amended and restated certificate of incorporation, we are authorized to issue 850,000,000 shares of Class A common stock, 140,000,000 shares of Class B common stock, 260,000,000 shares of Class B1 common stock and 50,000,000 shares of preferred stock with preferences and rights as determined by our board of directors. The potential issuance of additional shares of common stock or preferred stock or convertible debt may create downward pressure on the trading price of our Class A common stock. We may also issue additional shares of our Class A common stock or other securities that are convertible into or exercisable for our Class A common stock in future public offerings or private placements for capital raising purposes or for other business purposes, potentially at an offering price, conversion price or exercise price that is below the trading price of our Class A common stock.
If securities or industry analysts do not publish or cease publishing research or reports about us, our business or our market, or if they change their recommendations regarding our Class A common stock adversely, the stock price and trading volume of our Class A common stock could decline.
The trading market for our Class A common stock will be influenced by the research and reports that industry or securities analysts may publish about us, our business, our market or our competitors. If any of the analysts who may cover us change their recommendation regarding our Class A common stock adversely, or provide more favorable relative recommendations about our competitors, the price of our Class A common stock would likely decline. If any analyst who may cover us were to cease coverage of our company or fail to regularly publish reports on us, we could lose visibility in the financial markets, which in turn could cause the stock price or trading volume of our Class A common stock to decline.
Future sales of our common stock by SunEdison, Riverstone or the Private Placement Purchasers may cause the price of our Class A common stock to fall.
The market price of our Class A common stock could decline as a result of sales of such shares (issuable to SunEdison or Riverstone upon the exchange of some or all of its Class B units or Class B1 units of Terra LLC) by SunEdison, Riverstone, the IPO Private Placement Purchasers or the Acquisition Private Placement Purchasers (together with the IPO Private Placement Purchasers, the “Private Placement Purchasers”) in the market, or the perception that these sales could occur.
The market price of our Class A common stock may also decline as a result of SunEdison disposing or transferring some or all of our outstanding Class B common stock, which disposals or transfers would reduce SunEdison’s ownership interest in, and voting control over, us. These sales might also make it more difficult for us to sell equity securities at a time and price that we deem appropriate. In addition, in connection with the First Wind acquisition, SunEdison issued $336.5 million of seller notes that, pursuant to their terms, may be converted into shares of our Class A common stock that are issued in exchange for Class B units and Class B common stock currently held by SunEdison.
SunEdison, certain of its affiliates, Riverstone and the IPO Private Placement Purchasers have certain registration rights with respect to shares of our Class A common stock issued or issuable upon the exchange of Class B units or Class B1 units of Terra LLC. The presence of additional shares of our Class A common stock trading in the public market, including as a result of the exercise of registration rights, may have a material adverse effect on the market price of our securities. We filed a registration statement relating to the resale of the shares of our Class A common stock issued in the Acquisition Private Placement and such shares are freely tradable without restriction by the Acquisition Private Placement Purchasers.
SunEdison has pledged the shares of Class B common stock that it owns to its lenders under its credit facilities. If the lenders foreclose on these shares, the market price of our shares of Class A common stock could be materially adversely affected.
SunEdison has pledged approximately 25% of the shares of Class B common stock, and a corresponding amount of the Class B units of Terra LLC, that it owns to its lenders as security under its credit facility with Wells Fargo Bank, National Association, as administrative agent, Goldman Sachs Bank USA and Deutsche Bank Securities Inc., as joint lead arrangers and joint syndication agents, Goldman Sachs Bank USA, Deutsche Bank Securities Inc., Wells Fargo Securities, LLC and Macquarie Capital (USA) Inc., as joint bookrunners, and the lenders identified in the credit agreement. If SunEdison breaches certain covenants and obligations in its credit facility, an event of default could result and the lenders could exercise their right to accelerate all the debt under the credit facility and foreclose on the pledged shares (and a corresponding number of Class B units). Any future sale of the shares of Class A common stock received upon foreclosure of the pledged securities after the expiration of the lock-up periods could cause the market price of our Class A common stock to decline. In addition, SunEdison has pledged approximately 75% of the shares of Class B common stock, and a corresponding amount of the Class B units of Terra LLC, that it owns, as security for the margin loan agreement and exchangeable note it entered into in connection with the First Wind acquisition. If there is an event of default on the margin loan agreement or the exchangeable note, it may result in the sale of a significant number of shares of our Class A common stock, including during the 90-day lock-up period, which
50
could cause the market price of our Class A common stock to decline. In addition, because SunEdison owns a majority of the combined voting power of our common stock, the occurrence of an event of default, foreclosure, and a subsequent sale of all, or substantially all, of the shares of Class A common stock received upon foreclosure of any pledged securities could result in a change of control, even when such change may not be in the best interest of our stockholders. SunEdison, through its wholly-owned subsidiary, SunEdison Holdings Corporation, owns 62,726,654 Class B units of Terra LLC, which are exchangeable (together with shares of our Class B common stock) for shares of our Class A common stock.
Risks Related to Taxation
Tax provisions and policies supporting renewable energy could change at any time, and such changes may result in a material increase in our estimated future income tax liability.
Renewable generation assets currently benefit from various federal, state and local tax incentives, including ITCs, PTCs and a modified accelerated cost-recovery system of depreciation. The Code currently provides an ITC of 30% of the cost-basis of an eligible facility, including certain solar energy facilities placed in service prior to the end of 2016, which percentage is currently scheduled to be reduced to 10% for solar generation facilities placed in service after December 31, 2016. The U.S. Congress could reduce, replace or eliminate the ITC. PTCs, or ITCs in lieu of PTCs, for wind generation assets apply only to projects the construction of which began prior to the end of 2014 and, the U.S. Congress could fail to extend the termination of, renew or replace such incentives. In addition, we benefit from an accelerated tax depreciation schedule for our eligible solar generation facilities and wind power plants. The U.S. Congress could in the future eliminate or modify such accelerated depreciation. Moreover, the cost-basis of eligible projects acquired from SunEdison may be reduced if a tax authority were to successfully challenge our transfer prices as not reflecting arms’ length prices, in which case the amount of our expected ITC and depreciation deductions would be reduced. Additionally, we may be required to repay a Section 1603 Grant, with interest, if the U.S. Treasury were to successfully challenge a solar generation facility and wind power plant for which such a Section 1603 Grant has been made as not complying with the requirements of Section 1603.
Any reduction in our ITCs, PTCs or depreciation deductions as a result of a change in law or successful transfer pricing challenge, or any elimination or modification of the accelerated tax depreciation schedule, may result in a material increase in our estimated future income tax liability and may negatively impact our business, financial condition and results of operations.
Our future tax liability may be greater than expected if we do not generate Net Operating Losses, or "NOLs," sufficient to offset taxable income.
We expect to generate NOLs and NOL carryforwards that we can utilize to offset future taxable income. Based on our portfolio of assets that we expect will benefit from an accelerated tax depreciation schedule, and subject to tax obligations resulting from potential tax audits, we do not expect to pay significant United States federal income tax in the near term. However, in the event these losses are not generated as expected (including if our accelerated tax depreciation schedule for our eligible solar generation facilities and wind power plants is eliminated or adversely modified), are successfully challenged by the IRS (in a tax audit or otherwise), or are subject to future limitations as a result of an “ownership change” as discussed below, our ability to realize these future tax benefits may be limited. Any such reduction, limitation, or challenge may result in a material increase in our estimated future income tax liabilities and may negatively impact our business, financial condition and operating results.
Our ability to use NOLs to offset future income may be limited.
Our ability to use NOLs generated in the future could be substantially limited if we were to experience an “ownership change” as defined under Section 382 of the Code. In general, an ownership change occurs if the aggregate stock ownership of certain holders (generally 5% holders, applying certain look-through and aggregation rules) increases by more than 50% over such holders’ lowest percentage ownership over a rolling three-year period. If a corporation undergoes an ownership change, its ability to use its pre-change NOL carryforwards and other pre-change deferred tax attributes to offset its post-change income and taxes may be limited. Future sales of our Class A common stock by SunEdison, as well as future issuances by us, could contribute to a potential ownership change.
A valuation allowance may be required for our deferred tax assets.
Our expected NOLs will be reflected as a deferred tax asset as they are generated until utilized to offset income. Valuation allowances may need to be maintained for deferred tax assets that we estimate are more likely than not to be unrealizable, based on available evidence at the time the estimate is made. Valuation allowances related to deferred tax assets
51
can be affected by changes to tax laws, statutory tax rates and future taxable income levels and based on input from our auditors, tax advisors or regulatory authorities. In the event that we were to determine that we would not be able to realize all or a portion of our net deferred tax assets in the future, we would reduce such amounts through a charge to income tax expense in the period in which that determination was made, which could have a material adverse impact on our financial condition and results of operations and our ability to maintain profitability.
Item 1B. Unresolved Staff Comments.
None.
Item 2. Properties.
Each of our power generation facilities has contracted to sell all or a majority of its output pursuant to a long-term, fixed-price power sale agreement with a creditworthy counterparty. We expect any power generation facility we acquire in the future will be party to a similar agreement, but we may acquire power generation facilities with greater levels of uncontracted capacity. See the table of our properties as of February 20, 2015 in Item 1. Business. Details of each property owned as of February 20, 2015 are described below.
Distributed Generation solar generation facilities
Distributed generation facilities provide customers with an alternative to traditional utility energy suppliers. Distributed resources are typically smaller in unit size and can be installed at a customer’s site, removing the need for lengthy transmission and distribution lines. By bypassing the traditional utility suppliers, distributed energy systems delink the customer’s price of power from external factors such as volatile commodity prices, costs of the incumbent energy supplier and some transmission and distribution charges. This makes it possible for distributed energy purchasers to buy energy at a predictable and stable price over a long period of time.
The PPAs for certain of our U.S. solar distributed generation facilities allow the offtake purchaser to elect to purchase the facility from us at a price equal to the greater of a specified amount in the PPA or fair market value. In addition, certain of our PPAs allow the offtake purchaser to terminate the PPA if we do not meet certain prescribed operating thresholds or performance measures or otherwise by the payment of an early termination fee, which would require us to remove the power generation facility from the offtaker’s site. These operating thresholds and performance measures are readily achievable in the normal operation of the power generation facilities.
CD DG Portfolio
We acquired the CD DG Portfolio on December 18, 2014. The CD DG Portfolio consists of 42 solar distributed generation facilities with an aggregate nameplate capacity of approximately 77.6 MW located in California, Massachusetts, New Jersey, New York and Pennsylvania. All of these facilities achieved commercial operations between 2011 and 2014.
All 42 solar distributed generation facilities were designed, engineered and constructed pursuant to various engineering, procurement and construction, or "EPC," contracts. All electricity output is sold pursuant to 20-25 year PPAs or net metering contracts to a mix of commercial, municipal, and utility-scale purchasers with an average credit rating that is investment grade. The facilities that are located in Massachusetts, Pennsylvania and New Jersey also benefit from the sale of RECs, the majority of which will be contracted for a period of at least five years with investment grade buyers.
U.S. Projects 2014
Our U.S. Projects 2014 portfolio consists of 41 canopy, groundmount and rooftop solar generation facilities with an aggregate nameplate capacity of approximately 45.4 MW located in Arizona, California, Connecticut, Georgia, Massachusetts, New Jersey, New York and Puerto Rico, 36 of which achieved commercial operations in 2014 with the remaining five sites achieving commercial operations in January 2015. The solar distributed generation facilities have been designed and engineered, and are being constructed pursuant to fixed-price turn-key EPC contracts with an affiliate of SunEdison. An affiliate of SunEdison provides day-to-day operations and maintenance services under 8-year O&M agreements, whose terms may be extended for additional 12-year periods by mutual agreement. We have a 100% ownership interest in all of the U.S. Projects 2014. The solar distributed generation facilities sell power to corporate entities (comprising approximately 20.8 MW), municipalities (comprising approximately 24.5 MW) and school districts (comprising approximately 2.9 MW).
52
The solar distributed generation facilities sell all of their energy output under separate 20 year PPAs with various creditworthy counterparties, except for one facility that has a PPA with a term of 10 years (2.7 MW). In addition, many of the California power generation facilities receive incremental cash flow from five-year production based incentives from the California Solar Initiative. The solar distributed generation facilities also receive revenue from contracted and un-contracted RECs in the states of California, Connecticut, Massachusetts and New Jersey.
HES Portfolio
The HES Portfolio consists of 101 operational solar distributed generation facilities having an aggregate nameplate capacity of 25.3 MW. The solar distributed generation facilities reached commercial operation between 2011 and 2014, and are located in Massachusetts, New Jersey and Pennsylvania. A third party provider provides day-to-day operations and maintenance services.
Each of the solar distributed generation facilities sells all of its energy output under separate 15-25 year PPAs with various creditworthy counterparties. The PPA offtake agreements are with corporate and other entities (representing approximately 10.0 MW), municipalities/government entities (representing approximately 2.1 MW), school districts (representing approximately 13.0 MW) and residential rooftop installations (representing approximately 0.2 MW). The solar distributed generation facilities also receive revenues from contracted RECs in New Jersey.
DG 2014 Portfolio 1
The DG 2014 Portfolio 1 currently consists of 19 canopy, ground mount and rooftop solar distributed generation facilities. We expect to acquire an additional 33 solar distributed generation facilities currently on the Call Right Project list, all of which are currently under construction, or construction is expected to begin in the second quarter of 2015. The facilities have an aggregate nameplate capacity of approximately 43.8 MW. All of the facilities are expected to achieve commercial operations prior to the end of the third quarter of 2015. The facilities are located in Arizona, California, Georgia, Hawaii, Massachusetts, Maryland, New Jersey, New York, Oregon, Puerto Rico, Texas and Vermont.
The solar distributed generation facilities in the DG 2014 Portfolio 1 have been designed and engineered, and are being constructed, pursuant to fixed-price, turn-key EPC contracts with an affiliate of SunEdison. An affiliate of SunEdison will also provide day-to-day operations and maintenance services under 10-year O&M agreements, the terms of which may be extended for additional periods by mutual agreement. We will have a 100% ownership interest in all of the DG 2014 Portfolio 1 facilities upon their construction completion. The facilities sell power to corporate entities, municipalities, and school districts.
All but 2.9 MW of the aggregate nameplate capacity of the 52 solar distributed generation facilities in the DG 2014 Portfolio 1 is sold under separate 15-25 year PPAs with various creditworthy counterparties. The portfolio has a weighted average contract life of approximately 20 years. A number of the California solar distributed generation facilities in the portfolio receive incremental cash flow from five-year production based incentives from the California Solar Initiative. In addition, the solar distributed generation facilities in Massachusetts, Maryland, and New Jersey receive revenue from contracted and un-contracted RECs.
Summit Solar Projects
On May 22, 2014, we signed a purchase and sale agreement to acquire the equity interests in 50 operational solar generation facilities with a combined capacity of 19.6 MW located in the U.S. from Nautilus Solar PV Holdings, Inc. In addition, we acquired seven operational solar generation facilities in Canada with a total capacity of 3.8 MW.
The Summit Solar Projects portfolio has an aggregate nameplate capacity of 23.4 MW and consists of 57 canopy, groundmount and rooftop facilities located in California, Connecticut, Florida, Maryland, New Jersey and Ontario (Canada). The facilities commenced operations between 2007 and 2014. An affiliate of SunEdison provides day-to-day operations and maintenance services under 5-year O&M agreements, the terms of which may be extended for additional 5- year periods by mutual agreement.
The solar generation facilities sell all of their output under 50 separate 10-20 year PPAs in the U.S. and seven FIT contracts in Canada to school districts, municipalities, municipal and public utilities, businesses, a community center, a public non-profit institute, a university and private schools. The U.S. facilities also generate RECs, the majority of which are contracted to investment grade buyers at a fixed price for a period of up to ten years.
53
Enfinity
Our Enfinity portfolio consists of 16 operational solar distributed generation facilities across six host customers with an aggregate nameplate capacity of 15.7 MW. The facilities reached commercial operation between 2011 and 2013, and are located in Arizona, California, Colorado and Ohio. An affiliate of SunEdison provides day-to-day operations and maintenance services under 10-year O&M agreements, the terms of which may be extended for additional 10-year periods by mutual agreement.
Each of the solar distributed generation facilities sells all of its energy output under separate 15-20 year PPAs with various creditworthy counterparties. The PPAs are with corporate entities (representing approximately 9.8 MW), municipalities/government entities (representing approximately 3.7 MW) and school districts (representing approximately 2.2 MW). The facilities also generate revenues from contracted RECs in Arizona and Colorado, and the California solar distributed generation facility receives incremental cash flow from a five-year production based incentive from the California Solar Initiative. The Denver Housing Authority Projects (2.5 MW) in the portfolio are residential rooftop installations.
U.S. Projects 2009-2013
Our U.S. Projects 2009-2013 portfolio has an aggregate nameplate capacity of 15.3 MW and consists of: (i) a distributed generation portfolio consisting of 73 canopy, groundmount and rooftop solar generation facilities with an aggregate nameplate capacity of 13.2 MW located in California, Colorado, Connecticut, Massachusetts, New Jersey, and Oregon, and (ii) a distributed generation portfolio consisting of five rooftop solar generation facilities with an aggregate nameplate capacity of 2.0 MW located in Puerto Rico. The solar distributed generation facilities in Puerto Rico commenced operations between 2012 and 2013 while the remaining facilities commenced operations between 2009 and 2012. We have a 100% ownership interest in all of the U.S. Projects 2009-2013. The U.S. Projects 2009-2013 sell power to various corporate entities (comprising 8.3 MW), municipalities (comprising 3.7 MW), school districts (comprising 1.9 MW) and REIT/developer entities (comprising 1.4 MW). An affiliate of SunEdison provides day-to-day operations and maintenance services under long-term O&M agreements.
The facilities in the United States sell all of their energy output under 68 separate 10-20 year PPAs with various creditworthy counterparties, except for a 121 KW solar distributed generation facility that has a PPA with a term of 10 years. In addition, many of the facilities receive incremental cash flow from 5-20 year production-based incentives from the California Solar Initiative and Colorado’s Xcel Solar*Rewards. The solar distributed generation facilities in the United States also receive revenue from contracted and un-contracted RECs in California, Connecticut, Massachusetts and New Jersey. The solar distributed generation facilities in Puerto Rico sell all of their energy under separate PPAs with various creditworthy counterparties and have 15-20 year terms.
California Public Institutions
Our California Public Institutions solar distributed generation facilities consist of five separate groundmount solar generation facilities with an aggregate nameplate capacity of approximately 13.5 MW located in California. Three of the facilities (representing approximately 9.3 MW) achieved commercial operations in December 2013 with the remaining two facilities (representing approximately 4.2 MW) achieving commercial operations in July 2014. The facilities were designed, engineered and constructed pursuant to fixed-price turn-key EPC contracts with an affiliate of SunEdison. An affiliate of our SunEdison provides day-to-day operations and maintenance services under 20-year O&M agreements, the terms of which may be extended by mutual agreement.
Four of the facilities in the portfolio supply electricity to prisons in California and one facility supplies electricity to a hospital in California. All electricity output is sold pursuant to a 20-year PPA with the State of California acting through the Department of Corrections and Rehabilitation and the Department of State Hospitals, as applicable. In addition, the three operational facilities receive incremental cash flow from five-year production based incentives through the California Solar Initiative.
Under a tax-equity financing arrangement our subsidiaries lease the facilities to a master tenant. Currently, we have a 1% and the tax equity investor has a 99% ownership interest in the master tenant. On the fifth anniversary of the tax equity financing, we will have a 67% and the tax equity investor will have a 33% ownership interest in the master tenant. Distributions from the master tenant are not subject to restrictive covenants. Additionally, we have a 51% ownership interest and the master tenant has a 49% ownership in the holding company for the solar distributed generation facility subsidiaries.
54
MA Operating
Our MA Operating portfolio consists of four groundmount solar distributed generation facilities with an aggregate nameplate capacity of 12.2 MW located in Massachusetts. The facilities commenced operations in 2012 and 2013. The facilities were designed, engineered and constructed under an EPC contract with Gehrlicher Solar America Corp., and Gehrlicher Solar America Corp. provides day-to-day operations and maintenance services under a 10-year O&M Agreement.
All electricity output is sold pursuant to 20-year PPAs with investment grade municipal customers. The PPA customer is obligated to pay us a fixed percentage of each virtual net metering credit generated by the solar generation facility. The virtual net metering credit is derived from the National Grid G-1 electricity tariff. In addition, the facilities generate RECs through the end of 2023, the majority of which will be contracted for a period of at least five years with an investment grade buyer.
SunE Solar Fund X
The SunE Solar Fund X consists of 12 solar distributed generation facilities with an aggregate nameplate capacity of approximately 8.8 MW located in California, Maryland, and New Mexico. The facilities achieved commercial operations between June 2010 and February 2011. The facilities were designed, engineered and constructed pursuant to EPC contracts with an affiliate of SunEdison. Another affiliate of SunEdison provides day-to-day operations and maintenance services under O&M agreements, the terms of which will match those of the PPAs.
All electricity output is sold pursuant to 20-25 year PPAs to customers including universities, a municipality, and corporations. In addition, several of the facilities receive incremental cash flow from production-based incentives through the California Solar Initiative. The facilities also receive revenue from contracted RECs in the states of California, Maryland and New Mexico.
In 2010, SunEdison entered into a sale-leaseback transaction with J.P. Morgan with respect to the facilities in the portfolio. A subsidiary of SunEdison served as the lessee and a J.P. Morgan subsidiary as the lessor of the facilities. On May 16, 2014, we executed a purchase and sale agreement pursuant to which we acquired J.P. Morgan’s equity interests in the facility lessor under the sale-leaseback transaction and removed any interest J.P. Morgan had in the facilities.
DG 2015 Portfolio 2
Our DG 2015 Portfolio 2 consists of solar distributed generation facilities with an aggregate nameplate capacity of 2.6 MW and approximately 52.0 MW of additional projects identified as Call Right Projects, all under a partnership flip structure with a U.S. tax equity participant. The facilities have completed construction or are expected to start construction by the end of the second quarter of 2015 and the facilities will be purchased by the partnership by the end of the third quarter of 2015.
The facilities are located in the United States across Arizona, California, Massachusetts, New York, Oregon, Utah and Puerto Rico. Each of the facilities has an executed PPA with a term between 10 - 25 years. The power offtakers under the PPAs consist of corporate, municipal, and school district customers. The facilities are designed and constructed by an affiliate of SunEdison and an affiliate of SunEdison will provide day-to-day operations and maintenance services pursuant to a 10 year Master Servicing Agreement.
MA Solar
MA Solar is a 21.1 MW group of four solar distributed generation facilities located in the towns of Millbury and Warren, Massachusetts, which commenced commercial operations in May 2014. MA Solar has contracts with four different municipal and state supported educational institution counterparties to sell 100% of the electrical output. Each of the facilities sells all of its energy output under 25 year PPAs with various creditworthy counterparties
Utility-scale solar generation facilities
Our utility-scale solar generation facility are power plants where either the purchaser of the electricity is an electric utility entity or where power is delivered directly to the grid.
55
Mt. Signal
Mt. Signal is a groundmount utility-scale solar generation facility located in Imperial County, California with a nameplate capacity of approximately 265.8 MW. Mt. Signal achieved commercial operations in three phases from Q4 2013 through Q1 2014. The facility was designed, engineered, constructed and commissioned pursuant to an EPC agreement with an unaffiliated third party. An affiliate of SunEdison provides day-to-day operations and maintenance services under a five-year O&M agreement, the terms of which may be extended for four additional five-year periods by mutual agreement.
The facility sells 100% of its electricity generation, including environmental attributes and ancillary products and services from the facility, to San Diego Gas & Electric, pursuant to a 25-year PPA that expires in March 2039. The price under the PPA is a stated price per MWh, which is adjusted by time-of-day factors resulting in higher payments during peak hours.
Regulus Solar
Regulus Solar is a groundmount utility-scale solar generation facility located in Kern County, California with a nameplate capacity of approximately 81.6 MW. The facility achieved commercial operations in November 2014. The facility was designed, engineered, constructed and commissioned pursuant to an EPC agreement with an affiliate of SunEdison. An affiliate of SunEdison provides day-to-day operations and maintenance services under a 5-year O&M agreement, the terms of which may be extended for additional 5-year periods by mutual agreement.
All energy, capacity, green attributes and ancillary products and services from the facility are sold to Southern California Edison pursuant to a 20-year PPA that expires in December 2034. Revenues consist of a fixed payment based on production, which is adjusted by time-of-day factors resulting in higher payments during peak hours.
North Carolina Portfolio
The North Carolina Portfolio consists of four groundmount utility-scale solar generation facility with an aggregate nameplate capacity of approximately 26.4 MW. One of these facilities achieved commercial operations in November 2014, one achieved commercial operations in December 2014 and the remaining two facilities achieved commercial operations in January 2015. The facilities were designed, engineered, constructed and commissioned pursuant to an EPC agreement with an affiliate of SunEdison. An affiliate of SunEdison provides day-to-day operations and maintenance services under O&M agreements, the terms of which may be extended through 20-year periods by mutual agreement.
All energy and capacity generated by the North Carolina Portfolio will be sold to Progress Energy Carolinas pursuant to 15-year PPAs for fixed prices based on electricity production, which is adjusted by time-of-day factors resulting in higher payments during peak hours. The green attributes and ancillary products and services from the facilities are not subject to the PPAs and will be sold to various customers at market prices.
Atwell Island
Atwell Island is a 23.5 MW utility-scale solar generation facility located in Tulare County, California, which commenced operations in March 2013. The facility was engineered, constructed and commissioned pursuant to an EPC agreement with Samsung Solar Construction Inc., who also subcontracted to a wholly owned subsidiary of Quanta Services Inc. This subsidiary provides day-today operations and maintenance services under a three-year O&M agreement that ends in March 2016. The term of the agreement may be extended by mutual agreement of the parties.
The facility sells 100% of its electricity generation, including environmental attributes and ancillary products and services from the facility, to Pacific Gas & Electric (“PG&E”) pursuant to a 25-year PPA that expires in March 2038. The price under the PPA is a stated price per MWh, which escalates annually for the remainder of the delivery term. The PPA price is also adjusted by time-of-day factors resulting in higher payments during peak hours.
56
Nellis
Nellis is a groundmount utility-scale solar generation facility with a nameplate capacity of approximately 14.0 MW located on the Nellis Air Force Base (“Nellis AFB”) near Las Vegas, Nevada. The facility achieved commercial operations in December 2007. The facility is structured as a limited liability company, in which we hold the position of the investor member, while SunEdison continues to hold the position of the managing member. An affiliate of SunEdison provides day-to-day operations and maintenance services under a 5-year O&M agreement, the terms of which may be extended annually by mutual agreement.
The facility has a ground lease with Nellis AFB until January 1, 2028. The facility derives approximately 90% of its revenues from a Portfolio Energy Credit Purchase Agreement with the Nevada Power Company (“NPC”) Under the agreement, NPC purchases all of the Portfolio Energy Credits produced by the facility at a fixed rate for 20 years from January 1, 2008 to help meet NPC’s renewable energy portfolio obligations under Nevada law. The remaining revenues of the facility comes from the sale of energy and capacity generated by the facility to Nellis AFB pursuant to an indefinite life PPA subject to one-year reauthorizations at the option of the United States federal government.
Alamosa
Alamosa is a groundmount utility-scale solar generation facility in Alamosa, Colorado with a nameplate capacity of approximately 8.2 MW. The facility achieved commercial operations in December 2007. The facility was designed, engineered, constructed and commissioned by an affiliate of SunEdison. An affiliate of SunEdison provides day-to-day operations and maintenance services under an O&M agreement, the terms of which match those of the PPA.
All electricity, green attributes and ancillary services produced by the Alamosa facility are sold to the Public Service Company of Colorado through a 20-year, fixed-price PPA, which expires on December 31, 2027.
In 2007, SunEdison entered into a sale-leaseback transaction with Union Bank, N.A. with respect to the Alamosa facility. A subsidiary of SunEdison served as the lessee and a Union Bank subsidiary as the lessor of the facility. In 2014, we acquired 100% of the interests of both the lessee and the lessor of the facility, as a result of which Union Bank, N.A. no longer has any interest in the facility.
CalRENEW-1
CalRENEW-1 is a groundmount utility-scale solar generation facility located in Mendota, California with a nameplate capacity of approximately 6.3 MW. This facility achieved commercial operations in April 2010. The facility was designed, engineered, constructed and commissioned pursuant to an EPC agreement with Golden State Utility Company. We intend for an affiliate of SunEdison to provide day-to-day operation and maintenance services under a long-term O&M agreement.
All energy, green attributes and ancillary services from the facility are sold to PG&E pursuant to a 20-year PPA that expires in April 2030. Revenues consist of a fixed payment based on production, which is adjusted based on time-of-day factors resulting in higher payments during peak hours.
Marsh Hill
Marsh Hill is a groundmount utility-scale solar generation facility with a nameplate capacity of approximately 18.7 MW located in the municipality of Scugog in eastern Ontario, Canada. The facility is expected to achieve commercial operations in June 2015. We own 72% of the facility and the remaining 28% ownership interest is retained by the original developer of the facility and will be transferred to us upon the facility achieving commercial operation. The facility is being designed, engineered, constructed and commissioned pursuant to an EPC agreement with an affiliate of SunEdison. An affiliate of SunEdison will provide day-to-day operations and maintenance services under a 5-year O&M agreement, the terms of whcih may be extended for additional 5-year periods by mutual agreement.
All energy, green attributes and ancillary services from the facility are sold to the Ontario Power Authority pursuant to a PPA that expires 20 years after achieving commercial operation (approximately June 2035). Revenues consist of a fixed payment based on production, with no annual escalation.
57
SunE Perpetual Lindsay
SunE Perpetual Lindsay is a groundmount utility-scale solar generation facility with a nameplate capacity of approximately 15.5 MW located in Lindsay, Ontario, Canada. The facility achieved commercial operations in December 2014. The facility is being designed, engineered, constructed and commissioned pursuant to an EPC agreement with an affiliate of SunEdison. An affiliate of SunEdison provides day-to-day operations and maintenance services under a 5-year O&M agreement, the terms of which may be extended for additional 5-year periods by mutual agreement.
All energy, capacity, green attributes and ancillary products and services from the facility are sold to the Ontario Power Authority pursuant to a PPA that expires in December 2034. Revenues consist of a fixed payment based on production, with no annual escalation.
U.K. 2014 Projects
The U.K. 2014 Projects portfolio has an aggregate nameplate capacity of 88.3 MW and consists of the Stonehenge Q1 portfolio (the Fareham, Knowlton and Westwood groundmount utility-scale solar generation facilities) and the Says Court, Crucis Farm, and Norrington facilities. Our Stonehenge Q1 portfolio has a total nameplate capacity of approximately 41.2 MW, our Says Court facility has a nameplate capacity of approximately 19.8 MW, our Crucis Farm facility has a nameplate capacity of approximately 16.1 MW, and our Norrington facility has a nameplate capacity of approximately 11.2 MW. The Stonehenge Q1 portfolio and Says Court achieved commercial operations in March 2014. Crucis Farm achieved commercial operations in the July 2014 while Norrington achieved commercial operations in June 2014. We have a 100% ownership interest in each of the facilities.
Each of the facilities were constructed pursuant to an EPC contract with an affiliate of SunEdison. An affiliate of SunEdison also provides operations and maintenance services under 10-year O&M agreements, which may be extended for additional 10-year terms at our election.
Each of the facilities sells all of its electricity, ROCs, embedded benefits and LECs under 15-year PPAs with an affiliate of Statkraft A/S. Pricing of the electricity sold under these PPAs, which is expected to constitute about 40% of the revenues under the PPAs, is fixed for the first four years of the PPAs, after which the price is subject to an adjustment based on current market prices (subject to a price floor). Pricing for ROCs, which is expected to constitute about 55% of the revenues under the PPAs, is fixed by U.K. laws or regulations for the entire PPA term. Pricing for LECs and embedded benefits, which jointly constitute about 5% of the revenues under the PPAs, is indexed to prices set by U.K. laws or regulations.
Fairwinds and Crundale
Fairwinds and Crundale are two groundmount solar generation facilities in the U.K. with an aggregate nameplate capacity of 50.0 MW. Fairwinds achieved commercial operations in September 2014 and Crundale achieved commercial operations in October 2014. These were Call Right Projects that we acquired from SunEdison on November 4, 2014.
The facilities were constructed pursuant to an EPC contract with an affiliate of SunEdison. An affiliate of SunEdison will also provide operations and maintenance services under a 10-year O&M agreement, which may be extended for an additional 10-year term at our election.
Both facilities have entered into 15-year PPAs with an affiliate of Statkraft A/S under which they will sell all of their electricity, ROCs, embedded benefits and Climate Change LECs. Pricing of the electricity sold under these PPAs, which is expected to constitute about 40% of the revenues under the PPAs, is fixed for the first four years of the PPAs, after which the price is subject to an adjustment based on current market prices (subject to a price floor). Pricing for ROCs, which is expected to constitute about 55% of the revenues under the PPAs, is fixed by U.K. laws or regulations for the entire PPA term. Pricing for LECs and embedded benefits, which jointly constitute about 5% of the revenues under the PPAs, is indexed to prices set by U.K. laws or regulations.
58
Stonehenge Operating
The Stonehenge Operating portfolio has an aggregate nameplate capacity of 23.6 MW and consists of the Langunnett, West Farm, and Manston groundmount utility-scale solar generation facilities. Our Langunnett facility has a nameplate capacity of approximately 6.2 MW and achieved commercial operations in March 2013. Our West Farm facility has a nameplate capacity of approximately 7.6 MW and achieved commercial operations in March 2013. Our Manston 6 facility has a nameplate capacity of approximately 9.8 MW and achieved commercial operations in May 2013. Vogt Solar Ltd. provides day-to day operations and maintenance services to the facilities under 2-year O&M agreements. Upon expiration of these O&M agreements in 2015, we expect to enter into 10-year O&M agreements with an affiliate of SunEdison.
Each of the facilities sells all of its electricity, ROCs, embedded benefits and LECs under 14-year PPAs to Total Gas & Power Limited. Pricing of the electricity sold under these PPAs, which constitutes about 45% of the revenues under the PPAs, is fixed for the first five years of the PPAs, after which the price is subject to an adjustment based on the current market price (subject to a price floor). Pricing for ROCs, which is expected to constitute about 54% of the revenues under the PPAs, is fixed by U.K. laws or regulations.
CAP
CAP is a groundmount utility-scale solar generation facility with a nameplate capacity of 101.6 MW located near the city of Copiapó in north-central Chile. It is connected to the Chilean Central Interconnected System and achieved commercial operations in March 2014. The facility was designed, engineered and constructed pursuant to a construction contract with an affiliate of SunEdison. An affiliate of SunEdison provides day-to-day operations and maintenance services under a 5-year O&M agreement, the terms of which may be extended for up to three additional 5-year periods at our election.
All energy, green attributes and ancillary services from the facility are sold under a 20-year PPA with Compañía Minera del Pacífico, S.A. (“CMP”) an affiliate of CAP, S.A., a leading iron ore mining and steel company. The U.S. dollar denominated PPA serves as a contract for differences, pursuant to which CMP guarantees the payment of a fixed price per MWh of electricity produced, which increases semiannually with inflation. In connection with the PPA, CAP and its affiliates were granted an option to acquire up to 40% of the shares of the facility from us pursuant to a predetermined purchase price formula. CAP can exercise this option during a period of two years from achieving commercial operations, which occurred in March 2014.
Utility-scale wind power plants
Cohocton
Cohocton is a 125.0 MW power plant in Steuben County, New York. Cohocton commenced commercial operations in January 2009. The power plant consists of fifty 2.5 MW Clipper turbines. Similar to Mars Hill (described below), Cohocton qualifies a portion of its energy for New England RECs. We began self-performing turbine O&M work in the first quarter of 2013.
Energy from Cohocton is sold to the New York Independent System Operator, or “NYISO.” To stabilize Cohocton’s electricity revenue, we entered into a swap with Citigroup Energy Inc., or “Citigroup,” for approximately 80% of expected generation through the end of 2020. 40% of Cohocton's RECs are sold to the NYSERDA under a long-term agreement and approximately 43% of Cohocton's RECs are sold to an affiliate of Citigroup under a long-term contract as New England RECs, since we sell the related generation output in New England. The remaining RECs are sold to various other counterparties.
Rollins
Rollins is a 60.0 MW expansion power plant in Penobscot County, Maine, which commenced operation in July 2011. Rollins consists of forty 1.5 MW GE turbines and includes an approximately 8-mile 115 kV generator lead that ties into the existing 38-mile generator lead that serves the Stetson I and Stetson II power plants. The land on which Rollins is located is leased from private landowners under lease agreements with 25 to 27-year terms and options to extend the leases for an additional 20 years. The power plant has turbine O&M and warranty agreements with GE through December 2019.
All of Rollins’ energy and capacity is sold to two utilities in Maine under 20-year PPAs. Approximately 72% of the power plant’s RECs are hedged under a separate 5-year contract with Vitol Group, an energy trading company, which expires in 2016.
59
Stetson I
Stetson I is a 57.0 MW power plant in Washington County, Maine that became operational in January 2009. The power plant consists of thirty eight 1.5 MW GE turbines. As part of the Stetson I power plant, a 38-mile, 200 MW, 115 kV generator lead was constructed to interconnect to the ISO New England Inc., or "ISO NE" power grid. The capacity of the transmission line was overbuilt by 140 MW to accommodate future expansions, 25.5 MW of which is now being used by the Stetson II power plant and 60.0 MW by the Rollins power plant. The power plant has turbine O&M and warranty agreements with GE through December 2019.
As Stetson I connects directly into ISO NE, all of its generation qualifies for New England RECs. Those RECs are sold to numerous counterparties, similar to Mars Hill and Cohocton. Power from Stetson I is sold separately directly into ISO NE, at a floating price at the point of sale. The point of sale has historically traded at a modest discount to Mass Hub, a liquid hub where electricity is traded. A 10-year fixed-for-floating financial swap was entered into with an affiliate of Exelon Generation Company (“Exelon”) for approximately 74% of the expected output of Stetson I and a portion of the expected output from Stetson II. Stetson I was among the first power plants for which an ARRA grant was given.
Mars Hill
Mars Hill is a 42.0 MW power plant located in Mars Hill, Maine, which commenced commercial operations in March 2007. The power plant consists of twenty eight 1.5 MW GE turbines. The power plant has turbine O&M and warranty agreements with GE through December 2019.
The power plant has an agreement to sell electricity under a PPA with New Brunswick Power Generation Corporation, which expires at the end of February 2016 and provides for the purchase of the entire output of electricity and RECs from the power plant. Mars Hill qualified for and receives PTCs.
Sheffield
Sheffield is a 40.0 MW power plant in Sheffield, Vermont, which commenced operation in October 2011. Sheffield consists of sixteen 2.5 MW Clipper turbines. Lease agreements have been entered into with private landowners with 23 to 27-year terms and options to extend the leases for an additional 20 years. The power plant obtained the first Certificate of Public Good granted by the Vermont Public Service Board for a utility-scale wind energy power plant since 1996. Sheffield sells its power through four PPAs with three Vermont utilities: two PPAs with the Vermont Electric Cooperative, or "VEC," one with the City of Burlington, acting through the Burlington Electric Department, or "BED," and one with the Washington Electric Cooperative, or "WEC." The PPAs with VEC include a 10-year contract for 25% of the electricity and RECs generated by the power plant and a 20-year contract for 25% of the electricity generated during the first 10 years and 50% of the electricity generated during years 11-20. The PPA with WEC includes a 20-year contract for 10% of the electricity and RECs generated by the power plant, and the PPA with BED includes a 10-year contract for 40% of the electricity and RECs generated. During the subsequent 10 years following the expiration of the BED PPA, the remaining 40% of the electricity and RECs generated is not contracted.
Bull Hill
Bull Hill is an approximately 34.5 MW power plant located on the Bull Hill and Heifer Hill ridges near Eastbrook, Maine. The power plant commenced commercial operation in October 2012. The power plant consists of nineteen 1.8 MW Vestas turbines. The power plant has a 15-year, fixed price PPA for 32.4 MW of the power plant’s electric power and RECs with NSTAR. Turbine maintenance and warranty coverage is provided by Vestas under a 10-year service, maintenance and warranty agreement commencing at final commissioning of the power plant.
Kaheawa Wind Power I
KWP I is a 30.0 MW power plant in the West Maui Mountains of Maui, Hawaii, which commenced commercial operations in June 2006. The power plant consists of twenty 1.5 MW GE turbines. The Company purchased the development rights to KWP I in June 2004. The power plant has turbine O&M and warranty agreements with GE through December 2019.
KWP I has a 20-year PPA for power with the Maui Electric Company, or "MECO," with a remaining term of approximately 12 years. The PPA is 100% fixed price. Prior to an amendment approved in 2012, 30% of the price of the PPA was linked to MECO’s avoided cost. The amendment delinked the PPA price from avoided cost and set a new fixed payment
60
rate for 100% of the generation. KWP I qualified for and receives PTCs and MACRS depreciation, along with cash payments under its PPA.
Kahuku
Kahuku is a 30.0 MW power plant on land owned or leased by the Company on the north shore of Oahu, Hawaii, which commenced commercial operations on March 23, 2011. The power plant consists of twelve 2.5 MW Clipper turbines. Kahuku connects directly into the Hawaii Electric Company's, or "HECO," transmission system through a transmission line that transects the power plant area. A 20-year fixed-price PPA has been executed with HECO and approved by the Hawaiian Public Utilities Commission.
In August 2012, a fire struck Kahuku destroying the power plant’s battery energy storage system, or "BESS", and the associated BESS enclosure building. The power plant’s substation control room, which was housed in the BESS enclosure building, was also destroyed. Since the fire, the Company has rebuilt Kahuku’s substation control room and equipment within a stand-alone enclosure, and installed a dynamic volt-amp reactive system, or "D-Var." The D-Var provides voltage regulation and stability to meet the interconnection requirements of HECO and replaces some critical functionality (overvoltage mitigation) that was once provided by the BESS. Kahuku received business interruption insurance and property damage insurance to minimize the financial result of the loss. The power plant is currently connected to the grid and has completed system testing with HECO. As part of the rebuilding process and in concert with HECO, the PPA was amended to include revised interconnection and performance standards to reflect the shift from the BESS to the D-Var, as well as a change to the fixed energy price received by Kahuku based on the same and the amendment is pending regulatory approval.
Stetson II
Stetson II is a 25.5 MW expansion power plant in Washington County, Maine. Construction on Stetson II began in October 2009, and commenced commercial operations in March 2010. The power plant consists of seventeen 1.5 MW GE turbines. Stetson II uses the existing infrastructure at Stetson I, including Stetson I’s generator lead, substation and interconnection equipment. The power plant has turbine O&M and warranty agreements with GE through December 2019.
Half of Stetson II’s electricity and RECs is being sold to Harvard University under a long-term PPA. The other half of the power plant's electricity is being sold directly into ISO NE. The revenue from the majority of the portion of the facility’s energy being sold into the market is hedged with a financial swap with an affiliate of Exelon. The majority of remaining REC volumes are sold to an affiliate of Citigroup under a 10-year contract. Approximately 79% of Stetson II’s expected electricity and REC output is covered by a PPA or otherwise hedged through 2019. An ARRA grant of approximately $19 million was received for Stetson II in June 2010.
Kaheawa Wind Power II
KWP II is a 21.0 MW expansion power plant adjacent to the KWP I site on Maui. The power plant consists of fourteen 1.5 MW GE turbines and commenced operation in July 2012. KWP II connects to MECO’s 69 kV transmission system, which crosses the site. A directed lease agreement was entered into with Hawaii’s Department of Land and Natural Resources, as well as, a long-term PPA for 100% of the power plant’s electric power and RECs with MECO. The power plant has turbine O&M and warranty agreements with GE through December 2019.
KWP II uses a battery system to help mesh the output of the power plant with the grid. The battery system helps stabilize the amount of power available from the power plant and limit curtailment, which is important because Maui has a small electricity grid. The battery system commenced operation along with the wind energy power plant in July 2012.
Steel Winds I & II
Steel Winds consists of two power plants located on the shores of Lake Erie in Lackawanna, New York. The initial phase, or “Steel Winds I,” commenced commercial operations in June 2007, and is a 20.0 MW power plant. Steel Winds II is a 15.0 MW expansion and reached commercial operation in January 2012. The power plants consist of fourteen 2.5 MW Clipper turbines.
Power generated by the power plants is sold at floating power prices within NYISO Zone A. To stabilize this revenue, a swap for the two combined power plants was entered into with Morgan Stanley Capital Group, which expires in 2019. The volume of this swap is approximately 83% of Steel Winds’ expected output. Steel Winds II has a contract with the New York
61
State Energy Research and Development Authority for the sale of 95% of its RECs, which expires in 2022. In addition, the power plants share short-term REC contracts with several counter parties that expire on various dates through 2015.
Item 3. Legal Proceedings.
We are not a party to any legal proceedings other than legal proceedings arising in the ordinary course of our business. We are also a party to various administrative and regulatory proceedings that have arisen in the ordinary course of our business. Although we cannot predict with certainty the ultimate resolution of such proceedings or other claims asserted against us, we do not believe that any currently pending legal proceeding to which we are a party will have a material adverse effect on our business, financial condition or results of operations.
Daniel Gerber v. Wiltshire Council
On March 5, 2015, the UK High Court issued a verdict that quashed (nullified) the planning permission necessary to build the Company’s 11.2 MW Norrington solar generation facility in Wiltshire, England. The court found that, among other issues, the local Wiltshire council failed to properly notify a local landowner (the claimant) or notify the English historic preservation agency before granting the permission. U.K. counsel have advised us that the quashing of this planning permission deviates significantly from established case law. The Company has therefore decided to appeal this ruling and plans to assert a vigorous defense. At this time, the Company does not have enough information regarding the probable outcome or the estimated range of reasonably probable losses associated with this ruling, and as of December 31, 2014, no such accrual has been recorded in the consolidated financial statements. The solar generation facility was constructed by SunEdison pursuant to an engineering, procurement and construction agreement, under which SunEdison assumed development and construction risk. If the ultimate outcome of this case were unfavorable and no replacement permit could be obtained, the Company would therefore be able recover its investment in this project from SunEdison.
Item 4. Mine Safety Disclosures.
Not applicable.
62
PART II
Item 5. Market for Registrant’s Common Equity, Related Stockholder Matters and Issuer Purchases of Equity Securities.
Class A Common Stock
The Company's Class A common stock began trading on the NASDAQ Global Select Market under the symbol “TERP” on July 18, 2014. Prior to that, there was no public market for our Class A common stock. The Company's Class B common stock and Class B1 common stock are not publicly traded.
As of February 20, 2015, there were 27 holders of record of the Company’s Class A common stock, one holder of record of the Company’s Class B common stock and one holder of record of the Company’s Class B1 common stock.
The table below sets forth, for the periods indicated, the high and low sale prices per share of our Class A common stock since July 18, 2014:
High | Low | |||||||
July 18, 2014 to September 30, 2014 | $ | 33.65 | $ | 28.86 | ||||
Fourth Quarter 2014 | 33.64 | 22.83 | ||||||
Dividends
On October 27, 2014, we declared a quarterly dividend of $0.1717 per share on our outstanding Class A common stock, which was paid on December 15, 2014 to holders of record on December 1, 2014. This amount represents a quarterly dividend of $0.2257 per share, or $0.9028 per share on an annualized basis, prorated to adjust for a partial quarter as we consummated our IPO on July 23, 2014.
On December 22, 2014, we declared a quarterly dividend for the fourth quarter on the Company's Class A common stock of $0.27 per share, or $1.08 per share on an annualized basis. The fourth-quarter dividend is payable on March 16, 2015 to shareholders of record as of March 2, 2015.
Stock Performance Graph
The performance graph below compares the Company's cumulative total stockholder return on the Company's Class A common stock for the period July 18, 2014 through December 31, 2014, with the cumulative total return of the Standard & Poor's 500 Composite Stock Price Index, or the "S&P 500," the NASDAQ Composite Index, as well as our peer group consisting of Abengoa Yield plc; NextEra Energy Partners, LP; NRG Yield, Inc.; and Pattern Energy Group Inc.
The performance graph below is being furnished and compares each period assuming that $100 was invested on the initial public offering date in each of the Class A common stock of the Company, the stocks in the S&P 500, the NASDAQ Composite Index, our peer group, and that all dividends were reinvested.
63
Comparison of Cumulative Total Return
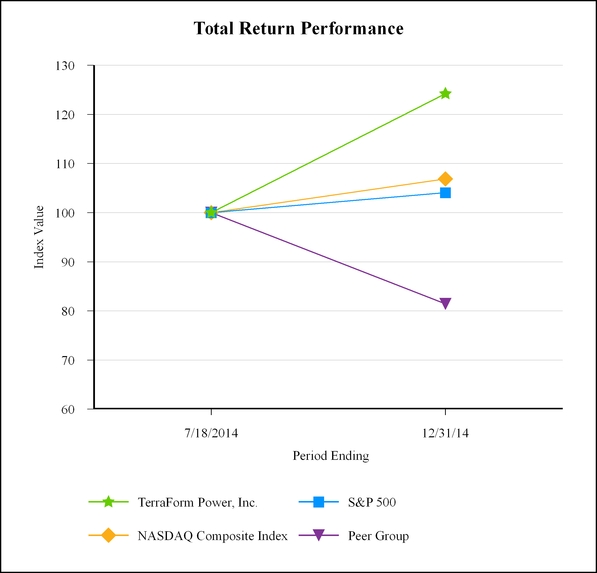
Stock | July 18, 2014 | December 31, 2014 | ||||||
TerraForm Power, Inc. | $ | 100.00 | $ | 124.21 | ||||
S&P 500 | 100.00 | 104.08 | ||||||
NASDAQ Composite Index | 100.00 | 106.86 | ||||||
Peer Group | 100.00 | 81.44 | ||||||
64
Item 6. Selected Financial Data.
The Company's historical selected financial data is presented in the following table. For all periods prior to the IPO, the amounts shown in the table below represent the combination of the Company and Terra LLC, the accounting predecessor, and were prepared using SunEdison's historical basis in assets and liabilities. For all periods subsequent to the IPO, the amounts shown in the table below represent the results of the Company, which consolidates Terra LLC through its controlling interest. This historical data should be read in conjunction with the Consolidated Financial Statements and the related notes thereto in Item 15. Exhibits, Financial Statements and Schedules.
For the year ended December 31, | ||||||||||||
(in thousands, except per share data) | 2014 | 2013 | 2012 | |||||||||
Statement of Operations Data: | ||||||||||||
Operating revenues, net | $ | 125,864 | $ | 17,469 | $ | 15,694 | ||||||
Operating costs and expenses: | ||||||||||||
Cost of operations | 10,544 | 1,024 | 837 | |||||||||
Cost of operations - affiliate | 7,903 | 911 | 680 | |||||||||
General and administrative | 20,984 | 289 | 177 | |||||||||
General and administrative - affiliate | 19,144 | 5,158 | 4,425 | |||||||||
Acquisition and related costs | 10,177 | — | — | |||||||||
Acquisition and related costs - affiliate | 5,049 | — | — | |||||||||
Formation and offering related fees and expenses | 3,570 | — | — | |||||||||
Formation and offering related fees and expenses - affiliates | 1,870 | — | — | |||||||||
Depreciation, accretion and amortization | 40,509 | 4,961 | 4,267 | |||||||||
Total operating costs and expenses | 119,750 | 12,343 | 10,386 | |||||||||
Operating income | 6,114 | 5,126 | 5,308 | |||||||||
Other expense (income): | ||||||||||||
Interest expense, net | 84,418 | 6,267 | 5,702 | |||||||||
Gain on extinguishment of debt, net | (7,635 | ) | — | — | ||||||||
Loss/(Gain) on foreign currency exchange, net | 14,007 | (771 | ) | — | ||||||||
Other, net | 438 | — | — | |||||||||
Total other expense, net | 91,228 | 5,496 | 5,702 | |||||||||
Loss before income tax benefit | (85,114 | ) | (370 | ) | (394 | ) | ||||||
Income tax benefit | (4,689 | ) | (88 | ) | (1,270 | ) | ||||||
Net (loss) income | $ | (80,425 | ) | $ | (282 | ) | $ | 876 | ||||
Net loss attributable to TerraForm Power, Inc. Class A common stockholders | (25,617 | ) | N/A | N/A | ||||||||
Basic loss per Class A common share | (0.87 | ) | N/A | N/A | ||||||||
Diluted loss per Class A common share | (0.87 | ) | N/A | N/A | ||||||||
Cash Flow Data: | ||||||||||||
Net cash provided by (used in): | ||||||||||||
Operating activities | 82,578 | (7,202 | ) | 2,890 | ||||||||
Investing activities | (1,528,025 | ) | (264,239 | ) | (410 | ) | ||||||
Financing activities | 1,912,960 | 272,482 | (2,477 | ) | ||||||||
65
As of December 31, | ||||||||||||
(in thousands, except per share data) | 2014 | 2013 | 2012 | |||||||||
Balance Sheet Data (at period end): | ||||||||||||
Cash and cash equivalents | $ | 468,393 | $ | 1,044 | $ | 3 | ||||||
Restricted cash | 81,000 | 69,722 | 8,828 | |||||||||
Property and equipment, net | 2,327,803 | 407,356 | 111,697 | |||||||||
Long-term debt and financing lease obligations | 1,598,095 | 408,109 | 75,498 | |||||||||
Capital lease obligations | — | 29,171 | 30,974 | |||||||||
Total assets | 3,378,018 | 566,877 | 158,955 | |||||||||
Total liabilities | 1,837,759 | 551,425 | 128,926 | |||||||||
Redeemable non-controlling interests | 24,338 | — | — | |||||||||
Total stockholders' equity | 1,515,921 | 15,452 | 30,029 | |||||||||
Item 7. Management’s Discussion and Analysis of Financial Condition and Results of Operations.
The following discussion and analysis should be read in conjunction with our accompanying consolidated financial statements as of and for the years ended December 31, 2014 and 2013, and the notes thereto. The results shown herein are not necessarily indicative of the results to be expected in any future periods. References in this section to "we," "our," "us," or the "Company" refer to TerraForm Power, Inc. and its consolidated subsidiaries.
Overview
We are a dividend growth-oriented company formed to own and operate contracted clean power generation assets acquired from SunEdison and unaffiliated third parties. Our business objective is to acquire and operate high-quality contracted cash flows, currently from owning solar generation assets serving utility, commercial and residential customers. Over time, we intend to acquire other clean power generation assets, including wind, natural gas, and hydro-electricity, as well as hybrid energy solutions that enable us to provide contracted power on a 24/7 basis. We believe we are well-positioned for substantial growth due to the high-quality, diversification and scale of our portfolio, the long-term PPAs we have with creditworthy counterparties, our dedicated management team and SunEdison's project origination and asset management capabilities.
Factors that Significantly Affect our Results of Operations and Business
We expect the following factors will affect our results of operations:
Increasing Utilization of Clean Power Generation Sources
Clean energy has been one of the fastest growing sources of electricity generation in North America and globally over the past decade. We expect the renewable energy generation segment in particular to continue to offer high growth opportunities driven by:
• | the significant reduction in the cost of solar and other renewable energy technologies, which will lead to grid parity in an increasing number of markets; |
• | distribution charges and the effects of an aging transmission infrastructure, which enable renewable energy generation sources located at a customer’s site, or distributed generation, to be more competitive with, or cheaper than, grid-supplied electricity; |
• | the replacement of aging and conventional power generation facilities in the face of increasing industry challenges, such as regulatory barriers, increasing costs of and difficulties in obtaining and maintaining applicable permits, and the decommissioning of certain types of conventional power generation facilities, such as coal and nuclear facilities; |
• | the ability to couple renewable power generation with other forms of power generation, creating a hybrid energy solution capable of providing energy on a 24/7 basis while reducing the average cost of electricity obtained through the system; |
• | the desire of energy consumers to lock in long-term pricing of a reliable energy source; |
• | renewable power generation’s ability to utilize freely available sources of fuel, thus avoiding the risks of price volatility and market disruptions associated with many conventional fuel sources; |
• | environmental concerns over conventional power generation; and |
66
• | government policies that encourage development of renewable power, such as state or provincial renewable portfolio standard programs, which motivate utilities to procure electricity from renewable resources. In addition to renewable energy, we expect natural gas to grow as a source of electricity generation due to its relatively lower cost and lower environmental impact compared to other fossil fuel sources, such as coal and oil. |
Offtake Contracts
Our revenue is primarily a function of the volume of electricity generated and sold by our solar generation facilities and wind power plants as well as, to a lesser extent, where applicable, the sale of green energy certificates and other environmental attributes related to energy generation. Our current portfolio of power generation assets are contracted under long-term PPAs with creditworthy counterparties. As of December 31, 2014, the weighted average (based on MW) remaining life of our PPAs was 19 years. Pricing of the electricity sold under these PPAs is or will be fixed for the duration of the contract. In the case of our U.K. power generation facilities, the price for electricity is fixed for a specified period of time (typically four years), after which the price is subject to an adjustment based on the current market price (subject to a price floor). The prices for green energy certificates are fixed by U.K. laws or regulations, and certain other attributes are indexed to prices set by U.K. laws or regulations. In the case of our Massachusetts power generation facilities (MA Operating and certain power generation facilities in our U.S. Projects 2014 portfolio), a portion of the contracted revenue is fixed and the remainder is subject to an adjustment based on the current market price. Certain of our PPAs have price escalators based on an index (such as the consumer price index) or other rates specified in the applicable PPA.
The Company also generates SRECs as it produces electricity. SRECs are accounted for as governmental incentives and are not considered output of the underlying solar energy systems. These SRECs are currently sold pursuant to agreements with third parties, our parent and a certain debt holder, and SREC revenue is recognized when the electricity is generated and the SREC is sold. Under the terms of certain debt agreements with a creditor, SRECs are transferred directly to the creditor to reduce principal and interest payments due under solar program loans and are therefore presented in the consolidated statements of cash flows as a non-cash reconciling item in determining cash flows from operations. Additionally, we have contractual agreements with SunEdison for the sale of 100% of the SRECs generated by certain systems included in our initial portfolio. These SRECs are transferred directly to SunEdison when they are generated.
Generation Availability
Generation availability refers to the actual amount of time a power generation asset produces electricity divided by the amount of time such asset is expected to produce electricity, which reflects anticipated maintenance and interconnection interruptions. Our ability to generate electricity in an efficient and cost-effective manner is impacted by our ability to maintain and utilize the electrical generation capacity of our projects. The volume of electricity generated and sold by our projects during a particular period is also impacted by the number of projects that have commenced commercial operations, as well as both scheduled and unexpected repair and maintenance required to keep our projects operational. Equipment performance represents the primary factor affecting our operating results because equipment downtime impacts the volume of the electricity that we are able to generate from our projects. The volume of electricity generated and sold by our projects will be negatively impacted if any projects experience higher than normal downtime as a result of equipment failures, electrical grid disruption or curtailment, weather disruptions or other events beyond our control. The Company tracks generation availability as a measure of the operational efficiency of our business.
Seasonality
The amount of electricity our solar power generation facilities produce is dependent in part on the amount of sunlight, or irradiation, where the assets are located. Because shorter daylight hours in winter months results in less irradiation, the generation of particular assets will vary depending on the season. Additionally, to the extent more of our power generation facilities are located in either the northern or southern hemisphere, overall generation of our entire solar asset portfolio could be impacted by seasonality. While we expect seasonal variability to occur, we expect aggregate seasonal variability to decrease if geographic diversity of our portfolio between the northern and southern hemisphere increases. We expect our current solar portfolio’s power generation to be at its lowest during the fourth quarter of each year as our assets are geographically concentrated in the northern hemisphere. Therefore, we expect our fourth quarter solar revenue generation to be lower than other quarters.
Similarly, the electricity produced and revenues generated by a wind energy project depend heavily on wind conditions, which are variable and difficult to predict. Operating results for projects vary significantly from period to period depending on the windiness during the periods in question. Because our wind power plants are located in geographies with different profiles, there is some flattening of the seasonal variability associated with each individual power plant’s generation,
67
and we expect that as the fleet expands the effect of such wind resource variability may be favorably impacted, although we cannot guarantee that we will purchase or develop wind projects that will achieve such results in part or at all. Historically, our wind production is greater in the first and fourth quarters which can partially offset the lower solar revenue expected to be generated in the fourth quarter. We intend to reserve a portion of our cash available for distribution and maintain a revolving credit facility in order to, among other things, facilitate the payment of dividends to our stockholders. As a result, we do not expect seasonality to have a material effect on the amount of our quarterly dividends.
Cash Distribution Restrictions
In certain cases we obtain project-level financing for our renewable generation facilities which may limit our ability to distribute funds to the Company. These limitations typically require that the project-level cash is used to meet debt obligations and fund operating reserves of the project company.
Solar Generation Facility and Wind Power Plant Acquisitions
Our growth strategy is dependent on our ability to acquire additional clean power generation assets from SunEdison and unaffiliated third parties. We are focused on acquiring long-term contracted clean power generation assets with proven technologies, low operating risks and stable cash flows in geographically diverse locations with growing demand and stable legal and political systems.
We entered into the Support Agreement with SunEdison, which requires SunEdison to sell us certain projects from its development pipeline by the end of 2016 that have at least $175.0 million of cash available for distribution during the first 12 months following the project's respective commercial operations date ("Projected FTM CAFD"). Specifically, the Support Agreement requires SunEdison to sell to us:
• | solar projects that have at least $75.0 million of Projected FTM CAFD prior to the end of 2015; and |
• | solar projects that have at least $100.0 million of Projected FTM CAFD during calendar year 2016 |
If the amount of Projected FTM CAFD of the projects we acquire under the Support Agreement prior to the end of 2015 is less than $75.0 million, or the amount of Projected FTM CAFD of the projects we acquire under the Support Agreement during 2016 is less than $100.0 million, SunEdison has agreed that it will continue to offer to us sufficient projects until the total aggregate Projected FTM CAFD commitment has been satisfied.
In connection with the First Wind acquisition, we entered into an Intercompany Agreement with SunEdison, under which we have been granted additional call rights with respect to certain projects in the First Wind pipeline. The projects to which we have call rights that are specifically identified in the Support Agreement and Intercompany Agreement have a total nameplate capacity of 3.4 GW.
Foreign Exchange
Our operating results are reported in United States dollars. Currently, a majority of our revenues and expenses are generated in U.S. Dollars. However, in the future, we expect a significant amount of our revenues and expenses will be generated in currencies other than United States dollars (including the British pound, the Canadian dollar and other currencies). In addition, our investments (including intercompany loans) on power generation facilities in foreign countries are exposed to foreign currency fluctuations. As a result, we expect our revenues and expenses will be exposed to foreign exchange fluctuations in local currencies where our clean power generation assets are located. To the extent we do not hedge these exposures, fluctuations in foreign exchange rates could negatively impact our profitability and financial position.
68
Key Metrics
Operating Metrics
Nameplate Megawatt Capacity
We measure the electricity-generating production capacity of our power generation assets in nameplate megawatt capacity. Rated capacity is the expected maximum output a power generation system can produce without exceeding its design limits. Nameplate capacity is the rated capacity of all of the power generation assets we own adjusted to reflect our economic ownership of joint ventures and similar power generation facilities. We measure nameplate capacity for solar power generation facilities in MW(dc) and for wind energy projects in MW(ac). The size of our power generation assets varies significantly among the assets comprising our portfolio. We believe the aggregate nameplate megawatt capacity of our portfolio is indicative of our overall production capacity and period to period comparisons of our nameplate megawatt capacity are indicative of the growth rate of our business.
Megawatt Hours Sold
Megawatt hours sold refers to the actual volume of electricity sold by our power generation facilities during a particular period. We track megawatt hours sold as an indicator of our ability to recognize revenue from the generation of electricity at our power generation facilities.
Financial Metrics
Adjusted EBITDA
We believe Adjusted EBITDA is useful to investors in evaluating our operating performance because securities analysts and other interested parties use such calculations as a measure of financial performance and debt service capabilities. In addition, Adjusted EBITDA is used by our management for internal planning purposes, including for certain aspects of our consolidated operating budget.
We define Adjusted EBITDA as net income plus interest expense, net; income taxes; depreciation, accretion and amortization; stock-based compensation; and certain other non-cash charges, unusual or non-recurring items and other items that we believe are not representative of our core business or future operating performance. Our definitions and calculations of these items may not necessarily be the same as those used by other companies. Adjusted EBITDA is not a measure of liquidity or profitability and should not be considered as an alternative to net income, operating income, net cash provided by operating activities or any other measure determined in accordance with U.S. GAAP.
The following table presents a reconciliation of net loss to Adjusted EBITDA:
Year Ended December 31, | ||||||||||||
(In thousands) | 2014 | 2013 | 2012 | |||||||||
Net (loss) income | $ | (80,425 | ) | $ | (282 | ) | $ | 876 | ||||
Interest expense, net (a) | 84,418 | 6,267 | 5,702 | |||||||||
Income tax benefit | (4,689 | ) | (88 | ) | (1,270 | ) | ||||||
Depreciation, amortization and accretion (b) | 44,699 | 4,961 | 4,267 | |||||||||
General and administrative - affiliate (c) | 20,278 | 5,158 | 4,425 | |||||||||
Stock-based compensation | 5,787 | — | — | |||||||||
Acquisition and related costs, including affiliate (d) | 15,226 | — | — | |||||||||
Formation and offering related fees and expenses, including affiliate (e) | 5,440 | — | — | |||||||||
Gain on extinguishment of debt, net (f) | (7,635 | ) | — | — | ||||||||
Non-recurring facility-level non-controlling interest member transaction fees (g) | 11,828 | — | — | |||||||||
Loss / (gain) on foreign currency exchange, net (h) | 14,007 | (771 | ) | — | ||||||||
Adjusted EBITDA | $ | 108,934 | $ | 15,245 | $ | 14,000 | ||||||
—————
(a) | In connection with the closing of the IPO, SunEdison and TerraForm entered into the Interest Payment Agreement, pursuant to which SunEdison agreed to pay all scheduled interest on the Term Loan through August 2017, up to a maximum aggregate amount of $48.0 |
69
million. The Interest Payment Agreement was amended in connection with the First Wind acquisition, such that SunEdison will instead pay amounts equal to a portion of each scheduled interest payment on the Senior Notes, beginning with the first scheduled interest payment on August 1, 2015 and continuing through the scheduled interest payment on August 1, 2017, up to a maximum aggregate amount of $48.0 million. During the period from July 24, 2014 to December 31, 2014, the Company received an equity contribution of $5.4 million from SunEdison pursuant to the Interest Payment Agreement.
(b) | Includes $4,190 of amortization of intangible assets included within operating revenues, net for the year ended December 31, 2014. |
(c) | Represents the non-cash allocation of SunEdison's corporate overhead. In conjunction with the closing of the IPO on July 23, 2014, we entered into the Management Services Agreement with SunEdison, pursuant to which SunEdison provides or arranges for other service providers to provide management and administrative services to us. There will be no cash payments to SunEdison for these services during 2014, and in subsequent years, the cash fees payable to SunEdison will be capped at $4.0 million in 2015, $7.0 million in 2016, and $9.0 million in 2017. The amount of general and administrative expenses in excess of the fees paid to SunEdison in each year will be treated as an addback in the reconciliation of net income (loss) to Adjusted EBITDA. |
(d) | Represents transaction related costs, including affiliate acquisition costs, associated with the acquisitions completed during the year ended December 31, 2014. There were no such costs during the same period in the prior years. |
(e) | Represents non-recurring professional fees for legal, tax and accounting services incurred in connection with the IPO. |
(f) | We recognized a net gain on extinguishment of debt of $7.6 million for the year ended December 31, 2014 due primarily to the termination of our capital lease obligations upon acquiring the lessor interest in the SunE Solar Fund X solar generation assets. There was no such gain during the same period in the prior year. |
(g) | Represents non-recurring plant-level professional fees attributable to tax equity transactions entered into during the year ended December 31, 2014. |
(h) | We incurred a net loss / (gain) on foreign currency exchange of $14.0 million and $(771) for the years ended December 31, 2014 and 2013, respectively. The loss during the year ended December 31, 2014 was primarily driven by unrealized losses during the year ended December 31, 2014 on the remeasurement of intercompany loans which are denominated in British pounds. We also realized a $2.8 million loss on the payment of outstanding Chilean peso denominated payables related to the construction of the CAP power plant in Chile, which were paid subsequent to the power plant reaching commercial operations in March 2014. |
Cash Available for Distribution
We believe cash available for distribution is useful to investors in evaluating our operating performance because securities analysts and other interested parties use such calculations as a measure of financial performance. In addition, cash available for distribution is used by our management team for internal planning purposes.
We define “cash available for distribution” or “CAFD” as net cash provided by operating activities of Terra LLC as adjusted for certain other cash flow items that we associate with our operations. It is a non-GAAP measure of our ability to generate cash to service our dividends. As used in this news release, cash available for distribution represents net cash provided by (used in) operating activities of Terra LLC (i) plus or minus changes in assets and liabilities as reflected on our statements of cash flows, (ii) minus deposits into (or plus withdrawals from) restricted cash accounts required by project financing arrangements to the extent they decrease (or increase) cash provided by operating activities, (iii) minus cash distributions paid to non-controlling interests in our projects, if any, (iv) minus scheduled project-level and other debt service payments and repayments in accordance with the related borrowing arrangements, to the extent they are paid from operating cash flows during a period, (v) minus non-expansionary capital expenditures, if any, to the extent they are paid from operating cash flows during a period, (vi) plus cash contributions from SunEdison pursuant to the Interest Payment Agreement, (vii) plus operating costs and expenses paid by SunEdison pursuant to the Management Services Agreement to the extent such costs or expenses exceed the fee payable by us pursuant to such agreement but otherwise reduce our net cash provided by operating activities and (viii) plus or minus operating items as necessary to present the cash flows we deem representative of our core business operations, with the approval of the audit committee. Our intention is to cause Terra LLC to distribute a portion of the cash available for distribution generated by our project portfolio to its members each quarter, after appropriate reserves for our working capital needs and the prudent conduct of our business.
70
The following table presents a reconciliation of cash flows from operating activities to CAFD for the periods presented:
Year Ended December 31, | ||||||||||||
(In thousands) | 2014 | 2013 | 2012 | |||||||||
Adjustments to reconcile net cash provided by operating activities to cash available for distribution: | ||||||||||||
Net cash provided by operating activities | $ | 82,578 | $ | (7,202 | ) | $ | 2,890 | |||||
Changes in assets and liabilities | (96,813 | ) | 10,162 | 456 | ||||||||
Deposits into/withdrawals from restricted cash accounts | 19,753 | 2,834 | 475 | |||||||||
Cash distributions to non-controlling interests | (1,323 | ) | — | — | ||||||||
Scheduled project-level and other debt service and repayments | (24,302 | ) | (2,838 | ) | (529 | ) | ||||||
Contributions received pursuant to Interest Payment Agreement with SunEdison | 5,457 | — | — | |||||||||
Other: | ||||||||||||
Bridge loan interest | 7,556 | — | — | |||||||||
Formation and offering related fees and expenses, including affiliates | 5,440 | — | — | |||||||||
Acquisition and related costs, including affiliates | 15,226 | — | — | |||||||||
Stock-based compensation | 5,787 | — | — | |||||||||
Change in accrued interest | 28,295 | (711 | ) | — | ||||||||
Non-cash allocation of SunEdison corporate overhead | 20,278 | 5,158 | 4,425 | |||||||||
Other | (1,065 | ) | — | — | ||||||||
Estimated cash available for distribution | $ | 66,867 | $ | 7,403 | $ | 7,717 | ||||||
71
Consolidated Results of Operations
Year Ended December 31, 2014 Compared to Year Ended December 31, 2013
For periods prior to the IPO, our consolidated results of operations represent the combination of TerraForm Power and Terra LLC, our accounting predecessor. For all periods subsequent to the IPO, the amounts shown in the table below represent the results of Terra LLC, which are consolidated by TerraForm Power through its controlling interest. The operating results of Terra LLC for the year-ended December 31, 2014 exclude $5.8 million of stock-based compensation expense, which is reflected in the operating results of TerraForm Power. There was no stock-based compensation expense recorded during the year-ended December 31, 2013. The following table illustrates the consolidated results of operations for the years ended December 31, 2014 compared to December 31, 2013:
Year Ended December 31, | ||||||||
(In thousands) | 2014 | 2013 | ||||||
Operating revenues, net | $ | 125,864 | $ | 17,469 | ||||
Operating costs and expenses: | ||||||||
Cost of operations | 10,544 | 1,024 | ||||||
Cost of operations - affiliate | 7,903 | 911 | ||||||
General and administrative | 20,984 | 289 | ||||||
General and administrative - affiliate | 19,144 | 5,158 | ||||||
Acquisition and related costs | 10,177 | — | ||||||
Acquisition and related costs - affiliate | 5,049 | — | ||||||
Formation and offering related fees and expenses | 3,570 | — | ||||||
Formation and offering related fees and expenses - affiliate | 1,870 | — | ||||||
Depreciation, accretion and amortization | 40,509 | 4,961 | ||||||
Total operating costs and expenses | 119,750 | 12,343 | ||||||
Operating income | 6,114 | 5,126 | ||||||
Other expense (income): | ||||||||
Interest expense, net | 84,418 | 6,267 | ||||||
Gain on extinguishment of debt, net | (7,635 | ) | — | |||||
Loss/(Gain) on foreign currency exchange, net | 14,007 | (771 | ) | |||||
Other, net | 438 | — | ||||||
Total other expenses, net | 91,228 | 5,496 | ||||||
Loss before income tax benefit | (85,114 | ) | (370 | ) | ||||
Income tax benefit | (4,689 | ) | (88 | ) | ||||
Net loss | (80,425 | ) | $ | (282 | ) | |||
Less: Predecessor loss prior to initial public offering on July 23, 2014 | (10,357 | ) | ||||||
Net loss subsequent to initial public offering | (70,068 | ) | ||||||
Less: Net loss attributable to non-controlling interests | (44,451 | ) | ||||||
Net loss attributable to TerraForm Power, Inc. Class A common stockholders | $ | (25,617 | ) | |||||
72
Operating Revenues, net
Operating revenues, net for the years ended December 31, 2014 and 2013 were as follows:
Year Ended December 31, | ||||||||
Operating Revenues, net (in thousands, other than MW data) | 2014 | 2013 | ||||||
Energy | $ | 91,144 | $ | 8,928 | ||||
Incentives including affiliates | 34,720 | 8,541 | ||||||
Total operating revenues, net | $ | 125,864 | $ | 17,469 | ||||
MWh Sold | 722,411 | 60,176 | ||||||
Nameplate Megawatt Capacity (MW) (1) | 928.1 | 57.2 | ||||||
_________
(1) Operational at end of period.
Energy revenues increased by $82.2 million during the year ended December 31, 2014, compared to the same period
in 2013, due to:
(In thousands) | ||||
Increase in energy revenues as California Public Institutions, U.S. Projects 2014, CAP, Norrington, Stonehenge Q1, Says Court, Crucis Farm, North Carolina Portfolio, and Regulus Solar achieved commercial operations | $ | 32,420 | ||
Increase in energy revenues from acquisitions of operating power generation facilities, which includes Enfinity, Summit Solar (U.S. and Canada), Nellis, Atwell Island, CalRenew-1, Stonehenge Operating, Mt. Signal, Capital Dynamics, Hudson Energy, and MA Operating portfolios | 53,277 | |||
Increase in energy revenues from acquired Call Right Projects, which includes Fairwinds and Crundale and Distributed Generation Acquisition portfolios | 558 | |||
Amortization of acquired PPA intangible assets | (4,190 | ) | ||
Existing power generation facility energy revenue | 151 | |||
$ | 82,216 | |||
Incentive revenue increased by $26.2 million during the year ended December 31, 2014, compared to the same period in 2013, due to:
(In thousands) | ||||
Increase in incentive revenues as California Public Institutions, U.S. Projects 2014, Norrington, Stonehenge Q1, Says Court, Crucis Farm, and the North Carolina Portfolio achieved commercial operations | $ | 9,876 | ||
Increase in incentive revenues from acquisitions of operating power generation facilities, which includes the Enfinity, Summit Solar (U.S. and Canada), Nellis, Stonehenge Operating, Capital Dynamics, Hudson Energy, and MA Operating portfolios | 15,574 | |||
Increase in incentive revenues from acquired Call Right Projects, which includes Fairwinds and Crundale | 680 | |||
Existing power generation facility incentive revenue | 49 | |||
$ | 26,179 | |||
Costs of Operations
Costs of operations for the years ended December 31, 2014 and 2013 were as follows:
Year Ended December 31, | ||||||||
Cost of operations (in thousands) | 2014 | 2013 | ||||||
Cost of operations | $ | 10,544 | $ | 1,024 | ||||
Cost of operations - affiliate | 7,903 | 911 | ||||||
Total cost of operations | $ | 18,447 | $ | 1,935 | ||||
73
Total costs of operations increased by $16.5 million compared to the year ended December 31, 2013. This increase is primarily driven by an $8.2 million increase in cost of operations related to new solar generation facilities commencing operation, including the U.S. Projects 2014, California Public Institutions, Regulus Solar, North Carolina Portfolio, Stonehenge Q1, Says Court, Crucis Farm, Norrington, and CAP portfolios, a $7.9 million increase in cost of operations resulting from the acquisitions of Capital Dynamics, Enfinity, Hudson Energy, Summit Solar (U.S. and Canada), MA Operating, Mt. Signal, Atwell Island, Nellis, CalRENEW-1, and Stonehenge Operating, and a $0.2 million increase in costs of operations resulting from the acquisition of Call Right Projects, including Fairwinds and Crundale and the Distributed Generation solar power facilities.
General and Administrative
General and administrative expenses for the years ended December 31, 2014 and 2013 were as follows:
Year ended December 31, | ||||||||
General and administrative (in thousands) | 2014 | 2013 | ||||||
General and administrative | $ | 20,984 | $ | 289 | ||||
General and administrative - affiliate | 19,144 | 5,158 | ||||||
Total general and administrative | $ | 40,128 | $ | 5,447 | ||||
General and administrative expense increased by $20.7 million compared to the year ended December 31, 2013, and general and administrative—affiliate expense increased by $14.0 million compared to the year ended December 31, 2013 due to:
(In thousands) | General and administrative | General and administrative - affiliate | ||||||
Increase due to stock-based compensation expense | $ | 5,787 | $ | — | ||||
Increase from non-recurring plant-level professional fees for legal and other consulting services related to tax equity transactions | 11,828 | — | ||||||
Increased costs related to being a public company and owning more power generation facilities than in 2013 | 3,080 | 13,986 | ||||||
Total Change | $ | 20,695 | $ | 13,986 | ||||
Immediately prior to the closing of the IPO on July 23, 2014, we entered into the Management Services Agreement with SunEdison. Pursuant to the Management Services Agreement, we will not pay SunEdison any fees for general and administrative services provided to us for 2014. The cash fees payable to SunEdison will be capped at $4.0 million in 2015, $7.0 million in 2016, and $9.0 million in 2017.
There was no cash consideration paid to SunEdison for these services for the period from July 24, 2014 through December 31, 2014. Total actual costs for these services during the period from July 24, 2014 to December 31, 2014 of $17.5 million is reflected in the consolidated statement of operations and has been treated as an equity contribution from SunEdison.
Acquisition and Related Costs
Acquisition and related costs, including amounts related to affiliates, were $15.2 million during the year ended December 31, 2014. These fees primarily consist of professional fees for legal and accounting services related to the acquisitions completed during the period, including $5.0 million paid by SunEdison pursuant to the Management Services Agreement. There were no acquisition and related costs for the year ended December 31, 2013.
Formation and Offering Related Fees and Expenses
Formation and offering related fees and expenses, including amounts related to affiliates, were $5.4 million during the year ended December 31, 2014. These fees primarily consist of non-recurring professional fees for legal, tax and accounting services not directly related to the IPO. There were no formation and offering related fees and expenses for the year ended December 31, 2013.
Depreciation, Accretion and Amortization
74
Depreciation, accretion and amortization expense increased by $35.5 million compared to the year ended December 31, 2013, due to $15.6 million of additional depreciation for solar generation facilities that commenced operations and $20.4 million of additional depreciation expense related to third party acquisitions and acquired Call Right Projects during the year ended December 31, 2014.
Interest Expense, Net
Interest expense, net increased by $78.2 million compared to the year ended December 31, 2013, primarily due to increased indebtedness related to construction financings, financing lease arrangements and borrowings under the Term Loan, which resulted in higher interest expense compared to the same period in 2013. In addition, the amortization of fees included in interest expense increased $25.6 million primarily due to deferred fees associated with the bridge facility, which was repaid upon completion of the IPO.
Immediately prior to the closing of the IPO on July 23, 2014, we entered into the Interest Payment Agreement with SunEdison. Pursuant to this agreement, SunEdison has agreed to pay all of the scheduled interest on the Term Loan through July 23, 2017, up to an aggregate of $48.0 million over such three year period (plus any interest due on any payment not remitted when due). During the period from July 24, 2014 to December 31, 2014, the Company received $5.4 million of equity contributions from SunEdison in connection with SunEdison's payment obligations under the Interest Payment Agreement.
Gain on Extinguishment of Debt, net
We incurred a net gain on the extinguishment of debt of $7.6 million for the year ended December 31, 2014, primarily due to the termination of our financing lease obligations upon acquiring the lessor interest in the SunE Solar Fund X solar generation assets and defeasance of debt obligations related to certain power generation facilities in the U.S. Projects 2009-2013 portfolio. The net gain on extinguishment of project-level indebtedness for the year ended December 31, 2014 related to the following power generation facility portfolios:
Loss/(Gain) on Extinguishment of Debt | Year Ended December 31, 2014 | |||
U.S. Projects 2009-2013 | $ | 2,459 | ||
Alamosa | 1,945 | |||
Stonehenge Operating | 3,797 | |||
SunE Solar Fund X | (15,836 | ) | ||
Total net gain on extinguishment of debt | $ | (7,635 | ) | |
There was no gain or loss on the extinguishment of debt for the year ended December 31, 2013.
Loss on Foreign Currency Exchange, net
We incurred a net loss on foreign currency exchange of $14.0 million for the year ended December 31, 2014, primarily due to an unrealized loss on the remeasurement of intercompany loans which are denominated in British pounds. These amounts were offset by other inconsequential foreign currency fluctuations.
Income Tax Benefit
The income tax benefit was $4.7 million for the year ended December 31, 2014 compared to an income tax benefit of $0.1 million during the same period in 2013. For the year ended December 31, 2014, the overall effective tax rate was different than the statutory rate of 35% primarily due to the recognition of a valuation allowance on the tax benefit attributed to the Company post IPO. The tax benefit for losses realized before the IPO on July 23, 2014, were recognized primarily because of existing deferred tax liabilities.
Net Loss Attributable to Non-Controlling Interest
75
Net loss attributable to non-controlling interest was $44.5 million for the year ended December 31, 2014. This was the result of a $44.2 million loss attributable to SunEdison's and Riverstone's interest in Terra LLC's net loss during the period from July 23, 2014 through December 31, 2014 and a $0.9 million loss attributable to project level non-controlling interest. No net income (loss) was allocated to the non-controlling interest holders in 2013.
Year ended December 31, 2013 Compared to Year ended December 31, 2012
The following table illustrates the consolidated results of operations for the years ended December 31, 2013 compared to December 31, 2012:
Year Ended December 31, | ||||||||
(In thousands) | 2013 | 2012 | ||||||
Operating revenues, net | $ | 17,469 | $ | 15,694 | ||||
Operating costs and expenses: | ||||||||
Cost of operations | 1,024 | 837 | ||||||
Cost of operations - affiliate | 911 | 680 | ||||||
General and administrative | 289 | 177 | ||||||
General and administrative - affiliate | 5,158 | 4,425 | ||||||
Depreciation, accretion and amortization | 4,961 | 4,267 | ||||||
Total operating costs and expenses | 12,343 | 10,386 | ||||||
Operating income | 5,126 | 5,308 | ||||||
Other expense (income): | ||||||||
Interest expense, net | 6,267 | 5,702 | ||||||
Gain on foreign currency exchange, net | (771 | ) | — | |||||
Total other expenses, net | 5,496 | 5,702 | ||||||
Loss before income tax benefit | (370 | ) | (394 | ) | ||||
Income tax benefit | (88 | ) | (1,270 | ) | ||||
Net (loss) income | $ | (282 | ) | $ | 876 | |||
Operating Revenues, net
Operating revenues, net for the years ended December 31, 2013 and 2012 were as follows:
Year Ended December 31, | ||||||||
Operating Revenues, net (in thousands, other than MW data) | 2013 | 2012 | ||||||
Energy | $ | 8,928 | $ | 8,193 | ||||
Incentives including affiliates | 8,541 | 7,501 | ||||||
Total operating revenues, net | $ | 17,469 | $ | 15,694 | ||||
MWh Sold | 60,176 | 52,325 | ||||||
Nameplate Megawatt Capacity (MW) (1) | 57.2 | 32.3 | ||||||
_________
(1) Operational at end of period.
Operating revenues, net during the year ended December 31, 2013 increased by $1.8 million compared to the same period in 2012 primarily due to an increase in incentive revenue of $1.0 million, or 14%, due to the acquisition of the Enfinity solar distributed generation facilities (acquired by SunEdison in July 2013), which were included in the results of operations for five months and contributed $1.8 million of incentive revenues during the year ended December 31, 2013. Total nameplate megawatt capacity increased 77% during the year ended December 31, 2013 compared to the same period in 2012 primarily
76
due to the acquisition of the Enfinity solar distributed generation facilities, which have a total capacity of 15.7 MW, and the completion of solar generation facilities with total capacity of 9.3 MW, which reached commercial operations in December 2013. MWh sold increased by 7,851 MWh, or 15%, due primarily to the acquisition of the Enfinity solar distributed generation facilities, which contributed sales of 8,009 MWh during the year ended December 31, 2013 and none during the same period in the prior year. As of December 31, 2013, we had solar energy power generation facilities under construction that will result in an additional 310 MW of nameplate capacity when the power generation facilities commence operations in 2014.
Costs of Operations
Costs of operations for the years ended December 31, 2013 and 2012 were as follows:
Year Ended December 31, | ||||||||
Cost of operations (in thousands) | 2013 | 2012 | ||||||
Cost of operations | $ | 1,024 | $ | 837 | ||||
Cost of operations - affiliate | 911 | 680 | ||||||
Total cost of operations | $ | 1,935 | $ | 1,517 | ||||
Total costs of operations, non-affiliate, increased by $0.2 million, or 22%, during the year ended December 31, 2013 compared to the year ended December 31, 2012. This increase was primarily due to an increase in MWh sold as a result of the addition of the Enfinity solar distributed generation facility portfolio. Cost of operations—affiliate increased $0.2 million, or 34% during the year ended December 31, 2013 compared to the same period in 2012. The increase is primarily due to additional operations and maintenance expenses related to the Enfinity solar distributed generation facility portfolio and other power generation facilities that commenced operations in December 2012.
General and Administrative
General and administrative—affiliate expense increased by $0.8 million to $5.2 million during 2013 compared to $4.4 million during the year ended December 31, 2012. The increase compared to the prior year is due to the overall increase in the nameplate capacity of our operational solar generation facilities. General and administrative expense, non-affiliate, increased to $0.3 million for the year ended December 31, 2013 compared to $0.2 million in the year ended December 31, 2012.
Depreciation, Accretion and Amortization
Depreciation, accretion and amortization expense increased by $0.7 million from the year ended December 31, 2013 compared to the year ended December 31, 2012, due primarily to additional depreciation for solar generation facilities that reached commercial operations in late 2012 and throughout 2013 and the acquisition of the Enfinity solar distributed generation facility portfolio.
Interest Expense, Net
Interest expense, net increased by $0.6 million from the year ended December 31, 2013 when compared to the same period in 2012 primarily due to the acquisition of the Enfinity solar distributed generation facility portfolio, which incurred $0.7 million of interest expense related to term bond and financing leaseback arrangements.
Gain on Foreign Currency Exchange, net
We incurred a net gain on foreign currency exchange of $0.8 million for the year ended December 31, 2013, due to transactional gains primarily related to construction in Chile. There was no gain or loss on foreign currency exchange for the year ended December 31, 2012.
Income Tax Benefit
The income tax benefit was $0.1 million for the year ended December 31, 2013 compared to an income tax benefit of $1.3 million during the same period in 2012. The decrease in the income tax benefit compared to the prior year is primarily due to grants received in lieu of tax credits in 2012 that were not received in 2013.
77
Liquidity and Capital Resources
Our principal liquidity requirements are to finance current operations, service our debt and to fund cash dividends to our investors. We will also use capital in the future to finance expansion capital expenditures and acquisitions. Historically, our Predecessor's operations were financed as part of our SunEdison's integrated operations and largely relied on internally generated cash flow as well as corporate and/or project-level borrowings to satisfy capital expenditure requirements. As a normal part of our business, depending on market conditions, we will from time to time consider opportunities to repay, redeem, repurchase or refinance our indebtedness. Changes in our operating plans, lower than anticipated electricity sales, increased expenses, acquisitions or other events may cause us to seek additional debt or equity financing in future periods. There can be no guarantee that financing will be available on acceptable terms or at all. Debt financing, if available, could impose additional cash payment obligations and additional covenants and operating restrictions. Equity financing, if any, could result in the dilution of our existing stockholders and make it more difficult for us to maintain our dividend policy.
Liquidity Position
Total liquidity as of December 31, 2014 was approximately $764.4 million, comprised of cash and restricted cash of $549.4 million and availability under the Revolver of $215.0 million. As of December 31, 2013, our total liquidity was approximately $70.8 million, comprised of cash and restricted cash. Management believes that our liquidity position and cash flows from operations will be adequate to finance growth, operating and maintenance capital expenditures, and to fund dividends to holders of our Class A common stock and other liquidity commitments. Management continues to regularly monitor our ability to finance the needs of operating, financing and investing activities within the dictates of prudent balance sheet management as our long-term growth will require additional capital.
As of January 31, 2015, subsequent to the acquisition of First Wind, our liquidity was approximately $712.6 million, comprised of $219.6 million of cash and restricted cash and $493.0 million available under our New Revolver.
Sources of Liquidity
Our principal sources of liquidity include cash on hand, cash generated from operations, borrowings under new and existing financing arrangements and the issuance of additional equity securities as appropriate given market conditions. We expect that these sources of funds will be adequate to provide for our short-term and long-term liquidity needs. Our ability to meet our debt service obligations and other capital requirements, including capital expenditures, as well as make acquisitions, will depend on our future operating performance which, in turn, will be subject to general economic, financial, business, competitive, legislative, regulatory and other conditions, many of which are beyond our control. Our financing arrangements consisted mainly of the Term Loan, the Revolver, and the project-level financings for our various solar generation facility assets.
Initial Public Offering
On July 23, 2014, we closed our IPO of 23,074,750 shares of our Class A common stock, including 3,009,750 shares sold pursuant to the underwriters' overallotment option. Concurrently with our IPO, we completed a private placement of an aggregate of 2,600,000 shares of our Class A common stock at the IPO price to Altai and Everstream. In addition, on July 23, 2014, as consideration for the acquisition of the Mt. Signal power plant from Silver Ridge Power at an aggregate purchase price of $292.0 million, Terra LLC issued to Silver Ridge Power 5,840,000 Class B units (and we issued a corresponding number of shares of Class B common stock) and 5,840,000 Class B1 units (and we issued a corresponding number of shares of Class B1 common stock). Silver Ridge Power distributed the Class B shares and units to SunEdison and the Class B1 shares and units to Riverstone, the owners of Silver Ridge Power.
We received $533.5 million of net proceeds from our IPO (including the net proceeds from the underwriters exercise in full of their option to purchase additional shares), after deducting underwriting discounts, commissions and offering expenses. We received $65.0 million of net proceeds from the IPO Private Placements. We used $159.2 million of these net proceeds to repurchase Class B common stock and Class B units from SunEdison.
We used $436.2 million of the net proceeds, together with borrowings under the Term Loan, to repay all outstanding indebtedness (including accrued interest) under our bridge facility, to pay fees and expenses related to the Term Loan and revolving credit facility and to repay $50.0 million of project-level indebtedness. In addition, we used $83.0 million of the net proceeds to pay for the acquisition and related milestone payments of certain power generation facilities included in our initial portfolio.
78
Term Loan and Revolving Credit Facility Refinancing
In connection with the closing of the IPO on July 23, 2014, Terra Operating LLC entered into the Revolver and the Term Loan. The Revolver provided for up to a $140.0 million senior secured revolving credit facility and the Term Loan provided for up to a $300.0 million senior secured term loan. On December 18, 2014, we obtained additional financing by increasing the Revolver by $75.0 million to a total of $215.0 million and increasing the Term Loan by $275.0 million to a total of $575.0 million to increase liquidity and to fund the Capital Dynamics Acquisition.
On January 28, 2015, we repaid the Term Loan in full and replaced our existing Revolver with a $550.0 million New Revolver. Our New Revolver is available for revolving loans and letters of credit. Terra Operating LLC is permitted to increase commitments under the new Revolver by $175.0 million to a total of $725.0 million in the aggregate, subject to customary closing conditions. The New Revolver matures on the five-year anniversary of the closing date of such facility. Each of Terra Operating LLC’s existing and subsequently acquired or organized domestic restricted subsidiaries (excluding non-recourse subsidiaries) and Terra LLC are or will become guarantors under the New Revolver.
All outstanding amounts under the New Revolver will bear interest initially at a rate per annum equal to, at Terra Operating LLC’s option, either (i) a base rate plus a margin of 1.50% or (ii) a reserve adjusted Eurodollar rate plus a margin of 2.50%. After the fiscal quarter ended June 30, 2015, the base rate margin will range between 1.25% and 1.75% and the Eurodollar rate margin will range between 2.25% and 2.75% as determined by reference to a leverage-based grid.
Acquisition Private Placement
On November 26, 2014, we completed the sale of a total of 11,666,667 shares of our Class A common stock in a private placement to certain eligible investors for a net purchase price of $337.8 million. We used the net proceeds from the private placement to repay a portion of amounts outstanding under our Term Loan among other things. In connection with the Acquisition Private Placement, we entered into a registration rights agreement with the purchasers pursuant to which we filed a registration statement with the SEC covering the resale of the purchased shares. The registration statement for these shares became effective on January 8, 2015.
Follow-on Public Offering
On January 22, 2015, we completed the sale of a total of 13,800,000 shares of our Class A common stock to the public in a registered offering, including 1,800,000 shares sold pursuant to the underwriters’ overallotment option, or the "Follow-on Public Offering." We received net proceeds of $390.6 million from the offering, $50.9 million of which we used to repurchase Class B common stock and Class B units from SunEdison and the remainder of which we used to pay for part of the purchase price of the First Wind assets and to repay remaining amounts outstanding under our Term Loan among other things.
Green Bond Offering
On January 28, 2015, through our indirect subsidiary, Terra Operating LLC, we issued $800.0 million of 5.875% Senior Notes due 2023 at a price of 99.214%. We used the net proceeds from the offering, together with a portion of the net proceeds from the Follow-on Public Offering, to fund the full purchase price of the First Wind acquisition.
The Senior Notes are senior obligations of Terra Operating LLC and are guaranteed by Terra LLC and each of Terra Operating LLC's existing and future subsidiaries that guarantee our New Revolver, subject to certain exceptions.
79
Project-Level Financing Arrangements
We have outstanding project-level non-recourse indebtedness that is backed by certain of our solar generation facilities and wind power plant assets. The agreements governing our project-level financing contain financial and other restrictive covenants that limit our project subsidiaries’ ability to make distributions to us or otherwise engage in activities that may be in our long-term best interests. The project-level financing agreements generally prohibit distributions from the project entities to us unless certain specific conditions are met, including the satisfaction of certain financial ratios. The table below summarizes certain terms of the project-level financing arrangements for our portfolio as of December 31, 2014:
Name of Project | Remaining Principal Due | Type of Financing | Maturity Date(s) | |||||
Distributed Generation: | ||||||||
Enfinity | $ | 29,124 | Financing lease obligations | 2025 - 2032 | ||||
Enfinity | 6,470 | Term debt | 2032 | |||||
HES Portfolio | 24,538 | Financing lease obligations | 2019-2028 | |||||
Summit Solar U.S. | 23,127 | Financing lease obligations | 2020 - 2032 | |||||
California Public Institutions | 16,861 | Term debt | 2024 - 2030 | |||||
U.S. Projects 2009-2013 | 9,338 | Solar program loans | 2024 - 2026 | |||||
U.S. Projects 2014 | 6,869 | Financing lease obligations | 2019 | |||||
DG 2014 Portfolio 1 | 1,185 | Financing lease obligations | 2023 | |||||
Total Distributed Generation | $ | 117,512 | ||||||
Utility-scale: | ||||||||
Mt. Signal | $ | 402,440 | Senior notes | 2038 | ||||
CAP | 211,377 | Term debt | 2032 | |||||
Regulus Solar | 85,000 | Note facility | 2034 | |||||
Regulus Solar | 50,433 | Term debt | 2024 | |||||
Regulus Solar | 9,138 | Financing lease obligations | 2034 | |||||
Fairwinds and Crundale | 61,982 | Term debt | 2016 | |||||
Nellis | 42,248 | Senior notes | 2027 | |||||
SunE Perpetual Lindsay | 42,992 | Construction debt and Harmonized Sales Tax Facility | 2015 | |||||
Total Utility-scale | 905,610 | |||||||
Subtotal: Project-level Indebtedness | $ | 1,023,122 | ||||||
Net unamortized premium | $ | 1,473 | ||||||
Total Project-level Indebtedness | $ | 1,024,595 | ||||||
Uses of Liquidity
Our principal requirements for liquidity and capital resources, other than for operating our business, can generally be categorized by the following: (i) debt service obligations; (ii) funding acquisitions, if any; and (iii) cash dividends to investors. Generally, once commercial operation is reached, solar and wind power generation assets do not require significant capital expenditures to maintain operating performance.
80
Debt Service Obligations
The aggregate amounts of payments on long-term debt, excluding amortization of debt discounts, due after December 31, 2014 are as follows:
(In thousands) | 2015 (2) | 2016 (3) | 2017 | 2018 | 2019 | Thereafter | Total | |||||||||||||||||||||
Financing Lease Obligations | $ | 6,292 | $ | 6,612 | $ | 6,947 | $ | 6,889 | $ | 16,395 | $ | 50,846 | $ | 93,981 | ||||||||||||||
Maturities of long-term debt as of December 31, 2014 (1) | 73,616 | 96,915 | 33,809 | 35,115 | 580,961 | 682,225 | 1,502,641 | |||||||||||||||||||||
Total | $ | 79,908 | $ | 103,527 | $ | 40,756 | $ | 42,004 | $ | 597,356 | $ | 733,071 | $ | 1,596,622 | ||||||||||||||
—————
(1) | This table includes the $573.5 million Term Loan that was fully repaid on January 28, 2015 and excludes the $800.0 million aggregate principal amount of Senior Notes due 2023, issued on January 28, 2015. |
(2) | This amount includes $43.0 million of construction debt for SunE Perpetual Lindsay which will be repaid by SunEdison upon completion. |
(3) | This amount includes $62.0 million of term debt for Fairwinds and Crundale that will be repaid in 2016. |
Acquisitions
We expect to continue to acquire additional power generation assets from SunEdison and from unaffiliated third parties. Although we have no commitments to make any such acquisitions, we expect to acquire certain of the Call Right Projects and ROFO Projects in the near future.
Interest Payment Agreement
In connection with the closing of the IPO on July 23, 2014, we entered into the Interest Payment Agreement with SunEdison and its wholly owned subsidiary, SunEdison Holdings Corporation, pursuant to which SunEdison has agreed to pay all of the scheduled interest on the Term Loan through July 23, 2017, up to an aggregate of $48.0 million over such period (plus any interest due on any payment not remitted when due).
On January 28, 2015, Terra LLC and Terra Operating entered into the Amended and Restated Interest Payment Agreement (the “Amended Interest Payment Agreement”) with SunEdison and SunEdison Holdings Corporation. The Amended Interest Payment Agreement amends and restates the Interest Payment Agreement, all in accordance with the terms of the Intercompany Agreement.
Pursuant to the Amended Interest Payment Agreement, SunEdison has agreed to pay amounts equal to a portion of each scheduled interest payment on the 2023 Notes, beginning with the first scheduled interest payment on August 1, 2015, and continuing through the scheduled interest payment on August 1, 2017. Amounts will be paid by SunEdison as follows: (1) in respect of the first scheduled interest payment, $16.0 million, less amounts already paid by SunEdison under the original Interest Payment Agreement, (2) in respect of each scheduled interest payment in 2016, $8.0 million, and (3) in respect of each scheduled interest payment in 2017, $8.0 million, provided that the maximum amount payable by SunEdison under the Amended Interest Payment Agreement (inclusive of amounts already paid under the original Interest Payment Agreement) may not exceed $48.0 million (plus any interest due on any payment not remitted when due). SunEdison will also not be obligated to pay any amounts payable under the Senior Notes in connection with an acceleration of the indebtedness thereunder.
The Amended Interest Payment Agreement may be terminated early by mutual written agreement of SunEdison and Terra Operating and will automatically terminate upon the repayment in full of all outstanding indebtedness under the Senior Notes or a specified change of control of TerraForm Power, Terra LLC or Terra Operating. The agreement may also be terminated at the election of SunEdison, Terra LLC or Terra Operating if any of them experiences certain events relating to bankruptcy or insolvency. Any decision by Terra LLC or Terra Operating to terminate the Amended Interest Payment Agreement must have the prior approval of a majority of the members of TerraForm Power’s Corporate Governance and Conflicts Committee of its board of directors.
Cash Dividends to Investors
We intend to pay regular quarterly cash dividends to holders of our Class A common stock on or about the 75th day following the last day of each fiscal quarter.
81
On October 27, 2014, we declared a quarterly dividend of $0.1717 per share on our outstanding Class A common stock which was paid on December 15, 2014 to holders of record on December 1, 2014. This amount represents a quarterly dividend of $0.2257 per share, or $0.9028 per share on an annualized basis, prorated to adjust for a partial quarter as we consummated our IPO, on July 23, 2014.
On December 22, 2014, we declared a quarterly dividend for the fourth quarter on the Company's Class A common stock of $0.27 per share, or $1.08 per share on an annualized basis. The fourth-quarter dividend is payable on March 16, 2015 to shareholders of record as of March 2, 2015.
We intend to cause Terra LLC to make regular quarterly cash distributions in an amount equal to cash available for distribution generated during a particular quarter, less reserves for working capital needs and the prudent conduct of our business, to its members (including to us as the sole holder of the Class A units, to SunEdison as the sole holder of the Class B units and to Riverstone as the sole holder of Class B1 units) pro rata based on the number of units held. During the Subordination Period provided for in the operating agreement of Terra LLC, or the "Subordination Period," which will be a minimum of three years from the date of the IPO, the Class A units and Class B1 units are entitled to receive quarterly distributions in an amount equal to $0.2257 per unit, or the "Minimum Quarterly Distribution," plus any arrearages in the payment of the Minimum Quarterly Distribution from prior quarters, before any distributions may be made on the Class B units. The practical effect of the subordination of the Class B units is to increase the likelihood that during the Subordination Period there will be sufficient CAFD to pay the Minimum Quarterly Distribution on the Class A units (and Class B1 units, if any).
Incentive Distribution Rights
IDRs represent the right to receive increasing percentages (15.0%, 25.0% and 50.0%) of Terra LLC’s quarterly distributions after the Class A Units, Class B units, and Class B1 units of Terra LLC have received quarterly distributions in an amount equal to $0.2257 per unit and the target distribution levels have been achieved. Upon the completion of the IPO, SunEdison holds 100% of the IDRs.
Initial IDR Structure
If for any quarter:
• | Terra LLC has made cash distributions to the holders of its Class A units, Class B1 units and, subject to the Distribution Forbearance Provisions, Class B units in an amount equal to the Minimum Quarterly Distribution; and |
• | Terra LLC has distributed cash to holders of Class A units and holders of Class B1 units in an amount necessary to eliminate any arrearages in payment of the Minimum Quarterly Distribution; |
then Terra LLC will make additional cash distributions for that quarter among holders of its Class A units, Class B units, Class B1 units and the IDRs in the following manner:
• | first, to all holders of Class A units, Class B1 units and, subject to the Distribution Forbearance Provisions, Class B units, pro rata, until each holder receives a total of $0.3386 per unit for that quarter (the “First Target Distribution”) (150.0% of the Minimum Quarterly Distribution); |
• | second, 85.0% to all holders of Class A units, Class B1 units and, subject to the Distribution Forbearance Provisions, Class B units, pro rata, and 15.0% to the holders of the IDRs, until each holder of Class A units, Class B1 units and, subject to the Distribution Forbearance Provisions, Class B units receives a total of $0.3950 per unit for that quarter (the “Second Target Distribution”) (175.0% of the Minimum Quarterly Distribution); |
• | third, 75.0% to all holders of Class A units, Class B1 units and, subject to the Distribution Forbearance Provisions, Class B units, pro rata, and 25.0% to the holders of the IDRs, until each holder of Class A units, Class B1 units and, subject to the Distribution Forbearance Provisions, Class B units receives a total of $0.4514 per unit for that quarter (the “Third Target Distribution”) (200.0% of the Minimum Quarterly Distribution); and |
• | thereafter, 50.0% to all holders of Class A units, Class B1 units and, subject to the Distribution Forbearance Provisions, Class B units, pro rata, and 50.0% to the holders of the IDRs. |
Cash Flow Discussion
We use traditional measures of cash flow, including net cash used in operating activities, net cash used in investing activities and net cash provided by financing activities to evaluate our periodic cash flow results.
82
Year Ended December 31, 2014 Compared to Year Ended December 31, 2013
The following table reflects the changes in cash flows for the comparative periods:
(In thousands) | Year Ended December 31, | |||||||||||
2014 | 2013 | Change | ||||||||||
Net cash provided by (used in) operating activities | $ | 82,578 | $ | (7,202 | ) | $ | 89,780 | |||||
Net cash used in investing activities | (1,528,025 | ) | (264,239 | ) | (1,263,786 | ) | ||||||
Net cash provided by financing activities | 1,912,960 | 272,482 | 1,640,478 | |||||||||
Net Cash Provided By (Used In) Operating Activities
The increase in net cash provided by operating activities is primarily driven by the receipt of $68.7 million from the non-controlling interest member for the allocation of ITCs to tax equity investors, which will be amortized to revenue over the life of the investment tax credit recapture period. The remaining increase compared to the year ended December 31, 2013 is primarily attributable to the timing of cash payments to SunEdison and affiliates for reimbursement of operating expenses paid by those entities and the impact of operating results for power generation facilities acquired during the year ended December 31, 2014.
Net Cash Used In Investing Activities
The change in net cash used in investing activities includes $786.7 million of cash paid to SunEdison and third parties for the construction of solar generation facilities, $644.9 million of cash paid to third parties for acquisitions of solar generation facilities, $30.0 million of cash paid to third parties for the acquisition of PPA intangible assets, and changes in restricted cash of $23.6 million in accordance with the restrictions in our debt agreements. When SunEdison contributes projects, we recast our cash flow statement to present construction costs incurred by SunEdison as if they were our construction costs. SunEdison continues to maintain the construction related liabilities for all contributed power generation facilities.
Net Cash Provided By Financing Activities
The change in net cash provided by financing activities is primarily driven by $770.4 million of net proceeds from the issuance of Class A common stock, $974.8 million proceeds from construction and term debt financing arrangements and $405.1 million of contributions from SunEdison to fund capital expenditures.
Year Ended December 31, 2013 Compared to Year Ended December 31, 2012
The following table reflects the changes in cash flows for the comparative periods:
(In thousands) | Year Ended December 31, | |||||||||||
2013 | 2012 | Change | ||||||||||
Net cash (used in) provided by operating activities | $ | (7,202 | ) | $ | 2,890 | $ | (10,092 | ) | ||||
Net cash used in investing activities | (264,239 | ) | (410 | ) | (263,829 | ) | ||||||
Net cash provided by (used in) financing activities | 272,482 | (2,477 | ) | 274,959 | ||||||||
Net Cash (Used In) Provided By Operating Activities
The change to net cash provided by operating activities is primarily driven by the timing of cash payments to SunEdison and affiliates for reimbursement of operating expenses paid by the same or other affiliates of SunEdison. In addition, changes in current assets and liabilities used cash of $10.2 million during 2013 compared to $0.5 million during 2012 primarily due to an increase in VAT receivable related to the construction of the CAP power plant in Chile during fiscal 2013.
Net Cash Used In Investing Activities
The change to net cash used in investing activities is driven by capital expenditures related to the construction of solar generation facilities and changes in restricted cash in accordance with the restrictions in our debt agreements.
83
Net Cash Provided By (Used In) Financing Activities
The change in net cash provided by financing activities is primarily driven by proceeds from system construction and term debt financing arrangements which were partially offset by distributions to SunEdison.
Contractual Obligations and Commercial Commitments
We have a variety of contractual obligations and other commercial commitments that represent prospective cash requirements. The following table summarizes our outstanding contractual obligations and commercial commitments as of December 31, 2014.
Payment due by Period (1) | ||||||||||||||||||||
Contractual Cash Obligations (in thousands) | 1 Year | 1-3 Years | 3-5 Years | Over 5 Years | Total | |||||||||||||||
Long-term debt (principal) | $ | 73,616 | $ | 130,724 | $ | 616,076 | $ | 682,225 | $ | 1,502,641 | ||||||||||
Long-term debt (interest) (2) | 84,868 | 160,521 | 135,752 | 344,054 | 725,195 | |||||||||||||||
Financing lease obligations | 6,292 | 13,559 | 23,284 | 50,846 | 93,981 | |||||||||||||||
Purchase obligations (3) | 17,149 | 30,239 | 30,228 | 141,389 | 219,005 | |||||||||||||||
Management services agreement | 4,000 | 7,000 | 9,000 | — | 20,000 | |||||||||||||||
Total contractual obligations | $ | 185,925 | $ | 342,043 | $ | 814,340 | $ | 1,218,514 | $ | 2,560,822 | ||||||||||
———
(1) These amounts include the $573.5 million Term Loan that was fully repaid on January 28, 2015 and exclude the $800.0 million aggregate principal amount of Senior Notes due in 2023 issued on January 28, 2015.
(2) Includes fixed rate interest and variable rate interest using December 31, 2014 rates.
(3) Consists primarily of contractual payments due for operation and maintenance services, asset management services, and operating leases.
Off-Balance Sheet Arrangements
We are not party to any off-balance sheet arrangements.
Critical Accounting Policies and Estimates
The preparation of financial statements in conformity with accounting principles generally accepted in the United States requires us to make estimates and assumptions in certain circumstances that affect amounts reported in our consolidated financial statements and related footnotes. In preparing these consolidated financial statements, we have made our best estimates of certain amounts included in the consolidated financial statements. Application of accounting policies and estimates, however, involves the exercise of judgment and use of assumptions as to future uncertainties and, as a result, actual results could differ from these estimates. In arriving at our critical accounting estimates, factors we consider include how accurate the estimate or assumptions have been in the past, how much the estimate or assumptions have changed and how reasonably likely such change may have a material impact.
Our critical accounting policies are discussed below.
Business Combinations
The Company accounts for its business combinations by recognizing in the financial statements the identifiable assets acquired, the liabilities assumed, and any non-controlling interest in the acquiree at fair value at the acquisition date. The Company also recognizes and measures the goodwill acquired or a gain from a bargain purchase in the business combination and determines what information to disclose to enable users of an entity's financial statements to evaluate the nature and financial effects of the business combination. In addition, acquisition costs are expensed as incurred. Business combinations is a critical accounting policy as there are significant judgments involved in the allocation of acquisition cost.
When we acquire renewable energy facilities, we allocate the purchase price to (i) the acquired tangible assets and liabilities assumed, primarily consisting of land, plant, and long-term debt, (ii) the identified intangible assets and liabilities, consisting of the value of above-market and below-market power purchase agreements and in-place power purchase agreements, (iii) non-controlling interests, and (iv) other working capital items based in each case on their fair values in accordance with ASC 805. All expenses related to acquisition costs related to business combinations are expensed as incurred.
84
We generally use independent appraisers to assist with the estimates and methodologies used such as a replacement cost approach, or an income approach or excess earnings approach. Factors considered by management in its analysis include considering current market conditions and costs to construct similar facilities. We also consider information obtained about each property as a result of our pre-acquisition due diligence, marketing and income activities in estimating the fair value of the tangible and intangible assets and liabilities acquired or assumed. In estimating the fair value, we also establishes estimates of energy production, current in-place and market power purchase rates, tax credit arrangements, operating and maintenance costs, and local market conditions. A change in any of the assumptions above, which are subjective, could have a significant impact on the results of operations.
The allocation of the purchase price directly affects the following items in our consolidated financial statements:
• | The amount of purchase price allocated to the various tangible and intangible assets, liabilities, and non-controlling interests on our balance sheet; |
• | The amounts allocated to the value of above-market and below-market power purchase agreement values are amortized to revenue over the remaining non-cancelable terms of the respective arrangement. The amounts allocated to all other tangible and intangible assets are amortized to depreciation or amortization expense; and |
• | The period of time over which tangible and intangible assets are depreciated or amortized varies, and thus, changes in the amounts allocated to these assets will have a direct impact on our results of operations. Intangible assets are generally amortized over the respective life of the power purchase arrangement, which normally range from 15 to 20 years. The Company generally depreciates our energy facilities over 30 years, but do not depreciate our land. These differences in timing could have an impact on our results of operations. |
Acquisitions completed in 2014 are presented with preliminary purchase price allocations. Certain information necessary, primarily valuation of individual assets and liabilities assumed, are preliminary and were not complete. We do not expect changes to the preliminary purchase price allocations to have a material effect of our reported operating results or financial
Non-controlling Interests and hypothetical liquidation of book value ("HLBV")
Non-controlling interests represents the portion of net assets in consolidated entities that are not owned by the Company. The Company has determined for certain of its consolidated subsidiaries, the allocation of economics between controlling and third-party, non-controlling interests does not correspond to ownership percentages. In order to reflect the substantive profit sharing arrangements, the Company has determined that the appropriate methodology for determining the value of non-controlling interests is a balance sheet approach using the HLBV method.
Under the HLBV method, the amounts reported as non-controlling interest on the consolidated balance sheets represent the amounts the third party investors could hypothetically receive at each balance sheet reporting date based on the liquidation provisions of the respective operating partnership agreements. HLBV assumes that the proceeds available for distribution are equivalent to the unadjusted, stand-alone net assets of each respective partnership, as determined under U.S. GAAP. The third-party, non-controlling interests in the consolidated statements of operations and statements of comprehensive income are determined based on the difference in the carrying amounts of non-controlling interests on the consolidated balance sheets between reporting dates, adjusted for any capital transactions between the Company and third-party investors that occurred during the respective period. Non-controlling interests are reported as a component of equity in the consolidated balance sheets.
Where, prior to the commencement of operating activities for a respective project, HLBV results in an immediate change in the carrying value of non-controlling interest on the consolidated balance sheet due to the recognition of investment tax credits or other adjustments as required by the U.S. Internal Revenue Code, the Company defers the recognition of the respective adjustments and recognizes the adjustments in non-controlling interest on the consolidated statement of operations on a straight-line basis over the expected life of the underlying assets giving rise to the respective difference. Similarly, where the Company has acquired a controlling interest in a partnership and there is a resulting difference between the initial fair value of non-controlling interest and the value of non-controlling interest as measured using HLBV, the Company initially records non-controlling interest at fair value and amortizes the resulting difference over the remaining life of the underlying assets.
Recently Issued Accounting Standards
On May 28, 2014, the Financial Accounting Standards Board ("FASB") issued Accounting Standards Update ("ASU") No. 2014-09, Revenue from Contracts with Customers, which requires an entity to recognize the amount of revenue to which it
85
expects to be entitled for the transfer of promised goods or services to customers. This ASU will replace most existing revenue recognition guidance in U.S. GAAP when it becomes effective. The new standard is effective for us on January 1, 2017. Early application is not permitted. The standard permits the use of either the retrospective or cumulative effect transition method. The Company is currently evaluating the effect that ASU No. 2014-09 will have on its consolidated financial statements and related disclosures. The Company has not yet selected a transition method or determined the effect of the standard on its ongoing financial reporting.
In August 2014, the FASB issued ASU No. 2014-15, Presentation of Financial Statements-Going Concern, which is intended to define management's responsibility to evaluate whether there is substantial doubt about an organization's ability to continue as a going concern and to provide related footnote disclosures. This guidance is effective for us in the annual period ending December 31, 2016 and interim and annual periods thereafter. We do not expect the adoption of this standard to have a material impact on our consolidated financial position, results of operations and cash flows.
In January 2015, the FASB issued ASU No. 2015-01, Income Statement-Extraordinary and Unusual Items (Subtopic 225-20), which eliminates the concept of reporting for extraordinary items. ASU No. 2015-01 is effective for us for our fiscal year ending December 31, 2016 and for interim periods thereafter. We do not believe this standard will have a significant effect on our consolidated financial position, results of operations and cash flows.
In February 2015, the FASB issued ASU No. 2015-02 Consolidation (Topic 810) Amendments to the Consolidation Analysis, which affects the following areas of the consolidation analysis: limited partnerships and similar entities, evaluation of fees paid to a decision maker or service provider as a variable interest and in determination of the primary beneficiary, effect of related parties on the primary beneficiary determination and for certain investment funds. ASU No. 2015-02 is effective for us for our fiscal year ending December 31, 2016 and interim periods therein. We are evaluating the impact of this standard on our consolidated financial position, results of operations and cash flows.
Item 7A. Quantitative and Qualitative Disclosures About Market Risk.
We are exposed to several market risks in our normal business activities. Market risk is the potential loss that may result from market changes associated with our business or with an existing or forecasted financial or commodity transaction. The types of market risks we are exposed to are interest rate risk, foreign currency risk, liquidity risk and credit risk.
Interest Rate Risk
As of December 31, 2014, our long-term debt was at both fixed and variable interest rates. We estimate that a hypothetical 1% increase or decrease in our variable interest rates would have a $2.5 million effect on our earnings for the year ended December 31, 2014. As of December 31, 2014, the estimated fair value of our debt was $1,607.5 million and the carrying value of our debt was $1,598.1 million. We estimate that a 1% decrease in market interest rates would have increased the fair value of our long-term debt by $80.3 million.
We entered into the Term Loan and the Revolver upon completion of the IPO which bore interest at variable rates. Under the agreement governing the Term Loan, we were required to hedge 50% of our notional amount for the first three years. As of January 31, 2015, we had repaid our Term Loan and replaced our Revolver, leaving only our New Revolver which bears interest at a variable rate.
As of December 31, 2014, our project-level debt was at both fixed and variable rates. We have entered into short-term interest rate hedges to swap certain of our variable rate project-level debt to a fixed rate. Although we intend to use hedging strategies to mitigate our exposure to interest rate fluctuations, we may not hedge all of our interest rate risk and, to the extent we enter into interest rate hedges, our hedges may not necessarily have the same duration as the associated indebtedness. Our exposure to interest rate fluctuations will depend on the amount of indebtedness that bears interest at variable rates, the time at which the interest rate is adjusted, the amount of the adjustment, our ability to prepay or refinance variable rate indebtedness when fixed rate debt matures and needs to be refinanced and hedging strategies we may use to reduce the impact of any increases in rates.
Foreign Currency Risk
In 2013, all of our operating revenues were generated in the United States and Puerto Rico and were denominated in United States dollars. During the year ended December 31, 2014, we generated operating revenues in the United States, Puerto Rico, Canada, the United Kingdom, and Chile, with all of our revenues being denominated in U.S. dollars, Canadian dollars, and British pounds. The PPAs, operating and maintenance agreements, financing arrangements and other contractual arrangements relating to our current portfolio are denominated in U.S. dollars, British pounds and Canadian dollars.
86
We utilize currency forward contracts in certain instances to mitigate the financial market risks of fluctuations in foreign currency exchange rates. We manage our foreign currency exposures through the use of these currency forward contracts to reduce risks arising from the change in fair value of certain assets and liabilities denominated in British pounds and Canadian dollars. The objective of these practices is to minimize the impact of foreign currency fluctuations on our operating results. We do not use derivative financial instruments for speculative or trading purposes.
Item 8. Financial Statements and Supplementary Data.
The financial statements and schedules are listed in Part IV, Item 15 of this Form 10-K and are incorporated by reference herein.
Item 9. Changes in and Disagreements With Accountants on Accounting and Financial Disclosure.
None.
Item 9A. Controls and Procedures.
Evaluation of Disclosure Controls and Procedures
We carried out an evaluation as of December 31, 2014, under the supervision and with the participation of our management, including our Chief Executive Officer and Chief Financial Officer, of the effectiveness of the design and operation of our disclosure controls and procedures, as defined in Rules 13a-15(e) and 15d-15(e) of the Securities Exchange Act of 1934, as amended. Based upon that evaluation, our Chief Executive Officer and Chief Financial Officer have concluded that our disclosure controls and procedures were effective as of December 31, 2014.
Management’s Report on Internal Control Over Financial Reporting
This annual report does not include a report of management's assessment regarding internal control over financial reporting or an attestation report of the Company's registered public accounting firm due to a transition period established by rules of the SEC for newly public companies.
Changes in Internal Control Over Financial Reporting
There have been no changes in the Company's internal control over financial reporting (as defined in Rules 13a-15(f) and 15d-15(f) of the Securities Exchange Act of 1934, as amended) during the year ended December 31, 2014 that have materially affected, or are reasonably likely to materially affect, the Company's internal control over financial reporting.
Item 9B. Other Information.
None.
87
PART III
Item 10. Directors, Executive Officers and Corporate Governance.
The information required under this Item is incorporated by reference to the similarly named section of our 2014 Proxy Statement.
Item 11. Executive Compensation.
The information required under this Item is incorporated by reference to the similarly named section of our 2014 Proxy Statement.
Item 12. Security Ownership of Certain Beneficial Owners and Management and Related Stockholder
Matters.
The information required under this Item is incorporated by reference to the similarly named section of our 2014 Proxy Statement.
Item 13. Certain Relationships and Related Transactions, and Director Independence.
The information required under this Item is incorporated by reference to the similarly named section of our 2014 Proxy Statement.
Item 14. Principal Accounting Fees and Services.
The information required under this Item is incorporated by reference to the similarly named section of our 2014 Proxy Statement.
88
PART IV
Item 15. Exhibits, Financial Statement Schedules.
(a) The following documents are filed as a part of this report
(1) Financial Statements:
Page # | ||
(2) Financial Statement Schedules:
The information required to be submitted in the Financial Statement Schedules for TerraForm Power, Inc. has either been shown in the financial statements or notes, or is not applicable or required under Regulation S-X; therefore, those schedules have been omitted.
(3) Exhibits:
See Exhibit Index submitted as a separate section of this report.
89
Report of Independent Registered Public Accounting Firm
The Board of Directors
TerraForm Power, Inc.:
We have audited the accompanying consolidated balance sheets of TerraForm Power, Inc. and subsidiaries (a solar energy generation asset business of SunEdison, Inc.) (the Company) as of December 31, 2014 and 2013, and the related consolidated statements of operations, comprehensive income (loss), stockholders' equity, and cash flows for each of the years in the three-year period ended December 31, 2014. These consolidated financial statements are the responsibility of the Company’s management. Our responsibility is to express an opinion on these consolidated financial statements based on our audits.
We conducted our audits in accordance with the standards of the Public Company Accounting Oversight Board (United States). Those standards require that we plan and perform the audit to obtain reasonable assurance about whether the financial statements are free of material misstatement. An audit includes examining, on a test basis, evidence supporting the amounts and disclosures in the financial statements. An audit also includes assessing the accounting principles used and significant estimates made by management, as well as evaluating the overall financial statement presentation. We believe that our audits provide a reasonable basis for our opinion.
In our opinion, the consolidated financial statements referred to above present fairly, in all material respects, the financial position of TerraForm Power, Inc. and subsidiaries as of December 31, 2014 and 2013, and the results of their operations and their cash flows for each of the years in the three-year period ended December 31, 2014, in conformity with U.S. generally accepted accounting principles.
/s/ KPMG LLP
McLean, Virginia
March 13, 2015
90
TERRAFORM POWER, INC. AND SUBSIDIARIES
CONSOLIDATED STATEMENTS OF OPERATIONS
(In thousands, except per share data)
Year Ended December 31, | |||||||||||
2014 | 2013 | 2012 | |||||||||
Operating revenues, net | $ | 125,864 | $ | 17,469 | $ | 15,694 | |||||
Operating costs and expenses: | |||||||||||
Cost of operations | 10,544 | 1,024 | 837 | ||||||||
Cost of operations - affiliate | 7,903 | 911 | 680 | ||||||||
General and administrative | 20,984 | 289 | 177 | ||||||||
General and administrative - affiliate | 19,144 | 5,158 | 4,425 | ||||||||
Acquisition and related costs | 10,177 | — | — | ||||||||
Acquisition and related costs - affiliate | 5,049 | — | — | ||||||||
Formation and offering related fees and expenses | 3,570 | — | — | ||||||||
Formation and offering related fees and expenses - affiliate | 1,870 | — | — | ||||||||
Depreciation, accretion and amortization | 40,509 | 4,961 | 4,267 | ||||||||
Total operating costs and expenses | 119,750 | 12,343 | 10,386 | ||||||||
Operating income | 6,114 | 5,126 | 5,308 | ||||||||
Other expense (income): | |||||||||||
Interest expense, net | 84,418 | 6,267 | 5,702 | ||||||||
Gain on extinguishment of debt, net | (7,635 | ) | — | — | |||||||
Loss/(Gain) on foreign currency exchange, net | 14,007 | (771 | ) | — | |||||||
Other, net | 438 | — | — | ||||||||
Total other expenses, net | 91,228 | 5,496 | 5,702 | ||||||||
Loss before income tax benefit | (85,114 | ) | (370 | ) | (394 | ) | |||||
Income tax benefit | (4,689 | ) | (88 | ) | (1,270 | ) | |||||
Net (loss) income | (80,425 | ) | $ | (282 | ) | $ | 876 | ||||
Less: Predecessor loss prior to initial public offering on July 23, 2014 | (10,357 | ) | |||||||||
Net loss subsequent to initial public offering | (70,068 | ) | |||||||||
Less: Net loss attributable to non-controlling interests | (44,451 | ) | |||||||||
Net loss attributable to TerraForm Power, Inc. Class A common stockholders | $ | (25,617 | ) | ||||||||
Weighted average number of shares: | |||||||||||
Class A common stock - Basic and diluted | 29,602 | ||||||||||
Loss per share: | |||||||||||
Class A common stock - Basic and diluted | $ | (0.87 | ) | ||||||||
See accompanying notes to consolidated financial statements.
91
TERRAFORM POWER, INC. AND SUBSIDIARIES
CONSOLIDATED STATEMENTS OF COMPREHENSIVE INCOME (LOSS)
(In thousands)
Year Ended December 31, | ||||||||||||
2014 | 2013 | 2012 | ||||||||||
Net (loss) income | $ | (80,425 | ) | $ | (282 | ) | $ | 876 | ||||
Other comprehensive loss, net of tax: | ||||||||||||
Translation adjustment | (3,541 | ) | — | — | ||||||||
Unrealized loss on hedging instruments | (1,925 | ) | — | — | ||||||||
Other comprehensive loss, net of tax | (5,466 | ) | — | — | ||||||||
Total comprehensive (loss) income | (85,891 | ) | (282 | ) | 876 | |||||||
Less: Predecessor comprehensive income (loss) prior to initial public offering on July 23, 2014 | (10,357 | ) | (282 | ) | 876 | |||||||
Comprehensive loss subsequent to initial public offering | (75,534 | ) | $ | — | $ | — | ||||||
Less: comprehensive loss attributable to non-controlling interests | ||||||||||||
Net loss attributable to non-controlling interests | (44,451 | ) | ||||||||||
Translation adjustment | (2,392 | ) | ||||||||||
Unrealized loss on hedging instruments | (1,437 | ) | ||||||||||
Comprehensive loss attributable to non-controlling interests | (48,280 | ) | ||||||||||
Comprehensive loss attributable to TerraForm Power, Inc. Class A stockholders | $ | (27,254 | ) | |||||||||
See accompanying notes to consolidated financial statements.
92
TERRAFORM POWER, INC. AND SUBSIDIARIES
CONSOLIDATED BALANCE SHEETS
(In thousands, except per share data)
ASSETS | December 31, 2014 | December 31, 2013 | |||||
Current assets: | |||||||
Cash and cash equivalents | $ | 468,393 | $ | 1,044 | |||
Restricted cash, including consolidated variable interest entities of $39,898 and $2,139 in 2014 and 2013, respectively | 70,545 | 62,321 | |||||
Accounts receivable, including consolidated variable interest entities of $16,921 and $0 in 2014 and 2013, respectively | 31,986 | 1,505 | |||||
Deferred income taxes | — | 128 | |||||
Value-added tax (VAT) receivable | — | 38,281 | |||||
Due from SunEdison and affiliates, net | 19,640 | — | |||||
Prepaid expenses and other current assets | 21,840 | 3,079 | |||||
Total current assets | 612,404 | 106,358 | |||||
Property and equipment, net, including consolidated variable interest entities of $1,466,223 and $26,006 in 2014 and 2013, respectively | 2,327,803 | 407,356 | |||||
Intangible assets, net, including consolidated variable interest entities of $259,004 and $0 in 2014 and 2013, respectively | 361,673 | 22,600 | |||||
Deferred financing costs, net | 42,113 | 12,397 | |||||
Restricted cash | 10,455 | 7,401 | |||||
Deferred income taxes | 4,606 | — | |||||
Other assets, including consolidated variable interest entities of $16,658 and $0 in 2014 and 2013, respectively | 18,964 | 10,765 | |||||
Total assets | $ | 3,378,018 | $ | 566,877 | |||
See accompanying notes to consolidated financial statements.
93
TERRAFORM POWER, INC. AND SUBSIDIARIES
CONSOLIDATED BALANCE SHEETS
(CONTINUED)
(In thousands, except per share data)
LIABILITIES AND STOCKHOLDERS' EQUITY | December 31, 2014 | December 31, 2013 | |||||
Current liabilities: | |||||||
Current portion of long-term debt and financing lease obligations, including consolidated variable interest entities of $20,907 and $587 in 2014 and 2013, respectively | $ | 80,133 | $ | 36,682 | |||
Current portion of capital lease obligations | — | 773 | |||||
Accounts payable, accrued expenses and other current liabilities, including consolidated variable interest entities of $27,284 and $0 in 2014 and 2013, respectively | 81,781 | 8,688 | |||||
Deferred revenue, including consolidated variable interest entities of $12,941 of $0 in 2014 and 2013, respectively | 21,989 | 428 | |||||
Due to SunEdison and affiliates, net | — | 82,051 | |||||
Total current liabilities | 183,903 | 128,622 | |||||
Other liabilities: | |||||||
Long-term debt and financing lease obligations, less current portion, including consolidated variable interest entities of $620,853 and $8,683 in 2014 and 2013, respectively | 1,517,962 | 371,427 | |||||
Long-term capital lease obligations, less current portion | — | 28,398 | |||||
Deferred revenue, including consolidated variable interest entities of $51,943 and $0 in 2014 and 2013, respectively | 52,081 | 5,376 | |||||
Deferred income taxes | 7,702 | 6,600 | |||||
Asset retirement obligations, including consolidated variable interest entities of $32,181 and $1,627 in 2014 and 2013, respectively | 76,111 | 11,002 | |||||
Total liabilities | 1,837,759 | 551,425 | |||||
Redeemable non-controlling interests | 24,338 | — | |||||
Stockholders' equity: | |||||||
Net SunEdison investment | — | 2,674 | |||||
Preferred stock, $0.01 par value, 50,000 shares authorized, none issued and outstanding in 2014 and 2013 | — | — | |||||
Class A common stock, $0.01 par value per share, 850,000 shares authorized, 42,218 issued and outstanding as of December 31, 2014. No shares authorized, issued or outstanding in 2013. | 387 | — | |||||
Class B common stock, $0.01 par value per share, 140,000 shares authorized, 64,526 issued and outstanding as of December 31, 2014. No shares authorized, issued or outstanding in 2013. | 645 | — | |||||
Class B1 common stock, $0.01 par value per share: 260,000 shares authorized, 5,840 issued and outstanding as of December 31, 2014. No shares authorized, issued or outstanding in 2013. | 58 | — | |||||
Additional paid-in capital | 497,556 | — | |||||
Accumulated deficit | (25,617 | ) | — | ||||
Accumulated other comprehensive loss | (1,637 | ) | — | ||||
Total TerraForm Power stockholders' equity | 471,392 | 2,674 | |||||
Non-controlling interests | 1,044,529 | 12,778 | |||||
Total stockholders' equity | 1,515,921 | 15,452 | |||||
Total liabilities and stockholders' equity | $ | 3,378,018 | $ | 566,877 | |||
See accompanying notes to consolidated financial statements.
94
TERRAFORM POWER, INC. AND SUBSIDIARIES
CONSOLIDATED STATEMENT OF STOCKHOLDERS' EQUITY
(In thousands)
Controlling Interest | Non-controlling Interests | ||||||||||||||||||||||||||||||||||||||||||||||||||||||||||||||||||
Net SunEdison Investment | Preferred Stock | Class A Common Stock | Class B Common Stock | Class B1 Common Stock | Additional Paid-in Capital | Accumulated Deficit | Accumulated Other Comprehensive Income (Loss) | Accumulated Deficit | Accumulated Other Comprehensive Income (Loss) | Total Equity | |||||||||||||||||||||||||||||||||||||||||||||||||||||||||
Shares | Amount | Shares | Amount | Shares | Amount | Shares | Amount | Total | Capital | Total | |||||||||||||||||||||||||||||||||||||||||||||||||||||||||
Balance at January 1, 2012 | $ | 29,801 | — | $ | — | — | $ | — | — | $ | — | — | $ | — | $ | — | $ | — | $ | — | $ | 29,801 | $ | — | $ | — | $ | — | $ | — | $ | 29,801 | |||||||||||||||||||||||||||||||||||
Net income | 876 | — | — | — | — | — | — | — | — | — | — | — | 876 | — | — | — | — | 876 | |||||||||||||||||||||||||||||||||||||||||||||||||
Contributions from SunEdison | 4,818 | — | — | — | — | — | — | — | — | — | — | — | 4,818 | — | — | — | — | 4,818 | |||||||||||||||||||||||||||||||||||||||||||||||||
Distributions to SunEdison | (5,466 | ) | — | — | — | — | — | — | — | — | — | — | — | (5,466 | ) | — | — | — | — | (5,466 | ) | ||||||||||||||||||||||||||||||||||||||||||||||
Balance at January 1, 2013 | $ | 30,029 | — | $ | — | — | $ | — | — | $ | — | — | $ | — | $ | — | $ | — | $ | — | $ | 30,029 | $ | — | $ | — | $ | — | $ | — | $ | 30,029 | |||||||||||||||||||||||||||||||||||
Net loss | (282 | ) | — | — | — | — | — | — | — | — | — | — | — | (282 | ) | — | — | — | — | (282 | ) | ||||||||||||||||||||||||||||||||||||||||||||||
Contributions from SunEdison | 53,417 | — | — | — | — | — | — | — | — | — | — | — | 53,417 | — | — | — | — | 53,417 | |||||||||||||||||||||||||||||||||||||||||||||||||
Distributions to SunEdison | (80,490 | ) | — | — | — | — | — | — | — | — | — | — | — | (80,490 | ) | — | — | — | — | (80,490 | ) | ||||||||||||||||||||||||||||||||||||||||||||||
Sale of membership interests in solar generation facilities | — | — | — | — | — | — | — | — | — | — | — | — | — | 12,778 | — | — | 12,778 | 12,778 | |||||||||||||||||||||||||||||||||||||||||||||||||
Balance at December 31, 2013 | $ | 2,674 | — | $ | — | — | $ | — | — | $ | — | — | $ | — | $ | — | $ | — | $ | — | $ | 2,674 | $ | 12,778 | $ | — | $ | — | $ | 12,778 | $ | 15,452 | |||||||||||||||||||||||||||||||||||
Contributions from SunEdison, net | 417,590 | — | — | — | — | — | — | — | — | — | — | — | 417,590 | — | — | — | — | 417,590 | |||||||||||||||||||||||||||||||||||||||||||||||||
Issuance of Class B common stock to SunEdison at formation | (657 | ) | — | — | — | — | 65,709 | 657 | — | — | — | — | — | — | — | — | — | — | — | ||||||||||||||||||||||||||||||||||||||||||||||||
Sale of membership interests in solar generation facilities | — | — | — | — | — | — | — | — | — | — | — | — | — | 1,928 | — | — | 1,928 | 1,928 | |||||||||||||||||||||||||||||||||||||||||||||||||
Consolidation of 50% non-controlling interest in Mt. Signal, net of cash | — | — | — | — | — | — | — | — | — | — | — | — | 146,000 | — | — | 146,000 | 146,000 | ||||||||||||||||||||||||||||||||||||||||||||||||||
Consolidation of non-controlling interests in acquired solar generation facilities | — | — | — | — | — | — | — | — | — | — | — | — | — | 74,460 | — | — | 74,460 | 74,460 | |||||||||||||||||||||||||||||||||||||||||||||||||
Issuance of restricted Class A common stock | — | — | — | 4,977 | 14 | — | — | — | — | (14 | ) | — | — | — | — | — | — | — | — | ||||||||||||||||||||||||||||||||||||||||||||||||
Stock-based compensation | — | — | — | — | — | — | — | — | — | 566 | — | — | 566 | — | — | — | — | 566 | |||||||||||||||||||||||||||||||||||||||||||||||||
Net loss | (10,357 | ) | — | — | — | — | — | — | — | — | — | — | — | (10,357 | ) | — | 643 | — | 643 | (9,714 | ) | ||||||||||||||||||||||||||||||||||||||||||||||
Balance at July 23, 2014 | $ | 409,250 | — | $ | — | 4,977 | $ | 14 | 65,709 | $ | 657 | — | $ | — | $ | 552 | — | $ | — | $ | 410,473 | $ | 235,166 | $ | 643 | $ | — | $ | 235,809 | $ | 646,282 | ||||||||||||||||||||||||||||||||||||
See accompanying notes to consolidated financial statements.
95
TERRAFORM POWER, INC. AND SUBSIDIARIES
CONSOLIDATED STATEMENT OF STOCKHOLDERS' EQUITY
(CONTINUED)
(In thousands)
Controlling Interest | Non-controlling Interests | ||||||||||||||||||||||||||||||||||||||||||||||||||||||||||||||||||
Net SunEdison Investment | Preferred Stock | Class A Common Stock | Class B Common Stock | Class B1 Common Stock | Additional Paid-in Capital | Accumulated Deficit | Accumulated Other Comprehensive Income (Loss) | Accumulated Deficit | Accumulated Other Comprehensive Income (Loss) | Total Equity | |||||||||||||||||||||||||||||||||||||||||||||||||||||||||
Shares | Amount | Shares | Amount | Shares | Amount | Shares | Amount | Total | Capital | Total | |||||||||||||||||||||||||||||||||||||||||||||||||||||||||
Balance at July 23, 2014 | $ | 409,250 | — | $ | — | 4,977 | $ | 14 | 65,709 | $ | 657 | — | $ | — | $ | 552 | $ | — | $ | — | $ | 410,473 | $ | 235,166 | $ | 643 | $ | — | $ | 235,809 | $ | 646,282 | |||||||||||||||||||||||||||||||||||
Write off U.S. deferred tax assets and liabilities at IPO | 3,616 | — | — | — | — | — | — | — | — | — | — | — | 3,616 | — | — | — | — | 3,616 | |||||||||||||||||||||||||||||||||||||||||||||||||
Issuance of Class B common stock to SunEdison at IPO | (58 | ) | — | — | — | — | 5,840 | 58 | — | — | — | — | — | — | — | — | — | — | — | ||||||||||||||||||||||||||||||||||||||||||||||||
Issuance of Class B membership units in TerraForm LLC to SunEdison at IPO | (412,808 | ) | — | — | — | — | — | — | — | — | (222,155 | ) | — | — | (634,963 | ) | 634,963 | — | — | 634,963 | — | ||||||||||||||||||||||||||||||||||||||||||||||
Issuance of class B1 common stock to Riverstone at IPO | — | — | — | — | — | — | — | 5,840 | 58 | 145,942 | — | — | 146,000 | (146,000 | ) | — | — | (146,000 | ) | — | |||||||||||||||||||||||||||||||||||||||||||||||
Issuance of Class B1 membership units in TerraForm LLC to Riverstone at IPO | — | — | — | — | — | — | — | — | — | (57,633 | ) | — | — | (57,633 | ) | 57,633 | — | — | 57,633 | — | |||||||||||||||||||||||||||||||||||||||||||||||
Issuance of Class A common stock related to the public offering, net of issuance costs | — | — | — | 23,075 | 231 | (7,023 | ) | (70 | ) | — | — | 368,460 | — | — | 368,621 | — | — | — | — | 368,621 | |||||||||||||||||||||||||||||||||||||||||||||||
Issuance of Class A common stock related to the Private Placement at IPO | — | — | — | 2,600 | 26 | — | — | — | — | 64,974 | — | — | 65,000 | — | — | — | — | 65,000 | |||||||||||||||||||||||||||||||||||||||||||||||||
Issuance of Class A common stock related to the Private Placement | — | — | — | 11,667 | 116 | — | — | — | — | 336,684 | — | — | 336,800 | — | — | — | — | 336,800 | |||||||||||||||||||||||||||||||||||||||||||||||||
Forfeiture of restricted Class A common stock | — | — | — | (101 | ) | — | — | — | — | — | — | — | — | — | — | — | — | — | — | ||||||||||||||||||||||||||||||||||||||||||||||||
Dividends paid | — | — | — | — | — | — | — | — | — | (7,249 | ) | — | — | (7,249 | ) | — | — | — | — | (7,249 | ) | ||||||||||||||||||||||||||||||||||||||||||||||
Stock-based compensation | — | — | — | — | — | — | — | — | — | 5,221 | — | — | 5,221 | — | — | — | — | 5,221 | |||||||||||||||||||||||||||||||||||||||||||||||||
Net loss | — | — | — | — | — | — | — | — | — | — | (25,617 | ) | — | (25,617 | ) | — | (45,094 | ) | — | (45,094 | ) | (70,711 | ) | ||||||||||||||||||||||||||||||||||||||||||||
Contributions from SunEdison | — | — | — | — | — | — | — | — | — | 1,869 | — | — | 1,869 | 3,987 | — | — | 3,987 | 5,856 | |||||||||||||||||||||||||||||||||||||||||||||||||
Other comprehensive loss | — | — | — | — | — | — | — | — | — | — | — | (1,637 | ) | (1,637 | ) | — | — | (3,829 | ) | (3,829 | ) | (5,466 | ) | ||||||||||||||||||||||||||||||||||||||||||||
Consolidation of non-controlling interests in acquired solar generation facilities | — | — | — | — | — | — | — | — | — | — | — | — | — | 6,460 | — | — | 6,460 | 6,460 | |||||||||||||||||||||||||||||||||||||||||||||||||
Sale of membership interests in solar generation facilities | — | — | — | — | — | — | — | — | — | — | — | — | — | 162,814 | — | — | 162,814 | 162,814 | |||||||||||||||||||||||||||||||||||||||||||||||||
Distributions to non-controlling interests | — | — | — | — | — | — | — | — | — | — | — | — | — | (1,323 | ) | — | — | (1,323 | ) | (1,323 | ) | ||||||||||||||||||||||||||||||||||||||||||||||
Adjustments to non-controlling interests | — | — | — | — | — | — | — | — | — | (139,109 | ) | — | — | (139,109 | ) | 139,109 | — | — | 139,109 | — | |||||||||||||||||||||||||||||||||||||||||||||||
Balance at December 31, 2014 | $ | — | — | $ | — | 42,218 | $ | 387 | 64,526 | $ | 645 | 5,840 | $ | 58 | $ | 497,556 | $ | (25,617 | ) | $ | (1,637 | ) | $ | 471,392 | $ | 1,092,809 | $ | (44,451 | ) | $ | (3,829 | ) | $ | 1,044,529 | $ | 1,515,921 | |||||||||||||||||||||||||||||||
See accompanying notes to consolidated financial statements.
96
TERRAFORM POWER, INC. AND SUBSIDIARIES
CONSOLIDATED STATEMENTS OF CASH FLOWS
(In thousands)
Year Ended December 31, | |||||||||||
2014 | 2013 | 2012 | |||||||||
Cash flows from operating activities: | |||||||||||
Net income (loss) | $ | (80,425 | ) | $ | (282 | ) | $ | 876 | |||
Adjustments to reconcile net income (loss) to net cash provided by (used in) operating activities: | |||||||||||
Non-cash incentive revenue | (1,746 | ) | (1,761 | ) | (1,831 | ) | |||||
Non-cash interest expense | 877 | 1,139 | 1,119 | ||||||||
Stock compensation expense | 5,787 | — | — | ||||||||
Depreciation, accretion and amortization | 40,509 | 4,961 | 4,267 | ||||||||
Amortization of intangible assets | 4,190 | — | — | ||||||||
Amortization of deferred financing costs and debt discounts | 25,713 | 119 | 161 | ||||||||
Recognition of deferred revenue | (258 | ) | (205 | ) | (190 | ) | |||||
Gain on extinguishment of debt, net | (7,635 | ) | — | — | |||||||
Unrealized loss (gain) on foreign currency exchange | 11,920 | (771 | ) | — | |||||||
Deferred taxes | (4,773 | ) | (253 | ) | (1,270 | ) | |||||
Other, net | (8,394 | ) | 13 | 214 | |||||||
Changes in assets and liabilities: | |||||||||||
Accounts receivable | (3,432 | ) | (892 | ) | 106 | ||||||
VAT receivable, prepaid expenses and other current assets | 23,730 | (33,701 | ) | (786 | ) | ||||||
Accounts payable, accrued interest, and other current liabilities | 3,371 | 4,774 | (613 | ) | |||||||
Deferred revenue | 68,722 | 792 | 173 | ||||||||
Due to SunEdison and affiliates | 4,422 | 18,865 | 664 | ||||||||
Net cash provided by (used in) operating activities | 82,578 | (7,202 | ) | 2,890 | |||||||
Cash flows from investing activities: | |||||||||||
Cash paid to SunEdison and third parties for solar generation facility construction | (816,682 | ) | (205,361 | ) | (2,274 | ) | |||||
Acquisitions of solar generation facilities from third parties, net of cash acquired | (644,890 | ) | — | — | |||||||
Deposit for acquisition of Call Right Projects | (34,000 | ) | — | — | |||||||
Receipts of grants in lieu of tax credits | — | — | 5,466 | ||||||||
Due to SunEdison and affiliates | (56,088 | ) | — | — | |||||||
Change in restricted cash | 23,635 | (58,878 | ) | (3,602 | ) | ||||||
Net cash used in investing activities | (1,528,025 | ) | (264,239 | ) | (410 | ) | |||||
See accompanying notes to consolidated financial statements.
97
TERRAFORM POWER, INC. AND SUBSIDIARIES
CONSOLIDATED STATEMENTS OF CASH FLOWS
(CONTINUED)
(In thousands)
(In thousands) | Year Ended December 31, | ||||||||||
2014 | 2013 | 2012 | |||||||||
Cash flows from financing activities: | |||||||||||
Proceeds from issuance of Class A common stock | 770,421 | — | — | ||||||||
Change in restricted cash for principal debt service | 1,897 | 2,834 | 475 | ||||||||
Proceeds from term loan | 575,000 | — | — | ||||||||
Proceeds from bridge loan | 400,000 | — | — | ||||||||
Repayment of bridge loan | (400,000 | ) | — | — | |||||||
Borrowings of long-term debt | 399,806 | 304,729 | — | ||||||||
Principal payments on long-term debt | (341,336 | ) | (4,641 | ) | (2,291 | ) | |||||
Contributions from non-controlling interests | 164,742 | 12,778 | — | ||||||||
Distributions to non-controlling interests | (1,323 | ) | — | — | |||||||
Net SunEdison investment | 405,062 | (32,702 | ) | (648 | ) | ||||||
Payment of dividends | (7,249 | ) | — | — | |||||||
Payment of deferred financing costs | (54,060 | ) | (10,516 | ) | (13 | ) | |||||
Net cash provided by (used in) financing activities | 1,912,960 | 272,482 | (2,477 | ) | |||||||
Net increase in cash and cash equivalents | 467,513 | 1,041 | 3 | ||||||||
Effect of exchange rate changes on cash and cash equivalents | (164 | ) | — | — | |||||||
Cash and cash equivalents at beginning of period | 1,044 | 3 | — | ||||||||
Cash and cash equivalents at end of period | $ | 468,393 | $ | 1,044 | $ | 3 | |||||
See accompanying notes to consolidated financial statements.
98
TERRAFORM POWER, INC. AND SUBSIDIARIES
CONSOLIDATED STATEMENTS OF CASH FLOWS
(CONTINUED)
(In thousands)
Year Ended December 31, | |||||||||||
2014 | 2013 | 2012 | |||||||||
Supplemental Disclosures: | |||||||||||
Cash paid for interest, net of amounts capitalized of $19,694, $3,599, and $0, respectively | $ | 79,867 | $ | 8,564 | $ | 4,946 | |||||
Cash paid for income taxes | — | — | — | ||||||||
Schedule of non-cash activities: | |||||||||||
Additions to property and equipment in accounts payable, accrued expenses and other current liabilities | 15,046 | — | — | ||||||||
Additions to property and equipment in Due from SunEdison and affiliates | 9,780 | 54,090 | 3,978 | ||||||||
Additions of asset retirement obligation (ARO) assets and liabilities | 34,414 | 4,518 | 37 | ||||||||
ARO assets and obligations from acquisitions | 29,450 | — | — | ||||||||
Amortization of deferred financing costs capitalized as construction in progress | 17,589 | 791 | — | ||||||||
Decrease in due to SunEdison and affiliates in exchange for equity | 14,768 | — | — | ||||||||
Write off of pre-IPO U.S. deferred tax assets and liabilities | 3,616 | — | — | ||||||||
Issuance of Class B1 common stock to Riverstone for Mt. Signal | 146,000 | — | — | ||||||||
Non-controlling interest in Terra LLC (Class B units) issued in connection with the initial public offering | 634,963 | — | — | ||||||||
Non-controlling interest in Terra LLC (Class B1 units) issued in connection with the initial public offering | 57,633 | — | — | ||||||||
Principal payments on long-term debt from solar renewable energy certificates | 869 | 622 | 712 | ||||||||
Long-term debt assumed in connection with acquisitions | 550,936 | — | — | ||||||||
Additions from a non-monetary transaction by SunEdison: | |||||||||||
Restricted cash | — | 4,850 | — | ||||||||
Property and equipment | — | 34,514 | — | ||||||||
Debt and financing lease obligations | — | (31,482 | ) | — | |||||||
Deferred tax liability | — | (2,253 | ) | — | |||||||
Total non-cash contribution from SunEdison | — | 5,629 | — | ||||||||
See accompanying notes to consolidated financial statements.
99
TERRAFORM POWER, INC. AND SUBSIDIARIES
NOTES TO CONSOLIDATED FINANCIAL STATEMENTS
(Dollar amounts in thousands, unless otherwise noted)
1. NATURE OF OPERATIONS
TerraForm Power, Inc. (the "Company") was formed under the name SunEdison Yieldco, Inc. on January 15, 2014, as a wholly owned indirect subsidiary of SunEdison, Inc. ("SunEdison"). The name change from SunEdison Yieldco, Inc. to TerraForm Power, Inc. became effective on May 22, 2014. Following the Company's initial public offering ("IPO") on July 23, 2014, and as part of a series of formation transactions, the Company became a holding company and its sole asset is an equity interest in TerraForm Power, LLC ("Terra LLC" or "the Predecessor") an owner of solar generation facilities and long-term contractual arrangements to sell the electricity generated by such systems and the related green energy certificates, ancillary services and other environmental attributes to third parties. The Company is the managing member of Terra LLC, and operates, controls and consolidates the business affairs of Terra LLC.
Basis of Presentation
Certain solar generation facilities in the Company's current portfolio have been contributed from SunEdison and are reflected in the accompanying consolidated balance sheets at SunEdison's historical cost. When solar generation facilities are contributed or acquired from SunEdison, the Company is required to recast its historical financial statements to reflect the assets and liabilities of the acquired solar generation facilities for the period it was owned by SunEdison in accordance with rules applicable to transactions between entities under common control.
For all periods prior to the IPO, the accompanying consolidated financial statements represent the combination of the Company and Terra LLC, the accounting predecessor, and were prepared using SunEdison's historical basis in assets and liabilities. For all periods subsequent to the IPO, the accompanying consolidated financial statements represent the results of the Company, which consolidates Terra LLC through its controlling interest.
The historical financial statements of the Predecessor include allocations of certain SunEdison corporate expenses and income tax expense. Management believes the assumptions and methodology underlying the allocation of general corporate overhead expenses are reasonable. Subsequent to the IPO, corporate expenses represent those costs allocated to the Company under the management services agreement, as more fully described in Note 17. Related Parties.
2. SUMMARY OF SIGNIFICANT ACCOUNTING POLICIES
Use of Estimates
In preparing the consolidated financial statements, the Company used estimates and assumptions that affect the reported amounts of assets and liabilities at the date of the financial statements. Such estimates also affect the reported amounts of revenues, expenses and cash flows during the reporting period. Actual results may differ from estimates under different assumptions or conditions.
Reclassifications
Certain amounts in prior fiscal year have been reclassified to conform with the presentation adopted in the current fiscal year. Such reclassifications have no effect on previously reported balance sheet subtotals, results of operations or accumulated deficit.
Principles of Consolidation
The accompanying consolidated financial statements have been prepared in accordance with U.S. generally accepted accounting principles ("U.S. GAAP"). They include the results of wholly owned and partially owned subsidiaries in which the Company has a controlling interest with all significant intercompany accounts and transactions eliminated. When the Company is the primary beneficiary of a variable interest entity ("VIE") in solar generation facilities, they are consolidated.
100
Variable Interest Entities
The Company consolidates VIEs when the Company is the primary beneficiary. The primary beneficiary of a VIE is the party that has the power to direct the activities that most significantly impact the performance of the entity and the obligation to absorb losses or the right to receive benefits that could potentially be significant to the entity.
VIEs are entities that lack sufficient equity to finance their activities without additional financial support from other parties or whose equity holders, as a group, lack one or more of the following characteristics: (a) direct or indirect ability to make decisions; (b) obligation to absorb expected losses; or (c) right to receive expected residual returns. VIEs must be evaluated quantitatively and qualitatively to determine the primary beneficiary, which is the reporting entity that has (a) the power to direct activities of a VIE that most significantly impact the VIEs economic performance and (b) the obligation to absorb losses of the VIE that could potentially be significant to the VIE or the right to receive benefits from the VIE that could potentially be significant to the VIE. The primary beneficiary is required to consolidate the VIE for financial reporting purposes. A VIE can have only one primary beneficiary, but may not have a primary beneficiary if no party meets the criteria described above.
To determine a VIE's primary beneficiary, an enterprise must perform a qualitative assessment to determine which party, if any, has the power to direct activities of the VIE, the obligation to absorb losses, and/or receive its benefits. Therefore, an enterprise must identify the activities that most significantly impact the VIE's economic performance and determine whether it, or another party, has the power to direct those activities. When evaluating whether the Company is the primary beneficiary of a VIE, and must therefore consolidate the entity, we perform a qualitative analysis that considers the design of the VIE, the nature of our involvement and the variable interests held by other parties. If that evaluation is inconclusive as to which party absorbs a majority of the entity’s expected losses or residual returns, a quantitative analysis is performed to determine the primary beneficiary.
For our consolidated VIEs, we have presented on our consolidated balance sheets, to the extent material, the assets of our consolidated VIEs that can only be used to settle specific obligations of the consolidated VIE, and the liabilities of our
consolidated VIEs for which creditors do not have recourse to our general assets outside of the VIE.
Cash and Cash Equivalents
Cash and cash equivalents include all cash balances and money market funds with original maturity periods of three months or less when purchased.
Restricted Cash
Restricted cash consists of cash on deposit in financial institutions that is restricted from use in operations pursuant to requirements of certain debt agreements. These funds are used to pay for capital expenditures, current operating expenses and current debt service payments in accordance with the restrictions in the debt agreements.
Accounts Receivable and Allowance for Doubtful Accounts
Accounts receivable are reported on the consolidated balance sheets, including both billed and unbilled amounts, and are adjusted for any write-offs as well as the allowance for doubtful accounts. We establish an allowance for doubtful accounts to adjust our receivables to amounts considered to be ultimately collectible. Our allowance is based on a variety of factors, including the length of time receivables are past due, significant one-time events, the financial health of our customers and historical experience. There was no allowance for doubtful accounts as of December 31, 2014 and December 31, 2013. There were no write-offs of accounts receivable for the years ended December 31, 2014, 2013 and 2012.
Property and Equipment
Property and equipment consists of solar generation facilities and is stated at cost. Expenditures for major additions and improvements are capitalized, and minor replacements, maintenance, and repairs are charged to expense as incurred. When property and equipment is retired, or otherwise disposed of, the cost and accumulated depreciation is removed from the consolidated balance sheets and any resulting gain or loss is included in the results of operations for the respective period. Depreciation of property and equipment is recognized using the straight-line method over the estimated useful lives of the solar generation facilities of twenty to thirty years.
101
The Company is entitled to receive investment tax credits ("ITCs") or grants in lieu of tax credits from various government agencies, both state and federal, for the construction of certain eligible items of property and equipment. The carrying value of the property and equipment has been reduced by the amount of the credits or grants received. Credits received that have been presented as a reduction in property and equipment include $5,466 in 2012. No such credits were received in 2014 and 2013.
Impairment of Long-lived Assets
Long-lived assets that are held and used are reviewed for impairment whenever events or changes in circumstances indicate carrying values may not be recoverable. An impairment loss is recognized if the total future estimated undiscounted cash flows expected from an asset are less than its carrying value. An impairment charge is measured as the difference between an asset's carrying amount and fair value with the difference recorded in operating costs and expenses in the statement of operations. Fair values are determined by a variety of valuation methods, including appraisals, sales prices of similar assets and present value techniques. There were no impairments recognized during the years ended December 31, 2014 , 2013 and 2012.
Intangible Assets
Intangible assets that have determinable estimated lives are amortized over those estimated lives. The straight-line method of amortization is used because it best reflects the pattern in which the economic benefits of the intangible asset are consumed or otherwise used up. The amounts and useful lives assigned to intangible assets acquired impact the amount and timing of future amortization. Reviews are performed to determine whether the carrying value of an asset is impaired, based on comparisons to undiscounted expected future cash flows or some other fair value measure. If this comparison indicates that there is impairment, the impaired asset is written down to fair value, which is typically calculated using discounted expected future cash flows utilizing an appropriate discount rate. Impairment is based on the excess of the carrying amount over the fair value of those assets.
Capitalized Interest
Interest incurred on funds borrowed to finance construction of solar generation facilities is capitalized until the system is ready for its intended use. The amount of interest capitalized during the years ended December 31, 2014, 2013 and 2012 was $19,694, $3,599, $0, respectively. Interest costs charged to interest expense was $79,300 , $6,275 and $5,706 during the years ended December 31, 2014, 2013 and 2012, respectively.
Financing Lease Obligations
Certain of our assets were financed with sale leaseback arrangements. Proceeds received from a sale leaseback are treated using the deposit method when the sale of the solar generation facility is not recognizable. A sale is not recognized when the leaseback arrangements include a prohibited form of continuing involvement, such as an option or obligation to repurchase the assets under our master lease agreements. Under these arrangements, we do not recognize any profit until the sale is recognizable, which we expect will be at the end of the arrangement when the contract is canceled and the initial deposits received are forfeited by the financing party.
Over the course of the leaseback arrangements we are required to make rental payments. These payments are allocated between principal and interest payments using an effective yield method.
Deferred Financing Costs
Financing costs incurred in connection with obtaining construction and term financing are deferred and amortized over the maturities of the respective financing arrangements using the effective-interest method. Amortization of deferred financing costs is capitalized during construction and recorded as interest expense in the consolidated statements of operations following commencement of commercial operation. Amortization of deferred financing costs capitalized during construction was $17,589 and $791 during the years ended December 31, 2014 and 2013, respectively. No amounts were capitalized during the year ended December 31, 2012. Amortization of deferred financing costs recorded as interest expense was $25,713, $119, and $161 during the years ended December 31, 2014, 2013, and 2012, respectively.
Asset Retirement Obligations
The Company operates under solar power services agreements with some customers that include a requirement for the removal of the solar generation facilities at the end of the term of the agreement. Asset retirement obligations are recognized at
102
fair value in the period in which they are incurred and the carrying amount of the related long-lived asset is correspondingly increased. Over time, the liability is accreted to its expected future value. The corresponding solar generation facility is capitalized at inception is depreciated over its useful life.
Revenue Recognition
Power Purchase Agreements
A significant majority of our revenues are obtained through the sale of energy (based on MW) pursuant to terms of PPAs or other contractual arrangements which have a weighted-average remaining life of 19 years as of December 31, 2014. All PPAs are accounted for as operating leases, have no minimum lease payments and all of the rental income under these leases is recorded as revenue when the electricity is delivered.
Incentive Revenue
We also generate solar RECs as we produce electricity. These RECs are currently sold pursuant to agreements with our parent, third parties and a certain debt holder, and revenue is recognized as the underlying electricity is produced.
We also receive Performance-based incentives ("PBIs") from public utilities in connection with certain sponsored programs. We have a PBI arrangement with the State of California whereby we will receive a set rate multiplied by the kilowatt hour ("KWh") production on a monthly basis for 60 months. The PBI revenue is recognized as energy is generated over the measurement period. We recognize revenue based on the rate applicable at the time the energy is created and adjusts the amount recognized when we meet the threshold that qualifies us for the higher rate. PBI in the state of Colorado has a 20-year term at a fixed price per kWh produced. The revenue is recognized as energy is generated over the term of the agreement.
Deferred Revenue
Deferred revenue consists of upfront incentives or subsidies received from various state governmental jurisdictions for operating certain of our solar generation facilities or from the sale of ITCs to non-controlling members. The amounts deferred are recognized as revenue on a straight-line basis over the depreciable life of the solar generation facility or upon the contingency of claw-back of the tax credits resolve as the Company fulfills its obligation to operate these solar generation facilities. Recognition of deferred revenue was $258, $205, and $190 during the years ended December 31, 2014, 2013, and 2012 respectively.
Income Taxes
The Company accounts for income taxes using the liability method in accordance with Financial Accounting Standards Board ("FASB") Accounting Standards Codification ("ASC") 740, Income Taxes ("ASC 740"), which requires that it use the asset and liability method of accounting for deferred income taxes and provide deferred income taxes for all significant temporary differences.
The Company reports certain of its revenues and expenses differently for financial statement purposes than for income tax return purposes, resulting in temporary and permanent differences between the Company's financial statements and income tax returns. The tax effects of such temporary differences are recorded as either deferred income tax assets or deferred income tax liabilities in the Company's consolidated balance sheets. The Company measures its deferred income tax assets and deferred income tax liabilities using income tax rates that are currently in effect. The Company believes it is more likely than not that the results of future operations will generate sufficient taxable income which includes the future reversal of existing taxable temporary differences to realize deferred tax assets, net of valuation allowances. A valuation allowance is recorded to reduce the net deferred tax assets to an amount that is more-likely-than-not to be realized. The Company accounts for uncertain tax positions in accordance with ASC 740, which applies to all tax positions related to income taxes. Under ASC 740, tax benefits are recognized when it is more-likely-than-not that a tax position will be sustained upon examination by the authorities. The benefit recognized from a position that has surpassed the more-likely-than-not threshold is the largest amount of benefit that is more than 50% likely to be realized upon settlement. The Company recognizes interest and penalties accrued related to uncertain tax benefits as a component of income tax expense. Changes to existing net deferred tax assets or valuation allowances or changes to uncertain tax benefits are recorded to income tax expense.
103
Non-controlling Interests and Hypothetical Liquidation of Book Value ("HLBV")
Non-controlling interests represents the portion of net assets in consolidated entities that are not owned by the Company. The Company has determined the allocation of economics between the controlling party and the third-party for non-controlling interests does not correspond to ownership percentages for certain of its consolidated subsidiaries. In order to reflect the substantive profit sharing arrangements, the Company has determined that the appropriate methodology for determining the value of non-controlling interests is a balance sheet approach using the HLBV method.
Under the HLBV method, the amounts reported as non-controlling interest on the consolidated balance sheets represent the amounts the third party investors could hypothetically receive at each balance sheet reporting date based on the liquidation provisions of the respective operating partnership agreements. HLBV assumes that the proceeds available for distribution are equivalent to the unadjusted, stand-alone net assets of each respective partnership, as determined under U.S. GAAP. The third-party, non-controlling interests in the consolidated statements of operations and statements of comprehensive income are determined based on the difference in the carrying amounts of non-controlling interests on the consolidated balance sheets between reporting dates, adjusted for any capital transactions between the Company and third-party investors that occurred during the respective period. Non-controlling interests are reported as a component of equity in the consolidated balance sheets.
Where, prior to the commencement of operating activities for a respective project, HLBV results in an immediate change in the carrying value of non-controlling interest on the consolidated balance sheet due to the recognition of ITCs or other adjustments as required by the U.S. Internal Revenue Code, the Company defers the recognition of the respective adjustments and recognizes the adjustments in non-controlling interest on the consolidated statement of operations on a straight-line basis over the expected life of the underlying assets giving rise to the respective difference. Similarly, where the Company has acquired a controlling interest in a partnership and there is a resulting difference between the initial fair value of non-controlling interest and the value of non-controlling interest as measured using HLBV, the Company initially records non-controlling interest at fair value and amortizes the resulting difference over the remaining life of the underlying assets.
Contingencies
The Company is involved in conditions, situations or circumstances in the ordinary course of business with possible gain or loss contingencies that will ultimately be resolved when one or more future events occur or fail to occur. If some amount within a range of loss appears at the time to be a better estimate than any other amount within the range, that amount will be accrued. When no amount within the range is a better estimate than any other amount, however, the minimum amount in the range will be accrued. The Company continually evaluates uncertainties associated with loss contingencies and record a charge equal to at least the minimum estimated liability for a loss contingency when both of the following conditions are met: (i) information available prior to issuance of the financial statements indicates that it is probable that an asset had been impaired or a liability had been incurred at the date of the financial statements; and (ii) the loss or range of loss can be reasonably estimated. Legal costs are expensed when incurred. Gain contingencies are not recorded until realized or realizable.
Derivative Financial Instruments
The Company recognizes its derivative instruments as assets or liabilities at fair value in the consolidated balance sheets. Accounting for changes in the fair value (i.e., gains or losses) of a derivative instrument depends on whether it has been designated as part of a hedging relationship and the type of hedging relationship.
The effective portion of changes in fair value of derivative instruments designated as cash flow hedges is reported as a component of other comprehensive income (loss) (“OCI”). Changes in the fair value of these derivatives are subsequently reclassified into earnings in the period that the hedged transaction affects earnings. The ineffective portion of changes in fair value is recorded as a component of net income (loss) on the consolidated statement of operations. There was no ineffectiveness during the years ended December 31, 2014, 2013, and 2012.
The change in fair value of undesignated derivative instruments is reported as a component of net income (loss) on the consolidated statement of operations.
104
Fair Value Measurements
The Company performs fair value measurements in accordance with ASC 820, Fair Value Measurement ("ASC 820"), which defines fair value as the price that would be received from selling an asset or paid to transfer a liability in an orderly transaction between market participants at the measurement date. When determining the fair value measurements for assets and liabilities required to be recorded at their fair values, the Company considers the principal or most advantageous market in which it would transact and consider assumptions that market participants would use when pricing the assets or liabilities, such as inherent risk, transfer restrictions and risk of nonperformance.
ASC 820 establishes a fair value hierarchy that requires an entity to maximize the use of observable inputs and minimize the use of unobservable inputs when measuring fair value. An asset’s or a liability’s categorization within the fair value hierarchy is based upon the lowest level of input that is significant to the fair value measurement. ASC 820 establishes three levels of inputs that may be used to measure fair value:
• | Level 1: quoted prices in active markets for identical assets or liabilities; |
Level 2: inputs other than Level 1 that are observable, either directly or indirectly, such as quoted prices in active markets for similar assets or liabilities, quoted prices for identical or similar assets or liabilities in markets that are not active, or other inputs that are observable or can be corroborated by observable market data for substantially the full term of the assets or liabilities; or
• | Level 3: unobservable inputs that are supported by little or no market activity and that are significant to the fair values of the assets or liabilities. |
We maintain various financial instruments recorded at cost in the December 31, 2014 and December 31, 2013 consolidated balance sheets that are not required to be recorded at fair value. For cash and cash equivalents, restricted cash, accounts receivable, VAT receivable, prepaid expenses and other current assets, accounts payable, accrued expenses and other current liabilities, and due to SunEdison, the carrying amount approximates fair value because of the short-term maturity of the instruments. See Note 11. Fair Value of Financial Instruments for disclosures related to the fair value of our long-term debt.
Foreign Operations
The Company’s functional currency is the U.S. dollar. The results of operations and cash flows that are denominated in a currency other than the functional currency are translated at the average exchange rates during the period. Assets and liabilities that are denominated in a currency other than the functional currency are translated at end of period exchange rates. Translation adjustments resulting from this process are reported in other comprehensive income.
Transaction gains and losses that arise from exchange rate fluctuations on transactions and balances denominated in a currency other than the functional currency and the changes in fair value of our foreign exchange derivative contracts not accounted for under hedge accounting are included in results from operations as incurred. Foreign currency transaction losses (gains) included in other income were $14,007, $(771) and $0 during the years ended December 31, 2014, December 31, 2013 and December 31, 2012, respectively.
Business Combinations
The Company accounts for its business combinations by recognizing in the financial statements the identifiable assets acquired, the liabilities assumed, and any non-controlling interest in the acquiree at fair value at the acquisition date. The Company also recognizes and measures the goodwill acquired or a gain from a bargain purchase in the business combination and determines what information to disclose to enable users of an entity's financial statements to evaluate the nature and financial effects of the business combination. In addition, acquisition costs are expensed as incurred. Business combinations is a critical accounting policy as there are significant judgments involved in the allocation of acquisition cost.
When the Company acquires renewable energy facilities, the purchase price is allocated to (i) the acquired tangible assets and liabilities assumed, primarily consisting of land, plant, and long-term debt, (ii) the identified intangible assets and liabilities, consisting of the value of above-market and below-market power purchase agreements and in-place power purchase agreements, (iii) non-controlling interests, and (iv) other working capital items based in each case on their fair values in accordance with ASC 805. All expenses related to acquisition costs related to business combinations are expensed as incurred.
105
The Company generally use independent appraisers to assist with the estimates and methodologies used such as a replacement cost approach, or an income approach or excess earnings approach. Factors considered by the Company in its analysis include considering current market conditions and costs to construct similar facilities. The Company also considers information obtained about each property as a result of our pre-acquisition due diligence, marketing and income activities in estimating the fair value of the tangible and intangible assets and liabilities acquired or assumed. In estimating the fair value, the Company also establishes estimates of energy production, current in-place and market power purchase rates, tax credit arrangements, operating and maintenance costs, and local market conditions. A change in any of the assumptions above, which are subjective, could have a significant impact on the results of operations.
The allocation of the purchase price directly affects the following items in our consolidated financial statements:
• | The amount of purchase price allocated to the various tangible and intangible assets, liabilities, and non-controlling interests on our balance sheet; |
• | The amounts allocated to the value of above-market and below-market power purchase agreement values are amortized to revenue over the remaining non-cancelable terms of the respective arrangement. The amounts allocated to all other tangible and intangible assets are amortized to depreciation or amortization expense; and |
• | The period of time over which tangible and intangible assets are depreciated or amortized varies, and thus, changes in the amounts allocated to these assets will have a direct impact on our results of operations. Intangible assets are generally amortized over the respective life of the power purchase arrangement, which normally range from 10 to 25 years. The Company generally depreciates our energy facilities over 30 years. These differences in timing could have an impact on our results of operations. |
Basic and Diluted Earnings (Loss) Per Share
Basic earnings (loss) per share is computed by dividing net income attributable to common stockholders by the number of weighted-average ordinary shares outstanding during the period. Diluted earnings (loss) per share is computed by adjusting basic earnings (loss) per share for the impact of weighted-average dilutive common equivalent shares outstanding during the period. Common equivalent shares represent the incremental shares issuable for unvested restricted Class A common stock and redeemable shares of Class B and Class B1 common stock.
Stock-Based Compensation
Stock-based compensation expense for all share-based payment awards is based on the estimated grant-date fair value. The Company recognizes these compensation costs net of an estimated forfeiture rate for only those shares expected to vest on a straight-line basis over the requisite service period of the award, which is generally the award vesting term. For ratable awards, the Company recognizes compensation costs for all grants on a straight-line basis over the requisite service period of the entire award.
Recent Accounting Pronouncements
In April 2014, the Financial Accounting Standards Board (“FASB”) issued Accounting Standards Update (“ASU”) No. 2014-08, Presentation of Financial Statements (Topic 205) and Property, Plant, and Equipment (Topic 360): Reporting Discontinued Operations and Disclosures of Disposals of Components of an Entity. ASU 2014-08 limits the requirement to report discontinued operations to disposals of components of an entity that represent strategic shifts that have (or will have) a major effect on an entity’s operations and financial results. ASU 2014-08 also requires expanded disclosures concerning discontinued operations, disclosures of certain financial results attributable to a disposal of a significant component of an entity that does not qualify for discontinued operations reporting and expanded disclosures for long-lived assets classified as held for sale or disposed of. ASU 2014-08 is effective for us on a prospective basis in our first quarter of fiscal 2015. Early adoption is permitted, but only for disposals (or assets classified as held for sale) that have not been reported in financial statements previously issued or available for issuance. The adoption of ASU 2014-08 is not expected to have a material impact on our consolidated financial statements and related disclosures.
On May 28, 2014, FASB issued Accounting Standards Update ("ASU") No. 2014-09, Revenue from Contracts with Customers, which requires an entity to recognize the amount of revenue to which it expects to be entitled for the transfer of promised goods or services to customers. This ASU will replace most existing revenue recognition guidance in U.S. GAAP when it becomes effective. The new standard is effective for us on January 1, 2017. Early application is not permitted. The standard permits the use of either the retrospective or cumulative effect transition method. The Company is currently evaluating the effect that ASU 2014-09 will have on its consolidated financial statements and related disclosures. The Company has not yet selected a transition method or determined the effect of the standard on its ongoing financial reporting.
106
In August 2014, the FASB issued Accounting Standards Update No. 2014-15, Presentation of Financial Statements-Going Concern. ASU 2014-15 is intended to define management's responsibility to evaluate whether there is substantial doubt about an organization's ability to continue as a going concern and to provide related footnote disclosures. This guidance is effective for us in the annual period ending December 31, 2016 and interim and annual periods thereafter. We do not expect the adoption of this standard to have a material impact on our consolidated financial position, results of operations and cash flows.
In January 2015, the FASB issued ASU No. 2015-01, Income Statement-Extraordinary and Unusual Items (Subtopic 225-20), which eliminates the concept of reporting for extraordinary items. ASU 2015-01 is effective for us for our fiscal year ending December 31, 2016 and for interim periods thereafter. We do not believe this standard will have a significant effect on our consolidated financial position, results of operations and cash flows.
In February 2015, the FASB issued ASU No. 2015-02 Consolidation (Topic 810) Amendments to the Consolidation Analysis, which affects the following areas of the consolidation analysis: limited partnerships and similar entities, evaluation of fees paid to a decision maker or service provider as a variable interest and in determination of the primary beneficiary, effect of related parties on the primary beneficiary determination and for certain investment funds. ASU No. 2015-02 is effective for us for our fiscal year ending December 31, 2016 and interim periods therein. We are evaluating the impact of this standard on our consolidated financial position, results of operations and cash flows.
3. ACQUISITIONS
The initial accounting for acquisitions is not complete because the evaluation necessary to assess the fair values of assets acquired, liabilities assumed and any non-controlling interest is not complete including the valuation of solar generation facilities, related intangible assets, assumed debt and non-controlling interests. The provisional amounts are subject to revision to the extent additional information is obtained about the facts and circumstances that existed as of the acquisition dates.
2014 Acquisitions
Nellis
On March 28, 2014, the Company acquired 100% of the controlling investor member interests in MMA NAFB Power, LLC (“Nellis”), which owns a 14.0 MW utility-scale solar power plant located on Nellis Air Force Base in Clark County, Nevada. A wholly owned subsidiary of SunEdison holds the non-controlling interest in Nellis. The purchase price for this acquisition was $14,211.
CalRENEW-1
On May 15, 2014, the Company acquired 100% of the issued and outstanding membership interests of CalRENEW-1, LLC, which owns a 6.3 MW utility-scale solar power plant located in Mendota, California. The purchase price for this acquisition was $14,334, net of acquired cash.
Atwell Island
On May 16, 2014, the Company acquired 100% of the membership interests in SPS Atwell Island, LLC (“Atwell Island”), a 23.5 MW utility-scale solar power plant located in Tulare County, California. The purchase price for this acquisition was $67,212, net of acquired cash.
Stonehenge Operating Projects
On May 21, 2014, the Company acquired 100% of the issued share capital of three operating utility-scale solar power plants located in the United Kingdom from ib Vogt GmbH. These acquisitions are collectively referred to as Stonehenge Operating Projects. The Stonehenge Operating Projects consist of the Langunnett, West Farm, and Manston power plants. The total combined nameplate capacity for the Stonehenge Operating Projects is 23.6 MW. The purchase price for the Stonehenge Operating Projects was $25,102, net of acquired cash.
107
Summit Solar Projects
On May 22, 2014, the Company acquired the equity interests in 50 solar generation facilities located in the U.S. from Nautilus Solar PV Holdings, Inc. These 50 systems have a combined nameplate capacity of 19.6 MW. The purchase price for these systems was $29,040, net of acquired cash. In addition, an affiliate of the seller owns certain interests in seven operating solar generation facilities in Canada with a total capacity of 3.8 MW. In conjunction with the signing of the purchase and sale agreement to acquire the U.S. equity interests, the Company signed an asset purchase agreement to purchase the right and title to all of the assets of the Canadian facilities. The purchase of the Canadian assets closed on July 23, 2014, and the purchase price was $21,061.
MA Operating
On June 26, 2014, the Company acquired four operating solar generation facilities located in Massachusetts that achieved commercial operations during 2013. The total nameplate capacity for these facilities is 12.2 MW. The purchase price for this acquisition was $39,500.
Mt. Signal
On July 23, 2014, the Company acquired a controlling interest in Imperial Valley Solar 1 Holdings II, LLC, which owns a 265.8 MW utility-scale solar generation facility located in Mt. Signal, California ("Mt. Signal"). The Company acquired Mt. Signal from an indirect wholly owned subsidiary of Silver Ridge Power, LLC ("SRP") in exchange for $291.7 million, net of acquired cash, for total consideration consisting of (i) 5,840,000 Class B1 units (and a corresponding number of shares Class B1 common stock) equal in value to $146.0 million and (ii) 5,840,000 Class B units (and a corresponding number of shares Class B common stock) equal in value to $146.0 million. Prior to the IPO, SRP was owned 50% by R/C US Solar Investment Partnership, L.P. ("Riverstone") and 50% by SunEdison, who acquired all of The AES Corporation’s ("AES") equity ownership interest in SRP on July 2, 2014. In connection with its acquisition of AES’s interest in SRP, SunEdison entered into a Master Transaction Agreement with Riverstone pursuant to which the parties agreed to sell Mt. Signal to the Company and to distribute the Class B units (and shares of Class B common stock) to SunEdison and the Class B1 units (and shares of Class B1 common stock) to Riverstone.
Hudson Energy
On November 4, 2014, the Company acquired the operating portfolio of Hudson Energy Solar Corporation, a solar generation facility developer that owns and operates solar assets for schools, school districts, and commercial and industrial customers. The HES Portfolio consists of 101 operational solar distributed generation facilities located in Massachusetts, New Jersey and Pennsylvania that have a total nameplate capacity of 25.3 MW. The cash purchase price for this acquisition was $32.8 million, net of acquired cash.
Capital Dynamics
On December 18, 2014, the Company acquired 77.6 MW of solar distributed generation facilities in the U.S. from Capital Dynamics U.S. Solar Energy Fund, L.P., a closed-end private equity fund. The CD DG Portfolio consists of 42 solar generation facilities located in California, Massachusetts, New Jersey, New York, and Pennsylvania. The purchase price for this acquisition was $256.7 million, net of acquired cash.
108
The preliminary estimated fair values of assets, liabilities and non-controlling interest as of December 31, 2014, is as follows:
Total | |||||||||||||||
Capital | Other | Preliminary | |||||||||||||
(In thousands) | Dynamics | Mt. Signal | Acquisitions | Allocation | |||||||||||
Property and equipment | $ | 200,712 | $ | 649,005 | $ | 245,828 | $ | 1,095,545 | |||||||
Accounts receivable | 4,511 | 11,617 | 11,251 | 27,379 | |||||||||||
Restricted cash | 15 | 22,165 | 14,688 | 36,868 | |||||||||||
Deferred income taxes | 22,129 | — | — | 22,129 | |||||||||||
Other assets | 687 | 12,621 | 4,987 | 18,295 | |||||||||||
Intangible assets | 83,114 | 117,925 | 140,248 | 341,287 | |||||||||||
Total assets acquired | 311,168 | 813,333 | 417,002 | 1,541,503 | |||||||||||
Long-term debt | — | 413,464 | 137,472 | 550,936 | |||||||||||
Accounts payable, accrued expenses and other current liabilities | 5,925 | 24,813 | 7,410 | 38,148 | |||||||||||
Asset retirement obligations | 6,749 | 4,656 | 18,058 | 29,463 | |||||||||||
Deferred income taxes | 25,191 | — | 892 | 26,083 | |||||||||||
Total liabilities assumed | 37,865 | 442,933 | 163,832 | 644,630 | |||||||||||
Non-controlling interest | 16,600 | 78,745 | 9,913 | 105,258 | |||||||||||
Purchase price, net of cash acquired | $ | 256,703 | $ | 291,655 | $ | 243,257 | $ | 791,615 | |||||||
The acquired solar generation facilities' non-financial assets represent preliminary estimates of the fair value of acquired PPAs based on significant inputs that are not observable in the market and thus represent a Level 3 measurement. The estimated fair values were determined based on an income approach and the estimated useful lives of the intangible assets range from 10 to 25 years. See Note 6. Intangible Assets for additional disclosures related to the acquired intangible assets.
The operating revenues and net income of acquired solar generation facilities reflected in the accompanying consolidated statement of operations for the year ended December 31, 2014 were $60,794 and $12,487, respectively. The following unaudited pro forma supplementary data presented in the table below gives effect to the acquisitions as if the transactions had occurred on January 1, 2013. The pro forma supplementary data is provided for informational purposes only and should not be construed to be indicative of the Company’s results of operations had the acquisitions been consummated on the date assumed or of the Company’s results of operations for any future date.
Year Ended December 31, | |||||||
(In thousands, unaudited) | 2014 | 2013 | |||||
Total operating revenues, net | $ | 113,324 | $ | 51,450 | |||
Net loss | (3,483 | ) | (10,537 | ) | |||
Acquisition costs, including amounts for affiliates, related to the transactions above were $14,261 for the year ended December 31, 2014 and are reflected as acquisition and related costs in the accompanying consolidated statements of operations. There were no acquisition costs for the years ended December 31, 2013 and 2012, respectively.
Acquisitions of Call Right Projects
The assets and liabilities transferred to the Company for the acquisitions listed below relate to interests under common control with SunEdison and accordingly, were recorded at historical cost basis. The difference between the cash purchase price and historical cost basis of the net assets acquired was recorded as a distribution to SunEdison and reduced the balance of its non-controlling interest.
109
Fairwinds and Crundale
On November 4, 2014, the Company completed the acquisition of Fairwinds and Crundale, two utility-scale solar power plants with a total capacity of 50.0 MW located in the United Kingdom that became operational in September 2014. The Company paid approximately $32.2 million in cash to acquire the power plants from SunEdison and assumed approximately $63.7 million of project level debt. Fairwinds and Crundale were the first Call Right Project acquisitions pursuant to the Support Agreement with SunEdison, see further discussion in Note 17. Related Parties.
DG 2014 Portfolio I and DG 2015 Portfolio 2
In December 2014, the Company acquired the DG 2014 Portfolio 1 and the DG 2015 Portfolio 2, consisting of 25.7 MW of solar distributed generation facilities. As of December 31, 2014, the Company has paid $50.6 million in cash to acquire these solar generation facilities from subsidiaries of SunEdison in a series of transactions. The acquired facilities were Call Right Projects pursuant to the Support Agreement with SunEdison, see further discussion in Note 17. Related Parties.
The following table is a summary of assets and liabilities acquired from SunEdison as of December 31, 2014:
(in thousands) | Fairwinds and Crundale | DG 2014 Portfolio 1 | DG 2015 Portfolio 2 | Total | ||||||||||||
Current Assets | $ | 3,260 | $ | 1,380 | $ | — | $ | 4,640 | ||||||||
Property, plant and equipment | 118,197 | 55,358 | 5,489 | 179,044 | ||||||||||||
Non-current assets | 899 | — | — | 899 | ||||||||||||
Total assets acquired | 122,356 | 56,738 | 5,489 | 184,583 | ||||||||||||
Long-term debt | 61,982 | 1,185 | — | 63,167 | ||||||||||||
Other liabilities | 37,741 | 17,596 | — | 55,337 | ||||||||||||
Total liabilities assumed | 99,723 | 18,781 | — | 118,504 | ||||||||||||
Net assets acquired | $ | 22,633 | $ | 37,957 | $ | 5,489 | $ | 66,079 | ||||||||
Subsequent Event
Acquisition of First Wind
On January 29, 2015, the Company through Terra LLC acquired from First Wind Holdings, LCC (together with its subsidiaries, “First Wind”) 521.1 MW of operating power assets, including 500.0 MW of wind power assets and 21.1 MW of solar power assets, from First Wind (the “First Wind acquisition”). The operating power assets we acquired are located in Maine, New York, Hawaii, Vermont and Massachusetts and were acquired for total cash consideration of $830.0 million net of acquired cash, plus additional expenses incurred through the refinancing of certain existing indebtedness, the termination of certain swaps, debt breakage fees, and the purchase of a partner’s ownership stake in certain assets held by First Wind through a joint venture.
110
4. PROPERTY AND EQUIPMENT
Property and equipment, net consists of the following:
December 31, 2014 | December 31, 2013 | |||||||
(In thousands) | ||||||||
Solar generation facilities | $ | 2,220,401 | $ | 163,698 | ||||
Construction in progress - solar generation facilities | 157,482 | 228,749 | ||||||
Capitalized leases - solar generation facilities | — | 29,170 | ||||||
Property and equipment, gross | 2,377,883 | 421,617 | ||||||
Less accumulated depreciation - solar generation facilities | (50,080 | ) | (9,956 | ) | ||||
Less accumulated depreciation - capitalized leases - solar generation facilities | — | (4,305 | ) | |||||
Property and equipment, net | $ | 2,327,803 | $ | 407,356 | ||||
The Company recorded depreciation expense related to property and equipment of $36,482, $4,652 and $3,997 for the years ended December 31, 2014, 2013 and 2012, respectively, which includes depreciation expense for capital leases of $350 for the year ended December 31, 2014 and $1,051 for each of the years ended December 31, 2013 and 2012, respectively. Construction in progress represents $157.5 million of costs incurred to complete the construction of the facilities in the Company's current portfolio that were contributed to the Company by SunEdison.
When projects are contributed or sold to the Company after completion by SunEdison, the Company will retroactively recast its historical financial statements to present the construction activity as if it consolidated the facility at inception of the construction. Subsequent to the completion of the construction in progress projects in the Company's current portfolio, the Company expects to acquire only completed facilities. All construction in progress costs are stated at SunEdison's historical cost. These costs include capitalized interest costs and amortization of deferred financing costs incurred during the asset's construction period, which totaled $37,283, $4,390 and $0 for the years ended December 31, 2014, 2013 and 2012 respectively.
5. ASSET RETIREMENT OBLIGATIONS
Activity in asset retirement obligations for the years ended December 31, 2014 and 2013 is as follows:
Year Ended December 31, | ||||||||
(In thousands) | 2014 | 2013 | ||||||
Balance at the beginning of the year | $ | 11,002 | $ | 6,175 | ||||
Additional obligations | 34,414 | 4,518 | ||||||
Assumed through acquisition | 29,450 | — | ||||||
Accretion expense | 2,048 | 309 | ||||||
Currency translation adjustment | (803 | ) | — | |||||
Balance at the end of the year | $ | 76,111 | $ | 11,002 | ||||
The Company does not have any assets that are legally restricted for the purpose of settling our asset retirement obligations as of December 31, 2014 and 2013. Additionally, there were no revisions of the estimated cash flows for our asset retirement obligations for the years ended December 31, 2014, 2013 and 2012.
111
6. INTANGIBLE ASSETS
The following table presents the gross carrying amount and accumulated amortization of intangible assets as of December 31, 2014:
(In thousands, except weighted average amortization period) | Gross Carrying Amount | Weighted Average Amortization Period | Accumulated Amortization | Currency Translation Adjustment | Net Book Value | |||||||||||||
Power purchase agreements | $ | 371,765 | 21 years | $ | (6,169 | ) | $ | (3,923 | ) | $ | 361,673 | |||||||
The following table presents the gross carrying amount and accumulated amortization of intangible assets as of December 31, 2013:
(In thousands, except weighted average amortization period) | Gross Carrying Amount | Weighted Average Amortization Period | Accumulated Amortization | Currency Translation Adjustment | Net Book Value | |||||||||||
Development rights | $ | 22,600 | Indefinite | — | — | $ | 22,600 | |||||||||
As of December 31, 2014, the Company had PPA intangible assets representing long-term electricity sales agreements that were obtained through acquisitions (see Note. 3 Acquisitions). PPA intangible assets are amortized on a straight-line basis over the life of the agreements, which typically range from 10 to 25 years. Amortization expense related to the PPA intangible assets is recorded on the consolidated statements of operations either as a reduction of energy revenue or within depreciation, accretion and amortization expense. Amortization expense was $6,169 during the year ended December 31, 2014, $4,190 of which was a reduction of energy revenue and $1,979 of which was recorded as depreciation, accretion and amortization expense. There was no amortization expense during the years ended December 31, 2013 and 2012.
As of December 31, 2013, the Company had an intangible asset with a carrying amount of $22,600 related to solar generation facilities development rights. This intangible asset was reclassified to the related solar generation facility (property and equipment, net) upon completion at December 31, 2014 and is depreciated on a straight-line basis over the estimated life of the solar generation facility.
Over the next five fiscal years, we expect to recognize annual amortization expense on our intangible assets as follows:
(in thousands) | 2015 | 2016 | 2017 | 2018 | 2019 | |||||||||||||||
Amortization | $ | 18,366 | $ | 19,057 | $ | 19,057 | $ | 19,057 | $ | 19,057 | ||||||||||
7. VARIABLE INTEREST ENTITIES
The Company is the primary beneficiary of nine VIEs in solar generation facilities that were consolidated as of December 31, 2014, one of which existed and was consolidated as of December 31, 2013. No VIEs were deconsolidated during the years ended December 31, 2014 and 2013.
112
The carrying amounts and classification of the consolidated VIEs’ assets and liabilities included in the Company's consolidated balance sheet are as follows:
(In thousands) | December 31, 2014 | December 31, 2013 | ||||||
Current assets | $ | 69,955 | $ | 2,139 | ||||
Noncurrent assets | 1,756,276 | 27,076 | ||||||
Total assets | $ | 1,826,231 | $ | 29,215 | ||||
Current liabilities | $ | 64,324 | $ | 6,129 | ||||
Noncurrent liabilities | 707,989 | 10,310 | ||||||
Total liabilities | $ | 772,313 | $ | 16,439 | ||||
All of the assets in the table above are restricted for settlement of the VIE obligations, and all of the liabilities in the table above can only be settled by using VIE resources. The Company has not identified any material VIEs during the year ended December 31, 2014 for which we determined that we are not the primary beneficiary and thus did not consolidate.
113
8. LONG-TERM DEBT
Long-term debt consists of the following:
(in thousands, except rates) Description: | December 31, 2014 | December 31, 2013 | Interest Type | Current Interest Rate % (1) | Financing Type | |||||||||
Term Loan, due 2019 | $ | 573,500 | $ | — | Variable | 5.33 (2) | Term debt | |||||||
Mt. Signal, due 2038 | 402,440 | — | Fixed | 6.00 | Senior notes | |||||||||
CAP, due 2032 | 211,377 | 243,581 | Variable | 7.00 - 7.29 | Term debt | |||||||||
Regulus Solar, due 2034 | 85,000 | — | Fixed | 5.80 | Note facility | |||||||||
Regulus Solar, due 2024 | 50,433 | — | Variable | 2.22 (3) | Term debt | |||||||||
Regulus Solar, due 2015 – 2016 | — | 44,400 | Fixed | 18.00 | Construction debt | |||||||||
Fairwinds and Crundale, due 2016 | 61,982 | — | Fixed | 2.50 | Term debt | |||||||||
Nellis, due 2027 | 42,248 | — | Imputed | 5.75 | Senior notes | |||||||||
SunE Perpetual Lindsay, due 2015 | 42,992 | — | Variable | 3.3 | Construction debt and Harmonized Sales Tax Facility | |||||||||
California Public Institutions, due 2024 – 2030 | 16,861 | 9,270 | Variable | 3.39 (4) | Term debt | |||||||||
U.S. Projects 2009 – 2013, due 2024 – 2026 | 9,338 | 10,206 | Fixed | 11.1 - 11.3 | Solar program loans | |||||||||
U.S. Projects 2009 – 2013 | — | 8,638 | Fixed | 5.0 - 5.75 | Term debt | |||||||||
Enfinity, due 2032 | 6,470 | 6,775 | Stated | 1.745 | Term debt | |||||||||
Alamosa | — | 29,171 | Fixed | 2.98 | Capital lease obligations | |||||||||
Financing lease obligations: | ||||||||||||||
Enfinity, due 2025 – 2032 | 29,124 | 31,494 | Fixed | 5.62 - 7.26 | Financing lease obligations | |||||||||
HES Portfolio, due 2019 – 2028 | 24,538 | — | Imputed | 6.50 | Financing lease obligations | |||||||||
Summit Solar U.S., due 2020 – 2032 | 23,127 | — | Fixed | 5.75 | Financing lease obligations | |||||||||
Regulus Solar, due 2034 | 9,138 | — | Fixed | 1.87 | Financing lease obligations | |||||||||
U.S. Projects 2014, due 2019 | 6,869 | — | Imputed | 6.00 | Financing lease obligations | |||||||||
DG 2014 Portfolio 1, due 2023 | 1,185 | — | Fixed | 7.26 | Financing lease obligations | |||||||||
SunE Solar Fund X | — | 55,616 | Fixed | 3.91 - 5.11 | Financing lease obligations | |||||||||
Total Principal long-term debt and financing and capital lease obligations | $ | 1,596,622 | $ | 439,151 | ||||||||||
Less current maturities | (80,133 | ) | (37,455 | ) | ||||||||||
Net unamortized (discount) premium | 1,473 | (1,871 | ) | |||||||||||
Long-term debt and financing and capital lease obligations, less current portion | $ | 1,517,962 | $ | 399,825 | ||||||||||
———
(1) The weighted average effective interest rate for all debt outstanding, including financing lease obligations, during the period was 7.3%.
(2) The variable rate as of December 31, 2014 was 4.75%. The Company has entered into an interest rate swap agreement (see Note 10) fixing the interest rate at 5.33% for the next three years.
(3) The variable rate as of December 31, 2014 was 2.66% on the Regulus term loan balance of $50.4M. The Company has entered into an interest rate swap agreement (see Note 10) fixing the interest rate at 2.22% for the next three years.
(4) The variable rate as of December 31, 2014 was 3.13%. The Company has entered into a series of interest rate swap agreement (see Note 10) fixing the interest rate at a weighted average of 3.39% through 2028.
114
Bridge Credit Facility
On March 28, 2014, the Company entered into a credit and guaranty agreement with Goldman Sachs Bank USA as administrative agent and the lenders party thereto (the “Bridge Credit Facility”). The Bridge Credit Facility originally provided for a senior secured term loan facility in an aggregate principal amount of $250.0 million. On May 15, 2014, the Bridge Credit Facility was amended to increase the aggregate principal amount to $400.0 million (the "Amended Bridge Credit Facility").
Interest under the Amended Bridge Credit Facility had variable interest rate options based on Base Rate Loans or Eurodollar loans at the Company’s election. The Amended Bridge Credit Facility was repaid following the closing of the IPO on July 23, 2014.
Term Loan and Revolving Credit Facility
In connection with the closing of the IPO on July 23, 2014, Terra Operating LLC (a wholly owned subsidiary of Terra LLC) entered into a revolving credit facility (the "Revolver") and a term loan facility (the "Term Loan" and together with the Revolver, the “Credit Facilities”). The Revolver initially provided for up to a $140.0 million senior secured revolving credit facility and the Term Loan initially provided for up to a $300.0 million senior secured term loan. The Term Loan was used to repay a portion of outstanding borrowings under the Amended Bridge Credit Facility.
On December 18, 2014, the Company obtained additional financing by increasing the Term Loan by $275.0 million to a total of $575.0 million and the Revolver by $75.0 million to a total of $215.0 million to increase liquidity and to fund the acquisitions of Hudson Energy and Capital Dynamics as described in Note 3. Acquisitions. As of December 31, 2014, no amounts had been drawn on the Revolver.
On January 28, 2015, the Company repaid the Term Loan in full and replaced its existing Revolver with a new $550.0 million revolving credit facility (the "New Revolver"). The New Revolver consists of a revolving credit facility in an amount of at least $550.0 million (available for revolving loans and letters of credit) and permits Terra Operating LLC to increase commitments to up to $725.0 million in the aggregate, subject to customary closing conditions. The New Revolver matures on January 27, 2020. Each of Terra Operating LLC's existing and subsequently acquired or organized domestic restricted subsidiaries (excluding non-recourse subsidiaries) and Terra LLC are or will become guarantors under the New Revolver.
All outstanding amounts under the New Revolver will bear interest initially at a rate per annum equal to, at Terra Operating LLC’s option, either (i) a base rate plus a margin of 1.50% or (ii) a reserve adjusted Eurodollar rate plus a margin of 2.50%. After the fiscal quarter ended June 30, 2015, the base rate margin will range between 1.25% and 1.75% and the Eurodollar rate margin will range between 2.25% and 2.75% as determined by reference to a leverage-based grid.
The New Revolver provides for voluntary prepayments, in whole or in part, subject to notice periods, and requires Terra Operating LLC to prepay outstanding borrowings in an amount equal to 100% of the net cash proceeds received by Terra LLC or its restricted subsidiaries from the incurrence of indebtedness not permitted by the New Revolver by Terra Operating LLC or its restricted subsidiaries.
The New Revolver, each guaranty and any interest rate, currency hedging or hedging of RECs obligations of Terra Operating LLC or any guarantor owed to the administrative agent, any arranger or any lender under the New Revolver is secured by first priority security interests in (i) all of Terra Operating LLC's and each guarantor’s assets, (ii) 100% of the capital stock of each of Terra Operating LLC’s and its domestic restricted subsidiaries and 65% of the capital stock of Terra Operating LLC’s foreign restricted subsidiaries, and (iii) all intercompany debt. Notwithstanding the foregoing, collateral under the New Revolver excludes the capital stock of non-recourse subsidiaries.
Project-level Financing Arrangements
The Company's solar generation facilities which have long-term debt obligations are included in separate legal entities. The Company typically finances its solar generation facilities through project entity specific debt secured by the solar generation facility's assets (mainly the solar generation facility) with no recourse to the Company. Typically, these financing arrangements provide for a construction loan, which upon completion may or may not be converted into a term loan. The following is a summary of construction and term debt entered into or assumed during the year ended December 31, 2014.
115
Mt. Signal
In November 2012, the Mt. Signal utility-scale solar power plant company issued $415.7 million of senior notes secured in a private placement. The senior secured notes bear interest at 6% and mature in 2038. Interest on the notes is payable semi-annually on June 30 and December 31 of each year, commencing on June 30, 2013. A letter of credit facility was also extended for Mt. Signal to satisfy certain security obligations under the PPA, other power plant agreements and the senior secured notes. The Company also entered into a $79.6 million letter of credit facility and a cash bridge loan in connection with the financing of the Mt. Signal power plant. The subordinated cash bridge loan was repaid in full in 2014 and the letter of credit facility will terminate on July 2, 2019. The remaining power plant development and construction costs were funded by equity.
As of December 31, 2014, the outstanding balance under the senior notes was $402.4 million and $73.3 million of the letters of credit were issued with no amounts outstanding. Pursuant to the note purchase agreement and the letter of credit and reimbursement agreement, the Mt. Signal power plant is permitted to make distributions out of restricted cash if the applicable distribution conditions are satisfied.
CAP
In August 2013, the CAP utility-scale solar power plant entity obtained $212.5 million in non-recourse debt financing from the Overseas Private Investment Corporation (“OPIC”), the U.S. Government's development finance institution, and the International Finance Corporation (“IFC”), a member of the World Bank Group, that matures in December 2032. In addition to the debt financing provided by OPIC and IFC, the CAP power plant received a Chilean peso VAT credit facility from Rabobank. Under the VAT credit facility the CAP power plant borrowed funds to pay for value added tax payments due from the power plant. The VAT credit facility had a variable interest rate that was tied to the Chilean Interbank Rate plus 1.40% and was fully repaid in November 2014.
Regulus Solar
In March 2013, the utility-scale solar power plant entity entered into a financing agreement with a group of lenders for a $44.4 million development loan of which $0 and $44.4 million was outstanding as of December 31, 2014 and 2013, respectively. The financing arrangement accrued interest from the date of borrowing until the repayment date at a rate of 18% per annum and is payment-in-kind (“PIK”) at each PIK interest date.
In March 28, 2014, the Regulus utility-scale solar power plant entered into an agreement for a construction loan facility for an amount up to $120.0 million. The $44.4 million development loan and a $120.0 million non-recourse construction loan, were repaid in November 2014 with the proceeds of permanent financing, which was a combination of equity, non-controlling member interest proceeds and a $135.4 million amortizing term loan and fixed rate note facility. The term loan and fixed rate note mature in 2024 and 2034, respectively. All of the membership interests of the project-level entity that owns the Regulus power plant have been pledged as security under the credit agreement. Pursuant to the credit agreement, the Regulus power plant is permitted to make distributions if the applicable distribution tests are satisfied. The Regulus power plant’s PPA security obligation and debt service reserve are being met through $23.3 million and $7.4 million non-recourse letters of credit, respectively, maturing in 2021.
Fairwinds and Crundale
On November 4, 2014, the Company assumed all outstanding debt as a result of the acquisition of these two Call Right Projects. The development and construction of Fairwinds and Crundale was financed with a cumulative £39.8 million ($62.0 million USD equivalent) of short-term bridge facility indebtedness that matures in July 2016. Pursuant to the bridge loan agreement, these utility-scale solar power plants and holding company for the power plants are permitted to begin making distributions upon first and final repayment in July 2016. The debt is due to be repaid by the end of Q2 2015 and bears an interest rate of 2.50%. Additionally, the debt for Fairwinds and Crundale contain a cross default provision and the assets of these plants are cross collateralized.
Nellis
On March 28, 2014, the Company assumed a term loan facility in conjunction with the acquisition of Nellis, a utility-scale solar power plant. The term loan was financed with $55 million fully amortizing senior notes that will mature in 2027. The notes bear interest at a rate of 5.75% per annum and are secured by the assets of Nellis. As of December 31, 2014, $42.2
116
million aggregate principal amount of the senior notes was outstanding. Pursuant to the senior note agreement, the Nellis power plant is permitted to pay quarterly distribution out of restricted cash if a debt service coverage ratio is met.
SunE Perpetual Lindsay ("Lindsay")
On March 25, 2014, Lindsay, a Canadian utility-scale solar power plant entity, obtained a construction term loan to finance and develop the construction of the power plant. The loan matures in September 2015. Interest under the construction term loan facility has variable rate options based on Prime Rate Advances or CDOR (“Canadian Dealer Offered Rate”) Advances at the Company’s election. The interest rate payable under Prime Rate Advances will be the sum of the Prime Rate in effect on such day plus 1.00% and an applicable margin of 2.00%. The interest rate payable under CDOR Advances will be based on the published CDOR rate plus an applicable margin of 2.00%. This debt is secured by the assets of the Lindsay power plant entity. As of December 31, 2014, Lindsay had two security letters of credit for an aggregate amount of CAD 0.8 million ($0.6 million USD equivalent) issued and outstanding as per the terms of its Ontario Power Authority feed-in tarriff contract.
California Public Institutions ("CPI")
The CPI solar generation facilities are financed in part by a series of non-recourse, project-level amortizing term loans provided by National Bank of Arizona in an aggregate of $17.6 million that were entered into on December 31, 2013 and July 31, 2014. All of the membership interests of the project-level entity that owns the facilities have been pledged as security under the non-recourse, project-level amortizing term loan. Pursuant to the term-loan agreement, the facilities and the holding company for the facilities are permitted to make distributions if the applicable debt service coverage ratios are met. The term loans mature between 2024 and 2030 and bear interest at a rate of LIBOR plus 2.5%.
U.S. Projects 2009-2013
Nineteen of the solar generation facilities in the U.S. Projects 2009-2013 portfolio that are located in New Jersey, with an aggregate nameplate capacity of approximately 3.6MW, are financed with REC-based term loans through the Public Service Electric and Gas Company, or "PSE&G." The loans were issued between the third quarter of 2009 and the fourth quarter of 2011, when each applicable facility achieved commercial operations, and mature between 2024 and 2026. Loan payments are made by transferring the RECs generated by the facilities to SPE&G and, as a result, the loans are not repaid in cash. On September 8, 2014, the Company repaid all outstanding amounts due under its term bonds. The Company recognized a $2.5 million loss on extinguishment of debt during the year ended December 31, 2014 as a result of this repayment. As of December 31, 2014, the aggregate outstanding indebtedness under the loans was approximately $9.3 million. The term loans contain customary covenants related to business operations, maintenance of the facilities, insurance coverage and a debt service calculation requirement.
Enfinity
The portion of the Enfinity Portfolio representing a 2.5MW DHA solar generation facility was financed with a non-recourse, 20-year Qualified Energy Conservation, or “QEC,” bond. The QEC bond matures on April 20, 2032. The balance at December 31, 2014 was $6.5 million.
Marsh Hill
As of December 31, 2014, the Company had two letters of credit for a total of CAD 1.0 million ($0.9 million USD equivalent) related to our Marsh Hill facility with no amounts outstanding.
Capital Lease Obligations
Alamosa
On May 7, 2014, the Company purchased the lessor portion of the capital lease related to this utility-scale solar power plant and there is no additional project level financing outstanding at December 31, 2014. The Company recognized a $1.9 million loss on extinguishment of debt during the year ended December 31, 2014 as a result of this transaction.
117
Financing Lease Obligations
In certain transactions, the Company accounts for the proceeds of sale leasebacks as financings, which are typically secured by the solar generation facility asset and its future cash flows from energy sales, and without recourse to the Company under the terms of the arrangement.
Enfinity
Certain of the Enfinity solar generation facilities (representing 13.2 MW of the 15.7 MW total nameplate capacity of the portfolio) were financed through a series of non-recourse, sale-leaseback transactions between December 2011 and December 2013. The balance outstanding for sale leaseback transactions accounted for as financings as of December 31, 2014 for Enfinity was $29.1 million. The Enfinity sale leaseback accounted for as financings mature between 2025 and 2032 and are collateralized by the related solar generation facility assets.
HES Portfolio
On November 4, 2014, the Company assumed all outstanding debt as a result of the acquisition of Hudson Energy. The term loans mature from 2019-2028 and bear an interest rate of 6.50%. Six of the solar generation facilities in the HES Portfolio that are located in New Jersey, with an aggregate nameplate capacity of 3.6MW, are financed with non-controlling member contributions and a leveraged tax equity structure with REC-based loans through PSE&G. As of December 31, 2014 approximately $24.5 million aggregate principal amount of the term loans were outstanding.
Summit Solar U.S.
On May 22, 2014, the Company assumed seven sale-leaseback transactions in conjunction with the acquisition of Summit Solar U.S. The term loans are due from 2020 through 2032, bear interest at a rate of 5.75% per annum, and are secured by the assets of Summit Solar U.S.
Regulus Solar
On April 11, 2014, Regulus Solar entered into a sale leaseback agreement with respect to the project site for a sales price of $9.2 million, which was received at closing on April 14, 2014. The lease term is 20 years and Regulus Solar has two options to renew the term for 5 years each and then one option to renew for a total lease term not to exceed 34 years, 11 months. The total purchase price of $9.2 million was recorded as a financing obligation and is secured by the land and the utility-scale power plant asset.
U.S. Projects 2014
On June 3, 2014, certain solar generation facilities within the Company's U.S. Projects 2014 portfolio entered into an inverted lease structure to finance approximately 45 MW of solar distributed generation facilities that were constructed and placed into operation during the fourth quarter of 2014. The lease term is five years and the total purchase price was $55.6 million, of which $6.9 million is reflected as a financing obligation and $48.7 million is recorded as deferred revenue in the accompanying consolidated balance sheet as of December 31, 2014.
DG 2014 Portfolio 1
On June 3, 2014, certain solar generation facilities within the Company's U.S. Projects 2015 portfolio entered into an inverted lease structure to finance approximately 45 MW of solar distributed generation facilities that were constructed and placed into operation during the fourth quarter of 2014. The lease term is eight years and the total purchase price was $54.3 million, of which $1.2 million is reflected as a financing obligation as of December 31, 2014.
SunE Solar Fund X
On July 23, 2014, concurrent with the closing of the IPO, the Company purchased the lessor portion of the capital lease related to the SunE Solar Fund X project and there is no additional project level financing outstanding at December 31, 2014. The Company recognized a $15.8 million gain on extinguishment of debt during the year ended December 31, 2014 as a result of this transaction.
118
Minimum Lease Payments
The aggregate amounts of minimum lease payments on our financing lease obligations are $94.0 million. Obligations for 2015 through 2019 and thereafter are as follows:
(In thousands) | 2015 | 2016 | 2017 | 2018 | 2019 | Thereafter | Total | |||||||||||||||||||||
Minimum lease obligations | $ | 6,292 | $ | 6,612 | $ | 6,947 | $ | 6,889 | $ | 16,395 | $ | 50,846 | $ | 93,981 | ||||||||||||||
Maturities
The aggregate amounts of payments on long-term debt due after December 31, 2014 are as follows:
(In thousands) | 2015 | 2016 | 2017 | 2018 | 2019 | Thereafter | Total | |||||||||||||||||||||
Maturities of long-term debt as of December 31, 2014 | $ | 73,616 | $ | 96,915 | $ | 33,809 | $ | 35,115 | $ | 580,961 | $ | 682,225 | $ | 1,502,641 | ||||||||||||||
The amount of long-term debt due in 2015 includes $43.0 million of construction debt for SunE Perpetual Lindsay, which will be repaid by SunEdison in the first quarter of 2015. The amounts of long-term debt due in 2016 includes $62.0 million of construction term debt for Fairwinds and Crundale.
Senior Notes
On January 28, 2015, through our indirect subsidiary, Terra Operating LLC, the Company issued $800.0 million of 5.875% senior notes due 2023 at a price of 99.214%, or the "Senior Notes." Terra Operating LLC used the net proceeds from the offering to fund a portion of the price of the First Wind acquisition. The Senior Notes are senior obligations of Terra Operating LLC and are guaranteed by Terra LLC and each of Terra Operating LLC's existing and future subsidiaries that guarantee its senior secured credit facility, subject to certain exceptions.
119
9. INCOME TAXES
Income tax expense (benefit) consists of the following:
(In thousands) | Current | Deferred | Total | |||||||||
Year ended December 31, 2014 | ||||||||||||
U.S. federal | $ | 84 | $ | (3,554 | ) | $ | (3,470 | ) | ||||
State and local | — | (213 | ) | (213 | ) | |||||||
Foreign | — | (1,006 | ) | (1,006 | ) | |||||||
Total | $ | 84 | $ | (4,773 | ) | $ | (4,689 | ) | ||||
Tax benefit in equity | — | (3,616 | ) | (3,616 | ) | |||||||
Total | $ | 84 | $ | (8,389 | ) | $ | (8,305 | ) | ||||
Year ended December 31, 2013 | ||||||||||||
U.S. federal | $ | — | $ | (329 | ) | $ | (329 | ) | ||||
State and local | — | 42 | 42 | |||||||||
Foreign | 165 | 34 | 199 | |||||||||
Total | $ | 165 | $ | (253 | ) | $ | (88 | ) | ||||
Year ended December 31, 2012 | ||||||||||||
U.S. federal | $ | — | $ | (1,094 | ) | $ | (1,094 | ) | ||||
State and local | — | (176 | ) | (176 | ) | |||||||
Total | $ | — | $ | (1,270 | ) | $ | (1,270 | ) | ||||
Effective Tax Rate
Income tax expense (benefit) differed from the amounts computed by applying the statutory U.S. federal income tax rate of 35% to loss before income taxes.
Year ended December 31, | |||||||||
Effective Tax Rate - Year-end | 2014 | 2013 | 2012 | ||||||
Income tax benefit at U.S. federal statutory rate | 35.0 | % | 35.0 | % | 35.0 | % | |||
Increase (reduction) in income taxes: | |||||||||
State income taxes, net of U.S. federal benefit | 1.0 | % | (11.2 | )% | 6.7 | % | |||
Grants in lieu of tax credits—U.S. federal benefit | — | % | — | % | 242.6 | % | |||
Grants in lieu of tax credits—state, net of U.S. federal benefit | — | % | — | % | 38.0 | % | |||
Foreign operations | 1.4 | % | — | % | — | % | |||
Non-controlling interest | (16.1 | )% | — | % | — | % | |||
Stock-based compensation | (2.2 | )% | — | % | — | % | |||
Change in valuation allowance | (9.0 | )% | — | % | — | % | |||
Other | (4.6 | )% | — | % | — | % | |||
Effective tax (expense) benefit rate | 5.5 | % | 23.8 | % | 322.3 | % | |||
When ITCs or grants in lieu of tax credits are received by the Company for its solar generation facilities, the credits and grants are recognized as a reduction in the carrying value of the property and equipment. This also results in the recognition of a deferred tax asset and income tax benefit for the future tax depreciation of the property and equipment.
On July 23, 2014, the Company acquired a controlling interest in Terra LLC and its subsidiary Terra Operating LLC. As a result, the Company owns 37.5% of Terra LLC and consolidates the results due to its controlling interest. The Company records SunEdison's 57.3% and Riverstone's 5.2% ownership as a non-controlling interests in the financial statements. Terra
120
LLC is treated as a partnership for income tax purposes. As such, the Company records income tax on its 37.5% of Terra LLC's taxable income. SunEdison records income tax on its 57.3% share of taxable income generated by Terra LLC.
The Company's deferred tax balances reflect the change in tax basis of the Company's assets as a result of the IPO, primarily due to the recognition of the tax basis of the Company's investment in Terra LLC.
For the year ended December 31, 2014, the overall effective tax rate was different than the statutory rate of 35% primarily due to the recognition of a valuation allowance on the tax benefit attributed to the Company post IPO and income allocated to non-controlling interests. Tax benefits for losses realized before July 23, 2014, were recognized primarily because of existing deferred tax liabilities. Tax benefits for losses realized after July 23, 2014 were recognized primarily because of existing deferred tax liabilities at our foreign operations. As of December 31, 2014, all jurisdictions are in a net deferred tax asset position. A valuation allowance is recognized for the deferred tax assets resulting from the IPO transaction primarily because of the history of losses.
The tax effects of the major items recorded as deferred tax assets and liabilities are:
As of December 31, | ||||||||
(In thousands) | 2014 | 2013 | ||||||
Deferred tax assets: | ||||||||
Net operating losses and tax credit carryforwards | $ | 53,968 | $ | 6,745 | ||||
Investment in partnership | 115,861 | — | ||||||
Deferred revenue | 207 | 2,575 | ||||||
Solar generation facilities | — | 44,218 | ||||||
Other | 2,078 | — | ||||||
Total deferred tax assets | 172,114 | 53,538 | ||||||
Valuation allowance | (167,508 | ) | — | |||||
Net deferred tax assets | 4,606 | 53,538 | ||||||
Deferred tax liabilities: | ||||||||
Solar generation facilities | 7,473 | 57,971 | ||||||
Other | 229 | 2,039 | ||||||
Total deferred tax liabilities | 7,702 | 60,010 | ||||||
Net deferred tax liabilities | $ | 3,096 | $ | 6,472 | ||||
Upon the closing of the IPO on July 23, 2014, the Company's most significant asset for which deferred taxes are being provided is its basis in the Terra LLC partnership interest. The underlying solar generation facilities are controlled under Terra LLC, and thus deferred tax assets and liabilities at the Company's project portfolio companies are captured within the deferred tax asset for investment in partnership. The Company has gross net operating loss carryforwards of $95.4 million in the United States and multiple foreign jurisdictions that will expire beginning in 2026. The Company believes that it is more likely than not that it will not generate sufficient taxable income to realize the deferred tax assets associated with net operating losses and tax credit carryforwards and has recorded a valuation allowance against its deferred tax assets.
As of December 31, 2014, the Company has identified no uncertain tax positions for which a reserve under ASC 740-10 is required.
121
10. DERIVATIVES
As part of the Company’s risk management strategy, the Company has entered into interest rate swaps and foreign currency hedges to mitigate interest rate and foreign currency exposure. Financial instruments are not utilized for speculative purposes. If the Company elects to do so and if the instrument meets the criteria specified in ASC 815, Derivatives and Hedging, management designates its derivative instruments as cash flow hedges. The Company enters into interest rate swap agreements in order to hedge the variability of expected future cash interest payments. Currency swaps are used to reduce risks arising from the change in fair value of certain foreign currency denominated assets and liabilities. The objective of these practices is to minimize the impact of foreign currency fluctuations on operating results.
As of December 31, 2014 and 2013, derivative transactions consisted of the following:
Fair Value As of | ||||||||||||||
(In thousands) | Balance Sheet Classification | Notional Amount | December 31, 2014 | December 31, 2013 | ||||||||||
Derivatives designated as hedges: | ||||||||||||||
Interest rate swaps | Accounts payable and other current liabilities | $ | 349,213 | $ | (1,925 | ) | $ | — | ||||||
Interest rate swaps | Accumulated other comprehensive loss | 349,213 | 1,925 | — | ||||||||||
Derivatives not designated as hedges: | ||||||||||||||
Interest rate swaps | Accounts payable and other current liabilities | $ | 16,861 | $ | (1,279 | ) | $ | — | ||||||
Foreign exchange contracts | Accounts payable and other current liabilities | 62,649 | (685 | ) | — | |||||||||
Foreign exchange contracts | Other assets | 52,844 | 1,811 | — | ||||||||||
(In thousands) | Loss / (gain) for the Year Ended December 31, | |||||||||
Derivatives not designated as hedges: | Statement of Operations Classification | 2014 | 2013 | |||||||
Interest rate swaps | Interest expense, net | $ | 1,279 | $ | — | |||||
Foreign exchange contracts | Interest expense, net | 685 | — | |||||||
Foreign exchange contracts | Gain on foreign currency exchange | (1,811 | ) | — | ||||||
The Company has elected to offset derivative assets and liabilities on the balance sheet on a trade-by-trade basis as a right to setoff exists. The Company has a master netting arrangement with only one counterparty, however, no amounts were netted under this arrangement as each of the interest rate swaps subject to this arrangement were in a loss position as of December 31, 2014. The following table provides information on the gross fair values of derivative asset and liabilities, the balance sheet netting adjustments, and the resulting net fair value amount recorded on our balance sheet.
December 31, 2014 | ||||||||||||
(In thousands) | Gross Amounts Recognized | Gross Amounts Offset in Consolidated Balance Sheet | Net Amounts in Consolidated Balance Sheet | |||||||||
Derivative assets: | ||||||||||||
Foreign exchange contracts | $ | 1,811 | $ | — | $ | 1,811 | ||||||
Total derivative assets | $ | 1,811 | $ | — | $ | 1,811 | ||||||
Derivative liabilities: | ||||||||||||
Interest rate swaps | $ | 3,204 | $ | — | $ | 3,204 | ||||||
Foreign exchange contracts | 685 | — | 685 | |||||||||
Total derivative liabilities | $ | 3,889 | $ | — | $ | 3,889 | ||||||
The Company held no derivative instruments on the balance sheet as of December 31, 2013. Additionally, there was no cash collateral received or pledged as of December 31, 2014 and December 31, 2013, related to our derivative transactions.
In September 2014, the Company entered into an interest rate swap agreement to hedge floating rate debt under the Term Loan. The interest rate swap matures in July 2017, qualifies for hedge accounting and was designated as a cash flow
122
hedge. Under the interest rate swap agreement, the Company pays a fixed rate and the counterparty to the agreement pays the Company a floating interest rate. The amount recorded in the consolidated balance sheet represents the estimated fair value of the net amount that the Company would pay in order to settle the agreement on December 31, 2014, if the agreements were transferred to other third parties or canceled by the Company. The effective portion of the change in fair value of this cash flow hedge for the year ended December 31, 2014 was an unrealized loss of $1,213, which was recorded within accumulated other comprehensive loss and amounts reclassified into earnings for the year ended December 31, 2014 were inconsequential. This amount is will be recognized in earnings in January 2015 as the swap was canceled due to the payoff of the Term Loan by the Company on January 28, 2015 as discussed in Note 8. Long-term Debt. There was no material ineffectiveness during the year ended December 31, 2014.
In November 2014, the Regulus Solar entity entered into an interest rate swap agreement to hedge floating rate debt under its term loan facility. The interest rate swap matures in September 2024, qualifies for hedge accounting and was designated as a cash flow hedge. Under the interest rate swap agreement, Regulus Solar pays a fixed rate and the counterparty to the agreement pays Regulus Solar a floating interest rate. The amount recorded in the consolidated balance sheet represents the estimated fair value of the net amount that Regulus Solar would pay in order to settle the agreement on December 31, 2014, if the agreement was transferred to other third parties or canceled by Regulus Solar. The effective portion of the change in fair value of this cash flow hedge for the year ended December 31, 2014 was an unrealized loss of $712, which was recorded within accumulated other comprehensive loss and no amounts were reclassified into earnings over the year ended December 31, 2014. The amount expected to be reclassified into earnings during the year ended December 31, 2015 is approximately $886. There was no material ineffectiveness during the year ended December 31, 2014.
As of December 31, 2014, the solar generation facilities in the CPI portfolio are party to six interest rate swap instruments that are economic hedges. These instruments are used to economically hedge floating rate debt and each one matures in December 2028. Under the interest rate swap agreements, the CPI entities pay a fixed rate and the financial institution counterparties to the agreements pay the CPI entities a floating interest rate. The combined notional value of the six interest rate swap instruments at December 31, 2014 was $16,861. The amounts recorded in the consolidated balance sheet, as provided in the table above, represent the estimated fair value of the net amount that the Company would pay in order to settle the agreement on the balance sheet date if the swaps were transferred to other third parties or canceled by us. Because these hedges are deemed economic hedges and not accounted for under hedge accounting, the changes in fair value are recorded in the consolidated statement of operations, as provided in the table above.
In September 2014, the Company entered into a series of foreign exchange contracts in order to economically hedge its exposure to foreign currency fluctuations. The combined notional value of the British pound and Canadian dollar contracts at December 31, 2014 were GBP 21.0 million and CAD 25.4 million, respectively. The settlement of these hedges occurs on a quarterly basis through July 2016. The amounts recorded in the consolidated balance sheet, as provided in the table above, represent the estimated fair value of the net amounts that the Company would pay or receive in order to settle the agreements on the balance sheet date if the swaps were transferred to other third parties or canceled by us. Because these hedges are deemed economic hedges and not accounted for under hedge accounting, the changes in fair value are recorded in the consolidated statement of operations, as provided in the table above.
11. FAIR VALUE OF FINANCIAL INSTRUMENTS
The fair value of the Company's long-term debt was determined using inputs classified as Level 2 and a discounted cash flow approach using market rates for similar debt instruments. The carrying amount and estimated fair value of the Company's long-term debt as of December 31, 2014 and 2013 are as follows:
As of December 31, 2014 | As of December 31, 2013 | |||||||||||||||
(In thousands) | Carrying Amount | Fair Value | Carrying Amount | Fair Value | ||||||||||||
Liabilities: | ||||||||||||||||
Long-term debt, including current portion | $ | 1,598,095 | $ | 1,607,511 | $ | 437,280 | $ | 443,067 | ||||||||
123
Recurring Fair Value Measurements
The following table summarizes the financial instruments measured at fair value on a recurring basis classified in the fair value hierarchy (Level 1, 2 or 3) based on the inputs used for valuation in the accompanying consolidated balance sheet:
(In thousands) | As of December 31, 2014 | As of December 31, 2013 | |||||||||||||||||||||||||||||
Assets | Level 1 | Level 2 | Level 3 | Total | Level 1 | Level 2 | Level 3 | Total | |||||||||||||||||||||||
Foreign exchange contracts | $ | — | $ | 1,811 | $ | — | $ | 1,811 | $ | — | $ | — | $ | — | $ | — | |||||||||||||||
Total Derivative Assets | $ | — | $ | 1,811 | $ | — | $ | 1,811 | $ | — | $ | — | $ | — | $ | — | |||||||||||||||
Liabilities | |||||||||||||||||||||||||||||||
Interest rate swaps | $ | — | $ | 3,204 | $ | — | $ | 3,204 | $ | — | $ | — | $ | — | $ | — | |||||||||||||||
Foreign exchange contracts | — | 685 | — | 685 | — | — | — | — | |||||||||||||||||||||||
Total Derivative Liabilities | $ | — | $ | 3,889 | $ | — | $ | 3,889 | $ | — | $ | — | $ | — | $ | — | |||||||||||||||
The Company's interest rate swaps and foreign currency hedges are classified as Level 2 since all significant inputs are observable for similar instruments. The fair value is determined based on observable market prices for forward currencies and interest rates. There were no transfers between Level 1, Level 2 and Level 3 financial instruments during the year ended December 31, 2014. The Company held no financial instruments measured at fair value during the year ended December 31, 2013.
12. STOCKHOLDER'S EQUITY
On January 15, 2014, at formation, the Company authorized 1,000 shares of common stock. On January 29, 2014, the Company amended and restated its certificate of incorporation to authorize 500,000 shares of Class A common stock, par value $0.01 per share, of which 250,000 shares were issued to SunEdison at par value and 10,942 restricted shares were issued to certain individuals, all of which were outstanding at December 31, 2014. In addition, the Company authorized 500,000 shares of Class B common stock, par value $0.01 per share, of which 250,000 shares were issued to SunEdison at par value and were outstanding at December 31, 2014. Further, the Company authorized 100,000 shares of Class C common stock, par value $0.01 per share, of which 41,765 shares were issued to certain members of management and executive officers at par value and were outstanding at December 31, 2014.
Each share of Class A and Class C common stock entitles the holder to one vote per share on all matters. Each share of Class B common stock entitles the holder to ten votes per share. Holders of the Company's Class B common stock do not have any right to receive dividends. Shares of Class B common stock can be redeemed at a price per share equal to par value upon the exchange of Class B units of the Company for shares of the Company's Class A common stock. Shares of Class B common stock may not be transferred, except to SunEdison or a controlled affiliate of SunEdison, so long as an equivalent number of Class B units are transferred to the same person.
The Company also authorized 50,000,000 shares of preferred stock, par value $0.01 per share. No shares of preferred stock have been issued.
Effective upon the filing of the Company's amended and restated certificate of incorporation immediately prior to the completion of the IPO, the Company retired all of the outstanding shares of Class A common stock held by SunEdison, effected a 127.1624-for-one stock split of the remaining outstanding shares of the Company's Class A common stock and a 262.8376-for-one stock split of the outstanding shares of its Class B common stock, and converted all outstanding shares of Class C common stock into shares of Class A common stock on a 85.8661-for-one basis.
The Company's amended and restated certificate of incorporation also authorized 260,000,000 shares of Class B1 common stock, par value $0.01 per share. Each share of Class B1 common stock entitles the holder to one vote per share. Holders of the Company's Class B1 common stock do not have any right to receive dividends. Shares of Class B1 common stock can be redeemed at a price per share equal to par value upon the exchange of Class B1 units of the Company for shares of the Company's Class A common stock.
Initial Public Offering
On July 23, 2014, the Company completed its IPO by issuing 20,065,000 shares of its Class A common stock at a price of $25.00 per share (the "IPO Price") for aggregate gross proceeds of $501.6 million. In addition, the underwriters
124
exercised in full their option to purchase an additional 3,009,750 shares of Class A common stock at the IPO Price for aggregate gross proceeds of $75.2 million. Concurrently with the IPO, the Company sold an aggregate of 2,600,000 shares of its Class A common stock at the IPO Price to Altai Capital Master Fund, Ltd. ("Altai") and Everstream Opportunities Fund I, LLC ("Everstream") (the "Private Placements"), for aggregate gross proceeds of $65.0 million. In addition, on July 23, 2014, as consideration for the acquisition of the Mt. Signal utility-scale solar power plant from Silver Ridge Power, LLC ("SRP") at an aggregate purchase price of $292.0 million, the Company issued to SRP 5,840,000 Class B units (and the Company issued a corresponding number of shares of Class B common stock) and 5,840,000 Class B1 units (and the Company issued a corresponding number of shares of Class B1 common stock). SRP distributed the Class B shares and units to SunEdison and the Class B1 shares and units to R/C US Solar Investment Partnership, L.P. ("Riverstone"), the owners of SRP.
The Company received net proceeds of $463.9 million from the sale of the Class A common stock after deducting underwriting discounts, commissions, structuring fees, and offering expenses. The Company received net proceeds of $69.6 million from the underwriters' exercise of their option to purchase an additional 3,009,750 shares of Class A common stock, after deducting underwriting discounts, commissions, and structuring fees, which was used to purchase Class B common stock from SunEdison. The Company also received net proceeds of $65.0 million from the Private Placements. The Company used $159.2 million of net proceeds to repurchase Class B common stock and Class B1 units from SunEdison.
Acquisition Private Placement Offering
On November 26, 2014, we completed the sale of a total of 11,666,667 shares of our Class A common stock in a private placement, or the “Acquisition Private Placement,” to certain eligible investors for a net purchase price of $337.8 million. We used the net proceeds from the Acquisition Private Placement to repay a portion of amounts outstanding under our Term Loan among other things. In connection with the Acquisition Private Placement, we entered into a registration rights agreement with the purchasers pursuant to which we filed a registration statement with the SEC covering the resale of the purchased shares. The registration statement for these shares became effective on January 8, 2015.
As of December 31, 2014, the following shares of the Company were outstanding:
Shares: | Number Outstanding | Shareholder(s) | |||
Class A common stock | 42,217,984 | * | |||
Class B common stock | 64,526,654 | SunEdison | |||
Class B1 common stock | 5,840,000 | Riverstone | |||
Total Shares | 112,584,638 | ||||
———
* Common stock holders are comprised of: public, Acquisition Private Placement, Altai, Everstream, executive officers, management and employees. The par value of Class A common stock reflected on the consolidated balance sheets and consolidated statement of stockholders' equity excludes 3,485,155 shares of unvested restricted Class A common stock awards.
As of December 31, 2014, the Company owns 37.5% of Terra LLC and consolidates the results of Terra LLC through its controlling interest, with SunEdison's 57.3% interest and Riverstone's 5.2% interest shown as non-controlling interests.
Dividends
On October 27, 2014, the Company declared a quarterly dividend of $0.1717 per share on our outstanding Class A common stock payable which was paid on December 15, 2014 to holders of record on December 1, 2014. This amount represents a quarterly dividend of $0.2257 per share, or $0.9028 per share on an annualized basis, prorated to adjust for a partial quarter as we consummated our IPO on July 23, 2014.
On December 22, 2014, the Company declared a quarterly dividend for the fourth quarter on the Company's Class A common stock of $0.27 per share, or $1.08 per share on an annualized basis. The fourth-quarter dividend is payable on March 16, 2015 to shareholders of record as of March 2, 2015.
Follow-on Public Offering
On January 22, 2015, the Company completed the sale of a total of 13,800,000 shares of its Class A common stock to the public in a registered offering, including 1,800,000 shares sold pursuant to the underwriters' overallotment option. The Company received net proceeds of $390.6 million, $50.9 million of which was used to repurchase Class B common stock and
125
Class B units from SunEdison and the remainder of which was used to pay for part of the purchase price of the First Wind assets and to repay remaining amounts outstanding under the Term Loan among other things.
13. STOCK-BASED COMPENSATION
In April 2014, the Company adopted the 2014 Second Amended and Restated Long-Term Incentive Plan ("2014 Plan"), which permits the Company to issue an aggregate of 8,586,614 shares of Class A common stock pursuant to equity awards including incentive and nonqualified stock options, restricted stock awards ("RSAs") and restricted stock units ("RSUs") to employees and directors. The 2014 Plan modified the SunEdison Yieldco, Inc. 2014 Long-Term Incentive Plan ("Yieldco Plan") which also permitted the Company to issue RSAs that remained issued under the 2014 Plan. RSAs provide the holder with immediate voting rights, but are restricted in all other respects until vested. Upon cessation of services to the Company, any unvested RSAs will be canceled. All unvested RSAs are paid dividends and distributions. The Company measures the fair value of RSAs and RSUs at the grant date fair value of Class A common stock and accounts for stock-based compensation expense by amortizing the fair value on a straight line basis over the related vesting period less estimated forfeitures.
In 2014, the Company made grants of 4,977,586 RSAs to certain executives and an affiliate of the Company with a term of three years. In connection with the IPO, the Company granted 416,193 RSUs to employees with a term of three years. Subsequent to the IPO and until December 31, 2014, the Company granted 409,750 RSUs and 150,000 stock options to new hires with terms of three and four years, respectively. As of December 31, 2014, an aggregate of 2,734,104 shares of Class A common stock were available for issuance under the 2014 Plan. The stock-based compensation expense related to issued stock options, RSAs, and RSUs is recorded as a component of general and administrative expenses in the Company’s consolidated statements of operations and totaled $5.8 million for the year ended December 31, 2014. Upon exercise of the RSAs, RSUs, or stock options, the Company will issue shares that have been previously authorized to be issued.
Restricted Class C Awards
On January 31, 2014 and February 20, 2014, the Company granted 27,647 and 14,118 shares (determined at 3.55% of the Company) of restricted Class C common stock, respectively (or 2,373,946 and 1,212,228 shares, respectively, of restricted Class A common stock after giving effect to conversion of restricted Class C common stock to restricted Class A common stock on an 85.8661-for-one basis immediately prior to the completion of the IPO), under the Yieldco Plan.
For the restricted Class C common stock converted to unvested, restricted Class A common stock in connection with the IPO, 25% of the unvested, restricted Class A common stock will vest on the first anniversary of the grant date, 25% will vest on the second anniversary of the grant date, and 50% will vest on the third anniversary of the grant date, subject to accelerated vesting upon certain events. Under certain circumstances upon a termination of employment, any unvested shares of unvested, restricted Class A common stock held by the terminated executive will be forfeited.
In estimating the fair value of the Company's Class C restricted common stock and Class A restricted common stock, the primary valuation considerations were an enterprise value determined from an income-based approach using an enterprise value multiple applied to its forward revenue metric and a lack of marketability discount of 15%. The illiquidity discount model used the following assumptions: a time to liquidity event of 6 months; a risk free rate of 3.4%; a volatility of 60% over the time to a liquidity event. Estimates of the volatility of the Company's Class A common stock were based on available information on the volatility of Class A common stock of comparable publicly traded companies. The fair value of restricted stock on the date of grant was $58 per share (or $0.68 per share after giving effect to conversion of Class C restricted common stock to Class A common stock on an 85.8661-for-one basis upon the closing of the IPO) or $2.4 million total.
The amount of stock compensation expense related to the restricted Class C common stock awards, which were converted to restricted Class A awards in connection with the IPO, was $2.9 million, net of estimated forfeitures, during the year ended December 31, 2014. As of December 31, 2014, $1.4 million of total unrecognized compensation cost related to these awards is expected to be recognized over a period of approximately two years. The fair value of Class A common stock on the date of grant was $38 per share (or $0.30 per share after giving effect to the 127.1624-for-one stock split) or $0.4 million.
126
Restricted Class A Awards
On January 29, 2014 and February 20, 2014, the Company granted 7,193 and 3,749 shares of restricted Class A common stock, respectively (or 914,680 and 476,732 shares, respectively, after giving effect to the 127.1624-for-one stock split), to certain individuals under the Yieldco Plan.
The amount of stock compensation expense related to the Class A restricted common stock awards, which was recognized upon the completion of the IPO, was $0.4 million. The restriction of these awards expires over 18 months; however, the awards are not subject to forfeiture for any reason. There is no unrecognized stock compensation expense related to the restricted Class A common stock at December 31, 2014.
The following table summarizes restricted stock awards activity under the 2014 Plan for the year ended December 31, 2014, after giving effect to both the conversion of restricted Class C common stock to restricted Class A common stock on an 85.8661-for-one basis and the 127.1624-for-one Class A common stock split immediately prior to the completion of the IPO:
Number of RSAs Outstanding | Weighted Average Grant Date Fair Value Per Share | ||||||
Balance at January 1, 2014 | — | $ | — | ||||
Granted | 4,977,586 | $ | 1.11 | ||||
Forfeited | (101,019 | ) | $ | 0.68 | |||
Balance at December 31, 2014 | 4,876,567 | $ | 1.12 | ||||
On October 30, 2014, the Company modified the award of its former Chief Financial Officer, which resulted in the forfeiture of the existing award and granting of a new award. This modification increased the grant date fair value to $5.6 million, or $1.11 per share.
Restricted Stock Units
The following table presents information regarding outstanding RSUs as of December 31, 2014, and changes during the year ended December 31, 2014:
Number of RSUs Outstanding | Weighted Average Grant Date Fair Value Per Share | ||||||
Balance at January 1, 2014 | — | $ | — | ||||
Granted | 825,943 | $ | 27.37 | ||||
Balance at December 31, 2014 | 825,943 | $ | 27.37 | ||||
The Company measures the fair value of RSUs at the closing price of the Company's stock on the grant date and accounts for stock-based compensation by amortizing the fair value on a straight line basis over the related vesting period. The RSUs vest 25% on the first anniversary of the grant date, 25% on the second anniversary of the grant date, and 50% on the third anniversary of the grant date, subject to accelerated vesting upon certain events. Under certain circumstances upon a termination of employment, any unvested shares held by the terminated employee will be forfeited.
The amount of stock compensation expense related to RSUs was $2.3 million during the year ended December 31, 2014. As of December 31, 2014, $16.9 million of total unrecognized compensation cost related to RSUs is expected to be recognized over a period of approximately three years.
127
Options
The following table presents information regarding outstanding options as of December 31, 2014, and changes during the year ended December 31, 2014:
Number of Options Outstanding | Weighted Average Exercise Price Per Share | Aggregate Intrinsic Value (in thousands) | |||||||||
Balance at January 1, 2014 | — | $ | — | ||||||||
Granted | 150,000 | $ | 29.31 | ||||||||
Balance at December 31, 2014 | 150,000 | $ | 29.31 | $ | 236 | ||||||
Aggregate intrinsic value represents the value of the Company's closing stock price of $30.88 on the last trading date of the period in excess of the weighted-average exercise price multiplied by the number of options outstanding or exercisable.
The stock option award includes both a service and performance condition. The service condition tranche will vest in accordance with the anniversary date of the grant, with 25% vesting annually over the four year term of the option. The performance condition tranche will vest in 25% increments if the Company meets a 15% quarterly dividend payment growth rate measured from a base dividend amount of $0.2257. There is no proportionate or partial vesting of the performance tranche to the extent the Company pays a dividend that is less than or greater than the specified targets. Under certain circumstances upon a termination of employment, any unvested options help by the terminated employee will be forfeited.
The Company accounts for stock-based compensation related to stock options granted to employees by estimating the fair value of the stock-based awards using the Black-Scholes option pricing model. The fair value of the stock options granted are amortized over the applicable vesting period. The Black-Scholes option pricing model includes assumptions regarding dividend yields, expected volatility, expected option term, expected forfeiture rate and risk-free interest rates. The Company estimates expected volatility based on the historical volatility of comparable publicly traded companies for a period commensurate with the estimated expected option term.
As of December 31, 2014, our weighted average assumptions were as follows:
Year ended | |||
December 31, 2014 | |||
Risk-free interest rate | 1.42 | % | |
Expected volatility | 63 | % | |
Expected term (in years) | 4 | ||
Expected dividend yield | 3.7 | % | |
The amount of stock compensation expense related to options was inconsequential during the year ended December 31, 2014. As of December 31, 2014, $1.3 million of total unrecognized compensation cost related to options is expected to be recognized ratably over a period of approximately four years.
14. LOSS PER SHARE
Basic earnings (loss) per share is computed by dividing net income (loss) by the number of weighted-average Class A common shares outstanding during the period. Diluted earnings (loss) per share is computed using the weighted-average Class A common shares outstanding and, if dilutive, potential Class A common shares outstanding during the period. Potential Class A common shares represent the incremental Class A common shares issuable for restricted stock units and stock option exercises. The Company calculates the dilutive effect of outstanding restricted stock units and stock options on earnings (loss) per share by application of the treasury stock method. The computations of basic and diluted earnings (loss) per share ("EPS") assumes that the number of Class A common shares outstanding for all periods prior to the closing of the IPO on July 23, 2014 was equal to the historical number of shares outstanding during each period.
128
Weighted Average Number of Shares
Weighted average number of shares: | Year Ended December 31, 2014 | ||
Class A common stock - Basic and diluted | 29,602 | ||
Class A Common Stock
Basic and diluted earnings (loss) per share for the year ended December 31, 2014 was calculated as follows:
Year Ended December 31, 2014 | ||||||||
(In thousands, except per share amounts) | Basic | Diluted (1) | ||||||
EPS Numerator: | ||||||||
Net loss attributable to Class A Common stock shareholders | $ | (25,617 | ) | $ | (25,617 | ) | ||
EPS Denominator: | ||||||||
Weighted-average shares outstanding | 29,602 | 29,602 | ||||||
Loss per share | $ | (0.87 | ) | $ | (0.87 | ) | ||
———
(1) The computations for diluted earnings (loss) per share for the year ended December 31, 2014 excludes approximately 64.5 million shares of Class B common stock, 5.8 million shares of Class B1 common stock, 3.5 million of unvested RSAs, 0.8 million RSUs and 0.2 million options to purchase the Company's shares because the effect would have been anti-dilutive.
Follow-on Public Offering
On January 22, 2015, the Company completed the sale of a total of 13,800,000 shares of its Class A common stock to the public in a registered offering, including 1,800,000 shares sold pursuant to the underwriters' overallotment option.
15. NON-CONTROLLING INTERESTS
Non-controlling interests represent the portion of net assets in consolidated entities that are not owned by the Company. The following table presents the non-controlling interest balances by entity, reported in stockholders’ equity in the consolidated balance sheets as of December 31, 2014 and 2013:
As of December 31, | ||||||||
(in thousands) | 2014 | 2013 | ||||||
Non-controlling interests in Terra LLC: | ||||||||
SunEdison | $ | 722,342 | $ | — | ||||
Riverstone | 65,376 | — | ||||||
Total non-controlling interests in Terra LLC | $ | 787,718 | $ | — | ||||
Non-controlling interest in projects: | ||||||||
Nellis | $ | 1,394 | $ | — | ||||
CPI | 18,277 | 12,778 | ||||||
Regulus | 127,804 | — | ||||||
HES * | 787 | — | ||||||
Mt. Signal | 88,597 | — | ||||||
North Carolina Portfolio | 19,271 | — | ||||||
DG 2015 Portfolio 2 | 681 | — | ||||||
Total non-controlling interests in projects | $ | 256,811 | $ | 12,778 | ||||
Total non-controlling interests | $ | 1,044,529 | $ | 12,778 | ||||
129
The following table presents the redeemable non-controlling interest balance reported on the consolidated balance sheets as of December 31, 2014 and 2013:
(in thousands) | HES * | CD DG Portfolio * | Total | |||||||||
As of December 31, 2013 | $ | — | $ | — | $ | — | ||||||
Consolidation of redeemable non-controlling interests | 7,738 | 16,600 | 24,338 | |||||||||
As of December 31, 2014 | $ | 7,738 | $ | 16,600 | $ | 24,338 | ||||||
————
* | Amounts represent the preliminary values based on initial purchase price allocation. Amounts are subject to change when fair values at the acquisition date are determined. |
16. COMMITMENTS AND CONTINGENCIES
Contractual Obligations and Commercial Commitments
The Company have a variety of contractual obligations and other commercial commitments that represent prospective cash requirements. The following table summarizes our outstanding contractual obligations and commercial commitments as of December 31, 2014.
Contractual Cash Obligations (in thousands) | Rent | |||
2015 | $ | 12,999 | ||
2016 | 11,710 | |||
2017 | 11,000 | |||
2018 | 11,203 | |||
2019 | 11,454 | |||
Thereafter | 108,528 | |||
Total | $ | 166,894 | ||
Total rental expense was $1.0 million, $0.1 million and $0.0 million during the years ended December 31, 2014, 2013 and 2012, respectively.
Legal Proceedings
We are not a party to any legal proceedings other than legal proceedings arising in the ordinary course of our business. We are also a party to various administrative and regulatory proceedings that have arisen in the ordinary course of our business. Although we cannot predict with certainty the ultimate resolution of such proceedings or other claims asserted against us, we do not believe that any currently pending legal proceeding to which we are a party will have a material adverse effect on our business, financial condition or results of operations.
Daniel Gerber v. Wiltshire Council
On March 5, 2015, the UK High Court issued a verdict that quashed (nullified) the planning permission necessary to build the Company’s 11.2 MW Norrington solar generation facility in Wiltshire, England. The court found that, among other issues, the local Wiltshire council failed to properly notify a local landowner (the claimant) or notify the English historic preservation agency before granting the permission. U.K. counsel have advised us that the quashing of this planning permission deviates significantly from established case law. The Company has therefore decided to appeal this ruling and plans to assert a vigorous defense. At this time, the Company does not have enough information regarding the probable outcome or the estimated range of reasonably probable losses associated with this ruling, and as of December 31, 2014, no such accrual has been recorded in the consolidated financial statements. The solar generation facility was constructed by SunEdison pursuant to an engineering, procurement and construction agreement, under which SunEdison assumed development and construction risk. If the ultimate outcome of this case were unfavorable and no replacement permit could be obtained, the Company would therefore be able recover its investment in this project from SunEdison.
130
17. RELATED PARTIES
Corporate Allocations
General and administrative affiliate costs include amounts allocated from SunEdison for general corporate overhead costs attributable to the operations of the Predecessor through the completion of the IPO on July 23, 2014. Subsequent to the completion of the IPO, general and administrative affiliate costs represent costs incurred by SunEdison for services provided pursuant to the Management Services Agreement. General and administrative affiliate costs were $19.1 million during the year ended December 31, 2014, $5.2 million during the year ended December 31, 2013 and $4.4 million during the year ended December 31, 2012 . The general corporate overhead expenses incurred by SunEdison included costs from certain corporate and shared services functions provided by SunEdison. The amounts reflected included (i) charges that were incurred by SunEdison that were specifically identified as being attributable to the Predecessor and (ii) an allocation of applicable remaining general corporate overhead costs based on the proportional level of effort attributable to the operation of the Company’s solar generation facilities. These costs include legal, accounting, tax, treasury, information technology, insurance, employee benefit costs, communications, human resources, and procurement. Corporate costs that were specifically identifiable to a particular operation of SunEdison were allocated to that operation, including the Predecessor. Where specific identification of charges to a particular operation of SunEdison was not practicable, an allocation was applied to all remaining general corporate overhead costs. The allocation methodology for all remaining corporate overhead costs was based on management’s estimate of the proportional level of effort devoted by corporate resources that is attributable to each of the Company’s operations. The cost allocations were determined on a basis considered to be a reasonable reflection of all costs of doing business by the Predecessor. The amounts that would have been or will be incurred on a stand-alone basis could differ from the amounts allocated due to economies of scale, management judgment, or other factors.
Management Services Agreement
Immediately prior to the completion of the IPO on July 23, 2014, Terra LLC and Terra Operating LLC entered into the Management Services Agreement with SunEdison. Pursuant to the Management Services Agreement, SunEdison agreed to provide or arrange for other service providers to provide management and administrative services including legal, accounting, tax, treasury, information technology, insurance, employee benefit costs, communications, human resources, and procurement to the Company and its subsidiaries. As consideration for the services provided, the Company will pay SunEdison a base management fee as follows: (1) no fee for 2014, (ii) 2.5% of the Company's cash available for distribution in 2015, 2016, and 2017 (not to exceed $4.0 million in 2015, $7.0 million in 2016 or $9.0 million in 2017), and (iii) an amount equal to SunEdison's or other service provider's actual cost in 2018 and thereafter.
There was no cash consideration paid to SunEdison for these services for the period from July 24, 2014 through December 31, 2014. Total actual costs for these services during the period from July 24, 2014 to December 31, 2014 of $17.5 million is reflected in the consolidated statement of operations as part of general and administrative affiliate costs and have been treated as an equity contribution from SunEdison.
Interest Payment Agreement
Immediately prior to the completion of the IPO on July 23, 2014, Terra LLC and Terra Operating LLC entered into an interest payment agreement (the "Interest Payment Agreement") with SunEdison and its wholly owned subsidiary, SunEdison Holdings Corporation, pursuant to which SunEdison will pay all of the scheduled interest on the Term Loan through the third anniversary of Terra LLC and Terra Operating LLC entering into the Term Loan, up to an aggregate of $48.0 million over such period (plus any interest due on any payment not remitted when due). Interest expense incurred under the term loan is reflected in the consolidated statement of operations and the reimbursement for such costs is treated as an equity contribution in additional paid-in capital from SunEdison. During the period from July 24, 2014 to December 31, 2014, the Company received $5.4 million equity contribution from SunEdison pursuant to the Interest Payment Agreement. There were no amounts outstanding as of December 31, 2014.
On January 23, 2015, the Interest Payment Agreement between Terra LLC, Terra Operating LLC, and SunEdison, Inc. was amended and restated. SunEdison agreed to provide support with respect to the interest payment obligations of Terra Operating LLC with respect to its $800.0 million aggregate principal amount of 5.875% Senior Notes due 2023 under the Indenture, dated January 28, 2015.
131
Incentive Revenue
Certain solar renewable energy certificates ("SRECs") are sold to SunEdison under contractual arrangements at fixed prices. Revenue from the sale of SRECs to affiliates was $1.1 million during the year ended December 31, 2014 , $0.9 million during the year ended December 31, 2013 and $1.6 million during the year ended December 31, 2012 and are reported as operating revenues, net in the consolidated statements of operations.
Operations and Maintenance
Operations and maintenance services are provided to the Company by affiliates of SunEdison pursuant to contractual agreements. Costs incurred for these services were $7.9 million for the year ended December 31, 2014 , $0.9 million during the year ended December 31, 2013, and $0.7 million during the year ended December 31, 2012 and are reported as cost of operations-affiliates in the consolidated statements of operations.
SunEdison and Affiliates
Certain of the Company's expenses and capital expenditures related to construction in process are paid by affiliates of SunEdison and are reimbursed by the Company to the same, or other affiliates of SunEdison. As of December 31, 2014 SunEdison and affiliates owed the Company $19.6 million, which is reported is reported as Due from SunEdison and affiliates in the consolidated balance sheets. As of December 31, 2013, the Company owed SunEdison and affiliates $82.1 million, which is reported as Due to SunEdison and affiliates in the consolidated balance sheets.
Incentive Distribution Rights
Incentive Distribution Rights ("IDRs") represent the right to receive increasing percentages (15.0%, 25.0% and 50.0%) of Terra LLC’s quarterly distributions after the Class A Units, Class B units, and Class B1 units of Terra LLC have received quarterly distributions in an amount equal to $0.2257 per unit (the "Minimum Quarterly Distribution") and the target distribution levels have been achieved. Upon the completion of the IPO, SunEdison holds 100% of the IDRs.
Initial IDR Structure
If for any quarter:
• | Terra LLC has made cash distributions to the holders of its Class A units, Class B1 units and, subject to the Distribution Forbearance Provisions, Class B units in an amount equal to the Minimum Quarterly Distribution; and |
• | Terra LLC has distributed cash to holders of Class A units and holders of Class B1 units in an amount necessary to eliminate any arrearages in payment of the Minimum Quarterly Distribution; |
then Terra LLC will make additional cash distributions for that quarter among holders of its Class A units, Class B units, Class B1 units and the IDRs in the following manner:
• | first, to all holders of Class A units, Class B1 units and, subject to the Distribution Forbearance Provisions, Class B units, pro rata, until each holder receives a total of $0.3386 per unit for that quarter (the “First Target Distribution”) (150.0% of the Minimum Quarterly Distribution); |
• | second, 85.0% to all holders of Class A units, Class B1 units and, subject to the Distribution Forbearance Provisions, Class B units, pro rata, and 15.0% to the holders of the IDRs, until each holder of Class A units, Class B1 units and, subject to the Distribution Forbearance Provisions, Class B units receives a total of $0.3950 per unit for that quarter (the “Second Target Distribution”) (175.0% of the Minimum Quarterly Distribution); |
• | third, 75.0% to all holders of Class A units, Class B1 units and, subject to the Distribution Forbearance Provisions, Class B units, pro rata, and 25.0% to the holders of the IDRs, until each holder of Class A units, Class B1 units and, subject to the Distribution Forbearance Provisions, Class B units receives a total of $0.4514 per unit for that quarter (the “Third Target Distribution”) (200.0% of the Minimum Quarterly Distribution); and |
• | thereafter, 50.0% to all holders of Class A units, Class B1 units and, subject to the Distribution Forbearance Provisions, Class B units, pro rata, and 50.0% to the holders of the IDRs. |
Support Agreement
The Company entered into a project support agreement with SunEdison (the "Support Agreement"), which provides us the option to purchase additional solar projects from SunEdison in 2015 and 2016. The Support Agreement also provides us a right of first offer with respect to certain other projects.
132
18. SEGMENT REPORTING
The Company has one reportable segment, Solar Energy, that includes our entire portfolio of solar generation facility assets, determined based on the “management” approach. This approach designates the internal reporting used by management for making decisions and assessing performance as the source of the reportable segments. Corporate expenses include general and administrative expenses, acquisition costs, formation and offering related fees and expenses, interest expense on corporate indebtedness and stock-based compensation. All operating revenues, net for the year ended December 31, 2014 were earned by our reportable segment from external customers in the United States and its unincorporated territories, Canada, the United Kingdom and Chile. All operating revenue for the years ended December 31, 2013 and 2012 were from customers located in the United States and Puerto Rico.
The following table reflects summarized financial information concerning the Company’s reportable segment for the years ended December 31, 2014, 2013 and 2012:
Year Ended | Year Ended | Year Ended | ||||||||||||||||||||||||||||
December 31, 2014 | December 31, 2013 | December 31, 2012 | ||||||||||||||||||||||||||||
(In thousands) | Solar Energy | Corporate | Total | Solar Energy | Corporate | Total | Solar Energy | Corporate | Total | |||||||||||||||||||||
Operating revenues, net | $ | 125,864 | $ | — | $ | 125,864 | $ | 17,469 | $ | — | $ | 17,469 | $ | 15,694 | $ | — | $ | 15,694 | ||||||||||||
Depreciation, accretion and amortization | 40,509 | — | 40,509 | 4,961 | — | 4,961 | 4,267 | — | 4,267 | |||||||||||||||||||||
Other operating costs and expenses | 33,076 | 46,165 | 79,241 | 7,382 | — | 7,382 | 6,119 | — | 6,119 | |||||||||||||||||||||
Interest expense, net | 54,246 | 30,172 | 84,418 | 6,267 | — | 6,267 | 5,702 | — | 5,702 | |||||||||||||||||||||
Other non-operating expense (income) | (6,209 | ) | 13,019 | 6,810 | (771 | ) | — | (771 | ) | — | — | — | ||||||||||||||||||
Income tax benefit (1) | — | (4,689 | ) | (4,689 | ) | — | (88 | ) | (88 | ) | — | (1,270 | ) | (1,270 | ) | |||||||||||||||
Net (loss) income | $ | 4,242 | $ | (84,667 | ) | $ | (80,425 | ) | $ | (370 | ) | $ | 88 | $ | (282 | ) | $ | (394 | ) | $ | 1,270 | $ | 876 | |||||||
Balance Sheet | ||||||||||||||||||||||||||||||
Capital expenditures | $ | 816,682 | $ | — | $ | 816,682 | $ | 205,361 | $ | — | $ | 205,361 | $ | 2,274 | $ | — | $ | 2,274 | ||||||||||||
Total assets (2) | $ | 2,863,848 | $ | 514,170 | $ | 3,378,018 | $ | 566,877 | $ | — | $ | 566,877 | $ | 158,955 | $ | — | $ | 158,955 | ||||||||||||
———
(1) Income tax benefit is not allocated to the Company's Solar Energy segment.
(2) Corporate assets include cash and cash equivalents; other current assets; deferred financing costs, net and other assets.
133
Operating Revenues, net
The following table reflects operating revenues, net for the years ended December 31, 2014, 2013 and 2012 by specific customers exceeding 10% of total operating revenue:
Year Ended | |||||||||||||||
December 31, 2014 | December 31, 2013 | December 31, 2012 | |||||||||||||
(In thousands, except for percentages) | Amount | Percentage | Amount | Percentage | Amount | Percentage | |||||||||
San Diego Gas & Electric | $ | 39,574 | 31.4% | ** | ** | ** | ** | ||||||||
Compania Minera del Pacifico | 23,130 | 18.4 | ** | ** | ** | ** | |||||||||
Customer A | * | * | $ | 4,196 | 24.0% | $ | 4,207 | 26.8% | |||||||
Customer B | * | * | 1,761 | 10.1 | 1,831 | 11.7 | |||||||||
Customer C | * | * | 1,726 | 10.0 | 1,760 | 11.2 | |||||||||
———
* These customers did not exceed 10% of total operating revenue for the year ended December 31, 2014.
** No revenue was earned from these customers for the years ended December 31, 2013 and 2012.
The following table reflects operating revenues, net for the years ended December 31, 2014, 2013 and 2012 by geographic location:
Year Ended | ||||||||||
(In thousands) | December 31, 2014 | December 31, 2013 | December 31, 2012 | |||||||
United States and Puerto Rico | $ | 86,210 | $ | 17,469 | $ | 15,694 | ||||
Chile | 23,130 | — | — | |||||||
United Kingdom | 15,890 | — | — | |||||||
Canada | 634 | — | — | |||||||
Total Operating Revenues, net | $ | 125,864 | $ | 17,469 | $ | 15,694 | ||||
Long-lived Assets, Net
Long-lived assets consist of property and equipment, net and intangible assets, net all of which are attributable to the Company's one reportable segment. The following table is a summary of long-lived assets by geographic area:
As of December 31, 2014 | As of December 31, 2013 | |||||||
(In thousands) | ||||||||
United States and Puerto Rico | $ | 2,053,483 | $ | 250,927 | ||||
Chile | 189,221 | 167,313 | ||||||
United Kingdom | 319,833 | 10,804 | ||||||
Canada | 126,939 | 912 | ||||||
Total long-lived assets, net | 2,689,476 | 429,956 | ||||||
Current assets | 612,404 | 106,358 | ||||||
Other non-current assets | 76,138 | 30,563 | ||||||
Total assets | $ | 3,378,018 | $ | 566,877 | ||||
134
19. OTHER COMPREHENSIVE INCOME (LOSS)
Comprehensive income (loss) represents a measure of all changes in equity that result from recognized transactions and other economic events other than transactions with owners in their capacity as owners. Other comprehensive income (loss) includes foreign currency translations and gains (losses) on hedging instruments.
The following table presents the changes in each component of accumulated other comprehensive loss, net of tax:
(In thousands) | Foreign Currency Translation Adjustments | Hedging Activities | Accumulated Other Comprehensive Loss | |||||||||
Balance, December 31, 2013 | $ | — | $ | — | $ | — | ||||||
Other comprehensive loss before reclassifications | (3,541 | ) | (1,925 | ) | (5,466 | ) | ||||||
Amounts reclassified from accumulated other comprehensive loss | — | — | — | |||||||||
Net other comprehensive loss | (3,541 | ) | (1,925 | ) | (5,466 | ) | ||||||
Less: other comprehensive loss attributable to non-controlling interests | (2,392 | ) | (1,437 | ) | (3,829 | ) | ||||||
Balance, December 31, 2014 | $ | (1,149 | ) | $ | (488 | ) | $ | (1,637 | ) | |||
The following table presents the changes in each component of accumulated other comprehensive loss and the related tax effects for the year ended December 31, 2014:
(In thousands) | Before Tax | Tax Effect | Net of Tax | |||||||||
Foreign currency translation adjustments | $ | (3,541 | ) | $ | — | $ | (3,541 | ) | ||||
Unrealized loss on hedging instruments | (1,925 | ) | — | (1,925 | ) | |||||||
Other comprehensive loss | $ | (5,466 | ) | $ | — | $ | (5,466 | ) | ||||
Less: other comprehensive loss attributable to non-controlling interests, net of tax | (3,829 | ) | ||||||||||
Other comprehensive loss attributable to TerraForm Power, Inc. Class A stockholders | $ | (1,637 | ) | |||||||||
20. QUARTERLY FINANCIAL INFORMATION (UNAUDITED)
Quarterly results of operations for the year ended December 31, 2014 were as follows:
(in thousands, except per share data) | Q1 | Q2 | Q3 | Q4 | ||||||||||||
Operating revenues, net | $ | 8,109 | $ | 21,968 | $ | 53,221 | $ | 42,566 | ||||||||
Operating income | 2,244 | 8,236 | 20,491 | (24,857 | ) | |||||||||||
Interest expense, net | 6,580 | 24,171 | 22,466 | 31,201 | ||||||||||||
Net loss | (3,374 | ) | (13,143 | ) | (1,521 | ) | (62,387 | ) | ||||||||
Net loss attributable to TerraForm Power, Inc. Class A common stockholders subsequent to initial public offering | N/A | N/A | (4,014 | ) | (21,603 | ) | ||||||||||
Other Comprehensive Income | — | 573 | (3,648 | ) | (2,391 | ) | ||||||||||
Weighted average Class A common shares outstanding - basic and diluted | N/A | N/A | 27,066 | 31,505 | ||||||||||||
Net earnings (loss) per weighted average Class A common share - basic and diluted | N/A | N/A | $ | (0.15 | ) | $ | (0.69 | ) | ||||||||
135
Quarterly results of operations for the year ended December 31, 2013 were as follows:
(in thousands, except per share data) | Q1 | Q2 | Q3 | Q4 | ||||||||||||
Operating revenues, net | $ | 2,975 | $ | 4,663 | $ | 5,401 | $ | 4,430 | ||||||||
Operating income | 432 | 2,033 | 2,114 | 547 | ||||||||||||
Interest expense, net | 1,374 | 1,378 | 1,963 | 1,552 | ||||||||||||
Net income (loss) | (491 | ) | 341 | 74 | (206 | ) | ||||||||||
136
EXHIBIT INDEX
Exhibit Number | Description | |
3.1(b) | Amended and Restated Certificate of Incorporation of TerraForm Power, Inc. | |
3.2(b) | Amended and Restated Bylaws of TerraForm Power, Inc. | |
4.1(a) | Specimen Class A Common Stock Certificate. | |
4.2(b) | Amended and Restated Operating Agreement of Terra LLC. | |
4.3(d) | First Amendment, dated as of December 3, 2014, to the Amended and Restated Operating Agreement of Terra LLC. | |
10.1(d) | Management Services Agreement by and between Terra LLC and SunEdison, Inc. | |
10.2(b) | Project Support Agreement by and between TerraForm Power, Inc. and SunEdison, Inc. | |
10.3(b) | Repowering Services ROFR Agreement by and between TerraForm Power, Inc., Terra LLC, Terra Operating LLC and SunEdison, Inc. | |
10.4(b) | Interest Payment Agreement by and between Terra LLC, Terra Operating LLC, SunEdison, Inc. and SunEdison Holdings Corporation. | |
10.5(b) | Exchange Agreement by and among TerraForm Power, Inc., Terra LLC and SunEdison Inc. | |
10.6(b) | Exchange Agreement by and among TerraForm Power, Inc., Terra LLC and R/C US Solar Investment Partnership, L.P. | |
10.7(b) | Registration Rights Agreement by and between TerraForm Power, Inc. and SunEdison, Inc. | |
10.8(b) | Registration Rights Agreement by and between TerraForm Power, Inc. and R/C US Solar Investment Partnership, L.P. | |
10.9(c) | Registration Rights Agreement, dated November 26, 2014, by and between TerraForm Power, Inc. and the purchasers of the shares party thereto. | |
10.10(a) | Form of Indemnification Agreement between TerraForm Power, Inc. and its directors and officers. | |
10.11(a) | Investment Agreement, dated as of March 28, 2014, by and among Terra LLC, Terra Operating LLC and SunEdison, Inc. | |
10.12†(a) | SunEdison Yieldco, Inc. 2014 Second Amended and Restated Long-Term Incentive Plan. | |
10.13(a) | Common Stock Purchase Agreement, dated as of July 3, 2014, by and among TerraForm Power, Inc. and Altai Capital Master Fund, Ltd. | |
10.14(a) | Common Stock Purchase Agreement, dated as of July 3, 2014, by and among TerraForm Power, Inc. and Everstream Opportunities Fund I, LLC. | |
10.15(b) | Mt. Signal Contribution Agreement by and among TerraForm Power, Inc., Terra LLC and Silver Ridge Power. | |
10.16(b) | Letter Agreement Regarding the Call Right Assets, between TerraForm Power, Inc. and SunEdison, Inc. | |
10.17(d) | Purchase and Sale Agreement, dated October 29, 2014, by and between TerraForm CD Holdings Corporation, TerraForm CD Holdings GP, LLC, TerraForm CD Holdings, LLC and the other parties thereto. | |
10.18(d) | First Amendment, dated as of December 18, 2014, to Purchase and Sale Agreement, dated October 29, 2014, by and between TerraForm CD Holdings Corporation, TerraForm CD Holdings GP, LLC, TerraForm CD Holdings, LLC and the other parties thereto. | |
137
Exhibit Number | Description | |
10.19(d) | Purchase and Sale Agreement, dated November 17, 2014, by and between Terra LLC, TerraForm Power, Inc., First Wind Holdings, LLC, First Wind Capital, LLC, SunEdison, Inc. and the other parties thereto. | |
10.20(d) | Intercompany Agreement, dated November 17, 2014, by and between Terra LLC, SunEdison, Inc. and SunEdison Holdings Corporation. | |
10.21†(a) | Form of Restricted Stock Unit Award Agreement for employees. | |
10.22†(a) | Form of Restricted Stock Unit Award Agreement for directors. | |
10.23(b) | First Amendment to the Purchase and Sale Agreement, dated as of January 28, 2015, among SunEdison, Inc., TerraForm Power, LLC and D. E. Shaw Composite Holdings, L.L.C. and Madison Dearborn Capital Partners IV, L.P., acting jointly, solely in their capacity as the representative of the sellers. | |
10.24(e) | Indenture, dated as of January 28, 2015, among Terra Operating LLC, the guarantors party thereto and U.S. Bank National Association, as trustee. | |
10.25(e) | Credit and Guaranty Agreement, dated as of January 28, 2015, among Terra Operating LLC, as borrower, Terra LLC, as a guarantor, certain subsidiaries of Terra Operating LLC, as guarantors, the lenders party thereto from time to time, and Barclays Bank PLC, as administrative agent and collateral agent. | |
10.26(e) | Registration Rights Agreement, dated as of January 29, 2015, among TerraForm Power, Inc., SunEdison, Inc., the holders of the Registrable Securities party thereto and Wilmington Trust, National Association, as collateral agent. | |
10.27(e) | Amended and Restated Interest Payment Agreement, dated as of January 28, 2015, by and among Terra LLC, Terra Operating LLC, SunEdison, Inc. and SunEdison Holdings Corporation. | |
21.1 (d) | List of subsidiaries of TerraForm Power, Inc. | |
24.1(e) | Power of Attorney | |
31.1 | Certification by the Chief Executive Officer of TerraForm Power, Inc. pursuant to Section 302 of the Sarbanes-Oxley Act of 2002 | |
31.2 | Certification by the Chief Financial Officer of TerraForm Power, Inc. pursuant to Section 302 of the Sarbanes-Oxley Act of 2002 | |
32 | Certification by the Chief Executive Officer and the Chief Financial Officer of TerraForm Power, Inc. pursuant to Section 906 of the Sarbanes-Oxley Act of 2002 | |
101.INS | XBRL Instance Document | |
101.SCH | XBRL Taxonomy Extension Schema Document | |
101.CAL | XBRL Taxonomy Extension Calculation Linkbase Document | |
101.DEF | XBRL Taxonomy Extension Definition Linkbase Document | |
101.LAB | XBRL Taxonomy Extension Label Linkbase Document | |
101.PRE | XBRL Taxonomy Extension Presentation Linkbase Document | |
——————
* To be filed by amendment.
† Indicates exhibits that constitute compensatory plans or arrangements.
(a) Incorporated by reference to our Registration Statement on Form S-1, File No. 333-196345.
(b) Incorporated by reference to our Current Report on Form 8-K, filed on July 25, 2014.
(c) Incorporated by reference to our Current Report on Form 8-K, filed on November 26, 2014.
(d) Incorporated by reference to our Registration Statement on Form S-1, File No. 333-200830.
(e) Incorporated by reference to our Current Report on Form 8-K, filed on February 3, 2015.
138
SIGNATURES
Pursuant to the requirements of Section 13 or 15(d) of the Securities Exchange Act of 1934, the registrant has duly caused this report to be signed on its behalf by the undersigned, thereunto duly authorized.
TERRAFORM POWER, INC. | ||||||
By: | /S/ CARLOS DOMENECH ZORNOZA | |||||
Date: | March 13, 2015 | Name: | Carlos Domenech Zornoza | |||
Title: | President, Chief Executive Officer and Director | |||||
Pursuant to the requirements of the Securities Exchange Act of 1934, this report has been signed below by the following persons on behalf of the registrant and in the capacities and on the dates indicated.
Signature | Title | Date | ||
/s/ CARLOS DOMENECH ZORNOZA | President, Chief Executive Officer and Director | March 13, 2015 | ||
Carlos Domenech Zornoza | (Principal executive officer) | |||
/s/ ALEJANDRO HERNANDEZ | Executive Vice President and Chief Financial Officer | March 13, 2015 | ||
Alejandro Hernandez | (Principal financial officer) | |||
/s/ FRANCISCO “PANCHO” PEREZ-GUNDIN | Chief Operating Officer and Director | March 13, 2015 | ||
Francisco “Pancho” Perez-Gundin | ||||
/s/ AHMAD CHATILA | Chairman of the Board | March 13, 2015 | ||
Ahmad Chatila | ||||
/s/ BRIAN WUEBBELS | Director | March 13, 2015 | ||
Brian Wuebbels | ||||
/s/ STEVEN TESORIERE | Director | March 13, 2015 | ||
Steven Tesoriere | ||||
/s/ MARTIN TRUONG | Director | March 13, 2015 | ||
Martin Truong | ||||
/s/ MARK LERDAL | Director | March 13, 2015 | ||
Mark Lerdal | ||||
/s/ MARK FLORIAN | Director | March 13, 2015 | ||
Mark Florian | ||||
/s/ HANIF “WALLY” DAHYA | Director | March 13, 2015 | ||
Hanif “Wally” Dahya | ||||
139