Attached files
| file | filename |
|---|---|
| EX-21.1 - EX-21.1 - TELECOMMUNICATION SYSTEMS INC /FA/ | tsys-ex211_2014123112.htm |
| EXCEL - IDEA: XBRL DOCUMENT - TELECOMMUNICATION SYSTEMS INC /FA/ | Financial_Report.xls |
| EX-32.2 - EX-32.2 - TELECOMMUNICATION SYSTEMS INC /FA/ | tsys-ex322_201412316.htm |
| EX-31.2 - EX-31.2 - TELECOMMUNICATION SYSTEMS INC /FA/ | tsys-ex312_2014123111.htm |
| EX-32.1 - EX-32.1 - TELECOMMUNICATION SYSTEMS INC /FA/ | tsys-ex321_2014123110.htm |
| EX-31.1 - EX-31.1 - TELECOMMUNICATION SYSTEMS INC /FA/ | tsys-ex311_2014123114.htm |
| EX-23.1 - EX-23.1 - TELECOMMUNICATION SYSTEMS INC /FA/ | tsys-ex231_201412318.htm |
SECURITIES AND EXCHANGE COMMISSION
WASHINGTON, D.C. 20549
FORM 10-K
(Mark One)
|
þ |
ANNUAL REPORT PURSUANT TO SECTION 13 OR 15(d) OF THE SECURITIES EXCHANGE ACT OF 1934 |
For the year ended December 31, 2014
OR
|
¨ |
TRANSITION REPORT PURSUANT TO SECTION 13 OR 15(d) OF THE SECURITIES EXCHANGE ACT OF 1934 |
Commission File No. 0-30821
TELECOMMUNICATION SYSTEMS, INC.
(Exact name of registrant as specified in its charter)
|
Maryland |
|
52-1526369 |
|
(State or Other Jurisdiction of Incorporation or Organization) |
|
(I.R.S. Employer Identification No.) |
|
|
|
|
|
275 West Street, Annapolis, MD |
|
21401 |
|
(Address of principal executive offices) |
|
(Zip Code) |
(410) 263-7616
(Registrant’s telephone number, including area code)
Securities registered pursuant to Section 12(b) of the Act: None.
Securities registered pursuant to Section 12(g) of the Act: Class A Common Stock, Par Value $0.01 per share
Indicate by check mark if the registrant is a well-known seasoned issuer, as defined in Rule 405 of the Securities Act: Yes ¨ No þ
Indicate by check mark if the registrant is not required to file reports pursuant to Section 13 or Section 15(d) of the Act: Yes ¨ No þ
Indicate by check mark whether the registrant (1) has filed all reports required to be filed by Section 13 or 15(d) of the Securities Exchange Act of 1934 during the preceding 12 months (or for such shorter period that the registrant was required to file such reports) and (2) has been subject to such filing requirements for the past 90 days: Yes þ No ¨
Indicate by check mark whether the registrant has submitted electronically and posted on its corporate Web site, if any, every Interactive Data File required to be submitted and posted pursuant to Rule 405 of Regulation S-T during the preceding 12 months (or for such shorter period that the registrant was required to submit and post such files). Yes þ No ¨
Indicate by check mark if disclosure of delinquent filers pursuant to Item 405 of Regulation S-K is not contained herein, and will not be contained, to the best of registrant’s knowledge, in definitive proxy or information statements incorporated by reference in Part III of this Form 10-K or any amendment to this Form 10-K. ¨
Indicate by check mark whether the registrant is a large accelerated filer, an accelerated filer, or a non-accelerated filer.
|
Large accelerated filer ¨ |
|
Accelerated filer þ |
|
Non-accelerated filer ¨ |
|
Smaller reporting company ¨ |
Indicate by check mark whether the registrant is a shell company (as defined in rule 12b-2 of the Act): Yes ¨ No þ
As of June 30, 2014, the aggregate market value of the Class A Common Stock held by non-affiliates, as reported on the NASDAQ Global Market, was approximately $155,083,244.*
As of March 5, 2015 there were 55,862,326 shares of Class A Common Stock and 4,801,245 shares of Class B Common Stock outstanding.
DOCUMENTS INCORPORATED BY REFERENCE
|
Document |
|
Part of 10-K into which incorporated |
|
Portions of the registrant’s Proxy Statement for the Annual Meeting of Stockholders to be held May 28, 2015 |
|
Part III |
* Excludes 7,388,941 shares of Class A Common Stock and 4,997,769 shares of Class B Common Stock deemed to be held by stockholders whose ownership exceeds ten percent of the shares outstanding at June 30, 2014. Exclusion of shares held by any person should not be construed to indicate that such person possesses the power, direct or indirect, to direct or cause the direction of the management or policies of the registrant, or that such person is controlled by or under common control with the registrant.
TABLE OF CONTENTS
|
|
|
|
|
Page |
|
|
Part I |
|
|
|
||
|
Item 1 |
|
|
|
5 |
|
|
Item 1A |
|
|
|
11 |
|
|
Item 1B |
|
|
|
24 |
|
|
Item 2 |
|
|
|
24 |
|
|
Item 3 |
|
|
|
25 |
|
|
Item 4 |
|
|
|
25 |
|
|
Part II |
|
|
|
||
|
Item 5 |
|
|
|
26 |
|
|
Item 6 |
|
|
|
27 |
|
|
Item 7 |
|
Management’s Discussion and Analysis of Financial Condition and Results of Operations |
|
|
29 |
|
Item 7A |
|
|
|
46 |
|
|
Item 8 |
|
|
|
46 |
|
|
Item 9 |
|
Changes In and Disagreements With Accountants on Accounting and Financial Disclosure |
|
|
46 |
|
Item 9A |
|
|
|
46 |
|
|
Part III |
|
|
|
||
|
Item 10 |
|
|
|
49 |
|
|
Item 11 |
|
|
|
49 |
|
|
Item 12 |
|
Security Ownership of Certain Beneficial Owners and Management |
|
|
49 |
|
Item 13 |
|
Certain Relationships and Related Transactions and Director Independence |
|
|
49 |
|
Item 14 |
|
|
|
49 |
|
|
Part IV |
|
|
|
||
|
Item 15 |
|
|
|
50 |
|
|
|
|
51 |
|||
|
|
|
52 |
|||
|
|
F– |
1 |
|||
2
Cautionary Note Concerning Factors That May Affect Future Results
This document contains forward-looking statements within the meaning of Section 27A of the Securities Act of 1933, as amended (the “Securities Act”), and Section 21E of the Securities Exchange Act of 1934, as amended (the “Exchange Act”). Forward-looking statements are statements other than historical information or statements of current condition. We generally identify forward-looking statements by the use of terms such as “believe”, “intend”, “expect”, “may”, “should”, “plan”, “project”, “contemplate”, “anticipate”, or other similar statements. Examples of forward looking statements in this Annual Report on Form 10-K include, but are not limited to statements that
|
(i) |
we intend to continue to selectively consider acquisitions of companies and technologies in order to increase the scale and scope of our operations, market presence, products, services and customer base and that could enhance both our business segments; |
|
(ii) |
we intend to expand our domestic and international carrier base through channels and by re-deploying our direct sales and field support organizations; |
|
(iii) |
we intend to expand our adaptation of our technology for device platform and other non-carrier customers and our penetration of such customers; |
|
(iv) |
we intend to retain any future earnings to fund the business and do not currently anticipate paying any cash dividends in the foreseeable future; |
|
(v) |
we believe that our expertise in the areas of 9-1-1, location-based and messaging services, and secure satellite communications can be leveraged to provide the needed wireless infrastructure for the U.S. Departments of Homeland Security and Commerce, and we are pursuing opportunities to provide such products and services; |
|
(vi) |
we believe we have invented to enable key features of the location services, wireless text alerts, Short Message Service Center, mobile-originated data and E9-1-1 network software; |
|
(vii) |
we believe relations with our employees are good; |
|
(viii) |
we believe our technology does not infringe the cited patents and due to specific clauses within the customer contractual arrangements that may or may not give rise to an indemnification obligation, and that we believe we should not incur any material liabilities from customer indemnification requests; |
|
(ix) |
we believe the assumptions and estimates we have made regarding our valuation of certain of the intangible assets are reasonable and that unanticipated events and circumstances may occur which may affect the accuracy or validity of such assumptions, estimates or actual results; |
|
(x) |
that we believe our capitalized research and development expense will be recoverable from future gross profits generated by the related products; |
|
(xi) |
we believe we can fund our future acquisitions with our internally available cash, cash equivalents and marketable securities, cash generated from operations, amounts available under our existing debt capacity, additional borrowings or from the issuance of additional securities; |
|
(xii) |
we believe we have sufficient capital resources including cash generated from operations as well as cash on hand to meet our anticipated cash operating expenses, working capital and capital expenditure and debt services needs for the next twelve months; |
|
(xiii) |
we expect our deployable communication system terminals will be provided more broadly in the U.S. military; |
|
(xiv) |
steep growth in spending to the multi-billion dollar level by U.S. federal agencies on cyber initiatives are expected over the next five years; |
|
(xv) |
while we expect our revenue from messaging to continue declining, text messaging continues to be the most popular type of messaging for mobile users; |
|
(xvi) |
we expect that we will continue to compete primarily on the basis of the functionality, breadth, time to market, ease of integration, price, and quality of our products and services, as well as our market experience, reputation, and price; |
|
(xvii) |
we expect to realize revenue from our backlog; |
|
(xviii) |
a sustained, significant decline in the Company’s stock price and market capitalization, a decline in the Company’s expected future cash flows, a significant adverse change in legal factors or in the business climate, unanticipated competition, and/or slower growth, among others, may indicate an impairment of our goodwill; |
|
(xix) |
our methods used to value our goodwill and long-lived assets and our exercise of significant judgment in those matters are reasonable; |
3
|
(xx) |
our estimated amounts of future non-cash stock compensation are reasonable or appropriate; |
|
(xxi) |
our assumptions and expectations related to income taxes and deferred tax assets are appropriate; |
|
(xxii) |
our expectations relating to our R&D spending are reasonable and appropriate; |
|
(xxiii) |
we do not expect that the adoption of new accounting standards to have a material impact on the company’s financial statements; |
|
(xxiv) |
our expectations with regard to our senior credit facility, notes and notes hedge transactions are reasonable; |
|
(xxv) |
we plan to provide technology solutions to a broadening body of U.S. federal, state and local, and international government customers; |
|
(xxvi) |
our approaches to monetization of our patent portfolios and intellectual property will generate a material return; |
|
(xxvii) |
our reliance on particular levels of U.S. government spending on our communication solutions and our backlog depends in a large part on continued funding by the U.S. government for the programs in which we are involved. A decrease in expenditures, the elimination or curtailment of a material program in which we are involved, the expiration of a contracting vehicle or changes in payment patterns of our customers as a result of changes in U.S. government spending, could have a material adverse effect on our operating results, financial condition, and/or cash flows; |
|
(xxviii) |
we continue to develop and sell software and engineered systems which we deliver through deployment in customer wireless networks, through hosted and subscription business models, and fee for service contracts; |
|
(xxix) |
we are well positioned to provide carrier-branded enhanced services that efficiently use the carriers’ capacity to deliver a user experience that merits incremental service payments and continuous use; |
|
(xxx) |
we are actively pursuing Next Generation 9-1-1 business; |
|
(xxxi) |
we are developing relationships with communication infrastructure providers in order to expand our sales channels for our carrier software products and services; |
|
(xxxii) |
we will continue to develop network software for wireless carriers and cable operators that operate on all major types of networks; |
|
(xxxiii) |
we are selectively addressing vertical markets including mobile medicine and connected car applications using our software and company expertise and our intention to expand our penetration of such customers; |
|
(xxxiv) |
we are proficient in recruiting and developing cyber professionals and our Art of Exploitation training is based on intellectual property developed by the company to support cybersecurity initiatives and the training covers a clear set of leading cyber methodologies to produce a certified cyber scientist; |
|
(xxxv) |
TCS continues to submit proposals to participate in large government procurement vehicles; |
|
(xxxvi) |
foreign patent rights may or may not be available or pursued in any technology area for which U.S. patent applications have been filed; |
|
(xxxvii) |
we have limited exposure to financial market risks, including changes in interest rates; and |
|
(xxxviii) |
we believe that our disclosure controls and procedures were effective to provide reasonable assurance that information we are required to disclose in reports we file or submit under the Exchange Act is recorded, processed, summarized and reported within the time periods specified in the applicable rules and forms, and that it is accumulated and communicated to our management as appropriate to allow timely decisions regarding required disclosures. |
Other such statements include without limitation risks and uncertainties relating to our financial results and our ability to (i) continue to rely on our customers and other third parties to provide additional products and services that create a demand for our products and services, (ii) conduct our business in foreign countries, (iii) adapt and integrate new technologies into our products, (iv) develop software without any errors or defects, (v) protect our intellectual property rights, (vi) implement our business strategy, (vii) realize backlog, (viii) compete with small business competitors, (ix) effectively manage our counter party risks, and (x) achieve continued revenue growth in the foreseeable future in certain of our business lines. This list should not be considered exhaustive.
These forward-looking statements relate to our plans, objectives and expectations for future operations. We base these statements on our beliefs as well as assumptions made using information currently available to us. In light of the risks and uncertainties inherent in all projected operational matters, the inclusion of forward-looking statements in this document should not be regarded as a representation by us or any other person that our objectives or plans will be achieved or that any of our operating
4
expectations will be realized. Revenues, results of operations, and other matters are difficult to forecast and could differ materially from those projected in the forward-looking statements contained in this Annual Report on Form 10-K as a result of factors discussed in “Management’s Discussion and Analysis of Financial Conditions and Results of Operations”, the matters discussed in “Risk Factors Affecting Our Business and Future Results”, which are included in Item 1A, and those factors discussed elsewhere in this Annual Report on Form 10-K including, changes in economic conditions, technology and the market in general, and our ability to adapt our products and services to these changes. We undertake no obligation to release publicly the results of any future revisions we make to forward-looking statements to reflect events or circumstances after the date hereof or to reflect the occurrence of unanticipated events. We caution you not to put undue reliance on these forward-looking statements.
Overview
TeleCommunication Systems, Inc. develops and delivers highly reliable and secure wireless communication technology, the development of which has led to ownership of 388 patents and about 300 patent applications as of December 31, 2014. We deliver cellular network computing services that include public safety solutions for 9-1-1 call delivery, precision location platforms, and applications that include navigation, locator applications and text messaging, as well as secure wireless communications systems and professional services, including cybersecurity operations and training. Customers use our “mobile cloud” software functionality through connections to and from network operations centers, paying us monthly fees based on the number of subscribers, cell sites, call center circuits, or other metrics. We do business with the U.S. federal government as a prime contractor under major technology contract vehicles, as well as state, local and foreign government entities. In addition to incorporation of our inventions in our deliverables, we monetize our intellectual property portfolio via patent sales and licensing.
We are a Maryland corporation with global headquarters at 275 West Street, Annapolis, Maryland 21401 and we were founded in 1987. Our web address is www.telecomsys.com. The information contained on our website does not constitute part of this Annual Report on Form 10-K. All of our filings with the Securities and Exchange Commission are available through links on our website. The terms “TCS”, “Company”, “we”, “us” and “our” as used in this Annual Report on Form 10-K refer to TeleCommunication Systems, Inc. and its subsidiaries as a combined entity, except where it is made clear that such terms mean only TeleCommunication Systems, Inc.
While engineers are drawn from throughout the company to provide solutions to all markets, we report two operating segments, Commercial (50% of 2014 revenue) and Government (50% of 2014 revenue). See further detail about the segment operations below, and discussion of segment reporting in Note 21 to the audited Consolidated Financial Statements presented elsewhere in this Annual Report on Form 10-K.
|
(i) |
Commercial Segment: We are one of two leading companies that enable 9-1-1 call delivery via cellular, Voice Over Internet Protocol (“VoIP”), and next generation technology. Other TCS hosted and managed services include cellular network and device platforms and applications for text messaging and location-based services. Our patent monetization activity is included in this segment. Commercial Segment customers include wireless network operators, VoIP service providers, wireless device manufacturers, automotive industry suppliers, and state and local governments. |
|
(ii) |
Government Segment: For our core segment customers, U.S. Department of Defense agencies, we provide cybersecurity services, support, and training and “C4ISR” (command, control, communications, computers, intelligence surveillance and reconnaissance) resources, wireless ground terminals and related support, management and resale of satellite bandwidth, and information technology outsource services. TCS engineers, furnishes, and supports ground terminals used for secure satellite-based and other line-of-sight and beyond-line-of-sight communications, as well as related components incorporating government-approved cryptologic devices and other hardened components for aerospace and defense. |
Art of Exploitation®, VirtuMedix®, Xypoint®, AtlasBook®, Gokivo®, Connections that Matter®, Designed for Mobility®, Secure the Edge®, SwiftLink®, and Enabling Convergent Technologies® are registered trademarks or service marks of TeleCommunication Systems, Inc. or our subsidiaries. This Annual Report on Form 10-K also contains trademarks, trade names and services marks of other companies that are the property of their respective owners.
Commercial Segment Products and Services
We engineer and develop software for cellular carrier and enterprise networks that enables the delivery of secure and personalized content, services, and transactions to and from wireless devices. Our extensive research and development investment has led to a large patent portfolio, mostly related to our commercial solutions. We design our software using industry standards for easy implementation, customization, and interoperability with other network components and we have service and technology partnerships with companies around the world. We manage several network operation centers that host software and equipment for which
5
customers, mainly wireless and VoIP network operators, make recurring monthly usage payments, usually based on a measure of the volume of usage. Our primary deliverables are:
Wireless, Voice Over IP, Voice Over WiFi, and Next Generation 9-1-1. We work with network operators and local emergency services to enable compliance with Federal Communication Commission 9-1-1 requirements. When a wireless subscriber covered by our service makes a 9-1-1 call from his or her wireless phone, our software (1) identifies the call as an emergency call, (2) accesses the handset’s location information from the wireless network, (3) routes the call to the appropriate public safety jurisdiction, (4) translates the information into a dispatcher-friendly format, and (5) transmits the location data to the local emergency service call center. Since 2011, we have worked under contracts with state and local governments for engineering, deployment and operation of Next Generation 9-1-1 (“NG9-1-1”), enabling the public to transmit text, images, video and data to public safety answering points. Our solutions include Geographical Information Systems emergency services internet protocol network software and Public Safety Answering Point-based customer premise equipment software. We have distribution to state and local governments as well as federal agencies for NG9-1-1 solutions through relationships with AT&T, CenturyLink, Frontier Communications, and Cincinnati Bell.
Licensed Software-Based Infrastructure for Mobile Location-Based Services: Our Xypoint Location Platform (“XLP”) infrastructure system interacts with wireless networks to extract the precise location of a user’s device. In order to determine a user’s location with sufficient precision for U.S. public safety compliance and for commercial location-based applications, our technology interacts with networks that have incorporated Assisted GPS systems that use Global Positioning System (“GPS”) chips in user handsets. Our XLP can also work with network triangulation software which some carriers have added to cell towers and switches in the network. We have been a leader in developing the location platform standard called Secure User Plane for Location (“SUPL”) and have incorporated the technology in our products. Our platform also provides privacy controls so that the wireless device user may control access to the user’s location information, and exposes location application programming interfaces (“APIs”) to location-based applications. We offer carriers around the world the complete LBS solution continuum, with the expertise to enable infrastructure, middleware and application functionality. Mobile operators have made large capital investments in infrastructure for wireless data and location determination technologies, and are motivated to grow subscriber use of services that enhance subscriber loyalty and average revenue per user. We are well positioned to provide carrier-branded enhanced services that efficiently use the carriers’ capacity to deliver a user experience that merits incremental service payments and continuous use.
Short Message Service Center and Related Text Messaging Solutions. Our Short Message Service Center software has been used by wireless carrier subscribers to send and receive text or data messages to and from wireless devices since 1997. We are enabling the use of text messaging to communicate with 9-1-1 public safety answering points through major network operators. For our installed base of systems, we provide ongoing operational support, including administration of system components, system optimization, and configuration management. Maintenance services include tracking customer support issues, trouble shooting, and developing and installing maintenance releases. We typically provide maintenance services for an annual or quarterly fee paid in advance.
Communication Applications Involving Security, High Reliability, Location and/or Messaging: For our applications with location-based services (“LBS”), the user device’s precise location (its “X/Y” coordinates) is extracted and used for 9-1-1 call routing, navigation directions, identifying points of interest locations near the user (such as gas stations, restaurants, or hotels), and locating other network subscribers near the user’s current position. During 2014, we launched our VirtuMedix® telemedicine platform which enables doctors and other caregivers to virtually interact with their patients either on a mobile device, a web portal, or telephone. For “Connected Car” motor vehicle connectivity, we provide custom software development and professional services, using our core geo-services platform, to customers engaged in the use of mobile communications technology and related data for application in moving vehicles. Through wireless carriers, we sell subscriptions to services using our client software as a “white label” vendor to the operators. For device and platform companies, we have engineered software development kits and application program interfaces that enable location-based functionality involving the device. Applications revenue is realized in various forms: revenue shares based on usage, fees for non-recurring engineering, professional services, and licenses.
Commercial Segment Market Opportunities and Strategy. Our company is a leader in public safety communications technology for delivery of 9-1-1 calls. We continue to develop software and engineered systems which we deliver through deployment in customer wireless networks, through hosted and subscription business models, and fee for service contracts. Our engineers design solutions to optimize the balance of functionality between the device and the hosted network components, or “cloud.” We are continuing to make development investments focused on the delivery of location information, internet and corporate network data, and other enhanced data-communication services to and from wireless devices, with emphasis on data and network security.
Trends and our strategy for Commercial Segment products and services include:
9-1-1 Mandate Including Indoor Accuracy Requirements and Technology Advances. A key to enhancing personal safety through a cell phone is the availability of E9-1-1 wireless capabilities. We are one of the two leading providers of E9-1-1 service
6
to wireless and VoIP service providers in the U.S., and one of several leading providers to state and county governments for Next Generation, or NG9-1-1. In 1996, the Federal Communications Commission (“FCC”) mandated the adoption of E9-1-1 technology by wireless carriers, and in 2005, the FCC ordered providers of interconnected VoIP service to provide E9-1-1 services to all of their customers as a standard feature of the service. More recently the FCC has recently adopted new rules for improved indoor location accuracy. We are actively pursuing NG9-1-1 business and have deployed solutions in six states. We now have distribution to state and local governments as well as federal agencies for NexGen solutions through relationships with AT&T, CenturyLink, Interact, Frontier, Direct Technologies, and Cincinnati Bell.
Network Operator Infrastructure Upgrades by New and Incumbent Customers for Voice Over LTE, Voice Over Wifi, and Other Technology Advances. TCS does business with about 50 wireless and VoIP service providers in multiple countries. Technologies to enable high-volume voice and data traffic through small cells and via Wifi connectivity to fiber infrastructure require new and upgraded components provided by TCS. We intend to expand our domestic and international carrier base through channels and our direct sales and field support organizations. We will continue to develop network software for wireless carriers and cable operators that operate on all major types of networks.
Adaptation of our Technology for Device Platform and Other Non-carrier Customers. Our applications software has been developed in a modular fashion which enables collaborations with hardware customers on solutions using our software development kits and application program interfaces. We are selectively addressing vertical markets including mobile medicine and connected car applications using our software and company expertise. We intend to expand our penetration of such customers.
Text Messaging (SMS) Trend. While we expect our revenue from messaging to continue declining, text messaging continues to be the most popular type of messaging for mobile users. We have applied our expertise in SMS to enable text to 9-1-1 service, and have developed a hosted messaging service.
Enhancement of our Global Channel Relationships. We are developing relationships with communication infrastructure providers in order to expand our sales channels for our carrier software products and services. We have historically leveraged our strategic relationships with original equipment manufacturers to market our Commercial Segment products to wireless carriers worldwide. Our partners include AT&T, CenturyLink, Alcatel-Lucent, and Level 3.
Monetization of our Patent Portfolio. We are systematically evaluating our patents together with third parties. In some cases we are selling patents with license-back rights, and in others entering into arrangements towards licensing of the intellectual property. We have initiated approximately 30 such projects.
Government Segment Products and Services
We engineer and provide secure, wireless communication solutions, including deployable communication systems and related support services with emphasis on satellite-based technology, to agencies of the U.S. Departments of Defense (“DoD”), Homeland Security, State, Justice and other state and local government customers. We present a TCS TotalCom™ solution opportunity to customers. Since 2006 we have provided a deployable Very Small Aperture Terminal (“VSAT”) ground terminal called “SNAP” (Secret / Nonsecure Access Point) to the Army, and continue to support and upgrade the design. We are a prime vendor under two additional, 5-year indefinite delivery, indefinite quantity defense contract vehicles: the Army’s Global Tactical Advanced Communications Systems (“GTACS”) contract with twenty awardees and a maximum value of $10 billion, and the Defense Information Systems Agency’s Custom SATCOM Solutions (“CS2”) contract with eight awardees and a maximum value of $2.6 billion. In 2014, we were named an awardee of the Department of Homeland Security’s $22 billion Enterprise Acquisition Gateway for Leading Edge II (EAGLE II) contract. The contract enables the purchase of the full range of TCS IT services, technical and management expertise, and solution-oriented products.
We enter into fee-for-service contracts under which revenue is generated based on contract labor billing rates or based on fixed fees for deliverables. Revenue from integration work which typically accompanies customer purchases of our secure deployable systems is reported together with the system sales revenue.
Government segment products and services, typically delivered under multi-year contracts or contract vehicles, include:
Cybersecurity Services, Cybersecurity Training, and Other Information Technology Professional Services. We provide cybersecurity training and services for Computer Network Operations including Computer Network Defense, Computer Network Attack, and Computer Network Exploitation. We develop software tools and database applications related to system testing, security, engineering, and analysis. We enhance secure network communication and encryption engineering and provide a wide range of project management, information assurance oversight, and business management. We provide field and maintenance support of ground terminals and related systems, including maintenance services, training, depot support, product resets, and documentation. We design, install, and operate data networks that integrate computing and communications, including systems that provide communications via both satellite and terrestrial links. We also provide ongoing network operation and management support services including telecom expense management under multi-year contracts.
7
Secure Satellite Teleport Data Landing and Transmission Services. We operate high-speed satellite communications teleports connected to the public switched telephone network for government customers, providing transport services for internet protocol-based voice, video and messaging data using VSAT satellite technology. We purchase space segment (satellite airtime) and resell it to customers using our facilities. TCS also maintains two satellite earth stations on Pacific islands.
Ground Terminal Systems and Components. Our ground terminals provide secure voice, video and data communications via ruggedized modules that can be rapidly deployed in harsh, remote areas for satellite-based or point-to-point communications, where other means of reliable communication may not be available. Our deployable VSAT multi-band terminals provide access to commercial and military satellites enabling global broadband access. The tropo version of this technology can achieve significant cost efficiency by enabling beyond-line-of-sight communication by bouncing radio signals off the lowest portion of the Earth’s atmosphere rather than via satellite transponders, and a low-cost version protected from jamming and enemy interference is in testing. Uses include critical communications for military personnel in command and control headquarters, emergency response, news reporting, public safety, drilling and mining operations, field surveys and other activities that require remote voice, video, and data communication. We also design, produce and sell communication system components as well as electronic components and solid state drives for aerospace applications.
Government Segment Market Opportunities and Strategy. We have a history as a provider of cybersecurity training and deployable, tactical systems and related field support and maintenance, cybersecurity training and professional service work, and as an operator of fixed teleports, and reseller of space segment. Extensions of these competencies include professional service areas such as cyber-security training. We have developed partner relationships with large, global technology companies engaged in systems integration, handheld devices, and integrated circuits. We intend to selectively consider acquisitions of companies and technologies in order to increase the scale and scope of our operations, market presence, products, services and customer base. We plan to provide communications technology solutions to a broadening body of U.S. federal, state and local, and international government customers.
Trends and our strategy for Government Segment products and services are:
Growing Need for Cybersecurity. Escalating focus by government agencies to protect their online assets has brought the importance of cybersecurity and associated solutions to the fore. We have contract vehicles for the government’s surging demand for information technology cybersecurity training, cyber technical solutions, and related procurement support. Steep growth in spending to the multi-billion dollar level by U.S. federal agencies on cyber initiatives is expected over the next five years. The expertise and processes developed by our Government Segment personnel are being adapted to meet the online security needs of commercial clients. We are proficient in recruiting and developing cyber professionals and our Art of Exploitation training is based on intellectual property developed by the company to support cybersecurity initiatives. The training covers a clear set of leading cyber methodologies to produce a certified cyber scientist.
Expanding Need for C4ISR Solutions. Technology to avoid interception or jamming of wireless communications is a growing need for many network operations. TCS has sold deployable communication system terminals to federal government customers for more than a decade. We expect that similar terminals will be provided more broadly in the U.S. military. We are continuing to enhance our deployable communication systems product line to enable broader use of VSAT satellite terminals and components. In addition to the aforementioned GTACS and CS2 contract vehicles. TCS continues to submit proposals to participate in large government procurement vehicles. There can be no assurance that our proposals will be successful or that we will receive additional awards or contracts.
Government Outsourcing of Network and Telecom Technical Functions. Federal defense and civilian agencies, as well as state and local governments, are increasingly contracting with specialist teams for functions such as network management, and for projects such as enablement of reliable, comprehensive in-building wireless communication service. TCS field support and network operations professionals enjoy a favorable reputation for work in harsh environments. We have long-term relationships with federal agencies and the City of Baltimore.
Growing Use of Secure Wireless Communications for Homeland Security and for the First Responder Network Authority (FirstNet). Wireless communications and location technology are key initiatives within the federal government for both defense and civil infrastructure, including the Commerce Department’s FirstNet broadband network which is dedicated to public safety. Wireless communications in emergencies are very important, as first responders need to be able to share information across agencies and departments where wireline systems may be unavailable. We believe that our expertise in the areas of 9-1-1, location-based and messaging services, and secure satellite communications can be leveraged to provide the needed wireless infrastructure for the U.S. Departments of Homeland Security and Commerce, and we are pursuing opportunities to provide such products and services.
Application of Commercially Proven Technology to Government Solutions. Government customers increasingly are using commercial carrier networks. Procurement officers have expressed a preference for solutions that incorporate proven commercial technology, rather than reliance on government research and development funding. Our portfolio of software, patented intellectual property, and teams of wireless and encryption specialists position us to tap into this opportunity.
8
Customers and Markets
Our company’s technology addresses the converging digital, wireless, internet protocol networks operated by governments, carriers and enterprises.
Our principal government customers are major units of the U.S. Departments of Defense, Homeland Security, and the General Services Administration. In some cases we are subcontractors to their contractors. In the aggregate, U.S. federal government entities accounted for 22% of our total 2014 revenue. We compete for business through federal, state and local procurement processes that typically involve requests for proposal from multiple bidders. Customers also include international space agencies and their agents. Customers of NG9-1-1 are mainly state and local government entities that manage first responder dispatch, to whom we sell directly and through channels. This business is managed and reported as part of our Commercial Segment.
Our commercial customers are wireless and VoIP network operators in the United States and around the world, and state and local government agencies operating public safety answering points. We sell directly and through channel partners. Commercial customers include Verizon Wireless, AT&T Mobility, Comcast, T-Mobile, Sprint, Bell Mobility, US Cellular, Blackberry, Telus, and Denso Corporation. Our sales efforts target network operators around the world, as well as state and local public safety entities and new device and hardware customers who may use our technology and software in their products.
The markets for our products and services are highly competitive. The adoption of industry standards may make it easier for new market entrants to compete with us. We expect that we will continue to compete primarily on the basis of the functionality, breadth, time to market, ease of integration, price, and quality of our products and services, as well as our market experience, reputation, and price. The market and competitive conditions are continually developing. Our software-based deliverables compete with alternatives provided by other companies. It is difficult to present a meaningful comparison between our competitors and us because there is a large variation in revenue generated by different customers, different products and services, as well as the different combinations of products and services offered by our competitors. We cannot, therefore, quantify our relative competitive position.
Our current and potential competitors include:
|
· |
Government Segment. General Dynamics Corporation; CACI International Inc.; Harris Corp.; Computer Sciences Corporation; The KEYW Holding Corporation, and large government systems integrators. |
|
· |
Commercial Segment. Intrado Inc. division of West Corporation; Airbus DS Communications; Solacom Technologies Inc.: Emergency CallWorks; TeleNav, Inc.; Ericsson LM Telephone Co.; Comverse Technology Inc; Google Inc.; and Nokia Networks. |
Many of our existing and potential competitors have substantially greater financial, technical, marketing and distribution resources than we do. Many of these companies have greater name recognition and more established relationships with their target customers. Furthermore, these competitors may be able to adopt more aggressive pricing policies and offer customers more attractive terms than we can. With time and capital, it would be possible for our competitors to replicate our products and services.
The markets for commercial location and other mobile wireless applications for carriers and enterprises are continually developing. We partner with vendors of precise location technology. Certain of our partners may attempt to compete with our operating platform by developing their own transmission platform or by purchasing another mobile location platform. The convergence of wireless technologies and the internet is creating many initiatives to bring data and transaction capabilities to wireless devices. There is a wide array of potential competitors in this market, including providers of competing location management platforms, competing enterprise mobility platforms and other competing location-based applications for wireless devices.
Backlog
We had unfilled orders, or funded contract backlog at December 31, as follows:
|
|
|
|
|
2014 vs. 2013 |
|
||||||||||||
|
($ in millions) |
2014 |
|
|
2013 |
|
|
$ |
|
|
% |
|
||||||
|
|
|
|
|
|
|
|
|
|
|
|
|
|
|
|
|
||
|
Commercial Segment funded contract backlog |
$ |
248.8 |
|
|
$ |
223.7 |
|
|
$ |
25.1 |
|
|
|
11 |
% |
||
|
Government Segment funded contract backlog |
|
60.6 |
|
|
|
64.4 |
|
|
|
(3.8 |
) |
|
|
(6 |
%) |
||
|
Total funded contract backlog |
$ |
309.4 |
|
|
$ |
288.1 |
|
|
$ |
21.3 |
|
|
|
7 |
% |
||
|
|
|
|
|
|
|
|
|
|
|
|
|
|
|
|
|
||
|
Expected to be realized within the next 12 months |
$ |
184.4 |
|
|
$ |
158.7 |
|
|
$ |
25.7 |
|
|
|
16 |
% |
||
|
|
|
|
|
|
|
|
|
|
|
|
|
|
|
|
|
||
9
Funded contract backlog represents contracts for which fiscal year funding has been appropriated by our customers (mainly federal agencies), and for hosted services (mainly for wireless carriers). Backlog is computed by multiplying the most recent month’s contract or subscription revenue by the months remaining under the existing long-term agreements, which is considered to be the best available information for anticipating revenue under those agreements.
Our backlog at any given time may be affected by a number of factors, including the availability of funding, contracts being renewed, or new contracts being signed before existing contracts are completed and the other factors described in the Company’s Risk Factors as filed with the Securities and Exchange Commission from time to time. The timing and amounts of government contract funding may be adversely affected by federal budget policy decisions, like handling of sequestration and continuing resolutions, and can lead to delays in procurement of our products and services due to lack of funding. Some of our backlog could be canceled for causes such as late delivery, poor performance and other factors. Accordingly, a comparison of backlog from period to period is not necessarily meaningful and may not be indicative of eventual actual revenue.
Sales and Marketing
We sell our products and services through our direct sales force and through indirect channels. Our direct sales and marketing force consists of approximately 35 professionals in the U.S., Europe, Latin America, Africa and Asia as of December 31, 2014. We also leverage our relationships with larger companies to market our commercial systems. These indirect sales relationships include AT&T, CenturyLink, and Alcatel-Lucent. We have Cisco certifications which enhance our ability to co-sell with Cisco’s sales force.
We are pre-qualified as an approved vendor for some government contracts, and some of our products and services are available to government customers via the General Services Administration’s Information Technology Schedule 70, GTACS, CS2, and the Space and Naval Warfare Foreign Military Sales contract vehicles. We collaborate in sales efforts under various arrangements with integrators. Our marketing efforts also include advertising, public relations, speaking engagements and attending and sponsoring industry conferences.
Research and Development
Our success depends on a number of factors, which include our ability to identify and respond to emerging technological trends in our target markets, to develop and maintain competitive products, to enhance our existing products by adding features and functionality that differentiate the products from those of our competitors, and to bring products to market on a timely basis and at competitive prices. As of December 31, 2014, our overall staff included approximately 700 professionals with technical expertise in wireless network, client software development and satellite-based communication technology. Since 1996, we have made substantial investments in wireless technology research and development, most of which has been devoted to the development of network and device software products and services, including application program interfaces and software development kits. We are primarily focusing our current research and development investments in location-based technology, 9-1-1 call routing and dispatch solutions, and highly reliable tactical communication solutions.
We support existing telecommunications standards and promote new standards in order to expand the market for wireless data. We actively participate in wireless standards-setting organizations including the Open Mobile Alliance, and our CEO is a member of the FCC Communications, Reliability, Interoperability Council (“CSRIC”), and on the Board of Directors of CTIA – The Wireless Association. For the years ended December 31, 2014, 2013, and 2012, our research and development expense was $41.7 million, $34.3 million, and $36.6 million, respectively.
Certain of our government customers contract with us from time to time to conduct research on telecommunications software, equipment and systems.
Intellectual Property Rights
We rely on a combination of patent, copyright, trademark, service mark, and trade secret laws and restrictions to establish and protect certain proprietary rights in our products and services.
At year-end 2014, we held 388 issued patents worldwide relating to wireless location-based services, text messaging, GPS ephemeris data, emergency public safety data routing, electronic commerce, and other areas. We have filed about 300 additional patent applications for certain apparatus and processes we believe we have invented to enable key features of the location services, wireless text alerts, Short Message Service Center, mobile-originated data and E9-1-1 network software. Our patent portfolio allows us to build meaningful partnerships with other companies through direct licensing, cross licensing, and other forms of agreements. Our commitment to protecting our intellectual property ensures continued differentiation and freedom to operate in the industry. We also monetize our intellectual property portfolio via patent sales and licensing of the technology as well as incorporating our inventions in
10
our deliverables. No single patent or group of patents, patent applications or patent license agreement is or are material to the Company’s operations.
There is no assurance that our patent applications will result in a patent being issued by the U.S. Patent and Trademark Office or other patent offices, nor is there any guarantee that any issued patent will be valid and enforceable. Additionally, foreign patent rights may or may not be available or pursued in any technology area for which U.S. patent applications have been filed.
We developed our Short Message Service Center software in 1996 under our development agreement with Alcatel-Lucent. Under the development agreement, we share certain ownership rights in this software application with Alcatel-Lucent. The scope of each party’s ownership interest is subject to each party’s various underlying ownership rights in intellectual property and also to confidential information contributed to the applications, and is subject to challenge by either party.
As a member of various industry standard-setting forums, we have agreed to license certain of our intellectual property to other members on fair and reasonable terms to the extent that the license is required to develop non-infringing products under the specifications promulgated by those forums.
Employees
As of December 31, 2014, we had 1,115 employees, of which 1,074 were full-time and 41 were part-time or temporary. We believe relations with our employees are good. None of our employees is represented by a union.
Geographical Information
During 2014, 2013, and 2012, total revenue generated from products and services in the U.S. were $319.1 million, $324.1 million, and $445.6 million, respectively, and total revenue generated from products and services outside of the U.S. were $40.7 million, $38.2 million, and $41.8 million, respectively. As of December 31, 2014, 2013, and 2012, essentially all of the long-lived assets of our operations were located in the U.S.
We are subject to risks related to offering our products and services in foreign countries. See the information under the heading “Risk Factors — Because our product offerings are sold internationally, we are subject to risks of conducting business in foreign countries” included in Item 1A.
You should consider carefully each of the following risks and all of the other information in this Annual Report on Form 10-K and the documents incorporated by reference herein. If any of the following risks and uncertainties develops into actual events, our business, financial condition or results of operations could be materially adversely affected.
Risks Related to Our Business
Changes in the U.S. federal government budgetary priorities and global market conditions that are beyond our control may have a material adverse effect on us.
We depend on the U.S. government for a significant portion of our revenues. Competing demands for federal funds could pressure all areas of spending, which will impact the U.S. government budget. Cost cutting, efficiency initiatives, reprioritization and other affordability analysis by the U.S. government and changes in budgetary priorities could adversely impact our Government Segment. Although governments worldwide, including the U.S. government, have initiated sweeping economic plans, we are unable to predict the impact, severity, and duration of these economic events, which could have a material effect on our business, financial position, results of operations or cash flows.
We rely on particular levels of U.S. government spending on our communication solutions and our backlog depends in a large part on continued funding by the U.S. government for the programs in which we are involved. These spending levels are not generally correlated with any specific economic cycle, but rather follow the cycle of general public policy and political support for this type of spending. Moreover, although our contracts often contemplate that our services will be performed over a period of several years, the Executive Branch must propose and Congress must approve funds for a given program each government fiscal year and may significantly change - increase, reduce or eliminate - funding for a program. A decrease in DoD and/or Homeland Security expenditures, the elimination or curtailment of a material program in which we are involved, or changes in payment patterns of our customers as a result of changes in U.S. government spending, could have a material adverse effect on our operating results, financial condition, and/or cash flows.
11
There remains therefore a significant level of uncertainty and lack of detail available to predict specific future government spending on the solutions that we offer. While we are unable to predict the exact impact on our Government Segment, these factors, could in the aggregate have material adverse operational and financial consequences, depending on how the cuts are allocated across the federal government budget.
Agencies of the U.S. government have special rights unlike other customers, exposing us to additional risks that could have a material adverse effect on us.
Sales to various agencies of the U.S. government accounted for approximately 22% of our 2014 revenue, all of which was reported as Government Segment revenue. Our ability to earn revenue from sales to the U.S. government can be affected by numerous factors outside of our control, including:
|
· |
The U.S. government may terminate its contracts it with us. All of the contracts we have with the U.S. government are, by their terms, subject to termination by the U.S. government either for its convenience or in the event of a default by us. In the event of termination of a contract by the U.S. government, we may have little or no recourse. |
|
· |
The U.S. government may audit and review our costs and performance on their contracts, as well as our accounting and general practices. The costs and prices under these contracts may be subject to adjustment based upon the results of any audits. Future audits that result in the increase in our costs may adversely affect our business, financial position, results of operations or cash flows. |
Most of our Government contracts are on a fixed price basis which could negatively impact our profitability.
Fixed-price contracts inherently have more risk than flexibly priced contracts. Our operating margin is adversely affected when contract costs that cannot be billed to customers are incurred. While management uses its best judgment to estimate costs associated with fixed-price contracts, future events could result in either upward or downward adjustments to those estimates which could negatively impact our profitability. The increase in contract costs can occur if estimates to complete increase or if initial estimates used for calculating the contract cost were incorrect. The cost estimation process requires significant judgment and expertise. Reasons for cost growth may include unavailability and productivity of labor, the nature and complexity of the work to be performed, the effect of change orders, the availability of materials, interruptions in our supply chain, the effect of any delays in performance, availability and timing of funding from the customer, natural disasters, and the inability to recover any claims included in the estimates to complete. A significant change in cost estimates on one or more programs could have a material effect on our consolidated financial position or results of operations.
We cannot guarantee that our estimated contract backlog will result in actual revenue.
As of December 31, 2014, our estimated contract backlog totaled approximately $340.5 million, of which $309.4 million was funded. There can be no assurance that our backlog will result in actual revenue in any particular period, or at all, or that any contract included in backlog will be profitable. There is a higher degree of risk in this regard with respect to unfunded backlog. The actual receipt and timing of any revenue is subject to various contingencies, many of which are beyond our control. The actual receipt of revenue on contracts included in backlog may never occur or may change because a program schedule could change, the program could be canceled, a contract could be reduced, modified or terminated early, or an option that we had assumed would be exercised not being exercised. Approximately 20% of our funded contract backlog consisted of Government Segment orders and the fluctuations in political and fiscal policy priorities and processes materially influence the funding of our backlog and our ability to convert backlog into revenue. Our estimates are based on our experience under such contracts and similar contracts. However, there can be no assurances that all, or any, of such estimated contract value will be recognized as revenue.
We are subject to procurement and other related laws and regulations which carry significant penalties for non-compliance.
As a supplier to the U.S. government, we must comply with numerous regulations, including those governing security and contracting practices. In addition, prime contracts with various agencies of the U.S. government and subcontracts with other prime contractors are subject to numerous laws and regulations.
Failure to comply with these procurement regulations and practices could result in fines being imposed against us or our suspension for a period of time from eligibility for bidding on, or for award of, new government contracts. If we are disqualified as a supplier to government agencies, we would lose most, if not all, of our U.S. government customers and revenues from sales of our products would decline significantly. Among the potential causes for disqualification are violations of various statutes, including those related to procurement integrity, export control, U.S. government security regulations, employment practices, protection of the environment, accuracy of records in the recording of costs, and foreign corruption. The government could investigate and make inquiries of our business practices and conduct audits of contract performance and cost accounting. Based on the results of such audits,
12
the U.S. government could adjust our contract-related costs and fees. Depending on the results of these audits and investigations, the government could make claims against us, and if it were to prevail, certain incurred costs would not be recoverable by us.
Technological and regulatory change to wireless and next-generation 9-1-1 could affect our future performance.
The Federal Communication Commission, or FCC, requires that certain location information be provided to network operators for public safety answering points when a subscriber makes a 9-1-1 call. Technical failures, greater regulation by federal, state or foreign governments or regulatory authorities, time delays or the significant costs associated with developing or installing improved location technology could slow down or stop the deployment of our mobile location products. If deployment of improved location technology is delayed, stopped or never occurs, market acceptance of our products and services may be adversely affected. Because we rely on some third-party location technology instead of developing all of the technology ourselves, we have little or no influence over its improvement.
The technology employed with next-generation 9-1-1 services generally anticipates a migration to internet-protocol (“IP”) based communication. Since many companies are proficient in IP-based communication protocols, the barriers to entry to providing next-generation 9-1-1 products and services are lower than exist for the traditional switch-based protocols. If we are unable to develop unique and proprietary solutions that are superior to and more cost effective than other market offers, our 9-1-1 business could get replaced by new market entrants, resulting in material adverse impacts on our overall business, financial position, results of operations or cash flows.
Our 9-1-1 business is dependent on state and local governments and the regulatory environment for Voice over Internet Protocol (VoIP) services is developing.
Under the FCC’s mandate, wireless carriers are required to provide 9-1-1 services only if state and local governments request the service. As part of a state or local government’s decision to request 9-1-1, they have the authority to develop cost recovery mechanisms. However, cost recovery is no longer a condition to wireless carriers’ obligation to deploy the service. If state and local governments do not widely request that 9-1-1 services be provided or we become subject to significant pressures from wireless carriers with respect to pricing of 9-1-1 services, our 9-1-1 business would be harmed and future growth of our business would be reduced.
The FCC has determined that VoIP services are not subject to the same regulatory scheme as traditional wireline and wireless telephone services. If the regulatory environment for VoIP services evolves in a manner other than the way we anticipate, our 9-1-1 business would be significantly harmed and future growth of our business would be significantly reduced. For example, the regulatory scheme for wireless and wireline service providers requires those carriers to allow service providers such as us to have access to certain databases that make the delivery of a 9-1-1 call possible. No such requirements exist for VoIP service providers so carriers could prevent us from continuing to provide VoIP 9-1-1 service by denying us access to the required databases.
Failure to meet our contractual obligations, including sufficiently reliable software and successful integration with customer networks, could adversely affect our profitability and future prospects.
We design, develop and manufacture technologically advanced and innovative products and services applied by our customers in a variety of environments. Problems and delays in development or delivery as a result of issues with respect to design, technology, licensing and patent rights, labor, learning curve assumptions, or materials and components could prevent us from achieving contractual obligations. In addition, our products cannot be tested and proven in all situations and are otherwise subject to unforeseen problems. Examples of unforeseen problems which could negatively affect revenue and profitability include problems with quality, delivery of subcontractor components or services, and unplanned degradation of product performance.
Our operations are subject to government regulations, and failure to comply with them would harm our business.
We operate an FCC licensed teleports which are subject to the Communications Act of 1934, as amended, or the FCC Act, and the rules and regulations of the FCC. We cannot guarantee that the FCC will grant renewals when our existing licenses expire, nor are we assured that the FCC will not adopt new or modified technical requirements that will require us to incur expenditures to modify or upgrade our equipment as a condition of retaining our licenses.
The sale of our products outside the U.S. is subject to compliance with the United States Export Administration Regulations and, in certain circumstances, with the International Traffic in Arms Regulations. The absence of comparable restrictions on competitors in other countries may adversely affect our competitive position. In addition, in order to ship our products into and implement our services in some countries, the products must satisfy the technical requirements of that particular country. If we were
13
unable to comply with such requirements with respect to a significant quantity of our products, our sales in those countries could be restricted, which could have a material adverse effect on our business, results of operations and financial condition.
We may, in the future, be required to seek FCC or other government approval if foreign ownership of our stock exceeds certain specified criteria. Failure to comply with these policies could result in an order to divest the offending foreign ownership, fines, denial of license renewal and/or license revocation proceedings against the licensee by the FCC, or denial of certain contracts from other U.S. government agencies.
If wireless carriers do not continue to provide our wireless applications to their subscribers, our business could be harmed. Our success with applications depends on increasing the number of end users that purchase the products and services of our wireless applications business from our wireless carrier partners. Our wireless carrier partners may change the pricing and other terms by which they offer our wireless applications business, which could result in increased end user churn, lower revenue and adverse effects on our business.
A portion of our revenue is derived from subscription fees that we receive from our wireless carrier partners for end users who subscribe to our service on a standalone basis or in a bundle with other services. To date, a relatively small number of end users have subscribed for our services in connection with their wireless plans compared to the total number of mobile phone users. The near term success of our wireless applications business depends heavily on achieving significantly increased subscriber adoption of the products and services of our wireless applications business either through standalone subscriptions to our services or as part of bundles from our existing wireless carrier partners. The success of our wireless applications business also depends on achieving widespread deployment of the products and services of our wireless applications business by attracting and retaining additional wireless carrier partners. The use of the products and services of our wireless applications business will depend on the pricing and quality of those services, subscriber demand for those services, which may vary by market, as well as the level of subscriber turnover experienced by our wireless carrier partners. If subscriber turnover increases more than we anticipate, our financial results could be adversely affected.
Competitors offer technology that has functionality similar to ours for free, under different business models. Competition from these free offerings may reduce our revenue and harm our business. If our wireless carrier partners can offer these location-based services to their subscribers for free, they may elect to cease their relationships with us, alter or reduce the manner or extent to which they market or offer our services or require us to substantially reduce our subscription fees or pursue other business strategies that may not prove successful for us and have a material adverse effect on our business, financial position, results of operations or cash flows.
Network failures, disruptions or capacity constraints in our third party data center facilities or in our servers could affect the performance of the products and services of our wireless applications and 9-1-1 business and harm our reputation and our revenue.
The products and services of our wireless applications business are provided through a combination of our servers, which we house at third party data centers, and the networks of our wireless carrier partners. The operations of our wireless applications business rely to a significant degree on the efficient and uninterrupted operation of the third party data centers we use. Our hosted data centers are currently located in third party facilities located in the Irvine and San Francisco, California areas, and we may use others as required. We also use third party data center facilities in the Phoenix, Arizona area to provide for disaster recovery.
Poor performance in or disruptions of the services of our wireless applications business could harm our reputation, delay market acceptance of our services and subject us to liabilities. Our wireless carrier agreements require us to meet operational uptime requirements, excluding scheduled maintenance periods, or be subjected to penalties. If we are unable to meet these requirements, our wireless carrier partners could terminate our agreements or we may be required to refund a portion of monthly subscriptions fees they have paid us.
Our operating results could be adversely affected by interruption of our data delivery services, system failure or production interruptions.
Our 9-1-1, hosted location-based services and satellite teleport services operations depend on our ability to maintain our computer and telecommunications equipment and systems in effective working order, and to protect our systems against damage from fire, natural disaster, power loss, telecommunications failure, sabotage, unauthorized access to our system or similar events. Although all of our mission-critical systems and equipment are designed with built-in redundancy and security, any unanticipated interruption or delay in our operations or breach of security could have a material adverse effect on our business, financial condition and results of operations. Our property and business interruption insurance may not be adequate to compensate us for any losses that may occur in the event of a system failure or a breach of security. Insurance may not be available to us at all or, if available, may not be available to us on commercially reasonable terms.
14
Our past and future acquisitions of companies or technologies could prove difficult to integrate, disrupt our business, dilute shareholder value or adversely affect operating results or the market price of our Class A common stock.
We have made several acquisitions and intend to continue to selectively consider acquisitions of companies and technologies in order to increase the scale and scope of our operations, market presence, products, services and customer base. Any acquisitions, strategic alliances or investments we may pursue in the future will have a continuing, significant impact on our business, financial condition and operating results. The value of the companies or assets that we acquire or invest in may be less than the amount we paid if there is a decline of their position in the respective markets they serve or a decline in general of the markets they serve. If we fail to properly evaluate and execute acquisitions and investments, our business and prospects may be seriously harmed. Acquisitions involve risks including:
|
· |
properly evaluating the technology; |
|
· |
accurately forecasting the financial impact of the transaction, including accounting charges and transaction expenses; |
|
· |
integrating and retaining personnel; |
|
· |
retaining and cross-selling to acquired customers; |
|
· |
combining potentially different corporate cultures; |
|
· |
the potential of significant goodwill and intangibles write-offs in the future in the event that an acquisition or investment does not meet expectations; and |
|
· |
effectively integrating products and services, and research and development, sales and marketing and support operations. |
If we fail to do any of these, we may suffer losses or incur impairment charges, our management may be distracted from day-to-day operations and the market price of our Class A common stock may be materially adversely affected. In addition, if we consummate future acquisitions using our equity securities or convertible notes, existing shareholders may be diluted which could have a material adverse effect on the market price of our Class A common stock. The companies and business units we have acquired or invested in or may acquire or invest in are subject to each of the business risks we describe in this section, and if they incur any of these risks the businesses may not be as valuable as the amount we paid. Further, we cannot guarantee that we will realize the benefits or strategic objectives we are seeking to obtain by acquiring or investing in these companies.
New entrants and the introduction of other distribution models in the location- based services market may harm our competitive position.
New entrants seeking to gain market share by introducing new technology and new products may make it more difficult for us to sell our products and services and could create increased pricing pressure, reduced profit margins, increased sales and marketing expenses, or the loss of market share or expected market share, any of which may significantly harm our business, operating results and financial condition. Consumers can now download and provision applications from individual provider websites and select from a menu of applications through the Apple iTunes App Store, the Blackberry App World, the Android Market, and other application aggregators. Applications from other LBS providers may be preloaded on mobile devices by OEMs or offered by OEMs directly. Increased competition from providers of location-based services which do not rely on a wireless carrier may result in fewer wireless carrier subscribers electing to purchase their wireless carrier’s branded location-based services, which could harm our business and revenue. In addition, these location-based services may be offered for free or on a onetime fee basis, which could force us to reduce monthly subscription fees or migrate to a onetime fee model to remain competitive. We may also lose end users or face erosion in our average revenue per user if these competitors deliver their products without charge to the consumer by generating revenue from advertising or as part of other applications or services.
We rely on third party data and content and some licenses to other parties’ technology to provide the services of our wireless applications business, and if we were unable to obtain content and licenses at reasonable prices, or at all, our gross margins and our ability to provide the services of our wireless applications business would be harmed.
Our wireless applications business relies on third party data and content to provide those services including map data, points of interest data, traffic information, gas prices, theater, event, and weather information. If our suppliers of this data or content were to enter into exclusive relationships with other providers of location-based services or were to discontinue providing such information and we were unable to replace them cost effectively, or at all, our ability to provide the services of our wireless applications business would be harmed. Our gross margins may also be affected if the cost of third party data and content increases substantially.
We obtain map data from companies owned by current and potential competitors, who may act in a manner that is not in our best interest. We may not be able to upgrade our location-based services platform to support certain advanced features and functionality without obtaining technology licenses from third parties. Obtaining these licenses may be costly and may delay the
15
introduction of such features and functionality, and these licenses may not be available on commercially favorable terms, or at all. The inability to offer advanced features or functionality, or a delay in our ability to upgrade our location-based services platform, may adversely affect consumer demand for the products and services of our wireless applications business, consequently, harm our business.
Some of our research and development operations are conducted in China, India, and Australia, and our ability to introduce new services and support our existing services cost effectively depend on our ability to manage those remote development sites successfully.
Our success depends on our ability to enhance our current services and develop new services and products rapidly and cost effectively. We currently have research and development employees in China and Australia, and contractors in India. Managing product development operations that are remote from our U.S. headquarters is difficult and we may not be able to manage these remote centers successfully. We could incur unexpected costs or delays in product development that could impair our ability to meet market windows or cause it to forego certain new product opportunities. In addition, if our carrier customers become adverse to introducing products into their networks that have been developed in these remote centers, the market for our products could be adversely affected.
Our research and development investments may not lead to successful new products, services or enhancements.
We will continue to invest in research and development for the introduction of new and enhanced products and services designed to improve the capacity, data processing rates and features. We must also continue to develop new features and to improve functionality of our software. Research and development in our industry is complex, expensive and uncertain. We believe that we must continue to dedicate a significant amount of resources to research and development efforts to maintain our competitive position. If we continue to expend a significant amount of resources on research and development, but our efforts do not lead to the successful introduction of product and service enhancements that are competitive in the marketplace, our business, financial position, results of operations or cash flows could be negatively impacted.
We could incur substantial costs from product liability claims relating to our software.
Our agreements with customers may require us to indemnify customers for our own acts of negligence and non-performance. Product liability and other forms of insurance are expensive and may not be available in the future. We cannot be sure that we will be able to maintain or obtain insurance coverage at acceptable costs or in sufficient amounts or that our insurer will not disclaim coverage as to a future claim. A product liability or similar claim may have a material adverse effect on our business, financial position, results of operations or cash flows.
Our revenue may decline if we fail to retain our largest customers for all of the deliverables that we sell to them and if we fail to maintain or expand our relationships with strategic partners and indirect distribution channels our license revenues could decline.
Our growth depends on maintaining relationships with our major customers and on developing other customers and distribution channels. If our largest customers reduce their expenditures for marketing the services for which we provide technology, change their plans to eliminate our services, price our products and services at a level that makes them less attractive, or offer and promote competing products and services, in lieu of, or to a greater degree than, our products and services, our revenue would be materially reduced and our business, operating results and financial condition would be materially and adversely affected.
Our growth also depends on maintaining relationships with distribution channels for NG9-1-1 solutions. The loss of these relationships would have a material adverse impact on our business, financial position, results of operations or cash flows.
Government regulation of the mobile industry is evolving, and unfavorable changes or our failure to comply with regulations could harm our business and operating results.
As the mobile industry continues to evolve, we believe greater regulation by federal, state or foreign governments or regulatory authorities is likely. For example, we believe increased regulation is likely in the area of data privacy, and laws and regulations applying to the solicitation, collection, processing or use of personal or consumer information, could affect our customers’ ability to use and share data, potentially reducing our ability to utilize this information for the purpose of continued improvement of the overall mobile subscriber experience. In addition, any regulation of the requirement to treat all content and application provider services the same over the mobile Internet, sometimes referred to as net neutrality regulation, could reduce our customers’ ability to make full use of the value of our services.
16
Growing market acceptance of “open source” software could have a negative impact on us.
We have incorporated some types of open source software into our products, allowing us to enhance certain solutions without incurring substantial additional research and development costs. Thus far, we have encountered no unanticipated material problems arising from our use of open source software. However, as the use of open source software becomes more widespread, certain open source technology could become competitive with our proprietary technology, which could cause sales of our products to decline or force us to reduce the fees we charge for our products, which could have a material adverse effect on our business, financial position, results of operations or cash flows.
From time to time, there have been claims challenging the ownership of open source software against companies that incorporate open source software into their products. As a result, we could be subject to suits by parties claiming ownership of what we believe to be open source software. Some open source licenses contain requirements that we make available source code for modifications or derivative works under the terms of a particular open source license or other license granting third parties certain rights of further use. If we combine our proprietary software products with open source software in a certain manner, we could under certain of the open source licenses, be required to release our proprietary source code. Open source license terms may be ambiguous and many of the risks associated with usage of open source cannot be eliminated, and could if not properly addressed, negatively affect our business. If we were found to have inappropriately used open source software, we may be required to release our proprietary source code, re-engineer our products and client applications, discontinue the sale of our products or services in the event re-engineering cannot be accomplished on a timely basis or take other remedial action that may divert resources away from our development efforts, any of which could adversely affect our business, operating results and financial condition.
Because our solutions are sold internationally, we are subject to risks of conducting business in foreign countries.
We believe our revenue will increasingly include business in foreign countries, and we will be subject to the social, political and economic risks of conducting business in foreign countries. Laws and regulations for foreign business include internal control and disclosure rules, data privacy and filtering requirements, anti-corruption laws, such as the Foreign Corrupt Practices Act, and other local laws prohibiting corrupt payments to governmental officials, and antitrust and competition regulations, among others. Violations of these laws and regulations could result in fines and penalties, criminal sanctions against us, our officers, or our employees, prohibitions on the conduct of our business and on our ability to offer our products and services in one or more countries, and our international expansion efforts. Although we have implemented policies and procedures designed to ensure compliance with these laws and regulations, there can be no assurance that our employees, contractors, or agents will not violate our policies. Some international government customers may require contractors to agree to specific in-country purchases, manufacturing agreements or financial support arrangements, known as offsets, as a condition for a contract award. The contracts may include penalties if we fail to meet the offset requirements. Other risks include:
|
· |
our inability to adapt our products and services to local business practices, customs and mobile user preferences; |
|
· |
the costs of adapting our product and service offerings for foreign markets and compliance with applicable laws and regulations; |
|
· |
our inability to locate qualified local employees, partners and suppliers; |
|
· |
reduced protection of intellectual property rights; |
|
· |
changes in regulatory requirements which could restrict our ability to deliver services to our international customers, including the addition of a country to the list of sanctioned countries under the International Emergency Economic Powers Act or similar legislation; |
|
· |
general geopolitical risks, such as political and economic instability and changes in diplomatic and trade relations; and |
|
· |
unpredictable fluctuations in currency exchange rates. |
Any of the foregoing risks could have a material adverse effect on our business, financial position, results of operations or cash flows by diverting time and money toward addressing them or by reducing or eliminating sales in such foreign countries.
Because some of our competitors have significantly greater resources than we do, we could lose customers and market share.
Our business is highly competitive. Several of our potential competitors are substantially larger than we are and have greater financial, technical and marketing resources than we do. In particular, larger competitors have certain advantages over us which could cause us to lose customers and impede our ability to attract new customers, including: larger bases of financial, technical, marketing, personnel and other resources; more established relationships with wireless carriers and government customers; more funds to deploy products and services; and the ability to lower prices (or not charge any price) of competitive products and services because they are selling larger volumes.
17
While we characterize some of our services revenue as being “recurring” there is no guarantee that we will actually achieve this revenue.
A significant portion of our revenue is generated from long-term customer contracts for month-to-month fees. While we currently believe that these revenue streams will continue, renegotiation of the contract terms, early termination or non-renewal of material contracts could cause our recurring revenues to be lower than expected, and growth depends on maintaining relationships with these important customers and on developing other customers and distribution channels.
We are exposed to counterparty credit risk and there can be no assurance that we will manage or mitigate this risk effectively.
We are exposed to many different industries, counterparties, and agreements, and regularly interact with counterparties in various industries. The insolvency or other inability of a significant counterparty or partner, including a counterparty to a significant counterparty, to perform its obligations under an agreement or transaction, including without limitation, as a result of the rejection of an agreement or transaction by a counterparty in bankruptcy proceedings, could have a material adverse effect on our business financial position, results of operations or cash flows. Examples of our counterparty risks include counterparties to our credit agreement, large customers and suppliers, and partners on major procurements.
The loss of key personnel or inability to attract and retain personnel could harm our business.
Our future success will depend in large part on our ability to hire and retain a sufficient number of qualified personnel, particularly in sales and marketing and research and development. If we are unable to do so, our business could be harmed. Our future success also depends upon the continued service of our executive officers and other key sales, engineering and technical staff. The loss of the services of our executive officers and other key personnel could harm our operations. We maintain key person life insurance on certain of our executive officers. We would be harmed if one or more of our officers or key employees decided to join a competitor or if we failed to attract qualified personnel. Our ability to attract qualified personnel may be adversely affected by a decline in the price of our Class A common stock. In the event of a decline in the price of our Class A common stock, the retention value of stock options will decline and our employees may choose not to remain with us, which could have a material adverse effect on our business, financial position, results of operations or cash flows.
Our accounting policies and methods for reporting of our financial position and results of operations require management to make estimates, judgments and assumptions about matters that are inherently uncertain.
Our accounting policies and methods are fundamental to how we record and report our financial position and results of operations. We have identified several accounting policies as being critical to the presentation of our financial position and results of operations because they require management to make particularly subjective or complex judgments about matters that are inherently uncertain and because of the likelihood that materially different amounts would be recorded under different conditions or using different assumptions For example, we assess goodwill for impairment in the fourth quarter of each fiscal year, or sooner should there be an indicator of impairment. We periodically analyze whether any such indicators of impairment exist, such as a sustained significant decline in our stock price and market capitalization, a decline in our expected future cash flows, a significant adverse change in legal factors or in the business climate, unanticipated competition, and/or slower growth rate, among others. The impairment test is based on several factors requiring judgments determined as of that date. Changes in market conditions may indicate a potential future impairment of recorded goodwill. If goodwill becomes impaired, we would record a significant charge to earnings in our financial statements during the period in which any impairment of our goodwill is determined, which may significantly reduce or eliminate our profits.
The nature of our business requires the application of complex revenue and expense recognition rules and the current legislative and regulatory environment affecting U.S. Generally Accepted Accounting Principles (“GAAP”) is uncertain and significant changes in current principles could affect our financial statements going forward and changes in financial accounting standards or practices may cause adverse, unexpected financial reporting fluctuations and harm our operating results.
The accounting rules and regulations that we must comply with are complex. Recent actions and public comments from the Financial Accounting Standards Board (the “FASB”) and the Securities and Exchange Commission have focused on the integrity of financial reporting. In addition, many companies’ accounting policies are being subject to heightened scrutiny by regulators and the public. Further, the accounting rules and regulations are continually changing in ways that could materially impact our financial statements. For example, in May 2014, the FASB issued new guidance for revenue recognition. The new guidance provides a five-step revenue recognition model which replaces the prior revenue recognition guidance in its entirety. We have not yet selected a transition method and continue to evaluate the impact that this guidance will have on our financial condition and results of operations. Regardless of the transition method, the application of this new guidance may result in certain adjustment to our financial statements, which could have a material adverse effect on our net income. Because of the uncertainty of the estimates, judgments and assumptions
18
associated with our accounting policies, we cannot provide any assurances that we will not make subsequent significant adjustments to our consolidated financial statements.
Industry Risks
Because the wireless data industry is a rapidly evolving market, our product and service offerings could become obsolete unless we respond effectively and on a timely basis to rapid technological changes.
The successful execution of our business strategy is contingent upon wireless network operators launching and maintaining mobile location services, our ability to maintain a technically skilled development and engineering team, our ability to create new network software products and adapt our existing products to rapidly changing technologies, industry standards and customer needs. As a result of the complexities inherent in our product offerings, new technologies may require long development and testing periods. Additionally, new products may not achieve market acceptance or our competitors could develop alternative technologies that gain broader market acceptance than our products. If we are unable to develop and introduce technologically advanced products that respond to evolving industry standards and customer needs, or if we are unable to complete the development and introduction of these products on a timely and cost effective basis, it could have a material adverse effect on our business, financial position, results of operations or cash flows or could result in our technology becoming obsolete.
Wireless network operator consolidating, future business combinations could result in a loss of revenue for our business.
The telecommunications industry generally is currently undergoing a consolidation phase. Many of our customers, specifically wireless carrier customers of our Commercial Segment, have or may become the target of acquisitions. If the number of our customers is significantly reduced as a result of this consolidation trend, or if the resulting companies do not utilize our product offerings, our business, financial position, results of operations or cash flows could be adversely affected.
Concerns about personal privacy and commercial solicitation may limit the growth of mobile location-based services and change the business models appropriate for service delivery, affecting our business opportunities.
In order for mobile location products and services to function properly, wireless carriers must locate their subscribers and store information on each subscriber’s location. Although data regarding the location of the wireless user resides only on the wireless carrier’s systems, users may not feel comfortable with the idea that the wireless carrier knows and can track their location. Carriers will need to obtain subscribers’ permission to gather and use the subscribers’ personal information, or they may not be able to provide customized mobile location services which those subscribers might otherwise desire. If subscribers view mobile location services as an annoyance or a threat to their privacy, that could reduce demand for our products and services and have an adverse effect on our business, financial position, results of operations or cash flows.
Technology Risks
Because our software may contain defects or errors, and our hardware products may incorporate defective components, our sales could decrease if these defects or errors adversely affect our reputation or delays shipments of our products.
The software products that we develop are complex and must meet the stringent technical requirements of our customers. Our hardware products are equally complex and integrate a wide variety of components from different vendors. We must quickly develop new products and product enhancements to keep pace with the rapidly changing software and telecommunications markets in which we operate. Products as complex as ours are likely to contain undetected errors or defects, especially when first introduced or when new versions are released. Our products may not be error or defect free after delivery to customers, which could damage our reputation, cause revenue losses, result in the rejection of our products or services, divert development resources and increase service and warranty costs, each of which could have a serious harmful effect on our business, financial position, results of operations or cash flows.
If we are unable to protect our intellectual property rights or are sued by third parties for infringing upon intellectual property rights, we may incur substantial costs.
Our success and competitive position depends in large part upon our ability to develop and maintain the proprietary aspects of our technology. We rely on a combination of patent, copyright, trademark, service mark, trade secret laws, confidentiality provisions and various other contractual provisions to protect our proprietary rights, but these legal means provide only limited protection. Although a number of patents have been issued to us and we have obtained a number of other patents as a result of our acquisitions, we cannot assure you that our issued patents will be upheld if challenged by another party. Additionally, with respect to any patent applications which we have filed, we cannot assure you that any patents will issue as a result of these applications. If we fail to protect our intellectual property, we may not receive any return on the resources expended to create the intellectual property or generate any
19
competitive advantage based on it, and we may be exposed to expensive litigation or risk jeopardizing our competitive position. Similarly, some third parties have claimed and others could claim that our existing and future products or services infringe upon their intellectual property rights. Claims like these could require us to enter into costly royalty arrangements or cause us to lose the right to use critical technology.
Our ability to protect our intellectual property rights is also subject to the terms of future government contracts. We cannot assure you that the federal government will not demand greater intellectual property rights or restrict our ability to disseminate intellectual property. We are also a member of standards-setting organizations and have agreed to license some of our intellectual property to other members on fair and reasonable terms to the extent that the license is required to develop non-infringing products.
Pursuing infringers of our patents and other intellectual property rights can be costly.
Pursuing infringers of our proprietary rights could result in significant litigation costs, and any failure to pursue infringers could result in our competitors utilizing our technology and offering similar products, potentially resulting in loss of a competitive advantage and decreased revenues. Despite our efforts to protect our proprietary rights, existing patent, copyright, trademark and trade secret laws afford only limited protection. In addition, the laws of some foreign countries do not protect our proprietary rights to the same extent as do the laws of the United States. Protecting our know-how is difficult especially after our employees or those of our third party contract service providers end their employment or engagement. Attempts may be made to copy or reverse-engineer aspects of our products or to obtain and use information that we regard as proprietary. Accordingly, we may not be able to prevent the misappropriation of our technology or prevent others from developing similar technology. Furthermore, policing the unauthorized use of our products is difficult and expensive. Litigation may be necessary in the future to enforce our intellectual property rights or to determine the validity and scope of the proprietary rights of others. The costs and diversion of resources could significantly harm our business. If we fail to protect our intellectual property, we may not receive any return on the resources expended to create the intellectual property or generate any competitive advantage based on it.
Third parties may claim we are infringing their intellectual property rights and we could be prevented from selling our products, or suffer significant litigation expense, even if these claims have no merit, and our customers also could demand indemnification for such claims.
Our competitive position is driven in part by our intellectual property and other proprietary rights. Third parties, however, may claim that we, our products, operations or any products or technology we obtain from other parties are infringing their intellectual property rights, and we may be unaware of intellectual property rights of others that may cover some of our assets, technology and products. From time to time we receive letters from third parties that allege we are infringing their intellectual property and asking us to license such intellectual property. We review the merits of each such letter and respond as we deem appropriate.
From time to time our customers are parties to allegations of intellectual property infringement claims based on solutions which incorporate our products and services, which may lead to demands from our customers to indemnify them for costs in defending those allegations. Any litigation regarding patents, trademarks, copyrights or intellectual property rights, even those without merit, and the related indemnification demands of our customers, can be costly and time consuming, and divert our management and key personnel from operating our business. The complexity of the technology involved and inherent uncertainty and cost of intellectual property litigation increases our risks. If any third party has a meritorious or successful claim that we are infringing its intellectual property rights, we may be forced to change our products or enter into licensing arrangements with third parties, which may be costly or impractical. This also may require us to stop selling our products as currently engineered, which could harm our competitive position. We also may be subject to significant damages or injunctions that prevent the further development and sale of certain of our products or services and may result in a material loss of revenue.
The measures we have implemented to secure information we collect and store or enable access to may be breached, which could cause us to breach agreements with our partners and expose us to potential investigation and penalties by authorities and potential claims by persons whose information was disclosed.
We take reasonable steps to protect the security, integrity and confidentiality of the information we collect and store and to prevent unauthorized access to third party data to which we enable access through our products, but there is no guarantee that inadvertent or unauthorized disclosure will not occur or that third parties will not gain unauthorized access despite our efforts. If such unauthorized disclosure or access does occur, we may be required to notify persons whose information was disclosed or accessed under existing and proposed laws. Because the techniques used to obtain unauthorized access, disable or degrade service, or sabotage systems change frequently and are often not recognized until launched against a target, we may be unable to anticipate these techniques or implement adequate preventative measures. We also may be subject to claims of breach of contract for such disclosure, investigation and penalties by regulatory authorities and potential claims by persons whose information was disclosed.
20
If there is a security breach or if there is an inappropriate disclosure of any of these types of information, we could be exposed to investigations, litigation, fines and penalties. Remediation of and liability for loss or misappropriation of end user or employee personal information could have a material adverse effect on our business and financial results. Even if we were not held liable for such event, a security breach or inappropriate disclosure of personal, private or confidential information could harm our reputation and our relationships with current and potential customers and end users. Even the perception of a security risk could inhibit market acceptance of our products and services. We may be required to invest additional resources to protect against damages caused by any actual or perceived disruptions of our services. We may also be required to provide information about the location of an end user’s mobile device to government authorities, which could result in public perception that we are providing the government with intelligence information and deter some end users from using our services. Any of these developments could harm our business.
Because our systems may be vulnerable to systems failures and security risks, we may incur significant costs to protect against the threat of these problems.
We provide for the delivery of information and content to and from wireless devices in a prompt and timely manner. Any systems failure that causes a disruption in our ability to facilitate the transmission of information to these wireless devices could result in delays in end users receiving this information and cause us to lose customers. Our systems could experience such failures as a result of unauthorized access by hackers, computer viruses, hardware or software failures, power or telecommunications failures and other accidental or intentional actions which could disrupt our systems. We may incur significant costs to prevent such systems disruptions.
The wireless data services provided by our Commercial Segment are dependent on real-time, continuous feeds from map and traffic data vendors and others. The ability of our subscribers to receive critical location and business information requires timely and uninterrupted connections with our wireless network carriers. Any disruption from our satellite feeds or backup landline feeds could result in delays in our subscribers’ ability to receive information. We cannot be sure that our systems will operate appropriately if we experience hardware or software failure, intentional disruptions of service by third parties, an act of God or an act of war. A failure in our systems could cause delays in transmitting data, and as a result we may lose customers or face litigation that could involve material costs and distract management from operating our business.
If wireless handsets pose health and safety risks, we may be subject to new regulations and demand for our products and services may decrease.
Media reports have suggested that certain radio frequency emissions from wireless handsets may be linked to various health concerns, including cancer, and may interfere with various electronic medical devices, including hearing aids and pacemakers. Concerns over radio frequency emissions may have the effect of discouraging the use of wireless handsets, which would decrease demand for our services. In recent years, the FCC and foreign regulatory agencies have updated the guidelines and methods they use for evaluating radio frequency emissions from radio equipment, including wireless handsets. In addition, interest groups have requested that the FCC investigate claims that wireless technologies pose health concerns and cause interference with airbags, hearing aids and other medical devices. There also are some safety risks associated with the use of wireless handsets while driving. Concerns over these safety risks and the effect of any legislation that may be adopted in response to these risks could limit our ability to market and sell our products and services.
Risks Related to Our Class A Common Stock
The price of our Class A common stock historically has been volatile. This volatility may affect the price at which you could sell your Class A common stock, and the sale of substantial amounts of our Class A common stock could adversely affect the price of our Class A common stock.
The market price for our Class A common stock has experienced significant volatility. This volatility may affect the price at which you could sell the Class A common stock and the sale of substantial amounts of our Class A common stock could adversely affect the price of our Class A common stock. Our stock price is likely to continue to be volatile and subject to significant price and volume fluctuations in response to market and other factors, including the other factors discussed in these risk factors; variations in our quarterly operating results from our expectations or those of securities analysts or investors; downward revisions in securities analysts’ estimates; and announcement by us or our competitors of significant acquisitions, strategic partnerships, joint ventures or capital commitments.
A significant percentage of our common stock is beneficially owned by our President, Chief Executive Officer and Chairman of the Board, and he can exert significant influence over us.
We have two classes of common stock: Class A common stock and Class B common stock. Holders of Class A common stock generally have the same rights as holders of Class B common stock, except that holders of Class A common stock have one vote per share while holders of Class B common stock have three votes per share. As of December 31, 2014, Maurice B. Tosé, our President,
21
Chief Executive Officer and Chairman of the Board, beneficially owned 4,801,245 shares of our Class B common stock and 2,761,285 shares of our Class A common stock. Therefore, as of that date, in the aggregate, Mr. Tosé beneficially owned shares representing approximately 24% of our total voting power, assuming no conversion or exercise of issued and outstanding convertible or exchangeable securities held by our other shareholders or holders of the notes. Mr. Tosé can exert significant influence over us through his ability to influence the outcome of elections of directors, amendments to our charter and by-laws and other actions requiring shareholder action, including mergers, going private transactions and other extraordinary transactions. Mr. Tosé may also be able to deter or prevent a change of control regardless of whether holders of Class A common stock might benefit financially from such a transaction.
If our business does not generate sufficient cash to fund our operations and we are unable to obtain additional capital when needed, we may not be able to continue to grow our business.
We believe that our cash and cash equivalents, and our bank line of credit, coupled with the funds anticipated to be generated from operations will be sufficient to finance our operations for at least the next twelve months. However, unanticipated events could cause us to fall short of our capital requirements. In addition, such unanticipated events could cause us to violate our bank credit covenants, enabling bank remedies provided in their agreement with us making it necessary for us to return to the public markets or to establish new credit facilities or raise capital in private transactions in order to meet our capital requirements. We cannot assure you that we will be able to raise additional capital in the future on terms acceptable to us, or at all.
Our bank credit facility contains covenants requiring us to maintain fixed charge coverage and leverage ratios; as well as other restrictive covenants. The agreement also provides subjective events of default based upon (i) no material adverse change in the business, operations, or condition (financial or otherwise) of our Company occur, or (ii) no material impairment of the prospect of repayment of the Company’s obligations under the bank credit agreement; or (iii) no material impairment of perfection or priority of the lenders security interests in the collateral under the bank credit agreement. If our performance does not result in compliance with any of the restrictive covenants, and our lenders exercise their rights under the subjective acceleration clause referred to above, we would seek to further modify our financing arrangements, but there can be no assurance that our debt holders would not exercise their rights and remedies under their agreements with us, including declaring all outstanding debt due and payable. If we are not in compliance with one or more of our covenants which if not complied with could result in an event of default under our line of credit or term loan, there can be no assurance that our lenders would waive such non-compliance. In such an event, we would be prohibited from drawing funds against the line of credit and our indebtedness under the line of credit and term loan could be accelerated. This could have a material adverse effect on our business, financial condition, results of operation, liquidity, or stock price.
Our short-term investments are subject to market fluctuations which may affect our liquidity.
Although we have not experienced any material losses on our cash, cash equivalents, and short-term investments, declines in the market values of these investments in the future could have an adverse impact on our financial condition and operating results. Historically, we have invested in AAA rated money market funds meeting certain criteria. These investments are subject to general credit, liquidity, market, and interest rate risks, which may be directly or indirectly impacted by the U.S. sub-prime mortgage defaults that have affected various sectors of the financial markets causing credit and liquidity issues. If an issuer defaults on its obligations, or its credit ratings are negatively affected by liquidity, losses or other factors, the impact on liquidity could decline and could have a material adverse effect on our business, financial position, results of operations or cash flows.
Failure to hedge effectively against interest rate changes may adversely affect our results of operations.
The interest rate swap agreement we use to manage some of our exposure to interest rate volatility involve risks, such as the risk that counterparties may fail to honor their obligations under these arrangements. In addition, these arrangements may not be effective in reducing our exposure to changes in interest rates. These risk factors may lead to failure to hedge effectively against changes in interest rates and therefore may adversely affect our results of operations.
Variations in quarterly operating results due to factors such as changes in demand for our products and changes in our mix of revenues and costs may cause our Class A common stock price to decline.
Our revenue and operating results are difficult to predict and are likely to fluctuate from quarter-to-quarter. For example, 2014 systems revenue was higher in the fourth quarter of the year compared to 2013 systems revenue which was lower in the fourth quarter. We generally derive a significant portion of wireless carrier systems revenue in our Commercial Segment from initial license fees. The initial license fees that we receive in a particular quarter may vary significantly. As systems projects begin and end, quarterly results may vary. We therefore believe that quarter-to-quarter comparisons of our operating results may not be a good indication of our future performance, and you should not rely on them to predict our future performance or the future performance of our Class A common
22
stock. If our operating results in future quarters fall below the expectations of market analysts and investors, the market price of our stock may fall.
Factors that have either caused our results to fluctuate in the past or that are likely to do so in the future include:
|
· |
changes in our relationships with wireless carriers, the U.S. government or other customers; |
|
· |
timing and success of introduction of new products and services and our wireless carrier partners’ marketing expenditures; |
|
· |
changes in pricing policies and product offerings by us or our competitors; |
|
· |
changes in projected profitability of acquired assets requiring the write down of the value of the goodwill reflected on our balance sheet; |
|
· |
loss of subscribers by our wireless carrier partners or a reduction in the number of subscribers to plans that include our services; |
|
· |
the timing and quality of information we receive from our wireless carrier partners; |
|
· |
the timing and success of new mobile phone introductions by our wireless carrier partners; |
|
· |
our ability to attract new end users; |
|
· |
the extent of any interruption in our services; |
|
· |
costs associated with advertising, marketing and promotional efforts to acquire new customers; |
|
· |
capital expenditures and other costs and expenses related to improving our business, expanding operations and adapting to new technologies and changes in consumer preferences; and |
|
· |
our lengthy and unpredictable sales cycle. |
We may not have, and may not have the ability to raise, the funds necessary to repurchase our currently outstanding Convertible Senior Notes upon a fundamental change, as required by the indenture governing the Convertible Senior Notes.
Following a fundamental change as described in the indenture governing the Convertible Senior Notes, holders of those notes may require us to repurchase their notes for cash. A fundamental change may also constitute an event of default or prepayment under, and result in the acceleration of the maturity of, our then existing indebtedness. We cannot provide any assurance that we will have sufficient financial resources, or will be able to arrange financing to pay the repurchase price in cash with respect to any notes tendered by holders for repurchase upon a fundamental change. In addition, restrictions in our then-existing credit facilities or other indebtedness, if any, may not allow us to repurchase the Convertible Senior Notes. The failure of us to repurchase the notes when required would result in an event of default with respect to the Convertible Senior Notes which could in turn constitute a default under the terms of our other indebtedness, if any, and have an adverse effect on our business, financial position, results of operations or cash flows.
Future sales of our Class A common stock in the public market or issuances of securities convertible into our Class A common stock and hedging activities could lower the market price for our Class A common stock and adversely impact the trading price of the notes.
As of December 31, 2014, we had outstanding approximately 57 million shares of our Class A common stock and options to purchase approximately 16 million shares of our Class A common stock. In the future, we may sell additional shares of our Class A common stock to raise capital. In addition, a substantial number of shares of our Class A common stock are reserved for issuance upon the exercise of stock options and upon conversion of the Convertible Notes. Our Class A common stock may also be issued upon conversion of our Class B common stock, which is convertible into our Class A common stock on a one-for-one basis. As of December 31, 2014, we had approximately 5 million shares of Class B common stock outstanding. We cannot predict the size of future issuances or the effect, if any, that they may have on the market price for our Class A common stock. The issuance and sale of substantial amounts of Class A common stock, or the perception that such issuances and sales may occur, could adversely affect the trading price of the Convertible Notes and the market price of our Class A common stock and impair our ability to raise capital through the sale of additional equity securities.
23
The fundamental change purchase feature of the Convertible Senior Notes may delay or prevent an otherwise beneficial attempt to purchase our company.
The terms of the Convertible Senior Notes require us to purchase them for cash in the event of a fundamental change. A takeover of our Company would trigger the requirement that we purchase the Convertible Senior Notes. This may have the effect of delaying or preventing a takeover that would otherwise be beneficial to investors.
Our governing corporate documents and Maryland law contain certain anti-takeover provisions that could prevent a change of control that may be favorable to shareholders.
We are a Maryland corporation. Anti-takeover provisions of Maryland law and provisions contained in our charter and by-laws could make it more difficult for a third party to acquire control of us, even if a change in control would be beneficial to shareholders. These provisions include the following:
|
· |
authorization of the board of directors to issue “blank check” preferred stock; |
|
· |
prohibition of cumulative voting in the election of directors; |
|
· |
our classified board of directors; |
|
· |
limitation of the persons who may call special meetings of shareholders; |
|
· |
prohibition on shareholders acting without a meeting other than through unanimous written consent; |
|
· |
supermajority voting requirement on various charter and by-law provisions; and |
|
· |
establishment of advance notice requirements for nominations for election to the board of directors or for proposing matters that can be acted on by shareholders at shareholder meetings. |
These provisions could delay, deter or prevent a potential acquirer from attempting to obtain control of us, depriving shareholders of an opportunity to receive a premium for Class A common stock. These provisions could therefore materially adversely affect the market price of our Class A common stock.
Item 1B. Unresolved Staff Comments
None.
Our principal executive office is located in Annapolis, Maryland, as well as portions of our Commercial and Government Segments. Our office in Seattle, Washington is used primarily for servicing and hosting our wireless and VoIP E9-1-1 public safety support services. The design and development of our software based systems and applications are located in Annapolis, Maryland, Seattle, Washington, Aliso Viejo, California, Calgary, Canada, and North Wollongong, Australia. Major Government Segment operations are in Tampa, Florida and Hanover, Maryland.
The following table lists significant leased facilities at December 31, 2014:
|
Location: |
|
Size: |
|
|
|
Lease Expiration: |
|
|
Annapolis, Maryland |
|
|
43,000 |
|
square feet |
|
July 2019 |
|
Seattle, Washington |
|
|
57,000 |
|
square feet |
|
October 2017 |
|
Tampa, Florida |
|
|
45,600 |
|
square feet |
|
December 2022 |
|
Hanover, Maryland |
|
|
36,000 |
|
square feet |
|
August 2017 |
|
Torrance, California |
|
|
35,000 |
|
square feet |
|
January 2018 |
|
Aliso Viejo, California |
|
|
29,000 |
|
square feet |
|
December 2017 |
|
Greenwood Village, Colorado |
|
|
17,000 |
|
square feet |
|
May 2020 |
|
Richardson, Texas |
|
|
13,000 |
|
square feet |
|
April 2015 |
|
Manassas, Virginia |
|
|
10,000 |
|
square feet |
|
November 2017 |
|
Total |
|
|
285,600 |
|
square feet |
|
|
|
|
|
|
|
|
|
|
|
24
From time to time, some of our customers have sought indemnification under their contractual arrangements with us for costs associated with defending lawsuits alleging infringement of certain patents through the use of our products and services and the use of our products and services in combination with products and services of other vendors. In some cases we have agreed to assume the defense of the case. In others, the Company will continue to negotiate with these customers in good faith because the Company believes its technology does not infringe the cited patents and due to specific clauses within the customer contractual arrangements that may or may not give rise to an indemnification obligation. The Company cannot currently predict the outcome of these matters and the resolutions could have a material effect on our consolidated results of operations, financial position or cash flows.
Item 4. Mine Safety Disclosure
Not applicable.
25
Item 5. Market for Registrant’s Common Equity, Related Stockholder Matters and Issuer Purchases of Equity Securities
Our Class A Common Stock has been traded on the NASDAQ Global Market under the symbol “TSYS” since our initial public offering on August 8, 2000. The following table sets forth, for the periods indicated, the high and low sales prices for our Class A Common Stock as reported on the NASDAQ Global Market:
|
|
|
|
|
|
|
|
|
|
|
High |
|
|
Low |
|
||
|
2015 |
|
|
|
|
|
|
|
|
First Quarter 2015 (through March 5, 2015) |
$ |
3.39 |
|
|
$ |
2.79 |
|
|
|
|
|
|
|
|
|
|
|
2014 |
|
|
|
|
|
|
|
|
First Quarter 2014 |
$ |
2.50 |
|
|
$ |
2.08 |
|
|
Second Quarter 2014 |
$ |
3.47 |
|
|
$ |
2.16 |
|
|
Third Quarter 2014 |
$ |
3.59 |
|
|
$ |
2.75 |
|
|
Fourth Quarter 2014 |
$ |
3.26 |
|
|
$ |
2.72 |
|
|
|
|
|
|
|
|
|
|
|
2013 |
|
|
|
|
|
|
|
|
First Quarter 2013 |
$ |
2.65 |
|
|
$ |
2.11 |
|
|
Second Quarter 2013 |
$ |
2.42 |
|
|
$ |
1.82 |
|
|
Third Quarter 2013 |
$ |
3.21 |
|
|
$ |
2.31 |
|
|
Fourth Quarter 2013 |
$ |
2.59 |
|
|
$ |
2.10 |
|
|
|
|
|
|
|
|
|
|
There are approximately 6,500 shareholders of our Class A Common Stock and as of March 5, 2015, approximately 260 were holders of record. As of March 5, 2015, there were 8 holders of record of our Class B Common Stock.
Dividend Policy
We have never declared or paid cash dividends on our common stock. We currently intend to retain any future earnings to fund the development, growth and operation of our business. Additionally, under the terms of our loan arrangements, our lender’s prior written consent is required to pay cash dividends on our common stock. We do not currently anticipate paying any cash dividends on our common stock in the foreseeable future.
Issuer Purchases of Equity Securities
None.
Stock Performance Graph
The following graph compares the cumulative total shareholder return on the Company’s Class A Common Stock with the cumulative total return of the Nasdaq Global Market U.S. Index and a mobile data index prepared by the Company of the following relevant publicly traded companies in the commercial and government sectors in which we operate: CACI International Inc.; Comtech Telecommunications Corp.; Comverse, Inc..; General Dynamics Corp.; Harris Corp.; The KEYW Holding Corporation; Kratos Defense & Security Solutions, Inc.; Mavenir Systems, Inc.; NCI Inc.; NeuStar, Inc.; Rockwell Collins, Inc.; LM Ericsson Telephone Company; Telenav, Inc.; and ViaSat, Inc. (the “New Peer Group”).
The composition of the Mobile Data Index has been changed from last year (the “Old Peer Group”) as follows: (1) Blackberry’s and Garmin’s business models have diverged from comparability to ours. Comverse, Inc. and Mavenir Systems, Inc. have been added to the New Peer Group because they have gone public and are engaged in businesses similar to our technology services to network operators.
The information provided is from January 1, 2009 through December 31, 2014.
26
This performance graph shall not be deemed “filed” for purposes of Section 18 of the Exchange Act, or incorporated by reference into any filing of the Company under the Securities Act or the Exchange Act, except as shall be expressly set forth by specific reference in such filing. The stock price performance shown on the graph below is not necessarily indicative of future price performance.
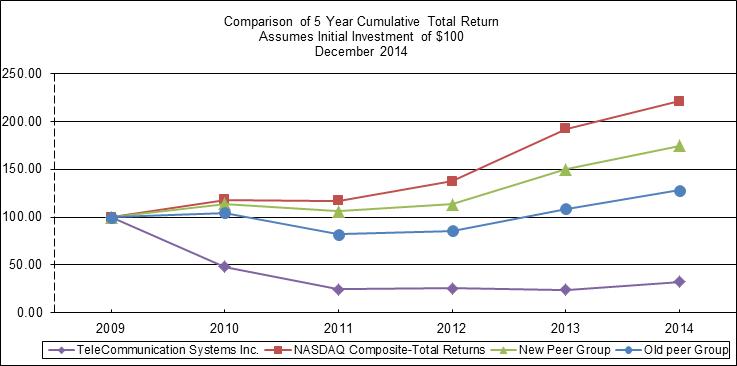
Item 6. Selected Financial Data
The table that follows presents portions of our consolidated financial statements. You should read the following selected financial data together with our audited Consolidated Financial Statements and related notes and with “Management’s Discussion and Analysis of Financial Condition and Results of Operations” and the more complete financial information included elsewhere in this Form 10-K. We have derived the statements of operations data for the years ended December 31, 2014, 2013, and 2012 and the balance sheet data as of December 31, 2014 and 2013 from our consolidated financial statements which have been audited by Ernst & Young LLP, independent registered public accounting firm, and which are included in Item 15 of this Form 10-K. We have derived the statements of operations data for the years ended December 31, 2011 and 2010 and the balance sheet data as of December 31, 2012, 2011, and 2010, from our audited financial statements which are not included in this Form 10-K. The historical results presented below are not necessarily indicative of the results to be expected for any future fiscal year. See “Management’s Discussion and Analysis of Financial Condition and Results of Operations.”
27
|
|
|
Year Ended December 31, |
|
|||||||||||||||||
|
|
|
2014 |
|
|
2013 |
|
|
2012 |
|
|
2011 |
|
|
2010 |
|
|||||
|
Statement of Operations Data: |
|
(in millions, except share and per share data) |
|
|||||||||||||||||
|
|
|
|
|
|
|
|
|
|
|
|
|
|
|
|
|
|
|
|
|
|
|
Revenue |
|
|
|
|
|
|
|
|
|
|
||||||||||
|
Services |
|
$ |
260.7 |
|
|
$ |
281.4 |
|
|
$ |
305.1 |
|
|
$ |
303.9 |
|
|
$ |
262.3 |
|
|
Systems |
|
|
99.1 |
|
|
|
80.9 |
|
|
|
182.3 |
|
|
|
121.5 |
|
|
|
126.5 |
|
|
Total revenue |
|
|
359.8 |
|
|
|
362.3 |
|
|
|
487.4 |
|
|
|
425.4 |
|
|
|
388.8 |
|
|
Direct costs of revenue |
|
|
|
|
|
|
|
|
|
|
|
|
|
|
|
|
|
|
|
|
|
Direct cost of services revenue |
|
|
142.2 |
|
|
|
156.3 |
|
|
|
178.3 |
|
|
|
171.0 |
|
|
|
152.2 |
|
|
Direct cost of systems revenue |
|
|
70.1 |
|
|
|
67.0 |
|
|
|
148.9 |
|
|
|
103.2 |
|
|
|
98.6 |
|
|
Total direct cost of revenue |
|
|
212.3 |
|
|
|
223.3 |
|
|
|
327.2 |
|
|
|
274.2 |
|
|
|
250.8 |
|
|
|
|
|
|
|
|
|
|
|
|
|
|
|
|
|
|
|
|
|
|
|
|
Services gross profit |
|
|
118.5 |
|
|
|
125.1 |
|
|
|
126.8 |
|
|
|
132.9 |
|
|
|
110.1 |
|
|
Systems gross profit |
|
|
29.0 |
|
|
|
13.9 |
|
|
|
33.4 |
|
|
|
18.3 |
|
|
|
27.9 |
|
|
Total gross profit |
|
|
147.5 |
|
|
|
139.0 |
|
|
|
160.2 |
|
|
|
151.2 |
|
|
|
138.0 |
|
|
Operating expenses |
|
|
|
|
|
|
|
|
|
|
|
|
|
|
|
|
|
|
|
|
|
Research and development expense |
|
|
41.7 |
|
|
|
34.3 |
|
|
|
36.6 |
|
|
|
37.1 |
|
|
|
30.1 |
|
|
Sales and marketing expense |
|
|
26.0 |
|
|
|
28.5 |
|
|
|
30.7 |
|
|
|
29.4 |
|
|
|
23.9 |
|
|
General and administrative expense |
|
|
50.8 |
|
|
|
54.7 |
|
|
|
54.3 |
|
|
|
46.2 |
|
|
|
37.2 |
|
|
Depreciation and amortization of property and equipment |
|
|
13.0 |
|
|
|
14.8 |
|
|
|
14.2 |
|
|
|
12.1 |
|
|
|
9.7 |
|
|
Amortization of acquired intangible assets |
|
|
3.8 |
|
|
|
4.6 |
|
|
|
4.4 |
|
|
|
5.5 |
|
|
|
4.7 |
|
|
Impairment of goodwill and long-lived assets |
|
|
— |
|
|
|
32.0 |
|
|
|
125.7 |
|
|
|
— |
|
|
|
— |
|
|
Total operating costs and expenses |
|
|
135.3 |
|
|
|
168.9 |
|
|
|
265.9 |
|
|
|
130.3 |
|
|
|
105.6 |
|
|
Income (loss) from operations |
|
|
12.2 |
|
|
|
(29.9 |
) |
|
|
(105.7 |
) |
|
|
20.9 |
|
|
|
32.4 |
|
|
|
|
|
|
|
|
|
|
|
|
|
|
|
|
|
|
|
|
|
|
|
|
Interest expense |
|
|
(8.3 |
) |
|
|
(8.2 |
) |
|
|
(7.4 |
) |
|
|
(7.3 |
) |
|
|
(9.2 |
) |
|
Amortization of deferred financing fees |
|
|
(1.0 |
) |
|
|
(3.4 |
) |
|
|
(0.8 |
) |
|
|
(0.8 |
) |
|
|
(0.8 |
) |
|
Gain (loss) on early retirement of debt |
|
|
— |
|
|
|
(0.2 |
) |
|
|
0.4 |
|
|
|
— |
|
|
|
— |
|
|
Other income (expense), net |
|
|
(1.1 |
) |
|
|
(0.3 |
) |
|
|
— |
|
|
|
(0.4 |
) |
|
|
1.6 |
|
|
Net income (loss) before income taxes |
|
|
1.8 |
|
|
|
(42.0 |
) |
|
|
(113.5 |
) |
|
|
12.4 |
|
|
|
24.0 |
|
|
Benefit (provision) for income taxes |
|
|
(3.5 |
) |
|
|
(16.6 |
) |
|
|
15.5 |
|
|
|
(5.4 |
) |
|
|
(8.1 |
) |
|
|
|
|
|
|
|
|
|
|
|
|
|
|
|
|
|
|
|
|
|
|
|
Net income (loss) |
|
$ |
(1.7 |
) |
|
$ |
(58.6 |
) |
|
$ |
(98.0 |
) |
|
$ |
7.0 |
|
|
$ |
15.9 |
|
|
|
|
|
|
|
|
|
|
|
|
|
|
|
|
|
|
|
|
|
|
|
|
Net income (loss) per share-basic |
|
$ |
(0.03 |
) |
|
$ |
(1.00 |
) |
|
$ |
(1.69 |
) |
|
$ |
0.12 |
|
|
$ |
0.30 |
|
|
Net income (loss) per share-diluted1 |
|
$ |
(0.03 |
) |
|
$ |
(1.00 |
) |
|
$ |
(1.69 |
) |
|
$ |
0.12 |
|
|
$ |
0.28 |
|
|
|
|
|
|
|
|
|
|
|
|
|
|
|
|
|
|
|
|
|
|
|
|
Basic shares used in computation (in thousands) |
|
|
59,466 |
|
|
|
58,611 |
|
|
|
57,889 |
|
|
|
56,722 |
|
|
|
53,008 |
|
|
Diluted shares used in computation (in thousands) |
|
|
59,466 |
|
|
|
58,611 |
|
|
|
57,889 |
|
|
|
58,581 |
|
|
|
56,032 |
|
|
|
|
|
|
|
|
|
|
|
|
|
|
|
|
|
|
|
|
|
|
|
|
1 Shares issuable via the convertible notes are included if diluted, in which case tax-effected interest on the debt is excluded from the determination of Net income (loss) per share-diluted, see Note 3 presented in the Notes to Consolidated Financial Statements. |
|
|||||||||||||||||||
|
|
|
|
|
|
|
|
|
|
|
|
|
|
|
|
|
|
|
|
|
|
|
|
|
|
|
|||||||||||||||||
|
As of December 31: |
|
2014 |
|
|
2013 |
|
|
2012 |
|
|
2011 |
|
|
2010 |
|
|||||
|
|
|
(in millions) |
|
|||||||||||||||||
|
Balance Sheet Data: |
|
|
|
|
|
|
|
|
|
|
|
|
|
|
|
|
|
|
|
|
|
Cash and cash equivalents |
|
$ |
26.9 |
|
|
$ |
41.9 |
|
|
$ |
36.6 |
|
|
$ |
40.9 |
|
|
$ |
45.2 |
|
|
Working capital |
|
|
74.3 |
|
|
|
55.2 |
|
|
|
82.6 |
|
|
|
87.0 |
|
|
|
89.6 |
|
|
Total assets |
|
|
334.1 |
|
|
|
321.5 |
|
|
|
413.7 |
|
|
|
489.6 |
|
|
|
462.8 |
|
|
Capital leases and long-term debt (including current portion) |
|
|
139.1 |
|
|
|
147.5 |
|
|
|
167.6 |
|
|
|
140.8 |
|
|
|
160.5 |
|
|
Total liabilities |
|
|
221.2 |
|
|
|
212.2 |
|
|
|
252.6 |
|
|
|
238.9 |
|
|
|
247.3 |
|
|
Total stockholders' equity |
|
|
112.8 |
|
|
|
109.3 |
|
|
|
161.1 |
|
|
|
250.7 |
|
|
|
215.5 |
|
|
|
|
|
|
|
|
|
|
|
|
|
|
|
|
|
|
|
|
|
|
|
28
Item 7. Management’s Discussion and Analysis of Financial Condition and Results of Operations
Critical Accounting Policies and Estimates
Management’s Discussion and Analysis of Financial Condition and Results of Operations addresses our consolidated financial statements, which have been prepared in accordance with U.S. generally accepted accounting principles. The preparation of these financial statements requires management to make estimates and assumptions that affect the reported amounts of assets and liabilities at the date of the financial statements and the reported amounts of revenues and expenses during the reporting period. On an on-going basis, management evaluates its estimates and judgments. Management bases its estimates and judgments on historical experience and on various other factors that are believed to be reasonable under the circumstances, the results of which form the basis for making judgments about the carrying value of assets and liabilities that are not readily apparent from other sources. Actual results may differ from these estimates under different assumptions or conditions. We have identified our most critical accounting policies and estimates to be those related to the following:
Revenue Recognition. We recognize revenue according to the guidance in the Accounting Standards Update (“ASU”) 2009-14 (ASC topic 985) “Certain Revenue Arrangements That Include Software Elements” and the ASU 2009-13 (ASC topic 605) “Revenue Recognition — Multiple Deliverable Revenue Arrangements”. We recognize revenue when all of the following criteria are met: (i) persuasive evidence of an arrangement exists, (ii) delivery has occurred, (iii) the fee is fixed or determinable, and (iv) the fee is probable of collection.
Revenue is reported as described below:
Services Revenue. Revenue from hosted and subscriber services consists of monthly recurring service fees and is recognized in the month earned. Maintenance fees are generally collected in advance and recognized ratably over the maintenance period. Services revenue for consulting, training and the design, development, deployment, field support and maintenance of communication systems is generated under time and materials contracts, cost plus fee contracts, or fixed price contracts. Revenue is recognized under time and materials contracts and cost plus fee contracts as billable costs are incurred. Fixed-price service contracts are accounted for using the proportional performance method. These contracts generally allow for monthly billing or billing upon achieving certain specified milestones.
Systems Revenue. We design, develop, and deploy custom communications products, components, and systems. Custom systems contracts often contain multiple elements, which may include hardware, installation, integration, product licenses and maintenance, which are either incidental or provide essential functionality.
We allocate the fees in a multi-element arrangements based on the relative fair value of each element, using vendor-specific objective evidence (“VSOE”) of their fair values, if available. VSOE is generally determined based on the price charged when an element is sold separately. In the absence of VSOE of fair value, the fee is allocated among each element based on third-party evidence (“TPE”) of fair value, which is determined based on competitor pricing for similar deliverables when sold separately. When the Company is unable to establish fair value using VSOE or TPE, the Company uses estimated selling price (“ESP”) to allocate value to each element. The objective of ESP is to determine the price at which the Company would transact a sale if the product or service were sold separately. The Company determines ESP for deliverables by considering multiple factors including, but not limited to, prices it charges for similar offerings, market conditions, competitive landscape, and pricing practices.
Fees from the development and implementation of custom systems are generally performed under time and materials and fixed fee contracts. Revenue is recognized under time and materials contracts and cost plus fee contracts as billable costs are incurred. Fixed-price product delivery contracts are accounted for using the percentage-of-completion or proportional performance method, measured either by total costs incurred as a percentage of total estimated costs at the completion of the contract, or direct labor costs incurred compared to estimated total direct labor costs for projects for which third-party hardware represents a significant portion of the total estimated costs. These contracts generally allow for monthly billing or billing upon achieving certain specified milestones. Any estimated losses under long-term contracts are recognized in their entirety at the date that it becomes probable of occurring. Revenue from hardware sales to monthly subscriber customers is recognized as systems revenue. The Company has contracts and purchase orders where revenue is recognized at the time products or services are delivered, or when the product is shipped and the risk of the loss is transferred to the buyer, net of discounts.
Software licenses are generally perpetual licenses for a specified number of users that allow for the purchase of annual maintenance at a specified rate. All fees are recognized as revenue when the four criteria described above are met. For multiple element arrangements that contain only software and software-related elements, we allocate the fees to each element based on the VSOE of fair value of each element. Systems containing software licenses include a 90-day warranty for defects. We have not incurred significant warranty costs on any software product to date, and no costs are currently accrued upon recording the related revenue.
29
Revenue generated from our intellectual property consists of patent infringement liabilities, upfront and non-refundable license fees, royalty fees, and sales of our patents. Revenue from upfront and non-refundable payments is recognized when the arrangement is executed. When patent licensing arrangements include royalties for future sales of products using our licensed patented technology, revenue is recognized when earned during the applicable period. Due to the nature of some of the agreements it may be difficult to establish VSOE of separate elements of an agreement, in these circumstances the appropriate recognition of revenue may require the use of judgment based on the particular facts and circumstances. In all cases, revenue from the licensing of our intellectual property is recognized when all of four of the revenue recognition criteria are met, and included in Commercial systems revenue.
When a customer is billed or we receive payment and we have not met all of the criteria for revenue recognition, the billed or paid amount is recorded as deferred revenue on the Company’s consolidated balance sheet. As the revenue recognition criteria are met, the deferred amounts are recognized as revenue. We defer direct project costs incurred in certain situations as dictated by authoritative accounting literature. The Company classifies deferred revenue and deferred project costs on the consolidated balance sheet as either current or long-term depending on the expected product delivery dates or service coverage periods. Long-term deferred revenue is included in other liabilities and long-term deferred project costs are included in other assets on the Company’s consolidated balance sheet.
Under our contracts with the U.S. government for both systems and services, contract costs, including the allocated indirect expenses, are subject to audit and adjustment by the Defense Contract Audit Agency. We record revenue under these contracts at estimated net realizable amounts.
Business Combinations. Pursuant to ASC 805 for Business Combinations, we account for each business combination under the “acquisition method.” Accordingly, the total estimated purchase prices were allocated to the net tangible and intangible assets acquired in connection with each acquisition, based on their estimated fair values as of the effective date of the acquisition. The preliminary allocation of the purchase prices on each of the acquisitions were based upon management’s preliminary valuation of the fair value of tangible and intangible assets acquired and liabilities assumed and such estimates and assumptions are subject to change (generally one year from their acquisition date). The purchase price allocation process requires management to make significant estimates and assumptions, especially at acquisition date with respect to intangible assets and deferred revenue obligations assumed.
Although we believe the assumptions and estimates we have made are reasonable, they are based in part on historical experience and information obtained from the managements of the acquired companies and are inherently uncertain. Examples of critical estimates in valuing certain of the intangible assets we have acquired or may acquire in the future include but are not limited to:
|
· |
future expected cash flows from application subscriptions, software license sales, support agreements, consulting contracts and acquired developed technologies and patents; |
|
· |
expected costs to develop the in-process research and development into commercially viable products and estimated cash flows from the projects when completed; |
|
· |
the acquired company’s trade name and trademarks as well as assumptions about the period of time the acquired trade name and trademarks will continue to be used in the combined company’s product portfolio; |
|
· |
variable seller consideration arrangements; and |
|
· |
discount rates |
Unanticipated events and circumstances may occur which may affect the accuracy or validity of such assumptions, estimates or actual results.
Acquired Intangible Assets. Acquired intangible assets are amortized over their useful lives of between four and ten years, based on the straight-line method. We evaluate acquired intangible assets when events or changes in circumstances indicate that the carrying values of such assets might not be recoverable. Our review of factors present and the resulting appropriate carrying value of our acquired intangible assets are subject to judgments and estimates by management. Future events such as a significant underperformance relative to historical or projected future operating results, significant changes in the manner of our use of the acquired assets, and significant negative industry or economic trends could cause us to conclude that impairment indicators exist and that our acquired intangible assets might be impaired.
In the fourth quarter of 2013, after adjusting projections for uncertainty at a significant customer, we recorded an impairment charge of $0.6 million to acquired intangible assets. In the second quarter of 2012, after adjusting projections for the impact of a customer contract renegotiation, we recorded an impairment charge of $14 million to acquired intangible assets.
Goodwill. Goodwill represents the excess of cost over the fair value of assets of acquired businesses. Goodwill is not amortized, but instead is evaluated for impairment in the fourth quarter of each fiscal year, or sooner should there be an indicator of impairment.
30
We may assess qualitative factors to determine whether it is more likely than not an event or circumstance might indicate the fair value of the reporting unit is less than its carrying value. Such indicators include a sustained, significant decline in the Company’s stock price and market capitalization, a decline in the Company’s expected future cash flows, a significant adverse change in legal factors or in the business climate, unanticipated competition, and/or slower expected growth, among others. After completing our assessment of such qualitative factors, and if it is determined that it is more likely than not that the fair value of a reporting unit is less than its carrying value we perform a two-step process. The first step requires a comparison of the book value of net assets to the fair value of the reporting units that have goodwill assigned to them. If the fair value is determined to be less than the book value, a second step is performed to compute the amount of the impairment. In the second step, a fair value for implied goodwill is estimated, based in part on the fair value of the reporting unit used in the first step, and is compared to its carrying value. The shortfall of the fair value below carrying value, if any, would represent the amount of goodwill impairment.
For goodwill impairment testing, we have four reporting units. In 2013, the company reorganized operations of the Commercial Segment to better integrate the product lines and create efficiencies. One management team is now responsible for all Commercial Platforms & Applications other than the 9-1-1 Safety and Security part of the Commercial Segment. Previously, our Commercial Segment was comprised of Navigation and Other Commercial reporting units. Our two Government Segment reporting units, the Government Solutions Group unit and the Cyber Intelligence unit, remain the same.
Our year-end goodwill balances by reporting unit were:
|
|
|
2014 |
|
|
2013 |
|
||
|
Platforms and Applications |
|
$ |
27.9 |
|
|
$ |
27.9 |
|
|
Safety and Security Group |
|
|
22.0 |
|
|
|
22.0 |
|
|
Government Solutions Group |
|
|
26.1 |
|
|
|
26.1 |
|
|
Cyber Intelligence |
|
|
28.2 |
|
|
|
28.2 |
|
|
Total goodwill |
|
$ |
104.2 |
|
|
$ |
104.2 |
|
|
|
|
|
|
|
|
|
|
|
2014. In performing our 2014 testing for all of our reporting units, we used a discounted cash flow method as well as a market approach based on observable public comparable company multiples of revenue and earnings before interest, taxes, depreciation, amortization, and amortization of non-cash stock-based compensation (“Adjusted EBITDA”) and weighted the results from the two methods to estimate the reporting units’ fair values.
Our discounted cash flow models are based on our most recent long-range forecast and, for years beyond the forecast, we estimated terminal values based on perpetual cash flow growth rates ranging from 2.5% to 4.0%. The models reflect management’s expectation of future market conditions and expected levels of financial performance for our reporting units, as well as discount rates and estimated terminal values that would be used by market participants in an arms-length transaction. Business operational risks which could impact profits are detailed in our “Risk Factors” disclosures. Discount rates used were intended to reflect the risks inherent in the future cash flows of the respective reporting units and were between 13% and 15%.
For the market comparable approaches, we evaluated comparable company public trading values, and valued our reporting units using multiples of Adjusted EBITDA ranging from approximately 5 to 13 times and multiples of revenue ranging from 0.4 to 1.5 times. Comparable company public trading values are based on the market’s view of future industry conditions and the comparable companies’ future financial results. Adverse changes in any of these variables would negatively influence the valuation of our reporting units. It is not possible to determine the impact of such potential adverse changes on the valuation of our reporting units.
Determining fair value requires the exercise of significant judgment, including judgment about appropriate discount rates, the amount and timing of expected future cash flows, as well as relevant comparable company multiples for the market comparable approach and the relevant weighting of the methods utilized.
For fiscal year 2014, all of our reporting units passed the first step of the goodwill impairment testing, indicating no impairment.
2013. Following our fourth quarter 2013 testing, we wrote down the values of our Platforms and Applications reporting unit’s goodwill and long-lived assets from a carrying value of $65.4 million to their estimated fair value of $33.4 million at December 31, 2013, resulting in an impairment charge of $32 million. We valued the existing technology using a discounted cash flow method to determine whether a write-down was necessary, and after concluding that a write-down was necessary, used a relief from royalty method to value the licensable technology. We then used a discounted cash flow method to determine the fair value of our Platforms and Applications reporting unit. We consulted with a third party valuation firm to assist in the work.
In performing our 2013 testing for our Safety and Security and Cyber Intelligence reporting units, we used a discounted cash flow method as well as a market approach based on observable public comparable company multiples of revenue and Adjusted
31
EBITDA and weighted the results from the two methods to estimate the reporting units’ fair values. For our Government Solutions Group we used only a discounted cash flow method. Determining fair value requires the exercise of significant judgment, including judgment about appropriate discount rates, the amount and timing of expected future cash flows, as well as relevant comparable company multiples for the market comparable approach and the relevant weighting of the methods utilized.
For the market comparable approaches, we evaluated comparable company public trading values and valued our reporting units using multiples of Adjusted EBITDA ranging from approximately 6 to 8 times. Comparable company public trading values are based on the market’s view of future industry conditions and the comparable companies’ future financial results. Adverse changes in any of these variables would negatively influence the valuation of our reporting units. It is not possible to determine the impact of such potential adverse changes on the valuation of our reporting units.
Our discounted cash flow models are based on our most recent long-range forecast and, for years beyond the forecast, we estimated terminal values based on estimated exit multiples ranging from approximately 6 to 7 times the final forecasted year Adjusted EBITDA. They reflect management’s expectation of future market conditions and expected levels of financial performance for our reporting units, as well as discount rates and estimated terminal values that would be used by market participants in an arms-length transaction. Business operational risks which could impact profits are detailed in our “Risk Factors” disclosures. Discount rates used were intended to reflect the risks inherent in the future cash flows of the respective reporting units and were between 13% and 15%.
A summary of the impairment charge recorded in 2013 is as follows:
|
|
|
Carrying Value |
|
|
Fair Value |
|
|
Impairment Charge |
|
|||
|
Goodwill – Platforms and Applications |
|
$ |
36.1 |
|
|
$ |
27.9 |
|
|
$ |
8.2 |
|
|
Property and equipment, including capitalized software for internal use |
|
|
18.1 |
|
|
|
5.5 |
|
|
|
12.6 |
|
|
Software development costs |
|
|
9.3 |
|
|
|
— |
|
|
|
9.3 |
|
|
Other assets |
|
|
1.3 |
|
|
|
— |
|
|
|
1.3 |
|
|
Acquired intangible assets |
|
|
0.6 |
|
|
|
— |
|
|
|
0.6 |
|
|
|
|
$ |
65.4 |
|
|
$ |
33.4 |
|
|
$ |
32.0 |
|
2012. In the second quarter of 2012, we received notice from a significant navigation application customer that it intended to adjust pricing for TCS services. Management considered this to be an indicator that we should evaluate the long-lived assets (including goodwill and other intangible assets) related to the Company’s 2009 acquisition of Networks In Motion, operating as the Company’s Navigation reporting unit, for potential impairment. No triggering events occurred with regard to other reporting units, so an interim analysis of other units was not completed.
We completed Step 1 of the goodwill impairment testing for the Navigation reporting unit using a discounted cash flow (“DCF”) method supported by a market comparable approach. The DCF model was based on our updated long-range forecast for the Navigation reporting unit. For years beyond the forecast, our estimated terminal value was based on a discount rate of approximately 12% and a perpetual cash flow growth rate of 3%. For the market comparable approach, we evaluated comparable company public trading values, using sales and Adjusted EBITDA multiples. The estimated fair value of the Navigation reporting unit was compared to the carrying amount including goodwill, and the results of the Step 1 goodwill testing indicated a potential impairment.
Accordingly, we proceeded with Step 2 of the impairment test to measure the amount of potential impairment. We allocated the fair value of the Navigation reporting unit to its assets and liabilities as of the date of the impairment analysis. As a result of our analysis as described above, an impairment charge of $86.3 million was recorded in 2012 for the excess of the carrying value of goodwill over the estimated fair value.
Our Navigation reporting unit’s goodwill, acquired intangibles, capitalized software development costs, and long-lived assets with a carrying value of $164.5 million were written down to estimated fair value of $38.8 million, resulting in a total impairment charge of $125.7 million. We engaged a third party valuation firm to assist in the determination of the fair value of goodwill, acquired intangibles, capitalized software, and long-lived assets.
32
A summary of the impairment charge recorded in the second quarter of 2012 is as follows:
|
|
|
Carrying Value March 31, 2012 |
|
|
Fair Value June 30, 2012 |
|
|
Total Impairment Charge |
|
|||
|
|
|
|
|
|
|
|
|
|
|
|
|
|
|
Property and Equipment, including capitalized software for |
|
$ |
23.3 |
|
|
$ |
10.3 |
|
|
$ |
13.0 |
|
|
Software development costs |
|
|
18.8 |
|
|
|
6.4 |
|
|
|
12.4 |
|
|
Acquired intangible assets |
|
|
14.0 |
|
|
|
— |
|
|
|
14.0 |
|
|
Goodwill – Navigation |
|
|
108.4 |
|
|
|
22.1 |
|
|
|
86.3 |
|
|
|
|
$ |
164.5 |
|
|
$ |
38.8 |
|
|
$ |
125.7 |
|
|
|
|
|
|
|
|
|
|
|
|
|
|
|
We performed our annual fourth quarter 2012 goodwill Step 1 testing and there was no indication of any further impairment in any of our reporting units, so the second step of the goodwill impairment analysis was not performed. For all reporting units, we used a market approached based on observable public comparable company multiples. For our Navigation and Cyber Intelligence reporting units, we also used a DCF analysis. Where multiple approaches were used, we weight the results from different methods to estimate the reporting unit’s fair value. The cash flows employed in 2012 DCF analyses were based on our most recent long-range forecast and, for years beyond the forecast, we estimated terminal value based on estimated exit multiples ranging from 6 to 7 times the final forecasted year earnings before interest, taxes, depreciation, and amortization. The discount rates used in the DCF analyses were intended to reflect the risks inherent in the future cash flows of the respective reporting units and were approximately 12%. For the market comparable approaches, we evaluated comparable company public trading values, using multiples of earnings before interest, taxes, depreciation, and amortization ranging from 6 to 12 times and multiples of revenue ranging from 1 to 2 times.
Software Development Costs. Acquired technology, representing the estimated value of the proprietary technology acquired, has been recorded as capitalized software development costs. We also capitalize software development costs after we establish technological feasibility, and amortize those costs over the estimated useful lives of the software beginning on the date when the software is available for general release. We believe that these capitalized costs will be recoverable from gross profits generated by these products.
For new products, technological feasibility is established when an operative version of the computer software product is completed in the same software language as the product to be ultimately marketed, performs all the major functions planned for the product, and has successfully completed initial customer testing. Technological feasibility for enhancements to an existing product is established when a detailed program design is completed. Costs that are capitalized include direct labor and other direct costs. In 2014, 2013, and 2012, we capitalized $1.7 million, $2 million, and $1.9 million, respectively, of software development costs for software developed for resale.
These costs are amortized on a product-by-product basis using the straight-line method over the product’s estimated useful life, between three and five years. Amortization is also computed using the ratio that current revenue for the product bears to the total of current and anticipated future revenue for that product (the revenue curve method). If this revenue curve method results in amortization greater than the amount computed using the straight-line method, amortization is recorded at that greater amount. Our policies to determine when to capitalize software development costs and how much to amortize in a given period require us to make subjective estimates and judgments. If our software products do not achieve the level of market acceptance that we expect and our future revenue estimates for these products change, the amount of amortization that we record may increase compared to prior periods. The amortization of capitalized software development costs is recorded as a cost of revenue.
We capitalize all costs related to software developed or obtained for internal use when management commits to funding the project and the project completes the preliminary project stage. Capitalization of such costs ceases when the project is substantially complete and ready for its intended use. Capitalized software development costs for internal use are included in Property and Equipment on the Consolidated Balance Sheets.
No impairment charges were recorded in 2014. In 2013, we recorded an impairment charge of $9.3 million related to our Platforms and Applications reporting unit. In 2012, we recorded an impairment charge of $12.4 million after determining that the capitalized software development costs related to our Navigation reporting unit were not recoverable based on decreased projected revenues and sales pipeline.
Marketable Securities. Our marketable securities are classified as available-for-sale. Our primary objectives when investing are to preserve principal, maintain liquidity, and obtain higher returns than from cash equivalents. Our intent is not specifically to invest and hold securities with longer term maturities. We have the ability and intent, if necessary, to liquidate any of these investments in
33
order to meet our operating needs within the next twelve months. The securities are carried at fair market value based on quoted market price with net unrealized gains and losses in stockholders’ equity as a component of accumulated other comprehensive income. If we determine that a decline in fair value of the marketable securities is other than temporary, a realized loss would be recognized in earnings. Gains or losses on securities sold are based on the specific identification method and are recognized in earnings.
Stock Compensation Expense. We estimate the fair value of our employee stock awards at the date of grant using the Black-Scholes option pricing model, which requires the use of certain subjective assumptions. The most significant of these assumptions are our estimates of expected volatility of the market price of our stock and the expected term of the stock award. We have determined that historical volatility is the best predictor of expected volatility and the expected term of our awards was determined taking into consideration the vesting period of the award, the contractual term and our historical experience of employee stock option exercise behavior. We review our valuation assumptions at each grant date and, as a result, we could change our assumptions used to value employee stock-based awards granted in future periods. In addition, we are required to estimate the expected forfeiture rate and only recognize expense for those awards expected to vest. If our actual forfeiture rate were materially different from our estimate, the stock-based compensation expense would be different from what we have recorded in the current period. Our employee stock-based compensation costs are recognized over the vesting period of the award and are recorded using the straight-line method.
Income Taxes. We use the asset and liability method of accounting for deferred income taxes. Under this method, deferred tax assets and liabilities are determined based on temporary differences between financial reporting basis and the tax basis of assets and liabilities. We also recognize deferred tax assets for tax net operating loss carryforwards. The deferred tax assets and liabilities are measured using the enacted tax rates and laws expected to be in effect when such amounts are projected to reverse or be utilized. The realization of total deferred tax assets is contingent upon the generation of future taxable income in the tax jurisdictions in which the deferred tax assets are located. When appropriate, we recognize a valuation allowance to reduce such deferred tax assets to amounts more likely than not to be realized. The calculation of deferred tax assets (including valuation allowances) and liabilities requires management to apply significant judgment related to such factors as the application of complex tax laws and the changes in such laws. We have also considered our future operating results, which require assumptions such as future market penetration levels, forecasted revenues and the mix of earnings in the jurisdictions in which we operate, in determining the need for a valuation allowance. Changes in our assessment of the need for a valuation allowance could give rise to a change in such allowance, potentially resulting in material amounts of additional tax expense or benefit in the period of change.
We recognize the benefits of tax positions in the financial statements, if such positions are more likely than not to be sustained upon examination by the taxing authority and satisfy the appropriate measurement criteria. If the recognition threshold is met, the tax benefit is generally measured and recognized as the tax benefit having the highest likelihood, based on our judgment, of being realized upon ultimate settlement with the taxing authority, assuming full knowledge of the position and all relevant facts. At December 31, 2014, we had unrecognized tax positions totaling approximately $4.6 million. The determination of these unrecognized amounts requires significant judgments and interpretation of complex tax laws. Different judgments or interpretations could result in material changes to the amount of unrecognized tax positions.
Legal and Other Contingencies. We are currently involved in various claims and legal proceedings. As required, we review the status of each significant matter and assess our potential financial exposure. If the potential loss from any claim or legal proceeding is considered probable and the amount can be reasonably estimated, we accrue a liability for the estimated loss. Significant judgment is required in both the determination of probability and the determination as to whether the amount of an exposure is reasonably estimable. Because of uncertainties related to these matters, accruals are based only on the best information available at the time. As additional information becomes available, we reassess the potential liability related to our pending claims and litigation and may revise our estimates. Such revisions in the estimates of the potential liabilities could have a material impact on our results of operations and financial position.
Acquisitions
We made no material acquisitions in 2014 or 2013. Opportunistic acquisitions are part of our long-term corporate strategy. We pursue specific targets that complement our portfolio of existing products and services, and try to pursue business combinations through exclusivity rather than participation in auction processes. We believe we can fund future acquisitions with our internally available cash, equivalents and marketable securities, cash generated from operations, amounts available under our existing debt facilities, additional borrowings or from the issuance of additional securities. We evaluate the financial impact of any potential acquisition and associated financing with regard to earnings, operating margin, cash flow and return on invested capital targets before deciding to move forward with an acquisition.
Effective July 6, 2012, we completed the acquisition of all of the outstanding shares of privately-held microDATA, GIS, Inc., (“microDATA.”) microDATA is a leading provider of NG9-1-1 software and solutions. Consideration for the acquisition was approximately $35 million, comprised of $21 million in cash at closing, plus $14 million in promissory notes and performance-based earn-out opportunities. microDATA’s business operations are included in our Commercial Segment. Operating results of microDATA
34
are reflected in the Company’s consolidated financial statements from the date of acquisition. The purchase of microDATA did not result in our entry into a new line of business or product category; they added products, services and technical depth with features and functionality similar to our previous business.
Indicators of Our Financial and Operating Performance
Our management monitors and analyzes a number of performance indicators in order to manage our business and evaluate our financial and operating performance. Those indicators include:
|
· |
Revenue. We derive revenue from the sales of systems and services including recurring monthly service and subscriber fees, maintenance fees, software licenses and related service fees for the design, development, and deployment of software and communication systems, and products and services derived from the delivery of information processing, communication systems and components for governmental agencies. |
|
· |
Gross profit (revenue minus direct cost of revenue, including certain non-cash expenses). The major items comprising our cost of revenue are compensation and benefits, third-party hardware and software, network operation center and co-location facility operating expenses, amortization of capitalized software development costs, stock-based compensation, and overhead expenses. The costs of hardware and third-party software are primarily associated with the delivery of systems, and fluctuate from period to period as a result of the relative volume, mix of projects, level of service support required and the complexity of customized products and services delivered. Amortization of capitalized software development costs, including acquired technology, is associated with the recognition of revenue from our Commercial Segment. |
|
· |
Operating expenses. Our operating expenses are primarily compensation and benefits, professional fees, facility costs, marketing and sales-related expenses, and travel costs as well as certain non-cash expenses such as stock based compensation expense, depreciation and amortization of property and equipment, and amortization of acquired intangible assets. |
|
· |
Liquidity and cash flows. The primary driver of our cash flows is the results of our operations. Other important sources of our liquidity are our capacity to borrow, through our bank credit and term loan facility, lease financing for the purchase of equipment and access to the public equity market. |
|
· |
Balance sheet. We view cash, working capital, and accounts receivable balances and days revenue outstanding as important indicators of our financial health. |
Results of Operations
Revenue, Cost of Revenue, and Gross Profit
The following discussion addresses by segment our revenue, cost of revenue, and gross profit. See discussion of segment reporting in Note 21 to the audited Consolidated Financial Statements presented elsewhere in this Annual Report on Form 10-K.
Commercial Segment:
|
|
|
|
|
|
|
|
|
|
|
|
|
|
|||||||||||||||
|
|
|
|
|
2014 vs. 2013 |
|
|
|
|
|
|
2013 vs. 2012 |
|
|||||||||||||||
|
($ in millions) |
2014 |
|
|
2013 |
|
|
$ |
|
|
% |
|
|
2012 |
|
|
$ |
|
|
% |
|
|||||||
|
Services revenue |
$ |
154.4 |
|
|
$ |
150.3 |
|
|
$ |
4.1 |
|
|
|
3 |
% |
|
$ |
159.0 |
|
|
$ |
(8.7 |
) |
|
|
(5 |
%) |
|
Systems revenue |
|
25.1 |
|
|
|
19.8 |
|
|
|
5.3 |
|
|
|
27 |
% |
|
|
23.7 |
|
|
|
(3.9 |
) |
|
|
(16 |
%) |
|
Total Commercial Segment revenue |
|
179.5 |
|
|
|
170.1 |
|
|
|
9.4 |
|
|
|
6 |
% |
|
|
182.7 |
|
|
|
(12.6 |
) |
|
|
(7 |
%) |
|
|
|
|
|
|
|
|
|
|
|
|
|
|
|
|
|
|
|
|
|
|
|
|
|
|
|
|
|
|
Direct cost of services |
|
60.2 |
|
|
|
64.0 |
|
|
|
(3.8 |
) |
|
|
(6 |
%) |
|
|
70.4 |
|
|
|
(6.4 |
) |
|
|
(9 |
%) |
|
Direct cost of systems |
|
12.5 |
|
|
|
16.6 |
|
|
|
(4.1 |
) |
|
|
(25 |
%) |
|
|
15.2 |
|
|
|
1.4 |
|
|
|
9 |
% |
|
Total Commercial Segment cost of revenue |
|
72.7 |
|
|
|
80.6 |
|
|
|
(7.9 |
) |
|
|
(10 |
%) |
|
|
85.6 |
|
|
|
(5.0 |
) |
|
|
(6 |
%) |
|
|
|
|
|
|
|
|
|
|
|
|
|
|
|
|
|
|
|
|
|
|
|
|
|
|
|
|
|
|
Services gross profit |
|
94.2 |
|
|
|
86.3 |
|
|
|
7.9 |
|
|
|
9 |
% |
|
|
88.6 |
|
|
|
(2.3 |
) |
|
|
(3 |
%) |
|
Systems gross profit |
|
12.6 |
|
|
|
3.2 |
|
|
|
9.4 |
|
|
|
294 |
% |
|
|
8.5 |
|
|
|
(5.3 |
) |
|
|
(62 |
%) |
|
Total Commercial Segment gross profit |
$ |
106.8 |
|
|
$ |
89.5 |
|
|
$ |
17.3 |
|
|
|
19 |
% |
|
$ |
97.1 |
|
|
$ |
(7.6 |
) |
|
|
(8 |
%) |
|
Segment gross profit as a percentage of revenue |
|
59 |
% |
|
|
53 |
% |
|
|
|
|
|
|
|
|
|
|
53 |
% |
|
|
|
|
|
|
|
|
35
Commercial Services Revenue, Cost of Revenue, and Gross Profit:
Our commercial services revenue is generated from hosting and maintaining software and networks for 9-1-1 service for wireless and VoIP service providers and operators of NG9-1-1 infrastructure (mainly state and local governments), as well as hosting and maintaining applications and infrastructure software for Location-Based Services (“LBS”) and text messaging platform software. This revenue primarily consists of monthly recurring service fees recognized in the month earned. Hosted LBS service and E9-1-1 fees are generally priced based on units served during the period, such as the number of customer cell sites, the number of connections to Public Safety Answering Points (“PSAPs”), or the number of customer subscribers or sessions using our technology. Subscriber service revenue is generated by client software applications for wireless subscribers, generally on a per-subscriber per-month basis. We also earn services revenue through nonrecurring engineering (“NRE”) custom software development contracts. Maintenance fees on our systems and software licenses are usually collected in advance and recognized ratably over the contractual maintenance period. Unrecognized maintenance fees are included in deferred revenue. Services also include custom software development, implementation, and related service projects under time and materials or fixed-fee contracts, which are reported using percentage-of-completion accounting.
Commercial services revenue in 2014 was $4.1 million (3%) higher than in 2013, due mainly to a one-time favorable 2014 $4.7 million adjustment to applications subscriber-based revenue and higher revenue from NG9-1-1 related services, offset by lower revenue from non-recurring project work. Commercial services revenue in 2013 was $8.7 million (5%) lower than in 2012, reflecting 7% higher revenue from 9-1-1 related services, offset by 16% lower application services revenue.
The direct cost of our services revenue consists primarily of compensation and benefits, licensed location-based application content, network access, data feed and circuit costs for network operation centers and co-location facilities, and equipment and software maintenance. Direct cost of commercial services revenue was $3.8 million (6%) lower in 2014 than in 2013 mainly due to lower direct labor and other direct costs associated with 2013 and 2014 management actions. In 2013, direct cost of commercial services revenue were $6.4 million (9%) lower than in 2012, due mainly to lower contractor labor and other direct costs as part of cost containment actions taken during 2013. The direct cost of commercial services includes amortization of capitalized software development costs of $0.1 million, $2.5 million, and $2.7 million in 2014, 2013, and 2012, respectively. The decrease in capitalized software development amortization cost in 2014 over 2013 reflects the write-down of amortizable intangible assets in the fourth quarter of 2013.
Commercial services gross profit in 2014 was $7.9 million (9%) higher in 2014 than in 2013 reflecting more favorable average margins on software-based arrangements in 2014 in new markets. Commercial services gross profit in 2013 was $2.3 million (3%) lower than in 2012 due mainly to lower volume from white label wireless carrier revenue-sharing arrangements.
Commercial Systems Revenue, Cost of Revenue, and Gross Profit:
Commercial systems revenue results from sales to wireless carriers and state and local governments of systems incorporating our licensed software for enablement of 9-1-1 call routing and computer-aided responder dispatch, and location-based wireless services infrastructure. It also includes revenue from the sale of patents and licensing of our intellectual property including payments for past patent infringement liabilities, upfront and non-refundable license fees, and royalty fees. In all cases, revenue from the licensing of our intellectual property is recognized when all four of the revenue recognition criteria are met. Some revenue from our larger NG9-1-1 deployments incorporating our software and third party components is recognized as long term contracts using percentage of completion accounting. License prices for our carrier software are generally a function of its volume of usage in our customers’ networks during the relevant period.
Commercial systems revenue in 2014 was $5.3 million (27%) higher than in 2013 as a result of more than 100% growth in NG9-1-1 infrastructure and license revenue, partially offset by about 60% lower messaging and intellectual property-related revenue. Commercial systems revenue in 2013 was $3.9 million (16%) lower than in 2012 as a result of about 60% lower NG9-1-1 revenue due to delays of system deployments dependent on the readiness of our channel partners and customers, partially offset by approximately 35% higher LBS platform sales. Revenue from patent sales and other intellectual property transactions remained about the same at $2.8 million for 2013 and 2012. The NG9-1-1 operations of microDATA, acquired in July 2012, contributed $5.2 million of 2013 systems revenue, down from $8.7 million in 2012, primarily due to funding delays.
The direct cost of commercial systems revenue consists primarily of compensation and benefits, third-party hardware and software purchased for integration and resale, travel expenses, and consulting fees as well as the amortization of acquired and capitalized software development costs. The direct cost of commercial systems decreased $4.1 million (25%) in 2014 compared to 2013, reflecting $3.7 million lower software development cost amortization as a result of the 2013 write-down of intangible assets, and reflecting lower labor and direct costs related to custom development efforts and cost controls. The direct cost of commercial systems was $1.4 million (9%) higher in 2013 than in 2012, reflecting an increase in labor and direct costs for customer-related custom messaging and location-based system development projects.
36
Commercial systems gross profit in 2014 was $9.4 million higher in 2014 than 2013, reflecting higher revenue from NG9-1-1 and platform systems and cost efficiencies, partially offset by the decrease in gross profit from intellectual property monetization. Our 2013 commercial systems gross profit was $5.3 million (62%) lower in 2013 than 2012, reflecting lower revenue due to deployment delays from NG9-1-1 systems and the impact on gross profit of non-variable costs necessary to perform those deployments.
Government Segment:
|
|
|
|
|
|
|
|
|
|
|
|
|
|
|||||||||||||||
|
|
|
|
|
2014 vs. 2013 |
|
|
|
|
|
|
2013 vs. 2012 |
|
|||||||||||||||
|
($ in millions) |
2014 |
|
|
2013 |
|
|
$ |
|
|
% |
|
|
2012 |
|
|
$ |
|
|
% |
|
|||||||
|
Services revenue |
$ |
106.3 |
|
|
$ |
131.1 |
|
|
$ |
(24.8 |
) |
|
|
(19 |
%) |
|
$ |
146.1 |
|
|
$ |
(15.0 |
) |
|
|
(10 |
%) |
|
Systems revenue |
|
74.0 |
|
|
|
61.1 |
|
|
|
12.9 |
|
|
|
21 |
% |
|
|
158.6 |
|
|
|
(97.5 |
) |
|
|
(61 |
%) |
|
Total Government Segment revenue |
|
180.3 |
|
|
|
192.2 |
|
|
|
(11.9 |
) |
|
|
(6 |
%) |
|
|
304.7 |
|
|
|
(112.5 |
) |
|
|
(37 |
%) |
|
|
|
|
|
|
|
|
|
|
|
|
|
|
|
|
|
|
|
|
|
|
|
|
|
|
|
|
|
|
Direct cost of services |
|
82.0 |
|
|
|
92.3 |
|
|
|
(10.3 |
) |
|
|
(11 |
%) |
|
|
107.9 |
|
|
|
(15.6 |
) |
|
|
(14 |
%) |
|
Direct cost of systems |
|
57.6 |
|
|
|
50.4 |
|
|
|
7.2 |
|
|
|
14 |
% |
|
|
133.7 |
|
|
|
(83.3 |
) |
|
|
(62 |
%) |
|
Total Government Segment cost of revenue |
|
139.6 |
|
|
|
142.7 |
|
|
|
(3.1 |
) |
|
|
(2 |
%) |
|
|
241.6 |
|
|
|
(98.9 |
) |
|
|
(41 |
%) |
|
|
|
|
|
|
|
|
|
|
|
|
|
|
|
|
|
|
|
|
|
|
|
|
|
|
|
|
|
|
Services gross profit |
|
24.3 |
|
|
|
38.8 |
|
|
|
(14.5 |
) |
|
|
(37 |
%) |
|
|
38.2 |
|
|
|
0.6 |
|
|
|
2 |
% |
|
Systems gross profit |
|
16.4 |
|
|
|
10.7 |
|
|
|
5.7 |
|
|
|
53 |
% |
|
|
24.9 |
|
|
|
(14.2 |
) |
|
|
(57 |
%) |
|
Total Government Segment gross profit |
$ |
40.7 |
|
|
$ |
49.5 |
|
|
$ |
(8.8 |
) |
|
|
(18 |
%) |
|
$ |
63.1 |
|
|
$ |
(13.6 |
) |
|
|
(22 |
%) |
|
Segment gross profit as a percentage of revenue |
|
23 |
% |
|
|
26 |
% |
|
|
|
|
|
|
|
|
|
|
21 |
% |
|
|
|
|
|
|
|
|
The primary Government Segment customers are U.S. government agencies including the Departments of Defense and Homeland Security, domestic and foreign space programs, and the contractors that supply products and services to these government customers.
Government Services Revenue, Cost of Revenue, and Gross Profit:
Government services revenue is generated from cybersecurity training and consulting, professional communications engineering and field support, program management, help desk outsource, and network design, deployment and management for government agencies, and operation, including resale of satellite airtime of fixed satellite ground terminal facilities for data connectivity. Systems maintenance fees are usually collected in advance and recognized ratably over the contractual maintenance periods.
Government services revenue in 2014 was $24.8 million (19%) lower than in 2013, due mainly to a 42% decrease in field support and professional services associated with war-related contracts, partly offset by 22% growth in cybersecurity business and higher global satellite and ground station support services revenue. In 2013, government services revenue was $15 million (10%) lower than 2012, reflecting 7% lower professional services and managed satellite services revenue, lower field support revenue due to the draw-down of Afghanistan personnel, and 3% lower cybersecurity revenue due to timing of funding for training services.
Direct cost of government services revenue consists of compensation, benefits and travel incurred in delivering these services, as well as satellite space segment purchased for resale. These costs have varied over the three years presented as a direct result of changes in volume.
Gross profit from government services was $14.5 million (37%) lower in 2014 than 2013 due largely to the effects of declining volume and margin from war-related field support and professional services, not fully offset by growth in cybersecurity and managed satellite services. Gross profit from government services in 2013 was $0.6 million (2%) higher than in 2012, due largely to the effects of some one-time changes to field support compensation arrangements as personnel transitioned from one contract to a successor.
Government Systems Revenue, Cost of Revenue, and Gross Profit:
We generate government systems revenue from the sale of secure wireless communication systems, and the integration of these systems into customer networks, and from electronic components sold mainly to domestic and foreign space programs. Government systems sales in 2014 were $12.9 million (21%) higher than in 2013 due to higher volume of sales and resets of ground terminals and higher electronic component sales. This revenue varies based on the timing of orders and shipments and overall government spending and budgeting conditions. For 2013, government systems sales were $97.5 million (61%) lower than in 2012, reflecting comparison to significant 2012 non-recurring “pass through” (low-margin, low-value-add) sales, funding delays for our highly reliable electronic components and deployable communication systems, and competitor protests of awarded contracts.
37
The cost of our government systems revenue consists of purchased system components, compensation and benefits, the costs of third-party contractors, and travel. These costs have varied over the three years presented as a direct result of changes in mix and volume. These equipment and third-party costs are variable for our various types of products, and margins fluctuate between periods based on pricing and product mix.
Government systems gross profit in 2014 was $5.7 million (53%) higher than in 2013 due to higher volume in both ground terminals and electronic components. Government systems gross profit decreased $14.2 million (57%) for 2013 compared to 2012 due mainly to the lower sales volume.
Operating Expenses
Research and Development Expense:
|
|
|
|
|
|
|
|
|
|
|
|
|
|
|||||||||||||||
|
|
|
|
|
2014 vs. 2013 |
|
|
|
|
|
|
2013 vs. 2012 |
|
|||||||||||||||
|
($ in millions) |
2014 |
|
|
2013 |
|
|
$ |
|
|
% |
|
|
2012 |
|
|
$ |
|
|
% |
|
|||||||
|
Research and development expense |
$ |
41.7 |
|
|
$ |
34.3 |
|
|
$ |
7.4 |
|
|
|
22 |
% |
|
$ |
36.6 |
|
|
$ |
(2.3 |
) |
|
|
(6 |
%) |
|
% of total revenue |
|
12 |
% |
|
|
9 |
% |
|
|
|
|
|
|
|
|
|
|
8 |
% |
|
|
|
|
|
|
|
|
Our research and development (“R&D”) expense consists of compensation, benefits, and a proportionate share of facilities and corporate overhead, as well as costs associated with using third-party laboratory and testing resources. We expense such costs as they are incurred until technological feasibility has been reached and we believe that capitalized costs will be recoverable, upon which we capitalize and amortize them over the product’s expected life. Technological feasibility is established for our software when a detailed program design is completed. We incur R&D costs to enhance existing software products as well as to create new products, including software hosted in network operation centers.
We develop software for systems and services used mainly by network operators, state and local public safety organizations, federal agencies, and device manufacturers. In 2014 and 2013, we have invested in R&D for 9-1-1 software and updates to location-based products, including our toolkits and application program interfaces for markets beyond network operators. We also invested in updating and expanding our secure wireless communication technology products for government customers and applications for network operators, telematics supply chain, and network security. We continue to obtain patents for some of our developers’ innovations.
In addition to company deliverables, our research and development expenditures and acquisitions have yielded a portfolio of 388 patents as of December 31, 2014, and more than 300 patent applications pending, primarily for wireless location-based technology.
In 2014 R&D expense was $7.4 million (22%) higher than in 2013 mainly due to assigning more developers to projects representing R&D expense than in earlier years, when more project work was for single-customer deliverables (reported as cost of revenue) or was subject to capitalization. R&D expense in 2013 was $2.3 million (6%) lower than in 2012 mainly due to a shift of resources to custom development efforts (reported as cost of revenue) and spending adjustments to reduce labor, contractor, and other vendor costs on mature products.
Sales and Marketing Expense:
|
|
|
|
|
|
|
|
|
|
|
|
|
|
|||||||||||||||
|
|
|
|
|
2014 vs. 2013 |
|
|
|
|
|
|
2013 vs. 2012 |
|
|||||||||||||||
|
($ in millions) |
2014 |
|
|
2013 |
|
|
$ |
|
|
% |
|
|
2012 |
|
|
$ |
|
|
% |
|
|||||||
|
Sales and marketing expense |
$ |
26.0 |
|
|
$ |
28.5 |
|
|
$ |
(2.5 |
) |
|
|
(9 |
%) |
|
$ |
30.8 |
|
|
$ |
(2.3 |
) |
|
|
(7 |
%) |
|
% of total revenue |
|
7 |
% |
|
|
8 |
% |
|
|
|
|
|
|
|
|
|
|
6 |
% |
|
|
|
|
|
|
|
|
Our sales and marketing expenses include fixed and variable compensation and benefits, trade show expenses, travel costs, advertising and public relations costs, as well as a proportionate share of facility-related costs which are expensed as incurred. Our marketing efforts also include speaking engagements and industry conferences. We sell our solutions through our direct sales force and leverage relationships with original equipment manufacturers and large network operators as channels for our technology. We sell our products and services to agencies and departments of the U.S. government primarily through direct sales professionals, and to foreign customers through agency and subcontractor arrangements. We sell our products and services to agencies and departments of the U.S. government primarily through direct sales professionals under prime and sub-contracts.
38
Sales and marketing expense in 2014 was $2.5 million (9%) lower than 2013 due to lower variable compensation and decreases in personnel and travel. In 2013 sales and marketing expense was $2.3 million (7%) lower than 2012, also due to lower variable compensation and due to decreases in personnel and travel.
General and Administrative Expense:
|
|
|
|
|
|
|
|
|
|
|
|
|
|
|||||||||||||||
|
|
|
|
|
2014 vs. 2013 |
|
|
|
|
|
|
2013 vs. 2012 |
|
|||||||||||||||
|
($ in millions) |
2014 |
|
|
2013 |
|
|
$ |
|
|
% |
|
|
2012 |
|
|
$ |
|
|
% |
|
|||||||
|
General and administrative expense |
$ |
50.8 |
|
|
$ |
54.7 |
|
|
$ |
(3.9 |
) |
|
|
(7 |
%) |
|
$ |
54.3 |
|
|
$ |
0.4 |
|
|
|
1 |
% |
|
% of total revenue |
|
14 |
% |
|
|
15 |
% |
|
|
|
|
|
|
|
|
|
|
11 |
% |
|
|
|
|
|
|
|
|
General and administrative (“G&A”) expense primarily represents management, finance, legal (including intellectual property management), human resources, and internal information system functions. These costs include compensation, benefits, professional fees, travel, and a proportionate share of rent, utilities, and other facilities costs which are expensed as incurred.
G&A expenses for 2014 were $3.9 million (7%) lower than 2013 reflecting personnel cost reductions associated with 2013 actions and lower legal fees related to our intellectual property monetization, offset by about $1.3 million of one-time costs from exiting our China and Canada software development sites, so that we no longer have employees in China. G&A expenses in 2013 increased slightly over 2012 mainly due to higher expenses related to intellectual property monetization efforts and higher spending on the security and operations of internal data networks, offsetting the effects of other cost reductions and the absence of non-recurring 2012 microDATA acquisition expenses.
Depreciation and Amortization of Property and Equipment:
|
|
|
|
|
|
|
|
|
|
|
|
|
|
|||||||||||||||
|
|
|
|
|
2014 vs. 2013 |
|
|
|
|
|
|
2013 vs. 2012 |
|
|||||||||||||||
|
($ in millions) |
2014 |
|
|
2013 |
|
|
$ |
|
|
% |
|
|
2012 |
|
|
$ |
|
|
% |
|
|||||||
|
Depreciation and amortization of property and equipment |
$ |
13.0 |
|
|
$ |
14.9 |
|
|
$ |
(1.9 |
) |
|
|
(13% |
) |
|
$ |
14.2 |
|
|
$ |
0.7 |
|
|
|
5% |
|
|
Average gross cost of property and equipment during the period |
$ |
114.2 |
|
|
$ |
111.4 |
|
|
|
2.8 |
|
|
|
3% |
|
|
$ |
117.3 |
|
|
|
(5.9 |
) |
|
|
(5% |
) |
Depreciation and amortization of property and equipment represents the period costs associated with our investment in information technology and telecommunications equipment, software, furniture and fixtures, and leasehold improvements, as well as amortization of capitalized software developed for internal use, including hosted applications. We compute depreciation and amortization using the straight-line method over the estimated useful lives of the assets, generally five years for furniture, fixtures, and leasehold improvements, and three to seven years for other types of assets including computers, software, and telephone equipment.
Depreciation expense in 2014 was $1.9 million or 13% lower than 2013 due largely to the effect of 2013 impairment charges on the remaining depreciable base, partly offset by incremental depreciation on additions to property and equipment in 2014. Our depreciable asset based decreased in 2013 as a result of a $12.6 million write-down.
Amortization of Acquired Intangible Assets:
|
|
|
|
|
|
|
|
|
|
|
|
|
|
|||||||||||||||
|
|
|
|
|
2014 vs. 2013 |
|
|
|
|
|
|
2013 vs. 2012 |
|
|||||||||||||||
|
($ in millions) |
2014 |
|
|
2013 |
|
|
$ |
|
|
% |
|
|
2012 |
|
|
$ |
|
|
% |
|
|||||||
|
Amortization of acquired intangible assets |
$ |
3.8 |
|
|
$ |
4.6 |
|
|
$ |
(0.8 |
) |
|
|
(17 |
%) |
|
$ |
4.4 |
|
|
$ |
0.2 |
|
|
|
5 |
% |
Acquired intangible assets are being amortized over estimated useful lives of between four and ten years. Amortization expense in 2014 was $0.8 million (17%) lower than 2013 reflecting the lower amortizable base following the 2013 write-down. Amortization in 2013 was $0.2 million (5%) higher than 2012, mainly due to the higher asset base resulting from the mid-2012 acquisition of microDATA.
Impairment of goodwill and long-lived assets:
|
|
|
|
|
2014 vs. 2013 |
|
|
|
|
|
|
2013 vs. 2012 |
|
|||||||||||||||
|
($ in millions) |
2014 |
|
|
2013 |
|
|
$ |
|
|
% |
|
|
2012 |
|
|
$ |
|
|
% |
|
|||||||
|
Impairment of goodwill and long-lived assets |
$ |
— |
|
|
$ |
32.0 |
|
|
$ |
(32.0 |
) |
|
|
(100 |
%) |
|
$ |
125.7 |
|
|
$ |
(93.7 |
) |
|
|
(75 |
%) |
39
No impairment charges were recorded in 2014. In 2013, we recorded a $32 million impairment charge for the excess of the carrying value over the estimated fair value of our Platforms and Applications reporting unit’s goodwill and long-lived assets. In 2012, we recorded a $125.7 million impairment charge for the excess of the carrying value over the estimated fair value of our Navigation reporting unit’s goodwill and other long-lived assets.
Interest and Financing Expense
|
|
|
|
|
|
|
|
|
|
|
|
|
|
|||||||||||||||
|
|
|
|
|
2014 vs. 2013 |
|
|
|
|
|
|
2013 vs. 2012 |
|
|||||||||||||||
|
($ in millions) |
2014 |
|
|
2013 |
|
|
$ |
|
|
% |
|
|
2012 |
|
|
$ |
|
|
% |
|
|||||||
|
Interest expense on bank and other notes payable |
$ |
3.4 |
|
|
$ |
3.0 |
|
|
$ |
0.4 |
|
|
|
13 |
% |
|
$ |
2.1 |
|
|
$ |
0.9 |
|
|
|
43 |
% |
|
Interest expense on convertible note financing |
|
4.4 |
|
|
|
4.8 |
|
|
|
(0.4 |
) |
|
|
(8 |
%) |
|
|
4.7 |
|
|
|
0.1 |
|
|
|
2 |
% |
|
Interest expense on capital lease obligations |
|
0.5 |
|
|
|
0.6 |
|
|
|
(0.1 |
) |
|
|
(17 |
%) |
|
|
0.6 |
|
|
|
— |
|
|
|
— |
|
|
Amortization of deferred financing fees |
|
1.0 |
|
|
|
3.4 |
|
|
|
(2.4 |
) |
|
|
(71 |
%) |
|
|
0.8 |
|
|
|
2.6 |
|
|
|
325 |
% |
|
Less: capitalized interest |
|
— |
|
|
|
(0.1 |
) |
|
|
0.1 |
|
|
|
100 |
% |
|
|
(0.1 |
) |
|
|
— |
|
|
|
— |
|
|
Total interest and financing expense |
$ |
9.3 |
|
|
$ |
11.7 |
|
|
$ |
(2.4 |
) |
|
|
(21 |
%) |
|
$ |
8.1 |
|
|
$ |
3.6 |
|
|
|
44 |
% |
Interest expense is incurred under bank and other notes payable, convertible note financings, and capital lease obligations. Financing expense amortization results from deferral of costs incurred at the time of contracting for financing facilities, which are then amortized over the terms of the facilities.
Interest and financing expenses were lower in 2014 than 2013 mainly due to lower deferred cost balances resulting from accelerated amortization of deferred 4.5% convertible notes financing fees as these notes were retired. Convertible notes interest expense in 2014 was lower than in 2013 due to lower outstanding borrowings, partially offset by the effect of a higher average rate. Higher 2014 interest expense on bank debt and other notes payable was due to a higher average bank borrowing balance offset by lower interest on seller notes as payments were made.
Interest and financing expenses were higher in 2013 than 2012 due to interest on the higher average borrowing balance under our Senior Credit Facility, full-year interest on the mid-2012 microDATA promissory notes, a higher interest rate on $50 million of new convertible notes due 2018 that were exchanged in the second quarter of 2013 for notes due 2014, the accelerated amortization of deferred financing fees upon refinancing of the 2012 bank term loan, and accelerated amortization deferred financing costs for notes retired early.
Our capital lease obligations include interest at various stated rates averaging about 5% per annum. Our interest under capital leases fluctuates depending on the amount of capital lease obligations in each year.
Gain (loss) on early retirement of debt
|
|
|
|
|
2014 vs. 2013 |
|
|
|
|
|
|
2013 vs. 2012 |
|
|||||||||||||||
|
($ in millions) |
2014 |
|
|
2013 |
|
|
$ |
|
|
% |
|
|
2012 |
|
|
$ |
|
|
% |
|
|||||||
|
Gain (loss) on early retirement of debt |
$ |
— |
|
|
$ |
(0.2 |
) |
|
$ |
0.2 |
|
|
|
100% |
|
|
$ |
0.4 |
|
|
$ |
(0.6 |
) |
|
|
(150% |
) |
In 2012, we repurchased and retired $10 million of the outstanding 4.5% Convertible Senior Notes due in November 2014, and recorded a $0.4 million gain on retirement of debt. During 2013, we retired and repurchased an additional $78.9 million of the outstanding Notes and recorded a loss of $0.2 million on the retirement of the debt.
Other Income (Expense), Net
|
|
|
|
|
2014 vs. 2013 |
|
|
|
|
|
|
2013 vs. 2012 |
|
|||||||||||||||
|
($ in millions) |
2014 |
|
|
2013 |
|
|
$ |
|
|
% |
|
|
2012 |
|
|
$ |
|
|
% |
|
|||||||
|
|
|
|
|
|
|
|
|
|
|
|
|
|
|
|
|
|
|
|
|
|
|
|
|
|
|
|
|
|
Foreign currency transaction (loss) gain |
$ |
(1.4 |
) |
|
$ |
(0.1 |
) |
|
$ |
(1.3 |
) |
|
|
(1300% |
) |
|
$ |
(0.1 |
) |
|
$ |
— |
|
|
NM |
|
|
|
Miscellaneous other (expense) income |
|
0.3 |
|
|
|
(0.1 |
) |
|
|
0.4 |
|
|
|
400% |
|
|
|
0.1 |
|
|
|
(0.2 |
) |
|
|
(200% |
) |
|
Total other income (expense), net |
$ |
(1.1 |
) |
|
$ |
(0.2 |
) |
|
$ |
(0.9 |
) |
|
|
(450% |
) |
|
$ |
— |
|
|
$ |
(0.2 |
) |
|
|
100% |
|
40
Other income (expense), net, includes foreign currency transaction gain or loss resulting from exchange rate fluctuations, adjustments to the estimate of payments due under acquisition earn-out arrangements, as well as interest income, and realized gain or loss on marketable securities. Other income (expense), net also includes the effects of foreign currency revaluation on our cash, receivables, and deferred revenues that are stated in currencies other than U.S dollars. In 2014, we recorded a currency translation loss as the Euros we purchased in anticipation of fulfillment of a Euro-denominated obligation coming due in 2015 declined in value relative to the US dollar.
Income Taxes
The Company accounts for income taxes in accordance with ASC 740, Accounting for Income Taxes. Deferred tax assets and liabilities are computed based on the difference between the financial statement and income tax basis of assets and liabilities using enacted tax rates. The Company records the estimated value of its uncertain tax position by reducing the value of certain tax attributes. The Company would classify any interest and penalties accrued on any unrecognized tax benefits as a component of the provision for income taxes. There were no interest or penalties recognized in the Consolidated Statements of Operations for 2014 and the Consolidated Balance Sheets at December 31, 2014. The Company does not currently anticipate that the total amounts of unrecognized tax benefits will significantly increase within the next 12 months. The Company files income tax returns in U.S. and various state and foreign jurisdictions. As of December 31, 2014, open tax years in the federal and some state jurisdictions date back to 1998, due to the taxing authorities’ ability to adjust operating loss carryforwards.
ASC 740 requires that deferred tax assets be reduced by a valuation allowance if, based on the weight of available evidence, it is more likely than not that some portion of the deferred tax assets will not be realized. This process requires the Company’s management to make assessments regarding the timing and probability of the ultimate tax impact. Additionally, the Company establishes reserves for uncertain tax positions based upon our judgment regarding potential future challenges to those positions. Actual income taxes could vary from these estimates due to future changes in income tax law, significant changes in the jurisdictions in which the Company operates, our inability to generate sufficient future taxable income or unpredicted results from the final determination of each year’s liability by taxing authorities. These changes could have a significant impact on the Company’s financial position.
Deferred tax assets consist primarily of net operating loss and tax credit carryforwards as well as deductible temporary differences. Prior to 2008 and at December 31, 2013 and 2014, the Company provided a valuation allowance for deferred tax assets based on management’s evaluation that the Company’s ability to realize such assets did not meet the criteria of “more likely than not”. The Company has continuously evaluated additional facts representing positive and negative evidence in the determination of its ability to realize the deferred tax assets.
Net loss
|
|
|
|
|
2014 vs. 2013 |
|
|
|
|
|
|
2013 vs. 2012 |
|
|||||||||||||||
|
($ in millions) |
2014 |
|
|
2013 |
|
|
$ |
|
|
% |
|
|
2012 |
|
|
$ |
|
|
% |
|
|||||||
|
Net loss |
$ |
(1.7 |
) |
|
$ |
(58.6 |
) |
|
$ |
56.9 |
|
|
|
97% |
|
|
$ |
(98.0 |
) |
|
$ |
39.4 |
|
|
|
40% |
|
Our 2014 net loss was lower than in 2013 and 2012 as a result of improved operating results and the absence of impairment charges and other factors discussed above.
41
Liquidity and Capital Resources
The following table summarizes our cash flows for the years ended December 31:
|
($ in millions) |
2014 |
|
|
2013 |
|
|
2012 |
|
|||
|
Net cash and cash equivalents provided by/(used in): |
|
|
|
|
|
|
|
|
|
|
|
|
Operating activities: |
|
|
|
|
|
|
|
|
|
|
|
|
Net loss |
$ |
(1.7 |
) |
|
$ |
(58.6 |
) |
|
$ |
(98.0 |
) |
|
Non-cash charges |
|
26.2 |
|
|
|
36.4 |
|
|
|
37.0 |
|
|
Non-cash impairment of goodwill and long-lived assets |
|
— |
|
|
|
32.0 |
|
|
|
125.7 |
|
|
Deferred income tax provision |
|
3.6 |
|
|
|
16.0 |
|
|
|
(15.7 |
) |
|
Excess tax provision (benefit) from share-based compensation arrangements |
|
— |
|
|
|
— |
|
|
|
1.5 |
|
|
Net changes in working capital, including changes in other assets |
|
(35.6 |
) |
|
|
22.4 |
|
|
|
(12.6 |
) |
|
Net operating activities |
|
(7.5 |
) |
|
|
48.2 |
|
|
|
37.9 |
|
|
Investing activities: |
|
|
|
|
|
|
|
|
|
|
|
|
Purchases of property and equipment |
|
(8.5 |
) |
|
|
(16.7 |
) |
|
|
(22.7 |
) |
|
Capital purchases funded through leases |
|
2.8 |
|
|
|
6.0 |
|
|
|
4.9 |
|
|
Purchases of property and equipment, net of assets funded through leases |
|
(5.7 |
) |
|
|
(10.7 |
) |
|
|
(17.8 |
) |
|
Capitalized software development costs |
|
(1.7 |
) |
|
|
(2.0 |
) |
|
|
(1.9 |
) |
|
Proceeds from (purchases of) marketable securities, net |
|
(3.7 |
) |
|
|
(5.4 |
) |
|
|
4.0 |
|
|
Cash received for location business wind-down arrangement |
|
15.0 |
|
|
|
— |
|
|
|
— |
|
|
Acquisitions, net of cash acquired |
|
— |
|
|
|
— |
|
|
|
(20.8 |
) |
|
Net investing activities |
|
3.9 |
|
|
|
(18.1 |
) |
|
|
(36.5 |
) |
|
Financing activities: |
|
|
|
|
|
|
|
|
|
|
|
|
Payments on long-term debt and capital leases |
|
(30.6 |
) |
|
|
(91.1 |
) |
|
|
(55.6 |
) |
|
Proceeds from bank and other debt borrowings |
|
19.6 |
|
|
|
66.5 |
|
|
|
54.5 |
|
|
Earn-out payment |
|
(0.3 |
) |
|
|
— |
|
|
|
(3.9 |
) |
|
Excess tax benefit from stock compensation plan |
|
— |
|
|
|
— |
|
|
|
(1.5 |
) |
|
Other financing activities |
|
(0.1 |
) |
|
|
(0.2 |
) |
|
|
0.8 |
|
|
Net financing activities |
|
(11.4 |
) |
|
|
(24.8 |
) |
|
|
(5.7 |
) |
|
Net change in cash and cash equivalents |
$ |
(15.0 |
) |
|
$ |
5.3 |
|
|
$ |
(4.3 |
) |
|
Days revenue outstanding in accounts receivable, including unbilled receivables |
|
93 |
|
|
|
72 |
|
|
|
72 |
|
Capital resources: We have funded our operations, acquisitions, and capital expenditures primarily using cash generated by our operations, debt and capital leases, and issuance of public equity.
At December 31, 2014, our liquidity included $50.1 million cash, cash equivalents, and marketable securities and $25 million of unused borrowing availability under our bank line of credit. We also had up to $18.9 million of undrawn bank delayed draw term loan capacity under our June 2013 Senior Credit facility which may be available to us in the second quarter of 2015 for general corporate purposes if covenant requirements are met. The Senior Credit Facilities also include a $25 million incremental loan arrangement subject to our future needs and bank approval, although no assurances can be given that this incremental loan amount will be available to us when and if needed.
Our year-end cash and cash equivalents balance was $26.9 million and when added to marketable securities, our total liquid funds were $50.1 million, down $11.8 million from $61.9 million at year-end 2013. At December 31, 2013, our cash and cash equivalents balance was $41.9 million and when added to marketable securities, our total liquid funds were $61.9 million, up $10.4 million from $51.5 million at year-end 2012.
Sources and uses of cash:
Operating activities: Cash used in operations was $7.5 million in 2014 compared to cash generated by operations of $48.2 million in 2013. Higher year-end working capital was mainly due to higher accounts receivable relating to late-in-the-year timing of billings under business agreement terms. Cash generated by operations was $48.2 million in 2013, up $10.3 million compared to $37.9 million in 2012. Lower year end working capital was mainly due to lower accounts receivable relating to the timing of revenue and customer payments under business agreement terms, decreased inventory, a decrease in accounts payable and accrued expenses due to timing of vendor payments, and lower unbilled receivables and deferred revenue due to timing of percentage of completion projects. Cash from operating profits during 2014, 2013, and 2012 has been largely sheltered from income taxes due to the use of loss carry-forwards generated in prior years.
42
Investing activities: Investing activities for 2014 included acquiring a small location-based application business serving customers in Europe and the Middle East under a plan to wind-down its separate operations. The seller provided $15 million of funding, which we expect to be sufficient to complete the wind-down over a period of two years or less. On July 6, 2012, we completed the acquisition of microDATA for approximately $35 million, comprised of $20.8 million in cash at closing, plus $14.3 million in promissory notes and performance-based earn-out opportunities. Fixed asset additions, excluding assets funded by leasing, were $8.5 million, $16.7 million, and $22.7 million for 2014, 2013, and 2012, respectively. Also, investments were made in development of software for resale which had reached the stage of development calling for capitalization, in the amounts of $1.7 million, $2 million, and $1.9 million 2014, 2013, and 2012, respectively. During 2014 and 2013, we invested (net) $3.7 million and $5.4 million in marketable securities, respectively, and during 2012, we received net $4 million from the sale and maturity of marketable securities.
Financing activities: In 2014 we made $30.6 million in principal payments on bank and capital lease borrowings including the repurchase of the remaining $14.6 million outstanding principal of our 4.5% Convertible Notes which was financed using our Delayed Draw Term Loan Facility. We also made the final promissory note installment of $4.8 million to the sellers of microDATA, and the final $0.3 million microDATA earn-out payment. We funded $2.8 million of fixed asset additions using capital leases in 2014 and drew $5 million on our line of credit facility, which was repaid in January 2015.
In 2013 we closed on a new $130 million Senior Credit Facilities agreement, we retired $50 million of our outstanding 4.5% Convertible Senior Notes in exchange for new $50 million 7.75% Convertible Senior Notes, and repurchased $28.9 million of 4.5% Convertible Senior Notes. We made $42.4 million in bank loan principal payments. We paid off the $6 million of borrowings on our line of credit outstanding at December 31, 2012. We also made our scheduled $7.5 million payment due on seller promissory notes and made regularly scheduled capital lease principal payments of $6.3 million. We funded fixed asset purchases with new capital leases totaling $6 million in 2013.
In 2012 we amended our loan and security agreement, and made scheduled payments on bank borrowings and capital leases of $27 million. We repurchased a portion of our 4.5% convertible notes for $9.6 million and borrowed an additional $9.5 million under our line of credit. We made an earn-out payment of $3.9 million related to a 2009 acquisition, and funded fixed asset purchases with capital leases totaling $4.9 million.
Senior debt: The Company has borrowing capacity under our $130 million Senior Credit Facilities (the “Senior Credit Facilities” or “Credit Agreement”) in accordance with a June 25, 2013 agreement, as amended June 9, 2014. The Senior Credit Facilities include (i) a $56.5 million term loan A facility (“Term Loan A Facility”), (ii) a $43.5 million delayed draw term loan facility (“Delayed Draw Term Loan Facility”), and (iii) a $30 million revolving loan facility (“Revolving Loan Facility”). The Senior Credit Facilities also include a $25 million incremental loan arrangement subject to the Company’s future needs and bank approval, although no assurance can be given that this incremental loan amount will be available to us when and if needed.
In 2013, we borrowed $56.5 million under the Term Loan A Facility. Proceeds were used for (i) repayment of the remaining balance under 2012 Term Loan, which was terminated, (ii) approximately $16 million for on-going working capital and other general corporate purposes, and (iii) fees and expenses associated with the new facility. In 2013 and 2014, we borrowed a $10 million and $14.6 million, respectively, under the Delayed Draw Term Loan Facility which was used towards the purchase of the remaining outstanding 4.5% convertible notes. Under the agreement, $18.9 million of the remaining Delayed Draw Term Loan Facility may be available to us in the second quarter of 2015 subject to our meeting certain financial covenants. Any amount of the Delayed Draw Term Loan Facility not drawn on April 30, 2015 will expire unused. The Credit Agreement provides that the banks hold at least $35 million of the Company’s cash and marketable securities until December 31, 2015.
Additional liquidity is available through the $30 million Revolving Loan Facility, of which $25 million is undrawn, to be used for our on-going working capital and other general corporate purposes, replacing the revolving line under the 2009 Loan and Security Agreement which has been paid off and terminated.
Loans borrowed under the Term Loan A Facility, the Revolving Loan Facility or the Delayed Draw Term Loan Facility may be borrowed at rates based on the Eurodollar/LIBOR (beginning at L +3.75%) or Alternate Base Rate (ABR) (beginning at ABR + 2.75%), which may be adjusted as provided in the Credit Agreement.
The Term Loan A Facility, the Delayed Draw Term Loan Facility, and the Revolving Loan Facility have a maturity date of March 31, 2018, unless extended as provided in the Credit Agreement. The Term Loan A and Delayed Draw facility are payable in quarterly installments on the first fiscal day of each quarter beginning October 1, 2013. We made $0.4 million of scheduled payments on the Term Loan A and Delayed Draw facilities in 2013, and $2 million in 2014. $1 million is payable in the quarter beginning January 1, 2015 increasing to $1.5 million in the quarter ending December 31, 2016 and to $1.9 million in the quarter ending December 31, 2017, with the remaining principal due at maturity. Additional Delayed Draw Term Loan Facility borrowings would be repaid in consecutive quarterly installment payments in the same proportion as the installment payments for the Term Loan A and
43
existing Delayed Draw Term Loan borrowings, with the remaining principal due at maturity. The Senior Credit Facilities are also subject to mandatory repayments from excess cash flow and other sources, such as net cash proceeds of debt or equity issuances, asset sales, casualty insurance claims and other recovery events, as described in the Credit Agreement. In 2014, a mandatory repayment of $3.9 million was made based on 2013 results. Based on 2014 excess cash flow as defined, the company will make a mandatory repayment of $5.9 million in the first quarter of 2015.
The Senior Credit Facilities are secured by substantially all of the Company’s tangible and intangible assets, including intellectual property. The Credit Agreement contains customary representations and warranties of the Company and customary covenants and events of default. Availability under the Revolving Loan Facility and the Delayed Draw Term Loan Facility is subject to certain conditions, including the continued accuracy of the Company’s representations and warranties and compliance with covenants. The Senior Credit Facilities are also subject to possible mandatory repayments from excess cash flow and other sources, such as net cash proceeds of debt or equity issuances, asset sales, casualty insurance claims and other recovery events, as described in the Credit Agreement. During the continuance of an event of default, at the request of the required lenders, all outstanding loans shall bear interest at a rate per annum equal to the rate that would otherwise be applicable thereto plus 2%, and shall be payable from time to time on demand.
In July 2012, we borrowed $45 million under a term loan agreement (“2012 Term Loan”). We used $19 million of the borrowings to pay off outstanding indebtedness under our prior term loan and for transaction fees associated with the Amendment, and $20 million was used towards the acquisition of privately-held microDATA. The 2012 Term Loan was paid in full with funds borrowed under the 2013 Term Loan A Facility, as discussed above.
Interest Rate Hedging Activities: In August 2014, we entered into an interest rate swap agreement with our principal bank to reduce the variability of interest expense due to fluctuations in market interest rates. Its $32.1 million initial notional amount represents about half of the outstanding balances of the floating rate Term Loan A and Delayed Term Loan Facilities. The interest rate swap results in a fixed rate of 5.165% on the notional amount of the swap until its June 25, 2018 maturity. The notional amount of the swap will change over time to reflect approximately 50% of the outstanding expected Senior Credit Facility balances; interest rate re-set and interest rate payment dates mirror those of the underlying Senior Credit Facilities. The swap is expected to offset changes in expected cash flows due to fluctuations in the one month LIBOR rate over the term of the hedge. The interest rate swap fair value as of December 31, 2014 was a $0.2 million liability. For the three months ended December 31, 2014, the hedge was highly effective and no gains or losses were recognized in earnings.
7.75% Convertible Notes: On May 8, 2013, we completed privately-negotiated exchange agreements with note holders and retired $50 million of our 4.5% Convertible Senior Notes due 2014 issued in 2009 (“2014 Notes”) in exchange for $50 million of new 7.75% Convertible Senior Notes due 2018 (“2018 Notes”).
The 2018 Notes were issued pursuant to an indenture, dated as of May 8, 2013 (the “Indenture”), between the Company and The Bank of New York Mellon Trust Company, N.A., as trustee (the “Trustee”). We offered the 2018 Notes to certain holders of the 2014 Notes in reliance on the exemption from registration provided by Section 4(2) of the Securities Act of 1933, as amended. The 2018 Notes bear interest at 7.75% per year, payable semiannually in arrears in cash on June 30 and December 30 of each year, beginning on December 30, 2013. The 2018 Notes are TCS’s senior unsecured obligations and rank equally with all of its present and future senior unsecured debt and senior to any future subordinated debts and will be effectively subordinate to all of TCS’s present and future secured debt to the extent of the collateral securing that debt.
Holders may convert the 2018 Notes at their option on any day prior to the close of business on the second “scheduled trading day” (as defined in the Indenture) immediately preceding June 30, 2018. The conversion rate will initially be 96.637 shares of Class A common stock per $1 (one thousand) principal amount of 2018 Notes, equivalent to an initial conversion price of $10.348 per share of Class A common stock, which is the same conversion price as the 2014 Notes. Shares of the Company’s Class A common stock into which the 2018 Notes are convertible have been reserved for issuance by the Company. We may redeem some or all of the 2018 Notes at any time on or after June 30, 2014 at the redemption prices set forth in the Indenture plus accrued and unpaid interest to the redemption date. In addition, subject to certain exceptions, holders may require us to repurchase, for cash, all or part of their 2018 Notes upon a “fundamental change” (as defined in the Indenture) at a price equal to the purchase prices set forth in the Indenture, plus accrued and unpaid interest to, but excluding, the fundamental change purchase date. The Indenture contains customary terms and covenants, including that upon certain events of default occurring and continuing, either the Trustee or the holders of not less than 25% in aggregate principal amount of the 2018 Notes then outstanding may declare the entire principal amount of all the 2018 Notes plus accrued interest, if any, to be immediately due and payable.
4.5% Convertible Notes: In 2009, we sold $103.5 million aggregate principal amount of 4.5% Convertible Senior Notes, which have now been fully retired.
44
In the fourth quarter of 2012, we repurchased $10 million of the outstanding 2014 Notes, plus accrued and unpaid interest and recorded a gain on the early retirement of $0.4 million. On May 8, 2013, we retired $50 million of the 4.5% Convertible Senior Notes by exchanging them for $50 million of 2018 Notes. In the second half of 2013, we repurchased $28.9 million of the outstanding 2014 Notes, plus accrued and unpaid interested and recorded a loss of $0.2 million. In 2014, we repurchased the remaining $14.6 million balance of the 2014 Notes.
Concurrent with the issuance of the 2014 Notes, we entered into convertible note hedge transactions and warrant transactions, that were expected to reduce the potential dilution associated with the conversion of the 2014 Notes. Holders may have converted the 2014 Notes at their option on any day prior to the close of business on the second “scheduled trading day” (as defined in the Indenture) immediately preceding November 1, 2014. The conversion rate would have initially been 96.637 shares of Class A common stock per $1 (one thousand) principal amount of 2014 Notes, equivalent to an initial conversion price of approximately $10.35 per share of Class A common stock. The effect of the convertible note hedge and warrant transactions is an increase in the effective conversion premium of the 2014 Notes to $12.74 per share. The convertible note hedge and the warrant transactions are separate transactions, each entered into by the Company with the counterparties, which are not part of the terms of the 2014 Notes and will not affect the holders’ rights under the 2014 Notes. The cost of the convertible note hedge transactions to the Company was approximately $23.8 million, and was accounted for as an equity transaction in accordance with ASC 815-40, Contracts in Entity’s own Equity. The Company received proceeds of approximately $13 million related to the sale of the warrants, which has also been classified as equity as the warrants meet the classification criteria under ASC 815-40-25, in which the warrants and the convertible note hedge transactions require settlements in shares and provide the Company with the choice of a net cash or common shares settlement. As the convertible note hedge and warrants are indexed to our common stock, we recognized them in permanent equity in Additional paid-in capital, and will not recognize subsequent changes in fair value as long as the instruments remain classified as equity. The note hedge transaction expired pro rata as the 2014 Notes were repurchased. The warrants, which expire in 2015, were not affected by the retirements of the 2014 Notes.
Seller Notes: In July, 2012, we issued $14.3 million in 6% promissory notes as part of the consideration for our acquisition of microDATA. The remaining outstanding balance of $4.8 million was paid in accordance with the note terms on June 30, 2014.
We currently believe that we have sufficient capital resources with cash generated from operations as well as cash on hand to meet our anticipated cash operating expenses, working capital, and capital expenditure and debt service needs for the next twelve months. We have a $25 million undrawn Revolving Loan Facility through March 2018, $18.9 million of undrawn Delayed Draw Term Loan Facility available in the second quarter of 2015 for further borrowings if covenant requirements are met, as well as borrowing capacity under a capital lease facility. We may also consider raising capital in the public markets as a means to meet our capital needs and to invest in our business. Although we may need to return to the capital markets, establish new credit facilities, raise capital in private transactions in order to meet our capital requirements, we can offer no assurances that we will be able to access these potential sources of funds on terms acceptable to us or at all.
Off-Balance Sheet Arrangements
As of December 31, 2014, 2013, and 2012, we did not have any material standby letters of credit outstanding.
Contractual Commitments
As of December 31, 2014, our most significant commitments consisted of term debt, non-cancelable operating leases, purchase obligations, and obligations under capital leases. We lease certain furniture and computer equipment under capital leases. We lease office space and equipment under non-cancelable operating leases. Purchase obligations represent contracts for parts and services in connection with our government satellite services and systems offerings. As of December 31, 2014 our commitments consisted of the following:
|
|
Within 12 |
|
|
1-3 |
|
|
3-5 |
|
|
More Than |
|
|
|
|
|
||||
|
($ in millions) |
Months |
|
|
Years |
|
|
Years |
|
|
5 Years |
|
|
Total |
|
|||||
|
Senior credit facility1 |
$ |
12.6 |
|
|
$ |
15.7 |
|
|
$ |
55.2 |
|
|
$ |
— |
|
|
$ |
83.5 |
|
|
7.75% Convertible notes obligation due 2018 |
|
3.9 |
|
|
|
7.8 |
|
|
|
51.9 |
|
|
|
— |
|
|
|
63.6 |
|
|
Operating leases |
|
6.4 |
|
|
|
13.1 |
|
|
|
2.4 |
|
|
|
0.7 |
|
|
|
22.6 |
|
|
Purchase obligations |
|
12.7 |
|
|
|
1.8 |
|
|
|
— |
|
|
|
— |
|
|
|
14.5 |
|
|
Capital lease obligations |
|
4.6 |
|
|
|
5.6 |
|
|
|
— |
|
|
|
— |
|
|
|
10.2 |
|
|
Total contractual commitments |
$ |
40.2 |
|
|
$ |
44.0 |
|
|
$ |
109.5 |
|
|
$ |
0.7 |
|
|
$ |
194.4 |
|
1The cash payments due for Senior credit facility include estimated interest payments based on the LIBOR plus a fixed spread that were effective at the balance sheet date.
45
The preceding table does not reflect unrecognized tax benefits as of year ended 2014 of $4.6 million as the Company is unable to estimate the timing of related future payments. The Company does not anticipate the total amounts of unrecognized tax benefits to significantly increase in the next twelve months, see Note 16 to the Consolidated Financial Statements.
Item 7A. Qualitative and Quantitative Disclosures about Market Risk
Interest Rate Risk
We have limited exposure to financial market risks, including changes in interest rates. As discussed above under “Item 7. Management’s Discussion and Analysis of Financial Condition and Results of Operations — Liquidity and Capital Resources,” we have Senior Credit Facilities comprised of a $30 million revolving line of credit, a $56.5 million Term Loan A Facility, and a $43.5 million Delayed Draw Term Loan Facility. During 2014, we entered into an interest rate swap which initially hedged about $32.1 million of our floating rate bank debt. The notional amount of the swap will change over time to reflect approximately 50% of the outstanding expected Senior Credit Facilities balances. At December 31, 2014, we had $26.9 million of cash and cash equivalents and $23.2 million of marketable securities, or a total of $50.1 million. Cash and cash equivalents consisted of demand deposits and money market accounts that are interest rate sensitive. Marketable securities consisted of corporate bonds, agency bonds and mortgage and asset backed securities, see Note 5. These investments have short maturities mitigating their sensitivity to interest rates. A hypothetical 100 basis point adverse movement (increase) in interest rates would have decreased our net income for 2014 by approximately $0.5 million, resulting in no significant impact on our consolidated financial position, results of operations or cash flows.
Foreign Currency Risk
For the year ended December 31, 2014, we generated $40.7 million of revenue outside the U.S. A majority of our transactions generated outside the U.S. are denominated in U.S. dollars and a change in exchange rates would not have a material impact on our Consolidated Financial Statements. As of December 31, 2014, we had approximately $0.8 million of billed and $1.1 million unbilled accounts receivable that would expose us to foreign currency exchange risk. During 2014, our average receivables and deferred revenue subject to foreign currency exchange risk were $1.4 million and $0.2 million, respectively. We recorded an immaterial amount of transaction income on foreign currency denominated receivables and deferred revenue for the year ended December 31, 2014.
Item 8. Financial Statements and Supplementary Data
The financial statements listed in Item 15 are included in this Annual Report on Form 10-K beginning on page F-1.
Item 9. Changes In and Disagreements With Accountants on Accounting and Financial Disclosure
None.
Item 9A. Controls and Procedures
Evaluation of Disclosure Controls and Procedures
As of the end of the period covered by this Annual Report on Form 10-K, we carried out an evaluation, under the supervision and with the participation of our management, including our Chief Executive Officer and Chief Financial Officer, of the effectiveness of the design and operation of our disclosure controls and procedures. There are inherent limitations to the effectiveness of any system of disclosure controls and procedures, including the possibility of human error and the circumvention or overriding of the controls and procedures. Accordingly, even effective disclosure controls and procedures can only provide reasonable assurance of achieving their control objectives.
Based upon that evaluation, our Chief Executive Officer and Chief Financial Officer concluded that our disclosure controls and procedures (as defined in Rule 13a-15(e) or 15d-15(e) of the Exchange Act) were effective to provide reasonable assurance that information we are required to disclose in reports we file or submit under the Exchange Act is recorded, processed, summarized and reported within the time periods specified in the applicable rules and forms, and that it is accumulated and communicated to our management, including our Chief Executive Officer and Chief Financial Officer, as appropriate, to allow timely decisions regarding required disclosure.
46
Management’s Report on Internal Control over Financial Reporting
Our management is responsible for establishing and maintaining adequate internal control over financial reporting, as defined in Exchange Act Rule 13a-15(f). Management, including our Chief Executive Officer and Chief Financial Officer, conducted an evaluation of the effectiveness of our internal control over financial reporting based on the framework in Internal Control—Integrated Framework issued by the Committee of Sponsoring Organizations of the Treadway Commission (1992 framework). Based on this evaluation, management concluded that our internal control over financial reporting was effective as of December 31, 2014. Management reviewed the results of their assessment with our Audit Committee. The effectiveness of our internal control over financial reporting as of December 31, 2014 has been audited by Ernst & Young LLP, an independent registered public accounting firm, as stated in their report which is included in Item 9A of this Annual Report on Form 10-K.
Changes in Internal Control over Financial Reporting
There were no changes in the Company’s internal controls over financial reporting during the quarter ended December 31, 2014, that are materially affected, or are reasonably likely to materially affect, the Company’s internal control over financial reporting.
47
Report of Independent Registered Public Accounting Firm
The Board of Directors and Shareholders of
TeleCommunication Systems, Inc.
We have audited TeleCommunication Systems, Inc. internal control over financial reporting as of December 31, 2014, based on criteria established in Internal Control—Integrated Framework issued by the Committee of Sponsoring Organizations of the Treadway Commission (1992 framework) (the COSO criteria). TeleCommunication Systems, Inc.’s management is responsible for maintaining effective internal control over financial reporting, and for its assessment of the effectiveness of internal control over financial reporting included in the accompanying Management’s Report on Internal Control over Financial Reporting. Our responsibility is to express an opinion on the company’s internal control over financial reporting based on our audit.
We conducted our audit in accordance with the standards of the Public Company Accounting Oversight Board (United States). Those standards require that we plan and perform the audit to obtain reasonable assurance about whether effective internal control over financial reporting was maintained in all material respects. Our audit included obtaining an understanding of internal control over financial reporting, assessing the risk that a material weakness exists, testing and evaluating the design and operating effectiveness of internal control based on the assessed risk, and performing such other procedures as we considered necessary in the circumstances. We believe that our audit provides a reasonable basis for our opinion.
A company’s internal control over financial reporting is a process designed to provide reasonable assurance regarding the reliability of financial reporting and the preparation of financial statements for external purposes in accordance with generally accepted accounting principles. A company’s internal control over financial reporting includes those policies and procedures that (1) pertain to the maintenance of records that, in reasonable detail, accurately and fairly reflect the transactions and dispositions of the assets of the company; (2) provide reasonable assurance that transactions are recorded as necessary to permit preparation of financial statements in accordance with generally accepted accounting principles, and that receipts and expenditures of the company are being made only in accordance with authorizations of management and directors of the company; and (3) provide reasonable assurance regarding prevention or timely detection of unauthorized acquisition, use, or disposition of the company’s assets that could have a material effect on the financial statements.
Because of its inherent limitations, internal control over financial reporting may not prevent or detect misstatements. Also, projections of any evaluation of effectiveness to future periods are subject to the risk that controls may become inadequate because of changes in conditions, or that the degree of compliance with the policies or procedures may deteriorate.
In our opinion, TeleCommunication Systems, Inc. maintained, in all material respects, effective internal control over financial reporting as of December 31, 2014, based on the COSO criteria.
We also have audited, in accordance with the standards of the Public Company Accounting Oversight Board (United States), the consolidated balance sheets of TeleCommunication Systems, Inc. as of December 31, 2014 and 2013, and the related consolidated statements of operations, comprehensive income (loss), shareholders' equity and cash flows for each of the three years in the period ended December 31, 2014 of TeleCommunication Systems, Inc. and our report dated March 13, 2015 expressed an unqualified opinion thereon.
Baltimore, Maryland/s/ Ernst & Young LLP
March 13, 2015
48
Item 10. Directors , Executive Officers, and Corporate Governance
The information required by this Item 10 is incorporated herein by reference from the information captioned “Board of Directors” and “Security Ownership of Certain Beneficial Owners and Management” to be included in the Company’s definitive proxy statement to be filed in connection with the 2015 Annual Meeting of Stockholders, to be held on May 28, 2015 (the “Proxy Statement”).
The Company’s Code of Ethics and Whistleblower Procedures may be found at http://www1.telecomsys.com/investor_info/corp_governance.cfm.
Item 11. Executive Compensation
The information required by this Item 11 is incorporated herein by reference from the information captioned “Board of Directors” and “Executive Compensation” to be included in the Proxy Statement.
Item 12. Security Ownership of Certain Beneficial Owners and Management
The information required by this Item 12 is incorporated herein by reference from the information captioned “Security Ownership of Certain Beneficial Owners and Management” to be included in the Proxy Statement.
Item 13. Certain Relationships and Related Transactions and Director Independence
The information required by this Item 13 is incorporated herein by reference from the information captioned “Certain Relationships and Related Transactions” and “General Information Concerning the Board of Directors” to be included in the Proxy Statement.
Item 14. Principal Accountant Fees and Services
The information required by this Item 14 is incorporated herein by reference from the information captioned “Principal Accountant Fees and Services” to be included in the Proxy Statement.
49
Item 15. Exhibits, Financial Statement Schedules
(a)(1) Financial Statements
The financial statements listed in Item 15 are included in this Annual Report on Form 10-K beginning on page F-1.
(a)(2) Financial Statement Schedules
The financial statement schedule required by Item 15 is included in Exhibit 12 to this Annual Report on Form 10-K.
Exhibits
The exhibits are listed in the Exhibit Index immediately preceding the exhibits.
|
Supplemental Financial Schedule II |
|
||||||||||||||||||
|
|
|
|
|
|
|
|
|
|
|
|
|
|
|
|
|
|
|
||
|
TeleCommunication Systems, Inc. |
|
||||||||||||||||||
|
Valuation and Qualifying Accounts |
|
||||||||||||||||||
|
(amounts in thousands) |
|
||||||||||||||||||
|
|
|
|
|
|
|
|
|
|
|
|
|
|
|
|
|
|
|
||
|
|
Column A |
|
Column B |
|
|
Column C |
|
|
Column D |
|
|
Column E |
|
||||||
|
|
|
|
|
|
|
|
|
|
|
|
|
|
|
|
|
|
|
||
|
|
Description |
|
Balance Beginning of Year |
|
|
Additions, Costs, and Expenses |
|
|
Deductions |
|
|
Balance End of Year |
|
||||||
|
|
|
|
|
|
|
|
|
|
|
|
|
|
|
|
|
|
|
||
|
|
Year ended December 31, 2014 |
|
|
|
|
|
|
|
|
|
|
|
|
|
|
|
|
||
|
|
Allowance for doubtful accounts |
|
$ |
388 |
|
|
$ |
242 |
|
|
$ |
(25 |
) |
|
$ |
605 |
|
||
|
|
Income tax valuation allowance |
|
$ |
30,284 |
|
|
$ |
4,611 |
|
|
$ |
- |
|
|
$ |
34,895 |
|
||
|
|
|
|
|
|
|
|
|
|
|
|
|
|
|
|
|
|
|
||
|
|
Year ended December 31, 2013 |
|
|
|
|
|
|
|
|
|
|
|
|
|
|
|
|
||
|
|
Allowance for doubtful accounts |
|
$ |
394 |
|
|
$ |
446 |
|
|
$ |
(452 |
) |
|
$ |
388 |
|
||
|
|
Income tax valuation allowance |
|
$ |
698 |
|
|
$ |
29,586 |
|
|
$ |
- |
|
|
$ |
30,284 |
|
||
|
|
|
|
|
|
|
|
|
|
|
|
|
|
|
|
|
|
|
||
|
|
Year ended December 31, 2012 |
|
|
|
|
|
|
|
|
|
|
|
|
|
|
|
|
||
|
|
Allowance for doubtful accounts |
|
$ |
368 |
|
|
$ |
30 |
|
|
$ |
(4 |
) |
|
$ |
394 |
|
||
|
|
Income tax valuation allowance |
|
$ |
698 |
|
|
$ |
- |
|
|
$ |
- |
|
|
$ |
698 |
|
||
50
Index to Consolidated Financial Statements
|
|
F– |
2 |
|
|
Consolidated Balance Sheets as of December 31, 2014 and 2013 |
|
F– |
3 |
|
|
F– |
4 |
|
|
|
F– |
5 |
|
|
|
F– |
6 |
|
|
|
F– |
7 |
|
|
|
F– |
8 |
F-1
Report of Independent Registered Public Accounting Firm
The Board of Directors and Shareholders of
TeleCommunication Systems, Inc.
We have audited the accompanying consolidated balance sheets of TeleCommunication Systems, Inc. as of December 31, 2014 and 2013, and the related consolidated statements of operations, comprehensive income (loss), shareholders' equity and cash flows for each of the three years in the period ended December 31, 2014. Our audits also included the financial statement schedule listed in the Index at Item 15(a)(2). These financial statements and schedule are the responsibility of the Company's management. Our responsibility is to express an opinion on these financial statements and schedule based on our audits.
We conducted our audits in accordance with the standards of the Public Company Accounting Oversight Board (United States). Those standards require that we plan and perform the audit to obtain reasonable assurance about whether the financial statements are free of material misstatement. An audit includes examining, on a test basis, evidence supporting the amounts and disclosures in the financial statements. An audit also includes assessing the accounting principles used and significant estimates made by management, as well as evaluating the overall financial statement presentation. We believe that our audits provide a reasonable basis for our opinion.
In our opinion, the financial statements referred to above present fairly, in all material respects, the consolidated financial position of TeleCommunication Systems, Inc. at December 31, 2014 and 2013, and the consolidated results of its operations and its cash flows for each of the three years in the period ended December 31, 2014, in conformity with U.S. generally accepted accounting principles. Also, in our opinion, the related financial statement schedule, when considered in relation to the basic financial statements taken as a whole, presents fairly in all material respects the information set forth therein.
We also have audited, in accordance with the standards of the Public Company Accounting Oversight Board (United States), TeleCommunication Systems, Inc.'s internal control over financial reporting as of December 31, 2014, based on criteria established in Internal Control-Integrated Framework issued by the Committee of Sponsoring Organizations of the Treadway Commission (1992 framework) and our report dated March 13, 2015 expressed an unqualified opinion thereon.
Baltimore, Maryland/s/ Ernst & Young LLP
March 13, 2015
F-2
TeleCommunication Systems, Inc.
(amounts in thousands, except share data)
|
|
December 31, |
|
|
December 31, |
|
||
|
|
2014 |
|
|
2013 |
|
||
|
|
|
|
|
|
|
|
|
|
Assets |
|
|
|
|
|
|
|
|
Current assets: |
|
|
|
|
|
|
|
|
Cash and cash equivalents |
$ |
26,922 |
|
|
$ |
41,904 |
|
|
Marketable securities |
|
23,226 |
|
|
|
20,004 |
|
|
Accounts receivable, net of allowance of $605 in 2014 and $388 in 2013 |
|
74,051 |
|
|
|
45,789 |
|
|
Unbilled receivables |
|
22,324 |
|
|
|
16,009 |
|
|
Inventory |
|
6,253 |
|
|
|
9,890 |
|
|
Deferred project costs and other current assets |
|
17,977 |
|
|
|
15,286 |
|
|
Total current assets |
|
170,753 |
|
|
|
148,882 |
|
|
Property and equipment, net of accumulated depreciation and amortization of $83,645 in 2014 and $73,068 in 2013 |
|
33,418 |
|
|
|
38,355 |
|
|
Software development costs, net of accumulated amortization of $3,072 in 2014 and $1,791 in 2013 |
|
4,608 |
|
|
|
4,178 |
|
|
Acquired intangible assets, net of accumulated amortization of $13,970 in 2014 and $10,173 in 2013 |
|
17,206 |
|
|
|
21,003 |
|
|
Goodwill |
|
104,241 |
|
|
|
104,241 |
|
|
Other assets |
|
3,855 |
|
|
|
4,796 |
|
|
Total assets |
$ |
334,081 |
|
|
$ |
321,455 |
|
|
Liabilities and stockholders’ equity |
|
|
|
|
|
|
|
|
Current liabilities: |
|
|
|
|
|
|
|
|
Accounts payable and accrued expenses |
$ |
41,599 |
|
|
$ |
24,372 |
|
|
Accrued payroll and related liabilities |
|
13,599 |
|
|
|
14,378 |
|
|
Deferred revenue |
|
22,000 |
|
|
|
24,809 |
|
|
Current portion of bank borrowings and notes payable, and capital lease obligations |
|
19,291 |
|
|
|
30,145 |
|
|
Total current liabilities |
|
96,489 |
|
|
|
93,704 |
|
|
Notes payable and capital lease obligations, less current portion |
|
119,850 |
|
|
|
117,384 |
|
|
Deferred tax liabilities |
|
3,556 |
|
|
|
— |
|
|
Other liabilities |
|
1,340 |
|
|
|
1,124 |
|
|
Stockholders’ equity: |
|
|
|
|
|
|
|
|
Class A Common Stock; $0.01 par value: |
|
|
|
|
|
|
|
|
Authorized shares - 225,000,000; issued and outstanding shares of 55,144,066 in 2014 and 53,763,871 in 2013 |
|
552 |
|
|
|
538 |
|
|
Class B Common Stock; $0.01 par value: |
|
|
|
|
|
|
|
|
Authorized shares - 75,000,000; issued and outstanding shares of 4,801,245 in 2014 and 4,997,769 in 2013 |
|
48 |
|
|
|
50 |
|
|
Additional paid-in capital |
|
346,277 |
|
|
|
340,814 |
|
|
Accumulated other comprehensive (loss) income |
|
(114 |
) |
|
|
27 |
|
|
Accumulated deficit |
|
(233,917 |
) |
|
|
(232,186 |
) |
|
Total stockholders’ equity |
|
112,846 |
|
|
|
109,243 |
|
|
Total liabilities and stockholders’ equity |
$ |
334,081 |
|
|
$ |
321,455 |
|
See accompanying Notes to Consolidated Financial Statements.
F-3
TeleCommunication Systems, Inc.
Consolidated Statements of Operations
(amounts in thousands, except per share data)
|
|
Year ended December 31, |
|
|||||||||
|
|
2014 |
|
|
2013 |
|
|
2012 |
|
|||
|
Revenue |
|
|
|
|
|
|
|
|
|
|
|
|
Services |
$ |
260,747 |
|
|
$ |
281,389 |
|
|
$ |
305,118 |
|
|
Systems |
|
99,090 |
|
|
|
80,902 |
|
|
|
182,266 |
|
|
Total revenue |
|
359,837 |
|
|
|
362,291 |
|
|
|
487,384 |
|
|
|
|
|
|
|
|
|
|
|
|
|
|
|
Direct costs of revenue |
|
|
|
|
|
|
|
|
|
|
|
|
Direct cost of services revenue |
|
142,231 |
|
|
|
156,285 |
|
|
|
178,317 |
|
|
Direct cost of systems revenue |
|
70,040 |
|
|
|
67,038 |
|
|
|
148,860 |
|
|
Total direct cost of revenue |
|
212,271 |
|
|
|
223,323 |
|
|
|
327,177 |
|
|
|
|
|
|
|
|
|
|
|
|
|
|
|
Services gross profit |
|
118,516 |
|
|
|
125,104 |
|
|
|
126,801 |
|
|
Systems gross profit |
|
29,050 |
|
|
|
13,864 |
|
|
|
33,406 |
|
|
Total gross profit |
|
147,566 |
|
|
|
138,968 |
|
|
|
160,207 |
|
|
|
|
|
|
|
|
|
|
|
|
|
|
|
Operating expenses |
|
|
|
|
|
|
|
|
|
|
|
|
Research and development expense |
|
41,723 |
|
|
|
34,308 |
|
|
|
36,602 |
|
|
Sales and marketing expense |
|
25,994 |
|
|
|
28,495 |
|
|
|
30,753 |
|
|
General and administrative expense |
|
50,820 |
|
|
|
54,689 |
|
|
|
54,277 |
|
|
Depreciation and amortization of property and equipment |
|
13,032 |
|
|
|
14,853 |
|
|
|
14,245 |
|
|
Amortization of acquired intangible assets |
|
3,797 |
|
|
|
4,570 |
|
|
|
4,374 |
|
|
Impairment of goodwill and long-lived assets |
|
— |
|
|
|
31,977 |
|
|
|
125,703 |
|
|
Total operating expenses |
|
135,366 |
|
|
|
168,892 |
|
|
|
265,954 |
|
|
|
|
|
|
|
|
|
|
|
|
|
|
|
Income (loss) from operations |
|
12,200 |
|
|
|
(29,924 |
) |
|
|
(105,747 |
) |
|
|
|
|
|
|
|
|
|
|
|
|
|
|
Interest expense |
|
(8,264 |
) |
|
|
(8,262 |
) |
|
|
(7,383 |
) |
|
Amortization of deferred financing fees |
|
(1,005 |
) |
|
|
(3,403 |
) |
|
|
(757 |
) |
|
Gain (loss) on early retirement of debt |
|
— |
|
|
|
(178 |
) |
|
|
431 |
|
|
Other income (expense), net |
|
(1,133 |
) |
|
|
(239 |
) |
|
|
(23 |
) |
|
Net income (loss) before income taxes |
|
1,798 |
|
|
|
(42,006 |
) |
|
|
(113,479 |
) |
|
Income tax (expense) benefit |
|
(3,529 |
) |
|
|
(16,591 |
) |
|
|
15,491 |
|
|
Net loss |
$ |
(1,731 |
) |
|
$ |
(58,597 |
) |
|
$ |
(97,988 |
) |
|
|
|
|
|
|
|
|
|
|
|
|
|
|
Net loss per share-basic and diluted |
$ |
(0.03 |
) |
|
$ |
(1.00 |
) |
|
$ |
(1.69 |
) |
|
|
|
|
|
|
|
|
|
|
|
|
|
|
Weighted average shares outstanding-basic and diluted |
|
59,466 |
|
|
|
58,611 |
|
|
|
57,889 |
|
See accompanying Notes to Consolidated Financial Statements.
F-4
TeleCommunication Systems, Inc.
Consolidated Statements of Comprehensive Loss
(amounts in thousands)
|
|
|
|
|||||||||
|
|
Year Ended December 31, |
|
|||||||||
|
|
2014 |
|
|
2013 |
|
|
2012 |
|
|||
|
Net loss |
$ |
(1,731 |
) |
|
$ |
(58,597 |
) |
|
$ |
(97,988 |
) |
|
Other comprehensive income (loss): |
|
|
|
|
|
|
|
|
|
|
|
|
Foreign currency translation adjustments |
|
|
|
|
|
|
|
|
|
|
|
|
Arising during the period |
|
198 |
|
|
|
(17 |
) |
|
|
(7 |
) |
|
Reclassification to net loss |
|
(17 |
) |
|
|
— |
|
|
|
— |
|
|
Net foreign currency translation |
|
181 |
|
|
|
(17 |
) |
|
|
(7 |
) |
|
Unrealized loss on interest rate hedge |
|
(240 |
) |
|
|
— |
|
|
|
— |
|
|
Unrealized gain (loss) on securities: |
|
|
|
|
|
|
|
|
|
|
|
|
Arising during the period |
|
(89 |
) |
|
|
1 |
|
|
|
38 |
|
|
Reclassification to net loss |
|
7 |
|
|
|
(7 |
) |
|
|
(13 |
) |
|
Net unrealized gain (loss) |
|
(82 |
) |
|
|
(6 |
) |
|
|
25 |
|
|
Other comprehensive income (loss) |
|
(141 |
) |
|
|
(23 |
) |
|
|
18 |
|
|
Comprehensive loss |
$ |
(1,872 |
) |
|
$ |
(58,620 |
) |
|
$ |
(97,970 |
) |
See accompanying Notes to Consolidated Financial Statements.
F-5
TeleCommunication Systems, Inc.
Consolidated Statements of Stockholders’ Equity
(amounts in thousands, except share data)
|
|
|
|
|
|
|
|
|
|
|
|
|
|
Accumulated |
|
|
|
|
|
|
|
|
|
|
|
|
Class A |
|
|
Class B |
|
|
Additional |
|
|
Other |
|
|
|
|
|
|
|
|
|
||||
|
|
Common |
|
|
Common |
|
|
Paid-In |
|
|
Comprehensive |
|
|
Accumulated |
|
|
|
|
|
|||||
|
|
Stock |
|
|
Stock |
|
|
Capital |
|
|
Income (Loss) |
|
|
Deficit |
|
|
Total |
|
||||||
|
Balance at January 1, 2012 |
$ |
521 |
|
|
$ |
53 |
|
|
$ |
325,744 |
|
|
$ |
32 |
|
|
$ |
(75,601 |
) |
|
$ |
250,749 |
|
|
|
|
|
|
|
|
|
|
|
|
|
|
|
|
|
|
|
|
|
|
|
|
|
|
|
Options exercised for the purchase of 54,921 shares of Class A Common Stock |
|
— |
|
|
|
— |
|
|
|
132 |
|
|
|
— |
|
|
|
— |
|
|
|
132 |
|
|
Issuance of 583,034 shares of Class A Common Stock under Employee Stock Purchase Plan |
|
6 |
|
|
|
— |
|
|
|
862 |
|
|
|
— |
|
|
|
— |
|
|
|
868 |
|
|
Issuance of 301,053 Restricted Class A Common Stock |
|
3 |
|
|
|
— |
|
|
|
— |
|
|
|
— |
|
|
|
— |
|
|
|
3 |
|
|
Surrender of shares of Restricted Class A Common Stock |
|
— |
|
|
|
— |
|
|
|
(191 |
) |
|
|
— |
|
|
|
— |
|
|
|
(191 |
) |
|
Conversion of 100,000 shares of Class B Common Stock to Class A Common Stock |
|
1 |
|
|
|
(1 |
) |
|
|
— |
|
|
|
— |
|
|
|
— |
|
|
|
— |
|
|
Stock-based compensation expense |
|
— |
|
|
|
— |
|
|
|
9,021 |
|
|
|
— |
|
|
|
— |
|
|
|
9,021 |
|
|
Excess tax deficit from share-based payment arrangements |
|
— |
|
|
|
— |
|
|
|
(1,510 |
) |
|
|
— |
|
|
|
— |
|
|
|
(1,510 |
) |
|
Other comprehensive income |
|
— |
|
|
|
— |
|
|
|
— |
|
|
|
18 |
|
|
|
— |
|
|
|
18 |
|
|
Net loss |
|
— |
|
|
|
— |
|
|
|
— |
|
|
|
— |
|
|
|
(97,988 |
) |
|
|
(97,988 |
) |
|
Balance at December 31, 2012 |
$ |
531 |
|
|
$ |
52 |
|
|
$ |
334,058 |
|
|
$ |
50 |
|
|
$ |
(173,589 |
) |
|
$ |
161,102 |
|
|
|
|
|
|
|
|
|
|
|
|
|
|
|
|
|
|
|
|
|
|
|
|
|
|
|
Options exercised for the purchase of 96,267 shares of Class A Common Stock |
|
1 |
|
|
|
— |
|
|
|
181 |
|
|
|
— |
|
|
|
— |
|
|
|
182 |
|
|
Issuance of 639,232 Restricted Class A Common Stock |
|
6 |
|
|
|
— |
|
|
|
(6 |
) |
|
|
— |
|
|
|
— |
|
|
|
— |
|
|
Surrender of shares of Restricted Class A Common Stock |
|
(2 |
) |
|
|
— |
|
|
|
(455 |
) |
|
|
— |
|
|
|
— |
|
|
|
(457 |
) |
|
Conversion of 250,000 shares of Class B Common Stock to Class A Common Stock |
|
2 |
|
|
|
(2 |
) |
|
|
— |
|
|
|
— |
|
|
|
— |
|
|
|
— |
|
|
Stock-based compensation expense |
|
— |
|
|
|
— |
|
|
|
7,036 |
|
|
|
— |
|
|
|
— |
|
|
|
7,036 |
|
|
Other comprehensive loss |
|
— |
|
|
|
— |
|
|
|
— |
|
|
|
(23 |
) |
|
|
— |
|
|
|
(23 |
) |
|
Net loss |
|
— |
|
|
|
— |
|
|
|
— |
|
|
|
— |
|
|
|
(58,597 |
) |
|
|
(58,597 |
) |
|
Balance at December 31, 2013 |
$ |
538 |
|
|
$ |
50 |
|
|
$ |
340,814 |
|
|
$ |
27 |
|
|
$ |
(232,186 |
) |
|
$ |
109,243 |
|
|
|
|
|
|
|
|
|
|
|
|
|
|
|
|
|
|
|
|
|
|
|
|
|
|
|
Options exercised for the purchase of 232,448 shares of Class A Common Stock |
|
2 |
|
|
|
— |
|
|
|
537 |
|
|
|
— |
|
|
|
— |
|
|
|
539 |
|
|
Issuance of 160,115 shares of Class A Common Stock under Employee Stock Purchase Plan |
|
2 |
|
|
|
— |
|
|
|
336 |
|
|
|
— |
|
|
|
— |
|
|
|
338 |
|
|
Issuance of 1,063,993 Restricted Class A Common Stock |
|
11 |
|
|
|
— |
|
|
|
(129 |
) |
|
|
— |
|
|
|
— |
|
|
|
(118 |
) |
|
Surrender of shares of Restricted Class A Common Stock |
|
(3 |
) |
|
|
— |
|
|
|
(830 |
) |
|
|
— |
|
|
|
— |
|
|
|
(833 |
) |
|
Conversion of 196,524 shares of Class B Common Stock to Class A Common Stock |
|
2 |
|
|
|
(2 |
) |
|
|
— |
|
|
|
— |
|
|
|
— |
|
|
|
— |
|
|
Stock-based compensation expense |
|
— |
|
|
|
— |
|
|
|
5,549 |
|
|
|
— |
|
|
|
— |
|
|
|
5,549 |
|
|
Other comprehensive loss |
|
— |
|
|
|
— |
|
|
|
— |
|
|
|
(141 |
) |
|
|
— |
|
|
|
(141 |
) |
|
Net loss |
|
— |
|
|
|
— |
|
|
|
— |
|
|
|
— |
|
|
|
(1,731 |
) |
|
|
(1,731 |
) |
|
Balance at December 31, 2014 |
$ |
552 |
|
|
$ |
48 |
|
|
$ |
346,277 |
|
|
$ |
(114 |
) |
|
$ |
(233,917 |
) |
|
$ |
112,846 |
|
See accompanying Notes to Consolidated Financial Statements.
F-6
TeleCommunication Systems, Inc.
Consolidated Statements of Cash Flows
(amounts in thousands)
|
|
|
|
|||||||||
|
|
Year Ended December 31, |
|
|||||||||
|
|
2014 |
|
|
2013 |
|
|
2012 |
|
|||
|
Operating activities: |
|
|
|
|
|
|
|
|
|
|
|
|
Net loss |
$ |
(1,731 |
) |
|
$ |
(58,597 |
) |
|
$ |
(97,988 |
) |
|
Adjustments to reconcile net income to net cash provided by operating activities: |
|
|
|
|
|
|
|
|
|
|
|
|
Impairment of goodwill and long-lived assets |
|
— |
|
|
|
31,977 |
|
|
|
125,703 |
|
|
Depreciation and amortization of property and equipment |
|
13,032 |
|
|
|
14,853 |
|
|
|
14,245 |
|
|
Stock-based compensation expense |
|
5,549 |
|
|
|
7,036 |
|
|
|
9,021 |
|
|
Amortization of acquired intangible assets |
|
3,797 |
|
|
|
4,570 |
|
|
|
4,374 |
|
|
Deferred tax expense (benefit) |
|
3,556 |
|
|
|
16,046 |
|
|
|
(15,691 |
) |
|
Amortization of capitalized software development costs |
|
1,281 |
|
|
|
7,466 |
|
|
|
7,660 |
|
|
Amortization of deferred financing fees |
|
1,005 |
|
|
|
3,403 |
|
|
|
757 |
|
|
Amortization of investment premiums and accretion of discounts, net |
|
437 |
|
|
|
246 |
|
|
|
425 |
|
|
Excess tax deficit from share-based payment arrangements |
|
— |
|
|
|
— |
|
|
|
1,510 |
|
|
Gain (loss) on early retirement of debt |
|
— |
|
|
|
178 |
|
|
|
(431 |
) |
|
Other non-cash adjustments |
|
1,221 |
|
|
|
(1,339 |
) |
|
|
968 |
|
|
Changes in operating assets and liabilities: |
|
|
|
|
|
|
|
|
|
|
|
|
Accounts receivable, net |
|
(26,296 |
) |
|
|
37,202 |
|
|
|
(16,062 |
) |
|
Unbilled receivables |
|
(4,613 |
) |
|
|
7,086 |
|
|
|
8,768 |
|
|
Inventory |
|
3,637 |
|
|
|
1,194 |
|
|
|
(3,941 |
) |
|
Deferred project costs and other current assets |
|
(2,338 |
) |
|
|
108 |
|
|
|
1,376 |
|
|
Other assets |
|
(64 |
) |
|
|
(2,772 |
) |
|
|
1,316 |
|
|
Accounts payable and accrued expenses |
|
7,945 |
|
|
|
(13,464 |
) |
|
|
(10,441 |
) |
|
Accrued payroll and related liabilities |
|
(3,665 |
) |
|
|
(4,028 |
) |
|
|
1,063 |
|
|
Deferred revenue |
|
(7,429 |
) |
|
|
(1,718 |
) |
|
|
5,184 |
|
|
Other liabilities |
|
(2,809 |
) |
|
|
(1,254 |
) |
|
|
108 |
|
|
Subtotal - Changes in operating assets and liabilities |
|
(35,632 |
) |
|
|
22,354 |
|
|
|
(12,629 |
) |
|
Net cash (used in) provided by operating activities |
|
(7,485 |
) |
|
|
48,193 |
|
|
|
37,924 |
|
|
|
|
|
|
|
|
|
|
|
|
|
|
|
Investing activities: |
|
|
|
|
|
|
|
|
|
|
|
|
Purchases of property and equipment |
|
(5,663 |
) |
|
|
(10,736 |
) |
|
|
(17,761 |
) |
|
Cash received for business wind-down arrangement |
|
15,016 |
|
|
|
— |
|
|
|
— |
|
|
Acquisition, net of cash acquired |
|
— |
|
|
|
— |
|
|
|
(20,786 |
) |
|
Purchases of marketable securities |
|
(24,770 |
) |
|
|
(12,697 |
) |
|
|
(6,630 |
) |
|
Proceeds from sale and maturity of marketable securities |
|
21,029 |
|
|
|
7,316 |
|
|
|
10,587 |
|
|
Capitalized software development costs |
|
(1,687 |
) |
|
|
(1,954 |
) |
|
|
(1,881 |
) |
|
Net cash provided by (used in) investing activities |
|
3,925 |
|
|
|
(18,071 |
) |
|
|
(36,471 |
) |
|
|
|
|
|
|
|
|
|
|
|
|
|
|
Financing activities: |
|
|
|
|
|
|
|
|
|
|
|
|
Payments on bank borrowings, notes payable, and capital lease obligations |
|
(30,642 |
) |
|
|
(91,066 |
) |
|
|
(55,664 |
) |
|
Proceeds from bank and other borrowings |
|
19,562 |
|
|
|
66,500 |
|
|
|
54,500 |
|
|
Payments of tax withholdings on restricted stock |
|
(833 |
) |
|
|
(457 |
) |
|
|
— |
|
|
Earn-out payment related to 2012 acquisition |
|
(268 |
) |
|
|
— |
|
|
|
(3,863 |
) |
|
Excess tax deficit from share-based payment arrangements |
|
— |
|
|
|
— |
|
|
|
(1,510 |
) |
|
Proceeds from exercise of employee stock options and sale of stock |
|
759 |
|
|
|
182 |
|
|
|
809 |
|
|
Net cash used in financing activities |
|
(11,422 |
) |
|
|
(24,841 |
) |
|
|
(5,728 |
) |
|
|
|
|
|
|
|
|
|
|
|
|
|
|
Net increase (decrease) in cash |
|
(14,982 |
) |
|
|
5,281 |
|
|
|
(4,275 |
) |
|
Cash and cash equivalents at the beginning of the period |
|
41,904 |
|
|
|
36,623 |
|
|
|
40,898 |
|
|
|
|
|
|
|
|
|
|
|
|
|
|
|
Cash and cash equivalents at the end of the period |
$ |
26,922 |
|
|
$ |
41,904 |
|
|
$ |
36,623 |
|
See accompanying Notes to Consolidated Financial Statements.
F-7
TeleCommunication Systems, Inc.
Notes to Consolidated Financial Statements
(amounts in thousands, except per share data)
1. Significant Accounting Policies
Description of Business
TeleCommunication Systems, Inc. develops and delivers highly reliable and secure wireless communication technology. The Company enables 9-1-1 infrastructure, cybersecurity, deployable wireless terminals, space components, and applications for mobile location-based services and messaging. Principal customers are wireless network operators, defense and public safety government agencies, and Fortune 150 enterprises requiring high reliability and security. While we manage and have historically reported two business segments, Commercial and Government, digital wireless voice and data communication technology is converging, so engineers from either segment are collaborating to address solution needs for customers of the other segment.
Commercial Segment: We are one of two leading companies that enable 9-1-1 call routing via cellular, VoIP, and next generation technology. Other TCS hosted and managed services include cellular carrier infrastructure for text messaging and location-based platforms and applications. Commercial segment customers include wireless network operators, VoIP, wireless device manufacturers, automotive industry suppliers, and state and local governments.
Government Segment: For our core segment customers, U.S. Department of Defense agencies, we provide cybersecurity services, support, and training and “C4ISR” (command, control, communications, computers, intelligence surveillance and reconnaissance) resources, wireless ground terminals and related support, management and resale of satellite bandwidth, and information technology outsource services. TCS engineers, furnishes, and supports ground terminals used for secure satellite-based and other line-of-sight and beyond-line-of-sight communications, as well as related components incorporating government-approved cryptologic devices and other hardened components for aerospace and defense.
Use of Estimates. The preparation of financial statements in conformity with accounting principles generally accepted in the U.S. requires management to make estimates and assumptions that affect the reported amounts and related disclosures. Significant estimates and assumptions in these consolidated financial statements include estimates used in revenue recognition, fair value of business combinations, fair value associated with goodwill, intangible assets and long-lived asset impairment tests, estimated values of software development costs, income taxes and deferred tax valuation allowances, the fair value of marketable securities and stock based compensation, and legal and contingent liabilities. Actual results could differ from those estimates.
In reporting the values of long-lived assets, the Company reported no impairment charges in 2014. In 2013, TCS’s Platforms and Applications reporting unit’s goodwill and long-lived assets with a carrying value of $65,406 were written down to estimated fair value of $33,429, resulting in an impairment charge of $31,977 to goodwill and long-lived assets. We valued the existing technology using a discounted cash flow method to determine whether a write-down was necessary, and after concluding that a write-down was necessary, used a relief from royalty method to value the licensable technology. We then used a discounted cash flow method to determine the fair value of our Platforms and Applications reporting unit.
A summary of the 2013 impairment charge is set forth below:
|
|
|
Carrying |
|
|
|
Fair Value |
|
|
|
Total Impairment Charge |
|
|
|
|
|
|
|
|
|
|
|
|
|
|
|
Goodwill – Platforms and Applications |
$ |
36,121 |
|
|
$ |
27,912 |
|
|
$ |
8,209 |
|
|
Property and equipment, including capitalized software for internal use |
|
18,082 |
|
|
|
5,517 |
|
|
|
12,565 |
|
|
Software development costs |
|
9,270 |
|
|
|
— |
|
|
|
9,270 |
|
|
Acquired intangible assets |
|
599 |
|
|
|
— |
|
|
|
599 |
|
|
Other assets |
|
1,334 |
|
|
|
— |
|
|
|
1,334 |
|
|
$ |
65,406 |
|
|
$ |
33,429 |
|
|
$ |
31,977 |
|
In 2012, TCS’s Navigation reporting unit’s goodwill and long-lived assets with a carrying value of $164,500 were written down to estimated fair value of $38,797, resulting in an impairment charge of $125,703 to Goodwill, Acquired intangibles, and Long-lived (fixed) assets. We used a discounted cash flow model to determine the fair value of goodwill and an income approach to determine the fair values of acquired intangibles, capitalized software, and long-lived assets.
F-8
Foreign Currency Translation. Financial statements for the Company’s small foreign subsidiaries with functional currencies other than U.S. dollars are translated using the exchange rates at the balance sheet date for assets and liabilities, and a weighted average rate is used to remeasure revenues and expenses. The resulting adjustments are reported in other comprehensive income. Income and expense items are translated at average monthly rates of exchange. Foreign currency transaction gains and losses are recorded in other income (expense) in the Consolidated Statements of Operations.
Principles of Consolidation. The accompanying financial statements include the accounts of our wholly owned subsidiaries. All intercompany balances and transactions have been eliminated in consolidation.
Cash and Cash Equivalents. Cash and cash equivalents include cash and highly liquid investments with a maturity of three months or less when purchased. Cash equivalents are reported at fair value, which approximates cost.
Marketable Securities. Our marketable securities are classified as available-for-sale. Our primary objectives when investing are to preserve principal, maintain liquidity, and obtain higher yield. Our intent is not specifically to invest and hold securities with longer term maturities. We have the ability and intent, if necessary, to liquidate any of these investments in order to meet our operating needs within the next twelve months. The securities are carried at fair market value based on quoted market price with net unrealized gains and losses in stockholders’ equity as a component of accumulated other comprehensive income. If we determine that a decline in fair value of the marketable securities is other than temporary, a realized loss would be recognized in earnings. Gains or losses on securities sold are based on the specific identification method and are recognized in earnings. We recorded immaterial net gains on the sale and maturity of marketable securities for the years ended December 31, 2014, 2013, and 2012 in Other income (expense), net.
Interest Rate Hedging Activity. To reduce the risk of variability of cash flows associated with changes in interest rates on a portion of our floating rate debt, we entered into an interest rate swap (“hedge” or “swap”) agreement with our principal bank during the third quarter of 2014. The interest rate swap is designated as a cash flow hedge and its effect is recognized on the consolidated balance sheets at fair value. We formally documented the relationship between the interest rate swap and the hedged bank debt, as well as the risk management objective and the strategy for using the hedging instrument. We assess whether the relationship is highly effective at offsetting changes in the fair value both at inception of the hedging relationship and on an ongoing basis. Unrealized gains and losses are recognized as a component of accumulated other comprehensive income (loss) to the extent that the hedge is effective at offsetting the change in the fair value of the hedged item and realized gains and losses are recognized in interest expense.
Allowances for Doubtful Accounts Receivable. Substantially all of our accounts receivable are trade receivables generated in the ordinary course of our business. We use estimates to determine the amount of the allowance for doubtful accounts necessary to reduce accounts receivable to their expected net realizable value. We estimate the amount of the required allowance by reviewing the status of significant past-due receivables and by establishing provisions for estimated losses by analyzing current and historical bad debt trends. Changes to our allowance for doubtful accounts are recorded as a component of general and administrative expenses in our accompanying Consolidated Statements of Operations. Our credit and collection policies and the financial strength of our customers are critical to us in maintaining a relatively small amount of write-offs of receivables. We generally do not require collateral from or enter netting agreements with our customers. Receivables that are ultimately deemed uncollectible are charged-off as a reduction of receivables and the allowance for doubtful accounts.
Inventory. We maintain inventory of component parts and finished product for our deployable communication systems and aerospace components. Inventory is stated at the lower of cost or market value. Cost is based on the weighted average method. The cost basis for finished units includes manufacturing cost. We record any amounts required to reduce the carrying value of inventory to net realizable value as a change to cost of revenue.
Property and Equipment. Property and equipment represents costs associated with our investment in information technology and telecommunications equipment, software, furniture and fixtures, leasehold improvements, as well as capitalized software developed for internal use, including hosted applications. Property and equipment is stated at cost less accumulated depreciation. Depreciation is computed using the straight-line method based on the estimated useful lives of the assets, generally five years for furniture, fixtures, and leasehold improvements and three to seven years for other types of assets including computers, software, and telephone equipment.
The carrying value of property and equipment is reviewed for impairment whenever events or changes in circumstances indicate that the carrying amount of an asset or group of assets may not be fully recoverable. If an impairment indicator is present, we evaluate recoverability by a comparison of the carrying amount of the assets to future undiscounted net cash flows that we expect to generate from these assets. If the assets are impaired, we recognize an impairment charge equal to the amount by which the carrying amount exceeds the fair value of the assets using the appropriate valuation technique of market, income or cost approach. Assets to be disposed of are reported at the lower of carrying values or fair values, less estimated costs of disposal.
F-9
In 2013 and 2012, after adjusting projections for decreased expected revenue from services supported by capitalized software for internal use included in property and equipment, we evaluated the recoverability of our Platforms and Applications and Navigation reporting units’ fixed assets, respectively, by comparing the carrying amount of the assets to future undiscounted net cash flows that we expect to generate from these assets. As a result of our reviews, we recorded impairment charges of $12,565 in 2013 and $12,987 in 2012.
Goodwill. Goodwill represents the excess of cost over the fair value of assets of acquired businesses. Goodwill is not amortized, but instead is evaluated for impairment in the fourth quarter of each year, or sooner should there be an indicator of impairment. We may assess qualitative factors to determine whether it is more likely than not an event or circumstance might indicate the fair value of the reporting unit is less than its carrying value. Such indicators include a sustained, significant decline in the Company’s stock price and market capitalization, a decline in the Company’s expected future cash flows, a significant adverse change in legal factors or in the business climate, unanticipated competition, and/or slower expected growth, among others. After completing our assessment of such qualitative factors, and if it is determined that it is more likely than not that the fair value of a reporting unit is less than its carrying value we perform a two-step process. The first step requires a comparison of the book value of net assets to the fair value of the reporting units that have goodwill assigned to them. If the fair value is determined to be less than the book value, a second step is performed to compute the amount of the impairment. In the second step, a fair value for implied goodwill is estimated, based in part on the fair value of the reporting unit used in the first step, and is compared to its carrying value. The shortfall of the fair value below carrying value, if any, would represent the amount of goodwill impairment.
At December 31, 2014, goodwill was $104,241. Our assessment of goodwill in the current reporting period indicated that the fair value of our reporting units exceeded their carrying value, see Note 9 for additional details.
For goodwill impairment testing, we have four reporting units. In 2013, we reorganized the Commercial Segment in order to better conform and integrate the product lines and create efficiencies, so that one management team is now responsible for all Commercial Platforms & Applications other than the 9-1-1 Safety and Security part of the Commercial Segment. Previously, our Commercial Segment was comprised of Navigation and Other Commercial reporting units. Our two Government Segment reporting units, the Government Solutions Group unit and the Cyber Intelligence unit, remain the same.
In 2013, we recorded an $8,209 impairment charge for the excess of the carrying value of goodwill over the estimated fair value of our Platform and Applications reporting unit. In 2012, we recorded an $86,332 impairment charge for the excess of the carrying value of goodwill over the estimated fair value of our Navigation reporting unit.
Software Development Costs. Acquired technology, representing the estimated value of the proprietary technology acquired, has been recorded as capitalized software development costs. We also capitalize software development costs after we establish technological feasibility, and amortize those costs over the estimated useful lives of the software beginning on the date when the software is available for general release.
Costs are capitalized when technological feasibility has been established. For new products, technological feasibility is established when an operative version of the computer software product is completed in the same software language as the product to be ultimately marketed, performs all the major functions planned for the product, and has successfully completed initial customer testing. Technological feasibility for enhancements to an existing product is established when a detail program design is completed. Costs that are capitalized include direct labor and other direct costs. These costs are amortized on a product-by-product basis using the straight-line method over the product’s estimated useful life, between three and five years. Amortization is also computed using the ratio that current revenue for the product bears to the total of current and anticipated future revenue for that product (the revenue curve method). If this revenue curve method results in amortization greater than the amount computed using the straight-line method, amortization is recorded at that greater amount. Our policies to determine when to capitalize software development costs and how much to amortize in a given period require us to make subjective estimates and judgments. If our software products do not achieve the level of market acceptance that we expect and our future revenue estimates for these products change, the amount of amortization that we record may increase compared to prior periods. The amortization of capitalized software development costs is recorded as a cost of revenue. Amortization of capitalized software developments costs included in direct costs of services and systems were respectively $88 and $1,194 in 2014, $2,527 and $4,939 in 2013, and $2,692 and $4,971 in 2012. The decrease in capitalized software development costs included in services is directly related to the 2013 and 2012 write-down of capitalized software development costs associated with the Platforms and Applications and Navigation reporting unit, respectively.
Acquired technology is amortized over the product’s estimated useful life based on the valuation procedures performed at the time of the acquisition. Amortization is calculated using the straight-line method or the revenue curve method, whichever is greater.
We also capitalize costs related to software developed or obtained for internal use when management commits to funding the project and the project completes the preliminary project stage. Capitalization of such costs ceases when the project is substantially
F-10
complete and ready for its intended use. Capitalized software developed for internal use is reported as part of property and equipment on our Consolidated Balance Sheets.
During 2013, we recognized a software development cost impairment charge of $9,270 after determining that costs related to our Platforms and Applications reporting unit were not recoverable based on decreased expected revenue from services using the software. During 2012, we recognized a software development cost impairment charge of $12,420 after determining that the costs related our Navigation reporting unit were not recoverable based on decreased projected revenue.
Acquired Intangible Assets. Our acquired intangible assets have useful lives of four to ten years, including assets acquired in 2009 and 2012. We are amortizing these assets using the straight-line method. We have not incurred costs to renew or extend the term of acquired intangible assets.
We evaluate acquired intangible assets when events or changes in circumstances indicate that the carrying values of such assets might not be recoverable. Our review of factors present and the resulting appropriate carrying value of our acquired intangible assets are subject to judgments and estimates by management. Future events such as a significant underperformance relative to historical or projected future operating results, significant changes in the manner of our use of the acquired assets, and significant negative industry or economic trends could cause us to conclude that impairment indicators exist and that our acquired intangible assets might be impaired. In 2013, after adjusting projections for uncertainty at a significant customer, we recorded an impairment charge of $599 to acquired intangible assets related to our Platforms and Applications reporting unit. In 2012, after adjusting projections for the impact of a customer contract renegotiation, we recorded an impairment charge of $13,964 to acquired intangible assets related to our Navigation reporting unit.
Deferred Compensation Plan. We have a non-qualified deferred compensation arrangement to fund certain supplemental executive retirement and deferred income plans. Under the terms of the arrangement, the participants may elect to defer the receipt of a portion of their compensation and each participant directs the manner in which their investments are deemed invested. The funds are held by us in a rabbi trust which include fixed income funds, equity securities, and money market accounts, or other investments for which there is an active quoted market, and are classified as trading securities. At December 31, 2014 and 2013, funds of $1,282 and $1,003, respectively, were included in Other assets and the deferred compensation liabilities of $873 in 2014 and $637 in 2013 were included in Other long-term liabilities on the Consolidated Balance Sheets.
Revenue Recognition. We recognize revenue when all of the following criteria are met: (i) persuasive evidence of an arrangement exists, (ii) delivery has occurred, (iii) the fee is fixed or determinable, and (iv) the fee is probable of collection.
Revenue is reported as described below:
Services Revenue. Revenue from hosted and subscriber services consists of monthly recurring service fees and is recognized in the month earned. Maintenance fees are generally collected in advance and recognized ratably over the maintenance period. Services revenue for consulting, training and the design, development, deployment, field support and maintenance of communication systems is generated under time and materials contracts, cost plus fee contracts, or fixed price contracts. Revenue is recognized under time and materials contracts and cost plus fee contracts as billable costs are incurred. Fixed-price service contracts are accounted for using the proportional performance method. These contracts generally allow for monthly billing or billing upon achieving certain specified milestones.
Systems Revenue. We design, develop, and deploy custom communications products, components, and systems. Custom systems typically contain multiple elements, which may include hardware, installation, integration, and product licenses, which are either incidental or provide essential functionality.
We allocate the fees in a multi-element arrangement to each element based on the relative fair value of each element, using vendor-specific objective evidence (“VSOE”) of the fair value of each of the elements, if available. VSOE is generally determined based on the price charged when an element is sold separately. In the absence of VSOE of fair value, the fee is allocated among each element based on third-party evidence (“TPE”) of fair value, which is determined based on competitor pricing for similar deliverables when sold separately. When we are unable to establish fair value using VSOE or TPE, we use estimated selling price (“ESP”) to allocate value to each element. The objective of ESP is to determine the price at which we would transact a sale if the product or service were sold separately. We determine ESP for deliverables by considering multiple factors including, but not limited to, prices we charge for similar offerings, market conditions, competitive landscape, and pricing practices.
Fees from the development and implementation of custom systems are generally performed under time and materials and fixed fee contracts. Revenue is recognized under time and materials contracts and cost plus fee contracts as billable costs are incurred. Fixed-price product delivery contracts are accounted for using the percentage-of-completion or proportional performance method,
F-11
measured either by total costs incurred as a percentage of total estimated costs at the completion of the contract, or direct labor costs incurred compared to estimated total direct labor costs for projects for which third-party hardware represents a significant portion of the total estimated costs. These contracts generally allow for monthly billing or billing upon achieving certain specified milestones. Any estimated losses under long-term contracts are recognized in their entirety at the date that it becomes probable of occurring. Revenue from hardware sales to monthly subscriber customers is recognized as systems revenue. We have contracts and purchase orders where revenue is recognized at the time products or services are delivered, or when the product is shipped and the risk of the loss is transferred to the buyer, net of discounts.
Software licenses are generally perpetual licenses for a specified number of users that allow for the purchase of annual maintenance at a specified rate. All fees are recognized as revenue when the four criteria described above are met. For multiple element arrangements that contain only software and software-related elements, we allocate the fees to each element based on the VSOE of fair value of each element. Some systems containing software licenses include a 90-day warranty for defects. We have not incurred significant warranty costs on any software product to date, and no costs are currently accrued upon recording the related revenue.
Revenue generated from our intellectual property consists of patent infringement liabilities, upfront and non-refundable license fees, royalty fees, and sales of our patents. Revenue from upfront and non-refundable payments is recognized when the arrangement is executed. When patent licensing arrangements include royalties for future sales of products using our licensed patented technology, revenue is recognized when earned during the applicable period. Due to the nature of some of the agreements it may be difficult to establish VSOE of separate elements of an agreement, in these circumstances the appropriate recognition of revenue may require the use of judgment based on the particular facts and circumstances. In all cases, revenue from the licensing of our intellectual property is recognized when all of four of the revenue recognition criteria are met, and included in Commercial systems revenue.
When a customer is billed or we receive payment and we have not met all of the criteria for revenue recognition, the billed or paid amount is recorded as deferred revenue on our consolidated balance sheet. As the revenue recognition criteria are met, the deferred amounts are recognized as revenue. We defer direct project costs incurred in certain situations as dictated by authoritative accounting literature. We classify deferred revenue and deferred project costs on the consolidated balance sheet as either current or long-term depending on the expected product delivery dates or service coverage periods. Long-term deferred revenue is included in other liabilities and long-term deferred project costs are included in other assets on our Consolidated Balance Sheets.
Under our contracts with the U.S. Government for both systems and services, contract costs, including the allocated indirect expenses, are subject to audit and adjustment by the Defense Contract Audit Agency. We record revenue under these contracts at estimated net realizable amounts.
Advertising Costs. Advertising costs are expensed as incurred. Advertising expense totaled $174, $104, and $69, for the years ended December 31, 2014, 2013, and 2012, respectively.
Capitalized Interest. Total interest incurred, including amortization of deferred financing fees, was $9,296, $11,780, and $8,278 for the years ended December 31, 2014, 2013, and 2012, respectively. Approximately $27, $115, and $138 of total interest incurred was capitalized as a component of software development costs during the year ended December 31, 2014, 2013, and 2012 respectively.
Stock-Based Compensation. We have two stock-based employee compensation plans, which are described more fully in Note 18. Both the incentive stock option plan and the employee stock purchase plan are considered equity plans. The fair values of stock option grants are estimated on the date of grant using a Black-Scholes option-pricing model and expensed on a straight-line basis over the requisite service period of the options, which is generally three to five years. The employee stock purchase plan gives all employees an opportunity to purchase shares of our Class A common stock at a discount of 15% of the fair market value.
Research and Development Expense. We incur research and development costs which are primarily comprised of compensation expenses for engineers engaged in the development and enhancement of software and integrated system products. Research and development cost is expensed as incurred or accounted for as set forth in “Software Development Costs” above.
Income Taxes. We account for income taxes in accordance with ASC 740, Accounting for Income Taxes. Deferred tax assets and liabilities are computed based on the difference between the financial statement and income tax basis of assets and liabilities using enacted tax rates. Our deferred tax assets consist primarily of net operating loss and tax credit carryforwards as well as deductible temporary differences. Prior to 2008 and since December 31, 2013, we have provided a full valuation allowance for deferred tax assets based on the evaluation that our ability to realize such assets did not meet the criteria of “more likely than not”. We continuously evaluate additional facts representing positive and negative evidence in determining our ability to realize the deferred tax assets.
F-12
We record the estimated value of uncertain tax positions by reducing the value of certain tax attributes. We would classify any interest and penalties accrued on any unrecognized tax benefits as a component of the provision for income taxes. There were no interest or penalties recognized in the Consolidated Statements of Operations for 2014 and the Consolidated Balance Sheets at December 31, 2014. We do not currently anticipate that the total amounts of unrecognized tax benefits will significantly increase within the next 12 months. We file income tax returns in U.S. and various state and foreign jurisdictions. As of December 31, 2014, open tax years in the federal and some state jurisdictions date back to 1998, due to the taxing authorities’ ability to adjust operating loss carryforwards.
The accounting standards require that deferred tax assets be reduced by a valuation allowance if, based on the weight of available evidence, it is more likely than not that some portion of the deferred tax assets will not be realized. This process requires management to make assessments regarding the timing and probability of the ultimate tax impact and to record valuation allowances on deferred tax assets if determined it is more likely than not that the asset will not be realized. Management also establishes reserves for uncertain tax positions based upon management’s judgment regarding potential future challenges to those positions. Actual income taxes could vary from these estimates due to future changes in income tax law, significant changes in the jurisdictions in which the Company operates, our inability to generate sufficient future taxable income or unpredicted results from the final determination of each year’s liability by taxing authorities. These changes could have a significant impact on the Company’s financial position.
Other Comprehensive Income. Other comprehensive income (loss) refers to revenue, expenses, gains and losses that under GAAP are included as a component of shareholders’ equity but are excluded from net income. Other comprehensive income consists of foreign currency translation adjustments, unrealized gains or losses on interest rate hedge and unrealized gains and losses on marketable securities classified as available-for-sale.
Fair Value Measurements. We apply valuation techniques, such as the market approach (comparable market prices), the income approach (present value of future income or cash flows), and the cost approach (cost to replace the service capacity of an asset or replacement cost) and uses a fair value hierarchy that prioritizes the inputs to valuation techniques used to measure fair value into three broad levels. The following is a brief description of those three levels:
Level 1: Observable inputs such as quoted prices (unadjusted) in active markets for identical assets or liabilities.
Level 2: Inputs other than quoted prices that are observable for the asset or liability, either directly or indirectly. These include quoted prices for similar assets or liabilities in active markets and quoted prices for identical or similar assets or liabilities in markets that are not active.
Level 3: Observable inputs that reflect the reporting entity’s own assumptions.
Our major categories of financial assets and liabilities subject to fair value measurements, including cash and cash equivalents and marketable securities that are held as available-for-sale, are measured on a recurring basis. Certain assets and liabilities, including long-lived assets, intangible assets and goodwill, are measured at fair value on a non-recurring basis. Additional disclosures regarding our fair value measurements are included in Note 15.
Recent Accounting Pronouncements. In January 2015, the Financial Accounting Standards Board ("FASB") issued new guidance for presentation of financial statements for simplifying income statement presentation by eliminating the concept of extraordinary items. Under the new guidance, items that are both unusual in nature and infrequently occurring should be presented within income from continuing operations or disclosed in the notes to the financial statements. The guidance is effective for annual periods beginning after December 15, 2015 including interim periods within those annual periods. The amended guidance is not expected to have a material impact on our consolidated financial statements.
In August 2014, the FASB issued new guidance for presentation of financial statements for going-concern, which addresses when and how to disclose going-concern uncertainties in the financial statements. The new standard requires management to perform interim and annual assessments of an entity’s ability to continue as a going concern within one year after the date the financial statements are issued. An entity must provide certain disclosures if conditions or events raise substantial doubt about the entity’s ability to continue as a going concern. The new guidance applies to all entities and is effective for annual periods ending after December 15, 2016, and interim periods thereafter, with early adoption permitted. The amended guidance is not expected to have a material impact on our consolidated financial statements.
In May 2014, the FASB issued new guidance for revenue recognition. The new guidance provides a five-step revenue recognition model which replaces the prior revenue recognition guidance in its entirety. The core principle of the new standard is that an entity will recognize revenue to depict the transfer of promised goods or services to customers in an amount that reflects what it expects in exchange for the goods or services. The standard also requires more detailed disclosures to enable users of the financial statements to understand the nature, amount, timing, and uncertainty of revenue and cash flows arising from contracts with customers.
F-13
The guidance provides alternative methods of initial adoption; retrospectively applied to each prior reporting period or a modified retrospective approach, in which the cumulative effect of initially applying this new guidance is recognized at the date of initial application with additional disclosures. The guidance is effective for annual periods beginning after December 15, 2016 including interim periods within those annual periods. Early adoption is not permitted. We are currently evaluating the alternative transition methods and the impact that this standard will have on our consolidated financial statements.
In April 2014, the FASB amended guidance related to reporting discontinued operations and disposals of components of an entity. The amended guidance requires that a disposal representing a strategic shift that has (or will have) a major effect on an entity’s financial results or a business activity should be reported as discontinued operations. The amendment also expands the disclosure requirements for discontinued operations and adds new disclosures for individually significant dispositions that do not qualify as discontinued operations. The guidance is for periods beginning after December 15, 2014, with early adoption permitted only for disposals that have not been previously reported. The amended guidance is not expected to have a material impact on our consolidated financial statements.
On January 1, 2014, the FASB adopted amended guidance related to income taxes and the presentation of an unrecognized tax benefit when a net operating loss carryforward, a similar loss, or a tax credit carryforward exists. Under certain circumstances, unrecognized tax benefits should be presented in the financial statements as a reduction to a deferred tax asset for a net operating loss carryforward, a similar tax loss, or a tax credit carryforward. The amendment did not have a material effect on our consolidated financial statements.
2. Acquisitions
On July 6, 2012, we acquired all of the outstanding shares of privately-held microDATA, GIS, Inc. (“microDATA”), in accordance with a Purchase and Sale Agreement. The microDATA acquisition was accounted for using the acquisition method; accordingly, the total purchase price was $35,544 comprised of $20,786 in cash, net of cash acquired, and $14,250 in promissory notes, and performance-based earn-out opportunities. microDATA’s operating results are reflected in the consolidated financial statements and are included in the Commercial Segment. The acquisition cash was funded by incremental bank debt; see Note 12. The valuation has resulted in $22,032 of goodwill, which will be deductible for tax purposes over 15 years.
There were no material business acquisitions completed in 2014 or 2013.
3. Loss Per Share
Basic loss per share is based upon the average number of shares of common stock outstanding during the period. Potentially dilutive securities are stock options and restricted stock, discussed in Notes 1 and 18, which are handled in per-share calculations using the treasury-stock method, and convertible notes as discussed in Note 12, which are handled using the “if converted” method.
In 2014, we repurchased the remaining $14,562 of outstanding 4.5% Convertible Senior Notes (“2014 Notes”), after which we had $50,000 of 7.75% Convertible Senior Notes still outstanding. For 2014, 2013, and 2012, shares issuable upon conversion of convertible debt at $10.348 per share were excluded from the computation of diluted net income per share because their inclusion would have been anti-dilutive.
Concurrent with the issuance of the 4.5% Convertible Notes, we entered into convertible note hedge and warrant transactions. Because a call option would have been exercised by the company if the warrant exercise price of $12.74 per share had become lower than the market price of our stock, the effect of the convertible note hedge, which expired pro rata as the 2014 Notes were repurchased, was excluded from the calculation of diluted earnings per share for the years ended December 31, 2013 and 2012, as the impact was always considered anti-dilutive. The warrants expire in 2015 and are considered to have no value.
Our two classes of common stock (Class A and B) share equally in dividends declared or accumulated and have equal participation rights in undistributed earnings. Additionally our unvested restricted stock does not contain non-forfeitable rights to dividends and dividend equivalents. As such, unvested shares of restricted stock are not participating securities and our basic and diluted earnings per share are not impacted by the two class method of computing earnings per share.
F-14
4. Supplemental Disclosure of Cash Flow Information
The following table presents supplemental disclosure of cash flow information for the years ended December 31:
|
|
2014 |
|
|
2013 |
|
|
2012 |
|
|||
|
|
|
|
|
|
|
|
|
|
|
|
|
|
Property and equipment acquired under capital lease |
$ |
2,750 |
|
|
$ |
6,022 |
|
|
$ |
4,930 |
|
|
|
|
|
|
|
|
|
|
|
|
|
|
|
Interest paid |
$ |
8,743 |
|
|
$ |
8,105 |
|
|
$ |
6,366 |
|
|
|
|
|
|
|
|
|
|
|
|
|
|
|
Income taxes paid (refunded) |
$ |
583 |
|
|
$ |
(497 |
) |
|
$ |
1,248 |
|
5. Marketable Securities
Available-for-sale marketable securities at December 31, 2014 were:
|
|
Amortized |
|
|
Gross |
|
|
Gross |
|
|
Estimated |
|
||||
|
|
Cost |
|
|
Unrealized |
|
|
Unrealized |
|
|
Fair |
|
||||
|
|
Basis |
|
|
Gains |
|
|
Losses |
|
|
Value |
|
||||
|
Corporate bonds |
$ |
21,748 |
|
|
$ |
6 |
|
|
$ |
(50 |
) |
|
$ |
21,704 |
|
|
Mortgage-backed and asset-backed securities |
|
1,226 |
|
|
|
— |
|
|
|
(3 |
) |
|
|
1,223 |
|
|
Agency bonds |
|
300 |
|
|
|
— |
|
|
|
(1 |
) |
|
|
299 |
|
|
Total marketable securities |
$ |
23,274 |
|
|
$ |
6 |
|
|
$ |
(54 |
) |
|
$ |
23,226 |
|
The estimated fair values of available-for-sale marketable securities by contractual maturity at December 31, 2014 were:
|
|
Fair Value |
|
|
|
Due within 1 year or less |
$ |
7,483 |
|
|
Due after 1 through 5 years |
|
14,520 |
|
|
Mortgage-backed securities not due in a single maturity date |
|
1,223 |
|
|
|
$ |
23,226 |
|
Available-for-sale marketable securities at December 31, 2013 were:
|
|
Amortized |
|
|
Gross |
|
|
Gross |
|
|
Estimated |
|
||||
|
|
Cost |
|
|
Unrealized |
|
|
Unrealized |
|
|
Fair |
|
||||
|
|
Basis |
|
|
Gains |
|
|
Losses |
|
|
Value |
|
||||
|
Corporate bonds |
$ |
18,798 |
|
|
$ |
41 |
|
|
$ |
(6 |
) |
|
$ |
18,833 |
|
|
Mortgage-backed and asset-backed securities |
|
1,170 |
|
|
|
1 |
|
|
|
— |
|
|
|
1,171 |
|
|
Total marketable securities |
$ |
19,968 |
|
|
$ |
42 |
|
|
$ |
(6 |
) |
|
$ |
20,004 |
|
The estimated fair values of available-for-sale marketable securities by contractual maturity at December 31, 2013 were:
|
|
Fair Value |
|
|
|
Due within 1 year or less |
$ |
6,248 |
|
|
Due after 1 through 5 years |
|
13,449 |
|
|
Mortgage-backed securities not due in a single maturity date |
|
307 |
|
|
|
$ |
20,004 |
|
6. Unbilled Receivables
Unbilled receivables consist of the excess of revenue earned in accordance with generally accepted accounting principles over the amounts billed at contract milestones. Substantially all unbilled receivables are expected to be billed and collected within twelve months.
F-15
7. Inventory
Inventory consisted of the following at December 31:
|
|
2014 |
|
|
2013 |
|
||
|
Component parts |
$ |
4,848 |
|
|
$ |
7,710 |
|
|
Finished goods |
|
1,405 |
|
|
|
2,180 |
|
|
Total inventory |
$ |
6,253 |
|
|
$ |
9,890 |
|
8. Property and Equipment
Property and equipment consisted of the following at December 31:
|
|
2014 |
|
|
2013 |
|
||
|
Computer equipment |
$ |
63,378 |
|
|
$ |
59,499 |
|
|
Computer software |
|
40,870 |
|
|
|
38,097 |
|
|
Furniture and fixtures |
|
3,421 |
|
|
|
3,648 |
|
|
Leasehold improvements |
|
8,312 |
|
|
|
9,097 |
|
|
Land |
|
1,000 |
|
|
|
1,000 |
|
|
Vehicles |
|
82 |
|
|
|
82 |
|
|
Total property and equipment at cost |
|
117,063 |
|
|
|
111,423 |
|
|
Less: accumulated depreciation and amortization |
|
(83,645 |
) |
|
|
(73,068 |
) |
|
Net property and equipment |
$ |
33,418 |
|
|
$ |
38,355 |
|
9. Acquired Intangible Assets, Capitalized Software Development Costs, and Goodwill
Our acquired intangible assets and capitalized software development cost balances consisted of the following:
|
|
December 31, 2014 |
|
|
December 31, 2013 |
|
||||||||||||||||||
|
|
Gross |
|
|
|
|
|
|
|
|
|
|
Gross |
|
|
|
|
|
|
|
|
|
||
|
|
Carrying |
|
|
Accumulated |
|
|
|
|
|
|
Carrying |
|
|
Accumulated |
|
|
|
|
|
||||
|
|
Amount |
|
|
Amortization |
|
|
Net |
|
|
Amount |
|
|
Amortization |
|
|
Net |
|
||||||
|
Acquired intangible assets and capitalized software development costs: |
|
|
|
|
|
|
|
|
|
|
|
|
|
|
|
|
|
|
|
|
|
|
|
|
Acquired intangible assets, including customer lists |
$ |
31,176 |
|
|
$ |
13,970 |
|
|
$ |
17,206 |
|
|
$ |
31,176 |
|
|
$ |
10,173 |
|
|
$ |
21,003 |
|
|
Capitalized software development costs |
|
7,680 |
|
|
|
3,072 |
|
|
|
4,608 |
|
|
|
5,969 |
|
|
|
1,791 |
|
|
|
4,178 |
|
|
Total acquired intangible assets and capitalized software development costs |
$ |
38,856 |
|
|
$ |
17,042 |
|
|
$ |
21,814 |
|
|
$ |
37,145 |
|
|
$ |
11,964 |
|
|
$ |
25,181 |
|
Estimated future amortization expense:
|
Year ending December 31, 2015 |
$ |
5,203 |
|
|
Year ending December 31, 2016 |
|
5,007 |
|
|
Year ending December 31, 2017 |
|
4,110 |
|
|
Year ending December 31, 2018 |
|
2,955 |
|
|
Year ending December 31, 2019 |
|
2,280 |
|
|
Thereafter |
|
2,259 |
|
|
Total estimated future amortization expense |
$ |
21,814 |
|
Acquired intangibles
In 2013 we recorded a $599 Platforms and Applications reporting unit impairment charge for the excess of the carrying value of acquired intangible assets over the estimated fair value. The weighted average remaining amortization period for acquired intangible assets, including customer lists and other as well as acquired technology included in software development costs is 3.9 years.
F-16
Capitalized software development costs
In 2014, 2013, and 2012 we capitalized $1,712, $1,987, and $1,890, respectively, of software development costs for software projects after the point of technological feasibility had been reached but before the products were available for general release. We routinely update our estimates of the recoverability of the software products that have been capitalized as the basis for evaluating the carrying values and remaining useful lives of the respective assets. In 2013, we recorded an impairment charge of $9,270 related to our Platforms and Applications reporting unit. In 2012, we recorded an impairment charge related to our Navigation reporting unit of $12,420.
Goodwill
The balances and changes in amount of goodwill are as follows:
|
|
Commercial |
|
|
Government |
|
|
|
|
|
||
|
|
Segment |
|
|
Segment |
|
|
Total |
|
|||
|
Balance as of December 31, 2012 |
$ |
58,154 |
|
|
$ |
54,296 |
|
|
$ |
112,450 |
|
|
2013 Impairment charge related to the adjusted fair value of the Platforms and Applications reporting unit |
|
(8,209 |
) |
|
|
— |
|
|
|
(8,209 |
) |
|
Balance as of December 31, 2013 and 2014 |
$ |
49,945 |
|
|
$ |
54,296 |
|
|
$ |
104,241 |
|
We assess goodwill for impairment in the fourth quarter of each year, or sooner should there be an indicator of impairment. We periodically analyze whether any such indicators of impairment exist. Such indicators include a sustained, significant decline in the Company’s stock price and market capitalization, a decline in the Company’s expected future cash flows, a significant adverse change in legal factors or in the business climate, unanticipated competition, and/or slower expected growth, among others. For goodwill impairment testing, we have four reporting units. In 2013, we reorganized the Commercial Segment so that one management team is now responsible for all Commercial Platforms & Applications other than the 9-1-1 Safety and Security part of the Commercial Segment. Previously, our Commercial Segment was comprised of Navigation and Other Commercial reporting units. Our two Government Segment reporting units, the Government Solutions Group unit and the Cyber Intelligence unit, remain the same.
Goodwill balances by reporting unit at December 31:
|
|
2014 |
|
|
2013 |
|
||
|
|
|
|
|
|
|
|
|
|
Platforms and Applications |
$ |
27,912 |
|
|
$ |
27,912 |
|
|
Safety and Security Group |
|
22,033 |
|
|
|
22,033 |
|
|
Government Solutions Group |
|
26,141 |
|
|
|
26,141 |
|
|
Cyber Intelligence |
|
28,155 |
|
|
|
28,155 |
|
|
Total goodwill |
$ |
104,241 |
|
|
$ |
104,241 |
|
In performing our 2014 testing for all of our reporting units, we used a discounted cash flow method as well as a market approach based on observable public comparable company multiples of revenue and earnings before interest, taxes, depreciation, amortization, and amortization of non-cash stock-based compensation (“Adjusted EBITDA”) and weighted the results from the two methods to estimate the reporting units’ fair values.
Our discounted cash flow models are based on our most recent long-range forecast and, for years beyond the forecast, we estimated terminal values based on perpetual cash flow growth rates ranging from 2.5% to 4.0%. The models reflect management’s expectation of future market conditions and expected levels of financial performance for our reporting units, as well as discount rates and estimated terminal values that would be used by market participants in an arms-length transaction. Business operational risks which could impact profits are detailed in our “Risk Factors” disclosures. Discount rates used were intended to reflect the risks inherent in the future cash flows of the respective reporting units and were between 13% and 15%.
For the market comparable approaches, we evaluated comparable company public trading values, and valued our reporting units using multiples of Adjusted EBITDA ranging from approximately 5 to 13 times and multiples of revenue ranging from 0.4 to 1.5 times. Comparable company public trading values are based on the market’s view of future industry conditions and the comparable companies’ future financial results. Adverse changes in any of these variables would negatively influence the valuation of our reporting units. It is not possible to determine the impact of such potential adverse changes on the valuation of our reporting units.
Determining fair value requires the exercise of significant judgment, including judgment about appropriate discount rates, the amount and timing of expected future cash flows, as well as relevant comparable company multiples for the market comparable
F-17
approach and the relevant weighting of the methods utilized. For fiscal 2014, all of our reporting units passed the first step of the goodwill impairment testing, indicating no impairment.
Our fourth quarter 2013 impairment testing resulted in the write-down of our Platforms and Applications reporting unit’s goodwill from a carrying value of $36,121 to the estimated fair value of $27,912 at December 31, 2013, resulting in an impairment charge of $8,209. We used a discounted cash flow method to determine the fair value of the goodwill of the Platforms and Applications Reporting Unit. In performing our 2013 testing for our Safety and Security and Cyber Intelligence reporting units, we used a discounted cash flow method as well as a market approach based on observable public comparable company multiples of Adjusted EBITDA and weighted the results from the two methods to estimate the reporting units’ fair values. For our Government Solutions Group we used only a discounted cash flow method.
In the second quarter of 2012, due to a triggering event we recorded a goodwill impairment charge was of $86,332 for the excess of the carrying value of goodwill over the estimated fair value. There was no indication of any further impairment in any of our reporting units during the 2012 annual testing.
10. Accounts Payable and Accrued Expenses
Accounts payable and accrued expenses at December 31 were:
|
|
2014 |
|
|
2013 |
|
||
|
Accounts payable |
$ |
22,790 |
|
|
$ |
10,341 |
|
|
Accrued expenses |
|
18,809 |
|
|
|
14,031 |
|
|
Total accounts payable and accrued expenses |
$ |
41,599 |
|
|
$ |
24,372 |
|
Accrued expenses consist primarily of costs incurred for which we have not yet been invoiced, accrued sales taxes, accrued property taxes, and amounts due to our E9-1-1 customers that we have billed and collected from regulating agencies on their behalf under cost recovery arrangements.
11. Line of Credit
We have maintained a line of credit arrangement with our principal bank since 2003. On June 25, 2013, we closed on a new senior secured credit facility, as amended on June 9, 2014 (the “Senior Credit Facility” or “Credit Agreement”), with the Silicon Valley Bank and a syndicate of lenders. The Credit Agreement includes a revolving loan facility (“Revolving Loan Facility”) up to $30,000 through March 31, 2018, unless extended by as provided in the Credit Agreement. The principal amount outstanding under the Revolving Loan Facility is payable prior to or on the maturity date. Interest on the Revolving Loan Facility is payable monthly and accrues at Eurodollar/LIBOR (beginning at L+3.75%) or Alternate Base Rate (“ABR”) (beginning at ABR +2.75%), which may be adjusted as provided in the Credit Agreement.
The Revolving Loan Facility includes two sub-facilities: (i) a $10,000 letter of credit sub-facility pursuant to which the bank may issue letters of credit, and (ii) a $5,000 swingline sub-facility.
As of December 31, 2014, we had $5,000 of borrowings outstanding under the Line of Credit and had approximately $25,000 of unused borrowing availability under our Line of Credit. As of December 31, 2013, there were no borrowings on our Revolving Loan Facility, and we had $30,000 of unused borrowing availability.
12. Long-Term Debt
Long-term debt consisted of at December 31:
|
|
|
|
|
|
|
|
|
|
|
2014 |
|
|
2013 |
|
||
|
Senior credit facility |
$ |
74,567 |
|
|
$ |
66,084 |
|
|
7.75% Convertible notes due 2018 |
|
50,000 |
|
|
|
50,000 |
|
|
4.5% Convertible notes due 2014 |
|
— |
|
|
|
14,562 |
|
|
Promissory notes payable to microDATA sellers |
|
— |
|
|
|
4,809 |
|
|
Total long-term debt |
|
124,567 |
|
|
|
135,455 |
|
|
|
|
|
|
|
|
|
|
|
Less: current portion |
|
(10,049 |
) |
|
|
(25,089 |
) |
|
Non-current portion of long-term debt |
$ |
114,518 |
|
|
$ |
110,366 |
|
F-18
Aggregate maturities of long-term debt at December 31, 2014 are as follows:
|
2015 |
$ |
10,049 |
|
|
2016 |
|
4,358 |
|
|
2017 |
|
6,295 |
|
|
2018 |
|
103,865 |
|
|
Total long-term debt |
$ |
124,567 |
|
|
|
|
|
|
Senior credit facilities
Our senior credit facilities under a June 25, 2013 agreement, as amended on June 9, 2014 (the “Senior Credit Facilities” or “Credit Agreement”) include (i) a $56,500 term loan A facility (“Term Loan A Facility”), and (ii) a $43,500 delayed draw term loan facility (“Delayed Draw Term Loan Facility”). The Senior Credit Facilities also include a $25,000 incremental loan arrangement subject to the Company’s future needs and bank approval, although no assurances can be given that this incremental loan amount will be available to us when and if needed.
We borrowed $56,500 under the Term Loan A Facility at closing for (i) repayment of the remaining balance under 2012 Term Loan, which was terminated, (ii) approximately $16,000 for on-going working capital and other general corporate purposes, and (iii) fees and expenses associated with the new facility. On September 30, 2013, we borrowed $10,000 under the Delayed Draw Term Loan Facility and used the proceeds towards the retirement of the 4.5% Convertible Senior Notes, discussed below. On July 23, 2014, we borrowed $3,360 under our Delayed Draw Term Loan Facility and the proceeds were used towards the retirement of a portion of our 4.5% Convertible Senior Notes. On November 3, 2014, we used $11,202 of the Delayed Draw Term Loan Facility to retire the remaining 4.5% Convertible Senior Notes. Under the agreement, $18,938 of the remaining Delayed Draw Term Loan Facility may be available to us in the second quarter of 2015 subject to our meeting certain financial covenants. Any amount of the Delayed Draw Term Loan Facility not drawn on April 30, 2015 will expire unused. The Credit Agreement provides that the banks hold at least $35,000 of the Company’s cash and marketable securities until December 31, 2015.
Additional liquidity is available through the $30,000 Revolving Loan Facility, of which $25,000 is undrawn at December 31, 2014, to be used for our on-going working capital and other general corporate purposes. See Line of Credit Note 11.
Loans borrowed under the Term Loan A Facility, the Revolving Loan Facility or the Delayed Draw Term Loan Facility may be borrowed at rates based on the Eurodollar/LIBOR (beginning at L +3.75%) or Alternate Base Rate (ABR) (beginning at ABR + 2.75%), which may be adjusted as provided in the Credit Agreement.
The Term Loan A Facility, the Delayed Draw Term Loan Facility, and the Revolving Loan Facility have a maturity date of March 31, 2018, unless extended as provided in the Credit Agreement. The Term Loan A and Delayed Draw facilities are payable in quarterly installments on the first day of each quarter beginning October 1, 2013. We made $416 of scheduled principal payments on the Term Loan A and Delayed Draw facilities in 2013, and $2,045 in 2014. Beginning with the first quarter of 2015, $968 is payable in the quarter increasing to $1,453 in the fourth quarter of 2016 and to $1,937 in the fourth quarter of 2017, with the remaining principal due at maturity. Additional Delayed Draw Term Loan borrowings would be repaid in consecutive quarterly installment payments in the same proportion as the installment payments for the Term Loan A and existing Delayed Draw Term Loan borrowings, with the remaining principal due at maturity. The Senior Credit Facilities are also subject to mandatory repayments from excess cash flow and other sources, such as net cash proceeds of debt or equity issuances, asset sales, casualty insurance claims and other recovery events, as described in the Credit Agreement. In, 2014, a mandatory repayment of $3,859 was made based on 2013 results. Based on 2014 excess cash flow as defined, the company will make a mandatory repayment of $5,929 in the first quarter of 2015.
The Senior Credit Facilities are secured by substantially all of the Company’s tangible and intangible assets, including intellectual property. The Credit Agreement contains customary representations and warranties of the Company and customary covenants and events of default. Availability under the Revolving Loan Facility and the Delayed Draw Term Loan Facility is subject to certain conditions, including the continued accuracy of the Company’s representations and warranties and compliance with covenants. During the continuance of an event of default, at the request of the required lenders, all outstanding loans shall bear interest at a rate per annum equal to the rate that would otherwise be applicable thereto plus 2%, and shall be payable from time to time on demand.
F-19
Interest Rate Hedging Activities
In August 2014, we entered into an interest rate swap agreement with our principal bank to reduce the variability of interest expense due to fluctuations in market interest rates. Its $32,094 initial notional amount represents about half of the outstanding balances of the floating rate Term Loan A and Delayed Term Loan Facilities. The interest rate swap results in a fixed rate of 5.165% on the notional amount of the swap until its June 25, 2018 maturity. The notional amount of the swap will change over time to reflect approximately 50% of the outstanding expected Senior Credit Facility balances; interest rate re-set and interest rate payment dates mirror those of the underlying Senior Credit Facilities. The swap is expected to offset changes in expected cash flows due to fluctuations in the one month LIBOR rate over the term of the hedge. The interest rate swap fair value as of December 31, 2014 was a $240 liability. For the three months ended December 31, 2014, the hedge was highly effective and no gains or losses were recognized in earnings.
7.75% Convertible notes
On May 8, 2013, we completed privately-negotiated exchange agreements with noteholders under which we retired $50,000 of our outstanding 4.5% Convertible Senior Notes due 2014 issued in 2009 (the “2014 Notes”) in exchange for $50,000 of new 7.75% Convertible Senior Notes due 2018 (the “2018 Notes”).
The 2018 Notes were issued pursuant to an indenture, dated as of May 8, 2013 (the “Indenture”), between the Company and The Bank of New York Mellon Trust Company, N.A., as trustee (the “Trustee”). We offered the 2018 Notes to certain holders of the 2014 Notes in reliance on the exemption from registration provided by Section 4(2) of the Securities Act of 1933, as amended. The 2018 Notes bear interest at 7.75% per year, payable semiannually in arrears in cash on June 30 and December 30 of each year, beginning on December 30, 2013. The 2018 Notes are TCS’s senior unsecured obligations and rank equally with all of its present and future senior unsecured debt and senior to any future subordinated debts and will be effectively subordinate to all of TCS’s present and future secured debt to the extent of the collateral securing that debt.
Holders may convert the 2018 Notes at their option on any day prior to the close of business on the second “scheduled trading day” (as defined in the Indenture) immediately preceding June 30, 2018. The conversion rate will initially be 96.637 shares of Class A common stock per $1 (one thousand) principal amount of 2018 Notes, equivalent to an initial conversion price of $10.348 per share of Class A common stock, which is the same conversion price as the 2014 Notes. Shares of the Company’s Class A common stock into which the 2018 Notes are convertible have been reserved for issuance by the Company. We may redeem some or all of the 2018 Notes at any time on or after June 30, 2014 at the redemption prices set forth in the Indenture plus accrued and unpaid interest to the redemption date. In addition, subject to certain exceptions, holders may require us to repurchase, for cash, all or part of their 2018 Notes upon a “fundamental change” (as defined in the Indenture) at a price equal to the purchase prices set forth in the Indenture, plus accrued and unpaid interest to, but excluding, the fundamental change purchase date. The Indenture contains customary terms and covenants, including that upon certain events of default occurring and continuing, either the Trustee or the holders of not less than 25% in aggregate principal amount of the 2018 Notes then outstanding may declare the entire principal amount of all the 2018 Notes plus accrued interest, if any, to be immediately due and payable.
4.5% Convertible notes
In 2009, we sold $103,500 aggregate principal amount of 4.5% Convertible Senior Notes due 2014, which have now been fully retired.
During the fourth quarter of 2012, we repurchased $10,000 of the outstanding 2014 Notes, plus accrued and unpaid interest and recorded a gain of $431 gain on the retirement. During the second half of 2013, we repurchased an additional $28,938 of the outstanding 2014 Notes and recorded a loss of $178 on the retirement including transaction costs. On May 8, 2013, we retired $50,000 in aggregate principal of these 2014 Notes, in exchange for $50,000 of new 7.75% Convertible Senior Notes due 2018, as discussed above. During 2014, we repurchased the remaining $14,562 balance of the 2014 Notes.
Concurrent with the issuance of the 2014 Notes, we entered into convertible note hedge transactions and warrant transactions, that were expected to reduce the potential dilution associated with the conversion of the 2014 Notes. Holders may have converted the 2014 Notes at their option on any day prior to the close of business on the second “scheduled trading day” (as defined in the Indenture) immediately preceding November 1, 2014. The conversion rate would have initially been 96.637 shares of Class A common stock per $1 (one thousand) principal amount of 2014 Notes, equivalent to an initial conversion price of approximately $10.35 per share of Class A common stock. The effect of the convertible note hedge and warrant transactions is an increase in the effective conversion premium of the 2014 Notes to $12.74 per share. The convertible note hedge and the warrant transactions are separate transactions, each entered into by the Company with the counterparties, which are not part of the terms of the 2014 Notes and will not affect the holders’ rights under the 2014 Notes. The cost of the convertible note hedge transactions to the Company was approximately $23,800, and was accounted for as an equity transaction in accordance with ASC 815-40, Contracts in Entity’s own Equity. The Company received proceeds of approximately $13,000 related to the sale of the warrants, which has also been classified
F-20
as equity as the warrants meet the classification criteria under ASC 815-40-25, in which the warrants and the convertible note hedge transactions require settlements in shares and provide the Company with the choice of a net cash or common shares settlement. As the convertible note hedge and warrants are indexed to our common stock, we recognized them in permanent equity in Additional paid-in capital, and will not recognize subsequent changes in fair value as long as the instruments remain classified as equity. The note hedge transaction expired pro rata as the 2014 Notes were repurchased. The warrants, which expire in 2015, were not affected by the retirements of the 2014 Notes.
Promissory notes payable to microDATA sellers
In July, 2012, we issued $14,250 in 6% promissory notes as part of the consideration for our acquisition of microDATA. The remaining outstanding balance of $4,750 was paid in accordance with the note terms on June 30, 2014.
13. Capital Leases
We lease certain equipment under capital leases. Property and equipment included the following amounts for capital leases at December 31:
|
|
2014 |
|
|
2013 |
|
||
|
Computer equipment |
$ |
16,764 |
|
|
$ |
20,409 |
|
|
Computer software |
|
3,036 |
|
|
|
3,304 |
|
|
Furniture and fixtures |
|
41 |
|
|
|
90 |
|
|
Leasehold improvements |
|
42 |
|
|
|
42 |
|
|
Total property and equipment under capital lease at cost |
|
19,883 |
|
|
|
23,845 |
|
|
Less: accumulated depreciation and amortization |
|
(8,702 |
) |
|
|
(9,886 |
) |
|
Net property and equipment under capital lease |
$ |
11,181 |
|
|
$ |
13,959 |
|
Capital leases are collateralized by the leased assets. Our capital leases generally contain provisions whereby we can purchase the equipment at the end of the lease for a one dollar buyout. Amortization of leased assets is included in depreciation and amortization expense.
Future minimum payments under capital lease obligations consisted of the following at December 31, 2014:
|
2015 |
$ |
4,607 |
|
|
2016 |
|
3,082 |
|
|
2017 |
|
1,969 |
|
|
2018 |
|
552 |
|
|
2019 |
|
14 |
|
|
Total minimum lease payments |
|
10,224 |
|
|
Less: amounts representing interest |
|
(649 |
) |
|
Present value of net minimum lease payments (including current portion of $4,243) |
$ |
9,575 |
|
14. Common Stock
Our Class A common stockholders are entitled to one vote for each share of stock held for all matters submitted to a vote of stockholders. Our Class B stockholders are entitled to three votes for each share owned.
F-21
15. Fair Value Measurements
Our assets and liabilities subject to fair value measurements on a recurring basis and the required disclosures are:
|
|
Fair |
|
|
Fair Value Measurements |
|
||||||||||
|
|
Value |
|
|
Using Fair Value Hierarchy |
|
||||||||||
|
As of December 31, 2014 |
Total |
|
|
Level 1 |
|
|
Level 2 |
|
|
Level 3 |
|
||||
|
Assets: |
|
|
|
|
|
|
|
|
|
|
|
|
|
|
|
|
Cash and cash equivalents |
$ |
26,922 |
|
|
$ |
26,922 |
|
|
$ |
— |
|
|
$ |
— |
|
|
Corporate bonds |
|
21,704 |
|
|
|
21,704 |
|
|
|
— |
|
|
|
— |
|
|
Mortgage-backed and asset-backed securities |
|
1,223 |
|
|
|
1,223 |
|
|
|
— |
|
|
|
— |
|
|
Agency bonds |
|
299 |
|
|
|
299 |
|
|
|
— |
|
|
|
— |
|
|
Marketable securities |
|
23,226 |
|
|
|
23,226 |
|
|
|
— |
|
|
|
— |
|
|
Deferred compensation plan investments |
|
1,282 |
|
|
|
1,282 |
|
|
|
— |
|
|
|
— |
|
|
Assets at fair value |
$ |
51,430 |
|
|
$ |
51,430 |
|
|
$ |
— |
|
|
$ |
— |
|
|
Liabilities: |
|
|
|
|
|
|
|
|
|
|
|
|
|
|
|
|
Interest rate swap |
$ |
240 |
|
|
|
— |
|
|
$ |
240 |
|
|
|
— |
|
|
Deferred compensation |
|
873 |
|
|
|
873 |
|
|
|
— |
|
|
|
— |
|
|
Liabilities at fair value |
$ |
1,113 |
|
|
$ |
873 |
|
|
$ |
240 |
|
|
$ |
— |
|
|
|
Fair |
|
|
Fair Value Measurements |
|
||||||||||
|
|
Value |
|
|
Using Fair Value Hierarchy |
|
||||||||||
|
As of December 31, 2013 |
Total |
|
|
Level 1 |
|
|
Level 2 |
|
|
Level 3 |
|
||||
|
Assets: |
|
|
|
|
|
|
|
|
|
|
|
|
|
|
|
|
Cash and cash equivalents |
$ |
41,904 |
|
|
$ |
41,904 |
|
|
$ |
— |
|
|
$ |
— |
|
|
Corporate bonds |
|
18,833 |
|
|
|
18,833 |
|
|
|
— |
|
|
|
— |
|
|
Mortgage-backed and asset-backed securities |
|
1,171 |
|
|
|
1,171 |
|
|
|
— |
|
|
|
— |
|
|
Marketable securities |
|
20,004 |
|
|
|
20,004 |
|
|
|
— |
|
|
|
— |
|
|
Deferred compensation plan investments |
|
1,003 |
|
|
|
1,003 |
|
|
|
— |
|
|
|
— |
|
|
Assets at fair value |
$ |
62,911 |
|
|
$ |
62,911 |
|
|
$ |
— |
|
|
$ |
— |
|
|
Liabilities: |
|
|
|
|
|
|
|
|
|
|
|
|
|
|
|
|
Deferred compensation |
$ |
637 |
|
|
$ |
637 |
|
|
$ |
— |
|
|
$ |
— |
|
|
Contractual acquisition earn-outs |
|
369 |
|
|
|
— |
|
|
|
— |
|
|
|
369 |
|
|
Liabilities at fair value |
$ |
1,006 |
|
|
$ |
637 |
|
|
$ |
— |
|
|
$ |
369 |
|
The carrying values of financial instruments, including accounts receivable, unbilled receivables, and accounts payable, approximate their fair values due to their short-term maturities.
We hold marketable securities that are investment grade and are classified as available-for-sale. The securities include corporate bonds, agency bonds, mortgage and asset backed securities that are carried at fair market value based on quoted market prices; see Note 5.
We hold trading securities as part of a rabbi trust to fund supplemental executive retirement plans and deferred income plans. The funds held are all managed by a third party and include fixed income funds, equity securities, and money market accounts, or other investments for which there is an active quoted market. The related deferred compensation liabilities are valued based on the underlying investment selections in each participant’s account.
The interest rate swap was valued based on forward curves observable in the market, using Level 2 inputs; see Note 12. The effectiveness of the interest rate swap is computed by comparing the present value of the cumulative change in the expected future cash flows of the variable leg of the swap and the present value of the cumulative change in the expected future variable interest payments designated in the hedging relationship.
The contractual acquisition earn-outs were part of the consideration paid for the 2012 microDATA acquisition. The fair value of the earn-outs was based on probability-weighted payouts under different scenarios, discounted using a discount rate commensurate with the risk.
F-22
The following table summarizes the changes in the contractual acquisition earn-outs measured at fair value on a recurring basis using significant unobservable inputs (Level 3) during 2014:
|
|
Fair Value Measurements Using Significant Unobservable Inputs (Level 3) |
|
|
|
Balance at December 31, 2012 |
$ |
508 |
|
|
Fair value adjustment recognized in earnings |
|
(139 |
) |
|
Balance at December 31, 2013 |
|
369 |
|
|
Fair value adjustment recognized in earnings |
|
(101 |
) |
|
Settlements |
|
(268 |
) |
|
Balance at December 31, 2014 |
$ |
— |
|
Assets and liabilities that are measured at fair value on a non-recurring basis include long-lived assets, intangible assets, and goodwill. These items are recognized at fair value when they are considered to be other than temporarily impaired using significant unobservable inputs (Level 3). In 2013, Our Platforms and Applications reporting unit’s goodwill and long-lived assets with a carrying value of $65,406 were written down to their estimated fair value of $33,429, resulting in an impairment charge of $31,977.
Long-term debt, excluding leases, consists of borrowings under a commercial bank term loan agreement, 7.75% convertible senior notes, and promissory notes; see Note 12. The long-term debt, excluding leases, is currently reported at the borrowed amount outstanding. At December 31, 2014, the estimated fair value of the long-term debt, excluding leases, was approximately $123,000 versus a carrying value of $124,567. At December 31, 2013, the fair value of long-term debt, including 4.5% convertible senior notes and excluding leases, was approximately $133,000 versus a carrying value of $135,455. The estimated fair value is based on a market approach using quoted market prices or current market rates for similar debt with approximately the same remaining maturities, where possible.
There were no transfers in or out of Level 1, 2, or 3 (as defined in Note 1) during the year ended December 31, 2014.
16. Income Taxes
Our income tax provisions (benefits) for the years ended December 31 were:
|
|
2014 |
|
|
2013 |
|
|
2012 |
|
|||
|
Current: |
|
|
|
|
|
|
|
|
|
|
|
|
Federal |
$ |
(2 |
) |
|
$ |
32 |
|
|
$ |
(82 |
) |
|
Foreign |
|
154 |
|
|
|
300 |
|
|
|
— |
|
|
State |
|
51 |
|
|
|
228 |
|
|
|
47 |
|
|
Total current |
|
203 |
|
|
|
560 |
|
|
|
(35 |
) |
|
|
|
|
|
|
|
|
|
|
|
|
|
|
Deferred: |
|
|
|
|
|
|
|
|
|
|
|
|
Federal |
|
4,043 |
|
|
|
12,953 |
|
|
|
(14,107 |
) |
|
Foreign |
|
— |
|
|
|
(87 |
) |
|
|
— |
|
|
State |
|
(717 |
) |
|
|
3,165 |
|
|
|
(1,349 |
) |
|
Total deferred |
|
3,326 |
|
|
|
16,031 |
|
|
|
(15,456 |
) |
|
Total provision (benefit) for income taxes |
$ |
3,529 |
|
|
$ |
16,591 |
|
|
$ |
(15,491 |
) |
F-23
Deferred tax assets and liabilities at December 31 were:
|
|
2014 |
|
|
2013 |
|
||
|
Deferred tax assets: |
|
|
|
|
|
|
|
|
Net operating loss carryforwards |
$ |
4,874 |
|
|
$ |
6,416 |
|
|
Research and development tax credit carryforwards |
|
9,329 |
|
|
|
8,790 |
|
|
Stock-based compensation expense |
|
6,263 |
|
|
|
6,153 |
|
|
Deferred revenue |
|
8,551 |
|
|
|
7,040 |
|
|
Reserves and accrued expenses |
|
2,113 |
|
|
|
1,745 |
|
|
Alternative minimum tax credit |
|
2,250 |
|
|
|
2,091 |
|
|
Goodwill and intangibles |
|
3,905 |
|
|
|
110 |
|
|
Deferred compensation |
|
157 |
|
|
|
372 |
|
|
Deferred financing fees |
|
433 |
|
|
|
482 |
|
|
Other |
|
1,346 |
|
|
|
1,197 |
|
|
Total deferred tax assets |
|
39,221 |
|
|
|
34,396 |
|
|
|
|
|
|
|
|
|
|
|
Deferred tax liabilities: |
|
|
|
|
|
|
|
|
Capitalized software development costs |
|
(3,999 |
) |
|
|
(2,103 |
) |
|
Cash to accrual adjustment |
|
(132 |
) |
|
|
— |
|
|
Depreciation and amortization |
|
(3,751 |
) |
|
|
(2,009 |
) |
|
Total deferred tax liabilities |
|
(7,882 |
) |
|
|
(4,112 |
) |
|
Net deferred tax asset before valuation allowance |
|
31,339 |
|
|
|
30,284 |
|
|
Valuation allowance for deferred tax assets |
|
(34,895 |
) |
|
|
(30,284 |
) |
|
Net deferred tax liability |
$ |
(3,556 |
) |
|
$ |
— |
|
|
|
|
|
|
|
|
|
|
We account for income taxes using the asset and liability approach. Deferred tax assets and liabilities are determined based upon differences between financial reporting and tax basis of assets and liabilities and are measured using the enacted tax rates and laws that will be in effect when the differences are expected to reverse. Net deferred tax assets are recorded when it is more likely than not that the tax benefits will be realized. In accordance with ASC 740, in 2013 we determined that recent losses were significant evidence of the need for a $30,284 valuation allowance on our deferred tax assets and that near-term full realization of these assets was not more likely than not. In 2014, we determined that a $34,895 valuation allowance was needed. For 2014, a valuation allowance is needed against all deferred tax assets except those state deferred tax assets of affiliates that file separate state tax returns. There is a net deferred tax liability because of tax deductible goodwill from asset acquisitions which cannot be assumed to reverse and offset deductible temporary differences and thus cannot be considered a source of future taxable income for valuation allowance purposes. However, as noted below, our deferred tax assets have expiry dates many years into the future, and we expect to be able to use these assets to offset prospective tax liabilities.
At December 31, 2014, we had $8,271 of U.S. federal net operating loss carryforwards reflected in deferred tax assets plus $4,282 of net operating loss carryforwards from excess tax benefits related to stock-based compensation which will be recognized as an increase to additional paid in capital, when the benefit is realized through a reduction of income taxes payable. Of the total $12,553 loss carryforwards, $3,228 is the remaining net operating loss carryforwards acquired with Xypoint in 2001, usable at the rate of $1,401 per year, and which will begin to expire in 2021 if unused at that time. The remaining $9,325 of U.S. federal net operating loss carryforwards which were generated in 2007 and 2013 will begin to expire in 2027 and 2033.The timing and manner in which we may utilize net operating loss carryforwards and tax credits in future tax years will be limited by the amounts and timing of future taxable income and by the application of the ownership change rules under Section 382 of the Internal Revenue Code.
We have state net operating loss carryforwards available which expire through 2027, utilization of which will be limited in a manner similar to the federal net operating loss carryforwards. At December 31, 2014, we had federal alternative minimum tax credit carryforwards of $2,250, which are available to offset future regular federal taxes. Federal research and development credits of approximately $8,115 will begin to expire in 2019.
F-24
Reconciliations of the reported income tax provision to the amount that would result by applying the 35% U.S. federal statutory rate to the income for the years ended December 31 follow:
|
|
2014 |
|
|
2013 |
|
|
2012 |
|
|||||||||||||||
|
Income tax expense (benefit) at statutory rate |
$ |
629 |
|
|
|
35.0 |
% |
|
$ |
(14,702 |
) |
|
|
35.0 |
% |
|
$ |
(39,718 |
) |
|
|
35.0 |
% |
|
Goodwill impairment charge |
|
— |
|
|
|
— |
|
|
|
1,758 |
|
|
|
(4.2 |
%) |
|
|
30,136 |
|
|
|
(26.6 |
%) |
|
Change in valuation allowance |
|
4,886 |
|
|
|
271.7 |
% |
|
|
30,284 |
|
|
|
(72.1 |
%) |
|
|
— |
|
|
|
— |
|
|
Nondeductible stock-based compensation expense |
|
1,039 |
|
|
|
57.8 |
% |
|
|
1,258 |
|
|
|
(3.0 |
%) |
|
|
1,849 |
|
|
|
(1.6 |
%) |
|
Research and development tax credit |
|
(496 |
) |
|
|
(27.6 |
%) |
|
|
(639 |
) |
|
|
1.5 |
% |
|
|
(858 |
) |
|
|
0.8 |
% |
|
Worthless stock deduction |
|
— |
|
|
|
— |
|
|
|
— |
|
|
|
— |
|
|
|
(1,646 |
) |
|
|
1.5 |
% |
|
State income tax benefit |
|
(322 |
) |
|
|
(17.9 |
%) |
|
|
(692 |
) |
|
|
1.7 |
% |
|
|
(1,156 |
) |
|
|
1.0 |
% |
|
Original issue discount amortization |
|
(241 |
) |
|
|
(13.4 |
%) |
|
|
(2,993 |
) |
|
|
7.1 |
% |
|
|
(1,678 |
) |
|
|
1.5 |
% |
|
Other |
|
(1,966 |
) |
|
|
(109.4 |
%) |
|
|
2,317 |
|
|
|
(5.5 |
%) |
|
|
(2,420 |
) |
|
|
2.1 |
% |
|
Income tax provision (benefit) |
$ |
3,529 |
|
|
|
196.2 |
% |
|
$ |
16,591 |
|
|
|
(39.5 |
%) |
|
$ |
(15,491 |
) |
|
|
13.7 |
% |
We do not currently anticipate that the total amounts of unrecognized tax benefits will significantly increase within the next 12 months. We record the estimated value of uncertain tax positions by adjusting the value of certain tax assets.
The following table summarizes the 2014 and 2013 activity related to the unrecognized tax benefits (excluding interest, penalties and related tax carryforwards):
|
|
|
|
|
|
Balance at December 31, 2012 |
$ |
3,446 |
|
|
Increases related to prior year tax positions |
|
1,040 |
|
|
Increases related to current year tax positions |
|
294 |
|
|
Balance at December 31, 2013 |
|
4,780 |
|
|
Increases related to prior year tax positions |
52 |
|
|
|
Decreases related to prior year tax positions |
|
(415 |
) |
|
Increases related to current year tax positions |
165 |
|
|
|
Balance at December 31, 2014 |
$ |
4,582 |
|
|
|
|
|
|
If the Company’s positions are sustained by the taxing authority in favor of the Company, $4,582 (excluding interest and penalties) of uncertain tax positions would favorably impact the effective tax rate. Our policy is to classify any interest and penalties accrued on any unrecognized tax positions as a component of the provision for income taxes. There were no interest or penalties recognized in the Consolidated Statements of Operations for the year ended December 31, 2014.
We file income tax returns in the U.S. and various state and foreign jurisdictions. As of December 31, 2014, open tax years in the federal and some state jurisdictions date back to 1998, due to the taxing authorities’ ability to adjust operating loss and credit carryforwards.
17. Employee Retirement Plan
We maintain a 401(k) plan covering defined employees who meet established eligibility requirements. Under the provisions of the plan, we may contribute a discretionary match. The plan may also contribute a non-elective contribution. Company contributions matched 40% of employee deferrals in 2012 through August 2013, when the employer match was temporarily suspended. Matching resumed at a 25% rate in July 2014. Company contributions were $71, $1,868, and $2,853 for the years ended December 31, 2014, 2013, and 2012, respectively.
18. Stock-based Compensation Plans
We maintain two stock-based compensation plans: a stock incentive plan and an employee stock purchase plan.
Stock Incentive Plan. We maintain a stock incentive plan that is administered by the Compensation Committee of our Board of Directors. Options granted under the plan vest over periods ranging from one to five years and expire ten years from the date of grant. Under the plans, we may grant certain employees, directors and consultants options to purchase common stock, stock appreciation rights and restricted stock units. Options are rights to purchase our common stock at the fair market value on the date of the grant. Stock appreciation rights are equity settled share-based compensation arrangements whereby the number of shares that will ultimately be issued is based upon the appreciation of our common stock and the number of awards granted to an individual. Restricted stock
F-25
units are equity settled share-based compensation arrangements of a number of share of our common stock. Restricted stock unit holders do not have voting rights until the restrictions lapse.
We recognize compensation expense net of estimated forfeitures over the requisite service period, which is generally the vesting period of 5 years. We estimate the fair value of each stock option award on the date of grant using the Black-Scholes option-pricing model. Expected volatilities are based on historical volatility of our stock. We estimate forfeitures based on historical experience and the expected term of the options granted are derived from historical data on employee exercises. The risk free interest rate is based on the U.S. Treasury yield curve in effect at the time of the grant. We have not paid and do not anticipate paying dividends in the near future.
Our assumptions in calculating the fair value of our stock options using Black-Scholes our assumptions for the years ended December 31 were as follows:
|
|
2014 |
|
|
2013 |
|
|
2012 |
|
|||
|
Expected file (in years) |
5.5 |
|
|
5.5 |
|
|
5.5 |
|
|||
|
Risk-free interest rate (%) |
1.5%-1.9% |
|
|
1%-1.5% |
|
|
1%-1.1% |
|
|||
|
Volatility (%) |
55%-62% |
|
|
63%-64% |
|
|
61%-64% |
|
|||
|
Dividend yield (%) |
|
0% |
|
|
|
0% |
|
|
|
0% |
|
A summary of stock option activity and related information follows (all share amounts in thousands):
|
|
|
|
|
|
|
|
|
|
|
|
|
|||||||||||||||||||||||||||||||||||||
|
|
Number of Options |
|
|
Weighted Average Exercise Price |
|
|
Weighted Average Remaining Contractual Term (Years) |
|
|
Aggregate Intrinsic Value ($000) |
|
|||||||||||||||||||||||||||||||||||||
|
Outstanding at December 31, 2013 |
|
17,177 |
|
|
$ |
4.47 |
|
|
|
|
|
|
|
|
|
|||||||||||||||||||||||||||||||||
|
Granted |
|
2,656 |
|
|
|
2.62 |
|
|
|
|
|
|
|
|
|
|||||||||||||||||||||||||||||||||
|
Exercised |
|
(232 |
) |
|
|
2.36 |
|
|
|
|
|
|
|
|
|
|||||||||||||||||||||||||||||||||
|
Expired |
|
(2,399 |
) |
|
|
6.29 |
|
|
|
|
|
|
|
|
|
|||||||||||||||||||||||||||||||||
|
Forfeited |
|
(1,601 |
) |
|
|
2.89 |
|
|
|
|
|
|
|
|
|
|||||||||||||||||||||||||||||||||
|
Outstanding, December 31, 2014 |
|
15,601 |
|
|
$ |
4.00 |
|
|
5.3 |
|
|
$ |
4,787 |
|
||||||||||||||||||||||||||||||||||
|
Exercisable, December 31, 2014 |
|
10,978 |
|
|
$ |
4.53 |
|
|
|
4.0 |
|
|
$ |
2,136 |
|
|||||||||||||||||||||||||||||||||
|
Vested and expected to vest, December 31, 2014 |
|
14,453 |
|
|
$ |
4.11 |
|
|
|
5.0 |
|
|
$ |
4,128 |
|
|||||||||||||||||||||||||||||||||
|
|
|
|
|
|
|
|
|
|
|
|
|
|
|
|
|
|||||||||||||||||||||||||||||||||
|
|
|
|||||||||||||||||||||||||||||||||||||||||||||||
|
Exercise prices for options outstanding at December 31, 2014 as follows (all share amounts in thousands): |
|
|||||||||||||||||||||||||||||||||||||||||||||||
|
Exercise Prices |
Options Outstanding |
|
|
Weighted-Average Exercise Prices of Options Outstanding |
|
|
Weighted-Average Remaining Contractual Life of Options Outstanding (years) |
|
|
Options Vested and Exercisable |
|
|
Weighted-Average Exercise Prices of Options Vested and Exercisable |
|
|
Weighted-Average Remaining Contractual Life of Options Vested and Exercisable (years) |
|
|||||||||||||||||||||||||||||||
|
$ 1.39 – $ 2.18 |
|
281 |
|
|
$ |
1.46 |
|
|
|
7.2 |
|
|
|
137 |
|
|
$ |
1.49 |
|
|
|
6.9 |
|
|||||||||||||||||||||||||
|
$ 2.20 – $ 3.47 |
|
8,926 |
|
|
$ |
2.65 |
|
|
|
5.8 |
|
|
|
4,877 |
|
|
$ |
2.73 |
|
|
|
3.3 |
|
|||||||||||||||||||||||||
|
$ 3.69 – $ 5.96 |
|
3,484 |
|
|
$ |
4.08 |
|
|
|
4.4 |
|
|
|
3,103 |
|
|
$ |
4.05 |
|
|
|
4.2 |
|
|||||||||||||||||||||||||
|
$ 6.77 – $ 9.86 |
|
2,910 |
|
|
$ |
8.27 |
|
|
|
4.7 |
|
|
|
2,861 |
|
|
$ |
8.27 |
|
|
|
4.6 |
|
|||||||||||||||||||||||||
|
Total end of year |
|
15,601 |
|
|
|
|
|
|
|
|
|
|
|
10,978 |
|
|
|
|
|
|
|
|
|
|||||||||||||||||||||||||
|
|
|
|
|
|
|
|
|
|
|
|
|
|
|
|
|
|
|
|
|
|
|
|
|
|||||||||||||||||||||||||
The weighted average grant date fair value of options granted during the years 2014, 2013, and 2012 was $1.41, $1.33, and $1.30, respectively. The total intrinsic value of options exercised during the years ended December 31, 2014, 2013, and 2012, was $186, $60, and $15, respectively. The total fair value of shares vested during the years ended December 31, 2014, 2013, and 2012, was $3,816, $5,948, and $7,813, respectively. As of December 31, 2014, we estimate that we will recognize $4,000 in expense for outstanding, unvested options over their weighted average remaining vesting period of 3 years.
F-26
A summary of restricted stock activity follows (all share amounts in thousands):
|
|
|
|
|
|
|
||
|
|
Nonvested Shares |
|
|
Weighted Average Grant Date Fair Value |
|
||
|
Nonvested at December 31, 2013 |
|
2,218 |
|
|
$ |
2.68 |
|
|
Granted |
|
830 |
|
|
|
2.30 |
|
|
Vested |
|
(1,064 |
) |
|
|
2.90 |
|
|
Forfeited |
|
(19 |
) |
|
|
2.40 |
|
|
Nonvested at December 31, 2014 |
|
1,965 |
|
|
$ |
2.40 |
|
The restrictions expire at the end of one year for directors and expire in annual increments over two and three years for employees and executives, respectively, conditional on continued employment. The fair value of the restricted stock on the date of issuance is recognized as non-cash stock based compensation expense, net of forfeiture adjustments, over the period over which the restrictions expire. The total fair value of restricted stock of shares vested during the years ended December 31, 2014, 2013, and 2012 was $2,510, $1,959, and $1,058. We recognized $2,907, $2,589, and $1,873 of non-cash stock compensation expense related to these grants for the years ended December 31, 2014, 2013, and 2012, respectively. We expect to record future stock compensation expense of $2,600 as a result of these restricted stock grants that will be recognized over the remaining vesting period.
Employee Stock Purchase Plan. We have an employee stock purchase plan (the Plan) that gives all employees an opportunity to purchase shares of our Class A Common Stock. The Plan allows for the purchase of 4,384 shares of our Class A Common Stock at a discount of 15% of the fair market value. The discount of 15% is calculated based on the average daily share price on either the first or the last day of each quarterly enrollment period, whichever date is more favorable to the employee. Option periods are three months in duration. As of December 31, 2014, 2,544 shares of Class A Common Stock have been issued under the Plan. The Plan will continue until the earlier of termination by the board of directors or the date on which all of the share available for issuance under the plan have been issued. Compensation expense related to the Employee Stock Purchase Plan was $107 for the year ended December 31, 2014. We did not recognize any compensation expense related to the Employee Stock Purchase Plan in 2013. Compensation expense relating to the Employee Stock Purchase Plan was $288 for the year ended December 31, 2012.
As of December 31, 2014, the shares of Class A Common Stock reserved for future issuance are:
|
|
|
(in thousands) |
|
|
|
Stock incentive plan |
|
|
3,118 |
|
|
Outstanding stock options |
|
|
15,601 |
|
|
Note warrant hedge (see Note 12) |
|
|
10,001 |
|
|
For Series B to A conversion |
|
|
4,801 |
|
|
Employee stock purchase plan |
|
|
1,840 |
|
|
Total shares restricted for future use |
|
|
35,361 |
|
Non-cash stock based compensation expense was included in the following income statement captions for the years ended December 31:
|
|
2014 |
|
|
2013 |
|
|
2012 |
|
|||
|
Direct costs of revenue |
$ |
3,602 |
|
|
$ |
4,802 |
|
|
$ |
6,131 |
|
|
Research and development expenses |
|
1,244 |
|
|
|
1,106 |
|
|
|
1,599 |
|
|
Sales and marketing expense |
|
278 |
|
|
|
513 |
|
|
|
483 |
|
|
General and administrative expense |
|
425 |
|
|
|
615 |
|
|
|
808 |
|
|
Total non-cash stock compensation expense |
$ |
5,549 |
|
|
$ |
7,036 |
|
|
$ |
9,021 |
|
F-27
19. Operating Leases
We lease office space and equipment under non-cancelable operating leases that expire on various dates through 2022. Future minimum payments under non-cancelable operating leases with initial terms of one year or more consisted of the following at December 31, 2014:
|
2015 |
$ |
6,370 |
|
|
2016 |
|
6,091 |
|
|
2017 |
|
5,222 |
|
|
2018 |
|
1,772 |
|
|
2019 |
|
1,719 |
|
|
Beyond |
|
1,434 |
|
|
Total operating lease obligations |
$ |
22,608 |
|
|
|
|
|
|
Our leases include offices in Annapolis, Maryland under a lease expiring in July 2019, office space in Hanover, Maryland expiring August 2017, a facility in Seattle, Washington under a lease expiring in October 2017, and we lease a production facility in Tampa, Florida under a lease expiring in December 2022.
We also lease office space in Aliso Viejo, California under a lease expiring in December 2017, a facility near Atlanta, Georgia under a lease expiring August 2020, a facility in Richardson, Texas under a lease expiring April 2015, a facility in North Wollongong, Australia under a lease expiring April 2017 and office space in Torrance, California expiring January 2018. As a result of the 2012 acquisition of microDATA, we lease office space in Danville, Vermont expiring June 2017 and office space in Greenwood Village, Colorado expiring May 2020. Future payments on all of our leases are estimated including the minimum future rent escalations, if any, stipulated in the respective agreements.
Rent expense was $6,556, $7,634 and $7,490 for 2014, 2013, and 2012, respectively.
20. Concentrations of Credit Risk and Major Customers
Financial instruments that potentially subject us to concentrations of credit risk consist of accounts receivable and unbilled receivables. Customers that comprised 10% or more of our revenue, accounts receivable and unbilled receivables are as follows:
Percentage of total revenue for the year ended December 31:
|
Customer |
Segment |
|
2014 |
|
|
2013 |
|
|
2012 |
|
|||
|
U.S. Government agencies and departments |
Government |
|
|
22% |
|
|
|
32% |
|
|
|
44% |
|
|
Verizon Wireless (various divisions, directly and through channel) |
Commercial |
|
|
16% |
|
|
|
16% |
|
|
|
13% |
|
|
|
|
|
|
|
|
|
|
|
|
|
|
|
|
Percentage of receivables (billed and unbilled) as of December 31:
|
Customer |
Segment |
|
2014 |
|
|
2013 |
|
||
|
U.S. Government agencies and departments |
Government |
|
|
31% |
|
|
|
10% |
|
|
Verizon Wireless (various divisions, directly and through channel) |
Commercial |
|
|
15% |
|
|
|
17% |
|
|
AT&T (various divisions) |
Commercial |
|
<10% |
|
|
|
13% |
|
|
|
|
|
|
|
|
|
|
|
|
|
As of December 31, 2014, our total exposure to credit risk from the above customers was $22,908. As of December 31, 2013, our exposure to such risks was $26,643. We did not experience significant losses from amounts due to us by any customers for the year ended December 31, 2014 or 2013.
21. Geographic and Business Segment Information
For 2014, 2013, and 2012 respectively, our revenue includes $40,666, $38,220, and $41,782 of revenue generated from customers outside of the United States.
Our two reporting segments are the Commercial Segment and the Government Segment.
F-28
Commercial Segment: We are one of two leading companies that enable 9-1-1 call delivery via cellular, VoIP, and next generation technology. Other TCS hosted and managed services include cellular network and device platforms and applications for text messaging and location-based services. We are also engaged in patent monetization activity which is included in this segment. Commercial Segment customers include wireless network operators, VoIP service providers, wireless device manufacturers, automotive industry suppliers, and state and local governments.
Government Segment: For our core segment customers, U.S. Department of Defense agencies, we provide cybersecurity services, support, and training and “C4ISR” (command, control, communications, computers, intelligence surveillance and reconnaissance) resources, wireless ground terminals and related support, management and resale of satellite bandwidth, and information technology outsource services. TCS engineers, furnishes, and supports ground terminals used for secure satellite-based and other line-of-sight and beyond-line-of-sight communications, as well as related components incorporating government-approved cryptologic devices and other hardened components for aerospace and defense.
Management evaluates segment performance based on gross profit and all revenues reported below are from external customers. We do not maintain information regarding segment assets. Accordingly, asset information by reportable segment is not presented.
The following tables set forth the results of our reportable segments and a reconciliation of segment gross profit to net loss for the years ended December 31:
|
|
|
|
|
|
|
|
|
|
|
|
|
|
|
|
|||||||||||||||||||||
|
|
2014 |
|
|
2013 |
|
|
2012 |
|
|||||||||||||||||||||||||||
|
|
Comm. |
|
|
Gvmt |
|
|
Total |
|
|
Comm. |
|
|
Gvmt |
|
|
Total |
|
|
Comm. |
|
|
Gvmt |
|
|
Total |
|
|||||||||
|
Revenue |
|
|
|
|
|
|
|
|
|
|
|
|
|
|
|
|
|
|
|
|
|
|
|
|
|
|
|
|
|
|
|
|
|
|
|
|
Services |
$ |
154,388 |
|
|
$ |
106,359 |
|
|
$ |
260,747 |
|
|
$ |
150,311 |
|
|
$ |
131,078 |
|
|
$ |
281,389 |
|
|
$ |
159,054 |
|
|
$ |
146,064 |
|
|
$ |
305,118 |
|
|
Systems |
|
25,114 |
|
|
|
73,976 |
|
|
|
99,090 |
|
|
|
19,749 |
|
|
|
61,153 |
|
|
|
80,902 |
|
|
|
23,690 |
|
|
|
158,576 |
|
|
|
182,266 |
|
|
Total revenue |
|
179,502 |
|
|
|
180,335 |
|
|
|
359,837 |
|
|
|
170,060 |
|
|
|
192,231 |
|
|
|
362,291 |
|
|
|
182,744 |
|
|
|
304,640 |
|
|
|
487,384 |
|
|
Direct costs of revenue |
|
|
|
|
|
|
|
|
|
|
|
|
|
|
|
|
|
|
|
|
|
|
|
|
|
|
|
|
|
|
|
|
|
|
|
|
Direct cost of services |
|
60,241 |
|
|
|
81,990 |
|
|
|
142,231 |
|
|
|
63,984 |
|
|
|
92,301 |
|
|
|
156,285 |
|
|
|
70,438 |
|
|
|
107,879 |
|
|
|
178,317 |
|
|
Direct cost of systems |
|
12,461 |
|
|
|
57,579 |
|
|
|
70,040 |
|
|
|
16,593 |
|
|
|
50,445 |
|
|
|
67,038 |
|
|
|
15,222 |
|
|
|
133,638 |
|
|
|
148,860 |
|
|
Total direct cost of revenue |
|
72,702 |
|
|
|
139,569 |
|
|
|
212,271 |
|
|
|
80,577 |
|
|
|
142,746 |
|
|
|
223,323 |
|
|
|
85,660 |
|
|
|
241,517 |
|
|
|
327,177 |
|
|
Gross profit |
|
|
|
|
|
|
|
|
|
|
|
|
|
|
|
|
|
|
|
|
|
|
|
|
|
|
|
|
|
|
|
|
|
|
|
|
Services gross profit |
|
94,147 |
|
|
|
24,369 |
|
|
|
118,516 |
|
|
|
86,327 |
|
|
|
38,777 |
|
|
|
125,104 |
|
|
|
88,616 |
|
|
|
38,185 |
|
|
|
126,801 |
|
|
Systems gross profit |
|
12,653 |
|
|
|
16,397 |
|
|
|
29,050 |
|
|
|
3,156 |
|
|
|
10,708 |
|
|
|
13,864 |
|
|
|
8,468 |
|
|
|
24,938 |
|
|
|
33,406 |
|
|
Total gross profit |
$ |
106,800 |
|
|
$ |
40,766 |
|
|
$ |
147,566 |
|
|
$ |
89,483 |
|
|
$ |
49,485 |
|
|
$ |
138,968 |
|
|
$ |
97,084 |
|
|
$ |
63,123 |
|
|
$ |
160,207 |
|
|
|
|
|
|
|
|
|
|
|
|
|
|
|
|
|
|
|
|
|
|
|
|
|
|
|
|
|
|
|
|
|
|
|
|
|
|
|
|
|
|
|
|
|
|
|||||
|
|
2014 |
|
|
2013 |
|
|
2012 |
|
|||
|
Total segment gross profit |
$ |
147,566 |
|
|
$ |
138,968 |
|
|
$ |
160,207 |
|
|
Research and development expense |
|
(41,723 |
) |
|
|
(34,308 |
) |
|
|
(36,602 |
) |
|
Sales and marketing expense |
|
(25,994 |
) |
|
|
(28,495 |
) |
|
|
(30,753 |
) |
|
General and administrative expense |
|
(50,820 |
) |
|
|
(54,689 |
) |
|
|
(54,277 |
) |
|
Depreciation and amortization of property and equipment |
|
(13,032 |
) |
|
|
(14,853 |
) |
|
|
(14,245 |
) |
|
Amortization of acquired intangible assets |
|
(3,797 |
) |
|
|
(4,570 |
) |
|
|
(4,374 |
) |
|
Impairment of goodwill and long-lived assets |
|
— |
|
|
|
(31,977 |
) |
|
|
(125,703 |
) |
|
Interest expense |
|
(8,264 |
) |
|
|
(8,262 |
) |
|
|
(7,383 |
) |
|
Amortization of deferred finance fees |
|
(1,005 |
) |
|
|
(3,403 |
) |
|
|
(757 |
) |
|
Gain (loss) on early retirement of debt |
|
— |
|
|
|
(178 |
) |
|
|
431 |
|
|
Other income (expense), net |
|
(1,133 |
) |
|
|
(239 |
) |
|
|
(23 |
) |
|
Net income (loss) before income taxes |
|
1,798 |
|
|
|
(42,006 |
) |
|
|
(113,479 |
) |
|
Income tax (expense) benefit |
|
(3,529 |
) |
|
|
(16,591 |
) |
|
|
15,491 |
|
|
Net loss |
$ |
(1,731 |
) |
|
$ |
(58,597 |
) |
|
$ |
(97,988 |
) |
22. Quarterly Financial Information (Unaudited)
The following is a summary of the quarterly results of operations for 2014 and 2013. The quarterly information has not been audited, but in our opinion, includes all normal adjustments, which are, in the opinion of the management, necessary for fair statement of the results of the interim periods.
F-29
2014 quarters (unaudited)
|
|
First |
|
|
Second |
|
|
Third |
|
|
Fourth |
|
||||
|
Revenue2 |
$ |
85,090 |
|
|
$ |
86,221 |
|
|
$ |
95,332 |
|
|
$ |
93,194 |
|
|
Gross profit |
$ |
34,799 |
|
|
$ |
38,235 |
|
|
$ |
35,906 |
|
|
$ |
38,626 |
|
|
Net income (loss) |
$ |
(477 |
) |
|
$ |
1,058 |
|
|
$ |
(1,964 |
) |
|
$ |
(348 |
) |
|
|
|
|
|
|
|
|
|
|
|
|
|
|
|
|
|
|
Net loss per share basic |
$ |
(0.01 |
) |
|
$ |
0.02 |
|
|
$ |
(0.03 |
) |
|
$ |
(0.01 |
) |
|
Net loss per share diluted1 |
$ |
(0.01 |
) |
|
$ |
0.02 |
|
|
$ |
(0.03 |
) |
|
$ |
(0.01 |
) |
2013 quarters (unaudited)
|
|
First |
|
|
Second |
|
|
Third |
|
|
Fourth |
|
||||
|
Revenue |
$ |
94,794 |
|
|
$ |
92,842 |
|
|
$ |
96,033 |
|
|
$ |
78,622 |
|
|
Gross profit |
$ |
35,481 |
|
|
$ |
35,907 |
|
|
$ |
35,783 |
|
|
$ |
31,797 |
|
|
Net loss |
$ |
(829 |
) |
|
$ |
(1,871 |
) |
|
$ |
(155 |
) |
|
$ |
(55,742 |
) |
|
|
|
|
|
|
|
|
|
|
|
|
|
|
|
|
|
|
Net loss per share basic and diluted1 |
$ |
(0.01 |
) |
|
$ |
(0.03 |
) |
|
$ |
— |
|
|
$ |
(0.95 |
) |
|
1 |
Shares issuable via the convertible notes are included if dilutive, in which case tax-effected interest expense on the debt is excluded from the determination of net income (loss) per share - diluted. For all periods reported in 2014 and 2013 the shares issuable via the convertible notes were anti-dilutive and the tax-effected interest expense was excluded in determining net income (loss) per share. |
|
2 |
During the year ended December 31, 2014, we recognized a one-time favorable 2014 change in estimate of approximately $4,700 associated with our applications subscriber-based revenue. |
23. Commitments and Contingencies
Some customers seek indemnification under their contractual arrangements with the Company for claims and other costs associated with defending lawsuits alleging infringement of patents through their use of our products and services, and the use of our products and services in combination with products and services of other vendors. In some cases we have agreed to assume the defense of the case. In others, the Company will negotiate with these customers in good faith because the Company believes its technology does not infringe the cited patents and due to specific clauses within the customer contractual arrangements that may or may not give rise to an indemnification obligation. The Company cannot predict the outcome of such matters and the resolutions could have a material effect on our consolidated results of operations, financial position, or cash flows. Due to the inherent difficulty of predicting the outcome of litigation and other legal proceedings and uncertainties regarding the Company’s existing litigation and other legal proceedings, the Company is unable to estimate the amount or range of reasonably possible loss in excess of amounts accrued. The Company’s assessments are based on estimates and assumptions that have been deemed reasonable by management, but that may prove to be incomplete or inaccurate, and unanticipated events and circumstances may occur that might cause the Company to change those estimates and assumptions. Therefore, it is possible that an unfavorable resolution of one or more pending litigation or other contingencies could have a material adverse effect on the Company’s consolidated financial statements in a future fiscal period.
The application and interpretation of applicable state and local sales and other tax laws to certain of our service and system offerings in certain jurisdictions is uncertain. In accordance with generally accepted accounting principles, the Company makes a provision for a liability for taxes when it is both probable that the liability has been incurred and the amount of the liability or range of liability can be reasonably estimated. These provisions are reviewed at least quarterly and adjusted if necessary. At December 31, 2014, the Company is subject to an ongoing state and local tax audit by the Washington State Department of Revenue. As this and other tax audits progress in the normal course of business, the Company will review and adjust a provision any estimated liability as appropriate.
Other than the items discussed immediately above, we are not currently subject to any other material legal proceedings. However, we may from time to time become a party to various legal proceedings arising in the ordinary course of our business.
F-30
Pursuant to the requirements of Section 13 or 15(d) of the Securities Exchange Act of 1934, the registrant has duly caused this report to be signed on its behalf by the undersigned, thereunto duly authorized.
|
TeleCommunication Systems, Inc. |
||
|
|
|
|
|
By: |
|
/s/ MAURICE B. TOSÉ |
|
|
|
Maurice B. Tosé |
|
|
|
Chief Executive Officer, President and |
|
|
|
Chairman of the Board |
Pursuant to the requirements of the Securities Exchange Act of 1934, this report has been signed below by the following persons on behalf of the registrant and in the capacities and on the dates indicated. The undersigned hereby constitute and appoint Maurice B. Tosé, Thomas M. Brandt, Jr. and Bruce A. White, and each of them, their true and lawful agents and attorneys-in-fact with full power and authority in said agents and attorneys-in-fact, and in any one or more of them, to sign for the undersigned and in their respective names as directors and officers of TeleCommunication Systems, any amendment or supplement hereto. The undersigned hereby confirm all acts taken by such agents and attorneys-in-fact, and any one or more of them, as herein authorized
|
Name |
|
Title |
|
Date |
|
|
|
|
||
|
/s/ MAURICE B. TOSÉ |
|
Chief Executive Officer, President and |
|
March 13, 2014 |
|
Maurice B. Tosé |
|
Chairman of the Board (Principal Executive Officer) |
|
|
|
|
|
|
||
|
/s/ THOMAS M. BRANDT, JR. |
|
Chief Financial Officer and Senior Vice |
|
March 13, 2014 |
|
Thomas M. Brandt, Jr. |
|
President (Principal Financial Officer) and Director |
|
|
|
|
|
|
||
|
/s/ James M. Bethmann |
|
Director |
|
March 13, 2014 |
|
James M. Bethmann |
|
|
|
|
|
|
|
|
||
|
/s/ Don Carlos Bell, III |
|
Director |
|
March 13, 2014 |
|
Don Carlos Bell, III |
|
|
|
|
|
|
|
|
||
|
/s/ Jan C. Huly |
|
Director |
|
March 13, 2014 |
|
Jan C. Huly |
|
|
|
|
|
|
|
|
||
|
/s/ A. Reza Jafari |
|
Director |
|
March 13, 2014 |
|
A. Reza Jafari |
|
|
|
|
|
|
|
|
||
|
/s/ Jon B. Kutler |
|
Director |
|
March 13, 2014 |
|
Jon B. Kutler |
|
|
|
|
|
|
|
|
||
|
/s/ Weldon H. Latham |
|
Director |
|
March 13, 2014 |
|
Weldon H. Latham |
|
|
|
|
|
|
|
|
|
|
|
/s/ Michael P. Madon |
|
Director |
|
March 13, 2014 |
|
Michael P. Madon |
|
|
|
|
51
|
Exhibit |
|
Description |
|
|
|
|
|
4.1 |
|
Amended and Restated Articles of Incorporation. (Incorporated by reference to the Company’s Quarterly Report on Form 10-Q for the quarter ended June 30, 2004) |
|
|
|
|
|
4.2 |
|
Second Amended and Restated Bylaws. (Incorporated by reference to the Company’s Quarterly Report on Form 10-Q for the quarter ended June 30, 2004) |
|
|
|
|
|
4.3 |
|
Form of Class A Common Stock certificate. (Incorporated by reference to the Company’s Registration Statement on Form S-1 (No. 333-35522) |
|
|
|
|
|
4.4 |
|
Indenture dated as of November 16, 2009, by and between the Company and The Bank of New York Mellon Trust Company, as Trustee (Incorporated by reference to the Company’s Current Report on Form 8-K filed on November 16, 2009) |
|
4.5 |
|
Amendment to Second Amendment and Restated Bylaws (Incorporated by to the Company’s Current Report on Form 8-k filed on February 2, 2015) |
|
|
|
|
|
10.1† |
|
Form of Indemnification Agreement. (Incorporated by reference to the Company’s Registration Statement on Form S-1 (No. 333-35522)) |
|
|
|
|
|
10.2† |
|
First Amended and Restated Employee Stock Purchase Plan. (Incorporated by reference to the Company’s Registration Statement on Form S-8 (No. 333-136072)) |
|
|
|
|
|
10.3 |
|
Deed of Lease by and between Annapolis Partner, LLC and the Company. (Incorporated by reference to the Company’s Annual Report on Form 10-K for the year ended December 31, 2002) |
|
|
|
|
|
10.4† |
|
Form of Incentive Stock Option Agreement. (Incorporated by reference to the Company’s Annual Report on Form 10-K for the year ended December 31, 2011) |
|
|
|
|
|
10.5† |
|
Form of Non-Qualified Stock Option Agreement. (Incorporated by reference to the Company’s Annual Report on Form 10-K for the year ended December 31, 2011) |
|
|
|
|
|
10.6† |
|
Form of Restricted Stock Grant Agreement. (Incorporated by reference to the Company’s Annual Report on Form 10-K for the year ended December 31, 2011) |
|
|
|
|
|
10.7† |
|
Fifth Amended and Restated 1997 Stock Incentive Plan. (Incorporated by reference to Appendix A to the Company’s definitive proxy statement for its 2007 Annual Meeting of stockholders as filed with the SEC on April 30, 2007 (No. 000-30821)) |
|
|
|
|
|
10.8† |
|
Employment Agreement dated February 1, 2010, by and between the Company and Richard A. Young (Incorporated by reference to the Company’s Annual Report on Form 10-K for the year ended December 31, 2006) |
|
|
|
|
|
10.9† |
|
Employment Agreement dated February 1, 2010, by and between the Company and Thomas M. Brandt, Jr. (Incorporated by reference to the Company’s Annual Report on Form 10-K for the year ended December 31, 2006) |
|
|
|
|
|
10.10† |
|
Employment Agreement dated February 1, 2010, by and between the Company and Drew A. Morin (Incorporated by reference to the Company’s Annual Report on Form 10-K for the year ended December 31, 2006) |
|
|
|
|
|
10.11† |
|
Employment Agreement dated February 1, 2010, by and between the Company and Timothy J. Lorello (Incorporated by reference to the Company’s Annual Report on Form 10-K for the year ended December 31, 2006) |
|
|
|
|
|
10.12 |
|
Agreement and Plan of Merger dated November 25, 2009 by and among the Company, Networks in Motion, Inc., Olympus Merger Sub Inc., and G. Bradford Jones, as Stockholders’ Representative (Incorporated by reference to the Company’s Current Report on Form 8-K filed December 15, 2009) |
|
|
|
|
|
10.13 |
|
Purchase Agreement dated as of November 10, 2009, by and among the Company and Oppenheimer & Co. Inc. and Raymond James & Associates, Inc. (Incorporated by reference to the Company’s Current Report on Form 8-K filed on November 16, 2009) |
|
|
|
|
|
10.14 |
|
Convertible Bond Hedging Transaction Confirmation dated November 10, 2009, by and between the Company and Royal Bank of Canada (Incorporated by reference to the Company’s Current Report on Form 8-K filed on November 16, 2009) |
52
|
Exhibit |
|
Description |
|
|
|
|
|
10.15 |
|
Confirmation of Warrants dated November 10, 2009, by and between the Company and Deutsche Bank AG, London Branch (Incorporated by reference to the Company’s Current Report on Form 8-K filed on November 16, 2009) |
|
|
|
|
|
10.16 |
|
Confirmation of Warrants dated November 10, 2009, by and between the Company and Société Générale (Incorporated by reference to the Company’s Current Report on Form 8-K filed on November 16, 2009) |
|
|
|
|
|
10.17 |
|
Confirmation of Warrants dated November 10, 2009, by and between the Company and Royal Bank of Canada (Incorporated by reference to the Company’s Current Report on Form 8-K filed on November 16, 2009) |
|
|
|
|
|
10.18 |
|
Convertible Bond Hedging Transaction Confirmation dated November 11, 2009, by and between the Company and Deutsche Bank AG, London Branch (Incorporated by reference to the Company’s Current Report on Form 8-K filed on November 16, 2009) |
|
|
|
|
|
10.19 |
|
Convertible Bond Hedging Transaction Confirmation dated November 11, 2009, by and between the Company and Société Générale (Incorporated by reference to the Company’s Current Report on Form 8-K filed on November 16, 2009) |
|
|
|
|
|
10.20 |
|
Confirmation of Warrants dated November 11, 2009, by and between the Company and Deutsche Bank AG, London Branch (Incorporated by reference to the Company’s Current Report on Form 8-K filed on November 16, 2009) |
|
|
|
|
|
10.21 |
|
Confirmation of Warrants dated November 11, 2009, by and between the Company and Société Générale (Incorporated by reference to the Company’s Current Report on Form 8-K filed on November 16, 2009) |
|
|
|
|
|
10.22† |
|
Amended and Restated Stock Incentive Plan. (Incorporated by reference to Appendix A to the Company’s definitive proxy statement for its 2010 Annual Meeting of stockholders as filed with the SEC on April 30, 2010 (No. 000-30821)) |
|
|
|
|
|
10.23 |
|
Senior Secured Credit Facilities, Credit Agreement dated June 25, 2013 (Incorporated by reference to the Company’s Quarterly Report on Form 10-Q for the quarter ended June 30, 2013) |
|
|
|
|
|
10.24 |
|
Amendment No. 1 to the Credit Agreement dated July 29, 2013 (Incorporated by reference to the Company’s Quarterly Report on Form 10-Q for the quarter ended June 30, 2013) |
|
|
|
|
|
10.25† |
|
Third Amended and Restated Employee Stock Purchase Plan (Incorporated by reference to the Company’s definitive proxy statement for its 2013 Annual Meeting of stockholders as filed with the SEC on April 29, 2013 (No. 000-30821)) |
|
|
|
|
|
10.26 |
|
Indenture dated as of May 7, 2013, by and between the Company and The Bank of New York Mellon Trust company, as Trustee (Incorporated by reference to the company’s Current Report on Form 8-K filed on May 8, 2013) |
|
|
|
|
|
10.27† |
|
Employment Agreement dated March 3, 2014, by and between the Company and Maurice B. Tosé (Incorporated by reference to the Company’s Annual Report on Form 10-K for the year ended December 31, 2013) |
|
|
|
|
|
10.28 |
|
Amendment No. 2 to the Credit Agreement dated July 29, 2013 (Incorporated by reference to the Company’s Annual Report on Form 10-K for the year ended December 31, 2013) |
|
|
|
|
|
10.29 |
|
Amendment No. 3 to the Credit Agreement dated June 9, 2014 (Incorporated by reference to the Company’s Quarterly Report on Form 10-Q for the quarter ended June 30, 2014) |
|
21.1 |
|
Subsidiaries of the Registrant |
|
|
|
|
|
23.1 |
|
Consent of Ernst & Young LLP |
|
|
|
|
|
31.1 |
|
Certification of CEO required by the Securities and Exchange Commission Rule 13a-14(a) or 15d-14(a) |
|
|
|
|
|
31.2 |
|
Certification of CFO required by the Securities and Exchange Commission Rule 13a-14(a) or 15d-14(a) |
|
|
|
|
|
32.1 |
|
Certification pursuant to 18 U.S.C. Section 1350, as adopted pursuant to Section 906 of the Sarbanes-Oxley Act of 2002 |
|
|
|
|
|
32.2 |
|
Certification pursuant to 18 U.S.C. Section 1350, as adopted pursuant to Section 906 of the Sarbanes-Oxley Act of 2002 |
|
|
|
|
|
101.INS |
|
XBRL Instance Document |
|
|
|
|
|
101.SCH |
|
XBRL Taxonomy Extension Schema Document |
|
|
|
|
|
101.CAL |
|
XBRL Taxonomy Extension Calculation Linkbase Document |
|
|
|
|
53
|
Exhibit |
|
Description |
|
101.DEF |
|
XBRL Taxonomy Extension Definition Linkbase Document |
|
|
|
|
|
101.LAB |
|
XBRL Taxonomy Extension Label Linkbase Document |
|
|
|
|
|
101.PRE |
|
XBRL Taxonomy Extension Presentation Linkbase Document |
|
† |
Management contract, compensatory plans or arrangement required to be filed as an exhibit pursuant to Item 15(a)(3) of Form 10-K. |
54