Attached files
| file | filename |
|---|---|
| EXCEL - IDEA: XBRL DOCUMENT - E.W. SCRIPPS Co | Financial_Report.xls |
| EX-23 - EXHIBIT 23 - E.W. SCRIPPS Co | ssp-ex23122014x10xk.htm |
| EX-21 - EXHIBIT 21 - E.W. SCRIPPS Co | ssp-ex21122014x10xk.htm |
| EX-32.A - EXHIBIT 32.A - E.W. SCRIPPS Co | ssp-ex32a20141231x10k.htm |
| EX-31.A - EXHIBIT 31.A - E.W. SCRIPPS Co | ssp-ex31a20141231x10k.htm |
| EX-32.B - EXHIBIT 32.B - E.W. SCRIPPS Co | ssp-ex32b20141231x10k.htm |
| EX-31.B - EXHIBIT 31.B - E.W. SCRIPPS Co | ssp-ex31b20141231x10k.htm |
UNITED STATES
SECURITIES AND EXCHANGE COMMISSION
Washington, D.C. 20549
FORM 10-K
þ | ANNUAL REPORT PURSUANT TO SECTION 13 OR 15(d) OF THE SECURITIES EXCHANGE ACT OF 1934 | |
For the fiscal year ended December 31, 2014 OR
o | TRANSITION REPORT PURSUANT TO SECTION 13 OR 15(d) OF THE SECURITIES EXCHANGE ACT OF 1934 | |
For the transition period from to
Commission File Number 0-16914
THE E. W. SCRIPPS COMPANY
(Exact name of registrant as specified in its charter)
Ohio (State or other jurisdiction of incorporation or organization) | 31-1223339 (IRS Employer Identification Number) | |
312 Walnut Street Cincinnati, Ohio (Address of principal executive offices) | 45202 (Zip Code) | |
Registrant’s telephone number, including area code: (513) 977-3000
Title of each class Securities registered pursuant to Section 12(b) of the Act: | Name of each exchange on which registered New York Stock Exchange | |
Class A Common shares, $.01 par value | ||
Securities registered pursuant to Section 12(g) of the Act: | ||
Not applicable | ||
Indicate by check mark if the registrant is a well-known seasoned issuer, as defined in Rule 405 of the Securities Act. Yes o No þ
Indicate by check mark if the registrant is not required to file reports pursuant to Section 13 or Section 15(d) of the Act. Yes o No þ
Indicate by check mark whether the registrant (1) has filed all reports required to be filed by Section 13 or 15(d) of the Securities Exchange Act of 1934 during the preceding 12 months (or for such shorter period that the registrant was required to file such reports), and (2) has been subject to such filing requirements for the past 90 days. Yes þ No o
Indicate by check mark whether the registrant has submitted electronically and posted on its corporate Web site, if any, every Interactive Data File required to be submitted and posted pursuant to Rule 405 of Regulation S-T (§ 232.405 of this chapter) during the preceding 12 months (or for such shorter period that the registrant was required to submit and post such files). Yes þ No o
Indicate by check mark if disclosure of delinquent filers pursuant to Item 405 of Regulation S-K is not contained herein, and will not be contained to the best of the registrant’s knowledge, in definitive proxy or information statements incorporated by reference in Part III of this Form 10-K or any amendment to this Form 10-K. o
Indicate by check mark whether the registrant is a large accelerated filer, an accelerated filer, a non-accelerated filer, or a smaller reporting company. See definition of “large accelerated filer”, “accelerated filer” and “smaller reporting company “in Rule 12b-2 of the Exchange Act.
Large accelerated filer o | Accelerated filer þ | Non-accelerated filer o (do not check if a smaller reporting company) | Smaller reporting company o | |||
Indicate by check mark whether the registrant is a shell company (as defined in Rule 12b-2 of the Act). Yes o No þ
The aggregate market value of Class A Common shares of the registrant held by non-affiliates of the registrant, based on the $21.16 per share closing price for such stock on June 30, 2014, was approximately $640,490,000. All Class A Common shares beneficially held by executives and directors of the registrant and descendants of Edward W. Scripps have been deemed, solely for the purpose of the foregoing calculation, to be held by affiliates of the registrant. There is no active market for our Common Voting shares.
As of January 31, 2015, there were 45,293,298 of the registrant’s Class A Common shares, $.01 par value per share, outstanding and 11,932,722 of the registrant’s Common Voting shares, $.01 par value per share, outstanding.
Certain information required for Part III of this report is incorporated herein by reference to the proxy statement for the 2015 annual meeting of shareholders.
Index to The E. W. Scripps Company Annual Report
on Form 10-K for the Year Ended December 31, 2014
Item No. | Page | |
2
As used in this Annual Report on Form 10-K, the terms “Scripps,” “Company,” “we,” “our” or “us” may, depending on the context, refer to The E. W. Scripps Company, to one or more of its consolidated subsidiary companies, or to all of them taken as a whole.
Additional Information
Our Company website is http://www.scripps.com. Copies of all of our SEC filings filed or furnished pursuant to Section 13(a) or 15(d) of the Securities Exchange Act of 1934 are available free of charge on this website as soon as reasonably practicable after we electronically file the material with, or furnish it to, the SEC. Our website also includes copies of the charters for our Compensation, Nominating & Governance and Audit Committees, our Corporate Governance Principles, our Insider Trading Policy, our Ethics Policy and our Code of Ethics for the CEO and Senior Financial Officers. All of these documents are also available to shareholders in print upon request or by request via e-mail to secretary@scripps.com.
Forward-Looking Statements
Our Annual Report on Form 10-K contains certain forward-looking statements related to our businesses. We base our forward-looking statements on our current expectations. Forward-looking statements are subject to certain risks, trends and uncertainties that could cause actual results to differ materially from the expectations expressed in the forward-looking statements. Such risks, trends and uncertainties, which in most instances are beyond our control, include changes in advertising demand and other economic conditions; consumers’ tastes; newsprint prices; program costs; labor relations; technological developments; competitive pressures; interest rates; regulatory rulings; and reliance on third-party vendors for various products and services. The words “believe,” “expect,” “anticipate,” “estimate,” “intend” and similar expressions identify forward-looking statements. You should evaluate our forward-looking statements, which are as of the date of this filing, with the understanding of their inherent uncertainty. We undertake no obligation to update any forward-looking statements to reflect events or circumstances after the date of the statement.
3
PART I
Item 1. | Business |
We are a diverse, 136-year-old media enterprise with interests in television stations, newspapers, and local and national digital media sites. Our mission is to do well by doing good — providing value to customers, employees and owners by informing, engaging and empowering those we serve. We serve audiences and businesses through a growing portfolio of television, print and digital media brands. We own 21 local television stations, as well as daily newspapers in 13 markets across the United States. We also run an expanding collection of local and national digital journalism and information businesses including digital video news service Newsy and weather app developer WeatherSphere. We also produce television programming, run an award-winning investigative reporting newsroom in Washington, D.C., and serve as the longtime steward of the nation's largest, most successful and longest-running educational program, the Scripps National Spelling Bee. Founded in 1878, our motto is "Give light and the people will find their own way." For a full listing of our media companies and their associated websites, visit http://www.scripps.com.
On July 30, 2014, our Board of Directors approved an agreement under which Scripps would acquire the broadcast business of Journal Communications, Inc. ("Journal") and each would spin-off their newspaper businesses into a separate publicly traded company (the “Journal Transactions”). The newspaper company will be named Journal Media Group, combining the 13 Scripps newspapers with Journal's Milwaukee Journal Sentinel. After the completion of the transaction, Scripps will be the fifth-largest independent television operator in the U.S. with 33 stations in 24 markets, as well as owning 34 radio stations in eight markets.
Scripps and Journal shareholders voted to approve the Journal Transactions on March 11, 2015. The closing date of the Journal Transactions is currently scheduled for April 1, 2015.
On June 16, 2014, we acquired two television stations owned by Granite Broadcasting Corporation for $110 million in cash. The acquisition included an ABC-affiliated station and a MyNetworkTV affiliate, which will be operated as a duopoly with our Detroit ABC affiliate.
On January 1, 2014, we acquired Media Convergence Group, which operates as Newsy, a digital video news provider, for $35 million in cash. Newsy adds a new dimension to our video news strategy with a storytelling approach, specifically geared toward digital audiences.
Beginning in 2013, we expanded our digital sales force in many of our markets. We believe a broad deployment of additional sales resources supporting our digital initiatives will allow us to take advantage of opportunities in digital media. We hired more than 100 digital-only sales professionals for our television and newspaper segments between 2013 and 2014.
On December 30, 2011, we acquired the television station group owned by McGraw-Hill Broadcasting Company, Inc., for $212 million in cash, plus a working capital adjustment of $4.4 million. The acquisition included four ABC-affiliated television stations, as well as five Azteca America Spanish-language affiliates.
At the beginning of 2011, we signaled our commitment to developing our local digital media business by combining all of our digital initiatives into a single organization. Under the direction of our digital leadership, working closely with the leadership of both of our divisions, this focus is beginning to deliver long-term financial benefits as we find new and efficient platforms for bringing together advertisers and audiences. Under this structure, our digital media group develops products and offerings that enable our television stations and newspapers to provide unique and compelling content through the web, smartphones and tablets. The digital group also develops content and applications specifically for digital platforms to make the user experience unique. Our digital group drives the coordinated local and national digital sales efforts for our television and newspaper divisions.
In the first quarter of 2011, we entered into a five-year agreement with Universal Uclick (“Universal”) to provide syndication services for the news features and comics of United Media. Universal provides editorial and production services, sales and marketing, sales support and customer service, and distribution and fulfillment for all the news features and comics of United Media. Under the terms of the agreement, Scripps receives a fixed fee from Universal and continues to own certain copyrights and control the licenses for those properties and manages the business relationships with the creative talent that produces those comics and features.
Financial information for each of our business segments can be found under “Management’s Discussion and Analysis of Financial Condition and Results of Operations” and the Notes to Consolidated Financial Statements of this Form 10-K.
4
Television
Scripps has operated broadcast television stations since 1947, when it launched Ohio’s first television station, WEWS-TV, in Cleveland. Today, our television station group reaches approximately 14% of the nation’s households and includes 11 ABC affiliates, three NBC affiliates and two independent stations, which we operate as duopolies with our Kansas City NBC affiliate and our Detroit ABC affiliate. We also own five Azteca America affiliates.
We produce high-quality news and information content that informs and engages local and national communities. We distribute our content to four platforms — broadcast, web, smartphones and tablets. It is our objective to develop content and applications designed to enhance the user experience on each of those platforms. Our ability to cover our communities across multiple digital platforms allows us to expand our audiences beyond our traditional broadcast television boundaries.
Our digital sites offer comprehensive local news and information and user-generated content. We continue to enhance our online and digital services, using features such as long-form text articles, in addition to streaming video and audio, to deliver news and information. Many of our journalists routinely produce videos for consumption through our digital platforms and use an array of social media sites, such as Facebook, YouTube and Twitter, to communicate with and build our audiences. We have embraced mobile technology by offering our products on apps available on the Apple, Android, Kindle Fire and Windows 8 platforms.
We believe the most critical component of our product mix is compelling news content, which is an important link to the community and aids our stations' efforts to expand viewership. In addition, local news programming can provide local news viewers access to advertising sources specific to television. We have trained employees in our news departments to be multi-media journalists, allowing us to pursue a “hyper-local” strategy by having more reporters covering local news for our over-the-air and digital platforms. In 2014, a number of our television stations earned prestigious media industry awards, including the Edward R. Murrow Award and the Alfred I. duPont-Columbia Award.
In addition to news programming, our television stations run network programming, syndicated programming and internally produced programming. Some of the Scripps-owned programming on our television stations offers viewers an interactive experience. In 2012, we began a strategy to rely less on expensive syndicated programming and develop our own programming and that September, we launched two original shows — a new game show called Let's Ask America and a nightly infotainment magazine called The List. One or both of these shows is aired in the access hour just before prime time in 12 of our markets. We are also a partner in RightThisMinute, a daily news and entertainment program, which airs on 15 of our stations and reaches more than 90% of the country through syndication. We launched our fourth original show, The Now, in eight of our markets in the third quarter of 2014. The Now is a news show designed for a 4 p.m. audience and takes a deeper dive into the day's events. These four shows were developed internally or in partnership with others and replaced expensive syndicated content. We believe this strategy has the potential to improve our television division's financial performance for years to come.
5
Information concerning our full-power television stations, their network affiliations and the markets in which they operate is as follows:
Station | Market | Network Affiliation/ DTV Channel | Affiliation Agreement Expires in | FCC License Expires in | Rank of Market (1) | Stations in Market (2) | Station Rank in Market (3) | Percentage of U.S. Television Households in Mkt (4) | Average Audience Share (5) | ||||||||||||||
KNXV-TV | Phoenix, Ch. 15 | ABC/15 | 2019 | 2022 | 11 | 13 | 3 | 1.6 | % | 6 | |||||||||||||
WXYZ-TV | Detroit, Ch. 7 | ABC/41 | 2019 | 2021 | 12 | 8 | 1 | 1.6 | % | 9 | |||||||||||||
WMYD-TV | Detroit, Ch. 20 | MY/21 | 2016 | 2021 | 12 | 8 | 6 | 1.6 | % | 2 | |||||||||||||
WFTS-TV | Tampa, Ch. 28 | ABC/29 | 2019 | 2021 | 13 | 12 | 4 | 1.6 | % | 5 | |||||||||||||
KMGH-TV | Denver, Ch. 7 | ABC/7 | 2019 | 2022 | 17 | 11 | 3 | 1.4 | % | 5 | |||||||||||||
WEWS-TV | Cleveland, Ch. 5 | ABC/15 | 2019 | 2021 | 19 | 8 | 3 | 1.3 | % | 8 | |||||||||||||
WMAR-TV | Baltimore, Ch. 2 | ABC/38 | 2019 | 2020 | 26 | 6 | 4 | 1.0 | % | 4 | |||||||||||||
WRTV-TV | Indianapolis, Ch. 6 | ABC/25 | 2019 | 2021 | 27 | 9 | 3 | 0.9 | % | 7 | |||||||||||||
KGTV-TV | San Diego, Ch. 10 | ABC/10 | 2019 | 2014 (6) | 28 | 11 | 3 | 0.9 | % | 5 | |||||||||||||
KSHB-TV | Kansas City, Ch. 41 | NBC/42 | 2015 | 2022 | 31 | 8 | 4 | 0.8 | % | 6 | |||||||||||||
KMCI-TV | Lawrence, Ch. 38 | Ind./41 | N/A | 2022 | 31 | 8 | 6 | 0.8 | % | 1 | |||||||||||||
WCPO-TV | Cincinnati, Ch. 9 | ABC/22 | 2019 | 2021 | 36 | 5 | 2 | 0.8 | % | 8 | |||||||||||||
WPTV-TV | W. Palm Beach, Ch. 5 | NBC/12 | 2015 | 2021 | 38 | 7 | 1 | 0.7 | % | 10 | |||||||||||||
WKBW-TV | Buffalo, Ch. 7 | ABC/38 | 2018 | 2015 | 52 | 8 | 3 | 0.5 | % | 6 | |||||||||||||
KJRH-TV | Tulsa, Ch. 2 | NBC/8 | 2015 | 2022 | 60 | 10 | 4 | 0.5 | % | 7 | |||||||||||||
KERO-TV | Bakersfield, Ch. 23 | ABC/10 | 2019 | 2022 | 127 | 4 | 3 | 0.2 | % | 9 | |||||||||||||
All market and audience data is based on the November 2014 Nielsen survey.
(1) | Rank of Market represents the relative size of the television market in the United States. |
(2) | Stations in Market represents stations within the Designated Market Area per the Nielsen survey excluding public broadcasting stations, satellite stations, and lower-power stations. |
(3) | Station Rank in Market is based on Average Audience Share as described in (5). |
(4) | Percentage of U.S. Television Households in Market represents the number of U.S. television households in Designated Market Area as a percentage of total U.S. television households. |
(5) | Average Audience Share represents the number of television households tuned to a specific station from 6 a.m. to 2 a.m. M-SU, as a percentage of total viewing households in the Designated Market Area. |
(6) | Renewal application pending. Under FCC rules, a license is automatically extended pending FCC processing and granting of the renewal application. |
Historically, we have been successful in renewing our expiring FCC licenses.
We also operate five low-power stations affiliated with the Azteca America network, a Hispanic network producing Spanish-language programming. The stations are clustered around our California and Denver stations.
6
Revenue cycles and sources
Broadcast Advertising
We sell advertising to local, national and political customers. The sale of local, national and political commercial spots accounted for approximately 83% of the television segment’s revenues in 2014. Pricing of advertising is based on audience size and share, the demographics of our audiences and the demand for our limited inventory of commercial time. Our television stations compete for advertising revenues with other sources of local media, including competitors’ television stations in the same markets, radio stations, cable television systems, newspapers, digital platforms and direct mail.
Cyclical factors influence revenues from our core advertising categories. Some of the cycles are periodic and known well in advance, such as election campaign seasons and special programming events (e.g. the Olympics or the Super Bowl). For example, our NBC affiliates benefit from incremental advertising demand from the coverage of the Olympics. Economic cycles are less predictable and beyond our control.
Advertising revenues increase significantly during even-numbered years when local, state and federal elections occur.
Due to increased demand in the spring and holiday seasons, the second and fourth quarters normally have higher advertising revenues than the first and third quarters.
Retransmission Revenues
We earn revenues from retransmission consent agreements with multi-channel video programming distributors ("MVPDs") in our markets. Retransmission revenues were 12% of television segment operating revenues in 2014. The MVPDs are cable operators and satellite carriers who pay us to offer our programming to their customers. The revenue we receive is typically based on the number of subscribers the MVPD has in our local market. There are approximately 14.7 million subscribers to MVPD services in our markets. We renewed contracts covering 5.6 million subscribers which expired at the end of 2014. When we have renewed retransmission consent agreements, they have generally been at higher rates.
Prior to the spin-off in 2008 of Scripps Networks Interactive (SNI), we granted retransmission rights to MVPDs in exchange for carriage of cable networks. Pursuant to an agreement entered into as part of the spin-off, SNI pays us an annual fee for carriage of our broadcast signals by certain MVPDs, including Comcast and Time Warner Cable. Our agreement with Time Warner Cable expires at the end of 2015, and our Comcast agreement expires at the end of 2019.
Our retransmission consent agreements with MVPD providers expire through 2019. The number of subscribers to those services by year of renewal is as follows: 3.0 million in 2015, 3.0 million in 2016, 1.4 million in 2017, 4.7 million in 2018 and 2.6 million in 2019. These renewals do not contemplate the impact of the proposed Time Warner Cable and Comcast merger.
Digital Revenues
We sell advertising across all our digital platforms. Digital advertising provided approximately 4% of our television segment operating revenues in 2014. Digital advertising includes fixed-duration campaigns whereby, for a fee, a video preroll, a banner, text or other advertisement appears for a specified period of time; impression-based campaigns where the fee is based on the number of times the advertisement appears in webpages viewed by a user; and click-through campaigns where the fee is based on the number of users who click on an advertisement and are directed to the advertisers’ websites. We use a variety of audience-extension programs to enhance the reach of our websites and garner a larger share of local advertising dollars that are spent online. We also offer our local advertising customers additional marketing services, such as managing their search engine marketing campaigns.
In late 2013, we launched a subscription model for in-depth news content features on the website of our Cincinnati station, WCPO. In 2014, we began charging the users of WCPO.com a subscription fee to access premium content. Depending on the success of the WCPO subscription model, we may consider launching similar models in additional television markets in future years.
Other
In addition to selling commercials during our programming, we also offer marketing opportunities for our business customers, including sponsorships and community events.
7
Expenses
Employee costs accounted for 55% of segment costs and expenses in 2014.
We have been centralizing certain functions at company-owned hubs that do not require a presence in the local markets, enabling each of our stations to focus local resources on the creation of content and revenue-producing activities.
Programming costs, which include syndicated programming, shows produced for us or in partnership with others, and network affiliation fees, were 16% of total segment costs and expenses in 2014. Our ABC and NBC network-affiliated stations pay the networks for the programming that is supplied to us in various dayparts. Our network affiliation agreements also require us to pay a portion of retransmission revenues above a threshold to the network.
Federal Regulation of Broadcasting — Broadcast television is subject to the jurisdiction of the FCC pursuant to the Communications Act of 1934, as amended (“Communications Act”). The Communications Act prohibits the operation of broadcast television stations except in accordance with a license issued by the FCC and empowers the FCC to revoke, modify and renew broadcast television licenses, approve the transfer of control of any entity holding such licenses, determine the location of stations, regulate the equipment used by stations and adopt and enforce necessary regulations. The FCC also exercises limited authority over broadcast programming by, among other things, requiring certain children's programming and limiting commercial content therein, regulating the sale of political advertising and the distribution of emergency information, and restricting indecent programming. The FCC also requires television broadcasters to close caption their programming for the benefit of the hearing impaired and to ensure that any of their programming that is later transmitted via the Internet is captioned. Network-affiliated broadcasters in larger markets must also offer audio narration of certain television programming for the benefit of the visually impaired.
Broadcast television licenses are granted for a term of up to eight years and are renewable upon request, subject to FCC review of the licensee's performance. All the Company’s applications for license renewal during the current renewal cycle have been granted for full terms except the timely-filed applications of stations KGTV and WKBW-TV that await Commission action. While there can be no assurance regarding the renewal of our broadcast television licenses, we have never had a license revoked, have never been denied a renewal, and all previous renewals have been for the maximum term.
FCC regulations govern the ownership of television stations and other media. Under the FCC's current rules, a license for a television station will generally not be granted or renewed if the grant of the license would result in (i) the applicant owning or controlling more than one television station, or in some markets under certain conditions, more than two television stations in the same market (the “television duopoly rule”), or (ii) the grant of the license would result in the applicant's owning or controlling television stations whose total national audience reach exceeds 39% of all television households. The FCC also has generally prohibited “cross ownership” of a television station and a daily newspaper in the same community. The FCC is currently revisiting its newspaper-broadcast rule, and an expected change in the manner of measuring the rule's geographic scope could bring the Company's Treasure Coast newspapers and nearby station WPTV-TV within the rule's terms, but the FCC in the past has permitted the continuation of such preexisting relationships after a rule change. In addition, the FCC has modified its rules to impose the television duopoly rule's ownership restrictions on independent stations within a market that engage in joint advertising sales, and it is considering imposing disclosure and other limits on local stations that share facilities or services such as program production. Station WPTV-TV has entered into such a shared program services agreement with another local station. We cannot predict the outcome of the FCC’s ongoing consideration of these ownership issues or the effect of any FCC revision of these policies on our stations' operations or our business.
The FCC has concluded that the transition to more efficient digital television broadcasting permits further reductions in the amount of spectrum allocated to over-the-air broadcasting. In order to provide additional spectrum for mobile broadband services, Congress granted the FCC authority to conduct spectrum auctions in which some broadcasters would voluntarily give up spectrum in return for a share of the auction proceeds. While the FCC has adopted a broad framework for the auction, numerous critical issues remain unresolved, and broadcasters are appealing certain FCC decisions to a reviewing court, objecting, for example, to the standard the FCC intends to use in calculating stations’ protected service contours during the necessary “repacking” of the broadcast spectrum post-auction and to the limited time the FCC plans to allocate for repacking to be completed. The FCC’s chairman has recently announced a delayed schedule whereby the agency would finalize the auction procedures during 2015 and then hold the auction in 2016. Broadcasters support sufficient delay to permit the FCC to better address the variety of complex issues associated with this auction, including encouraging broadcasters’ voluntary participation, adequately compensating those stations that will be required to change their facilities due to the repacking of the remaining broadcast spectrum, and protecting the remaining television stations from a reduction of their over-the-air coverage. Implementing the required changes in television stations' frequency use will be costly, and stations located near the Canadian and Mexican borders are at particular risk of service loss due to the need to coordinate international frequency use. The
8
repacking of broadcast spectrum could also have particular adverse effects on the ability of low-power television stations to offer service, since these stations enjoy only “secondary” status and would not be protected from interference caused by a full-power station that was forced to relocate. Separately, the FCC has issued rules and authorizations permitting the non-broadcast use of broadcast spectrum in the “white spaces” between stations' service areas despite broadcaster concerns about harmful interference to their operations. We cannot predict the effect of these proceedings on our offering of digital television service or our business.
Broadcast television stations generally enjoy “must-carry” rights on any cable television system defined as “local” with respect to the station. Stations may waive their must-carry rights and instead negotiate retransmission consent agreements with local cable companies. Similarly, satellite carriers, upon request, are required to carry the signal of those television stations that request carriage and that are located in markets in which the satellite carrier chooses to retransmit at least one local station, and satellite carriers cannot carry a broadcast station without its consent. The Company has elected to negotiate retransmission consent agreements with cable operators and satellite carriers for both our network-affiliated stations and our independent stations. Some members of Congress have urged the FCC to address concerns about cable and satellite subscribers occasionally losing television service during retransmission consent negotiations, and the FCC initiated a rulemaking proceeding to reexamine the process. While the FCC has concluded that it lacks authority to require arbitration or mandate station carriage, it has determined to restrict the practice whereby some independently owned stations in a market would jointly negotiate retransmission consent rights, and it is seeking additional comment on whether it should eliminate the “network nonduplication” and “syndicated exclusivity” rules that permit broadcasters to enforce certain contractual programming exclusivity rights through the FCC's processes rather than by judicial proceedings. We cannot predict the outcome of these proceedings or their possible impact on the Company.
Other proceedings before the FCC and the courts are reexamining policies that now protect television stations' rights to control the distribution of their programming within their local service areas. For example, the FCC has initiated a rulemaking proceeding on the degree to which an entity relying upon the Internet to deliver video programming should be subject to the regulations that apply to multi-channel video programming distributors (“MVPDs”), such as cable operators and satellite systems. This proceeding raises a variety of issues, including whether Internet-based distributors might be able to take advantage of MVPDs' statutory copyright licensing rights. Other ongoing copyright-related proceedings involve, for example, the legality of digital recorders that can automatically remove commercials from broadcast programming during playback. We cannot predict the outcome of these and other proceedings that address the use of new technologies to challenge traditional means of redistributing broadcast programming or their possible impact on the Company.
During recent years, the FCC has considered substantially increasing its scrutiny of broadcasters' programming practices. In particular, it has heightened its attention to enforcement of the restrictions on indecent programming. Congress' decision to greatly increase the financial penalty for airing such programming has also increased the threat to broadcasters from such enforcement. Litigation continues over the scope of the FCC's authority to regulate indecency, and substantial uncertainty remains concerning FCC indecency enforcement. In addition, the FCC continues to consider requiring far more detailed reporting of television stations' public service-related programming, and it now requires the online posting of stations' public inspection files, including their political sales files. The FCC also continues to maintain an open docket addressing how the evolution of digital media may be affecting children, including whether commercial television broadcasters are adequately addressing children's educational needs and whether steps should be taken to better protect children from exposure to potentially harmful media content, including harmful advertising messages. We cannot predict the outcome of these proceedings or their possible impact on the Company.
9
Newspapers
We have operated newspapers since 1878, when our founder, Edward W. Scripps, began publishing the Penny Press in Cleveland, Ohio. Today, the Scripps newspaper division operates in 13 local markets across the United States. We produce content that informs and engages local communities. We distribute our content primarily to four platforms — print, web, smartphones and tablets. It is our objective to develop content and applications designed to enhance the user experience on each of those platforms. Our ability to serve our communities by providing content across multiple digital platforms allows us to expand our audiences beyond our traditional print boundaries.
Our digital sites offer comprehensive local news and information and user-generated content. We continue to enhance our digital offerings, using features such as streaming video and audio, to deliver our news and information content. Many of our journalists routinely produce videos for consumption through our websites and use an array of social media sites, such as Facebook, YouTube and Twitter, to communicate with and build our audiences. We have embraced mobile technology by offering our products on apps available on the Apple, Android, Kindle Fire and Windows 8 platforms.
We believe all of our newspapers have an excellent reputation for journalistic quality and content, which we believe is key to retaining readership. Our newspapers were recognized during 2014 by various regional and national journalism organizations for high-quality reporting across multiple platforms.
Over the years, we have supplemented our daily newspapers with an array of niche products, including direct mail advertising, total market coverage publications, zoned editions, specialty publications and event-based publications. These product offerings allow existing advertisers to reach their target audiences in multiple ways, while giving us a portfolio of products with which to acquire new clients, particularly small- and mid-sized advertisers.
The daily circulation, which includes print and E-edition, for our newspaper markets and audiences that we serve is as follows:
(in thousands)(1) | 2014 | 2013 | 2012 | 2011 | 2010 | ||||||||||
Abilene (TX) Reporter-News | 18 | 21 | 22 | 24 | 24 | ||||||||||
Anderson (SC) Independent-Mail | 19 | 21 | 22 | 23 | 23 | ||||||||||
Corpus Christi (TX) Caller-Times | 35 | 39 | 42 | 43 | 45 | ||||||||||
Evansville (IN) Courier & Press | 41 | 43 | 47 | 52 | 52 | ||||||||||
Henderson (KY) Gleaner | 7 | 8 | 9 | 10 | 10 | ||||||||||
Kitsap (WA) Sun | 18 | 19 | 20 | 21 | 23 | ||||||||||
Knoxville (TN) News Sentinel | 71 | 73 | 80 | 92 | 93 | ||||||||||
Memphis (TN) Commercial Appeal | 85 | 88 | 96 | 109 | 118 | ||||||||||
Naples (FL) Daily News | 51 | 58 | 59 | 54 | 63 | ||||||||||
Redding (CA) Record-Searchlight | 18 | 19 | 20 | 21 | 22 | ||||||||||
San Angelo (TX) Standard-Times | 16 | 17 | 18 | 18 | 18 | ||||||||||
Treasure Coast (FL) News/Press/Tribune (2) | 59 | 67 | 69 | 76 | 75 | ||||||||||
Ventura County (CA) Star | 46 | 49 | 54 | 62 | 65 | ||||||||||
Wichita Falls (TX) Times Record News | 18 | 19 | 22 | 22 | 23 | ||||||||||
Total Daily Circulation | 502 | 541 | 580 | 627 | 654 | ||||||||||
10
Circulation information for the Sunday edition of our newspapers is as follows:
(in thousands)(1) | 2014 | 2013 | 2012 | 2011 | 2010 | ||||||||||
Abilene (TX) Reporter-News | 23 | 25 | 28 | 31 | 31 | ||||||||||
Anderson (SC) Independent-Mail | 27 | 27 | 28 | 30 | 29 | ||||||||||
Corpus Christi (TX) Caller-Times | 46 | 51 | 55 | 58 | 58 | ||||||||||
Evansville (IN) Courier & Press | 57 | 61 | 68 | 73 | 74 | ||||||||||
Henderson (KY) Gleaner | 8 | 9 | 10 | 11 | 11 | ||||||||||
Kitsap (WA) Sun | 20 | 21 | 23 | 23 | 24 | ||||||||||
Knoxville (TN) News Sentinel | 96 | 100 | 108 | 121 | 116 | ||||||||||
Memphis (TN) Commercial Appeal | 120 | 124 | 131 | 147 | 151 | ||||||||||
Naples (FL) Daily News | 59 | 70 | 71 | 65 | 73 | ||||||||||
Redding (CA) Record-Searchlight | 21 | 21 | 23 | 24 | 25 | ||||||||||
San Angelo (TX) Standard-Times | 18 | 20 | 22 | 22 | 21 | ||||||||||
Treasure Coast (FL) News/Press/Tribune (2) | 75 | 84 | 88 | 94 | 95 | ||||||||||
Ventura County (CA) Star | 59 | 64 | 74 | 81 | 82 | ||||||||||
Wichita Falls (TX) Times Record News | 20 | 22 | 25 | 25 | 26 | ||||||||||
Total Sunday Circulation | 649 | 699 | 754 | 805 | 816 | ||||||||||
(1) | Based on Audit Bureau of Circulation Publisher’s Statements (“Statements”) for the six-month periods ended September 30, except figures for the Naples Daily News and the Treasure Coast News/Press/Tribune, which are from the Statements for the 12-month periods ended September 30. |
(2) | Represents the combined daily and Sunday circulation of The Stuart News, the Indian River Press Journal and The St. Lucie News Tribune. |
Revenue sources
Our newspapers derive revenue by selling marketing and advertising services to businesses in our markets and our news and information content to subscribers.
Advertising
We believe that compelling news and information content and a diverse portfolio of product offerings on multiple platforms are critical components to garnering the most profitable share of local advertising dollars in our markets.
Our range of products and audience reach give us the ability to deliver the specific audiences desired by our advertisers. While many advertisers want the broad reach delivered by our daily newspaper, others want to target their message by demography, geography, buying habits or consumer behavior. We develop advertising campaigns that utilize products within our portfolio to best reach the advertisers' targeted audience with the appropriate frequency.
We sell advertising based upon audience size, demographics, price and effectiveness. Advertising rates and revenues vary among our newspapers depending on circulation, type of advertising, local market conditions and competition. Each of our newspapers operates in highly competitive local media marketplaces, where advertisers and media consumers can choose from a wide range of alternatives, including other news publications, radio, broadcast and cable television, magazines, Internet sites, outdoor advertising, directories and direct mail products.
Print advertising
Print advertising provided approximately 55% of newspaper segment operating revenues in 2014. Print advertising includes Run-of-Press (“ROP”) advertising, preprinted inserts, advertising in niche publications, and direct mail. Advertisements, located throughout the newspaper, include local, classified and national advertising. Local advertising refers to any advertising purchased by in-market advertisers that is not included in the paper’s classified section. Classified advertising includes all auto, real estate and help-wanted advertising and other ads listed together in sequence by the nature of the ads. National advertising includes advertising purchased by businesses outside our local market. National advertisers typically procure advertising from numerous newspapers using advertising agency buying services. Preprinted inserts are stand-alone, multi-page circulars inserted into and distributed with the daily newspaper, niche publications and shared mail products.
11
Digital advertising and marketing services
We sell advertising across all our digital platforms. Digital advertising provided approximately 7% of our newspaper segment operating revenues in 2014. Digital advertising includes fixed duration campaigns whereby a banner, text or other advertisement appears for a specified period of time for a fee; impression-based campaigns where the fee is based on the number of times the advertisement appears in webpages viewed by a user; and click-through campaigns where the fee is based on the number of users who click on an advertisement and are directed to the advertisers’ websites. We use a variety of audience-extension programs to enhance the reach of our websites and garner a larger share of local advertising dollars that are spent online. We also offer our local advertising customers additional marketing services, such as managing their search engine marketing campaigns.
Circulation (subscriptions)
We deliver our news and other content on four platforms — print, web, smartphones and tablets. In the third quarter of 2013, we completed the implementation of a strategy to meter the access to content that is delivered on our digital platforms. We introduced bundled subscription offerings for our print and digital products in all of our markets in 2013. Under our bundled model, home delivery subscribers receive access to all of our newspaper content on all digital platforms, and only limited digital content is available to non-subscribers. We also offer digital-only subscriptions.
Approximately 30% of our total revenue comes from readers who pay us to receive a printed newspaper. Our print product may be delivered directly to subscribers (home delivery) or purchased from a retail store or vending machine (single copy). Home delivery copies account for more than 80% of our total daily subscription revenues.
Daily and Sunday circulation has declined during the past five years, due in part to readers who consume more news and information through the Internet or on mobile devices. Some of the declines are due to a deliberate decision to eliminate distribution to outlying areas. More recently, we have implemented marketing and pricing strategies intended to stabilize home delivery subscription revenues.
Expenses
Our newspaper business is characterized as having high fixed costs with much of our expense base dedicated to employees and production and distribution capabilities.
Employees — Employee costs accounted for approximately 45% of segment costs and expenses in 2014. Our workforce is comprised of non-union and union employees. See “Employees.” During the past five years, we have reduced our workforce from 3,000 employees to approximately 2,100.
Distribution — We primarily outsource the physical distribution of our products to independent contractors. Distribution costs are affected by the cost of fuel and the number of papers being delivered. We also coordinate the distribution of other publications, such as The Wall Street Journal and Barron’s, in a number of our markets.
Newsprint — We consumed approximately 48,000 metric tons of newsprint in 2014. Newsprint is a basic commodity and its price is sensitive to changes in the balance of worldwide supply and demand. Mill closures and industry consolidation have decreased overall newsprint production capacity and could lead to future price increases. We purchase newsprint from various suppliers, many of which are Canadian. Based on our expected newsprint consumption, we believe our supply sources are sufficient.
Capital Expenditures
During the past several years, our newspaper operations have consumed a historically low level of capital for ongoing operations. We will continue to make necessary investments to maintain the physical operations and to ensure employee safety. We will focus additional capital on projects that expand our ability to deliver news and improve sales, which will likely include software development and technological capabilities that improve audience or revenue growth directly.
12
Syndication and Other
Syndication and other primarily includes certain digital operations outside of our television and newspaper markets and syndication of news features and comics. Under the trade name United Media, we distribute news columns, comics and other features for the newspaper industry. Newspapers typically pay a weekly fee for their use of the features. Newsy, a digital video news service, and WeatherSphere, a provider of weather-related mobile apps, are also included in syndication and other.
In 2011, we entered into a five-year agreement with Universal Uclick (“Universal”) to provide syndication services for the news features and comics of United Media. Universal provides editorial and production services, sales and marketing, sales support and customer service, and distribution and fulfillment for all the news features and comics of United Media. Under the terms of the agreement, Scripps receives a fixed fee from Universal and continues to own certain copyrights and control the licenses for those properties, and manages the business relationships with the creative talent that produces those comics and features.
Employees
As of December 31, 2014, we had approximately 4,800 full-time equivalent employees, of whom approximately 2,000 were with television, 2,100 with newspapers and 400 with our digital operations. Various labor unions represent approximately 600 employees, 300 of which are in television and 300 are in newspapers. We have not experienced any work stoppages at our current operations since 1985. We consider our relationships with our employees to be generally satisfactory.
13
Item 1A. | Risk Factors |
For an enterprise as large and complex as ours, a wide range of factors could materially affect future developments and performance. The most significant factors affecting our operations include the following:
We derive the majority of our revenues from marketing and advertising spending by businesses, which is affected by numerous factors. Declines in advertising revenues will adversely affect the profitability of our business.
The demand for advertising on our television stations or in our newspapers is sensitive to a number of factors, both locally and nationally, including the following:
• | The advertising and marketing spending by our customers can be subject to seasonal and cyclical variations and are likely to be adversely affected during economic downturns. |
• | Television advertising revenues in even-numbered years benefit from political advertising, which are affected by campaign finance laws, as well as the competitiveness of the campaigns in the markets where our television stations operate. |
• | The impact of advertiser consolidation and contraction in our local markets. The majority of the broadcast and print advertising is sold to local businesses in our markets. Continued consolidation and contraction of local advertisers could adversely impact our operating results. |
• | The size and demographics of the audience reached by advertisers through our media businesses. Continued declines in our newspaper circulation could have an effect on the rate and volume of advertising, which are dependent on the size and demographics of the audience we provide to our advertisers. Television audiences have also fragmented in recent years as the broad distribution of cable and satellite television has greatly increased the options available to the viewing public. Continued fragmentation of television audiences could adversely impact the rates we obtain for advertising. |
• | Our television stations have significant exposure to automotive advertising. Advertising revenue from the automotive category represented approximately 22% and 26% of our total advertising revenue in our television segment for 2014 and 2013, respectively. |
If we are unable to respond to any or all of these factors, our advertising revenues could decline and affect our profitability.
Our local media businesses operate in a changing and increasingly competitive environment. We must continually invest in new business initiatives and modify strategies to maintain our competitive position. Investment in new business strategies and initiatives could disrupt our ongoing business and present risks not originally contemplated.
The profile of our newspaper and television audience has shifted dramatically in recent years as readers and viewers access news and other content online or through mobile devices and as they spend more discretionary time with social media. While slow and steady declines in audiences have been somewhat offset by growing viewership on digital platforms, digital advertising rates are typically much lower than print and broadcast advertising rates on a cost-per-thousand basis. This audience shift results in lower profit margins. To remain competitive we must adjust business strategies and invest in new business initiatives, particularly within digital media. Development of new products and services may require significant costs. The success of these initiatives depends on a number of factors, including timely development and market acceptance. Investments we make in new strategies and initiatives may not perform as expected.
Programmatic advertising models that allow advertisers to buy audiences at scale or through automated processes may begin to play a more significant role in the local television advertising marketplace, causing downward pricing pressure and resulting in a loss of revenue that could materially adversely affect broadcast operations.
Several national advertising agencies are now looking at an automated process known as “programmatic buying” to reduce costs related to buying local TV spot advertising. Growth in advertising revenues will rely in part on the ability to maintain and expand relationships with existing and future advertisers. The implementation of a programmatic model, where automation replaces existing pricing and allocation methods, could turn local advertising inventory into a price-driven commodity, reducing the value of these relationships and related revenues. Scripps cannot predict the pace at which programmatic buying will be adopted or utilized in the broadcast industry. Widespread adoption causing downward pricing pressure could result in a loss of revenue and materially adversely affect future broadcast operations.
14
Our print newspaper business is in secular decline. Our profitability may be adversely affected if we are unsuccessful in creating other revenue opportunities or in aligning costs with declining revenues.
In recent years, the advertising industry generally has experienced a secular shift toward digital advertising and away from other traditional media. In addition, the Company’s newspaper circulation has declined, reflecting general trends in the newspaper industry, including consumer migration toward the Internet and other media for news and information. The Company faces increasing competition from other digital sources for both advertising and subscription revenues. This competition has intensified as a result of the continued development of digital media technologies. Distribution of news, entertainment and other information over the Internet, as well as through smartphones, tablets and other devices, continues to increase in popularity. These technological developments are increasing the number of media choices available to advertisers and audiences. As media audiences fragment, the Company expects advertisers to continue to allocate larger portions of their advertising budgets to digital media.
In response to the ongoing secular changes, we must continually monitor and align our cost structure to the declining revenues. The alignment of our costs includes measures such as reduction in force initiatives, standardization and centralization of systems and processes, outsourcing of certain financial processes and the implementation of new software for our circulation, advertising and editorial systems.
If we are unsuccessful in creating other revenue opportunities or aligning our costs with declining revenues, our profitability could be affected.
A significant portion of our operating cost for the newspaper segment is newsprint, so an increase in price or reduction in supplies may adversely affect our operating results.
Newsprint is a significant component of the operating cost of our newspaper operations, comprising 9% of newspaper costs in 2014. The price of newsprint has historically been volatile, and increases in the price of newsprint could materially reduce our operating results. In addition, the continued reduction in the capacity of newsprint producers increases the risk that supplies of newsprint could be limited in the future.
The loss of affiliation agreements could adversely affect our television stations’ operating results.
Eleven of our stations have affiliations with the ABC television network and three have affiliations with the NBC television network. These television networks produce and distribute programming in exchange for each of our stations’ commitment to air the programming at specified times and for commercial announcement time during the programming. These television networks produce and distribute programming which Scripps’ stations commit to air at specified times. Networks sell commercial announcement time during the programming, and require stations to pay fees on the right to carry programming. These fees may be a percentage of retransmission revenues that the stations receive (see below) or may be fixed amounts. There is no assurance that Scripps will be able to reach agreements with networks about the amount of these fees.
The non-renewal or termination of our network affiliation agreements would prevent us from being able to carry programming of the relevant network. Loss of network affiliation would require us to obtain replacement programming, which may involve higher costs and may not be as attractive to its target audiences, resulting in lower advertising revenues. In addition, loss of network affiliation would result in materially lower retransmission revenue, particularly in the case of the "Big 4" networks, such as our affiliations with ABC and NBC.
Our retransmission consent revenue may be adversely affected by renewals of retransmission consent agreements and network affiliation agreements, by consolidation of cable or satellite television systems, or by new technologies for the distribution of broadcast programming.
As our retransmission consent agreements expire, there can be no assurance that we will be able to renew them at comparable or better rates. As a result, retransmission revenues could decrease and retransmission revenue growth could decline over time. Major networks that we are affiliated with currently require us to share our retransmission revenue with them. There can be no assurance that these networks will not require an increase in their share of this revenue as a condition to the renewal of our affiliation agreements. If an MVPD in our markets acquires additional distribution systems, our retransmission revenue could be adversely affected if our retransmission agreement with the acquiring MVPD has lower rates or a longer term than our retransmission agreement with the MVPD whose systems are being sold.
The use of new technologies to redistribute broadcast programming, such as those that rely upon the Internet to deliver video programming or those that receive and record broadcast signals over the air via an antenna and then retransmit that information digitally to customers’ computer or mobile devices, could adversely affect Scripps’ retransmission revenue if such
15
technologies are not found to be subject to copyright law restrictions or to regulations that apply to MVPDs such as cable operators or satellite carriers.
Changes in the Communications Act of 1934, as amended (the “Communications Act”), or the FCC’s rules with respect to the negotiation of retransmission consent agreements between broadcasters and MVPDs could also adversely impact Scripps’ ability to negotiate acceptable retransmission consent agreements. In addition, continued consolidation among cable television operators could adversely impact Scripps’ ability to negotiate acceptable retransmission consent agreements. In February 2014, Comcast Corporation, the largest cable television operator, announced that it was acquiring Time Warner Cable, Inc., which is the second largest cable television operator. In May 2014, AT&T announced that it was acquiring DIRECTV, the largest direct-to-home satellite provider. Both transactions remain subject to regulatory approvals of the Department of Justice and the FCC.
There are proceedings before the FCC and legislation has been proposed in Congress reexamining policies that now protect television stations' rights to control the distribution of their programming within their local service areas. For example, in a dispute that does not directly involve broadcasting, the FCC's Media Bureau is seeking comment on the degree to which an entity relying upon the Internet to deliver video programming should be subject to the regulations that apply to MVPDs. Should the FCC determine that Internet-based distributors may avoid its MVPD rules, broadcasters' ability to rely on the protection of the MVPD retransmission consent requirements could be jeopardized. Scripps cannot predict the outcome of these and other proceedings that address the use of new technologies to challenge traditional means of redistributing broadcast programming or their possible impact on Scripps’ operations.
Our television stations are subject to government regulations which, if revised, could adversely affect our operating results.
• | Pursuant to FCC rules, local television stations must elect every three years to either (1) require cable operators and/or direct broadcast satellite carriers to carry the stations’ over the air signals or (2) enter into retransmission consent negotiations for carriage. At present, all of our stations have retransmission consent agreements with cable operators and satellite carriers. If our retransmission consent agreements are terminated or not renewed, or if our broadcast signals are distributed on less-favorable terms than our competitors, our ability to compete effectively may be adversely affected. |
• | If we cannot renew our FCC broadcast licenses, our broadcast operations will be impaired. Our television business depends upon maintaining our broadcast licenses from the FCC, which has the authority to revoke licenses, not renew them, or renew them only with significant qualifications, including renewals for less than a full term. We cannot assure that future renewal applications will be approved, or that the renewals will not include conditions or qualifications that could adversely affect our operations. If the FCC fails to renew any of our licenses, it could prevent us from operating the affected stations. If the FCC renews a license with substantial conditions or modifications (including renewing the license for a term of fewer than eight years), it could have a material adverse effect on the affected station’s revenue-generation potential. |
• | The FCC is developing standards to accomplish the repurposing of a substantial amount of the spectrum now allocated to broadcast television through a novel “incentive auction” process. Television licensees are being encouraged to voluntarily relinquish their licensed spectrum in return for a share of the auction’s proceeds, and the broadcast spectrum that remains post-auction will be “repacked” in order to permit efficient use of the repurposed spectrum by the wireless industry buyers. Broadcasters are concerned that the FCC is not adequately adhering to Congress’ direction that those television licensees who choose to retain their spectrum should not be affected adversely. If the FCC’s auction processes do not adequately protect stations’ service areas from interference or do not provide adequate time and compensation to broadcasters for what is expected to be a major post-auction rearrangement of the broadcast spectrum, this could have a material adverse effect on the affected stations and on the Company. |
• | The FCC and other government agencies are considering various proposals intended to promote consumer interests, including proposals to encourage locally-focused television programming and to restrict certain types of advertising to children. New government regulations affecting the television industry could raise programming costs, restrict broadcasters’ operating flexibility, reduce advertising revenues, raise the costs of delivering broadcast signals, or otherwise affect our operating results. We cannot predict the nature or scope of future government regulation or its impact on our operations. |
• | There are proceedings before the FCC and the courts reexamining policies that now protect television stations' rights to control the distribution of their programming within their local service areas. For example, the FCC has initiated a rulemaking proceeding on the degree to which an entity relying upon the Internet to deliver video |
16
programming should be subject to the regulations that apply to multi-channel video programming distributors (“MVPDs”) such as cable operators and satellite systems. This proceeding raises a variety of issues, including whether Internet-based video distributors might be able to take advantage of MVPDs' statutory copyright licensing rights. Other ongoing copyright disputes involve, for example, the legality of digital recorders that can automatically remove commercials from broadcast programming during playback. We cannot predict the outcome of these and other proceedings that address the use of new technologies to challenge traditional means of redistributing broadcast programming or their possible impact on the Company.
Sustained increases in costs of employee health and welfare plans and funding requirements of our pension obligations may reduce the cash available for our business.
Employee compensation and benefits account for approximately 50% of our total operating expenses. In recent years, we have experienced significant increases in employee benefit costs. Various factors may continue to put upward pressure on the cost of providing medical benefits. Although we have actively sought to control increases in these costs, there can be no assurance that we will succeed in limiting cost increases, and continued upward pressure could reduce the profitability of our businesses.
The projected benefit obligations of our pension plans exceed plan assets by $141 million at December 31, 2014. In 2009, we froze the accrual of service credits under our defined benefit pension plans that cover a majority of our employees, including our Supplemental Executive Retirement Plan ("SERP"). Our pension plans invest in a variety of equity and debt securities, many of which were affected by the disruption in the credit and capital markets in 2008 and 2009. Future volatility and disruption in the stock and bond markets could cause further declines in the asset values of our pension plans. In addition, a decrease in the discount rate used to determine minimum funding requirements could result in increased future contributions. If either occurs, we may need to make additional pension contributions above what is currently estimated, which could reduce the cash available for our businesses.
We may be unable to effectively integrate any new business we acquire.
We may make future acquisitions and could face integration challenges and acquired businesses could significantly under-perform relative to our expectations. If acquisitions are not successfully integrated, our revenues and profitability could be adversely affected and impairment charges may result if acquired businesses significantly under-perform relative to our expectations.
Scripps faces cybersecurity and similar risks, which could result in the disclosure of confidential information, disruption of its operations, damage to its brands and reputation, legal exposure and financial losses.
Security breaches, computer malware or other “cyber attacks” could harm Scripps’ business by disrupting its delivery of services, jeopardizing Scripps’ confidential information and that of its vendors and clients, and damaging its reputation. Scripps’ operations are expected to routinely involve receiving, storing, processing and transmitting sensitive information. Although Scripps monitors its security measures regularly and believes it is not in a key target industry, any unauthorized intrusion, malicious software infiltration, theft of data, network disruption, denial of service, or similar act by any party could disrupt the integrity, continuity, and security of Scripps’ systems or the systems of its clients or vendors. These events could create financial liability, regulatory sanction, or a loss of confidence in our ability to protect information, and adversely affect our revenue by causing the loss of current or potential clients.
Ownership of our Common Voting shares could inhibit potential changes of control.
Certain descendants of Edward W. Scripps own approximately 93% of our Common Voting shares and are signatories to the Scripps Family Agreement, which governs the transfer and voting of Common Voting shares held by them.
As a result of the foregoing, these descendants have the ability to elect two-thirds of the Board of Directors and to direct the outcome of any matter on which Ohio law does not require a vote of the Class A Common shares. Because this concentrated control could discourage others from initiating any potential merger, takeover or other change of control transaction, the market price of our Class A Common shares could be adversely affected.
17
Item 1B. | Unresolved Staff Comments |
None.
Item 2. | Properties |
We own substantially all of the facilities and equipment used by our television stations. We own, or co-own with other broadcast television stations, the towers used to transmit our television signals.
We own substantially all of the facilities and equipment used in our newspaper operations.
Item 3. | Legal Proceedings |
We are involved in litigation arising in the ordinary course of business, such as defamation actions, and governmental proceedings primarily relating to renewal of broadcast licenses, none of which is expected to result in material loss.
Members of the Board of Directors of Journal Communications, Inc. ("Journal"), and the parties to the Master Transaction Agreement, including Journal and Scripps, were defendants in a class action lawsuit filed in Circuit Court, Milwaukee County, Wisconsin (Howard Goldfinger v. Journal Communications, Inc., et al.). The plaintiff in the lawsuit alleged that the directors of Journal breached their fiduciary duties to Journal shareholders in connection with the Journal Transactions and that the other parties to the lawsuit aided and abetted such alleged breaches of fiduciary duty. The plaintiff alleged that the directors of Journal breached their fiduciary duties by, among other things, (i) agreeing to enter into the Master Transaction Agreement for inadequate consideration, (ii) having certain conflicts of interest, (iii) not negotiating a “collar” mechanism on the share exchange ratio, and (iv) agreeing to certain deal protection provisions, such as a termination fee, a “no-shop” provision, and a “matching rights” provision. The plaintiff also challenged the qualifications of Journal's financial advisor, Methuselah Advisors LLC ("Methuselah"), and asserted that Methuselah has a conflict because the founder and managing partner of Methuselah, who is the lead investment banker at Methuselah for Journal in the Journal Transactions, was employed by Lazard Fréres & Co. LLC (“Lazard”) prior to 2010 as a managing director, where he had responsibility for Lazard’s relationship with Scripps. On August 29, 2014, the defendants filed Motions to Dismiss asking the Circuit Court to dismiss the lawsuit. On November 12, 2014, the Circuit Court entered an Order granting the defendants’ Motions to Dismiss and dismissing the lawsuit.
On January 6, 2015, the plaintiff in the above-referenced lawsuit filed a putative class action lawsuit in the United States District Court for the Eastern District of Wisconsin (Howard Goldfinger v. Journal Communications, Inc., et al. (Case No. 2:15-cv-00012-JPS)), naming Journal, the Board of Directors of Journal, Scripps, and the other parties to the Master Transaction Agreement as defendants. The plaintiff asserts disclosure claims under Sections 14(a) and 20(a) of the Securities Exchange Act of 1934, as well as state common law claims for breaches of fiduciary duty and aiding and abetting breaches of fiduciary duty. The complaint seeks, among other remedies, injunctive relief enjoining the Journal Transactions and damages. The outcome of this lawsuit is uncertain. An adverse judgment for monetary damages could have an adverse effect on the operations and liquidity of Journal and Scripps. A preliminary injunction could delay or jeopardize the completion of the Journal Transactions, and an adverse judgment granting permanent injunctive relief could indefinitely enjoin completion of the Journal Transactions. Journal, Scripps, and the other defendants named in the lawsuit believe the claims asserted are without merit and intend to continue to vigorously defend against them.
Item 4. | Mine Safety Disclosures |
None.
18
Executive Officers of the Company — Executive officers serve at the pleasure of the Board of Directors.
Name | Age | Position | |||
Richard A. Boehne | 58 | President, Chief Executive Officer and Director (since July 2008); Executive Vice President (1999 to 2008) and Chief Operating Officer (2006 to 2008) | |||
Timothy M. Wesolowski | 57 | Senior Vice President, Chief Financial Officer & Treasurer (since August 2011); Senior Vice President Finance - Call Center Division, Convergys Corporation (2010 to 2011); Senior Vice President Finance/Controller, Convergys Corporation (2006 to 2009) | |||
William Appleton | 66 | Senior Vice President and General Counsel (since July 2008); Managing Partner Cincinnati office, Baker & Hostetler, LLP (2003 to 2008) | |||
Timothy E. Stautberg | 52 | Senior Vice President/Newspapers (since August 2011); Senior Vice President and Chief Financial Officer (July 2008 to August 2011); Vice President/Corporate Communications and Investor Relations (1999-2008) | |||
Lisa A. Knutson | 49 | Senior Vice President/Chief Administrative Officer (since September 2011); Senior Vice President/Human Resources (2008 to 2011) | |||
Brian G. Lawlor | 48 | Senior Vice President/Television (since January 2009); Vice President/General Manager of WPTV (2004 to 2008) | |||
Adam Symson | 40 | Senior Vice President/Digital (since February 2013); Chief Digital Officer (2011 to February 2013); Vice President Interactive Media/Television (2007 to 2011) | |||
Douglas F. Lyons | 58 | Vice President/Controller (since July 2008); Vice President Finance/Administration (2006 to 2008), Director Financial Reporting (1997 to 2006) | |||
19
PART II
Item 5. | Market for Registrant’s Common Equity, Related Stockholder Matters and Issuer Purchases of Equity Securities |
Our Class A Common shares are traded on the New York Stock Exchange (“NYSE”) under the symbol “SSP.” As of December 31, 2014, there were approximately 9,000 owners of our Class A Common shares, based on security position listings, and 70 owners of our Common Voting shares (which do not have a public market). We did not pay any cash dividends in 2014 or 2013.
The range of market prices of our Class A Common shares, which represents the high and low sales prices for each full quarterly period, are as follows:
Quarter | |||||||||||||||
1st | 2nd | 3rd | 4th | ||||||||||||
2014 | |||||||||||||||
Market price of common stock: | |||||||||||||||
High | $ | 21.40 | $ | 21.16 | $ | 21.76 | $ | 23.34 | |||||||
Low | 16.17 | 16.06 | 16.31 | 15.22 | |||||||||||
2013 | |||||||||||||||
Market price of common stock: | |||||||||||||||
High | $ | 12.04 | $ | 15.73 | $ | 18.35 | $ | 21.78 | |||||||
Low | 10.37 | 11.82 | 14.44 | 17.45 | |||||||||||
There were no sales of unregistered equity securities during the quarter for which this report is filed.
In November 2012, our Board of Directors authorized the repurchase of up to $100 million of our Class A Common shares through December 2014. We repurchased a total of $95 million of shares under this authorization through December 31, 2014. No additional shares may be repurchased pursuant to this authorization.
In May 2014, our Board of Directors authorized a new repurchase program of up to $100 million of our Class A Common shares through December 2016. No shares have been repurchased under this program as of December 31, 2014.
Under the terms of the Master Transaction Agreement with Journal Communications, Inc., we are precluded from repurchasing shares prior to the closing of the Journal Transactions.
20
Performance Graph — Set forth below is a line graph comparing the cumulative return on the Company’s Class A Common shares, assuming an initial investment of $100 as of December 31, 2009, and based on the market prices at the end of each year and assuming dividend reinvestment, with the cumulative return of the Standard & Poor’s Composite-500 Stock Index and an Index based on a peer group of media companies.
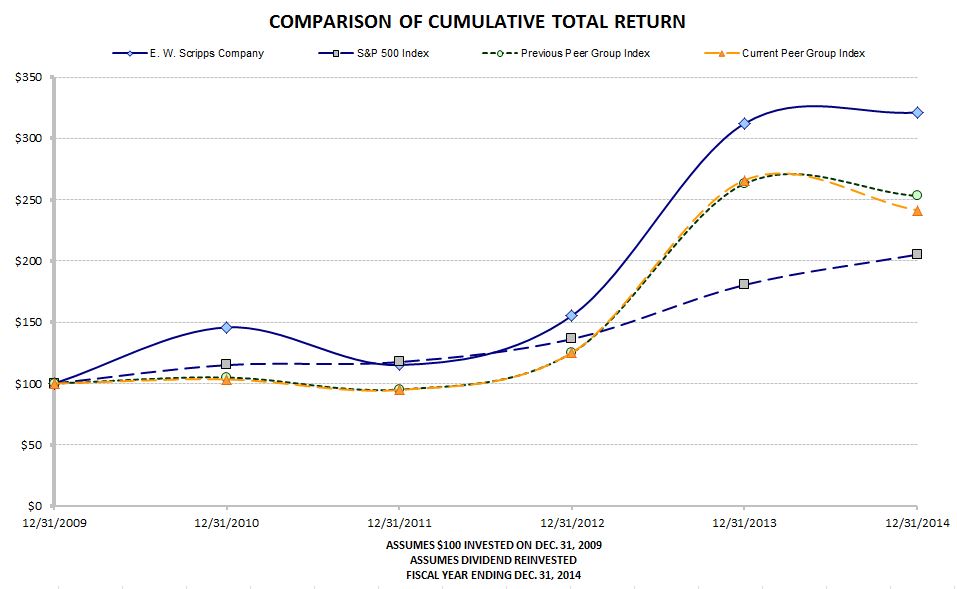
12/31/2009 | 12/31/2010 | 12/31/2011 | 12/31/2012 | 12/31/2013 | 12/31/2014 | ||||||||||||||||||
E.W. Scripps Company | $ | 100.00 | $ | 145.83 | $ | 115.09 | $ | 155.32 | $ | 312.07 | $ | 321.12 | |||||||||||
S&P 500 Index | $ | 100.00 | $ | 115.06 | $ | 117.49 | $ | 136.30 | $ | 180.44 | $ | 205.14 | |||||||||||
Current Peer Group Index | $ | 100.00 | $ | 103.42 | $ | 94.74 | $ | 125.22 | $ | 265.86 | $ | 241.44 | |||||||||||
Previous Peer Group Index | $ | 100.00 | $ | 105.03 | $ | 95.16 | $ | 125.06 | $ | 263.02 | $ | 253.03 | |||||||||||
We continually evaluate and revise our Peer Group Index as necessary so that it is reflective of our Company’s portfolio of businesses. The companies that comprise our current peer group are Gannett Company, Gray Television, Inc., LIN Television Corporation, McClatchy Company, Media General, New York Times Company, Nexstar Broadcasting Group, Sinclair Broadcast Group, Tribune Media and Tribune Publishing. Our peer group was revised in 2014 to include Tribune Media and Tribune Publishing in place of A.H. Belo and Journal Communications, Inc. The Peer Group Index is weighted based on market capitalization.
21
Item 6. | Selected Financial Data |
The Selected Financial Data required by this item is filed as part of this Form 10-K. See Index to Consolidated Financial Statement Information at page F-1 of this Form 10-K.
Item 7. | Management’s Discussion and Analysis of Financial Condition and Results of Operations |
Management’s Discussion and Analysis of Financial Condition and Results of Operations required by this item is filed as part of this Form 10-K. See Index to Consolidated Financial Statement Information at page F-1 of this Form 10-K.
Item 7A. | Quantitative and Qualitative Disclosures About Market Risk |
The market risk information required by this item is filed as part of this Form 10-K. See Index to Consolidated Financial Statement Information at page F-1 of this Form 10-K.
Item 8. | Financial Statements and Supplementary Data |
The Financial Statements and Supplementary Data required by this item are filed as part of this Form 10-K. See Index to Consolidated Financial Statement Information at page F-1 of this Form 10-K.
Item 9. | Changes in and Disagreements With Accountants on Accounting and Financial Disclosure |
None.
Item 9A. | Controls and Procedures |
The Controls and Procedures required by this item are filed as part of this Form 10-K. See Index to Consolidated Financial Statement Information at page F-1 of this Form 10-K.
Item 9B. | Other Information |
None.
22
PART III
Item 10. | Directors, Executive Officers and Corporate Governance |
Information regarding executive officers is included in Part I of this Form 10-K as permitted by General Instruction G(3).
Information required by Item 10 of Form 10-K relating to directors is incorporated by reference to the material captioned “Election of Directors” in our definitive proxy statement for the Annual Meeting of Shareholders (“Proxy Statement”). Information regarding Section 16(a) compliance is incorporated by reference to the material captioned “Report on Section
16(a) Beneficial Ownership Compliance” in the Proxy Statement.
We have adopted a code of conduct that applies to all employees, officers and directors of Scripps. We also have a code of ethics for the CEO and Senior Financial Officers that meets the requirements of Item 406 of Regulation S-K and the NYSE listing standards. Copies of our codes of ethics are posted on our website at http://www.scripps.com.
Information regarding our audit committee financial expert is incorporated by reference to the material captioned “Corporate Governance” in the Proxy Statement.
The Proxy Statement will be filed with the Securities and Exchange Commission in connection with our 2015 Annual Meeting of Shareholders.
Item 11. | Executive Compensation |
The information required by Item 11 of Form 10-K is incorporated by reference to the material captioned “Compensation Discussion and Analysis” and “Compensation Tables” in the Proxy Statement.
Item 12. | Security Ownership of Certain Beneficial Owners and Management and Related Stockholder Matters |
The information required by Item 12 of Form 10-K is incorporated by reference to the material captioned “Report on the Security Ownership of Certain Beneficial Owners,” “Report on the Security Ownership of Management,” and “Equity Compensation Plan Information” in the Proxy Statement.
Item 13. | Certain Relationships and Related Transactions, and Director Independence |
The information required by Item 13 of Form 10-K is incorporated by reference to the materials captioned “Corporate Governance” and “Report on Related Party Transactions” in the Proxy Statement.
Item 14. | Principal Accounting Fees and Services |
The information required by Item 14 of Form 10-K is incorporated by reference to the material captioned “Report of the Audit Committee of the Board of Directors” in the Proxy Statement.
23
PART IV
Item 15. | Exhibits and Financial Statement Schedules | |
Documents filed as part of this report:
(a) | The consolidated financial statements of The E. W. Scripps Company are filed as part of this Form 10-K. See Index to Consolidated Financial Statement Information at page F-1. |
The reports of Deloitte & Touche LLP, an Independent Registered Public Accounting Firm, dated March 13, 2015, are filed as part of this Form 10-K. See Index to Consolidated Financial Statement Information at page F-1.
(b) | There are no supplemental schedules that are required to be filed as part of this Form 10-K. |
(c) | An exhibit index required by this item appears at page S-2 of this Form 10-K. |
24
Signatures
Pursuant to the requirements of Section 13 or 15(d) of the Securities Exchange Act of 1934, the registrant has duly caused this report to be signed on its behalf by the undersigned, thereunto duly authorized.
THE E. W. SCRIPPS COMPANY | ||
Dated: March 13, 2015 | By: | /s/ Richard A. Boehne |
Richard A. Boehne | ||
President and Chief Executive Officer | ||
Pursuant to the requirements of the Securities Exchange Act of 1934, this report has been signed below by the following persons on behalf of the registrant in the capacities indicated, on March 13, 2015.
Signature | Title | |
/s/ Richard A. Boehne | Chairman of the Board of Directors, President, Chief Executive Officer | |
Richard A. Boehne | (Principal Executive Officer) | |
/s/ Timothy M. Wesolowski | Senior Vice President, Chief Financial Officer & Treasurer | |
Timothy M. Wesolowski | ||
/s/ Douglas F. Lyons | Vice President and Controller | |
Douglas F. Lyons | (Principal Accounting Officer) | |
/s/ Kelly P. Conlin | Director | |
Kelly P. Conlin | ||
/s/ John W. Hayden | Director | |
John W. Hayden | ||
/s/ Anne M. La Dow | Director | |
Anne M. La Dow | ||
/s/ Roger L. Ogden | Director | |
Roger L. Ogden | ||
/s/ Mary Peirce | Director | |
Mary Peirce | ||
/s/ J. Marvin Quin | Director | |
J. Marvin Quin | ||
/s/ Paul K. Scripps | Director | |
Paul K. Scripps | ||
/s/ Kim Williams | Director | |
Kim Williams | ||
25
The E. W. Scripps Company
Index to Consolidated Financial Statement Information
Item No. | Page | ||
F-1
Selected Financial Data
Five-Year Financial Highlights
For the years ended December 31, | ||||||||||||||||||||
(in millions, except per share data) | 2014 (1) | 2013 (1) | 2012 (1) | 2011 (1) | 2010 (1) | |||||||||||||||
Summary of Operations (2) | ||||||||||||||||||||
Total operating revenues | $ | 869 | $ | 817 | $ | 903 | $ | 729 | $ | 777 | ||||||||||
Income (loss) before income taxes | 12 | (9 | ) | 57 | (26 | ) | 30 | |||||||||||||
Net income (loss) | 10 | (1 | ) | 40 | (16 | ) | 29 | |||||||||||||
Depreciation and amortization of intangibles | (49 | ) | (48 | ) | (49 | ) | (40 | ) | (45 | ) | ||||||||||
Per Share Data | ||||||||||||||||||||
Income (loss) from continuing operations - diluted | $ | 0.18 | $ | (0.01 | ) | $ | 0.69 | $ | (0.27 | ) | $ | 0.45 | ||||||||
Cash dividends | $ | — | $ | — | $ | — | $ | — | $ | — | ||||||||||
Market Value of Common Shares at December 31 | ||||||||||||||||||||
Per share | $ | 22.35 | $ | 21.72 | $ | 10.81 | $ | 8.01 | $ | 10.15 | ||||||||||
Total | 1,274 | 1,217 | 600 | 435 | 592 | |||||||||||||||
Balance Sheet Data | ||||||||||||||||||||
Total assets | $ | 1,033 | $ | 966 | $ | 1,031 | $ | 971 | $ | 828 | ||||||||||
Long-term debt (including current portion) | 198 | 200 | 196 | 212 | — | |||||||||||||||
Equity | 520 | 548 | 540 | 517 | 592 | |||||||||||||||
Notes to Selected Financial Data
As used herein and in Management’s Discussion and Analysis of Financial Condition and Results of Operations, the terms “Scripps,” “Company,” “we,” “our,” or “us” may, depending on the context, refer to The E. W. Scripps Company, to one or more of its consolidated subsidiary companies, or to all of them taken as a whole.
The statement of operations and cash flow data for the five years ended December 31, 2014, and the balance sheet data as of the same dates have been derived from our audited consolidated financial statements. All per-share amounts are presented on a diluted basis. The five-year financial data should be read in conjunction with “Management’s Discussion and Analysis of Financial Condition and Results of Operations” and the consolidated financial statements and notes thereto included elsewhere herein.
(1) | 2014 — On January 1, 2014, we acquired Media Convergence Group, Inc., which operates as Newsy. On June 16, 2014, we acquired two television stations owned by Granite Broadcasting Corporation. Operating results for each are included for periods after the acquisitions. | |
2011 — On December 30, 2011, we acquired the television station group owned by McGraw-Hill Broadcasting, Inc. Operating results are included for periods after the acquisition. | ||
(2) | The five-year summary of operations excludes the operating results of the following entities and the gains (losses) on their divestiture as they are accounted for as discontinued operations: | |
2010 — Completed the sale of United Feature Syndicate, Inc. character licensing business for $175 million in cash. We recorded a $162 million pre-tax gain which is included in discontinued operations. | ||
F-2
Management’s Discussion and Analysis of Financial Condition and Results of Operations
The consolidated financial statements and notes to consolidated financial statements are the basis for our discussion and analysis of financial condition and results of operations. You should read this discussion in conjunction with those financial statements.
Forward-Looking Statements
Certain forward-looking statements related to our businesses are included in this discussion. Those forward-looking statements reflect our current expectations. Forward-looking statements are subject to certain risks, trends and uncertainties that could cause actual results to differ materially from the expectations expressed in the forward-looking statements. Such risks, trends and uncertainties, which in most instances are beyond our control, include changes in advertising demand and other economic conditions; consumers’ tastes; newsprint prices; program costs; labor relations; technological developments; competitive pressures; interest rates; regulatory rulings; and reliance on third-party vendors for various products and services. The words “believe,” “expect,” “anticipate,” “estimate,” “intend” and similar expressions identify forward-looking statements. You should evaluate our forward-looking statements, which are as of the date of this filing, with the understanding of their inherent uncertainty. We undertake no obligation to update any forward-looking statements to reflect events or circumstances after the date the statement is made.
Executive Overview
The E. W. Scripps Company is a diverse media enterprise with interests in television stations, newspapers and local and national digital media sites. We serve audiences and businesses through a growing portfolio of television, print and digital media brands. We own 21 local television stations, as well as daily newspapers in 13 markets across the United States. We also run an expanding collection of local and national digital journalism and information businesses including digital video news service Newsy and weather app developer WeatherSphere. We also produce television programming, run an award-winning investigative reporting newsroom in Washington, D.C., and serve as the longtime steward of the nation's largest, most successful and longest-running educational program, the Scripps National Spelling Bee.
In 2014, we focused on our broadcast and digital operations. On July 30, 2014, our Board of Directors approved an agreement under which Scripps would acquire the broadcast business of Journal Communications, Inc. ("Journal") and each would spin-off their newspaper businesses into a separate publicly traded company (the “Journal Transactions”). The newspaper company will be named Journal Media Group, combining the 13 Scripps newspapers with Journal's Milwaukee Journal Sentinel. After the completion of the transaction, Scripps will be the fifth-largest independent television operator in the U.S. with 33 stations in 24 markets, as well as owning 34 radio stations in eight markets.
In June 2014, we completed our acquisition of two television stations from Granite Broadcasting Corporation for $110 million in cash. The acquisition includes the Detroit MyNetworkTV affiliate and the Buffalo, N.Y., ABC affiliate. The acquisition of the Detroit station creates a duopoly with our ABC affiliate WXYZ-TV.
We continue with our strategies of improving our ratings in key news blocks. In the November 2014 rating period, eight stations finished first or second in key adult demographics in at least one of the major local news time periods (6 a.m., 6 p.m. or late news). Twelve of our 14 major network-affiliated stations improved their percentage of local news viewing in at least one of these time periods over the same time in November 2013. Five stations improved their market rank in at least one newscast in November 2014. In 2014, our Tampa television station was awarded a national Alfred I. DuPont-Columbia Award and our Cincinnati and Tulsa television stations won national Edward R. Murrow awards.
We continue our programming strategy, lessening our reliance on purchased syndicated shows. We have two original shows — a game show called Let's Ask America and a nightly infotainment magazine called The List — with one or both being aired during the access period between evening news and prime time in 12 of our markets. We are also a partner in another original show called RightThisMinute, a daily news and entertainment program, that airs on 15 of our stations and reaches more than 90% of the country through syndication. We launched our fourth original show, The Now, in eight of our markets in the third quarter of 2014. The Now is a news show designed for a 4 p.m. audience and takes a deeper dive into the day's events.
We continued our investment in digital with the January 2014 acquisition of digital video news provider Media Convergence Group, Inc., which operates as Newsy, for $35 million in cash. This acquisition fits our digital strategy to run a national news brand that both enhances our local content offerings and gives us more access to the fast-growing digital news audiences and revenues on national platforms. Newsy adds a new dimension to our video news strategy with a storytelling
F-3
approach, specifically geared toward digital audiences. In 2014, we launched the Newsy video platform on our television station websites and expect to rollout a similar product offering in other markets in 2015.
In September 2014, we continued our digital expansion with our acquisition of Geoterrestrial, Inc. ("WeatherSphere"), a top-selling provider of weather-related mobile apps, for $4 million. The acquisition reinforces our commitment to creating more products and deeper connections with digital consumers around news and information. WeatherSphere's brands include top-rated weather and lifestyle apps available for sale for most smartphones. The WeatherSphere portfolio will expand our national digital footprint and complement StormShield, our existing paid weather app, which provides emergency alerts to consumers through their smartphones and tablets. We are building our inventory of digital assets that generate revenue as stand-alone apps and also serve as a vehicle for our television and newspaper markets to strengthen consumer connections across traditional and digital media platforms.
In our newspaper division, we saw the launch late in the first quarter of 2013 of our bundled-subscription model in our Memphis and Treasure Coast markets. By the end of the third quarter of 2013, all of our newspaper markets had rolled out this model. Under our bundled model, subscribers receive access to all our newspaper content on all platforms. Only limited digital content is available to non-subscribers. We also offer digital-only subscriptions. As we have cycled against the completion of the launch of our digital bundles, subscription revenue growth has moderated.
Results of Operations
The trends and underlying economic conditions affecting the operating performance and future prospects differ for each of our business segments. Accordingly, you should read the following discussion of our consolidated results of operations in conjunction with the discussion of the operating performance of our business segments that follows.
Consolidated Results of Operations
Consolidated results of operations were as follows:
For the years ended December 31, | ||||||||||||||||||
(in thousands, except per share data) | 2014 | Change | 2013 | Change | 2012 | |||||||||||||
Operating revenues | $ | 869,068 | 6.4 | % | $ | 816,871 | (9.6 | )% | $ | 903,458 | ||||||||
Employee compensation and benefits | (415,595 | ) | 6.2 | % | (391,207 | ) | (1.3 | )% | (396,241 | ) | ||||||||
Programs and program licenses | (55,487 | ) | 3.1 | % | (53,826 | ) | (5.2 | )% | (56,783 | ) | ||||||||
Newsprint, press supplies and other printing costs | (45,362 | ) | (3.4 | )% | (46,965 | ) | (8.4 | )% | (51,266 | ) | ||||||||
Newspaper distribution | (46,948 | ) | (3.2 | )% | (48,490 | ) | (3.7 | )% | (50,379 | ) | ||||||||
Other expenses | (205,755 | ) | 2.3 | % | (201,089 | ) | (0.1 | )% | (201,302 | ) | ||||||||
Defined benefit pension plan expense | (10,000 | ) | 13.2 | % | (8,837 | ) | 2.5 | % | (8,620 | ) | ||||||||
Acquisition and related integration costs | (13,974 | ) | — | (5,826 | ) | |||||||||||||
Restructuring costs | — | (4,893 | ) | (9,335 | ) | |||||||||||||
Depreciation and amortization of intangibles | (49,070 | ) | (47,762 | ) | (49,332 | ) | ||||||||||||
Gains (losses), net on disposal of property, plant and equipment | 2,260 | (166 | ) | (474 | ) | |||||||||||||
Operating income | 29,137 | 13,636 | 73,900 | |||||||||||||||
Interest expense | (8,494 | ) | (10,448 | ) | (12,246 | ) | ||||||||||||
Miscellaneous, net | (8,389 | ) | (11,760 | ) | (4,747 | ) | ||||||||||||
Income (loss) before income taxes | 12,254 | (8,572 | ) | 56,907 | ||||||||||||||
(Provision) benefit for income taxes | (2,032 | ) | 7,848 | (16,985 | ) | |||||||||||||
Net income (loss) | 10,222 | (724 | ) | 39,922 | ||||||||||||||
Net loss attributable to noncontrolling interests | (307 | ) | (250 | ) | (266 | ) | ||||||||||||
Net income (loss) attributable to the shareholders of The E.W. Scripps Company | $ | 10,529 | $ | (474 | ) | $ | 40,188 | |||||||||||
F-4
2014 compared with 2013
The Company completed its acquisition of two Granite television stations on June 16, 2014. The inclusion of operating results from these stations for the period subsequent to the acquisition impacts the comparability of our television division operating results.
Operating revenues increased 6.4% in 2014 compared to 2013 and 4.7% excluding the impact of the Granite acquisition compared to prior year. Television revenues increased 15%, primarily driven by higher political advertising and increased retransmission revenues, while newspaper revenues declined 3.7%. Political advertising was up nearly $53 million on a same-station basis compared to 2013. On a same-station basis, retransmission revenues increased approximately 30% in 2014, primarily due to annual rate increases in long-term contracts and the renewal in the middle of the year of a retransmission agreement with an MVPD providing service to about 15% of the subscribers to such services in our markets. We renewed retransmission agreements with MVPDs providing service to another 15% of subscribers to those services later in the year. These contracts were renewed at market rates, and as a result we expect a substantial increase in 2015 retransmission revenues. Retransmission revenues also could be impacted positively by the proposed Time Warner and Comcast merger and the subsequent transfer of certain Time Warner and Comcast systems as previously announced by Comcast. If the transactions are consummated as proposed, retransmission revenue will increase by about $6 million per quarter. In our newspaper division, advertising and marketing services revenues decreased 7.1% in 2014, primarily as a result of continued secular changes in the demand for print advertising.
Employee compensation and benefits increased 6.2% in 2014. Employee compensation and benefits associated with supporting our digital operations increased approximately $12 million over prior year. The impact of the acquisition of two Granite television stations on employee compensation and benefits was $4.9 million. The television division incurred severance costs primarily as a result of centralizing our master control hub, which accounted for $1.6 million of the increase, and our newspaper division had increased severance costs of $1.1 million. Higher incentive compensation in 2014 accounted for $4.6 million of the increase over 2013.
Programs and program licenses decreased 2.3% on a same-station basis. The decrease is primarily due to reduced costs for syndicated programming, partially offset by an increase in fees we pay under our network affiliation agreements. Syndicated programming costs decreased $6.5 million in 2014 as we replaced more of our syndicated programming with internally produced programming. The decrease in syndicated programming costs was partially offset by a $5.4 million increase in fees we pay under our network affiliation agreements, which require us to pay a portion of retransmission revenues above a threshold to the network. At the end of 2014, we renewed our ABC network affiliation agreements for 10 of our 11 ABC-affiliated stations through 2019. Under the terms of the renewed agreements, we expect to pay a higher portion of our retransmission revenues as fees than we paid prior to the renewal.
Newsprint, press supplies and other printing costs declined by 3.4% in 2014 due to lower expenditures for newsprint. Consumption decreased by 6% and average newsprint prices decreased by1.6%.
Newspaper distribution costs decreased by 3.2% in 2014 compared to 2013 as a result of lower net paid circulation levels. A large portion of our newspaper distribution costs are variable and increase or decrease in relation to our circulation levels.
Other expenses are comprised of the following:
For the years ended December 31, | |||||||||||
(in thousands) | 2014 | Change | 2013 | ||||||||
Facilities rent and maintenance | $ | 41,221 | 6.1 | % | $ | 38,854 | |||||
Purchased news and content | 14,368 | (4.5 | )% | 15,051 | |||||||
Marketing and promotion | 14,022 | (14.2 | )% | 16,338 | |||||||
Miscellaneous costs | 136,144 | 4.0 | % | 130,846 | |||||||
Total other expenses | $ | 205,755 | 2.3 | % | $ | 201,089 | |||||
Other expenses increased $4.7 million in 2014 compared to prior year, most of which was driven by the acquired Granite stations. Marketing and promotion costs in 2013 included costs to support the launch of our bundled subscription offerings in our newspaper markets. The campaign to launch our bundled subscription model was completed in the third quarter of 2013.
F-5
Defined benefit pension plan expense increased to $10 million in 2014 from $8.8 million in 2013. In the second quarter of 2014, unions ratified our plan to withdraw from the Graphics Communication International Union (GCIU) Employer Retirement Fund. Upon ratification of the agreement, we estimated the undiscounted withdrawal liability to be approximately $6.5 million and recorded $4.1 million for the present value of the liability. Once we reach a final agreement with the GCIU, we either will pay the liability in a lump sum or make equal monthly installments over 20 years beginning in 2015.
Acquisition and related integration costs of $14 million for 2014 include costs associated with the acquisition of two television stations from Granite Broadcasting as well as costs for spinning off our newspaper operations and acquiring Journal's broadcast business as contemplated by the Journal Transactions.
Restructuring costs were $4.9 million in 2013 related to costs associated with the implementation of common advertising and circulation systems. In 2014, we were in the final stages of these system implementations and any remaining costs are now included in segment operating results.
In 2014, we recognized a gain of approximately $3 million on the sale of excess land in our newspaper division.
Interest expense decreased in 2014 due to a decline in our borrowing rate when we refinanced our debt in the fourth quarter of 2013.
Miscellaneous expense of $8.4 million in 2014 included a $5.9 million non-cash charge to reduce the carrying value of investments.
The effective income tax rate was 16.6% and 91.6% for 2014 and 2013, respectively. The impact of state and local taxes and non-deductible expenses (including a portion of the transaction costs for the Journal Transactions) has made our effective rate volatile due to relatively small amounts of pretax income or loss in each of the reporting periods. In addition, our effective income tax rates for 2014 and 2013 were impacted by tax settlements and changes in our reserve for uncertain tax positions. In 2014 and 2013, we recognized $6.4 million and $3.1 million, respectively of previously unrecognized tax benefits upon settlement of tax audits or upon the lapse of the statutes of limitations in certain jurisdictions.
2013 compared with 2012
Operating revenues decreased 9.6% in 2013 compared to 2012. The expected decline in political advertising in an off-political year and continued secular declines in print advertising led to the decline. Political advertising revenues decreased $102 million in 2013. Newspaper revenues decreased 3.7%, or $14.6 million, in 2013. These declines were partially offset by a 38% increase, or $11.6 million, in retransmission revenues for 2013 and a $2.1 million increase in digital marketing services.
Employee compensation and benefits decreased approximately 1% in 2013. Newspaper division employees decreased by approximately 130, or 5%, from 2012. Incentive compensation in 2013 was $11.3 million less than the prior year, due to lower operating results. Employee compensation and benefits associated with supporting our digital initiatives increased year-to-date costs by approximately $10.2 million.
Programs and program licenses decreased by 5.2% in 2013 primarily due to reduced costs for syndicated programming. Syndicated programming costs decreased $5.7 million in 2013. In the third quarter of 2012, we replaced some of the syndicated programming that seven of our stations air in the access period between evening news and prime time with programming we produce internally or in partnership with others. In the third quarter of 2013, we replaced syndicated programming on one additional station during the access period. The decrease in syndicated programming costs was partially offset by a $2.9 million increase in fees we pay under our network affiliation agreements, which require us to pay a portion of retransmission revenues above a threshold to the network.
Newsprint, press supplies and other printing costs declined by 8.4% in 2013 due to lower expenditures for newsprint. Average newsprint prices decreased 7% and newsprint consumption decreased approximately 5% for 2013.
Newspaper distribution costs decreased by 3.7% in 2013 compared to 2012 as a result of lower net paid circulation levels. A large portion of our newspaper distribution costs are variable and increase or decrease in relation to our circulation levels.
F-6
Other expenses are comprised of the following:
For the years ended December 31, | |||||||||||
(in thousands) | 2013 | Change | 2012 | ||||||||
Facilities rent and maintenance | $ | 38,854 | (8.5 | )% | $ | 42,442 | |||||
Purchased news and content | 15,051 | (7.9 | )% | 16,340 | |||||||
Marketing and promotion | 16,338 | 2.6 | % | 15,918 | |||||||
Miscellaneous costs | 130,846 | 3.4 | % | 126,602 | |||||||
Total other expenses | $ | 201,089 | (0.1 | )% | $ | 201,302 | |||||
Facilities rent and maintenance decreased in 2013 due to lower repairs and maintenance costs. Marketing and promotion costs in 2012 included costs to promote the 2012 launch of our two original shows in seven of our television markets. Marketing and promotion costs increased in 2013 primarily due to campaigns to support the launch of our bundled subscription offerings in our newspaper markets. Miscellaneous costs increased primarily from costs to support our digital initiatives.
Acquisition and related integration costs in 2012 include a $5.7 million non-cash charge associated with the cancellation of a contract with the national advertising firm that represented the McGraw-Hill stations that were acquired.
Interest expense decreased in 2013 due to lower average debt levels and a decline in our borrowing rate.
Miscellaneous expense increased in 2013 due to a $3 million non-cash loss on the disposition of a cost basis investment in the fourth quarter of 2013 as well as a $4.6 million non-cash charge to write-off deferred loan fees as a result of the refinancing of our debt.
The effective income tax rate was 91.6% and 29.8% for 2013 and 2012, respectively. The impact of state and local taxes and non-deductible expenses has made our effective rate volatile due to relatively small amounts of pretax income or loss in each of the reporting periods. In addition, our effective income tax rates for 2013 and 2012 were impacted by tax settlements and changes in our reserve for uncertain tax positions. In 2013, we recognized $3.1 million of previously unrecognized tax benefits upon settlement of tax audits or upon the lapse of the statutes of limitations in certain jurisdictions. In 2012, we recognized $5.5 million of previously unrecognized tax benefits upon the lapse of the statutes of limitations in certain jurisdictions.
F-7
Business Segment Results — As discussed in the Notes to Consolidated Financial Statements, our chief operating decision maker evaluates the operating performance of our business segments using a measure called segment profit. Segment profit excludes interest, defined benefit pension plan expense (other than current service costs), income taxes, depreciation and amortization, impairment charges, divested operating units, restructuring activities, investment results and certain other items that are included in net income (loss) determined in accordance with accounting principles generally accepted in the United States of America.
Items excluded from segment profit generally result from decisions made in prior periods or from decisions made by corporate executives rather than the managers of the business segments. Depreciation and amortization charges are the result of decisions made in prior periods regarding the allocation of resources and are therefore excluded from the measure. Generally, our corporate executives make financing, tax structure and divestiture decisions. Excluding these items from measurement of our business segment performance enables us to evaluate business segment operating performance based upon current economic conditions and decisions made by the managers of those business segments in the current period.
Information regarding the operating performance of our business segments and a reconciliation of such information to the consolidated financial statements is as follows:
For the years ended December 31, | ||||||||||||||||||
(in thousands) | 2014 | Change | 2013 | Change | 2012 | |||||||||||||
Segment operating revenues: | ||||||||||||||||||
Television | $ | 486,322 | 15.0 | % | $ | 422,763 | (14.4 | )% | $ | 493,896 | ||||||||
Newspapers | 370,316 | (3.7 | )% | 384,514 | (3.7 | )% | 399,091 | |||||||||||
Syndication and other | 12,430 | 29.6 | % | 9,594 | (8.4 | )% | 10,471 | |||||||||||
Total operating revenues | $ | 869,068 | 6.4 | % | $ | 816,871 | (9.6 | )% | $ | 903,458 | ||||||||
Segment profit (loss): | ||||||||||||||||||
Television | $ | 134,885 | 35.2 | % | $ | 99,790 | (37.6 | )% | $ | 159,917 | ||||||||
Newspapers | 20,783 | (25.7 | )% | 27,965 | 1.3 | % | 27,595 | |||||||||||
Syndication and other | (1,871 | ) | 102 | (347 | ) | |||||||||||||
Shared services and corporate | (53,876 | ) | 2.5 | % | (52,563 | ) | 32.5 | % | (39,678 | ) | ||||||||
Depreciation and amortization of intangibles | (49,070 | ) | (47,762 | ) | (49,332 | ) | ||||||||||||
Gains (losses), net on disposal of property, plant and equipment | 2,260 | (166 | ) | (474 | ) | |||||||||||||
Defined benefit pension plan expense | (10,000 | ) | (8,837 | ) | (8,620 | ) | ||||||||||||
Acquisition and related integration costs | (13,974 | ) | — | (5,826 | ) | |||||||||||||
Restructuring costs | — | (4,893 | ) | (9,335 | ) | |||||||||||||
Interest expense | (8,494 | ) | (10,448 | ) | (12,246 | ) | ||||||||||||
Miscellaneous, net | (8,389 | ) | (11,760 | ) | (4,747 | ) | ||||||||||||
Income (loss) before income taxes | $ | 12,254 | $ | (8,572 | ) | $ | 56,907 | |||||||||||
F-8
Television — Our television segment includes 11 ABC affiliates, three NBC affiliates and two independent stations, which we operate as duopolies with our Kansas City NBC affiliate and our Detroit ABC affiliate. We also own five Azteca America affiliates. Our television stations reach approximately 14% of the nation’s households. Our television stations earn revenue primarily from the sale of advertising time to local and national advertisers and retransmission fees received from cable operators and satellite carriers.
National television networks offer affiliates a variety of programs and sell the majority of advertising within those programs. In addition to network programs, we broadcast locally produced programs, syndicated programs, sporting events and other programs of interest in each station's market. News is the primary focus of our locally produced programming.
The operating performance of our television group is most affected by the health of the local and national economies, particularly conditions within the automotive, services and retail categories, and by the volume of advertising time purchased by campaigns for elective office and political issues. The demand for political advertising is significantly higher in the third and fourth quarters of even-numbered years.
Operating results for our television segment were as follows:
For the years ended December 31, | ||||||||||||||||||
(in thousands) | 2014 | Change | 2013 | Change | 2012 | |||||||||||||
Segment operating revenues: | ||||||||||||||||||
Local | $ | 236,772 | 1.9 | % | 232,358 | 3.9 | % | $ | 223,534 | |||||||||
National | 109,448 | (7.5 | )% | 118,375 | 8.5 | % | 109,084 | |||||||||||
Political | 57,981 | 4,272 | 106,732 | |||||||||||||||
Retransmission | 56,185 | 32.2 | % | 42,505 | 37.7 | % | 30,867 | |||||||||||
Digital | 19,357 | 15.1 | % | 16,822 | 12.0 | % | 15,024 | |||||||||||
Other | 6,579 | (22.0 | )% | 8,431 | (2.6 | )% | 8,655 | |||||||||||
Total operating revenues | 486,322 | 15.0 | % | 422,763 | (14.4 | )% | 493,896 | |||||||||||
Segment costs and expenses: | ||||||||||||||||||
Employee compensation and benefits | 193,056 | 7.9 | % | 178,928 | (1.8 | )% | 182,221 | |||||||||||
Programs and program licenses | 55,487 | 3.1 | % | 53,826 | (5.2 | )% | 56,783 | |||||||||||
Other expenses | 102,894 | 14.0 | % | 90,219 | (5.0 | )% | 94,975 | |||||||||||
Total costs and expenses | 351,437 | 8.8 | % | 322,973 | (3.3 | )% | 333,979 | |||||||||||
Segment profit | $ | 134,885 | 35.2 | % | $ | 99,790 | (37.6 | )% | $ | 159,917 | ||||||||
2014 compared with 2013
The Company completed its acquisition of two Granite television stations on June 16, 2014. The inclusion of operating results from these stations for the period subsequent to the acquisition impact the comparability of our television division operating results.
Revenues
Total reported television revenues increased 15%, or $64 million, in 2014 compared to 2013. On a same-station basis, television revenues increased 12% for the year. The same-station increase was primarily driven by higher political advertising and retransmission revenue, while national and local advertising softened in the second half of the year. Political advertising was up nearly $53 million compared to 2013 on a same-station basis.
On a same-station basis, retransmission revenues increased approximately 30% in 2014, primarily due to annual rate increases in long-term contracts and the renewal in the middle of the year of a retransmission agreement with an MVPD providing service to about 15% of the subscribers to such services in our markets. We renewed retransmission agreements with MVPDs providing service to another 15% of subscribers to those services later in the year. These contracts were renewed at market rates, and as a result we expect a substantial increase in 2015 retransmission revenues. Retransmission revenues also could be impacted positively by the proposed Time Warner and Comcast merger and the subsequent transfer of certain Time Warner and Comcast systems as previously announced by Comcast. If the transactions are consummated as proposed, retransmission revenue will increase by about $6 million per quarter.
F-9
On February 13, 2014, Comcast and Time Warner Cable announced their agreement to merge. Comcast and Time Warner provide cable television service to about one-third of the households in our markets. In addition, Time Warner negotiates on behalf of cable provider Bright House for about 1 million subscribers in Scripps markets. The Scripps/Time Warner retransmission agreement, which covers about 3 million subscribers (including the Bright House subscribers), expires at the end of 2015. The Scripps/Comcast retransmission agreement, which covers approximately 2.5 million subscribers, expires at the end of 2019. Any Time Warner cable systems in the Scripps markets ultimately acquired by Comcast in the merger would become subject to the Scripps/Comcast retransmission agreement. The proposed merger would not affect retransmission revenues we receive in 2015. In May 2014, details were released by Comcast about the cable systems that it expects to divest as part of the merger transaction. About 2 million of the proposed divested households are in our markets (Detroit, Indianapolis, Cleveland and Cincinnati) and would fall under our contract with Charter Communications, which was renewed at the end of 2014. The impact of this depends on when the merger between Comcast and Time Warner and the subsequent transaction between Comcast and Charter are completed. The contract for the approximately 1 million Bright House subscribers expires at the end of 2015, and we believe that those subscribers may not be included under our Comcast retransmission agreement.
Digital revenues on a same-station basis increased 13%, or $2.2 million, as we continued our focus on increasing digital advertising revenues with an expanded sales force.
Other revenues decreased $1.9 million compared to the prior year, due to a $1.2 million decrease in revenues we received for news production and television services provided by our West Palm Beach television station to the Raycom station in that market.
Costs and expenses
Employee compensation and benefits increased $9.2 million, or 5%, on a same-station basis, primarily due to a $2.6 million increase resulting from annual salary increases and the addition of approximately 80 positions to staff The List and The Now, two of our internally developed and produced programs. Also in 2014, we incurred higher incentive compensation of $1.7 million and increased severance costs of $1.6 million, primarily related to centralizing our master control hub.
Programs and program licenses decreased 2.3% on a same-station basis. The decrease is primarily due to reduced costs for syndicated programming, partially offset by an increase in fees we pay under our network affiliation agreements. Syndicated programming costs decreased $6.5 million in 2014 as we replaced more of our syndicated programming with internally produced programming. The decrease in syndicated programming costs was partially offset by a $5.4 million increase in fees we pay under our network affiliation agreements, which require us to pay a portion of retransmission revenues above a threshold to the network. At the end of 2014, we renewed our ABC network affiliation agreements for 10 of our 11 ABC-affiliated stations through 2019. Under the terms of the renewed agreements, we expect to pay a higher portion of our retransmission revenues as fees than we paid prior to the renewal.
Other expenses on an as-reported basis increased 14% compared to 2013. On a same-station basis, other expenses increased 9.1%. Costs to support digital initiatives in the television segment increased $9.8 million, which was partially off-set by a decrease in various other operating expenses.
2013 compared with 2012
Revenues
Total television revenues decreased 14.4% in 2013, primarily due to expected declines in political advertising in the off-election year. The prior year included $107 million of political advertising, as well as incremental revenue from airing the 2012 Olympics on our three NBC-affiliated stations. As is common during election cycles, the influx of political advertising displaces certain traditional advertising.
Retransmission revenues increased 37.7%, or $11.6 million, in 2013, primarily due to an extension of an agreement that increases the amounts we receive under our retransmission fees.
Digital revenues for 2013 increased 12%, or $1.8 million, as we continued our focus on increasing digital advertising revenues.
F-10
Costs and expenses
Total costs and expenses decreased 3.3% year-over-year, primarily due to the decline in costs for programs and program licenses and a $4.2 million decrease in incentive compensation expense.
Programs and program licenses decreased by 5.2% during 2013, primarily due to reduced costs for syndicated programming. Syndicated programming costs decreased $5.7 million in 2013. In the third quarter of 2012, we replaced some of the syndicated programming that seven of our stations air in the access period between evening news and prime time with programming we produce internally or in partnership with others. In the third quarter of 2013, we replaced some of the syndicated programming on one additional station during the access period. The decrease in syndicated programming costs was partially offset by a $2.9 million increase in fees we pay under our network affiliation agreements, which require us to pay a portion of retransmission revenues above a threshold to the network.
Other expenses decreased by 5% in 2013. The decrease was primarily driven by $2.2 million in lower marketing and promotion costs. In 2012, we incurred marketing and promotion costs to promote the launch of our two new programs in seven of our television markets. Repairs and maintenance costs were $3.9 million lower than the prior year, which included several major projects. Offsetting these expense reductions was $3.5 million of additional expense for our digital operations.
F-11
Newspapers — We operate daily and community newspapers in 13 markets across the United States. Our newspapers earn revenue primarily from the sale of advertising to local and national advertisers and newspaper subscription fees. Our newspapers operate in mid-size markets, focusing on news coverage within their local markets. Advertising and subscription revenues provide substantially all of the operating revenues for each newspaper market, and employee costs, newspaper distribution and newsprint costs are the primary expenses at each newspaper. The operating performance of our newspapers is most affected by local and national economic conditions, particularly within the retail, labor, housing and automotive markets, as well as newsprint prices.
Operating results for our newspaper segment were as follows:
For the years ended December 31, | ||||||||||||||||||
(in thousands) | 2014 | Change | 2013 | Change | 2012 | |||||||||||||
Segment operating revenues: | ||||||||||||||||||
Local | $ | 72,400 | (5.6 | )% | $ | 76,722 | (3.7 | )% | $ | 79,700 | ||||||||
Classified | 64,028 | (4.9 | )% | 67,324 | (9.7 | )% | 74,530 | |||||||||||
National | 4,462 | (41.3 | )% | 7,607 | (19.3 | )% | 9,421 | |||||||||||
Preprint and other | 62,166 | (7.8 | )% | 67,420 | (4.6 | )% | 70,701 | |||||||||||
Digital advertising and marketing services | 24,964 | (5.0 | )% | 26,277 | 0.7 | % | 26,085 | |||||||||||
Advertising and marketing services | 228,020 | (7.1 | )% | 245,350 | (5.8 | )% | 260,437 | |||||||||||
Subscriptions | 121,565 | 3.2 | % | 117,762 | 0.1 | % | 117,700 | |||||||||||
Other | 20,731 | (3.1 | )% | 21,402 | 2.1 | % | 20,954 | |||||||||||
Total operating revenues | 370,316 | (3.7 | )% | 384,514 | (3.7 | )% | 399,091 | |||||||||||
Segment costs and expenses: | ||||||||||||||||||
Employee compensation and benefits | 155,768 | (5.9 | )% | 165,558 | (5.9 | )% | 175,907 | |||||||||||
Newsprint, press supplies and other printing costs | 45,362 | (3.4 | )% | 46,965 | (8.4 | )% | 51,266 | |||||||||||
Distribution | 46,948 | (3.2 | )% | 48,490 | (3.7 | )% | 50,379 | |||||||||||
Other expenses | 101,455 | 6.2 | % | 95,536 | 1.7 | % | 93,944 | |||||||||||
Total costs and expenses | 349,533 | (2.0 | )% | 356,549 | (4.0 | )% | 371,496 | |||||||||||
Segment profit | $ | 20,783 | (25.7 | )% | $ | 27,965 | 1.3 | % | $ | 27,595 | ||||||||
2014 compared with 2013
Revenues
Total newspaper revenues decreased 3.7% for 2014 compared to 2013. Advertising and marketing services revenues decreased more than 7% in 2014, which was partially offset by an increase in subscription revenue from targeted price increases and print and digital subscription bundles. As of December 31, 2014, we had approximately 34,000 digital-only subscribers across all of our markets.
Advertising and marketing services revenues decreased 7.1% for 2014, primarily as a result of continued secular changes in the demand for print advertising. Automotive and other classified advertising, as well as national advertising remained particularly weak, while employment and real estate showed improvement in selected markets.
Digital advertising and marketing services include advertising on our newspaper websites, digital advertising provided through audience-extension programs and other digital marketing services we offer to our local advertising customers, such as managing their search engine marketing campaigns. The decrease in 2014 was due to lower revenues from our bundled products that we sell with print advertising.
Subscriptions include fees paid by readers for access to our content in print and digital formats. We completed the launch of our bundled subscription model in the third quarter of 2013. Under our bundled offerings, subscribers receive access to all our newspaper content on all platforms and only limited digital content is available to non-subscribers. We also offer digital-only subscriptions. Subscription revenue increased in 2014 by 3.2% which was driven by the rollout of our bundled subscription model, increases in single-copy prices and digital-only subscriptions. As we cycled against the completion of the launch of our digital bundles, subscription revenue growth moderated.
F-12
Other operating revenues, including commercial printing and distribution services, decreased by 3.1% in 2014. Distribution services decreased by $0.6 million. In 2014 and 2013, we had revenues of $2.1 million and $1.6 million, respectively, for a commercial print job where our Knoxville newspaper printed the Chattanooga newspaper while their plant was improved. The Chattanooga printing contract ended in August 2014.
Costs and expenses
Employee compensation and benefits decreased primarily due to lower employment levels year-over-year, including the transfer of approximately 30 information technology ("IT") employees into the corporate IT group. The employee compensation and benefits for IT is included in other expenses. The fourth quarter 2014 reduction in force, as well as attrition, resulted in approximately 7% fewer employees in 2014 compared to 2013. The impact of lower employee levels was partially offset by a $1.1 million increase in severance costs and a $1 million increase in incentive compensation.
Newsprint, press supplies and other printing costs declined by 3.4% in 2014 due to lower expenditures for newsprint. Consumption decreased by 6% and average newsprint prices decreased by1.6%.
Newspaper distribution costs decreased by 3.2% in 2014 compared to 2013 as a result of lower net paid circulation levels. A large portion of our newspaper distribution costs are variable and increase or decrease in relation to our circulation levels.
Other expenses increased by 6.2% in 2014, primarily due to a $14 million increase in costs related to employee compensation and benefits of the IT employees transferred to corporate, support of our digital initiatives of our newspaper business, as well as costs to implement systems and process changes. Prior to the transfer of the IT employees, their costs were included in employee compensation and benefits. The increase in these expenses were partially offset by lower marketing costs and decreases in various other operating expenses due to cost-control efforts. In 2013, we incurred $2 million in incremental marketing costs to support the launch of our digital subscription initiative.
2013 compared with 2012
Revenues
Advertising and marketing services revenues decreased 5.8% for 2013, primarily as a result of continued secular changes in the demand for print advertising. Automotive and employment classified advertising and national advertising remained particularly weak.
Digital advertising and marketing services include advertising on our newspaper websites, digital advertising provided through audience-extension programs and other digital marketing services we offer to our local advertising customers, such as managing their search engine marketing campaigns.
Subscriptions include fees paid by readers for access to our content in print and digital formats. We completed the launch of our bundled subscription model in the third quarter of 2013. Subscription revenue was flat year over year, but it increased in the third and fourth quarters — the first year-over-year increase since the fourth quarter of 2010. The positive trend was driven by the rollout of our bundled subscription model and increases in single-copy prices in select markets.
Other operating revenues, including commercial printing and distribution services, were essentially flat year-over-year.
Costs and expenses
Employee compensation and benefits decreased, primarily due to lower employment levels year-over-year. We had approximately 5% fewer employees in 2013 compared to 2012.
Newsprint, press supplies and other printing costs declined by 8.4% in 2013 due to lower expenditures for newsprint. Average newsprint prices decreased 7% and newsprint consumption decreased approximately 5% for 2013.
Newspaper distribution costs decreased by 3.7% in 2013 compared to 2012 as a result of lower net paid circulation levels. A large portion of our newspaper distribution costs are variable and increase or decrease in relation to our circulation levels.
Other expenses increased by 1.7% in 2013, primarily due to a $2 million increase in marketing and promotion to support the launch of our bundled subscription offerings.
F-13
Shared services and corporate
We centrally provide certain services to our business segments. Such services include accounting, tax, cash management, procurement, human resources, employee benefits and information technology. The business segments are allocated costs for such services at amounts agreed upon by management. Such allocated costs may differ from amounts that might be negotiated at arms-length. Costs for such services that are not allocated to the business segments are included in shared services and corporate costs. Shared services and corporate also includes unallocated corporate costs, including costs associated with being a public company and certain unallocated digital costs.
2014 to 2013
Shared services and corporate expenses were $53.9 million in 2014 and $52.6 million in 2013. The increase is primarily attributable to higher incentive compensation of $3.1 million and a $1 million contribution to the Scripps Howard Foundation related to the extension of the employment agreement with Richard Boehne, President and Chief Executive Officer. These increases were partially offset by lower amounts of unallocated costs for digital and information technology costs to our television and newspaper segments.
2013 to 2012
Shared services and corporate expenses were $52.6 million in 2013 and $39.7 million in 2012. Incremental costs to hire and develop digital-only sales professionals, streamline the digital sales processes, and create digital content that were not allocated to our television and newspaper divisions totaled $14.3 million in 2013. In 2013, we hired approximately 100 digital-only sales professionals for our television and newspaper divisions.
Liquidity and Capital Resources
Our primary source of liquidity is our available cash and borrowing capacity under our revolving credit facility, as well as cash provided by operating activities.
Operating activities
Cash provided by operating activities for the years ended December 31 is as follows:
For the years ended December 31, | ||||||||||||
(in thousands) | 2014 | 2013 | 2012 | |||||||||
Cash Flows from Operating Activities: | ||||||||||||
Net income (loss) | $ | 10,222 | $ | (724 | ) | $ | 39,922 | |||||
Adjustments to reconcile income (loss) from operations to net cash flows from operating activities: | ||||||||||||
Depreciation and amortization | 49,070 | 47,762 | 49,332 | |||||||||
Contract termination fees | — | — | 5,663 | |||||||||
(Gains)/losses on sale of property, plant and equipment | (2,260 | ) | 166 | 474 | ||||||||
Loss on sale of investments | 64 | 3,000 | — | |||||||||
Deferred income taxes | 7,499 | (5,065 | ) | 8,297 | ||||||||
Excess tax benefits of share-based compensation plans | (8,352 | ) | — | (4,206 | ) | |||||||
Stock and deferred compensation plans | 7,966 | 7,148 | 8,223 | |||||||||
Pension expense, net of payments | 4,520 | 6,331 | 5,903 | |||||||||
Liability for withdrawal from GCIU Employer Retirement Fund | 4,100 | — | — | |||||||||
Other changes in certain working capital accounts, net | 28,240 | (30,069 | ) | 60,594 | ||||||||
Miscellaneous, net | 986 | 4,956 | (1,620 | ) | ||||||||
Net cash provided by operating activities | $ | 102,055 | $ | 33,505 | $ | 172,582 | ||||||
F-14
2014 to 2013
The $69 million increase in cash provided by operating activities was primarily attributable to changes in working capital in 2014 and 2013 and higher segment profit in 2014. The primary factors affecting changes in working capital are described below.
• | Collections of accounts receivable increased $17.9 million in 2014 compared to 2013 primarily due to the impact of 2014 fourth quarter political advertising, which is paid in advance. |
• | The accrual of incentive compensation, net of the payment of amounts earned in the prior year, increased working capital by $4.7 million in 2014 and decreased working capital by $9.8 million in 2013. |
• | The timing of payments for accounts payable increased working capital by $11 million in 2014. |
• | In 2014, $8.4 million of excess tax benefits was reflected as a use of cash. |
2013 to 2012
The $139 million decrease in cash provided by operating activities was primarily attributable to changes in working capital in each of the periods and lower segment profit in 2013. The primary factors affecting changes in working capital are described below.
• | Due to the high level of political advertising in the fourth quarter of 2012, the timing of collections of accounts receivable decreased working capital by $14.1 million in 2013. |
• | We received $25 million in 2012 for refunds of prior year taxes from the carryback of our 2011 net operating loss, increasing our cash flow from operations. |
• | Income tax benefits recognized in 2013 of $21.6 million will not be realized until we utilize our net operating loss against future taxable income. |
• | The accrual of annual incentive compensation, net of the payment of amounts earned in the prior year, decreased working capital by $9.8 million in 2013 and increased working capital by $5.6 million in 2012. |
Investing activities
Cash used in investing activities for the years ended December 31 is as follows:
For the years ended December 31, | ||||||||||||
(in thousands) | 2014 | 2013 | 2012 | |||||||||
Cash Flows from Investing Activities: | ||||||||||||
Acquisitions | $ | (149,284 | ) | $ | — | $ | (266 | ) | ||||
Proceeds from sale of property, plant and equipment | 7,001 | 345 | 511 | |||||||||
Additions to property, plant and equipment | (19,008 | ) | (20,522 | ) | (30,210 | ) | ||||||
Changes in restricted cash | 1,400 | 1,800 | — | |||||||||
Purchase of investments | (2,653 | ) | (1,575 | ) | (5,066 | ) | ||||||
Miscellaneous, net | 2,007 | 69 | 2,607 | |||||||||
Net cash used in investing activities | $ | (160,537 | ) | $ | (19,883 | ) | $ | (32,424 | ) | |||
In 2014, 2013 and 2012 we used $161 million, $20 million and $32 million, respectively, in cash for investing activities. The primary factors affecting our investing activities for the years presented are described below.
• | On January 1, 2014 we completed our acquisition of Media Convergence Group, Inc., which operates as Newsy, a digital video news provider, for $35 million in cash. |
• | On June 16, 2014, we completed our acquisition of two television stations owned by Granite Broadcasting Corporation for $110 million in cash. |
• | On September 16, 2014, we completed our acquisition of Geoterrestrial, Inc. ("WeatherSphere") for $4 million in cash. |
• | In 2014, we received $5.8 million in proceeds from the sale of excess land in our newspaper business. |
• | In 2012, we increased our capital expenditures to $30 million primarily due to increased investments in our television business, while in 2014 and 2013, years with lower levels of political advertising, we incurred lower capital expenditures. |
F-15
Financing activities
Cash used in or provided by financing activities for the years ended December 31 is as follows:
For the years ended December 31, | ||||||||||||
(in thousands) | 2014 | 2013 | 2012 | |||||||||
Cash Flows from Financing Activities: | ||||||||||||
Increases in long-term debt | $ | — | $ | 200,000 | $ | — | ||||||
Payments on long-term debt | (2,000 | ) | (196,100 | ) | (15,900 | ) | ||||||
Payments of financing costs | (483 | ) | (2,470 | ) | (993 | ) | ||||||
Repurchase of Class A Common shares | (21,237 | ) | (74,199 | ) | (23,564 | ) | ||||||
Proceeds from employee stock options | 16,579 | 46,624 | 18,215 | |||||||||
Tax payments related to shares withheld for vested stock and RSUs | (4,261 | ) | (6,270 | ) | (7,658 | ) | ||||||
Excess tax benefits from stock compensation plans | 8,352 | — | 4,206 | |||||||||
Miscellaneous, net | (1,264 | ) | (2,594 | ) | 289 | |||||||
Net cash used in financing activities | $ | (4,314 | ) | $ | (35,009 | ) | $ | (25,405 | ) | |||
In 2014, 2013 and 2012 we used $4 million, $35 million and $25 million, respectively, in net cash for financing activities. The primary factors affecting our financing activities are described below.
In the fourth quarter of 2013, we refinanced our debt. On November 26, 2013, we entered into a $275 million revolving credit and term loan agreement (“Financing Agreement”). The Financing Agreement includes a $200 million term loan B maturing in November 2020 and a $75 million revolving credit facility maturing in November 2018. There were no borrowings under the revolving credit agreements in any of the years.
The Financing Agreement includes the maintenance of a net leverage ratio if we borrow more than 20% on the revolving credit facility. The term loan B requires that if we borrow additional amounts or make a permitted acquisition that we cannot exceed a stated net leverage ratio on a pro forma basis at the date of the transaction. We were in compliance with all financial covenants in our financing agreements at December 31, 2014 and 2013.
The Financing Agreement also includes a provision that in certain circumstances we must use a portion of excess cash flow to repay debt. As of December 31, 2014, we were not required to make additional principal payments based on excess cash flow.
In November 2012, our Board of Directors authorized a repurchase program of up to $100 million of our Class A Common shares through December 2014. We repurchased $21.2 million of shares under this authorization in 2014 and $74.2 million of shares in 2013. No additional shares may be repurchased pursuant to this authorization. Under a previous authorization, we repurchased a total of $23.6 million of shares in 2012.
In May 2014, our Board of Directors authorized a new repurchase program of up to $100 million of our Class A Common shares through December 2016. We have not made any repurchases under this authorization. Under the terms of the Master Transaction Agreement with Journal Communications, Inc., we are precluded from repurchasing shares prior to the closing of the Journal Transactions.
In 2014, 2013 and 2012, we received $17 million, $47 million and $18 million, respectively, of proceeds from the exercise of employee stock options. The number of options being exercised has increased as our share price has moved above the exercise prices and the outstanding options near their expiration dates. As of December 31, 2014, our employees held options to purchase 1.7 million shares at exercise prices between $6.63 and $10.92 per share.
Other
We have met our funding requirements for our defined benefit pension plans under the provisions of the Pension Funding Equity Act of 2004 and the Pension Protection Act of 2006. We expect to contribute $1.0 million in 2015 to our defined benefit pension plans, including our SERP.
We expect that our cash and short-term investments and cash flow from operating activities will be sufficient to meet our operating and capital needs over the next 12 months.
F-16
As discussed previously, we have announced a transaction with Journal Communications, Inc. whereby we will pay a special cash dividend of $60 million, spin-off our newspaper operations and acquire Journal's broadcast business. In order to carry out the Journal Transactions we will incur $25 to $30 million in costs, of which we have incurred approximately $10 million to date. With the Journal Transactions, we will also assume Journal's outstanding liabilities, including any employee benefit obligations ($95 million as of December 31, 2014). Journal also has outstanding debt of $131 million as of December 31, 2014, of which we will refinance $120 million and expect to assume the remainder. We expect to increase our term loan B by $200 million to refinance Journal's debt and pay costs, taxes and the dividend associated with the Journal Transactions. We expect to have more than $100 million of cash on hand and a $398 million term loan B after closing the Journal Transactions. The closing date of the Journal Transactions is currently scheduled for April 1, 2015.
In the case that Scripps breaches its obligation to consummate the Journal Transactions, the Master Transaction Agreement may require Scripps to pay liquidated damages of $15.8 million plus expenses, subject to an overall limit of $23.5 million.
Off-Balance Sheet Arrangements and Contractual Obligations
Off-Balance Sheet Arrangements
Off-balance sheet arrangements include the following four categories: obligations under certain guarantees or contracts; retained or contingent interests in assets transferred to an unconsolidated entity or similar arrangements; obligations under certain derivative arrangements; and obligations under material variable interests.
We may utilize interest rate swaps to manage our interest expense exposure by fixing our interest rate on portions of our floating rate term loan. We have entered into a $75 million notional value interest rate swap expiring in December 2016 which provides for a fixed LIBOR interest rate of 1.08%. We did not provide or receive any collateral for this contract. The fair value of this financial derivative is based on quoted market prices which reflect the present values of the difference between estimated future variable-rate receipts and future fixed-rate payments. Through November 2013, this hedge qualified as and was designated as a cash flow hedge. Upon refinancing our term loan B in November 2013, this hedge no longer qualifies as a cash flow hedge.
As of December 31, 2014 and 2013, we had outstanding letters of credit totaling $0.2 million.
F-17
Contractual Obligations
A summary of our contractual cash commitments as of December 31, 2014 is as follows:
Less than | Years | Years | Over | |||||||||||||||||
(in thousands) | 1 Year | 2 & 3 | 4 & 5 | 5 Years | Total | |||||||||||||||
Long-term debt: | ||||||||||||||||||||
Principal amounts | $ | 2,000 | $ | 4,000 | $ | 4,000 | $ | 188,000 | $ | 198,000 | ||||||||||
Interest on note | 6,403 | 12,610 | 12,350 | 6,086 | 37,449 | |||||||||||||||
Programming: | ||||||||||||||||||||
Program licenses and network affiliation agreements | 101,095 | 200,017 | 226,687 | — | 527,799 | |||||||||||||||
Employee compensation and benefits: | ||||||||||||||||||||
Deferred compensation and other post-employment benefits | 4,651 | 7,191 | 3,306 | 1,484 | 16,632 | |||||||||||||||
Employment and talent contracts | 31,822 | 25,660 | 2,209 | — | 59,691 | |||||||||||||||
Operating leases: | ||||||||||||||||||||
Noncancelable | 4,181 | 6,555 | 4,776 | 9,504 | 25,016 | |||||||||||||||
Cancelable | 817 | 1,249 | 717 | — | 2,783 | |||||||||||||||
Pension obligations: | ||||||||||||||||||||
Minimum pension funding | 1,070 | 1,963 | 4,319 | 133,484 | 140,836 | |||||||||||||||
Other commitments: | ||||||||||||||||||||
Noncancelable purchase and service commitments | 9,967 | 3,745 | 360 | — | 14,072 | |||||||||||||||
Other purchase and service commitments | 35,237 | 24,953 | 4,161 | — | 64,351 | |||||||||||||||
Total contractual cash obligations | $ | 197,243 | $ | 287,943 | $ | 262,885 | $ | 338,558 | $ | 1,086,629 | ||||||||||
Long-term debt — Our long-term debt bears interest at rates based on LIBOR, with a 0.75% LIBOR floor, plus a fixed margin of 2.50%. The rate on our term loan B was 3.25% at December 31, 2014. Amounts included in the table may differ from amounts actually paid due to changes in LIBOR. A 1% increase in LIBOR would result in an increase in annual interest payments of approximately $2.0 million.
Our Financing Agreement also includes a provision that in certain circumstances we must use a portion of excess cash flow to repay debt. Principal payments included in the contractual obligations table reflect only scheduled principal payments and do not reflect any amounts that may be required to be paid under this provision. As of December 31, 2014, we were not required to make any additional principal payments from excess cash flow.
Other Contractual Obligations — In the ordinary course of business, we enter into long-term contracts to license or produce programming, to secure on-air talent, to lease office space and equipment and to purchase other goods and services.
Programming — Program licenses generally require payments over the terms of the licenses. Licensed programming includes both programs that have been delivered and are available for telecast and programs that have not yet been produced. It also includes payments for our network affiliation agreements. If the programs are not produced, our commitments would generally expire without obligation. Fixed fee amounts payable under our network affiliation agreements are also included. Variable amounts to the networks that are payable throughout the life of the contracts are included based on current estimates at December 31, 2014.
We expect to enter into additional program licenses and production contracts to meet our future programming needs.
Talent Contracts — We secure on-air talent for our television stations through multi-year talent agreements. Certain agreements may be terminated under certain circumstances or at certain dates prior to expiration. We expect our employment and talent contracts will be renewed or replaced with similar agreements upon their expiration. Amounts due under the contracts, assuming the contracts are not terminated prior to their expiration, are included in the contractual obligations table.
F-18
Operating Leases — We obtain certain office space under multi-year lease agreements. Leases for office space are generally not cancelable prior to their expiration.
Leases for operating and office equipment are generally cancelable by either party with 30 to 90 days notice. However, we expect such contracts will remain in force throughout the terms of the leases. The amounts included in the table above represent the amounts due under the agreements assuming the agreements are not canceled prior to their expiration.
We expect our operating leases will be renewed or replaced with similar agreements upon their expiration.
Pension Funding — We sponsor qualified defined benefit pension plans that cover substantially all non-union and certain union-represented employees. We also have a non-qualified Supplemental Executive Retirement Plan (“SERP”).
Contractual commitments summarized in the contractual obligations table include payments to meet minimum funding requirements of our defined benefit pension plans and estimated benefit payments for our unfunded SERP. Contractual pension obligations reflect anticipated minimum statutory pension contributions as of December 31, 2014, based upon pension funding regulations in effect at the time and our current pension assumptions regarding discount rates and returns on plan assets. Actual funding requirements may differ from amounts presented due to changes in discount rates, returns on plan assets or pension funding regulations that are in effect at the time.
Payments for the SERP plan have been estimated over a ten-year period. Accordingly, the amounts in the “over 5 years” column include estimated payments for the periods of 2020-2024. While benefit payments under these plans are expected to continue beyond 2024, we do not believe it is practicable to estimate payments beyond this period.
Income Tax Obligations — The contractual obligations table does not include any reserves for income taxes recognized because we are unable to reasonably predict the ultimate amount or timing of settlement of our reserves for income taxes. As of December 31, 2014, our reserves for income taxes totaled $6.7 million, which is reflected as a long-term liability in our Consolidated Balance Sheets.
Purchase Commitments — We obtain audience ratings, market research and certain other services under multi-year agreements. These agreements are generally not cancelable prior to expiration of the service agreement. We expect such agreements will be renewed or replaced with similar agreements upon their expiration.
We may also enter into contracts with certain vendors and suppliers, including most of our newsprint vendors. These contracts typically do not require the purchase of fixed or minimum quantities and generally may be terminated at any time without penalty. Included in the table of contractual obligations are purchase orders placed as of December 31, 2014. Purchase orders placed with vendors, including those with whom we maintain contractual relationships, are generally cancelable prior to shipment. While these vendor agreements do not require us to purchase a minimum quantity of goods or services, and we may generally cancel orders prior to shipment, we expect expenditures for goods and services in future periods will approximate those in prior years.
Critical Accounting Policies and Estimates
The preparation of financial statements in accordance with accounting principles generally accepted in the United States of America (“GAAP”) requires us to make a variety of decisions that affect reported amounts and related disclosures, including the selection of appropriate accounting principles and the assumptions on which to base accounting estimates. In reaching such decisions, we apply judgment based on our understanding and analysis of the relevant circumstances, including our historical experience, actuarial studies and other assumptions. We are committed to incorporating accounting principles, assumptions and estimates that promote the representational faithfulness, verifiability, neutrality and transparency of the accounting information included in the financial statements.
Note 1 to our Consolidated Financial Statements describes the significant accounting policies we have selected for use in the preparation of our financial statements and related disclosures. We believe the following to be the most critical accounting policies, estimates and assumptions affecting our reported amounts and related disclosures.
Acquisitions — The accounting for a business combination requires tangible and intangible assets acquired and liabilities assumed to be recorded at estimated fair value. With the assistance of third party appraisals, we generally determine fair values using comparisons to market transactions and a discounted cash flow analysis. The use of a discounted cash flow analysis requires significant judgment to estimate the future cash flows derived from the asset and the expected period of time over which those cash flows will occur and to determine an appropriate discount rate. Changes in such estimates could affect the
F-19
amounts allocated to individual identifiable assets. While we believe our assumptions are reasonable, if different assumptions were made, the amount allocated to intangible assets could differ substantially from the reported amounts.
Long-Lived Assets — Long-lived assets (primarily property, plant and equipment and amortizable intangible assets) must be tested for impairment whenever events occur or circumstances change that indicate that the carrying value of an asset or asset group may not be recoverable. A long-lived asset group is determined not to be recoverable if the estimated future undiscounted cash flows of the asset group are less than the carrying value of the asset group.
Estimating undiscounted cash flows requires significant judgments and estimates. We continually monitor the estimated cash flows of our newspaper properties and may incur impairment charges if future cash flows are less than our current estimates.
Changes in circumstances, such as technological advances or changes to our business model or capital strategy, could result in actual useful lives differing from our estimates. In cases where we determine the useful life of buildings and equipment should be shortened, we would, after evaluating for impairment, depreciate the asset over its revised remaining useful life thereby increasing depreciation expense.
Goodwill and Other Indefinite-Lived Intangible Assets — Goodwill for each reporting unit must be tested for impairment on an annual basis or when events occur or circumstances change that would indicate the fair value of a reporting unit is below its carrying value. For purposes of performing the impairment test for goodwill, our reporting units are our television group and Newsy. If the fair value of the reporting unit is less than its carrying value, an impairment loss is recorded to the extent that the fair value of the goodwill for the reporting unit is less than its carrying value. At December 31, 2014, we had $106 million of goodwill.
For our annual television reporting unit goodwill impairment, we have utilized the Step 0 approach which allows us to first qualitatively assess whether it is more likely than not that goodwill has been impaired. As part of our qualitative assessment, we consider the following factors related to the television reporting unit, where applicable:
• | significant changes in the macroeconomic conditions; |
• | significant changes in the regulatory environment; |
• | significant changes in the operating model, management, products and services, customer base, cost structure and/or margin trends; |
• | comparison of current year and prior year operating performance and forecast trends for future operating performance; and |
• | the excess of the fair value over carrying value of the reporting units determined in prior quantitative assessments. In our prior quantitative assessment the fair value of the reporting unit was over 100% in excess of the carrying value. |
If we conclude that it is more likely than not that a reporting unit is impaired, we will apply the quantitative step-two method for determining the amount of impairment, if any. Our annual impairment test for goodwill indicated that it was more likely than not that the fair value of our television reporting unit exceeds its recorded value.
For our reporting unit comprising the Newsy business, which has a goodwill balance of $29 million, we have utilized the Step 1, quantitative approach for performing our annual goodwill test. Under that approach we determine the fair value of our reporting unit generally using market data, appraised values and discounted cash flow analyses. The use of a discounted cash flow analysis requires significant judgment to estimate the future cash flows derived from the asset or business and the period of time over which those cash flows will occur and to determine an appropriate discount rate. While we believe the estimates and judgments used in determining the fair values were appropriate, different assumptions with respect to future cash flows, long-term growth rates and discount rates could produce a different estimate of fair value. The estimate of fair value assumes certain growth of the newly acquired business, which if not achieved could impact the fair value and possibly result in an impairment of the goodwill. Our annual impairment testing for goodwill indicated that the fair value of the Newsy reporting unit exceeded its recorded value by over 10%.
We have determined that our FCC licenses are indefinite lived assets and not subject to amortization. At December 31, 2014, the carrying value of our FCC licenses was $92 million. They are tested for impairment annually, or more frequently if events or changes in circumstances indicate that they might be impaired. We compare the estimated fair value of each individual FCC license to its carrying amount. If the carrying amount of an indefinite-lived intangible asset exceeds its fair value, an impairment loss is recognized. Fair value is estimated using an income approach referred to as the “Greenfield Approach,” which requires multiple assumptions relating to the future prospects of each individual FCC license. The fair value of the FCC license is sensitive to each of the assumptions used in the Greenfield Approach and a change in any individual
F-20
assumption could result in the fair value being less than the carrying value of the asset and an impairment charge being recorded. For example a 0.5% increase in the discount rate would reduce the aggregate fair value of the FCC licenses by approximately $5 million. Our annual impairment testing for our FCC licenses indicated that their fair value exceeded their recorded value. The recorded value of our FCC licenses from the recently acquired television stations are derived from more recent business operating plans and macroeconomic environmental conditions and therefore are more susceptible to an adverse change that could require an impairment charge if future assumptions were to change.
Income Taxes — The accounting for uncertain tax positions and the application of income tax law is inherently complex. As such, we are required to make many assumptions and judgments regarding our income tax positions and the likelihood of whether such tax positions would be sustained if challenged. Interpretations and guidance surrounding income tax laws and regulations change over time. As such, changes in our assumptions and judgments can materially affect amounts recognized in the consolidated financial statements.
Our deferred tax asset balance included in our Consolidated Balance Sheets was $51 million at December 31, 2014. We are required to assess the likelihood that our deferred tax assets, which include our net operating loss carryforwards and temporary differences that are expected to be deductible in future years, will be recoverable from the carryback to prior years, carryforward to future years or through other prudent and feasible tax planning strategies. If recovery is not likely, we have to provide a valuation allowance based on our estimates of future taxable income in the various taxing jurisdictions, and the amount of deferred taxes that are ultimately realizable. The provision for current and deferred taxes involves evaluations and judgments of uncertainties in the interpretation of complex tax regulations by various taxing authorities. Actual results could differ from our estimates and if we determine the deferred tax asset we would realize would be greater or less than the net amount recorded, an adjustment would be made to the tax provision in that period.
Pension Plans — We sponsor various noncontributory defined benefit pension plans covering substantially all full-time employees that began employment prior to June 30, 2008, including a SERP, which covers certain executive employees. In 2009, we froze the accrual of benefits under our defined benefit pension plans. Defined benefit pension plan expense for the plans was $5.9 million in 2014, $8.8 million in 2013 and $8.6 million in 2012.
The measurement of our pension obligation and related expense is dependent on a variety of estimates, including: discount rates; expected long-term rate of return on plan assets; and employee turnover, mortality and retirement ages. We review these assumptions on an annual basis and make modifications to the assumptions based on current rates and trends when appropriate. In accordance with accounting principles, we record the effects of these modifications currently or amortize them over future periods. We consider the most critical of our pension estimates to be our discount rate and the expected long-term rate of return on plan assets.
The assumptions used in accounting for our defined benefit pension plans for 2014 and 2013 are as follows:
2014 | 2013 | ||||
Discount rate for expense | 5.08 | % | 4.27 | % | |
Discount rate for obligations | 4.23 | % | 5.08 | % | |
Long-term rate of return on plan assets | 5.25 | % | 4.65 | % | |
The discount rate used to determine our future pension obligations is based upon a dedicated bond portfolio approach that includes securities rated Aa or better with maturities matching our expected benefit payments from the plans. The rate is determined each year at the plan measurement date and affects the succeeding year’s pension cost. Discount rates can change from year to year based on economic conditions that impact corporate bond yields. A decrease in the discount rate increases pension obligations and pension expense.
Changes in other key actuarial assumptions affect the determination of the benefit obligations as of the measurement date and the calculation of net periodic benefit costs in subsequent periods. Recent actuarial studies indicate life expectancies are longer and thus increase the total expected benefit payments to plan participants. Our benefit obligations at December 31, 2014 reflect the new life expectancy assumptions which increased our pension obligations by approximately $45 million in 2014.
F-21
For our defined benefit pension plans, as of December 31, 2014, a half percent increase or decrease in the discount rate would have the following effect:
(in thousands) | 0.5% Increase | 0.5% Decrease | ||||||
Effect on 2015 total pension expense | $ | (409 | ) | $ | 300 | |||
Effect on pension benefit obligation as of December 31, 2014 | $ | (44,809 | ) | $ | 49,749 | |||
We have target asset allocations to invest plan assets in securities that match the timing of the payment of plan obligations. As a result, approximately 70% of plan assets are invested in a portfolio of fixed income securities with a duration approximately that of the projected payment of benefit obligations. The remaining 30% of plan assets are invested in equity securities and other return-seeking assets. The expected long-term rate of return on plan assets is based primarily upon the target asset allocation for plan assets and capital markets forecasts for each asset class employed. Our expected rate of return on plan assets also considers our historical compound rate of return on plan assets for 10- and 15-year periods. A decrease in the expected rate of return on plan assets increases pension expense. A 0.5% change in the 2015 expected long-term rate of return on plan assets of 4.2%, to either 3.7% or 4.7%, would increase or decrease our 2015 pension expense by approximately $2.4 million.
We had cumulative unrecognized actuarial losses for our pension plans of $201 million at December 31, 2014. Unrealized actuarial gains and losses result from deferred recognition of differences between our actuarial assumptions and actual results. In 2014, we had an actuarial loss of $76 million. The 2014 increase in cumulative unrecognized net loss is due to declines in corporate bond yields and their impact on our discount rate and the change in life expectancy of plan participants. Based on our current assumptions, we anticipate that 2015 pension expense will include $4.9 million in amortization of unrecognized actuarial losses.
Recently Adopted Standards and Issued Accounting Standards
Recently Adopted Accounting Standards — In May 2014, the Financial Accounting Standards Board (FASB) issued new guidance on revenue recognition. Under this new standard, an entity shall recognize revenue when it transfers promised goods or services to customers in an amount that reflects the consideration to which the entity expects to be entitled in exchange for those goods or services. The standard creates a five-step process that requires entities to exercise judgment when considering the terms of the contract(s) and all relevant facts and circumstances. This standard permits the use of either the retrospective or cumulative effect transition method and will be effective for us beginning in 2017. Early adoption is not permitted. We are currently assessing the impact this new guidance will have on our consolidated financial statements and have not yet determined a transition method.
In August 2014, the FASB issued new guidance related to the disclosures around going concern. The new standard provides guidance around management's responsibility to evaluate whether there is substantial doubt about an entity's ability to continue as a going concern and to provide related footnote disclosures. The new standard is effective for fiscal years, and interim periods within those fiscal years, beginning after December 15, 2016. Early adoption is permitted. The adoption of this standard is not expected to have a material impact on our consolidated financial statements.
F-22
Quantitative and Qualitative Disclosures about Market Risk
Earnings and cash flow can be affected by, among other things, economic conditions and interest rate changes. We are also exposed to changes in the market value of our investments.
Our objectives in managing interest rate risk are to limit the impact of interest rate changes on our earnings and cash flows, and to reduce overall borrowing costs.
The following table presents additional information about market-risk-sensitive financial instruments:
As of December 31, 2014 | As of December 31, 2013 | |||||||||||||||
(in thousands) | Cost Basis | Fair Value | Cost Basis | Fair Value | ||||||||||||
Financial instruments subject to interest rate risk: | ||||||||||||||||
Variable rate credit facilities | $ | — | $ | — | $ | — | $ | — | ||||||||
Term loan | 198,000 | 194,000 | 200,000 | 200,000 | ||||||||||||
Long-term debt, including current portion | $ | 198,000 | $ | 194,000 | $ | 200,000 | $ | 200,000 | ||||||||
Interest rate swap | $ | 471 | $ | 471 | $ | 723 | $ | 723 | ||||||||
Financial instruments subject to market value risk: | ||||||||||||||||
Investments held at cost | $ | 5,503 | (a) | $ | 11,724 | (a) | ||||||||||
(a) | Includes securities that do not trade in public markets, thus the securities do not have readily determinable fair values. We estimate the fair value of these securities approximates their carrying value. There can be no assurance that we would realize the carrying value upon the sale of these securities. |
We may utilize interest rate swaps to manage our interest expense exposure by fixing our interest rate on portions of our floating rate term loan. We have entered into a $75 million notional value interest rate swap expiring in December 2016 which provides for a fixed interest rate of 1.08%. We did not provide or receive any collateral for this contract. The fair value of this financial derivative is based on quoted market prices which reflect the present values of the difference between estimated future variable-rate receipts and future fixed-rate payments. Through November 2013, this hedge qualified as and was designated as a cash flow hedge. Upon refinancing our term loan B in November 2013, this hedge no longer qualifies as a cash flow hedge.
F-23
Controls and Procedures
Evaluation of Disclosure Controls and Procedures
The effectiveness of the design and operation of our disclosure controls and procedures (as defined in Rule 13a-15(e) under the Securities Exchange Act of 1934) was evaluated as of the date of the financial statements. This evaluation was carried out under the supervision of and with the participation of management, including the Chief Executive Officer and the Chief Financial Officer. Based upon that evaluation, the Chief Executive Officer and the Chief Financial Officer concluded that the design and operation of these disclosure controls and procedures are effective. There were no changes to the Company’s internal controls over financial reporting (as defined in Exchange Act Rule 13a-15(f)) during the fourth quarter covered by this report that have materially affected, or are reasonably likely to materially affect, the Company’s internal control over financial reporting.
F-24
Management’s Report on Internal Control Over Financial Reporting
Scripps’ management is responsible for establishing and maintaining adequate internal controls designed to provide reasonable assurance regarding the reliability of financial reporting and the preparation of financial statements for external purposes in accordance with accounting principles generally accepted in the United States of America (“GAAP”). The Company’s internal control over financial reporting includes those policies and procedures that:
1. | pertain to the maintenance of records that, in reasonable detail, accurately and fairly reflect the transactions and dispositions of the assets of the Company; |
2. | provide reasonable assurance that transactions are recorded as necessary to permit preparation of financial statements in accordance with GAAP and that receipts and expenditures of the Company are being made only in accordance with authorizations of management and the directors of the Company; and |
3. | provide reasonable assurance regarding prevention or timely detection of unauthorized acquisition, use or disposition of the Company’s assets that could have a material effect on the financial statements. |
All internal control systems, no matter how well designed, have inherent limitations, including the possibility of human error, collusion and the improper overriding of controls by management. Accordingly, even effective internal control can only provide reasonable, but not absolute assurance with respect to financial statement preparation. Further, because of changes in conditions, the effectiveness of internal control may vary over time.
As required by Section 404 of the Sarbanes Oxley Act of 2002, management assessed the effectiveness of The E. W. Scripps Company and subsidiaries (the “Company”) internal control over financial reporting as of December 31, 2014. Management’s assessment is based on the criteria established in the Internal Control – Integrated Framework (2013) issued by the Committee of Sponsoring Organizations of the Treadway Commission. Based upon our assessment, management believes that the Company maintained effective internal control over financial reporting as of December 31, 2014.
The Company’s independent registered public accounting firm has issued an attestation report on our internal control over financial reporting as of December 31, 2014. This report appears on page F-27.
Date: March 13, 2015
BY:
/s/ Richard A. Boehne | ||
Richard A. Boehne | ||
President and Chief Executive Officer | ||
/s/ Timothy M. Wesolowski | ||
Timothy M. Wesolowski | ||
Senior Vice President, Chief Financial Officer & Treasurer | ||
F-25
REPORT OF INDEPENDENT REGISTERED PUBLIC ACCOUNTING FIRM
To the Board of Directors and Shareholders,
The E.W. Scripps Company
We have audited the accompanying consolidated balance sheets of The E. W. Scripps Company and subsidiaries (the "Company") as of December 31, 2014 and 2013, and the related consolidated statements of operations, comprehensive income (loss), cash flows and equity for each of the three years in the period ended December 31, 2014. These financial statements are the responsibility of the Company's management. Our responsibility is to express an opinion on the financial statements based on our audits.
We conducted our audits in accordance with the standards of the Public Company Accounting Oversight Board (United States). Those standards require that we plan and perform the audit to obtain reasonable assurance about whether the financial statements are free of material misstatement. An audit includes examining, on a test basis, evidence supporting the amounts and disclosures in the financial statements. An audit also includes assessing the accounting principles used and significant estimates made by management, as well as evaluating the overall financial statement presentation. We believe that our audits provide a reasonable basis for our opinion.
In our opinion, such consolidated financial statements present fairly, in all material respects, the financial position of The E. W. Scripps Company and subsidiaries as of December 31, 2014 and 2013, and the results of their operations and their cash flows for each of the three years in the period ended December 31, 2014, in conformity with accounting principles generally accepted in the United States of America.
We have also audited, in accordance with the standards of the Public Company Accounting Oversight Board (United States), the Company's internal control over financial reporting as of December 31, 2014, based on the criteria established in Internal Control - Integrated Framework (2013) issued by the Committee of Sponsoring Organizations of the Treadway Commission and our report dated March 13, 2015 expressed an unqualified opinion on the Company's internal control over financial reporting.
/s/ Deloitte & Touche LLP
Cincinnati, Ohio
March 13, 2015
F-26
REPORT OF INDEPENDENT REGISTERED PUBLIC ACCOUNTING FIRM
To the Board of Directors and Shareholders,
The E. W. Scripps Company
We have audited the internal control over financial reporting of The E. W. Scripps Company and subsidiaries (the "Company") as of December 31, 2014, based on criteria established in Internal Control - Integrated Framework (2013) issued by the Committee of Sponsoring Organizations of the Treadway Commission. The Company's management is responsible for maintaining effective internal control over financial reporting and for its assessment of the effectiveness of internal control over financial reporting, included in the accompanying Management’s Report on Internal Control over Financial Reporting. Our responsibility is to express an opinion on the Company's internal control over financial reporting based on our audit.
We conducted our audit in accordance with the standards of the Public Company Accounting Oversight Board (United States). Those standards require that we plan and perform the audit to obtain reasonable assurance about whether effective internal control over financial reporting was maintained in all material respects. Our audit included obtaining an understanding of internal control over financial reporting, assessing the risk that a material weakness exists, testing and evaluating the design and operating effectiveness of internal control based on the assessed risk, and performing such other procedures as we considered necessary in the circumstances. We believe that our audit provides a reasonable basis for our opinion.
A company's internal control over financial reporting is a process designed by, or under the supervision of, the company's principal executive and principal financial officers, or persons performing similar functions, and effected by the company's board of directors, management, and other personnel to provide reasonable assurance regarding the reliability of financial reporting and the preparation of financial statements for external purposes in accordance with generally accepted accounting principles. A company's internal control over financial reporting includes those policies and procedures that (1) pertain to the maintenance of records that, in reasonable detail, accurately and fairly reflect the transactions and dispositions of the assets of the company; (2) provide reasonable assurance that transactions are recorded as necessary to permit preparation of financial statements in accordance with generally accepted accounting principles, and that receipts and expenditures of the company are being made only in accordance with authorizations of management and directors of the company; and (3) provide reasonable assurance regarding prevention or timely detection of unauthorized acquisition, use, or disposition of the company's assets that could have a material effect on the financial statements.
Because of the inherent limitations of internal control over financial reporting, including the possibility of collusion or improper management override of controls, material misstatements due to error or fraud may not be prevented or detected on a timely basis. Also, projections of any evaluation of the effectiveness of the internal control over financial reporting to future periods are subject to the risk that the controls may become inadequate because of changes in conditions, or that the degree of compliance with the policies or procedures may deteriorate.
In our opinion, the Company maintained, in all material respects, effective internal control over financial reporting as of December 31, 2014, based on the criteria established in Internal Control - Integrated Framework (2013) issued by the Committee of Sponsoring Organizations of the Treadway Commission.
We have also audited, in accordance with the standards of the Public Company Accounting Oversight Board (United States), the consolidated financial statements as of and for the year ended December 31, 2014 of the Company and our report dated March 13, 2015 expressed an unqualified opinion on those financial statements.
/s/ Deloitte & Touche LLP
Cincinnati, Ohio
March 13, 2015
F-27
The E. W. Scripps Company
Consolidated Balance Sheets
As of December 31, | ||||||||
(in thousands, except share data) | 2014 | 2013 | ||||||
Assets | ||||||||
Current assets: | ||||||||
Cash and cash equivalents | $ | 158,459 | $ | 221,255 | ||||
Restricted cash | 6,810 | 8,210 | ||||||
Accounts and notes receivable (less allowances - 2014, $2,136; 2013, $2,027) | 136,567 | 139,703 | ||||||
Inventory | 6,183 | 6,543 | ||||||
Deferred income taxes | 12,836 | 17,861 | ||||||
Income taxes receivable | — | 436 | ||||||
Miscellaneous | 7,805 | 8,046 | ||||||
Total current assets | 328,660 | 402,054 | ||||||
Investments | 9,530 | 16,567 | ||||||
Property, plant and equipment | 343,389 | 353,797 | ||||||
Goodwill | 106,261 | 27,966 | ||||||
Other intangible assets | 189,260 | 137,862 | ||||||
Deferred income taxes | 37,946 | 8,733 | ||||||
Miscellaneous | 17,685 | 19,151 | ||||||
Total Assets | $ | 1,032,731 | $ | 966,130 | ||||
Liabilities and Equity | ||||||||
Current liabilities: | ||||||||
Accounts payable | $ | 21,004 | $ | 16,529 | ||||
Customer deposits and unearned revenue | 29,948 | 28,633 | ||||||
Current portion of long-term debt | 2,000 | 2,000 | ||||||
Accrued liabilities: | ||||||||
Employee compensation and benefits | 33,305 | 26,986 | ||||||
Miscellaneous | 38,123 | 28,930 | ||||||
Other current liabilities | 10,158 | 10,043 | ||||||
Total current liabilities | 134,538 | 113,121 | ||||||
Long-term debt (less current portion) | 196,000 | 198,000 | ||||||
Other liabilities (less current portion) | 182,260 | 107,272 | ||||||
Commitments and contingencies (Note 19) | — | — | ||||||
Equity: | ||||||||
Preferred stock, $.01 par — authorized: 25,000,000 shares; none outstanding | — | — | ||||||
Common stock, $.01 par: | ||||||||
Class A — authorized: 240,000,000 shares; issued and outstanding: 2014 - 45,062,522; shares; 2013 - 44,094,501 shares | 451 | 441 | ||||||
Voting — authorized: 60,000,000 shares; issued and outstanding: 2014 - 11,932,722 shares; 2013 - 11,932,722 shares | 119 | 119 | ||||||
Total | 570 | 560 | ||||||
Additional paid-in capital | 525,456 | 509,243 | ||||||
Retained earnings | 118,693 | 116,893 | ||||||
Accumulated other comprehensive loss, net of income taxes | (126,443 | ) | (80,923 | ) | ||||
Total The E.W. Scripps Company shareholders’ equity | 518,276 | 545,773 | ||||||
Noncontrolling interest | 1,657 | 1,964 | ||||||
Total equity | 519,933 | 547,737 | ||||||
Total Liabilities and Equity | $ | 1,032,731 | $ | 966,130 | ||||
See notes to consolidated financial statements.
F-28
The E. W. Scripps Company
Consolidated Statements of Operations
For the years ended December 31, | ||||||||||||
(in thousands, except per share data) | 2014 | 2013 | 2012 | |||||||||
Operating Revenues: | ||||||||||||
Advertising | $ | 646,407 | $ | 613,093 | $ | 711,144 | ||||||
Subscriptions | 121,565 | 117,762 | 117,700 | |||||||||
Retransmission | 56,185 | 42,505 | 30,867 | |||||||||
Other | 44,911 | 43,511 | 43,747 | |||||||||
Total operating revenues | 869,068 | 816,871 | 903,458 | |||||||||
Costs and Expenses: | ||||||||||||
Employee compensation and benefits | 415,595 | 391,207 | 396,241 | |||||||||
Programs and program licenses | 55,487 | 53,826 | 56,783 | |||||||||
Newsprint, press supplies and other printing costs | 45,362 | 46,965 | 51,266 | |||||||||
Newspaper distribution | 46,948 | 48,490 | 50,379 | |||||||||
Other expenses | 205,755 | 201,089 | 201,302 | |||||||||
Defined benefit pension plan expense | 10,000 | 8,837 | 8,620 | |||||||||
Acquisition and related integration costs | 13,974 | — | 5,826 | |||||||||
Restructuring costs | — | 4,893 | 9,335 | |||||||||
Total costs and expenses | 793,121 | 755,307 | 779,752 | |||||||||
Depreciation, Amortization, and (Gains) Losses: | ||||||||||||
Depreciation | 40,668 | 40,839 | 42,258 | |||||||||
Amortization of intangible assets | 8,402 | 6,923 | 7,074 | |||||||||
(Gains) losses, net on disposal of property, plant and equipment | (2,260 | ) | 166 | 474 | ||||||||
Net depreciation, amortization, and (gains) losses | 46,810 | 47,928 | 49,806 | |||||||||
Operating income | 29,137 | 13,636 | 73,900 | |||||||||
Interest expense | (8,494 | ) | (10,448 | ) | (12,246 | ) | ||||||
Miscellaneous, net | (8,389 | ) | (11,760 | ) | (4,747 | ) | ||||||
Income (loss) before income taxes | 12,254 | (8,572 | ) | 56,907 | ||||||||
Provision (benefit) for income taxes | 2,032 | (7,848 | ) | 16,985 | ||||||||
Net income (loss) | 10,222 | (724 | ) | 39,922 | ||||||||
Net loss attributable to noncontrolling interests | (307 | ) | (250 | ) | (266 | ) | ||||||
Net income (loss) attributable to the shareholders of The E.W. Scripps Company | $ | 10,529 | $ | (474 | ) | $ | 40,188 | |||||
Net income (loss) per basic share of common stock attributable to the shareholders of The E.W. Scripps Company: | $ | 0.18 | $ | (0.01 | ) | $ | 0.70 | |||||
Net income (loss) per diluted share of common stock attributable to the shareholders of The E.W. Scripps Company: | $ | 0.18 | $ | (0.01 | ) | $ | 0.69 | |||||
Weighted average shares outstanding: | ||||||||||||
Basic | 56,342 | 56,516 | 54,907 | |||||||||
Diluted | 57,239 | 56,516 | 55,381 | |||||||||
See notes to consolidated financial statements.
F-29
The E. W. Scripps Company
Consolidated Statements of Comprehensive Income (Loss)
For the years ended December 31, | ||||||||||||
(in thousands) | 2014 | 2013 | 2012 | |||||||||
Net income (loss) | $ | 10,222 | $ | (724 | ) | $ | 39,922 | |||||
Changes in fair value of derivative, net of tax of $145, $175 and $(610) | 239 | 291 | (1,009 | ) | ||||||||
Changes in defined benefit pension plans, net of tax of $(27,516), $21,662 and $(10,893) | (45,500 | ) | 35,811 | (18,009 | ) | |||||||
Other | (259 | ) | (185 | ) | (274 | ) | ||||||
Total comprehensive (loss) income | (35,298 | ) | 35,193 | 20,630 | ||||||||
Less comprehensive loss attributable to noncontrolling interest | (307 | ) | (250 | ) | (266 | ) | ||||||
Total comprehensive (loss) income attributable to the shareholders of The E.W. Scripps Company | $ | (34,991 | ) | $ | 35,443 | $ | 20,896 | |||||
See notes to consolidated financial statements.
F-30
The E. W. Scripps Company
Consolidated Statements of Cash Flows
For the years ended December 31, | ||||||||||||
(in thousands) | 2014 | 2013 | 2012 | |||||||||
Cash Flows from Operating Activities: | ||||||||||||
Net income (loss) | $ | 10,222 | $ | (724 | ) | $ | 39,922 | |||||
Adjustments to reconcile income (loss) from operations to net cash flows from operating activities: | ||||||||||||
Depreciation and amortization | 49,070 | 47,762 | 49,332 | |||||||||
Contract termination fees | — | — | 5,663 | |||||||||
(Gains)/losses on sale of property, plant and equipment | (2,260 | ) | 166 | 474 | ||||||||
Loss on sale of investments | 64 | 3,000 | — | |||||||||
Deferred income taxes | 7,499 | (5,065 | ) | 8,297 | ||||||||
Excess tax benefits of share-based compensation plans | (8,352 | ) | — | (4,206 | ) | |||||||
Stock and deferred compensation plans | 7,966 | 7,148 | 8,223 | |||||||||
Pension expense, net of payments | 4,520 | 6,331 | 5,903 | |||||||||
Liability for withdrawal from GCIU Employer Retirement Fund | 4,100 | — | — | |||||||||
Other changes in certain working capital accounts, net | 28,240 | (30,069 | ) | 60,594 | ||||||||
Miscellaneous, net | 986 | 4,956 | (1,620 | ) | ||||||||
Net cash provided by operating activities | 102,055 | 33,505 | 172,582 | |||||||||
Cash Flows from Investing Activities: | ||||||||||||
Acquisitions | (149,284 | ) | — | (266 | ) | |||||||
Proceeds from sale of property, plant and equipment | 7,001 | 345 | 511 | |||||||||
Additions to property, plant and equipment | (19,008 | ) | (20,522 | ) | (30,210 | ) | ||||||
Changes in restricted cash | 1,400 | 1,800 | — | |||||||||
Purchase of investments | (2,653 | ) | (1,575 | ) | (5,066 | ) | ||||||
Miscellaneous, net | 2,007 | 69 | 2,607 | |||||||||
Net cash used in investing activities | (160,537 | ) | (19,883 | ) | (32,424 | ) | ||||||
Cash Flows from Financing Activities: | ||||||||||||
Increases in long-term debt | — | 200,000 | — | |||||||||
Payments on long-term debt | (2,000 | ) | (196,100 | ) | (15,900 | ) | ||||||
Payments of financing costs | (483 | ) | (2,470 | ) | (993 | ) | ||||||
Repurchase of Class A Common shares | (21,237 | ) | (74,199 | ) | (23,564 | ) | ||||||
Proceeds from employee stock options | 16,579 | 46,624 | 18,215 | |||||||||
Tax payments related to shares withheld for vested stock and RSUs | (4,261 | ) | (6,270 | ) | (7,658 | ) | ||||||
Excess tax benefits from stock compensation plans | 8,352 | — | 4,206 | |||||||||
Miscellaneous, net | (1,264 | ) | (2,594 | ) | 289 | |||||||
Net cash used in financing activities | (4,314 | ) | (35,009 | ) | (25,405 | ) | ||||||
(Decrease) increase in cash and cash equivalents | (62,796 | ) | (21,387 | ) | 114,753 | |||||||
Cash and cash equivalents: | ||||||||||||
Beginning of year | 221,255 | 242,642 | 127,889 | |||||||||
End of year | $ | 158,459 | $ | 221,255 | $ | 242,642 | ||||||
See notes to consolidated financial statements.
F-31
The E. W. Scripps Company
Consolidated Statements of Equity
(in thousands, except share data) | Common Stock | Additional Paid-in Capital | Retained Earnings | Accumulated Other Comprehensive Loss | Noncontrolling Interests | Total Equity | ||||||||||||||||||
As of December 31, 2011 | $ | 543 | $ | 515,421 | $ | 96,105 | $ | (97,548 | ) | $ | 2,480 | $ | 517,001 | |||||||||||
Net income (loss) | — | — | 40,188 | — | (266 | ) | 39,922 | |||||||||||||||||
Changes in defined benefit pension plans | — | — | — | (18,009 | ) | — | (18,009 | ) | ||||||||||||||||
Change in fair value of derivative | — | — | — | (1,009 | ) | — | (1,009 | ) | ||||||||||||||||
Repurchase 2,478,453 Class A Common Shares | (25 | ) | (23,539 | ) | — | — | — | (23,564 | ) | |||||||||||||||
Compensation plans: 3,718,800 net shares issued * | 37 | 18,253 | — | — | — | 18,290 | ||||||||||||||||||
Excess tax expense of compensation plans | — | 7,553 | — | — | — | 7,553 | ||||||||||||||||||
Other | — | — | — | (274 | ) | — | (274 | ) | ||||||||||||||||
As of December 31, 2012 | 555 | 517,688 | 136,293 | (116,840 | ) | 2,214 | 539,910 | |||||||||||||||||
Net loss | — | — | (474 | ) | — | (250 | ) | (724 | ) | |||||||||||||||
Changes in defined benefit pension plans | — | — | — | 35,811 | — | 35,811 | ||||||||||||||||||
Change in fair value of derivative | — | — | — | 291 | — | 291 | ||||||||||||||||||
Repurchase 5,065,660 Class A Common Shares | (51 | ) | (55,222 | ) | (18,926 | ) | — | — | (74,199 | ) | ||||||||||||||
Compensation plans: 5,565,932 net shares issued * | 56 | 46,777 | — | — | — | 46,833 | ||||||||||||||||||
Other | — | — | — | (185 | ) | — | (185 | ) | ||||||||||||||||
As of December 31, 2013 | 560 | 509,243 | 116,893 | (80,923 | ) | 1,964 | 547,737 | |||||||||||||||||
Net income (loss) | — | — | 10,529 | — | (307 | ) | 10,222 | |||||||||||||||||
Changes in defined benefit pension plans | — | — | — | (45,500 | ) | — | (45,500 | ) | ||||||||||||||||
Change in fair value of derivative | — | — | — | 239 | — | 239 | ||||||||||||||||||
Repurchase 1,181,560 Class A Common Shares | (12 | ) | (12,496 | ) | (8,729 | ) | — | — | (21,237 | ) | ||||||||||||||
Compensation plans: 2,149,581 net shares issued * | 22 | 20,138 | — | — | — | 20,160 | ||||||||||||||||||
Excess tax expense of compensation plans | — | 8,571 | — | — | — | 8,571 | ||||||||||||||||||
Other | — | — | — | (259 | ) | — | (259 | ) | ||||||||||||||||
As of December 31, 2014 | $ | 570 | $ | 525,456 | $ | 118,693 | $ | (126,443 | ) | $ | 1,657 | $ | 519,933 | |||||||||||
* Net of tax payments related to shares withheld for vested stock and RSUs of $4,261 in 2014, $6,270 in 2013, and $7,658 in 2012.
See notes to consolidated financial statements.
F-32
THE E. W. SCRIPPS COMPANY
NOTES TO CONSOLIDATED FINANCIAL STATEMENTS
1. Summary of Significant Accounting Policies
As used in the Notes to Consolidated Financial Statements, the terms “Scripps,” “Company,” “we,” “our,” or “us” may, depending on the context, refer to The E. W. Scripps Company, to one or more of its consolidated subsidiary companies or to all of them taken as a whole.
Nature of Operations — We are a diverse media enterprise with a portfolio of television, print and digital media brands. All of our media businesses provide content and advertising services via digital platforms, including the web, smartphones and tablets. Our media businesses are organized into the following reportable business segments: television, newspapers and syndication and other.
Basis of Presentation — Certain amounts in prior periods have been reclassified to conform to the current period’s presentation.
Concentration Risks — Our operations are geographically dispersed and we have a diverse customer base. We believe bad debt losses resulting from default by a single customer, or defaults by customers in any depressed region or business sector, would not have material effect on our financial position, results of operations or cash flows.
We derive approximately 74% of our operating revenues from marketing services, including advertising. Changes in the demand for such services, both nationally and in individual markets, can affect operating results.
Use of Estimates — Preparing financial statements in accordance with accounting principles generally accepted in the United States of America requires us to make a variety of decisions that affect the reported amounts and the related disclosures. Such decisions include the selection of accounting principles that reflect the economic substance of the underlying transactions and the assumptions on which to base accounting estimates. In reaching such decisions, we apply judgment based on our understanding and analysis of the relevant circumstances, including our historical experience, actuarial studies and other assumptions.
Our financial statements include estimates and assumptions used in accounting for our defined benefit pension plans; the periods over which long-lived assets are depreciated or amortized; the fair value of long-lived assets, goodwill and indefinite lived assets; the liability for uncertain tax positions and valuation allowances against deferred income tax assets; the fair value of assets acquired and liabilities assumed in business combinations; and self-insured risks.
While we re-evaluate our estimates and assumptions on an ongoing basis, actual results could differ from those estimated at the time of preparation of the financial statements.
Consolidation — The consolidated financial statements include the accounts of The E. W. Scripps Company and its majority-owned subsidiary companies. Investments in 20%-to-50%-owned companies where we exert significant influence and all 50%-or-less-owned partnerships and limited liability companies are accounted for using the equity method. We do not hold any interests in variable interest entities. All significant intercompany transactions have been eliminated.
Income (loss) attributable to noncontrolling interests in subsidiary companies is included in net income (loss) attributable to noncontrolling interest in the Consolidated Statements of Operations.
Revenue Recognition — We recognize revenue when persuasive evidence of a sales arrangement exists, delivery occurs or services are rendered, the sales price is fixed or determinable and collectability is reasonably assured. When a sales arrangement contains multiple elements, such as the sale of advertising and other services, we allocate revenue to each element based upon its relative fair value. We report revenue net of sales and other taxes collected from our customers.
Our primary sources of revenue are from the sale of print, broadcast and digital advertising, retransmission fees received from cable operators and satellite carriers and newspaper subscription fees.
Revenue recognition policies for each source of revenue are as follows.
Advertising — Print and broadcast advertising revenue is recognized, net of agency commissions, when we display the advertisements. Digital advertising includes time-based, impression-based, and click-through campaigns. We recognize digital advertising revenue from fixed duration campaigns over the period in which the advertising appears. We recognize digital
F-33
advertising revenue that is based upon the number of impressions delivered or the number of click-throughs as impressions are delivered or as click-throughs occur.
Advertising arrangements, which generally have a term of one year or less, may provide rebates, discounts and bonus advertisements based upon the volume of advertising purchased during the terms of the contracts. This requires us to make certain estimates regarding future advertising volumes. We record estimated rebates, discounts and bonus advertisements as a reduction of revenue in the period the advertisement is displayed.
Broadcast advertising arrangements may guarantee the advertiser a minimum audience. We provide the advertiser with additional advertising time if we do not deliver the guaranteed audience size. We recognize broadcast advertising revenue as the guaranteed minimum audience is delivered.
Newspaper Subscriptions — We recognize newspaper subscription revenue upon the publication date of the newspaper. We defer revenues from prepaid newspaper subscriptions and recognize subscription revenue on a pro-rata basis over the term of the subscription.
We base subscription revenue for newspapers sold directly to subscribers on the retail rate. We base subscription revenue for newspapers sold to independent newspaper distributors, which are subject to returns, upon the wholesale rate. We estimate returns based on historical return rates and adjust our estimates based on the actual returns.
Retransmission — We derive revenues from cable and satellite retransmission of our broadcast signal. We recognize retransmission revenues based on the contractual terms and rates.
Other Revenues — We also derive revenues from printing and distribution of other publications. We recognize printing revenues and third-party distribution revenue when the product is delivered in accordance with the customer’s instructions.
Cash Equivalents — Cash-equivalents represent highly liquid investments with an original maturity of less than three months.
Inventories — Inventories are stated at the lower of cost or market. We determine the cost of inventories using the first in, first out (“FIFO”) method.
Trade Receivables — We extend credit to customers based upon our assessment of the customer’s financial condition. Collateral is generally not required from customers. We base allowances for credit losses upon trends, economic conditions, review of aging categories, specific identification of customers at risk of default and historical experience. We require advance payment from political advertisers and certain transient advertisers.
A rollforward of the allowance for doubtful accounts is as follows:
(in thousands) | ||||
January 1, 2012 | $ | 1,885 | ||
Charged to revenues, costs and expenses | 1,717 | |||
Amounts charged off, net | (1,111 | ) | ||
Balance as of December 31, 2012 | 2,491 | |||
Charged to revenues, costs and expenses | 1,043 | |||
Amounts charged off, net | (1,507 | ) | ||
Balance as of December 31, 2013 | 2,027 | |||
Charged to revenues, costs and expenses | 1,705 | |||
Amounts charged off, net | (1,596 | ) | ||
Balance as of December 31, 2014 | $ | 2,136 | ||
Investments — We make investments in private companies. Investment securities can be impacted by various market risks, including interest rate risk, credit risk and overall market volatility. Due to the level of risk associated with certain investment securities, it is reasonably possible that changes in the values of investment securities will occur in the near term. Such changes could materially affect the amounts reported in our financial statements.
We record investments in private companies not accounted for under the equity method at cost, net of impairment write-downs, because no readily determinable market price is available.
F-34
We regularly review our investments to determine if there has been any other-than-temporary decline in value. These reviews require management judgments that often include estimating the outcome of future events and determining whether factors exist that indicate impairment has occurred. We evaluate, among other factors, the extent to which cost exceeds fair value; the duration of the decline in fair value below cost; and the current cash position, earnings and cash forecasts and near term prospects of the investee. We reduce the cost basis when a decline in fair value below cost is determined to be other than temporary, with the resulting adjustment charged against earnings.
Property, Plant and Equipment — Property, plant and equipment is carried at cost less depreciation. Property, plant and equipment includes internal use software, mobile app development and digital site development cost, which is carried at cost less amortization. We expense costs incurred in the preliminary project stage to develop or acquire internal use software, and to develop mobile apps or digital sites. Upon completion of the preliminary project stage and upon management authorization of the project, we capitalize costs to acquire or develop internal use software or digital sites, which primarily include coding, designing system interfaces, and installation and testing, if it is probable the project will be completed and the software will be used for its intended function. We expense costs incurred after implementation, such as maintenance and training.
We compute depreciation using the straight-line method over estimated useful lives as follows:
Buildings and improvements | 35 to 45 years |
Leasehold improvements | Shorter of term of lease or useful life |
Printing presses | 20 to 30 years |
Other newspaper production equipment | 5 to 15 years |
Television transmission towers and related equipment | 15 to 35 years |
Other television and program production equipment | 3 to 15 years |
Computer hardware and software | 3 to 5 years |
Office and other equipment | 3 to 10 years |
Programs and Program Licenses — Programs and program licenses include the cost of national television network programming, programming produced by us or for us by independent production companies and programs licensed under agreements with independent producers.
Our network affiliation agreements require the payment of affiliation fees to the network. Network affiliation fees include both pre-determined fixed fees and variable payments based on other factors, including a share of retransmission revenues above a threshold. Network fees are based on the greater of a minimum amount or percentage of retransmission revenues and we base our expense on the greater of the two.
Program licenses generally have fixed terms, limit the number of times we can air the programs and require payments over the terms of the licenses. We record licensed program assets and liabilities when the programs become available for broadcast. We do not discount program licenses for imputed interest. We amortize program licenses based upon expected cash flows over the term of the license agreement. We classify the portion of the unamortized balance expected to be amortized within one year as a current asset.
The costs of programming produced by us or for us by independent production companies are expensed over the course of the television season. Internal costs, including employee compensation and benefits, to produce daily or live broadcast shows, such as news, sports or daily magazine shows, are expensed as incurred and are not classified in our Consolidated Statements of Operations as program costs.
We review the net realizable value of programs and program licenses for impairment using a day-part methodology, whereby programs broadcast during a particular time period, such as prime time, are evaluated on an aggregate basis.
Program rights liabilities payable within the next twelve months are included in accounts payable. Noncurrent program rights liabilities are included in other noncurrent liabilities.
Goodwill and Other Indefinite-Lived Intangible Assets — Goodwill represents the cost of acquisitions in excess of the acquired businesses’ tangible assets and identifiable intangible assets.
FCC licenses represent the value assigned to the broadcast licenses of acquired broadcast television stations. Broadcast television stations are subject to the jurisdiction of the Federal Communications Commission (“FCC”) which prohibits the operation of stations except in accordance with an FCC license. FCC licenses stipulate each station’s operating parameters as
F-35
defined by channels, effective radiated power and antenna height. FCC licenses are granted for a term of up to eight years, and are renewable upon request. We have never had a renewal request denied and all previous renewals have been for the maximum term.
We do not amortize goodwill and other indefinite-lived intangible assets, but we review them for impairment at least annually. We perform our annual impairment review during the fourth quarter of each year in conjunction with our annual planning cycle. We also assess, at least annually, whether assets classified as indefinite-lived intangible assets continue to have indefinite lives.
We review goodwill for impairment based upon reporting units, which are defined as operating segments or groupings of businesses one level below the operating segment level. Reporting units with similar economic characteristics are aggregated into a single unit when testing goodwill for impairment. Our reporting units are our television group and Newsy.
Amortizable Intangible Assets — Television network affiliations represents the value assigned to an acquired broadcast television station’s relationship with a national television network. Television stations affiliated with national television networks typically have greater profit margins than independent television stations, primarily due to audience recognition of the television station as a network affiliate. We amortize these network affiliation relationships on a straight-line basis over estimated useful lives of 20 years.
We amortize customer lists and other intangible assets in relation to their expected future cash flows over estimated useful lives of up to 20 years.
Impairment of Long-Lived Assets — We review long-lived assets (primarily property, plant and equipment and amortizable intangible assets) for impairment whenever events or circumstances indicate the carrying amounts of the assets may not be recoverable. Recoverability is determined by comparing the forecasted undiscounted cash flows of the operation to which the assets relate to the carrying amount of the assets. If the undiscounted cash flow is less than the carrying amount of the assets, then amortizable intangible assets are written down first, followed by other long-lived assets, to fair value. We determine fair value based on discounted cash flows or appraisals. We report long-lived assets to be disposed of at the lower of carrying amount or fair value less costs to sell.
Self-Insured Risks — We are self-insured, up to certain limits, for general and automobile liability, employee health, disability and workers’ compensation claims and certain other risks. Estimated liabilities for unpaid claims totaled $14.3 million and $16.3 million at December 31, 2014 and 2013, respectively. We estimate liabilities for unpaid claims using actuarial methodologies and our historical claims experience. While we re-evaluate our assumptions and review our claims experience on an ongoing basis, actual claims paid could vary significantly from estimated claims, which would require adjustments to expense.
Income Taxes — We recognize deferred income taxes for temporary differences between the tax basis and reported amounts of assets and liabilities that will result in taxable or deductible amounts in future years. We establish a valuation allowance if we believe that it is more likely than not that we will not realize some or all of the deferred tax assets.
We record a liability for unrecognized tax benefits resulting from uncertain tax positions taken or that we expect to take in a tax return. Interest and penalties associated with such tax positions are included in the tax provision. The liability for additional taxes and interest is included in other liabilities in the Consolidated Balance Sheets.
Newsprint, Press Supplies and Other Printing Costs — Newsprint, press supplies and other printing costs include costs incurred to print and produce our newspapers and other publications. We expense these costs as incurred.
Risk Management Contracts — We do not hold derivative financial instruments for trading or speculative purposes and we do not hold leveraged contracts. From time to time, we may use derivative financial instruments to limit the impact of interest rate fluctuations on our earnings and cash flows.
Stock-Based Compensation — We have a Long-Term Incentive Plan (the “Plan”) which is described more fully in Note 20. The Plan provides for the award of incentive and nonqualified stock options, stock appreciation rights, restricted stock units (RSUs), restricted and unrestricted Class A Common shares and performance units to key employees and non-employee directors.
We recognize compensation cost based on the grant-date fair value of the award. We determine the fair value of awards that grant the employee the underlying shares by the fair value of a Class A Common share on the date of the award.
F-36
Certain awards of Class A Common shares or RSUs have performance conditions under which the number of shares granted is determined by the extent to which such performance conditions are met (“Performance Shares”). Compensation costs for such awards are measured by the grant-date fair value of a Class A Common share and the number of shares earned. In periods prior to completion of the performance period, compensation costs are based upon estimates of the number of shares that will be earned.
Compensation costs, net of estimated forfeitures due to termination of employment or failure to meet performance targets, are recognized on a straight-line basis over the requisite service period of the award. The requisite service period is generally the vesting period stated in the award. Grants to retirement-eligible employees are expensed immediately and grants to employees who will become retirement eligible prior to the end of the stated vesting period are expensed over such shorter period because stock compensation grants vest upon the retirement of the employee.
Earnings Per Share (“EPS”) — Unvested awards of share-based payments with rights to receive dividends or dividend equivalents, such as our RSUs, are considered participating securities for purposes of calculating EPS. Under the two-class method, we allocate a portion of net income to these participating securities and therefore exclude that income from the calculation of EPS for common stock. We do not allocate losses to the participating securities.
The following table presents information about basic and diluted weighted-average shares outstanding:
For the years ended December 31, | ||||||||||||
(in thousands) | 2014 | 2013 | 2012 | |||||||||
Numerator (for basic and diluted earnings per share) | ||||||||||||
Net income (loss) attributable to the shareholders of The E.W. Scripps Company | $ | 10,529 | $ | (474 | ) | $ | 40,188 | |||||
Less income allocated to RSUs | (240 | ) | — | (1,845 | ) | |||||||
Numerator for basic and diluted earnings per share | $ | 10,289 | $ | (474 | ) | $ | 38,343 | |||||
Denominator | ||||||||||||
Basic weighted-average shares outstanding | 56,342 | 56,516 | 54,907 | |||||||||
Effect of dilutive securities: | ||||||||||||
Stock options held by employees and directors | 897 | — | 474 | |||||||||
Diluted weighted-average shares outstanding | 57,239 | 56,516 | 55,381 | |||||||||
Anti-dilutive securities(1) | — | 4,957 | 176 | |||||||||
(1) | Amount outstanding at Balance Sheet date, before application of the treasury stock method and not weighted for period outstanding. |
For 2014 and 2012, in the determination of dilutive securities, the inclusion of RSUs as participating securities is more dilutive, and therefore, the dilutive EPS calculation excludes them. For 2013, we incurred a net loss and the inclusion of RSUs and stock options held by employees and directors were anti-dilutive, and accordingly the diluted EPS calculation excludes those common share equivalents.
Derivative Financial Instruments — It is our policy that derivative transactions are executed only to manage exposures arising in the normal course of business and not for the purpose of creating speculative positions or trading. Derivative financial instruments are utilized to manage interest rate risks. We do not hold derivative financial instruments for trading purposes. All derivatives must be recorded on the balance sheet at fair value. Each derivative is designated as a cash flow hedge or remains undesignated. Changes in the fair value of derivatives that are designated and effective as cash flow hedges are recorded in other comprehensive income and reclassified to the Consolidated Statement of Operations when the effects of the item being hedged are recognized in the statement of operations. These changes are offset in earnings to the extent the hedge was effective by fair value changes related to the risk being hedged on the hedged item. Changes in the fair value of undesignated hedges are recognized currently in the Consolidated Statement of Operations. All ineffective changes in derivative fair values are recognized currently in earnings.
All designated hedges are formally documented as to the relationship with the hedged item as well as the risk-management strategy. Both at inception and on an ongoing basis, the hedging instrument is assessed as to its effectiveness, when applicable. If and when a derivative is determined not to be highly effective as a hedge, or the underlying hedged transaction is no longer likely to occur, or the hedge designation is removed, or the derivative is terminated, the hedge accounting discussed above is discontinued.
F-37
2. Recently Adopted Standards and Issued Accounting Standards
Recently Adopted Accounting Standards — In May 2014, the Financial Accounting Standards Board (FASB) issued new guidance on revenue recognition. Under this new standard, an entity shall recognize revenue when it transfers promised goods or services to customers in an amount that reflects the consideration to which the entity expects to be entitled in exchange for those goods or services. The standard creates a five-step process that requires entities to exercise judgment when considering the terms of the contract(s) and all relevant facts and circumstances. This standard permits the use of either the retrospective or cumulative effect transition method and will be effective for us beginning in 2017. Early adoption is not permitted. We are currently assessing the impact this new guidance will have on our consolidated financial statements and have not yet determined a transition method.
In August 2014, the FASB issued new guidance related to the disclosures around going concern. The new standard provides guidance around management's responsibility to evaluate whether there is substantial doubt about an entity's ability to continue as a going concern and to provide related footnote disclosures. The new standard is effective for fiscal years, and interim periods within those fiscal years, beginning after December 15, 2016. Early adoption is permitted. The adoption of this standard is not expected to have a material impact on our consolidated financial statements.
3. Acquisitions
On June 16, 2014, we closed our acquisition of two television stations owned by Granite Broadcasting Corporation — the Detroit MyNetworkTV affiliate WMYD-TV and the Buffalo, N.Y. ABC affiliate WKBW-TV ("Acquired Granite Stations") — for $110 million in cash. The acquisition of WMYD-TV creates a duopoly with our Detroit ABC affiliate WXYZ-TV.
We finalized the determination of fair values of the assets acquired and the liabilities assumed in the fourth quarter of 2014. There were no material changes in the fair values of the assets acquired and the liabilities assumed from the preliminary amounts. The following table summarizes the final fair values.
(in thousands) | ||||
Assets: | ||||
Property, plant and equipment | $ | 12,025 | ||
Intangible assets | 53,500 | |||
Goodwill | 44,715 | |||
Total assets acquired | 110,240 | |||
Current liabilities | 240 | |||
Net purchase price | $ | 110,000 | ||
Of the $54 million allocated to intangible assets, $34 million was for FCC licenses which we have determined to have an indefinite life and therefore will not be amortized. The remaining balance of $19 million was allocated to television network affiliation relationships and advertiser relationships with estimated amortization periods of 10 to 20 years.
The goodwill of $45 million arising from the transaction consists largely of synergies and economies of scale and other benefits of a larger broadcast footprint, as well as synergies from being able to create a duopoly in our Detroit market. We have allocated the goodwill to our television segment. We will treat this purchase as an asset acquisition for income tax purposes resulting in a step-up in the assets acquired. The goodwill is deductible for income tax purposes.
Pro forma results of operations, assuming the transaction had taken place at the beginning of 2013, are included in the following table. The pro forma information includes the historical results of operations of Scripps and the Acquired Granite Stations and adjustments for additional depreciation and amortization of the assets acquired. The pro forma information does not include efficiencies, cost reductions or synergies expected to result from the acquisition. The unaudited pro forma financial information is not necessarily indicative of the results that actually would have occurred had the acquisition been completed at the beginning of the period.
For the year ended December 31, | ||||||||
(in thousands, except per share data) (unaudited) | 2014 | 2013 | ||||||
Operating revenues | $ | 883,307 | $ | 847,890 | ||||
Income from operations attributable to the shareholders of The E.W. Scripps Company | 12,062 | 4,441 | ||||||
Income per share from operations attributable to the shareholders of The E.W. Scripps Company: | ||||||||
Basic | $ | 0.21 | $ | 0.08 | ||||
Diluted | 0.21 | 0.07 | ||||||
On January 1, 2014 we completed our acquisition of Media Convergence Group, Inc., which operates as Newsy, a digital video news provider, for $35 million in cash, plus a working capital adjustment of $0.2 million.
We finalized the determination of fair values of the assets acquired and the liabilities assumed in the fourth quarter of 2014. There were no material changes in the fair values of the assets acquired and the liabilities assumed from the preliminary amounts. The following table summarizes the final fair values.
(in thousands) | ||||
Assets: | ||||
Accounts receivable | $ | 640 | ||
Other assets | 74 | |||
Equipment and software | 631 | |||
Intangible assets | 5,900 | |||
Goodwill | 28,983 | |||
Total assets acquired | 36,228 | |||
Current liabilities | 116 | |||
Long-term deferred tax liability | 890 | |||
Net purchase price | $ | 35,222 | ||
Of the $6 million allocated to intangible assets, $4 million was allocated to customer relationships with an estimated amortization period of 5 years and the balance of $2 million was allocated to various other intangible assets.
The goodwill of $29 million arising from the transaction consists largely of the benefit we will derive from being able to enter the digital video market with an established business. We have allocated the goodwill to our syndication and other segment. We will treat the transaction as a purchase of stock for income tax purposes resulting in no step-up in the basis of the assets acquired. The goodwill will not be deductible for income tax purposes. We are not presenting any pro forma results of operations since the impact of the acquisition is not material to prior year results of operations.
On September 16, 2014, we completed our acquisition of Geoterrestrial, Inc. ("WeatherSphere") for $4 million. WeatherSphere is a provider of weather-related mobile apps. The stock purchase agreement includes an earnout provision, whereby up to an additional $2.5 million may be payable over a three year period. We have estimated the fair value of the earnout to be $1.2 million. We are not presenting any pro forma results of operations since the impact of the acquisition is not material to prior periods results of operations.
4. Asset Write-Downs and Other Charges and Credits
Income (loss) from operations was affected by the following:
2014 — Acquisition and related integration costs of $14.0 million include costs associated with the acquisition of two television stations from Granite Broadcasting, as well as costs for spinning off our newspaper operations and the acquisition of Journal's broadcast business.
We recorded a $3.0 million gain from the sale of excess land in our newspaper business.
F-38
We recorded a $5.9 million non-cash charge to reduce the carrying value of investments.
In 2014, we were in the final stages of the system implementations for our newspaper division and any remaining restructuring costs are now included in segment operating results.
2013 — Restructuring costs, primarily at our newspaper operations, totaled $4.9 million. Restructuring costs primarily include costs associated with efforts to simplify and standardize advertising and circulation systems and other processes in our newspaper division.
We recorded a $4.5 million non-cash loss on the disposition of an investment and to reduce the carrying value of investments.
We recorded a $4.6 million non-cash charge to write-off unamortized deferred loan fees and costs as a result of the debt refinance in the fourth quarter of 2013.
2012 — Restructuring costs, primarily at our newspaper operations, totaled $9.3 million. Restructuring costs primarily include costs associated with efforts to simplify and standardize advertising and circulation systems and other processes in our newspaper division.
We incurred a $5.7 million non-cash charge to terminate the McGraw-Hill stations' national representation agreement. We decided to use our existing national representative in all Scripps markets. As an inducement, our existing national representative firm agreed to pay the $5.7 million termination fee on our behalf.
We recorded a $1.4 million non-cash charge to reduce the carrying value of investments.
5. Income Taxes
We file a consolidated federal income tax return, consolidated unitary returns in certain states, and other separate state income tax returns for certain of our subsidiary companies.
The provision for income taxes consisted of the following:
For the years ended December 31, | ||||||||||||
(in thousands) | 2014 | 2013 | 2012 | |||||||||
Current: | ||||||||||||
Federal | $ | 2,358 | $ | 319 | $ | 8,171 | ||||||
State and local | (7,825 | ) | (3,102 | ) | 517 | |||||||
Total current income tax provision | (5,467 | ) | (2,783 | ) | 8,688 | |||||||
Deferred: | ||||||||||||
Federal | 7,904 | (4,842 | ) | 7,185 | ||||||||
Other | (405 | ) | (223 | ) | 1,112 | |||||||
Total deferred income tax provision | 7,499 | (5,065 | ) | 8,297 | ||||||||
Provision (benefit) for income taxes | $ | 2,032 | $ | (7,848 | ) | $ | 16,985 | |||||
F-39
The difference between the statutory rate for federal income tax and the effective income tax rate was as follows:
For the years ended December 31, | |||||||||
2014 | 2013 | 2012 | |||||||
Statutory rate | 35.0 | % | 35.0 | % | 35.0 | % | |||
Effect of: | |||||||||
State and local income taxes, net of federal tax benefit | 5.1 | 4.4 | 2.1 | ||||||
Nondeductible expenses | 19.4 | (9.6 | ) | 0.4 | |||||
Reserve for uncertain tax positions | (48.7 | ) | 35.7 | (7.3 | ) | ||||
Amended returns and settlements | — | 16.6 | — | ||||||
Other | 5.8 | 9.5 | (0.4 | ) | |||||
Effective income tax rate | 16.6 | % | 91.6 | % | 29.8 | % | |||
Nondeductible expenses in 2014 includes amounts for transaction costs related to the Journal Transactions.
The approximate effect of the temporary differences giving rise to deferred income tax assets (liabilities) were as follows:
As of December 31, | ||||||||
(in thousands) | 2014 | 2013 | ||||||
Temporary differences: | ||||||||
Property, plant and equipment | $ | (42,418 | ) | $ | (44,448 | ) | ||
Goodwill and other intangible assets | (9,803 | ) | (2,684 | ) | ||||
Investments, primarily gains and losses not yet recognized for tax purposes | 7,162 | 4,750 | ||||||
Accrued expenses not deductible until paid | 13,011 | 11,865 | ||||||
Deferred compensation and retiree benefits not deductible until paid | 66,002 | 37,041 | ||||||
Other temporary differences, net | 4,135 | 25 | ||||||
Total temporary differences | 38,089 | 6,549 | ||||||
Federal and state net operating loss carryforwards | 13,605 | 21,123 | ||||||
Valuation allowance for state deferred tax assets | (912 | ) | (1,078 | ) | ||||
Net deferred tax asset | $ | 50,782 | $ | 26,594 | ||||
Total federal operating loss carryforwards were $37 million and state operating loss carryforwards were $246 million at December 31, 2014. Our federal tax loss carryforwards and our state tax loss carryforwards expire through 2034. Because we file separate state income tax returns for certain of our subsidiary companies, we are not able to use state tax losses of a subsidiary company to offset state taxable income of another subsidiary company.
Deferred tax assets totaled $51 million at December 31, 2014. Management believes that it is more likely than not that we will realize the benefits of our federal deferred tax assets and therefore has not recorded a valuation allowance for our federal deferred tax assets. If economic conditions worsen, future estimates of taxable income could be lower than our current estimates, which may require valuation allowances to be recorded in future reporting periods.
We recognize state net operating loss carryforwards as deferred tax assets, subject to valuation allowances. At each balance sheet date, we estimate the amount of carryforwards that are not expected to be used prior to expiration of the carryforward period. The tax effect of the carryforwards that are not expected to be used prior to their expiration is included in the valuation allowance.
During 2013, deferred tax assets relating to employee share-based compensation from the vesting of RSU's and the exercise of stock options have not been recognized since we were in a net tax loss position in 2013. The additional tax benefits were reflected as net operating loss carryforwards when we filed our 2013 tax return, but the additional tax benefits are not recorded under GAAP until the tax deduction reduces taxes payable. When the tax benefit is recognized, it will be recorded as additional paid-in capital. The amount of unrecognized tax deductions for the year ended December 31, 2014 and 2013 was approximately $23 million. Tax deductions of $22.9 million related to share-based compensation for exercises of grants in 2014
F-40
have been recognized in accordance with the ordering method in GAAP resulting in a $8.6 million adjustment to additional paid-in capital.
A reconciliation of the beginning and ending balances of the total amounts of gross unrecognized tax benefits is as follows:
For the years ended December 31, | ||||||||||||
(in thousands) | 2014 | 2013 | 2012 | |||||||||
Gross unrecognized tax benefits at beginning of year | $ | 14,824 | $ | 16,386 | $ | 21,240 | ||||||
Increases in tax positions for prior years | — | 2,692 | 623 | |||||||||
Decreases in tax positions for prior years | (525 | ) | — | (1,287 | ) | |||||||
Decreases from lapse in statute of limitations | (7,275 | ) | (2,670 | ) | (4,190 | ) | ||||||
Settlements | — | (1,584 | ) | — | ||||||||
Gross unrecognized tax benefits at end of year | $ | 7,024 | $ | 14,824 | $ | 16,386 | ||||||
The total amount of net unrecognized tax benefits that, if recognized, would affect the effective tax rate was $3 million at December 31, 2014. We accrue interest and penalties related to unrecognized tax benefits in our provision for income taxes. At December 31, 2014 and 2013, we had accrued interest related to unrecognized tax benefits of $1.2 million and $2.4 million, respectively.
We file income tax returns in the U.S. and in various state and local jurisdictions. We are routinely examined by tax authorities in these jurisdictions. At December 31, 2014, we are no longer subject to federal income tax examinations for years prior to 2012. For state and local jurisdictions, we are generally no longer subject to income tax examinations for years prior to 2010.
In 2014 and 2013, we recognized $6.0 million and $3.1 million, respectively, of previously unrecognized net tax benefits primarily due to the lapse of the statute of limitations in certain tax jurisdictions.
Due to the potential for resolution of federal and state examinations, and the expiration of various statutes of limitation, it is reasonably possible that our gross unrecognized tax benefits balance may change within the next twelve months by as much as $2.6 million.
6. Restricted Cash
At December 31, 2014 and 2013, we had $6.8 million and $8.2 million, respectively, in a restricted cash account on deposit with our insurance carrier. This account serves as collateral, in place of an irrevocable stand-by letter of credit, to provide financial assurance that we will fulfill our obligations with respect to cash requirements associated with our workers compensation self-insurance. This cash is to remain on deposit with the carrier until all claims have been paid or we provide a letter of credit in lieu of the cash deposit.
7. Investments
Investments consisted of the following:
As of December 31, | ||||||||
(in thousands) | 2014 | 2013 | ||||||
Investments held at cost | $ | 5,503 | $ | 11,724 | ||||
Equity method investments | 4,027 | 4,843 | ||||||
Total investments | $ | 9,530 | $ | 16,567 | ||||
Our investments do not trade in public markets, thus they do not have readily determinable fair values. We estimate the fair values of the investments to approximate their carrying values at December 31, 2014 and 2013. There can be no assurance we would realize the carrying values of these securities upon their sale.
F-41
8. Property, Plant and Equipment
Property, plant and equipment consisted of the following:
As of December 31, | ||||||||
(in thousands) | 2014 | 2013 | ||||||
Land and improvements | $ | 74,510 | $ | 73,980 | ||||
Buildings and improvements | 234,272 | 231,219 | ||||||
Equipment | 482,241 | 472,407 | ||||||
Computer software | 35,961 | 36,155 | ||||||
Total | 826,984 | 813,761 | ||||||
Accumulated depreciation | 483,595 | 459,964 | ||||||
Net property, plant and equipment | $ | 343,389 | $ | 353,797 | ||||
F-42
9. Goodwill and Other Intangible Assets
Goodwill by business segment was as follows:
(in thousands) | Television | Newspapers | Syndication and other | Total | ||||||||||||
Gross balance as of December 31, 2011 | $ | 244,005 | $ | 778,900 | $ | — | $ | 1,022,905 | ||||||||
Accumulated impairment losses | (215,414 | ) | (778,900 | ) | — | (994,314 | ) | |||||||||
Net balance as of December 31, 2011 | 28,591 | — | — | 28,591 | ||||||||||||
Purchase accounting adjustments in 2012 | (625 | ) | — | — | (625 | ) | ||||||||||
Balance as of December 31, 2012 | $ | 27,966 | $ | — | $ | — | $ | 27,966 | ||||||||
Gross balance as of December 31, 2012 | $ | 243,380 | $ | 778,900 | $ | — | $ | 1,022,280 | ||||||||
Accumulated impairment losses | (215,414 | ) | (778,900 | ) | — | (994,314 | ) | |||||||||
Balance as of December 31, 2013 | $ | 27,966 | $ | — | $ | — | $ | 27,966 | ||||||||
Gross balance as of December 31, 2013 | $ | 243,380 | $ | 778,900 | $ | — | $ | 1,022,280 | ||||||||
Accumulated impairment losses | (215,414 | ) | (778,900 | ) | — | (994,314 | ) | |||||||||
Net balance as of December 31, 2013 | 27,966 | — | — | 27,966 | ||||||||||||
2014 Newsy acquisition | — | — | 28,983 | 28,983 | ||||||||||||
2014 Granite Stations acquisitions | 44,715 | — | — | 44,715 | ||||||||||||
2014 WeatherSphere acquisition | — | — | 4,597 | 4,597 | ||||||||||||
Balance as of December 31, 2014 | $ | 72,681 | $ | — | $ | 33,580 | $ | 106,261 | ||||||||
Gross balance as of December 31, 2014 | $ | 288,095 | $ | 778,900 | $ | 33,580 | $ | 1,100,575 | ||||||||
Accumulated impairment losses | (215,414 | ) | (778,900 | ) | — | (994,314 | ) | |||||||||
Net balance as of December 31, 2014 | $ | 72,681 | $ | — | $ | 33,580 | $ | 106,261 | ||||||||
Other intangible assets consisted of the following:
As of December 31, | ||||||||
(in thousands) | 2014 | 2013 | ||||||
Amortizable intangible assets: | ||||||||
Carrying amount: | ||||||||
Television network affiliation relationships | $ | 93,944 | $ | 78,844 | ||||
Customer lists and advertiser relationships | 30,404 | 22,304 | ||||||
Other | 5,761 | 3,561 | ||||||
Total carrying amount | 130,109 | 104,709 | ||||||
Accumulated amortization: | ||||||||
Television network affiliation relationships | (14,092 | ) | (9,691 | ) | ||||
Customer lists and advertiser relationships | (16,416 | ) | (13,138 | ) | ||||
Other | (2,556 | ) | (1,833 | ) | ||||
Total accumulated amortization | (33,064 | ) | (24,662 | ) | ||||
Net amortizable intangible assets | 97,045 | 80,047 | ||||||
Other indefinite-lived intangible assets — FCC licenses | 92,215 | 57,815 | ||||||
Total other intangible assets | $ | 189,260 | $ | 137,862 | ||||
Estimated amortization expense of intangible assets for each of the next five years is $9.0 million in 2015, $9.0 million in 2016, $6.5 million in 2017, $6.5 million in 2018, $5.5 million in 2019 and $60.5 million in later years.
F-43
10. Long-Term Debt
Long-term debt consisted of the following:
As of December 31, | ||||||||
(in thousands) | 2014 | 2013 | ||||||
Variable rate credit facility | $ | — | $ | — | ||||
Term loan | 198,000 | 200,000 | ||||||
Long-term debt | 198,000 | 200,000 | ||||||
Current portion of long-term debt | 2,000 | 2,000 | ||||||
Long-term debt (less current portion) | $ | 196,000 | $ | 198,000 | ||||
Fair value of long-term debt * | $ | 194,000 | $ | 200,000 | ||||
* Fair value of the term loan was estimated based on quoted private market transactions and is classified as Level 1 in the fair value hierarchy.
On November 26, 2013, we entered into a $275 million revolving credit and term loan agreement (“Financing Agreement”) to provide liquidity for ongoing operations. The Financing Agreement includes a $200 million term loan B maturing in November 2020 and a $75 million revolving credit facility maturing in November 2018.
The Financing Agreement includes the maintenance of a net leverage ratio if we borrow more than 20% on the revolving credit facility. The term loan B requires that if we borrow additional amounts or make a permitted acquisition that we cannot exceed a stated net leverage ratio on a pro forma basis at the date of the transaction.
Interest is payable on the term loan B at rates based on LIBOR, with a 0.75% LIBOR floor, plus a fixed margin of 2.50%. Interest is payable on the revolving credit facility at rates based on LIBOR plus a margin based on our leverage ratio ranging from 2.25% to 2.75%. As of December 31, 2014, the interest rate was 3.25% on the term loan B. The Financing Agreement also includes a provision that in certain circumstances we must use a portion of excess cash flow to repay debt. As of December 31, 2014, we were not required to make additional principal payments based on excess cash flow. The weighted-average interest rate on borrowings was 3.25% and 3.66% during December 31, 2014 and 2013, respectively.
Scheduled principal payments on long-term debt at December 31, 2014 are: $2.0 million in 2015, $2.0 million in 2016 $2.0 million in 2017, $2.0 million in 2018, $2.0 million in 2019 and $188.0 million thereafter.
Under the terms of the Financing Agreement, we granted the lenders mortgages on certain of our real property, pledges of our equity interests in our subsidiaries and security interests in substantially all other personal property, including cash, accounts receivables, inventories and equipment.
The Financing Agreement allows us to make restricted payments (dividends and stock repurchases) up to $50 million plus additional amounts based on our financial results and condition. We can make additional stock repurchases equal to the amount of proceeds that we receive from the exercise of stock options held by our employees. We can also make acquisitions as long as the pro forma net leverage ratio is less than 4.5 to 1.0.
Commitment fees of 0.30% to 0.50% per annum, based on our leverage ratio, of the total unused commitment are payable under the revolving credit facility.
As of December 31, 2014 and 2013, we had outstanding letters of credit totaling $0.2 million.
11. Financial Instruments
We are exposed to various market risks, including changes in interest rates. To manage risks associated with the volatility of changes in interest rates, we may enter into interest rate management instruments.
We may utilize interest rate swaps to manage our interest expense exposure by fixing our interest rate on portions of our floating rate term loan. We have entered into a $75 million notional value interest rate swap expiring in December 2016 which provides for a fixed interest rate of 1.08%. We did not provide or receive any collateral for this contract. The fair value of this financial derivative, which was designated as and qualified as a cash flow hedge through November 2013, is determined using the market standard methodology of netting the discounted future fixed cash receipts (or payments) and the discounted expected variable cash payments (or receipts). The variable cash payments (or receipts) are based the expectation of future
F-44
interest rates (forward curves) derived from observed market interest rate curves and implied volatilities. In addition, credit valuation adjustments, which consider the impact of any credit enhancements to the contracts, are incorporated in the fair values to account for potential nonperformance risk.
Fair Value of Derivative Instruments
The notional amounts and fair values of derivative instruments are shown in the table below:
December 31, 2014 | December 31, 2013 | |||||||||||||||||||||||
Notional amount | Fair value | Notional amount | Fair value | |||||||||||||||||||||
(in thousands) | Asset | Liability (1) | Asset | Liability (1) | ||||||||||||||||||||
Undesignated derivatives: | ||||||||||||||||||||||||
Interest rate swap | $ | 75,000 | $ | — | $ | 471 | $ | 75,000 | $ | — | $ | 723 | ||||||||||||
(1) Balance recorded as other liabilities in Consolidated Balance Sheets | ||||||||||||||||||||||||
Through November 2013, the above derivative instrument was designated as and qualified as a cash flow hedge and the effective portion of the unrealized gains and losses on the derivative was reported as a component of accumulated other comprehensive loss and reclassified into earnings in the same period or periods during which the hedged transactions affected earnings. Upon refinancing our term loan B in November 2013, this hedge no longer qualified as a cash flow hedge and gains and losses on the derivative are recognized in current period earnings. The balance in accumulated other comprehensive loss at the date of discontinuance of hedge accounting is being amortized into earnings on a straight-line basis through December 2016. For the years ended December 31, 2014 and 2013, approximately $0.4 million and less than $0.1 million, respectively, was amortized into earnings from accumulated other comprehensive loss and is included in the reclassified from accumulated OCL, gain/(loss) line in the table below.
As of December 31, | ||||||
(in thousands) | 2014 | 2013 | ||||
Effective portion recognized in accumulated OCL, gain/(loss) | — | (182 | ) | |||
Reclassified from accumulated OCL, gain/(loss) | 384 | 649 | ||||
Gain/(loss) on derivative | 252 | 468 | ||||
12. Fair Value Measurement
We measure certain financial assets at fair value on a recurring basis, such as cash equivalents and derivatives. The fair value of these financial assets and liabilities were determined based on three levels of inputs, of which the first two are considered observable and the last unobservable, that may be used to measure fair value. These levels of input are as follows:
• | Level 1 — Quoted prices in active markets for identical assets or liabilities. |
• | Level 2 — Inputs, other than quoted market prices in active markets, that are observable either directly or indirectly. |
• | Level 3 — Unobservable inputs based on our own assumptions. |
The following tables set forth our assets and liabilities that are measured at fair value on a recurring basis at December 31, 2014 and 2013:
December 31, 2014 | ||||||||||||||||
(in thousands) | Total | Level 1 | Level 2 | Level 3 | ||||||||||||
Assets/(liabilities): | ||||||||||||||||
Cash equivalents | $ | 10,000 | $ | 10,000 | $ | — | $ | — | ||||||||
Interest rate swap | (471 | ) | — | (471 | ) | — | ||||||||||
F-45
December 31, 2013 | ||||||||||||||||
(in thousands) | Total | Level 1 | Level 2 | Level 3 | ||||||||||||
Assets/(liabilities): | ||||||||||||||||
Cash equivalents | $ | 30,000 | $ | 30,000 | $ | — | $ | — | ||||||||
Interest rate swap | (723 | ) | — | (723 | ) | — | ||||||||||
13. Other Liabilities
Other liabilities consisted of the following:
As of December 31, | ||||||||
(in thousands) | 2014 | 2013 | ||||||
Employee compensation and benefits | $ | 19,537 | $ | 19,756 | ||||
Liability for pension benefits | 139,789 | 62,020 | ||||||
Liabilities for uncertain tax positions | 6,741 | 10,670 | ||||||
Other | 16,193 | 14,826 | ||||||
Other liabilities (less current portion) | $ | 182,260 | $ | 107,272 | ||||
14. Noncontrolling Interest
Individuals and other entities own a 4% noncontrolling interest in the capital stock of the subsidiary company that publishes our Memphis newspaper and a 6% noncontrolling interest in the capital stock of the subsidiary company that publishes our Evansville newspaper. We are not required to redeem the noncontrolling interests in these subsidiary companies.
15. Supplemental Cash Flow Information
The following table presents additional information about the change in certain working capital accounts:
For the years ended December 31, | ||||||||||||
(in thousands) | 2014 | 2013 | 2012 | |||||||||
Other changes in certain working capital accounts, net | ||||||||||||
Accounts and notes receivable | $ | 3,855 | $ | (14,064 | ) | $ | 10,181 | |||||
Income taxes receivable/payable, net | 4,692 | 2,490 | 34,412 | |||||||||
Accounts payable | 4,248 | (6,800 | ) | 5,631 | ||||||||
Accrued employee compensation and benefits | 6,064 | (10,132 | ) | 2,049 | ||||||||
Other accrued liabilities | 9,938 | 2,326 | 673 | |||||||||
Other, net | (557 | ) | (3,889 | ) | 7,648 | |||||||
Total | $ | 28,240 | $ | (30,069 | ) | $ | 60,594 | |||||
Information regarding supplemental cash flow disclosures is as follows:
For the years ended December 31, | ||||||||||||
(in thousands) | 2014 | 2013 | 2012 | |||||||||
Supplemental cash flow disclosures: | ||||||||||||
Interest paid, excluding amounts capitalized | $ | 7,244 | $ | 8,067 | $ | 9,339 | ||||||
Income taxes paid | $ | 455 | $ | 417 | $ | 7,088 | ||||||
F-46
16. Employee Benefit Plans
We sponsor various noncontributory defined benefit pension plans covering substantially all full-time employees that began employment prior to June 30, 2008. Benefits earned by employees are generally based upon employee compensation and years of service credits. We also have a non-qualified Supplemental Executive Retirement Plan ("SERP"). Effective June 30, 2009, we froze the accrual of benefits under our defined benefit pension plans and our SERP that cover the majority of our employees.
We sponsor a defined contribution plan covering substantially all non-union and certain union employees. We match a portion of employees' voluntary contributions to this plan. In connection with freezing the accrual of service credits under certain of our defined benefit pension plans, we began contributing additional amounts (transition credits) to certain employees' defined contribution retirement accounts in 2011. These transition credits, which we will make through 2015, are determined based upon the employee’s age, compensation and years of service.
Other union-represented employees are covered by defined benefit pension plans jointly sponsored by us and the union, or by union-sponsored multi-employer plans.
We use a December 31 measurement date for our retirement plans. Retirement plans expense is based on valuations as of the beginning of each fiscal year.
The components of the expense consisted of the following:
For the years ended December 31, | ||||||||||||
(in thousands) | 2014 | 2013 | 2012 | |||||||||
Service cost | $ | 85 | $ | 79 | $ | 104 | ||||||
Interest cost | 25,539 | 23,732 | 25,830 | |||||||||
Expected return on plan assets, net of expenses | (23,481 | ) | (21,501 | ) | (22,520 | ) | ||||||
Amortization of actuarial loss | 2,861 | 4,192 | 3,586 | |||||||||
Curtailment/Settlement losses | — | — | 664 | |||||||||
Total for defined benefit plans | 5,004 | 6,502 | 7,664 | |||||||||
Multi-employer plans | 393 | 407 | 467 | |||||||||
Withdrawal from GCIU multi-employer plan | 4,100 | — | — | |||||||||
SERP | 896 | 2,335 | 956 | |||||||||
Defined contribution plans | 11,739 | 11,379 | 10,538 | |||||||||
Net periodic benefit cost | 22,132 | 20,623 | 19,625 | |||||||||
Other changes in plan assets and benefit obligations recognized in other comprehensive income (loss) were as follows:
For the years ended December 31, | ||||||||||||
(in thousands) | 2014 | 2013 | 2012 | |||||||||
Current year actuarial gain/(loss) | $ | (75,527 | ) | $ | 52,063 | $ | (30,761 | ) | ||||
Amortization of actuarial loss | 2,861 | 4,192 | 4,246 | |||||||||
Amortization of prior service cost | — | — | 4 | |||||||||
Total | $ | (72,666 | ) | $ | 56,255 | $ | (26,511 | ) | ||||
In addition to the amounts summarized above, amortization of actuarial losses of $0.3 million, $0.4 million and $0.3 million were recorded through other comprehensive income in 2014, 2013 and 2012, respectively, related to our SERP plan. A current year actuarial loss of $0.6 million, $0.7 million and $2.3 million was recognized in 2014, 2013 and 2012, respectively, related to our SERP plan. In 2013, a settlement charge of $1.1 million was recorded for our SERP plan.
F-47
Assumptions used in determining the annual retirement plans expense were as follows:
2014 | 2013 | 2012 | |||||||
Discount rate | 5.08 | % | 4.27 | % | 5.29 | % | |||
Long-term rate of return on plan assets | 5.25 | % | 4.65 | % | 5.30 | % | |||
Increase in compensation levels | 2.0 | % | 3.3 | % | 3.3 | % | |||
The discount rate used to determine our future pension obligations is based on a dedicated bond portfolio approach that includes securities rated Aa or better with maturities matching our expected benefit payments from the plans. The increase in compensation levels assumption is based on actual past experience and our near-term outlook.
The expected long-term rate of return on plan assets is based upon the weighted-average expected rate of return and capital market forecasts for each asset class employed. Our expected rate of return on plan assets also considers our historical compounded return on plan assets for 10- and 15-year periods.
Changes in other key actuarial assumptions affect the determination of the benefit obligations as of the measurement date and the calculation of net periodic benefit costs in subsequent periods. Recent actuarial studies indicate life expectancies are longer and thus increase the total expected benefit payments to plan participants. Our benefit obligations at December 31, 2014 reflect the new life expectancy assumptions which increased our pension obligations by approximately $45 million in 2014.
F-48
Obligations and Funded Status — The defined benefit pension plan obligations and funded status are actuarially valued as of the end of each year. The following table presents information about our employee benefit plan assets and obligations:
For the years ended December 31, | ||||||||||||||||
Defined Benefit Plans | SERP | |||||||||||||||
(in thousands) | 2014 | 2013 | 2014 | 2013 | ||||||||||||
Accumulated benefit obligation | $ | 620,623 | $ | 503,500 | $ | 15,261 | $ | 14,593 | ||||||||
Change in projected benefit obligation: | ||||||||||||||||
Projected benefit obligation at beginning of year | $ | 504,571 | $ | 570,219 | $ | 14,872 | $ | 15,920 | ||||||||
Service cost | 85 | 79 | — | — | ||||||||||||
Interest cost | 25,539 | 23,732 | 638 | 749 | ||||||||||||
Benefits paid | (24,708 | ) | (24,806 | ) | (810 | ) | (804 | ) | ||||||||
Actuarial (gains)/losses | 115,136 | (64,653 | ) | 561 | 662 | |||||||||||
Curtailments/Settlements | — | — | — | (1,655 | ) | |||||||||||
Projected benefit obligation at end of year | 620,623 | 504,571 | 15,261 | 14,872 | ||||||||||||
Plan assets: | ||||||||||||||||
Fair value at beginning of year | 456,591 | 472,417 | — | — | ||||||||||||
Actual return on plan assets | 63,090 | 8,911 | — | — | ||||||||||||
Company contributions | 74 | 69 | 810 | 2,459 | ||||||||||||
Benefits paid | (24,708 | ) | (24,806 | ) | (810 | ) | (804 | ) | ||||||||
Curtailments/Settlements | — | — | — | (1,655 | ) | |||||||||||
Fair value at end of year | 495,047 | 456,591 | — | — | ||||||||||||
Funded status | $ | (125,576 | ) | $ | (47,980 | ) | $ | (15,261 | ) | $ | (14,872 | ) | ||||
Amounts recognized in Consolidated Balance Sheets: | ||||||||||||||||
Current liabilities | $ | — | $ | — | $ | (1,048 | ) | $ | (832 | ) | ||||||
Noncurrent liabilities | (125,576 | ) | (47,980 | ) | (14,213 | ) | (14,040 | ) | ||||||||
Total | $ | (125,576 | ) | $ | (47,980 | ) | $ | (15,261 | ) | $ | (14,872 | ) | ||||
Amounts recognized in accumulated other comprehensive loss consist of: | ||||||||||||||||
Unrecognized net actuarial loss | $ | 191,757 | $ | 119,091 | $ | 9,632 | $ | 9,343 | ||||||||
In 2015, for our defined benefit pension plans, we expect to recognize amortization of actuarial loss from accumulated other comprehensive loss into net periodic benefit costs of $4.9 million (including $0.3 million for the SERP).
F-49
Information for pension plans with an accumulated benefit obligation and projected benefit obligation in excess of plan assets was as follows:
As of December 31, | ||||||||||||||||
Defined Benefit Plans | SERP | |||||||||||||||
(in thousands) | 2014 | 2013 | 2014 | 2013 | ||||||||||||
Accumulated benefit obligation | $ | 620,623 | $ | 503,500 | $ | 15,261 | $ | 14,593 | ||||||||
Projected benefit obligation | 620,623 | 504,571 | 15,261 | 14,872 | ||||||||||||
Fair value of plan assets | 495,047 | 456,591 | — | — | ||||||||||||
Assumptions used to determine the defined benefit pension plans benefit obligations were as follows:
2014 | 2013 | 2012 | |||||||
Weighted average discount rate | 4.23 | % | 5.08 | % | 4.27 | % | |||
Increase in compensation levels | N/A | 2.0 | % | 3.3 | % | ||||
We expect to contribute $1.0 million in 2015 to fund SERP benefits. We have met the minimum funding requirements for our qualified defined benefit pension plans and do not expect to make contributions in 2015.
Estimated future benefit payments expected to be paid from the plans for the next ten years are $22.8 million in 2015, $24.0 million in 2016, $25.6 million in 2017, $27.6 million in 2018, $29.2 million in 2019 and a total of $167.9 million for the five years ending 2024.
Plan Assets and Investment Strategy
Our long-term investment strategy for pension assets is to earn a rate of return over time that minimizes future contributions to the plan while reducing the volatility of pension assets relative to pension liabilities. The strategy reflects the fact that we have frozen the accrual of service credits under defined benefit pension plans covering the majority of employees. We evaluate our asset allocation target ranges for equity, fixed income and other investments annually. We monitor actual asset allocations monthly and adjust as necessary. We control risk through diversification among multiple asset classes, managers and styles. Risk is further monitored at the manager and asset class level by evaluating performance against appropriate benchmarks.
Information related to our pension plan asset allocations by asset category were as follows:
Target allocation | Percentage of plan assets as of December 31, | ||||||||
2015 | 2014 | 2013 | |||||||
US equity securities | 10 | % | 11 | % | 10 | % | |||
Non-US equity securities | 15 | % | 15 | % | 16 | % | |||
Fixed-income securities | 70 | % | 70 | % | 69 | % | |||
Other | 5 | % | 4 | % | 5 | % | |||
Total | 100 | % | 100 | % | 100 | % | |||
U.S. equity securities include common stocks of large, medium and small capitalization companies, which are predominantly U.S. based. Non-U.S. equity securities include companies domiciled outside of the U.S. and American depository receipts. Fixed-income securities include securities issued or guaranteed by the U.S. government, mortgage backed securities and corporate debt obligations. Other investments include real estate funds.
We have target asset allocations to invest plan assets in securities that match the timing of the payment of plan obligations. As a result, approximately 70% of plan assets are invested in a portfolio of fixed income securities with a duration approximately that of the projected payment of benefit obligations. The remaining 30% of plan assets are invested in equity securities and other return-seeking assets. The expected long-term rate of return on plan assets is based primarily upon the target asset allocation for plan assets and capital markets forecasts for each asset class employed. Our expected rate of return on plan assets also considers our historical compound rate of return on plan assets for 10- and 15 year periods.
F-50
The following tables present our plan assets using the fair value hierarchy as of December 31, 2014 and 2013:
December 31, 2014 | ||||||||||||||||
(in thousands) | Total | Level 1 | Level 2 | Level 3 | ||||||||||||
Equity securities | ||||||||||||||||
Common/collective trust funds | $ | 128,189 | $ | — | $ | 128,189 | $ | — | ||||||||
Fixed income | ||||||||||||||||
Common/collective trust funds | 343,462 | — | 343,462 | — | ||||||||||||
Real estate fund | 21,661 | — | — | 21,661 | ||||||||||||
Cash equivalents | 1,735 | 1,735 | — | — | ||||||||||||
Fair value of plan assets | $ | 495,047 | $ | 1,735 | $ | 471,651 | $ | 21,661 | ||||||||
December 31, 2013 | ||||||||||||||||
(in thousands) | Total | Level 1 | Level 2 | Level 3 | ||||||||||||
Equity securities | ||||||||||||||||
Common/collective trust funds | $ | 122,851 | $ | — | $ | 122,851 | $ | — | ||||||||
Fixed income | ||||||||||||||||
Common/collective trust funds | 312,626 | — | 312,626 | — | ||||||||||||
Real estate fund | 19,534 | — | — | 19,534 | ||||||||||||
Cash equivalents | 1,580 | 1,580 | — | — | ||||||||||||
Fair value of plan assets | $ | 456,591 | $ | 1,580 | $ | 435,477 | $ | 19,534 | ||||||||
Equity securities-common/collective trust funds and fixed income-common/collective trust funds are comprised of shares or units in commingled funds that are not publicly traded. The underlying assets in these funds (equity securities and fixed income securities) are publicly traded on exchanges and price quotes for the assets held by these funds are readily available. Common/collective trust funds are typically valued at their net asset values that are calculated by the investment manager or sponsor of the fund and have daily or monthly liquidity.
Real estate pertains to an investment in a real estate fund which invests in limited partnerships, limited liability corporations, real estate investment trusts, other funds and insurance company group annuity contracts. The valuations for these holdings are based on property appraisals using cash flow analysis and market transactions.
The following table presents a reconciliation of Level 3 assets held during 2014 and 2013:
(in thousands) | Real Estate Fund | |||
As of December 31, 2012 | $ | 17,766 | ||
Unrealized gains/(losses) | 1,768 | |||
As of December 31, 2013 | 19,534 | |||
Unrealized gains/(losses) | 2,127 | |||
As of December 31, 2014 | $ | 21,661 | ||
F-51
Multi-employer plans
We participate in four multi-employer pension plans that cover certain employees that are members of unions or trade associations that have a collective bargaining agreement with us. We represent fewer than 5% of the total contributions made to the four plans and deem only two of the four plans we participate in to be significant. The following table summarizes the two plans we deem significant:
Pension Protection Act Zone Status | Contributions of the Company | |||||||||||||||||||||||||
Pension Fund | EIN/Pension Plan Number | 2014 | 2013 | FIP/RP Status Pending/Implemented | 2014 | 2013 | 2012 | Surcharge Imposed | Expiration Date of Collective Bargaining Agreement | |||||||||||||||||
CWA/ITU | 13-6212879 | Red | Red | Implemented | $ | 126,453 | $ | 116,295 | $ | 126,205 | NA | 2015 | ||||||||||||||
GCIU | 91-6024903 | Red | Red | Implemented | $ | 80,972 | $ | 99,594 | $ | 117,131 | Yes | 2016 | ||||||||||||||
The CWA/ITU Negotiated Pension Plan has a withdrawal liability of approximately $4.8 million. Contribution rates are scheduled to remain consistent with current rates for the foreseeable future. A rehabilitation plan was adopted in 2010 related to pension vesting and early retirement, however, mandatory increases in contributions or surcharges were not implemented.
The GCIU-Employer Retirement Fund has a withdrawal liability of approximately $6.5 million. A rehabilitation plan was adopted in 2009, which increased employer contributions beginning in 2013 and continued through 2014. In the second quarter of 2014, unions ratified our plan to withdraw from the GCIU Employer Retirement Fund. Upon ratification of the agreement, we recorded $4.1 million for the present value of the liability. Once we reach a final agreement with the GCIU, we either will pay the liability in a lump sum or make equal monthly installments over 20 years beginning in 2015.
17. Segment Information
We determine our business segments based upon our management and internal reporting structure. Our reportable segments are strategic businesses that offer different products and services.
Our television segment includes 11 ABC affiliates, three NBC affiliates and two independent stations, which we operate as duopolies with our Kansas City NBC affiliate and our Detroit ABC affiliate. We also own five Azteca America affiliates. Our television stations reach approximately 14% of the nation’s households. Television stations earn revenue primarily from the sale of advertising time to local and national advertisers and retransmission fees received from cable operators and satellite carriers.
Our newspaper segment includes daily and community newspapers in 13 markets across the United States. Newspapers earn revenue primarily from the sale of advertising space to local and national advertisers and newspaper subscription fees.
Syndication and other primarily includes certain digital operations outside our television and newspaper markets and syndication of news features and comics and other features for the newspaper industry. Newsy, a digital video news service, and WeatherSphere, a provider of weather-related mobile apps, are also included in syndication and other.
We allocate a portion of certain corporate costs and expenses, including information technology, certain employee benefits, digital operation services and other shared services, to our business segments. The allocations are generally amounts agreed upon by management, which may differ from an arms-length amount. Corporate assets are primarily cash, cash equivalents, restricted cash, property and equipment primarily used for corporate purposes, and deferred income taxes. A portion of our digital operations, which are not allocated to our television and newspaper segments, is included in shared services and corporate.
Our chief operating decision maker evaluates the operating performance of our business segments and makes decisions about the allocation of resources to our business segments using a measure called segment profit. Segment profit excludes interest, defined benefit pension plan expense (other than current service cost), income taxes, depreciation and amortization, impairment charges, divested operating units, restructuring activities, investment results and certain other items that are included in net income (loss) determined in accordance with accounting principles generally accepted in the United States of America.
F-52
Information regarding our business segments is as follows:
For the years ended December 31, | ||||||||||||
(in thousands) | 2014 | 2013 | 2012 | |||||||||
Segment operating revenues: | ||||||||||||
Television | $ | 486,322 | $ | 422,763 | $ | 493,896 | ||||||
Newspapers | 370,316 | 384,514 | 399,091 | |||||||||
Syndication and other | 12,430 | 9,594 | 10,471 | |||||||||
Total operating revenues | $ | 869,068 | $ | 816,871 | $ | 903,458 | ||||||
Segment profit (loss): | ||||||||||||
Television | $ | 134,885 | $ | 99,790 | $ | 159,917 | ||||||
Newspapers | 20,783 | 27,965 | 27,595 | |||||||||
Syndication and other | (1,871 | ) | 102 | (347 | ) | |||||||
Shared services and corporate | (53,876 | ) | (52,563 | ) | (39,678 | ) | ||||||
Defined benefit pension plan expense | (10,000 | ) | (8,837 | ) | (8,620 | ) | ||||||
Acquisition and related integration costs | (13,974 | ) | — | (5,826 | ) | |||||||
Restructuring costs | — | (4,893 | ) | (9,335 | ) | |||||||
Depreciation and amortization of intangibles | (49,070 | ) | (47,762 | ) | (49,332 | ) | ||||||
Gains (losses), net on disposal of property, plant and equipment | 2,260 | (166 | ) | (474 | ) | |||||||
Interest expense | (8,494 | ) | (10,448 | ) | (12,246 | ) | ||||||
Miscellaneous, net | (8,389 | ) | (11,760 | ) | (4,747 | ) | ||||||
Income (loss) from operations before income taxes | $ | 12,254 | $ | (8,572 | ) | $ | 56,907 | |||||
Depreciation: | ||||||||||||
Television | $ | 21,676 | $ | 22,561 | $ | 23,022 | ||||||
Newspapers | 15,933 | 16,204 | 18,186 | |||||||||
Syndication and other | 495 | 78 | 55 | |||||||||
Shared services and corporate | 2,564 | 1,996 | 995 | |||||||||
Total depreciation | $ | 40,668 | $ | 40,839 | $ | 42,258 | ||||||
Amortization of intangibles: | ||||||||||||
Television | $ | 7,092 | $ | 6,378 | $ | 6,413 | ||||||
Newspapers | 390 | 545 | 661 | |||||||||
Syndication and other | 920 | — | — | |||||||||
Total amortization of intangibles | $ | 8,402 | $ | 6,923 | $ | 7,074 | ||||||
The following table presents additions to property, plant and equipment by segment:
For the years ended December 31, | ||||||||||||
(in thousands) | 2014 | 2013 | 2012 | |||||||||
Additions to property, plant and equipment: | ||||||||||||
Television | $ | 13,039 | $ | 12,595 | $ | 19,947 | ||||||
Newspapers | 2,206 | 2,399 | 2,771 | |||||||||
Syndication and other | 1,335 | — | 780 | |||||||||
Shared services and corporate | 2,428 | 6,361 | 6,712 | |||||||||
Total additions to property, plant and equipment | $ | 19,008 | $ | 21,355 | $ | 30,210 | ||||||
F-53
Total assets by segment for the years ended December 31 were as follows:
As of December 31, | ||||||||||||
(in thousands) | 2014 | 2013 | 2012 | |||||||||
Assets: | ||||||||||||
Television | $ | 509,569 | $ | 410,529 | $ | 415,174 | ||||||
Newspapers | 232,420 | 261,974 | 278,110 | |||||||||
Syndication and other | 44,178 | 2,017 | 3,837 | |||||||||
Shared services and corporate | 246,564 | 291,610 | 333,647 | |||||||||
Total assets | $ | 1,032,731 | $ | 966,130 | $ | 1,030,768 | ||||||
No single customer provides more than 10% of our revenue.
18. Spin-off of Scripps Networks Interactive, Inc.
On July 1, 2008, we distributed all of the shares of Scripps Networks Interactive, Inc. (“SNI”) to shareholders of record as of the close of business on June 16, 2008. SNI owned and operated our national lifestyle cable television networks and interactive media businesses.
In connection with the separation, we entered into several agreements, including a Tax Allocation Agreement. This agreement sets forth the allocations between us and SNI with regards to liabilities for federal, state and local taxes for periods prior to the separation. Pursuant to this agreement, we paid SNI $0.4 million 2012 for its share of the tax refund claims we received from the tax authorities.
In addition, under the terms of the Tax Allocation Agreement, we receive any tax deductions for share-based compensation awards held by our employees in SNI. In 2014, 2013 and 2012, we took deductions upon the exercise of those awards that totaled approximately $8.1 million, $14.3 million and $17.8 million, respectively. These benefits are recorded as additional paid-in-capital at the time they are realized. At December 31, 2014, our employees held approximately 0.2 million SNI options which expire through 2017.
19. Commitments and Contingencies
Minimum payments on noncancelable leases at December 31, 2014 were: $4.2 million in 2015, $3.4 million in 2016, $3.2 million in 2017, $2.4 million in 2018, $2.3 million in 2019 and $9.5 million in later years. We expect our operating leases will be replaced with leases for similar facilities upon their expiration. Rental expense for cancelable and noncancelable leases was $10.1 million in 2014, $8.7 million in 2013 and $10.3 million in 2012.
We are involved in litigation arising in the ordinary course of business, such as defamation actions, and governmental proceedings primarily relating to renewal of broadcast licenses, none of which is expected to result in material loss.
Members of the Board of Directors of Journal Communications, Inc. ("Journal"), and the parties to the Master Transaction Agreement, including Journal and Scripps, were defendants in a class action lawsuit filed in Circuit Court, Milwaukee County, Wisconsin (Howard Goldfinger v. Journal Communications, Inc., et al.). The plaintiff in the lawsuit alleged that the directors of Journal breached their fiduciary duties to Journal shareholders in connection with the Journal Transactions and that the other parties to the lawsuit aided and abetted such alleged breaches of fiduciary duty. The plaintiff alleged that the directors of Journal breached their fiduciary duties by, among other things, (i) agreeing to enter into the Master Transaction Agreement for inadequate consideration, (ii) having certain conflicts of interest, (iii) not negotiating a “collar” mechanism on the share exchange ratio, and (iv) agreeing to certain deal protection provisions, such as a termination fee, a “no-shop” provision, and a “matching rights” provision. The plaintiff also challenged the qualifications of Journal's financial advisor, Methuselah Advisors LLC ("Methuselah"), and asserted that Methuselah has a conflict because the founder and managing partner of Methuselah, who is the lead investment banker at Methuselah for Journal in the Journal Transactions, was employed by Lazard Fréres & Co. LLC (“Lazard”) prior to 2010 as a managing director, where he had responsibility for Lazard’s relationship with Scripps. On August 29, 2014, the defendants filed Motions to Dismiss asking the Circuit Court to dismiss the lawsuit. On November 12, 2014, the Circuit Court entered an Order granting the defendants’ Motions to Dismiss and dismissing the lawsuit.
On January 6, 2015, the plaintiff in the above-referenced lawsuit filed a putative class action lawsuit in the United States District Court for the Eastern District of Wisconsin (Howard Goldfinger v. Journal Communications, Inc., et al. (Case No. 2:15-
F-54
cv-00012-JPS)), naming Journal, the Board of Directors of Journal, Scripps, and the other parties to the Master Transaction Agreement as defendants. The plaintiff asserts disclosure claims under Sections 14(a) and 20(a) of the Securities Exchange Act of 1934, as well as state common law claims for breaches of fiduciary duty and aiding and abetting breaches of fiduciary duty. The complaint seeks, among other remedies, injunctive relief enjoining the Journal Transactions and damages. The outcome of this lawsuit is uncertain. An adverse judgment for monetary damages could have an adverse effect on the operations and liquidity of Journal and Scripps. A preliminary injunction could delay or jeopardize the completion of the Journal Transactions, and an adverse judgment granting permanent injunctive relief could indefinitely enjoin completion of the Journal Transactions. Journal, Scripps, and the other defendants named in the lawsuit believe the claims asserted are without merit and intend to continue to vigorously defend against them.
20. Capital Stock and Share-Based Compensation Plans
Capital Stock — We have two classes of common shares, Common Voting shares and Class A Common shares. The Class A Common shares are only entitled to vote on the election of the greater of three or one-third of the directors and other matters as required by Ohio law.
Share Repurchase Plan — In November 2012, our Board of Directors authorized a repurchase program of up to $100 million of our Class A Common shares through December 2014. Under the authorization, we repurchased a total of $95 million of shares at prices ranging from $10.83 to $19.99 per share. No additional shares may be repurchased pursuant to this authorization.
In May 2014, our Board of Directors authorized a new repurchase program of up to $100 million of our Class A Common shares through December 2016. No shares have been repurchased under this program as of December 31, 2014.
Under the terms of the Master Transaction Agreement with Journal Communications, Inc., we are precluded from repurchasing shares prior to the closing of the Journal Transactions.
Incentive Plans — On May 13, 2010, we adopted The E.W. Scripps Company 2010 Long-Term Incentive Plan (the “Plan”) which terminates on February 15, 2020. The Plan permits the granting of incentive and nonqualified stock options, stock appreciation rights, restricted stock units (RSUs), restricted and unrestricted Class A Common shares and performance units to key employees and non-employee directors. Any shares previously granted under the 1997 Plan that are subsequently forfeited, terminated, settled in cash or used to satisfy tax withholding obligations become available for issuance under the 2010 Plan.
We satisfy stock option exercises and vested stock awards with newly issued shares. As of December 31, 2014, 4.2 million shares were available for future stock compensation awards.
Stock Options — Stock options grant the recipient the right to purchase Class A Common shares at not less than 100% of the fair market value on the date the option is granted. We have not issued any new stock options since 2008.
The following table summarizes information about stock option transactions:
Number of Shares | Weighted- Average Exercise Price | Range of Exercise Prices | |||||||
Outstanding at December 31, 2011 | 10,094,622 | $ | 9.62 | $7-11 | |||||
Exercised in 2012 | (2,046,309 | ) | 9.03 | 8-10 | |||||
Forfeited in 2012 | (36,933 | ) | 9.12 | 8-11 | |||||
Outstanding at December 31, 2012 | 8,011,380 | 9.77 | 7-11 | ||||||
Exercised in 2013 | (4,635,148 | ) | 10.00 | 7-11 | |||||
Forfeited in 2013 | (6,184 | ) | 10.23 | 9-11 | |||||
Outstanding at December 31, 2013 | 3,370,048 | 9.46 | 7-11 | ||||||
Exercised in 2014 | (1,662,055 | ) | 10.01 | 9-11 | |||||
Forfeited in 2014 | (4,117 | ) | 10.45 | 10-11 | |||||
Outstanding at December 31, 2014 | 1,703,876 | 8.92 | 7-11 | ||||||
F-55
The following table presents additional information about exercises of stock options:
For the years ended December 31, | ||||||||||||
(in thousands) | 2014 | 2013 | 2012 | |||||||||
Cash received upon exercise | $ | 16,579 | $ | 46,624 | $ | 18,215 | ||||||
Intrinsic value (market value on date of exercise less exercise price) | 16,036 | 18,468 | 2,378 | |||||||||
Tax benefits realized (1) | 6,013 | 6,926 | 892 | |||||||||
(1) Benefits for 2013 to be recognized in future years when realizable.
Information about options outstanding and options exercisable by year of grant is as follows:
Options Outstanding and Exercisable | |||||||||||||||
Year of Grant | Range of Exercise Prices | Average Remaining Term (in years) | Options on Shares Outstanding | Weighted Average Exercise Price | Aggregate Intrinsic Value (in millions) | ||||||||||
2005 – expire in 2015 | $10-11 | 0.28 | 33,799 | $ | 10.89 | $ | 0.4 | ||||||||
2006 – expire in 2016 | 10 | 1.34 | 42,250 | 9.96 | 0.5 | ||||||||||
2007 – expire in 2015 | 9-10 | 0.18 | 190,679 | 10.15 | 2.3 | ||||||||||
2008 – expire in 2016 | 7-10 | 1.26 | 1,437,148 | 8.68 | 19.7 | ||||||||||
Total | $7-11 | 1.12 | 1,703,876 | $ | 8.92 | $ | 22.9 | ||||||||
Restricted Stock and Restricted Stock Units — Awards of Class A Common shares (restricted stock) and restricted stock units generally require no payment by the employee. RSUs are converted into an equal number of Class A Common shares when vested. These awards generally vest over a three or four year period, conditioned upon the individual’s continued employment through that period. Awards vest immediately upon the retirement, death or disability of the employee or upon a change in control of Scripps or in the business in which the individual is employed. Unvested awards may be forfeited if employment is terminated for other reasons. Awards are nontransferable during the vesting period, but the awards are entitled to all the rights of an outstanding share. There are no post-vesting restrictions on awards granted to employees and non-employee directors.
Long-term incentive compensation includes performance share awards. Performance share awards represent the right to receive an award of RSUs if certain performance measures are met. Each award specifies a target number of shares to be issued and the specific performance criteria that must be met. The number of shares that an employee receives may be less or more than the target number of shares depending on the extent to which the specified performance measures are met or exceeded.
F-56
Information and activity for our restricted stock and RSUs is presented below:
Grant Date Fair Value | |||||||||
Number of Shares | Weighted Average | Range of Prices | |||||||
Unvested at December 31, 2011 | 3,982,532 | $ | 3.53 | $1-11 | |||||
Awarded in 2012 | 877,349 | 9.77 | 8-11 | ||||||
Vested in 2012 | (2,506,232 | ) | 2.68 | 9-11 | |||||
Forfeited in 2012 | (24,247 | ) | 8.19 | 1-10 | |||||
Unvested at December 31, 2012 | 2,329,402 | 6.75 | 1-11 | ||||||
Awarded in 2013 | 757,229 | 11.71 | 11-20 | ||||||
Vested in 2013 | (1,452,719 | ) | 5.01 | 1-12 | |||||
Forfeited in 2013 | (47,071 | ) | 10.35 | 9-12 | |||||
Unvested at December 31, 2013 | 1,586,841 | 10.59 | 7-20 | ||||||
Awarded in 2014 | 567,695 | 16.52 | 16-22 | ||||||
Vested in 2014 | (704,528 | ) | 10.40 | 7-20 | |||||
Forfeited in 2014 | (225,487 | ) | 11.75 | 9-18 | |||||
Unvested at December 31, 2014 | 1,224,521 | 13.24 | 7-22 | ||||||
The following table presents additional information about restricted stock and restricted stock unit vesting:
For the years ended December 31, | ||||||||||||
(in thousands) | 2014 | 2013 | 2012 | |||||||||
Fair value of shares and units vested | $ | 12,906 | $ | 16,565 | $ | 23,326 | ||||||
Tax benefits realized on vesting (1) | 4,840 | 6,212 | 8,747 | |||||||||
(1) Benefits for 2013 to be recognized in future years when realizable.
Share-based Compensation Costs
Share-based compensation costs were as follows:
For the years ended December 31, | ||||||||||||
(in thousands) | 2014 | 2013 | 2012 | |||||||||
RSUs | $ | 7,631 | $ | 6,078 | $ | 7,549 | ||||||
Share-based compensation, net of tax | 4,769 | 3,799 | 4,718 | |||||||||
As of December 31, 2014, $5.2 million of total unrecognized compensation costs related to RSUs and performance shares is expected to be recognized over a weighted-average period of 1.5 years.
F-57
21. Accumulated Other Comprehensive Loss
Changes in accumulated other comprehensive loss ("AOCL") by component, including items reclassified out of AOCL, were as follows:
(in thousands) | Gains and Losses on Derivatives | Defined Benefit Pension Items | Other | Total | ||||||||||||
As of December 31, 2012 | $ | (1,009 | ) | $ | (116,188 | ) | $ | 357 | $ | (116,840 | ) | |||||
Other comprehensive loss before reclassifications | (113 | ) | — | — | (113 | ) | ||||||||||
Amounts reclassified from accumulated other comprehensive loss | ||||||||||||||||
Interest rate swap (a), net of tax of $245 | 404 | — | — | 404 | ||||||||||||
Actuarial gain (loss) (b), net of tax of $21,927 | — | 35,811 | (185 | ) | 35,626 | |||||||||||
Net current-period other comprehensive income (loss) | 291 | 35,811 | (185 | ) | 35,917 | |||||||||||
As of December 31, 2013 | (718 | ) | (80,377 | ) | 172 | (80,923 | ) | |||||||||
Amounts reclassified from accumulated other comprehensive loss | ||||||||||||||||
Interest rate swap (a), net of tax of $145 | 239 | — | — | 239 | ||||||||||||
Actuarial gain (loss) (b), net of tax of $(27,672) | — | (45,500 | ) | (259 | ) | (45,759 | ) | |||||||||
Net current-period other comprehensive income (loss) | 239 | (45,500 | ) | (259 | ) | (45,520 | ) | |||||||||
As of December 31, 2014 | $ | (479 | ) | $ | (125,877 | ) | $ | (87 | ) | $ | (126,443 | ) | ||||
(a) Included in interest expense in the Consolidated Statements of Operations
(b) Included in defined benefit pension plan expense in the Consolidated Statements of Operations
F-58
22. Summarized Quarterly Financial Information (Unaudited)
Summarized quarterly financial information is as follows:
2014 | 1st | 2nd | 3rd | 4th | ||||||||||||||||
(in thousands, except per share data) | Quarter | Quarter | Quarter | Quarter | Total | |||||||||||||||
Operating revenues | $ | 203,794 | $ | 211,946 | $ | 207,600 | $ | 245,728 | $ | 869,068 | ||||||||||
Costs and expenses | (190,059 | ) | (203,347 | ) | (194,699 | ) | (205,016 | ) | (793,121 | ) | ||||||||||
Depreciation and amortization of intangibles | (11,729 | ) | (11,595 | ) | (13,195 | ) | (12,551 | ) | (49,070 | ) | ||||||||||
(Losses) gains, net on disposal of property, plant and equipment | (68 | ) | (22 | ) | 2,951 | (601 | ) | 2,260 | ||||||||||||
Interest expense | (2,254 | ) | (2,043 | ) | (2,050 | ) | (2,147 | ) | (8,494 | ) | ||||||||||
Miscellaneous, net | (445 | ) | (400 | ) | (216 | ) | (7,328 | ) | (8,389 | ) | ||||||||||
Benefit (provision) for income taxes | 149 | 2,027 | (1,835 | ) | (2,373 | ) | (2,032 | ) | ||||||||||||
Net (loss) income | (612 | ) | (3,434 | ) | (1,444 | ) | 15,712 | 10,222 | ||||||||||||
Net loss attributable to noncontrolling interests | — | (199 | ) | (103 | ) | (5 | ) | (307 | ) | |||||||||||
Net (loss) income attributable to the shareholders of The E.W. Scripps Company | $ | (612 | ) | $ | (3,235 | ) | $ | (1,341 | ) | $ | 15,717 | $ | 10,529 | |||||||
Net (loss) income per basic share of common stock attributable to the shareholders of The E.W. Scripps Company: | $ | (0.01 | ) | $ | (0.06 | ) | $ | (0.02 | ) | $ | 0.27 | $ | 0.18 | |||||||
Net (loss) income per diluted share of common stock attributable to the shareholders of The E.W. Scripps Company: | $ | (0.01 | ) | $ | (0.06 | ) | $ | (0.02 | ) | $ | 0.27 | $ | 0.18 | |||||||
Weighted average shares outstanding: | ||||||||||||||||||||
Basic | 56,084 | 56,043 | 56,469 | 56,763 | 56,342 | |||||||||||||||
Diluted | 56,084 | 56,043 | 56,469 | 57,474 | 57,239 | |||||||||||||||
Cash dividends per share of common stock | $ | — | $ | — | $ | — | $ | — | $ | — | ||||||||||
F-59
2013 | 1st | 2nd | 3rd | 4th | ||||||||||||||||
(in thousands, except per share data) | Quarter | Quarter | Quarter | Quarter | Total | |||||||||||||||
Operating revenues | $ | 198,653 | $ | 207,853 | $ | 189,535 | $ | 220,830 | $ | 816,871 | ||||||||||
Costs and expenses | (190,538 | ) | (187,935 | ) | (185,418 | ) | (191,416 | ) | (755,307 | ) | ||||||||||
Depreciation and amortization of intangibles | (11,814 | ) | (11,774 | ) | (12,096 | ) | (12,078 | ) | (47,762 | ) | ||||||||||
(Losses) gains, net on disposal of property, plant and equipment | (5 | ) | 42 | (177 | ) | (26 | ) | (166 | ) | |||||||||||
Interest expense | (2,613 | ) | (2,656 | ) | (2,655 | ) | (2,524 | ) | (10,448 | ) | ||||||||||
Miscellaneous, net | (1,304 | ) | (1,634 | ) | (1,087 | ) | (7,735 | ) | (11,760 | ) | ||||||||||
Benefit (provision) for income taxes | 4,950 | (711 | ) | 3,047 | 562 | 7,848 | ||||||||||||||
Net (loss) income | (2,671 | ) | 3,185 | (8,851 | ) | 7,613 | (724 | ) | ||||||||||||
Net loss attributable to noncontrolling interests | — | — | — | (250 | ) | (250 | ) | |||||||||||||
Net (loss) income attributable to the shareholders of The E.W. Scripps Company | $ | (2,671 | ) | $ | 3,185 | $ | (8,851 | ) | $ | 7,863 | $ | (474 | ) | |||||||
Net (loss) income per basic share of common stock attributable to the shareholders of The E.W. Scripps Company: | $ | (0.05 | ) | $ | 0.05 | $ | (0.16 | ) | $ | 0.14 | $ | (0.01 | ) | |||||||
Net (loss) income per diluted share of common stock attributable to the shareholders of The E.W. Scripps Company: | $ | (0.05 | ) | $ | 0.05 | $ | (0.16 | ) | $ | 0.13 | $ | (0.01 | ) | |||||||
Weighted average shares outstanding: | ||||||||||||||||||||
Basic | 56,330 | 57,448 | 56,177 | 55,980 | 56,516 | |||||||||||||||
Diluted | 56,330 | 58,747 | 56,177 | 57,272 | 56,516 | |||||||||||||||
Cash dividends per share of common stock | $ | — | $ | — | $ | — | $ | — | $ | — | ||||||||||
The sum of the quarterly net income per share amounts may not equal the reported annual amount because each amount is computed independently based upon the weighted-average number of shares outstanding for the period.
23. Pending Broadcast Acquisition and Newspaper Spin-off
On July 30, 2014, Scripps and Journal Communications, Inc. ("Journal") agreed to spin-off their newspaper businesses into a separate publicly traded company and for Scripps to acquire Journal's broadcast business (the “Journal Transactions”). The closing date of the Journal Transactions is currently scheduled for April 1, 2015.
The merged broadcast and digital media company, to be based in Cincinnati, will retain The E. W. Scripps Company name and continue to be controlled by the Scripps family. The company’s television operations will reach approximately 18% of all U.S. households and will have approximately 4,000 employees across its television, radio and digital media operations.
The newspaper company will be named Journal Media Group, combining the 13 Scripps newspapers with Journal's Milwaukee Journal Sentinel. The company will have approximately 3,600 employees and will be headquartered in Milwaukee.
The Board of Directors of both companies have approved the Journal Transactions, which are subject to customary regulatory and shareholder approvals. Scripps and Journal shareholders voted to approve the Journal Transactions on March 11, 2015. As part of the Journal Transactions, Scripps shareholders will receive a $60 million special cash dividend. Under the terms of the Master Transaction Agreement with Journal Communications, Inc., we are precluded from repurchasing shares prior to the closing of the Journal Transactions.
F-60
In order to carry out the Journal Transactions, we will incur $25 to $30 million in costs, of which we have incurred approximately $10 million to date. With the Journal Transactions, we will also assume Journal's outstanding liabilities, including any employee benefit obligations ($95 million as of December 31, 2014). Journal also has outstanding debt of $131 million as of December 31, 2014, of which we will refinance $120 million and assume the remainder. We expect to increase our term loan B by $200 million to refinance Journal's debt and pay costs, taxes and the dividend associated with the Journal Transactions. We expect to have a $398 million term loan B after closing the Journal Transactions.
In the case that Scripps breaches its obligation to consummate the Journal Transactions, the Master Transaction Agreement may require Scripps to pay liquidated damages of $15.8 million plus expenses, subject to an overall limit of $23.5 million.
F-61
The E. W. Scripps Company
Index to Consolidated Financial Statement Schedules
Exhibits | S-2 |
S-1
The E. W. Scripps Company
Exhibit Number | Exhibit Description | Form | File Number | Exhibit | Report Date | |||||
2.01 | Master Transaction Agreement, dated as of July 30, 2014, by and among The E. W. Scripps Company, Scripps Media, Inc., Desk Spinco, Inc., Scripps NP Operating, LLC (f/k/a Desk NP Operating, LLC), Desk NP Merger Co., Desk BC Merger, LLC, Journal Communications, Inc., Boat Spinco, Inc., Boat NP Merger Co., and Journal Media Group, Inc. (f/k/a Boat NP Newco, Inc.) | S-4 | 333-200388 | 2.1 | 11/20/2014 | |||||
3.01 | Amended Articles of Incorporation | 8-K | 000-16914 | 3 (i) | 2/17/2009 | |||||
3.02 | Amended and Restated Code of Regulations | 8-K | 000-16914 | 3.02 | 5/10/2007 | |||||
3.03 | Amendment to Articles of Incorporation of The E. W. Scripps Company | 8-K | 000-16914 | 3.1 | 3/12/2015 | |||||
10.01 | The E.W. Scripps Company 2010 Long-Term Incentive Plan | 8-K | 000-16914 | 99.08 | 5/13/2010 | |||||
10.02 | Amended and Restated 1997 Long-Term Incentive Plan | 8-K | 000-16914 | 10.01 | 5/8/2008 | |||||
10.03 | Form of Executive Officer Nonqualified Stock Option Agreement | 8-K | 000-16914 | 10.03A | 2/9/2005 | |||||
10.04 | Form of Independent Director Nonqualified Stock Option Agreement | 8-K | 000-16914 | 10.03B | 2/9/2005 | |||||
10.05 | Form of Performance-Based Restricted Share Agreement | 8-K | 000-16914 | 10.03C | 2/9/2005 | |||||
10.06 | Form of Restricted Share Agreement (Nonperformance Based) | 8-K | 000-16914 | 10.02C | 2/28/2006 | |||||
10.07 | Executive Bonus Plan, as amended April 14, 2005 | 8-K | 000-16914 | 10.04 | 2/9/2006 | |||||
10.08 | The E.W. Scripps Company Executive Severance Plan | 8-K | 000-16914 | 10.04 | 5/19/2009 | |||||
10.09 | The E.W. Scripps Company Executive Severance Plan Amended and Restated as of February 23, 2015 | 8-K | 000-16914 | 10.1 | 2/23/2015 | |||||
10.10 | The E.W. Scripps Company Employee Stock Purchase Plan | 8-K | 000-16914 | 5.02 | 6/12/2008 | |||||
10.11 | Scripps Family Agreement dated October 15, 1992 | 8-K | 000-16914 | 1 | 10/15/1992 | |||||
10.12 | Amendments to the Scripps Family Agreement | S-4 | 333-200388 | 10.5 | 11/20/2014 | |||||
10.13 | Amendments to the Scripps Family Agreement | 8-K | 000-16914 | 10.57A | 5/8/2008 | |||||
10.14 | Amendments to the Scripps Family Agreement | S-4 | 333-200388 | 10.7 | 11/20/2014 | |||||
10.15 | Amendments to the Scripps Family Agreement | S-4 | 333-200388 | 10.8 | 11/20/2014 | |||||
10.16 | Non-Employee Directors’ Stock Option Plan | S-8 | 333-27623 | 4A | ||||||
10.17 | 1997 Deferred Compensation and Stock Plan for Directors, as amended | 8-K | 000-16914 | 10.61 | 5/8/2008 | |||||
10.18 | Amended and Restated Scripps Supplemental Executive Retirement Plan | 8-K | 000-16914 | 10.74 | 5/19/2009 | |||||
10.19 | Employment Agreement between the Company and Richard A. Boehne | 8-K | 000-16914 | 10.66 | 2/15/2011 | |||||
10.20 | Amendment to Employment Agreement between the Company and Richard A. Boehne | 8-K | 000-16914 | 10.1 | 11/4/2014 | |||||
10.21 | Scripps Senior Executive Change in Control Plan | 10-Q | 000-16914 | 10.65 | 5/19/2009 | |||||
10.22 | Scripps Executive Deferred Compensation Plan, as amended | 8-K | 000-16914 | 10.76 | 5/19/2009 | |||||
10.23 | Short-Term Incentive Plan | 8-K | 000-16914 | 99.01 | 2/17/2009 | |||||
10.24 | Independent Director Restricted Stock Unit Agreement | 8-K | 000-16914 | 99.02 | 2/17/2009 | |||||
10.25 | Employee Restricted Stock Unit Agreement | 8-K | 000-16914 | 10.79 | 3/5/2009 | |||||
10.26 | Amended and Restated Revolving Credit and Term Loan Agreement dated as of November 26, 2013 | 8-K | 000-16914 | 10.80 | 11/26/2013 | |||||
14 | Code of Ethics for CEO and Senior Financial Officers | 10-K | 000-16914 | 14 | 12/31/2004 | |||||
21 | Subsidiaries of the Company | |||||||||
22 | Results of matters submitted to vote of holders of common voting shares | 8-K | 000-16914 | 3/12/2015 | ||||||
23 | Consent of Independent Registered Public Accounting Firm | |||||||||
31(a) | Section 302 Certifications | |||||||||
31(b) | Section 302 Certifications | |||||||||
32(a) | Section 906 Certifications | |||||||||
32(b) | Section 906 Certifications | |||||||||
101.INS | XBRL Instance Document (furnished herewith) | |||||||||
101.SCH | XBRL Taxonomy Extension Schema Document (furnished herewith) | |||||||||
101.CAL | XBRL Taxonomy Extension Calculation Linkbase Document (furnished herewith) | |||||||||
101.DEF | XBRL Taxonomy Extension Definition Linkbase Document (furnished herewith) | |||||||||
101.LAB | XBRL Taxonomy Extension Label Linkbase Document (furnished herewith) | |||||||||
101.PRE | XBRL Taxonomy Extension Presentation Linkbase Document (furnished herewith) | |||||||||
S-2