Attached files
| file | filename |
|---|---|
| EX-99.1 - PRESS RELEASE DATED MARCH 13, 2015 - MOSAIC CO | exhibit991pressreleasesegm.htm |
| 8-K - 8-K - SEGMENT REPORTING - MOSAIC CO | form8-kxsegmentreportingma.htm |

Segment Reporting Changes March 2015

Click to edit Master title style 2 Safe Harbor Statement This document contains forward-looking statements within the meaning of the Private Securities Litigation Reform Act of 1995. Such statements include, but are not limited to, statements about the Wa’ad Al Shamal Phosphate Company (also known as the Ma’aden joint venture), the acquisition and assumption of certain related liabilities of the Florida phosphate assets of CF Industries, Inc. (“CF”) and Mosaic’s ammonia supply agreements with CF; repurchases of stock; other proposed or pending future transactions or strategic plans and other statements about future financial and operating results. Such statements are based upon the current beliefs and expectations of The Mosaic Company’s management and are subject to significant risks and uncertainties. These risks and uncertainties include but are not limited to risks and uncertainties arising from the ability of the Ma’aden joint venture to obtain additional planned funding in acceptable amounts and upon acceptable terms, the future success of current plans for the Ma’aden joint venture and any future changes in those plans; difficulties with realization of the benefits of the transactions with CF, including the risk that the cost or capital savings from the transactions may not be fully realized or may take longer to realize than expected, or the price of natural gas or ammonia changes to a level at which the natural gas based pricing under one of the long term ammonia supply agreements with CF becomes disadvantageous to Mosaic; customer defaults; the effects of Mosaic’s decisions to exit business operations or locations; the predictability and volatility of, and customer expectations about, agriculture, fertilizer, raw material, energy and transportation markets that are subject to competitive and other pressures and economic and credit market conditions; the level of inventories in the distribution channels for crop nutrients; changes in foreign currency and exchange rates; international trade risks and other risks associated with Mosaic’s international operations and those of joint ventures in which Mosaic participates, including the risk that protests against natural resource companies in Peru extend to or impact the Miski Mayo mine; changes in government policy; changes in environmental and other governmental regulation, including greenhouse gas regulation, implementation of numeric water quality standards for the discharge of nutrients into Florida waterways or efforts to reduce the flow of excess nutrients into the Mississippi River basin, the Gulf of Mexico or elsewhere; further developments in judicial or administrative proceedings, or complaints that Mosaic’s operations are adversely impacting nearby farms, business operations or properties; difficulties or delays in receiving, increased costs of or challenges to necessary governmental permits or approvals or increased financial assurance requirements; resolution of global tax audit activity; the effectiveness of Mosaic’s processes for managing its strategic priorities; adverse weather conditions affecting operations in Central Florida, the Mississippi River basin, the Gulf Coast of the United States or Canada, and including potential hurricanes, excess heat, cold, snow, rainfall or drought; actual costs of various items differing from management’s current estimates, including, among others, asset retirement, environmental remediation, reclamation or other environmental regulation, Canadian resources taxes and royalties, the liabilities Mosaic assumed in the Florida phosphate assets acquisition, or the costs of the Ma’aden joint venture, its existing or future funding and Mosaic’s commitments in support of such funding; reduction of Mosaic’s available cash and liquidity, and increased leverage, due to its use of cash and/or available debt capacity to fund share repurchases, financial assurance requirements and strategic investments; brine inflows at Mosaic’s Esterhazy, Saskatchewan, potash mine or other potash shaft mines; other accidents and disruptions involving Mosaic’s operations, including potential mine fires, floods, explosions, seismic events or releases of hazardous or volatile chemicals; and risks associated with cyber security, including reputational loss, as well as other risks and uncertainties reported from time to time in The Mosaic Company’s reports filed with the Securities and Exchange Commission. Actual results may differ from those set forth in the forward-looking statements.

• Following acquisition of Archer Daniels Midland’s (ADM) fertilizer business Mosaic realigned management and reporting of results into four segments: – Potash – Phosphates – International Distribution – Corporate and Other • Expected outcomes/benefits: – Increased transparency – Improved peer benchmarking – Ease of modeling 3 Summary Provides execution proof points of strategic and operational initiatives

4 Summary of Changes • Potash, Phosphates and International Distribution Segments will no longer include mark-to-market gains/losses on derivatives. • Phosphates Segment now captures only manufacturing economics, with inter- segment transactions based on arms length transfer pricing methodology with the International Distribution segment. • Phosphates Segment will include our equity earnings from our Miski Mayo and Ma’aden investments. • The new International Distribution segment will capture the lower margin, less capital intense distribution businesses currently operating in Brazil and Paraguay, India and China. • The Corporate and Other segment includes inter-segment eliminations, the mark-to-market gains/losses on derivatives, debt expenses, as well as the legacy Argentina and Chile results. • We have also provided incremental disclosures to facilitate benchmarking and analytics. Old and new metrics are defined at the end of this deck.

5 Business Drivers: 101 • Realized prices are reported FOB mine. • Mix of domestic vs. international shipments impacts price realization. Price realizations reported exclude impact of intercompany sales to International Distribution. • Realized prices also lag spot market (supply chain length). • Over 70% of costs are fixed in the short term, so per tonne costs fluctuate with operating rate. • Production mix (between mines) also impacts average costs/tonne. • K-Mag ® sells at a premium to MOP on a K20 content basis. • Phosphates is a margin business with market prices for raw materials (ammonia & sulfur) generally correlated to prices of finished product. • Realized prices are reported FOB plant. Price realizations reported exclude impact of intercompany sales to International Distribution. • Realized DAP price is provided as the reference price, however, the company sells multiple products, so product mix impacts revenues and margins. • Ammonia costs realized in costs of goods sold are expected to be lower starting in 2017 as a result of deliveries under a long-term contract with price based on natural gas costs. • Over time, shift to higher mix of MicroEssentials® is expected to benefit margins. Potash Phosphates

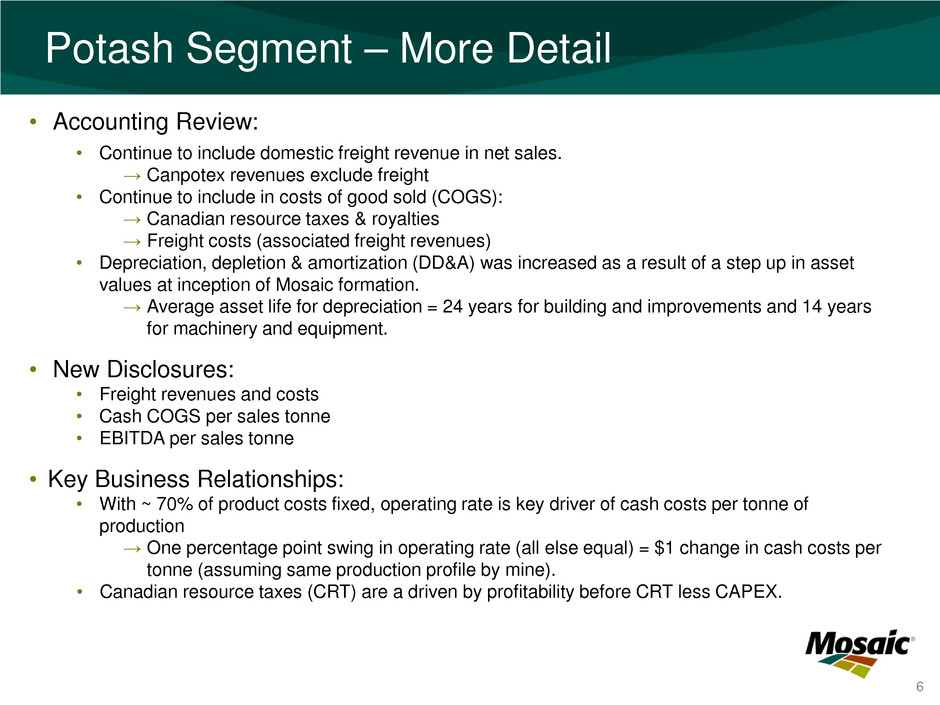
6 Potash Segment – More Detail • Accounting Review: • Continue to include domestic freight revenue in net sales. → Canpotex revenues exclude freight • Continue to include in costs of good sold (COGS): → Canadian resource taxes & royalties → Freight costs (associated freight revenues) • Depreciation, depletion & amortization (DD&A) was increased as a result of a step up in asset values at inception of Mosaic formation. → Average asset life for depreciation = 24 years for building and improvements and 14 years for machinery and equipment. • New Disclosures: • Freight revenues and costs • Cash COGS per sales tonne • EBITDA per sales tonne • Key Business Relationships: • With ~ 70% of product costs fixed, operating rate is key driver of cash costs per tonne of production → One percentage point swing in operating rate (all else equal) = $1 change in cash costs per tonne (assuming same production profile by mine). • Canadian resource taxes (CRT) are a driven by profitability before CRT less CAPEX.

7 Phosphates Segment – More Detail • Accounting Review: • Continue to include freight in both revenue and costs of goods sold. • Depreciation, depletion & amortization (DD&A) is historically higher than competitors as a result of a step up in asset values at inception of Mosaic formation. • Additionally, DD&A increased roughly $14 million per quarter as a result of the recent CF Industries’ phosphate business acquisition. • New Disclosures: • Freight revenue and costs • Full production conversion costs per production tonne • EBITDA per sales tonne • Total MicroEssentials sales volumes (prior disclosures excluded sales through International Distribution blends) • Key Business Relationships: • Realized raw material costs are normally one quarter lagged from purchase prices. • Realized ammonia costs are a function of both internal production and market purchases. Faustina ammonia plant’s operating capacity is 500 thousand tonnes. Annual ammonia consumption is ~1.8 million tonnes. • Costs to produce one tonne of DAP = 1.7x blended rock costs + 0.2x realized ammonia costs + 0.4x realized sulfur costs + conversion costs. • MicroEssentials products generate a margin premium over DAP.

8 International Distribution Segment • Accounting Overview: • Prices and revenue include transportation costs. • All of the Selling, General and Administrative (SG&A) expenses are local. • Revenue and profit from products sold to International Distribution from the Phosphates and Potash segments that are not sold to end customers in the same period are eliminated in a Corporate and Other segment adjustment called profit in inventory adjustment. As inventory levels and profits change this amount could be positive or negative. • Key Business Relationships: • The historical seasonality in this business has resulted in the third quarter normally being the strongest and first quarter the weakest in terms of volumes which often impact gross margin per tonne. • Blends prices vary based on nutrient content mix. • Over time, increasing sell-through of MicroEssentials® is expected to drive higher margins, both per tonne and in absolute. • Business Strategy is Two-fold: • First, to increase the value of the phosphates and potash manufacturing businesses by → providing market access to geographies outside North America, → allowing the flexibility to manage seasonality in demand and maintaining consistent North American operating rates, as well as → supporting premium product growth. • And, second, to run a successful stand-alone distribution business.

9 Guidance Update Phosphates Guidance Q1 Sales volume 2.1 to 2.3 million tonnes Q1 DAP selling price $450 to $460 per tonne Q1 Gross margin rate in the high teens Q1 Operating rate in the 80 to 85 percent range 2015 Sales volume 9 to 10 million tonnes International Distribution Guidance Q1 Sales volume 0.85 to 0.95 million tonnes Q1 Gross margin of $24 to $27 per tonne 2015 Sales volumes 6 to 7 million tonnes Prior phosphate volume and margin guidance reflected the combined manufacturing and distribution businesses. This guidance aligns with new segment reporting. This guidance also reflects roughly 0.2 million tonnes of volumes manufactured by the Phosphates business and sold through the International Distribution business. All other guidance remains unchanged.

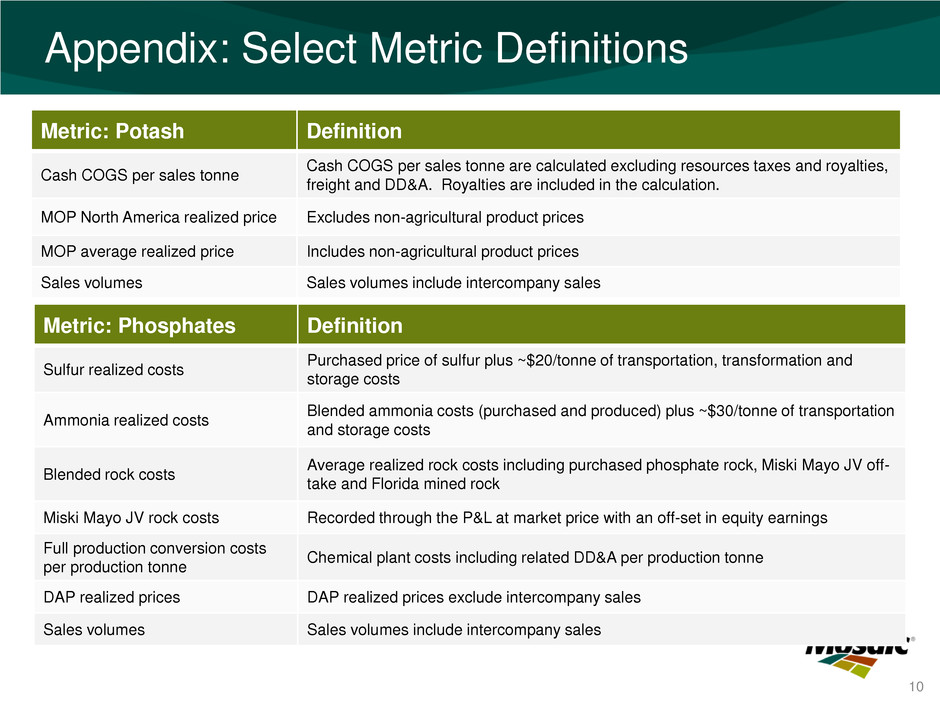
10 Appendix: Select Metric Definitions Metric: Potash Definition Cash COGS per sales tonne Cash COGS per sales tonne are calculated excluding resources taxes and royalties, freight and DD&A. Royalties are included in the calculation. MOP North America realized price Excludes non-agricultural product prices MOP average realized price Includes non-agricultural product prices Sales volumes Sales volumes include intercompany sales Metric: Phosphates Definition Sulfur realized costs Purchased price of sulfur plus ~$20/tonne of transportation, transformation and storage costs Ammonia realized costs Blended ammonia costs (purchased and produced) plus ~$30/tonne of transportation and storage costs Blended rock costs Average realized rock costs including purchased phosphate rock, Miski Mayo JV off-take and Florida mined rock Miski Mayo JV rock costs Recorded through the P&L at market price with an off-set in equity earnings Full production conversion costs per production tonne Chemical plant costs including related DD&A per production tonne DAP realized prices DAP realized prices exclude intercompany sales Sales volumes Sales volumes include intercompany sales

