Attached files
| file | filename |
|---|---|
| EXCEL - IDEA: XBRL DOCUMENT - CITIZENS HOLDING CO /MS/ | Financial_Report.xls |
| EX-21 - EX-21 - CITIZENS HOLDING CO /MS/ | d838457dex21.htm |
| EX-23 - EX-23 - CITIZENS HOLDING CO /MS/ | d838457dex23.htm |
| EX-32.2 - EX-32.2 - CITIZENS HOLDING CO /MS/ | d838457dex322.htm |
| EX-31.1 - EX-31.1 - CITIZENS HOLDING CO /MS/ | d838457dex311.htm |
| EX-31.2 - EX-31.2 - CITIZENS HOLDING CO /MS/ | d838457dex312.htm |
| 10-K - 10-K - CITIZENS HOLDING CO /MS/ | d838457d10k.htm |
| EX-32.1 - EX-32.1 - CITIZENS HOLDING CO /MS/ | d838457dex321.htm |
Exhibit 13
Letter to the Stockholders
I am very pleased to report your company’s accomplishments for 2014. We experienced growth in earnings, assets and deposits as we also expanded our markets and services. These factors all work together to enhance the value of your investment. In 2014 earnings increased 4.2% from the previous year equating to basic per share earnings of $1.53 compared to $1.47 for 2013. The total assets of the bank increased 5.5% while deposits increased by 6.3%. I am very pleased with our growth accomplishments in the current economic market that we are operating in.
A significant part of our overall growth is attributable to the positive accomplishments in our south Mississippi markets. Along with our Hattiesburg branch, we now operate two full service branches in Biloxi. These branches are staffed by competent bankers that represent the bank very well in their respective markets. In addition to market growth, we continue to develop products that take advantage of current technology and provide convenient customer access.
The Board and senior management recognize that we have a strong and healthy capital position and fully intend to deploy that capital strategically in any opportunity that will enhance and maximize your investment. We are constantly seeking ways to improve our existing operations while expanding into new products, services and markets. While growth is a vital component of a healthy company, we strive to be prudent and cautious in the addition of quality assets and in our decisions regarding growth and capital investments.
I am fully aware of the need to properly grow our company. But at the same time, I am also fully aware of the foundation that this company stands on. Without the legacy of generations of loyal customers, employees and stockholders that we have, future growth and new opportunities would be unattainable. While we attempt to grow the company, we will never fail to recognize the core of who and what we are. Your support of our efforts is never taken lightly or for granted and all decisions are made with the intent of maximizing your investment.
I am thankful for our heritage and legacy as a company and I am truly encouraged about our future as well. As the economy continues to improve, we will continue to adapt and prudently grow the company.
I am truly grateful for the employees, customers, and stockholders of this bank, and it is an honor to serve each of you. As always, I appreciate your support in the continuing success of this great company.
| Sincerely, |

|
| Greg McKee |
| President & CEO |
CITIZENS HOLDING COMPANY
Philadelphia, Mississippi
Consolidated Financial Statements
As of December 31, 2014 and 2013 and for the
Years Ended December 31, 2014, 2013 and 2012
CONTENTS
|
Report of Independent Registered Public Accounting Firm |
1 | |||
| Management’s Assessment of Internal Control over Financial Reporting
|
|
3
|
| |
| Consolidated Financial Statements |
||||
| Consolidated Statements of Condition |
4 | |||
| Consolidated Statements of Income |
5 | |||
| Consolidated Statements of Comprehensive Income (Loss) |
6 | |||
| Consolidated Statements of Changes in Stockholders’ Equity |
7 | |||
| Consolidated Statements of Cash Flows |
8–9 | |||
| Notes to Consolidated Financial Statements
|
|
10–63
|
| |

REPORT OF INDEPENDENT REGISTERED PUBLIC ACCOUNTING FIRM
To the Board of Directors and Stockholders
Citizens Holding Company
Philadelphia, Mississippi
We have audited the accompanying consolidated statements of condition of Citizens Holding Company and subsidiary (the “Company”) as of December 31, 2014 and 2013, and the related consolidated statements of income, comprehensive income (loss), changes in stockholders’ equity, and cash flows for each of the three years in the period ended December 31, 2014. We have also audited the Company’s internal control over financial reporting as of December 31, 2014, based on criteria established in Internal Control — Integrated Framework issued by the Committee of Sponsoring Organizations of the Treadway Commission in 2013. The Company’s management is responsible for these consolidated financial statements, for maintaining effective internal control over financial reporting, and for its assessment of the effectiveness of internal control over financial reporting included in the accompanying Management’s Assessment of Internal Control Over Financial Reporting. Our responsibility is to express an opinion on these consolidated financial statements and an opinion on the Company’s internal control over financial reporting based on our audits.
We conducted our audits in accordance with the standards of the Public Company Accounting Oversight Board (United States). Those standards require that we plan and perform the audits to obtain reasonable assurance about whether the consolidated financial statements are free of material misstatement and whether effective internal control over financial reporting was maintained in all material respects. Our audits of the consolidated financial statements included examining, on a test basis, evidence supporting the amounts and disclosures in the consolidated financial statements, assessing the accounting principles used and significant estimates made by management, and evaluating the overall financial statement presentation. Our audit of internal control over financial reporting included obtaining an understanding of internal control over financial reporting, assessing the risk that a material weakness exists, and testing and evaluating the design and operating effectiveness of internal control based on the assessed risk. Our audits also included performing such other procedures as we considered necessary in the circumstances. We believe that our audits provide a reasonable basis for our opinions.

To the Board of Directors and Stockholders
Citizens Holding Company
Page Two
A company’s internal control over financial reporting is a process designed to provide reasonable assurance regarding the reliability of financial reporting and the preparation of financial statements for external purposes in accordance with generally accepted accounting principles. A company’s internal control over financial reporting includes those policies and procedures that: (a) pertain to the maintenance of records that, in reasonable detail, accurately and fairly reflect the transactions and dispositions of the assets of the company; (b) provide reasonable assurance that transactions are recorded as necessary to permit preparation of financial statements in accordance with generally accepted accounting principles, and that receipts and expenditures of the company are being made only in accordance with authorizations of management and directors of the company; and (c) provide reasonable assurance regarding prevention or timely detection of unauthorized acquisition, use, or disposition of the company’s assets that could have a material effect on the financial statements.
Because of its inherent limitations, internal control over financial reporting may not prevent or detect misstatements. Also, projections of any evaluation of effectiveness to future periods are subject to the risk that controls may become inadequate because of changes in conditions, or that the degree of compliance with the policies or procedures may deteriorate.
In our opinion, the consolidated financial statements referred to above present fairly, in all material respects, the consolidated financial position of the Company as of December 31, 2014 and 2013, and the results of their operations and their cash flows for each of the years in the three-year period ended December 31, 2014, in conformity with accounting principles generally accepted in the United States of America. Also in our opinion, the Company maintained, in all material respects, effective internal control over financial reporting as of December 31, 2014, based on criteria established in Internal Control — Integrated Framework issued by the Committee of Sponsoring Organizations of the Treadway Commission in 2013.

|
|
Ridgeland, Mississippi |
| March 6, 2015 |
2
Citizens Holding Company
Philadelphia, MS 39350
MANAGEMENT’S ASSESSMENT OF INTERNAL CONTROL OVER FINANCIAL REPORTING
Management of Citizens Holding Company (the “Company”) is responsible for establishing and maintaining adequate internal control over financial reporting. Internal control over financial reporting is a process designed under the supervision of the Company’s principal executive and principal financial officers to provide reasonable assurance regarding the reliability of financial reporting and the preparation of the Company’s financial statements for external purposes in accordance with accounting principles generally accepted in the United States of America.
Management, under the direction of the chief executive officer and chief financial officer, assessed the Company’s internal control over financial reporting as of December 31, 2014 based on the criteria for effective internal control over financial reporting established in Internal Control — Integrated Framework issued by the Committee of Sponsoring Organizations of the Treadway Commission in 2013. Based on this assessment, management believes that, as of December 31, 2014, the Company maintained effective internal control over financial reporting.
The Company’s internal control over financial reporting includes policies and procedures that (1) pertain to the maintenance of records that in reasonable detail accurately and fairly reflect the transactions and dispositions of the assets of the Company, (2) provide reasonable assurance that transactions are recorded as necessary to permit preparation of financial statements in accordance with generally accepted accounting principles and that receipts and expenditures of the Company are being made only in accordance with authorizations of management and directors of the Company, and (3) provide reasonable assurance regarding prevention or timely detection of unauthorized acquisition, use or disposition of the Company’s assets that could have a material effect on the financial statements.
Because of its inherent limitations, internal control over financial reporting may not prevent or detect misstatements. Projections of any evaluation of effectiveness to future periods are subject to risk that controls may become inadequate because of changes in conditions, or that the degree of compliance with the policies or procedures may deteriorate.
HORNE LLP, the Company’s Independent Registered Public Accounting Firm, has audited the Company’s internal control over financial reporting as of December 31, 2014, as stated in their report, beginning on page 1, which expresses an unqualified opinion on the Company’s internal control over financial reporting as of December 31, 2014.

|

| |
| Greg L. McKee |
Robert T. Smith | |
| President and Chief Executive Officer |
Treasurer and Chief Financial Officer |
March 6, 2015
3
CITIZENS HOLDING COMPANY
Consolidated Statements of Condition
December 31, 2014 and 2013
| ASSETS |
2014 | 2013 | ||||||
| Cash and due from banks |
$ | 22,405,730 | $ | 16,040,195 | ||||
| Interest bearing deposits with other banks |
61,481,223 | 684,100 | ||||||
| Securities available for sale, at fair value (amortized cost of $178,392,462 in 2014 and $432,065,590 in 2013) |
179,745,130 | 398,176,402 | ||||||
| Securities held to maturity, at book value (fair value of $216,745,438 in 2014 and $0 in 2013) |
206,817,169 | — | ||||||
| Loans, net of allowance for loan losses of $6,542,326 in 2014 and $8,077,499 in 2013 |
384,417,508 | 384,104,766 | ||||||
| Bank premises, furniture, fixtures and equipment, net |
19,240,230 | 18,623,154 | ||||||
| Other real estate owned, net |
4,051,561 | 3,751,168 | ||||||
| Accrued interest receivable |
3,869,937 | 4,132,053 | ||||||
| Cash surrender value of life insurance |
22,347,601 | 22,208,962 | ||||||
| Intangible assets, net |
3,149,657 | 3,149,657 | ||||||
| Other assets |
13,534,935 | 22,198,442 | ||||||
|
|
|
|
|
|||||
| Total assets |
$ | 921,060,681 | $ | 873,068,899 | ||||
|
|
|
|
|
|||||
| LIABILITIES AND STOCKHOLDERS’ EQUITY |
||||||||
| Deposits |
||||||||
| Non-interest bearing deposits |
$ | 145,729,932 | $ | 120,424,895 | ||||
| Interest bearing deposits |
550,363,962 | 534,204,901 | ||||||
|
|
|
|
|
|||||
| Total deposits |
696,093,894 | 654,629,796 | ||||||
| Securities sold under agreement to repurchase |
114,426,770 | 82,420,781 | ||||||
| Federal funds purchased |
— | 27,500,000 | ||||||
| Federal Home Loan Bank advances |
20,000,000 | 33,500,000 | ||||||
| Accrued interest payable |
190,717 | 199,513 | ||||||
| Deferred compensation payable |
7,209,694 | 6,719,948 | ||||||
| Other liabilities |
1,281,820 | 1,832,659 | ||||||
|
|
|
|
|
|||||
| Total liabilities |
839,202,895 | 806,802,697 | ||||||
|
|
|
|
|
|||||
| Stockholders’ equity |
||||||||
| Common stock, $.20 par value, authorized 22,500,000 shares; 4,877,614 shares issued and outstanding at 2014 and 4,870,114 shares issued and outstanding at 2013 |
975,482 | 974,023 | ||||||
| Additional paid-in capital |
3,861,717 | 3,748,176 | ||||||
| Accumulated other comprehensive loss, net of tax benefit of ($5,283,048) in 2014 and ($12,640,667) in 2013 |
(8,880,620 | ) | (21,248,521 | ) | ||||
| Retained earnings |
85,901,207 | 82,792,524 | ||||||
|
|
|
|
|
|||||
| Total stockholders’ equity |
81,857,786 | 66,266,202 | ||||||
|
|
|
|
|
|||||
| Total liabilities and stockholders’ equity |
$ | 921,060,681 | $ | 873,068,899 | ||||
|
|
|
|
|
|||||
The accompanying notes are an integral part of these statements.
4
CITIZENS HOLDING COMPANY
Consolidated Statements of Income
Years Ended December 31, 2014, 2013, and 2012
| 2014 | 2013 | 2012 | ||||||||||
| Interest income |
||||||||||||
| Interest and fees on loans |
$ | 20,081,852 | $ | 20,610,580 | $ | 23,244,808 | ||||||
| Interest on securities |
||||||||||||
| Taxable |
8,226,508 | 7,949,437 | 7,326,516 | |||||||||
| Non-taxable |
3,022,992 | 3,504,084 | 3,751,909 | |||||||||
| Other interest |
49,398 | 51,994 | 64,580 | |||||||||
|
|
|
|
|
|
|
|||||||
| Total interest income |
31,380,750 | 32,116,095 | 34,387,813 | |||||||||
| Interest expense |
||||||||||||
| Deposits |
1,754,909 | 1,944,997 | 2,710,082 | |||||||||
| Other borrowed funds |
1,263,386 | 2,135,460 | 2,998,939 | |||||||||
|
|
|
|
|
|
|
|||||||
| Total interest expense |
3,018,295 | 4,080,457 | 5,709,021 | |||||||||
|
|
|
|
|
|
|
|||||||
| Net interest income |
28,362,455 | 28,035,638 | 28,678,792 | |||||||||
| Provision for loan losses |
(923,397 | ) | (2,204,366 | ) | (1,545,797 | ) | ||||||
|
|
|
|
|
|
|
|||||||
| Net interest income after provision for loan losses |
27,439,058 | 25,831,272 | 27,132,995 | |||||||||
| Non-interest income |
||||||||||||
| Service charges on deposit accounts |
3,932,691 | 3,884,997 | 3,702,425 | |||||||||
| Other service charges and fees |
2,096,836 | 1,953,263 | 1,840,211 | |||||||||
| Net gains on sales of securities |
14,542 | 423,388 | 459,934 | |||||||||
| Other income |
2,118,435 | 1,554,454 | 1,399,209 | |||||||||
|
|
|
|
|
|
|
|||||||
| Total non-interest income |
8,162,504 | 7,816,102 | 7,401,779 | |||||||||
| Non-interest expense |
||||||||||||
| Salaries and employee benefits |
13,095,023 | 13,110,603 | 13,736,939 | |||||||||
| Occupancy expense |
2,129,193 | 2,016,965 | 2,007,513 | |||||||||
| Equipment expense |
3,065,842 | 2,379,167 | 2,480,323 | |||||||||
| Other expense |
8,033,654 | 7,220,876 | 7,875,192 | |||||||||
|
|
|
|
|
|
|
|||||||
| Total non-interest expense |
26,323,712 | 24,727,611 | 26,099,967 | |||||||||
|
|
|
|
|
|
|
|||||||
| Income before income taxes |
9,277,850 | 8,919,763 | 8,434,807 | |||||||||
| Income tax expense |
1,828,091 | 1,769,903 | 1,650,808 | |||||||||
|
|
|
|
|
|
|
|||||||
| Net income |
$ | 7,449,759 | $ | 7,149,860 | $ | 6,783,999 | ||||||
|
|
|
|
|
|
|
|||||||
| Net income per share – basic |
$ | 1.53 | $ | 1.47 | $ | 1.40 | ||||||
|
|
|
|
|
|
|
|||||||
| Net income per share – diluted |
$ | 1.53 | $ | 1.47 | $ | 1.39 | ||||||
|
|
|
|
|
|
|
|||||||
| Average shares outstanding |
||||||||||||
| Basic |
4,870,114 | 4,868,263 | 4,857,798 | |||||||||
|
|
|
|
|
|
|
|||||||
| Diluted |
4,870,749 | 4,869,767 | 4,865,865 | |||||||||
|
|
|
|
|
|
|
|||||||
The accompanying notes are an integral part of these statements.
5
CITIZENS HOLDING COMPANY
Consolidated Statements of Comprehensive Income (Loss)
Years Ended December 31, 2014, 2013, and 2012
| 2014 | 2013 | 2012 | ||||||||||
| Net income |
$ | 7,449,759 | $ | 7,149,860 | $ | 6,783,999 | ||||||
| Other comprehensive income (loss) |
||||||||||||
| Unrealized holding gains (losses) on available-for-sale securities |
35,256,397 | (40,399,686 | ) | 307,841 | ||||||||
| Income tax effect |
(13,150,636 | ) | 15,069,083 | (114,825 | ) | |||||||
|
|
|
|
|
|
|
|||||||
| Net unrealized gains (losses) |
22,105,761 | (25,330,603 | ) | 193,016 | ||||||||
|
|
|
|
|
|
|
|||||||
| Unrealized losses on securities transferred to from available-for-sale to held-to-maturity |
(17,061,438 | ) | — | — | ||||||||
| Amortization of net unrealized losses transferred during the period |
1,545,103 | — | — | |||||||||
| Income tax effect |
5,787,593 | — | — | |||||||||
|
|
|
|
|
|
|
|||||||
| (9,728,742 | ) | — | — | |||||||||
|
|
|
|
|
|
|
|||||||
| Reclassification adjustment for gains included in net income |
(14,542 | ) | (423,388 | ) | (459,934 | ) | ||||||
| Income tax effect |
5,424 | 157,924 | 171,555 | |||||||||
|
|
|
|
|
|
|
|||||||
| Net gains included in net income |
(9,118 | ) | (265,464 | ) | (288,379 | ) | ||||||
|
|
|
|
|
|
|
|||||||
| Total other comprehensive income (loss) |
12,367,901 | (25,596,067 | ) | (95,363 | ) | |||||||
|
|
|
|
|
|
|
|||||||
| Comprehensive income (loss) |
$ | 19,817,660 | $ | (18,446,207 | ) | $ | 6,688,636 | |||||
|
|
|
|
|
|
|
|||||||
The accompanying notes are an integral part of these statements.
6
CITIZENS HOLDING COMPANY
Consolidated Statements of Changes in Stockholders’ Equity
Years Ended December 31, 2014, 2013, and 2012
| Number of Shares Issued |
Common Stock |
Additional Paid-In Capital |
Accumulated Other Comprehensive Income (Loss) |
Retained Earnings |
Total | |||||||||||||||||||
| Balance, December 31, 2011 |
4,843,911 | $ | 968,782 | $ | 3,247,208 | $ | 4,442,909 | $ | 77,420,318 | $ | 86,079,217 | |||||||||||||
| Net income |
— | — | — | — | 6,783,999 | 6,783,999 | ||||||||||||||||||
| Dividends paid ($0.88 per share) |
— | — | — | — | (4,276,282 | ) | (4,276,282 | ) | ||||||||||||||||
| Options exercised |
17,500 | 3,500 | 253,925 | — | — | 257,425 | ||||||||||||||||||
| Stock compensation expense |
— | — | 119,834 | — | — | 119,834 | ||||||||||||||||||
| Other comprehensive income, net |
— | — | — | (95,363 | ) | — | (95,363 | ) | ||||||||||||||||
|
|
|
|
|
|
|
|
|
|
|
|
|
|||||||||||||
| Balance, December 31, 2012 |
4,861,411 | 972,282 | 3,620,967 | 4,347,546 | 79,928,035 | 88,868,830 | ||||||||||||||||||
| Net income |
— | — | — | — | 7,149,860 | 7,149,860 | ||||||||||||||||||
| Dividends paid ($0.88 per share) |
— | — | — | — | (4,285,371 | ) | (4,285,371 | ) | ||||||||||||||||
| Options exercised |
8,703 | 1,700 | 127,250 | — | — | 128,950 | ||||||||||||||||||
| Other comprehensive loss, net |
— | — | — | (25,596,067 | ) | — | (25,596,067 | ) | ||||||||||||||||
|
|
|
|
|
|
|
|
|
|
|
|
|
|||||||||||||
| Balance, December 31, 2013 |
4,870,114 | 973,982 | 3,748,217 | (21,248,521 | ) | 82,792,524 | 66,266,202 | |||||||||||||||||
| Net income |
— | — | — | — | 7,449,759 | 7,449,759 | ||||||||||||||||||
| Dividends paid ($0.89 per share) |
— | — | — | — | (4,341,076 | ) | (4,341,076 | ) | ||||||||||||||||
| Restricted stock granted |
7,500 | 1,500 | (1,500 | ) | — | — | — | |||||||||||||||||
| Stock compensation expense |
— | — | 115,000 | — | — | 115,000 | ||||||||||||||||||
| Other comprehensive income, net |
— | — | — | 12,367,901 | — | 12,367,901 | ||||||||||||||||||
|
|
|
|
|
|
|
|
|
|
|
|
|
|||||||||||||
| Balance, December 31, 2014 |
4,877,614 | $ | 975,482 | 3,861,717 | (8,880,620 | ) | 85,901,207 | $ | 81,857,786 | |||||||||||||||
|
|
|
|
|
|
|
|
|
|
|
|
|
|||||||||||||
The accompanying notes are an integral part of these statements.
7
CITIZENS HOLDING COMPANY
Consolidated Statements of Cash Flows
Years Ended December 31, 2014, 2013, and 2012
| 2014 | 2013 | 2012 | ||||||||||
| Cash flows from operating activities |
||||||||||||
| Net income |
$ | 7,449,759 | $ | 7,149,860 | $ | 6,783,999 | ||||||
| Adjustments to reconcile net income to net cash provided by operating activities |
||||||||||||
| Depreciation |
1,190,393 | 1,140,753 | 1,149,029 | |||||||||
| Amortization of intangibles |
— | — | 76,955 | |||||||||
| Amortization of premiums and accretion of discounts on investment securities, net |
405,017 | 717,749 | 850,887 | |||||||||
| Stock compensation expense |
115,000 | — | 119,834 | |||||||||
| Provision for loan losses |
923,397 | 2,204,366 | 1,545,797 | |||||||||
| Gain on sale of securities |
(14,542 | ) | (423,388 | ) | (459,934 | ) | ||||||
| Federal Home Loan Bank stock dividends |
(8,400 | ) | (11,400 | ) | (13,100 | ) | ||||||
| Deferred income taxes |
307,920 | (850,100 | ) | (536,374 | ) | |||||||
| Excess tax benefit on stock options |
— | (14,566 | ) | (12,167 | ) | |||||||
| Net writedown on other real estate owned |
824,059 | 276,400 | 309,797 | |||||||||
| Decrease (increase) in accrued interest receivable |
262,116 | 533,815 | (220,484 | ) | ||||||||
| Increase in cash surrender value life insurance |
(784,425 | ) | (1,017,032 | ) | (809,867 | ) | ||||||
| Gain on BOLI death benefits |
(623,774 | ) | — | — | ||||||||
| Decrease in accrued interest payable |
(8,796 | ) | (121,959 | ) | (50,902 | ) | ||||||
| Increase in deferred compensation liability |
489,746 | 802,286 | 831,727 | |||||||||
| Net change in other operating assets and liabilities |
(837,072 | ) | 824,044 | 1,522,053 | ||||||||
|
|
|
|
|
|
|
|||||||
| Net cash provided by operating activities |
9,690,398 | 11,210,828 | 11,087,250 | |||||||||
|
|
|
|
|
|
|
|||||||
| Cash flows from investing activities |
||||||||||||
| Proceeds from maturities of securities available-for-sale |
12,944,631 | 81,916,607 | 256,825,697 | |||||||||
| Proceeds from sales of securities available-for-sale |
18,004,518 | 41,974,017 | 5,583,382 | |||||||||
| Purchases of investment securities available-for-sale |
— | (142,276,646 | ) | (313,234,435 | ) | |||||||
| Purchases of bank premises, furniture, fixtures and equipment |
(1,807,469 | ) | (338,615 | ) | (295,878 | ) | ||||||
| Proceeds from sale of other real estate owned |
1,749,721 | 2,091,610 | 1,574,051 | |||||||||
| Net (increase) decrease in interest bearing deposits with other banks |
(60,797,123 | ) | 15,544,647 | (12,238,226 | ) | |||||||
| Proceeds from redemption of Federal Home Loan Bank Stock |
1,292,600 | 1,052,000 | 442,800 | |||||||||
| Purchases of Federal Home Loan Bank Stock |
— | (438,600 | ) | (282,700 | ) | |||||||
| Proceeds from death benefits of bank owned life insurance |
1,269,560 | — | — | |||||||||
| Net (increase) decrease in loans |
(4,110,312 | ) | (25,809,560 | ) | 17,400,787 | |||||||
|
|
|
|
|
|
|
|||||||
| Net cash used by investing activities |
(31,453,874 | ) | (26,284,540 | ) | (44,224,522 | ) | ||||||
|
|
|
|
|
|
|
|||||||
8
CITIZENS HOLDING COMPANY
Consolidated Statements of Cash Flows
Years Ended December 31, 2014, 2013, and 2012
2 of 2
| 2014 | 2013 | 2012 | ||||||||||
| Cash flows from financing activities |
||||||||||||
| Net increase in deposits |
$ | 41,464,098 | $ | 12,080,458 | $ | 70,211,203 | ||||||
| Net increase (decrease) in federal funds purchased |
(27,500,000 | ) | 27,500,000 | — | ||||||||
| Net change in securities sold under agreement to repurchase |
32,005,989 | 9,114,016 | (46,913,668 | ) | ||||||||
| Proceeds from exercise of stock options |
— | 128,950 | 257,425 | |||||||||
| Excess tax benefit on stock option exercises |
— | 14,566 | 12,167 | |||||||||
| Dividends paid to stockholders |
(4,341,076 | ) | (4,285,371 | ) | (4,276,282 | ) | ||||||
| Federal Home Loan Bank advance proceeds |
— | 10,000,000 | — | |||||||||
| Federal Home Loan Bank advance payments |
(13,500,000 | ) | (45,000,000 | ) | — | |||||||
|
|
|
|
|
|
|
|||||||
| Net cash provided by financing activities |
28,129,011 | 9,552,619 | 19,290,845 | |||||||||
|
|
|
|
|
|
|
|||||||
| Net increase (decrease) in cash and due from banks |
6,365,535 | (5,521,093 | ) | (13,846,427 | ) | |||||||
| Cash and due from banks, beginning of year |
16,040,195 | 21,561,288 | 35,407,715 | |||||||||
|
|
|
|
|
|
|
|||||||
| Cash and due from banks, end of year |
$ | 22,405,730 | $ | 16,040,195 | $ | 21,561,288 | ||||||
|
|
|
|
|
|
|
|||||||
| Supplemental disclosures of cash flow information |
||||||||||||
| Cash paid for Interest |
$ | 3,027,090 | $ | 4,202,416 | $ | 5,760,923 | ||||||
|
|
|
|
|
|
|
|||||||
| Income taxes |
$ | 2,460,014 | $ | 2,357,215 | $ | 2,442,092 | ||||||
|
|
|
|
|
|
|
|||||||
| Noncash disclosures |
||||||||||||
| Real estate acquired by foreclosure |
$ | 2,874,173 | $ | 1,436,923 | $ | 1,697,450 | ||||||
|
|
|
|
|
|
|
|||||||
| Transfers from available-for-sale to held-to-maturity |
$ | 222,322,423 | $ | — | $ | — | ||||||
|
|
|
|
|
|
|
|||||||
The accompanying notes are an integral part of these financial statements.
9
CITIZENS HOLDING COMPANY
Years Ended December 31, 2014, 2013 and 2012
NOTES TO CONSOLIDATED FINANCIAL STATEMENTS
Note 1. Summary of Significant Accounting Policies
Basis of Financial Statement Presentation
The accounting policies of Citizens Holding Company and its subsidiary conform to generally accepted accounting principles (“GAAP”) in the United States of America and to general practices within the banking industry. The consolidated financial statements of Citizens Holding Company include the accounts of its wholly-owned subsidiary, The Citizens Bank of Philadelphia, Mississippi (collectively, the “Company”). All significant intercompany transactions have been eliminated in consolidation.
Nature of Business
The Citizens Bank of Philadelphia, Mississippi (the “Bank”) operates under a state bank charter and provides general banking services. As a state bank, the Bank is subject to regulations of the Mississippi Department of Banking and Consumer Finance and the Federal Deposit Insurance Company. Citizens Holding Company is also subject to the regulations of the Federal Reserve. The area served by the Bank is central and southern counties of Mississippi and the surrounding areas. Services are provided at several branch offices.
Estimates
The preparation of financial statements in conformity with GAAP requires management to make estimates and assumptions that affect the reported amounts of assets and liabilities and disclosure of contingent assets and liabilities at the date of the financial statements and the reported amounts of revenues and expenses during the reporting period. Actual results could differ from those estimates.
Estimates that are particularly susceptible to significant change relate to the determination of the allowance for loan losses and the valuation of real estate acquired in connection with foreclosures or in satisfaction of loans. In connection with the determination of the allowance for loan losses and valuation of foreclosed real estate, management obtains independent appraisals for significant properties.
While management uses available information to recognize losses on loans and to value foreclosed real estate, future additions to the allowance or adjustments to the valuation may be necessary based on changes in local economic conditions. In addition, regulatory agencies, as an integral part of their examination process, periodically review the Company’s allowance for loan losses and valuations of foreclosed real estate. Such agencies may require the Company to recognize additions to the allowance or to make adjustments to the valuation based on their judgments about information available to them at the time of their examination. Due to these factors, it is reasonably possible that the allowance for loan losses and valuation of foreclosed real estate may change materially in the near term.
10
CITIZENS HOLDING COMPANY
Years Ended December 31, 2014, 2013 and 2012
NOTES TO CONSOLIDATED FINANCIAL STATEMENTS
Note 1. Continued
Cash, Due from Banks and Interest Bearing Deposits with Other Banks
For the purpose of reporting cash flows, cash and due from banks includes cash on hand and demand deposits. Cash flows from loans originated by the Company, deposits, and federal funds purchased and sold are reported net in the statement of cash flows. The Company is required to maintain average reserve balances with the Federal Reserve Bank based on a percentage of deposits. The average reserve required by the Federal Reserve Bank at December 31, 2014 and 2013 was $0 and $2,015,000, respectively.
Interest-bearing deposits with other banks mature within one year and are carried at cost.
Investment Securities
In accordance with the investments topic of the Accounting Standards Codification (“ASC”), securities are classified as “available-for-sale,” “held-to-maturity” or “trading”. Fair values for securities are based on quoted market prices where available. If quoted market prices are not available, fair values are based on quoted market prices of comparable instruments. Gains or losses on the sale of securities are determined using the specific identification method. Currently, the Company has no trading securities.
Securities Available-for-Sale
Securities that are held for indefinite periods of time or used as part of the Company’s asset/liability management strategy and that may be sold in response to interest rate changes, changes in prepayment risk, the need to increase regulatory capital and other similar factors are classified as available-for-sale (“AFS”). Securities available-for-sale are reported at fair value, with unrealized gains and losses reported, net of related income tax effect, as a separate component of stockholders’ equity.
Securities Held to Maturity
Securities that are held-to-maturity (“HTM”) are those securities that the Corporation has the positive intent and ability to hold until maturity. These securities cannot be sold in response to the risk factors discussed above for available for sale securities. These securities are reported at book value. The securities currently classified as held to maturity were transferred from AFS in April 2014. Any unrealized loss at that time is being amortized over the remaining life of the securities at the same rate as the discount is being accreted on the new balance, resulting in a zero income effect.
11
CITIZENS HOLDING COMPANY
Years Ended December 31, 2014, 2013 and 2012
NOTES TO CONSOLIDATED FINANCIAL STATEMENTS
Note 1. Continued
Realized gains or losses, determined on the basis of the cost of specific securities sold, are included in earnings. The amortization of premiums and accretion of discounts are recognized in interest income.
The Company periodically reviews its securities for impairment based upon a number of factors, including but not limited to, length of time and extent to which the fair value has been less than cost, the likelihood of the security’s ability to recover any decline in its fair value, financial condition of the underlying issuer, ability of the issuer to meet contractual obligations and ability to retain the security for a period of time sufficient to allow for recovery in fair value. Impairments on securities are recognized when management, based on its analysis, deems the impairment to be other-than-temporary. Disclosures about unrealized losses in our securities portfolio that have not been recognized as other-than-temporary impairments are provided in Note 3.
Loans and Allowance for Loan Losses
Loans receivable that management has the intent and ability to hold for the foreseeable future or until maturity or payoff are reported at the principal amount outstanding, net of unearned income and an allowance for loan losses. The Company has no loans held-for-sale.
Unearned income includes deferred fees net of deferred direct incremental loan origination cost. Unearned income attributable to loans held with a maturity of more than one year is recognized as income or expense over the life of the loan.
Unearned discounts on installment loans are recognized as income over the terms of the loans by a method that approximates the interest method. Unearned income and interest on commercial loans are recognized based on the principal amount outstanding. For all other loans, interest is accrued daily on the outstanding balances. For impaired loans, interest is discontinued on a loan when management believes, after considering collection efforts and other factors, that the borrower’s financial condition is such that collection of interest is doubtful. Cash collections on impaired loans are credited to the loan receivable balance, and no interest income is recognized on those loans until the principal balance has been collected. The Company generally discontinues the accrual of interest income when a loan becomes 90 days past due as to principal or interest; however, management may elect to continue the accrual when the estimated net realizable value of collateral is sufficient to cover the principal balance and the accrued interest. Interest income on other nonaccrual loans is recognized only to the extent of interest payments. Upon discontinuance of the accrual of interest on a loan, any previously accrued but unpaid interest is reversed against interest income.
12
CITIZENS HOLDING COMPANY
Years Ended December 31, 2014, 2013 and 2012
NOTES TO CONSOLIDATED FINANCIAL STATEMENTS
Note 1. Continued
A loan is impaired when management determines that it is probable the Company will be unable to collect all contractual principal and interest payments due in accordance with the terms of the loan agreement. Impaired loans are measured based on the present value of expected future cash flows discounted at the loan’s effective interest rate or, as a practical expedient, at the loan’s observable market price or the fair value of the collateral if the loan is collateral dependent. The amount of impairment, if any, and any subsequent changes are included in the allowance for loan losses.
Troubled debt restructurings (“TDR”) are those for which concessions have been granted to the borrower due to a deterioration of the borrower’s financial condition. Such concessions may include reduction in interest rates or deferral of interest or principal payments. In evaluating whether to restructure a loan, management analyzes the long-term financial condition of the borrower, including guarantor and collateral support, to determine whether the proposed concessions will increase the likelihood of repayment of principal and interest. TDR are classified as performing, unless they are on nonaccrual status of 90 days or more delinquent, in which case they are considered nonperforming.
The allowance for loan losses is established through a provision for loan losses charged against net income. Loans determined to be uncollectible are charged against the allowance for loan losses, and subsequent recoveries, if any, are credited to the allowance. The allowance represents an amount, which, in management’s judgment, will be adequate to absorb estimated probable losses on existing loans that may become uncollectible. In order to determine an adequate level of allowance, management utilizes a model that calculates the allowance for loan loss by applying an average historical charge-off percentage by loan segment and over a 20 quarter period of time with the most current quarters weighted to show the effect of the most recent chargeoff activity to the current loan balances in the corresponding loan segment. Additionally, specific reserves on an individual loan basis may be applied in addition to the allowance calculated using the model. This specific reserve is determined by an extensive review of the borrower’s credit history, capacity to pay, adequacy of collateral and general economic conditions related to the respective loan. This specific reserve will stay in place until such time that the borrower’s obligation is satisfied or the loan is greatly improved.
Large groups of small-balance homogenous loans are collectively evaluated for impairment. Accordingly, the Company does not separately identify individual consumer and residential loans for impairment disclosures.
13
CITIZENS HOLDING COMPANY
Years Ended December 31, 2014, 2013 and 2012
NOTES TO CONSOLIDATED FINANCIAL STATEMENTS
Note 1. Continued
Bank Premises, Furniture, Fixtures and Equipment
The Company’s premises, furniture, fixtures and equipment are stated at cost less accumulated depreciation computed by straight-line methods over the estimated useful lives of the assets, which range from three to forty years. Costs of major additions and improvements are capitalized. Expenditures for maintenance and repairs are charged to expense as incurred.
Other Real Estate Owned
Other real estate owned (“OREO”) consists of properties repossessed by the Company on foreclosed loans. These assets are stated at fair value at the date acquired less estimated costs to sell. Losses arising from the acquisition of such property are charged against the allowance for loan losses. Declines in value resulting from subsequent revaluation of the property or losses resulting from disposition of such property are expensed as incurred. Revenue and expenses from operations of other real estate owned are reflected as other income (expense).
Cash Surrender Value of Life Insurance
The Company has purchased life insurance contracts on certain employees and directors. Certain of such policies were acquired to fund deferred compensation arrangements with employees and directors. The cash surrender value of the Company owned policies is carried at the actual cash surrender value of the policy at the balance sheet date. Changes in the value of the policies are classified in non-interest income.
Intangible Assets
Intangible assets include core deposits purchased and goodwill. Core deposit intangibles are amortized on a straight-line basis over their estimated economic lives ranging from 5 to 10 years. At December 31, 2014, all core deposit intangibles had been fully amortized. Goodwill and other intangible assets with indefinite lives are not amortized, but are tested at least annually for impairment. Fair values are determined based on market valuation multiples for the Company and comparable businesses based on the assets and cash flow of the Bank, the Company’s only reportable segment. If impairment has occurred, the goodwill or other intangible asset is reduced to its estimated fair value through a charge to expense.
14
CITIZENS HOLDING COMPANY
Years Ended December 31, 2014, 2013 and 2012
NOTES TO CONSOLIDATED FINANCIAL STATEMENTS
Note 1. Continued
Trust Assets
Assets held by the trust department of the Company in its fiduciary or agency capacities are not assets of the Company and are not included in the consolidated financial statements.
Income Taxes
Provisions for income taxes are based on taxes payable or refundable for the current year and the changes in deferred tax assets and liabilities, excluding components of other comprehensive income. Deferred tax assets and liabilities are included in the financial statements at currently enacted income tax rates applicable to the period in which the deferred tax assets and liabilities are expected to be realized or settled. As changes in tax laws or rates are enacted, deferred tax assets and liabilities are adjusted through the provision for income taxes. Deferred tax assets are reduced by a valuation allowance when, in the opinion of management, it is more likely than not that some portion or all of the deferred tax assets will not be realized.
Comprehensive Income (Loss)
Comprehensive income includes net earnings reported in the consolidated statements of income, changes in unrealized gain (loss) on securities available-for-sale and changes in unrealized losses on securities transferred from AFS to HTM reported as a component of stockholders’ equity. Unrealized gain (loss) on securities available-for-sale and changes in unrealized losses on securities transferred from AFS to HTM, net of related income taxes, are the only components of accumulated other comprehensive income for the Company.
15
CITIZENS HOLDING COMPANY
Years Ended December 31, 2014, 2013 and 2012
NOTES TO CONSOLIDATED FINANCIAL STATEMENTS
Note 1. Continued
Net Income Per Share
Net income per share-basic is computed by dividing net income by the weighted average number of common shares outstanding during the year. Net income per share-diluted is based on the weighted average number of shares of common stock outstanding for the periods, including the dilutive effect of the Company’s outstanding stock options. The effect of the dilutive shares for the years 2014, 2013 and 2012 is illustrated in the following table.
| 2014 | 2013 | 2012 | ||||||||||
| Basic weighted average shares outstanding |
4,870,114 | 4,868,263 | 4,857,798 | |||||||||
| Dilutive effect of stock options |
635 | 1,504 | 8,067 | |||||||||
|
|
|
|
|
|
|
|||||||
| Dilutive weighted average shares outstanding |
4,870,749 | 4,869,767 | 4,865,865 | |||||||||
|
|
|
|
|
|
|
|||||||
| Net income |
$ | 7,449,759 | $ | 7,149,860 | $ | 6,783,999 | ||||||
|
|
|
|
|
|
|
|||||||
| Net income per share-basic |
$ | 1.53 | $ | 1.47 | $ | 1.40 | ||||||
| Net income per share-diluted |
$ | 1.53 | $ | 1.47 | $ | 1.39 | ||||||
Advertising Costs
Advertising costs are charged to expense when incurred. Advertising expense was $769,081, $621,216 and $636,652 for the years ended December 31, 2014, 2013 and 2012, respectively.
Securities Sold Under Agreements to Repurchase
Securities sold under agreements to repurchase are accounted for as collateralized financing transactions and are recorded at the amounts at which the securities were sold. Securities, generally United States Government, federal agency and state county municipal securities, pledged as collateral under these financing arrangements cannot be sold or re-pledged by the secured party.
Reclassifications
Certain information for 2012 and 2013 has been reclassified to conform to the financial presentation for 2014. Such reclassifications had no effect on net income or stockholders’ equity.
16
CITIZENS HOLDING COMPANY
Years Ended December 31, 2014, 2013 and 2012
NOTES TO CONSOLIDATED FINANCIAL STATEMENTS
Note 1. Continued
Stock-Based Compensation
At December 31, 2014, the Company had outstanding grants under three stock-based compensation plans, which are the 1999 Employees’ Long-Term Incentive Plan, which expired in 2009, the 1999 Directors’ Stock Compensation Plan and the 2013 Incentive Compensation Plan. Compensation expense for the option grants is determined based on the estimated fair value of the stock options on the applicable grant date. Compensation expense for grants of restricted stock is accounted for using the fair market value of the Company’s stock on the date the restricted shares are awarded. Further, compensation expense is based on an estimate of the number of grants expected to vest and is recognized over the grants’ implied vesting period of 6 months and 1 day. Expense associated with the Company’s stock based compensation is included in salaries and benefits on the Consolidated Statements of Income. The Company recognizes compensation expense for all share-based payments to employees in accordance with ASC 718, “Compensation – Stock Compensation.” See Note 18 for further details regarding the Company’s stock-based compensation.
Subsequent Events
The Company has evaluated, for consideration of recognition or disclosure, subsequent events that have occurred through the date of issuance of its financial statements, and has determined that no significant events occurred after December 31, 2014 but prior to the issuance of these financial statements that would have a material impact on its Consolidated Financial Statements.
17
CITIZENS HOLDING COMPANY
Years Ended December 31, 2014, 2013 and 2012
NOTES TO CONSOLIDATED FINANCIAL STATEMENTS
Note 2. Intangible Assets
In 2002, the Company acquired CB&T Capital Corporation, a one-bank holding company, whose wholly-owned subsidiary was Citizens Bank & Trust Company in Louisville, Mississippi. In addition to the intangible assets related to the purchase of CB&T Capital Corporation, the Company recorded intangible assets from the purchase of branches located in Kosciusko and Scooba, Mississippi and from the purchase of Three D Mortgage Company. The following table details the goodwill associated with each purchase, which is no longer being amortized, in accordance with ASC Topic 350, Intangibles- Goodwill and Other.
| Purchase |
Total | |||
| Kosciusko Branch |
$ | 295,837 | ||
| Scooba Branch |
220,000 | |||
| Three D Mortgage Company |
66,220 | |||
| CB&T Capital Corporation |
2,567,600 | |||
|
|
|
|||
| Total goodwill |
$ | 3,149,657 | ||
|
|
|
|||
18
CITIZENS HOLDING COMPANY
Years Ended December 31, 2014, 2013 and 2012
NOTES TO CONSOLIDATED FINANCIAL STATEMENTS
Note 3. Investment Securities
The amortized cost and estimated fair value of securities available-for-sale and the corresponding amounts of gross unrealized gains and losses recognized in accumulated other comprehensive income at December 31, 2014 and 2013 were as follows:
| 2014 |
Amortized Cost |
Gross Unrealized Gains |
Gross Unrealized Losses |
Fair Value | ||||||||||||
| Securities available-for-sale Obligations of U.S. Government agencies |
$ | 77,996,980 | $ | — | $ | 2,035,905 | $ | 75,961,075 | ||||||||
| Mortgage-backed securities |
12,501,990 | 824,844 | — | 13,326,834 | ||||||||||||
| State, County, Municipals |
84,896,091 | 3,048,489 | 360,082 | 87,584,498 | ||||||||||||
| Other investments |
2,997,401 | — | 124,678 | 2,872,723 | ||||||||||||
|
|
|
|
|
|
|
|
|
|||||||||
| Total |
$ | 178,392,462 | $ | 3,873,333 | $ | 2,520,665 | $ | 179,745,130 | ||||||||
|
|
|
|
|
|
|
|
|
|||||||||
| 2013 |
Amortized Cost |
Gross Unrealized Gains |
Gross Unrealized Losses |
Fair Value | ||||||||||||
| Securities available-for-sale Obligations of U.S. Government agencies |
$ | 316,305,125 | $ | 98,740 | $ | 33,587,465 | $ | 282,816,400 | ||||||||
| Mortgage-backed securities |
16,476,430 | 719,825 | 29,861 | 17,166,394 | ||||||||||||
| State, County, Municipals |
96,258,584 | 2,309,291 | 3,140,470 | 95,427,405 | ||||||||||||
| Other investments |
3,025,451 | — | 259,248 | 2,766,203 | ||||||||||||
|
|
|
|
|
|
|
|
|
|||||||||
| Total |
$ | 432,065,590 | $ | 3,127,856 | $ | 37,017,044 | $ | 398,176,402 | ||||||||
|
|
|
|
|
|
|
|
|
|||||||||
During the second quarter of 2014, the Corporation transferred securities with an amortized cost of $222,322,423 from the AFS classification to HTM. This transfer was completed after consideration of the Corporation’s ability and intent to hold these securities to maturity.
19
CITIZENS HOLDING COMPANY
Years Ended December 31, 2014, 2013 and 2012
NOTES TO CONSOLIDATED FINANCIAL STATEMENTS
Note 3. Continued
The fair value of the securities transferred as of the date of transfer was $205,260,985 with a net unrealized loss of $17,061,438. In accordance with ASC 320-10-35-16, the discount on each security that resulted from this transfer is amortized over the remaining lives of the individual securities. Any unrealized holding losses on the date of the transfer are not recognized in net income but remain in accumulated other comprehensive loss. In accordance with ASC 320-10-15-10d, the unrealized loss amounts in accumulated other comprehensive loss are amortized simultaneously against interest income as the discount is accreted on the transferred securities. There is no effect on net income as the discount accretion offsets the accumulated other comprehensive loss amortization.
The amortized cost and estimated fair value of HTM securities and the corresponding amounts of gross unrecognized gains and losses were as follows:
| 2014 |
Amortized Cost |
Gross Unrealized Gains |
Gross Unrealized Losses |
Fair Value | ||||||||||||
| Securities held-to-maturity Obligations of U.S. Government agencies |
$ | 206,817,169 | $ | 9,928,269 | $ | — | $ | 216,745,438 | ||||||||
|
|
|
|
|
|
|
|
|
|||||||||
| Total |
$ | 206,817,169 | $ | 9,928,269 | $ | — | $ | 216,745,438 | ||||||||
|
|
|
|
|
|
|
|
|
|||||||||
As of December 31, 2013, the Corporation had not classified any securities as HTM.
20
CITIZENS HOLDING COMPANY
Years Ended December 31, 2014, 2013 and 2012
NOTES TO CONSOLIDATED FINANCIAL STATEMENTS
Note 3. Continued
The following tables show the gross unrealized losses and fair value of the Company’s investments classified as AFS and HTM investments with unrealized losses that are not deemed to be other-than-temporarily impaired, aggregated by investment category and length of time that individual securities have been in a continuous unrealized loss position, at December 31, 2014 and 2013.
A summary of unrealized loss information for AFS securities, categorized by security type follows (in thousands):
| December 31, 2014 | Less than 12 months | 12 months or more | Total | |||||||||||||||||||||
| Description of Securities |
Fair Value |
Unrealized Losses |
Fair Value |
Unrealized Losses |
Fair Value |
Unrealized Losses |
||||||||||||||||||
| Obligations of U.S. |
||||||||||||||||||||||||
| Government agencies |
$ | — | $ | — | $ | 75,961 | $ | 2,036 | $ | 75,961 | $ | 2,036 | ||||||||||||
| Mortgage backed securities |
— | — | — | — | — | — | ||||||||||||||||||
| State, County, Municipal |
697 | 3 | 14,980 | 357 | 15,677 | 360 | ||||||||||||||||||
| Other investments |
— | — | 2,873 | 125 | 2,873 | 125 | ||||||||||||||||||
|
|
|
|
|
|
|
|
|
|
|
|
|
|||||||||||||
| Total |
$ | 697 | $ | 3 | $ | 93,814 | $ | 2,518 | $ | 94,511 | $ | 2,521 | ||||||||||||
|
|
|
|
|
|
|
|
|
|
|
|
|
|||||||||||||
| December 31, 2013 | Less than 12 months | 12 months or more | Total | |||||||||||||||||||||
| Description of Securities |
Fair Value |
Unrealized Losses |
Fair Value |
Unrealized Losses |
Fair Value |
Unrealized Losses |
||||||||||||||||||
| Obligations of U.S. |
||||||||||||||||||||||||
| Government agencies |
$ | 255,350 | $ | 29,954 | $ | 26,367 | $ | 3,633 | $ | 281,717 | $ | 33,587 | ||||||||||||
| Mortgage backed securities |
3,581 | 30 | — | — | 3,581 | 30 | ||||||||||||||||||
| State, County, Municipal |
20,131 | 1,461 | 10,014 | 1,680 | 30,145 | 3,141 | ||||||||||||||||||
| Other investments |
— | — | 2,766 | 259 | 2,766 | 259 | ||||||||||||||||||
|
|
|
|
|
|
|
|
|
|
|
|
|
|||||||||||||
| Total |
$ | 279,062 | $ | 31,445 | $ | 39,147 | $ | 5,572 | $ | 318,209 | $ | 37,017 | ||||||||||||
|
|
|
|
|
|
|
|
|
|
|
|
|
|||||||||||||
21
CITIZENS HOLDING COMPANY
Years Ended December 31, 2014, 2013 and 2012
NOTES TO CONSOLIDATED FINANCIAL STATEMENTS
Note 3. Continued
Investment Securities.
The Company’s unrealized losses on its Obligations of United States Government agencies, Mortgage backed securities and State, County and Municipal bonds are the result of an upward trend in interest rates, mainly in the mid-term sector. None of the unrealized losses disclosed in the previous table are related to credit deterioration. The Company has determined that none of the securities in this classification are other-than-temporarily impaired at December 31, 2014 or 2013.
Other investments.
The Company’s unrealized loss on other investments relates to an investment in a pooled trust preferred security. The decline in value of the pooled trust preferred security is related to the deterioration of the markets for these types of securities brought about by the lowered credit ratings and past deferrals and defaults of the underlying issuing financial institutions. However, due to the reductions in defaults and deferrals during the year, the unrealized losses have improved from $259,248 in 2013 to $124,678 in 2014. The Company owns a senior tranche of this security and therefore has a higher degree of which future deferrals and defaults would be required before the cash flow for the Company’s tranche is negatively impacted. The Company does not intend to sell this security and it is not more likely than not that the Company will be required to sell at a price less than amortized cost prior to maturity. Given these factors, the Company does not consider the investment to be other-than-temporarily impaired at December 31, 2014 or 2013. This security is not subject to any of the restrictions put forth under the Volcker Rule that was brought about by the passage of the Dodd-Frank Act.
22
CITIZENS HOLDING COMPANY
Years Ended December 31, 2014, 2013 and 2012
NOTES TO CONSOLIDATED FINANCIAL STATEMENTS
Note 3. Continued
The amortized cost and estimated fair value of securities at December 31, 2014, by contractual maturity, are shown below. Expected maturities will differ from contractual maturities because borrowers may have the right to call or prepay obligations with or without call or prepayment penalties.
| AFS |
Amortized Cost |
Fair Value | ||||||
| Securities AFS |
||||||||
| Due in one year or less |
$ | 3,619,965 | $ | 3,644,097 | ||||
| Due after one year through five years |
11,886,005 | 12,165,884 | ||||||
| Due after five years through ten years |
73,014,502 | 72,750,584 | ||||||
| Due after ten years |
89,871,990 | 91,184,565 | ||||||
|
|
|
|
|
|||||
| Total |
$ | 178,392,462 | $ | 179,745,130 | ||||
|
|
|
|
|
|||||
| HTM |
Amortized Cost |
Fair Value | ||||||
| Securities HTM |
||||||||
| Due after five years through ten years |
$ | 27,599,235 | $ | 28,395,635 | ||||
| Due after ten years |
179,217,934 | 188,349,803 | ||||||
|
|
|
|
|
|||||
| Total |
$ | 206,817,169 | $ | 216,745,438 | ||||
|
|
|
|
|
|||||
Investment securities with fair values of $156,226,081 and $133,977,764 at December 31, 2014 and 2013, respectively, were pledged as collateral for public deposits.
Gross realized gains and losses are included in net gains on sales of securities. Total gross realized gains and gross realized losses from the sale of investment securities for each of the years ended December 31 were:
| 2014 | 2013 | 2012 | ||||||||||
| Gross realized gains |
$ | 206,258 | $ | 1,039,793 | $ | 459,934 | ||||||
| Gross realized losses |
191,716 | 616,405 | — | |||||||||
|
|
|
|
|
|
|
|||||||
| $ | 14,542 | $ | 423,388 | $ | 459,934 | |||||||
|
|
|
|
|
|
|
|||||||
23
CITIZENS HOLDING COMPANY
Years Ended December 31, 2014, 2013 and 2012
NOTES TO CONSOLIDATED FINANCIAL STATEMENTS
Note 4. Federal Home Loan Bank Stock
The Company, as a member of the Federal Home Loan Bank of Dallas (“FHLB”) system, owns stock in the organization. No ready market exists for the stock, and it has no quoted market value. The Company’s investment in the FHLB is carried at cost of $1,347,600 and $2,633,300 at December 31, 2014 and 2013, respectively, and is included in other assets. The Company has purchased stock and had stock redeemed in 2014 and 2013 at the par value of $100 per share.
While the Federal Home Loan Banks have been negatively impacted by the current economic conditions, the Federal Home Loan Bank of Dallas reported profits for 2014 and 2013, as of 2014 and 2013, was in compliance with its regulatory capital and liquidity requirements, and in 2014 and 2013, continued to pay dividends on its stock and make redemptions at the par value. With consideration given to these factors, management concluded that the stock was not impaired at December 31, 2014 or 2013.
24
CITIZENS HOLDING COMPANY
Years Ended December 31, 2014, 2013 and 2012
NOTES TO CONSOLIDATED FINANCIAL STATEMENTS
Note 5. Loans
The composition of loans, net at December 31, 2014 and 2013 is as follows:
| 2014 | 2013 | |||||||
| (In Thousands) | ||||||||
| Real Estate: |
||||||||
| Land Development and Construction |
$ | 43,233 | $ | 27,224 | ||||
| Farmland |
26,463 | 29,634 | ||||||
| 1-4 Family Mortgages |
104,170 | 105,489 | ||||||
| Commercial Real Estate |
151,746 | 145,369 | ||||||
|
|
|
|
|
|||||
| Total Real Estate Loans |
325,612 | 307,716 | ||||||
|
|
|
|
|
|||||
| Business Loans: |
||||||||
| Commercial and Industrial Loans |
38,333 | 55,813 | ||||||
| Farm Production and other Farm Loans |
1,035 | 1,308 | ||||||
|
|
|
|
|
|||||
| Total Business Loans |
39,368 | 57,121 | ||||||
|
|
|
|
|
|||||
| Consumer Loans: |
||||||||
| Credit Cards |
1,075 | 1,087 | ||||||
| Other Consumer Loans |
25,440 | 26,744 | ||||||
|
|
|
|
|
|||||
| Total Consumer Loans |
26,515 | 27,831 | ||||||
|
|
|
|
|
|||||
| Total Gross Loans |
391,495 | 392,668 | ||||||
|
|
|
|
|
|||||
| Unearned income |
(535 | ) | (485 | ) | ||||
| Allowance for loan losses |
(6,542 | ) | (8,078 | ) | ||||
|
|
|
|
|
|||||
| Loans, net |
$ | 384,418 | $ | 384,105 | ||||
|
|
|
|
|
|||||
The Company has certain lending policies and procedures in place that are designed to maximize loan income within an acceptable level of risk. Management reviews these policies and procedures and submits them to the Company’s Board of Directors for its approval when needed, but no less frequently than annually. A reporting system supplements the review process by providing management with frequent reports related to loan production, loan quality, concentrations of credit, loan delinquencies and non-performing and potential problem loans. Diversification in the loan portfolio is a means of managing risk associated with fluctuations in economic conditions.
The Company maintains an independent loan review department that reviews and validates the credit risk program on a periodic basis. Results of this review are presented to management with quarterly reports made to the board of directors. The loan review process complements and reinforces the risk identification and assessment decisions made by the lenders and credit personnel, as well as the Company’s policies and procedures.
25
CITIZENS HOLDING COMPANY
Years Ended December 31, 2014, 2013 and 2012
NOTES TO CONSOLIDATED FINANCIAL STATEMENTS
Note 5. Continued
Loans are made principally to customers in the Company’s market. The Company’s lending policy provides that loans collateralized by real estate are normally made with loan-to-value (“LTV”) ratios of 80 percent or less. Commercial loans are typically collateralized by property, equipment, inventories or receivables with LTV ratios from 50 percent to 80 percent. Real estate mortgage loans are collateralized by personal residences with LTV ratios of 80 percent or less. Consumer loans are typically collateralized by real estate, vehicles and other consumer durable goods. Approximately $34.3 million and $54.8 million of the loans outstanding at December 31, 2014 and 2013, respectively, were variable rate loans.
In the ordinary course of business, the Company has granted loans to certain directors and their affiliates (collectively referred to as “related parties”). These loans were made on substantially the same terms, including interest rates and collateral, as those prevailing at the time for comparable transactions with other unaffiliated persons and do not involve more than normal risk of collectability. Activity in related party loans during 2014 is presented in the following table.
| Balance outstanding at December 31, 2013 |
$ | 1,326,327 | ||
| Principal additions |
3,770,089 | |||
| Principal reductions |
(957,059 | ) | ||
|
|
|
|||
| Balance outstanding at December 31, 2014 |
$ | 4,139,357 | ||
|
|
|
|||
Loans are considered to be past due if the required principal and interest payments have not been received as of the date such payments were due. Loans are placed on non-accrual status, when, in management’s opinion, the borrower may be unable to meet payment obligations as they become due, as well as when required by regulatory provisions. Loans may be placed on non-accrual status regardless of whether such loans are considered past due. When interest accruals are discontinued, all unpaid accrued interest is reversed. Interest income is subsequently recognized only to the extent cash payments are received in excess of principal due. Loans are returned to accrual status when all the principal and interest amounts contractually due are brought current and future payments are reasonably assured.
26
CITIZENS HOLDING COMPANY
Years Ended December 31, 2014, 2013 and 2012
NOTES TO CONSOLIDATED FINANCIAL STATEMENTS
Note 5. Continued
Year-end non-accrual loans, segregated by class of loans, were as follows:
| 2014 | 2013 | |||||||
| (in thousands) | ||||||||
| Real Estate: |
||||||||
| Land Development and Construction |
$ | 92 | $ | 136 | ||||
| Farmland |
222 | 352 | ||||||
| 1-4 Family Mortgages |
1,905 | 1,866 | ||||||
| Commercial Real Estate |
9,444 | 8,894 | ||||||
|
|
|
|
|
|||||
| Total Real Estate Loans |
11,663 | 11,248 | ||||||
|
|
|
|
|
|||||
| Business Loans: |
||||||||
| Commercial and Industrial Loans |
70 | 2,224 | ||||||
| Farm Production and other Farm Loans |
— | — | ||||||
|
|
|
|
|
|||||
| Total Business Loans |
70 | 2,224 | ||||||
|
|
|
|
|
|||||
| Consumer Loans: |
||||||||
| Credit Cards |
— | — | ||||||
| Other Consumer Loans |
133 | 120 | ||||||
|
|
|
|
|
|||||
| Total Consumer Loans |
133 | 120 | ||||||
|
|
|
|
|
|||||
| Total Non-Accrual Loans |
$ | 11,854 | $ | 13,592 | ||||
|
|
|
|
|
|||||
In the event that non-accrual loans had performed in accordance with their original terms, the Company would have recognized additional interest income of approximately $819,524, $813,710 and $770,509 in 2014, 2013 and 2012, respectively.
27
CITIZENS HOLDING COMPANY
Years Ended December 31, 2014, 2013 and 2012
NOTES TO CONSOLIDATED FINANCIAL STATEMENTS
Note 5. Continued
An age analysis of past due loans, segregated by class of loans, as of December 31, 2014 was as follows (in thousands):
| Loans 30-89 Days Past Due |
Loans 90 or more Days Past Due |
Total Past Due Loans |
Current Loans |
Total Loans |
Accruing Loans 90 or more Days Past Due |
|||||||||||||||||||
| Real Estate: |
||||||||||||||||||||||||
| Land Development and Construction |
$ | 578 | $ | — | $ | 578 | $ | 42,655 | $ | 43,233 | $ | — | ||||||||||||
| Farmland |
889 | 17 | 906 | 25,557 | 26,463 | — | ||||||||||||||||||
| 1-4 Family Mortgages |
4,606 | 837 | 5,443 | 98,727 | 104,170 | 131 | ||||||||||||||||||
| Commercial Real Estate |
2,211 | 4,471 | 6,682 | 145,064 | 151,746 | 724 | ||||||||||||||||||
|
|
|
|
|
|
|
|
|
|
|
|
|
|||||||||||||
| Total Real Estate Loans |
8,284 | 5,325 | 13,609 | 312,003 | 325,612 | 855 | ||||||||||||||||||
|
|
|
|
|
|
|
|
|
|
|
|
|
|||||||||||||
| Business Loans: |
||||||||||||||||||||||||
| Commercial and Industrial Loans |
115 | 3 | 118 | 38,215 | 38,333 | 3 | ||||||||||||||||||
| Farm Production and other Farm Loans |
22 | — | 22 | 1,013 | 1,035 | — | ||||||||||||||||||
|
|
|
|
|
|
|
|
|
|
|
|
|
|||||||||||||
| Total Business Loans |
137 | 3 | 140 | 39,228 | 39,368 | 3 | ||||||||||||||||||
|
|
|
|
|
|
|
|
|
|
|
|
|
|||||||||||||
| Consumer Loans: |
||||||||||||||||||||||||
| Credit Cards |
27 | 6 | 33 | 1,042 | 1,075 | 6 | ||||||||||||||||||
| Other Consumer Loans |
1,179 | 53 | 1,232 | 24,208 | 25,440 | 16 | ||||||||||||||||||
|
|
|
|
|
|
|
|
|
|
|
|
|
|||||||||||||
| Total Consumer Loans |
1,206 | 59 | 1,265 | 25,250 | 26,515 | 22 | ||||||||||||||||||
|
|
|
|
|
|
|
|
|
|
|
|
|
|||||||||||||
| Total Loans |
$ | 9,627 | $ | 5,387 | $ | 15,014 | $ | 376,481 | $ | 391,495 | $ | 880 | ||||||||||||
|
|
|
|
|
|
|
|
|
|
|
|
|
|||||||||||||
28
CITIZENS HOLDING COMPANY
Years Ended December 31, 2014, 2013 and 2012
NOTES TO CONSOLIDATED FINANCIAL STATEMENTS
Note 5. Continued
An age analysis of past due loans, segregated by class of loans, as of December 31, 2013 was as follows (in thousands):
| Loans 30-89 Days Past Due |
Loans 90 or more Days Past Due |
Total Past Due Loans |
Current Loans |
Total Loans |
Accruing Loans 90 or more Days Past Due |
|||||||||||||||||||
| Real Estate: |
||||||||||||||||||||||||
| Land Development and Construction |
$ | 170 | $ | — | $ | 170 | $ | 27,054 | $ | 27,224 | $ | — | ||||||||||||
| Farmland |
419 | 69 | 488 | 29,146 | 29,634 | — | ||||||||||||||||||
| 1-4 Family Mortgages |
4,234 | 1,088 | 5,322 | 100,167 | 105,489 | 335 | ||||||||||||||||||
| Commercial Real Estate |
3,308 | 9,316 | 12,624 | 132,745 | 145,369 | 1,750 | ||||||||||||||||||
|
|
|
|
|
|
|
|
|
|
|
|
|
|||||||||||||
| Total Real Estate Loans |
8,131 | 10,473 | 18,604 | 289,112 | 307,716 | 2,085 | ||||||||||||||||||
|
|
|
|
|
|
|
|
|
|
|
|
|
|||||||||||||
| Business Loans: |
||||||||||||||||||||||||
| Commercial and Industrial Loans |
248 | 23 | 271 | 55,542 | 55,813 | — | ||||||||||||||||||
| Farm Production and other Farm Loans |
5 | — | 5 | 1,303 | 1,308 | — | ||||||||||||||||||
|
|
|
|
|
|
|
|
|
|
|
|
|
|||||||||||||
| Total Business Loans |
253 | 23 | 276 | 56,845 | 57,121 | — | ||||||||||||||||||
|
|
|
|
|
|
|
|
|
|
|
|
|
|||||||||||||
| Consumer Loans: |
||||||||||||||||||||||||
| Credit Cards |
39 | 10 | 49 | 1,038 | 1,087 | 10 | ||||||||||||||||||
| Other Consumer Loans |
1,105 | 41 | 1,146 | 25,598 | 26,744 | — | ||||||||||||||||||
|
|
|
|
|
|
|
|
|
|
|
|
|
|||||||||||||
| Total Consumer Loans |
1,144 | 51 | 1,195 | 26,636 | 27,831 | 10 | ||||||||||||||||||
|
|
|
|
|
|
|
|
|
|
|
|
|
|||||||||||||
| Total Loans |
$ | 9,528 | $ | 10,547 | $ | 20,075 | $ | 372,593 | $ | 392,668 | $ | 2,095 | ||||||||||||
|
|
|
|
|
|
|
|
|
|
|
|
|
|||||||||||||
29
CITIZENS HOLDING COMPANY
Years Ended December 31, 2014, 2013 and 2012
NOTES TO CONSOLIDATED FINANCIAL STATEMENTS
Note 5. Continued
Loans are considered impaired when, based on current information and events, it is probable the Company will be unable to collect all the amounts due in accordance with the original contractual terms of the loan agreement, including scheduled principal and interest payments. In determining which loans to evaluate for impairment, management looks at past due loans, bankruptcy filings and any situation that might lend itself to cause a borrower to be unable to repay the loan according to the original contract terms. If a loan is determined to be impaired and the collateral is deemed to be insufficient to fully repay the loan, a specific reserve will be established. Interest payments on impaired loans are typically applied to principal unless collectability of the principal amount is reasonably assured, in which case interest is recognized on a cash basis. Impaired loans or portions thereof, are charged-off when deemed uncollectible.
Impaired loans as of December 31, by class of loans, are as follows (in thousands):
| 2014 |
Unpaid Principal Balance |
Recorded Investment With No Allowance |
Recorded Investment With Allowance |
Total Recorded Investment |
Related Allowance |
Average Recorded Investment |
||||||||||||||||||
| Real Estate: |
||||||||||||||||||||||||
| Land Development and Construction |
$ | 92 | $ | — | $ | 92 | $ | 92 | $ | 92 | $ | 114 | ||||||||||||
| Farmland |
798 | 104 | 694 | 798 | 108 | 575 | ||||||||||||||||||
| 1-4 Family Mortgages |
2,554 | 1,685 | 869 | 2,554 | 143 | 2,210 | ||||||||||||||||||
| Commercial Real Estate |
9,444 | 895 | 8,549 | 9,444 | 1,642 | 9,169 | ||||||||||||||||||
|
|
|
|
|
|
|
|
|
|
|
|
|
|||||||||||||
| Total Real Estate Loans |
12,888 | 2,684 | 10,204 | 12,888 | 1,985 | 12,068 | ||||||||||||||||||
|
|
|
|
|
|
|
|
|
|
|
|
|
|||||||||||||
| Business Loans: |
||||||||||||||||||||||||
| Commercial and Industrial Loans |
70 | 30 | 40 | 70 | 40 | 1,147 | ||||||||||||||||||
| Farm Production and other Farm Loans |
— | — | — | — | — | — | ||||||||||||||||||
|
|
|
|
|
|
|
|
|
|
|
|
|
|||||||||||||
| Total Business Loans |
70 | 30 | 40 | 70 | 40 | 1,147 | ||||||||||||||||||
|
|
|
|
|
|
|
|
|
|
|
|
|
|||||||||||||
| Consumer Loans: |
||||||||||||||||||||||||
| Other Consumer Loans |
121 | 121 | — | 121 | — | 120 | ||||||||||||||||||
|
|
|
|
|
|
|
|
|
|
|
|
|
|||||||||||||
| Total Consumer Loans |
121 | 121 | — | 121 | — | 120 | ||||||||||||||||||
|
|
|
|
|
|
|
|
|
|
|
|
|
|||||||||||||
| Total Loans |
$ | 13,079 | $ | 2,835 | $ | 10,244 | $ | 13,079 | $ | 2,025 | $ | 13,335 | ||||||||||||
|
|
|
|
|
|
|
|
|
|
|
|
|
|||||||||||||
30
CITIZENS HOLDING COMPANY
Years Ended December 31, 2014, 2013 and 2012
NOTES TO CONSOLIDATED FINANCIAL STATEMENTS
Note 5. Continued
| 2013 |
Unpaid Principal Balance |
Recorded Investment With No Allowance |
Recorded Investment With Allowance |
Total Recorded Investment |
Related Allowance |
Average Recorded Investment |
||||||||||||||||||
| Real Estate: |
||||||||||||||||||||||||
| Land Development and Construction |
$ | 136 | $ | 25 | $ | 111 | $ | 136 | $ | 103 | $ | 278 | ||||||||||||
| Farmland |
352 | 220 | 132 | 352 | 24 | 720 | ||||||||||||||||||
| 1-4 Family Mortgages |
1,866 | 1,054 | 812 | 1,866 | 202 | 2,111 | ||||||||||||||||||
| Commercial Real Estate |
8,894 | 976 | 7,918 | 8,894 | 896 | 9,535 | ||||||||||||||||||
|
|
|
|
|
|
|
|
|
|
|
|
|
|||||||||||||
| Total Real Estate Loans |
11,248 | 2,275 | 8,973 | 11,248 | 1,225 | 12,644 | ||||||||||||||||||
|
|
|
|
|
|
|
|
|
|
|
|
|
|||||||||||||
| Business Loans: |
||||||||||||||||||||||||
| Commercial and Industrial Loans |
2,224 | 118 | 2,106 | 2,224 | 1,072 | 1,195 | ||||||||||||||||||
| Farm Production and other Farm Loans |
— | — | — | — | — | 2 | ||||||||||||||||||
|
|
|
|
|
|
|
|
|
|
|
|
|
|||||||||||||
| Total Business Loans |
2,224 | 118 | 2,106 | 2,224 | 1,072 | 1,197 | ||||||||||||||||||
|
|
|
|
|
|
|
|
|
|
|
|
|
|||||||||||||
| Consumer Loans: |
||||||||||||||||||||||||
| Other Consumer Loans |
120 | 120 | — | 120 | — | 166 | ||||||||||||||||||
|
|
|
|
|
|
|
|
|
|
|
|
|
|||||||||||||
| Total Consumer Loans |
120 | 120 | — | 120 | — | 166 | ||||||||||||||||||
|
|
|
|
|
|
|
|
|
|
|
|
|
|||||||||||||
| Total Loans |
$ | 13,592 | $ | 2,513 | $ | 11,079 | $ | 13,592 | $ | 2,297 | $ | 14,007 | ||||||||||||
|
|
|
|
|
|
|
|
|
|
|
|
|
|||||||||||||
31
CITIZENS HOLDING COMPANY
Years Ended December 31, 2014, 2013 and 2012
NOTES TO CONSOLIDATED FINANCIAL STATEMENTS
Note 5. Continued
The following table presents troubled debt restructurings segregated by class (in thousands, except number of loans):
| December 31, 2014 | Number of Loans |
Pre-Modification Outstanding Recorded Investment |
Post-Modification Outstanding Recorded Investment |
|||||||||
| Commercial real estate |
4 | $ | 6,850 | $ | 4,741 | |||||||
|
|
|
|
|
|
|
|||||||
| Total |
4 | $ | 6,850 | $ | 4,741 | |||||||
|
|
|
|
|
|
|
|||||||
| December 31, 2013 | Number of Loans |
Pre-Modification Outstanding Recorded Investment |
Post-Modification Outstanding Recorded Investment |
|||||||||
| Commercial real estate |
5 | $ | 9,261 | $ | 7,119 | |||||||
|
|
|
|
|
|
|
|||||||
| Total |
5 | $ | 9,261 | $ | 7,119 | |||||||
|
|
|
|
|
|
|
|||||||
Changes in the Company’s troubled debt restructurings are set forth in the table below:
| Number of Loans |
Recorded Investment |
|||||||
| Totals at January 1, 2014 |
5 | $ | 7,119 | |||||
| Additional loans with concessions |
||||||||
| Reductions due to: |
||||||||
| Charge-off |
1 | (2,028 | ) | |||||
| Principal paydowns |
(350 | ) | ||||||
|
|
|
|
|
|||||
| Total at December 31, 2014 |
4 | $ | 4,741 | |||||
|
|
|
|
|
|||||
The allocated allowance for loan losses attributable to restructured loans was $174,274 and $1,196,274 at December 31, 2014 and 2013, respectively.
The Company had no remaining availability under commitments to lend additional funds on these troubled debt restructurings at December 31, 2014.
32
CITIZENS HOLDING COMPANY
Years Ended December 31, 2014, 2013 and 2012
NOTES TO CONSOLIDATED FINANCIAL STATEMENTS
Note 5. Continued
The Corporation utilizes a risk grading matrix to assign a risk grade to each of its loans when originated and is updated as factors related to the strength of the loan changes. Loans are graded on a scale of 1 to 9. A description of the general characteristics of the 9 risk grades is as follows.
Grade 1. MINIMAL RISK - These loans are without loss exposure to the Corporation. This classification is reserved for only the best, well secured loans to borrowers with significant capital strength, low leverage, stable earnings and growth and other readily available financing alternatives. This type of loan would also include loans secured by a program of the government.
Grade 2. MODEST RISK - These loans include borrowers with solid credit quality and moderate risk of loss. These loans may be fully secured by certificates of deposit with another reputable financial institution, or secured by readily marketable securities with acceptable margins.
Grade 3. AVERAGE RISK - This is the rating assigned to most of the loans held by the Corporation. This includes loans with average loss exposure and average overall quality. These loans should liquidate through possessing adequate collateral and adequate earnings of the borrower. In addition, these loans are properly documented and are in accordance with all aspects of the current loan policy.
Grade 4. ACCEPTABLE RISK - Borrower generates sufficient cash flow to fund debt service but most working asset and capital expansion needs are provided from external sources. Profitability and key balance sheet ratios are usually close to peers but one or more may be higher than peers.
Grade 5. MANAGEMENT ATTENTION - Borrower has significant weaknesses resulting from performance trends or management concerns. The financial condition of the borrower has taken a negative turn and may be temporarily strained. Cash flow is weak but cash reserves remain adequate to meet debt service. Management weakness is evident.
Grade 6. OTHER LOANS ESPECIALLY MENTIONED (OLEM) - Loans in this category are fundamentally sound but possess some weaknesses. OLEM loans have potential weaknesses, which may, if not checked or corrected, weaken the asset or inadequately protect the Bank’s credit position at some future date. These loans have an identifiable weakness in credit, collateral, or repayment ability but there is no expectation of loss.
Grade 7. SUBSTANDARD ASSETS - Assets classified as substandard are inadequately protected by the current net worth and paying capacity of the obligor or of the collateral pledged, if any. Assets classified as substandard must have a well-defined weakness based upon objective evidence. Assets classified as substandard are characterized by the distinct possibility that the
33
CITIZENS HOLDING COMPANY
Years Ended December 31, 2014, 2013 and 2012
NOTES TO CONSOLIDATED FINANCIAL STATEMENTS
Note 5. Continued
insured institution will sustain some loss if the deficiencies are not corrected. The possibility that liquidation would not be timely requires a substandard classification even if there is little likelihood of total loss.
Grade 8. DOUBTFUL - A loan classified as doubtful has all the weaknesses of a substandard classification and the added characteristic that the weakness makes collection or liquidation in full, on the basis of currently existing facts, conditions, and values, highly questionable or improbable. The possibility of loss is extremely high, but because of certain important and reasonable specific pending factors that may work to the advantage and strengthening of the asset, its classification as an estimated loss is deferred until its more exact status may be determined. A doubtful classification could reflect the fact that the primary source of repayment is gone and serious doubt exists as to the quality of a secondary source of repayment.
Grade 9. LOSS - Loans classified loss are considered uncollectible and of such little value that their continuance as bankable assets is not warranted. This classification does not mean that the asset has absolutely no recovery or salvage value, but rather it is not practical or desirable to defer writing off this basically worthless asset even though partial recovery may occur in the future. Also included in this classification is the defined loss portion of loans rated substandard assets and doubtful assets.
These internally assigned grades are updated on a continual basis throughout the course of the year and represent management’s most updated judgment regarding grades at December 31, 2014.
34
CITIZENS HOLDING COMPANY
Years Ended December 31, 2014, 2013 and 2012
NOTES TO CONSOLIDATED FINANCIAL STATEMENTS
Note 5. Continued
The following table details the amount of gross loans by loan grade and class for the year ended December 31, 2014 (in thousands):
| Grades | Satisfactory 1, 2, 3,4 |
Special Mention 5,6 |
Substandard 7 |
Doubtful 8 |
Loss 9 |
Total Loans |
||||||||||||||||||
| Real Estate: |
||||||||||||||||||||||||
| Land Development and Construction |
$ | 41,431 | $ | 424 | $ | 1,378 | $ | — | $ | — | $ | 43,233 | ||||||||||||
| Farmland |
23,993 | 708 | 1,762 | — | — | 26,463 | ||||||||||||||||||
| 1-4 Family Mortgages |
86,969 | 5,351 | 11,850 | — | — | 104,170 | ||||||||||||||||||
| Commercial Real Estate |
126,881 | 13,558 | 11,307 | — | — | 151,746 | ||||||||||||||||||
|
|
|
|
|
|
|
|
|
|
|
|
|
|||||||||||||
| Total Real Estate Loans |
279,274 | 20,041 | 26,297 | — | — | 325,612 | ||||||||||||||||||
|
|
|
|
|
|
|
|
|
|
|
|
|
|||||||||||||
| Business Loans: |
||||||||||||||||||||||||
| Commercial and Industrial Loans |
37,890 | 232 | 211 | — | — | 38,333 | ||||||||||||||||||
| Farm Production and other Farm Loans |
1,035 | — | — | — | — | 1,035 | ||||||||||||||||||
|
|
|
|
|
|
|
|
|
|
|
|
|
|||||||||||||
| Total Business Loans |
38,925 | 232 | 211 | — | — | 39,368 | ||||||||||||||||||
|
|
|
|
|
|
|
|
|
|
|
|
|
|||||||||||||
| Consumer Loans: |
||||||||||||||||||||||||
| Credit Cards |
1,069 | — | 6 | — | — | 1,075 | ||||||||||||||||||
| Other Consumer Loans |
24,889 | 177 | 358 | 16 | — | 25,440 | ||||||||||||||||||
|
|
|
|
|
|
|
|
|
|
|
|
|
|||||||||||||
| Total Consumer Loans |
25,958 | 177 | 364 | 16 | — | 26,515 | ||||||||||||||||||
|
|
|
|
|
|
|
|
|
|
|
|
|
|||||||||||||
| Total Loans |
$ | 344,157 | $ | 20,450 | $ | 26,872 | $ | 16 | $ | — | $ | 391,495 | ||||||||||||
|
|
|
|
|
|
|
|
|
|
|
|
|
|||||||||||||
35
CITIZENS HOLDING COMPANY
Years Ended December 31, 2014, 2013 and 2012
NOTES TO CONSOLIDATED FINANCIAL STATEMENTS
Note 5. Continued
The following table details the amount of gross loans by loan grade and class for the year ended December 31, 2013:
| Grades | Satisfactory 1, 2, 3,4 |
Special Mention 5,6 |
Substandard 7 |
Doubtful 8 |
Loss 9 |
Total Loans |
||||||||||||||||||
| Real Estate: |
||||||||||||||||||||||||
| Land Development and Construction |
$ | 25,165 | $ | 192 | $ | 1,867 | $ | — | $ | — | $ | 27,224 | ||||||||||||
| Farmland |
25,160 | 744 | 3,730 | — | — | 29,634 | ||||||||||||||||||
| 1-4 Family Mortgages |
87,108 | 4,671 | 13,710 | — | — | 105,489 | ||||||||||||||||||
| Commercial Real Estate |
125,339 | 5,915 | 14,115 | — | — | 145,369 | ||||||||||||||||||
|
|
|
|
|
|
|
|
|
|
|
|
|
|||||||||||||
| Total Real Estate Loans |
262,772 | 11,522 | 33,422 | — | — | 307,716 | ||||||||||||||||||
|
|
|
|
|
|
|
|
|
|
|
|
|
|||||||||||||
| Business Loans: |
||||||||||||||||||||||||
| Commercial and Industrial Loans |
52,871 | 426 | 416 | 2,100 | — | 55,813 | ||||||||||||||||||
| Farm Production and other Farm Loans |
1,298 | 8 | 2 | — | — | 1,308 | ||||||||||||||||||
|
|
|
|
|
|
|
|
|
|
|
|
|
|||||||||||||
| Total Business Loans |
54,169 | 434 | 418 | 2,100 | — | 57,121 | ||||||||||||||||||
|
|
|
|
|
|
|
|
|
|
|
|
|
|||||||||||||
| Consumer Loans: |
||||||||||||||||||||||||
| Credit Cards |
1,077 | — | 10 | — | — | 1,087 | ||||||||||||||||||
| Other Consumer Loans |
25,942 | 193 | 564 | 42 | 3 | 26,744 | ||||||||||||||||||
|
|
|
|
|
|
|
|
|
|
|
|
|
|||||||||||||
| Total Consumer Loans |
27,019 | 193 | 574 | 42 | 3 | 27,831 | ||||||||||||||||||
|
|
|
|
|
|
|
|
|
|
|
|
|
|||||||||||||
| Total Loans |
$ | 343,960 | $ | 12,149 | $ | 34,414 | $ | 2,142 | $ | 3 | $ | 392,668 | ||||||||||||
|
|
|
|
|
|
|
|
|
|
|
|
|
|||||||||||||
The allowance for loan losses is a reserve established through a provision for possible loan losses charged to expense, which represents management’s best estimate of probable losses that will occur within the existing portfolio of loans. The allowance, in the judgment of management, is necessary to reserve for estimated loan losses and risks inherent in the loan portfolio.
The allowance on the majority of the loan portfolio is calculated using a historical chargeoff percentage applied to the current loan balances by loan segment. This historical period is the average of the previous five years with the most current years weighted to show the effect of the most recent chargeoff activity. This percentage is also adjusted for economic factors such as unemployment and general business conditions, both local and nationwide.
The group of loans that are considered to be impaired are individually evaluated for possible loss and a specific reserve is established to cover any loss contingency. Loans that are determined to be a loss with no benefit of remaining in the portfolio are charged off to the allowance. These specific reserves are reviewed periodically for continued impairment and adequacy of the specific reserve and adjusted when necessary.
36
CITIZENS HOLDING COMPANY
Years Ended December 31, 2014, 2013 and 2012
NOTES TO CONSOLIDATED FINANCIAL STATEMENTS
Note 5. Continued
Net chargeoffs (recoveries), segregated by class of loans, were as follows:
| 2014 | 2013 | 2012 | ||||||||||
| Real Estate: |
||||||||||||
| Land Development and Construction |
$ | 241,853 | $ | (15,787 | ) | $ | 87,917 | |||||
| Farmland |
52,731 | 14,915 | (2,386 | ) | ||||||||
| 1-4 Family Mortgages |
22,205 | 152,756 | 220,591 | |||||||||
| Commercial Real Estate |
42,582 | 513,841 | 854,847 | |||||||||
|
|
|
|
|
|
|
|||||||
| Total Real Estate Loans |
359,371 | 665,725 | 1,160,969 | |||||||||
|
|
|
|
|
|
|
|||||||
| Business Loans: |
||||||||||||
| Commercial and Industrial Loans |
2,038,953 | 350,740 | (936 | ) | ||||||||
| Farm Production and other Farm Loans |
— | (1,700 | ) | 3,436 | ||||||||
|
|
|
|
|
|
|
|||||||
| Total Business Loans |
2,038,953 | 349,040 | 2,500 | |||||||||
|
|
|
|
|
|
|
|||||||
| Consumer Loans: |
||||||||||||
| Credit Cards |
11,482 | 17,726 | 9,441 | |||||||||
| Other Consumer Loans |
49,022 | 48,387 | 100,030 | |||||||||
|
|
|
|
|
|
|
|||||||
| Total Consumer Loans |
60,504 | 66,113 | 109,471 | |||||||||
|
|
|
|
|
|
|
|||||||
| Total Net Chargeoffs |
$ | 2,458,828 | $ | 1,080,878 | $ | 1,272,940 | ||||||
|
|
|
|
|
|
|
|||||||
37
CITIZENS HOLDING COMPANY
Years Ended December 31, 2014, 2013 and 2012
NOTES TO CONSOLIDATED FINANCIAL STATEMENTS
Note 5. Continued
The following table details activity in the allowance for loan losses by portfolio segment for the years ended December 31, 2014, 2013 and 2012:
| 2014 | Real Estate |
Business Loans |
Consumer | Total | ||||||||||||
| Beginning Balance |
$ | 4,706,011 | $ | 2,767,409 | $ | 604,337 | $ | 8,077,757 | ||||||||
| Provision for loan losses |
855,511 | 145,359 | (77,473 | ) | 923,397 | |||||||||||
| Chargeoffs |
560,298 | 2,050,939 | 121,093 | 2,732,330 | ||||||||||||
| Recoveries |
200,927 | 11,986 | 60,589 | 273,502 | ||||||||||||
|
|
|
|
|
|
|
|
|
|||||||||
| Net Chargeoffs |
359,371 | 2,038,953 | 60,504 | 2,458,828 | ||||||||||||
|
|
|
|
|
|
|
|
|
|||||||||
| Ending Balance |
$ | 5,202,151 | $ | 873,815 | $ | 466,360 | $ | 6,542,326 | ||||||||
|
|
|
|
|
|
|
|
|
|||||||||
| Period end allowance allocated to: |
||||||||||||||||
| Loans individually evaluated for impairment |
$ | 1,984,671 | $ | 40,083 | $ | — | $ | 2,024,754 | ||||||||
| Loans collectively evaluated for impairment |
3,217,480 | 833,732 | 466,360 | 4,517,572 | ||||||||||||
|
|
|
|
|
|
|
|
|
|||||||||
| Ending Balance |
$ | 5,202,151 | $ | 873,815 | $ | 466,360 | $ | 6,542,326 | ||||||||
|
|
|
|
|
|
|
|
|
|||||||||
38
CITIZENS HOLDING COMPANY
Years Ended December 31, 2014, 2013 and 2012
NOTES TO CONSOLIDATED FINANCIAL STATEMENTS
Note 5. Continued
| 2013 | Real Estate |
Business Loans |
Consumer | Total | ||||||||||||
| Beginning Balance |
$ | 4,629,559 | $ | 1,554,698 | $ | 770,012 | $ | 6,954,269 | ||||||||
| Provision for loan losses |
742,177 | 1 ,561,751 | (99,562 | ) | 2,204,366 | |||||||||||
| Chargeoffs |
763,914 | 375,498 | 135,302 | 1,274,714 | ||||||||||||
| Recoveries |
98,189 | 26,458 | 69,189 | 193,836 | ||||||||||||
|
|
|
|
|
|
|
|
|
|||||||||
| Net Chargeoffs |
665,725 | 349,040 | 66,113 | 1,080,878 | ||||||||||||
|
|
|
|
|
|
|
|
|
|||||||||
| Ending Balance |
$ | 4,706,011 | $ | 2,767,409 | $ | 604,337 | $ | 8,077,757 | ||||||||
|
|
|
|
|
|
|
|
|
|||||||||
| Period end allowance allocated to: |
||||||||||||||||
| Loans individually evaluated for impairment |
$ | 1,224,874 | $ | 1,071,729 | $ | — | $ | 2,296,603 | ||||||||
| Loans collectively evaluated for impairment |
3,481,137 | 1,695,680 | 604,337 | 5,781,154 | ||||||||||||
|
|
|
|
|
|
|
|
|
|||||||||
| Ending Balance |
$ | 4,706,011 | $ | 2,767,409 | $ | 604,337 | $ | 8,077,757 | ||||||||
|
|
|
|
|
|
|
|
|
|||||||||
39
CITIZENS HOLDING COMPANY
Years Ended December 31, 2014, 2013 and 2012
NOTES TO CONSOLIDATED FINANCIAL STATEMENTS
Note 5. Continued
| 2012 | Real Estate |
Business Loans |
Consumer | Total | ||||||||||||
| Beginning Balance |
$ | 4,176,475 | $ | 1,672,467 | $ | 832,470 | $ | 6,681,412 | ||||||||
| Provision for loan losses |
1,614,053 | (115,269 | ) | 47,013 | 1,545,797 | |||||||||||
| Chargeoffs |
1,218,879 | 55,390 | 229,926 | 1,504,195 | ||||||||||||
| Recoveries |
57,910 | 52,890 | 120,455 | 231,255 | ||||||||||||
|
|
|
|
|
|
|
|
|
|||||||||
| Net Chargeoffs |
1,160,969 | 2,500 | 109,471 | 1,272,940 | ||||||||||||
|
|
|
|
|
|
|
|
|
|||||||||
| Ending Balance |
$ | 4,629,559 | $ | 1,554,698 | $ | 770,012 | $ | 6,954,269 | ||||||||
|
|
|
|
|
|
|
|
|
|||||||||
| Period end allowance allocated to: |
||||||||||||||||
| Loans individually evaluated for impairment |
$ | 1,038,521 | $ | 54,706 | $ | — | $ | 1,093,227 | ||||||||
| Loans collectively evaluated for impairment |
3,591,038 | 1,499,992 | 770,012 | 5,861,042 | ||||||||||||
|
|
|
|
|
|
|
|
|
|||||||||
| Ending Balance |
$ | 4,629,559 | $ | 1,554,698 | $ | 770,012 | $ | 6,954,269 | ||||||||
|
|
|
|
|
|
|
|
|
|||||||||
40
CITIZENS HOLDING COMPANY
Years Ended December 31, 2014, 2013 and 2012
NOTES TO CONSOLIDATED FINANCIAL STATEMENTS
Note 5. Continued
The Company’s recorded investment in loans as of December 31, 2013 and 2012 related to each balance in the allowance for possible loan losses by portfolio segment and disaggregated on the basis of the Company’s impairment methodology was as follows (in thousands):
| 2014 | Real Estate | Business Loans |
Consumer | Total | ||||||||||||
| Loans individually evaluated for impairment |
$ | 12,888 | $ | 70 | $ | 121 | $ | 13,079 | ||||||||
| Loans collectively evaluated for impairment |
312,724 | 39,298 | 26,394 | 378,416 | ||||||||||||
|
|
|
|
|
|
|
|
|
|||||||||
| $ | 325,612 | $ | 39,368 | $ | 26,515 | $ | 391,495 | |||||||||
|
|
|
|
|
|
|
|
|
|||||||||
| 2013 | Real Estate | Business Loans |
Consumer | Total | ||||||||||||
| Loans individually evaluated for impairment |
$ | 11,248 | $ | 2,224 | $ | 120 | $ | 13,592 | ||||||||
| Loans collectively evaluated for impairment |
296,468 | 54,897 | 27,711 | 379,076 | ||||||||||||
|
|
|
|
|
|
|
|
|
|||||||||
| $ | 307,716 | $ | 57,121 | $ | 27,831 | $ | 392,668 | |||||||||
|
|
|
|
|
|
|
|
|
|||||||||
Note 6. Bank Premises, Furniture, Fixtures and Equipment
Bank premises, furniture, fixtures and equipment consist of the following at December 31, 2014 and 2013:
| 2014 | 2013 | |||||||
| Land and buildings |
$ | 24,085,233 | $ | 23,291,103 | ||||
| Furniture, fixtures and equipment |
15,161,067 | 14,257,831 | ||||||
|
|
|
|
|
|||||
| 39,246,300 | 37,548,934 | |||||||
| Less accumulated depreciation |
20,006,070 | 18,925,780 | ||||||
|
|
|
|
|
|||||
| Total |
$ | 19,240,230 | $ | 18,623,154 | ||||
|
|
|
|
|
|||||
Depreciation expense for the years ended December 31, 2014, 2013 and 2012 was $1,190,393, $1,140,753 and $1,149,029, respectively.
41
CITIZENS HOLDING COMPANY
Years Ended December 31, 2014, 2013 and 2012
NOTES TO CONSOLIDATED FINANCIAL STATEMENTS
Note 7. Deposits
The composition of deposits as of December 31, 2014 and 2013 is as follows:
| 2014 | 2013 | |||||||
| Non-interest bearing |
$ | 145,729,932 | $ | 120,424,895 | ||||
| NOW and money market accounts |
268,567,815 | 248,015,410 | ||||||
| Savings deposits |
60,253,788 | 53,745,787 | ||||||
| Time deposits, $100,000 or more |
121,360,214 | 124,886,164 | ||||||
| Other time deposits |
100,182,145 | 107,557,540 | ||||||
|
|
|
|
|
|||||
| Total |
$ | 696,093,894 | $ | 654,629,796 | ||||
|
|
|
|
|
|||||
The scheduled maturities of time deposits at December 31, 2014 are as follows:
| Year Ending December 31, |
Amount | |||
| 2015 |
$ | 179,539,727 | ||
| 2016 |
38,921,215 | |||
| 2017 |
2,715,789 | |||
| 2018 |
197,779 | |||
| 2019 |
167,849 | |||
|
|
|
|||
| $ | 221,542,359 | |||
|
|
|
|||
Interest expense for time deposits over $100,000 was approximately $671,000, $754,000 and $996,000 for the years ended December 31, 2014, 2013 and 2012, respectively.
42
CITIZENS HOLDING COMPANY
Years Ended December 31, 2014, 2013 and 2012
NOTES TO CONSOLIDATED FINANCIAL STATEMENTS
Note 8. Federal Home Loan Bank Advances
Pursuant to collateral agreements with the FHLB, advances are collateralized by all of the Bank’s FHLB stock ($1,347,600 included in other assets at December 31, 2014) and qualifying first mortgages and other loans. As of December 31, 2014, the balance in qualifying first mortgages and other loans was $162,313,563. At December 31, 2014 and 2013, advances from the FHLB, along with their rate and maturity date, consist of the following:
| Advance Amount at | Interest Rate |
Final Maturity | ||||||||||
| December 31, | ||||||||||||
| 2014 | 2013 | |||||||||||
| $ | — | $ | 10,000,000 | 0.16 | January 21, 2014 | |||||||
| — | 3,500,000 | 4.67 | December 16, 2014 | |||||||||
| 20,000,000 | 20,000,000 | 2.53 | January 09, 2018 | |||||||||
|
|
|
|
|
|||||||||
| $ | 20,000,000 | $ | 33,500,000 | |||||||||
|
|
|
|
|
|||||||||
The scheduled payments for the next five years are as follows:
| Year Due |
Payment | |||
| 2015 |
— | |||
| 2016 |
— | |||
| 2017 |
— | |||
| 2018 |
20,000,000 | |||
| 2019 |
— | |||
|
|
|
|||
| $ | 20,000,000 | |||
|
|
|
|||
43
CITIZENS HOLDING COMPANY
Years Ended December 31, 2014, 2013 and 2012
NOTES TO CONSOLIDATED FINANCIAL STATEMENTS
Note 9. Other Income and Other Expense
The following is a detail of the major income classifications that are included in other income under non-interest income on the income statement for the year ended December 31:
| Other Income |
2014 | 2013 | 2012 | |||||||||
| BOLI insurance |
$ | 562,732 | $ | 657,273 | $ | 567,440 | ||||||
| Mortgage loan origination fees |
342,765 | 367,573 | 486,136 | |||||||||
| Other income |
1,212,938 | 529,608 | 345,633 | |||||||||
|
|
|
|
|
|
|
|||||||
| Total other income |
$ | 2,118,435 | $ | 1,554,454 | $ | 1,399,209 | ||||||
|
|
|
|
|
|
|
|||||||
The following is a detail of the major expense classifications that comprise the other expense line item in the income statement for the year ended December 31:
| Other Expense |
2014 | 2013 | 2012 | |||||||||
| Intangible amortization |
$ | — | $ | — | $ | 76,955 | ||||||
| Advertising |
769,081 | 621,216 | 636,652 | |||||||||
| Office supplies |
774,961 | 563,706 | 487,581 | |||||||||
| Legal and audit fees |
416,339 | 393,997 | 458,731 | |||||||||
| FDIC and state assessments |
771,097 | 69,282 | 1,270,792 | |||||||||
| Telephone expense |
408,646 | 442,781 | 430,695 | |||||||||
| Loan collection expense |
621,227 | 554,542 | 378,576 | |||||||||
| Other losses |
930,401 | 462,475 | 354,279 | |||||||||
| Debit card / ATM expense |
330,612 | 830,396 | 815,960 | |||||||||
| Travel and convention |
184,723 | 200,684 | 194,541 | |||||||||
| Other expenses |
2,826,567 | 3,081,797 | 2,770,430 | |||||||||
|
|
|
|
|
|
|
|||||||
| Total other expense |
$ | 8,033,654 | $ | 7,220,876 | $ | 7,875,192 | ||||||
|
|
|
|
|
|
|
|||||||
Other losses in 2014, 2013 and 2012 include the write-down on OREO in the amount of $694,207, $276,400 and $309,797, respectively.
44
CITIZENS HOLDING COMPANY
Years Ended December 31, 2014, 2013 and 2012
NOTES TO CONSOLIDATED FINANCIAL STATEMENTS
Note 10. Income Taxes
The consolidated provision for income taxes consists of the following:
| 2014 | 2013 | 2012 | ||||||||||
| Currently payable |
||||||||||||
| Federal |
$ | 1,399,794 | $ | 2,335,959 | $ | 1,917,068 | ||||||
| State |
120,377 | 284,044 | 270,114 | |||||||||
|
|
|
|
|
|
|
|||||||
| 1,520,171 | 2,620,003 | 2,187,182 | ||||||||||
| Deferred tax expense (benefit) |
307,920 | (850,100 | ) | (536,374 | ) | |||||||
|
|
|
|
|
|
|
|||||||
| Income tax expense |
$ | 1,828,091 | $ | 1,769,903 | $ | 1,650,808 | ||||||
|
|
|
|
|
|
|
|||||||
The differences between income taxes calculated at the federal statutory rate and income tax expense were as follows:
| 2014 | 2013 | 2012 | ||||||||||
| Federal taxes based on statutory rate |
$ | 3,154,469 | $ | 3,032,719 | $ | 2,867,834 | ||||||
| State income taxes, net of federal benefit |
79,449 | 187,469 | 178,275 | |||||||||
| Tax-exempt investment interest |
(1,006,536 | ) | (1,159,571 | ) | (1,231,567 | ) | ||||||
| Other, net |
(399,291 | ) | (290,714 | ) | (163,734 | ) | ||||||
|
|
|
|
|
|
|
|||||||
| Income tax expense |
$ | 1,828,091 | $ | 1,769,903 | $ | 1,650,808 | ||||||
|
|
|
|
|
|
|
|||||||
At December 31, 2014 and 2013, net deferred tax assets consist of the following:
| 2014 | 2013 | |||||||
| Deferred tax assets |
||||||||
| Allowance for loan losses |
$ | 2,440,150 | $ | 3,012,907 | ||||
| Deferred compensation liability |
3,005,808 | 2,506,541 | ||||||
| Intangible assets |
92,276 | 154,037 | ||||||
| Unrealized loss on securities available-for-sale |
— | 12,640,667 | ||||||
| Unrealized loss on securities transferred to HTM |
5,787,593 | — | ||||||
| Other |
570,076 | 689,235 | ||||||
|
|
|
|
|
|||||
| Total |
11,895,903 | 19,003,387 | ||||||
| Deferred tax liabilities |
||||||||
| Premises and equipment |
1,149,615 | 1,056,263 | ||||||
| Unrealized gain on available-for-sale securities |
504,545 | — | ||||||
| Other |
113,002 | 152,844 | ||||||
|
|
|
|
|
|||||
| Total |
1,767,162 | 1,209,107 | ||||||
|
|
|
|
|
|||||
| Net deferred tax asset |
$ | 10,128,741 | $ | 17,794,280 | ||||
|
|
|
|
|
|||||
45
CITIZENS HOLDING COMPANY
Years Ended December 31, 2014, 2013 and 2012
NOTES TO CONSOLIDATED FINANCIAL STATEMENTS
Note 10. Continued
The net deferred tax asset of $10,128,741 and $17,794,280 at December 31, 2014 and 2013, respectively, is included in other assets. The Company has evaluated the need for a valuation allowance related to the above deferred tax assets and, based on the weight of the available evidence, has determined that it is more likely than not that all deferred tax assets will be realized.
As of December 31, 2014, the Company has no unrecognized tax benefits related to federal and state income tax matters. As of December 31, 2014, the Company has not accrued for interest and penalties related to uncertain tax positions. It is the Company’s policy to recognize interest or penalties related to income tax matters in income tax expense.
The Company and the Bank file a consolidated United States federal income tax return. The Company is currently open to audit under the statute of limitations by the Internal Revenue Service for the years ended December 31, 2011 through 2014. The Company and Bank’s state income tax returns are open to audit under the statute of limitations for the years ended December 31, 2011 through 2014.
Note 11. Summarized Financial Information of Citizens Holding Company
Summarized financial information of Citizens Holding Company, excluding the Bank, at December 31, 2014 and 2013, and for the years ended December 31, 2014, 2013 and 2012, is as follows:
Balance Sheets
December 31, 2014 and 2013
| 2014 | 2013 | |||||||
| Assets |
||||||||
| Cash (1) |
$ | 1,688,497 | $ | 1,750,766 | ||||
| Investment in bank subsidiary (1) |
79,797,988 | 64,188,216 | ||||||
| Other assets (1) |
371,301 | 327,220 | ||||||
|
|
|
|
|
|||||
| Total assets |
$ | 81,857,786 | $ | 66,266,202 | ||||
|
|
|
|
|
|||||
| Liabilities |
||||||||
| Other liabilities |
$ | — | $ | — | ||||
| Stockholders’ equity |
81,857,786 | 66,266,202 | ||||||
|
|
|
|
|
|||||
| Total liabilities and stockholders’ equity |
$ | 81,857,786 | $ | 66,266,202 | ||||
|
|
|
|
|
|||||
| (1) | Fully or partially eliminates in consolidation. |
46
CITIZENS HOLDING COMPANY
Years Ended December 31, 2014, 2013 and 2012
NOTES TO CONSOLIDATED FINANCIAL STATEMENTS
Note 11. Continued
Income Statements
Years Ended December 31, 2014, 2013 and 2012
| 2014 | 2013 | 2012 | ||||||||||
| Interest income (1) |
$ | 2,140 | $ | 2,140 | $ | 3,348 | ||||||
|
|
|
|
|
|
|
|||||||
| Other income |
||||||||||||
| Dividends from bank subsidiary (1) |
4,371,900 | 4,332,000 | 4,332,000 | |||||||||
| Equity in undistributed earnings of bank subsidiary (1) |
3,241,870 | 2,898,509 | 2,603,735 | |||||||||
| Other income |
1,676 | — | — | |||||||||
|
|
|
|
|
|
|
|||||||
| Total other income |
7,615,446 | 7,230,509 | 6,939,083 | |||||||||
|
|
|
|
|
|
|
|||||||
| Other expense |
263,598 | 136,317 | 252,278 | |||||||||
|
|
|
|
|
|
|
|||||||
| Income before income taxes |
7,351,848 | 7,096,332 | 6,686,805 | |||||||||
| Income tax benefit |
(97,610 | ) | (53,528 | ) | (97,194 | ) | ||||||
|
|
|
|
|
|
|
|||||||
| Net income |
$ | 7,449,759 | $ | 7,149,860 | $ | 6,783,999 | ||||||
|
|
|
|
|
|
|
|||||||
| (1) | Eliminates in consolidation. |
Statements of Cash Flows
Years Ended December 31, 2014, 2013 and 2012
| 2014 | 2013 | 2012 | ||||||||||
| Cash flows from operating activities |
||||||||||||
| Net income |
$ | 7,449,759 | $ | 7,149,860 | $ | 6,783,999 | ||||||
| Adjustments to reconcile net income to net cash provided by operating activities |
||||||||||||
| Equity in undistributed earnings of Bank |
(3,241,870 | ) | (2,898,509 | ) | (2,603,735 | ) | ||||||
| Stock compensation expense |
115,000 | — | 119,834 | |||||||||
| Increase in other assets |
(44,082 | ) | (1,032 | ) | (40,774 | ) | ||||||
| Decrease in other liabilities |
— | (400 | ) | — | ||||||||
|
|
|
|
|
|
|
|||||||
| Net cash provided by operating activities |
4,278,807 | 4,249,919 | 4,259,324 | |||||||||
|
|
|
|
|
|
|
|||||||
47
CITIZENS HOLDING COMPANY
Years Ended December 31, 2014, 2013 and 2012
NOTES TO CONSOLIDATED FINANCIAL STATEMENTS
Note 11. Continued
| 2014 | 2013 | 2012 | ||||||||||
| Cash flows from financing activities |
||||||||||||
| Dividends paid to stockholders |
$ | (4,341,076 | ) | $ | (4,285,371 | ) | $ | (4,276,282 | ) | |||
| Proceeds from stock option exercises |
— | 128,950 | 257,425 | |||||||||
|
|
|
|
|
|
|
|||||||
| Net cash used by financing activities |
(4,341,076 | ) | (4,156,421 | ) | (4,018,857 | ) | ||||||
|
|
|
|
|
|
|
|||||||
| Net increase in cash |
(62,269 | ) | 93,498 | 240,467 | ||||||||
|
|
|
|
|
|
|
|||||||
| Cash, beginning of year |
1,750,766 | 1,657,268 | 1,416,801 | |||||||||
|
|
|
|
|
|
|
|||||||
| Cash, end of year |
$ | 1,688,497 | $ | 1,750,766 | $ | 1,657,268 | ||||||
|
|
|
|
|
|
|
|||||||
The Bank is required to obtain approval from state regulators before paying dividends.
Note 12. Related Party Transactions
The Company had, and may be expected to have in the future, banking transactions in the ordinary course of business with directors, significant stockholders, principal officers, their immediate families, and affiliated companies in which they are principal stockholders (commonly referred to as related parties). In management’s opinion, such loans are made on substantially the same terms, including interest rates and collateral, as those prevailing at the time for comparable transactions with unrelated parties, and do not involve more than the normal risk of collectability at the time of the transaction.
Activity in related party loans is detailed in tabular form in Note 5 of the notes to the Financial Statements.
Deposits from related parties at December 31, 2014 and 2013 approximated $6,587,915 and $3,698,844, respectively.
48
CITIZENS HOLDING COMPANY
Years Ended December 31, 2014, 2013 and 2012
NOTES TO CONSOLIDATED FINANCIAL STATEMENTS
Note 13. Off-Balance Sheet Financial Instruments, Commitments and Contingencies and Concentrations of Risks
Commitments to Extend Credit
In the ordinary course of business, the Company makes various commitments and incurs certain contingent liabilities to fulfill the financing needs of its customers. These commitments and contingent liabilities include commitments to extend credit and issue standby letters of credit. They involve, to varying degrees, elements of credit risk in excess of the amount recognized in the balance sheets. The Company’s exposure to credit loss in the event of nonperformance by the other party to the financial instrument for commitments to extend credit and standby letters of credit is represented by the contractual amount of those instruments. At December 31, 2014 and 2013, commitments related to unused lines of credit were $50,242,705 and $40,701,380, respectively, and standby letters of credit were $2,855,480 and $2,809,330, respectively. The fair value of such commitments is not materially different than stated values. As some of these commitments are expected to expire without being drawn upon, the total commitment amount does not necessarily represent future cash requirements. The Company applies the same credit policies and standards as it does in the lending process when making these commitments. The collateral obtained is based upon the assessed credit worthiness of the borrower. Collateral held varies, but may include accounts receivable, crops, livestock, inventory, property and equipment, residential real estate and income-producing commercial properties.
Interest Rate Risk
The Company is principally engaged in providing short-term and medium-term installment, commercial and agricultural loans with interest rates that are fixed or fluctuate with the prime lending rate. These assets are primarily funded through short-term demand deposits and long-term certificates of deposit with variable and fixed rates. Accordingly, the Company is exposed to interest rate risk because in changing interest rate environments interest rate adjustments on assets and liabilities may not occur at the same time or in the same amount. The Company manages the overall rate sensitivity and mix of its asset and liability portfolio and attempts to minimize the effects that interest rate fluctuations will have on its net interest margin.
Legal Proceedings
The Company is party to lawsuits and other claims that arise in the ordinary course of business. The lawsuits assert claims related to the general business activities of the Company. The cases are being vigorously contested. In the regular course of business, management evaluates estimated losses or costs related to litigation, and provision is made for anticipated losses whenever management believes that such losses are probable and can be reasonably estimated. While management believes that the final resolution of pending legal proceedings will not have a material impact on the Company’s financial position or results of operations, the final resolution of such proceedings could have a material adverse effect.
49
CITIZENS HOLDING COMPANY
Years Ended December 31, 2014, 2013 and 2012
NOTES TO CONSOLIDATED FINANCIAL STATEMENTS
Note 13. Continued
Concentration of Risk
The Company makes agricultural, agribusiness, commercial, residential and consumer loans primarily in eastern central Mississippi. A substantial portion of the customers’ abilities to honor their contracts is dependent on their business and the agricultural economy in the area.
Although the Company’s loan portfolio is diversified, there is a relationship in this region between the agricultural economy and the economic performance of loans made to nonagricultural customers. The Company’s lending policies for agricultural and nonagricultural customers require loans to be well-collateralized and supported by cash flows. Collateral for agricultural loans includes equipment, crops, livestock, and land. Credit losses from loans related to the agricultural economy are consistent with credit losses experienced in the portfolio as a whole. The concentration of credit in the regional agricultural economy is taken into consideration by management in determining the allowance for loan losses. See Note 5 for a summary of loans by type.
Note 14. Lease Commitment and Total Rental Expense
The Company has operating leases under non-cancellable operating lease agreements for banking facilities and equipment. Future minimum rental payments due under the leases are as follows:
| Years Ending December 31, |
Amounts | |||
| 2015 |
$ | 523,406 | ||
| 2016 |
448,922 | |||
| 2017 |
414,122 | |||
| 2018 |
414,122 | |||
| 2019 |
414,122 | |||
|
|
|
|||
| $ | 2,214,694 | |||
|
|
|
|||
The total rental expense included in the income statements for the years ended December 31, 2014, 2013 and 2012 is $104,384, $150,333 and $177,416, respectively.
50
CITIZENS HOLDING COMPANY
Years Ended December 31, 2014, 2013 and 2012
NOTES TO CONSOLIDATED FINANCIAL STATEMENTS
Note 15. Benefit Plans
The Company provides its employees with a profit sharing and savings plan, which allows employees to direct a percentage of their compensation into a tax deferred retirement account, subject to statutory limitations. To encourage participation, the Company provides a 50 percent matching contribution for up to 6 percent of each participant’s compensation, plus discretionary non-matching contributions. Employees are eligible after one year of service. For 2014, 2013 and 2012, the Company’s contributions were $485,251, $511,984 and $778,724, respectively.
Deferred Compensation Plans
The Company provides a deferred compensation plan covering its directors. Participants in the deferred compensation plan can defer a portion of their compensation for payment after attaining age 70. Life insurance contracts have been purchased which may be used to fund payments under the plan. Net expenses related to this plan were $174,509, $157,017 and $26,862 for the plan years ended December 31, 2014, 2013 and 2012, respectively.
The Company has also entered into deferred compensation arrangements with certain officers that provide for payments to such officers or their survivors after retirement. Life insurance policies have been purchased that may be used to fund payments under these arrangements. The obligations of the Company under both the directors and officers deferred compensation arrangements are expensed on a systematic basis over the remaining expected service period of the individual directors and officers. Net expenses related to this plan were $514,635, $804,755 and $882,904 for the plan years ended December 31, 2014, 2013 and 2012, respectively.
Note 16. Regulatory Matters
The Company (on a consolidated basis) and the Bank are subject to various regulatory capital requirements administered by federal banking agencies. Failure to meet the minimum regulatory capital requirements can initiate certain mandatory and possible additional discretionary actions by regulators that, if undertaken, could have a direct material adverse effect on the Company.
Under the regulatory capital adequacy guidelines and the regulatory framework for prompt corrective action, the Company must meet specific capital guidelines involving quantitative measures of the Company’s assets, liabilities and certain off-balance sheet items as calculated under regulatory accounting practices. The Company’s capital amounts and classification under the prompt corrective action guidelines are also subject to qualitative judgments by the regulators about components, risk weightings, and other factors. Quantitative measures established by regulation to ensure capital adequacy require the Company to maintain minimum amounts and ratios of total capital and Tier I capital to risk-weighted assets (as defined in the regulations) and Tier I capital to average assets (as defined in the regulations). Management believes, as of December 31, 2014, that the Company and the Bank meet all capital adequacy requirements to which they are subject.
51
CITIZENS HOLDING COMPANY
Years Ended December 31, 2014, 2013 and 2012
NOTES TO CONSOLIDATED FINANCIAL STATEMENTS
Note 16. Continued
As of December 31, 2014 and 2013, the most recent regulatory notification categorized the Bank as well capitalized. There have been no conditions or events that would cause changes to the capital structure of the Company since this notification. To continue to be categorized as well capitalized under the regulatory framework for prompt corrective action, the Company would have to maintain minimum total risk-based, Tier I risk-based, and Tier I leverage ratios as disclosed below, in comparison with actual capital amounts and ratios:
| Actual | For
Capital Adequacy Purposes |
To Be Well Capitalized under Prompt Corrective Action Provisions |
||||||||||||||||||||||
| Amount | Ratio | Amount | Ratio | Amount | Ratio | |||||||||||||||||||
| As of December 31, 2014 |
||||||||||||||||||||||||
| Total Capital (to Risk-Weighted Assets) |
||||||||||||||||||||||||
| Citizens Holding Company |
$ | 94,131,074 | 17.84 | % | $ | 42,219,926 | 8 | % | $ | N/A | — | |||||||||||||
| Citizens Bank |
92,071,276 | 17.46 | % | 42,190,221 | 8 | 52,737,777 | 10 | % | ||||||||||||||||
| Tier I Capital (to Risk-Weighted Assets) |
||||||||||||||||||||||||
| Citizens Holding Company |
$ | 87,588,748 | 16.60 | % | $ | 21,109,963 | 4 | N/A | — | |||||||||||||||
| Citizens Bank |
85,528,950 | 16.22 | % | 21,095,111 | 4 | 31,642,666 | 6 | |||||||||||||||||
| Tier I Capital (to Average Assets) |
||||||||||||||||||||||||
| Citizens Holding Company |
$ | 87,588,748 | 9.60 | % | $ | 36,487,785 | 4 | N/A | — | |||||||||||||||
| Citizens Bank |
85,528,950 | 9.71 | % | 35,247,045 | 4 | 44,058,806 | 5 | |||||||||||||||||
| Actual | For
Capital Adequacy Purposes |
To Be Well Capitalized under Prompt Corrective Action Provisions |
||||||||||||||||||||||
| Amount | Ratio | Amount | Ratio | Amount | Ratio | |||||||||||||||||||
| As of December 31, 2013 |
||||||||||||||||||||||||
| Total Capital (to Risk-Weighted Assets) |
||||||||||||||||||||||||
| Citizens Holding Company |
$ | 90,881,652 | 17.49 | % | $ | 41,581,280 | 8 | % | $ | N/A | — | |||||||||||||
| Citizens Bank |
88,800,245 | 17.09 | % | 41,559,111 | 8 | 51,948,889 | 10 | % | ||||||||||||||||
| Tier I Capital (to Risk-Weighted Assets) |
||||||||||||||||||||||||
| Citizens Holding Company |
$ | 84,365,066 | 16.23 | % | $ | 20,790,640 | 4 | N/A | — | |||||||||||||||
| Citizens Bank |
82,287,080 | 15.84 | % | 20,779,556 | 4 | 31,169,333 | 6 | |||||||||||||||||
| Tier I Capital (to Average Assets) |
||||||||||||||||||||||||
| Citizens Holding Company |
$ | 84,365,066 | 9.63 | % | $ | 35,026,360 | 4 | N/A | — | |||||||||||||||
| Citizens Bank |
82,287,080 | 9.40 | % | 35,013,482 | 4 | 43,766,853 | 5 | |||||||||||||||||
52
CITIZENS HOLDING COMPANY
Years Ended December 31, 2014, 2013 and 2012
NOTES TO CONSOLIDATED FINANCIAL STATEMENTS
Note 17. Fair Values of Financial Instruments
Under the authoritative guidance on fair value measurements, fair value is the price that would be received to sell an asset or paid to transfer a liability in an orderly transaction between market participants at the measurement date. In determining fair value, the Company uses various methods including market, income and cost approaches. Based on these approaches, the Company often utilizes certain assumptions about risk and or the risks inherent in the inputs to the valuation technique. These inputs can be readily observable, market corroborated, or generally unobservable inputs. The Company utilizes valuation techniques that maximize the use of observable inputs and minimize the use of unobservable inputs. Based on the observability of the inputs used in the valuation techniques, the Company is required to provide the following information according to the fair value hierarchy. The fair value hierarchy ranks the quality and reliability of the information used to determine fair values. Financial assets and liabilities carried at fair value will be classified and disclosed in one of the three following categories:
| Level 1 |
Quoted prices in active markets for identical assets or liabilities; | |
| Level 2 |
Quoted prices in active markets for similar assets and liabilities and inputs that are observable for the asset or liability; or | |
| Level 3 |
Unobservable inputs, such as discounted cash flow models or valuations. | |
The determination of where assets and liabilities fall within this hierarchy is based upon the lowest level of input that is significant to the fair value measurement. The fair value estimates, methods and assumptions used by the Company in estimating its fair value disclosures for financial instruments were:
Cash and Due from Banks and Interest Bearing Deposits with Banks
The carrying amounts reported in the balance sheet for these instruments approximate fair value because of their immediate and shorter-term maturities, which is considered to be three months or less at the time of purchase.
53
CITIZENS HOLDING COMPANY
Years Ended December 31, 2014, 2013 and 2012
NOTES TO CONSOLIDATED FINANCIAL STATEMENTS
Note 17. Continued
Investment Securities
Fair values for investment securities, available-for-sale and held-to-maturity, are based on quoted market prices, when available (Level 1). If quoted market prices are not available, fair values are based on quoted market prices of comparable instruments (Level 2). When neither quoted prices nor comparable instruments are available, unobservable inputs are needed to form an expected future cash flow analysis to establish fair values (Level 3).
The Company owns certain beneficial interests in one collateralized debt obligation secured by community bank trust preferred securities. These interests do not trade in a liquid market, and therefore, market quotes are not a reliable indicator of their ultimate realizability. The Company utilizes a discounted cash flow model using inputs of (1) market yields of trust-preferred securities as the discount rate and (2) expected cash flows which are estimated using assumptions related to defaults, deferrals and prepayments to determine the fair values of these beneficial interests. Many of the factors that adjust the timing and extent of cash flows are based on judgment and not directly observable in the markets. Therefore, these fair values are classified as Level 3 valuations for accounting and disclosure purposes. Since observable transactions in these securities are extremely rare, the Company uses assumptions that a market participant would use in valuing these instruments. These assumptions primarily include cash flow estimates and market discount rates. The cash flow estimates are sensitive to the assumptions related to the ability of the issuers to pay the underlying trust preferred securities according to their terms. The market discount rates depend on transactions, which are rare given the lack of interest of investors in these types of beneficial interests.
54
CITIZENS HOLDING COMPANY
Years Ended December 31, 2014, 2013 and 2012
NOTES TO CONSOLIDATED FINANCIAL STATEMENTS
Note 17. Continued
The following table presents investment securities that are measured at fair value on a recurring basis as of December 31, 2014:
| Quoted Prices in Active Markets for Identical Assets |
Significant Other Observable Inputs |
Significant Unobservable Inputs |
||||||||||||||
| (Level 1) | (Level 2) | (Level 3) | Totals | |||||||||||||
| Securities available for sale |
||||||||||||||||
| Obligations of U.S. |
||||||||||||||||
| Government agencies |
$ | — | $ | 75,961,075 | $ | — | $ | 75,961,075 | ||||||||
| Mortgage-backed securities |
— | 13,326,834 | — | 13,326,834 | ||||||||||||
| State, County, Municipals |
— | 87,584,498 | — | 87,584,498 | ||||||||||||
| Other Investments |
— | — | 2,872,723 | 2,872,723 | ||||||||||||
|
|
|
|
|
|
|
|
|
|||||||||
| $ | — | $ | 176,872,407 | $ | 2,872,723 | $ | 179,745,130 | |||||||||
|
|
|
|
|
|
|
|
|
|||||||||
The following table presents investment securities that are measured at fair value on a recurring basis as of December 31, 2013:
| Quoted Prices in Active Markets for Identical Assets |
Significant Other Observable Inputs |
Significant Unobservable Inputs |
||||||||||||||
| (Level 1) | (Level 2) | (Level 3) | Totals | |||||||||||||
| Securities available for sale |
||||||||||||||||
| Obligations of U.S. |
||||||||||||||||
| Government agencies |
$ | — | $ | 282,816,400 | $ | — | $ | 282,816,400 | ||||||||
| Mortgage-backed securities |
— | 17,166,394 | — | 17,166,394 | ||||||||||||
| State, County, Municipals |
— | 95,427,405 | — | 95,427,405 | ||||||||||||
| Other Investments |
— | — | 2,766,203 | 2,766,203 | ||||||||||||
|
|
|
|
|
|
|
|
|
|||||||||
| $ | — | $ | 395,410,199 | $ | 2,766,203 | $ | 398,176,402 | |||||||||
|
|
|
|
|
|
|
|
|
|||||||||
55
CITIZENS HOLDING COMPANY
Years Ended December 31, 2014, 2013 and 2012
NOTES TO CONSOLIDATED FINANCIAL STATEMENTS
Note 17. Continued
The following table reports the activity in assets measured at fair value on a recurring basis using significant unobservable inputs, during the years ended December 31, 2014 and 2013.
| 2014 | 2013 | |||||||
| Balance at January 1 |
$ | 2,766,203 | $ | 2,806,253 | ||||
| Principal payments received |
(31,824 | ) | (68,012 | ) | ||||
| Unrealized gains included in other comprehensive income |
138,344 | 27,962 | ||||||
|
|
|
|
|
|||||
| Balance at December 31 |
$ | 2,872,723 | $ | 2,766,203 | ||||
|
|
|
|
|
|||||
| The amount of total gains or losses for the period included in earnings attributable to the change in unrealized gains or losses relating to assets still held at reporting date |
||||||||
As of December 31, 2014 and 2013, management determined, based on the current credit ratings, known defaults and deferrals by the underlying banks and the degree to which future defaults and deferrals would be required to occur before the cash flow for the Company’s tranche is negatively impacted, that no other-than-temporary impairment exists.
The Company recorded no gains or losses in earnings for the period that were attributable to the change in unrealized gains or losses relating to assets still held at the reporting date.
Net Loans
For variable-rate loans that reprice frequently and with no significant change in credit risk, fair values are based on carrying values. The fair values for other loans (i.e., commercial real estate and rental property mortgage loans, commercial and industrial loans, financial institution loans, and agricultural loans) are estimated using discounted cash flow analyses, using interest rates currently being offered for loans with similar terms to borrowers of similar credit quality.
56
CITIZENS HOLDING COMPANY
Years Ended December 31, 2014, 2013 and 2012
NOTES TO CONSOLIDATED FINANCIAL STATEMENTS
Note 17. Continued
Impaired Loans
Loans considered impaired are reserved for at the time the loan is identified as impaired taking into account the fair value of the collateral less estimated selling costs. Collateral may be real estate and/or business assets including but not limited to, equipment, inventory and accounts receivable. The fair value of real estate is determined based on appraisals by qualified licensed appraisers. The fair value of the business assets is generally based on amounts reported on the business’s financial statements. Appraised and reported values may be adjusted based on management’s historical knowledge, changes in market conditions from the time of valuation and management’s knowledge of the client and the client’s business. Since not all valuation inputs are observable, these nonrecurring fair value determinations are classified Level 3. Impaired loans are reviewed and evaluated on at least a quarterly basis for additional impairment and adjusted accordingly, based on the same factors previously identified.
Other real estate owned
OREO is comprised of commercial and residential real estate obtained in partial and total satisfaction of loan obligations. OREO acquired in settlement of indebtedness is recorded at fair value of the real estate, less costs to sell. Subsequently, it may be necessary to record nonrecurring fair value adjustments for decline in fair value. Fair value, when recorded, is determined based on appraisals by qualified licensed appraisers and adjusted for management’s estimates of costs to sell. As such, values for OREO are classified as Level 3.
57
CITIZENS HOLDING COMPANY
Years Ended December 31, 2014, 2013 and 2012
NOTES TO CONSOLIDATED FINANCIAL STATEMENTS
Note 17. Continued
The following table presents assets measured at fair value on a nonrecurring basis during December 31, 2014 and 2013 and were still held at those respective dates:
| Quoted Prices in Active Markets for Identical Assets |
Significant Other Observable Inputs |
Significant Unobservable Inputs |
||||||||||||||
| (Level 1) | (Level 2) | (Level 3) | Totals | |||||||||||||
| December 31, 2014 |
||||||||||||||||
| Impaired loans |
$ | — | $ | — | $ | 8,218,696 | $ | 8,218,696 | ||||||||
| Other real estate owned |
— | — | 3,309,824 | 3,309,824 | ||||||||||||
|
|
|
|
|
|
|
|
|
|||||||||
| $ | — | $ | — | $ | 11,528,520 | $ | 11,528,520 | |||||||||
|
|
|
|
|
|
|
|
|
|||||||||
| December 31, 2013 |
||||||||||||||||
| Impaired loans |
$ | — | $ | — | $ | 8,782,923 | $ | 8,782,923 | ||||||||
| Other real estate owned |
— | — | 645,468 | 645,468 | ||||||||||||
|
|
|
|
|
|
|
|
|
|||||||||
| $ | — | $ | — | $ | 9,428,391 | $ | 9,428,391 | |||||||||
|
|
|
|
|
|
|
|
|
|||||||||
Impaired loans with a carrying value of $10,243,082 and $11,079,526 had an allocated allowance for loan losses of $2,024,754 and $2,296,603 at December 31, 2014 and 2013, respectively. The allocated allowance is based on the carrying value of the impaired loan and the fair value of the underlying collateral less estimated costs to sell.
After monitoring the carrying amounts for subsequent declines or impairment after foreclosure, management determined that a fair value adjustment to OREO in the amount of $694,207 and $276,400 was necessary and was recorded during the year ended December 31, 2014 and 2013, respectively.
58
CITIZENS HOLDING COMPANY
Years Ended December 31, 2014, 2013 and 2012
NOTES TO CONSOLIDATED FINANCIAL STATEMENTS
Note 17. Continued
Federal Funds Sold and Securities Sold Under Agreement to Repurchase
Due to the short term nature of these instruments, the carrying amount is equal to the fair value.
Deposits
The fair values for demand deposits, NOW and money market accounts and savings accounts are, by definition, equal to the amount payable on demand at the reporting date (i.e., their carrying amounts). The carrying amounts for variable-rate, fixed-term money market accounts and time deposits approximate their fair values at the reporting date. Fair values for fixed-rate time deposits are estimated using a discounted cash flow calculation that applies interest rates currently being offered on similar deposits to a schedule of aggregated expected monthly maturities on time deposits.
Federal Home Loan Bank Borrowings
The fair value of FHLB advances is based on discounted cash flow analysis.
Off-Balance Sheet Instruments
The fair value of commitments to extend credit and letters of credit are estimated using fees currently charged to enter into similar agreements. The fees associated with these financial instruments are not material.
59
CITIZENS HOLDING COMPANY
Years Ended December 31, 2014, 2013 and 2012
NOTES TO CONSOLIDATED FINANCIAL STATEMENTS
Note 17. Continued
The following represents the carrying value and estimated fair value of the Company’s financial instruments at December 31, 2014 and 2013:
| Carrying Value | Quoted Prices in Active Markets for Identical Assets |
Significant Other Observable Inputs |
Significant Unobservable Inputs |
Total Fair Value | ||||||||||||||||
| 2014 |
(Level 1) | (Level 2) | (Level 3) | |||||||||||||||||
| Financial assets |
||||||||||||||||||||
| Cash and due from banks |
$ | 22,405,730 | $ | 22,405,730 | $ | — | $ | — | $ | 22,405,730 | ||||||||||
| Interest bearing deposits with banks |
61,481,223 | 61,481,223 | — | — | 61,481,223 | |||||||||||||||
| Securities available-for-sale |
179,745,130 | — | 176,872,407 | 2,872,723 | 179,745,130 | |||||||||||||||
| Securities held-to-maturity |
206,817,168 | — | 216,745,438 | — | 216,745,438 | |||||||||||||||
| Net loans |
384,417,508 | — | — | 386,206,117 | 386,206,117 | |||||||||||||||
| Financial liabilities |
||||||||||||||||||||
| Deposits |
$ | 696,093,894 | $ | 474,551,535 | $ | — | $ | 221,685,000 | $ | 696,236,535 | ||||||||||
| Federal Home Loan Bank advances |
20,000,000 | — | — | 20,804,047 | 20,804,047 | |||||||||||||||
| Securities Sold under Agreement to Repurchase |
114,426,770 | 114,426,770 | — | — | 114,426,770 | |||||||||||||||
| Carrying Value | Quoted Prices in Active Markets for Identical Assets |
Significant Other Observable Inputs |
Significant Unobservable Inputs |
Total Fair Value | ||||||||||||||||
| 2013 |
(Level 1) | (Level 2) | (Level 3) | |||||||||||||||||
| Financial assets |
||||||||||||||||||||
| Cash and due from banks |
$ | 16,040,195 | $ | 16,040,195 | $ | — | $ | — | $ | 16,040,195 | ||||||||||
| Interest bearing deposits with banks |
684,100 | 684,100 | — | — | 684,100 | |||||||||||||||
| Securities available-for-sale |
432,065,590 | — | 395,410,199 | 2,766,203 | 398,176,402 | |||||||||||||||
| Net loans |
384,104,766 | — | — | 385,646,132 | 385,646,132 | |||||||||||||||
| Financial liabilities |
||||||||||||||||||||
| Deposits |
$ | 654,629,796 | $ | 422,186,092 | $ | — | $ | 232,602,224 | $ | 654,788,316 | ||||||||||
| Federal Home Loan Bank advances |
33,500,000 | — | — | 34,622,359 | 34,622,359 | |||||||||||||||
| Securities Sold under Agreement to Repurchase |
82,420,781 | 82,420,781 | — | — | 82,420,781 | |||||||||||||||
60
CITIZENS HOLDING COMPANY
Years Ended December 31, 2014, 2013 and 2012
NOTES TO CONSOLIDATED FINANCIAL STATEMENTS
Note 18. Stock Options
The Company has a directors’ stock compensation plan and had an employees’ long-term incentive plan. Under the directors’ plan, the Company may grant options for up to 210,000 shares of common stock. The price of each option is equal to the market price determined as of the option grant date. Options granted are exercisable after six months and expire after 10 years. The employee plan expired on April 13, 2009 and no options have been granted since this date. The options previously granted under the employee plan expire 10 years from the grant date. The exercise price is equal to the market price of the Company’s stock on the date of grant.
The fair value of each option granted is estimated on the date of the grant using the Black-Sholes option-pricing model. The following assumptions were used in estimating the fair value of the options granted in 2012. No options were granted in 2014 or 2013 therefore no calculations were required in 2014 or 2013 to determine fair values.
DIRECTORS
| Assumption |
2012 | |||
| Dividend yield |
4.7 | % | ||
| Risk-free interest rate |
0.78 | % | ||
| Expected life |
8.2 years | |||
| Expected volatility |
78.29 | % | ||
| Calculated value per option |
$ | 8.88 | ||
| Forfeitures |
0 | % | ||
The Corporation has adopted the 2013 Incentive Compensation Plan (the “2013 Plan”), which the Corporation intends to use for all future equity grants until the termination of the 2013 Plan.
During the first quarter of 2014, the Corporation’s directors received restricted stock grants totaling 7,500 shares of common stock at a then market value of $18.40 per share. These grants vest over a one-year period during which time the recipients have rights to vote the shares and to receive dividends. The grant date fair value of these shares was $138,000 and will be recognized over the one year restriction period at a cost of $11,500 per month less deferred taxes of $4,290 per month. During 2014, the Corporation recorded $115,000 in expense and $42,900 in deferred taxes related to these restricted shares.
At December 31, 2014, there were 7,500 shares non-vested with $22,500 in unrecognized stock-based compensation expense related to the 2013 Plan.
61
CITIZENS HOLDING COMPANY
Years Ended December 31, 2014, 2013 and 2012
NOTES TO CONSOLIDATED FINANCIAL STATEMENTS
Note 18. Continued
Following is a summary of the status of the plans for the years ending December 31, 2014, 2013 and 2012:
| Directors’ Plan | Employees’ Plan | |||||||||||||||
| Number of Shares |
Weighted Average Exercise Price |
Number of Shares |
Weighted Average Exercise Price |
|||||||||||||
| Outstanding at January 1, 2012 |
102,000 | $ | 21.00 | 135,500 | $ | 19.96 | ||||||||||
| Granted |
13,500 | 18.76 | — | — | ||||||||||||
| Exercised |
(3,000 | ) | 15.00 | (14,500 | ) | 14.65 | ||||||||||
| Expired |
(1,500 | ) | 15.00 | (13,000 | ) | 18.09 | ||||||||||
|
|
|
|
|
|
|
|
|
|||||||||
| Outstanding at December 31, 2012 |
111,000 | $ | 20.97 | 108,000 | $ | 20.90 | ||||||||||
| Granted |
— | — | — | — | ||||||||||||
| Exercised |
(3,000 | ) | 16.40 | (7,000 | ) | 14.91 | ||||||||||
| Expired |
(4,500 | ) | 16.40 | (19,000 | ) | 18.11 | ||||||||||
|
|
|
|
|
|
|
|
|
|||||||||
| Outstanding at December 31, 2013 |
103,500 | $ | 21.30 | 82,000 | $ | 22.06 | ||||||||||
| Granted |
— | — | — | — | ||||||||||||
| Exercised |
— | — | — | — | ||||||||||||
| Expired |
(7,500 | ) | 22.25 | (35,500 | ) | 21.95 | ||||||||||
|
|
|
|
|
|
|
|
|
|||||||||
| Outstanding at December 31, 2014 |
96,000 | $ | 21.23 | 46,500 | $ | 22.14 | ||||||||||
|
|
|
|
|
|
|
|
|
|||||||||
| Options exercisable at: |
||||||||||||||||
| December 31, 2014 |
96,000 | $ | 21.23 | 46,500 | $ | 22.14 | ||||||||||
|
|
|
|
|
|
|
|
|
|||||||||
| Weighted average fair value of Options granted during years ended |
||||||||||||||||
| December 31, 2012 |
$ | 8.88 | $ | — | ||||||||||||
|
|
|
|
|
|||||||||||||
| December 31, 2013 |
$ | — | $ | — | ||||||||||||
|
|
|
|
|
|||||||||||||
| December 31, 2014 |
$ | — | $ | — | ||||||||||||
|
|
|
|
|
|||||||||||||
62
CITIZENS HOLDING COMPANY
Years Ended December 31, 2014, 2013 and 2012
NOTES TO CONSOLIDATED FINANCIAL STATEMENTS
Note 18. Continued
The following table presents the outstanding stock options granted in relation to the option price and the weighted average maturity.
| Options | Weighted | Weighted Average | ||||||||
| Range of Exercise Prices |
Outstanding | Average Price | Life Remaining | |||||||
| $15.01 to $20.00 |
36,000 | 18.79 | 4 years, 1 month | |||||||
| $20.01 to $22.50 |
61,000 | 21.16 | 2 years, 8 months | |||||||
| $22.51 and above |
45,500 | 24.18 | 2 years, 6 months | |||||||
|
|
|
|
|
| ||||||
| Total |
142,500 | $ | 21.53 | 2 years, 11 months | ||||||
|
|
|
|
|
| ||||||
The intrinsic value of options granted under the Directors’ Plan at December 31, 2014 was $26,265 and the intrinsic value of the Employees’ Plan at December 31, 2014 was $2,145 for a total intrinsic value at December 31, 2014 of $28,410. Additionally, the total intrinsic value of options exercised during 2014 and 2013 was $0 and $39,050, respectively.
There were no options granted during 2014 under the 2013 Plan.
63
Management’s Discussion and Analysis of Financial Condition and Results of Operations as of
December 31, 2014, 2013 and 2012
OVERVIEW
The following information discusses the financial condition and results of operations of Citizens Holding Company (the “Company”) as of December 31, 2014, 2013 and 2012. In this discussion, all references to the activities, operations or financial performance of the Company reflect the Company’s activities, operations and financial performance through its wholly-owned subsidiary, The Citizens Bank of Philadelphia, Mississippi (the “Bank”), unless otherwise specifically noted.
Over the past three years, the Company has experienced growth in total assets and total deposits as management has capitalized on opportunities for organic growth within our market area and the addition of two branches in 2014. Despite a decrease in 2013, total assets increased over the three-year period by $67.1 million or 7.9%. In the three-year period, net income decreased in 2012 and then increased in 2013 and again in 2014. Although the cost of deposits decreased in all three years, the interest received on earning assets decreased at a faster rate and the net interest margin decreased in all three years. Loan loss provisions in 2014 decreased after increasing in 2013. Regardless of the decreases in the interest margins, management believes it has made appropriate provisions for loan losses.
During 2014, the Company’s assets increased by $47,991,781, or 5.5%, from 2013, loans increased by $312,742, or 0.1% and total deposits increased by $41,464,098, or 6.3%. Loans increased in 2014 due to the Company’s expansion into new market areas that offset soft loan demand. Certificates of deposit ended 2014 at $221,542,359, or 4.7% lower than 2013. Demand, NOW, savings and money market accounts increased $52,111,655, or 12.3%, to $474,551,535 at December 31, 2014.
During 2013, the Company’s assets decreased by $7,770,999, or 0.9%, from 2012, loans increased by $22,168,271, or 6.1% and total deposits increased by $12,080,458, or 1.9%. Loans increased in 2013 due to the Company’s expansion into new market areas and an increase in loan demand. Certificates of deposit ended 2013 at $232,443,704, or 6.4% lower than 2012. Demand, NOW, savings and money market accounts increased $27,887,591, or 7.1%, to $422,186,092 at December 31, 2013.
During 2012, the Company’s assets increased by $26,894,444, or 3.1%, from 2011, loans decreased by $20,644,034, or 5.4% and total deposits increased by $70,211,203, or 12.3%. Loans decreased in 2012 due to the continuing downturn in national and local economies and the weak loan demand that resulted from the sluggish economy. Certificates of deposit ended 2012 at $248,250,837, or 3.0% higher than 2011. Demand, NOW, savings and money market accounts increased $62,941,350, or 19.0%, to $394,298,501 at December 31, 2012.
In 2014, the Company’s net income after taxes increased to $7,449,759, an increase of $299,899 from 2013. Net interest income increased in 2014 primarily due to the reduction in interest paid on FHLB advances. This increase was offset by the increase in non-interest expense in excess of the increase in non-interest income. Net income for 2014 produced, on a fully diluted basis, earnings per share of $1.53 compared to $1.47 in 2013 and $1.39 for 2012.
64
In 2013, the Company’s net income after taxes increased to $7,149,860, an increase of $365,861 from 2012. The decrease in rates on earning assets was greater than the decrease in rates paid on deposits in 2013. This decrease was offset by the increase in non-interest income and a decrease in other operating expenses. Net income for 2013 produced, on a fully diluted basis, earnings per share of $1.47 compared to $1.39 in 2012 and $1.49 for 2011.
In 2012, the Company’s net income after taxes decreased to $6,783,999, a decrease of $433,848 from 2011. The decrease in rates on earning assets was greater than the decrease in rates paid on deposits in 2012. This decrease was offset by the decrease in the provision for loan losses and other operating expenses causing earnings to decrease slightly. Net income for 2012 produced, on a fully diluted basis, earnings per share of $1.39 compared to $1.49 in 2011 and $1.48 for 2010.
The Company’s return on average assets (“ROA”) was 0.84% in 2014, compared to 0.81% in 2013 and 0.81% in 2012. The Company’s return on average equity (“ROE”) was 10.17% in 2014, 9.00% in 2013 and 7.71% in 2012. During these periods, leverage capital ratios (the ratio of equity to average total assets) increased from 9.58% in 2012 to 9.63% in 2013 and decreased to 9.60% in 2014. The ROE in 2014, 2013 and 2012 is a function of the level of net income during those years. The changes in ROA were also a result of the Company’s income decreasing in 2012 and increasing in 2013 and again in 2014 and also affected by the change in total assets during these time periods. The Company set the annual dividend payout rate to approximately 58.17% of 2014 earnings per share, as compared to 59.86% in 2013 and 62.86% in 2012. The leverage capital ratio of 9.60% in 2014 remains above the regulatory requirement of 5% to be considered “well capitalized” under applicable Federal Deposit Insurance Corporation (the “FDIC”) guidelines for the Bank.
CRITICAL ACCOUNTING POLICIES
The preparation of financial statements in conformity with accounting principles generally accepted in the United States of America requires management to make estimates and assumptions that affect the reported amounts of assets and liabilities and disclosure of contingent assets and liabilities at the date of the financial statements and the reported amounts of revenues and expenses during the reporting period. Actual results could differ from those estimates.
The accounting policy most important to the presentation of our financial statements relates to the allowance for loan loss and the related provision for loan losses. The allowance for loan losses is available to absorb probable credit losses inherent in the entire loan portfolio. The appropriate level of the allowance is based on a monthly analysis of the loan portfolio and represents an amount that management deems adequate to provide for inherent losses, including collective impairment as recognized under ASC Subtopic 450-20, Loss Contingencies. The collective impairment is calculated based on loans grouped by similar risk characteristics. Another component of the allowance is losses on loans assessed as impaired under ASC Subtopic 310-10, Loan Impairments. The balance of these loans determined to be impaired under ASC Subtopic 310-10 and their related allowance is included in management’s estimation and
65
analysis of the allowance for loan losses. For a discussion of other considerations in establishing the allowance for loan losses and our loan policies and procedures for addressing credit risk, please refer to the disclosures in this Item under the heading “Provision for Loan Losses and Asset Quality.”
The Company currently classifies a portion of its debt securities as AFS as they might be sold before maturity. Securities available for sale are carried at fair value, with unrealized holding gains and losses reported in other comprehensive income (loss), net of tax. Interest income includes amortization of purchase premium or discount. Premiums and discounts on securities are amortized on the level-yield method without anticipating prepayments, except for mortgage-backed securities where prepayments are anticipated. Gains and losses on sales are recorded on the trade date and determined using the specific identification method.
Management evaluates securities for other-than-temporary impairment (“OTTI”) on at least a quarterly basis, and more frequently when economic or market conditions warrant such an evaluation. For securities in an unrealized loss position, management considers the extent and duration of the unrealized loss, and the financial condition and near-term prospects of the issuer. Management also assesses whether it intends to sell, or it is more likely than not that it will be required to sell, a security in an unrealized loss position before recovery of its amortized cost basis. If either of the criteria regarding intent or requirement to sell is met, the entire difference between amortized cost and fair value is recognized as impairment through earnings. For debt securities that do not meet the aforementioned criteria, the amount of impairment is split into two components as follows: 1) OTTI related to credit loss, which must be recognized in the income statement; and 2) OTTI related to other factors, which is recognized in other comprehensive income. The credit loss is defined as the difference between the present value of the cash flows expected to be collected and the amortized cost basis.
Real estate acquired through foreclosure on a loan or by surrender of the real estate in lieu of foreclosure is called “OREO”. OREO is initially recorded at the fair value of the property less estimated costs to sell, which establishes a new cost basis. OREO is subsequently accounted for at the lower of cost or fair value of the property less estimated costs. If fair value declines subsequent to foreclosure, a valuation allowance is recorded through noninterest expense. Fair value is commonly based on recent real estate appraisals. These appraisals may utilize a single valuation approach or a combination of approaches including comparable sales and the income approach. Valuation adjustments are routinely made in the appraisal process by the independent appraisers to adjust for differences between the comparable sales and income data available. Valuation adjustments are also required when the listing price to sell an OREO has had to be reduced below the current carrying value. If there is a decrease in the fair value of the property from the last valuation, the decrease in value is charged to noninterest expense. All income produced from, changes in fair values in, and gains and losses on OREOs is also included in noninterest expense. During the time the property is held, all related operating and maintenance costs are expensed as incurred.
66
Goodwill resulting from business combinations prior to January 1, 2009 represents the excess of the purchase price over the estimated fair value of the net assets acquired. Goodwill and intangible assets acquired in a business combination and determined to have an indefinite useful life are not amortized, but instead reviewed for impairment when there is evidence to suggest that the estimated fair value of the net assets is lower than the carrying value, or at a minimum of once a year. Intangible assets with definite useful lives are amortized over their estimated useful lives to their estimated residual values. Goodwill was the only intangible asset with an indefinite life on our balance sheet. Other intangible assets consisted of core deposit and acquired customer relationship intangible assets arising from the Company’s acquisition of the Citizens Bank and Trust Company of Louisville, Mississippi. These assets are initially measured at fair value and then are amortized on an accelerated method over their estimated useful lives, which were determined to be 15 years.
The Company recognizes stock compensation expenses in accordance with FASB ASC Topic 718, Compensation-Stock Compensation. Generally, all options granted to employees and directors fully vest six months and one day after the date of grant, rather than vesting in tranches over a specified period. Given the limited historical amount of forfeited options, the Company has not reduced compensation expense for estimated forfeitures. The Company utilizes the Black-Scholes valuation model to determine the fair value of stock options. The Black-Scholes model requires the use of certain assumptions, including the volatility of the Company’s stock price, the expected life of the option, the expected dividend rate and the discount rate. The Company does not currently expect to change the model or its methods for determining the assumptions underlying the valuation of future stock option grants. For more information on the Company’s stock options and the assumptions used to calculate the expense of such options, please refer to Note 1, “Summary of Significant Accounting Policies,” and Note 18, “Stock Options” to the Company’s Consolidated Financial Statements included in this Annual Report.
The Company uses the asset and liability method, which recognizes the future tax consequences attributable to an event or a liability or asset that has been recognized in the consolidated financial statements. Due to tax regulations, several items of income and expense are recognized in different periods for tax return purposes than for financial reporting purposes. These items represent “temporary differences.” Deferred tax assets and liabilities are the expected future tax amounts for the temporary differences between carrying amounts and tax bases of assets and liabilities, computed using enacted tax rates. Deferred tax assets represent future deductions in the Company’s income tax return, while deferred tax liabilities represent future payments to tax authorities. Income tax expense is the total of the current year income tax due or refundable and the change in deferred tax assets and liabilities. A valuation allowance, if needed, reduces deferred tax assets to the amount expected to be realized.
67
A tax position is recognized as a benefit only if it is “more likely than not” that the tax position would be sustained in a tax examination, with a tax examination being presumed to occur. The amount recognized is the largest amount of tax benefit that is greater than 50% likely of being realized on examination. For tax positions not meeting the “more likely than not” test, no tax benefit is recorded. The Company recognizes interest and/or penalties related to income tax matters in income tax expense.
Please refer to Note 1, “Summary of Significant Accounting Policies,” to the Consolidated Financial Statements of the Company included in this Annual Report for a detailed discussion of our other significant accounting policies affecting the Company.
68
DISCLOSURE REGARDING FORWARD-LOOKING STATEMENTS
In addition to historical information, this Annual Report contains statements which constitute forward-looking statements and information that are based on management’s beliefs, plans, expectations, assumptions and on information currently available to management. The words “may,” “should,” “expect,” “anticipate,” “intend,” “plan,” “continue,” “believe,” “seek,” “estimate,” and similar expressions used in this report that do not relate to historical facts are intended to identify forward-looking statements. The Company notes that a variety of factors could cause its actual results or experience to differ materially from the anticipated results or other expectations described or implied by such forward-looking statements. The risks and uncertainties that may affect the operation, performance, development and results of the business of the Company and the Bank, include, but are not limited to, the following:
| • | expectations about the movement of interest rates, including actions that may be taken by the Federal Reserve Board in response to changing economic conditions; |
| • | the risk of adverse changes in business conditions in the banking industry generally and in the specific markets in which the Company operates; |
| • | changes in the legislative and regulatory environment that negatively impact the Company and the Bank through increased operating expenses; |
| • | increased competition from other financial institutions; |
| • | the impact of technological advances; |
| • | changes in asset quality and loan demand; |
| • | expectations about overall economic strength and the performance of the economy in the Company’s market area; and |
| • | other risks detailed from time to time in the Company’s filings with the Securities and Exchange Commission. |
The Company undertakes no obligation to update or revise any forward-looking statements subsequent to the date on which they are made.
SELECTED FINANCIAL DATA
The following selected financial data has been taken from the Company’s Consolidated Financial Statements and related notes included in this Annual Report and should be read in conjunction with such consolidated financial statements and related notes. Dollar references in all of the following tables are in thousands except for per share data.
The major components of the Company’s operating results for the past five years are summarized in Table 1 - Five Year Financial Summary of Consolidated Statements and Related Statistics.
69
TABLE 1 - FIVE YEAR SUMMARY OF CONSOLIDATED STATEMENTS AND RELATED
STATISTICS (in thousands, except per share and ratio amounts)
| 2014 | 2013 | 2012 | 2011 | 2010 | ||||||||||||||||
| Summary of Earnings |
||||||||||||||||||||
| Total Interest Income |
$ | 31,380 | $ | 32,116 | $ | 34,388 | $ | 36,974 | $ | 38,138 | ||||||||||
| Total Interest Expense |
3,018 | 4,080 | 5,709 | 6,642 | 8,726 | |||||||||||||||
| Provision for loan losses |
923 | 2,204 | 1,546 | 2,995 | 2,456 | |||||||||||||||
| Non-interest income |
8,163 | 7,816 | 7,402 | 7,442 | 7,409 | |||||||||||||||
| Non-interest expense |
26,324 | 24,728 | 26,100 | 26,244 | 25,120 | |||||||||||||||
| Income tax expense |
1,828 | 1,770 | 1,651 | 1,317 | 2,082 | |||||||||||||||
| Net Income |
7,450 | 7,150 | 6,784 | 7,218 | 7,163 | |||||||||||||||
| Per Share Data |
||||||||||||||||||||
| Earnings-basic |
$ | 1.53 | $ | 1.47 | $ | 1.40 | $ | 1.49 | $ | 1.48 | ||||||||||
| Earnings-diluted |
1.53 | 1.47 | 1.39 | 1.49 | 1.48 | |||||||||||||||
| Cash dividends |
0.89 | 0.88 | 0.88 | 0.88 | 0.85 | |||||||||||||||
| Book value at year end |
16.78 | 13.61 | 18.28 | 17.77 | 15.77 | |||||||||||||||
| Selected Year End Actual Balances |
||||||||||||||||||||
| Loans, net of unearned income |
$ | 390,960 | $ | 392,183 | $ | 368,891 | $ | 389,262 | $ | 421,876 | ||||||||||
| Allowance for loan losses |
6,542 | 8,077 | 6,954 | 6,681 | 6,379 | |||||||||||||||
| Investment Securities |
386,562 | 398,176 | 420,908 | 374,508 | 324,730 | |||||||||||||||
| Earning assets |
833,845 | 785,592 | 802,220 | 760,744 | 741,383 | |||||||||||||||
| Total assets |
921,061 | 873,069 | 880,840 | 853,945 | 818,233 | |||||||||||||||
| Deposits |
696,094 | 654,630 | 642,549 | 572,338 | 537,430 | |||||||||||||||
| Long term borrowings |
20,000 | 33,626 | 68,674 | 68,677 | 84,760 | |||||||||||||||
| Shareholders’ equity |
81,858 | 66,266 | 88,869 | 86,079 | 76,295 | |||||||||||||||
| Selected Year End Average Balances |
||||||||||||||||||||
| Loans, net of unearned income |
$ | 389,720 | $ | 371,200 | $ | 381,597 | $ | 407,748 | $ | 437,563 | ||||||||||
| Allowance for loan losses |
7,902 | 7,078 | 7,056 | 6,594 | 5,939 | |||||||||||||||
| Investment securities |
396,806 | 419,461 | 360,721 | 325,179 | 302,571 | |||||||||||||||
| Earning assets |
798,432 | 801,549 | 766,663 | 753,042 | 762,993 | |||||||||||||||
| Total assets |
884,688 | 882,285 | 842,456 | 829,177 | 839,212 | |||||||||||||||
| Deposits |
682,444 | 650,931 | 592,723 | 543,711 | 556,798 | |||||||||||||||
| Long term borrowings |
35,593 | 58,192 | 72,553 | 82,576 | 86,378 | |||||||||||||||
| Shareholders’ equity |
73,219 | 79,458 | 87,972 | 82,254 | 78,776 | |||||||||||||||
70
| 2014 | 2012 | 2011 | 2010 | 2009 | ||||||||||||||||
| Selected Ratios |
||||||||||||||||||||
| Return on average assets |
0.84 | % | 0.81 | % | 0.81 | % | 0.87 | % | 0.85 | % | ||||||||||
| Return on average equity |
10.17 | % | 9.00 | % | 7.71 | % | 8.78 | % | 9.09 | % | ||||||||||
| Dividend payout ratio |
58.17 | % | 59.86 | % | 62.86 | % | 59.06 | % | 57.43 | % | ||||||||||
| Equity to year end assets |
8.89 | % | 7.59 | % | 10.09 | % | 10.08 | % | 9.32 | % | ||||||||||
| Total risk-based capital to risk-adjusted assets |
17.84 | % | 17.49 | % | 18.22 | % | 17.53 | % | 16.37 | % | ||||||||||
| Leverage capital ratio |
9.60 | % | 9.63 | % | 9.58 | % | 9.47 | % | 9.01 | % | ||||||||||
| Efficiency ratio |
70.09 | % | 67.52 | % | 70.73 | % | 68.51 | % | 65.52 | % | ||||||||||
NET OPERATING INCOME
Net operating income for 2014 increased by 4.2% to $7,449,759 or $1.53 per share-basic and -diluted, from $7,149,860, or $1.47 per share-basic and -diluted for 2013. The provision for loan losses for 2014 was $923,397 compared to the provision of $2,204,366 in 2013. The decrease in the loan loss provision for 2014 was mainly due to management’s assessment of inherent losses in the loan portfolio, including the impact caused by current local and national economic conditions. Non-interest income increased by $346,402, or 4.4%, and non-interest expense increased by $1,596,101 or 6.5%, in 2014. Non-interest income for 2014 increased primarily due to an increase in service fees on deposit accounts and other service charges and the receipt of insurance proceeds that was the result of the death of a bank officer that was insured with bank owned life insurance. Non-interest expense increased due to increased writedowns on other real estate, an increase in regulatory and compliance costs, an increase in banking equipment related service costs and an increase in office supplies.
Net operating income for 2013 increased by 6.0% to $7,149,860 or $1.47 per share-basic and -diluted, from $6,783,999, or $1.40 per share-basic and $1.39 per share-diluted for 2012. The provision for loan losses for 2013 was $2,204,366 compared to the provision of $1,545,797 in 2012. The increase in the loan loss provision for 2013 was mainly due to management’s assessment of inherent losses in the loan portfolio including the impact caused by current local and national economic conditions. Non-interest income increased by $414,323, or 5.6%, and non-interest expense decreased by $1,372,356 or 5.3%, in 2013. Non-interest income for 2013 increased primarily due to an increase in service fees on deposit accounts and other service charges. Non-interest expense decreased due to a decrease in salaries and benefits and a decrease in regulatory costs. The decrease in salaries and benefits is related to a reduction in the number of employees and the reduction in 401-k matching for our officers and employees.
Net operating income for 2012 decreased by 6.0% to $6,783,999, or $1.40 per share-basic and $1.39 per share-diluted, from $7,217,847, or $1.49 per share basic and diluted for 2011. The provision for loan losses for 2012 was $1,545,797 compared to the provision of $2,995,426 in 2011. The decrease in the loan loss provision for 2012 was mainly due to management’s assessment of inherent losses in the loan portfolio including the impact caused by current local and national economic conditions. Non-interest income decreased by $40,600, or 0.5%, and non-interest expense decreased by $143,653 or 0.5%, in 2012. Non-interest income for 2012
71
decreased primarily due to a reduction in the gains from sales of securities. Non-interest expense decreased due to a decrease in salaries and benefits. The decrease in salaries and benefits is related to a reduction in the number of employees and the freezing of salaries for our existing officers and employees.
NET INTEREST INCOME
Net interest income is the most significant component of the Company’s earnings. Net interest income is the difference between interest and fees realized on earning assets, primarily loans and securities, and interest paid on deposits and other borrowed funds. The net interest margin is this difference expressed as a percentage of average earning assets. Net interest income is affected by several factors, including the volume of earning assets and liabilities, the mix of earning assets and liabilities, and interest rates. The discussion below is presented on a tax equivalent basis which management believes to be the best way to analyze net interest income.
Net interest income on a tax equivalent basis was $29,411,000, $29,195,000 and $30,719,000 for the years 2014, 2013 and 2012, respectively. Net interest margin was 3.60%, 3.58% and 3.79% for the same periods. During 2014, the yields on interest earning assets declined slightly less than the rates paid on interest bearing deposits with the largest decrease occurring in the rates paid on certificates of deposit. In 2014, interest-bearing assets increased by $1.8 million, or 0.2% and interest bearing liabilities declined by $6.1 million, or 0.9%. For the year ended December 31, 2014, the average yield on earnings assets was 3.96%, a decrease of 12 basis points compared to the average yield at December 31, 2013. The average rate paid on interest-bearing liabilities was 0.45%, a decrease of 15 basis points compared to the average rate at December 31, 2013.
For the year ended December 31, 2013, the average yield on earnings assets was 4.08%, a decrease of 58 basis points compared to the average yield at December 31, 2012. The average rate paid on interest-bearing liabilities was 0.60%, a decrease of 28 basis points compared to the average rate at December 31, 2012. The volume of earning assets increased 6.9% while the volume of interest-bearing liabilities increased 5.2% in 2013.
For the year ended December 31, 2012, the average yield on earnings assets was 4.66%, a decrease of 42 basis points compared to the average yield at December 31, 2011. The average rate paid on interest-bearing liabilities was 0.88%, a decrease of 15 basis points compared to the average rate at December 31, 2011. The volume of earning assets increased 1.4% while the volume of interest-bearing liabilities decreased 0.2% in 2012.
During this three-year period, loan demand was weak in 2012 before improving in 2013 and 2014. Loans generally provide the Company with yields that are greater than the yields on typical investment securities.
During 2003, the Company purchased $11.4 million of additional bank-owned life insurance. The income received by the Company on these policies increased the Company’s total investment to approximately $21.2 million at December 31, 2012, $22.2 million at
72
December 31, 2013 and $22.3 million at December 31, 2014. In 2014, the increase in cash surrender value was reduced by the receipt of insurance proceeds that resulted from the death of an insured bank officer. The additional purchases were made to provide a future funding source for certain of the Company’s deferred compensation arrangements. Such insurance also offers more attractive yields than other investment securities.
Table 2 – Average Balance Sheets and Interest Rates sets forth average balance sheet data, including all major categories of interest-earning assets and interest-bearing liabilities, together with the interest earned or interest paid and the average yield or average rate paid on each such category for the fiscal years ended December 31, 2014, 2013 and 2012.
73
TABLE 2 – AVERAGE BALANCE SHEETS AND INTEREST RATES
(in thousands)
| Average Balance | Income/Expense | Average Yield/Rate | ||||||||||||||||||||||||||||||||||
| 2014 | 2013 | 2012 | 2014 | 2013 | 2012 | 2014 | 2013 | 2012 | ||||||||||||||||||||||||||||
| Loans: |
||||||||||||||||||||||||||||||||||||
| Loans, net of unearned(1) |
$ | 389,217 | $ | 370,769 | $ | 381,234 | $ | 20,082 | $ | 20,611 | $ | 23,245 | 5.16 | % | 5.56 | % | 6.08 | % | ||||||||||||||||||
| Investment Securities |
||||||||||||||||||||||||||||||||||||
| Taxable |
318,850 | 328,797 | 257,073 | 8,227 | 7,949 | 7,327 | 2.58 | % | 2.42 | % | 2.85 | % | ||||||||||||||||||||||||
| Tax-exempt |
91,933 | 101,543 | 103,648 | 4,071 | 4,697 | 5,030 | 4.43 | % | 4.63 | % | 4.85 | % | ||||||||||||||||||||||||
|
|
|
|
|
|
|
|
|
|
|
|
|
|
|
|
|
|
|
|||||||||||||||||||
| Total Investment Securities |
410,783 | 430,340 | 360,721 | 12,298 | 12,646 | 12,357 | 2.99 | % | 2.94 | % | 3.43 | % | ||||||||||||||||||||||||
| Federal Funds Sold and Other |
17,806 | 14,882 | 21,086 | 49 | 52 | 65 | 0.23 | % | 0.35 | % | 0.31 | % | ||||||||||||||||||||||||
|
|
|
|
|
|
|
|
|
|
|
|
|
|
|
|
|
|
|
|||||||||||||||||||
| Total Interest Earning Assets(1)(2) |
817,806 | 815,991 | 763,041 | 32,429 | 33,309 | 35,667 | 3.96 | % | 4.08 | % | 4.66 | % | ||||||||||||||||||||||||
|
|
|
|
|
|
|
|
|
|
|
|
|
|
|
|
|
|
|
|||||||||||||||||||
| Non-Earning Assets |
66,882 | 66,294 | 79,415 | |||||||||||||||||||||||||||||||||
|
|
|
|
|
|
|
|||||||||||||||||||||||||||||||
| Total Assets |
$ | 884,688 | $ | 882,285 | $ | 842,456 | ||||||||||||||||||||||||||||||
|
|
|
|
|
|
|
|||||||||||||||||||||||||||||||
| Deposits: |
||||||||||||||||||||||||||||||||||||
| Interest-bearing Demand |
||||||||||||||||||||||||||||||||||||
| Deposits(3) |
$ | 262,142 | $ | 240,524 | $ | 191,930 | $ | 550 | $ | 561 | $ | 739 | 0.21 | % | 0.23 | % | 0.39 | % | ||||||||||||||||||
| Savings |
58,053 | 50,846 | 44,777 | 100 | 111 | 90 | 0.12 | % | 0.22 | % | 0.20 | % | ||||||||||||||||||||||||
| Time |
227,390 | 239,104 | 248,886 | 1,105 | 1,307 | 1,839 | 0.49 | % | 0.55 | % | 0.74 | % | ||||||||||||||||||||||||
|
|
|
|
|
|
|
|
|
|
|
|
|
|
|
|
|
|
|
|||||||||||||||||||
| Total Deposits |
547,585 | 530,474 | 485,593 | 1,755 | 1,979 | 2,668 | 0.32 | % | 0.37 | % | 0.55 | % | ||||||||||||||||||||||||
| Borrowed Funds |
||||||||||||||||||||||||||||||||||||
| Short-term Borrowings |
84,813 | 85,804 | 79,002 | 573 | 666 | 754 | 0.68 | % | 0.78 | % | 0.95 | % | ||||||||||||||||||||||||
| Long-term Borrowings |
35,593 | 58,048 | 75,256 | 690 | 1,469 | 2,244 | 1.91 | % | 2.53 | % | 2.98 | % | ||||||||||||||||||||||||
|
|
|
|
|
|
|
|
|
|
|
|
|
|
|
|
|
|
|
|||||||||||||||||||
| Total Borrowed Funds |
120,406 | 143,852 | 154,258 | 1,263 | 2,135 | 2,998 | 1.05 | % | 1.48 | % | 1.94 | % | ||||||||||||||||||||||||
|
|
|
|
|
|
|
|
|
|
|
|
|
|
|
|
|
|
|
|||||||||||||||||||
| Total Interest-Bearing |
||||||||||||||||||||||||||||||||||||
| Liabilities(3) |
667,991 | 674,326 | 639,851 | 3,018 | 4,114 | 5,666 | 0.45 | % | 0.61 | % | 0.89 | % | ||||||||||||||||||||||||
| Non-Interest Bearing Liabilities |
||||||||||||||||||||||||||||||||||||
| Demand Deposits |
134,859 | 120,457 | 107,130 | |||||||||||||||||||||||||||||||||
| Other Liabilities |
8,619 | 8,044 | 7,503 | |||||||||||||||||||||||||||||||||
| Shareholders’ Equity |
73,219 | 79,458 | 87,972 | |||||||||||||||||||||||||||||||||
|
|
|
|
|
|
|
|||||||||||||||||||||||||||||||
| Total Liabilities and Shareholders’ Equity |
$ | 884,688 | $ | 882,285 | $ | 842,456 | ||||||||||||||||||||||||||||||
|
|
|
|
|
|
|
|||||||||||||||||||||||||||||||
| Interest Rate Spread |
3.51 | % | 3.47 | % | 3.77 | % | ||||||||||||||||||||||||||||||
|
|
|
|
|
|
|
|||||||||||||||||||||||||||||||
| Net Interest Margin |
$ | 29,411 | $ | 29,195 | $ | 30,719 | 3.60 | % | 3.58 | % | 3.79 | % | ||||||||||||||||||||||||
|
|
|
|
|
|
|
|
|
|
|
|
|
|||||||||||||||||||||||||
| Less |
||||||||||||||||||||||||||||||||||||
| Tax Equivalent Adjustment |
1,048 | 1,193 | 1,278 | |||||||||||||||||||||||||||||||||
|
|
|
|
|
|
|
|||||||||||||||||||||||||||||||
| Net Interest Income |
$ | 28,363 | $ | 28,002 | $ | 30,317 | ||||||||||||||||||||||||||||||
|
|
|
|
|
|
|
|||||||||||||||||||||||||||||||
74
| (1) | Overdrafts on demand deposit accounts are not included in the average volume calculation as they are not considered interest earning assets by the Company. They are included in the “Non-Earning Assets” balance above. |
| (2) | Earning Assets in Table 2 does not include the dividend paying stock of the Federal Home Loan Bank. |
| (3) | Demand deposits are not included in the average volume calculation as they are not interest bearing liabilities. They are included within the non-interest bearing liabilities section above. |
Table 3 – Net Average Interest Earning Assets illustrates net interest earning assets and liabilities for 2014, 2013, and 2012.
TABLE 3 – NET AVERAGE INTEREST EARNING ASSETS
| (in thousands) | ||||||||||||
| 2014 | 2013 | 2012 | ||||||||||
| Average interest earning assets |
$ | 817,806 | $ | 815,991 | $ | 763,041 | ||||||
| Average interest bearing liabilities |
667,991 | 674,326 | 639,851 | |||||||||
|
|
|
|
|
|
|
|||||||
| Net average interest earning assets |
$ | 149,815 | $ | 141,665 | $ | 123,190 | ||||||
|
|
|
|
|
|
|
|||||||
75
Table 4 – Volume/Rate Analysis depicts the effect on interest income and interest expense of changes in volume and changes in rate from 2012 through 2014. Variances, which were attributable to both volume and rate, are allocated proportionately between rate and volume using the absolute values of each for a basis for the allocation. Non-accruing loans are included in the average loan balances used in determining the yields. Interest income on tax-exempt securities and loans has been adjusted to a tax equivalent basis using a federal income tax rate of 34%.
TABLE 4 – VOLUME/RATE ANALYSIS
(in thousands)
| 2014 Change from 2013 | 2013 Change from 2012 | |||||||||||||||||||||||
| Volume | Rate | Total | Volume | Rate | Total | |||||||||||||||||||
| INTEREST INCOME |
||||||||||||||||||||||||
| Loans |
$ | 952 | (1,481 | ) | $ | (529 | ) | $ | (582 | ) | $ | (2,053 | ) | $ | (2,635 | ) | ||||||||
| Taxable Securities |
(257 | ) | 535 | 278 | 1,734 | (1,111 | ) | 623 | ||||||||||||||||
| Non-Taxable Securities |
(426 | ) | (200 | ) | (626 | ) | (97 | ) | (235 | ) | (332 | ) | ||||||||||||
| Federal Funds Sold and Other |
7 | (10 | ) | (3 | ) | (17 | ) | 6 | (11 | ) | ||||||||||||||
|
|
|
|
|
|
|
|
|
|
|
|
|
|||||||||||||
| TOTAL INTEREST INCOME |
$ | 276 | $ | (1,156 | ) | $ | (880 | ) | $ | 1,038 | $ | (3,393 | ) | $ | (2,355 | ) | ||||||||
|
|
|
|
|
|
|
|
|
|
|
|
|
|||||||||||||
| INTEREST EXPENSE |
||||||||||||||||||||||||
| Interest-bearing demand deposits |
$ | 45 | (56 | ) | (11 | ) | $ | 106 | $ | (318 | ) | (212 | ) | |||||||||||
| Savings Deposits |
9 | (20 | ) | (11 | ) | 8 | (31 | ) | (23 | ) | ||||||||||||||
| Time Deposits |
(57 | ) | (145 | ) | (202 | ) | (53 | ) | (478 | ) | (531 | ) | ||||||||||||
| Short-term borrowings |
(7 | ) | (86 | ) | (93 | ) | 53 | (141 | ) | (88 | ) | |||||||||||||
| Long-term borrowings |
(429 | ) | (350 | ) | (779 | ) | (435 | ) | (340 | ) | (775 | ) | ||||||||||||
|
|
|
|
|
|
|
|
|
|
|
|
|
|||||||||||||
| TOTAL INTEREST EXPENSE |
$ | (439 | ) | $ | (657 | ) | (1,096 | ) | $ | (321 | ) | $ | (1,308 | ) | (1,629 | ) | ||||||||
|
|
|
|
|
|
|
|
|
|
|
|
|
|||||||||||||
| NET INTEREST INCOME |
$ | 715 | $ | (499 | ) | $ | 216 | $ | 1,359 | $ | (2,085 | ) | $ | (726 | ) | |||||||||
|
|
|
|
|
|
|
|
|
|
|
|
|
|||||||||||||
76
LOANS
The loan portfolio constitutes the major earning asset of the Company and, in the opinion of management, offers the best alternative for maximizing net interest margin. The Company’s loan personnel have the authority to extend credit under guidelines established and approved by the Board of Directors. Any aggregate credit that exceeds the authority of the loan officer is forwarded to the Board’s loan committee for approval. The loan committee is composed of certain directors, including the Chairman of the Board of Directors. All aggregate loans that exceed the loan committee’s lending authority are presented to the full Board of Directors for ultimate approval or denial. The loan committee not only acts as an approval body to ensure consistent application of the Company’s loan policy but also provides valuable insight through communication and pooling of knowledge, judgment, and experience of its members.
The Company has stated in its loan policy the following objectives for its loan portfolio:
| • | to make loans after sound and thorough credit analysis; |
| • | to properly document all loans; |
| • | to eliminate loans from the portfolio that are under-priced, high risk or difficult and costly to administer; |
| • | to seek good relationships with the customer; |
| • | to avoid undue concentrations of loans; and |
| • | to keep non-accrual loans to a minimum by aggressive collection policies. |
Loan demand in the Company’s market improved in 2013 and 2014 after declining in 2012 due to economic conditions. Although the Company continues to face intense competition for available loans from other financial institutions and the current economic conditions have improved slightly, the Company was able in 2014 to increase the amount of loans outstanding. The impact on the housing market caused by the opening of a casino on the nearby Choctaw Indian Reservation in 1995 has lessened. Real estate mortgage loans originated by the Company decreased by 1.3%, or $1,319,331 in 2014, by 8.9%, or $10,347,060, in 2013 and by 13.6%, or $18,150,577, in 2012 when compared to the prior year. The decrease in mortgage loans in all years reflects the weakness in the local housing markets after seeing normal growth in the previous years.
Commercial and agricultural loans decreased by $15,586,507, or 6.7% in 2014, increased by $22,476,553 or 10.6% in 2013 and increased by $6,229,238, or 3.0% in 2012. Commercial, financial and agricultural loans are the largest segment of the loan portfolio and, by nature, bear a higher degree of risk. Management believes the lending practices, policies and procedures applicable to this loan category are adequate to manage any risk represented by the growth of the loans in this category.
77
Consumer loans declined by $1,316,141, or 4.7% in 2014, $1,560,119, or 5.3% in 2013 and $7,681,230, or 21.1% in 2012, compared to the prior year. The Company believes that changes in consumer purchasing habits and the increase in loan sources have affected the growth of this segment of loans.
Table 5 – Loans Outstanding reflects outstanding balances by loan type for the past five years. Additional loan information is presented in Note 5, “Loans,” to the Company’s Consolidated Financial Statements included in this Annual Report.
TABLE 5 – LOANS OUTSTANDING
(in thousands)
| AT DECEMBER 31, | ||||||||||||||||||||
| 2014 | 2013 | 2012 | 2011 | 2010 | ||||||||||||||||
| Commercial, financial and agricultural |
$ | 217,577 | $ | 232,124 | $ | 211,155 | $ | 203,458 | $ | 217,143 | ||||||||||
| Real estate - construction |
43,233 | 27,224 | 12,755 | 13,481 | 21,838 | |||||||||||||||
| Real estate - mortgage |
104,170 | 105,489 | 115,837 | 133,987 | 143,627 | |||||||||||||||
| Consumer |
26,515 | 27,831 | 29,391 | 38,540 | 39,491 | |||||||||||||||
|
|
|
|
|
|
|
|
|
|
|
|||||||||||
| TOTAL LOANS |
$ | 391,495 | $ | 392,668 | $ | 369,138 | $ | 389,466 | $ | 422,099 | ||||||||||
|
|
|
|
|
|
|
|
|
|
|
|||||||||||
Table 6 – Loan Liquidity and Sensitivity to Changes in Interest Rates reflects the maturity schedule or repricing frequency of all loans. Also presented are fixed and variable rate loans maturing after one year.
TABLE 6 – LOAN LIQUIDITY
LOAN MATURITIES AT DECEMBER 31, 2013
| 1 YEAR OR LESS |
1 - 5 YEARS |
OVER 5 YEARS |
Total | |||||||||||||
| Commercial, financial and agricultural |
$ | 24,850 | $ | 185,466 | $ | 7,261 | $ | 217,577 | ||||||||
| Real estate - construction |
14,068 | 15,476 | 13,689 | $ | 43,233 | |||||||||||
| Real estate - mortgage |
20,519 | 65,825 | 17,826 | $ | 104,170 | |||||||||||
| Consumer |
12,824 | 13,134 | 557 | $ | 26,515 | |||||||||||
|
|
|
|
|
|
|
|
|
|||||||||
| Total loans |
$ | 72,261 | $ | 279,901 | $ | 39,333 | $ | 391,495 | ||||||||
|
|
|
|
|
|
|
|
|
|||||||||
78
SENSITIVITY TO CHANGES IN INTEREST RATES
| 1 - 5 YEARS |
OVER 5 YEARS |
|||||||
| Fixed rates |
$ | 262,723 | $ | 26,399 | ||||
| Variable rates |
17,178 | 12,934 | ||||||
|
|
|
|
|
|||||
| Total loans |
$ | 279,901 | $ | 39,333 | ||||
|
|
|
|
|
|||||
Each loan the Company makes either has a stated maturity as to when the loan is to be repaid or is subject to an agreement between the Company and the customer governing its progressive reduction. The Company’s policy is that every loan is to be repaid by its stated maturity and not carried as a continuing debt. Generally, the Company requires that principal reductions on a loan must have begun prior to the second renewal date of the loan.
PROVISION FOR LOAN LOSSES AND ASSET QUALITY
The allowance for loan losses represents an amount that in management’s judgment will be adequate to absorb estimated probable losses within the existing loan portfolio. Loans that management determines to be uncollectible are charged against the allowance for loan losses, and subsequent recoveries, if any, are credited to the allowance. Management’s judgment in determining the adequacy of the allowance is based on evaluations of the collectability of specific loans and prior loss experience. Other factors considered by management include specific economic events, general economic conditions and trends, and loan portfolio mix and growth. The allowance for loan losses is subject to close regulatory review from the FDIC and the Mississippi Department of Banking and Consumer Finance and is also a factor in each agency’s determination of our capital adequacy. The estimation of losses in our loan portfolio is susceptible to changes resulting from changes in the financial condition of individual borrowers and economic conditions in the Company’s market area.
The allowance for loan losses is established through a provision for loan losses charged against net income. This expense is determined by a number of factors, including historical loan losses, assessment of specific credit weaknesses within the portfolio, assessment of the prevailing economic climate, and other factors that may affect the overall condition of the loan portfolio. Management utilized these factors to determine the provision for loan losses for each of 2012, 2013 and 2014. The ratio of net loans charged off to average loans was 0.63% in 2014, 0.29% in 2013 and 0.33% in 2012. The chargeoffs in 2012, 2013 and 2014 reflect the weakness of the economy and the continuing local and national high unemployment. Management evaluates the adequacy of the allowance for loan loss on a monthly basis and makes adjustments to the allowance based on this analysis.
The provision for loan losses in 2014 was $923,397 compared to $2,204,366 in 2013 and $1,545,797 in 2012. The decrease in the provision for 2014 was mainly due to management’s assessment of incurred losses in the loan portfolio, including the impact caused by current local and national economic conditions. The Company uses a model that takes into account historical charge-offs and recoveries and applies that to certain loan segments of our portfolio. At the end of 2014, the total allowance for loan losses was $6,542,326, an amount that management believes to be sufficient to cover estimated probable losses in the loan portfolio.
79
Activity in the allowance for loan losses is reflected in Table 7 – Analysis of Allowance for Loan Losses. The Company’s policy is to charge-off loans when in management’s opinion the loan is deemed uncollectible. Even after it is charged off, however, the Company makes concerted efforts to maximize recovery of such loan.
TABLE 7 – ANALYSIS OF ALLOWANCE FOR LOAN LOSSES
(in thousands except for percentage amounts)
| 2014 | 2013 | 2012 | 2011 | 2010 | ||||||||||||||||
| BALANCE AT BEGINNING OF YEAR |
$ | 8,078 | $ | 6,954 | $ | 6,681 | $ | 6,379 | $ | 5,526 | ||||||||||
| LOANS CHARGED-OFF |
||||||||||||||||||||
| Commercial, financial and agricultural |
2,213 | 915 | 920 | 1,523 | 593 | |||||||||||||||
| Real estate - construction |
249 | 1 | 99 | 67 | 176 | |||||||||||||||
| Real estate - mortgage |
149 | 223 | 250 | 922 | 636 | |||||||||||||||
| Consumer |
121 | 135 | 235 | 306 | 410 | |||||||||||||||
|
|
|
|
|
|
|
|
|
|
|
|||||||||||
| TOTAL CHARGE-OFFS |
2,732 | 1,274 | 1,504 | 2,818 | 1,815 | |||||||||||||||
|
|
|
|
|
|
|
|
|
|
|
|||||||||||
| CHARGE-OFFS RECOVERED |
||||||||||||||||||||
| Commercial, financial and agricultural |
79 | 38 | 69 | 21 | 108 | |||||||||||||||
| Real estate - construction |
7 | 16 | 11 | 6 | — | |||||||||||||||
| Real estate - mortgage |
126 | 71 | 29 | 11 | 12 | |||||||||||||||
| Consumer |
61 | 69 | 122 | 87 | 92 | |||||||||||||||
|
|
|
|
|
|
|
|
|
|
|
|||||||||||
| TOTAL RECOVERIES |
273 | 194 | 231 | 125 | 212 | |||||||||||||||
|
|
|
|
|
|
|
|
|
|
|
|||||||||||
| Net loans charged-off |
2,459 | 1,080 | 1,273 | 2,693 | 1,603 | |||||||||||||||
| Additions charged to operating expense |
923 | 2,204 | 1,546 | 2,995 | 2,456 | |||||||||||||||
|
|
|
|
|
|
|
|
|
|
|
|||||||||||
| BALANCE AT END OF YEAR |
$ | 6,542 | $ | 8,078 | $ | 6,954 | $ | 6,681 | $ | 6,379 | ||||||||||
|
|
|
|
|
|
|
|
|
|
|
|||||||||||
| Loans, net of unearned, at year end |
$ | 390,960 | $ | 392,183 | $ | 368,891 | $ | 389,262 | $ | 421,876 | ||||||||||
| Ratio of allowance to loans at year end |
1.67 | % | 2.06 | % | 1.89 | % | 1.72 | % | 1.51 | % | ||||||||||
| Average loans - net of unearned |
$ | 389,720 | $ | 371,200 | $ | 381,597 | $ | 407,748 | $ | 437,563 | ||||||||||
| Ratio of net loans charged-off to average loans |
0.63 | % | 0.29 | % | 0.33 | % | 0.66 | % | 0.37 | % | ||||||||||
80
ALLOCATION OF ALLOWANCE FOR LOAN LOSSES
(in thousands)
| AT DECEMBER 31, | ||||||||||||||||||||
| 2014 | 2013 | 2012 | 2011 | 2010 | ||||||||||||||||
| Commercial, financial and agricultural |
$ | 4,352 | $ | 5,565 | $ | 3,965 | $ | 3,453 | $ | 3,047 | ||||||||||
| Real estate - construction |
806 | 495 | 351 | 285 | 434 | |||||||||||||||
| Real estate - mortgage |
918 | 1,413 | 1,868 | 2,111 | 1,930 | |||||||||||||||
| Consumer |
466 | 604 | 770 | 832 | 968 | |||||||||||||||
|
|
|
|
|
|
|
|
|
|
|
|||||||||||
| Total |
$ | 6,542 | $ | 8,077 | $ | 6,954 | $ | 6,681 | $ | 6,379 | ||||||||||
|
|
|
|
|
|
|
|
|
|
|
|||||||||||
COMPOSITION OF LOAN PORTFOLIO BY TYPE
| AT DECEMBER 31, | ||||||||||||||||||||
| 2014 | 2013 | 2012 | 2011 | 2010 | ||||||||||||||||
| Commercial, financial and agricultural |
55.58 | % | 59.11 | % | 57.20 | % | 52.24 | % | 51.44 | % | ||||||||||
| Real estate - construction |
11.04 | % | 6.93 | % | 3.46 | % | 3.46 | % | 5.17 | % | ||||||||||
| Real estate - mortgage |
26.61 | % | 26.86 | % | 31.38 | % | 34.40 | % | 34.03 | % | ||||||||||
| Consumer |
6.77 | % | 7.09 | % | 7.96 | % | 9.90 | % | 9.36 | % | ||||||||||
|
|
|
|
|
|
|
|
|
|
|
|||||||||||
| 100.00 | % | 100.00 | % | 100.00 | % | 100.00 | % | 100.00 | % | |||||||||||
|
|
|
|
|
|
|
|
|
|
|
|||||||||||
Loan balances outstanding, as illustrated in Table 5, increased in 2013 even though the Company’s credit standards tightened, loan demand weakened and the competition for loans increased. In 2014, loans decreased due to increased competition for available loans and the Company maintained its tightened credit standards. The highest percentage increase in 2014 occurred in the construction real estate category, primarily due to an increase in the demand in this market. The allowance for loan losses is allocated to the various categories based on the historical loss percentage for each segment of loan and any specific reserves that might be assigned to those loans.
Non-performing assets and the relative percentages of such assets to loan balances are presented in Table 8 – Non-performing Assets. Non-performing loans include non-accrual loans, loans delinquent 90 days or more based on contractual terms and troubled debt restructurings. Management classifies loans as non-accrual when it believes that collection of interest is doubtful. This typically occurs when payments are past due over 90 days, unless the loans are well secured and in the process of collection. Another measurement of asset quality is OREO, which represents properties acquired by the Company through foreclosure following loan defaults by customers. The percentage of OREO to total loans at December 31, 2014 was 1.04% compared to 0.96% in 2013. OREO decreased in 2013 after increasing in 2012 due to a larger amount of foreclosures in 2011 and the sale of several parcels that were acquired in foreclosure and a write-down of several parcels to fair market value during 2012 and 2013.
Loans on non-accrual status amounted to $11,854,274 in 2014 as compared to $13,591,793 in 2013 and $14,141,887 in 2012. Interest income forgone on loans classified as non-accrual in 2014 was $819,524 as compared to $813,710 in 2013 and $770,509 in 2012. Upon the classification of a loan as non-accrual, all interest accrued on the loan prior to the time it is classified as non-accrual is reversed and interest accruals are suspended until such time that the loan is in compliance with its terms and deemed collectable.
81
TABLE 8 – NON-PERFORMING ASSETS
(in thousands, except percentages)
| As of December 31, | ||||||||||||||||||||
| 2014 | 2013 | 2012 | 2011 | 2010 | ||||||||||||||||
| PRINCIPAL BALANCE |
||||||||||||||||||||
| Non-accrual |
$ | 11,854 | $ | 13,592 | $ | 14,142 | $ | 11,299 | $ | 10,932 | ||||||||||
| Accruing loans 90 days or more past due |
880 | 2,095 | 609 | 269 | 1,023 | |||||||||||||||
| Troubled debt restructurings |
4,741 | 7,119 | 5,602 | 1,459 | — | |||||||||||||||
|
|
|
|
|
|
|
|
|
|
|
|||||||||||
| TOTAL NON-PERFORMING ASSETS |
$ | 17,475 | $ | 22,806 | $ | 20,353 | $ | 13,027 | $ | 11,955 | ||||||||||
|
|
|
|
|
|
|
|
|
|
|
|||||||||||
| Income on non-accrual loans not recorded |
$ | 820 | $ | 814 | $ | 771 | $ | 674 | $ | 615 | ||||||||||
| Non-performing as a percent of loans |
4.46 | % | 5.81 | % | 5.51 | % | 3.34 | % | 2.83 | % | ||||||||||
| Other real estate owned |
$ | 4,052 | $ | 3,751 | $ | 4,682 | $ | 4,869 | $ | 3,068 | ||||||||||
| OREO as a percent of loans |
1.04 | % | 0.96 | % | 1.27 | % | 1.25 | % | 0.73 | % | ||||||||||
| Allowance as a percent of non-performing loans |
37.44 | % | 35.42 | % | 34.17 | % | 51.29 | % | 53.35 | % | ||||||||||
ASC Subtopic 310-10, Loan Impairments outlines the guidance for evaluating impaired loans. These statements changed the methods of estimating the loan loss allowance for problem loans. In general, when management determines that principal and interest due under the contractual terms of a loan are not fully collectible, management must value the loan using discounted future expected cash flows. Management considers the Company’s nonaccrual loans as being impaired under ASC Subtopic 310-10. The balances of impaired (including non-accruals) loans for the years 2014, 2013 and 2012 were $13,079,337, $13,591,793 and $14,141,887, respectively.
82
This table details the impaired loans by category for years ending 2014, 2013 and 2012.
| AT DECEMBER 31, | ||||||||||||
| 2014 | 2013 | 2012 | ||||||||||
| Commercial, financial and agricultural |
$ | 10,312,674 | $ | 11,469,394 | $ | 11,431,714 | ||||||
| Real estate - construction |
91,540 | 136,271 | 141,917 | |||||||||
| Real estate - mortgage |
2,554,284 | 1,865,718 | 2,258,167 | |||||||||
| Consumer |
120,839 | 120,410 | 310,089 | |||||||||
|
|
|
|
|
|
|
|||||||
| Total loans |
$ | 13,079,337 | $ | 13,591,793 | $ | 14,141,887 | ||||||
|
|
|
|
|
|
|
|||||||
Management monitors any loans that are classified under FDIC regulations as loss, doubtful or substandard, even if management has not classified the loans as non-performing or impaired. In addition to loans classified for regulatory purposes, management also designates certain loans for internal monitoring purposes in a “watch” category. Loans may be placed on management’s watch list as a result of delinquent status, management’s concern about the borrower’s financial condition or the value of the collateral securing the loan, a substandard classification during regulatory examinations, or simply as a result of management’s desire to monitor more closely a borrower’s financial condition and performance. Watch category loans may include loans that are still performing and accruing interest and may be current under the terms of the loan agreement but which management has a significant degree of concern about the borrowers’ ability to continue to perform according to the terms of the loan agreement. Watch category loans may also include loans, which, although adequately secured and performing, reflect a past delinquency problem or unfavorable financial trends exhibited by the borrower. Loss exposure on these loans is typically evaluated based primarily upon the estimated liquidation value of the collateral securing the loan.
At December 31, 2014, loans totaling $31,921,730 were included on the Company’s watch list compared to $40,836,320 at December 31, 2013. The majority of these loans are real estate loans that, although adequately collateralized, have experienced frequent delinquencies in scheduled payments. The inclusion of loans on this list does not indicate a greater risk of loss; rather it indicates that the loan possesses one of the several characteristics described above warranting increased oversight by management.
SECURITIES
At December 31, 2014, the Company classified its securities as AFS or HTM. AFS securities are reported at fair value, with unrealized gains and losses included as a separate component of equity, net of tax. HTM Securities are reported at amortized book value. The Company does not hold any securities classified as held for trading purposes.
Table 9 – Securities and Securities Maturity Schedule summarizes the amortized cost of securities from 2012 through 2014 and the maturity distribution at December 31, 2014, by classification.
83
TABLE 9 – SECURITIES
(in thousands)
| 2014 | 2013 | 2012 | ||||||||||
| SECURITIES AVAILABLE FOR SALE |
||||||||||||
| U. S. Government Agencies |
$ | 77,997 | $ | 316,305 | $ | 269,194 | ||||||
| Mortgage Backed Securities |
12,502 | 16,476 | 36,386 | |||||||||
| State, County and Muncipal Obligations |
84,896 | 96,259 | 105,301 | |||||||||
| Other Securities |
2,997 | 3,026 | 3,093 | |||||||||
|
|
|
|
|
|
|
|||||||
| TOTAL SECURITIES AVAILABLE FOR SALE |
$ | 178,392 | $ | 432,066 | $ | 413,974 | ||||||
|
|
|
|
|
|
|
|||||||
| 2014 | 2013 | 2012 | ||||||||||
| SECURITIES HELD TO MATURITY |
||||||||||||
| U. S. Government Agencies |
$ | 206,817 | $ | — | $ | — | ||||||
|
|
|
|
|
|
|
|||||||
| TOTAL SECURITIES HELD TO MATURITY |
$ | 206,817 | $ | — | $ | — | ||||||
|
|
|
|
|
|
|
|||||||
SECURITIES MATURITY SCHEDULE
| 1 year or less | 1 to 5 years | 5 to 10 years | over 10 years | |||||||||||||||||||||||||||||
| Actual Balance |
Average Yield |
Actual Balance |
Average Yield |
Actual Balance |
Average Yield |
Actual Balance |
Average Yield |
|||||||||||||||||||||||||
| AVAILABLE-FOR-SALE |
||||||||||||||||||||||||||||||||
| U. S. Government Agencies(1) |
$ | — | 0.00 | % | $ | — | 0.00 | % | $ | 49,433 | 2.24 | % | $ | 28,564 | 2.79 | % | ||||||||||||||||
| Mortgage Backed Securities |
— | 0.00 | % | — | 0.00 | % | — | 0.00 | % | 12,502 | 3.91 | % | ||||||||||||||||||||
| State, County and Municipal(2) |
3,620 | 5.14 | % | 11,886 | 4.95 | % | 23,582 | 5.32 | % | 45,808 | 4.68 | % | ||||||||||||||||||||
| Other Securities |
— | 0.00 | % | — | 0.00 | % | — | 0.00 | % | 2,997 | 7.71 | % | ||||||||||||||||||||
|
|
|
|
|
|
|
|
|
|
|
|
|
|
|
|
|
|||||||||||||||||
| TOTAL AVAILABLE-FOR-SALE |
$ | 3,620 | 4.98 | % | $ | 11,886 | 4.76 | % | $ | 73,015 | 3.16 | % | $ | 89,871 | 2.94 | % | ||||||||||||||||
|
|
|
|
|
|
|
|
|
|
|
|
|
|
|
|
|
|||||||||||||||||
| HELD-TO-MATURITY |
||||||||||||||||||||||||||||||||
| U. S. Government Agencies(1) |
$ | — | 0.00 | % | $ | — | 0.00 | % | $ | 27,599 | 3.02 | % | $ | 179,218 | 3.76 | % | ||||||||||||||||
|
|
|
|
|
|
|
|
|
|
|
|
|
|
|
|
|
|||||||||||||||||
| TOTAL HELD-TO-MATURITY |
$ | — | 0.00 | % | $ | — | 0.00 | % | $ | 27,599 | 3.02 | % | $ | 179,218 | 3.76 | % | ||||||||||||||||
|
|
|
|
|
|
|
|
|
|
|
|
|
|
|
|
|
|||||||||||||||||
| (1) | The maturities for the mortgage backed securities included in this line item are based on final maturity. |
| (2) | Average yields were calculated on tax equivalent basis using a marginal federal income tax rate of 34% and a state tax rate of 5%. |
The change in the carrying value of the AFS portfolio is due to market value fluctuations resulting from the changing interest rate environment during 2014. This change is not used in the Tier 1 capital calculation.
The above table shows a decrease in the United States Government Agencies securities and a decrease in the Mortgage Backed Securities and State, County and Municipal classifications. The decrease was due to the Company’s effort to reduce other borrowings using
84
proceeds from calls and maturities rather than maintaining or increasing investment securities. The Company strives to maximize the yields on its portfolio while balancing pledging needs and managing risk. The Company seeks to invest most of it funds not needed for loan demand or the reduction of other borrowings in higher yielding securities and not in the lower yielding federal funds sold.
DEPOSITS
The Company offers a wide variety of deposit services to individual and commercial customers, such as non-interest-bearing and interest-bearing checking accounts, savings accounts, money market deposit accounts and time deposits. The deposit base is the Company’s major funding source for earning assets. Time deposits decreased in 2014 and 2013 due to customers desiring to stay short and liquid with their deposits. During this time, all other segments of deposits increased.
A three-year schedule of average deposits by type and maturities of time deposits greater than $100,000 is presented in Table 10 – Deposit Information.
TABLE 10 – DEPOSIT INFORMATION
| (in thousands, except percentages) | ||||||||||||||||||||||||
| 2014 | 2013 | 2012 | ||||||||||||||||||||||
| Average Balance |
Average Rate |
Average Balance |
Average Rate |
Average Balance |
Average Rate |
|||||||||||||||||||
| Noninterest-bearing |
$ | 134,859 | $ | 120,457 | $ | 107,130 | ||||||||||||||||||
| Interest-bearing demand |
262,142 | 0.21 | % | 240,524 | 0.22 | % | 191,930 | 0.39 | % | |||||||||||||||
| Savings |
58,053 | 0.12 | % | 50,846 | 0.15 | % | 44,777 | 0.22 | % | |||||||||||||||
| Time deposits |
227,390 | 0.49 | % | 239,104 | 0.55 | % | 248,886 | 0.74 | % | |||||||||||||||
|
|
|
|
|
|
|
|
|
|
|
|
|
|||||||||||||
| $ | 682,444 | 0.25 | % | $ | 650,931 | 0.30 | % | $ | 592,723 | 0.55 | % | |||||||||||||
|
|
|
|
|
|
|
|
|
|
|
|
|
|||||||||||||
MATURITY RANGES OF TIME DEPOSITS
OF $100,000 OR MORE
| AS OF DECEMBER 31, 2014 | ||||
| 3 months or less |
$ | 29,883 | ||
| 3 through 12 months |
70,475 | |||
| 1 year to 3 years |
20,902 | |||
| over 3 years |
100 | |||
|
|
|
|||
| $ | 121,360 | |||
|
|
|
|||
The Company, in its normal course of business, will acquire large time deposits, generally from public entities, with a variety of maturities. These funds are acquired on a bid basis and are considered to be part of the deposit base of the Company.
85
BORROWINGS
Aside from the core deposit base and large denomination time deposits mentioned above, the remaining funding sources utilized by the Company include short-term and long-term borrowings. Short-term borrowings consist of Federal Funds Purchased from other financial institutions on an overnight basis, short-term advances from the FHLB and securities sold under agreement to repurchase. Long-term borrowings are advances from the FHLB with an initial maturity of greater than one year.
TABLE 11 - SHORT-TERM BORROWINGS
(in thousands)
| As of December 31, | ||||||||||||
| 2014 | 2013 | 2012 | ||||||||||
| Short-term borrowings |
||||||||||||
| Year-end balance |
$ | 114,427 | $ | 82,421 | $ | 73,307 | ||||||
| Weighted average rate |
0.68 | % | 0.67 | % | 0.95 | % | ||||||
| Maximum month-end balance |
$ | 118,622 | $ | 151,929 | $ | 103,355 | ||||||
| Year to date average balance |
$ | 82,856 | $ | 80,393 | $ | 79,002 | ||||||
| Weighted average rate |
0.66 | % | 0.77 | % | 0.95 | % | ||||||
The Company borrows funds for short periods from the FHLB as an alternative to Federal Funds Purchased. The Company foresees short-term borrowings to be a continued source of liquidity and likely will continue to use these borrowings as a method to fund short-term needs. At December 31, 2014, the Company had the capacity to borrow up to $187,313,563 from the FHLB and other financial institutions in the form of Federal Funds Purchased. The Company generally will use these types of borrowings if loan demand is greater than the growth in deposits. In 2014, the Company reduced its borrowings from the FHLB to $20,000,000 and its Federal Funds Purchased decreased to $0. In 2013, the Company reduced its borrowing to $33,500,000 from the FHLB and increased its Federal Funds Purchased to $27,500,000. In 2014, the balances in Securities Sold Under Agreement to Repurchase increased $32,005,989, or 38.8% to $114,426,770. In 2013, these balances increased to $82,420,781, an increase of $9,114,016, or 12.4%.
At the end of 2014, the Company had long-term debt in the amount of $20,000,000 to the FHLB for advances and $65,213 payable to the State of Mississippi for advances under the Mississippi Agribusiness Enterprise Loan Program. This program provides interest-free loans to banks to fund loans to qualifying farmers. Farmers that qualify for the program receive 20% of their loan at zero interest. When the loan is repaid, the State of Mississippi receives 20% of the principal payment, which is equal to the amount advanced by the state, and the Company retains the balance of the principal payment.
86
The remaining maturity schedule of the long-term debt at December 31, 2014 is listed below.
| (in thousands) | ||||
| 2014 | ||||
| Less than one year |
$ | 2 | ||
| One year to three years |
7 | |||
| Over three years |
20,056 | |||
|
|
|
|||
| Total long-term borrowings |
$ | 20,065 | ||
|
|
|
|||
NON-INTEREST INCOME AND EXPENSE
Table 12 - Non-Interest Income and Expense illustrates the Company’s non-interest income and expense from 2012 through 2014 and percentage changes between such years.
TABLE 12 - NON-INTEREST INCOME & EXPENSE
(in thousands)
| % CHANGE | % CHANGE | |||||||||||||||||||
| 2014 | FROM ‘13 | 2013 | FROM ‘12 | 2012 | ||||||||||||||||
| NON-INTEREST INCOME |
||||||||||||||||||||
| Service charges on deposit accounts |
$ | 3,933 | 1.24 | % | $ | 3,885 | 4.94 | % | $ | 3,702 | ||||||||||
| Other operating income |
4,230 | 7.61 | % | 3,931 | 6.24 | % | 3,700 | |||||||||||||
|
|
|
|
|
|
|
|
|
|
|
|||||||||||
| TOTAL NON-INTEREST INCOME |
$ | 8,163 | 4.44 | % | $ | 7,816 | 5.59 | % | $ | 7,402 | ||||||||||
|
|
|
|
|
|
|
|
|
|
|
|||||||||||
| NON-INTEREST EXPENSE |
||||||||||||||||||||
| Salaries and employee benefits |
$ | 13,095 | -0.12 | % | $ | 13,111 | -4.56 | % | $ | 13,737 | ||||||||||
| Occupancy expense, including equipment |
5,195 | 18.18 | % | 4,396 | -2.05 | % | 4,488 | |||||||||||||
| Other operating expense |
8,034 | 11.26 | % | 7,221 | -8.30 | % | 7,875 | |||||||||||||
|
|
|
|
|
|
|
|
|
|
|
|||||||||||
| TOTAL NON-INTEREST EXPENSE |
$ | 26,324 | 6.45 | % | $ | 24,728 | -5.26 | % | $ | 26,100 | ||||||||||
|
|
|
|
|
|
|
|
|
|
|
|||||||||||
Non-interest income typically consists of service charges on checking accounts, including debit card fees, and other financial services. With continued pressure on interest rates, the Company has sought to increase its non-interest income through the expansion of fee income and the development of new services. Currently, the Company’s main sources of non-interest income are service charges on checking accounts, safe deposit box rentals, credit life insurance premiums and title insurance service fees.
During 2014, non-interest income increased by $346,402, or 4.44%, when compared to 2013. An increase in other income and service charge income from checking accounts was partially offset by a decrease in proceeds from gains on sales of investment securities. Other income increased mainly due to the receipt of proceeds of an insurance policy that insured the life of a bank officer that died in 2014.
During 2013, non-interest income increased by $414,323, or 5.59%, when compared to 2012. An increase in other income and service charge income from checking accounts was partially offset by a decrease in proceeds from gains on sales of investment securities.
87
During 2012, non-interest income decreased by $40,600, or 0.55%, when compared to 2011. An increase in other income and service charge income from checking accounts was offset by a decrease in proceeds from gains on sales of investment securities.
Non-interest expenses consist of salaries and benefits, occupancy expense and other overhead expenses incurred by the Company in the transaction of its business. In 2014, non-interest expense increased by $1,596,101, or 6.5%, to $26,323,712. Included in this increase was a reduction in salaries and benefits in the amount of $15,580, or 0.1%, an increase in occupancy expense in the amount of $798,903, or 18.2% and an increase in other expense in the amount of $812,778, or 11.3%. The increase in occupancy expense is related to increased banking equipment service costs and the increase in other expense was in large part due to increased regulatory and compliance costs.
In 2013, non-interest expense decreased by $1,372,356, or 5.3%, to $24,727,611. Included in this decrease was a reduction in salaries and benefits in the amount of $626,336, or 4.6% and a decrease in occupancy expense in the amount of $91,704, or 2.0%. The decrease in occupancy expense is related to cost savings and the closing of a branch in Meridian, Mississippi in 2013.
In 2012, non-interest expense decreased by $143,653, or 0.55%, to $26,099,967. Included in this was a decrease in salaries and benefits in the amount of $319,597, or 2.3% and an increase in occupancy expense in the amount of $80,710, or 4.2%. The increase in occupancy expense is related to cost increases and the addition of a branch in Flowood, Mississippi in 2012.
In 2014, the Company’s efficiency ratio was 70.09%, compared to 67.52% in 2013 and 70.73% in 2012. The efficiency ratio is calculated to measure the cost of generating one dollar of revenue. The efficiency ratio is calculated by dividing non-interest expense by the sum of net interest income, on a fully tax equivalent basis, and non-interest income.
INCOME TAXES
The Company records a provision for income taxes currently payable, along with a provision for deferred taxes to be realized in the future. Such deferred taxes arise from differences in timing of certain items for financial statement reporting rather than income tax reporting. The deferred tax amount of $10,128,741 is considered realizable without the use of extraordinary tax planning strategies.
The Company’s effective tax rate was 19.70%, 19.84% and 19.57% in 2014, 2013 and 2012, respectively. The major difference between the effective tax rate applied to the Company’s financial statement income and the federal statutory rate of 34% is interest on tax-exempt securities and loans. Further tax information is disclosed in Note 10, “Income Taxes” to the Company’s Consolidated Financial Statements included in this Annual Report.
88
LIQUIDITY AND RATE SENSITIVITY
Liquidity management is the process by which the Company ensures that adequate liquid funds are available to meet its financial commitments on a timely basis. These commitments include honoring withdrawals by depositors, funding credit obligations to borrowers, servicing long-term obligations, making shareholder dividend payments, paying operating expenses, funding capital expenditures and maintaining reserve requirements.
The Company’s predominant sources of funding include: core deposits (consisting of both commercial and individual deposits); proceeds from maturities of securities; repayments of loan principal and interest; Federal Funds Purchased; and short-term and long-term borrowing from the FHLB. In 2014, the Company experienced an increase in deposits and a decrease in loans outstanding. The decrease in investment securities is mainly the result of calls and maturities during the year being used to pay down other borrowings or to increase the amount of interest bearing balances at due from banks. The Company relies upon non-core sources of funding, such as Federal Funds Purchased and short and long term borrowings from the FHLB, when deposit growth is not adequate to meet its short term needs. While the strategy of using these wholesale funding sources is adequate to cover liquidity deficiencies in the short term, the Company’s goal is to increase core deposits as a source of long term funding. Management does not intend to rely on borrowings from the FHLB as the first choice as a source of funds but prefers to increase core deposits through increased competition for available deposits. Management believes that core deposits can continue to be increased by offering competitive rates and superior service to our customers.
The Company paid off $13.5 million of FHLB advances that matured during 2014 and will continue to pay off advances at maturity if they are no longer needed to maintain the Company’s liquidity position.
The deposit base is diversified between individual and commercial accounts, which the Company believes helps it avoid dependence on large concentrations of funds. The Company does not solicit certificates of deposit from brokers. The primary sources of liquidity on the asset side of the balance sheet are federal funds sold and securities classified as AFS. Approximately 46%, or $179,745,130 of the investment securities portfolio is classified in the AFS category, and is available to be sold, should liquidity needs arise. Management, through its Asset Liability Committee (“ALCO”), and the Board review the Company’s liquidity position on a monthly basis. At December 31, 2014, both the ALCO and the Board of Directors determined that the Company’s liquidity position was adequate.
89
Table 13 - Funding Uses and Sources details the main components of cash flows for 2014 and 2013.
TABLE 13 - FUNDING USES AND SOURCES
(in thousands)
| 2014 | 2013 | |||||||||||||||||||||||
| Average | Increase/(decrease) | Average | Increase/(decrease) | |||||||||||||||||||||
| Balance | Amount | Percent | Balance | Amount | Percent | |||||||||||||||||||
| FUNDING USES |
||||||||||||||||||||||||
| Loans, net of unearned income |
$ | 389,217 | $ | 18,448 | 4.98 | % | $ | 370,769 | $ | (10,465 | ) | -2.75 | % | |||||||||||
| Taxable securities |
318,850 | (9,947 | ) | -3.03 | % | 328,797 | 71,724 | 27.90 | % | |||||||||||||||
| Tax-exempt securities |
91,933 | (9,610 | ) | -9.46 | % | 101,543 | (2,105 | ) | -2.03 | % | ||||||||||||||
| Federal funds sold and other |
17,806 | 2,925 | 19.66 | % | 14,881 | (6,205 | ) | -29.43 | % | |||||||||||||||
|
|
|
|
|
|
|
|
|
|
|
|
|
|||||||||||||
| TOTAL USES |
$ | 817,806 | $ | 1,816 | 0.22 | % | $ | 815,990 | $ | 52,949 | 6.94 | % | ||||||||||||
|
|
|
|
|
|
|
|
|
|
|
|
|
|||||||||||||
| FUNDING SOURCES |
||||||||||||||||||||||||
| Noninterest-bearing deposits |
$ | 134,859 | $ | 14,402 | 11.96 | % | $ | 120,457 | $ | 13,327 | 12.44 | % | ||||||||||||
| Interest-bearing demand and savings deposits |
319,474 | 29,017 | 9.99 | % | 290,457 | 53,750 | 22.71 | % | ||||||||||||||||
| Time deposits |
227,390 | (11,714 | ) | -4.90 | % | 239,104 | (9,782 | ) | -3.93 | % | ||||||||||||||
| Short-term borrowings |
1,957 | (3,454 | ) | -63.83 | % | 5,411 | 2,511 | 86.59 | % | |||||||||||||||
| Commercial repo |
82,856 | 2,463 | 3.06 | % | 80,393 | 1,391 | 1.76 | % | ||||||||||||||||
| Long-term debt |
35,593 | (22,455 | ) | -38.68 | % | 58,048 | (14,308 | ) | -19.77 | % | ||||||||||||||
|
|
|
|
|
|
|
|
|
|
|
|
|
|||||||||||||
| TOTAL SOURCES |
$ | 802,129 | $ | 8,259 | 1.10 | % | $ | 753,096 | $ | 46,889 | 1.01 | % | ||||||||||||
|
|
|
|
|
|
|
|
|
|
|
|
|
|||||||||||||
The Company’s liquidity depends substantially on the ability of the Bank to transfer funds to the Company in the form of dividends. The information under the heading “Market Price and Dividend Information” in this Annual Report discusses federal and state statutory and regulatory restrictions on the ability of the Bank to transfer funds to the Company in the form of dividends.
CAPITAL RESOURCES
The Company and Bank are subject to various regulatory capital guidelines as required by federal and state banking agencies. These guidelines define the various components of core capital and assign risk weights to various categories of assets.
The Federal Deposit Insurance Corporation Improvement Act of 1991 (“FDICIA”) required federal regulatory agencies to define capital tiers. These tiers are: well capitalized, adequately capitalized, undercapitalized, significantly undercapitalized, and critically undercapitalized. Under FDICIA, a “well-capitalized” institution must achieve a Tier 1 risk-based capital ratio of at least 6.00%, a total capital ratio of at least 10.00%, a leverage ratio of at least 5.00% and not be under a capital directive order. These ratios generally measure the percentage of a bank’s capital to all or certain categories of assets. Failure to meet capital requirements can initiate regulatory action that could have a direct material effect on the Company’s financial statements. If a bank is only adequately capitalized, regulatory approval is required before the bank may accept brokered deposits. If undercapitalized, capital distributions, asset growth, and expansion are limited, and the institution is required to submit a capital restoration plan.
90
During 2014, total capital increased primarily due to earnings that were in excess of dividends.
Management believes the Company and the Bank meet all the capital requirements to be well-capitalized under the guidelines established by FDICIA as of December 31, 2014, as noted below in Table 14 - Capital Ratios. To be classified as well-capitalized, the Company and Bank must maintain the ratios described above.
TABLE 14 – CAPITAL RATIOS
(in thousands, except percentage amounts)
| At December 31, | ||||||||||||
| 2014 | 2013 | 2012 | ||||||||||
| Tier 1 capital |
||||||||||||
| Shareholders’ equity |
$ | 81,858 | $ | 66,266 | $ | 88,869 | ||||||
| Less: Intangibles |
(3,150 | ) | (3,150 | ) | (3,150 | ) | ||||||
| Add/less: Unrealized loss/(gain) on securities |
8,881 | 21,249 | (4,348 | ) | ||||||||
|
|
|
|
|
|
|
|||||||
| TOTAL TIER 1 CAPITAL |
$ | 87,589 | $ | 84,365 | $ | 81,371 | ||||||
|
|
|
|
|
|
|
|||||||
| Total capital |
||||||||||||
| Tier 1 capital |
$ | 87,589 | $ | 84,365 | $ | 81,371 | ||||||
| Allowable allowance for loan losses |
6,542 | 6,517 | 6,008 | |||||||||
|
|
|
|
|
|
|
|||||||
| TOTAL CAPITAL |
$ | 94,131 | $ | 90,882 | $ | 87,379 | ||||||
|
|
|
|
|
|
|
|||||||
| RISK WEIGHTED ASSETS |
$ | 527,749 | $ | 519,766 | $ | 479,658 | ||||||
|
|
|
|
|
|
|
|||||||
| AVERAGE ASSETS (FOURTH QUARTER) |
$ | 912,195 | $ | 875,659 | $ | 848,966 | ||||||
|
|
|
|
|
|
|
|||||||
| RISK BASED RATIOS TIER 1 |
16.60 | % | 16.23 | % | 16.96 | % | ||||||
|
|
|
|
|
|
|
|||||||
| TOTAL CAPITAL |
17.84 | % | 17.49 | % | 18.22 | % | ||||||
|
|
|
|
|
|
|
|||||||
| LEVERAGE RATIOS |
9.60 | % | 9.63 | % | 9.58 | % | ||||||
|
|
|
|
|
|
|
|||||||
91
Management’s strategy with respect to capital levels is to maintain a sufficient amount of capital to allow the Company to respond to growth and acquisition opportunities in our service area. Over the past three years, the Company has been able to increase the amount of its capital, through retention of earnings, while still maintaining the dividend payout ratio to approximately 58% of earnings per share. The Company does not currently have any commitments for capital expenditures that would require the Company to raise additional capital by means other than retained earnings. The Company does not plan to change this strategy unless needed to support future acquisition activity.
OFF-BALANCE SHEET ARRANGEMENTS
In the ordinary course of business, the Company makes various commitments and incurs certain contingent liabilities to fulfill the financing needs of its customers. These commitments and contingent liabilities include commitments to extend credit and issue standby letters of credit. These off-balance sheet arrangements are further detailed in Note 13, “Off-Balance Sheet Financial Instruments, Commitments and Contingencies and Concentrations of Risks,” in the notes to the Company’s Consolidated Financial Statements included in this Annual Report.
CONTRACTUAL OBLIGATIONS
The following table summarizes the contractual obligations, excluding deposits, of the Company as of December 31, 2014.
| Payments Due by Period (in thousands) |
||||||||||||||||||||
| Contractual Obligations | Total | Less than 1 year |
1-3 Years |
3-5 Years |
Over 5 Years |
|||||||||||||||
| Long Term Debt |
$ | 20,000 | $ | — | $ | — | $ | 20,000 | $ | — | ||||||||||
| Operating Leases |
2,214 | 523 | 863 | 828 | — | |||||||||||||||
| Other Long-term Liabilities |
65 | 2 | 7 | 56 | — | |||||||||||||||
|
|
|
|
|
|
|
|
|
|
|
|||||||||||
| Total |
$ | 22,279 | $ | 525 | $ | 870 | $ | 20,884 | $ | — | ||||||||||
|
|
|
|
|
|
|
|
|
|
|
|||||||||||
Long-term debt obligations represent borrowings from the FHLB that have an original maturity in excess of one year. Operating leases are primarily for the lease of ATM machines and other leases for mailing equipment. The equipment leases are for various terms. The other long-term liabilities are those obligations of the Company under the Agribusiness Enterprise Loan Program of the State of Mississippi.
92
QUANTITATIVE AND QUALITATIVE DISCLOSURES ABOUT MARKET RISK
OVERVIEW
The definition of market risk is the possibility of loss that could result from adverse changes in market prices or interest rates. The Company has taken steps to assess the amount of risk that is associated with its asset and liability structure. The Company measures the potential risk on a regular basis and makes changes to its strategies to manage these risks. The Board of Directors reviews important policy limits each month, with a more detailed risk analysis completed on a quarterly basis. These measurement tools are important in allowing the Company to manage market risk and to plan effective strategies to respond to any adverse changes in risk. The Company does not participate in some of the financial instruments that are inherently subject to substantial market risk. All of the financial instruments entered into by the Company are for purposes other than trading.
93
MARKET/INTEREST RATE RISK MANAGEMENT
Interest rate risk is the primary market risk that management must address. Interest rate risk is the exposure of Company earnings and capital to changes in interest rates. All financial institutions assume interest rate risk as an integral part of normal operations.
The primary purpose in managing interest rate risk is to effectively invest capital and preserve the value created by the core banking business of the Company. The Company utilizes an investment portfolio to manage the interest rate risk naturally created through its business activities. The process of managing interest rate risk generally involves both reducing the exposure of the Company’s net interest margin to swings in interest rates and concurrently ensuring that there is sufficient capital and liquidity to support balance sheet growth. The Company uses a quarterly interest rate risk report to evaluate its exposure to interest rate risk, project earnings and manage the composition of the balance sheet and its growth.
In addition to the quarterly interest rate risk report, the Company employs a number of tools to measure interest rate risk. One tool is static gap analysis, which matches assets with specified maturities to liabilities with corresponding maturities. Although management believes that this does not provide a complete picture of the Company’s exposure to interest rate risk, it does highlight significant short-term repricing volume mismatches. The following table presents the Company’s rate sensitivity static gap analysis at December 31, 2014 ($ in thousands):
| Interest Sensitive Within | ||||||||
| 90 days | One year | |||||||
| Total rate sensitive assets |
$ | 388,480 | $ | 136,015 | ||||
| Total rate sensitive liabilities |
392,702 | 126,004 | ||||||
|
|
|
|
|
|||||
| Net gap |
$ | (4,222 | ) | $ | 10,011 | |||
|
|
|
|
|
|||||
The analysis shows a negative gap position over the next three-month period, which indicates that the Company would benefit somewhat from a decrease in market interest rates in the very short term. Although rate increases would be detrimental to the interest rate risk of the Company, management believes there is adequate flexibility to alter the overall rate sensitivity structure as necessary to minimize exposure to these changes.
Management believes that static gap analysis does not fully capture the impact of interest rate movements on interest sensitive assets and liabilities. Thus, the Company also measures interest rate risk by analyzing interest rate sensitivity and the rate sensitivity gap. Table 15 - Interest Rate Sensitivity provides additional information about the financial instruments that are sensitive to changes in interest rates. This tabular disclosure is limited by its failure to depict accurately the effect on assumptions of significant changes in the economy or interest rates or changes in management’s expectations or intentions relating to the Company’s financial statements. The information in the interest rate sensitivity table below reflects contractual interest rate pricing dates and contractual maturity dates. For indeterminate maturity deposit
94
products (money market, NOW and savings accounts), the tables present principal cash flows in the shortest term. Although these deposits may not reprice within this time frame, the depositors of such funds have the ability to reprice. Weighted average floating rates are based on the rate for that product as of December 31, 2014 and 2013.
TABLE 15 - INTEREST RATE SENSITIVITY AS OF DECEMBER 31, 2014
(in thousands)
| 2015 | 2016 | 2017 | 2018 | 2019 | Thereafter | Carrying Value |
Fair Value |
|||||||||||||||||||||||||
| Loans |
||||||||||||||||||||||||||||||||
| Fixed Rate |
$ | 68,076 | $ | 65,820 | $ | 51,163 | $ | 41,910 | $ | 103,831 | $ | 26,398 | $ | 357,198 | $ | 359,427 | ||||||||||||||||
| Average Int Rate |
5.37 | % | 5.59 | % | 5.22 | % | 4.90 | % | 4.58 | % | 4.86 | % | 5.06 | % | ||||||||||||||||||
| Floating Rate |
$ | 4,185 | $ | 4,282 | $ | 863 | $ | 2,462 | $ | 9,571 | $ | 12,934 | $ | 34,297 | $ | 34,297 | ||||||||||||||||
| Average Int Rate |
4.41 | % | 3.79 | % | 4.26 | % | 4.33 | % | 3.33 | % | 4.97 | % | 4.23 | % | ||||||||||||||||||
| Investment securities |
||||||||||||||||||||||||||||||||
| Fixed Rate |
$ | 3,081 | $ | 4,219 | $ | 6,186 | $ | 5,986 | $ | 7,997 | $ | 354,743 | $ | 382,212 | $ | 393,618 | ||||||||||||||||
| Average Int Rate |
4.88 | % | 4.56 | % | 3.83 | % | 5.27 | % | 4.21 | % | 3.64 | % | 3.73 | % | ||||||||||||||||||
| Floating Rate |
$ | 2,997 | $ | 2,997 | $ | 2,873 | ||||||||||||||||||||||||||
| Average Int Rate |
7.71 | % | 7.71 | % | ||||||||||||||||||||||||||||
| Other earning assets |
||||||||||||||||||||||||||||||||
| Fixed Rate |
$ | 61,481 | $ | 61,481 | $ | 61,481 | ||||||||||||||||||||||||||
| Average Int Rate |
0.25 | % | 0.25 | % | ||||||||||||||||||||||||||||
| Floating Rate |
||||||||||||||||||||||||||||||||
| Average Int Rate |
||||||||||||||||||||||||||||||||
| Interest-bearing deposits |
||||||||||||||||||||||||||||||||
| Fixed Rate |
$ | 495,154 | $ | 38,921 | $ | 2,716 | $ | 198 | $ | 168 | $ | 0 | $ | 537,157 | $ | 537,315 | ||||||||||||||||
| Average Int Rate |
0.29 | % | 0.59 | % | 0.55 | % | 0.55 | % | 0.55 | % | 0.00 | % | 0.41 | % | ||||||||||||||||||
| Floating Rate |
||||||||||||||||||||||||||||||||
| Average Int Rate |
||||||||||||||||||||||||||||||||
| Other int-bearing liabilities |
||||||||||||||||||||||||||||||||
| Fixed Rate |
$ | 20,000 | $ | 20,000 | $ | 20,804 | ||||||||||||||||||||||||||
| Average Int Rate |
2.53 | % | 2.53 | % | ||||||||||||||||||||||||||||
| Floating Rate |
$ | 114,427 | $ | 114,427 | $ | 114,427 | ||||||||||||||||||||||||||
| Average Int Rate |
0.68 | % | 0.68 | % | ||||||||||||||||||||||||||||
95
AS OF DECEMBER 31, 2013
(in thousands)
| 2014 | 2015 | 2016 | 2017 | 2018 | Thereafter | Carrying Value |
Fair Value |
|||||||||||||||||||||||||
| Loans |
||||||||||||||||||||||||||||||||
| Fixed Rate |
$ | 95,488 | $ | 43,725 | $ | 72,563 | $ | 58,242 | $ | 55,638 | $ | 14,795 | $ | 340,451 | $ | 341,472 | ||||||||||||||||
| Average Int Rate |
5.58 | % | 6.26 | % | 5.28 | % | 5.13 | % | 4.66 | % | 6.10 | % | 6.36 | % | ||||||||||||||||||
| Floating Rate |
$ | 27,418 | $ | 1,275 | $ | 318 | $ | 4,611 | $ | 4,270 | $ | 14,325 | $ | 52,217 | $ | 52,217 | ||||||||||||||||
| Average Int Rate |
4.36 | % | 4.17 | % | 3.93 | % | 5.64 | % | 4.41 | % | 5.04 | % | 4.66 | % | ||||||||||||||||||
| Investment securities |
||||||||||||||||||||||||||||||||
| Fixed Rate |
$ | 2,429 | $ | 4,241 | $ | 3,984 | $ | 7,975 | $ | 8,841 | $ | 401,570 | $ | 429,040 | $ | 395,410 | ||||||||||||||||
| Average Int Rate |
4.98 | % | 4.96 | % | 4.69 | % | 3.99 | % | 5.40 | % | 4.08 | % | 3.31 | % | ||||||||||||||||||
| Floating Rate |
$ | 3,025 | $ | 3,025 | $ | 2,766 | ||||||||||||||||||||||||||
| Average Int Rate |
5.20 | % | 5.20 | % | ||||||||||||||||||||||||||||
| Other earning assets |
||||||||||||||||||||||||||||||||
| Fixed Rate |
$ | 684 | $ | 684 | $ | 684 | ||||||||||||||||||||||||||
| Average Int Rate |
0.25 | % | 0.25 | % | ||||||||||||||||||||||||||||
| Floating Rate |
||||||||||||||||||||||||||||||||
| Average Int Rate |
||||||||||||||||||||||||||||||||
| Interest-bearing deposits |
||||||||||||||||||||||||||||||||
| Fixed Rate |
$ | 498,458 | $ | 33,234 | $ | 2,359 | $ | 57 | $ | 97 | $ | 0 | $ | 534,205 | $ | 534,419 | ||||||||||||||||
| Average Int Rate |
0.31 | % | 0.60 | % | 0.55 | % | 0.55 | % | 0.55 | % | 0.00 | % | 0.41 | % | ||||||||||||||||||
| Floating Rate |
||||||||||||||||||||||||||||||||
| Average Int Rate |
||||||||||||||||||||||||||||||||
| Other int-bearing liabilities |
||||||||||||||||||||||||||||||||
| Fixed Rate |
$ | 13,500 | $ | 20,000 | $ | 33,500 | $ | 34,622 | ||||||||||||||||||||||||
| Average Int Rate |
1.33 | % | 2.53 | % | 2.05 | % | ||||||||||||||||||||||||||
| Floating Rate |
$ | 82,421 | $ | 82,421 | $ | 82,421 | ||||||||||||||||||||||||||
| Average Int Rate |
0.67 | % | 0.67 | % | ||||||||||||||||||||||||||||
Rate sensitivity gap analysis is another tool management uses to measure interest rate risk. The rate sensitivity gap is the difference between the repricing of interest-earning assets and the repricing of interest-bearing liabilities within certain defined time frames. The Company’s interest rate sensitivity position is influenced by the distribution of interest-earning assets and interest-bearing liabilities among the maturity categories. Table 16 - Rate Sensitivity Gap reflects interest-earning assets and interest-bearing liabilities by maturity distribution as of December 31, 2014. Product lines repricing in time periods predetermined by contractual agreements are included in the respective maturity categories.
96
TABLE 16 - RATE SENSITIVITY GAP AT DECEMBER 31, 2014
(in thousands, except percentage amounts)
| 1 - 90 Days |
91 - 365 Days |
1 - 5 Years |
Over 5 years |
Total | ||||||||||||||||
| INTEREST EARNING ASSETS |
||||||||||||||||||||
| Loans |
$ | 39,374 | $ | 59,863 | $ | 226,143 | $ | 27,581 | $ | 352,961 | ||||||||||
| Investment securities |
287,625 | 76,152 | 53,588 | 42,526 | 459,891 | |||||||||||||||
| Interest Bearing Due From Bank Accounts |
61,481 | — | — | — | 61,481 | |||||||||||||||
|
|
|
|
|
|
|
|
|
|
|
|||||||||||
| TOTAL INTEREST BEARING ASSETS |
$ | 388,480 | $ | 136,015 | $ | 279,731 | $ | 70,107 | $ | 874,333 | ||||||||||
|
|
|
|
|
|
|
|
|
|
|
|||||||||||
| INTEREST BEARING LIABILITIES |
||||||||||||||||||||
| Interest bearing demand deposits |
$ | 145,730 | $ | — | $ | — | $ | — | $ | 145,730 | ||||||||||
| Savings and Money Market deposits |
78,918 | — | — | — | 78,918 | |||||||||||||||
| Time deposits |
53,627 | 126,004 | 41,913 | — | 221,544 | |||||||||||||||
| Short term borrowings |
114,427 | — | — | — | 114,427 | |||||||||||||||
| Long term borrowings |
— | — | 20,065 | — | 20,065 | |||||||||||||||
|
|
|
|
|
|
|
|
|
|
|
|||||||||||
| TOTAL INTEREST BEARING LIABILITIES |
$ | 392,702 | $ | 126,004 | $ | 61,978 | $ | — | $ | 580,684 | ||||||||||
|
|
|
|
|
|
|
|
|
|
|
|||||||||||
| Rate sensitive gap |
$ | (4,222 | ) | $ | 10,011 | $ | 217,753 | $ | 70,107 | $ | 293,649 | |||||||||
| Rate sensitive cumulative gap |
(4,222 | ) | 5,789 | 223,542 | 293,649 | — | ||||||||||||||
| Cumulative gap as a percentage of total earning assets |
-0.48 | % | 0.66 | % | 25.57 | % | 33.59 | % | ||||||||||||
The purpose of the above table is to measure interest rate risk utilizing the repricing intervals of interest sensitive assets and liabilities. Rate sensitive gaps constantly change as funds are acquired and invested and as rates change. Rising interest rates are likely to increase net interest income in a positive gap position while falling interest rates are beneficial in a negative gap position.
The above rate sensitivity analysis places interest-bearing demand and savings deposits in the shortest maturity category because these liabilities do not have defined maturities. If these deposits were placed in a maturity distribution representative of the Company’s deposit base history, the shortfall of the negative rate sensitive gap position would be reduced in the 1-to-90 day time frame. It is the goal of the Company to achieve a cumulative gap ratio of plus or minus 15% for all periods under one year, with maximum acceptable limits of plus or minus 20%. Quarterly, management discusses with the ALCO and the board of directors the gap position in relation to the established goals, highlights any reasons for variances from the goals and suggests changes to better align the Company’s position with the established goals. When reviewing the
97
Company’s position, impacting factors and suggested changes, the board of directors also considers other corporate objectives, including increasing core deposits and increasing profitability, before implementing changes intended to align the Company’s position with the established goals. While the board of directors continues to closely monitor the Company’s negative gap position, at this time, management does not anticipate making any significant changes to the Company’s operating practices in order to mitigate the negative gap position.
The rate sensitivity gap table illustrates that the Company had a large negative cumulative gap position for the 1 to 90 day period as of December 31, 2014. This negative gap position was mainly due to: (1) a largest amount of investment securities that have call dates within that period, (2) the interest-bearing and savings deposits being classified in the 1-90 day category; (3) approximately 81.0% of certificates of deposit maturing during the next twelve months; and (4) a significant portion of the Company’s loans maturing after one year.
The interest rate sensitivity and rate sensitivity gap tables, taken together, indicate that the Company continues to be in a asset sensitive position when evaluating the maturities of interest-bearing items. Thus, a decline in the interest rate environment would enhance earnings, while an increase in interest rates would have the opposite effect on the Company’s earnings. The Company has attempted to mitigate the impact of its interest rate position by increasing the amount of its variable rate loans and also by structuring deposit rates to entice customers to shorten the maturities of their time deposits. The effect of any changes in interest rates on the Company would be mitigated by the fact that interest-bearing demand and savings deposits may not be immediately affected by changes in general interest rates.
Short term interest rates have remained low in 2012, 2013 and 2014 in connection with decreases in the target Federal Funds rate by the Federal Reserve Bank. However during 2013, medium term interest rates increased in anticipation of the ending of bond buying program by the Federal Reserve Bank before decreasing again in 2014. Overall, the effect on the Company was marginal. The Company’s net interest margin in 2014 was 3.60% and in 2013 was 3.58%.
98
Quarterly Financial Trends
| (in thousands, except per share amounts) 2014 |
||||||||||||||||
| First Quarter | Second Quarter | Third Quarter | Fourth Quarter | |||||||||||||
| Interest Income |
$ | 7,946 | $ | 7,926 | $ | 7,829 | $ | 7,679 | ||||||||
| Interest Expense |
729 | 734 | 758 | 797 | ||||||||||||
|
|
|
|
|
|
|
|
|
|||||||||
| Net Interest Income |
7,217 | 7,192 | 7,071 | 6,882 | ||||||||||||
| Provision for Loan Losses |
361 | 212 | 205 | 145 | ||||||||||||
| Non-interest Income |
1,783 | 2,484 | 2,056 | 1,840 | ||||||||||||
| Non-interest Expense |
6,369 | 7,046 | 6,439 | 6,470 | ||||||||||||
| Income Taxes |
473 | 325 | 585 | 445 | ||||||||||||
|
|
|
|
|
|
|
|
|
|||||||||
| Net Income |
$ | 1,797 | $ | 2,093 | $ | 1,898 | $ | 1,662 | ||||||||
|
|
|
|
|
|
|
|
|
|||||||||
| Per common share: |
||||||||||||||||
| Basic |
$ | 0.37 | $ | 0.43 | $ | 0.39 | $ | 0.34 | ||||||||
| Diluted |
$ | 0.37 | $ | 0.43 | $ | 0.39 | $ | 0.34 | ||||||||
|
|
|
|
|
|
|
|
|
|||||||||
| Cash Dividends |
$ | 0.22 | $ | 0.22 | $ | 0.22 | $ | 0.23 | ||||||||
| 2013 | ||||||||||||||||
| First Quarter | Second Quarter | Third Quarter | Fourth Quarter | |||||||||||||
| Interest Income |
$ | 7,987 | $ | 7,992 | $ | 8,078 | $ | 8,059 | ||||||||
| Interest Expense |
1,232 | 1,185 | 826 | 837 | ||||||||||||
|
|
|
|
|
|
|
|
|
|||||||||
| Net Interest Income |
6,755 | 6,807 | 7,252 | 7,222 | ||||||||||||
| Provision for Loan Losses |
175 | 574 | 1,080 | 375 | ||||||||||||
| Non-interest Income |
1,681 | 1,929 | 2,183 | 2,023 | ||||||||||||
| Non-interest Expense |
6,557 | 6,147 | 5,850 | 6,174 | ||||||||||||
| Income Taxes |
290 | 410 | 497 | 573 | ||||||||||||
|
|
|
|
|
|
|
|
|
|||||||||
| Net Income |
$ | 1,414 | $ | 1,605 | $ | 2,008 | $ | 2,123 | ||||||||
|
|
|
|
|
|
|
|
|
|||||||||
| Per common share: |
||||||||||||||||
| Basic |
$ | 0.29 | $ | 0.33 | $ | 0.41 | $ | 0.44 | ||||||||
| Diluted |
$ | 0.29 | $ | 0.33 | $ | 0.41 | $ | 0.44 | ||||||||
|
|
|
|
|
|
|
|
|
|||||||||
| Cash Dividends |
$ | 0.22 | $ | 0.22 | $ | 0.22 | $ | 0.22 | ||||||||
99
Market Price and Dividend Information
MARKET PRICE
The Company’s common stock trades on The NASDAQ Global Market (“NASDAQ”) under the symbol “CIZN”. On March 5, 2015, the common stock’s closing price on NASDAQ was $19.24. The following table sets forth the high and low sales prices for the common stock as reported on NASDAQ, as well as the dividends declared, in each quarter in the past two fiscal years.
| 2013 |
High | Low | Dividends Declared (per common share) |
|||||||||
| January - March |
$ | 19.80 | $ | 18.52 | 0.22 | |||||||
| April - June |
20.61 | 17.50 | 0.22 | |||||||||
| July - September |
19.67 | 17.63 | 0.22 | |||||||||
| October - December |
20.67 | 17.63 | 0.22 | |||||||||
| 2014 |
High | Low | Dividends Declared (per common share) |
|||||||||
| January - March |
$ | 19.34 | $ | 17.94 | 0.22 | |||||||
| April - June |
19.94 | 18.25 | 0.22 | |||||||||
| July - September |
19.50 | 18.28 | 0.22 | |||||||||
| October - December |
19.75 | 18.54 | 0.23 | |||||||||
On March 5, 2015, shares of the Company’s common stock were held of record by approximately 454 shareholders.
DIVIDENDS
Dividends totaled $0.89 per share for 2014 and $0.88 per share for 2013.
If funds are available, the Board of Directors of the Company typically declares dividends on a quarterly basis in March, June, September and December with payment following at the end of the month in which the dividend was declared. Funds for the payment by the Company of cash dividends are obtained from dividends, loans or advances received by the Company from the Bank. Accordingly, the declaration and payment of dividends by the Company depend upon the Bank’s earnings and financial condition, general economic conditions, compliance with regulatory requirements, and other factors. The Bank must also receive the approval of the Mississippi Department of Banking and Consumer Finance prior to the payment of a dividend.
100
STOCK PERFORMANCE GRAPH
The following performance graph compares the performance of the Company’s common stock to the NASDAQ Composite Index and the Morningstar Regional Bank index (a peer group of other regional bank holding companies) for the Company’s reporting period. The graph assumes that the value of the investment in the Company’s common stock and each index was $100 at December 31, 2009 and that all dividends were reinvested.
Performance Graph
December 31, 2009 - December 31, 2014
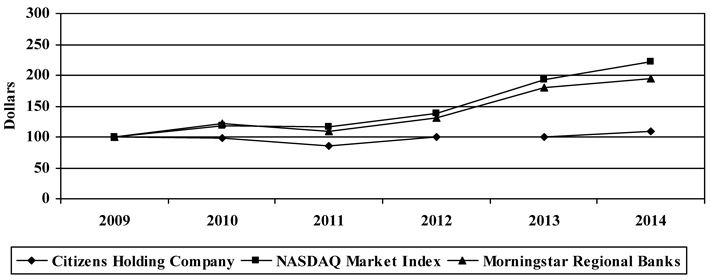
| 2009 | 2010 | 2011 | 2012 | 2013 | 2014 | |||||||||||||||||||
| Citizens Holding Company |
100.00 | 98.33 | 85.47 | 99.30 | 99.56 | 109.02 | ||||||||||||||||||
| NASDAQ Market Index |
100.00 | 118.02 | 117.04 | 137.47 | 192.62 | 221.02 | ||||||||||||||||||
| Morningstar Regional Banks |
100.00 | 121.75 | 109.60 | 130.20 | 180.64 | 194.77 | ||||||||||||||||||
There can be no assurance that the Company’s common stock performance will continue in the future with the same or similar trends depicted in the performance graph above. The Company does not and will not make or endorse any predictions as to future stock performance.
101
THE CITIZENS BANK OFFICERS
| 102 |
BOARD OF DIRECTORS
| Don Fulton |
Craig Dungan, MD | |
| Corporate PERT Coordinator |
Physician | |
| W. G. Yates and Sons Construction Co. |
Meridian Gastroenterology PLLC | |
| Donald L. Kilgore |
Greg L. McKee | |
| Special Assistant Attorney General |
President & Chief Executive Officer | |
| State of Mississippi |
Citizens Holding Company and The Citizens Bank | |
| David A. King |
David P. Webb | |
| Proprietor |
Attorney | |
| Philadelphia Motor Company |
Baker, Donelson, Bearman, Caldwell & Berkowitz, PC | |
| Herbert A. King |
A. T. Williams | |
| Civil Engineer |
Certified Public Accountant | |
| King Engineering Associates, Inc. |
A. T. Williams, CPA | |
| Adam Mars |
Terrell E. Winstead | |
| Business Manager |
Chief Financial Officer | |
| Mars, Mars, Mars & Chalmers |
Molpus Woodlands Group | |
CITIZENS HOLDING COMPANY OFFICERS
Herbert A. King
Chairman
Greg L. McKee
President and Chief Executive Officer
Mark Taylor
Secretary
Robert T. Smith
Treasurer and Chief Financial Officer
103
BANKING LOCATIONS
| Philadelphia Main Office |
Collinsville Branch |
Decatur Branch | ||
| 521 Main Street |
9065 Collinsville Road |
15330 Hwy 15 South | ||
| Philadelphia, MS 39350 |
Collinsville, MS 39325 |
Decatur, MS 39327 | ||
| 601.656.4692 |
601.626.7608 |
601.635.2321 | ||
| Westside Branch |
Flowood Branch |
Forest Branch | ||
| 912 West Beacon Street |
5419 Hwy 25 Ste. Q |
247 Woodland Drive North | ||
| Philadelphia, MS 39350 |
Flowood, MS 39232 |
Forest, MS 39074 | ||
| 601.656.4692 |
601.992.7688 |
601.469.3424 | ||
| Northside Branch |
Sebastopol Branch |
Louisville-Main Branch | ||
| 802 Pecan Avenue |
24 Pine Street |
l00 East Main Street | ||
| Philadelphia, MS 39350 |
Sebastopol, MS 39359 |
Louisville, MS 39339 | ||
| 601.656.4692 |
601.625.7447 |
662.773.6261 | ||
| Eastside Branch |
DeKalb Branch |
Noxapater Branch | ||
| 599 East Main Street |
176 Main Avenue |
45 East Main Street | ||
| Philadelphia, MS 39350 |
DeKalb, MS 39328 |
Noxapater, MS 39346 | ||
| 601.656.4692 |
601.743.2115 |
662.724.4261 | ||
| Union Branch |
Kosciusko Branch |
Louisville-Industrial Branch | ||
| 502 Bank Street |
775 North Jackson Street |
803 South Church Street | ||
| Union, MS 39365 |
Kosciusko, MS 39090 |
Louisville, MS 39339 | ||
| 601.774.9231 |
662.289.4356 |
662.773.6261 | ||
| Starkville Branch |
Scooba Branch |
Biloxi Lemoyne Boulevard | ||
| 201 Highway 12 West |
27597 Highway 16 East |
15309 Lemoyne Boulevard | ||
| Starkville, MS 39759 |
Scooba, MS 39358 |
Biloxi, MS 39532 | ||
| 662.323.1420 |
662.476.8431 |
228.207.2343 | ||
| Carthage Main Office |
Meridian Eastgate |
Meridian Broadmoor | ||
| 301 West Main Street |
1825 Hwy 39 North |
5015 Highway 493 | ||
| Carthage, MS 39051 |
Meridian, MS 39301 |
Meridian. MS 39305 | ||
| 601.257.4525 |
601.693.8367 |
601.581.1541 | ||
| Biloxi Cedar Lakes |
Hattiesburg Branch |
Flowood Branch | ||
| 1765 Popps Ferry Road |
6222 Highway 98 |
5419 Highway 25, Suite Q | ||
| Biloxi, MS 39532 |
Hattiesburg, MS 39402 |
Flowood, MS 39232 | ||
| 228.594.6913 |
601.264.4425 |
601.992.7688 | ||
| Phone Teller |
Internet Banking |
|||
| 1.800.397.0344 |
http://www.thecitizensbankphila.com |
|||
104
FINANCIAL INFORMATION
CORPORATE HEADQUARTERS
521 Main Street
P.O. Box 209
Philadelphia, MS 39350
601.656.4692
ANNUAL STOCKHOLDER MEETING
The Annual Stockholder meeting of the Citizens Holding Company, Inc. will be held Tuesday, April 28, 2015, at 4:30 P.M. in the lobby of the main office of The Citizens Bank, 521 Main Street, Philadelphia, Mississippi.
STOCK REGISTRAR AND TRANSFER AGENT
American Stock Transfer & Trust Company
59 Maiden Lane
New York, NY 10038
FORM 10-K
The Corporation’s most recent Annual Report on Form 10-K, filed with the Securities and Exchange Commission, is available without charge to stockholder’s upon request to the Treasurer of the Citizens Holding Company.
FINANCIAL CONTACT
Robert T. Smith
Treasurer and Chief Financial Officer
P.O. 209
Philadelphia, Mississippi 39350
Additional information can be obtained from our corporate website at www.citizensholdingcompany.com
105