Attached files
UNITED STATES
SECURITIES AND EXCHANGE COMMISSION
Washington, D.C. 20549
FORM 10-K
(Mark One)
þ ANNUAL REPORT PURSUANT TO SECTION 13 OR 15(d) OF THE SECURITIES EXCHANGE ACT OF 1934
For the fiscal year ended December 27, 2014
OR
o TRANSITION REPORT PURSUANT TO SECTION 13 OR 15(d) OF THE SECURITIES EXCHANGE ACT OF 1934
For the transition period from _________ to ________.
Commission File Number 0-2585

The Dixie Group, Inc.
(Exact name of registrant as specified in its charter)
Tennessee | 62-0183370 | |
(State or other jurisdiction of incorporation of organization) | (I.R.S. Employer Identification No.) | |
104 Nowlin Lane, Suite 101, Chattanooga, TN 37421 | (423) 510-7000 | |
(Address of principal executive offices and zip code) | (Registrant's telephone number, including area code) | |
Securities registered pursuant to Section 12(b) of the Act: | ||
Title of Class | Name of each exchange on which registered | |
Common Stock, $3.00 par value | NASDAQ Stock Market, LLC | |
Securities registered pursuant to Section 12(g) of the Act: | ||
Title of class | ||
None | ||
Indicate by check mark if the registrant is a well-known seasoned issuer, as defined in Rule 405 of the Securities Act. ¨ Yes þ No
Indicate by check mark if the registrant is not required to file reports pursuant to Section 13 or 15(d) of the Act. ¨ Yes þ No
Indicate by check mark whether the registrant (1) has filed all reports required to be filed by Section 13 or 15(d) of the Securities Exchange Act of 1934 during the preceding 12 months (or for such shorter period that the registrant was required to file such reports), and (2) has been subject to such filing requirements for the past 90 days. þ Yes ¨ No
Indicate by check mark whether the registrant has submitted electronically and posted on its corporate Web site, if any, every Interactive Data File required to be submitted and posted pursuant to Rule 405 of Regulations S-T (Section 232.405 of this chapter) during the preceding 12 months (or for such shorter period that the registrant was required to submit and post such files). þ Yes ¨ No
Indicate by check mark if disclosure of delinquent filers pursuant to Item 405 of Regulation S-K is not contained herein, and will not be contained, to the best of the registrant's knowledge, in definitive proxy or information statements incorporated by reference in Part III of the Form 10-K or any amendment to this Form 10-K. ¨
Indicate by check mark whether the registrant is a large accelerated filer, an accelerated filer, a non-accelerated filer, or a smaller reporting company. See definition of "large accelerated filer", "accelerated filer" and "smaller reporting company" in Rule 12b-2 of the Exchange Act.
Large accelerated filer ¨ Accelerated filer þ Non-accelerated filer ¨ Smaller reporting company ¨
Indicate by check mark whether the registrant is a shell company (as defined in Rule 12b-2 of the Act). ¨ Yes þ No
The aggregate market value of the Common Stock held by non-affiliates of the registrant on June 27, 2014 (the last business day of the registrant's most recently completed fiscal second quarter) was $154,037,606. The aggregate market value was computed by reference to the closing price of the Common Stock on such date. In making this calculation, the registrant has assumed, without admitting for any purpose, that all executive officers, directors, and holders of more than 10% of a class of outstanding Common Stock, and no other persons, are affiliates. No market exists for the shares of Class B Common Stock, which is neither registered under Section 12 of the Act nor subject to Section 15(d) of the Act.
Indicate the number of shares outstanding of each of the registrant's classes of Common Stock as of the latest practicable date.
Class | Outstanding as of February 27, 2015 | ||||
Common Stock, $3.00 Par Value | 15,007,423 | shares | |||
Class B Common Stock, $3.00 Par Value | 764,191 | shares | |||
Class C Common Stock, $3.00 Par Value | 0 | shares | |||
DOCUMENTS INCORPORATED BY REFERENCE
Specified portions of the following document are incorporated by reference:
Proxy Statement of the registrant for annual meeting of shareholders to be held April 28, 2015 (Part III).
THE DIXIE GROUP, INC.
Index to Annual Report
on Form 10-K for
Year Ended December 27, 2014
PART I | Page | |
Item 1. | ||
Item 1A. | ||
Item 1B. | ||
Item 2. | ||
Item 3. | ||
Item 4. | ||
PART II | ||
Item 5. | ||
Item 6. | ||
Item 7. | ||
Item 7A. | ||
Item 8. | ||
Item 9. | ||
Item 9A. | ||
Item 9B. | ||
PART III | ||
Item 10. | ||
Item 11. | ||
Item 12. | ||
Item 13. | ||
Item 14. | ||
PART IV | ||
Item 15. | ||
FORWARD-LOOKING INFORMATION
This Report contains statements that may be considered forward-looking statements within the meaning of Section 27A of the Securities Act of 1933, as amended and Section 21E of the Securities Exchange Act of 1934, as amended. Such statements include the use of terms or phrases such as "expects," "estimates," "projects," "believes," "anticipates," "intends," and similar terms and phrases. Such forward-looking statements relate to, among other matters, our future financial performance, business prospects, growth strategies or liquidity. The following important factors may affect our future results and could cause those results to differ materially from our historical results; these factors include, in addition to those "Risk Factors" detailed in Item 1A of this report, and described elsewhere in this document, the cost and availability of capital, raw material and transportation costs related to petroleum price levels, the cost and availability of energy supplies, the loss of a significant customer or group of customers, materially adverse changes in economic conditions generally in carpet, rug and floorcovering markets we serve and other risks detailed from time to time in our filings with the Securities and Exchange Commission.
PART I.
Item 1. | BUSINESS |
General
Our business consists principally of marketing, manufacturing and selling carpet and rugs to high-end residential and commercial customers through our various sales forces and brands. A small portion of our manufacturing capacity is used to provide carpet and yarn related services to other manufacturers.
From 1920 until 1993 we were exclusively in the textile business. We sold our textile assets and began acquiring floorcovering businesses in 1993. We focus exclusively on the upper-end of the soft floorcovering market where we believe we have strong brands and competitive advantages with our style and design capabilities and customer relationships.
Our business is concentrated in areas of the soft floorcovering markets where innovative styling, design, color, quality and service, as well as limited distribution, are welcomed and rewarded. Our Fabrica, Masland, and Dixie Home brands have a significant presence in the high-end residential soft floorcovering markets. Our Atlas Carpet Mills, Masland Contract brand and Masland Hospitality, participate in the upper end specified commercial marketplace. Dixie International sells all of our brands outside of the North American market. Our brands are well known, highly regarded and complementary; by being differentiated, we offer meaningful alternatives to the discriminating customer.
We have one line of business, carpet and rug manufacturing.
Our Brands
Fabrica, markets and manufactures luxurious residential carpet and custom rugs, at selling prices that we believe are approximately five times the average for the residential soft floorcovering industry. Its primary customers are interior decorators and designers, selected retailers and furniture stores, luxury home builders and manufacturers of luxury motor coaches and yachts. Fabrica is among the leading premium brands in the domestic marketplace and is known for styling innovation and unique colors and patterns. Fabrica consists of made-to-order, hand-crafted, extremely high quality carpets and area rugs in both nylon and wool, with a wide variety of patterns and textures. Fabrica is viewed by the trade as the premier quality brand for very high-end carpet and enjoys an established reputation as a styling trendsetter and a market leader in providing both custom and designer products to the very high-end residential sector.
Masland Residential, founded in 1866, markets and manufactures design-driven specialty carpets and rugs for the high-end residential marketplace. Its residential and commercial broadloom carpet products are marketed at selling prices that we believe are over three times the average for the residential soft floorcovering industry. Its products are marketed through the interior design community, as well as to consumers through specialty floorcovering retailers. Masland Residential has strong brand recognition within the upper-end residential market. Masland Residential competes through innovative styling, color, product design, quality and service with products made of both wool and nylon.
Dixie Home provides stylishly designed, differentiated products that offer affordable fashion to residential consumers. Dixie Home markets an array of tufted broadloom residential and commercial carpet to selected retailers and home centers under the Dixie Home and private label brands. Its objective is to make the Dixie Home brand the choice for styling, service and quality in the more moderately priced sector of the high-end broadloom residential carpet market. Its products are marketed at selling prices which we believe average two times the soft floorcovering industry's average selling price.
Atlas Carpet Mills, acquired in 2014, is our premium commercial brand. Atlas has long been known for superior style and design. Atlas’ focus is the specified design community including architects and designers who serve the upper end commercial marketplace. The Atlas brand has unique styling, as evident in both its broadloom and modular carpet tile product offerings. Atlas’ high quality offerings are manufactured utilizing just in time manufacturing techniques in our California operations.
Masland Contract markets and manufactures broadloom and modular carpet tile for the specified commercial marketplace. Its commercial products are marketed to the architectural and specified design community and directly to commercial end users, as well as to consumers through specialty floorcovering retailers. Masland Contract has strong brand recognition within the upper-end contract market, and competes through innovative styling, color, patterns, quality and service.
Masland Hospitality, a new commercial business launched in 2014, is designed to focus on the hospitality market with both custom designed and running line products. Utilizing the computerized yarn placement technology we acquired with our Burtco acquisition this past year, as well as offerings utilizing our state of the art Infinity tufting technology, this brand provides excellent service and design flexibility to the hospitality market serving upper-end hotels, conference centers and
senior living markets. Its broadloom and rug product offerings are designed for the interior designer in the upper-end of the hospitality market who appreciates sophisticated texture, color and patterns with excellent service.
Industry
The carpet and rug industry has two primary markets, residential and commercial, with the residential market making up the largest portion of the industry's sales. A substantial portion of industry shipments is made in response to replacement demand. Residential products consist of broadloom carpets and rugs in a broad range of styles, colors and textures. Commercial products consist primarily of broadloom carpet and modular carpet tile for a variety of institutional applications such as office buildings, restaurant chains, schools and other commercial establishments. The carpet industry also manufactures carpet for the automotive, recreational vehicle, small boat and other industries.
The Carpet and Rug Institute (the "CRI") is the national trade association representing carpet and rug manufacturers. Information compiled by the CRI suggests that the domestic carpet and rug industry is comprised of fewer than 100 manufacturers, with a significant majority of the industry's production concentrated in a limited number of manufacturers focused on the lower end of the price curve. We believe that this industry focus provides us with opportunities to capitalize on our competitive strengths in selected markets where innovative styling, design, product differentiation, focused service and limited distribution add value.
Competition
The floorcovering industry is highly competitive. We compete with other carpet and rug manufacturers and other types of floorcoverings. We believe our products are among the leaders in styling and design in the high-end residential and high-end commercial carpet markets. However, a number of manufacturers produce competitive products and some of these manufacturers have greater financial resources than we do.
We believe the principal competitive factors in our primary soft floorcovering markets are styling, color, product design, quality and service. In the high-end residential and high-end commercial markets, carpet competes with various other types of floorcoverings. Nevertheless, we believe we have competitive advantages in several areas. We have an attractive portfolio of brands that we believe are well known, highly regarded by customers and complementary; by being differentiated, we offer meaningful alternatives to the discriminating customer. We believe our investment in new yarns , such as Stainmaster's® TruSoft™ and PetProtect™, and innovative tufting and dyeing technologies, strengthens our ability to offer product differentiation to our customers. In addition, we have established longstanding relationships with key suppliers in our industry and customers in most of our markets. Finally, our reputation for innovative design excellence and our experienced management team enhance our competitive position. See "Risk Factors" in Item 1A of this report.
Backlog
Sales order backlog is not material to understanding our business, due to relatively short lead times for order fulfillment in the markets for the vast majority of our products.
Trademarks
Our floorcovering businesses own a variety of trademarks under which our products are marketed. Among such trademarks, the names "Fabrica", "Masland", "Dixie Home", “Atlas Carpet Mills”, “Masland Contract” and "Masland Hospitality" are of greatest importance to our business. We believe that we have taken adequate steps to protect our interest in all significant trademarks.
Customer and Product Concentration
As a percentage of our net sales, one customer, Lowe's, a mass merchant, accounted for approximately 9% in 2014, 13% in 2013 and 9% in 2012. No other customer was more than 10 percent of our sales during the periods presented. During 2014, sales to our top ten customers accounted for 15% percent of our sales and our top 20 customers accounted for 18% percent of our sales. We do not make a material amount of sales in foreign countries.
We do not have any single class of products that accounts for more than 10 percent of our sales. However, sales of our floorcovering products may be classified by significant end-user markets into which we sell, and such information for the past three years is summarized as follows:
2014 | 2013 | 2012 | ||||||
Residential floorcovering products | 67 | % | 73 | % | 75 | % | ||
Commercial floorcovering products | 33 | % | 27 | % | 25 | % | ||
Seasonality
Our sales historically have normally reached their lowest level in the first quarter (approximately 23% of our annual sales), with the remaining sales being distributed relatively equally between the second, third and fourth quarters. Working capital requirements have normally reached their highest levels in the third and fourth quarters of the year.
Environmental
Our operations are subject to federal, state and local laws and regulations relating to the generation, storage, handling, emission, transportation and discharge of materials into the environment. The costs of complying with environmental protection laws and regulations have not had a material adverse impact on our financial condition or results of operations in the past and are not expected to have a material adverse impact in the future. See "Risk Factors” in Item 1A of this report.
Raw Materials
Our primary raw material is yarn. Nylon is the primary yarn we utilize and, to a lesser extent, wool and polyester yarn is used. Additionally, we utilize polypropylene carpet backing, latex, dyes and chemicals, and man-made topical applications in the construction of our products. Our synthetic yarns are purchased primarily from domestic fiber suppliers and wool is purchased from a number of domestic and international sources. Our other raw materials are purchased primarily from domestic suppliers. Where possible, we pass raw material price increases through to our customers; however, there can be no assurance that price increases can be passed through to customers and that increases in raw material prices will not have an adverse effect on our profitability. See "Risk Factors” in Item 1A of this report. We purchase a significant portion of our primary raw material (nylon yarn) from one supplier. We believe there are other sources of nylon yarn; however, an unanticipated termination or interruption of our supply arrangements could adversely affect our supplies of raw materials and could have a material effect on our operations. See "Risk Factors” in Item 1A of this report.
Utilities
We use electricity as our principal energy source, with oil or natural gas used in some facilities for dyeing and finishing operations as well as heating. We have not experienced any material problem in obtaining adequate supplies of electricity, natural gas or oil. Energy shortages of extended duration could have an adverse effect on our operations, and price volatility could negatively impact future earnings. See "Risk Factors” in Item 1A of this report.
Working Capital
We are required to maintain significant levels of inventory in order to provide the enhanced service levels demanded by the nature of our business and our customers, and to ensure timely delivery of our products. Consistent and dependable sources of liquidity are required to maintain such inventory levels. Failure to maintain appropriate levels of inventory could materially adversely affect our relationships with our customers and adversely affect our business. See "Risk Factors” in Item 1A of this report.
Employment Level
At December 27, 2014, we employed 1,740 associates in our operations.
Available Information
Our internet address is www.thedixiegroup.com. We make the following reports filed by us with the Securities and Exchange Commission available, free of charge, on our website under the heading "Investor Relations":
1. | annual reports on Form 10-K; |
2. | quarterly reports on Form 10-Q; |
3. | current reports on Form 8-K; and |
4. | amendments to the foregoing reports. |
The contents of our website are not a part of this report.
Item 1A. RISK FACTORS
In addition to the other information provided in this Report, the following risk factors should be considered when evaluating the results of our operations, future prospects and an investment in shares of our Common Stock. Any of these factors could cause our actual financial results to differ materially from our historical results, and could give rise to events that might have a material adverse effect on our business, financial condition and results of operations.
The floorcovering industry is sensitive to changes in general economic conditions and a decline in residential or commercial construction activity or corporate remodeling and refurbishment could have a material adverse effect on our business.
The floorcovering industry, in which the Company participates, is highly dependent on general economic conditions, such as consumer confidence and income, corporate and government spending, interest rate levels, availability of credit and demand for housing. The Company derives a majority of its sales from the replacement segment of the market. Therefore, economic changes that result in a significant or prolonged decline in spending for remodeling and replacement activities could have a material adverse effect on the Company’s business and results of operations.
The floorcovering industry is highly dependent on construction activity, including new construction, which is cyclical in nature, and recently experienced a downturn. The 2008 downturn in the U.S. and global economies, along with the residential and commercial markets in such economies, negatively impacted the floorcovering industry and the Company’s business. Although the impact of a decline in new construction activity is typically accompanied by an increase in remodeling and replacement activity, these activities lagged during the downturn. Although the difficult economic conditions have improved, there may be additional downturns that could cause the industry to deteriorate in the foreseeable future. A significant or prolonged decline in residential or commercial construction activity could have a material adverse effect on the Company’s business and results of operations.
We have significant levels of sales in certain channels of distribution and reduction in sales through these channels could adversely affect our business.
A significant amount of our sales are generated through certain retail and mass merchant channels of distribution. Because we depend on such certain channels of distribution, a significant reduction of sales through these channels could adversely affect our business.
We have significant levels of indebtedness that could result in negative consequences to us.
We have a significant amount of indebtedness relative to our equity. Insufficient cash flow, profitability or the value of our assets securing our loans could materially adversely affect our ability to generate sufficient funds to satisfy the terms of our senior loan agreements and other debt obligations. Additionally, the inability to access debt or equity markets at competitive rates in sufficient amounts to satisfy our obligations could adversely impact our business.
Uncertainty in the credit market or downturns in the economy and our business could affect our overall availability and cost of credit.
Uncertainty in the credit markets could affect the overall availability and cost of credit. Despite recent improvement in overall economic conditions, market conditions could impact our ability to obtain financing in the future, including any financing necessary to refinance existing indebtedness, and the cost and terms of it, remains uncertain. These and other economic factors could have a material adverse effect on demand for our products and on its financial condition and operating results.
We face intense competition in our industry, which could decrease demand for our products and could have a material adverse effect on our profitability.
The floorcovering industry is highly competitive. We face competition from a number of domestic manufacturers and independent distributors of floorcovering products and, in certain product areas, foreign manufacturers. Significant consolidation within the floorcovering industry has caused a number of our existing and potential competitors to grow significantly larger and have greater access to resources and capital than we do. Maintaining our competitive position may require us to make substantial additional investments in our product development efforts, manufacturing facilities, distribution network and sales and marketing activities. These additional investments may be limited by our access to capital, as well as restrictions set forth in our credit facilities. Competitive pressures may also result in decreased demand for our products and in the loss of market share. In addition, we face, and will continue to face, competitive pressures on our sales price and cost of our products. As a result of any of these factors, there could be a material adverse effect on our sales and profitability.
If we are unable to anticipate consumer preferences and successfully develop and introduce new, innovative and updated products, we may not be able to maintain or increase our net revenues and profitability.
Our success depends on our ability to identify and originate product trends as well as to anticipate and react to changing consumer demands in a timely manner. All of our products are subject to changing consumer preferences that cannot be predicted with certainty. In addition, long lead times for certain of our products may make it hard for us to quickly respond to changes in consumer demands. Our new products may not receive consumer acceptance as consumer preferences could shift rapidly to different types of flooring products or away from these types of products altogether, and our future success depends in part on our ability to anticipate and respond to these changes. Failure to anticipate and respond in a timely manner to changing consumer preferences could lead to, among other things, lower sales and excess inventory levels, which could have a material adverse effect on our financial condition.
Raw material prices may increase and the inability to pass any such increases to our customers could materially adversely affect our business, results of operations and financial condition.
The prices of raw materials and fuel-related costs vary significantly with market conditions. In particular, our business requires the purchase of large volumes of nylon and polyester yarn, as well as wool yarns, synthetic backing, latex, and dyes. Increases in the cost of these raw materials could materially adversely affect our business, results of operations and financial condition if we are unable to pass these increases through to our customers. Although we generally attempt to pass on increases in raw material, energy and fuel-related costs to our customers, our ability to do so is dependent upon the rate and magnitude of any increase, competitive pressures and market conditions for our products. There have been in the past, and may be in the future, periods of time during which increases in these costs cannot be recovered. During such periods of time, our business may be materially adversely affected.
Unanticipated termination or interruption of our arrangements with third-party suppliers of nylon yarn could have a material adverse effect on us.
Nylon yarn is the principal raw material used in our floorcovering products. A significant portion of such yarn is purchased from one supplier. Our yarn supplier is one of the leading fiber suppliers within the industry and is the exclusive supplier of certain innovative branded fiber technology upon which we rely. We believe our offerings of this innovative fiber technology contribute materially to the competitiveness of our products. While we believe there are other sources of nylon yarns, an unanticipated termination or interruption of our current supply of nylon yarn could have a material adverse effect on our ability to supply our product to our customers and have a material adverse impact on our competitiveness if we are unable to replace our nylon supplier with another supplier that can offer similar innovative fiber products. An extended interruption in the supply of these or other raw materials or sourced products used in the Company’s business or in the supply of suitable substitute materials or products would disrupt the Company’s operations, which could have a material adverse effect on the Company’s business.
We may experience certain risks associated with internal expansion, acquisitions, joint ventures and strategic investments.
We have recently embarked on several strategic and tactical initiatives, including aggressive internal expansion, acquisitions and investment in new products, to strengthen our future and to enable us to return to sustained growth and profitability. Growth through expansion and acquisition involves risks, many of which may continue to affect us after the acquisition or expansion. An acquired company, operation or internal expansion may not achieve the levels of revenue, profitability and production that we expect. The combination of an acquired company’s business with ours involves risks. Further, internally generated growth that involves expansion involves risks as well. Such risks include the integration of computer systems, alignment of human resource policies and the retention of valued talent. Reported earnings may not meet expectations because of goodwill and intangible asset impairment, other asset impairments, increased interest costs and issuance of additional securities or debt as a result of these acquisitions. We may also face challenges in consolidating functions and integrating our organizations, procedures, operations and product lines in a timely and efficient manner.
The diversion of management attention and any difficulties encountered in the transition and integration process could have a material adverse effect on our revenues, level of expenses and operating results. Failure to successfully manage and integrate an acquisition with our existing operations or expansion of our existing operations could lead to the potential loss of customers of the acquired or existing business, the potential loss of employees who may be vital to the new or existing operations, the potential loss of business opportunities or other adverse consequences that could have a material adverse effect on our business, financial condition and results of operations. Even if integration occurs successfully, failure of the expansion or acquisition to achieve levels of anticipated sales growth, profitability or productivity, or otherwise perform as expected, may have a material adverse effect on our business, financial condition and results of operations.
We are subject to various environmental, safety and health regulations that may subject us to costs, liabilities and other obligations, which could have a material adverse effect on our business, results of operations and financial condition.
We are subject to various environmental, safety and health and other regulations that may subject us to costs, liabilities and other obligations which could have a material adverse effect on our business. The applicable requirements under these laws are subject to amendment, to the imposition of new or additional requirements and to changing interpretations of agencies or courts. We could incur material expenditures to comply with new or existing regulations, including fines and penalties and increased costs of its operations. Additionally, future laws, ordinances or regulations could give rise to additional compliance or remediation costs that could have a material adverse effect on our business, results of operations and financial condition. For example, producer responsibility regulations regarding end-of-life disposal could impose additional cost and complexity to our business.
Various federal, state and local environmental laws govern the use of our current and former facilities. These laws govern such matters as:
• | Discharge to air and water; |
• | Handling and disposal of solid and hazardous substances and waste, and |
• | Remediation of contamination from releases of hazardous substances in our facilities and off-site disposal locations. |
Our operations also are governed by laws relating to workplace safety and worker health, which, among other things, establish noise standards and regulate the use of hazardous materials and chemicals in the workplace. We have taken, and will continue to take, steps to comply with these laws. If we fail to comply with present or future environmental or safety regulations, we could be subject to future liabilities. However, we cannot ensure that complying with these environmental or health and safety laws and requirements will not adversely affect our business, results of operations and financial condition.
We may be exposed to litigation, claims and other legal proceedings in the ordinary course of business relating to our products or business, which could have a material adverse effect on our business, results of operations and financial condition.
In the ordinary course of business, we are subject to a variety of work-related and product-related claims, lawsuits and legal proceedings, including those relating to product liability, product warranty, product recall, personal injury, and other matters that are inherently subject to many uncertainties regarding the possibility of a loss our business. Such matters could have a material adverse effect on our business, results of operations and financial condition if we are unable to successfully defend against or resolve these matters or if our insurance coverage is insufficient to satisfy any judgments against us or settlements relating to these matters. Although we have product liability insurance, the policies may not provide coverage for certain claims against us or may not be sufficient to cover all possible liabilities. Further, we may not be able to maintain insurance at commercially acceptable premium levels. Additionally, adverse publicity arising from claims made against us, even if the claims are not successful, could adversely affect our reputation or the reputation and sales of our products.
Our business operations could suffer significant losses from natural disasters, catastrophes, fire or other unexpected events.
Many of our business activities involve substantial investments in manufacturing facilities and many products are produced at a limited number of locations. These facilities could be materially damaged by natural disasters, such as floods, tornadoes, hurricanes and earthquakes, or by fire or other unexpected events such as adverse weather conditions or other disruptions to our facilities, supply chain or our customer's facilities. We could incur uninsured losses and liabilities arising from such events, including damage to our reputation, and/or suffer material losses in operational capacity, which could have a material adverse impact on our business, financial condition and results of operations.
Item 1B. | UNRESOLVED STAFF COMMENTS |
None.
Item 2. | PROPERTIES |
The following table lists our facilities according to location, type of operation and approximate total floor space as of February 27, 2015:
Location | Type of Operation | Approximate Square Feet | |||
Administrative: | |||||
Saraland, AL | Administrative | 29,000 | |||
Commerce, CA* | Administrative | 21,800 | |||
Santa Ana, CA | Administrative | 4,000 | |||
Calhoun, GA | Administrative | 10,600 | |||
Dalton, GA* | Administrative | 16,000 | |||
Chattanooga, TN* | Administrative | 3,500 | |||
Total Administrative | 84,900 | ||||
Manufacturing and Distribution: | |||||
Atmore, AL | Carpet Manufacturing, Distribution | 610,000 | |||
Roanoke, AL | Carpet Yarn Processing | 204,000 | |||
Saraland, AL | Carpet Tile Manufacturing, Distribution | 384,000 | |||
Saraland, AL* | Samples and Rug Manufacturing, Distribution | 132,000 | |||
Commerce, CA* | Carpet Manufacturing, Distribution | 51,700 | |||
Commerce, CA* | Carpet Manufacturing | 250,000 | |||
Santa Ana, CA | Carpet and Rug Manufacturing, Distribution | 200,000 | |||
Adairsville, GA | Samples and Rug Manufacturing, Distribution | 292,000 | |||
Calhoun, GA * | Carpet Wool Manufacturing | 99,000 | |||
Calhoun, GA | Carpet Dyeing & Processing | 193,300 | |||
Chickamauga, GA* | Carpet Manufacturing | 107,000 | |||
Eton, GA | Carpet Manufacturing, Distribution | 408,000 | |||
Total Manufacturing and Distribution | 2,931,000 | ||||
* Leased properties | TOTAL | 3,015,900 | |||
In addition to the facilities listed above, we lease a small amount of office space in various locations.
In our opinion, our manufacturing facilities are well maintained and our machinery is efficient and competitive. Operations of our facilities generally vary between 120 and 168 hours per week. Substantially all of our owned properties are subject to mortgages, which secure the outstanding borrowings under our senior credit facilities.
Item 3. | LEGAL PROCEEDINGS |
At December 28, 2013, the Company was a plaintiff in a lawsuit against a former raw material supplier. In its lawsuit, the Company alleges that the former supplier sold defective materials to the Company over a period of time, which, when applied to certain of the Company’s products, caused those products to become defective and unmerchantable in the ordinary course of the Company’s business. On January 31, 2014, the Company and the supplier settled the Company's claim for $400 thousand.
Item 4. | MINE SAFETY DISCLOSURES |
Not applicable
Pursuant to instruction G of Form 10-K the following is included as an unnumbered item to PART I.
EXECUTIVE OFFICERS OF THE REGISTRANT
The names, ages, positions and offices held by the executive officers of the registrant as of February 27, 2015, are listed below along with their business experience during the past five years.
Name, Age and Position | Business Experience During Past Five Years | |
Daniel K. Frierson, 73 Chairman of the Board, and Chief Executive Officer, Director | Director since 1973, Chairman of the Board since 1987 and Chief Executive Officer since 1980. He is the Chairman of the Company's Executive Committee and Retirement Plans Committee. He is currently Chairman of The Carpet and Rug Institute. He serves as Director of Astec Industries, Inc. headquartered in Chattanooga, Tennessee; and Louisiana-Pacific Corporation headquartered in Nashville, Tennessee. | |
D. Kennedy Frierson, Jr., 48 Vice President and Chief Operating Officer | Director since 2012 and Vice President and Chief Operating Officer since August 2009. Vice President and President Masland Residential from February 2006 to July 2009. President Masland Residential from December 2005 to January 2006. Executive Vice President and General Manager, Dixie Home, 2003 to 2005. Business Unit Manager, Bretlin, 2002 to 2003. | |
Jon A. Faulkner, 54 Vice President and Chief Financial Officer | Vice President and Chief Financial Officer since October 2009. Vice President of Planning and Development from February 2002 to September 2009. Executive Vice President of Sales and Marketing for Steward, Inc. from 1997 to 2002. | |
Paul B. Comiskey, 63 Vice President and President, Dixie Residential | Vice President and President of Dixie Residential since August 2009. Vice President and President, Dixie Home from February 2007 to July 2009. President, Dixie Home from December 2006 to January 2007. Senior Vice President of Residential Sales, Mohawk Industries, Inc. from 1998 to 2006. Executive Vice President of Sales and Marketing for World Carpets from 1996 to 1998. | |
V. Lee Martin, 63 Vice President and President, Masland Contract | President, Masland Contract since August 2012 and Vice President since February 2013. President, Step 2 Surfaces, LLC from 2011 to August 2012. Corporate Vice President, Sales and Marketing, for J & J Industries from 1994 to 2011. | |
W. Derek Davis, 64 Vice President, Human Resources | Vice President of Human Resources since January 1991. Corporate Employee Relations Director, 1988 to 1991. | |
D. Eugene Lasater, 64 Controller | Controller since 1988. | |
Starr T. Klein, 72 Secretary | Secretary since November 1992. Assistant Secretary, 1987 to 1992. | |
The executive officers of the registrant are generally elected annually by the Board of Directors at its first meeting held after each annual meeting of our shareholders.
PART II.
Item 5. | MARKET FOR THE REGISTRANT'S COMMON EQUITY, RELATED STOCKHOLDER MATTERS AND ISSUER PURCHASES OF EQUITY SECURITIES |
Our Common Stock trades on the NASDAQ Global Market under the symbol DXYN. No market exists for our Class B Common Stock.
As of February 27, 2015, the total number of holders of our Common Stock was approximately 3,000 including an estimated 2,550 shareholders who hold our Common Stock in nominee names, but excluding approximately 540 participants in our 401(k) plan who may direct the voting of the shares allocated to their accounts. The total number of holders of our Class B Common Stock was 12.
Recent Sales of Unregistered Securities
None.
Issuer Purchases of Equity Securities
The following table provides information regarding our repurchases of shares of our Common Stock during the three months ended December 27, 2014:
Fiscal Month Ending | Total Number of Shares Purchased | Average Price Paid Per Share | Total Number of Shares Purchased as Part of Publicly Announced Plans or Programs (1) | Maximum Number (or approximate dollar value) of Shares That May Yet Be Purchased Under Plans or Programs | ||||||||||
November 1, 2014 | 4 | $ | 8.64 | 4 | ||||||||||
November 29, 2014 | — | — | — | |||||||||||
December 27, 2014 | — | — | — | |||||||||||
Three Fiscal Months Ended December 27, 2014 | 4 | $ | 8.64 | 4 | $ | 3,412,112 | ||||||||
(1) | On August 8, 2007, we announced a program to repurchase up to $10 million of our Common Stock. |
Quarterly Financial Data, Dividends and Price Range of Common Stock
Following are quarterly financial data, dividends and price range of Common Stock for the four quarterly periods in the years ended December 27, 2014 and December 28, 2013. Due to rounding, the totals of the quarterly information for each of the years reflected below may not necessarily equal the annual totals. The discussion of restrictions on payment of dividends is included in Note 10 to the Consolidated Financial Statements included herein.
THE DIXIE GROUP, INC. | ||||||||||||||||
QUARTERLY FINANCIAL DATA, DIVIDENDS AND PRICE RANGE OF COMMON STOCK | ||||||||||||||||
(unaudited) (dollars in thousands, except per share data) | ||||||||||||||||
2014 | 1ST (1)(2) | 2ND (1) | 3RD (1) | 4TH (1) | ||||||||||||
Net sales | $ | 85,082 | $ | 107,926 | $ | 109,006 | $ | 104,574 | ||||||||
Gross profit | 18,101 | 26,671 | 26,599 | 24,126 | ||||||||||||
Operating income (loss) | (2,241 | ) | 588 | 832 | (4,415 | ) | ||||||||||
Income (loss) from continuing operations | 4,821 | (510 | ) | (8 | ) | (3,630 | ) | |||||||||
Loss from discontinued operations | (193 | ) | (135 | ) | (177 | ) | (103 | ) | ||||||||
Loss on disposal of discontinued operations | — | — | — | (1,467 | ) | |||||||||||
Net income (loss) | $ | 4,628 | $ | (645 | ) | $ | (185 | ) | $ | (5,200 | ) | |||||
Basic earnings (loss) per share: | ||||||||||||||||
Continuing operations | $ | 0.36 | $ | (0.04 | ) | $ | — | $ | (0.24 | ) | ||||||
Discontinued operations | (0.02 | ) | (0.01 | ) | (0.01 | ) | (0.01 | ) | ||||||||
Disposal of discontinued operations | — | — | — | (0.10 | ) | |||||||||||
Net income (loss) | $ | 0.34 | $ | (0.05 | ) | $ | (0.01 | ) | $ | (0.35 | ) | |||||
Diluted earnings (loss) per share: | ||||||||||||||||
Continuing operations | $ | 0.36 | $ | (0.04 | ) | $ | — | $ | (0.24 | ) | ||||||
Discontinued operations | (0.02 | ) | (0.01 | ) | (0.01 | ) | (0.01 | ) | ||||||||
Disposal of discontinued operations | — | — | — | (0.10 | ) | |||||||||||
Net income (loss) | $ | 0.34 | $ | (0.05 | ) | $ | (0.01 | ) | $ | (0.35 | ) | |||||
Common Stock Prices: | ||||||||||||||||
High | $ | 16.80 | $ | 18.41 | $ | 10.78 | $ | 9.44 | ||||||||
Low | 12.10 | 9.77 | 7.42 | 6.00 | ||||||||||||
2013 | 1ST | 2ND | 3RD (1) | 4TH (1) | ||||||||||||
Net sales | $ | 75,440 | $ | 83,617 | $ | 89,933 | $ | 95,384 | ||||||||
Gross profit | 18,412 | 22,302 | 22,101 | 22,755 | ||||||||||||
Operating income | 1,677 | 3,271 | 1,962 | 1,945 | ||||||||||||
Income from continuing operations | 651 | 1,677 | 1,525 | 1,703 | ||||||||||||
Loss from discontinued operations | (15 | ) | (32 | ) | (113 | ) | (106 | ) | ||||||||
Net income | $ | 636 | $ | 1,645 | $ | 1,412 | $ | 1,597 | ||||||||
Basic earnings per share: | ||||||||||||||||
Continuing operations | $ | 0.05 | $ | 0.13 | $ | 0.12 | $ | 0.13 | ||||||||
Discontinued operations | — | — | (0.01 | ) | (0.01 | ) | ||||||||||
Net income | $ | 0.05 | $ | 0.13 | $ | 0.11 | $ | 0.12 | ||||||||
Diluted earnings per share: | ||||||||||||||||
Continuing operations | $ | 0.05 | $ | 0.13 | $ | 0.11 | $ | 0.13 | ||||||||
Discontinued operations | — | — | (0.01 | ) | (0.01 | ) | ||||||||||
Net income | $ | 0.05 | $ | 0.13 | $ | 0.10 | $ | 0.12 | ||||||||
Common Stock Prices: | ||||||||||||||||
High | $ | 5.93 | $ | 9.38 | $ | 12.05 | $ | 13.85 | ||||||||
Low | 3.24 | 5.30 | 7.43 | 9.15 | ||||||||||||
(1) | Periods have been restated to classify Carousel results to discontinued operations. |
(2) | The first quarter of 2014 10-Q included an initial bargain purchase of $8,744 based on provisional amounts of certain fair values of Atlas Carpet Mills, Inc. During 2014, based on further information, the Company retroactively applied adjustments to the initial provisional amounts resulting in a final bargain purchase amount of $10,937. |
Shareholder Return Performance Presentation
We compare our performance to two different industry indexes published by Dow Jones, Inc. The first of these is the Dow Jones Furnishings Index, which is composed of publicly traded companies classified by Dow Jones in the furnishings industry. The second is the Dow Jones Building Materials & Fixtures Index, which is composed of publicly traded companies classified by Dow Jones in the building materials and fixtures industry.
In accordance with SEC rules, set forth below is a line graph comparing the yearly change in the cumulative total shareholder return on our Common Stock against the total return of the Standard & Poor's 600 Stock Index, plus both the Dow Jones Furnishings Index and the Dow Jones Building Materials & Fixtures Index, in each case for the five year period ended December 27, 2014. The comparison assumes that $100.00 was invested on December 26, 2009, in our Common Stock, the S&P 600 Index, and each of the two Peer Groups, and assumes the reinvestment of dividends.
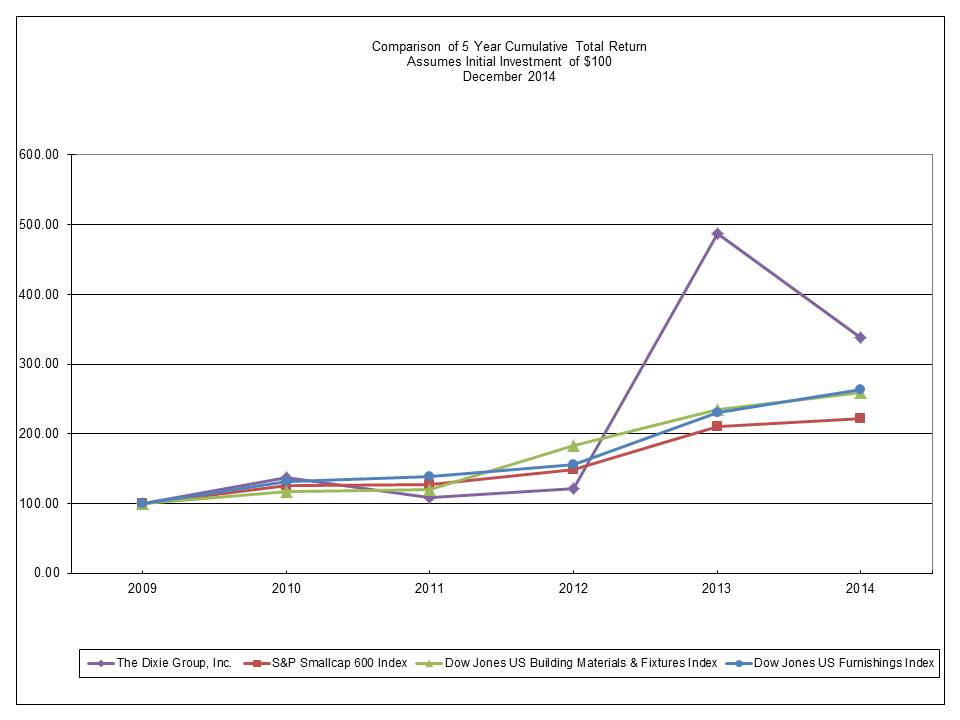
The foregoing shareholder performance presentation shall not be deemed "soliciting material" or to be "filed" with the Commission subject to Regulation 14A, or subject to the liabilities of Section 18 of the Exchange Act.
Item 6. | SELECTED FINANCIAL DATA |
Selected financial data for the periods presented have been restated to classify the results of Carousel operations discontinued in December 2014 as discontinued operations.
The Dixie Group, Inc. | ||||||||||||||||||||
Historical Summary | ||||||||||||||||||||
(dollars in thousands, except share and per share data) | ||||||||||||||||||||
FISCAL YEARS | 2014 (1)(2) | 2013 (3) | 2012 | 2011 (4) | 2010 (5) | |||||||||||||||
OPERATIONS | ||||||||||||||||||||
Net sales | $ | 406,588 | $ | 344,374 | $ | 266,372 | $ | 270,110 | $ | 231,322 | ||||||||||
Gross profit | 95,497 | 85,570 | 65,372 | 65,506 | 56,651 | |||||||||||||||
Operating income (loss) | (5,236 | ) | 8,855 | 1,815 | 5,668 | (2,570 | ) | |||||||||||||
Income (loss) from continuing operations before taxes | 1,726 | 4,979 | (1,054 | ) | 1,956 | (6,977 | ) | |||||||||||||
Income tax provision (benefit) | 1,053 | (577 | ) | (401 | ) | 684 | (2,604 | ) | ||||||||||||
Income (loss) from continuing operations | 673 | 5,556 | (653 | ) | 1,272 | (4,373 | ) | |||||||||||||
Depreciation and amortization | 12,850 | 10,230 | 9,396 | 9,649 | 11,575 | |||||||||||||||
Dividends | — | — | — | — | — | |||||||||||||||
Capital expenditures | 9,492 | 11,438 | 3,386 | 6,740 | 1,771 | |||||||||||||||
Assets purchased under capital leases & notes | 23,333 | 1,865 | 666 | 14 | 127 | |||||||||||||||
FINANCIAL POSITION | ||||||||||||||||||||
Total assets | $ | 300,880 | $ | 248,866 | $ | 201,770 | $ | 182,943 | $ | 180,929 | ||||||||||
Working capital | 113,324 | 95,679 | 76,958 | 66,417 | 56,496 | |||||||||||||||
Long-term debt | 118,210 | 101,759 | 80,166 | 65,357 | 58,070 | |||||||||||||||
Stockholders' equity | 92,977 | 70,771 | 64,046 | 64,385 | 62,430 | |||||||||||||||
PER SHARE | ||||||||||||||||||||
Income (loss) from continuing operations: | ||||||||||||||||||||
Basic | $ | 0.03 | $ | 0.42 | $ | (0.05 | ) | $ | 0.10 | $ | (0.35 | ) | ||||||||
Diluted | 0.03 | 0.42 | (0.05 | ) | 0.10 | (0.35 | ) | |||||||||||||
Dividends: | ||||||||||||||||||||
Common Stock | — | — | — | — | — | |||||||||||||||
Class B Common Stock | — | — | — | — | — | |||||||||||||||
Book value | 5.90 | 5.32 | 4.88 | 4.99 | 4.86 | |||||||||||||||
GENERAL | ||||||||||||||||||||
Weighted-average common shares outstanding: | ||||||||||||||||||||
Basic | 14,381,601 | 12,736,835 | 12,637,657 | 12,585,396 | 12,524,358 | |||||||||||||||
Diluted | 14,544,073 | 12,851,917 | 12,637,657 | 12,623,054 | 12,524,358 | |||||||||||||||
Number of shareholders (6) | 3,000 | 2,350 | 1,800 | 1,750 | 1,750 | |||||||||||||||
Number of associates | 1,740 | 1,423 | 1,200 | 1,171 | 1,150 | |||||||||||||||
(1) | Includes the results of operations of Atlas Carpet Mills, Inc. and Burtco Enterprises, Inc. subsequent to their acquisitions on March 19, 2014 and September 22, 2014, respectively. |
(2) | Includes expenses of $5,514, or $3,364 net of tax, for facility consolidation expenses, $1,133, or $691 net of tax, for impairment of assets and income of $11,110, or $6,777 net of tax, for bargain purchases on the acquisitions of Atlas Carpet Mills and Burtco Enterprises. |
(3) | Includes the results of operations of Robertex, Inc subsequent to its acquisition on June 30, 2013. |
(4) | Includes income of $563, or $356 net of tax, for facility consolidation expenses in 2011. |
(5) | Includes expenses of $1,556, or $1,008 net of tax, for facility consolidation expenses in 2010. |
(6) | The approximate number of record holders of our Common Stock for 2010 through 2014 includes Management's estimate of shareholders who held our Common Stock in nominee names as follows: 2010 - 1,250 shareholders; 2011 - 1,250 shareholders; 2012 - 1,255 shareholders; 2013 - 1,900 shareholders; 2014 - 2,550 shareholders. |
Item 7. MANAGEMENT'S DISCUSSION AND ANALYSIS OF FINANCIAL CONDITION AND RESULTS OF OPERATIONS
The following discussion and analysis should be read in conjunction with our consolidated financial statements and related notes appearing elsewhere in this report.
OVERVIEW
After the downturn of 2008 - 2009, we put together a growth plan to take advantage of the unique opportunities that, we believe, has driven our sales success over the last 5 years. Since 2009, our carpet product sales have grown 96%, while the industry, we estimate, grew only around 12%. While we had planned on 10% growth per year, we became capacity constrained in 2013 as our sales grew over 30%. As a result, we accelerated our plan to grow our capacity from $350 million to a range of $550 to $600 million, depending upon product mix. In addition, we made the decision to merge our two west coast dye houses as a result of the purchase of Atlas Carpet Mills (“Atlas”) in the first quarter of 2014. Further, in the fourth quarter, we decided to discontinue the Carousel brand, a small non-core line of products that was part of the 2013 Robertex acquisition (See Note 21 in Consolidated Financial Statements). Therefore, 2014 was a year of expansion and facility re-alignment which impacted virtually all of our facilities.
The investments we made have included both capital expenditures and temporary increases in operating costs due to implementation of the capacity expansion plan. We began the year by expanding capacity at Colormaster, our continuous dyeline. We completed the training and fully commissioning of our expanded Roanoke yarn facility designed to support our growth with internal supply and lessen our dependence on externally supplied yarn. We acquired and began the integration process of Atlas. We expanded our Eton residential tufting operations, doubling the number of machines in service. We realigned our Calhoun wool operations, a change designed to increase capacity and lower costs. Further, we moved the finished goods for our residential east coast business to our newly opened Adairsville facility, consolidating four warehousing operations into one facility. We added continuous yarn dyeing capability to our Colormaster facility and expanded our yarn skein dye operations in Calhoun. Similarly, we shut down our Atmore carpet and yarn dye operations, converting that mill to a dry mill dedicated to serving our Masland Contract brand. As part of this process, we de-commissioned our Atmore wastewater treatment plant. Further, on the west coast, we merged our newly acquired Atlas dye house into our Susan Street dye facility. We upgraded our machine tufted rug capability during the year with added capacity as well as installing skein dye yarn capability to support our custom wool rug programs. We purchased Burtco Enterprises, LLC (“Burtco”) and its excellence in computerized yarn placement tufting technology, using this as the foundation for our newly formed Masland Hospitality sales force. A prime focus in 2015 is on training our workforce which has increased 45% since the beginning of 2013. Further, in 2015 we are focused on improving waste, yields and efficiencies in our operations. We are seeing the positive impact of our expanded sales force, the result of our efforts in 2013 and 2014 to significantly increase our field coverage.
Several of the initiatives above were undertaken as a warehousing/distribution/manufacturing restructuring plan approved by our Board of Directors on January 20, 2014. This plan was developed to align our warehousing, distribution and manufacturing to support our growth and manufacturing strategy and to create a better cost structure and to improve distribution capabilities and customer service. The key element and first major step of this plan was securing a 292,000 square foot facility that serves as a finished goods warehouse and a cut-order and distribution center in Adairsville, Georgia on May 1, 2014. In June of 2014, the Board of Directors approved a modification of this plan to include the elimination of both carpet dyeing and yarn dyeing in our Atmore, Alabama facility designed to more fully accommodate our distribution and manufacturing realignment. As a result, the dyeing operations in Atmore were moved to our Colormaster continuous dyeing facility, our Calhoun Wool skein dyeing operation and other outside dyeing processors.
Expenses of this plan were $4.0 million in 2014 with remaining estimated expenses of $1.4 million anticipated through early 2016. These expenses primarily consist of moving and relocation expenses of inventory and equipment, facility restoration, information technology expenses and expenses relating to conversion and realignment of equipment. In addition, we incurred non-cash asset impairment charges of $1.1 million related to manufacturing and equipment taken out of service in our facilities.
On March 19, 2014, we acquired Atlas Carpet Mills. Total consideration for the acquisition was approximately $18.7 million. Atlas is a California based manufacturer and marketer of high-end commercial broadloom and tile carpeting serving soft floorcovering markets. Atlas has a strong reputation for exceptional design, quality and service. This brand will be sold through the existing Atlas sales force and will serve to broaden our product offerings for commercial applications along with our Masland Contract and Masland Hospitality brands. The existing management of Atlas will continue with the Company. Prior to the acquisition, we were a long-time supplier of yarn to Atlas through our Candlewick Yarn operation and provided certain tile manufacturing services for their tile product line. We recognized a pre-tax gain of $10.9 million on the acquisition of Atlas. We believe several factors were significant in the recognition of a gain from the acquisition of Atlas. Atlas had higher cost of dyeing due to the lack of capacity utilization and therefore needed to lower costs by combining dye facilities with another operation. In addition, Atlas had a higher cost of modular carpet tile manufacturing due to outsourcing the tile manufacturing operations. Therefore, Atlas would have had to make significant investments in product and manufacturing equipment to be competitive in the modular carpet manufacturing business. Finally, the Seller had the desire to see Atlas operated as an independent brand and organization in the future. All of these objectives were achieved in our mutually advantageous relationship (See Note 6 in the Consolidated Financial Statements).
As a part of the Atlas acquisition, we discontinued operations at the Atlas dyeing facility in Los Angeles and moved the carpet dyeing of their products to our Susan Street dyeing operation located in Santa Ana, California. As part of the acquisition, we initiated a restructuring plan to accommodate the dyeing move and address the modification of computer systems. The costs of these initiatives are expected to be approximately $1.8 million. $1.4 million of costs were incurred under this plan in 2014 and the remaining initiatives for $400 thousand are expected to be completed in 2015.
On September 22, 2014, we purchased certain assets, including specialized tufting equipment, and assumed certain liabilities from Burtco Enterprises. We believe the unique capabilities of this tufting equipment will enable us to develop products that complement our high-end, specialized commercial markets. The total consideration for the equipment, inventories and certain receivables, net of liabilities assumed was approximately $2.4 million. This transaction resulted in a pre-tax bargain purchase of $173 thousand (See Note 6 in the Consolidated Financial Statements).
We continue to see opportunities for our modular tile offerings in both the Masland Contract and Atlas markets. Further, the future opportunities in hospitality, we believe, can be capitalized upon with the creation of Masland Hospitality and leveraging our investment in Burtco and its unique position in custom computerized yarn placement tufting technology. Also, we remain optimistic about conditions that affect the higher-end residential markets we serve. We believe the actions discussed above have been, and are, necessary to position us to more fully take advantage of the markets we serve and have helped to facilitate the growth we have experienced and that we anticipate in the future.
RESULTS OF OPERATIONS
As a result of the discontinuance of the non-core Carousel brand in the fourth quarter of 2014, the operating results of Carousel have been reclassified to discontinued operations for all periods presented. Carousel was acquired as a portion of the Robertex acquisition at the beginning of the third quarter of 2013.
The following table sets forth certain elements of our continuing operations as a percentage of net sales for the periods indicated:
Fiscal Year Ended | ||||||||
December 27, 2014 | December 28, 2013 | December 29, 2012 | ||||||
Net sales | 100.0 | % | 100.0 | % | 100.0 | % | ||
Cost of sales | 76.5 | % | 75.2 | % | 75.5 | % | ||
Gross profit | 23.5 | % | 24.8 | % | 24.5 | % | ||
Selling and administrative expenses | 22.9 | % | 22.2 | % | 23.8 | % | ||
Other operating expense, net | 0.2 | % | 0.1 | % | — | % | ||
Facility consolidation expenses | 1.4 | % | — | % | — | % | ||
Impairment of assets | 0.3 | % | — | % | — | % | ||
Operating income (loss) | (1.3 | )% | 2.5 | % | 0.7 | % | ||
Fiscal Year Ended December 27, 2014 Compared with Fiscal Year Ended December 28, 2013
Net Sales. Net sales for the year ended December 27, 2014 were $406.6 million compared with $344.4 million in the year-earlier period, an increase of 18.1%, or 7.1% excluding Atlas, for the year-over-year comparison. Sales for the carpet industry were flat for annual 2014 compared with the prior year. Our 2014 year-over-year carpet sales comparison reflected an increase of 18.1% in net sales, or 7.5% excluding Atlas. Sales of residential carpet were up 8.2% and sales of commercial carpet increased 45.5%, or 5.5% excluding Atlas. Revenue from carpet yarn processing and carpet dyeing and finishing services increased $1.9 million in 2014 compared with 2013 primarily as a result of processing services performed by Atlas under an equity investment relationship. We believe our growth in both the residential and commercial sales were positively affected by the introduction of new and innovative products and the expansion of our wool product offerings.
Cost of Sales. Cost of sales, as a percentage of net sales, increased 1.3 percentage points, as a percentage of net sales in 2014 compared with 2013. The expansion and restructuring initiatives undertaken along with the expansion of our workforce negatively affected our operating results in the form of training costs, production inefficiencies, increased levels of waste and scrap and generally higher operating costs associated with the breadth and scope of activity.
Gross Profit. Gross profit increased $9.9 million in 2014 compared with 2013. The increase in gross profit was primarily attributable to higher sales. However, the gross profit dollars in 2014 were negatively impacted by our actions taken to address our capacity constraints.
Selling and Administrative Expenses. Selling and administrative expenses were $93.2 million in 2014 compared with $76.2 million in 2013, or an increase of 0.7% as a percentage of sales. Our selling expense increase as a percentage of sales was
primarily driven by the higher relative selling expense of Atlas and higher levels of investment in new products and marketing in our Masland Contract business compared with the prior year.
Other Operating (Income) Expense, Net. Net other operating (income) expense was an expense of $904 thousand in 2014 compared with expense of $494 thousand in 2013. The change in 2014 was primarily a result of an increase in losses on currency valuations and the amortization of an intangible asset associated with the 2014 Atlas acquisition.
Operating Income (Loss). Operations reflected an operating loss of $5.2 million in 2014 compared with operating income of $8.9 million in 2013. Facility consolidation expenses of $5.5 million and related asset impairment expenses of $1.1 million were included in the 2014 operating results.
Interest Expense. Interest expense increased $546 thousand in 2014 principally due to higher levels of debt to support our growth and the acquisition of capital assets under various debt arrangements.
Other (Income) Expense, Net. Other (income) expense, net was income of $154 thousand in 2014 compared with expense of $26 thousand in 2013. $209 thousand of earnings from equity investments were included in 2014.
Gain on Purchase of Businesses. During 2014, we recognized gains of $11.1 million on business acquisitions. The acquisition of Atlas resulted in a gain of $10.9 million and the acquisition of Burtco resulted in a gain of $173 thousand.
Income Tax Provision (Benefit). Our effective income tax rate was 61.0% in 2014 and included an increase of $569 thousand in increased valuation allowances related to state income tax carryforwards and state income tax credit carryforwards. Our income tax provision was a benefit of $643 thousand in 2013 on positive earnings primarily as a result of the reversal of $1.2 million of previously established reserves for state income tax loss and tax credit carryforwards. The recognition or reversal of such reserves established by taxing jurisdiction is based on a number of factors including current and forecasted earnings. Additionally, 2013 included certain tax credits of approximately $520 thousand related to the years 2009 - 2011 determined to be available for utilization and $304 thousand of 2012 research and development tax credits that could not be recognized until the extension of the credit was approved by Congress in 2013.
Loss from Discontinued Operations and Loss on Disposal of Discontinued Operations, net of tax. In the fourth quarter of 2014, we discontinued the Carousel specialty tufting and weaving operation that was part of the 2013 Robertex, Inc. acquisition. As a result, we recognized a loss on the disposal of the discontinued operation of $1.5 million, net of tax, which included the impairment of certain intangibles associated with Carousel and the related machinery and equipment. Additionally, 2014 included a loss from the discontinued Carousel operations of $598 thousand, net of tax, compared with a loss of $198 thousand, net of tax in 2013.
Net Income (Loss). Continuing operations reflected income of $673 thousand, or $0.03 per diluted share in 2014, compared with income from continuing operations of $5.6 million, or $0.42 per diluted share in 2013. Our discontinued operations reflected a loss of $608 thousand, or $0.04 per diluted share, and a loss on disposal of discontinued operations of $1.5 million, or $0.10 per diluted share in 2014 compared with a loss from discontinued operations of $266 thousand, or $0.02 per diluted share in 2013. Including discontinued operations, we had a net loss of $1.4 million, or $0.11 per diluted share, in 2014 compared with net income of $5.3 million, or $0.40 per diluted share, in 2013.
Fiscal Year Ended December 28, 2013 Compared with Fiscal Year Ended December 29, 2012
Net Sales. Net sales for the year ended December 28, 2013 were $344.4 million compared with $266.4 million in the year-earlier period, an increase of 29.3% for the year-over-year comparison. The carpet industry reported a percentage increase in the mid- single digits in net sales in 2013 compared with 2012. Our 2013 year-over-year carpet sales comparison reflected an increase of 28.6% in net sales. Sales of residential carpet were up 26.7% and sales of commercial carpet increased 34.3%. Revenue from carpet yarn processing and carpet dyeing and finishing services increased $4.1 million in 2013 compared with 2012. We believe our residential and commercial sales were positively affected primarily as a result of the introduction of new products and the expansion of our wool products.
Cost of Sales. Cost of sales, as a percentage of net sales, was basically unchanged in 2013 compared with 2012. Cost of sales in 2013 included approximately $5.1 million of costs associated with acquisitions in late 2012 and 2013 as well as certain process realignment and expansion initiatives undertaken during 2013. Cost of sales in 2012 included incremental costs of approximately $1.4 million related to tufting equipment relocations and costs related to the transition of products from our beck dyeing operations to our continuous dyeing operations acquired in the fourth quarter of 2012.
Gross Profit. Gross profit increased $20.2 million in 2013 compared with 2012. The increase in gross profit was primarily attributable to higher sales. Gross profit in 2013 and 2012 was negatively affected by the incremental costs discussed above related to costs of sales.
Selling and Administrative Expenses. Selling and administrative expenses were $76.2 million in 2013 compared with $63.5 million in 2012, a decline of 1.7 percentage points as a percentage of sales in 2013 compared with 2012. Selling and
administrative costs in 2013 included approximately $1.8 million of sampling costs incurred to incorporate the new wool products associated with the Robertex acquisition and our launch of a new tile product line. 2012 included $1.7 million related to investment in the development and sampling of new product initiatives, $409 thousand for incremental costs related to the two acquisitions and $600 thousand of costs related to management changes.
Other Operating (Income) Expense, Net. Net other operating (income) expense was $494 thousand in 2013 compared with $68 thousand in 2012. The change in 2013 was due to the disposal of certain manufacturing assets taken out of service, losses on currency valuations and settlement of a claim against a supplier.
Operating Income. Operating income was $8.9 million in 2013 compared with operating income of $1.8 million in 2012. The increase in 2013 was primarily a result of the increased level of sales in 2013, less the variable selling expenses associated with the sales increase.
Interest Expense. Interest expense increased $610 thousand in 2013 principally due to higher levels of debt to support our growth, including an increase in debt related to business acquisitions in late 2012 and during mid-2013.
Other (Income) Expense, Net. Other (income) expense, net was an expense of $26 thousand in 2013 compared to income of $277 thousand in 2012. The change was primarily the result of a $187 thousand gain recognized on the sale of a non-operating asset in 2012.
Income Tax Provision (Benefit). Our income tax provision was a benefit of $577 thousand in 2013 on positive earnings primarily as a result of the reversal of $1.2 million of previously established reserves for state income tax loss and tax credit carryforwards. The reversal of the reserves was based on a number of factors including current and future earnings assumptions by taxing jurisdiction. Additionally, 2013 included certain tax credits of approximately $520 thousand related to the years 2009 - 2011 determined to be available for utilization and $304 thousand of 2012 research and development tax credits that could not be recognized until the extension of the credit was approved by Congress in 2013. Our effective income tax benefit rate was 38.0% in 2012. The effective tax rate varied from statutory rates in 2012 primarily as a result of adjustments to estimates used in the 2011 estimated tax calculations versus amounts used in the subsequent tax return filing for the 2011 period, net of the effects of permanent differences on the lower level of pre-tax earnings in the 2012 tax calculations.
Net Income (Loss). Continuing operations reflected income of $5.6 million, or $0.42 per diluted share in 2013, compared with a loss from continuing operations of $653 thousand, or $0.05 per diluted share in 2012. Our discontinued operations reflected a loss of $266 thousand, or $0.02 per diluted share in 2013, compared with a loss of $274 thousand, or $0.02 per diluted share in 2012. Including discontinued operations, our net income was $5.3 million, or $0.40 per diluted share, in 2013 compared with a net loss of $927 thousand, or $0.07 per diluted share, in 2012.
LIQUIDITY AND CAPITAL RESOURCES
We believe our operating cash flows, credit availability under our senior loan and security agreement and other sources of financing are adequate to finance our normal foreseeable liquidity requirements. However, deterioration in our markets or significant additional cash expenditures above our normal liquidity requirements could require supplemental financing or other funding sources. There can be no assurance that such supplemental financing or other sources of funding can be obtained or will be obtained on terms favorable to us.
During the year ended December 27, 2014, we generated funds of $24.6 million from the May 2014 equity offering, net of issuance costs including the underwriter discount. Additionally, we generated $3.4 million from operating activities and $6.8 million from proceeds related to the sales of capitalized assets and the sale of an equity investment. These funds were used to finance our operations, invest $17.7 million in business acquisitions, invest $9.5 million for purchases of property, plant and equipment, reduce debt $3.5 million, $2.7 million to fund outstanding checks and $1.2 million for deposits for future equipment purchases.
Excluding assets acquired and liabilities assumed in the Atlas and Burtco acquisitions and the change in the current portion of debt, working capital increased $1.1 million in 2014. The increase in working capital was primarily a result of an increase in current deferred income tax assets offset by a decrease in accounts payable and accrued expenses.
Capital asset acquisitions for the year ended December 27, 2014, excluding those acquired in business acquisitions, were $32.8 million; $9.5 million through funded debt and $23.3 million of assets acquired under capital leases and notes payable, while depreciation and amortization was $12.9 million. We expect capital expenditures to be approximately $13.5 million in 2015 while depreciation and amortization is expected to be approximately $14.1 million. Planned capital expenditures in 2015 are primarily for new equipment.
Debt Facilities
On March 14, 2014, we amended our senior credit facility ("amended senior credit facility"), effective as of March 19, 2014 to permit the acquisition of Atlas Carpet Mills, Inc. by means of an over advance ("Tranche B Advance") of $5.4 million which
increased to $5.8 million and matured on June 30, 2014. The Tranche B Advance bore interest at a rate of 3.50% plus LIBOR, subject also to various availability percentages, limitations, covenants and conditions. In addition, the revolving portion of the facility ("Tranche A Advance") provides for a maximum of $150.0 million of revolving credit, subject to borrowing base availability. The borrowing base is currently equal to specified percentages of our eligible accounts receivable, inventories, fixed assets and real property less reserves established, from time to time, by the administrative agent under the facility. In addition, the term of the amended senior credit facility was extended from August 1, 2018 to March 14, 2019.
At our election, Tranche A Advances of the amended senior credit facility bears interest at annual rates equal to either (a) LIBOR for 1, 2 or 3 month periods, as selected by us, plus an applicable margin of either 1.50%, 1.75% or 2.00%, or (b) the higher of the prime rate, the Federal Funds rate plus 0.5%, or a daily LIBOR rate plus 1.00%, plus an applicable margin of either 0.50%, 0.75% or 1.00%. The applicable margin is determined based on availability under the amended senior credit facility with margins increasing as availability decreases. We pay an unused line fee on the average amount by which the aggregate commitments exceed utilization of the senior credit facility equal to 0.375% per annum.
The amended senior credit facility includes certain affirmative and negative covenants that impose restrictions on our financial and business operations. The amended senior credit facility required us to maintain a fixed charge coverage ratio of 1.1 to 1.0 during any period that borrowing availability was less than $14.4 million through May 31, 2014 and increased to $16.5 million after May 31, 2014. The amendment also provided for a waiver of the measurement and application of the fixed charge coverage ratio that would otherwise have been required by a reduction in excess availability from March 14, 2014 through and including April 13, 2014.
The weighted-average interest rate on borrowings outstanding under the amended senior credit facility was 2.29% at December 27, 2014 and 2.66% at December 28, 2013. As of December 27, 2014, the unused borrowing availability under the amended senior credit facility was $40.2 million.
Notes Payable - Buildings. On November 7, 2014, we entered into a ten-year $8.3 note payable to purchase a previously leased distribution center in Adairsville, Georgia. The note payable is scheduled to mature on November 7, 2024 and is secured by the distribution center. The note payable bears interest at a variable rate equal to one month LIBOR plus 2.0% and is payable in equal monthly installments of principal of $35, plus interest calculated on the declining balance of the note, with a final payment of $4,165 due on maturity. In addition, we entered into an interest swap with an amortizing notional amount effective November 7, 2014 which effectively fixes the interest rate at 4.50%.
On January 23, 2015, we entered into a ten-year $6,290 note payable to finance an owned facility in Saraland, Alabama. The note payable is scheduled to mature on January 7, 2025 and is secured by the facility. The note payable bears interest at a variable rate equal to one month LIBOR plus 2.0% and is payable in equal monthly installments of principal of $26, plus interest calculated on the declining balance of the note, with a final payment of $3,145 due on maturity. In addition, we entered into a forward interest rate swap with an amortizing $5.7 million notional amount effective January 7, 2017 which effectively fixes the interest rate at 4.30%.
Obligation to Development Authority of Gordon County. On November 2, 2012, we signed a 6% seller-financed note of $5.5 million with Lineage PCR, Inc. (“Lineage”) related to the acquisition of the continuous carpet dyeing facility in Calhoun, Georgia. Effective December 28, 2012 through a series of agreements between us, the Development Authority of Gordon County, Georgia (the “Authority”) and Lineage, obligations with identical payment terms as the original note to Lineage are now payment obligations to the Authority. These transactions were consummated in order to provide us with a tax abatement to the related real estate and equipment at this facility. The tax abatement plan provides for abatement for certain components of the real and personal property taxes for up to ten years. At any time, we have the option to pay off the obligation, plus a nominal amount. The debt to the Authority bears interest at 6% and is payable in equal monthly installments of principal and interest of $106 thousand over 57 months.
Note Payable - Robertex Acquisition. On July 1, 2013, we signed a 4.5% seller-financed note of $4.0 million, which was recorded at a fair value of $3.7 million with Robert P. Rothman related to the acquisition of Robertex Associates, LLC ("Robertex") in Calhoun, Georgia. The note is payable in five annual installments of principal of $800 thousand plus interest. The note matures June 30, 2018.
Equipment Notes Payable. Our equipment financing notes have terms ranging from three to seven years, are secured by the specific equipment financed, bear interest ranging from 1.00% to 6.86% and are due in monthly installments of principal and interest ranging from $1 thousand to $53 thousand through December 2021. The notes do not contain financial covenants. (See Note 10 to our Consolidated Financial Statements).
Capital Lease Obligations. Our capital lease obligations have terms ranging from four to seven years, are secured by the specific equipment leased, bear interest ranging from 2.90% to 7.37% and are due in monthly installments of principal and interest ranging from $1 thousand to $43 thousand through January 2022. (See Note 10 to our Consolidated Financial Statements).
Equity Offering
On May 20, 2014, we completed a public offering of 2.5 million shares of our common stock. Net proceeds from the offering were $24.6 million and were used to reduce the balance under our revolving credit facility and to pay off the $5.8 million Tranche B Advance associated with the recent acquisition of Atlas Carpet Mills which matured on June 30, 2014.
Contractual Obligations
The following table summarizes our future minimum payments under contractual obligations as of December 27, 2014.
Payments Due By Period | |||||||||||||||||||||||||||
(dollars in millions) | |||||||||||||||||||||||||||
2015 | 2016 | 2017 | 2018 | 2019 | Thereafter | Total | |||||||||||||||||||||
Debt | $ | 6.3 | $ | 5.4 | $ | 4.9 | $ | 3.7 | $ | 84.8 | $ | 7.2 | 112.3 | ||||||||||||||
Interest - debt (1) | 3.4 | 3.8 | 3.8 | 3.6 | 2.2 | 3.7 | 20.5 | ||||||||||||||||||||
Capital leases | 2.8 | 2.9 | 2.9 | 2.7 | 1.5 | 2.3 | 15.1 | ||||||||||||||||||||
Interest - capital leases | 0.7 | 0.6 | 0.4 | 0.3 | 0.2 | 0.1 | 2.3 | ||||||||||||||||||||
Operating leases | 3.1 | 2.5 | 2.2 | 1.9 | 1.1 | 1.5 | 12.3 | ||||||||||||||||||||
Purchase commitments | 5.9 | 0.7 | 0.1 | — | — | — | 6.7 | ||||||||||||||||||||
Totals | 22.2 | 15.9 | 14.3 | 12.2 | 89.8 | 14.8 | 169.2 | ||||||||||||||||||||
(1) Interest rates used for variable rate debt were those in effect at December 27, 2014.
Stock-Based Awards
We recognize compensation expense related to share-based stock awards based on the fair value of the equity instrument over the period of vesting for the individual stock awards that were granted. At December 27, 2014, the total unrecognized compensation expense related to unvested restricted stock awards was $1.8 million with a weighted-average vesting period of 3.6 years. At December 27, 2014, there was no unrecognized compensation expense related to unvested stock options
Off-Balance Sheet Arrangements
We have no off-balance sheet arrangements at December 27, 2014 or December 28, 2013.
Income Tax Considerations
During 2014, our tax provision of $1.1 million included $569 thousand of increase in our valuation allowances related to state income tax loss carryforwards and state income tax credit carryforwards. The reserve increase was based on a number of factors including current and future earnings assumptions by taxing jurisdiction.
During 2015, we anticipate cash outlays for income taxes to be approximately $3.0 million less than our provision for 2015. For 2016 and 2017, we expect our cash outlay for taxes to exceed our tax provision based on the anticipated differences between the book basis and tax basis of long-lived, depreciable assets. Such differences could be in the range of $2.0 million to $3.0 million in each of the periods, although further utilization of tax loss carryforwards and tax credit carryforwards could reduce such differences. At December 27, 2014, we were in a net deferred tax asset position of $3.3 million. We performed an analysis, including an evaluation of certain tax planning strategies available to us, related to the net deferred tax asset and believe that the net deferred tax asset is recoverable in future periods. Approximately $8.7 million of future taxable income would be required to realize the deferred tax asset.
Discontinued Operations - Environmental Contingencies
We have reserves for environmental obligations established at five previously owned sites that were associated with our discontinued textile businesses. Each site has a Corrective Action Plan (“CAP”) with the applicable authoritative state regulatory body responsible for oversight for environmental compliance. The CAP for four of these sites involves natural attenuation (degradation of the contaminants through naturally occurring events) over periods estimated at 10 to 20 years and the CAP on the remaining site involves a pump and treat remediation process, estimated to occur over a period of 25 years. Additionally, we have a reserve for an environmental liability on the property of a facility and related business that was sold in 2004. The CAP has a specified remaining remediation term estimated to be 3 years subsequent to 2014. The total costs for remediation for all of these sites during 2014 were $136 thousand, all of which related to normal ongoing remediation costs. We expect normal remediation costs to range from approximately $50 thousand to $150 thousand annually. We have a reserve of $1.6 million for environmental liabilities at these sites as of December 27, 2014. The liability established represents our best estimate of loss
and is the reasonable amount to which there is any meaningful degree of certainty given the periods of estimated remediation and the dollars applicable to such remediation for those periods. The actual timeline to remediate, and thus, the ultimate cost to complete such remediation through these remediation efforts, may differ significantly from our estimates. Pre-tax costs for environmental remediation obligations classified as discontinued operations were primarily a result of specific events requiring action and additional expense in each period.
Fair Value of Financial Instruments
At December 27, 2014, we had $1.9 million of liabilities measured at fair value that fall under a level 3 classification in the hierarchy (those subject to significant management judgment or estimation).
Certain Related Party Transactions
During 2014, we purchased a portion of our requirements for polyester fiber from Engineered Floors, an entity controlled by Robert E. Shaw. Mr. Shaw reported holding approximately 8.5% of our Common Stock, which as of year-end represented approximately 4% of the total vote of all classes of our Common Stock. Engineered Floors is our principal supplier of polyester fiber and polyester broadloom carpet. Total purchases from Engineered Floors for 2014 and 2013 were approximately $11.3 million and $12.0 million, respectively; or approximately 3.6% and 4.7% of our consolidated costs of sales in 2014 and 2013, respectively. Purchases from Engineered Floors are based on market value, negotiated prices. We have no contractual arrangements or commitments with Mr. Shaw associated with our business relationship with Engineered Floors. Transactions with Engineered Floors were reviewed and approved by our board of directors.
During 2013, we entered into a 10-year lease with the Rothman Family Partnership to lease a manufacturing facility as part of the Robertex acquisition. The Rothman Family Partnership includes Robert P. Rothman who is an associate of the Company. Rent paid to the Rothman Family Partnership during 2014 was $257 thousand. The lease was based on current market values for similar facilities.
During 2014, we entered into a 5-year lease with the seller of Atlas Carpet Mills, Inc. to lease three manufacturing facilities as part of the acquisition. The seller is an associate of the Company. Rent paid to the seller during 2014 was $343. The lease was based on current market values for similar facilities.
Recent Accounting Pronouncements
In December 2011, the Financial Accounting Standards Board ("FASB") issued ASU No. 2011-11, “Balance Sheet (Topic 210): Disclosures about Offsetting Assets and Liabilities.” The amendments in this ASU required an entity to disclose information about offsetting assets and liabilities and related arrangements to enable users of its financial statements to understand the effect of those arrangements on its financial position. An entity was required to apply the amendments for annual reporting periods beginning on or after January 1, 2013, and interim periods within those annual periods. An entity had to provide the disclosures required by those amendments retrospectively for all comparative periods presented. In January 2013, the FASB issued ASU No. 2013-01, "Balance Sheet (Topic 210)-Clarifying the Scope of Disclosures about Offsetting Assets and Liabilities". The ASU clarified that ordinary trade receivables and payables were not in the scope of ASU No. 2011-11. ASU No. 2011-11 applied only to derivatives, repurchase agreements and reverse purchase agreements, and securities borrowing and securities lending transactions that were either offset in accordance with specific criteria contained in the Codification or subject to a master netting arrangement or similar agreement. The effective date was the same as the effective date of ASU 2011-11. The adoption of these ASUs did not have a material effect on our Consolidated Financial Statements.
In February 2013, the FASB issued ASU No. 2013-04, "Liabilities (Topic 405): Obligations Resulting from Joint and Several Liability Arrangements for Which the Total Amount of the Obligation Is Fixed at the Reporting Date". This ASU provided guidance for the recognition, measurement, and disclosure of obligations resulting from joint and several liability arrangements for which the total amount of the obligation within the scope of this guidance was fixed at the reporting date, except for obligations addressed within existing guidance in GAAP. For public entities, the ASU was effective for fiscal years, and interim periods within those years, beginning after December 15, 2013. The ASU shall be applied retrospectively to all prior periods presented for those obligations within the scope of this Subtopic that existed at the beginning of an entity's fiscal year of adoption. Early adoption was permitted. The adoption of this ASU did not have a material effect on our Consolidated Financial Statements.
In July 2013, the FASB issued ASU No. 2013-11, "Income Taxes (Topic 740) - Presentation of an Unrecognized Tax Benefit When a Net Operating Loss Carryforward, a Similar Tax Loss, or a Tax Credit Carryforward Exists". This ASU required an unrecognized tax benefit, or a portion of an unrecognized tax benefit, to be presented in the financial statements as a reduction to a deferred tax asset for a net operating loss carryforward, a similar tax loss, or a tax credit carryforward, except to the extent that a net operating loss carryforward, a similar tax loss, or a tax credit carryforward was not available at the reporting date, the unrecognized tax benefit will be presented in the financial statements as a liability and not combined with deferred tax assets. This ASU was effective for annual and interim periods beginning after December 15, 2013, with early adoption permitted. The adoption of this ASU did not have a material effect on our Consolidated Financial Statements.
In April 2014, the Financial Accounting Standards Board ("FASB") issued ASU No. 2014-08, "Presentation of Financial Statements (Topic 205) and Property, Plant, and Equipment (Topic 360) - Reporting Discontinued Operations and Disclosures of Disposals of Components of an Entity". The ASU was issued to change the requirements for reporting discontinued operations and to enhance the disclosures in this area. The ASU requires a disposal of a component of an entity or a group of components of an entity to be reported in discontinued operations if the disposal represents a strategic shift and will have a major effect on an entity's operations and financial results. The ASU will be effective prospectively for interim and annual reporting periods beginning after December 15, 2014. The adoption of this ASU will only impact the reporting and disclosures of future disposals, if any.
In May 2014, the FASB issued ASU No. 2014-09, "Revenue from Contracts with Customers (Topic 606)". The ASU requires an entity to recognize the amount of revenue to which it expects to be entitled for the transfer of promised goods or services to customers. The ASU will replace most existing revenue recognition guidance in U.S. GAAP when it becomes effective. The new standard is effective for annual reporting periods beginning after December 15, 2016, including interim periods within that reporting period. Early application is not permitted. The standard permits the use of either the retrospective or cumulative effect transition method. We have not yet selected a transition method. We will be evaluating the effect that the ASU will have on our Consolidated Condensed Financial Statements and related disclosures
In August 2014, the FASB issued ASU No. 2014-15, "Presentation of Financial Statements - Going Concern (Subtopic 205-40): Disclosure of Uncertainties about an Entity's Ability to Continue as a Going Concern." The guidance requires an entity to evaluate whether there are conditions or events, in the aggregate, that raise substantial doubt about the entity’s ability to continue as a going concern within one year after the date that the financial statements are issued and to provide related footnote disclosures in certain circumstances. The guidance is effective for the annual period ending after December 15, 2016, and for annual and interim periods thereafter. Early application is permitted. We do not believe the adoption of this ASU will have a significant impact on our Consolidated Condensed Consolidated Financial Statements
Critical Accounting Policies
Certain estimates and assumptions are made when preparing our financial statements. Estimates involve judgments with respect to, among other things, future economic factors that are difficult to predict. As a result, actual amounts could differ from estimates made when our financial statements are prepared.
The Securities and Exchange Commission requires management to identify its most critical accounting policies, defined as those that are both most important to the portrayal of our financial condition and operating results and the application of which requires our most difficult, subjective, and complex judgments. Although our estimates have not differed materially from our experience, such estimates pertain to inherently uncertain matters that could result in material differences in subsequent periods.
We believe application of the following accounting policies require significant judgments and estimates and represent our critical accounting policies. Other significant accounting policies are discussed in Note 1 to our Consolidated Financial Statements.
• | Revenue recognition. Revenues, including shipping and handling amounts, are recognized when the following criteria are met: there is persuasive evidence that a sales agreement exists, delivery has occurred or services have been rendered, the price to the buyer is fixed or determinable, and collection is reasonably assured. Delivery is considered to have occurred when the customer takes title to products, which is generally on the date of shipment. At the time revenue is recognized, we record a provision for the estimated amount of future returns based primarily on historical experience and any known trends or conditions. |
• | Accounts receivable allowances. We provide allowances for expected cash discounts and doubtful accounts based upon historical experience and periodic evaluations of the financial condition of our customers. If the financial conditions of our customers were to significantly deteriorate, or other factors impair their ability to pay their debts, credit losses could differ from allowances recorded in our Consolidated Financial Statements. |
• | Customer claims and product warranties. We provide product warranties related to manufacturing defects and specific performance standards for our products. We record reserves for the estimated costs of defective products and failure to meet applicable performance standards. The levels of reserves are established based primarily upon historical experience and our evaluation of pending claims. Because our evaluations are based on historical experience and conditions at the time our financial statements are prepared, actual results could differ from the reserves in our Consolidated Financial Statements. |
• | Inventories. Inventories are stated at the lower of cost or market. Cost is determined using the last-in, first-out method (LIFO), which generally matches current costs of inventory sold with current revenues, for substantially all inventories. Reserves are also established to adjust inventories that are off-quality, aged or obsolete to their estimated net realizable value. Additionally, rates of recoverability per unit of off-quality, aged or obsolete inventory are estimated based on historical rates of recoverability and other known conditions or circumstances that may affect future recoverability. Actual results could differ from assumptions used to value our inventory. |
• | Goodwill. Goodwill is tested annually for impairment during the fourth quarter or earlier if significant events or substantive changes in circumstances occur that may indicate that goodwill may not be recoverable. The goodwill impairment tests are based on determining the fair value of the specified reporting units based on management judgments and assumptions using the discounted cash flows. The valuation approaches are subject to key judgments and assumptions that are sensitive to change such as judgments and assumptions about sales growth rates, operating margins and the weighted average cost of capital (“WACC”). When developing these key judgments and assumptions, we consider economic, operational and market conditions that could impact the fair value of the reporting unit. However, estimates are inherently uncertain and represent only management’s reasonable expectations regarding future developments. These estimates and the judgments and assumptions upon which the estimates are based will, in all likelihood, differ in some respects from actual future results. Should a significant or prolonged deterioration in economic conditions occur key judgments and assumptions could be impacted. |
• | Contingent Consideration. Contingent consideration liabilities represent future amounts we may be required to pay in conjunction with various business combinations. The ultimate amount of future payments is based on sales levels for one contingent liability and incremental gross margin growth related to another contingent liability. We estimate the fair value of the contingent consideration liability related to sales levels by forecasting estimated cash payments based on projected sales and discounting the cash payment to its present value using a risk-adjusted rate of return. We estimate the fair value of the contingent consideration liability associated with incremental gross margin growth by employing Monte Carlo simulations to estimate the volatility and systematic relative risk of gross margin levels and discounting the associated cash payment amounts to their present values using a credit-risk-adjusted interest rate. We evaluate our estimates of the fair value of contingent consideration liabilities on a periodic basis. Any changes in the fair value of contingent consideration liabilities are recorded through earnings. The total estimated fair value of contingent consideration liabilities was $1.9 million and $2.8 million at December 27, 2014 and December 28, 2013, respectively, and was included in accrued expenses and other liabilities in our consolidated balance sheets. |
• | Self-insured accruals. We estimate costs required to settle claims related to our self-insured medical, dental and workers' compensation plans. These estimates include costs to settle known claims, as well as incurred and unreported claims. The estimated costs of known and unreported claims are based on historical experience. Actual results could differ from assumptions used to estimate these accruals. |
• | Income taxes. The Company’s effective tax rate is based on its income, statutory tax rates and tax planning opportunities available in the jurisdictions in which it operates. Tax laws are complex and subject to different interpretations by the taxpayer and respective governmental taxing authorities. Deferred tax assets represent amounts available to reduce income taxes payable on taxable income in a future period. The Company evaluates the recoverability of these future tax benefits by assessing the adequacy of future expected taxable income from all sources, including reversal of taxable temporary differences, forecasted operating earnings and available tax planning strategies. These sources of income inherently rely on estimates, including business forecasts and other projections of financial results over an extended period of time. In the event that the Company is not able to realize all or a portion of its deferred tax assets in the future, a valuation allowance is provided. The Company would recognize such amounts through a charge to income in the period in which that determination is made or when tax law changes are enacted. The Company had valuation allowances of $4.3 million at December 27, 2014 and $3.7 million at December 28, 2013. For further information regarding the Company’s valuation allowances, see Note 14 to the consolidated financial statements. |
• | Loss contingencies. We routinely assess our exposure related to legal matters, environmental matters, product liabilities or any other claims against our assets that may arise in the normal course of business. If we determine that it is probable a loss has been incurred, the amount of the loss, or an amount within the range of loss, that can be reasonably estimated will be recorded. |
Item 7A. QUANTITATIVE AND QUALITATIVE DISCLOSURES ABOUT MARKET RISK (Dollars in thousands)
Our earnings, cash flows and financial position are exposed to market risks relating to interest rates, among other factors. It is our policy to minimize our exposure to adverse changes in interest rates and manage interest rate risks inherent in funding our Company with debt. We address this financial exposure through a risk management program that includes maintaining a mix of fixed and floating rate debt and the use of interest rate swap agreements (See Note 12 to the Consolidated Financial Statements).
At December 27, 2014, $57,897, or approximately 45% of our total debt, was subject to floating interest rates. A 10% fluctuation in the variable interest rates applicable to this floating rate debt would have an annual after-tax impact of approximately $5 thousand.
Item 8. | FINANCIAL STATEMENTS AND SUPPLEMENTARY DATA |
The supplementary financial information required by ITEM 302 of Regulation S-K is included in PART II, ITEM 5 of this report and the Financial Statements are included in a separate section of this report.
Item 9. | CHANGES IN AND DISAGREEMENTS WITH ACCOUNTANTS ON ACCOUNTING AND FINANCIAL DISCLOSURE |
None.
Item 9A. CONTROLS AND PROCEDURES
(a) Evaluation of Disclosure Controls and Procedures. We maintain disclosure controls and procedures to ensure that information required to be disclosed in the reports that we file or submit under the Exchange Act is recorded, processed, summarized and reported within the time periods specified in the Commission’s rules and forms and is accumulated and communicated to management, including our principal executive officer and principal financial officer, or persons performing similar functions, as appropriate to allow timely decisions regarding required disclosure. Our management, under the supervision and with the participation of our Chief Executive Officer (“CEO”) and Chief Financial Officer (“CFO”) evaluated the effectiveness of the design and operation of our disclosure controls and procedures (as such terms are defined in Rules 13(a)-15(e) and 15(d)-15(e)) under the Securities Exchange Act of 1934, as amended (the “Exchange Act”) as of December 27, 2014, the date of the financial statements included in this Form 10-K (the “Evaluation Date”). Based on that evaluation, our CEO and CFO concluded that our disclosure controls and procedures were effective as of the Evaluation Date.
We acquired Atlas on March 19, 2014 and Burtco on September 22, 2014. Since the date of these acquisitions, we have been analyzing and evaluating procedures and controls of Atlas and Burtco to determine their effectiveness and to make them consistent with our disclosure controls and procedures. We have made changes to their procedures and controls and expect to make additional changes to those controls in the future. Prior to these acquisitions, neither Atlas nor Burtco were required to maintain disclosure controls and procedures or document and assess internal control over financial reporting, in each case as required under the rules and regulations of the U.S. Securities and Exchange Commission. As permitted by guidance issued by the staff of the U.S. Securities and Exchange Commission, Atlas and Burtco have been excluded from the scope of our discussion of material changes in internal control over financial reporting below. Atlas was included in our results of operations subsequent to our acquisition on March 19, 2014 and Burtco was included subsequent to our acquisition on September 22, 2014 and together constituted 9.7% of our consolidated revenues for the year ended December 27, 2014 and 7.3% of consolidated assets as of December 27, 2014.
(b) Changes in Internal Control over Financial Reporting. No changes in our internal control over financial reporting occurred during the quarter covered by this report that materially affected, or are reasonably likely to materially affect, our internal control over financial reporting except as described above with respect to Atlas and Burtco. Changes to processes, information technology systems, and other components of internal control over financial reporting resulting from the acquisition of Atlas and Burtco, as described above, are expected as the integration proceeds.
Internal control over financial reporting cannot provide absolute assurance of achieving financial reporting objectives because of its inherent limitations. Internal control over financial reporting is a process that involves human diligence and compliance and is subject to lapses in judgment and breakdowns resulting from human failures, as well as diverse interpretation of U. S. generally accepted accounting principles by accounting professionals. It is also possible that internal control over financial reporting can be circumvented by collusion or improper management override. Because of such limitations, there is a risk that material misstatements may not be prevented or detected on a timely basis by internal control over financial reporting. Furthermore, projections of any evaluation of effectiveness to future periods are subject to the risk that controls may become inadequate because of changes in conditions, or that the degree of compliance with the policies or procedures may deteriorate. These inherent limitations are known features of the financial reporting process; therefore, while it is possible to design into the process safeguards to reduce such risk, it is not possible to eliminate all risk.
Our management report on internal control over financial reporting and the report of our independent registered public accounting firm on our internal control over financial reporting are contained in Item 15(a)(1) of this report.
Item 9B. | OTHER INFORMATION |
None.
PART III.
Item 10. | DIRECTORS, EXECUTIVE OFFICERS AND CORPORATE GOVERNANCE |
The sections entitled "Information about Nominees for Director" and "Section 16(a) Beneficial Ownership Reporting Compliance" in the Proxy Statement of the registrant for the annual meeting of shareholders to be held April 28, 2015 is incorporated herein by reference. Information regarding the executive officers of the registrant is presented in PART I of this report.
We adopted a Code of Business Conduct and Ethics (the "Code of Ethics") which applies to our principal executive officer, principal financial officer and principal accounting officer or controller, and any persons performing similar functions. A copy of the Code of Ethics is incorporated by reference herein as Exhibit 14 to this report.
Audit Committee Financial Expert
The Board has determined that John W. Murrey, III is an audit committee financial expert as defined by Item 407 (e)(5) of Regulation S-K of the Securities Exchange Act of 1934, as amended, and is independent within the meaning of the applicable Securities and Exchange Commission rules and NASDAQ standards. For a brief listing of Mr. Murrey's relevant experience, please refer to the "Election of Directors" section of the Company's Proxy Statement.
Audit Committee
We have a standing audit committee. At December 27, 2014, members of our audit committee are John W. Murrey, III, Chairman, William F. Blue, Jr., Charles E. Brock, J. Don Brock, Walter W. Hubbard, Lowry F. Kline, Hilda W. Murray and Michael L. Owens.
Item 11. | EXECUTIVE COMPENSATION |
The sections entitled "Compensation Discussion and Analysis", "Executive Compensation Information" and "Director Compensation" in the Proxy Statement of the registrant for the annual meeting of shareholders to be held April 28, 2015 are incorporated herein by reference.
Item 12. | SECURITY OWNERSHIP OF CERTAIN BENEFICIAL OWNERS AND MANAGEMENT AND RELATED STOCKHOLDER MATTERS |
The section entitled "Principal Shareholders", as well as the the beneficial ownership table (and accompanying notes), in the Proxy Statement of the registrant for the annual meeting of shareholders to be held April 28, 2015 is incorporated herein by reference.
Equity Compensation Plan Information as of December 27, 2014
The following table sets forth information as to our equity compensation plans as of the end of the 2014 fiscal year:
(a) | (b) | (c) | |||||||
Plan Category | Number of securities to be issued upon exercise of the outstanding options, warrants and rights | Weighted-average exercise price of outstanding options, warrants and rights | Number of securities remaining available for future issuance under equity compensation plans (excluding securities reflected in column (a) | ||||||
Equity Compensation Plans approved by security holders | 548,594 | (1) | $ | 9.60 | (2) | 646,504 | |||
(1) | Does not include 357,239 shares issued but unvested Common Stock pursuant to restricted stock grants under our 2006 Stock Awards Plan, with a weighted-average grant date value of $7.92 per share. |
(2) | Includes the aggregate weighted-average of (i) the exercise price per share for outstanding options to purchase 333,985 shares of Common Stock under our 2000 Stock Incentive Plan and 105,250 shares of Common Stock under our 2006 Stock Awards Plan and (ii) the price per share of the Common Stock on the grant date for each of 109,359 Performance Units issued under the Directors' Stock Plan (each unit equivalent to one share of Common Stock). |
Item 13. | CERTAIN RELATIONSHIPS AND RELATED TRANSACTIONS, AND DIRECTOR INDEPENDENCE |
The section entitled "Certain Transactions Between the Company and Directors and Officers" in the Proxy Statement of the registrant for the annual meeting of shareholders to be held April 28, 2015 is incorporated herein by reference.
Item 14. | PRINCIPAL ACCOUNTING FEES AND SERVICES |
The section entitled "Audit Fees Discussion" in the Proxy Statement of the Registrant for the Annual Meeting of Shareholders to be held April 28, 2015 is incorporated herein by reference.
PART IV.
Item 15. | EXHIBITS AND FINANCIAL STATEMENT SCHEDULES. |
(a) | (1) Financial Statements - The response to this portion of Item 15 is submitted as a separate section of this report. |
(2) Financial Statement Schedules - The response to this portion of Item 15 is submitted as a separate section of this report.
(3) Exhibits - Please refer to the Exhibit Index which is attached hereto.
(b) | Exhibits - The response to this portion of Item 15 is submitted as a separate section of this report. See Item 15(a)(3) above. |
(c) | Financial Statement Schedules - The response to this portion of Item 15 is submitted as a separate section of this report. See Item 15(a)(2) |
SIGNATURES
Pursuant to the requirements of Section 13 or 15(d) of the Securities Exchange Act of 1934, the registrant has duly caused this report to be signed on its behalf by the undersigned, thereunto duly authorized.
Date: March 12, 2015 | The Dixie Group, Inc. | |
/s/ DANIEL K. FRIERSON | ||
By: Daniel K. Frierson | ||
Chairman of the Board and Chief Executive Officer | ||
Pursuant to the requirements of the Securities Exchange Act of 1934, this report has been signed below by the following persons on behalf of the registrant and in the capacities and on the dates indicated.
Signature | Capacity | Date | ||
/s/ DANIEL K. FRIERSON | Chairman of the Board, Director and Chief Executive Officer | March 12, 2015 | ||
Daniel K. Frierson | ||||
/s/ JON A. FAULKNER | Vice President, Chief Financial Officer | March 12, 2015 | ||
Jon A. Faulkner | ||||
/s/ D. KENNEDY FRIERSON, JR. | Vice President, Chief Operating Officer and Director | March 12, 2015 | ||
D. Kennedy Frierson, Jr. | ||||
/s/ D. EUGENE LASATER | Controller | March 12, 2015 | ||
D. Eugene Lasater | ||||
/s/ WILLIAM F. BLUE, JR. | Director | March 12, 2015 | ||
William F. Blue, Jr. | ||||
/s/ CHARLES E. BROCK | Director | March 12, 2015 | ||
Charles E. Brock | ||||
/s/ WALTER W. HUBBARD | Director | March 12, 2015 | ||
Walter W. Hubbard | ||||
/s/ LOWRY F. KLINE | Director | March 12, 2015 | ||
Lowry F. Kline | ||||
/s/ HILDA S. MURRAY | Director | March 12, 2015 | ||
Hilda S. Murray | ||||
/s/ JOHN W. MURREY, III | Director | March 12, 2015 | ||
John W. Murrey, III | ||||
/s/ MICHAEL L. OWENS | Director | March 12, 2015 | ||
Michael L. Owens | ||||
ANNUAL REPORT ON FORM 10-K
ITEM 8 AND ITEM 15(a)(1) AND ITEM 15(a)(2)
LIST OF FINANCIAL STATEMENTS AND FINANCIAL STATEMENT SCHEDULES
FINANCIAL STATEMENTS
FINANCIAL STATEMENT SCHEDULES
YEAR ENDED DECEMBER 27, 2014
THE DIXIE GROUP, INC.
CHATTANOOGA, TENNESSEE
FORM 10-K - ITEM 8 and ITEM 15(a)(1) and (2)
THE DIXIE GROUP, INC. AND SUBSIDIARIES
LIST OF FINANCIAL STATEMENTS AND FINANCIAL STATEMENT SCHEDULES
The following consolidated financial statements and financial statement schedules of The Dixie Group, Inc. and subsidiaries are included in Item 8 and Item 15(a)(1) and 15(c):
Table of Contents | Page |
All other schedules for which provision is made in the applicable accounting regulation of the Securities and Exchange Commission are not required under the related instructions, or are inapplicable, or the information is otherwise shown in the financial statements or notes thereto, and therefore such schedules have been omitted.
Management's Report on Internal Control Over Financial Reporting
Our management is responsible for establishing and maintaining adequate internal control over financial reporting, as such term is defined in Rule 13a-15(f) under the Securities Exchange Act of 1934, as amended.
Internal control over financial reporting cannot provide absolute assurance of achieving financial reporting objectives because of its inherent limitations. Internal control over financial reporting is a process that involves human diligence and compliance and is subject to lapses in judgment and breakdowns resulting from human failures, as well as diverse interpretation of U. S. generally accepted accounting principles by accounting professionals. It is also possible that internal control over financial reporting can be circumvented by collusion or improper management override. Because of such limitations, there is a risk that material misstatements may not be prevented or detected on a timely basis by internal control over financial reporting. Furthermore, projections of any evaluation of effectiveness to future periods are subject to the risk that controls may become inadequate because of changes in conditions, or that the degree of compliance with the policies or procedures may deteriorate. These inherent limitations are known features of the financial reporting process; therefore, while it is possible to design into the process safeguards to reduce such risk, it is not possible to eliminate all risk. Our internal control over financial reporting has been audited by Dixon Hughes Goodman LLP an independent registered public accounting firm, as stated in their report on internal control over financial reporting as of December 27, 2014.
As permitted by guidance provided by the Staff of the U.S. Securities and Exchange Commission, the scope of management’s assessment of internal control over financial reporting as of December 27, 2014 has excluded Atlas Carpet Mills (Atlas) and Burtco Enterprises, Inc. (Burtco). Atlas and Burtco constituted 9.7% of consolidated revenues for the year ended December 27, 2014 and 7.3% of consolidated assets of December 27, 2014.
Management, including our principal executive officer and principal financial officer, has used the criteria set forth in the report entitled “Internal Control - Integrated Framework” published by the Committee of Sponsoring Organizations of the Treadway Commission (2013 framework) to evaluate the effectiveness of its internal control over financial reporting. Management has concluded that its internal control over financial reporting was effective as of December 27, 2014, based on those criteria.
Daniel K. Frierson
Chairman of the Board and
Chief Executive Officer
Jon A. Faulkner
Chief Financial Officer
Report of Independent Registered Public Accounting Firm
The Board of Directors and Shareholders of The Dixie Group, Inc.
We have audited The Dixie Group, Inc.'s (the “Company”) internal control over financial reporting as of December 27, 2014, based on criteria established in Internal Control-Integrated Framework (2013) issued by the Committee of Sponsoring Organizations of the Treadway Commission. The Company’s management is responsible for maintaining effective internal control over financial reporting and for its assessment of the effectiveness of internal control over financial reporting, included in the accompanying Management’s Annual Report on Internal Control Over Financial Reporting. Our responsibility is to express an opinion on the Company's internal control over financial reporting based on our audit.
We conducted our audit in accordance with the standards of the Public Company Accounting Oversight Board (United States). Those standards require that we plan and perform the audit to obtain reasonable assurance about whether effective internal control over financial reporting was maintained in all material respects. Our audit included obtaining an understanding of internal control over financial reporting, assessing the risk that a material weakness exists, and testing and evaluating the design and operating effectiveness of internal control based on the assessed risk. Our audit also included performing such other procedures as we considered necessary in the circumstances. We believe that our audit provides a reasonable basis for our opinion.
A company's internal control over financial reporting is a process designed to provide reasonable assurance regarding the reliability of financial reporting and the preparation of financial statements for external purposes in accordance with generally accepted accounting principles. A company's internal control over financial reporting includes those policies and procedures that (1) pertain to the maintenance of records that, in reasonable detail, accurately and fairly reflect the transactions and dispositions of the assets of the company; (2) provide reasonable assurance that transactions are recorded as necessary to permit preparation of financial statements in accordance with generally accepted accounting principles, and that receipts and expenditures of the company are being made only in accordance with authorizations of management and directors of the company; and (3) provide reasonable assurance regarding prevention or timely detection of unauthorized acquisition, use, or disposition of the company's assets that could have a material effect on the financial statements.
Because of its inherent limitations, internal control over financial reporting may not prevent or detect misstatements. Also, projections of any evaluation of effectiveness to future periods are subject to the risk that controls may become inadequate because of changes in conditions, or that the degree of compliance with the policies or procedures may deteriorate.
As described in Management’s Report on Internal Control Over Financial Reporting, management has excluded Atlas Carpet Mills (Atlas) and Burtco Enterprises, Inc. (Burtco) from its assessment of internal controls over financial reporting as of December 27, 2014 because they were acquired by the Company in 2014. We have also excluded Atlas and Burtco from the scope of our audit of internal control over financial reporting. Atlas and Burtco were wholly-owned subsidiaries which constituted 9.7% of consolidated revenue for the year ended December 27, 2014 and 7.3% of consolidated assets as of December 27, 2014.
In our opinion, The Dixie Group, Inc. maintained, in all material respects, effective internal control over financial reporting as of December 27, 2014, based on criteria established in Internal Control-Integrated Framework (2013) issued by the Committee of Sponsoring Organizations of the Treadway Commission.
We also have audited, in accordance with the standards of the Public Company Accounting Oversight Board (United States), the consolidated financial statements of The Dixie Group, Inc. as of and for the year ended December 27, 2014, and our report dated March 12, 2015, expressed an unqualified opinion on those consolidated financial statements.
/s/ Dixon Hughes Goodman LLP
Atlanta, Georgia
March 12, 2015
Report of Independent Registered Public Accounting Firm
The Board of Directors and Shareholders of The Dixie Group, Inc.
We have audited the accompanying consolidated balance sheet of The Dixie Group, Inc. as of December 27, 2014, and the related consolidated statements of statements of operations, comprehensive income (loss), stockholders' equity and cash flows for the year then ended. Our audit also included the financial statement schedule for the year ended December 27, 2014 listed in the Index at Item 15(a)2. These consolidated financial statements and schedule are the responsibility of the Company's management. Our responsibility is to express an opinion on these consolidated financial statements and schedule based on our audit.
We conducted our audit in accordance with the standards of the Public Company Accounting Oversight Board (United States). Those standards require that we plan and perform the audit to obtain reasonable assurance about whether the financial statements are free of material misstatement. An audit includes examining, on a test basis, evidence supporting the amounts and disclosures in the financial statements. An audit also includes assessing the accounting principles used and significant estimates made by management, as well as evaluating the overall financial statement presentation. We believe that our audit provides a reasonable basis for our opinion.
In our opinion, the financial statements referred to above present fairly, in all material respects, the consolidated financial position of The Dixie Group, Inc. as of December 27, 2014, and the consolidated results of its operations and its cash flows for the year then ended, in conformity with U.S. generally accepted accounting principles. Also, in our opinion, the related financial statement schedule for the year ended December 27, 2014, when considered in relation to the basic financials statements taken as a whole, presents fairly, in all material respects, the information set forth therein.
We also have audited, in accordance with the standards of the Public Company Accounting Oversight Board (United States), The Dixie Group, Inc.'s internal control over financial reporting as of December 27, 2014, based on criteria established in Internal Control-Integrated Framework (2013) issued by the Committee of Sponsoring Organizations of the Treadway Commission and our report dated March 12, 2015, expressed an unqualified opinion thereon.
/s/ Dixon Hughes Goodman LLP
Atlanta, Georgia
March 12, 2015
Report of Independent Registered Public Accounting Firm
The Board of Directors and Shareholders of The Dixie Group, Inc.
We have audited the accompanying consolidated balance sheet of The Dixie Group, Inc. as of December 28, 2013, and the related consolidated statements of operations, comprehensive income (loss), cash flows, and stockholders' equity for each of the two years in the period ended December 28, 2013. Our audits also included the financial statement schedule listed in the Index at Item 15(a). These financial statements and schedule are the responsibility of the Company's management. Our responsibility is to express an opinion on these financial statements and schedule based on our audits.
We conducted our audits in accordance with the standards of the Public Company Accounting Oversight Board (United States). Those standards require that we plan and perform the audit to obtain reasonable assurance about whether the financial statements are free of material misstatement. An audit includes examining, on a test basis, evidence supporting the amounts and disclosures in the financial statements. An audit also includes assessing the accounting principles used and significant estimates made by management, as well as evaluating the overall financial statement presentation. We believe that our audits provide a reasonable basis for our opinion.
In our opinion, the financial statements referred to above present fairly, in all material respects, the consolidated financial position of The Dixie Group, Inc. at December 28, 2013, and the consolidated results of its operations and its cash flows for each of the two years in the period ended December 28, 2013, in conformity with U.S. generally accepted accounting principles. Also, in our opinion, the related financial statement schedule, when considered in relation to the basic financial statements taken as a whole, presents fairly in all material respects the information set forth therein.
/s/ Ernst & Young LLP
Atlanta, Georgia
March 12, 2014, except for Note 21, as it relates to the two years in the period ended December 28, 2013, as to which the date is March 12, 2015
THE DIXIE GROUP, INC.
CONSOLIDATED BALANCE SHEETS
(amounts in thousands, except share data)
December 27, 2014 | December 28, 2013 | ||||||
ASSETS | |||||||
CURRENT ASSETS | |||||||
Cash and cash equivalents | $ | 394 | $ | 255 | |||
Receivables, net | 50,524 | 44,063 | |||||
Inventories | 104,207 | 93,219 | |||||
Prepaid expenses | 5,970 | 5,630 | |||||
Deferred income taxes | 12,722 | 6,622 | |||||
TOTAL CURRENT ASSETS | 173,817 | 149,789 | |||||
PROPERTY, PLANT AND EQUIPMENT, NET | 102,489 | 74,485 | |||||
OTHER ASSETS | 24,574 | 24,592 | |||||
TOTAL ASSETS | $ | 300,880 | $ | 248,866 | |||
LIABILITIES AND STOCKHOLDERS' EQUITY | |||||||
CURRENT LIABILITIES | |||||||
Accounts payable | $ | 22,108 | $ | 21,679 | |||
Accrued expenses | 29,307 | 26,202 | |||||
Current portion of long-term debt | 9,078 | 6,229 | |||||
TOTAL CURRENT LIABILITIES | 60,493 | 54,110 | |||||
LONG-TERM DEBT | 118,210 | 101,759 | |||||
DEFERRED INCOME TAXES | 9,376 | 4,072 | |||||
OTHER LONG-TERM LIABILITIES | 19,824 | 18,154 | |||||
TOTAL LIABILITIES | 207,903 | 178,095 | |||||
COMMITMENTS AND CONTINGENCIES (See Note 18) | |||||||
STOCKHOLDERS' EQUITY | |||||||
Common Stock ($3 par value per share): Authorized 80,000,000 shares, issued and outstanding - 15,007,423 shares for 2014 and 12,441,356 shares for 2013 | 45,022 | 37,324 | |||||
Class B Common Stock ($3 par value per share): Authorized 16,000,000 shares, issued and outstanding - 764,191 shares for 2014 and 870,287 shares for 2013 | 2,293 | 2,611 | |||||
Additional paid-in capital | 155,127 | 137,170 | |||||
Accumulated deficit | (107,952 | ) | (106,550 | ) | |||
Accumulated other comprehensive income (loss) | (1,513 | ) | 216 | ||||
TOTAL STOCKHOLDERS' EQUITY | 92,977 | 70,771 | |||||
TOTAL LIABILITIES AND STOCKHOLDERS' EQUITY | $ | 300,880 | $ | 248,866 | |||
See accompanying notes to the consolidated financial statements.
THE DIXIE GROUP, INC.
CONSOLIDATED STATEMENTS OF OPERATIONS
(amounts in thousands, except per share data)
Year Ended | |||||||||||
December 27, 2014 | December 28, 2013 | December 29, 2012 | |||||||||
NET SALES | $ | 406,588 | $ | 344,374 | $ | 266,372 | |||||
Cost of sales | 311,091 | 258,804 | 201,000 | ||||||||
GROSS PROFIT | 95,497 | 85,570 | 65,372 | ||||||||
Selling and administrative expenses | 93,182 | 76,221 | 63,489 | ||||||||
Other operating expense, net | 904 | 494 | 68 | ||||||||
Facility consolidation expenses | 5,514 | — | — | ||||||||
Impairment of assets | 1,133 | — | — | ||||||||
OPERATING INCOME (LOSS) | (5,236 | ) | 8,855 | 1,815 | |||||||
Interest expense | 4,302 | 3,756 | 3,146 | ||||||||
Other (income) expense, net | (154 | ) | 26 | (277 | ) | ||||||
Gain on purchase of businesses | (11,110 | ) | — | — | |||||||
Refinancing expenses | — | 94 | — | ||||||||
INCOME (LOSS) FROM CONTINUING OPERATIONS BEFORE TAXES | 1,726 | 4,979 | (1,054 | ) | |||||||
Income tax provision (benefit) | 1,053 | (577 | ) | (401 | ) | ||||||
INCOME (LOSS) FROM CONTINUING OPERATIONS | 673 | 5,556 | (653 | ) | |||||||
Loss from discontinued operations, net of tax | (608 | ) | (266 | ) | (274 | ) | |||||
Loss on disposal of discontinued operations, net of tax | (1,467 | ) | — | — | |||||||
NET INCOME (LOSS) | $ | (1,402 | ) | $ | 5,290 | $ | (927 | ) | |||
BASIC EARNINGS (LOSS) PER SHARE: | |||||||||||
Continuing operations | $ | 0.03 | $ | 0.42 | $ | (0.05 | ) | ||||
Discontinued operations | (0.04 | ) | (0.02 | ) | (0.02 | ) | |||||
Disposal of discontinued operations | (0.10 | ) | 0.00 | 0.00 | |||||||
Net income (loss) | $ | (0.11 | ) | $ | 0.40 | $ | (0.07 | ) | |||
BASIC SHARES OUTSTANDING | 14,382 | 12,737 | 12,638 | ||||||||
DILUTED EARNINGS (LOSS) PER SHARE: | |||||||||||
Continuing operations | $ | 0.03 | $ | 0.42 | $ | (0.05 | ) | ||||
Discontinued operations | (0.04 | ) | (0.02 | ) | (0.02 | ) | |||||
Disposal of discontinued operations | (0.10 | ) | 0.00 | 0.00 | |||||||
Net income (loss) | $ | (0.11 | ) | $ | 0.40 | $ | (0.07 | ) | |||
DILUTED SHARES OUTSTANDING | 14,544 | 12,852 | 12,638 | ||||||||
DIVIDENDS PER SHARE: | |||||||||||
Common Stock | $ | — | $ | — | $ | — | |||||
Class B Common Stock | — | — | — | ||||||||
See accompanying notes to the consolidated financial statements.
THE DIXIE GROUP, INC.
CONSOLIDATED STATEMENTS OF COMPREHENSIVE INCOME (LOSS)
(amounts in thousands)
Year Ended | |||||||||||
December 27, 2014 | December 28, 2013 | December 29, 2012 | |||||||||
NET INCOME (LOSS) | $ | (1,402 | ) | $ | 5,290 | $ | (927 | ) | |||
OTHER COMPREHENSIVE INCOME (LOSS), NET OF TAX: | |||||||||||
Unrealized gain (loss) on interest rate swaps | (1,928 | ) | 236 | (476 | ) | ||||||
Reclassification of loss into earnings from interest rate swaps | 231 | 176 | 98 | ||||||||
Amortization of unrealized loss on dedesignated interest rate swaps | — | 98 | 289 | ||||||||
Unrecognized net actuarial gain on postretirement benefit plans | 41 | 20 | 20 | ||||||||
Reclassification of net actuarial gain into earnings from postretirement benefit plans | (19 | ) | (22 | ) | (27 | ) | |||||
Reclassification of prior service credits into earnings from postretirement benefit plans | (54 | ) | (54 | ) | (54 | ) | |||||
TOTAL OTHER COMPREHENSIVE INCOME (LOSS), NET OF TAX | (1,729 | ) | 454 | (150 | ) | ||||||
COMPREHENSIVE INCOME (LOSS) | $ | (3,131 | ) | $ | 5,744 | $ | (1,077 | ) | |||
See accompanying notes to the consolidated financial statements.
THE DIXIE GROUP, INC.
CONSOLIDATED STATEMENTS OF CASH FLOWS
(amounts in thousands)
Year Ended | |||||||||||
December 27, 2014 | December 28, 2013 | December 29, 2012 | |||||||||
CASH FLOWS FROM OPERATING ACTIVITIES | |||||||||||
Income (loss) from continuing operations | $ | 673 | $ | 5,556 | $ | (653 | ) | ||||
Loss from discontinued operations | (608 | ) | (266 | ) | (274 | ) | |||||
Loss on disposal of discontinued operations | (1,467 | ) | — | — | |||||||
Net income (loss) | (1,402 | ) | 5,290 | (927 | ) | ||||||
Adjustments to reconcile net income (loss) to net cash provided by (used in) operating activities, net of acquisitions: | |||||||||||
Depreciation and amortization - | |||||||||||
Continuing operations | 12,850 | 10,230 | 9,396 | ||||||||
Discontinued operations | 59 | 32 | — | ||||||||
Provision (benefit) for deferred income taxes | 264 | (1,037 | ) | (643 | ) | ||||||
Net (gain) loss on property, plant and equipment disposals | 11 | 195 | (186 | ) | |||||||
Impairment of assets - | |||||||||||
Continuing operations | 1,133 | — | — | ||||||||
Discontinued operations | 2,363 | — | — | ||||||||
Gain on purchase of businesses | (11,110 | ) | — | — | |||||||
Stock-based compensation expense | 1,195 | 847 | 937 | ||||||||
Excess tax benefits from stock-based compensation | (379 | ) | (151 | ) | — | ||||||
Write-off of deferred financing costs | — | 94 | — | ||||||||
Changes in operating assets and liabilities: | |||||||||||
Receivables | (1,287 | ) | (11,479 | ) | (3,296 | ) | |||||
Inventories | 743 | (19,283 | ) | (8,115 | ) | ||||||
Other current assets | 679 | (878 | ) | (2,506 | ) | ||||||
Accounts payable and accrued expenses | (925 | ) | 11,642 | 1,455 | |||||||
Other operating assets and liabilities | (733 | ) | (1,423 | ) | (827 | ) | |||||
NET CASH PROVIDED BY (USED IN) OPERATING ACTIVITIES | 3,461 | (5,921 | ) | (4,712 | ) | ||||||
CASH FLOWS FROM INVESTING ACTIVITIES | |||||||||||
Net proceeds from sales of property, plant and equipment | 473 | 48 | 187 | ||||||||
Deposits on property, plant and equipment | (1,184 | ) | — | — | |||||||
Purchase of property, plant and equipment | (9,492 | ) | (11,438 | ) | (3,386 | ) | |||||
Proceeds from sale of equity investment | 870 | — | — | ||||||||
Proceeds from sale of assets held for sale | 5,501 | — | — | ||||||||
Net cash paid in business acquisitions | (17,739 | ) | (2,170 | ) | (1,197 | ) | |||||
NET CASH USED IN INVESTING ACTIVITIES | (21,571 | ) | (13,560 | ) | (4,396 | ) | |||||
CASH FLOWS FROM FINANCING ACTIVITIES | |||||||||||
Net (payments) borrowings on revolving credit facility | (2,378 | ) | 25,152 | 7,316 | |||||||
Payments on mortgage note payable | — | (10,141 | ) | (737 | ) | ||||||
Payments on building notes payable | (35 | ) | — | — | |||||||
Payments on notes payable related to acquisitions | (1,761 | ) | (852 | ) | (161 | ) | |||||
Borrowings on equipment financing | 3,760 | 4,312 | 5,003 | ||||||||
Payments on equipment financing | (1,917 | ) | (1,212 | ) | (1,293 | ) | |||||
Payments on capital leases | (1,539 | ) | (688 | ) | (204 | ) | |||||
Borrowings on notes payable | 1,433 | 2,429 | 795 | ||||||||
Payments on notes payable | (1,100 | ) | (851 | ) | (746 | ) | |||||
Change in outstanding checks in excess of cash | (2,683 | ) | 1,350 | (205 | ) | ||||||
Proceeds from equity offering, net of issuance costs | 24,559 | — | — | ||||||||
Proceeds from exercise of stock options | 192 | 190 | — | ||||||||
Repurchases of Common Stock | (497 | ) | (207 | ) | (199 | ) | |||||
Excess tax benefits from stock-based compensation | 379 | 151 | — | ||||||||
Payments for debt issuance costs | (164 | ) | (388 | ) | (268 | ) | |||||
NET CASH PROVIDED BY FINANCING ACTIVITIES | 18,249 | 19,245 | 9,301 | ||||||||
INCREASE (DECREASE) IN CASH AND CASH EQUIVALENTS | 139 | (236 | ) | 193 | |||||||
CASH AND CASH EQUIVALENTS AT BEGINNING OF PERIOD | 255 | 491 | 298 | ||||||||
CASH AND CASH EQUIVALENTS AT END OF PERIOD | $ | 394 | $ | 255 | $ | 491 | |||||
Year Ended | |||||||||||
December 27, 2014 | December 28, 2013 | December 29, 2012 | |||||||||
SUPPLEMENTAL CASH FLOW INFORMATION: | |||||||||||
Equipment purchased under capital leases | 10,078 | 1,865 | 666 | ||||||||
Equipment purchased under notes payable | 4,925 | — | — | ||||||||
Building purchased under notes payable | 8,330 | — | — | ||||||||
Assets acquired in acquisitions, net of cash acquired | 36,649 | 8,062 | 9,184 | ||||||||
Liabilities assumed in acquisitions | (6,397 | ) | (836 | ) | (42 | ) | |||||
Note payable related to acquisition | — | (3,749 | ) | (5,500 | ) | ||||||
Accrued consideration for working capital adjustment in acquisitions | (216 | ) | (1,307 | ) | (2,445 | ) | |||||
Accrued consideration for holdbacks in acquisition | (887 | ) | — | — | |||||||
Deposits on property, plant & equipment financed | (965 | ) | — | — | |||||||
Shortfall of tax benefits from stock-based compensation | (607 | ) | — | — | |||||||
See accompanying notes to the consolidated financial statements.
THE DIXIE GROUP, INC.
CONSOLIDATED STATEMENTS OF STOCKHOLDERS' EQUITY
(amounts in thousands, except share data)
Common Stock | Class B Common Stock | Additional Paid-In Capital | Accumulated Deficit | Accumulated Other Comprehensive Income (Loss) | Total Stockholders' Equity | ||||||||||||||||||
Balance at December 31, 2011 | $ | 36,068 | $ | 2,648 | $ | 136,670 | $ | (110,913 | ) | $ | (88 | ) | $ | 64,385 | |||||||||
Repurchases of Common Stock - 50,444 shares | (151 | ) | — | (48 | ) | — | — | (199 | ) | ||||||||||||||
Restricted stock grants issued - 289,233 shares | 609 | 258 | (867 | ) | — | — | — | ||||||||||||||||
Restricted stock grants forfeited - 17,229 shares | (52 | ) | — | 52 | — | — | — | ||||||||||||||||
Class B converted into Common Stock - 15,925 shares | 48 | (48 | ) | — | — | — | — | ||||||||||||||||
Stock-based compensation expense | — | — | 937 | — | — | 937 | |||||||||||||||||
Excess tax benefits from stock-based compensation | — | — | — | — | — | — | |||||||||||||||||
Net loss | — | — | — | (927 | ) | — | (927 | ) | |||||||||||||||
Other comprehensive loss | — | — | — | — | (150 | ) | (150 | ) | |||||||||||||||
Balance at December 29, 2012 | 36,522 | 2,858 | 136,744 | (111,840 | ) | (238 | ) | 64,046 | |||||||||||||||
Common Stock issued - 50,464 shares | 151 | — | 39 | — | — | 190 | |||||||||||||||||
Repurchases of Common Stock - 38,815 shares | (116 | ) | — | (91 | ) | — | — | (207 | ) | ||||||||||||||
Restricted stock grants issued - 173,249 shares | 346 | 174 | (520 | ) | — | — | — | ||||||||||||||||
Class B converted into Common Stock - 140,477 shares | 421 | (421 | ) | — | — | — | — | ||||||||||||||||
Stock-based compensation expense | — | — | 847 | — | — | 847 | |||||||||||||||||
Excess tax benefits from stock-based compensation | — | — | 151 | — | — | 151 | |||||||||||||||||
Net income | — | — | — | 5,290 | — | 5,290 | |||||||||||||||||
Other comprehensive income | — | — | — | — | 454 | 454 | |||||||||||||||||
Balance at December 28, 2013 | 37,324 | 2,611 | 137,170 | (106,550 | ) | 216 | 70,771 | ||||||||||||||||
Common Stock issued - 30,952 shares | 86 | 7 | 99 | — | — | 192 | |||||||||||||||||
Common Stock issued under equity offering - 2,500,000 shares | 7,500 | — | 17,059 | — | — | 24,559 | |||||||||||||||||
Repurchases of Common Stock - 47,296 shares | (142 | ) | — | (355 | ) | — | — | (497 | ) | ||||||||||||||
Restricted stock grants issued - 101,315 shares | 208 | 96 | (304 | ) | — | — | — | ||||||||||||||||
Restricted stock grants forfeited - 125,000 shares | (15 | ) | (360 | ) | 375 | — | — | — | |||||||||||||||
Class B converted into Common Stock - 20,400 shares | 61 | (61 | ) | — | — | — | — | ||||||||||||||||
Stock-based compensation expense | — | — | 1,195 | — | — | 1,195 | |||||||||||||||||
Excess tax benefits from stock-based compensation | — | — | (112 | ) | — | — | (112 | ) | |||||||||||||||
Net loss | — | — | — | (1,402 | ) | — | (1,402 | ) | |||||||||||||||
Other comprehensive loss | — | — | — | — | (1,729 | ) | (1,729 | ) | |||||||||||||||
Balance at December 27, 2014 | $ | 45,022 | $ | 2,293 | $ | 155,127 | $ | (107,952 | ) | $ | (1,513 | ) | $ | 92,977 | |||||||||
See accompanying notes to the consolidated financial statements.
THE DIXIE GROUP, INC.
NOTES TO CONSOLIDATED FINANCIAL STATEMENTS
(amounts in thousands, except per share data)
NOTE 1 - SUMMARY OF SIGNIFICANT ACCOUNTING POLICIES
Business
The Company's businesses consist principally of marketing, manufacturing and selling finished carpet and rugs. The Company has one reportable segment, carpet and rug manufacturing. The Company sells carpet and rug products in both residential and commercial applications. Additionally, the Company provides manufacturing support to its carpet businesses through its separate processing operations.
Principles of Consolidation
The Consolidated Financial Statements include the accounts of The Dixie Group, Inc. and its wholly-owned subsidiaries (the "Company"). Significant intercompany accounts and transactions have been eliminated in consolidation.
Use of Estimates in the Preparation of Financial Statements
The preparation of financial statements in conformity with U.S. generally accepted accounting principles requires management to make estimates and assumptions that affect the amounts reported in the financial statements and accompanying notes. Actual results could differ from those estimates and these differences could be material.
Fiscal Year
The Company ends its fiscal year on the last Saturday of December. All references herein to "2014," "2013," and "2012," mean the fiscal years ended December 27, 2014, December 28, 2013, and December 29, 2012, respectively. All years presented contained 52 weeks.
Reclassifications
The Company reclassified certain amounts in 2013 to conform to the 2014 presentation including the reclassification of the Company's spare parts inventory from inventory to prepaid expenses in the Consolidated Balance Sheets.
Discontinued Operations
The financial statements separately report discontinued operations and the results of continuing operations (See Note 21).
Cash and Cash Equivalents
Highly liquid investments with original maturities of three months or less when purchased are reported as cash equivalents.
Market Risk
The Company sells carpet to floorcovering retailers, the interior design, architectural and specifier communities and supplies carpet yarn and carpet dyeing and finishing services to certain manufacturers. The Company's customers are located principally throughout the United States. As a percentage of net sales, one customer accounted for approximately 9% in 2014, 13% in 2013 and 9% in 2012. No other customer accounted for more than 10% of net sales in 2014, 2013 or 2012, nor did the Company make a significant amount of sales to foreign countries during 2014, 2013 or 2012.
Credit Risk
The Company grants credit to its customers with defined payment terms, performs ongoing evaluations of the credit worthiness of its customers and generally does not require collateral. Accounts receivable are carried at their outstanding principal amounts, less an anticipated amount for discounts and an allowance for doubtful accounts, which management believes is sufficient to cover potential credit losses based on historical experience and periodic evaluation of the financial condition of the Company's customers. Notes receivable are carried at their outstanding principal amounts, less an allowance for doubtful accounts to cover potential credit losses based on the financial condition of borrowers and collateral held by the Company.
Inventories
Inventories are stated at the lower of cost or market. Cost is determined using the last-in, first-out (LIFO) method, which generally matches current costs of inventory sold with current revenues, for substantially all inventories.
THE DIXIE GROUP, INC.
NOTES TO CONSOLIDATED FINANCIAL STATEMENTS
(amounts in thousands, except per share data)
(Continued)
Property, Plant and Equipment
Property, plant and equipment is stated at the lower of cost or impaired value. Provisions for depreciation and amortization of property, plant and equipment have been computed for financial reporting purposes using the straight-line method over the estimated useful lives of the related assets, ranging from 10 to 40 years for buildings and improvements, and 3 to 10 years for machinery and equipment. Costs to repair and maintain the Company's equipment and facilities are expensed as incurred. Such costs typically include expenditures to maintain equipment and facilities in good repair and proper working condition.
Impairment of Long-Lived Assets
Long-lived assets are reviewed for impairment when circumstances indicate that the carrying value of an asset may not be fully recoverable. When the carrying value of the asset exceeds the value of its estimated undiscounted future cash flows, an impairment charge is recognized equal to the difference between the asset's carrying value and its fair value. Fair value is estimated using discounted cash flows, prices for similar assets or other valuation techniques.
Goodwill and Other Intangible Assets
Goodwill represents the excess of purchase price over the fair market value of identified net assets acquired in business combinations. The Company's goodwill is tested for impairment annually in the fourth quarter of each year or more frequently if events or circumstances indicate that the carrying value of goodwill associated with a reporting unit may not be fully recoverable.
The first step in the goodwill assessment process is to identify potential goodwill impairments and involves a comparison of the carrying value of a reporting unit, including goodwill, to the fair value of the reporting unit. The Company has identified its reporting units as its residential floorcovering business and commercial floorcovering business. For this purpose, the Company estimates fair value of the reporting unit based on expected current and future cash flows discounted at the Company's weighted-average cost of capital ("WACC"). Such an estimate necessarily involves judgments and assumptions concerning, among other matters, future sales and operating margins, as well as interest rates and other financial factors used to calculate the WACC.
If an impairment is indicated in the first step of the assessment, a second step in the assessment is performed by comparing the "implied fair value" of the Company's reporting units' goodwill with the carrying value of the reporting units' goodwill. For this purpose, the "implied fair value" of goodwill for each reporting unit that has goodwill associated with its operations is determined in the same manner as the amount of goodwill is determined in a business combination. (See Note 7).
Identifiable intangible assets with finite lives are generally amortized on a straight-line basis over their respective lives, which range from 10 to 20 years (See Note 7).
Customer Claims and Product Warranties
The Company generally provides product warranties related to manufacturing defects and specific performance standards for its products. At the time sales are recorded, the Company records reserves for the estimated costs of defective products and failure of its products to meet applicable performance standards. The level of reserves the Company establishes is based primarily upon historical experience, including the level of sales and evaluation of pending claims.
Self-Insured Benefit Programs
The Company records liabilities to reflect an estimate of the ultimate cost of claims related to its self-insured medical and dental benefits and workers' compensation. The amounts of such liabilities are based on an analysis of the Company's historical experience for each type of claim.
Income Taxes
The Company recognizes deferred income tax assets and liabilities for the future tax consequences of the differences between the financial statement carrying amounts of existing assets and liabilities and their respective tax bases. The Company recognizes interest and penalties related to uncertain tax positions, if any, in income tax expense.
Derivative Financial Instruments
The Company does not hold speculative financial instruments, nor does it hold or issue financial instruments for trading purposes. The Company uses derivative instruments, currently interest rate swaps, to minimize the effects of interest rate volatility.
THE DIXIE GROUP, INC.
NOTES TO CONSOLIDATED FINANCIAL STATEMENTS
(amounts in thousands, except per share data)
(Continued)
The Company recognizes all derivatives on its Consolidated Balance Sheet at fair value. Derivatives that are designated as cash flow hedges are linked to specific liabilities on the Company's balance sheet. The Company assesses, both at inception and on an ongoing basis, whether the derivatives that are used in hedging transactions are highly effective in offsetting changes in cash flows of the hedged items. When it is determined that a derivative is not highly effective or the derivative expires, is sold, terminated, or exercised, the Company discontinues hedge accounting for that specific hedge instrument. Changes in the fair value of effective cash flow hedges are deferred in accumulated other comprehensive income (loss) ("AOCIL") and reclassified to earnings in the same periods during which the hedge transaction affects earnings. Changes in the fair value of derivatives that are not effective cash flow hedges are recognized in results of operations.
Treasury Stock
The Company classifies treasury stock as a reduction to Common Stock for the par value of such shares acquired and the difference between the par value and the price paid for each share recorded either entirely to retained earnings or to additional paid-in-capital for periods in which the Company does not have retained earnings. This presentation reflects the repurchased shares as authorized but unissued as prescribed by state statute.
Revenue Recognition
Revenues, including shipping and handling amounts, are recognized when the following criteria are met: there is persuasive evidence that a sales agreement exists, delivery has occurred or services have been rendered, the price to the buyer is fixed or determinable, and collectability is reasonably assured. Delivery is not considered to have occurred until the customer takes title to the goods and assumes the risks and rewards of ownership, which is generally on the date of shipment. At the time revenue is recognized, the Company records a provision for the estimated amount of future returns based primarily on historical experience and any known trends or conditions that exist at the time revenue is recognized. Revenues are recorded net of taxes collected from customers.
Advertising Costs and Vendor Consideration
The Company engages in promotional and advertising programs that include rebates, discounts, points and cooperative advertising programs. Expenses relating to these programs are charged to results of operations during the period of the related benefits. These arrangements do not require significant estimates of costs. Substantially all such expenses are recorded as a deduction from sales. The cost of cooperative advertising programs is recorded as selling and administrative expenses when the Company can identify a tangible benefit associated with the program, and can reasonably estimate that the fair value of the benefit is equal to or greater than its cost. The amount of advertising and promotion expenses included in selling and administrative expenses was not significant for the years 2014, 2013 or 2012.
Cost of Sales
Cost of sales includes all costs related to manufacturing the Company's products, including purchasing and receiving costs, inspection costs, warehousing costs, freight costs, internal transfer costs or other costs of the Company's distribution network.
Selling and Administrative Expenses
Selling and administrative expenses include all costs, not included in cost of sales, related to the sale and marketing of the Company's products and general administration of the Company's business.
Operating Leases
Rent is expensed over the lease period, including the effect of any rent holiday and rent escalation provisions, which effectively amortizes the rent holidays and rent escalations on a straight-line basis over the lease period. Leasehold improvements are amortized over the shorter of their economic lives or the lease term, excluding renewal options. Any leasehold improvement made by the Company and funded by the lessor is treated as a leasehold improvement and amortized over the shorter of its economic life or the lease term. Any funding provided by the lessor for such improvements is treated as deferred costs and amortized over the lease period.
Stock-Based Compensation
The Company recognizes compensation expense relating to share-based payments based on the fair value of the equity or liability instrument issued. Restricted stock grants with pro-rata vesting are expensed using the straight-line method. (Terms of the Company's awards are specified in Note 16).
THE DIXIE GROUP, INC.
NOTES TO CONSOLIDATED FINANCIAL STATEMENTS
(amounts in thousands, except per share data)
(Continued)
NOTE 2 - RECENT ACCOUNTING PRONOUNCEMENTS
In December 2011, the Financial Accounting Standards Board ("FASB") issued ASU No. 2011-11, “Balance Sheet (Topic 210): Disclosures about Offsetting Assets and Liabilities.” The amendments in this ASU required an entity to disclose information about offsetting assets and liabilities and related arrangements to enable users of its financial statements to understand the effect of those arrangements on its financial position. An entity was required to apply the amendments for annual reporting periods beginning on or after January 1, 2013, and interim periods within those annual periods. An entity had to provide the disclosures required by those amendments retrospectively for all comparative periods presented. In January 2013, the FASB issued ASU No. 2013-01, "Balance Sheet (Topic 210)—Clarifying the Scope of Disclosures about Offsetting Assets and Liabilities". The ASU clarified that ordinary trade receivables and payables were not in the scope of ASU No. 2011-11. ASU No. 2011-11 applied only to derivatives, repurchase agreements and reverse purchase agreements, and securities borrowing and securities lending transactions that were either offset in accordance with specific criteria contained in the Codification or subject to a master netting arrangement or similar agreement. The effective date was the same as the effective date of ASU 2011-11. The adoption of these ASUs did not have a material effect on the Company's Consolidated Financial Statements.
In February 2013, the FASB issued ASU No. 2013-04, "Liabilities (Topic 405): Obligations Resulting from Joint and Several Liability Arrangements for Which the Total Amount of the Obligation Is Fixed at the Reporting Date". This ASU provided guidance for the recognition, measurement, and disclosure of obligations resulting from joint and several liability arrangements for which the total amount of the obligation within the scope of this guidance was fixed at the reporting date, except for obligations addressed within existing guidance in GAAP. For public entities, the ASU was effective for fiscal years, and interim periods within those years, beginning after December 15, 2013. The ASU shall be applied retrospectively to all prior periods presented for those obligations within the scope of this Subtopic that existed at the beginning of an entity's fiscal year of adoption. Early adoption was permitted. The adoption of this ASU did not have a material effect on the Company's Consolidated Financial Statements.
In July 2013, the FASB issued ASU No. 2013-11, "Income Taxes (Topic 740) - Presentation of an Unrecognized Tax Benefit When a Net Operating Loss Carryforward, a Similar Tax Loss, or a Tax Credit Carryforward Exists". This ASU required an unrecognized tax benefit, or a portion of an unrecognized tax benefit, to be presented in the financial statements as a reduction to a deferred tax asset for a net operating loss carryforward, a similar tax loss, or a tax credit carryforward, except to the extent that a net operating loss carryforward, a similar tax loss, or a tax credit carryforward was not available at the reporting date, the unrecognized tax benefit will be presented in the financial statements as a liability and not combined with deferred tax assets. This ASU was effective for annual and interim periods beginning after December 15, 2013, with early adoption permitted. The adoption of this ASU did not have a material effect on the Company's Consolidated Financial Statements.
In April 2014, the Financial Accounting Standards Board ("FASB") issued ASU No. 2014-08, "Presentation of Financial Statements (Topic 205) and Property, Plant, and Equipment (Topic 360) - Reporting Discontinued Operations and Disclosures of Disposals of Components of an Entity". The ASU was issued to change the requirements for reporting discontinued operations and to enhance the disclosures in this area. The ASU requires a disposal of a component of an entity or a group of components of an entity to be reported in discontinued operations if the disposal represents a strategic shift and will have a major effect on an entity's operations and financial results. The ASU will be effective prospectively for interim and annual reporting periods beginning after December 15, 2014. The adoption of this ASU will only impact the reporting and disclosures of future disposals, if any.
In May 2014, the FASB issued ASU No. 2014-09, "Revenue from Contracts with Customers (Topic 606)". The ASU requires an entity to recognize the amount of revenue to which it expects to be entitled for the transfer of promised goods or services to customers. The ASU will replace most existing revenue recognition guidance in U.S. GAAP when it becomes effective. The new standard is effective for annual reporting periods beginning after December 15, 2016, including interim periods within that reporting period. Early application is not permitted. The standard permits the use of either the retrospective or cumulative effect transition method. The Company has not yet selected a transition method. The Company will be evaluating the effect that the ASU will have on the Consolidated Financial Statements and related disclosures.
In August 2014, the FASB issued ASU No. 2014-15, "Presentation of Financial Statements - Going Concern (Subtopic 205-40): Disclosure of Uncertainties about an Entity's Ability to Continue as a Going Concern." The guidance requires an entity to evaluate whether there are conditions or events, in the aggregate, that raise substantial doubt about the entity’s ability to continue as a going concern within one year after the date that the financial statements are issued and to provide related footnote disclosures in certain circumstances. The guidance is effective for the annual period ending after December 15, 2016, and for annual and interim periods thereafter. Early application is permitted. The Company does not believe the adoption of this ASU will have a significant impact on the Consolidated Consolidated Financial Statements.
THE DIXIE GROUP, INC.
NOTES TO CONSOLIDATED FINANCIAL STATEMENTS
(amounts in thousands, except per share data)
(Continued)
NOTE 3 - RECEIVABLES, NET
Receivables are summarized as follows:
2014 | 2013 | ||||||
Customers, trade | $ | 46,422 | $ | 41,898 | |||
Other receivables | 4,552 | 2,306 | |||||
Gross receivables | 50,974 | 44,204 | |||||
Less allowance for doubtful accounts | (450 | ) | (141 | ) | |||
Receivables, net | $ | 50,524 | $ | 44,063 | |||
NOTE 4 - INVENTORIES
Inventories are summarized as follows:
2014 | 2013 | ||||||
Raw materials | $ | 40,649 | $ | 31,864 | |||
Work-in-process | 19,976 | 16,880 | |||||
Finished goods | 57,913 | 57,983 | |||||
Supplies and other | 126 | 118 | |||||
LIFO reserve | (14,457 | ) | (13,626 | ) | |||
Inventories | $ | 104,207 | $ | 93,219 | |||
NOTE 5 - PROPERTY, PLANT AND EQUIPMENT, NET
Property, plant and equipment consists of the following:
2014 | 2013 | ||||||
Land and improvements | $ | 7,327 | $ | 7,231 | |||
Buildings and improvements | 61,557 | 50,627 | |||||
Machinery and equipment | 171,586 | 149,040 | |||||
240,470 | 206,898 | ||||||
Accumulated depreciation | (137,981 | ) | (132,413 | ) | |||
Property, plant and equipment, net | $ | 102,489 | $ | 74,485 | |||
Depreciation of property, plant and equipment, including amounts for capital leases, totaled $12,212 in 2014, $9,834 in 2013 and $9,070 in 2012.
NOTE 6 - ACQUISITIONS
2014 Acquisitions
Atlas Carpet Mills, Inc.
Effective March 19, 2014, the Company acquired all outstanding stock of Atlas Carpet Mills, Inc. ("Atlas") for total purchase price consideration of $18,759, including a cash payment of $16,543, accrued consideration relating to holdbacks for certain inventories and customer claims of $923 and accrued consideration for a working capital adjustment of $1,293. The Company financed the transaction with availability under its amended credit facility. The Company incurred direct acquisition costs of approximately $645 related to this acquisition. These incremental costs are classified as selling and administrative expenses in the Company's Consolidated Statements of Operations.
Atlas is a California-based manufacturer and marketer of high-end commercial broadloom and tile carpeting serving soft floorcovering markets. Atlas has a strong reputation for exceptional design, quality and service. This brand will be sold through the existing Atlas sales force and will serve to broaden the Company's product offerings for commercial applications along with the Company's Masland Contract and Masland Hospitality brands.
THE DIXIE GROUP, INC.
NOTES TO CONSOLIDATED FINANCIAL STATEMENTS
(amounts in thousands, except per share data)
(Continued)
The purchase price consideration was as follows:
Cash paid | $ | 16,543 | |
Accrued consideration for holdbacks | 923 | ||
Accrued consideration for working capital adjustment | 1,293 | ||
Total purchase price consideration | $ | 18,759 | |
The acquisition was accounted for as a business combination which generally requires, among other things, that assets acquired and liabilities assumed be recognized at their fair values as of the acquisition date. The acquisition did not represent a significant business combination. The fair value of the net assets acquired exceeded the purchase price resulting in a bargain purchase. The initial gain was subject to adjustment because the Company had not yet completed its evaluation and determination of the fair value, or fair value less cost to sell as applicable, of certain assets acquired and liabilities assumed, which included the final valuation and assessment of (i) property, plant and equipment acquired including assets held for sale and (ii) net working capital acquired. The Company completed these final valuations and assessments by the end of fiscal 2014. During 2014, based on further information, the Company retroactively applied adjustments to the initial provisional amounts to the first quarter of 2014. Such adjustments are presented in the table below. The most significant adjustment was to assets held for sale. The amount of assets held for sale was revised based on the final sale price. As a result of the adjustments, previously reported first quarter pre-tax earnings were increased by $2,193 ($1,360 after tax). The adjusted bargain gain recognized in the Consolidated Statement of Operations is $10,937 ($6,781 after tax).
Originally | As | ||||||||
Reported | Adjustments | Adjusted | |||||||
Cash | $ | 2,466 | $ | — | $ | 2,466 | |||
Receivables | 4,304 | 694 | 4,998 | ||||||
Inventories | 11,511 | (530 | ) | 10,981 | |||||
Other current assets | 956 | (159 | ) | 797 | |||||
Assets held for sale | 3,250 | 1,902 | 5,152 | ||||||
Property, plant and equipment | 6,929 | (213 | ) | 6,716 | |||||
Finite intangible asset | 3,300 | — | 3,300 | ||||||
Other assets | 623 | 236 | 859 | ||||||
Accounts payable | (2,286 | ) | — | (2,286 | ) | ||||
Accrued expenses | (3,036 | ) | 153 | (2,883 | ) | ||||
Capital lease obligation | (404 | ) | — | (404 | ) | ||||
Fair value of net assets acquired | $ | 27,613 | $ | 2,083 | $ | 29,696 | |||
Total consideration | 18,869 | (110 | ) | 18,759 | |||||
Gain on purchase of business | $ | (8,744 | ) | $ | (2,193 | ) | $ | (10,937 | ) |
The Company believes that several factors were significant in the recognition of a gain from the acquisition of Atlas. Atlas had higher cost of dyeing due to the lack of capacity utilization and therefore needed to lower costs by combining dye facilities with another operation. In addition, Atlas had a higher cost of modular carpet tile manufacturing due to outsourcing the tile manufacturing operations. Therefore, Atlas would have had to make significant investments in product and manufacturing equipment to be competitive in the modular carpet manufacturing business. Finally, the Seller had the desire to see Atlas operated as an independent brand and organization in the future. All of these objectives were achieved by combining Atlas with the Company in a mutually advantageous relationship.
The Company determined that it is impracticable to provide comparative pro forma financial information related to the acquisition. Significant estimates of amounts to be included in pro forma financial information would be required and subject to an inordinate level of subjectivity. Net sales related to Atlas included in the Company’s Consolidated Statement of Operations from the date of the acquisition to December 27, 2014 was $37,620.
THE DIXIE GROUP, INC.
NOTES TO CONSOLIDATED FINANCIAL STATEMENTS
(amounts in thousands, except per share data)
(Continued)
Burtco Enterprises, Inc.
Effective September 22, 2014, the Company acquired certain assets and assumed certain liabilities of Burtco Enterprises, Inc. ("Burtco") for total purchase price consideration of $2,549, including a cash payment of $2,430 and accrued consideration for a working capital adjustment of $119. The Company incurred direct acquisition costs of approximately $101 related to this acquisition. These incremental costs are classified as selling and administrative expenses in the Company's Consolidated Statements of Operations.
Since 1979, Burtco has created high-quality, custom-crafted carpet designed for the hospitality industry. Burtco manufactures both wool and solution-dyed computer yarn placement (CYP) products that are used in public spaces and hotel guest rooms.
These products will broaden the product offerings for commercial applications under the Company's Masland Hospitality brand.
The acquisition was accounted for as a business combination which generally requires, among other things, that assets acquired and liabilities assumed be recognized at their fair values as of the acquisition date. The acquisition did not represent a significant business combination. The fair value of the net assets acquired totaled $2,722. The fair value of the net assets acquired exceeded the purchase price resulting in a pre-tax bargain purchase of $173.
2013 Acquisition
Robertex Associates, Inc.
On June 30, 2013, the Company acquired Robertex Associates, Inc. ("Robertex") from Robert P. Rothman. The Company acquired all the outstanding shares of capital stock of Robertex for an aggregate purchase price of $7,334, which included cash, a seller-financed note and an accrued contingent liability. The seller-financed note consists of five annual payments of principal and interest. The accrued contingent liability is payable in five annual payments based upon incremental growth in gross margins of selected products for five years subsequent to the acquisition. The Company has incurred direct incremental costs of approximately $350 related to this acquisition. These incremental costs are classified in selling and administrative expenses in the Company's Consolidated Statements of Operations.
This acquisition is designed to increase the Company's market share in the wool markets it currently serves. Robertex produces wool floorcovering products.
The purchase price consideration was as follows:
Cash paid | $ | 2,278 | |
Seller-financed note | 3,749 | ||
Contingent consideration | 1,307 | ||
Total purchase price | $ | 7,334 | |
The acquisition was accounted for as a business combination which requires, among other things, that assets acquired and liabilities assumed to be recognized at their fair values as of the acquisition date. The acquisition did not represent a material business combination. The following table summarizes the estimates of fair values of the assets acquired and liabilities assumed as of June 30, 2013 based on the purchase price allocation. The components of the purchase price allocation consisted of the following:
Cash | $ | 108 | |
Accounts receivable | 115 | ||
Inventory | 2,139 | ||
Other current assets | 14 | ||
Property, plant and equipment | 1,863 | ||
Finite intangible assets | 2,222 | ||
Goodwill | 1,709 | ||
Accounts payable | (643 | ) | |
Accrued expenses | (193 | ) | |
Total purchase price | $ | 7,334 | |
THE DIXIE GROUP, INC.
NOTES TO CONSOLIDATED FINANCIAL STATEMENTS
(amounts in thousands, except per share data)
(Continued)
2012 Acquisitions
Colormaster
On November 2, 2012, the Company acquired a continuous carpet dyeing facility ("Colormaster") in Calhoun, Georgia from Lineage PCR, Inc. for $6,562 which included cash, a seller financed note and the fair value of a five-year below market agreement to process certain of the seller's products on a commission basis. The Company incurred direct, incremental costs of $269 related to the acquisition which were expensed as incurred and included in general and administrative expenses in the Company's Consolidated Financial Statements. With the acquisition of these continuous dyeing assets, the Company has moved a significant volume of its dyeing production from its more costly beck dyeing process as well as developing future products that utilize the continuous dye process.
The purchase price consideration was as follows:
Cash paid | $ | 239 | |
Seller-financed note | 5,500 | ||
Below-market supply contract | 823 | ||
Total purchase price | $ | 6,562 | |
The acquisition was accounted for as a business combination which requires, among other things, that assets acquired and liabilities assumed be recognized at their fair values as of the acquisition date. The Company concluded that the acquisition did not represent a material business combination. The allocation of the purchase price was based on estimates of the fair value of the assets acquired as of November 2, 2012. The components of the purchase price allocation consisted of the following:
Property, plant and equipment | $ | 6,371 | |
Inventory | 173 | ||
Supplies | 18 | ||
Purchase price | $ | 6,562 | |
Crown Rug
On November 28, 2012, the Company acquired the specialized wool rug tufting equipment and related business ("Crown Rug") from Crown Manufacturing, Inc. for $2,580 which included cash, deferred payments and an accrued contingent liability. The deferred payment is payable in three equal annual installments and the accrued contingent liability is three annual payments based on sales volumes each year. The Company incurred direct incremental costs of $49 related to this acquisition which were classified in general and administrative expenses in the Company's Consolidated Financial Statements. The acquired assets were moved into the Company's facilities to meet internal requirements as well as to enter certain other markets not currently served by the Company. Prior to the acquisition of these assets from Crown Manufacturing, the Company utilized a significant portion of the related machinery capacity at Crown Manufacturing.
The purchase price consideration was as follows:
Cash paid | $ | 958 | |
Deferred payments to seller | 471 | ||
Contingent consideration | 1,151 | ||
Total purchase price | $ | 2,580 | |
THE DIXIE GROUP, INC.
NOTES TO CONSOLIDATED FINANCIAL STATEMENTS
(amounts in thousands, except per share data)
(Continued)
The acquisition was accounted for as a business combination which requires, among other things, that assets acquired and liabilities assumed be recognized at their fair values as of the acquisition date. The Company concluded that the acquisition did not represent a material business combination. The allocation of the purchase price was based on estimates of the fair value of the assets acquired as of November 28, 2012. The components of the purchase price allocation consisted of the following:
Property, plant and equipment | $ | 590 | |
Finite intangible assets | 352 | ||
Goodwill | 1,680 | ||
Accrued payable | (42 | ) | |
Purchase price | $ | 2,580 | |
NOTE 7 - GOODWILL AND OTHER INTANGIBLE ASSETS
The changes in the carrying amounts of goodwill are as follows:
Goodwill | Accumulated Impairment Losses | Net | |||||||||
Balance at December 29, 2012 | $ | 1,680 | $ | — | $ | 1,680 | |||||
Additional goodwill recognized during the period (1) | 1,709 | — | 1,709 | ||||||||
Impairment losses recognized during the period | — | — | — | ||||||||
Other changes in the carrying amounts during the period | — | — | — | ||||||||
Balance at December 28, 2013 | 3,389 | — | 3,389 | ||||||||
Additional goodwill recognized during the period | — | — | — | ||||||||
Impairment losses recognized during the period | — | — | — | ||||||||
Other changes in the carrying amounts during the period | — | — | — | ||||||||
Balance at December 27, 2014 | $ | 3,389 | $ | — | $ | 3,389 | |||||
(1) During 2013, the Company recorded goodwill related to the Robertex acquisition.
The following table represents the details of the Company's intangible assets:
Intangible assets subject to amortization:
2014 | 2013 | ||||||||||||||||||||||
Gross | Accumulated Amortization | Net | Gross | Accumulated Amortization | Net | ||||||||||||||||||
Customer relationships | $ | 208 | $ | (32 | ) | $ | 176 | $ | 1,062 | $ | (40 | ) | $ | 1,022 | |||||||||
Rug design coding | 144 | (29 | ) | 115 | 144 | (14 | ) | 130 | |||||||||||||||
Trade names | 3,300 | (214 | ) | 3,086 | 1,368 | (34 | ) | 1,334 | |||||||||||||||
Total | $ | 3,652 | $ | (275 | ) | $ | 3,377 | $ | 2,574 | $ | (88 | ) | $ | 2,486 | |||||||||
During 2014, the Company discontinued its Carousel operations which resulted in the impairment of customer relationships of $786 and trade names of $1,271 (See Note 21). These amounts have been included in the loss on disposal of discontinued operations in the Company's Consolidated Statements of Operations.
THE DIXIE GROUP, INC.
NOTES TO CONSOLIDATED FINANCIAL STATEMENTS
(amounts in thousands, except per share data)
(Continued)
Amortization expense for intangible assets is summarized as follows:
2014 | 2013 | 2012 | |||||||||
Customer relationships | $ | 59 | $ | 40 | $ | — | |||||
Rug design coding | 15 | 14 | — | ||||||||
Trade names | 277 | 34 | — | ||||||||
Amortization expense | $ | 351 | $ | 88 | $ | — | |||||
The estimated future amortization expense during each of the next five fiscal years is as follows:
Year | Amount | |||
2015 | $ | 305 | ||
2016 | 305 | |||
2017 | 305 | |||
2018 | 305 | |||
2019 | 305 | |||
NOTE 8 - ACCRUED EXPENSES
Accrued expenses are summarized as follows:
2014 | 2013 | ||||||
Compensation and benefits (1) | $ | 8,894 | $ | 8,233 | |||
Provision for customer rebates, claims and allowances | 7,960 | 6,202 | |||||
Advanced customer deposits | 3,501 | 1,862 | |||||
Outstanding checks in excess of cash | 1,190 | 3,873 | |||||
Other | 7,762 | 6,032 | |||||
Accrued expenses | $ | 29,307 | $ | 26,202 | |||
(1) | Includes a liability related to the Company's self-insured Workers' Compensation program. This program is collateralized by letters of credit in the aggregate amount of $1,762. |
NOTE 9 - PRODUCT WARRANTY RESERVES
The Company generally provides product warranties related to manufacturing defects and specific performance standards for its products. Product warranty reserves are included in accrued expenses in the Company's Consolidated Financial Statements. The following is a summary of the Company's product warranty activity.
2014 | 2013 | ||||||
Product warranty reserve at beginning of period | $ | 1,850 | $ | 1,297 | |||
Warranty reserve assumed in business combination | 209 | — | |||||
Warranty liabilities accrued | 4,720 | 4,330 | |||||
Warranty liabilities settled | (5,102 | ) | (3,905 | ) | |||
Changes for pre-existing warranty liabilities | 537 | 128 | |||||
Product warranty reserve at end of period | $ | 2,214 | $ | 1,850 | |||
THE DIXIE GROUP, INC.
NOTES TO CONSOLIDATED FINANCIAL STATEMENTS
(amounts in thousands, except per share data)
(Continued)
NOTE 10 - LONG-TERM DEBT AND CREDIT ARRANGEMENTS
Long-term debt consists of the following:
2014 | 2013 | ||||||
Revolving credit facility - Tranche A | $ | 82,897 | $ | 85,274 | |||
Notes payable - building | 8,295 | — | |||||
Obligation to Development Authority of Gordon County | 3,413 | 4,447 | |||||
Note payable - Robertex acquisition | 3,062 | 3,789 | |||||
Equipment notes payable | 13,362 | 7,987 | |||||
Notes payable | 1,261 | 2,210 | |||||
Capital lease obligations | 14,998 | 4,281 | |||||
Total long-term debt | 127,288 | 107,988 | |||||
Less: current portion of long-term debt | (9,078 | ) | (6,229 | ) | |||
Long-term debt | $ | 118,210 | $ | 101,759 | |||
Amended Revolving Credit Facility
On March 14, 2014, the Company amended its senior credit facility ("amended senior credit facility"), effective as of March 19, 2014 to permit the acquisition of Atlas by means of an over advance ("Tranche B Advance") of $5,438 which increased to $5,764. The Tranche B Advance matured on June 30, 2014 and amounts outstanding were repaid. There is no availability remaining under Tranche B. The Tranche B Advance had an interest rate of 3.50% plus LIBOR, subject also to various availability percentages, limitations, covenants and conditions. In addition, the revolving portion of the facility ("Tranche A Advance") provides for a maximum of $150,000 of revolving credit, subject to borrowing base availability. The borrowing base is currently equal to specified percentages of the Company's eligible accounts receivable, inventories, fixed assets and real property less reserves established, from time to time, by the administrative agent under the facility. In addition, the term of the amended senior credit facility was extended from August 1, 2018 to March 14, 2019. The amended senior credit facility is secured by a first priority lien on substantially all of the Company's assets.
At the Company's election, Tranche A Advances of the amended senior credit facility bear interest at annual rates equal to either (a) LIBOR for 1, 2 or 3 month periods, as selected by the Company, plus an applicable margin of either 1.50%, 1.75% or 2.00%, or (b) the higher of the prime rate, the Federal Funds rate plus 0.5%, or a daily LIBOR rate plus 1.00%, plus an applicable margin of either 0.50%, 0.75% or 1.00%. The applicable margin is determined based on availability under the amended senior credit facility with margins increasing as availability decreases. The Company pays an unused line fee on the average amount by which the aggregate commitments exceed utilization of the senior credit facility equal to 0.375% per annum.
The amended senior credit facility includes certain affirmative and negative covenants that impose restrictions on the Company's financial and business operations including the restriction on payment of dividends. The amended senior credit facility required the Company to maintain a fixed charge coverage ratio of 1.1 to 1.0 during any period that borrowing availability was less than $14,440 through May 31, 2014 and increased to $16,500 after May 31, 2014. The amendment also provided for a waiver of the measurement and application of the fixed charge coverage ratio that would otherwise have been required by a reduction in excess availability from March 14, 2014 through and including April 13, 2014.
Average Interest Rates and Availability
The weighted-average interest rate on borrowings outstanding under the amended senior credit facility was 2.29% at December 27, 2014 and 2.66% at December 28, 2013. As of December 27, 2014, the unused borrowing availability under the amended senior credit facility was $40,214.
Notes Payable - Building
On November 7, 2014, the Company entered into a ten-year $8,330 note payable to purchase a previously leased distribution center in Adairsville, Georgia. The note payable is scheduled to mature on November 7, 2024 and is secured by the distribution center. The note payable bears interest at a variable rate equal to one month LIBOR plus 2.0% and is payable in equal monthly installments of principal of $35, plus interest calculated on the declining balance of the note, with a final payment of $4,165 due on maturity. In addition, the Company entered into an interest rate swap with an amortizing notional amount effective November 7, 2014 which effectively fixes the interest rate at 4.50%.
THE DIXIE GROUP, INC.
NOTES TO CONSOLIDATED FINANCIAL STATEMENTS
(amounts in thousands, except per share data)
(Continued)
Obligation to Development Authority of Gordon County
On November 2, 2012, the Company signed a 6.00% seller-financed note of $5,500 with Lineage PCR, Inc. (“Lineage”) related to the acquisition of a continuous carpet dyeing facility in Calhoun, Georgia. Effective December 28, 2012, through a series of agreements between the Company, the Development Authority of Gordon County, Georgia (the “Authority”) and Lineage, obligations with identical payment terms as the original note to Lineage became payment obligations to the Authority. These transactions were consummated in order to provide a tax abatement to the Company related to the real estate and equipment at this facility. The tax abatement plan provides for abatement for certain components of the real and personal property taxes for up to ten years. At any time, the Company has the option to pay off the obligation, plus a nominal amount. The debt to the Authority bears interest at 6.00% and is payable in equal monthly installments of principal and interest of $106 over 57 months.
Note Payable - Robertex Acquisition
On July 1, 2013, the Company signed a 4.50% seller-financed note of $4,000, which was recorded at a fair value of $3,749, with Robert P. Rothman related to the acquisition of Robertex Associates, LLC ("Robertex") in Calhoun, Georgia. The note is payable in five annual installments of principal of $800 plus interest. The note matures June 30, 2018.
Equipment Notes Payable
The terms of the Company's equipment financing notes are as follows:
Instrument | Interest Rate | Term (Months) | Principal and Interest Payments | Frequency | Maturity Date | ||||
Note Payable - Equipment | 6.42 | % | 36 | $ | 16 | Monthly | April 1, 2016 | ||
Note Payable - Equipment | 2.00 | % | 60 | 38 | Monthly | August 1, 2016 | |||
Note Payable - Equipment | 5.94 | % | 75 | 41 | Monthly | February 1, 2019 | |||
Note Payable - Equipment | 1.00 | % | 84 | 18 | Monthly | June 14, 2020 | |||
Note Payable - Equipment | 6.84 | % | 60 | 3 | Monthly | July 1, 2018 | |||
Note Payable - Equipment | 6.86 | % | 60 | 49 | Monthly | October 1, 2018 | |||
Note Payable - Equipment | 3.65 | % | 84 | 8 | Monthly | December 24, 2021 | |||
Note Payable - Equipment | 1.50 | % | 36 | 49 | Quarterly | August 17, 2016 | |||
Note Payable - Equipment | 5.37 | % | 60 | 53 | Monthly | September 26, 2019 | |||
Note Payable - Equipment | 3.76 | % | 84 | 1 | Monthly | October 7, 2021 | |||
Note Payable - Equipment | 3.54 | % | 84 | 4 | Monthly | October 23, 2021 | |||
Note Payable - Equipment | 4.74 | % | 60 | 28 | Monthly | October 23, 2019 | |||
Note Payable - Equipment | 4.66 | % | 84 | 9 | Monthly | October 23, 2021 | |||
Note Payable - Equipment | 1.60 | % | 84 | 17 | Monthly | October 16, 2021 | |||
In connection with certain of the notes, the Company is required to maintain funds in a separate escrow account. At December 27, 2014 and December 28, 2013, the balances held were $574 and $1,401, respectively, and are included in other current assets on the Company’s Consolidated Balance Sheets. The Company's equipment financing notes are secured by the specific equipment financed and do not contain any financial covenants.
THE DIXIE GROUP, INC.
NOTES TO CONSOLIDATED FINANCIAL STATEMENTS
(amounts in thousands, except per share data)
(Continued)
Capital Lease Obligations
The terms of the Company's capitalized lease obligations are as follows:
Instrument | Interest Rate | Term (Months) | Principal and Interest Payments | Frequency | Maturity Date | ||||
Capital Lease - Equipment | 7.04 | % | 84 | $ | 8 | Monthly | December 1, 2015 | ||
Capital Lease - Equipment | 2.90 | % | 60 | 11 | Monthly | August 1, 2017 | |||
Capital Lease - Equipment | 4.76 | % | 58 | 33 | Monthly | October 1, 2018 | |||
Capital Lease - Equipment | 5.74 | % | 56 | 2 | Monthly | October 1, 2017 | |||
Capital Lease - Equipment | 4.88 | % | 48 | 16 | Quarterly | April 1, 2017 | |||
Capital Lease - Equipment | 5.65 | % | 48 | 13 | Quarterly | April 1, 2018 | |||
Capital Lease - Equipment | 5.42 | % | 36 | 2 | Quarterly | April 1, 2017 | |||
Capital Lease - Equipment | 5.10 | % | 60 | 3 | Monthly | November 1, 2018 | |||
Capital Lease - Equipment | 4.69 | % | 84 | 21 | Monthly | March 25, 2021 | |||
Capital Lease - Equipment | 4.59 | % | 60 | 6 | Monthly | February 1, 2018 | |||
Capital Lease - Equipment | 4.70 | % | 60 | 3 | Monthly | April 1, 2018 | |||
Capital Lease - Equipment | 4.78 | % | 60 | 1 | Monthly | June 1, 2018 | |||
Capital Lease - Equipment | 5.24 | % | 72 | 28 | Monthly | June 1, 2020 | |||
Capital Lease - Equipment | 5.82 | % | 51 | 43 | Monthly | September 1, 2018 | |||
Capital Lease - Equipment | 5.22 | % | 84 | 11 | Monthly | August 1, 2021 | |||
Capital Lease - Equipment | 4.69 | % | 84 | 5 | Monthly | July 7, 2021 | |||
Capital Lease - Equipment | 5.25 | % | 84 | 22 | Monthly | October 1, 2021 | |||
Capital Lease - Equipment | 5.28 | % | 84 | 33 | Monthly | October 1, 2021 | |||
Capital Lease - Equipment | 7.37 | % | 60 | 1 | Monthly | April 24, 2019 | |||
Capital Lease - Equipment | 6.07 | % | 48 | 38 | Monthly | January 1, 2019 | |||
Capital Lease - Equipment | 5.14 | % | 84 | 14 | Monthly | January 1, 2022 | |||
The Company's capital lease obligations are secured by the specific equipment leased.
Interest Payments and Debt Maturities
Interest payments for continuing operations were $3,757 in 2014, $3,067 in 2013, and $2,795 in 2012. Maturities of long-term debt for periods following December 27, 2014 are as follows:
Long-Term Debt | Capital Leases | Total | |||||||||
(See Note 18) | |||||||||||
2015 | $ | 6,295 | $ | 2,783 | $ | 9,078 | |||||
2016 | 5,445 | 2,854 | 8,299 | ||||||||
2017 | 4,853 | 2,923 | 7,776 | ||||||||
2018 | 3,733 | 2,678 | 6,411 | ||||||||
2019 | 84,789 | 1,497 | 86,286 | ||||||||
Thereafter | 7,175 | 2,263 | 9,438 | ||||||||
Total | $ | 112,290 | $ | 14,998 | $ | 127,288 | |||||
NOTE 11 - FAIR VALUE MEASUREMENTS
Fair value is defined as the exchange value of an asset or a liability in an orderly transaction between market participants. The fair value guidance outlines a valuation framework and establishes a fair value hierarchy in order to increase the consistency and comparability of fair value measurements and disclosures. The hierarchy consists of three levels as follows:
THE DIXIE GROUP, INC.
NOTES TO CONSOLIDATED FINANCIAL STATEMENTS
(amounts in thousands, except per share data)
(Continued)
Level 1 - Quoted market prices in active markets for identical assets or liabilities as of the reported date;
Level 2 - Other than quoted market prices in active markets for identical assets or liabilities, quoted prices for similar assets and liabilities in active markets, quoted prices for identical or similar assets or liabilities in markets that are not active, and other than quoted prices for assets or liabilities and prices that are derived principally from or corroborated by market data by correlation or other means; and
Level 3 - Measurements using management's best estimate of fair value, where the determination of fair value requires significant management judgment or estimation.
The following table reflects the fair values of assets and liabilities measured and recognized at fair value on a recurring basis on the Company's Consolidated Balance Sheets as of December 27, 2014 and December 28, 2013:
2014 | 2013 | Fair Value Hierarchy Level | |||||||
Assets: | |||||||||
Rabbi Trust (1) | $ | 15,316 | $ | 14,242 | Level 2 | ||||
Interest rate swaps (2) | 34 | 556 | Level 2 | ||||||
Liabilities: | |||||||||
Interest rate swaps (2) | $ | 3,040 | $ | 813 | Level 2 | ||||
Deferred compensation plan (3) | 14,331 | 13,210 | Level 2 | ||||||
Contingent consideration (4) | 1,855 | 2,751 | Level 3 | ||||||
(1) | The Company maintains a Rabbi Trust that serves as an investment designed to offset its deferred compensation plan liability. The investment assets of the trust consist of life insurance policies for which the Company recognizes income or expense based upon changes in cash surrender value. |
(2) | The fair value of the interest rate swaps was obtained from external sources. The interest rate swaps were valued using observable inputs (e.g., LIBOR yield curves, credit spreads). Valuations of interest rate swaps may fluctuate considerably from period-to-period due to volatility in underlying interest rates, which are driven by market conditions and the duration of the instrument. Credit adjustments could have a significant impact on the valuations due to changes in credit ratings of the Company or its counterparties. |
(3) | Senior management and other highly compensated associates may defer a specified percentage of their compensation into a non-qualified deferred compensation plan. Changes in the value of the deferred compensation under this plan are recognized each period based on the fair value of the underlying measurement funds. |
(4) | As a result of the Colormaster and Crown Rug acquisitions in 2012 and the Robertex acquisition in 2013, the Company recorded contingent consideration liabilities at fair value. These fair value measurements were based on calculations that utilize significant inputs not observable in the market including forecasted revenues, gross margins and discount rates and thus represent Level 3 measurements. These fair value measurements are directly impacted by the Company's estimates. Accordingly, if the estimates are higher or lower than the estimates within the fair value measurement, the Company would record additional charges or benefits, respectively, as appropriate. |
Changes in the fair value measurements using significant unobservable inputs (Level 3) during the years ending December 27, 2014 and December 28, 2013 were as follows:
2014 | 2013 | ||||||
Beginning balance | $ | 2,751 | $ | 1,928 | |||
Contingent consideration liabilities recorded at fair value at acquisition | — | 1,307 | |||||
Fair value adjustments | (625 | ) | (23 | ) | |||
Settlements | (271 | ) | (461 | ) | |||
Ending balance | $ | 1,855 | $ | 2,751 | |||
There were no transfers of assets or liabilities between Level 1, Level 2 and Level 3 during 2014 or 2013. If any, the Company recognizes the transfers in or transfers out at the end of the reporting period.
THE DIXIE GROUP, INC.
NOTES TO CONSOLIDATED FINANCIAL STATEMENTS
(amounts in thousands, except per share data)
(Continued)
The carrying amounts and estimated fair values of the Company's financial instruments are summarized as follows:
2014 | 2013 | ||||||||||||||
Carrying | Fair | Carrying | Fair | ||||||||||||
Amount | Value | Amount | Value | ||||||||||||
Financial assets: | |||||||||||||||
Cash and cash equivalents | $ | 394 | $ | 394 | $ | 255 | $ | 255 | |||||||
Notes receivable, including current portion | 282 | 282 | 282 | 282 | |||||||||||
Interest rate swaps | 34 | 34 | 556 | 556 | |||||||||||
Financial Liabilities: | |||||||||||||||
Long-term debt and capital leases, including current portion | 127,288 | 119,776 | 107,988 | 101,752 | |||||||||||
Interest rate swaps | 3,040 | 3,040 | 813 | 813 | |||||||||||
The fair values of the Company's long-term debt and capital leases were estimated using market rates the Company believes would be available for similar types of financial instruments and represent level 2 measurements. The fair values of cash and cash equivalents and notes receivable approximate their carrying amounts due to the short-term nature of the financial instruments.
NOTE 12 - DERIVATIVES
The Company's earnings, cash flows and financial position are exposed to market risks relating to interest rates. It is the Company's policy to minimize its exposure to adverse changes in interest rates and manage interest rate risks inherent in funding the Company with debt. The Company addresses this risk by maintaining a mix of fixed and floating rate debt and entering into interest rate swaps for a portion of its variable rate debt to minimize interest rate volatility.
The following is a summary of the Company's interest rate swaps as of December 27, 2014:
Type | Notional Amount | Effective Date | Fixed Rate | Variable Rate | |||
Interest rate swap | $ | 10,000 | October 3, 2011 through September 1, 2016 | 1.330% | 1 Month LIBOR | ||
Interest rate swap | $ | 10,000 | March 1, 2013 through September 1, 2016 | 1.620% | 1 Month LIBOR | ||
Interest rate swap | $ | 5,000 | June 1, 2013 through September 1, 2016 | 1.700% | 1 Month LIBOR | ||
Interest rate swap | $ | 25,000 | September 1, 2016 through September 1, 2021 | 3.105% | 1 Month LIBOR | ||
Interest rate swap | $ | 25,000 | September 1, 2015 through September 1, 2021 | 3.304% | 1 Month LIBOR | ||
Interest rate swap | $ | 8,330 | * | November 7, 2014 through November 7, 2024 | 4.500% | 1 Month LIBOR | |
* Interest rate swap notional amount amortizes by $35 monthly to maturity.
The following table summarizes the fair values of derivative instruments included in the Company's Consolidated Balance Sheets:
Location on Consolidated Balance Sheets | Fair Value | |||||||
2014 | 2013 | |||||||
Asset Derivatives: | ||||||||
Derivatives designated as hedging instruments: | ||||||||
Interest rate swaps | Other Assets | $ | 34 | $ | 556 | |||
Total Asset Derivatives | $ | 34 | $ | 556 | ||||
Liability Derivatives: | ||||||||
Derivatives designated as hedging instruments: | ||||||||
Interest rate swaps, current portion | Accrued Expenses | $ | 650 | $ | 328 | |||
Interest rate swaps, long-term portion | Other Long-Term Liabilities | 2,390 | 485 | |||||
Total Liability Derivatives | $ | 3,040 | $ | 813 | ||||
THE DIXIE GROUP, INC.
NOTES TO CONSOLIDATED FINANCIAL STATEMENTS
(amounts in thousands, except per share data)
(Continued)
The following tables summarize the pre-tax impact of derivative instruments on the Company's financial statements:
Amount of Gain or (Loss) Recognized in AOCIL on the effective portion of the Derivative | |||||||||||
2014 | 2013 | 2012 | |||||||||
Derivatives designated as hedging instruments: | |||||||||||
Cash flow hedges - interest rate swaps | $ | (3,110 | ) | $ | 381 | $ | (767 | ) | |||
Amount of Gain or (Loss) Reclassified from AOCIL on the effective portion into Income (1)(2) | |||||||||||
2014 | 2013 | 2012 | |||||||||
Derivatives designated as hedging instruments: | |||||||||||
Cash flow hedges - interest rate swaps | $ | (372 | ) | $ | (442 | ) | $ | (625 | ) | ||
Amount of Gain or (Loss) Recognized on the ineffective portion in Income on Derivative (3) | |||||||||||
2014 | 2013 | 2012 | |||||||||
Derivatives designated as hedging instruments: | |||||||||||
Cash flow hedges - interest rate swaps | $ | — | $ | — | $ | — | |||||
(1) | The amount of gain (loss) reclassified from AOCIL is included in interest expense on the Company's Consolidated Statements of Operations. |
(2) | The amount of loss expected to be reclassified from AOCIL into earnings during the next 12 months subsequent to fiscal 2014 is $650. |
(3) | The amount of gain (loss) recognized in income on the ineffective portion of interest rate swaps is included in other (income) expense, net on the Company's Consolidated Statements of Operations. |
Amount of Gain or (Loss) Recognized in Income on Derivative (1) | |||||||||||
2014 | 2013 | 2012 | |||||||||
Derivatives not designated as hedging instruments: | |||||||||||
Interest rate swaptions | $ | — | $ | — | $ | 87 | |||||
(1) | The amount of gain (loss) recognized in income for derivatives not designated as hedging instruments is included in other (income) expense, net on the Company's Consolidated Statements of Operations. |
NOTE 13 - EMPLOYEE BENEFIT PLANS
Defined Contribution Plans
The Company sponsors a 401(k) defined contribution plan that covers a significant portion, or approximately 86% of the Company's associates. This plan includes a mandatory Company match on the first 1% of participants' contributions. The Company matches the next 2% of participants' contributions if the Company meets prescribed earnings levels. The plan also provides for additional Company contributions above the 3% level if the Company attains certain additional performance targets. Matching contribution expense for this 401(k) plan was $382 in 2014, $610 in 2013 and $247 in 2012.
Additionally, the Company sponsors a 401(k) defined contribution plan that covers those associates at one facility who are under a collective-bargaining agreement, or approximately 14% of the Company's associates. Under this plan, the Company generally matches participants' contributions, on a sliding scale, up to a maximum of 2.75% of the participant's earnings. Matching contribution expense for the collective-bargaining 401(k) plan was $87 in 2014, $86 in 2013 and $78 in 2012.
Non-Qualified Retirement Savings Plan
The Company sponsors a non-qualified retirement savings plan that allows eligible associates to defer a specified percentage of their compensation. The obligations owed to participants under this plan were $14,331 at December 27, 2014 and $13,210 at December 28, 2013 and are included in other long-term liabilities in the Company's Consolidated Balance Sheets. The obligations are unsecured general obligations of the Company and the participants have no right, interest or claim in the assets of the Company, except as unsecured general creditors. The Company utilizes a Rabbi Trust to hold, invest and reinvest
THE DIXIE GROUP, INC.
NOTES TO CONSOLIDATED FINANCIAL STATEMENTS
(amounts in thousands, except per share data)
(Continued)
deferrals and contributions under the plan. Amounts are invested in Company-owned life insurance in the Rabbi Trust and the cash surrender value of the policies was $15,316 at December 27, 2014 and $14,242 at December 28, 2013 and is included in other assets in the Company's Consolidated Balance Sheets.
Multi-Employer Pension Plan
The Company contributes to a multi-employer pension plan under the terms of a collective-bargaining agreement that covers its union-represented employees. These union-represented employees represented approximately 14% of the Company's total employees. The risks of participating in multi-employer plans are different from single-employer plans. If a participating employer stops contributing to the plan, the unfunded obligations of the plan may be borne by the remaining participating employers. If the Company chooses to stop participating in the multi-employer plan, the Company may be required to pay the plan an amount based on the underfunded status of the plan, referred to as a withdrawal liability.
The Company's participation in the multi-employer pension plan for 2014 is provided in the table below. The "EIN/Pension Plan Number" column provides the Employee Identification Number (EIN) and the three digit plan number. The most recent Pension Protection Act (PPA) zone status available in 2014 and 2013 is for the plan's year-end at 2013 and 2012, respectively. The zone status is based on information that the Company received from the plan and is certified by the plan's actuary. Among other factors, plans in the red zone are generally less than 65% funded, plans in the yellow zone are less than 80% funded and plans in the green zone are at least 80% funded. The "FIP/RP Status Pending/Implemented" column indicates a plan for which a financial improvement plan (FIP) or a rehabilitation plan (RP) is either pending or has been implemented. The last column lists the expiration date of the collective-bargaining agreement to which the plan is subject.
Pension Fund | EIN/Pension Plan Number | Pension Protection Act Zone Status | FIP/RP Status Pending/Implemented (1) | Contributions (2) | Surcharge Imposed (1) | Expiration Date of Collective-Bargaining Agreement | |||||||||
2014 | 2013 | 2014 | 2013 | 2012 | |||||||||||
The Pension Plan of the National Retirement Fund | 13-6130178 - 001 | Red | Red | Implemented | $ | 279 | $ | 279 | $ | 256 | Yes | 6/3/2017 | |||
(1) The collective-bargaining agreement requires the Company to contribute to the plan at the rate of $0.47 per compensated hour for each covered employee. The Company will make additional contributions, as mandated by law, in accordance with the fund's 2010 Rehabilitation Plan which requires a surcharge equal to $0.03 per hour (from $0.47 to $0.50) effective June 1, 2014 to May 31, 2015. Based upon current employment and benefit levels, the Company's contributions to the multi-employer pension plan are expected to be approximately $300 for 2015.
(2) The Company's contributions to the plan do not represent more than 5% of the total contributions to the plan for the most recent plan year available.
Postretirement Plans
The Company inherited a legacy postretirement benefit plan that provides life insurance to a limited number of associates as a result of a prior acquisition. The Company also sponsors a postretirement benefit plan that provides medical insurance for a limited number of associates who retired prior to January 1, 2003 and life insurance to a limited number of associates upon retirement as part of a collective bargaining agreement.
THE DIXIE GROUP, INC.
NOTES TO CONSOLIDATED FINANCIAL STATEMENTS
(amounts in thousands, except per share data)
(Continued)
Information about the benefit obligation and funded status of the Company's postretirement benefit plans is summarized as follows:
2014 | 2013 | ||||||
Change in benefit obligation: | |||||||
Benefit obligation at beginning of year | $ | 598 | $ | 694 | |||
Service cost | 7 | 7 | |||||
Interest cost | 22 | 23 | |||||
Participant contributions | 12 | 15 | |||||
Actuarial gain | (317 | ) | (137 | ) | |||
Benefits paid | (5 | ) | (5 | ) | |||
Medicare Part D subsidy | — | 1 | |||||
Benefit obligation at end of year | 317 | 598 | |||||
Change in plan assets: | |||||||
Fair value of plan assets at beginning of year | — | — | |||||
Employer contributions | (7 | ) | (11 | ) | |||
Participant contributions | 12 | 15 | |||||
Benefits paid | (5 | ) | (5 | ) | |||
Medicare Part D subsidy | — | 1 | |||||
Fair value of plan assets at end of year | — | — | |||||
Unfunded amount | $ | (317 | ) | $ | (598 | ) | |
The balance sheet classification of the Company's liability for postretirement benefit plans is summarized as follows:
2014 | 2013 | ||||||
Accrued expenses | $ | 17 | $ | 18 | |||
Other long-term liabilities | 300 | 580 | |||||
Total liability | $ | 317 | $ | 598 | |||
Benefits expected to be paid on behalf of associates for postretirement benefit plans during the period 2015 through 2024 are summarized as follows:
Years | Postretirement Plans | ||
2015 | $ | 16 | |
2016 | 16 | ||
2017 | 15 | ||
2018 | 15 | ||
2019 | 16 | ||
2020 - 2024 | 83 | ||
Assumptions used to determine benefit obligations of the Company's postretirement benefit plans are summarized as follows:
2014 | 2013 | ||||
Weighted-average assumptions as of year-end: | |||||
Discount rate (benefit obligations) | 4.73 | % | 3.16 | % | |
THE DIXIE GROUP, INC.
NOTES TO CONSOLIDATED FINANCIAL STATEMENTS
(amounts in thousands, except per share data)
(Continued)
Assumptions used and related effects of health care cost are summarized as follows:
2014 | 2013 | ||||
Health care cost trend assumed for next year | 8.00 | % | 8.00 | % | |
Rate to which the cost trend is assumed to decline | 5.00 | % | 5.00 | % | |
Year that the rate reaches the ultimate trend rate | 2016 | 2017 | |||
The effect of a 1% change in the health care cost trend on the Company's postretirement benefit plans is summarized as follows:
2014 | 2013 | ||||||||||||||
1% Increase | 1% Decrease | 1% Increase | 1% Decrease | ||||||||||||
Accumulated postretirement benefit obligation | $ | 2 | $ | (2 | ) | $ | 4 | $ | (3 | ) | |||||
Components of net periodic benefit cost (credit) for all postretirement plans are summarized as follows:
2014 | 2013 | 2012 | |||||||||
Service cost | $ | 7 | $ | 7 | $ | 7 | |||||
Interest cost | 22 | 23 | 26 | ||||||||
Amortization of prior service credits | (88 | ) | (88 | ) | (88 | ) | |||||
Recognized net actuarial gains | (31 | ) | (35 | ) | (45 | ) | |||||
Settlement gain | (251 | ) | (105 | ) | (48 | ) | |||||
Net periodic benefit cost (credit) | $ | (341 | ) | $ | (198 | ) | $ | (148 | ) | ||
Pre-tax amounts included in AOCIL for the Company's postretirement benefit plans at 2014 are summarized as follows:
Postretirement Benefit Plans | |||||||
Balance at 2014 | 2015 Expected Amortization | ||||||
Prior service credits | $ | (102 | ) | $ | (88 | ) | |
Unrecognized actuarial gains | (427 | ) | (37 | ) | |||
Totals | $ | (529 | ) | $ | (125 | ) | |
NOTE 14 - INCOME TAXES
The provision (benefit) for income taxes on income (loss) from continuing operations consists of the following:
2014 | 2013 | 2012 | |||||||||
Current | |||||||||||
Federal | $ | 979 | $ | 282 | $ | 154 | |||||
State | (190 | ) | 178 | 88 | |||||||
Total current | 789 | 460 | 242 | ||||||||
Deferred | |||||||||||
Federal | 243 | (955 | ) | (592 | ) | ||||||
State | 21 | (82 | ) | (51 | ) | ||||||
Total deferred | 264 | (1,037 | ) | (643 | ) | ||||||
Income tax provision (benefit) | $ | 1,053 | $ | (577 | ) | $ | (401 | ) | |||
THE DIXIE GROUP, INC.
NOTES TO CONSOLIDATED FINANCIAL STATEMENTS
(amounts in thousands, except per share data)
(Continued)
Differences between the provision (benefit) for income taxes and the amount computed by applying the statutory federal income tax rate to income (loss) from continuing operations before taxes are summarized as follows:
2014 | 2013 | 2012 | |||||||||
Federal statutory rate | 35 | % | 35 | % | 35 | % | |||||
Statutory rate applied to income (loss) from continuing operations before taxes | $ | 604 | $ | 1,743 | $ | (369 | ) | ||||
Plus state income taxes, net of federal tax effect | (169 | ) | 96 | 24 | |||||||
Total statutory provision (benefit) | 435 | 1,839 | (345 | ) | |||||||
Increase (decrease) attributable to: | |||||||||||
Nondeductible meals and entertainment | 143 | 112 | 88 | ||||||||
Domestic production activities deduction | 112 | (208 | ) | — | |||||||
Federal tax credits | (483 | ) | (1,612 | ) | — | ||||||
Reserve for uncertain tax positions | 109 | 286 | — | ||||||||
Goodwill | (124 | ) | 283 | — | |||||||
Change in valuation allowance | 569 | (1,190 | ) | — | |||||||
Non-taxable insurance proceeds | — | (71 | ) | — | |||||||
Stock-based compensation | 117 | — | 14 | ||||||||
True-up to tax return | 102 | 14 | (75 | ) | |||||||
Other items | 73 | (30 | ) | (83 | ) | ||||||
Total tax provision (benefit) | $ | 1,053 | $ | (577 | ) | $ | (401 | ) | |||
In 2014, the Company increased valuation allowances by $569 related to state income tax loss carryforwards and credit carryforwards. This was primarily the result of actual 2014 pretax earnings being significantly less that the 2014 forecasted earnings used in the 2013 analysis, a change in California apportionment rules that limit the utilization of net operating loss and credit carryforwards in future years and a projected tax loss in 2014 that resulted in the need to record a valuation allowance against that loss in separate company reporting states.
During 2013, the Company reversed $1,190 of previously established reserves related to state income tax loss carryforwards and state income tax credit carryforwards. The reversal of the reserves was based on a number of factors including current and future earnings assumptions by taxing jurisdiction. Additionally, 2013 included certain tax credits of approximately $520 related to 2009 - 2011 determined to be available for utilization and $304 of 2012 research and development tax credits that could not be recognized until the extension of the credit was approved by Congress in 2013.
The Company’s 2012 effective income tax benefit rate varied from statutory rates primarily as a result of adjustments to estimates used in the 2011 estimated tax calculations versus amounts used in the subsequent tax return filing for the 2011 period; net of the effects of permanent differences on the lower level of pre-tax earnings in the 2012 tax calculations.
Income tax payments, net of income tax refunds received for continuing and discontinued operations were $345 in 2014, $58 in 2013 and $1,318 in 2012.
THE DIXIE GROUP, INC.
NOTES TO CONSOLIDATED FINANCIAL STATEMENTS
(amounts in thousands, except per share data)
(Continued)
Significant components of the Company's deferred tax assets and liabilities are as follows:
2014 | 2013 | ||||||
Deferred tax assets: | |||||||
Inventories | $ | 2,842 | $ | 2,226 | |||
Retirement benefits | 3,215 | 3,408 | |||||
State net operating losses | 3,417 | 2,936 | |||||
Federal net operating losses | 3,503 | — | |||||
State tax credit carryforwards | 1,740 | 1,740 | |||||
Federal tax credit carryforwards | 2,472 | — | |||||
Allowances for bad debts, claims and discounts | 3,175 | 2,527 | |||||
Other | 4,776 | 5,279 | |||||
Total deferred tax assets | 25,140 | 18,116 | |||||
Valuation allowance | (4,317 | ) | (3,748 | ) | |||
Net deferred tax assets | 20,823 | 14,368 | |||||
Deferred tax liabilities: | |||||||
Property, plant and equipment | 17,477 | 11,818 | |||||
Total deferred tax liabilities | 17,477 | 11,818 | |||||
Net deferred tax asset | $ | 3,346 | $ | 2,550 | |||
Balance sheet classification: | 2014 | 2013 | |||||
Current deferred tax assets | $ | 12,722 | $ | 6,622 | |||
Non-current deferred tax liabilities | 9,376 | 4,072 | |||||
Net deferred tax asset | $ | 3,346 | $ | 2,550 | |||
At December 27, 2014, $3,503 of deferred tax assets related to approximately $10,010 of federal net operating loss carryforwards and $3,417 of deferred tax assets related to approximately $77,405 of state net operating loss carryforwards. In addition, $2,472 of federal tax credit carryforwards and $1,740 of state tax credit carryforwards were available to the Company. The federal net operating loss carryforwards and the federal tax credit carryforwards will expire in 20 years. The state net operating loss carryforwards and the state tax credit carryforwards will expire within 10 years. A valuation allowance of $4,317 is recorded to reflect the estimated amount of deferred tax assets that may not be realized during the carryforward periods. At December 27, 2014, the Company is in a net deferred tax asset position of $3,346. The Company performed an analysis related to the net deferred tax asset and believes that the net tax asset is recoverable in future periods.
Tax Uncertainties
The Company accounts for uncertainty in income tax positions according to FASB guidance relating to uncertain tax positions. Unrecognized tax benefits were $400 and $291 at December 27, 2014 and December 28, 2013, respectively. Such benefits, if recognized, would affect the Company's effective tax rate. There were no significant interest or penalties accrued as of December 27, 2014 and December 28, 2013.
THE DIXIE GROUP, INC.
NOTES TO CONSOLIDATED FINANCIAL STATEMENTS
(amounts in thousands, except per share data)
(Continued)
The following is a summary of the change in the Company's unrecognized tax benefits:
2014 | 2013 | 2012 | |||||||||
Balance at beginning of year | $ | 291 | $ | 5 | $ | 16 | |||||
Additions based on tax positions taken during a prior period | — | 250 | — | ||||||||
Additions based on tax positions taken during a current period | 109 | 41 | — | ||||||||
Reductions related to settlement of tax matters | — | — | — | ||||||||
Reductions related to a lapse of applicable statute of limitations | — | (5 | ) | (11 | ) | ||||||
Balance at end of year | $ | 400 | $ | 291 | $ | 5 | |||||
The Company and its subsidiaries are subject to United States federal income taxes, as well as income taxes in a number of state jurisdictions. The tax years subsequent to 2010 remain open to examination for U.S. federal income taxes. The majority of state jurisdictions remain open for tax years subsequent to 2010. A few state jurisdictions remain open to examination for tax years subsequent to 2009.
NOTE 15 - COMMON STOCK AND EARNINGS (LOSS) PER SHARE
Common & Preferred Stock
The Company's charter authorizes 80,000,000 shares of Common Stock with a $3 par value per share and 16,000,000 shares of Class B Common Stock with a $3 par value per share. Holders of Class B Common Stock have the right to twenty votes per share on matters that are submitted to Shareholders for approval and to dividends in an amount not greater than dividends declared and paid on Common Stock. Class B Common Stock is restricted as to transferability and may be converted into Common Stock on a one share for one share basis. The Company's charter also authorizes 200,000,000 shares of Class C Common Stock, $3 par value per share, and 16,000,000 shares of Preferred Stock. No shares of Class C Common Stock or Preferred Stock have been issued.
On May 20, 2014, the Company completed its equity offering of 2,500,000 shares of Common Stock at a price of $10.65 per share, raising approximately $24,559 after deducting underwriter fees and costs directly related to the offering. The Company used the net proceeds from the offering for general corporate purposes and to reduce the balance under the Company's revolving credit facility, including borrowings associated with the acquisition of Atlas Carpet Mills.
Earnings (Loss) Per Share
The Company's unvested stock awards that contain non-forfeitable rights to dividends or dividend equivalents, whether paid or unpaid, are considered participating securities and are included in the computation of earnings per share. The accounting guidance requires additional disclosure of EPS for common stock and unvested share-based payment awards, separately disclosing distributed and undistributed earnings. Undistributed earnings represent earnings that were available for distribution but were not distributed. Common stock and unvested share-based payment awards earn dividends equally. All earnings were undistributed in all periods presented.
THE DIXIE GROUP, INC.
NOTES TO CONSOLIDATED FINANCIAL STATEMENTS
(amounts in thousands, except per share data)
(Continued)
The following table sets forth the computation of basic and diluted earnings (loss) per share from continuing operations:
2014 | 2013 | 2012 | |||||||||
Basic earnings (loss) per share: | |||||||||||
Income (loss) from continuing operations | $ | 673 | $ | 5,556 | $ | (653 | ) | ||||
Less: Allocation of earnings to participating securities | (197 | ) | (218 | ) | — | ||||||
Income (loss) from continuing operations available to common shareholders - basic | $ | 476 | $ | 5,338 | $ | (653 | ) | ||||
Basic weighted-average shares outstanding (1) | 14,382 | 12,737 | 12,638 | ||||||||
Basic earnings (loss) per share - continuing operations | $ | 0.03 | $ | 0.42 | $ | (0.05 | ) | ||||
Diluted earnings (loss) per share: | |||||||||||
Income (loss) from continuing operations available to common shareholders - basic | $ | 476 | $ | 5,338 | $ | (653 | ) | ||||
Add: Undistributed earnings reallocated to unvested shareholders | 3 | 2 | — | ||||||||
Income (loss) from continuing operations available to common shareholders - basic | $ | 479 | $ | 5,340 | $ | (653 | ) | ||||
Basic weighted-average shares outstanding (1) | 14,382 | 12,737 | 12,638 | ||||||||
Effect of dilutive securities: | |||||||||||
Stock options (2) | 97 | 54 | — | ||||||||
Directors' stock performance units (2) | 65 | 61 | — | ||||||||
Diluted weighted-average shares outstanding (1)(2) | 14,544 | 12,852 | 12,638 | ||||||||
Diluted earnings (loss) per share - continuing operations | $ | 0.03 | $ | 0.42 | $ | (0.05 | ) | ||||
(1) | Includes Common and Class B Common shares, in thousands. |
(2) | Because their effects are anti-dilutive, shares issuable under stock option plans where the exercise price is greater than the average market price of the Company's Common Stock during the relevant period and directors' stock performance units have been excluded. Aggregate shares excluded were 434 in 2014, 510 in 2013 and 827 in 2012. |
NOTE 16 - STOCK PLANS AND STOCK COMPENSATION EXPENSE
The Company recognizes compensation expense relating to share-based payments based on the fair value of the equity instrument issued and records such expense in selling and administrative expenses in the Company's Consolidated Condensed Financial Statements. The number of shares to be issued is determined by dividing the specified dollar value of the award by the market value per share on the grant date. The Company's stock compensation expense was $1,195 in 2014, $847 in 2013 and $937 in 2012.
2006 Stock Awards Plan
On May 3, 2006, the Company's shareholders' approved and adopted the Company's 2006 Stock Awards Plan (the "2006 Plan") which provided for the issuance of up to 800,000 shares of Common Stock and/or Class B Common Stock as stock-based or stock-denominated awards to directors of the Company and to salaried employees of the Company and its participating subsidiaries. The 2006 Plan superseded and replaced The Dixie Group, Inc. Stock Incentive Plan (the "2000 Plan"), which was terminated with respect to the granting of new awards. Awards previously granted under the 2000 Plan will continue to be governed by the terms of that plan and will not be affected by its termination.
On April 27, 2010, the Company's shareholders' approved the amendment and restatement of the 2006 Plan to increase the number of shares that may be issued under the plan from 800,000 to 1,300,000.
On April 30, 2013, the Company's shareholders' approved the amendment of the 2006 Plan to increase the number of shares that may be issued under the plan from 1,300,000 to 1,800,000.
Restricted Stock Awards
Each executive officer has the opportunity to earn a Primary Long-Term Incentive Award of restricted stock and separately receive an award of restricted stock denominated as “Career Shares.” The number of shares issued, if any, is based on the market price of the Company’s Common Stock at the time of grant of the award, subject to a $5.00 per share minimum value. Primary Long-
THE DIXIE GROUP, INC.
NOTES TO CONSOLIDATED FINANCIAL STATEMENTS
(amounts in thousands, except per share data)
(Continued)
Term Incentive Awards vest over 3 years, and Career Shares vest when the participant becomes qualified to retire from the Company at 60 years of age and has retained the Career Shares for 2 years following the grant date.
During 2014, the Company issued 101,315 shares of restricted stock to officers and other key employees. The grant-date fair value of the awards was $1,588, or $15.675 per share, and will be recognized as stock compensation expense over the vesting periods which range from 2 to 13 years from the date the awards were granted. Each award is subject to a continued service condition. The fair value of each share of restricted stock awarded was equal to the market value of a share of the Company's Common Stock on the grant date.
During 2013, the Company issued 173,249 shares of restricted stock to officers and other key employees. The grant-date fair value of the awards was $899, or $5.190 per share, and will be recognized as stock compensation expense over the vesting periods which range from 2 to 14 years from the date the awards were granted. Each award is subject to a continued service condition. The fair value of each share of restricted stock awarded was equal to the market value of a share of the Company's Common Stock on the grant date.
During 2012, the Company issued 241,233 shares of restricted stock to officers and other key employees. The grant-date fair value of the awards was $998, or $4.135 per share, and will be recognized as stock compensation expense over the vesting periods which range from 2 to 15 years from the date the awards were granted. Additionally, the Company issued 48,000 shares of restricted stock to certain key employees. The grant-date fair value of the awards was $156, or $3.255 per share, and will be recognized as stock compensation over a 4 year vesting period from the date the awards were granted. Each award is subject to a continued service condition. The fair value of each share of restricted stock awarded was equal to the market value of a share of the Company's Common Stock on the grant date.
Restricted stock activity for the three years ended December 27, 2014 is summarized as follows:
Number of Shares | Weighted-Average Grant-Date Fair Value | |||||
Outstanding at December 31, 2011 | 306,529 | $ | 8.00 | |||
Granted | 289,233 | 3.99 | ||||
Vested | (113,647 | ) | 4.20 | |||
Forfeited | (17,229 | ) | 4.14 | |||
Outstanding at December 29, 2012 | 464,886 | 6.57 | ||||
Granted | 173,249 | 5.19 | ||||
Vested | (112,336 | ) | 4.15 | |||
Forfeited | — | — | ||||
Outstanding at December 28, 2013 | 525,799 | 6.64 | ||||
Granted | 101,315 | 15.68 | ||||
Vested | (144,875 | ) | 4.50 | |||
Forfeited | (125,000 | ) | 12.78 | |||
Outstanding at December 27, 2014 | 357,239 | $ | 7.92 | |||
As of December 27, 2014, unrecognized compensation cost related to unvested restricted stock was $1,809. That cost is expected to be recognized over a weighted-average period of 3.6 years. The total fair value of shares vested was approximately $1,512, $669 and $439 during the year 2014, 2013 and 2012, respectively.
Stock Performance Units
Prior to 2014, the Company's non-employee directors received an annual retainer of $12 in cash and $12 in value of Stock Performance Units (subject to a $5.00 minimum per unit) under the Director's Stock Plan. In 2014, the Company's non-employee directors received $18 in cash and $18 in value of Stock Performance Units (subject to a $5.00 minimum per unit). If market value at the date of the grants is above $5.00 per share; there is no reduction in the number of units issued. However, if the market value at the date of the grants is below $5.00, units will be reduced to reflect the $5.00 per share minimum. Upon retirement, the Company issues the number of shares of Common Stock equivalent to the number of Stock Performance Units held by non-employee directors at that time. As of December 27, 2014, 109,359 Stock Performance Units were outstanding under this plan.
THE DIXIE GROUP, INC.
NOTES TO CONSOLIDATED FINANCIAL STATEMENTS
(amounts in thousands, except per share data)
(Continued)
Stock Purchase Plan
The Company has a stock purchase plan which authorizes 108,000 shares of Common Stock for purchase by supervisory associates at the market price prevailing at the time of purchase. At December 27, 2014, 27,480 shares remained available for issuance under the plan. Shares sold under this plan are held in escrow until paid for and are subject to repurchase agreements which give the Company a right of first refusal to purchase the shares if they are subsequently sold. No shares were sold under the plan in 2014, 2013 or 2012.
Stock Options
All stock options issued under the Company's 2000 Plan were exercisable generally at a cumulative rate of 25% per year after the second year from the date the options were granted. Options granted under the Company's 2006 Plan are exercisable for periods determined at the time the awards are granted. Effective 2009, the Company established a $5.00 minimum exercise price on all options granted. No options were granted during 2014, 2013 or 2012.
The fair value of each option was estimated on the date of grant using the Black-Scholes model. Expected volatility was based on historical volatility of the Company's stock, calculated using the most recent period equal to the expected life of the options. The risk-free interest rate was based on the U.S. Treasury yield for a term equal to the expected life of the option at the time of grant. The Company uses historical exercise behavior data of similar employee groups to determine the expected life of options.
Option activity for the three years ended December 27, 2014 is summarized as follows:
Number of Shares | Weighted-Average Exercise Price | Weighted-Average Fair Value of Options Granted During the Year | ||||||||
Outstanding at December 31, 2011 | 786,728 | $ | 10.91 | $ | — | |||||
Granted | — | — | — | |||||||
Exercised | — | — | — | |||||||
Forfeited | (89,321 | ) | 10.20 | — | ||||||
Outstanding at December 29, 2012 | 697,407 | 11.00 | — | |||||||
Granted | — | — | — | |||||||
Exercised | (37,052 | ) | 5.15 | — | ||||||
Forfeited | — | — | — | |||||||
Outstanding at December 28, 2013 | 660,355 | 11.33 | — | |||||||
Granted | — | — | — | |||||||
Exercised | (53,950 | ) | 10.22 | — | ||||||
Forfeited | (167,170 | ) | 14.36 | — | ||||||
Outstanding at December 27, 2014 | 439,235 | $ | 10.31 | $ | — | |||||
Options exercisable at: | ||||||||||
December 29, 2012 | 638,407 | $ | 11.56 | — | ||||||
December 28, 2013 | 630,855 | 11.63 | — | |||||||
December 27, 2014 | 439,235 | 10.31 | — | |||||||
THE DIXIE GROUP, INC.
NOTES TO CONSOLIDATED FINANCIAL STATEMENTS
(amounts in thousands, except per share data)
(Continued)
The following table summarizes information about stock options at December 27, 2014:
Options Outstanding | ||||||||||
Range of Exercise Prices | Number of Shares | Weighted-Average Remaining Contractual Life | Weighted-Average Exercise Price | |||||||
$4.20 - $5.00 | 111,000 | 4.6 | years | $ | 4.98 | |||||
$6.96 - $6.96 | 81,935 | 0.3 | years | 6.96 | ||||||
$11.85 - $17.58 | 246,300 | 0.9 | years | 13.82 | ||||||
$3.875 - $17.58 | 439,235 | 1.8 | years | $ | 10.31 | |||||
Options Exercisable | ||||||||||
Range of Exercise Prices | Number of Shares | Weighted-Average Remaining Contractual Life | Weighted-Average Exercise Price | |||||||
$4.20 - $5.00 | 111,000 | 4.6 | years | $ | 4.98 | |||||
$6.96 - $6.96 | 81,935 | 0.3 | years | 6.96 | ||||||
$11.85 - $17.58 | 246,300 | 0.9 | years | 13.82 | ||||||
$3.875 - $17.58 | 439,235 | 1.8 | years | $ | 10.31 | |||||
At December 27, 2014, the intrinsic value of outstanding stock options was $607 and the intrinsic value of exercisable stock options was $607. The intrinsic value of stock options exercised during the years ended 2014 and 2013 was $140 and $206, respectively. At December 27, 2014, there was no unrecognized compensation expense related to unvested stock options.
THE DIXIE GROUP, INC.
NOTES TO CONSOLIDATED FINANCIAL STATEMENTS
(amounts in thousands, except per share data)
(Continued)
NOTE 17 - OTHER COMPREHENSIVE INCOME (LOSS)
Components of other comprehensive income (loss) are as follows:
2014 | 2013 | 2012 | |||||||||
Other comprehensive income (loss): | |||||||||||
Unrealized gain (loss) on interest rate swaps: | |||||||||||
Before income taxes | $ | (3,110 | ) | $ | 381 | $ | (767 | ) | |||
Income taxes | (1,182 | ) | 145 | (291 | ) | ||||||
Net of taxes | (1,928 | ) | 236 | (476 | ) | ||||||
Reclassification of loss into earnings from interest rate swaps (1): | |||||||||||
Before income taxes | 372 | 284 | 158 | ||||||||
Income taxes | 141 | 108 | 60 | ||||||||
Net of taxes | 231 | 176 | 98 | ||||||||
Amortization of unrealized loss on dedesignated interest rate swaps (1): | |||||||||||
Before income taxes | — | 158 | 467 | ||||||||
Income taxes | — | 60 | 178 | ||||||||
Net of taxes | — | 98 | 289 | ||||||||
Unrecognized net actuarial gain on postretirement benefit plans: | |||||||||||
Before income taxes | 67 | 32 | 33 | ||||||||
Income taxes | 26 | 12 | 13 | ||||||||
Net of taxes | 41 | 20 | 20 | ||||||||
Reclassification of net actuarial gain into earnings from postretirement benefit plans (2): | |||||||||||
Before income taxes | (31 | ) | (35 | ) | (45 | ) | |||||
Income taxes | (12 | ) | (13 | ) | (18 | ) | |||||
Net of taxes | (19 | ) | (22 | ) | (27 | ) | |||||
Reclassification of prior service credits into earnings from postretirement benefit plans (2): | |||||||||||
Before income taxes | (88 | ) | (88 | ) | (88 | ) | |||||
Income taxes | (34 | ) | (34 | ) | (34 | ) | |||||
Net of taxes | (54 | ) | (54 | ) | (54 | ) | |||||
Other comprehensive income (loss) | $ | (1,729 | ) | $ | 454 | $ | (150 | ) | |||
(1) | Amounts for cash flow hedges reclassified from accumulated other comprehensive income (loss) to net income (loss) were included in interest expense in the Company's Consolidated Statement of Operations. |
(2) | Amounts for postretirement plans reclassified from accumulated other comprehensive income (loss) to net income (loss) were included in selling and administrative expenses in the Company's Consolidated Statement of Operations. |
THE DIXIE GROUP, INC.
NOTES TO CONSOLIDATED FINANCIAL STATEMENTS
(amounts in thousands, except per share data)
(Continued)
Components of accumulated other comprehensive income (loss), net of tax, are as follows:
Interest Rate Swaps | Post-Retirement Liabilities | Total | |||||||||
Balance at December 31, 2011 | (565 | ) | 477 | (88 | ) | ||||||
Unrealized gain (loss) on interest rate swaps, net of tax of $291 | (476 | ) | — | (476 | ) | ||||||
Reclassification of loss into earnings from interest rate swaps, net of tax of $60 | 98 | — | 98 | ||||||||
Amortization of unrealized loss on dedesignated interest rate swaps, net of tax of $178 | 289 | — | 289 | ||||||||
Unrecognized net actuarial gain on postretirement benefit plans, net of tax of $13 | — | 20 | 20 | ||||||||
Reclassification of net actuarial gain into earnings from postretirement benefit plans, net of tax of $18 | — | (27 | ) | (27 | ) | ||||||
Reclassification of prior service credits into earnings from postretirement benefit plans, net of tax of $34 | — | (54 | ) | (54 | ) | ||||||
Balance at December 29, 2012 | (654 | ) | 416 | (238 | ) | ||||||
Unrealized gain (loss) on interest rate swaps, net of tax of $145 | 236 | — | 236 | ||||||||
Reclassification of loss into earnings from interest rate swaps, net of tax of $108 | 176 | — | 176 | ||||||||
Amortization of unrealized loss on dedesignated interest rate swaps, net of tax of $60 | 98 | — | 98 | ||||||||
Unrecognized net actuarial gain on postretirement benefit plans, net of tax of $12 | — | 20 | 20 | ||||||||
Reclassification of net actuarial gain into earnings from postretirement benefit plans, net of tax of $13 | — | (22 | ) | (22 | ) | ||||||
Reclassification of prior service credits into earnings from postretirement benefit plans, net of tax of $34 | — | (54 | ) | (54 | ) | ||||||
Balance at December 28, 2013 | (144 | ) | 360 | 216 | |||||||
Unrealized loss on interest rate swaps, net of tax of $1,182 | (1,928 | ) | — | (1,928 | ) | ||||||
Reclassification of loss into earnings from interest rate swaps, net of tax of $141 | 231 | — | 231 | ||||||||
Unrecognized net actuarial gain on postretirement benefit plans, net of tax of $26 | — | 41 | 41 | ||||||||
Reclassification of net actuarial gain into earnings from postretirement benefit plans, net of tax of $12 | — | (19 | ) | (19 | ) | ||||||
Reclassification of prior service credits into earnings from postretirement benefit plans, net of tax of $34 | — | (54 | ) | (54 | ) | ||||||
Balance at December 27, 2014 | $ | (1,841 | ) | $ | 328 | $ | (1,513 | ) | |||
NOTE 18 - COMMITMENTS AND CONTINGENCIES
Commitments
The Company had purchase commitments of $4,843 at December 27, 2014, primarily related to machinery & equipment. The Company enters into fixed-price contracts with suppliers to purchase natural gas to support certain manufacturing processes. The Company had contract purchases of $977 in 2014, $1,109 in 2013 and $1,127 in 2012. At December 27, 2014, the Company has commitments to purchase natural gas of $1,027 for 2015, $741 for 2016 and $140 for 2017.
THE DIXIE GROUP, INC.
NOTES TO CONSOLIDATED FINANCIAL STATEMENTS
(amounts in thousands, except per share data)
(Continued)
The Company leases certain equipment under capital leases and certain buildings, machinery and equipment under operating leases. Commitments for minimum rentals under non-cancelable leases, including any applicable rent escalation clauses, are as follows:
Capital Leases | Operating Leases | ||||||
2015 | $ | 3,494 | $ | 3,094 | |||
2016 | 3,427 | 2,492 | |||||
2017 | 3,343 | 2,207 | |||||
2018 | 2,946 | 1,864 | |||||
2019 | 1,655 | 1,062 | |||||
Thereafter | 2,366 | 1,516 | |||||
Total commitments | 17,231 | 12,235 | |||||
Less amounts representing interest | (2,233 | ) | — | ||||
Total | $ | 14,998 | $ | 12,235 | |||
Rental expense was approximately $4,066, $2,434 and $2,188 during the years 2014, 2013 and 2012, respectively.
Property, plant and equipment includes machinery and equipment under capital leases which have asset cost and accumulated depreciation of $16,353 and $2,033, respectively, at December 27, 2014, and $5,390 and $914, respectively, at December 28, 2013.
Contingencies
The Company assesses its exposure related to legal matters, including those pertaining to product liability, safety and health matters and other items that arise in the regular course of its business. If the Company determines that it is probable a loss has been incurred, the amount of the loss, or an amount within the range of loss, that can be reasonably estimated will be recorded.
Environmental Remediation
The Company accrues for losses associated with environmental remediation obligations when such losses are probable and estimable. Remediation obligations are accrued based on the latest available information and are recorded at undiscounted amounts. The Company regularly monitors the progress of environmental remediation. If studies indicate that the cost of remediation has changed from the previous estimate, an adjustment to the liability would be recorded in the period in which such determination is made. (See Note 21)
Legal Proceedings
The Company was a plaintiff in a lawsuit against a former raw material supplier. In its lawsuit, the Company alleged that the former supplier sold defective materials to the Company over a period of time, which, when applied to certain of the Company’s products, caused those products to become defective and unmerchantable in the ordinary course of the Company’s business. On January 31, 2014, the Company and the supplier settled its claim for $400. The difference in the amount previously recognized and the settlement amount was recorded in other operating (income) expense in 2013.
THE DIXIE GROUP, INC.
NOTES TO CONSOLIDATED FINANCIAL STATEMENTS
(amounts in thousands, except per share data)
(Continued)
NOTE 19 - OTHER (INCOME) EXPENSE
Other operating (income) expense, net is summarized as follows:
2014 | 2013 | 2012 | |||||||||
Other operating (income) expense, net: | |||||||||||
Insurance proceeds (1) | $ | — | $ | (202 | ) | $ | — | ||||
(Gain) loss on property, plant and equipment disposals | (30 | ) | 195 | 1 | |||||||
Loss on currency exchanges | 587 | 217 | 55 | ||||||||
Amortization of intangibles | 351 | 88 | — | ||||||||
Retirement expenses | 135 | 154 | 201 | ||||||||
Contract settlement | — | 172 | — | ||||||||
Miscellaneous (income) expense | (139 | ) | (130 | ) | (189 | ) | |||||
Other operating (income) expense, net | $ | 904 | $ | 494 | $ | 68 | |||||
(1) | The Company recognized a settlement gain of $202 from a company-owned insurance policy during 2013. |
Other (income) expense, net is summarized as follows:
2014 | 2013 | 2012 | |||||||||
Other (income) expense, net: | |||||||||||
(Gain) loss on non-hedged swaptions | $ | — | $ | — | $ | (87 | ) | ||||
Earnings from equity investments | (209 | ) | — | — | |||||||
(Gain) loss on sale of non-operating assets | 41 | — | (187 | ) | |||||||
Miscellaneous (income) expense | 14 | 26 | (3 | ) | |||||||
Other (income) expense, net | $ | (154 | ) | $ | 26 | $ | (277 | ) | |||
NOTE 20 - FACILITY CONSOLIDATION EXPENSES
2014 Warehousing, Distribution & Manufacturing Consolidation Plan
On January 20, 2014, the Company developed a plan to align its warehousing, distribution and manufacturing to support its growth and manufacturing strategy resulting in better cost structure and improved distribution capabilities and customer service. The key element and first major step of this plan was the leasing of a facility that will serve as a finished goods warehouse and a cut-order and distribution center in Adairsville, Georgia; such lease commenced on May 1, 2014. Costs related to the consolidation include moving and relocation expenses, information technology expenses and expenses relating to conversion and realignment of equipment.
In June of 2014, the Board of Directors’ approved a modification of this plan to include the elimination of both carpet dyeing and yarn dyeing in the Company's Atmore, Alabama facility designed to more fully accommodate the distribution and manufacturing realignment. As a result, the dyeing operations in Atmore will be moved to the Company's continuous dyeing facility, skein dyeing operation and other outside dyeing processors. In addition, certain machinery and equipment has been identified for disposal resulting in an impairment charge of $1,133 during 2014.
2014 Atlas Integration Plan
As a part of the March 19, 2014 acquisition of Atlas, the Company developed a plan to close the operations of the Atlas dyeing facility in Los Angeles and move the carpet dyeing of their products to the Company's dyeing operation located in Santa Ana, California. Costs related to the consolidation include equipment relocation, computer systems modifications and severance costs and should be completed in fiscal 2015.
THE DIXIE GROUP, INC.
NOTES TO CONSOLIDATED FINANCIAL STATEMENTS
(amounts in thousands, except per share data)
(Continued)
Costs related to the facility consolidation plans are summarized as follows:
Asset Impairments (1) | Other Costs (2) | Total Expected Costs | Total Asset Impairments Incurred to Date | Total Other Costs Incurred to Date | Total Remaining Costs | ||||||||||||||||||
Warehousing, Distribution and Manufacturing Consolidation Plan | $ | 1,133 | $ | 5,398 | $ | 6,531 | $ | 1,133 | $ | 4,047 | $ | 1,351 | |||||||||||
Atlas Integration Plan | — | 1,846 | 1,846 | — | 1,467 | 379 | |||||||||||||||||
Total All Plans | $ | 1,133 | $ | 7,244 | $ | 8,377 | $ | 1,133 | $ | 5,514 | $ | 1,730 | |||||||||||
(1) Asset impairments under these plans are classified as "loss on impairments" in the Company's Consolidated Statements of Operations.
(2) Other costs incurred under these plans are classified as "facility consolidation expenses" in the Company's Consolidated Statements of Operations.
NOTE 21 - DISCONTINUED OPERATIONS
The Company has either sold or discontinued certain operations that are accounted for as "Discontinued Operations" under applicable accounting guidance. Discontinued operations are summarized as follows:
2014 | 2013 | 2012 | |||||||||
Carousel | |||||||||||
Net sales | $ | 1,168 | $ | 691 | $ | — | |||||
Loss before income taxes | $ | (863 | ) | $ | (264 | ) | $ | — | |||
Income tax benefit | (265 | ) | (66 | ) | — | ||||||
Loss from discontinued operations, net of tax | $ | (598 | ) | $ | (198 | ) | $ | — | |||
Loss on disposal of discontinued operations before income taxes | $ | (2,363 | ) | $ | — | $ | — | ||||
Income tax benefit | (896 | ) | — | — | |||||||
Loss on disposal of discontinued operations, net of tax | $ | (1,467 | ) | $ | — | $ | — | ||||
Previously Discontinued Operations | |||||||||||
Loss from discontinued operations: | |||||||||||
Workers' compensation costs | $ | (55 | ) | $ | (23 | ) | $ | (143 | ) | ||
Environmental remediation costs | (62 | ) | (74 | ) | (279 | ) | |||||
Loss from discontinued operations, before taxes | (117 | ) | (97 | ) | (422 | ) | |||||
Income tax benefit | (107 | ) | (29 | ) | (148 | ) | |||||
Loss from discontinued operations, net of tax | $ | (10 | ) | $ | (68 | ) | $ | (274 | ) | ||
Carousel
In the fourth quarter of 2014, the Company discontinued the Carousel specialty tufting and weaving operation that was part of the 2013 Robertex, Inc. acquisition. As a result, the Company had a loss on the disposal of the discontinued operation which included the impairment of certain intangibles associated with Carousel and the related machinery and equipment. The amount of non-current assets related to Carousel at December 28, 2013 was $2,579. Operating results associated with Carousel have been classified as discontinued operations for all periods presented.
Previously Discontinued Operations
The Company has previously either sold or discontinued certain operations that have certain contingent obligations primarily related to self-insured workers' compensation and environmental liabilities. Costs related to these obligations for those businesses are classified as discontinued operations.
THE DIXIE GROUP, INC.
NOTES TO CONSOLIDATED FINANCIAL STATEMENTS
(amounts in thousands, except per share data)
(Continued)
Undiscounted reserves are maintained for the self-insured workers' compensation obligations. These reserves are administered by a third-party workers' compensation service provider under the supervision of Company personnel. Such reserves are reassessed on a quarterly basis. Pre-tax cost incurred for workers' compensation as a component of discontinued operations primarily represents a change in estimate for each period from unanticipated medical costs associated with the Company's obligations.
Reserves for environmental remediation obligations are established on an undiscounted basis. The Company has an accrual for environmental remediation obligations of $1,637 and $1,830 as of December 27, 2014 and December 28, 2013, respectively. The liability established represents the Company's best estimate of possible loss and is the reasonable amount to which there is any meaningful degree of certainty given the periods of estimated remediation and the dollars applicable to such remediation for those periods. The actual timeline to remediate, and thus, the ultimate cost to complete such remediation through these remediation efforts, may differ significantly from our estimates. Pre-tax cost for environmental remediation obligations classified as discontinued operations were primarily a result of specific events requiring action and additional expense in each period.
NOTE 22 - RELATED PARTY TRANSACTIONS
During 2014, the Company entered into a 5-year lease with the seller of Atlas Carpet Mills, Inc. to lease three manufacturing facilities as part of the acquisition. The seller is an associate of the Company. Rent paid to the seller during 2014 was $343. The lease was based on current market values for similar facilities.
During 2014, the Company purchased a portion of its product needs in the form of fiber, yarn, carpet and dyeing services from Engineered Floors, an entity substantially controlled by Robert E. Shaw, a shareholder of the Company. Mr. Shaw reported holding approximately 8.5% of the Company's Common Stock, which as of year-end, represented approximately 4.2% of the total vote of all classes of the Company's Common Stock. Engineered Floors is one of several suppliers of such services to the Company. Total purchases from Engineered Floors for 2014, 2013 and 2012 were approximately $11,300, $12,000 and $8,000, respectively; or approximately 3.6% of the Company's cost of goods sold in 2014. Purchases from Engineered Floors are based on market value, negotiated prices. The Company has no contractual arrangements or commitments with Mr. Shaw associated with its business relationship with Engineered Floors. Transactions with Engineered Floors were reviewed and approved by the Company's board of directors.
During 2013, the Company entered into a 10-year lease with the Rothman Family Partnership to lease a manufacturing facility as part of the Robertex acquisition. The Rothman Family Partnership includes Robert P. Rothman who is an associate of the Company. Rent paid to the Rothman Family Partnership during 2014 and 2013 was $257 and $127, respectively. The lease was based on current market values for similar facilities.
NOTE 23 - SUBSEQUENT EVENTS
On January 23, 2015, the Company entered into a ten-year $6,290 note payable to finance an owned facility in Saraland, Alabama. The note payable is scheduled to mature on January 7, 2025 and is secured by the facility. The note payable bears interest at a variable rate equal to one month LIBOR plus 2.0% and is payable in equal monthly installments of principal of $26, plus interest calculated on the declining balance of the note, with a final payment of $3,145 due on maturity. In addition, the Company entered into a forward interest rate swap with an amortizing $5,661 notional amount effective January 7, 2017 which effectively fixes the interest rate at 4.30%.
On March 12, 2015, the Company granted 114,625 shares of restricted stock to officers and other key employees of the Company. The shares will vest over periods ranging from 1 to 29 years from the date of the awards were granted. Each award is subject to a continued service condition. In addition, the Compensation Committee has approved a grant of 100,000 shares of restricted stock to the Company's Chief Executive Officer, subject to shareholder approval. The shares would vest in 4 years from the date of the award was granted and would be subject to both a performance and continued service condition.
SCHEDULE II - VALUATION AND QUALIFYING ACCOUNTS
THE DIXIE GROUP, INC.
(dollars in thousands)
Description | Balance at Beginning of Year | Additions - Charged to Costs and Expenses | Additions - Charged to Other Account - Describe | Deductions - Describe | Balance at End of Year | |||||||||||||||
Year ended December 27, 2014: | ||||||||||||||||||||
Reserves deducted from asset accounts: | ||||||||||||||||||||
Allowance for doubtful accounts | $ | 141 | $ | 402 | $ | — | $ | 93 | (2) | $ | 450 | |||||||||
Reserves classified as liabilities: | ||||||||||||||||||||
Provision for claims, allowances and warranties | 3,377 | 9,249 | 606 | (1) | 8,585 | (3) | 4,647 | |||||||||||||
Year ended December 28, 2013: | ||||||||||||||||||||
Reserves deducted from asset accounts: | ||||||||||||||||||||
Allowance for doubtful accounts | $ | 216 | $ | 40 | $ | — | $ | 115 | (2) | $ | 141 | |||||||||
Reserves classified as liabilities: | ||||||||||||||||||||
Provision for claims, allowances and warranties | 2,509 | 7,141 | — | 6,273 | (3) | 3,377 | ||||||||||||||
Year ended December 29, 2012: | ||||||||||||||||||||
Reserves deducted from asset accounts: | ||||||||||||||||||||
Allowance for doubtful accounts | $ | 467 | $ | 276 | $ | — | $ | 527 | (2) | $ | 216 | |||||||||
Reserves classified as liabilities: | ||||||||||||||||||||
Provision for claims, allowances and warranties | 2,375 | 5,226 | — | 5,092 | (3) | 2,509 | ||||||||||||||
(1) Assumed reserve in business combinations.
(2) Uncollectible accounts written off, net of recoveries.
(3) Reserve reductions for claims, allowances and warranties settled.
ANNUAL REPORT ON FORM 10-K
ITEM 15(b)
EXHIBITS
YEAR ENDED DECEMBER 27, 2014
THE DIXIE GROUP, INC.
CHATTANOOGA, TENNESSEE
Exhibit Index
EXHIBIT NO. | EXHIBIT DESCRIPTION | INCORPORATION BY REFERENCE | |
(1.1) | Underwriting Agreement for 2,500,000 Shares of The Dixie Group, Inc. | Incorporated by reference to Exhibit (1.1) to Dixie's Current Report on Form 8-K dated May 20, 2014.* | |
(2.1) | Securities Purchase Agreement between Masland Carpets, LLC and Robert P. Rothman dated as of June 30, 2013. | Incorporated by reference to Exhibit (2.1) to Dixie's Current Report on Form 8-K dated June 30, 2013. * | |
(3.1) | Text of Restated Charter of The Dixie Group, Inc. as Amended - Blackline Version. | Incorporated by reference to Exhibit (3.4) to Dixie's Annual Report on Form 10-K for the year ended December 27, 2003. * | |
(3.2) | Amended By-Laws of The Dixie Group, Inc. as of February 22, 2007. | Incorporated by reference to Exhibit 3.1 to Dixie's Current Report on Form 8-K dated February 26 2007.* | |
(5.1) | Shelf Registration Statement on Form S-3. | Incorporated by reference to Exhibit (5.1) to Dixie's Current Report on Form 8-K dated May 20, 2014.* | |
(10.1) | The Dixie Group, Inc. Director's Stock Plan. ** | Incorporated by reference to Exhibit (10.1) to Dixie's Annual Report on Form 10-K for the year ended December 27, 1997. * | |
(10.2) | The Dixie Group, Inc. New Non-qualified Retirement Savings Plan effective August 1, 1999. ** | Incorporated by reference to Exhibit (10.1) to Dixie's Quarterly Report on Form 10-Q for the quarter ended June 26, 1999. * | |
(10.3) | The Dixie Group, Inc. Deferred Compensation Plan Amended and Restated Master Trust Agreement effective as of August 1, 1999. ** | Incorporated by reference to Exhibit (10.2) to Dixie's Quarterly Report on Form 10-Q for the quarter ended June 26, 1999. * | |
(10.4) | The Dixie Group, Inc. Stock Incentive Plan, as amended. ** | Incorporated by reference to Annex A to Dixie's Proxy Statement dated April 5, 2002 for its 2002 Annual Meeting of Shareholders. * | |
(10.5) | Form of Stock Option Agreement under The Dixie Group, Inc. Stock Incentive Plan. ** | Incorporated by reference to Exhibit (10.23) to Dixie's Annual Report on Form 10-K for the year ended December 29, 2001. * | |
(10.6) | Form of Stock Rights and Restrictions Agreement for Restricted Stock Award under The Dixie Group, Inc. Stock Incentive Plan, as amended.** | Incorporated by reference to Exhibit (10.35) to Dixie's Annual Report on Form 10-K for the year ended December 25, 2004. * | |
(10.7) | Form of Stock Option Agreement under The Dixie Group, Inc. Stock Incentive Plan for Non-Qualified Options Granted December 20, 2005.** | Incorporated by reference to Exhibit (10.1) to Dixie's Current Report on Form 8-K dated December 20, 2005. * | |
(10.8) | Summary Description of the Director Compensation Arrangements for The Dixie Group, Inc.** | Incorporated by reference to Exhibit (10.34) to Dixie's Annual Report on Form 10-K for the year ended December 25, 2004. * | |
(10.9) | The Dixie Group, Inc. 2006 Stock Awards Plan. ** | Incorporated by reference to Annex A to the Company's Proxy Statement for its 2006 Annual Meeting of Shareholders, filed March 20, 2006. * | |
(10.10) | Summary Description of the 2006 Incentive Compensation Plan, approved February 23, 2006.** | Incorporated by reference to Current Report on Form 8-K dated March 1, 2006. * | |
(10.11) | Summary Description of The Dixie Group, Inc., 2006 Incentive Compensation Plan/Range of Incentives.** | Incorporated by reference to Exhibit (10.62) to Dixie's Annual Report on Form 10-K for the year ended December 28, 2013 .* | |
(10.12) | Material terms of the performance goals for the period 2007-2011, pursuant to which incentive compensation awards may be made to certain key executives of the Company based on the results achieved by the Company during such years, approved March 14, 2006.** | Incorporated by reference to Current Report on Form 8-K dated March 20, 2006. * | |
(10.13) | Form of Award of Career Shares under the 2006 Incentive Compensation Plan for Participants holding only shares of the Company's Common Stock.** | Incorporated by reference to Exhibit (10.1) to Dixie's Current Report on Form 8-K dated June 6, 2006. * | |
(10.14) | Form of Award of Career Shares under the 2006 Incentive Compensation Plan for Participants holding shares of the Company's Class B Common Stock.** | Incorporated by reference to Exhibit (10.2) to Dixie's Current Report on Form 8-K dated June 6, 2006. * | |
(10.15) | Form of Award of Long Term Incentive Plan Shares under the 2006 Incentive Compensation Plan for Participants holding only shares of the Company's Common Stock.** | Incorporated by reference to Exhibit (10.3) to Dixie's Current Report on Form 8-K dated June 6, 2006. * | |
(10.16) | Form of Award of Long Term Incentive Plan Shares under the 2006 Incentive Compensation Plan for Participants holding shares of the Company's Class B Common Stock.** | Incorporated by reference to Exhibit (10.4) to Dixie's Current Report on Form 8-K dated June 6, 2006. * | |
(10.17) | Award of 125,000 shares of Restricted Stock under the 2006 Stock Awards Plan to Daniel K. Frierson.** | Incorporated by reference to Exhibit (10.1) to Dixie's Current Report on Form 8-K dated June 7, 2006. * | |
(10.18) | Summary description of The Dixie Group, Inc. 2007 Annual Compensation Plan.** | Incorporated by reference to Exhibit (10.1) to Dixie's Current Report on Form 8-K dated February 26, 2007.* | |
(10.19) | Merger agreement between The Dixie Group, Inc. and Unite Here National Retirement Fund regarding the Company's Masland Bargaining Unit Defined Benefit Pension Plan.** | Incorporated by reference to Exhibit (99.1) to Dixie's Current Report on Form 8-K dated December 28, 2007* | |
(10.20) | Summary description of The Dixie Group, Inc. 2008 Annual Incentive Plan.** | Incorporated by reference to Exhibit 10.1 to Dixie's Current Report on Form 8-K dated February 15, 2008* | |
(10.21) | Summary description of The Dixie Group, Inc. 2009 Annual Incentive Plan.** | Incorporated by reference to Exhibit 10.1 to Dixie's Current Report on Form 8-K dated March 26, 2009* | |
(10.22) | Amended and restated award of 125,000 shares of Restricted Stock under the 2006 Stock Awards Plan to Daniel K. Frierson.** | Incorporated by reference to Exhibit 10.1 to Dixie's Current Report on Form 8-K dated May 21, 2009.* | |
(10.23) | Summary description of The Dixie Group, Inc. 2010 Incentive Compensation Plan/Range of Incentives.** | Incorporated by reference to Exhibit (10.1) to Dixie's Current Report on Form 8-K dated March 3, 2010.* | |
(10.24) | Summary Description of The Dixie Group, Inc. 2011 Incentive Compensation Plan/Range of Incentives.** | Incorporated by reference to Exhibit (10.1) to Dixie's Current Report on Form 8-K dated February 1, 2011.* | |
(10.25) | Summary Description of The Dixie Group, Inc. 2012 Incentive Compensation Plan/Range of Incentives.** | Incorporated by reference to Exhibit (10.1) to Dixie's Current Report on Form 8-K dated March 12, 2012.* | |
(10.26) | Summary Description of The Dixie Group, Inc. 2012 Incentive Compensation Plan/Range of Incentives.** | Incorporated by reference to Exhibit (10.1) to Dixie's Current Report on Form 8-K dated August 22, 2012.* | |
(10.27) | Summary Description of The Dixie Group, Inc. 2013 Incentive Compensation Plan/Range of Incentives.** | Incorporated by reference to Exhibit (10.1) to Dixie's Current Report on Form 8-K dated February 15, 2013.* | |
(10.28) | Summary Description of The Dixie Group, Inc. 2014 Incentive Compensation Plan/Range of Incentives.** | Incorporated by reference to Exhibit (10.62) to Dixie's Annual Report on Form 10-K for the year ended December 28, 2013 .* | |
(10.29) | Rule 10b5-1 and 10b-18 Repurchase Agreement by and between The Dixie Group, Inc. and Raymond James & Associates, Inc. dated December 11, 2007* | Incorporated by reference to Exhibit (99.1) to Dixie's Current Report on Form 8-K dated December 11, 2007* | |
(10.30) | Agreement by and between Raymond James & Associates, Inc. dated November 6, 2008, to repurchase shares of The Dixie Group, Inc.'s Common Stock. | Incorporated by reference to Exhibit (99.1) to Dixie's Current Report on Form 8-K dated November 6, 2008.* | |
(10.31) | Fixed Rate Swap Agreement between Bank of America, N.A. and The Dixie Group, Inc. | Incorporated by reference to Exhibit (10.1) to Dixie's Current Report on Form 8-K dated April 19, 2010.* | |
(10.32) | Fixed Rate Swap Agreement between Bank of America, N.A. and The Dixie Group, Inc. | Incorporated by reference to Exhibit (10.1) to Dixie's Current Report on Form 8-K dated July 8, 2010.* | |
(10.33) | Termination of interest rate swap between Bank of America, N.A. and The Dixie Group, Inc. dated April 19, 2010. | Incorporated by reference to Exhibit (10.2) to Dixie's Current Report on Form 8-K dated July 8, 2010.* | |
(10.34) | Master Lease Agreement, Corporate Guaranty and Schedule to the Master Lease Agreement by and between General Electric Capital Corporation and Masland Carpets, LLC dated August 21, 2009. | Incorporated by reference to Exhibit (10.1, 10.2, 10.3) to Dixie's Current Report on Form 8-K dated August 25, 2009.* | |
(10.35) | Amended and Modified Financing Agreement, by and between The Dixie Group, Inc. and certain of its subsidiaries named therein, and General Electric Credit Corporation, as lender, dated June 26, 2012. | Incorporated by reference to Exhibit (10.1) to Dixie's Current Report on Form 8-K dated June 26, 2012.* | |
(10.36) | Agreement to Reduce Security Deposit Amount and Amendment to Security Deposit Pledge Agreement, by and between The Dixie Group, Inc. and certain of its subsidiaries named therein, and General Electric Credit Corporation, as lender, dated June 26, 2012. | Incorporated by reference to Exhibit (10.2) to Dixie's Current Report on Form 8-K dated June 26, 2012.* | |
(10.37) | Obligation to the Development Authority of Gordon County; by and among Masland Carpets, LLC, Purchase and Sale Agreement dated December 28, 2012. | Incorporated by reference to Exhibit (4.12) to Dixie's Annual Report on Form 10-K for the year ended December 29, 2012 .* | |
(10.38) | Obligation to the Development Authority of Gordon County; by and among Masland Carpets, LLC, Bill of Sale, dated December 28, 2012. | Incorporated by reference to Exhibit (4.12) to Dixie's Annual Report on Form 10-K for the year ended December 29, 2012. * | |
(10.39) | Obligation to the Development Authority of Gordon County; by and among Masland Carpets, LLC, Lease Agreement, dated December 28, 2012. | Incorporated by reference to Exhibit (4.12) to Dixie's Annual Report on Form 10-K for the year ended December 29, 2012 .* | |
(10.40) | Obligation to the Development Authority of Gordon County; by and among Masland Carpets, LLC, Short Form Lease Agreement, dated December 28, 2012. | Incorporated by reference to Exhibit (4.12) to Dixie's Annual Report on Form 10-K for the year ended December 29, 2012 .* | |
(10.41) | Obligation to the Development Authority of Gordon County; by and among Masland Carpets, LLC, Option Agreement, dated December 28, 2012. | Incorporated by reference to Exhibit (4.12) to Dixie's Annual Report on Form 10-K for the year ended December 29, 2012 .* | |
(10.42) | Obligation to the Development Authority of Gordon County; by and among Masland Carpets, LLC, Pilot Agreement, dated December 28, 2012. | Incorporated by reference to Exhibit (4.12) to Dixie's Annual Report on Form 10-K for the year ended December 29, 2012 .* | |
(10.43) | Obligation to the Development Authority of Gordon County; by and among Masland Carpets, LLC, Loan Agreement, dated December 28, 2012. | Incorporated by reference to Exhibit (4.12) to Dixie's Annual Report on Form 10-K for the year ended December 29, 2012 .* | |
(10.44) | Obligation to the Development Authority of Gordon County; by and among Masland Carpets, LLC, Loan and Security Agreement, dated December 28, 2012. | Incorporated by reference to Exhibit (4.12) to Dixie's Annual Report on Form 10-K for the year ended December 29, 2012 .* | |
(10.45) | Obligation to the Development Authority of Gordon County; by and among Masland Carpets, LLC, Deed to Secure Debt and Security Agreement, dated December 28, 2012. | Incorporated by reference to Exhibit (4.12) to Dixie's Annual Report on Form 10-K for the year ended December 29, 2012 .* | |
(10.46) | Obligation to the Development Authority of Gordon County; by and among Masland Carpets, LLC, Notice and Consent to Assignment, dated December 28, 2012. | Incorporated by reference to Exhibit (4.12) to Dixie's Annual Report on Form 10-K for the year ended December 29, 2012 .* | |
(10.47) | Obligation to the Development Authority of Gordon County; by and among Masland Carpets, LLC, Absolute Assignment of Deed to Secure Debt and Security Agreement and Other Loan Documents, dated December 28, 2012. | Incorporated by reference to Exhibit (4.12) to Dixie's Annual Report on Form 10-K for the year ended December 29, 2012 .* | |
(10.48) | Obligation to the Development Authority of Murray County; by and among TDG Operations, LLC, Series 2014 Bond, dated October 17, 2014. | Filed herewith.* | |
(10.49) | Obligation to the Development Authority of Murray County; by and among TDG Operations, LLC, PILOT Agreement, dated October 1, 2014 | Filed herewith.* | |
(10.50) | Obligation to the Development Authority of Murray County; by and among TDG Operations, LLC, Bond Purchase Loan Agreement, dated October 1, 2014 | Filed herewith.* | |
(10.51) | Obligation to the Development Authority of Murray County; by and among TDG Operations, LLC, Option Agreement, dated October 1, 2014 | Filed herewith.* | |
(10.52) | Obligation to the Development Authority of Murray County; by and among TDG Operations, LLC, Bill of Sale, dated October 1, 2014 | Filed herewith.* | |
(10.53) | Obligation to the Development Authority of Murray County; by and among TDG Operations, LLC, Assignment of Rents and Leases and Security Agreement dated October 1, 2014 | Filed herewith.* | |
(10.54) | Project Development Agreement, by and between TDG Operations, LLC, a Georgia Limited Liability Company doing business as Masland Carpets and the City of Atmore, Alabama, dated December 11, 2014. | Filed herewith. * | |
(10.55) | Credit Agreement, by and among The Dixie Group, Inc. and certain of its subsidiaries, as Borrowers, cert of its subsidiaries, as Guarantor, the Lendors from time to time party thereto, Wells Fargo Bank Capital Finance LLC, as Administrative Agent, and co-lender and Bank of America and the Other parties thereto, dated September 13, 2011. | Incorporated by reference to Exhibit (10.10) to Dixie's Current Report on Form 8-K dated September 14, 2011.* | |
(10.56) | Security Agreement, by and among The Dixie Group, Inc. and certain of its subsidiaries, as Borrowers, certain of its subsidiaries, as Guarantor, the Lenders from time to time party thereto, Wells Fargo Bank Capital Finance LLC, as Administrative Agent, and co-lender and Bank of America and the Other parties thereto, dated September 13, 2011. | Incorporated by reference to Exhibit (10.11) to Dixie's Current Report on Form 8-K dated September 14, 2011.* | |
(10.57) | Form of Mortgages, by and among The Dixie Group, Inc. and certain of its subsidiaries, as Borrowers, certain of its subsidiaries, as Guarantor, the Lenders from time to time party thereto, Wells Fargo Bank Capital Finance LLC, as Administrative Agent, and co-lender and Bank of America and the Other parties thereto, dated September 13, 2011. | Incorporated by reference to Exhibit (10.12) to Dixie's Current Report on Form 8-K dated September 14, 2011.* | |
(10.58) | Credit Agreement, by and between The Dixie Group, Inc. and certain of its subsidiaries named therein, and Wells Fargo Bank, N.A. as lender, dated September 13, 2011. | Incorporated by reference to Exhibit (10.20) to Dixie's Current Report on Form 8-K dated September 14, 2011.* | |
(10.59) | Security Agreement, by and between The Dixie Group, Inc. and certain of its subsidiaries named therein, and Wells Fargo Bank, N.A. as lender, dated September 13, 2011. | Incorporated by reference to Exhibit (10.21) to Dixie's Current Report on Form 8-K dated September 14, 2011.* | |
(10.60) | First Mortgage, by and between The Dixie Group, Inc. and certain of its subsidiaries named therein, and Wells Fargo Bank, N.A. as lender, dated September 13, 2011. | Incorporated by reference to Exhibit (10.22) to Dixie's Current Report on Form 8-K dated September 14, 2011.* | |
(10.61) | First Amendment to Credit Agreement dated as of November 2, 2012, by and among The Dixie Group, Inc., certain of its subsidiaries, and Wells Fargo Bank, N.A. as Agent and the persons identified as Lenders therein. | Incorporated by reference to Exhibit (10.1) to Dixie's Current Report on Form 8-K dated November 5, 2012.* | |
(10.62) | First Amendment to Credit Agreement dated as of November 2, 2012, by and among The Dixie Group, Inc., certain of it subsidiaries, and Wells Fargo Capital Finance, LLC as Agent and the persons identified as Lenders therein. | Incorporated by reference to Exhibit (10.2) to Dixie's Current Report on Form 8-K dated November 5, 2012.* | |
(10.63) | Intercreditor Agreement dated as of November 2, 2012, by and among Wells Fargo Capital Finance, LLC and Wells Fargo Bank, N.A. as Agents and The Dixie Group, Inc. and certain of its subsidiaries. | Incorporated by reference to Exhibit (10.3) to Dixie's Current Report on Form 8-K dated November 5, 2012.* | |
(10.64) | Second Amendment to Credit Agreement dated as of April 1, 2013, by and among The Dixie Group, Inc. certain of its subsidiaries and Wells Fargo Capital Finance, LLC, as Agent and the persons identified as Lenders therein. | Incorporated by reference to Exhibit (10.01) to Dixie's Current Report on Form 8-K dated April 3, 2013.* | |
(10.65) | Third Amendment to Credit Agreement dated as of May 22, 2013, by and among The Dixie Group, Inc. certain of its subsidiaries and Wells Fargo Capital Finance, LLC, as Agent and the persons identified as Lenders therein. | Incorporated by reference to Exhibit (10.57) to Dixie's Annual Report on Form 10-K for the year ended December 28, 2013 .* | |
(10.66) | Fourth Amendment to Credit Agreement dated as of July 1, 2013, by and among The Dixie Group, Inc. certain of its subsidiaries and Wells Fargo Capital Finance, LLC, as Agent and the persons identified as Lenders therein. | Incorporated by reference to Exhibit (10.58) to Dixie's Annual Report on Form 10-K for the year ended December 28, 2013 .* | |
(10.67) | Fifth Amendment to Credit Agreement dated as of July 30, 2013, by and among The Dixie Group, Inc. certain of its subsidiaries and Wells Fargo Capital Finance, LLC, as Agent and the persons identified as Lenders therein. | Incorporated by reference to Exhibit (10.1) to Dixie's Current Report on Form 10-Q dated August 7, 2013. * | |
(10.68) | Sixth Amendment to Credit Agreement dated as of August 30, 2013, by and among The Dixie Group, Inc. certain of its subsidiaries and Wells Fargo Capital Finance, LLC, as Agent and the persons identified as Lenders therein. | Incorporated by reference to Exhibit (10.1) to Dixie's Current Report on Form 10-Q dated November 6, 2013. * | |
(10.69) | Seventh Amendment to Credit Agreement dated as of January 20, 2014, by and among The Dixie Group, Inc. certain of its subsidiaries and Wells Fargo Capital Finance, LLC, as Agent and the persons identified as Lenders therein. | Incorporated by reference to Exhibit (10.1) to Dixie's Current Report on Form 8-K dated January 21, 2014. * | |
(10.70) | Eighth Amendment to Credit Agreement dated as of March 14, 2014, by and among The Dixie Group, Inc. certain of its subsidiaries and Wells Fargo Capital Finance, LLC, as Agent and the persons identified as Lenders therein. | Incorporated by reference to Exhibit (10.2) to Dixie's Current Report on Form 8-K dated March 20, 2014. * | |
(10.71) | Term Note 1 dated November 7, 2014, by TDG Operations, LLC, a Georgia limited liability company and First Tennessee Bank National Association. | Filed herewith.* | |
(10.72) | Deed to Secure Debt, Assignment of Rents and Leases, Security Agreement and Fixture Filing by TDG Operations, LLC, a Georgia limited liability company and First Tennessee Bank National Association, dated November 7, 2014. | Filed herewith.* | |
(10.73) | Term Note 2 dated November 7, 2014, by TDG Operations, LLC, a Georgia limited liability company and First Tennessee Bank National Association. | Filed herewith.* | |
(10.74) | Amendment to Term Loan Agreement, Note 2, dated November 7, 2014, by TDG Operations, LLC, a Georgia limited liability company and First Tennessee Bank National Association. | Filed herewith.* | |
(10.75) | Term Note 3 dated January 23, 2015, by TDG Operations, LLC, a Georgia limited liability company and First Tennessee Bank National Association. | Filed herewith.* | |
(10.76) | Mortgage, Assignment of Rents and Leases, Security Agreement and Fixture Filing by TDG Operations, LLC, a Georgia limited liability company and First Tennessee Bank National Association, dated January 23, 2015. | Filed herewith.* | |
(10.77) | Mortgagee's Subordination and Consent, dated January 23, 2015, by and between Wells Fargo Capital Finance, LLC, as Agent, and The Dixie Group, Inc. and it subsidiaries, as Borrower, and First Tennessee Bank National Association, as Mortgagee. | Filed herewith.* | |
(10.78) | Amended and Restated Mortgagee's Subordination and Consent, dated January 23, 2015, by and between Wells Fargo Capital Finance, LLC, as Agent, and The Dixie Group, Inc. and it subsidiaries, as Borrower, and First Tennessee Bank National Association, as Mortgagee. | Filed herewith.* | |
(10.79) | Amendment to Deed to Secure Debt, Assignment of Rents and Leases, Security Agreement and Fixture Filing, dated January 23, 2015, between TDG Operations, LLC, a Georgia limited liability company, and First Tennessee Bank National Association. | Filed herewith.* | |
(10.80) | Stock Purchase Agreement between TDG Operations, LLC, a wholly owned subsidiary of The Dixie Group, Inc. and James Horwich, Trustee under the Horwich Trust of 1973, to purchase all outstanding capital stock of Atlas Carpet Mills, Inc. | Incorporated by reference to Exhibit (10.2) to Dixie's Current Report on Form 8-K dated March 20, 2014. * | |
(14) | Code of Ethics, as amended and restated, February 15, 2010. | Incorporated by reference to Exhibit 14 to Dixie's Annual Report on Form 10-K for year ended December 26, 2009.* | |
(16) | Letter from Ernst & Young LLP regarding change in certifying accountant. | Incorporated by reference to Exhibit 16 to Dixie's Form 8-K dated November 15, 2013.* | |
(21) | Subsidiaries of the Registrant. | Filed herewith. | |
(23.1) | Consent of Dixon Hughes Goodman LLP Independent Registered Public Accounting Firm. | Filed herewith. | |
(23.2) | Consent of Ernst & Young LLP Independent Registered Public Accounting Firm. | Filed herewith. | |
(31.1) | CEO Certification pursuant to Securities Exchange Act Rule 13a-14(a). | Filed herewith. | |
(31.2) | CFO Certification pursuant to Securities Exchange Act Rule 13a-14(a). | Filed herewith. | |
(32.1) | CEO Certification pursuant to Securities Exchange Act Rule 13a-14(b). | Filed herewith. | |
(32.2) | CFO Certification pursuant to Securities Exchange Act Rule 13a-14(b). | Filed herewith. | |
(101.INS) | XBRL Instance Document | Filed herewith. | |
(101.SCH) | XBRL Taxonomy Extension Schema Document | Filed herewith | |
(101.CAL) | XBRL Taxaonomy Extension Calculation Linkbase Document | Filed herewith. | |
(101.DEF) | XBRL Taxonomy Extension Definition Linkbase Document | Filed herewith. | |
(101.LAB) | XBRL Taxonomy Extension Label Linkbase Document | Filed herewith. | |
(101.PRE) | XBRL Taxonomy Extension Presentation Linkbase Document | Filed herewith. | |
* Commission File No. 0-2585.
** Indicates a management contract or compensatory plan or arrangement.