Attached files
| file | filename |
|---|---|
| EXCEL - IDEA: XBRL DOCUMENT - HEIDRICK & STRUGGLES INTERNATIONAL INC | Financial_Report.xls |
| EX-31.1 - EX-31.1 - HEIDRICK & STRUGGLES INTERNATIONAL INC | d841065dex311.htm |
| EX-32.2 - EX-32.2 - HEIDRICK & STRUGGLES INTERNATIONAL INC | d841065dex322.htm |
| EX-32.1 - EX-32.1 - HEIDRICK & STRUGGLES INTERNATIONAL INC | d841065dex321.htm |
| EX-31.2 - EX-31.2 - HEIDRICK & STRUGGLES INTERNATIONAL INC | d841065dex312.htm |
| EX-23.01 - EX-23.01 - HEIDRICK & STRUGGLES INTERNATIONAL INC | d841065dex2301.htm |
| EX-21.01 - EX-21.01 - HEIDRICK & STRUGGLES INTERNATIONAL INC | d841065dex2101.htm |
| EX-10.12 - EX-10.12 - HEIDRICK & STRUGGLES INTERNATIONAL INC | d841065dex1012.htm |
Table of Contents
UNITED STATES
SECURITIES AND EXCHANGE COMMISSION
WASHINGTON, D.C. 20549
FORM 10-K
| x | ANNUAL REPORT PURSUANT TO SECTION 13 OR 15(d) OF THE SECURITIES EXCHANGE ACT OF 1934 |
For the fiscal year ended December 31, 2014
OR
| ¨ | TRANSITION REPORT PURSUANT TO SECTION 13 OR 15(d) SECURITIES EXCHANGE ACT OF 1934 |
Commission File No. 0-25837
HEIDRICK & STRUGGLES
INTERNATIONAL, INC.
(Exact Name of Registrant as Specified in its Charter)
| Delaware | 36-2681268 | |
| (State or Other Jurisdiction of Incorporation or Organization) |
(I.R.S. Employer Identification Number) |
233 South Wacker Drive, Suite 4200, Chicago, Illinois 60606-6303
(Address of principal executive offices) (Zip Code)
(312) 496-1200
(Registrant’s telephone number, including area code)
Securities registered pursuant to Section 12(b) of the Act:
| Title of Each Class |
Name of Each Exchange On Which Registered | |
| Common Stock, $.01 par value | The Nasdaq Stock Market |
Securities registered pursuant to Section 12(g) of the Act: None
Indicate by check mark if the registrant is a well-known seasoned issuer as defined in Rule 405 of the Securities Act. Yes ¨ No x
Indicate by check mark if the registrant is not required to file reports pursuant to Section 13 of Section 15(d) of the Act. Yes ¨ No x
Indicate by check mark whether the registrant (1) has filed all reports required to be filed by Section 13 or 15(d) of the Securities Exchange Act of 1934 during the preceding 12 months (or for such shorter period that the registrant was required to file such reports), and (2) has been subject to such filing requirements for the past 90 days. Yes x No ¨
Indicate by check mark whether the Registrant has submitted electronically and posted on its corporate Web site, if any, every Interactive Data File required to be submitted and posted pursuant to Rule 405 of Regulation S-T (§232.405 of this chapter) during the preceding 12 months (or for such shorter period that the Registrant was required to submit and post such files). Yes x No ¨
Indicate by check mark if disclosure of delinquent filers pursuant to Item 405 of Regulation S-K is not contained herein, and will not be contained, to the best of registrant’s knowledge, in definitive proxy or information statements incorporated by reference in Part III of this Form 10-K or any amendment to this Form 10-K Yes x No ¨.
Indicate by check mark whether the registrant is a large accelerated filer, an accelerated filer, a non-accelerated filer, or a smaller reporting company. See definition of “large accelerated filer,” “accelerated filer” and “smaller reporting company” in Rule 12b-2 of the Exchange Act. (Check one):
| Large accelerated filer | ¨ | Accelerated filer | x | |||
| Non-Accelerated filer | ¨ (Do not check if a smaller reporting company) | Smaller reporting company | ¨ | |||
Indicate by check mark whether the registrant is a shell company (as defined in Rule 12b-2 of the Exchange Act). Yes ¨ No x
The aggregate market value of the registrant’s Common Stock held by non-affiliates (excludes shares held by executive officers, directors and beneficial owners of 10% or more of the registrant’s outstanding Common Stock) on June 30, 2014 was approximately $337,275,702 based upon the closing market price of $18.50 on that date of a share of Common Stock as reported on the Nasdaq Global Stock Market. As of March 5, 2015, there were 18,244,337 shares of the Company’s Common Stock outstanding.
DOCUMENTS INCORPORATED BY REFERENCE
Portions of the registrant’s definitive Proxy Statement for its Annual Meeting of Stockholders to be held on May 21, 2015, are incorporated by reference into Part III of this Form 10-K.
Table of Contents
HEIDRICK & STRUGGLES INTERNATIONAL, INC. AND SUBSIDIARIES
| PAGE | ||||||
| PART I | ||||||
| Item 1. | 3 | |||||
| 8 | ||||||
| Item 1A. | 9 | |||||
| Item 1B. | 12 | |||||
| Item 2. | 13 | |||||
| Item 3. | 13 | |||||
| Item 4. | 13 | |||||
| PART II | ||||||
| Item 5. | 14 | |||||
| Item 6. | 17 | |||||
| Item 7. | Management’s Discussion and Analysis of Financial Condition and Results of Operations |
19 | ||||
| Item 7A. | 32 | |||||
| Item 8. | 33 | |||||
| Item 9. | Changes in and Disagreements with Accountants on Accounting and Financial Disclosure |
57 | ||||
| Item 9A. | 57 | |||||
| Item 9B. | 57 | |||||
| PART III | ||||||
| Item 10. | 58 | |||||
| Item 11. | 58 | |||||
| Item 12. | Security Ownership of Certain Beneficial Owners and Management and Related Stockholder Matters |
58 | ||||
| Item 13. | Certain Relationships and Related Transactions, and Director Independence |
58 | ||||
| Item 14. | 58 | |||||
| PART IV | ||||||
| Item 15. | 59 | |||||
| 62 | ||||||
2
Table of Contents
| ITEM 1. | BUSINESS |
Overview
Heidrick & Struggles International, Inc. (“Heidrick & Struggles”) is a leadership advisory firm providing executive search, culture shaping and leadership consulting services to businesses and business leaders worldwide. When we use the terms “Heidrick & Struggles,” “The Company,” “we,” “us” and “our,” in this Form 10-K, we mean Heidrick & Struggles International, Inc. a Delaware corporation, and its consolidated subsidiaries. We provide our services to a broad range of clients through the expertise of over 300 consultants located in major cities around the world. Heidrick & Struggles and its predecessors have been a leadership advisor for more than 60 years. Heidrick & Struggles was formed as a Delaware corporation in 1999 when two of our predecessors merged to form Heidrick & Struggles.
Our service offerings include the following:
Executive Search. We partner with respected organizations globally to build and sustain the best leadership teams in the world, with a specialized focus on the placement of top-level senior executives. We believe focusing on top-level senior executives provides the opportunity for several advantages including access to and influence with key decision makers, increased potential for recurring search and consulting engagements, higher fees per search, enhanced brand visibility, and a leveraged global footprint. Working at the top of client organizations also facilitates the attraction and retention of high-caliber consultants who desire to serve top industry executives and their leadership needs. Our executive search services derive revenues through the fees generated for each search engagement, which generally are based on the annual compensation for the placed executive. We provide our executive search services on a retained basis, recruiting senior executives whose first year base salary and bonus averaged approximately $348,000 in 2014 on a worldwide basis.
The executive search industry is highly fragmented, consisting of several thousand executive search firms worldwide. Executive search firms are generally separated into two broad categories: retained search and contingency search. Retained executive search firms fulfill their clients’ senior leadership needs by identifying potentially qualified candidates and assisting clients in evaluating and assessing these candidates. Retained executive search firms generally are compensated for their services regardless of whether the client employs a candidate identified by the search firm and are generally retained on an exclusive basis. Retained executive search firms normally charge a fee for their services equal to approximately one-third of the first year’s total compensation for the position being filled. In contrast, contingency search firms are compensated only upon successfully placing a recommended candidate.
We are a retained executive search firm. Our search process typically consists of the following steps:
| • | Analyzing the client’s business needs in order to understand its organizational structure, relationships, and culture; advising the client as to the required set of skills and experiences for the position; and identifying with the client the other characteristics desired of the successful candidate |
| • | Selecting, contacting, interviewing and evaluating candidates on the basis of experience and potential cultural fit with the client organization |
| • | Presenting confidential written reports on the candidates who potentially fit the position specification |
| • | Scheduling a mutually convenient meeting between the client and each candidate |
| • | Completing references on the final candidate selected by the client |
| • | Assisting the client in structuring compensation packages and supporting the successful candidate’s integration into the client team |
Culture Shaping. On December 31, 2012 we acquired Senn-Delaney Leadership Consulting Group, LLC, a global leader of corporate culture shaping. Chief executives seek our guidance to create thriving organizational cultures in a variety of business situations, including:
| • | Aligning executive teams when there are new leaders and/or new roles |
| • | Integrating cultures following mergers and acquisitions |
| • | Shaping the culture to support new strategies and structures |
| • | Helping minimize cultural barriers to change when implementing major organizational systems or processes |
| • | Creating greater organizational agility to meet the challenges of a changing marketplace. |
3
Table of Contents
Our culture shaping business uses its proprietary technology to administer, analyze and interpret organizational cultures and drivers, as well as methods to develop clarity around leadership teams and desired organizational outcomes. Our culture shaping services generate revenue through a combination of professional service and license fees related to the engagement.
Leadership Consulting. Our leadership consulting services include succession planning, executive assessment and top team and board effectiveness. Leadership Consulting is currently less than 10% of our net revenue. Our leadership consulting services generate revenue primarily through the professional fees generated for each engagement which are generally based on the size of the project and scope of services.
Client base. For many of our clients, our global access to and knowledge of regional and functional markets and candidate talent is an important differentiator of our business. Our clients generally fall into one of the following categories:
| • | Fortune 1000 companies |
| • | Major U.S. and non-U.S. companies |
| • | Middle market and emerging growth companies |
| • | Governmental, higher education and not-for-profit organizations |
| • | Other leading private and public entities |
Available Information
We maintain an Internet website at http://www.heidrick.com. We make available free of charge through the investor relations section of our website, annual reports on Form 10-K, quarterly reports on Form 10-Q and current reports on Form 8-K and amendments to those reports filed or furnished pursuant to Section 13(a) or 15(d) of the U.S. Securities Exchange Act of 1934 (Exchange Act), as well as proxy statements, as soon as reasonably practicable after we electronically file such material with, or furnish it to, the Securities and Exchange Commission (“SEC”). Also posted on our website, and available in print upon request of any shareholder to our Investor Relations Officer, are our certificate of incorporation and by-laws, charters for our Audit and Finance Committee, Human Resources and Compensation Committee, and Nominating and Board Corporate Governance Committee, our Policy Regarding Director Independence Determinations, our Policy on Reporting of Concerns Regarding Accounting and Other Matters, our Corporate Governance Guidelines and our Code of Business Conduct and Ethics governing our directors, officers and employees. Within the time period required by the SEC, we will post on our website any amendment to the Code of Business Conduct and Ethics and any waiver applicable to any executive officer, director or senior financial officer.
In addition, our website includes information concerning purchases and sales of our equity securities by our executive officers and directors, as well as disclosure relating to certain non-GAAP financial measures (as defined in the SEC’s Regulation G) that we may make public orally, telephonically, by webcast, by broadcast or by similar means from time to time.
Our Investor Relations Officer can be contacted at Heidrick & Struggles International, Inc., 233 South Wacker Drive, Suite 4200, Chicago, Illinois, 60606, Attn: Investor Relations Officer, telephone: 312-496-1200, e-mail: InvestorRelations@heidrick.com.
Organization
Our organizational structure, which is arranged by geography, service offering and industry and functional practices, is designed to enable us to better understand our clients’ cultures, operations, business strategies, industries and regional markets for leadership talent.
Geographic Structure. We provide senior-level executive search, culture shaping and leadership consulting services to our clients worldwide through a network of 49 offices in 26 countries. Each office size varies; however, major locations are staffed with consultants, research associates, administrative assistants and other support staff. Administrative functions are centralized where possible, although certain support and research functions are situated regionally because of variations in local requirements. We face risks associated with political instability, legal requirements and currency fluctuations in our international operations. Examples of such risks include difficulties in managing global operations, social and political instability, regulations and potential adverse tax consequences. For a more complete description of the risks associated with our business please see the Section in this Form 10-K entitled “Risk Factors”.
Our worldwide network includes affiliate relationships in Finland, South Africa, Turkey and Portugal. We have no financial investment in these affiliates but receive licensing fees from them for the use of our name and our databases. Licensing fees are less than 1% of our net revenue.
Information by Geography. We operate our executive search and leadership consulting services in three geographic regions: the Americas (which includes the countries in North and South America); Europe (which includes the continents of Europe and Africa); and Asia Pacific (which includes Asia and the region generally known as the Middle East). Our culture shaping segment operates in the Americas and Europe.
4
Table of Contents
Americas. As of December 31, 2014, we had 140 consultants in our Americas segment. The largest offices in this segment, as defined by net revenue, are located in New York, Chicago and San Francisco.
Europe. As of December 31, 2014, we had 89 consultants in our European segment. The largest countries in this segment, as defined by net revenue, are the United Kingdom, Germany and France.
Asia Pacific. As of December 31, 2014, we had 78 consultants in our Asia Pacific segment. The largest countries in this segment, as defined by net revenue, are Australia, China (including Hong Kong), and Singapore.
Culture Shaping. As of December 31, 2014, we had 22 consultants (including outside contractors) in our Culture Shaping segment. The culture shaping consultants are primarily based in Huntington Beach, CA and approximately 90% of the net revenue is generated in the United States.
The relative percentages of net revenue attributable to each segment were as follows:
| Year Ended December 31, |
||||||||||||
| 2014 | 2013 | 2012 | ||||||||||
| Executive Search and Leadership Consulting |
||||||||||||
| Americas |
53 | % | 56 | % | 58 | % | ||||||
| Europe |
22 | % | 19 | % | 22 | % | ||||||
| Asia Pacific |
18 | % | 20 | % | 20 | % | ||||||
| Culture Shaping |
7 | % | 5 | % | — | |||||||
For financial information relating to each segment, see Note 18, Segment Information, in the Notes to Consolidated Financial Statements.
Global Industry Practices. Our executive search and leadership consulting business operates in six broad industry groups listed below. These industry categories and their relative sizes, as measured by net revenue for 2014 and 2013, are as follows:
| Percentage of Net Revenue |
||||||||
| Global Industry Practices |
2014 | 2013 | ||||||
| Financial Services |
26 | % | 25 | % | ||||
| Industrial |
23 | 25 | ||||||
| Global Technology & Services |
21 | 20 | ||||||
| Consumer Markets |
18 | 17 | ||||||
| Healthcare & Life Sciences |
8 | 9 | ||||||
| Education, Non-Profit & Social Enterprise |
4 | 4 | ||||||
|
|
|
|
|
|||||
| 100 | % | 100 | % | |||||
|
|
|
|
|
|||||
Within each broad industry group are a number of industry sub-sectors. Consultants often specialize in one or more sub sectors to provide clients with market intelligence and candidate knowledge specific to their industry. For example, within the Financial Services sector our business is diversified amongst a number of industry sub sectors including Asset & Wealth Management, Consumer & Commercial Finance, Commodities, Corporate and Transaction Banking, Global Markets, Hedge Fund, Infrastructure, Investment Banking, Insurance, Private Equity Investment Professionals and Real Estate.
We service our clients with global industry interests and needs through unified global executive search teams who specialize in industry practices. This go-to-market strategy allows us to leverage our global diversity and market intelligence and is designed to provide better client service. Each client is served by one global account team, which we believe is a key differentiator from our competition.
Global Functional Practices. Our executive search consultants also specialize in searches for specific “C-level” functional positions, which are roles that generally report directly to the chief executive officer.
Our Global Functional Practices include Chief Executive Officer and Board of Directors; Human Resources Officers; Financial Officers; Information &Technology Officers; Legal, Risk, Compliance & Government Affairs; and Supply Chain & Transportation.
Our team of executive search consultants may service clients from any one of our offices around the world. For example, an executive search for a chief financial officer of an industrial company located in the United Kingdom may involve a consultant in the
United Kingdom with an existing relationship with the client, another executive search consultant in the United States with expertise in our Industrial practice and a third executive search consultant with expertise in recruiting chief financial officers. This same industrial client may also engage us to perform skill-based assessments for each of its senior managers, which could require the expertise of one of our leadership advisory consultants trained in this service.
5
Table of Contents
Seasonality
There is no discernible seasonality in our business, although as a percentage of total annual net revenue, the first quarter is typically the lowest. Revenue and operating income have historically varied by quarter and are hard to predict from quarter to quarter. In addition, the volatility in the global economy and business cycles can impact our quarterly revenue and operating income.
Clients and Marketing
Our consultants market the firm’s executive search, culture shaping and leadership consulting services through two principal means: targeted client calling and industry networking with clients and referral sources. These efforts are supported by proprietary databases, which provide our consultants with information as to contacts made by their colleagues with particular referral sources, candidates and clients. In addition, we benefit from a significant number of referrals generated by our reputation for high quality service and successfully completed assignments, as well as repeat business resulting from our ongoing client relationships.
In support of client calling and networking, the practice teams as well as individual consultants also author and publish articles and white papers on a variety of leadership and talent topics and trends around the world. Our consultants often present research findings and talent insights at notable conferences and events as well. Our insights are sometimes acknowledged by major media outlets and trade journalists. These efforts aid in the marketing of our services as well.
Either by agreement with the clients or to maintain strong client relationships, we may refrain from recruiting employees of a client, or possibly other entities affiliated with that client, for a specified period of time but typically not more than one year from the commencement of a search. We seek to mitigate any adverse effects of these off-limits arrangements by strengthening our long-term relationships, allowing us to communicate our belief to prospective clients that we can conduct searches without these off-limits arrangements impeding the quality of our work.
No single client accounted for more than 2% of our net revenue in 2014, 2013 or 2012. As a percentage of total revenue, our top ten clients in aggregate accounted for approximately 7% in 2014 and 2013 and approximately 8% in 2012.
Information Management Systems
We rely on technology to support our consultants and staff in the search process. Our technology infrastructure consists of internally developed databases containing candidate profiles and client records, coupled with online services, industry reference sources, and an internally developed assessment tool. We use technology to manage and share information on current and potential clients and candidates, to communicate to both internal and external constituencies and to support administrative functions.
Our culture shaping business’ proprietary Web-based system, SD Connect™ is integral to the culture-shaping process. This technology platform enables our consultants to administer, analyze and interpret online Corporate Culture Profiles™ (CCP) surveys to develop clarity around team and organizational need and desired outcomes. In addition, we gather data using our online Customer Intake Survey™ (CIS) to determine which culture-shaping concepts are being utilized by individuals and the team as a whole.
Professional Staff and Employees
Our professionals are generally categorized either as consultants or associates. Associates assist consultants by providing research support, coordinating candidate contact and performing other engagement-related functions. As of December 31, 2014, we had head count (including contractors) of 1,483, consisting of 329 consultants with 307 consultants related to executive search and leadership consulting and 22 consultants related to culture shaping, 436 associates and 718 other search, support and Global Operations Support staff.
We promote our associates to consultants during the annual consultant promotion process and we recruit our consultants from other executive search or human capital firms, or in the case of executive search, consultants new to search who have worked in industries or functions represented by our practices. In the latter case, these are often seasoned executives with extensive contacts and outstanding reputations who are entering the search profession as a second career and whom we train in our techniques and methodologies. Our culture shaping consultants are recruited for their consulting and leadership advisory experience and often are former clients who are familiar with our culture shaping methodology. In each of the past five years, no single consultant accounted for a material portion of our net revenue. We are not a party to any U.S. based collective bargaining agreement, and we consider relations with our employees to be good.
6
Table of Contents
Competition
The executive search industry is highly competitive. While we face competition to some degree from all firms in the industry, we believe our most direct competition comes from four established global retained executive search firms that conduct searches primarily for the most senior-level positions within an organization. In particular, our competitors include Egon Zehnder International, Korn Ferry International, Russell Reynolds Associates, Inc. and Spencer Stuart & Associates. To a lesser extent, we also face competition from smaller boutique firms, Internet-based firms and boutique firms that specialize in certain regional markets or industry segments. Each firm with which we compete is also a competitor in the marketplace for effective consultants.
Overall, the search industry has relatively few barriers to entry; however, there are higher barriers to entry to compete at the level of a global retained executive search firms that can provide leadership consulting services at the senior level. At this level, clients rely more heavily on a search firm’s reputation, global access and the experience level of its consultants. We believe that the segment of executive search in which we compete is more quality-sensitive than price-sensitive. As a result, we compete on the level of service we offer, reflected by our client services specialties and, ultimately, by the quality of our search results. We believe that our emphasis on senior-level executive search, the depth of experience of our search consultants and our global presence enable us to compete favorably with other executive search firms.
Competition in the leadership consulting services and culture shaping markets in which we operate is highly fragmented, with no universally recognized market leaders.
7
Table of Contents
Below is the name, age, present title, principal occupation and certain biographical information for each of our executive officers as of the date of this report. All of our executive officers have been appointed by and serve at the pleasure of our board of directors. There are no family relationships between any executive officer or director.
Tracy R. Wolstencroft (56) Mr. Wolstencroft has been our President and Chief Executive Officer since February 3, 2014, and a director since February 6, 2014. From 1994 until his retirement in 2010, Mr. Wolstencroft served as a partner for Goldman Sachs & Co. (“Goldman”), concluding a twenty-five year career with the firm. During his service to Goldman, Mr. Wolstencroft served on the Firmwide Partnership Committee, the Investment Banking Operating Committee, and the Asia Management Committee. During his career, he led a wide range of businesses in the United States and abroad, including Investment Banking Services, Environmental Markets, Latin America, Public Sector and Infrastructure Banking, and Fixed Income Capital Markets. While living in Asia from 1998 to 2002, Mr. Wolstencroft was President of GS Singapore, co-head of investment banking in Japan, head of Asia financial institutions, and a leader of the firm’s strategy in China. Mr. Wolstencroft also served as an Advisory Director for Goldman and as Chairman of the firm’s Clean Technology and Renewables business. He currently serves as a Trustee of the Brookings Institution, the National Geographic Society and the International Rescue Committee.
Richard W. Pehlke (61) Mr. Pehlke has been our Executive Vice President and Chief Financial Officer since August 2011 after serving as interim Chief Financial Officer since May 2011. Previously, Mr. Pehlke was Executive Vice President and Chief Financial Officer at Grubb & Ellis Company, a commercial real estate firm, from 2007 to 2010. During his extensive career, he also has held senior financial positions in the business services, telecommunications, financial services, food and consumer products and executive search and staffing industries. Mr. Pehlke currently serves on the board of directors of Ideal Industries.
Stephen W. Beard (43) Mr. Beard has been our Executive Vice President, General Counsel and Chief Administrative Officer since January 1, 2013. During his more than 10 years with the Company he has served in several senior leadership capacities, including serving as our General Counsel and Corporate Secretary (November 2010 to January 2013) and Deputy General Counsel and Chief Compliance Officer (2008 through November 2010).
Jory J. Marino (64) Mr. Marino has served as Global Head of Markets since April 2014 and was appointed an Executive Vice President on January 1, 2015. During his more than 15 years in executive search with the company, Mr. Marino has held a number of senior leadership roles, including: interim Chief Executive Office (July 2013 to February 2014); Vice Chairman and Regional Leader of the Americas (January 2013 to June 2013); Managing Partner, North America (2009 to 2010).
Krishnan Rajagopalan (54) Mr. Rajagopalan joined the firm in 2001 in executive search and has served as Global Head of Practices since April 2014 and was appointed an Executive Vice President on January 1, 2015. He has served in other leadership roles including Global Practice Managing Partner, Technology and Services (2010 to 2014) and Global Practice Managing Partner, Business/Professional Services (2007 to 2010).
Richard W. Greene (51) Mr. Greene has been our Executive Vice President and Chief Human Resources Officer since January 1, 2015. Previously, Mr. Greene was the global Head of Talent Management and a global segment HR executive at Bunge, an agribusiness and food production company (2011 to 2014). Mr. Greene previously managed Heidrick & Struggles’ Leadership Consulting and Human Resources practices in the Americas (2006 to 2011).
8
Table of Contents
| ITEM 1A. | RISK FACTORS |
In addition to other information in this Form 10-K, the following risk factors should be carefully considered in evaluating our business because such factors may have a material impact on our business, operating results, cash flows and financial condition. Additional risks not presently known to us or that we currently deem immaterial may also impair our business operations.
We depend on attracting, integrating, managing, and retaining qualified consultants and senior leaders.
Our success depends upon our ability to attract, develop, manage and retain quality consultants with the skills and experience necessary to fulfill our clients’ needs. Our ability to hire and retain qualified consultants could be impaired by any diminution of our reputation, disparity in compensation relative to our competitors, modifications to our total compensation philosophy or competitor hiring programs. If we cannot attract, hire, develop and retain qualified consultants, our business, financial condition and results of operations may suffer. Our future success also depends upon our ability to complete the integration of newly-hired consultants successfully into our operations and to manage the performance of our consultants. Failure to successfully integrate newly-hired consultants or to manage the performance of our consultants could affect our profitability by causing operating inefficiencies that could increase operating expenses and reduce operating income. There is also a risk that unanticipated turnover in senior leadership coupled with an inadequate succession plan stalls company activity, interrupts strategic vision or lowers productive output which may adversely impact our financial condition and results of operations.
We may not be able to prevent our consultants from taking our clients with them to another firm.
Our success depends upon our ability to develop and maintain strong, long-term relationships with our clients. Although we work on building these relationships between our firm and our clients, in many cases, one or two consultants have primary responsibility for a client relationship. When a consultant leaves one executive search firm and joins another, clients who have established relationships with the departing consultant may move their business to the consultant’s new employer. We may also lose clients if the departing consultant has widespread name recognition or a reputation as a specialist in executing searches in a specific industry or management function. If we fail to retain important client relationships when a consultant departs our firm, our business, financial condition and results of operations may be adversely affected.
Our success depends on our ability to maintain our professional reputation and brand name.
We depend on our overall professional reputation and brand name recognition to secure new engagements and hire qualified consultants. Our success also depends on the individual reputations of our consultants. We obtain many of our new engagements from existing clients or from referrals by those clients. A client who is dissatisfied with our work can adversely affect our ability to secure new engagements. If any factor hurts our reputation, including poor performance, we may experience difficulties in competing successfully for both new engagements and qualified consultants. Failure to maintain our professional reputation and brand name could seriously harm our business, financial condition and results of operations.
Our net revenue may be affected by adverse economic conditions.
Demand for our services is affected by global economic conditions and the general level of economic activity in the geographic regions in which we operate. During periods of slowed economic activity many companies hire fewer permanent employees, and our financial condition and results of operations can be adversely affected. If unfavorable changes in economic conditions occur, our business, financial condition and results of operations could suffer.
Because our clients may restrict us from recruiting their employees, we may be unable to fill or obtain new executive search assignments.
Clients frequently require us to refrain from recruiting certain of their employees when conducting executive searches on behalf of other clients. These restrictions generally remain in effect for no more than one year following the commencement of an engagement. However, the specific duration and scope of the off-limits arrangements depend on the length of the client relationship, the frequency with which the client engages us to perform searches, the number of assignments we have performed for the client and the potential for future business with the client.
Client restrictions on recruiting their employees could hinder us from fulfilling executive searches. Additionally, if a prospective client believes that we are overly restricted by these off-limits arrangements from recruiting the employees of our existing clients, these prospective clients may not engage us to perform their executive searches. As a result, our business, financial condition and results of operations may suffer.
9
Table of Contents
We face aggressive competition.
The global executive search industry is highly competitive and fragmented. We compete with other large global executive search firms, smaller specialty firms, and more recently with Internet-based firms and social media. Specialty firms can focus on regional or functional markets or on particular industries. Some of our competitors may possess greater resources, greater name recognition and longer operating histories than we do in particular markets or practice areas, or be willing to reduce their fees in order to attract clients and increase market share. There are limited barriers to entry into the search industry and new search firms continue to enter the market. Many executive search firms that have a smaller client base may be subject to fewer off-limits arrangements. In addition, our clients or prospective clients may decide to perform executive searches using in-house personnel. Also, as internet-based firms continue to evolve, they may develop offerings similar to or more expansive than ours, thereby increasing competition for our services or more broadly causing market disruption in the executive search industry. We may not be able to continue to compete effectively with existing or potential competitors and we may not be able to implement our leadership strategy effectively. Our inability to meet these competitive challenges could have an adverse impact on our business, financial condition and results of operations.
We rely heavily on information management systems.
Our success depends upon our ability to store, retrieve, process and manage substantial amounts of information. To achieve our goals, we must continue to improve and upgrade our information management systems. We may be unable to license, design and implement, in a cost-effective and timely manner, improved information systems that allow us to compete effectively. In addition, business process reengineering efforts may result in a change in software platforms and programs. Such efforts may result in an acceleration of depreciation expense over the shortened expected remaining life of the software and present transitional problems. Problems or issues with our proprietary search system or other factors may result in interruptions or loss in our information processing capabilities which may cause our business, financial condition and results of operations to suffer.
We face the risk of liability in the services we perform.
We are exposed to potential claims with respect to the executive search process. A client could assert a claim for violations of off-limits arrangements, breaches of confidentiality agreements or professional malpractice. The growth and development of our culture shaping and other leadership advisory services brings with it the potential for new types of claims. In addition, candidates and client employees could assert claims against us. Possible claims include failure to maintain the confidentiality of the candidate’s employment search or for discrimination or other violations of the employment laws or malpractice. In various countries, we are subject to data protection laws impacting the processing of candidate information. We maintain professional liability insurance in amounts and coverage that we believe are adequate; however, we cannot guarantee that our insurance will cover all claims or that coverage will always be available. Significant uninsured liabilities could have a negative impact on our business, financial condition and results of operations.
Our multinational operations may be adversely affected by social, political, regulatory, legal and economic risks.
We generate substantial revenue outside the United States. We offer our services through a network of offices in 26 countries around the world. Our ability to effectively serve our clients is dependent upon our ability to successfully leverage our operating model across all of these and any future locations, maintain effective management controls over all of our locations to ensure, among other things, compliance with applicable laws, rules and regulations, and instill our core values in all of our personnel at each of these and any future locations. We are exposed to the risk of changes in social, political, legal and economic conditions inherent in international operations, which could have a significant impact on our business, financial condition and results of operations. Beginning in 2011, several countries within the European Union experienced sovereign debt and credit issues. This has caused more volatility in the economic environment throughout the European Union. In addition, we conduct business in countries where the legal systems, local laws and trade practices are unsettled and evolving. Commercial laws in these countries are sometimes vague, arbitrary and inconsistently applied. Under these circumstances, it is difficult for us to determine at all times the exact requirements of such local laws. If we fail to comply with local laws, our business, financial condition and results of operations could suffer. In addition, the global nature of our operations poses challenges to our management, and financial and accounting systems. Failure to meet these challenges could seriously harm our business, financial condition and results of operations.
10
Table of Contents
A significant currency fluctuation between the U.S. dollar and other currencies could adversely impact our operating income.
With our operations in the Americas, Europe and Asia Pacific, we conduct business using various currencies. In 2014, approximately 44% of our net revenue was generated outside the United States. As we typically transact business in the local currency of our subsidiaries, our profitability may be impacted by the translation of foreign currency financial statements into U.S. dollars. Significant long-term fluctuations in relative currency values, in particular an increase in the value of the U.S. dollar against foreign currencies, could have an adverse effect on our profitability and financial condition.
We may not be able to align our cost structure with net revenue.
We must ensure that our costs and workforce continue to be in proportion to demand for our services. Failure to align our cost structure and headcount with net revenue could adversely affect our business, financial condition, and results of operations.
Unfavorable tax law changes and tax authority rulings may adversely affect results.
We are subject to income taxes in the United States and in various foreign jurisdictions. Domestic and international tax liabilities are subject to the allocation of income among various tax jurisdictions. Our effective tax rate could be adversely affected by changes in the mix of earnings among countries with differing statutory tax rates, or changes in the valuation allowance of deferred tax assets or tax laws. The amount of income taxes and other taxes are subject to ongoing audits by U.S. federal, state and local tax authorities and by non-U.S. authorities. If these audits result in assessments different from amounts recorded, future financial results may include unfavorable tax adjustments.
We may not be able to generate sufficient profits to realize the benefit of our net deferred tax assets.
We establish valuation allowances against deferred tax assets when there is insufficient evidence that we will be able to realize the benefit of these deferred tax assets. We reassess our ability to realize deferred tax assets as facts and circumstances dictate. If after future assessments of our ability to realize the deferred tax assets, we determine that a lesser or greater allowance is required, we record a reduction or increase to the income tax expense and the valuation allowance in the period of such determination. The uncertainty surrounding the future realization of our net deferred tax assets could adversely impact our results of operations.
We may experience impairment of our goodwill and other intangible assets.
In accordance with generally accepted accounting principles, we perform assessments of the carrying value of our goodwill at least annually and we review our goodwill and other intangible assets for impairment whenever events occur or circumstances indicate that a carrying amount of these assets may not be recoverable. These events and circumstances include a significant change in business climate, attrition of key personnel, changes in financial condition or results of operations, a prolonged decline in our stock price and market capitalization, competition, and other factors. In performing these assessments, we must make assumptions regarding the estimated fair value of our goodwill and other intangible assets. These assumptions include estimates of future market growth and trends, forecasted revenue and costs, capital investments, discount rates, and other variables. If the fair market value of one of our reporting units or other long term assets is less than the carrying amount of the related assets, we would be required to record an impairment charge. Due to continual changes in market and general business conditions, we cannot predict whether, and to what extent, our goodwill and long-lived intangible assets may be impaired in future periods. Any resulting impairment loss could have an adverse impact on our business, financial condition and results of operations.
We have anti-takeover provisions that make an acquisition of us difficult and expensive.
Anti-takeover provisions in our Certificate of Incorporation, our Bylaws and the Delaware laws make it difficult and expensive for someone to acquire us in a transaction which is not approved by our Board of Directors. Some of the provisions in our Certificate of Incorporation and Bylaws include:
| • | a classified board of directors |
| • | limitations on the removal of directors |
| • | limitations on stockholder actions |
| • | the ability to issue one or more series of preferred stock by action of our Board of Directors |
11
Table of Contents
These provisions could discourage an acquisition attempt or other transaction in which stockholders could receive a premium over the current market price for the common stock.
Our ability to access additional credit could be limited.
Banks can be expected to strictly enforce the terms of our credit agreement. Although we are currently in compliance with the financial covenants of our revolving credit facility, a deterioration of economic conditions may negatively impact our business resulting in our failure to comply with these covenants, which could limit our ability to borrow funds under our credit facility or from other borrowing facilities in the future. In such circumstances, we may not be able to secure alternative financing or may only be able to do so at significantly higher costs.
Increased cybersecurity requirements, vulnerabilities, threats and more sophisticated and targeted cyber-related attacks could pose a risk to our systems, networks, solutions, services and data.
Increased global cybersecurity vulnerabilities, threats and more sophisticated and targeted cyber-related attacks pose a risk to the security of our systems and networks and the confidentiality, availability and integrity of our data. We have a program in place to detect and respond to data security incidents. However, we remain potentially vulnerable to additional known or unknown threats. We also have access to sensitive, confidential or personal data or information that is subject to privacy and security laws, regulations and client-imposed controls. Despite our efforts to protect sensitive, confidential or personal data or information, we may be vulnerable to security breaches, theft, lost data, employee errors and/or malfeasance that could potentially lead to the compromising of sensitive, confidential or personal data or information, improper use of our systems or networks, unauthorized access, use, disclosure, modification or destruction of information. In addition, a cyber-related attack could result in other negative consequences, including damage to our reputation or competitiveness, remediation or increased protection costs, litigation or regulatory action which could result in a negative impact to our results of operations.
| ITEM 1B. | UNRESOLVED STAFF COMMENTS |
None.
12
Table of Contents
| ITEM 2. | PROPERTIES |
Our corporate headquarters is located in Chicago, Illinois. We have leased office space in 49 cities in 26 countries around the world. All of our offices are leased. We do not own any real estate. The aggregate square footage of office space under lease was 462,322 as of December 31, 2014. Our office leases call for future minimum lease payments of approximately $164.9 million and have terms that expire between 2015 and 2026, exclusive of renewal options that we can exercise. Approximately 21,000 square feet of office space has been sublet to third parties.
Our office space by geographic segment as of December 31, 2014 is as follows:
| Square Footage |
||||
| Americas |
229,212 | |||
| Europe |
110,706 | |||
| Asia Pacific |
122,404 | |||
|
|
|
|||
| Total |
462,322 | |||
|
|
|
|||
| ITEM 3. | LEGAL PROCEEDINGS |
We have contingent liabilities from various pending claims and litigation matters arising in the ordinary course of our business, some of which involve claims for damages that may be substantial in amount. Some of these matters are covered by insurance. Based upon information currently available, we believe the ultimate resolution of such claims and litigation, including the “UK Employee Benefits Trust” matter discussed below, will not have a material adverse effect on our financial condition, results of operations or liquidity.
UK Employee Benefits Trust
On January 27, 2010, HM Revenue & Customs (“HMRC”) in the United Kingdom notified us that it was challenging the tax treatment of certain of our contributions in the United Kingdom to an Employee Benefits Trust between 2002 and 2008. HMRC alleges that these contributions should have been subject to Pay As You Earn tax and Class 1 National Insurance Contributions in the United Kingdom; and HMRC is proposing an adjustment to our payroll tax liability for the affected years. The aggregate amount of HMRC’s proposed adjustment is approximately £3.9 million (equivalent to $6.1 million at December 31, 2014). We have appealed the proposed adjustment. At this time, we believe that the likelihood of an unfavorable outcome with respect to the proposed adjustment is not probable and the potential amount of any loss cannot be reasonably estimated. We also believe that the amount of a final adjustment, if any, would not be material to our financial condition.
| ITEM 4. | MINE SAFETY DISCLOSURES |
Not applicable.
13
Table of Contents
| ITEM 5. | MARKET FOR REGISTRANT’S COMMON EQUITY, RELATED STOCKHOLDER MATTERS AND ISSUER PURCHASES OF EQUITY SECURITIES |
Market for Registrant’s Common Equity
Our common stock is listed on the Nasdaq Global Stock Market under the symbol “HSII.” The following table sets forth the high and low stock price per share of the common stock for the periods indicated, as reported on the Nasdaq Global Stock Market.
| Year Ended December 31, 2014 |
High | Low | ||||||
| First Quarter |
$ | 20.52 | $ | 15.97 | ||||
| Second Quarter |
20.34 | 17.52 | ||||||
| Third Quarter |
23.68 | 17.85 | ||||||
| Fourth Quarter |
23.16 | 19.75 | ||||||
| Year Ended December 31, 2013 |
||||||||
| First Quarter |
$ | 17.42 | $ | 12.51 | ||||
| Second Quarter |
17.89 | 12.20 | ||||||
| Third Quarter |
19.37 | 14.51 | ||||||
| Fourth Quarter |
20.62 | 16.89 | ||||||
14
Table of Contents
Performance Graph
We have presented below a graph which compares the cumulative total stockholder return on our common shares with the cumulative total stockholder return of the Standard & Poor’s SmallCap 600 Index and the Standard & Poor’s Composite 1500 Human Resource and Employment Services Index. The S&P Composite 1500 Human Resource & Employment Services Index includes 11 companies in related businesses, including Heidrick & Struggles. Cumulative total return for each of the periods shown in the performance graph is measured assuming an initial investment of $100 on December 31, 2009.
The stock price performance depicted in this graph is not necessarily indicative of future price performance. This graph will not be deemed to be filed as part of this Form 10-K and will not be deemed to be incorporated by reference by any general statement incorporating this Form 10-K into any filing by us under the Securities Act of 1933 or the Securities Exchange Act of 1934, except to the extent we specifically incorporate this information by reference.
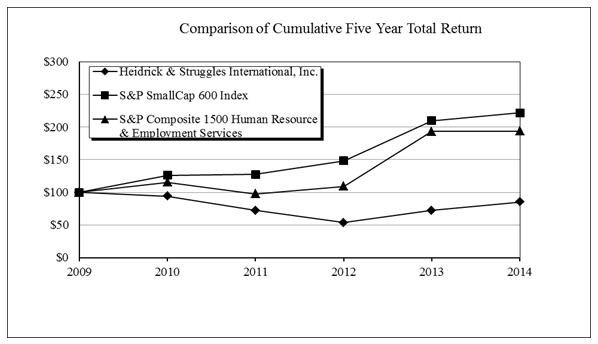
* Assuming $100 invested on 12/31/09 in HSII or index, including reinvestment of dividends.
Prepared by: Zacks Investment Research, Inc.
Copyright: Standard and Poor’s, Inc.
15
Table of Contents
Dividends
Since September 2007, we have paid a quarterly cash dividend of $0.13 per share as approved by our Board of Directors. In 2014, the total cash dividend paid was $0.52 per share.
The following table outlines the record date, payment date and amount of quarterly cash dividends paid during 2013 and 2014:
| Quarter |
Record Date |
Payment Date |
Dividends (in millions) |
|||||
| Q2 2013 |
May 3, 2013 |
May 17, 2013 |
$ | 2.3 | ||||
| Q3 2013 |
August 2, 2013 |
August 16, 2013 |
2.4 | |||||
| Q4 2013 |
November 1, 2013 |
November 15, 2013 |
2.4 | |||||
| Q1 2014 |
February 7, 2014 |
February 21, 2014 |
2.4 | |||||
| Q2 2014 |
May 2, 2014 |
May 16, 2014 |
2.4 | |||||
| Q3 2014 |
August 1, 2014 |
August 15, 2014 |
2.4 | |||||
| Q4 2014 |
November 7, 2014 |
November 21, 2014 |
2.4 | |||||
In December 2014, our Board of Directors declared a quarterly dividend of $0.13 per share on our common stock which was paid on February 20, 2015 to shareholders of record as of February 6, 2015. Cash dividends payable of $2.4 million related to the fourth quarter 2014 cash dividend, which was paid in the first quarter of 2015 is accrued in the Consolidated Balance Sheets as of December 31, 2014. Cash dividends payable of $2.4 million related to the fourth quarter 2013 cash dividend, was paid in the first quarter of 2014.
In connection with the quarterly cash dividend, we also pay a dividend equivalent on outstanding restricted stock units. The amounts related to the dividend equivalent payments for restricted stock units are accrued over the vesting period and paid upon vesting. In 2014 and 2013, we paid $0.1 million and $0.2 million, respectively, in dividend equivalent payments.
Issuer Purchases of Equity Securities
On February 11, 2008, we announced that our Board of Directors authorized management to repurchase shares of our common stock with an aggregate purchase price up to $50 million. We intend from time to time and as business conditions warrant, to purchase shares of our common stock on the open market or in negotiated or block trades. No time limit has been set for completion of this program. We did not repurchase any shares of our common stock in 2014. As of December 31, 2014 and December 31, 2013, we have purchased 1,038,670 shares of our common stock for a total of $28.3 million and $21.7 million remains available for future purchases under the authorization. For further information of our share repurchase activity, see “Management’s Discussion and Analysis of Financial Condition and Results of Operations – Liquidity and Capital Resources.”
16
Table of Contents
| ITEM 6. | SELECTED FINANCIAL DATA |
The selected financial data presented below have been derived from our audited consolidated financial statements. The data as of December 31, 2014 and 2013 and for the years ended December 31, 2014, 2013 and 2012 are derived from the audited current and historical consolidated financial statements, which are included elsewhere in this Form 10-K. The data as of December 31, 2012, 2011 and 2010 and for the years ended December 31, 2011 and 2010 are derived from audited historical consolidated financial statements, which are not included in this report. The data set forth is qualified in its entirety by, and should be read in conjunction with, “Management’s Discussion and Analysis of Financial Condition and Results of Operations,” the audited consolidated financial statements, the notes thereto, and the other financial data and statistical information included in this Form 10-K.
| Year Ended December 31, | ||||||||||||||||||||
| 2014 | 2013 | 2012 | 2011 | 2010 | ||||||||||||||||
| (in thousands, except per share and other operating data) | ||||||||||||||||||||
| Statements of Operations Data: |
||||||||||||||||||||
| Revenue: |
||||||||||||||||||||
| Revenue before reimbursements (net revenue) |
$ | 494,292 | $ | 461,995 | $ | 443,777 | $ | 527,793 | $ | 493,091 | ||||||||||
| Reimbursements |
18,947 | 18,998 | 21,304 | 26,187 | 20,145 | |||||||||||||||
|
|
|
|
|
|
|
|
|
|
|
|||||||||||
| Total revenue |
513,239 | 480,993 | 465,081 | 553,980 | 513,236 | |||||||||||||||
| Operating expenses: |
||||||||||||||||||||
| Salaries and employee benefits |
337,448 | 319,499 | 309,502 | 372,406 | 340,178 | |||||||||||||||
| General and administrative expenses |
130,191 | 126,931 | 113,826 | 123,592 | 130,622 | |||||||||||||||
| Other charges |
— | — | — | — | 4,218 | (5) | ||||||||||||||
| Reimbursed expenses |
18,947 | 18,998 | 21,304 | 26,187 | 20,145 | |||||||||||||||
| Restructuring charges |
— | — | 810 | (1) | 16,344 | (2) | 1,621 | (6) | ||||||||||||
| Impairment charges |
— | — | — | 26,366 | (3) | — | ||||||||||||||
| Other operating income |
— | — | — | — | (1,072 | )(7) | ||||||||||||||
|
|
|
|
|
|
|
|
|
|
|
|||||||||||
| Total operating expenses |
486,586 | 465,428 | 445,442 | 564,895 | 495,712 | |||||||||||||||
|
|
|
|
|
|
|
|
|
|
|
|||||||||||
| Operating income (loss) |
26,653 | 15,565 | 19,639 | (10,915 | ) | 17,524 | ||||||||||||||
| Non-operating income (expense): |
||||||||||||||||||||
| Interest, net |
(358 | ) | (175 | ) | 1,118 | 1,402 | 813 | |||||||||||||
| Other, net |
(2,108 | ) | (2,002 | ) | (495 | ) | (5,262 | )(4) | (1,389 | ) | ||||||||||
|
|
|
|
|
|
|
|
|
|
|
|||||||||||
| Net non-operating income (expense) |
(2,466 | ) | (2,177 | ) | 623 | (3,860 | ) | (576 | ) | |||||||||||
|
|
|
|
|
|
|
|
|
|
|
|||||||||||
| Income (loss) before income taxes |
24,187 | 13,388 | 20,262 | (14,775 | ) | 16,498 | ||||||||||||||
| Provision for (benefit from) income taxes |
17,390 | 7,041 | 14,022 | 18,947 | 9,455 | |||||||||||||||
|
|
|
|
|
|
|
|
|
|
|
|||||||||||
| Net income (loss) |
$ | 6,797 | $ | 6,347 | $ | 6,240 | $ | (33,722 | ) | $ | 7,493 | |||||||||
|
|
|
|
|
|
|
|
|
|
|
|||||||||||
| Basic weighted average common shares outstanding |
18,210 | 18,077 | 17,971 | 17,780 | 17,437 | |||||||||||||||
| Diluted weighted average common shares outstanding |
18,432 | 18,232 | 18,120 | 17,780 | 17,869 | |||||||||||||||
| Basic earnings (loss) per common share |
$ | 0.37 | $ | 0.35 | $ | 0.35 | $ | (1.90 | ) | $ | 0.43 | |||||||||
| Diluted earnings (loss) per common share |
$ | 0.37 | $ | 0.35 | $ | 0.34 | $ | (1.90 | ) | $ | 0.42 | |||||||||
| Cash dividends paid per share |
$ | 0.52 | $ | 0.39 | $ | 0.65 | $ | 0.52 | $ | 0.52 | ||||||||||
| Balance Sheet Data (at end of period): |
||||||||||||||||||||
| Working capital |
$ | 124,431 | $ | 114,987 | $ | 73,886 | $ | 125,235 | $ | 140,010 | ||||||||||
| Total assets |
568,701 | 553,224 | 494,992 | 515,565 | 545,027 | |||||||||||||||
| Long-term debt, less current maturities |
23,500 | 29,500 | — | — | — | |||||||||||||||
| Stockholders’ equity |
244,664 | 247,873 | 248,347 | 251,295 | 294,542 | |||||||||||||||
| Other Operating Data: |
||||||||||||||||||||
| Average number of consultants during the period |
313 | 341 | 342 | 376 | 353 | |||||||||||||||
17
Table of Contents
Notes to Selected Financial Data:
| (1) | In 2012, we recorded restructuring charges of $0.8 million in Europe related to adjustments associated with our 2011 restructuring plan. These charges consist of $1.1 million of employee-related costs associated with severance arrangements, partially offset by $0.3 million of adjustments to premise-related costs. |
| (2) | In 2011, we recorded restructuring charges of $16.3 million in connection with initiatives to reduce overall costs and improve operational efficiencies. These charges consist of employee-related costs, including severance associated with reductions in our workforce of 139 employees globally, and expenses associated with consolidating and closing 11 of our smaller office locations, predominately in Europe. By segment, the restructuring charges recorded in 2011 were $8.3 million in Europe, $5.1 million in the Americas, $0.7 million in Asia Pacific and $2.2 million in Global Operations Support. |
| (3) | In 2011, as a result of our restructuring initiatives, primarily in Europe, and the volatility associated with the economic outlook for Europe, including political and economic uncertainty in the region, we performed a goodwill and intangible asset impairment evaluation. Based on the evaluation, we recorded a goodwill and intangible asset impairment charge in Europe of $26.0 million, resulting in a write-off of all the goodwill in Europe, and an intangible asset impairment of $0.4 million in the Americas. See Note 9, Goodwill and Other Intangible Assets in the Notes to Consolidated Financial Statements. |
| (4) | In 2011, we wrote-off our $1.8 million investment in JobKoo and our $1.0 million loan to JobKoo made in the first quarter of 2011. JobKoo was a joint venture in which we held an equity method investment. |
| (5) | In 2010, we recorded other charges of $4.2 million, which consist of $3.2 million of accelerated occupancy costs and depreciation, dilapidation costs, and professional fees related to the settlement of our lease obligations for our former London office which we vacated and $1.0 million due to an unfavorable judgment in a lawsuit filed by a former European employee who separated from us in 2006. |
| (6) | In 2010, we recorded restructuring charges of $1.6 million. These charges consist of $0.6 million of severance associated with reductions in our workforce of 19 employees globally and $1.0 million related to the default of two of our subtenants in previously restructured offices. By segment, the restructuring charges recorded in 2010 were $1.0 million in the Americas, $0.3 million in Europe, and $0.3 million in Global Operations Support. |
| (7) | In 2010, as a result of continued lower than expected 2010 revenue production from consultants acquired in the Ray and Berndston Sp. z o. o acquisition, we performed a fair value assessment of the potential future earnout payments under the purchase agreement. This assessment indicated that there would not be any future earnout payments and resulted in a $1.1 million adjustment. Under the acquisition method of accounting for business combinations, we recognized the fair value adjustment as other operating income in the Consolidated Statement of Comprehensive Income. |
18
Table of Contents
| ITEM 7. | MANAGEMENT’S DISCUSSION AND ANALYSIS OF FINANCIAL CONDITION AND RESULTS OF OPERATIONS |
Management’s Discussion and Analysis of Financial Condition and Results of Operations as well as other sections of this annual report on Form 10-K contain forward-looking statements. The Private Securities Litigation Reform Act of 1995 provides a safe harbor for forward-looking statements. Forward-looking statements are not historical facts, but instead represent only our beliefs, assumptions, expectations, estimates, forecasts and projections regarding future events, many of which, by their nature, are inherently uncertain and outside our control. These statements include statements other than historical information or statements of current condition and may relate to our future plans and objectives and results. By identifying these statements for you in this manner, we are alerting you to the possibility that our actual results and financial condition may differ, possibly materially, from the anticipated results and financial condition indicated in these forward-looking statements. Important factors that could cause our actual results and financial condition to differ from those indicated in the forward-looking statements include, among others, those discussed under the Section heading “Risk Factors” in Part I, Item 1A of this Form 10-K.
Factors that may affect the outcome of the forward-looking statements include, among other things, leadership changes, our ability to attract, integrate, manage and retain qualified consultants and senior leaders; our ability to develop and maintain strong, long-term relationships with our clients; fluctuations in the global economy and our ability to execute successfully our leadership advisory strategy through business cycles; the timing, speed or robustness of any future economic recovery; social or political instability in markets where we operate, the impact of foreign currency exchange rate fluctuations; unfavorable tax law changes and tax authority rulings; price competition; the ability to forecast, on a quarterly basis, variable compensation accruals that ultimately are determined based on the achievement of annual results; our ability to realize our tax losses; the timing of the establishment or reversal of valuation allowance on deferred tax assets; the mix of profit and loss by country; our reliance on information management systems; any impairment of our goodwill and other intangible assets; and the ability to align our cost structure and headcount with net revenue. We undertake no obligation to update publicly any forward-looking statements, whether as a result of new information, future events or otherwise.
Executive Overview
Our Business
We are a leadership advisory firm providing executive search, leadership consulting and culture shaping services. We help our clients build leadership teams by facilitating the recruitment, management and development of senior executives. We believe focusing on top-level services offers us several advantages that include access to and influence with key decision makers, increased potential for recurring search consulting engagements, higher fees per search, enhanced brand visibility, and a leveraged global footprint, which create added barriers to entry for potential competitors. Working at the top of client organizations also allows us to attract and retain high-caliber consultants.
In addition to executive search, we provide culture shaping services and leadership consulting expertise including executive assessment, leadership development, board and top team effectiveness, and succession planning.
We provide our services to a broad range of clients through the expertise of over 300 consultants located in major cities around the world. Our executive search services are provided on a retained basis. Revenue before reimbursements of out-of-pocket expenses (“net revenue”) consists of retainers and indirect expenses billed to clients. Typically, we are paid a retainer for our executive search services equal to approximately one-third of the estimated first year compensation for the position to be filled. In addition, if the actual compensation of a placed candidate exceeds the estimated compensation, we often are authorized to bill the client for one-third of the excess. Indirect expenses are calculated as a percentage of the retainer with certain dollar limits per search. Net revenue associated with culture shaping consulting is recognized as services are performed. Net revenue associated with licenses to use culture shaping proprietary materials is typically recognized over the term of the license. Net revenue from leadership consulting is recognized in accordance with the completion of the engagement deliverables.
Key Performance Indicators
We manage and assess Heidrick & Struggles’ performance through various means, with the primary financial and operational measures including net revenue, operating income, operating margin, Adjusted EBITDA (non-GAAP), and Adjusted EBITDA margin (non-GAAP). Executive Search and Leadership Consulting performance is also measured using consultant headcount and consultant productivity. Specific to Executive Search, confirmation trends and average revenue per search or project are used to measure performance.
Revenue is driven by market conditions and a combination of the number of executive search engagements and leadership consulting and culture shaping projects and the average revenue per search or project. With the exception of compensation expense, incremental increases in revenue do not necessarily result in proportionate increases in costs, particularly operating and administrative expenses, thus potentially improving operating margins.
19
Table of Contents
The number of consultants, confirmation trends, number of searches or projects completed, productivity levels and the average revenue per search or project will vary from quarter to quarter, affecting net revenue and operating margin.
Our Compensation Model
At the Executive Search consultant level there are fixed and variable components of compensation. Individuals are rewarded for their performance based on a system that directly ties a portion of their compensation to the amount of net revenue for which they are responsible. A portion of the reward may be based upon individual performance against a series of non-financial measures. Credit towards the variable portion of an executive search consultant’s compensation is earned by generating net revenue for winning and executing work. Each quarter, we review and update the expected annual performance of all Executive Search consultants and accrue variable compensation accordingly. The amount of variable compensation that is accrued for each Executive Search consultant is based on a tiered payout model. Overall Company performance determines the amount available for total variable compensation. The more net revenue that is generated by the consultant, the higher the percentage credited towards the consultant’s variable compensation and thus accrued by our Company as expense. The mix of individual consultants who generate the revenue can significantly affect the total amount of compensation expense recorded, which directly impacts operating margin. As a result, the variable portion of the compensation expense may fluctuate significantly from quarter to quarter. The total variable compensation is discretionary and is based on Company-wide financial targets approved by the Human Resources and Compensation Committee of the Board of Directors.
A portion of our Executive Search consultants’ and management cash bonuses is deferred and paid over a three-year vesting period. The compensation expense related to the amounts being deferred is recognized on a graded vesting attribution method over the requisite service period. This service period begins on January 1 of the respective fiscal year and continues through the deferral date, which coincides with our bonus payments in the first quarter of the following year, and for an additional three year vesting period. The deferrals are recorded in Accrued salaries and employee benefits and Other non-current liabilities in the Consolidated Balance Sheets.
2014 Overview
Consolidated net revenue was $494.3 million for the year ended December 31, 2014, an increase of $32.3 million or 7.0% compared to December 31, 2013. Consultant productivity measured by net executive search and leadership consulting revenue per consultant was $1.5 million for the year ended December 31, 2014, compared to $1.4 million in the prior year. Average revenue per executive search was $116,000 for the year ended December 31, 2014 compared to $113,400 for the year ended December 31, 2013.
Operating income as a percentage of net revenue was 5.4% in 2014 compared to 3.4% in 2013. The operating income was driven by an increase in net revenue of $32.3 million, offset by increases in salaries and employee benefits expense of $17.9 million and general and administrative expense of $3.3 million. Salaries and employee benefits expense as a percentage of net revenue was 68.3% in 2014 and 69.2% in 2013. General and administrative expense as a percentage of net revenue was 26.3% in 2014 and 27.5% in 2013.
We ended the year with combined cash and cash equivalents of $211.4 million, an increase of $29.8 million compared to $181.6 million at December 31, 2013. The increase is primarily due to strong cash collections due to increased operating performance and a decline in our Days Sales Outstanding. We pay the majority of bonuses in the first quarter following the year in which they were earned. Employee bonuses are accrued throughout the year and are based on the Company’s performance and the performance of the individual employee. We expect to pay approximately $108 million in bonuses related to 2014 performance in March and April 2015. In February 2015, we paid approximately $9 million in cash bonuses deferred in prior years.
2015 Outlook
We are currently forecasting 2015 first quarter net revenue of between $108 million and $118 million. Our 2015 first quarter guidance is based upon, among other things, management’s assumptions for the anticipated volume of new executive search confirmations and leadership consulting and culture shaping projects, the current backlog, consultant productivity, consultant retention, the seasonality of our business and no change in future currency rates.
Our 2015 first quarter guidance is subject to a number of risks and uncertainties, including those disclosed under Risk Factors (See Item 1A. Risk Factors) and Management’s Discussion and Analysis of Financial Condition and Results of Operations included in this Form 10-K. As such, actual results could vary from these projections.
20
Table of Contents
Results of Operations
The following table summarizes, for the periods indicated, the results of operations (in thousands):
| Year Ended December 31, | ||||||||||||
| 2014 | 2013 | 2012 | ||||||||||
| Revenue: |
||||||||||||
| Revenue before reimbursements (net revenue) |
$ | 494,292 | $ | 461,995 | $ | 443,777 | ||||||
| Reimbursements |
18,947 | 18,998 | 21,304 | |||||||||
|
|
|
|
|
|
|
|||||||
| Total revenue |
513,239 | 480,993 | 465,081 | |||||||||
| Operating expenses: |
||||||||||||
| Salaries and employee benefits |
337,448 | 319,499 | 309,502 | |||||||||
| General and administrative expenses |
130,191 | 126,931 | 113,826 | |||||||||
| Reimbursements |
18,947 | 18,998 | 21,304 | |||||||||
| Restructuring charges |
— | — | 810 | |||||||||
|
|
|
|
|
|
|
|||||||
| Total operating expenses |
486,586 | 465,428 | 445,442 | |||||||||
|
|
|
|
|
|
|
|||||||
| Operating income |
26,653 | 15,565 | 19,639 | |||||||||
| Non-operating (expense) income |
||||||||||||
| Interest, net |
(358 | ) | (175 | ) | 1,118 | |||||||
| Other, net |
(2,108 | ) | (2,002 | ) | (495 | ) | ||||||
|
|
|
|
|
|
|
|||||||
| Net non-operating (expense) income |
(2,466 | ) | (2,177 | ) | 623 | |||||||
|
|
|
|
|
|
|
|||||||
| Income before income taxes |
24,187 | 13,388 | 20,262 | |||||||||
| Provision for income taxes |
17,390 | 7,041 | 14,022 | |||||||||
|
|
|
|
|
|
|
|||||||
| Net income |
$ | 6,797 | $ | 6,347 | $ | 6,240 | ||||||
|
|
|
|
|
|
|
|||||||
| Basic weighted average common shares outstanding |
18,210 | 18,077 | 17,971 | |||||||||
| Diluted weighted average common shares outstanding |
18,432 | 18,232 | 18,120 | |||||||||
| Basic net income per common share |
$ | 0.37 | $ | 0.35 | $ | 0.35 | ||||||
| Diluted net income per common share |
$ | 0.37 | $ | 0.35 | $ | 0.34 | ||||||
| Cash dividends paid per share |
$ | 0.52 | $ | 0.39 | $ | 0.65 | ||||||
21
Table of Contents
The following table summarizes, for the periods indicated, our results of operations as a percentage of revenue before reimbursements (net revenue):
| Year Ended December 31, | ||||||||||||
| 2014 | 2013 | 2012 | ||||||||||
| Revenue: |
||||||||||||
| Revenue before reimbursements (net revenue) |
100.0 | % | 100.0 | % | 100.0 | % | ||||||
| Reimbursements |
3.8 | 4.1 | 4.8 | |||||||||
|
|
|
|
|
|
|
|||||||
| Total revenue |
103.8 | 104.1 | 104.8 | |||||||||
| Operating expenses: |
||||||||||||
| Salaries and employee benefits |
68.3 | 69.2 | 69.7 | |||||||||
| General and administrative expenses |
26.3 | 27.5 | 25.6 | |||||||||
| Reimbursements |
3.8 | 4.1 | 4.8 | |||||||||
| Restructuring charges |
— | — | 0.2 | |||||||||
|
|
|
|
|
|
|
|||||||
| Total operating expenses |
98.4 | 100.7 | 100.4 | |||||||||
|
|
|
|
|
|
|
|||||||
| Operating income |
5.4 | 3.4 | 4.4 | |||||||||
|
|
|
|
|
|
|
|||||||
| Non-operating (expense) income |
||||||||||||
| Interest, net |
(0.0 | ) | (0.0 | ) | 0.3 | |||||||
| Other, net |
(0.4 | ) | (0.4 | ) | (0.1 | ) | ||||||
|
|
|
|
|
|
|
|||||||
| Net non-operating (expense) income |
(0.5 | ) | (0.5 | ) | 0.1 | |||||||
| Income before income taxes |
4.9 | 2.9 | 4.6 | |||||||||
| Provision for income taxes |
3.5 | 1.5 | 3.2 | |||||||||
|
|
|
|
|
|
|
|||||||
| Net income |
1.4 | % | 1.4 | % | 1.4 | % | ||||||
|
|
|
|
|
|
|
|||||||
Note: Totals and subtotals may not equal the sum of individual line items due to rounding.
22
Table of Contents
We operate our executive search and leadership consulting services in the Americas; Europe (which includes Africa); and Asia Pacific (which includes the Middle East) and operate our culture shaping business as a separate segment (See Note 18, Segment Information).
During 2014, consistent with our practice to periodically review our reporting structure and segments, we evaluated our allocation of corporate and support costs to each of our regions. In conjunction with that review, to better align our cost and reporting structure, additional costs were allocated to the regions reflecting our current view of the costs necessary to support the regional operations. The prior period results have been recast to reflect these changes and present comparative year-over-year results.
The following table sets forth, for the periods indicated, our revenue and operating income (loss) by segment (in thousands):
| Year Ended December 31, | ||||||||||||
| 2014 | 2013 | 2012 | ||||||||||
| Revenue: |
||||||||||||
| Executive Search and Leadership Consulting |
||||||||||||
| Americas |
$ | 260,830 | $ | 256,706 | $ | 254,395 | ||||||
| Europe |
108,979 | 90,081 | 99,004 | |||||||||
| Asia Pacific |
89,732 | 90,418 | 90,378 | |||||||||
|
|
|
|
|
|
|
|||||||
| Total Executive Search and Leadership Consulting |
459,541 | 437,205 | 443,777 | |||||||||
| Culture Shaping |
34,751 | 24,790 | — | |||||||||
|
|
|
|
|
|
|
|||||||
| Revenue before reimbursements (net revenue) |
494,292 | 461,995 | 443,777 | |||||||||
| Reimbursements |
18,947 | 18,998 | 21,304 | |||||||||
|
|
|
|
|
|
|
|||||||
| Total |
$ | 513,239 | $ | 480,993 | $ | 465,081 | ||||||
|
|
|
|
|
|
|
|||||||
| Operating income (loss): |
||||||||||||
| Executive Search and Leadership Consulting |
||||||||||||
| Americas |
$ | 57,682 | $ | 60,171 | $ | 53,172 | ||||||
| Europe |
4,806 | (6,513 | ) | 3,228 | ||||||||
| Asia Pacific |
4,886 | 3,678 | 2,082 | |||||||||
|
|
|
|
|
|
|
|||||||
| Total Executive Search and Leadership Consulting |
67,374 | 57,336 | 58,482 | |||||||||
| Culture Shaping |
4,621 | (4,215 | ) | — | ||||||||
|
|
|
|
|
|
|
|||||||
| Total segments |
71,995 | 53,121 | 58,482 | |||||||||
| Global Operations Support |
(45,342 | ) | (37,556 | ) | (38,033 | ) | ||||||
|
|
|
|
|
|
|
|||||||
| Operating income before restructuring charges |
26,653 | 15,565 | 20,449 | |||||||||
| Restructuring charges |
— | — | (810 | ) | ||||||||
|
|
|
|
|
|
|
|||||||
| Total |
$ | 26,653 | $ | 15,565 | $ | 19,639 | ||||||
|
|
|
|
|
|
|
|||||||
2014 Compared to 2013
Total revenue. Consolidated total revenue increased $32.2 million, or 6.7%, to $513.2 million in 2014 from $481.0 million in 2013. The increase in total revenue was primarily due to the increase in revenue before reimbursements (net revenue).
Revenue before reimbursements (net revenue). Consolidated net revenue increased $32.3 million, or 7.0%, to $494.3 million in 2014 from $462.0 million in 2013. Executive Search and Leadership Consulting net revenue was $459.5 million in 2014, an increase of $22.3 million, compared to 2013. Increases in the Financial Services, Global Technology & Services, and Consumer Markets search practices were the primary drivers of the increase in consolidated net revenue; however, these increases were partially offset by declines in net revenue from the Healthcare & Life Sciences and Industrial practices. Culture Shaping net revenue was $34.8 million, an increase of $10.0 million compared to 2013. The number of Executive Search and Leadership Consulting consultants was 307 as of December 31, 2014 compared to 293 as of December 31, 2013. Productivity, as measured by annualized net Executive Search and Leadership Consulting revenue per average consultant was $1.5 million for the year ended December 31, 2014 compared to $1.4 million for the year ended December 31, 2013. Specific to Executive Search, our primary business, the number of confirmed searches increased 5% compared to 2013, and average revenue per executive search was $116,000 for the year ended December 31, 2014 compared to $113,400 for the year ended December 31, 2013.
For Executive Search and Leadership Consulting, net revenue in the Americas segment was $260.8 million in 2014, an increase of $4.1 million, or 1.6%, from $256.7 million in 2013. Net revenue in the Europe segment was $109.0 million in 2014, an increase of $18.9 million, or 21.0%, from $90.1 million in 2013. Exchange rate fluctuations contributed approximately three percentage points of the increase in the Europe segment net revenue. Net revenue in the Asia Pacific segment was $89.7 million, a decrease of $0.7 million, or less than one percent, from $90.4 million in 2013. Exchange rate fluctuations contributed three percentage points to the decline in net revenue in the Asia Pacific segment.
23
Table of Contents
Salaries and employee benefits. Consolidated salaries and employee benefits expense increased $17.9 million, or 5.6%, to $337.4 million in 2014 from $319.5 million in 2013. The increase reflects higher performance related compensation of $20.7 million resulting from increases in production and net revenue, partially offset by a decrease in fixed compensation of $2.7 million due to lower severance expense primarily from an executive departure in the prior year. In 2014, we had on average 1,477 employees, compared to an average of 1,480 in 2013.
Exchange rate fluctuations increased salaries and employee benefits expense by $0.7 million or less than one percentage point.
As a percentage of net revenue, salaries and employee benefits expense was 68.3% in 2014, compared to 69.2% in 2013.
General and administrative expenses. Consolidated general and administrative expenses increased $3.3 million, or 2.6%, to $130.2 million in 2014 from $126.9 million in 2013. The increase was primarily due to $2.1 million for new information technology system contracts, $1.8 million for hiring and staffing fees, and $1.3 million for a state franchise tax matter. The increase was partially offset by a $1.5 million reduction in legal, strategy, and other professional consulting fees and $0.7 million in office occupancy expenses
Exchange rate fluctuations increased general and administrative expenses by $0.6 million or less than one percentage point.
As a percentage of net revenue, general and administrative expenses were 26.3% in 2014, compared to 27.5% in 2013.
Operating income. Our consolidated operating income was $26.7 million in 2014 compared to $15.6 million in 2013.
Net non-operating expense. Net non-operating expense was $2.5 million for 2014 compared to $2.2 million in 2013.
Net interest expense was $0.4 million and $0.2 million in 2014 and 2013, respectively. Interest income was $0.5 million for the year ended December 31, 2014 offset by $0.9 million of interest expense associated with the Term Loan. Interest income was $0.7 million, offset by $0.9 million of interest expense associated with the Term Loan for the year ended December 31, 2013.
Net other non-operating expense was $2.1 million in 2014 compared to $2.0 million in 2013. Net other non-operating expense consists of exchange gains and losses from balances which are denominated in currencies other than the functional currency and are not considered permanent in nature.
Income taxes. See Note 17, Income Taxes.
Executive Search and Leadership Consulting
Americas
The Americas segment reported operating income of $57.7 million in 2014, a decrease of $2.5 million compared to $60.2 million in 2013. The decrease in operating income was due to an increase in salaries and employee benefits of $6.8 million, which was partially offset by an increase in net revenue of $4.1 million and a decrease in general and administrative expense of $0.2 million.
The increase in salaries and employee benefits expense was due to a $8.8 million increase in performance-related compensation partially offset by a decline of $2.0 million in fixed compensation. Performance-related compensation increased primarily due to increased production and higher global net revenue. The increase in net revenue was primarily within the Consumer Markets, Global Technology & Services and Financial Services practices, but was partially offset by declines in the Industrial, Healthcare & Life Sciences and Education, Nonprofit & Social Enterprise practices. Fixed compensation declined due to lower average headcount during the year. The decrease in general and administrative expense was primarily due to lower internal travel expenses, partially offset by increased hiring and staffing fees. The number of consultants was 140 as of December 31, 2014, compared to 126 as of December 31, 2013.
Europe
The Europe segment reported operating income of $4.8 million in 2014, an increase of $11.3 million compared to a $6.5 million operating loss in 2013. The increase in operating income was due to an increase in net revenue of $18.9 million, partially offset by increases in salaries and employee benefits expense of $6.6 million and general and administrative expense of $1.0 million. The increase in net revenue was across all industry practices, except the Education, Nonprofit & Social Enterprise practice. The number of consultants was 89 and 83 as of December 31, 2014 and 2013, respectively.
The increase in salaries and employee benefits expense was due to a $8.1 million increase in performance-related compensation associated with increases in production and net revenue and a $1.5 million decrease in fixed compensation. The decrease in fixed costs was due to $0.9 million of lower severance costs and pension benefits, partially offset by impacts of exchange rate fluctuations. The increase in general and administrative expense of $1.0 million was due to $0.6 million of hiring and staffing fees and $0.5 million related to a value added tax charge.
24
Table of Contents
Asia Pacific
Asia Pacific reported operating income of $4.9 million in 2014, an increase of $1.2 million compared to operating income of $3.7 million in 2013. The improvement is due to a decrease of $1.9 million in salaries and employee benefits, partially offset by a decline in net revenue of $0.7 million. The decrease in salaries and employee benefits expense reflects a $1.1 million decrease in performance-related compensation due primarily to declines in average consultant headcount and productivity, partially offset by Company performance. The decrease in net revenue was primarily due to a decline in the Industrial practice, partially offset by increases in the Financial Services, Global Technology & Services, and Education, Nonprofit & Social Enterprise practices. The number of Executive Search and Leadership Consulting consultants was 78 as of December 31, 2014 and 84 as of December 31, 2013. General and administrative expense was $25.3 million in 2014 and 2013.
Culture Shaping
The Culture shaping segment reported operating income of $4.6 million in 2014, an improvement of $8.8 million compared to an operating loss of $4.2 million in 2013. The improvement was due to an increase in net revenue of $10.0 million and a decrease in general and administrative expense of $0.8 million, partially offset by an increase in salary and employee benefits expense of $2.0 million.
Net revenue increased due to higher volumes of client work. Net revenue in the prior year excluded $4.1 million of pre-acquisition deferred revenue that we were unable to recognize as a result of purchase accounting. The decrease in general and administrative costs was due to lower amortization and accretion expense. The increase in salary and benefit expenses was due to higher consultant costs for additional staffing related to increased projects.
Global Operations Support
Global Operations Support expenses in 2014 increased $7.8 million or 20.9% to $45.3 million from $37.5 million in 2013. Salaries and employee benefits expense increased $4.4 million and general and administrative expense increased $3.4 million.
The increase in general and administrative expense was primarily due to $1.8 million related to a global partners meeting, a state franchise tax matter of $1.3 million and higher IT systems contracts, partially offset by lower professional legal fees. The increase in salaries and employee benefits expense was due to a $4.4 million increase in performance-related compensation associated with higher net revenue and more participants in the bonus plan. Fixed compensation remained flat due to a $3.3 million decrease for an executive severance in the prior year, offset by an increase in support staff headcount.
2013 Compared to 2012
Total revenue. Consolidated total revenue increased $15.9 million, or 3.4%, to $481.0 million in 2013 from $465.1 million in 2012. The increase in total revenue was primarily due to the increase in revenue before reimbursements (net revenue).
Revenue before reimbursements (net revenue). Consolidated net revenue increased $18.2 million, or 4.1%, to $462.0 million in 2013 from $443.8 million in 2012. The negative impact of exchange rate fluctuations resulted in approximately a one percentage point decrease in 2013. Executive Search and Leadership Consulting net revenue was $437.2 million, a decline of $6.6 million compared to 2012. All search industry groups, except Healthcare & Life Sciences and Global Technology & Services declined. Culture Shaping net revenue was $24.8 million in 2013. The number of confirmed executive searches decreased less than one percent compared to 2012. The number of Executive Search and Leadership Consulting consultants was 293 as of December 31, 2013 compared to 342 as of December 31, 2012. Productivity, as measured by annualized net Executive Search and Leadership Consulting revenue per average consultant was $1.4 million for the year ended December 31, 2013 compared to $1.3 million for the year ended December 31, 2012, and average revenue per executive search was $113,400 for the year ended December 31, 2013 compared to $113,700 for the year ended December 31, 2012.
Net revenue in the Americas segment was $256.7 million in 2013, an increase of $2.3 million, or 0.9% from $254.4 million in 2012. The impact of exchange rate fluctuations in Canada and Latin America resulted in less than one percentage point of the increase in 2013. Net revenue in the Europe segment was $90.1 million in 2013, a decrease of $8.9 million, or 9.0% from $99.0 million in 2012. The impact of exchange rate fluctuations resulted in less than one percentage points of the decrease in 2013. Net revenue in the Asia Pacific segment was $90.4 million in 2013 and 2012. The negative impact of exchange rate fluctuations was $3.8 million (approximately 4 percentage points) in 2013.
Salaries and employee benefits. Consolidated salaries and employee benefits expense increased $10.0 million or 3.2% to $319.5 million in 2013 from $309.5 million in 2012. Salaries and employee benefits in 2013 includes $16.6 million of Senn Delaney salaries and benefit costs and $3.0 million of expense related to a separation agreement with the Company’s former chief executive officer. Excluding these costs, fixed salaries and employee benefits expense decreased due to a reduction in salaries, payroll taxes and other employee benefits primarily due to lower headcount, lower sign-on and minimum guarantee expense and lower amortization of retention related bonus payments, partially offset by an increase in severance. These decreases were offset by an increase in discretionary compensation related to consultant and Company performance. In 2013 we had an average headcount of 1,480, including 95 from Senn Delaney, compared to an average of 1,487 employees in 2012.
Exchange rate fluctuations positively impacted salaries and employee benefits expense by $2.7 million or 0.9%.
25
Table of Contents
As a percentage of net revenue, salaries and employee benefits expense was 69.2% in 2013, compared to 69.7% in 2012.
General and administrative expenses. Consolidated general and administrative expenses increased $13.1 million, or 11.5%, to $126.9 million in 2013 from $113.8 million in 2012. The increase is primarily due to $12.4 million related to Culture Shaping (including intangible asset amortization and accretion expense associated with the earnout payments), increased expenses related to our propriety database, increased travel, and increased hiring fees. These increases were partially offset by decreases in Senn Delaney acquisition related costs and video conferencing and other communication costs.
Exchange rate fluctuations positively impacted general and administrative expenses by $0.8 million or 0.7%.
As a percentage of net revenue, general and administrative expenses were 27.5% in 2013, compared to 25.6% in 2012.
Restructuring charges. In 2012, we recorded restructuring charges of $0.8 million in Europe, related to adjustments associated with our 2011 restructuring plan. These charges consisted of $1.1 million of employee-related costs associated with severance arrangements, partially offset by $0.3 million of adjustments to premise-related costs.
Operating income. Our consolidated operating income was $15.6 million in 2013 compared to $19.6 million in 2012.
For segment purposes, restructuring charges are not included in operating income by segment. We believe that analyzing trends in operating income excluding restructuring charges more appropriately reflects our core operations.
Executive Search and Leadership Consulting
Americas
The Americas reported operating income of $60.2 million in 2013, an increase of $7.0 million compared to $53.2 million in 2012. The increase in operating income is due to an increase in net revenue of $2.3 million and a decrease in salaries and employee benefits expense of $6.1 million partially offset by an increase in general and administrative expense of $1.4 million. The increase in revenue was due to increases in the Financial Services, Global Technology & Services and Healthcare & Life Sciences practices, partially offset by decreases in the Consumer Markets, Educational & Social Enterprises and Industrial search practices and Leadership Consulting. The number of consultants was 126 as of December 31, 2013, compared to 154 as of December 31, 2012.
Fixed compensation declined due to decreases in salaries, payroll taxes and employee benefits due primarily to lower headcount, a decrease in sign-on and minimum guarantee expense and a decrease in retention related awards. Performance based compensation increased due primarily to consultant and Company performance.
Europe
Europe reported an operating loss of $6.5 million in 2013, a decrease of $9.7 million compared to operating income of $3.2 million in 2012. The decrease in operating income is due primarily to a decrease in net revenue of $8.9 million and increases in general and administrative expense of $0.7 million and salaries and employee benefits expense of $0.1 million. The decrease in net revenue was across all search practices, except Healthcare & Life Sciences and in Leadership Consulting. The number of consultants was 83 as of December 31, 2013 compared to 93 as of December 31, 2012. The increase in general and administrative expense was due primarily to travel costs and bad debt expense.
Asia Pacific
Asia Pacific reported operating income of $3.7 million in 2013, an increase of $1.6 million compared to operating income of $2.1 million in 2012. The increase is due to a decrease of $2.5 million in salaries and employee benefits, partially offset by an increase in general and administrative expenses of $0.9 million. The increase in net revenue was less than $0.1 million. Net revenue increased in the Industrial search practice and Leadership Consulting, but was partially offset by declines in all other search practices. The number of Executive Search and Leadership Consulting consultants was 84 as of December 31, 2013 and December 31, 2012.
The decrease in salaries and employee benefits expense reflects decrease in fixed compensation due primarily to a decline in base salaries, payroll taxes and other fixed employee benefits and a decline in sign-on and minimum guarantee expense. The decrease in fixed compensation was partially offset by an increase in performance-related compensation primarily due to consultant and Company performance.
Culture Shaping
Culture shaping reported net revenue of $24.8 million and an operating loss of $4.3 million for the year ended December 31, 2013. Fixed salaries and employee benefits were $14.0 million, including $2.3 million of retention awards. Discretionary compensation was $2.6 million. General and administrative expense was $12.4 million including $5.4 million of intangible amortization expense and $2.1 million of accretion expense associated with earnout payments.
Global Operations Support
Global Operations Support expenses were $37.6 million in 2013, an increase of $0.4 million compared to $38.0 million in 2012. Salaries and employee benefits expense increased $1.9 million, partially offset by a decline in general and administrative expense of $2.4 million. Salaries and employee benefits expense in 2013 includes $3.0 million of expense related to a separation agreement with the Company’s former chief executive officer. Fixed compensation decreased due to a decrease in severance unrelated to the former
26
Table of Contents
chief executive officer partially offset by increases in base salaries, payroll taxes and other fixed employee benefits. Discretionary compensation increased due to higher net revenue and Company performance. General and administrative expense decreased due to declines in professional fees, Senn Delaney acquisition costs of $1.4 million and $0.3 million of expenses associated with our global partner meeting in 2012, partially offset by an increase in our system related costs.
Net non-operating income (expense). Net non-operating expense was $2.2 million in 2013 compared to net non-operating income of $0.6 million in 2012.
Net interest expense in 2013 was $0.2 million, compared to net interest income of $1.1 million in 2012. Interest expense associated with our 2013 borrowings was $0.9 million in 2013 offset by $0.7 million of interest income.
Net other non-operating expense was $2.0 million in 2013 compared to $0.5 million in 2012. Net other non-operating expense primarily consists of exchange gains and losses on balance sheet amounts, which are denominated in currencies other than the functional currency and are not considered permanent in nature.
Income taxes. See Note 17 Income Taxes.
Liquidity and Capital Resources
General. We continually evaluate our liquidity requirements, capital needs and availability of capital resources based on our operating needs. We believe that our available cash balances together with the funds expected to be generated from operations and funds available under our committed revolving credit facility and our term loan facility will be sufficient to finance our operations for the foreseeable future, as well as to finance the cash payments associated with our cash dividends and stock repurchase program.
We pay the non-deferred portion of annual bonuses in the first quarter following the year in which they are earned. Employee bonuses are accrued throughout the year and are based on our performance and the performance of the individual employee.
Line of Credit and Term Loan. On January 31, 2013, the Company and certain foreign subsidiary borrowers of the Company entered into an Amendment and Restatement Agreement (“Restated Credit Agreement”), pursuant to which the Borrowers, the Lenders and the Administrative Agent amended and restated the Credit Agreement (“Agreement”) dated as of June 22, 2011 (See Note 12, Line of Credit and Term Loan in the Notes to Consolidated Financial Statements). Pursuant to the Restated Credit Agreement, the Agreement was amended to add a committed term loan facility in an aggregate amount of up to $40 million (the “Term Facility”). On January 31, 2013 the Company borrowed $40 million under the Term Facility and $29.5 million and $35.5 million was outstanding as of December 31, 2014 and 2013, respectively. The Term Facility will be repaid over a five-year period pursuant to which the Company will make quarterly payments of $1.5 million through 2016 and quarterly payments of $2.0 million during 2017. The remaining outstanding balance of the Term Facility will be paid on January 31, 2018. The other material terms of the Agreement were not amended by the Restated Credit Agreement.
There were no other borrowings made during the year ended December 31, 2014 and 2013. During 2014 and 2013 we were in compliance with the financial and other covenants under the Restated Credit Agreement, respectively, and no event of default existed.
Cash and cash equivalents. Cash and cash equivalents at December 31, 2014 were $211.4 million, an increase of $29.8 million compared to $181.6 million at December 31, 2013. The $211.4 million of cash and cash equivalents at December 31, 2014 includes $66.6 million held by our foreign subsidiaries. A portion of the $66.6 million is considered permanently reinvested in these foreign subsidiaries. If these funds were required to satisfy obligations in the U.S., the repatriation of these funds could cause us to incur additional U.S. income taxes or foreign withholding taxes. Any additional taxes could be offset, in part or in whole, by foreign tax credits. The amount of such taxes and application of tax credits would be dependent on the income tax laws and other circumstances at the time these amounts are repatriated. Based on these variables, it is not practicable to determine the income tax liability that might be incurred if these earnings were to be repatriated. We expect to pay approximately $108 million in variable compensation related to 2014 performance in March and April 2015. In February 2015, we paid approximately $9 million in variable compensation that was deferred in prior years.
Cash flows from operating activities. In 2014, cash provided by operating activities was $56.8 million, principally reflecting a strong operating performance, an increase in accrued expenses primarily due to the 2014 bonus accruals of approximately $108 million partially offset by cash bonus payments of approximately $86 million, and a valuation adjustment to our German pension plan, partially offset by a decrease in accounts and other receivables of $3.6 million.
In 2013, cash provided by operating activities was $44.0 million, principally reflecting income net of non-cash charges, an increase in bonus, severance and retention accruals, and an increase in income tax payable, net of the increase in income tax receivable partially offset by bonus payments of approximately $87 million in 2013 related to 2012 performance.
In 2012, cash provided by operating activities was $12.5 million, principally reflecting income net of non-cash charges, decreases in trade and other receivables of $6.3 million and a decrease in income taxes recoverable of $10.2 million, partially offset by bonus payments of approximately $109 million in 2012 related to 2011 performance.
Cash flows from investing activities. Cash used in investing activities was $3.3 million in 2014 primarily due to capital expenditures of $3.4 million.
27
Table of Contents
Cash used in investing activities was $5.2 million in 2013 primarily due to capital expenditures of $3.7 million and the acquisition of Scambler MacGregor for $1.0 million.
Cash used in investing activities was $67.3 million in 2012 primarily due to $60.0 million related to the Senn Delaney acquisition including the purchase price of $53.5 million and $6.5 million for a retention escrow, capital expenditures of $7.5 million and purchases of available for sale investments of $1.1 million.
Capital expenditures were $3.4 million, $3.7 million, and $7.5 million in 2014, 2013 and 2012, respectively. Capital expenditures in 2014 were primarily related to office build outs, costs associated with our external website and an internal financial system. We anticipate that our capital expenditures for 2015 will be approximately $11 million, which primarily reflects office build outs and investments in technology.
Cash flows from financing activities. Cash used in financing activities in 2014 was $19.7 million primarily due to $9.9 million of quarterly cash dividends to shareholders, $6.0 million debt repayment, $3.4 million earnout payment related to the Senn Delaney acquisition, and $0.4 million for employee tax withholdings on equity transactions.
Cash provided by financing activities in 2013 was $27.2 million primarily due to $35.5 million of proceeds from our debt issuance, net of repayments, partially offset by $7.3 million of dividend payments, $0.7 million of payments for employee tax withholdings on equity transactions and a $0.4 million earnout payment related to the Bell McCaw Bampfylde Limited acquisition.
Cash used in financing activities in 2012 was $15.1 million primarily due to $12.0 million of quarterly cash dividends to shareholders, $1.7 million of payments for employee tax withholdings on equity transactions, $1.1 million of purchases of treasury stock and a $0.4 million earnout payment related to the Bell McCaw Bampfylde Limited acquisition.
On February 11, 2008, we announced that our Board of Directors authorized management to repurchase shares of our common stock with an aggregate total amount up to $50 million. We intend from time to time and as business conditions warrant, to purchase shares of our common stock on the open market or in negotiated or block trades. No time limit has been set for completion of this program. We did not repurchase any shares of our common stock in 2014. As of December 31, 2014 and December 31, 2013, we have purchased 1,038,670 shares of our common stock for a total of $28.3 million and $21.7 million remains available for future purchases under the authorization. Unless terminated or extended earlier by resolution of the board of directors, the program will expire when the amount authorized for repurchases has been spent.
Off-Balance Sheet Arrangements. We do not have material off-balance sheet arrangements, special purpose entities, trading activities of non-exchange traded contracts or transactions with related parties.
Contractual obligations. The following table presents our known contractual obligations as of December 31, 2014 and the expected timing of cash payments related to these contractual obligations (in millions):
| Payments due for the years ended December 31, | ||||||||||||||||||||||||||||
| 2015 | 2016 | 2017 | 2018 | 2019 | Thereafter | Total | ||||||||||||||||||||||
| Contractual obligations: |
||||||||||||||||||||||||||||
| Office space and equipment lease obligations |
$ | 27.5 | $ | 24.9 | $ | 18.8 | $ | 17.3 | $ | 15.1 | $ | 62.6 | $ | 166.2 | ||||||||||||||
| Debt and interest |
6.7 | 6.5 | 8.4 | 9.5 | — | — | 31.1 | |||||||||||||||||||||
| Asset retirement obligations (1) |
— | 1.0 | 0.2 | 0.1 | 0.1 | — | 1.4 | |||||||||||||||||||||
|
|
|
|
|
|
|
|
|
|
|
|
|
|
|
|||||||||||||||
| Total |
$ | 34.2 | $ | 32.4 | $ | 27.4 | $ | 26.9 | $ | 15.2 | $ | 62.6 | $ | 198.7 | ||||||||||||||
|
|
|
|
|
|
|
|
|
|
|
|
|
|
|
|||||||||||||||
| (1) | Represents the fair value of the obligation associated with the retirement of tangible long-lived assets, primarily related to our obligation at the end of the lease term to return office space to the landlord in its original condition. |
In addition to the contractual obligations included in the above table, we have liabilities related to certain employee benefit plans. These liabilities are recorded in our Consolidated Balance Sheet at December 31, 2014. The obligations related to these employee benefit plans are described in Note 13, Employee Benefit Plans, and Note 15, Pension Plan and Life Insurance Contract, in the Notes to Consolidated Financial Statements. As the timing of cash disbursements related to these employee benefit plans is uncertain, we have not included these obligations in the above table. The table excludes our liability for uncertain tax positions including accrued interest and penalties, which totaled $0.1 million as of December 31, 2014, since we cannot predict with reasonable reliability the timing of cash settlements to the respective taxing authorities.
Application of Critical Accounting Policies and Estimates
General. Management’s Discussion and Analysis of Financial Condition and Results of Operations is based upon our Consolidated Financial Statements, which have been prepared using accounting principles generally accepted in the United States of America. Our significant accounting policies are discussed in Note 2, Summary of Significant Accounting Policies, in the Notes to Consolidated Financial Statements. The preparation of these financial statements requires management to make estimates and assumptions that affect the reported amounts of assets, liabilities, revenue and expenses, and related disclosure of contingent assets and liabilities. Management bases its estimates on historical experience and on various other assumptions that are believed to be reasonable under the circumstances, the results of which form the basis for making judgments about the carrying values of assets and liabilities that are not
28
Table of Contents
readily apparent from other sources. Actual results may differ from these estimates under different assumptions or conditions. If actual amounts are ultimately different from previous estimates, the revisions are included in our results of operations for the period in which the actual amounts become known.
An accounting policy is deemed to be critical if it requires an accounting estimate to be made based on assumptions about matters that are highly uncertain at the time the estimate is made, if different estimates that reasonably could have been used, or if changes in the accounting estimates that are reasonably likely to occur periodically, that could materially impact the financial statements. Management believes the following critical accounting policies reflect its more significant estimates and assumptions used in the preparation of the Consolidated Financial Statements.
Revenue recognition. Revenue before reimbursements of out-of-pocket expenses (“net revenue”) consists of retainers and indirect expenses billed to clients. For each assignment, we and our client enter into a contract that outlines the general terms and conditions of the assignment. Typically, we are paid a retainer for our executive search services equal to approximately one-third of the estimated first year compensation for the position to be filled. In addition, if the actual compensation of a placed candidate exceeds the estimated compensation, we often will be authorized to bill the client for one-third of the excess. Indirect expenses are calculated as a percentage of the retainer with certain dollar limits per search. We generally bill our clients for our retainer and indirect expenses in one-third increments over a three-month period commencing in the month of a client’s acceptance of the contract.
Net revenue is recognized when earned and realizable and therefore when the following criteria have been met: (a) persuasive evidence of an arrangement exists, (b) services have been rendered, (c) the fee to our client is fixed or determinable, and (d) collectability is reasonably assured. Taxes collected from clients and remitted to governmental authorities are presented on a net basis. Typically, net revenue from standard executive search engagements is recognized over the expected average period of performance, in proportion to the estimated personnel time incurred to fulfill our obligations under the arrangements. Net revenue in excess of the retainer, resulting from actual compensation of the placed candidate exceeding the estimated compensation, is recognized upon completion of the executive search when the amount of the additional fee is known.
Net revenue associated with culture shaping consulting is recognized as services are performed. Net revenue associated with licenses to use our culture shaping proprietary materials is typically recognized over the term of the license.
Net revenue from certain leadership consulting and non-standard executive search engagements is recognized in accordance with the completion of the engagement deliverables.
Income taxes. Determining the consolidated provision for income tax expense, income tax liabilities and deferred tax assets and liabilities involves judgment. As a global company, we calculate and provide for income taxes in each of the tax jurisdictions in which we operate. This involves estimating current tax exposures in each jurisdiction as well as making judgments regarding the recoverability of deferred tax assets. Tax exposures can involve complex issues and may require an extended period to resolve. Changes in the geographic mix or estimated level of annual income before taxes can affect the overall effective tax rate.
We apply an estimated annual effective tax rate to our cumulative quarterly operating results to determine the provision for income tax expense. In the event there are significant unusual or infrequent items recognized in our quarterly operating results, the tax attributable to that item is recorded in the interim period in which it occurs.
The recognition of deferred tax assets is based on management’s belief that it is more likely than not that the tax benefits associated with temporary differences, net operating loss carryforwards and tax credits will be utilized. We assess the recoverability of the deferred tax assets on an ongoing basis. In making this assessment, we consider all positive and negative evidence, and all potential sources of taxable income including scheduled reversals of deferred tax liabilities, tax-planning strategies, projected future taxable income and recent financial performance.
No deferred tax liabilities have been recorded for U.S. income taxes and foreign withholding taxes related to undistributed foreign earnings that are planned to be indefinitely reinvested. If future events, including material changes in estimates of cash, working capital and long-term investment requirements, necessitate that these earnings be distributed, an additional provision for taxes may apply, which could materially affect our future effective tax rate.
As a matter of course, we are regularly audited by various taxing authorities, and sometimes these audits result in proposed assessments where the ultimate resolution may result in our owing additional taxes. We establish reserves on uncertain tax return positions that do not meet the more likely than not recognition criteria. We evaluate these reserves each quarter and adjust the reserves and the related accrued interest in light of changing facts and circumstances regarding the uncertainty of realizing tax benefits, such as the ultimate settlement of tax audits or the expiration of a statute of limitations. We believe the estimates and assumptions used to support our evaluation of tax benefit realization are reasonable. However, final determinations of prior year tax liabilities, either by settlement with tax authorities or expiration of statutes of limitations, could be materially different than estimates reflected in assets and liabilities and historical income tax provisions. The outcome of these final determinations could have a material effect on our income tax provision, net income, or cash flows in the period in which that determination is made. We believe our tax positions comply with applicable tax law and that we have adequately provided for any known tax reserves.
Goodwill and other intangible assets. We review goodwill for impairment annually. We also review goodwill and long-lived assets; including identifiable intangible assets for impairment whenever events or changes in circumstances indicate that it is more-
29
Table of Contents
likely-than-not that the fair value has fallen below the carrying amount of an asset. We review factors such as a significant change in business climate, attrition of key personnel, changes in financial condition or results of operations, a prolonged decline in our stock price and market capitalization, competition, and other factors to determine if an impairment test is necessary. Our annual impairment test begins with a qualitative assessment to determine whether it is necessary to perform the first step of the two-step, fair value based goodwill impairment test. The qualitative assessment includes evaluating whether events and circumstances indicate that it is more-likely-than-not that fair values of reporting units are greater than the carrying values. If the qualitative factors do not indicate that it is more-likely-than-not that the fair values of the reporting units are greater than the carrying values then we perform step 1 of the two-step test. The first step compares the fair value of a reporting unit with its carrying amount, including goodwill. The second step measures the impairment charge and is performed only if the carrying amount of a reporting unit exceeds its fair value as determined in step one. To measure the amount of the impairment loss, the implied fair value of a reporting unit’s goodwill is compared to the carrying amount of that goodwill. If the carrying amount of a reporting unit’s goodwill exceeds the implied fair value of that goodwill, an impairment loss is recognized in an amount equal to that excess. The implied fair value of goodwill is determined in the same manner as the amount of goodwill recognized in a business combination.
The impairment test is considered for each of our reporting units as defined in the accounting standard for goodwill and intangible assets. We operate our executive search and leadership consulting services in three segments: the Americas; Europe, which includes Africa; Asia Pacific, which includes the Middle East. We operate our culture shaping business as a separate segment. The Americas is comprised of the North America and the Latin America operations.
During the first step, the fair value of each of our reporting units is determined using a combination of valuation techniques, including a discounted cash flow methodology and comparable public company methodology.
The discounted cash flow approach is dependent on a number of factors including estimates of future market growth and trends, forecasted revenue and costs, capital investments, appropriate discount rates, certain assumptions to allocate shared assets and liabilities, historical and projected performance of our reporting units, the outlook for the executive search industry, and the macroeconomic conditions affecting each of our reporting units. We base our fair value estimates on assumptions we believe to be reasonable, but which are unpredictable and inherently uncertain. The fair value of our reporting units is also impacted by our overall market capitalization and may be impacted by volatility in our stock price and assumed control premium, among other factors. As a result, actual future results may differ from those estimates and may result in a future impairment charge. These assumptions are updated annually, at a minimum, to reflect information concerning our reportable segments.
Additionally, we review long-lived assets, such as property, equipment, and purchased intangibles subject to amortization for impairment whenever events or changes in circumstances indicate that the carrying amount of an asset may not be recoverable. Recoverability of assets to be held and used is measured by a comparison of the carrying amount of an asset to estimated undiscounted future cash flows expected to be generated by the asset. If the carrying amount of an asset exceeds its estimated future cash flows, an impairment charge, equal to the amount by which the carrying amount of the asset exceeds the fair value of the asset, is recognized.
We believe that the accounting estimate related to goodwill and other intangible asset impairment is a critical accounting estimate because the assumptions used are highly susceptible to changes in the operating results and cash flows of our reportable segments.
Allowance for doubtful accounts. Accounts receivable from our clients are recorded at the invoiced amount and do not bear interest. The allowance for doubtful accounts is our best estimate of the amount of probable credit losses in existing accounts receivable balances. We determine the allowance for doubtful accounts through an analysis of several factors, including the aging of our accounts receivable, historical write-off experience, and specific account analyses. We consider current and projected economic conditions and historical trends when determining the allowance for doubtful accounts. Actual collections of accounts receivable could differ from our estimates due to changes in future economic or industry conditions or specific clients’ financial condition.
The allowance for doubtful accounts is recorded as a reduction in revenue to the extent the provision relates to fee adjustments and other discretionary pricing adjustments. To the extent the provision relates to a client’s inability to make required payments on accounts receivables, the provision is recorded as bad debt expense within general and administrative expenses.
Stock-based compensation. We measure our stock-based compensation costs based on the grant date fair value of the awards and recognize these costs in the financial statements over the requisite service period. We apply a forfeiture rate to our share-based awards that represents our best estimate of the amount of awards that will be forfeited. Our estimate is based on our historical experience and specific analysis. We review our forfeiture rate quarterly or whenever events or changes in circumstances indicate our estimate may need to be revised. Actual forfeitures could differ from our estimates due to changes in retention rates of our employee population.
Recently Adopted Financial Accounting Standards
On January 1, 2013 we adopted the Financial Accounting Standards Board’s (“FASB”) guidance to improve the reporting of reclassifications out of accumulated other comprehensive income. The guidance requires an entity to report the effect of significant reclassifications out of accumulated other comprehensive income on the respective line items in net income if the amount being reclassified is required to be reclassified in its entirety to net income (See Note 16, Changes in Accumulated Other Comprehensive Income). For other amounts that are not required to be reclassified in their entirety to net income in the same reporting period, an
30
Table of Contents
entity is required to cross-reference other disclosures that provide additional detail about those amounts. These requirements are to be applied to each component of accumulated other comprehensive income. Other than the additional disclosure, the adoption of these changes had no impact on the Consolidated Financial Statements.
Recent Financial Accounting Standards
In May 2014, the Financial Accounting Standards Board (“FASB”) issued Accounting Standards Update (“ASU”) No. 2014-09, “Revenue from Contracts with Customers.” The ASU requires that an entity recognizes revenue to depict the transfer of promised goods or services to customer in an amount that reflects the consideration to which we expect to be entitled in exchange for these goods or services. The standard is effective for annual reporting periods beginning after December 15, 2016, including interim periods, using either of the following transition methods: (i) a full retrospective approach reflecting the application of the standard in each prior reporting period with the option to elect certain practical expedients or (ii) a retrospective approach with the cumulative effect upon initial adoption recognized at the date of adoption. We are currently evaluating the effect that this pronouncement will have on its financial statements and related disclosures. The effect is not known or reasonably estimable at this time.
Quarterly Financial Information
The following table sets forth certain financial information for each quarter of 2014 and 2013. The information is derived from our quarterly consolidated financial statements which are unaudited but which, in the opinion of management, have been prepared on the same basis as the audited annual consolidated financial statements included in this document. The consolidated financial data shown below should be read in conjunction with the consolidated financial statements and notes thereto. The operating results for any quarter are not necessarily indicative of results for any future period.
| Quarter Ended | ||||||||||||||||||||||||||||||||
| 2014 | 2013 | |||||||||||||||||||||||||||||||
| Mar. 31 | Jun. 30 | Sept. 30 | Dec. 31 | Mar. 31 | Jun. 30 | Sept. 30 | Dec. 31 | |||||||||||||||||||||||||
| Revenue before reimbursements (net revenue) |
$ | 111,121 | $ | 136,080 | $ | 125,829 | $ | 121,262 | $ | 102,978 | $ | 122,033 | $ | 118,981 | $ | 118,003 | ||||||||||||||||
| Operating income |
780 | 12,512 | 9,557 | 3,804 | 389 | 5,742 | 8,353 | 1,081 | ||||||||||||||||||||||||
| Income before income taxes |
512 | 12,744 | 8,917 | 2,014 | 85 | 5,052 | 7,553 | 699 | ||||||||||||||||||||||||
| Provision for income taxes |
1,256 | 8,957 | 5,925 | 1,252 | 1,300 | 3,115 | 3,429 | (803 | ) | |||||||||||||||||||||||
| Net income (loss) |
(744 | ) | 3,787 | 2,992 | 762 | (1,215 | ) | 1,937 | 4,124 | 1,502 | ||||||||||||||||||||||
| Basic earnings (loss) per common share |
(0.04 | ) | 0.21 | 0.16 | 0.04 | (0.07 | ) | 0.11 | 0.23 | 0.08 | ||||||||||||||||||||||
| Diluted earnings (loss) per common share |
(0.04 | ) | 0.21 | 0.16 | 0.04 | (0.07 | ) | 0.11 | 0.23 | 0.08 | ||||||||||||||||||||||
| Cash dividends paid per share |
0.13 | 0.13 | 0.13 | 0.13 | — | 0.13 | 0.13 | 0.13 | ||||||||||||||||||||||||
31
Table of Contents
| ITEM 7A. | QUANTITATIVE AND QUALITATIVE DISCLOSURES ABOUT MARKET RISK |
Currency market risk. With our operations in the Americas, Europe and Asia Pacific, we conduct business using various currencies. Revenue earned in each country is generally matched with the associated expenses incurred, thereby reducing currency risk to earnings. However, because certain assets and liabilities are denominated in currencies other than the U.S. dollar, changes in currency rates may cause fluctuations in the valuation of such assets and liabilities. As the local currency of our subsidiaries has generally been designated as the functional currency, we are affected by the translation of foreign currency financial statements into U.S. dollars. A 10% change in the average exchange rate for currencies of all foreign countries in which we operate would have increased or decreased our 2014 net income by approximately $0.6 million. For financial information by segment, see Note 18, Segment Information, in the Notes to Consolidated Financial Statements.
Interest Rate Risk. We are exposed to interest rate risk related to our debt. We mitigate this risk through the use of an interest rate swap; see Note 10, Derivative Financial Instruments and Note 12, Line of Credit and Term Loan, in the Notes to Consolidated Financial Statements, for more information on our debt and interest rate swaps. A 10% change in interest rates would not have a material impact on the fair value of the outstanding interest rate swap agreement in 2014.
32
Table of Contents
| ITEM 8. | FINANCIAL STATEMENTS AND SUPPLEMENTARY DATA |
HEIDRICK & STRUGGLES INTERNATIONAL, INC. AND SUBSIDIARIES
INDEX TO CONSOLIDATED FINANCIAL STATEMENTS
33
Table of Contents
Report of Independent Registered Public Accounting Firm
The Board of Directors and Stockholders
Heidrick & Struggles International, Inc.:
We have audited the accompanying consolidated balance sheets of Heidrick & Struggles International, Inc. and subsidiaries (the Company) as of December 31, 2014 and 2013, and the related consolidated statements of comprehensive income, changes in stockholders’ equity, and cash flows for each of the years in the three-year period ended December 31, 2014. We also have audited the Company’s internal control over financial reporting as of December 31, 2014, based on criteria established in Internal Control – Integrated Framework (2013) issued by the Committee of Sponsoring Organizations of the Treadway Commission (COSO). The Company’s management is responsible for these consolidated financial statements, for maintaining effective internal control over financial reporting, and for its assessment of the effectiveness of internal control over financial reporting, included in the accompanying Management’s Report on Internal Control over Financial Reporting. Our responsibility is to express an opinion on these consolidated financial statements and an opinion on the Company’s internal control over financial reporting based on our audits.
We conducted our audits in accordance with the standards of the Public Company Accounting Oversight Board (United States). Those standards require that we plan and perform the audits to obtain reasonable assurance about whether the financial statements are free of material misstatement and whether effective internal control over financial reporting was maintained in all material respects. Our audits of the consolidated financial statements included examining, on a test basis, evidence supporting the amounts and disclosures in the financial statements, assessing the accounting principles used and significant estimates made by management, and evaluating the overall financial statement presentation. Our audit of internal control over financial reporting included obtaining an understanding of internal control over financial reporting, assessing the risk that a material weakness exists, and testing and evaluating the design and operating effectiveness of internal control based on the assessed risk. Our audits also included performing such other procedures as we considered necessary in the circumstances. We believe that our audits provide a reasonable basis for our opinions.
A company’s internal control over financial reporting is a process designed to provide reasonable assurance regarding the reliability of financial reporting and the preparation of financial statements for external purposes in accordance with generally accepted accounting principles. A company’s internal control over financial reporting includes those policies and procedures that (1) pertain to the maintenance of records that, in reasonable detail, accurately and fairly reflect the transactions and dispositions of the assets of the Company; (2) provide reasonable assurance that transactions are recorded as necessary to permit preparation of financial statements in accordance with generally accepted accounting principles, and that receipts and expenditures of the Company are being made only in accordance with authorizations of management and directors of the Company; and (3) provide reasonable assurance regarding prevention or timely detection of unauthorized acquisition, use, or disposition of the Company’s assets that could have a material effect on the financial statements.
Because of its inherent limitations, internal control over financial reporting may not prevent or detect misstatements. Also, projections of any evaluation of effectiveness to future periods are subject to the risk that controls may become inadequate because of changes in conditions, or that the degree of compliance with the policies or procedures may deteriorate.
In our opinion, the consolidated financial statements referred to above present fairly, in all material respects, the financial position of Heidrick & Struggles International, Inc. and subsidiaries as of December 31, 2014 and 2013, and the results of its operations and its cash flows for each of the years in the three-year period ended December 31, 2014, in conformity with U.S. generally accepted accounting principles. Also in our opinion, the Company maintained, in all material respects, effective internal control over financial reporting as of December 31, 2014, based on criteria established in Internal Control – Integrated Framework (2013) issued by the Committee of Sponsoring Organizations of the Treadway Commission (COSO) .
KPMG LLP
Chicago, Illinois
March 11, 2015
34
Table of Contents
HEIDRICK & STRUGGLES INTERNATIONAL, INC. AND SUBSIDIARIES
(In thousands, except share amounts)
| December 31, 2014 |
December 31, 2013 |
|||||||
| Current assets: |
||||||||
| Cash and cash equivalents |
$ | 211,352 | $ | 181,646 | ||||
| Restricted cash |
6,501 | 130 | ||||||
| Accounts receivable, net |
68,353 | 71,666 | ||||||
| Other receivables |
10,613 | 6,906 | ||||||
| Prepaid expenses |
14,536 | 14,786 | ||||||
| Other current assets |
1,592 | 1,807 | ||||||
| Income taxes recoverable |
5,288 | 5,772 | ||||||
| Deferred income taxes |
12,094 | 8,061 | ||||||
|
|
|
|
|
|||||
| Total current assets |
330,329 | 290,774 | ||||||
| Non-current assets: |
||||||||
| Property and equipment, net |
30,417 | 34,961 | ||||||
| Restricted cash |
1,411 | 7,878 | ||||||
| Assets designated for retirement and pension plans |
19,426 | 22,685 | ||||||
| Investments |
13,989 | 13,848 | ||||||
| Other non-current assets |
6,601 | 5,693 | ||||||
| Goodwill |
122,176 | 123,274 | ||||||
| Other intangible assets, net |
20,939 | 26,637 | ||||||
| Deferred income taxes |
23,413 | 27,474 | ||||||
|
|
|
|
|
|||||
| Total non-current assets |
238,372 | 262,450 | ||||||
|
|
|
|
|
|||||
| Total assets |
$ | 568,701 | $ | 553,224 | ||||
|
|
|
|
|
|||||
| Current liabilities: |
||||||||
| Current portion of debt |
$ | 6,000 | $ | 6,000 | ||||
| Accounts payable |
5,493 | 7,791 | ||||||
| Accrued salaries and employee benefits |
130,434 | 109,943 | ||||||
| Deferred revenue, net |
30,452 | 27,714 | ||||||
| Other current liabilities |
26,835 | 18,938 | ||||||
| Income taxes payable |
6,684 | 5,401 | ||||||
|
|
|
|
|
|||||
| Total current liabilities |
205,898 | 175,787 | ||||||
| Non-current liabilities: |
||||||||
| Non-current debt, less current maturities |
23,500 | 29,500 | ||||||
| Retirement and pension plans |
39,892 | 38,735 | ||||||
| Other non-current liabilities |
54,747 | 61,329 | ||||||
|
|
|
|
|
|||||
| Total non-current liabilities |
118,139 | 129,564 | ||||||
|
|
|
|
|
|||||
| Total liabilities |
324,037 | 305,351 | ||||||
| Commitments and contingencies (Note 20) |
||||||||
| Stockholders’ equity: |
||||||||
| Preferred stock, $0.01 par value, 10,000,000 shares authorized, no shares issued at December 31, 2014 and December 31, 2013 |
— | — | ||||||
| Common stock, $0.01 par value, 100,000,000 shares authorized, 19,585,777 shares issued, 18,239,939 and 18,134,129 shares outstanding at December 31, 2014 and December 31, 2013, respectively |
196 | 196 | ||||||
| Treasury stock at cost, 1,345,838 and 1,451,648 shares at December 31, 2014 and December 31, 2013, respectively |
(44,261 | ) | (47,811 | ) | ||||
| Additional paid in capital |
232,075 | 232,008 | ||||||
| Retained earnings |
45,431 | 48,511 | ||||||
| Accumulated other comprehensive income |
11,223 | 14,969 | ||||||
|
|
|
|
|
|||||
| Total stockholders’ equity |
244,664 | 247,873 | ||||||
|
|
|
|
|
|||||
| Total liabilities and stockholders’ equity |
$ | 568,701 | $ | 553,224 | ||||
|
|
|
|
|
|||||
The accompanying notes to Consolidated Financial Statements are an integral part of these statements.
35
Table of Contents
HEIDRICK & STRUGGLES INTERNATIONAL, INC. AND SUBSIDIARIES
CONSOLIDATED STATEMENTS OF COMPREHENSIVE INCOME
(In thousands, except per share amounts)
| December 31, | ||||||||||||
| 2014 | 2013 | 2012 | ||||||||||
| Revenue: |
||||||||||||
| Revenue before reimbursements (net revenue) |
$ | 494,292 | $ | 461,995 | $ | 443,777 | ||||||
| Reimbursements |
18,947 | 18,998 | 21,304 | |||||||||
|
|
|
|
|
|
|
|||||||
| Total revenue |
513,239 | 480,993 | 465,081 | |||||||||
| Operating expenses: |
||||||||||||
| Salaries and employee benefits |
337,448 | 319,499 | 309,502 | |||||||||
| General and administrative expenses |
130,191 | 126,931 | 113,826 | |||||||||
| Reimbursed expenses |
18,947 | 18,998 | 21,304 | |||||||||
| Restructuring charges |
— | — | 810 | |||||||||
|
|
|
|
|
|
|
|||||||
| Total operating expenses |
486,586 | 465,428 | 445,442 | |||||||||
| Operating income |
26,653 | 15,565 | 19,639 | |||||||||
| Non-operating (expense) income: |
||||||||||||
| Interest, net |
(358 | ) | (175 | ) | 1,118 | |||||||
| Other, net |
(2,108 | ) | (2,002 | ) | (495 | ) | ||||||
|
|
|
|
|
|
|
|||||||
| Net non-operating (expense) income |
(2,466 | ) | (2,177 | ) | 623 | |||||||
|
|
|
|
|
|
|
|||||||
| Income before income taxes |
24,187 | 13,388 | 20,262 | |||||||||
| Provision for income taxes |
17,390 | 7,041 | 14,022 | |||||||||
|
|
|
|
|
|
|
|||||||
| Net income |
6,797 | 6,347 | 6,240 | |||||||||
| Other comprehensive (loss) income, net of tax: |
||||||||||||
| Foreign currency translation adjustment |
(1,235 | ) | (1,999 | ) | (467 | ) | ||||||
| Net unrealized gain on available-for-sale investments |
262 | 1,265 | 1,091 | |||||||||
| Pension (loss) gain adjustment |
(2,736 | ) | 628 | (1,901 | ) | |||||||
| Unrealized (loss) gain on cash flow hedge |
(37 | ) | 115 | — | ||||||||
|
|
|
|
|
|
|
|||||||
| Other comprehensive (loss) income, net of tax |
(3,746 | ) | 9 | (1,277 | ) | |||||||
|
|
|
|
|
|
|
|||||||
| Comprehensive income |
$ | 3,051 | $ | 6,356 | $ | 4,963 | ||||||
|
|
|
|
|
|
|
|||||||
| Basic weighted average common shares outstanding |
18,210 | 18,077 | 17,971 | |||||||||
| Diluted weighted average common shares outstanding |
18,432 | 18,232 | 18,120 | |||||||||
| Basic net income per common share |
$ | 0.37 | $ | 0.35 | $ | 0.35 | ||||||
| Diluted net income per common share |
$ | 0.37 | $ | 0.35 | $ | 0.34 | ||||||
| Cash dividends paid per share |
$ | 0.52 | $ | 0.39 | $ | 0.65 | ||||||
The accompanying notes to Consolidated Financial Statements are an integral part of these statements.
36
Table of Contents
HEIDRICK & STRUGGLES INTERNATIONAL, INC. AND SUBSIDIARIES
CONSOLIDATED STATEMENTS OF CHANGES IN STOCKHOLDERS’ EQUITY
(In thousands)
| Common Stock | Treasury Stock | Additional Paid in |
Retained | Accumulated Other Comprehensive |
||||||||||||||||||||||||||||
| Shares | Amount | Shares | Amount | Capital | Earnings | Income | Total | |||||||||||||||||||||||||
| Balance at December 31, 2011 |
19,586 | $ | 196 | 1,715 | $ | (58,690 | ) | $ | 238,523 | $ | 55,029 | $ | 16,237 | $ | 251,295 | |||||||||||||||||
| Net income |
— | — | — | — | — | 6,240 | — | 6,240 | ||||||||||||||||||||||||
| Other comprehensive income, net of tax |
— | — | — | — | — | — | (1,277 | ) | (1,277 | ) | ||||||||||||||||||||||
| Treasury and common stock transactions: |
||||||||||||||||||||||||||||||||
| Stock-based compensation |
— | — | — | — | 4,199 | — | — | 4,199 | ||||||||||||||||||||||||
| Vesting of equity, net of tax witholdings |
— | — | (184 | ) | 6,344 | (7,997 | ) | — | — | (1,653 | ) | |||||||||||||||||||||
| Purchases of treasury stock |
— | — | 88 | (1,123 | ) | — | — | — | (1,123 | ) | ||||||||||||||||||||||
| Re-issuance of treasury stock |
— | — | (27 | ) | 946 | (496 | ) | — | — | 450 | ||||||||||||||||||||||
| Cash dividends declared ($0.52 per share) |
— | — | — | — | — | (9,362 | ) | — | (9,362 | ) | ||||||||||||||||||||||
| Dividend equivalents on restricted stock units |
— | — | — | — | — | (203 | ) | — | (203 | ) | ||||||||||||||||||||||
| Tax deficit related to stock-based compensation |
— | — | — | — | (219 | ) | — | — | (219 | ) | ||||||||||||||||||||||
|
|
|
|
|
|
|
|
|
|
|
|
|
|
|
|
|
|||||||||||||||||
| Balance at December 31, 2012 |
19,586 | 196 | 1,592 | (52,523 | ) | 234,010 | 51,704 | 14,960 | 248,347 | |||||||||||||||||||||||
| Net income |
— | — | — | — | — | 6,347 | — | 6,347 | ||||||||||||||||||||||||
| Other comprehensive income, net of tax |
— | — | — | — | — | — | 9 | 9 | ||||||||||||||||||||||||
| Treasury and common stock transactions: |
||||||||||||||||||||||||||||||||
| Stock-based compensation |
— | — | — | — | 3,747 | — | — | 3,747 | ||||||||||||||||||||||||
| Vesting of equity, net of tax witholdings |
— | — | (120 | ) | 4,038 | (4,752 | ) | — | — | (714 | ) | |||||||||||||||||||||
| Re-issuance of treasury stock |
— | — | (20 | ) | 674 | (374 | ) | — | — | 300 | ||||||||||||||||||||||
| Cash dividends declared ($0.52 per share) |
— | — | — | — | — | (9,415 | ) | — | (9,415 | ) | ||||||||||||||||||||||
| Dividend equivalents on restricted stock units |
— | — | — | — | — | (125 | ) | — | (125 | ) | ||||||||||||||||||||||
| Tax deficit related to stock-based compensation |
— | — | — | — | (623 | ) | — | — | (623 | ) | ||||||||||||||||||||||
|
|
|
|
|
|
|
|
|
|
|
|
|
|
|
|
|
|||||||||||||||||
| Balance at December 31, 2013 |
19,586 | 196 | 1,452 | (47,811 | ) | 232,008 | 48,511 | 14,969 | 247,873 | |||||||||||||||||||||||
| Net income |
— | — | — | — | — | 6,797 | — | 6,797 | ||||||||||||||||||||||||
| Other comprehensive income, net of tax |
— | — | — | — | — | — | (3,746 | ) | (3,746 | ) | ||||||||||||||||||||||
| Treasury and common stock transactions: |
||||||||||||||||||||||||||||||||
| Stock-based compensation |
— | — | — | — | 3,579 | — | — | 3,579 | ||||||||||||||||||||||||
| Vesting of equity, net of tax witholdings |
— | — | (82 | ) | 2,737 | (3,142 | ) | — | — | (405 | ) | |||||||||||||||||||||
| Re-issuance of treasury stock |
— | — | (24 | ) | 813 | (363 | ) | — | — | 450 | ||||||||||||||||||||||
| Cash dividends declared ($0.52 per share) |
— | — | — | — | — | (9,481 | ) | — | (9,481 | ) | ||||||||||||||||||||||
| Dividend equivalents on restricted stock units |
— | — | — | — | — | (396 | ) | — | (396 | ) | ||||||||||||||||||||||
| Tax deficit related to stock-based compensation |
— | — | — | — | (7 | ) | — | — | (7 | ) | ||||||||||||||||||||||
|
|
|
|
|
|
|
|
|
|
|
|
|
|
|
|
|
|||||||||||||||||
| Balance at December 31, 2014 |
19,586 | $ | 196 | 1,346 | $ | (44,261 | ) | $ | 232,075 | $ | 45,431 | $ | 11,223 | $ | 244,664 | |||||||||||||||||
|
|
|
|
|
|
|
|
|
|
|
|
|
|
|
|
|
|||||||||||||||||
The accompanying notes to Consolidated Financial Statements are an integral part of these statements.
37
Table of Contents
HEIDRICK & STRUGGLES INTERNATIONAL, INC. AND SUBSIDIARIES
CONSOLIDATED STATEMENTS OF CASH FLOWS
(In thousands)
| Year Ended December 31, | ||||||||||||
| 2014 | 2013 | 2012 | ||||||||||
| Cash flows - operating activities: |
||||||||||||
| Net income |
$ | 6,797 | $ | 6,347 | $ | 6,240 | ||||||
| Adjustments to reconcile net income to net cash provided by operating activities: |
||||||||||||
| Depreciation and amortization |
15,312 | 16,275 | 10,801 | |||||||||
| Deferred income taxes |
237 | (3,749 | ) | 2,331 | ||||||||
| Stock-based compensation expense |
3,579 | 3,747 | 4,199 | |||||||||
| Accretion expense related to earnout payments |
1,854 | 2,082 | — | |||||||||
| Restructuring charges |
— | — | 810 | |||||||||
| Cash paid for restructuring charges |
(142 | ) | (999 | ) | (9,128 | ) | ||||||
| Changes in assets and liabilities, net of effects of acquisitions: |
||||||||||||
| Accounts and other receivables |
(4,129 | ) | 236 | 6,288 | ||||||||
| Accounts payable |
(2,113 | ) | (504 | ) | (471 | ) | ||||||
| Accrued expenses |
29,979 | 12,888 | (28,202 | ) | ||||||||
| Deferred revenue |
3,486 | 2,735 | 6,447 | |||||||||
| Income taxes recoverable, net |
1,482 | 4,292 | 10,182 | |||||||||
| Retirement and pension plan assets and liabilities |
4,477 | 1,201 | 1,594 | |||||||||
| Prepaid expenses |
(207 | ) | (625 | ) | 2,897 | |||||||
| Other assets and liabilities, net |
(3,848 | ) | 107 | (1,495 | ) | |||||||
|
|
|
|
|
|
|
|||||||
| Net cash provided by operating activities |
56,764 | 44,033 | 12,493 | |||||||||
|
|
|
|
|
|
|
|||||||
| Cash flows - investing activities: |
||||||||||||
| Restricted cash |
(53 | ) | 26 | (6,230 | ) | |||||||
| Acquisition of business and earnout payments, net of cash acquired |
— | (1,023 | ) | (52,733 | ) | |||||||
| Capital expenditures |
(3,359 | ) | (3,731 | ) | (7,504 | ) | ||||||
| Purchases of available for sale investments |
(963 | ) | (749 | ) | (1,121 | ) | ||||||
| Proceeds from sale of available for sale investments |
1,084 | 252 | 137 | |||||||||
| Other, net |
— | — | 200 | |||||||||
|
|
|
|
|
|
|
|||||||
| Net cash used in investing activities |
(3,291 | ) | (5,225 | ) | (67,251 | ) | ||||||
|
|
|
|
|
|
|
|||||||
| Cash flows - financing activities: |
||||||||||||
| Proceeds from debt issuance |
— | 40,000 | — | |||||||||
| Debt repayment |
(6,000 | ) | (4,500 | ) | — | |||||||
| Cash dividends paid |
(9,864 | ) | (7,260 | ) | (11,991 | ) | ||||||
| Payment of employee tax withholdings on equity transactions |
(406 | ) | (713 | ) | (1,653 | ) | ||||||
| Purchases of treasury stock |
— | — | (1,123 | ) | ||||||||
| Acquisition earnout payments |
(3,390 | ) | (357 | ) | (381 | ) | ||||||
|
|
|
|
|
|
|
|||||||
| Net cash (used in) provided by financing activities |
(19,660 | ) | 27,170 | (15,148 | ) | |||||||
|
|
|
|
|
|
|
|||||||
| Effect of exchange rates fluctuations on cash and cash equivalents |
(4,107 | ) | (1,937 | ) | 2,121 | |||||||
|
|
|
|
|
|
|
|||||||
| Net increase (decrease) in cash and cash equivalents |
29,706 | 64,041 | (67,785 | ) | ||||||||
| Cash and cash equivalents at beginning of period |
181,646 | 117,605 | 185,390 | |||||||||
|
|
|
|
|
|
|
|||||||
| Cash and cash equivalents at end of period |
$ | 211,352 | $ | 181,646 | $ | 117,605 | ||||||
|
|
|
|
|
|
|
|||||||
| Supplemental disclosures of cash flow information |
||||||||||||
| Cash paid for |
||||||||||||
| Gross income taxes |
$ | 14,175 | $ | 6,650 | $ | 8,191 | ||||||
| Interest |
$ | 861 | $ | 879 | $ | 21 | ||||||
The accompanying notes to Consolidated Financial Statements are an integral part of these statements.
38
Table of Contents
HEIDRICK & STRUGGLES INTERNATIONAL, INC. AND SUBSIDIARIES
NOTES TO CONSOLIDATED FINANCIAL STATEMENTS
(All tables in thousands, except share and per share figures)
| 1. | Basis of Presentation |
Heidrick & Struggles International, Inc. and Subsidiaries (the “Company”) is engaged in providing executive search, culture shaping and leadership consulting services to clients on a retained basis. The Company operates in the Americas, Europe and Asia Pacific.
The consolidated financial statements include Heidrick & Struggles International, Inc. and its wholly-owned subsidiaries and have been prepared using accounting principles generally accepted in the United States of America (“GAAP”). The preparation of these financial statements in conformity with GAAP requires management to make estimates and assumptions that affect the reported amounts of assets, liabilities, revenues and expenses. Significant items subject to estimates and assumptions include revenue recognition, allowance for doubtful accounts, allowances for deferred tax assets, assessment of goodwill and other intangible assets for impairment, compensation accruals, stock-based compensation and contingent liabilities. Estimates are subject to a degree of uncertainty and actual results could differ from these estimates.
| 2. | Summary of Significant Accounting Policies |
Cash and Cash Equivalents
The Company considers all highly liquid instruments with an original maturity of three months or less to be cash equivalents.
Concentration of Risk
The Company is potentially exposed to concentrations of risk associated with its accounts receivable. However, this risk is limited due to the Company’s large number of clients and their dispersion across many different industries and geographies. At December 31, 2014, the Company had no significant concentrations of risk.
Accounts Receivable
The Company’s accounts receivable primarily consist of trade receivables. The allowance for doubtful accounts is developed based upon several factors including the age of the Company’s accounts receivable, historical write-off experience and specific account analysis. These factors may change over time, impacting the allowance level.
Fair Value of Financial Instruments
Cash and cash equivalents are stated at cost, which approximates fair market value. The carrying value for receivables from clients, accounts payable, deferred revenue and other accrued liabilities reasonably approximate fair market value due to the nature of the financial instruments and the short term nature of the items.
Property and Equipment
Property and equipment are stated at cost. Depreciation is computed using the straight-line method over the estimated useful life of the asset or, for leasehold improvements, the shorter of the lease term or the estimated useful life of the asset, as follows:
| Office furniture, fixtures and equipment |
5–10 years | |
| Computer equipment and software |
3–8 years |
Depreciation is calculated for tax purposes using accelerated methods, where applicable.
Long-lived Assets
The Company reviews its long-lived assets, including property and equipment, for impairment whenever events or changes in circumstances indicate that the carrying amount of an asset may not be recoverable. Recoverability of assets to be held and used is measured by a comparison of the carrying amount of an asset to estimated undiscounted future cash flows expected to be generated by the asset. If the carrying amount of an asset exceeds its estimated future cash flows, an impairment charge, equal to the amount by which the carrying amount of the asset exceeds the fair value of the asset, is recognized.
39
Table of Contents
Investments
The Company’s investments consist primarily of available-for-sale investments within the U.S. non-qualified deferred compensation plan (the “Plan”) and warrants for equity securities in client companies classified as derivative instruments, cost method investments or available-for-sale investments.
Available-for-sale investments are reported at fair value with changes in unrealized gains (losses) recorded as a separate component of accumulated other comprehensive income in the Consolidated Balance Sheets until realized. Realized gains (losses) resulting from an employee’s termination from the Plan are recorded as a non-operating income (expense) in the Consolidated Statements of Comprehensive Income.
Goodwill and Other Intangible Assets
Goodwill represents the difference between the purchase price of acquired companies and the related fair value of the net assets acquired, which is accounted for by the acquisition method of accounting. Other intangible assets include client relationships, trade name, software and employee non-compete agreements. The Company performs assessments of the carrying value of goodwill at least annually and of its goodwill and other intangible assets whenever events occur or circumstances indicate that a carrying amount of these assets may not be recoverable. These circumstances include a significant change in business climate, attrition of key personnel, changes in financial condition or results of operations, a prolonged decline in the Company’s stock price and market capitalization, competition, and other factors.
The goodwill impairment test compares the fair value of a reporting unit to its carrying amount, including goodwill. The Company’s reporting units include Americas, Europe, Asia Pacific and Culture Shaping. If the carrying amount of a reporting unit exceeds its fair value, goodwill of the reporting unit would be considered impaired. To measure the amount of the impairment loss, the implied fair value of a reporting unit’s goodwill is compared to the carrying amount of that goodwill. If the carrying amount of a reporting unit’s goodwill exceeds the implied fair value of that goodwill, an impairment loss is recognized in an amount equal to that excess. The implied fair value of goodwill is determined in the same manner as the amount of goodwill recognized in a business combination is determined. The fair value of each of the Company’s reporting units is determined using a discounted cash flow methodology.
The other intangible asset impairment review compares the carrying amount of an asset to estimated undiscounted future cash flows expected to be generated by the asset. If the carrying amount of an asset exceeds its estimated future cash flows, an impairment charge, equal to the amount by which the carrying amount of the asset exceeds the fair value, is recognized.
Other intangible assets acquired are amortized either using the straight-line method over their estimated useful lives or based on the projected cash flow associated with the respective intangible assets.
Revenue Recognition
Revenue before reimbursements of out-of-pocket expenses (“net revenue”) consists of retainers and indirect expenses billed to clients. For each assignment, the Company and its client enter into a contract that outlines the general terms and conditions of the assignment. Typically, the Company is paid a retainer for its executive search services equal to approximately one-third of the estimated first year compensation for the position to be filled. In addition, if the actual compensation of a placed candidate exceeds the estimated compensation, the Company often will be authorized to bill the client for one-third of the excess. Indirect expenses are calculated as a percentage of the retainer with certain dollar limits per search. The Company generally bills its clients for its retainer and indirect expenses in one-third increments over a three-month period commencing in the month of a client’s acceptance of the contract.
Net revenue is recognized when earned and realizable and therefore when the following criteria have been met: (a) persuasive evidence of an arrangement exists, (b) services have been rendered, (c) the fee to our client is fixed or determinable, and (d) collectability is reasonably assured. Taxes collected from clients and remitted to governmental authorities are presented on a net basis. Typically, net revenue from standard executive search engagements is recognized over the expected average period of performance, in proportion to the estimated personnel time incurred to fulfill our obligations under the arrangements. Net revenue in excess of the retainer, resulting from actual compensation of the placed candidate exceeding the estimated compensation, is recognized upon completion of the executive search when the amount of the additional fee is known.
Net revenue associated with culture shaping consulting is recognized proportionally as services are performed. Net revenue associated with licenses to use our culture shaping proprietary materials is typically recognized over the term of the license.
Net revenue from certain leadership consulting and non-standard executive search engagements is recognized in accordance with the completion of the engagement deliverables.
40
Table of Contents
Reimbursements
The Company incurs certain out-of-pocket expenses that are reimbursed by its clients, which are accounted for as revenue and expense in its Consolidated Statements of Comprehensive Income.
Salaries and Employee Benefits
Salaries and employee benefits consist of compensation and benefits paid to consultants, executive officers, and administrative and support personnel, of which the most significant elements are salaries and annual performance-related bonuses. Other items in this category are expenses related to sign-on bonuses and minimum guaranteed bonuses (often incurred in connection with the hiring of new consultants), restricted stock unit amortization, payroll taxes, profit sharing and retirement benefits, and employee insurance benefits.
Salaries and employee benefits are recognized on an accrual basis. Certain signing bonuses, retention awards, and minimum guaranteed compensation are capitalized and amortized in accordance with the terms of the respective agreements.
A portion of the Company’s consultants’ and management cash bonuses are deferred and paid over a three-year vesting period. The portion of the bonus that is deferred varies between 10% and 15% depending on the employee’s level or position. The compensation expense related to the amounts being deferred is recognized on a graded vesting attribution method over the requisite service period. This service period begins on January 1 of the respective fiscal year and continues through the deferral date, which coincides with the Company’s bonus payments in the first quarter of the following year, and for an additional three year vesting period. The deferrals are recorded in Accrued salaries and employee benefits and Other non-current liabilities in the Consolidated Balance Sheets.
Stock-Based Compensation
The Company accounts for stock-based compensation, primarily consisting of restricted stock units, based on the fair value of the award at grant date, which is typically the closing stock-price, and recognizes compensation expense over the requisite service period.
Income Taxes
Deferred tax assets and liabilities are determined based on the differences between the financial statement and tax basis of assets and liabilities, applying enacted statutory tax rates in effect for the year in which the tax differences are expected to reverse. Deferred tax assets are reduced by a valuation allowance when, in the opinion of management, it is more likely than not that some portion or all of the deferred tax assets will not be realized. Deferred tax assets and liabilities are adjusted for the effects of changes in tax laws and rates on the date of enactment.
Earnings per Common Share
Basic earnings per common share is computed by dividing net income by weighted average common shares outstanding for the year. Diluted earnings per share reflect the potential dilution that could occur if securities or other contracts to issue common stock were exercised or converted. Common equivalent shares are excluded from the determination of diluted earnings per share in periods in which they have an anti-dilutive effect.
Translation of Foreign Currencies
The Company generally designates the local currency for all its subsidiaries as the functional currency. The Company translates the assets and liabilities of its subsidiaries into U.S. dollars at the current rate of exchange prevailing at the balance sheet date. Revenue and expenses are translated at a monthly average exchange rate for the period. Translation adjustments are reported as a component of accumulated other comprehensive income.
Recently Issued Financial Accounting Standards
In May 2014, the Financial Accounting Standards Board (“FASB”) issued Accounting Standards Update (“ASU”) No. 2014-09, “Revenue from Contracts with Customers.” The ASU requires that an entity recognizes revenue to depict the transfer of promised goods or services to a customer in an amount that reflects the consideration to which the Company expects to be entitled in exchange for these goods or services. The standard is effective for annual reporting periods beginning after December 15, 2016, including interim periods, using either of the following transition methods: (i) a full retrospective approach reflecting the application of the standard in each prior reporting period with the option to elect certain practical expedients or (ii) a retrospective approach with the cumulative effect upon initial adoption recognized at the date of adoption. The Company is currently evaluating the effect that this pronouncement will have on its financial statements and related disclosures. The effect is not currently known or reasonably estimable at this time.
41
Table of Contents
| 3. | Allowance for Doubtful Accounts |
The activity of the allowance for doubtful accounts for the years ended:
| December 31, | ||||||||||||
| 2014 | 2013 | 2012 | ||||||||||
| Balance at January 1, |
$ | 4,709 | $ | 4,798 | $ | 3,805 | ||||||
| Provision charged to income |
241 | 851 | 2,175 | |||||||||
| Write-offs |
(772 | ) | (870 | ) | (1,281 | ) | ||||||
| Currency |
(236 | ) | (70 | ) | 99 | |||||||
|
|
|
|
|
|
|
|||||||
| Balance at December 31, |
$ | 3,942 | $ | 4,709 | $ | 4,798 | ||||||
|
|
|
|
|
|
|
|||||||
| 4. | Property and Equipment, net |
The components of the Company’s property and equipment are as follows:
| December 31, | ||||||||
| 2014 | 2013 | |||||||
| Leasehold improvements |
$ | 43,930 | $ | 44,242 | ||||
| Office furniture, fixtures and equipment |
18,693 | 24,301 | ||||||
| Computer equipment and software |
30,751 | 38,039 | ||||||
|
|
|
|
|
|||||
| Property and equipment, gross |
93,374 | 106,582 | ||||||
| Accumulated depreciation |
(62,957 | ) | (71,621 | ) | ||||
|
|
|
|
|
|||||
| Property and equipment, net |
$ | 30,417 | $ | 34,961 | ||||
|
|
|
|
|
|||||
Depreciation expense for the years ended December 31, 2014, 2013, and 2012 was $9.8 million, $10.4 million, and $10.2 million, respectively.
| 5. | Restricted Cash |
The components of the Company’s restricted cash are as follows:
| December 31, | ||||||||
| 2014 | 2013 | |||||||
| Current restricted cash |
||||||||
| Retention escrow |
$ | 6,501 | $ | — | ||||
| Bank guarantees |
— | 130 | ||||||
|
|
|
|
|
|||||
| Total current restricted cash |
$ | 6,501 | $ | 130 | ||||
|
|
|
|
|
|||||
| Non-current restricted cash |
||||||||
| Retention escrow |
$ | — | $ | 6,501 | ||||
| Lease guarantees |
1,316 | 1,377 | ||||||
| Business licenses |
95 | — | ||||||
|
|
|
|
|
|||||
| Total non-current restricted cash |
$ | 1,411 | $ | 7,878 | ||||
|
|
|
|
|
|||||
The retention escrow is associated with the Senn Delaney acquisition and will be paid to certain key executives of Senn Delaney if they remain with the Company for three years subsequent to the acquisition (See Note 8, Acquisitions). The Company has certain business licenses and lease agreements with terms that require the Company to restrict cash through the termination dates of the agreements, which extend through 2017 and 2018, respectively.
| 6. | Investments |
The components of the Company’s investments are as follows:
| December 31, | ||||||||
| 2014 | 2013 | |||||||
| U.S. non-qualified deferred compensation plan |
$ | 13,709 | $ | 13,232 | ||||
| Warrants and equity securities |
280 | 616 | ||||||
|
|
|
|
|
|||||
| Total |
$ | 13,989 | $ | 13,848 | ||||
|
|
|
|
|
|||||
42
Table of Contents
The Company’s U.S. non-qualified deferred compensation plan consists primarily of U.S. marketable securities and mutual funds, all of which are valued using Level 1 inputs (See Note 7, Fair Value Measurements). The aggregate cost basis for these investments was $10.1 million and $9.9 million as of December 31, 2014 and 2013, respectively.
| 7. | Fair Value Measurements |
Fair value is defined as the price that would be received to sell an asset or paid to transfer a liability in an orderly transaction between market participants at the measurement date. A three-level fair value hierarchy prioritizes the inputs used to measure fair value. The hierarchy requires entities to maximize the use of observable inputs and minimize the use of unobservable inputs. The three levels of inputs used to measure fair value are as follows:
| • | Level 1 – Quoted prices in active markets for identical assets and liabilities. |
| • | Level 2 – Quoted prices in active markets for similar assets and liabilities, or other inputs that are observable for the asset or liability, either directly or indirectly, for substantially the full term of the financial instrument. |
| • | Level 3 – Unobservable inputs that are supported by little or no market activity and that are significant to the fair value of the assets and liabilities. This includes certain pricing models, discounted cash flow methodologies and similar techniques that use significant unobservable inputs. |
| Quoted Prices in Active Markets for Identical Assets (Level 1) |
Significant Other Observable Inputs (Level 2) |
Significant Unobservable Inputs (Level 3) |
Total | |||||||||||||
| At December 31, 2014 |
||||||||||||||||
| U.S. non-qualified deferred compensation plan |
$ | 13,709 | $ | — | $ | — | $ | 13,709 | ||||||||
| Assets designated for retirement and pension plans |
— | 20,880 | — | 20,880 | ||||||||||||
| Derivatives designated as cash flow hedge |
— | 125 | — | 125 | ||||||||||||
| Warrants and equity securities |
— | — | 280 | 280 | ||||||||||||
| Acquisition earnout accruals |
— | — | (12,944 | ) | (12,944 | ) | ||||||||||
|
|
|
|
|
|
|
|
|
|||||||||
| $ | 13,709 | $ | 21,005 | $ | (12,664 | ) | $ | 22,050 | ||||||||
|
|
|
|
|
|
|
|
|
|||||||||
| Quoted Prices in Active Markets for Identical Assets (Level 1) |
Significant Other Observable Inputs (Level 2) |
Significant Unobservable Inputs (Level 3) |
Total | |||||||||||||
| At December 31, 2013 |
||||||||||||||||
| U.S. non-qualified deferred compensation plan |
$ | 13,232 | $ | — | $ | — | $ | 13,232 | ||||||||
| Assets designated for retirement and pension plans |
— | 24,312 | — | 24,312 | ||||||||||||
| Derivatives designated as cash flow hedge |
— | 180 | — | 180 | ||||||||||||
| Warrants and equity securities |
— | — | 616 | 616 | ||||||||||||
| Acquisition earnout accruals |
— | — | (14,053 | ) | (14,053 | ) | ||||||||||
|
|
|
|
|
|
|
|
|
|||||||||
| $ | 13,232 | $ | 24,492 | $ | (13,437 | ) | $ | 24,287 | ||||||||
|
|
|
|
|
|
|
|
|
|||||||||
The following table provides a reconciliation of the beginning and ending balance of Level 3 assets and liabilities for the year ended December 31, 2014.
| Warrants and Equity Securities |
Acquisition Earnout Accruals |
Total | ||||||||||
| Balance at December 31, 2013 |
$ | 616 | $ | (14,053 | ) | $ | (13,437 | ) | ||||
| Realized / unrealized gains |
(336 | ) | — | (336 | ) | |||||||
| Earnout accretion |
— | (1,854 | ) | (1,854 | ) | |||||||
| Earnout payments |
— | 3,390 | 3,390 | |||||||||
| Foreign currency translation |
— | (427 | ) | (427 | ) | |||||||
|
|
|
|
|
|
|
|||||||
| Balance at December 31, 2014 |
$ | 280 | $ | (12,944 | ) | $ | (12,664 | ) | ||||
|
|
|
|
|
|
|
|||||||
The Level 2 assets above are fair valued using a market approach. The Level 3 liabilities are: (i) accruals for future earnout payments related to prior acquisitions, the values of which are determined based on discounted cash flow models; and (ii) warrant and equity securities, the values of which are determined using a valuation model. The Company considers the
43
Table of Contents
recorded value of its financial assets and liabilities, which consist primarily of cash and cash equivalents, accounts receivable, and accounts payable, to approximate the fair value of the respective assets and liabilities at December 31, 2014 and December 31, 2013 based upon the short-term nature of the assets and liabilities.
| 8. | Acquisition |
Scambler MacGregor Executive Search Pty Limited
In November 2013, the Company acquired Scambler MacGregor, an Australian-based retained Executive Search boutique in the financial services industry for 1.1 million Australian dollars (equivalent to $0.9 million at December 31, 2014 and $1.0 million at December 31, 2013) of initial consideration, pursuant to a stock purchase, which was funded from existing cash. In December 2013, the Company paid an additional $0.1 million related to the final working capital settlement. The former owners of Scambler MacGregor are eligible to receive earnout payments of up to 2.8 million Australian dollars based on the achievement of certain revenue metrics over the period November 2013 through December 2018. When estimating the fair value of future earnout payments, the Company has accrued 2.4 million Australian dollars and 2.3 million Australian dollars (equivalent to $2.0 million and $2.1 million, respectively) as of December 31, 2014 and 2013, respectively. The Company also recorded $0.4 million of intangible assets and $2.7 million of goodwill. The goodwill is primarily related to the acquired workforce and strategic fit.
Senn-Delaney Leadership Consulting Group, LLC
In December 2012, the Company acquired Senn-Delaney Leadership Consulting Group, LLC, a global leader of corporate culture shaping. Under the terms of the purchase agreement, the Company paid $53.5 million at closing for 100 percent of the equity of Senn Delaney. The agreement also included additional cash consideration up to $15.0 million based on the realization of specific earnings milestones achieved over the period December 2012 through December 2015, of which $3.4 million was paid during the second quarter of 2014. The Company has accrued $10.9 million and $12.1 million at December 31, 2014 and December 31, 2013, respectively, for the remaining cash consideration. The Company has recognized $1.7 million and $2.1 million of accretion expense included in General and administrative expenses in December 31, 2014 and 2013, respectively. The Company also holds $6.5 million in a retention escrow that will be paid to certain key executives of Senn Delaney if they remain with the Company for three years subsequent to the acquisition. The Company recognized $2.0 million and $2.3 million of compensation expense included in Salaries and employee benefits in December 31, 2014 and 2013, respectively, related to the retention awards.
| 9. | Goodwill and Other Intangible Assets |
Goodwill
Changes in the carrying amount of goodwill by segment for the years ended December 31, 2014, 2013 and 2012 were as follows:
| Executive Search and Leadership Consulting- Americas |
Executive Search and Leadership Consulting- Asia Pacific |
Culture Shaping |
Total | |||||||||||||
| Balance at December 31, 2011 |
$ | 82,814 | $ | 7,882 | $ | — | $ | 90,696 | ||||||||
| Senn-Delaney acquisition |
— | — | 29,707 | 29,707 | ||||||||||||
| Exchange rate fluctuations |
127 | 410 | — | 537 | ||||||||||||
|
|
|
|
|
|
|
|
|
|||||||||
| Balance at December 31, 2012 |
82,941 | 8,292 | 29,707 | 120,940 | ||||||||||||
| Scambler MacGregor acquisition |
— | 2,729 | — | 2,729 | ||||||||||||
| Exchange rate fluctuations |
(301 | ) | (167 | ) | 73 | (395 | ) | |||||||||
|
|
|
|
|
|
|
|
|
|||||||||
| Balance at December 31, 2013 |
82,640 | 10,854 | 29,780 | 123,274 | ||||||||||||
| Exchange rate fluctuations |
(370 | ) | (599 | ) | (129 | ) | (1,098 | ) | ||||||||
|
|
|
|
|
|
|
|
|
|||||||||
| Balance at December 31, 2014 |
$ | 82,270 | $ | 10,255 | $ | 29,651 | $ | 122,176 | ||||||||
|
|
|
|
|
|
|
|
|
|||||||||
During the 2014 fourth quarter, the Company conducted its annual goodwill impairment evaluation as of October 31, 2014. The goodwill impairment evaluation is performed using a two-step, fair value based test. The first step compares the fair value of a reporting unit with its carrying amount, including goodwill. The second step measures the impairment charge and is performed only if the carrying amount of a reporting unit exceeds its fair value as determined in step 1. To measure the amount of the impairment loss, the implied fair value of a reporting unit’s goodwill is compared to the carrying amount of that goodwill. If the carrying amount of a reporting unit’s goodwill exceeds the implied fair value of that goodwill, an impairment loss is recognized in an amount equal to that excess. The implied fair value of goodwill is determined in the same manner as the amount of goodwill recognized in a business combination.
44
Table of Contents
The impairment test is considered for each of the Company’s reporting units that have goodwill as defined in the accounting standard for goodwill and intangible assets. The Company operates four reporting units: the Americas; Europe, which includes Africa; Asia Pacific, which includes the Middle East, and Culture Shaping.
During the impairment evaluation process, the Company used a discounted cash flow methodology to estimate the fair value of its reporting units. The discounted cash flow approach is dependent on a number of factors, including estimates of future market growth and trends, forecasted revenue and costs, capital investments, appropriate discount rates, certain assumptions to allocate shared assets and liabilities, historical and projected performance of the Company’s reporting units, the outlook for the executive search industry, and the macroeconomic conditions affecting each of the Company’s reporting units.
The assumptions used in the determination of fair value were (1) a forecast of growth in the near term; (2) the discount rate; (3) working capital investments; and (4) other factors. Based on the result of the first step of this goodwill impairment analysis, the fair values of the Americas, Asia Pacific, and Cultural Shaping reporting units exceeded their carrying values by 134%, 13%, and 36%, respectively. The fair value of the Asia Pacific reporting unit may deteriorate and could result in the need to record an impairment charge in future periods. The Company continues to monitor potential triggering events including changes in the business climate in which it operates, the Company’s market capitalization compared to its book value, and the Company’s recent operating performance, specifically in relation to the Asia Pacific reporting unit. Any changes in these factors could result in an impairment charge. Since the fair value of the reporting units exceeded their carrying values, the second step of the goodwill impairment test was not necessary.
Other Intangible Assets, net
The Company’s other intangible assets, net by segment, are as follows:
| December 31, 2014 |
December 31, 2013 |
|||||||
| Executive Search and Leadership Consulting |
||||||||
| Americas |
$ | 1,044 | $ | 1,340 | ||||
| Asia Pacific |
383 | 591 | ||||||
|
|
|
|
|
|||||
| Total Executive Search and Leadership Consulting |
1,427 | 1,931 | ||||||
| Culture Shaping |
19,512 | 24,706 | ||||||
|
|
|
|
|
|||||
| Total Other intangible assets, net |
$ | 20,939 | $ | 26,637 | ||||
|
|
|
|
|
|||||
The carrying amount of amortizable intangible assets and the related accumulated amortization were as follows:
| December 31, 2014 | December 31, 2013 | |||||||||||||||||||||||||||
| Weighted Average Life (in years) |
Gross Carrying Amount |
Accumulated Amortization |
Net Carrying Amount |
Gross Carrying Amount |
Accumulated Amortization |
Net Carrying Amount |
||||||||||||||||||||||
| Client relationships |
8.7 | $ | 23,316 | $ | (14,999 | ) | $ | 8,317 | $ | 23,541 | $ | (11,834 | ) | $ | 11,707 | |||||||||||||
| Trade name |
15.0 | 9,334 | (2,358 | ) | 6,976 | 9,430 | (1,223 | ) | 8,207 | |||||||||||||||||||
| Software |
7.0 | 7,200 | (2,057 | ) | 5,143 | 7,200 | (1,029 | ) | 6,171 | |||||||||||||||||||
| Non-compete |
5.0 | 593 | (90 | ) | 503 | 603 | (51 | ) | 552 | |||||||||||||||||||
|
|
|
|
|
|
|
|
|
|
|
|
|
|
|
|||||||||||||||
| Total intangible assets |
10.3 | $ | 40,443 | $ | (19,504 | ) | $ | 20,939 | $ | 40,774 | $ | (14,137 | ) | $ | 26,637 | |||||||||||||
|
|
|
|
|
|
|
|
|
|
|
|
|
|
|
|||||||||||||||
Intangible asset amortization expense for the years ended December 31, 2014, 2013 and 2012 was $5.5 million, $5.8 million and $0.6 million, respectively. The estimated intangible amortization expense is $4.7 million for fiscal year 2015, $4.4 million for fiscal year 2016, $3.6 million for fiscal year 2017, $2.8 million for fiscal year 2018 and $2.2 million for fiscal year 2019. These amounts are based on intangible assets recorded as of December 31, 2014, and actual amortization expense could differ from these estimates as a result of future acquisitions and other factors.
| 10. | Derivative Financial Instruments |
The Company uses derivative instruments to manage exposures to interest rate risk. The Company’s primary objective in holding derivatives is to reduce the volatility of earnings and cash flows associated with changes in interest rates. The Company’s derivatives expose it to credit risk to the extent that the counterparties may be unable to meet the terms of the agreement. The Company does, however, seek to mitigate such risks by limiting its counterparties to financial institutions that meet certain criteria. In addition, the potential risk of loss with any one counterparty resulting from this type of credit risk is monitored. Management does not expect material losses as a result of defaults by counterparties.
45
Table of Contents
The Company pays short-term variable interest rates, plus a spread which is dependent on the Company’s leverage ratio, calculated as defined within the Amendment and Restatement Agreement (“Restated Credit Agreement”). The term loan exposes the Company to the variability in interest payments and therefore fluctuations in interest expense and cash flows due to changes in interest rates.
On February 28, 2013, the Company entered into an interest rate swap to hedge the variable interest rate exposure from the underlying term facility (See Note 12, Line of Credit and Term Loan). The interest rate swap was entered into to manage fluctuations in cash flows resulting from interest rate risk attributable to changes in the short-term variable interest rate. This interest rate swap involves the exchange of variable-rate interest payments for fixed-rate interest payments based on the contractual underlying notional amount. Gains or losses on the interest rate swap that are linked to the term loan being hedged are expected to perfectly offset the losses or gains on the underlying term loan from the short-term variable interest rate. The effective portion of changes in the fair value of a derivative that is designated and that qualifies as a cash flow hedge is recorded in Accumulated other comprehensive income and is subsequently reclassified into earnings in the period when the hedged forecasted transaction affects earnings. If a derivative is deemed to be ineffective, the ineffective portion of the change in fair value of the derivative is recognized directly in earnings. During the years ended December 31, 2014 and 2013, the Company’s interest rate swap entered into for purposes of managing fluctuations in cash flows resulting from the variable rate term loan was deemed effective. The Company expects it will be effective for the next twelve months. The notional amount of the interest rate swap was $29.5 million and $35.5 million as of December 31, 2014 and December 31, 2013, respectively.
| December 31, 2014 | December 31, 2013 | |||||||||||||||
| Interest Rate Swap Contract |
Fair Value (1) |
Loss(2) | Fair Value (1) |
Gain(2) | ||||||||||||
| Derivative designated as cash flow hedge |
$ | 125 | ($ | 55 | ) | $ | 180 | $ | 180 | |||||||
| (1) | Included in the Consolidated Balance Sheets within Other current assets. |
| (2) | Included in Accumulated other comprehensive income, net is $18 thousand of benefit and $65 thousand of tax as of December 31, 2014 and 2013, respectively. |
| 11. | Non-Current Liabilities |
The components of other non-current liabilities are as follows:
| December 31, 2014 |
December 31, 2013 |
|||||||
| Accrued salaries and employee benefits |
$ | 31,605 | $ | 30,879 | ||||
| Premise related costs |
15,058 | 16,562 | ||||||
| Accrued earnout payments |
7,567 | 11,628 | ||||||
| Other |
517 | 2,260 | ||||||
|
|
|
|
|
|||||
| Total other non-current liabilities |
$ | 54,747 | $ | 61,329 | ||||
|
|
|
|
|
|||||
| 12. | Line of Credit and Term Loan |
On June 22, 2011, the Company and certain foreign subsidiary borrowers of the Company entered into a Credit Agreement (the “Agreement”) with its lenders. The Agreement provides the terms under which the lenders will make available to the Company a committed unsecured revolving credit facility in an aggregate amount of up to $75 million (the “Revolving Facility”). The Agreement includes an expansion feature that allows the Company to seek to increase the aggregate commitment under the Revolving Facility by up to $25 million provided that the Company is in compliance with certain conditions set forth in the Agreement. The Agreement also provides for the issuance of letters of credit. The Revolving Facility matures on June 22, 2016. Under the Agreement, the Borrowers may borrow U.S. dollars, euros, British pound sterling, Australian dollars or other major traded currencies as agreed by the lenders. Borrowings under the Agreement bear interest, at the Company’s election, at the existing Alternate Base Rate (as defined in the Agreement) or Adjusted LIBOR Rate (as defined in the Agreement) plus a spread as determined by the Company’s leverage ratio.
On January 31, 2013, the Company and certain foreign subsidiary borrowers of the Company entered into a Restated Credit Agreement, which amended the Agreement to add a committed term loan facility in an aggregate amount of up to $40 million (the “Term Facility”). There was no other material term change in the Agreement.
On January 31, 2013 the Company borrowed $40 million under the Term Facility. The Term Facility is being repaid over a five-year period pursuant to which the Company will make quarterly payments of $1.5 million through 2016 and quarterly payments of $2.0 million during 2017. The remaining outstanding balance of the Term Facility will be paid on January 31,
46
Table of Contents
2018. The interest rate on the debt is Adjusted LIBOR plus a spread which is dependent on the Company’s leverage ratio. The Company entered into an interest rate swap to address the risk related to the fluctuation in Adjusted LIBOR (See Note 10, Derivative Financial Instruments). As of December 31, 2014 the Company’s interest rate, including the impact of the interest rate swap, was 2.54%.
As of December 31, 2014 and December 31, 2013 there was $29.5 million and $35.5 million, respectively, outstanding under the Term Facility. There were no borrowings made under the Revolving Facility during the years ended December 31, 2014 and 2013. The Company was in compliance with the financial and other covenants under the Restated Credit Agreement and no event of default existed as of December 31, 2014 and December 31, 2013, respectively.
| 13. | Employee Benefit Plans |
Qualified Retirement Plan
The Company has a defined contribution retirement plan (the “Plan”) for all eligible employees in the United States. Eligible employees may begin participating in the Plan upon their hire date. The Plan contains a 401(k) provision, which provides for employee pre-tax and/or after-tax contributions, from 1% to 50% of their eligible compensation up to a combined maximum permitted by law. The Company matched employee contributions on a dollar for dollar basis per participant up to the greater of $5,000, or 5.0%, of eligible compensation for the year ended December 31, 2014. The Company matched employee contributions up to the greater of $5,000, or 4.5%, of eligible compensation for the year ended December 31, 2013, and up to the greater of $4,750, or 4.0%, of eligible compensation for the year ended December 31, 2012. Employees are eligible for the Company match after satisfying a one year service requirement provided that they are working on the last day of the Plan year in which the match is made. The Plan also provides for employees who retire, die or become disabled during the Plan year to receive the Company match for that Plan year. The Plan provides that forfeitures will be used to reduce the Company’s contributions. Forfeitures are created annually by participants who terminate employment before becoming entitled to the Company’s matching contribution under the Plan. The Company also has the option of making discretionary contributions. There were no discretionary contributions made for the years ended December 31, 2014, 2013 and 2012. The expense that the Company incurred for matching employee contributions for the years ended December 31, 2014, 2013 and 2012 was $2.8 million, $2.4 million and $2.5 million, respectively.
The Company maintains additional retirement plans in the Americas, Europe and Asia Pacific regions which the Company does not consider as material, and, therefore additional disclosure has not been presented. The balances associated with these plans have been reported in the Consolidated Statements of Comprehensive Income for the years ended December 31, 2014, 2013 and 2012 and in the Consolidated Balance Sheets as of December 31, 2014 and 2013.
Deferred Compensation Plans
The Company has a deferred compensation plan for certain U.S. employees (the “U.S. Plan”) that became effective on January 1, 2006. The U.S. Plan allows participants to defer up to 25% of their base compensation and up to the lesser of $500,000 or 25% of their eligible bonus compensation into several different investment vehicles. These deferrals are immediately vested and are not subject to a risk of forfeiture. In 2014 and 2013, all deferrals in the U.S. Plan were funded. The compensation deferred in the U.S. Plan was $11.4 million and $11.0 million, at December 31, 2014 and 2013, respectively. The assets of the plan are included in investments and the liabilities of the plan are included in retirement and pension plans in the Consolidated Balance Sheets as of December 31, 2014 and 2013.
The Company has a Non-Employee Directors Voluntary Deferred Compensation Plan whereby non-employee members of the Company’s Board of Directors may elect to defer up to 100% of the cash component of their directors’ fees into several different investment vehicles. As of December 31, 2014 and 2013, the total amounts deferred under the plan were $2.3 million and $2.2 million, respectively, all of which was funded. The assets of the plan are included in investments and the liabilities of the plan are included in retirement and pension plans in the Consolidated Balance Sheets at December 31, 2014 and 2013.
The U.S. and Non-Employee Directors Voluntary Deferred Compensation Plans consist primarily of marketable securities and mutual funds, all of which are valued using Level 1 inputs (See Note 7, Fair Value Measurements).
47
Table of Contents
| 14. | Pension Plan and Life Insurance Contract |
The Company maintains a pension plan for certain current and former employees in Germany. The pensions are individually fixed euro amounts that vary depending on the function and the eligible years of service of the employee.
| 2014 | 2013 | |||||||
| Benefit obligation at January 1, |
$ | 26,398 | $ | 26,486 | ||||
| Service cost |
— | 173 | ||||||
| Interest cost |
799 | 820 | ||||||
| Actuarial loss (gain) |
4,794 | (928 | ) | |||||
| Benefits paid |
(1,502 | ) | (1,218 | ) | ||||
| Cumulative translation adjustment |
(3,504 | ) | 1,065 | |||||
|
|
|
|
|
|||||
| Benefit obligation at December 31, |
$ | 26,985 | $ | 26,398 | ||||
|
|
|
|
|
|||||
The benefit obligation amounts recognized in the Consolidated Balance Sheets are as follows:
| December 31, | ||||||||
| 2014 | 2013 | |||||||
| Current liabilities |
$ | 1,457 | $ | 1,627 | ||||
| Noncurrent liabilities |
25,528 | 24,771 | ||||||
|
|
|
|
|
|||||
| Total |
$ | 26,985 | $ | 26,398 | ||||
|
|
|
|
|
|||||
The accumulated benefit obligation amounts at December 31, 2014 and 2013 are $27.0 million and $26.4 million, respectively.
The components of and assumptions used to determine the net periodic benefit cost are as follows:
| December 31, | ||||||||||||
| 2014 | 2013 | 2012 | ||||||||||
| Net period benefit cost: |
||||||||||||
| Service cost |
$ | — | $ | 173 | $ | 147 | ||||||
| Interest cost |
799 | 820 | 1,042 | |||||||||
| Amortization of net gain |
— | — | (47 | ) | ||||||||
|
|
|
|
|
|
|
|||||||
| Net periodic benefit cost |
$ | 799 | $ | 993 | $ | 1,142 | ||||||
|
|
|
|
|
|
|
|||||||
| Weighted average assumptions |
||||||||||||
| Discount rate (1) |
3.25 | % | 3.15 | % | 4.65 | % | ||||||
| Rate of compensation increase |
1.75 | % | 1.75 | % | 1.75 | % | ||||||
Assumptions to determine the Company’s benefit obligation are as follows:
| December 31, | ||||||||||||
| 2014 | 2013 | 2012 | ||||||||||
| Discount rate (1) |
1.82 | % | 3.25 | % | 3.15 | % | ||||||
| Rate of compensation increase |
1.75 | % | 1.75 | % | 1.75 | % | ||||||
| Measurement Date |
12/31/2014 | 12/31/2013 | 12/31/2012 | |||||||||
| (1) | The discount rates are based on long-term bond indices adjusted to reflect the longer duration of the benefit obligation. |
The amounts in accumulated other comprehensive income as of December 31, 2014 and 2013 that had not yet been recognized as components of net periodic benefit cost were $4.0 million and $0.4 million, respectively. As of December 31, 2014, $0.1 million of the accumulated other comprehensive income is expected to be recognized as a component of net periodic benefit cost in 2015.
The Company’s investment strategy is to support its pension obligations through reinsurance contracts. The BaFin—German Federal Financial Supervisory Authority—supervises the insurance companies and the reinsurance contracts. The BaFin requires each reinsurance contract to guarantee a fixed minimum return. The Company’s pension benefits are fully reinsured by group insurance contracts with ERGO Lebensversicherung AG, and the group insurance contracts are measured in accordance with BaFin guidelines (including mortality tables and discount rates) which are considered Level 2 inputs (See Note 7, Fair Value Measurements). The fair value at December 31, 2014 and 2013 was $20.9 million and $24.3 million, respectively. The expected contribution to be paid into the plan in 2015 is $1.5 million.
48
Table of Contents
Since the pension assets are not segregated in trust from the Company’s other assets, the pension assets are not shown as an offset against the pension liabilities in the Consolidated Balance Sheets. These assets are included in the Consolidated Balance Sheets at December 31, 2014 and 2013, as a component of other current assets and assets designated for retirement and pension plans.
The benefits expected to be paid in each of the next five years, and in the aggregate for the five years thereafter are as follows:
| Year ending December 31, |
||||
| 2015 |
$ | 1,457 | ||
| 2016 |
1,458 | |||
| 2017 |
1,457 | |||
| 2018 |
1,453 | |||
| 2019 |
1,447 | |||
| 2020 through 2024 |
7,028 |
| 15. | Stock-Based Compensation |
GlobalShare Program
The Company’s 2007 Heidrick & Struggles GlobalShare Program (the “Prior Program”) provided for grants of stock options, stock appreciation rights, and other stock-based awards to directors, selected employees, and independent contractors. The Prior Program expired on May 24, 2012. Outstanding awards granted under the Prior Program remain outstanding and subject to the terms of the Prior Program and award agreements until such awards vest, are exercised, terminate or expire pursuant to their terms. As of December 31, 2014, there were 103,014 awards outstanding under the Prior Program, consisting of 8,877 stock options, 77,770 restricted stock units, and 16,367 performance stock units.
On May 24, 2012, the stockholders of the Company approved the 2012 Heidrick & Struggles GlobalShare Program (the “2012 Program”) at the Company’s Annual Meeting of Stockholders. The 2012 Program provides for grants of stock options, stock appreciation rights, and other stock-based awards that are valued based upon the grant date fair value of shares. These awards may be granted to directors, selected employees and independent contractors.
The total number of shares authorized or reserved for issuance under the 2012 Program is 1,300,000 shares (consisting of a number of shares not previously authorized for issuance under any plan, and the number of shares not subject to awards and remaining available for issuance under the Prior Program, as amended on April 2, 2012), plus any shares subject to the 671,528 outstanding awards as of April 2, 2012 under the Prior Program that on or after the effective date cease for any reason to be subject to such awards. Stock awards forfeited or cancelled under the Prior Program and the 2012 Program are eligible for reissuance under the 2012 Program.
On May 22, 2014, the stockholders of the Company approved an amendment to the 2012 Program to increase the number of shares of Common Stock reserved for issuance under the 2012 Program by 700,000 shares. As of December 31, 2014, 772,665 awards have been issued under the 2012 Program and 1,573,375 shares remain available for future awards, which includes 346,040 forfeited awards. The 2012 Program provides that no awards can be granted after May 24, 2022.
The Company measures its stock-based compensation costs based on the grant date fair value of the awards and recognizes these costs in the financial statements over the requisite service period.
A summary of information with respect to stock-based compensation is as follows:
| December 31, | ||||||||||||
| 2014 | 2013 | 2012 | ||||||||||
| Salaries and employee benefits |
$ | 3,128 | $ | 3,447 | $ | 3,749 | ||||||
| General and administrative expenses |
451 | 300 | 450 | |||||||||
| Income tax benefit related to stock-based compensation included in net income |
1,444 | 1,468 | 1,705 | |||||||||
Restricted Stock Units
Restricted stock units are generally subject to ratable vesting over a three year period. Compensation expense related to service-based restricted stock units is recognized on a straight-line basis over the vesting period. For awards requiring satisfaction of service and performance conditions, compensation expense is recognized using a graded vesting attribution method.
49
Table of Contents
Restricted stock unit activity as of December 31, 2014, 2013 and 2012:
| Number of Restricted Stock Units |
Weighted- Average Grant-date Fair Value |
|||||||
| Outstanding on December 31, 2011 |
489,720 | $ | 23.99 | |||||
| Granted |
123,951 | 19.84 | ||||||
| Vested and converted to common stock |
(211,616 | ) | 22.35 | |||||
| Forfeited |
(40,277 | ) | 24.85 | |||||
|
|
|
|||||||
| Outstanding on December 31, 2012 |
361,778 | 23.43 | ||||||
| Granted |
174,508 | 14.01 | ||||||
| Vested and converted to common stock |
(167,955 | ) | 24.70 | |||||
| Forfeited |
(97,876 | ) | 17.69 | |||||
|
|
|
|||||||
| Outstanding on December 31, 2013 |
270,455 | 18.64 | ||||||
| Granted |
295,733 | 18.02 | ||||||
| Vested and converted to common stock |
(93,159 | ) | 19.65 | |||||
| Forfeited |
(10,312 | ) | 17.45 | |||||
|
|
|
|||||||
| Outstanding on December 31, 2014 |
462,717 | 18.07 | ||||||
|
|
|
|||||||
As of December 31, 2014, there was $3.3 million of pre-tax unrecognized compensation expense related to unvested restricted stock units, which is expected to be recognized over a weighted average of 2.8 years.
Performance Stock Units
The Company grants performance stock units to certain of its senior executives. The performance stock units are generally subject to a cliff vesting at the end of a three year period. The vesting will vary between 0% - 200% based on the attainment of operating income goals over the 3 year vesting period. The performance stock units are expensed on a straight-line basis over the 3 year vesting period.
In 2014, the Company granted market-based performance stock units to the Chief Executive Officer as part of his initial compensation package. The market-based awards vest after a two-year service period and if the price of the Company’s common stock exceeds specified targets. The fair value of the market-based awards was determined using the Monte-Carlo simulation model. A Monte Carlo simulation model uses stock price volatility and other variables to estimate the probability of satisfying the market conditions and the resulting fair value of the award. Compensation costs related to the market-based awards are recognized regardless of whether the market condition is satisfied, as long as the requisite service has been provided.
Performance share unit activity as of December 31, 2014, 2013 and 2012:
| Number of Restricted Stock Units |
Weighted Average Grant-date Fair Value |
|||||||
| Outstanding on December 31, 2011 |
140,230 | $ | 23.67 | |||||
| Granted |
50,315 | 20.62 | ||||||
| Vested and converted to common stock |
(58,487 | ) | 18.07 | |||||
| Forfeited |
(52,058 | ) | 26.89 | |||||
|
|
|
|||||||
| Outstanding on December 31, 2012 |
80,000 | 23.75 | ||||||
| Granted |
63,895 | 13.89 | ||||||
| Vested and converted to common stock |
— | — | ||||||
| Forfeited |
(82,574 | ) | 19.07 | |||||
|
|
|
|||||||
| Outstanding on December 31, 2013 |
61,321 | 19.77 | ||||||
| Granted |
186,705 | 17.19 | ||||||
| Vested and converted to common stock |
(9,429 | ) | 27.18 | |||||
| Forfeited |
(9,427 | ) | 27.18 | |||||
|
|
|
|||||||
| Outstanding on December 31, 2014 |
229,170 | 17.06 | ||||||
|
|
|
|||||||
As of December 31, 2014, there was $1.9 million of pre-tax unrecognized compensation expense related to unvested performance stock units, which is expected to be recognized over a weighted average of 1.7 years.
50
Table of Contents
| 16. | Changes in Accumulated Other Comprehensive Income |
The changes in Accumulated other comprehensive income (“AOCI”) by component for the year ended December 31, 2014 is summarized below:
| Cash Flow Hedge |
Available- for- Sale Securities |
Foreign Currency Translation |
Pension | AOCI | ||||||||||||||||
| Balance at December 31, 2013 |
$ | 115 | $ | 2,921 | $ | 11,607 | $ | 326 | $ | 14,969 | ||||||||||
| Other comprehensive income (loss) before reclassification, net of tax |
(170 | ) | 596 | (1,235 | ) | (2,736 | ) | (3,545 | ) | |||||||||||
| Amount reclassified from AOCI (1) |
133 | (334 | ) | — | — | (201 | ) | |||||||||||||
|
|
|
|
|
|
|
|
|
|
|
|||||||||||
| Net current period other comprehensive income (loss) |
(37 | ) | 262 | (1,235 | ) | (2,736 | ) | (3,746 | ) | |||||||||||
|
|
|
|
|
|
|
|
|
|
|
|||||||||||
| Balance at December 31, 2014 |
$ | 78 | $ | 3,183 | $ | 10,372 | $ | (2,410 | ) | $ | 11,223 | |||||||||
|
|
|
|
|
|
|
|
|
|
|
|||||||||||
| (1) | Cash Flow Hedge and Available-for-Sale Securities reclassifications from AOCI are included in Interest, net and Other, net, respectively, in the Consolidated Statement of Comprehensive Income. |
| 17. | Income Taxes |
The sources of income before income taxes are as follows:
| December 31, | ||||||||||||
| 2014 | 2013 | 2012 | ||||||||||
| United States |
$ | 25,956 | $ | 29,334 | $ | 32,030 | ||||||
| Foreign |
(1,769 | ) | (15,946 | ) | (11,768 | ) | ||||||
|
|
|
|
|
|
|
|||||||
| Income before income taxes |
$ | 24,187 | $ | 13,388 | $ | 20,262 | ||||||
|
|
|
|
|
|
|
|||||||
The provision for (benefit from) income taxes are as follows:
| December 31, | ||||||||||||
| 2014 | 2013 | 2012 | ||||||||||
| Current |
||||||||||||
| Federal |
$ | 10,997 | $ | 6,954 | $ | 4,287 | ||||||
| State and local |
3,141 | 2,575 | 2,392 | |||||||||
| Foreign |
2,537 | 1,430 | 5,278 | |||||||||
|
|
|
|
|
|
|
|||||||
| Current provision for income taxes |
16,675 | 10,959 | 11,957 | |||||||||
| Deferred |
||||||||||||
| Federal |
($ | 2,845 | ) | $ | 1,026 | $ | 7,300 | |||||
| State and local |
(242 | ) | (16 | ) | 206 | |||||||
| Foreign |
3,802 | (4,928 | ) | (5,441 | ) | |||||||
|
|
|
|
|
|
|
|||||||
| Deferred provision (benefit) for income taxes |
715 | (3,918 | ) | 2,065 | ||||||||
|
|
|
|
|
|
|
|||||||
| Total provision for income taxes |
$ | 17,390 | $ | 7,041 | $ | 14,022 | ||||||
|
|
|
|
|
|
|
|||||||
51
Table of Contents
A reconciliation of the provision for income taxes to income taxes at the statutory U.S. federal income tax rate of 35% is as follows:
| December 31, | ||||||||||||
| 2014 | 2013 | 2012 | ||||||||||
| Income tax provision at the statutory U.S. federal rate |
$ | 8,466 | $ | 4,686 | $ | 7,092 | ||||||
| State income tax provision, net of federal tax benefit |
1,423 | 1,618 | 1,930 | |||||||||
| Nondeductible expenses |
1,747 | (109 | ) | 1,600 | ||||||||
| Foreign tax rates differential (includes changes in foreign valuation allowance) |
1,396 | 2,816 | 4,032 | |||||||||
| Establishment (release) of valuation allowance |
4,708 | (1,615 | ) | (3,119 | ) | |||||||
| U.S. tax on foreign dividends |
722 | 1,838 | 1,215 | |||||||||
| Current/deferred true-up |
(1,499 | ) | (1,786 | ) | 2,040 | |||||||
| Other, net |
427 | (407 | ) | (768 | ) | |||||||
|
|
|
|
|
|
|
|||||||
| Total provision for income taxes |
$ | 17,390 | $ | 7,041 | $ | 14,022 | ||||||
|
|
|
|
|
|
|
|||||||
The deferred tax assets and liabilities are attributable to the following components:
| December 31, | ||||||||
| 2014 | 2013 | |||||||
| Deferred tax assets attributable to: |
||||||||
| Foreign net operating loss carryforwards |
$ | 29,030 | $ | 32,018 | ||||
| Accrued compensation & employee benefits |
19,178 | 13,741 | ||||||
| Deferred compensation |
15,356 | 15,003 | ||||||
| Foreign tax credit carryforwards |
15,213 | 14,504 | ||||||
| Accrued rent |
4,180 | 4,569 | ||||||
| Other accrued expenses |
2,260 | 4,967 | ||||||
|
|
|
|
|
|||||
| Deferred tax assets, before valuation allowance |
85,217 | 84,802 | ||||||
|
|
|
|
|
|||||
| Valuation allowance |
(28,738 | ) | (29,423 | ) | ||||
|
|
|
|
|
|||||
| Deferred tax assets, after valuation allowance |
56,479 | 55,379 | ||||||
| Deferred tax liabilities attributable to: |
||||||||
| Goodwill |
14,973 | 13,616 | ||||||
| Taxes provided on unremitted earnings |
3,431 | 2,836 | ||||||
| Depreciation on property and equipment |
2,563 | 3,166 | ||||||
| Other |
87 | 513 | ||||||
|
|
|
|
|
|||||
| Deferred tax liabilities |
21,054 | 20,131 | ||||||
|
|
|
|
|
|||||
| Net deferred tax assets |
$ | 35,425 | $ | 35,248 | ||||
|
|
|
|
|
|||||
The recognition of deferred tax assets is based on management’s belief that it is more likely than not that the tax benefits associated with temporary differences, net operating loss carryforwards and tax credits will be utilized. The Company assesses the recoverability of the deferred tax assets on an ongoing basis. In making this assessment, the Company considers all positive and negative evidence, and all potential sources of taxable income including scheduled reversals of deferred tax liabilities, tax-planning strategies, projected future taxable income and recent financial performance.
The valuation allowance decreased from $29.4 million at December 31, 2013 to $28.7 million at December 31, 2014. The valuation allowance at December 31, 2014 was related to foreign net operating loss carryforwards and certain foreign deferred tax assets. The Company intends to maintain these valuation allowances until sufficient evidence exists to support their reversal.
At December 31, 2014, the Company had a net operating loss carryforward of $105.5 million related to its foreign filings and $0.5 million related to its U.S. state tax filings. Of the $105.5 million net operating loss carryforward, $82.8 million is subject to a valuation allowance. Depending on the tax rules of the tax jurisdictions, the losses can be carried forward indefinitely or for periods ranging from five to twenty years. The Company also had a foreign tax credit carryforward of $15.2 million, expiring in 2017 through 2024.
As of December 31, 2014, the Company had unremitted earnings held in its foreign subsidiaries of approximately $67.7 million, of which the company has provided $3.4 million of tax on $15.2 million of earnings that are intended to be remitted. The Company did not recognize a deferred tax liability for U.S. income taxes and foreign withholding taxes related to the unremitted earnings of its foreign operations because the Company intends to reinvest those earnings indefinitely. If a distribution of these earnings were to be made, the Company might be subject to both foreign withholding taxes and U.S. income taxes, net of any allowable foreign tax credits or deductions. An estimate of these taxes; however, is not practicable. A deferred tax liability will be recognized if and when the Company is no longer able to demonstrate that it plans to permanently reinvest unremitted earnings.
52
Table of Contents
As of January 1, 2014, the Company had $0.4 million of unrecognized tax benefits. As of December 31, 2014 the Company had $0.1 million of unrecognized tax benefits of which, if recognized, it would be fully offset by a federal tax benefit, as a component of income tax expense.
A reconciliation of the beginning and ending balances of the total amounts of gross unrecognized tax benefits is as follows:
| December 31, | ||||||||||||
| 2014 | 2013 | 2012 | ||||||||||
| Gross unrecognized tax benefits at January 1, |
$ | 362 | $ | 534 | $ | 432 | ||||||
| Gross increases for tax positions of prior years |
151 | — | 689 | |||||||||
| Gross decreases for tax positions of prior years |
(191 | ) | — | — | ||||||||
| Settlements |
(143 | ) | (7 | ) | (494 | ) | ||||||
| Lapse of statute of limitations |
(36 | ) | (165 | ) | (93 | ) | ||||||
|
|
|
|
|
|
|
|||||||
| Gross unrecognized tax benefits at December 31, |
$ | 143 | $ | 362 | $ | 534 | ||||||
|
|
|
|
|
|
|
|||||||
In many cases the Company’s uncertain tax positions are related to tax years that remain subject to examination by the relevant taxable authorities. Years 2009 through 2013 are subject to examination by the state taxing authorities. The year 2013 is subject to examination by the federal taxing authority. There are certain foreign jurisdictions that are subject to examination for years prior to 2009.
The Company is currently under audit by some foreign jurisdictions. It is likely that the examination phase of several of these audits will conclude in the next 12 months. No significant increases or decreases in unrecognized tax benefits are expected to occur by December 31, 2015.
Estimated interest and penalties related to the underpayment of income taxes are classified as a component of the provision for income taxes in the Consolidated Statements of Comprehensive Income. Accrued interest and penalties are $0.1 million as of December 31, 2014.
| 18. | Segment Information |
The Company operates its executive search and leadership consulting services in the Americas; Europe (which includes Africa); and Asia Pacific (which includes the Middle East) and operates its culture shaping business as a separate segment.
For segment purposes, reimbursements of out-of-pocket expenses classified as revenue and other operating income are reported separately and, therefore, are not included in the results of each segment. The Company believes that analyzing trends in revenue before reimbursements (net revenue), analyzing operating expenses as a percentage of net revenue, and analyzing operating income (loss) more appropriately reflects its core operations.
During 2014, consistent with the Company’s practice to periodically review its reporting structure and segments, the Company evaluated its allocation of corporate and support costs to each of its regions. In conjunction with that review, to better align the Company’s cost and reporting structure, additional costs were allocated to the regions reflecting management’s current view of the costs necessary to support the regional operations. The prior period results have been recast to reflect these changes and present comparative year-over-year results.
53
Table of Contents
The revenue, operating income, depreciation and amortization, and capital expenditures, by segment, are as follows:
| December 31, | ||||||||||||
| 2014 | 2013 | 2012 | ||||||||||
| Revenue: |
||||||||||||
| Executive Search and Leadership Consulting |
||||||||||||
| Americas |
$ | 260,830 | $ | 256,706 | $ | 254,395 | ||||||
| Europe |
108,979 | 90,081 | 99,004 | |||||||||
| Asia Pacific |
89,732 | 90,418 | 90,378 | |||||||||
|
|
|
|
|
|
|
|||||||
| Total Executive Search and Leadership Consulting |
459,541 | 437,205 | 443,777 | |||||||||
| Culture Shaping |
34,751 | 24,790 | — | |||||||||
|
|
|
|
|
|
|
|||||||
| Revenue before reimbursements (net revenue) |
494,292 | 461,995 | 443,777 | |||||||||
| Reimbursements |
18,947 | 18,998 | 21,304 | |||||||||
|
|
|
|
|
|
|
|||||||
| Total |
$ | 513,239 | $ | 480,993 | $ | 465,081 | ||||||
|
|
|
|
|
|
|
|||||||
| Operating income (loss): |
||||||||||||
| Executive Search and Leadership Consulting |
||||||||||||
| Americas |
$ | 57,682 | $ | 60,171 | $ | 53,172 | ||||||
| Europe |
4,806 | (6,513 | ) | 3,228 | ||||||||
| Asia Pacific |
4,886 | 3,678 | 2,082 | |||||||||
|
|
|
|
|
|
|
|||||||
| Total Executive Search and Leadership Consulting |
67,374 | 57,336 | 58,482 | |||||||||
| Culture Shaping |
4,621 | (4,215 | ) | — | ||||||||
|
|
|
|
|
|
|
|||||||
| Total segments |
71,995 | 53,121 | 58,482 | |||||||||
| Global Operations Support |
(45,342 | ) | (37,556 | ) | (38,033 | ) | ||||||
|
|
|
|
|
|
|
|||||||
| Operating income before restructuring charges |
26,653 | 15,565 | 20,449 | |||||||||
| Restructuring charges |
— | — | (810 | ) | ||||||||
|
|
|
|
|
|
|
|||||||
| Total |
$ | 26,653 | $ | 15,565 | $ | 19,639 | ||||||
|
|
|
|
|
|
|
|||||||
| Depreciation and amortization: |
||||||||||||
| Executive Search and Leadership Consulting |
||||||||||||
| Americas |
$ | 2,942 | $ | 3,672 | $ | 4,192 | ||||||
| Europe |
3,279 | 2,853 | 2,751 | |||||||||
| Asia Pacific |
1,856 | 2,281 | 2,555 | |||||||||
|
|
|
|
|
|
|
|||||||
| Total Executive Search and Leadership Consulting |
8,077 | 8,806 | 9,498 | |||||||||
| Culture Shaping |
5,325 | 5,738 | — | |||||||||
|
|
|
|
|
|
|
|||||||
| Total segments |
13,402 | 14,544 | 9,498 | |||||||||
| Global Operations Support |
1,910 | 1,731 | 1,303 | |||||||||
|
|
|
|
|
|
|
|||||||
| Total |
$ | 15,312 | $ | 16,275 | $ | 10,801 | ||||||
|
|
|
|
|
|
|
|||||||
| Capital expenditures: |
||||||||||||
| Executive Search and Leadership Consulting |
||||||||||||
| Americas |
$ | 2,858 | $ | 1,411 | $ | 2,770 | ||||||
| Europe |
478 | 822 | 1,441 | |||||||||
| Asia Pacific |
512 | 1,053 | 2,550 | |||||||||
|
|
|
|
|
|
|
|||||||
| Total Executive Search and Leadership Consulting |
3,848 | 3,286 | 6,761 | |||||||||
| Culture Shaping |
53 | 13 | — | |||||||||
|
|
|
|
|
|
|
|||||||
| Total segments |
3,901 | 3,286 | 6,761 | |||||||||
| Global Operations Support |
1,934 | 445 | 743 | |||||||||
|
|
|
|
|
|
|
|||||||
| Total |
$ | 5,835 | $ | 3,731 | $ | 7,504 | ||||||
|
|
|
|
|
|
|
|||||||
54
Table of Contents
Identifiable assets, and goodwill and other intangible assets, net, by segment, are as follows:
| December 31, | ||||||||
| 2014 | 2013 | |||||||
| Current assets: |
||||||||
| Executive Search and Leadership Consulting |
||||||||
| Americas |
$ | 196,030 | $ | 163,185 | ||||
| Europe |
49,185 | 50,000 | ||||||
| Asia Pacific |
52,566 | 56,916 | ||||||
|
|
|
|
|
|||||
| Total Executive Search and Leadership Consulting |
297,781 | 270,101 | ||||||
| Culture Shaping |
32,157 | 20,232 | ||||||
|
|
|
|
|
|||||
| Total segments |
329,938 | 290,333 | ||||||
| Global Operations Support |
391 | 442 | ||||||
|
|
|
|
|
|||||
| Total allocated current assets |
330,329 | 290,775 | ||||||
| Unallocated non-current assets: |
95,257 | 112,538 | ||||||
| Goodwill and other intangible assets, net: |
||||||||
| Executive Search and Leadership Consulting |
||||||||
| Americas |
83,314 | 83,980 | ||||||
| Asia Pacific |
10,638 | 11,445 | ||||||
|
|
|
|
|
|||||
| Total Executive Search and Leadership Consulting |
93,952 | 95,425 | ||||||
| Culture Shaping |
49,163 | 54,486 | ||||||
|
|
|
|
|
|||||
| Total goodwill and other intangible assets, net |
143,115 | 149,911 | ||||||
|
|
|
|
|
|||||
| Total assets: |
$ | 568,701 | $ | 553,224 | ||||
|
|
|
|
|
|||||
| 19. | Guarantees |
The Company has issued cash collateralized bank guarantees and letter of credit backed bank guarantees supporting certain obligations, primarily the payment of office lease obligations and business license requirements for certain of its subsidiaries in Europe and Asia Pacific. The bank guarantees were made to secure the respective agreements and are for the terms of the agreements, which extend through 2018. For each bank guarantee issued, the Company would have to perform under the guarantee if the subsidiary defaults on a lease payment. The maximum amount of undiscounted payments the Company would be required to make in the event of default on all outstanding bank guarantees is approximately $2.0 million as of December 31, 2014. The Company has not accrued for these arrangements as no event of default exists or is expected to exist.
| 20. | Commitments and Contingencies |
Operating Leases
The Company leases office space in 49 cities in 26 countries. The terms of these office-related leases provide that the Company pay base rent and a share of operating expenses and real estate taxes in excess of defined amounts. These leases expire at various dates through 2026. The Company also leases certain computer equipment and cars, the terms of which are accounted for as operating leases. Rent expense, which includes the base rent, operating expenses and real estate taxes, and the costs of equipment leases for the years ended December 31, 2014, 2013 and 2012 was $24.1 million, $27.1 million, and $28.1 million, respectively. The Company broadened the definition of rent expense in 2013 to also include maintenance costs. Under the broader definition, total expense was $32.3 million, $32.4 million, and $32.1 million in the years ended December 31, 2014, 2013 and 2012, respectively.
Minimum future office space and equipment lease payments due in each of the next five years and thereafter are as follows:
| Office Leases |
Equipment Leases |
Total | ||||||||||
| Year ending December 31, |
||||||||||||
| 2015 |
26,789 | 704 | 27,493 | |||||||||
| 2016 |
24,494 | 444 | 24,938 | |||||||||
| 2017 |
18,684 | 161 | 18,845 | |||||||||
| 2018 |
17,239 | 63 | 17,302 | |||||||||
| 2019 |
15,072 | 24 | 15,096 | |||||||||
| Thereafter |
62,576 | 3 | 62,579 | |||||||||
|
|
|
|
|
|
|
|||||||
| Total |
164,854 | 1,399 | 166,253 | |||||||||
|
|
|
|
|
|
|
|||||||
55
Table of Contents
The aggregate minimum future payments on office leases are $164.9 million. The Company has contractual arrangements to receive aggregate sublease income of $1.7 million related to certain leases that expire at various dates through 2016. This sublease income primarily relates to properties that were part of prior office consolidations and closings.
Certain leases provide for renewal options and payments of real estate taxes and other occupancy costs. In addition, certain leases contain rent escalation clauses that require additional rental amounts in later years of the term. Rent expense for leases with rent escalation clauses is recognized on a straight-line basis over the minimum lease term.
The Company has an obligation at the end of the lease term to return the office to the landlord in its original condition, which is recorded at fair value at the time the liability is incurred. The Company had $1.9 million and $1.7 million of asset retirement obligations as of December 31, 2014 and 2013, respectively.
Litigation
The Company has contingent liabilities from various pending claims and litigation matters arising in the ordinary course of the Company’s business, some of which involve claims for damages that are substantial in amount. Some of these matters are covered by insurance. Based upon information currently available, the Company believes the ultimate resolution of such claims and litigation, including the “UK Employee Benefits Trust” matter discussed below, will not have a material adverse effect on its financial condition, results of operations or liquidity.
UK Employee Benefits Trust
On January 27, 2010, HM Revenue & Customs (“HMRC”) in the United Kingdom notified the Company that it was challenging the tax treatment of certain of the Company’s contributions in the United Kingdom to an Employee Benefits Trust between 2002 and 2008. HMRC alleges that these contributions should have been subject to Pay As You Earn tax and Class 1 National Insurance Contributions in the United Kingdom; and HMRC is proposing an adjustment to the Company’s payroll tax liability for the affected years. The aggregate amount of HMRC’s proposed adjustment is approximately £3.9 million (equivalent to $6.1 million at December 31, 2014). The Company has appealed the proposed adjustment. At this time, the Company believes that the likelihood of an unfavorable outcome with respect to the proposed adjustment is not probable and the potential amount of any loss cannot be reasonably estimated. The Company also believes that the amount of any final adjustment would not be material to the Company’s financial condition.
56
Table of Contents
PART II (continued)
| ITEM 9. | CHANGES IN AND DISAGREEMENTS WITH ACCOUNTANTS ON ACCOUNTING AND FINANCIAL DISCLOSURE |
Not applicable.
| ITEM 9A. | CONTROLS AND PROCEDURES |
(a) Evaluation of Disclosure Controls and Procedures
The Company maintains disclosure controls and procedures as defined in Securities Exchange Act of 1934, as amended, (the “Exchange Act”) Rules 13a-15(e) and 15d-15(e), that are designed to ensure that information required to be disclosed in the Company’s reports filed or submitted under the Exchange Act is recorded, processed, summarized and reported within the time periods specified in the Securities and Exchange Commission (the “SEC”) rules and forms, and that such information is accumulated and communicated to the Company’s management, including its principal executive officer and principal financial officer, as appropriate, to allow timely decisions regarding required disclosure. Any system of controls and procedures, no matter how well designed and operated, can provide only reasonable assurance of achieving the desired control objectives.
Management of the Company, with the participation of the principal executive officer and the principal financial officer, evaluated the effectiveness of the design and operation of the Company’s disclosure controls and procedures as of December 31, 2014. Based on the evaluation, the Company’s principal executive officer and principal financial officer concluded that the Company’s disclosure controls and procedures were effective as of December 31, 2014.
(b) Management’s report on internal control over financial reporting
Management is responsible for establishing and maintaining adequate internal control over financial reporting, as defined in Securities Exchange Act Rules 13a-15(f) and 15d-15(f). The Company’s internal control over financial reporting is a process designed by, or under the supervision of, the Company’s principal executive and principal financial officers, or persons performing similar functions, and effected by the Company’s board of directors, management, and other personnel, to provide reasonable assurance regarding the reliability of financial reporting and the preparation of financial statements for external purposes in accordance with U.S. generally accepted accounting principles (U.S. GAAP) and includes those policies and procedures that:
| (1) | Pertain to the maintenance of records that, in reasonable detail, accurately and fairly reflect the transactions and dispositions of the assets of the Company; |
| (2) | Provide reasonable assurance that transactions are recorded as necessary to permit preparation of financial statements in accordance with U.S. GAAP, and that receipts and expenditures of the Company are being made only in accordance with authorizations of management and directors of the Company; and |
| (3) | Provide reasonable assurance regarding prevention or timely detection of unauthorized acquisition, use, or disposition of the Company’s assets that could have a material effect on the financial statements. |
Because of its inherent limitations, internal control over financial reporting may not prevent or detect misstatements. Also, projections of any evaluation of effectiveness to future periods are subject to the risk that controls may become inadequate because of changes in conditions, or that the degree of compliance with the policies and procedures may deteriorate.
Management conducted an evaluation of the effectiveness of the system of internal control over financial reporting based on the framework in Internal Control—Integrated Framework issued by the Committee of Sponsoring Organizations of the Treadway Commission 2013. Based on this evaluation, management concluded that the Company’s system of internal control over financial reporting was effective as of December 31, 2014.
The Company’s independent registered public accounting firm, KPMG LLP, has issued a report on the Company’s internal control over financial reporting. The report on the audit of internal control over financial reporting appears in this Form 10-K.
(c) Changes in Internal Control over Financial Reporting
There have been no changes in our internal control over financial reporting that occurred during the period covered by this Annual Report on Form 10-K as of December 31, 2014, that have materially affected, or is reasonably likely to materially affect, our internal control over financial reporting.
| ITEM 9B. | OTHER INFORMATION |
None.
57
Table of Contents
| ITEM 10. | DIRECTORS, EXECUTIVE OFFICERS AND CORPORATE GOVERNANCE |
Information relating to our executive officers is included in the Section entitled “Executive Officers” in Part I of this Form 10-K. Information relating to our directors, including our audit committee and audit committee financial experts and the procedures by which shareholders can recommend director nominees, and our executive officers will be in our definitive Proxy Statement for our 2015 Annual Meeting of Shareholders, which will be filed within 120 days of the end of 2014 (2015 Proxy Statement) and is incorporated herein by reference. Information relating to our Code of Business Conduct and Ethics, which applies to our senior financial officers, is included under “Available Information” in Part I, Item 1 of this Form 10-K.
| ITEM 11. | EXECUTIVE COMPENSATION |
Information relating to our executive officer and director compensation and the compensation committee of the Board will be in the 2015 Proxy Statement and is incorporated herein by reference.
| ITEM 12. | SECURITY OWNERSHIP OF CERTAIN BENEFICIAL OWNERS AND MANAGEMENT AND RELATED STOCKHOLDER MATTERS |
Information relating to security ownership of certain beneficial owners of our common stock and information relating to the security ownership of our management will be in the 2015 Proxy Statement and is incorporated herein by reference.
Equity Compensation Plan Information
The following table sets forth additional information as of December 31, 2014, about shares of our common stock that may be issued upon the vesting of restricted stock units and performance stock units and the exercise of options under our existing equity compensation plans and arrangements, divided between plans approved by our stockholders and plans or arrangements not submitted to the stockholders for approval. For a description of the types of securities that may be issued under our 2012 Heidrick & Struggles GlobalShare Program (See Note 15, Stock-Based Compensation).
| (a) | (b) | (c) | ||||||||||
| Plan Category |
Number of securities to be issued upon exercise of outstanding options |
Weighted- average exercise price of outstanding options |
Number of securities remaining available for future issuance under equity compensation plans (excluding securities reflected in column (a)) |
|||||||||
| Equity compensation plans approved by stockholders |
700,764 | (1) | $ | 33.79 | 1,573,375 | |||||||
| Equity compensation plans not approved stockholders |
— | — | — | |||||||||
|
|
|
|
|
|
|
|||||||
| Total equity compensation plans |
700,764 | $ | 33.79 | 1,573,375 | ||||||||
|
|
|
|
|
|
|
|||||||
| (1) | Includes 462,717 restricted stock units, 229,170 performance stock units at their target levels and 8,877 options. |
| ITEM 13. | CERTAIN RELATIONSHIPS AND RELATED TRANSACTIONS, AND DIRECTOR INDEPENDENCE |
Information regarding certain relationships and related transactions and director independence will be in the 2015 Proxy Statement and is incorporated herein by reference.
| ITEM 14. | PRINCIPAL ACCOUNTANT FEES AND SERVICES |
The information required by this Item is incorporated by reference to the discussion under the caption “Audit Fees” in our 2015 Proxy Statement.
58
Table of Contents
| ITEM 15. | EXHIBITS, FINANCIAL STATEMENT SCHEDULES |
| (a) | THE FOLLOWING DOCUMENTS ARE FILED AS PART OF THIS REPORT: |
| 1. | Index to Consolidated Financial Statements: |
See Consolidated Financial Statements included as part of this Form 10-K beginning on page 35.
| 2. | Exhibits: |
| Exhibit No. |
Description | |
| 3.01 | Amended and Restated Certificate of Incorporation of the Registrant (Incorporated by reference to Exhibit 3.02 of this Registrant’s Registration Statement on Form S-4 (File No. 333-61023)) | |
| 3.02 | Amended and Restated By-laws of the Registrant (Incorporated by reference to Exhibit 3.02 of the Registrant’s Form 10-K filed March 26, 2003) | |
| 4.01 | Specimen Stock Certificate (Incorporated by reference to Exhibit 4.01 of this Registrant’s Registration Statement on Form S-4 (File No. 333-61023)) | |
| 10.01 | Credit Agreement among Heidrick & Struggles International, Inc., certain foreign subsidiary borrowers thereto, the lenders party thereto and JPMorgan Chase Bank, as Administrative Agent, dated June, 2011 (Incorporated by reference to Exhibit 10.1 of the Registrant’s Form 8-K, dated June 22, 2011, filed on June 27, 2011) | |
| 10.02 | Amendment and Restatement Agreement among Heidrick & Struggles International, Inc., certain foreign subsidiary borrowers thereto, the lenders party thereto and JPMorgan Chase Bank, as Administrative Agent, dated January 31, 2013 (Incorporated by reference to Exhibit 10.1 of Registrant’s Form 8-K, dated January 31, 2013) | |
| 10.03 | Eighth Lease Amendment between 233 S. WACKER LLC and Heidrick & Struggles International, Inc. dated October 1, 2014 (Incorporated by reference to Exhibit 10.1 of the Registrant’s Form 8-K filed on October 9, 2014) | |
| 10.04 | Lease between 1114 6th Avenue Co., LLC and Heidrick & Struggles International, Inc., and Heidrick & Struggles, Inc., dated August 31, 2007 (Incorporated by reference to Exhibit 10.04 of the Registrant’s Form 10-K filed on February 28, 2008) | |
| 10.05 | Amended and Restated Employment Agreement of L. Kevin Kelly (Incorporated by reference to Exhibit 10.1 of the Registrant’s Form 8-K, dated December 29, 2011, filed on January 5, 2012)** | |
| 10.06 | Employment Agreement of Richard W. Pehlke dated August 15, 2011 (Incorporated by reference to Exhibit 10.1 of the Registrant’s Form 8-K, dated August 15, 2011, filed August 16, 2011) ** | |
| 10.07 | Employment Agreement of Stephen Beard (Incorporated by reference to Exhibit 10.2 of the Registrant’s Form 10-Q filed on August 1, 2011)** | |
| 10.08 | Employment Agreement of Tracy R. Wolstencroft (Incorporated by reference to exhibit 99.1 of the Registrant’s Form 8-K filed February 6, 2014)** | |
| 10.09 | Restricted Stock Unit Agreement issued to Tracy R. Wolstencroft (Incorporated by reference to exhibit 99.2 of the Registrant’s Form 8-K filed February 6, 2014)** | |
| 10.10 | Performance Stock Unit Agreement issued to Tracy R. Wolstencroft (Incorporated by reference to exhibit 99.3 of the Registrant’s Form 8-K filed February 6, 2014)** | |
59
Table of Contents
| 10.11 | Separation Agreement for L. Kevin Kelly (Incorporated by reference to exhibit 99.01 of the Registrant’s Form 8-K filed October 10, 2013)** | |
| *10.12 | Employment Agreement of Jory Marino** | |
| 10.13 | Membership Interest Purchase Agreement, dated as of December 31, 2012, among Heidrick & Struggles International, Inc., Senn-Delaney Leadership Consulting Group, LLC and the members of Senn-Delaney Leadership Consulting Group, LLC (Incorporated by reference to exhibit 2.1 of the Registrant’s Form 8-K filed January 4, 2013). | |
| 10.14 | Heidrick & Struggles International, Inc. Management Severance Pay Plan and Summary Plan Description as Amended and Restated Effective December 31, 2010 (Incorporated by reference to Exhibit 10.1 of the Registrant’s Form 8-K dated, October 25, 2011, filed on October 25, 2011) ** | |
| 10.15 | 2007 Heidrick & Struggles GlobalShare Plan (Incorporated by reference to Appendix A to the Registrant’s Proxy Statement dated April 25, 2011)** | |
| 10.16 | The Heidrick & Struggles Incentive Plan, as Amended and Restated Effective January 1, 2008 (Incorporated by reference to Exhibit 10.20 of the Registrant’s From 10-K filed on February 27, 2009)** | |
| 10.17 | Form of Non-Qualified Stock Option Agreement (Incorporated by reference to Exhibit 10.5 of the Registrant’s Form 8-K dated December 29, 2011, filed on January 5, 2012)** | |
| 10.18 | Form of Restricted Stock Unit Participation Agreement (Incorporated by reference to Exhibit 10.3 of the Registrant’s Form 8-K dated December 29, 2011, filed on January 5, 2012)** | |
| 10.19 | Form of Performance Stock Unit Participation Agreement (Incorporated by reference to Exhibit 10.4 of the Registrant’s Form 8-K dated December 29, 2011, filed on January 5, 2012)** | |
| 10.20 | Form of Non-Employee Director Restricted Stock Unit Participation Agreement (Incorporated by reference to Exhibit 10.19 of the Registrant’s 10-K dated March 14, 2012)** | |
| 10.21 | Heidrick & Struggles International, Inc. U.S. Employees Deferred Compensation Plan (Incorporated by reference to Exhibit 10.10 of the Registrant’s Form 10-K for the year ended December 31, 2005, filed on March 10, 2006)** | |
| 10.22 | Heidrick & Struggles International, Inc. Deferred Compensation Plan for UK Employees (Incorporated by reference to Exhibit 4.1 of this Registrant’s Registration Statement on Form S-8 (File No. 333-82424))** | |
| 10.23 | First Amendment to the Heidrick & Struggles International, Inc. U.S. Employees Deferred Compensation Plan (Incorporated by reference to Exhibit 10.25 of the Registrant’s Form 10-K for the year ended December 31, 2008, filed on February 27, 2009)** | |
| 10.24 | Heidrick & Struggles Non-Employee Directors’ Voluntary Deferred Compensation (Incorporated by reference to Exhibit 10.10 of the Registrant’s Form 10-K for the year ended December 31, 2005, filed on March 10, 2006)** | |
| 10.25 | Heidrick & Struggles International, Inc. Change in Control Severance Plan, as amended and restated effective December 29, 2011 (Incorporated by reference to Exhibit 10.2 of the Registrant’s Form 8-K dated December 29, 2011, filed on January 5, 2012).** | |
| *21.01 | Subsidiaries of the Registrant | |
| *23.01 | Consent of Independent Registered Public Accounting Firm | |
| *31.1 | Certification of the Company’s Chief Executive Officer pursuant to Section 302 of the Sarbanes-Oxley Act of 2002 | |
| *31.2 | Certification of the Company’s Chief Financial Officer pursuant to Section 302 of the Sarbanes-Oxley Act of 2002 | |
| *32.1 | Certification of the Company’s Chief Executive Officer pursuant to 18 U.S.C. Section 1350, as adopted pursuant to Section 906 of the Sarbanes-Oxley Act of 2002 | |
60
Table of Contents
| *32.2 | Certification of the Company’s Chief Financial Officer pursuant to 18 U.S.C. Section 1350, as adopted pursuant to Section 906 of the Sarbanes-Oxley Act of 2002 | |
| *101.INS | XBRL Instance document | |
| *101.SCH | XBRL Taxonomy Extension Schema Document | |
| *101.CAL | XBRL Taxonomy Calculation Linkbase Document | |
| *101.DEF | XBRL Taxonomy Extension Definition Linkbase Document | |
| *101.LAB | XBRL Taxonomy Extension Label Linkbase Document | |
| *101.PRE | XBRL Taxonomy Extension Presentation Linkbase Document | |
| * | Filed herewith. |
| ** | Denotes a management contract or compensatory plan or arrangement. |
| (b) | SEE EXHIBIT INDEX ABOVE |
| (c) | FINANCIAL STATEMENTS NOT PART OF ANNUAL REPORT |
None.
61
Table of Contents
Pursuant to the requirements of Section 13 or 15(d) of the Securities Exchange Act of 1934, as amended, the registrant has duly caused this report to be signed on its behalf by the undersigned, thereunto duly authorized on.
| HEIDRICK & STRUGGLES INTERNATIONAL, INC. | ||
| By | /S/ Karen K. Pepping | |
| Title | Senior Vice President, Chief Accounting Officer and Controller | |
Pursuant to the requirements of the Securities Exchange Act of 1934, this report has been signed below by the following persons on behalf of the registrant and in the capacities indicated on March 11, 2015.
| Signature |
Title | |
| /S/ TRACY R. WOLSTENCROFT Tracy R. Wolstencroft (Principal Executive Officer) |
Chief Executive Officer | |
| /S/ RICHARD W. PEHLKE Richard W. Pehlke (Principal Financial Officer) |
Executive Vice President & Chief Financial Officer | |
| /S/ KAREN K. PEPPING Karen K. Pepping (Principal Accounting Officer) |
Senior Vice President, Chief Accounting Officer and Controller | |
| /S/ RICHARD I. BEATTIE Richard I. Beattie |
Director | |
| /S/ JOHN A. FAZIO John A. Fazio |
Director | |
| /S/ MARK FOSTER Mark Foster |
Director | |
| /S/ JILL KANIN-LOVERS Jill Kanin-Lovers |
Director | |
| /S/ ROBERT S. KAPLAN Robert S. Kaplan |
Director | |
| /S/ GARY E. KNELL Gary E. Knell |
Director | |
| /S/ ROBERT E. KNOWLING, JR Robert E. Knowling, Jr. |
Director | |
| /S/ V. PAUL UNRUH V. Paul Unruh |
Director | |
62