Attached files
| file | filename |
|---|---|
| EXCEL - IDEA: XBRL DOCUMENT - GAMCO INVESTORS, INC. ET AL | Financial_Report.xls |
| EX-31.2 - FORM 10-K, EXHIBIT 31.2 - GAMCO INVESTORS, INC. ET AL | form10k2014ex312.htm |
| EX-31.1 - FORM 10-K, EXHIBIT 31.1 - GAMCO INVESTORS, INC. ET AL | form10k2014ex311.htm |
| EX-21.1 - FORM 10-K, EXHIBIT 21.1 - GAMCO INVESTORS, INC. ET AL | form10k2014ex211.htm |
| EX-23.1 - FORM 10-K, EXHIBIT 23.1 - GAMCO INVESTORS, INC. ET AL | form10k2014ex231.htm |
| EX-12.1 - FORM 10-K, EXHIBIT 12.1 - GAMCO INVESTORS, INC. ET AL | form10k2014ex121.htm |
| EX-32.1 - FORM 10-K, EXHIBIT 32.1 - GAMCO INVESTORS, INC. ET AL | form10k2014ex321.htm |
| EX-32.2 - FORM 10-K, EXHIBIT 32.2 - GAMCO INVESTORS, INC. ET AL | form10k2014ex322.htm |
UNITED STATES
SECURITIES AND EXCHANGE COMMISSION
Washington, D.C. 20549
FORM 10-K
| ☒ | ANNUAL REPORT PURSUANT TO SECTION 13 OR 15(D) OF THE SECURITIES EXCHANGE ACT OF 1934 |
For the fiscal year ended December 31, 2014
or
| ☐ | TRANSITION REPORT PURSUANT TO SECTION 13 OR 15(D) OF THE SECURITIES EXCHANGE ACT OF 1934 |
For the transition period from ______ to ______
Commission file number 001-14761
GAMCO Investors, Inc.
(Exact name of registrant as specified in its charter)
|
Delaware
|
13-4007862
|
|
|
(State or other jurisdiction of incorporation or organization)
|
(I.R.S. Employer Identification No.)
|
|
|
One Corporate Center, Rye, NY
|
10580-1422
|
|
|
(Address of principal executive offices)
|
(Zip Code)
|
Registrant’s telephone number, including area code (914) 921-3700
Securities registered pursuant to Section 12(b) of the Act:
|
Title of each class
|
Name of each exchange on which registered
|
|
|
Class A Common Stock, par value $0.001 per share
|
New York Stock Exchange
|
Securities registered pursuant to Section 12(g) of the Act: None
Indicate by check mark if the registrant is a well-known seasoned issuer, as defined in Rule 405 of the Securities Act Yes ☐ No ☒.
Indicate by check mark if the registrant is not required to file reports pursuant to Section 13 or Section 15(d) of the Act Yes ☐ No ☒.
Indicate by check mark whether the registrant (1) has filed all reports required to be filed by Section 13 or 15(d) of the Securities Exchange Act of 1934 during the preceding 12 months (or for such shorter period that the registrant was required to file such reports), and (2) has been subject to such filing requirements for the past 90 days Yes ☒ No ☐.
Indicate by check mark whether the registrant has submitted electronically and posted on its corporate Website, if any, every Interactive Data File required to be submitted and posted pursuant to Rule 405 of Regulation S-T during the preceding 12 months (or for such shorter period that the registrant was required to submit and post such files). Yes ☒ No ☐
Indicate by check mark if disclosure of delinquent filers pursuant to Item 405 of Regulation S-K is not contained herein, and will not be contained, to the best of registrant’s knowledge, in definitive proxy or information statements incorporated by reference in Part III of this Form 10-K or any amendment to this Form 10-K ☐.
Indicate by check mark whether the registrant is a large accelerated filer, an accelerated filer, a non-accelerated filer, or a smaller reporting company. See the definitions of “large accelerated filer”, “accelerated filer”, and “smaller reporting company” in Rule 12b-2 of the Exchange Act. (Check one):
|
Large accelerated filer ☐
|
Accelerated filer ☒
|
|
Non-accelerated filer o (Do not check if a smaller reporting company)
|
Smaller reporting company ☐
|
Indicate by check mark whether the registrant is a shell company (as defined in Exchange Act Rule 12b-2) Yes ☐ No ☒.
The aggregate market value of the class A common stock held by non-affiliates of the registrant as of June 30, 2013 (the last business day of the registrant’s most recently completed second fiscal quarter) was $526,153,724.
As of March 1, 2015, 6,618,666 shares of class A common stock and 19,219,260 shares of class B common stock were outstanding. 18,743,741 shares of class B common stock were held by a subsidiary of GGCP, Inc.
DOCUMENTS INCORPORATED BY REFERENCE: Portions of the registrant’s definitive proxy statement relating to the 2014 Annual Meeting of Shareholders are incorporated by reference in Items 10, 11, 12, 13 and 14 of Part III of this report.
2
|
GAMCO Investors, Inc.
|
|||
|
Annual Report on Form 10-K For the Fiscal Year Ended December 31, 2014
|
|||
|
Part I
|
|||
|
Item 1
|
Business
|
4
|
|
|
Overview
|
4
|
||
|
Business Strategy
|
5
|
||
|
Business Description
|
8
|
||
|
Assets Under Management
|
11
|
||
|
Mutual Fund Distribution, Institutional Research, Brokerage, and Underwriting
|
13
|
||
|
Competition
|
14
|
||
|
Intellectual Property
|
15
|
||
|
Regulation
|
15
|
||
|
Personnel
|
16
|
||
|
Item 1A
|
Risk Factors
|
16
|
|
|
Item 1B
|
Unresolved Staff Comments
|
23
|
|
|
Item 2
|
Properties
|
24
|
|
|
Item 3
|
Legal Proceedings
|
24
|
|
|
Item 4
|
Mine Safety Disclosures
|
24
|
|
|
Part II
|
|||
|
Item 5
|
Market For The Registrant's Common Equity, Related Stockholder Matters And Issuer
|
||
|
Purchases Of Equity Securities
|
25
|
||
|
Item 6
|
Selected Financial Data
|
27
|
|
|
Item 7
|
Management's Discussion And Analysis Of Financial Condition And Results Of Operations
|
29
|
|
|
Item 7A
|
Quantitative And Qualitative Disclosures About Market Risk
|
46
|
|
|
Item 8
|
Financial Statements And Supplementary Data
|
47
|
|
|
Item 9
|
Changes In And Disagreements With Accountants On Accounting And Financial Disclosure
|
87
|
|
|
Item 9A
|
Controls And Procedures
|
87
|
|
|
Item 9B
|
Other Information
|
87
|
|
|
Part III
|
|||
|
Item 10
|
Directors, Executive Officers and Corporate Governance
|
88
|
|
|
Item 11
|
Executive Compensation
|
88
|
|
|
Item 12
|
Security Ownership Of Certain Beneficial Owners And Management And Related
|
||
|
Stockholder Matters
|
88
|
||
|
Item 13
|
Certain Relationships And Related Transactions, and Director Independence
|
88
|
|
|
Item 14
|
Principal Accountant Fees And Services
|
88
|
|
|
Part IV
|
|||
|
Item 15
|
Exhibits, Financial Statement Schedules
|
89
|
|
|
Signatures
|
91
|
||
|
Power of Attorney
|
92
|
||
|
Computation of Ratios of Earnings to Fixed Charges
|
|||
|
Subsidiaries of GAMCO Investors, Inc.
|
|||
|
Consent of Independent Registered Public Accounting Firm
|
|||
|
Certifications
|
Exhibit 31.1
|
||
|
Exhibit 31.2
|
|||
|
Exhibit 32.1
|
|||
|
Exhibit 32.2
|
|||
3
PART I
Forward-Looking Statements
Our disclosure and analysis in this report and in documents that are incorporated by reference contain some forward-looking statements within the meaning of Section 27A of the Securities Act of 1933 and Section 21E of the Securities Exchange Act of 1934. Forward-looking statements give our current expectations or forecasts of future events. You can identify these statements because they do not relate strictly to historical or current facts. You should not place undue reliance on these statements. They use words such as “anticipate,” “estimate,” “expect,” “project,” “intend,” “plan,” “believe,” and other words and terms of similar meaning. They also appear in any discussion of future operating or financial performance. In particular, these include statements relating to future actions, future performance of our products, expenses, the outcome of any legal proceedings, and financial results.
Although we believe that we are basing our expectations and beliefs on reasonable assumptions within the bounds of what we currently know about our business and operations, there can be no assurance that our actual results will not differ materially from what we expect or believe. Some of the factors that could cause our actual results to differ from our expectations or beliefs include, without limitation: the adverse effect from a decline in the securities markets; a decline in the performance of our products; a general downturn in the economy; changes in government policy or regulation; changes in our ability to attract or retain key employees; and unforeseen costs and other effects related to legal proceedings or investigations of governmental and self-regulatory organizations. We also direct your attention to any more specific discussions of risk contained in Item 1A below and in our other public filings or in documents incorporated by reference here or in prior filings or reports.
We are providing these statements as permitted by the Private Litigation Reform Act of 1995. We do not undertake to update publicly any forward-looking statements if we subsequently learn that we are unlikely to achieve our expectations or if we receive any additional information relating to the subject matters of our forward-looking statements.
ITEM 1: BUSINESS
Unless we have indicated otherwise, or the context otherwise requires, references in this report to “GAMCO Investors, Inc.,” the “Company,” “GBL,” “Gabelli,” “we,” “us” and “our” or similar terms are to GAMCO Investors, Inc., its predecessors and its subsidiaries.
Overview
GAMCO Investors, Inc. (New York Stock Exchange (“NYSE”): GBL), a company incorporated under the laws of Delaware, is a widely-recognized provider of investment advisory services to open and closed-end funds, institutional and private wealth management investors, and investment partnerships, principally in the United States. We provide institutional research services to institutional clients and investment partnerships. We generally manage assets on a discretionary basis and invest in U.S. and international securities through various investment styles. Our revenues are based primarily on the firm’s levels of assets under management (“AUM”) and to a lesser extent, incentive fees associated with our various investment products, as well as revenues from institutional services.
Since our inception in 1977, we have been identified by our research driven approach to equity investing. We enhanced the “value” style approach with our proprietary hallmark Private Market Value (PMV) with a Catalyst™ stock selection process. Our mission is to earn a superior return for our clients over the long-term by providing value added products using fundamental research. Over the last 37 years, the firm has generated over $23.9 billion in investment returns for our institutional and private wealth management clients. In addition to our value portfolios, GAMCO and other brands offer a broad range of investment strategies that include global growth, international and gold products. We also offer performance fee-based investment partnerships that provide long-short investment opportunities, sector specific portfolios, and non-market correlated investments in merger arbitrage, as well as a fixed income strategy.
As of December 31, 2014, we had $47.5 billion of AUM. We conduct our investment advisory business principally through our subsidiaries: GAMCO Asset Management Inc. (Institutional and Private Wealth Management), Gabelli Funds, LLC (Funds) and Gabelli Securities, Inc. (Investment Partnerships). We also act as an underwriter and provide institutional research services through G.research, Inc. (“G.research”). G.distributors, LLC (“G.distributors”) acts as an underwriter and distributor of our open-end funds.
4
Our AUM are organized into four groups:
|
·
|
Investment Partnerships: We provide advisory services to limited partnerships and offshore funds (“Investment Partnerships”). We managed a total of $905 million in Investment Partnership assets on December 31, 2014.
|
|
·
|
Institutional and Private Wealth Management: We provide advisory services to a broad range of investors, including private wealth management, corporate pension and profit-sharing plans, foundations, endowments, jointly-trusteed plans and public funds, and also serve as sub-advisor to certain other third party investment funds including registered investment companies (“Institutional and Private Wealth Management”). Each Institutional and Private Wealth Management (“PWM”) portfolio is managed to meet the needs and objectives of the particular client by utilizing investment strategies and techniques within our areas of expertise. On December 31, 2014, we had $20.4 billion of Institutional and Private Wealth Management AUM.
|
|
·
|
Open and Closed-End Funds: We provide advisory services to twenty-one open-end funds and eleven closed-end funds under Gabelli, GAMCO and Comstock brands (collectively, the “Funds”). The Funds had $26.1 billion of AUM on December 31, 2014. Additionally, we provide administrative services to seven open-end funds, with AUM of $1.6 billion on December 31, 2014, under the TETON Westwood brand. Subsequent to year-end we completed the offering of our twelfth closed-end fund and first London Stock Exchange listed fund, the Gabelli Value Plus+ Trust, raising over £100 million in AUM.
|
|
·
|
SICAV: We provide advisory services to one fund under the GAMCO brand, the GAMCO International SICAV (the “SICAV”). The SICAV has two sub-fund strategies, the GAMCO Merger Arbitrage Fund and the GAMCO Strategic Value Fund, which was closed in January 2015. The SICAV had $135 million of AUM, including $71 million of seed capital provided by the Company, on December 31, 2014.
|
GBL is a holding company incorporated in April 1998 in contemplation of our initial public offering (“Offering”) in February 1999. GGCP Holdings, LLC, a subsidiary of GGCP, Inc. owns a majority of the outstanding shares of Class B Common Stock (“Class B Stock”) of GBL. Such ownership represented approximately 94% of the combined voting power of the outstanding common stock and approximately 72% of the equity interest on December 31, 2014. GGCP, Inc. is majority-owned by Mr. Mario J. Gabelli (“Mr. Gabelli”). Accordingly, Mr. Gabelli is deemed to control GBL.
Our principal executive offices are located at One Corporate Center, Rye, New York 10580. Our telephone number is (914) 921-3700. We post or provide a link on our website, www.gabelli.com, to the following filings as soon as reasonably practicable after they are electronically filed with or furnished to the Securities and Exchange Commission (“Commission” or “SEC”): our annual report on Form 10-K, quarterly reports on Form 10-Q, current reports on Form 8-K, and any amendments to those reports filed or furnished pursuant to Section 13(a) or 15(d) of the Securities Exchange Act of 1934. All such filings on our website are available free of charge.
During 2014, we returned $45.6 million to shareholders through dividends and our stock buyback program. We paid $12.9 million, or $0.50 per share, in cash dividends to our common shareholders and repurchased 414,432 shares at an average investment of $78.99 per share or $32.7 million.
Since the Offering, we have returned $879.6 million in total to shareholders of which $478.8 million was in the form of dividends and $400.8 million was through stock buybacks of 9,126,025 shares at an average investment of $43.92 per share.
On March 20, 2009, we distributed our ownership in Teton, the advisor to the TETON Westwood funds, to our shareholders. At the time of the distribution the stock price of Teton was $2.75 per share. At December 31, 2014 the stock price of Teton was $52.00 per share.
Our balance sheet provides access to financial markets and the flexibility to opportunistically add operating resources to our firm, repurchase our stock and consider strategic initiatives, including lift-outs, acquisitions and seeding new products. As a result of GBL's shelf registration in the second quarter of 2012, we have the ability to issue any combination of senior and subordinate debt securities, convertible debt securities and equity securities (including common and preferred securities) up to a total amount of $400 million. The shelf is available through May 30, 2015, at which time it may be renewed.
Business Strategy
Our business strategy targets global growth of the franchise through continued leveraging of our proven asset management strengths including our brand name, long-term performance record, diverse product offerings and experienced investment, research and client relationship professionals. In order to achieve performance and growth in AUM and profitability, we are pursuing a strategy which includes the following key elements:
5
| · | Gabelli “Private Market Value (PMV) with a CatalystTM” Investment Approach. While we have expanded our investment product offerings, our “value investing” approach remains the core of our business. This method is based on and has evolved from the value investing principles articulated by Graham & Dodd in 1934 and enhanced by Roger Murray and Bruce Greenwald, and has been further augmented by Mr. Gabelli, CFA, with his development of Private Market Value (PMV) with a CatalystTM value investment methodology. |
Private Market Value (PMV) with a CatalystTM investing is a disciplined, research-driven approach based on intensive security analysis. In this process, we generally select stocks whose intrinsic value, based on our estimate of current asset value and future growth and earnings power, is significantly different from the value reflected in the public market. We then calculate the stock’s PMV, which is defined as the price an informed industrial buyer would be likely to pay to acquire the business.
Our value team generally looks for situations in which a catalyst(s) is (are) working to narrow the spread between the public market price and the estimated PMV. Catalysts which are company specific include: realization of hidden assets, recognition of underperforming subsidiaries, share buybacks, spin-offs, mergers and acquisitions, balance sheet changes, new products, accounting changes, new management and cross-shareholder unwinding. Other catalysts are related to industry dynamics or macroeconomics and include but are not limited to: industry consolidation, deregulation, accounting, tax, pension and political reforms, technological change and the macroeconomic backdrop. The time horizons for catalysts to trigger change can either be short-term, medium-term or long-term.
| · | Establishing Research Centers. To enhance our research in our core research competency, we have eight offices including New York, London, Chicago, Greenwich, Shanghai, Tokyo, Hong Kong and St. Louis. We will continue to evaluate adding additional research offices throughout the world. These centers along with Reno and Palm Beach serve also as relationship centers. |
| · | Incentive Fees. Since a growing percentage of the firm's revenues may be directly linked to performance-based fees (largely recognized in the fourth quarter), this may increase the variability of our revenues and profits. As of December 31, 2014, approximately $4.8 billion of our AUM are managed on a performance fee basis including $2.7 billion of Institutional and Private Wealth Management assets, $729 million of preferred issues of closed-end funds, $381 million in The GDL Fund, $905 million of investment partnership assets and $135 million of SICAV AUM. In addition, the incubation of new product strategies using proprietary capital will compensate the investment team with a performance fee model to reinforce our pay-for-performance approach. |
| · | Expanding Mutual Fund Distribution. We continue to expand our distribution network primarily through national and regional brokerage firms and have developed additional classes of shares for most of our mutual funds for sale through these firms and other third party distribution channels on a commission basis. We have increased our wholesaling efforts to market the multi-class shares, which have been designed to meet the needs of investors who seek advice through financial consultants. |
| · | Increasing Presence in Private Wealth Management Market. Our private wealth management business focuses, in general, on serving clients who have established an account relationship of $2.5 million or more with us. According to industry estimates, the number of households with over $2.5 million in investable assets will continue to grow in the future, subject to ups and downs in the equity and fixed income markets. With our 37-year history of serving this segment, long-term performance record, customized portfolios tax-sensitive investment strategy, brand name recognition and broad array of product offerings, we believe that we are well-positioned to capitalize on the growth opportunities in this market. |
| · | Increasing Marketing for Institutional and Private Wealth Management. The Institutional and Private Wealth Management business was principally developed through direct marketing channels. Historically, pension and financial consultants have not been a major source of new institutional and private wealth management business for us. We plan to augment our institutional sales force through the addition of staff to market directly to the consultant community as well as through our traditional marketing channels. |
| · | Attracting and Retaining Experienced Professionals. We offer significant variable compensation that provides opportunities to our staff. We have increased the scope of our investment management capabilities by adding portfolio managers and other investment personnel in order to expand our broad array of products. The ability to attract and retain highly-experienced investment and other professionals with a long-term commitment to us and our clients has been, and will continue to be, a significant factor in our long-term growth. |
6
| · | Sponsorship of Industry Conferences. G.research, our institutional research services business, sponsors industry conferences and management events throughout the year. At these conferences and events, senior management from leading companies share their thoughts on the industry, competition, regulation and the challenges and opportunities in their businesses with portfolio managers and securities analysts. These meetings are an important component of the research services provided to institutional clients. Specifically, in 2014, we hosted 5 such meetings: our 38th Annual Automotive Aftermarket Symposium, 24th Annual Pump Valve & Energy Infrastructure Conference, 20th Annual Aircraft Supplier Conference, 6th Annual Movie & Entertainment Conference and 5th Annual Specialty Chemicals Conference. |
| · | Hosting of Institutional Investor Symposiums. We have a tradition of sponsoring institutional investor symposiums that bring together prominent portfolio managers, members of academia and other leading business professionals to present, discuss and debate current issues and topics in the investment industry. These symposiums have included: |
|
-1997
|
“Active vs. Passive Stock Selection”
|
|
-1998
|
“The Role of Hedge Funds as a Way of Generating Absolute Returns”
|
|
-2001
|
“Virtues of Value Investing”
|
|
-2003
|
“Dividends, Taxable versus Non-Taxable Issues”
|
|
-2006
-2013
|
“Closed-End Funds: Premiums vs. Discounts, Dividends and Distributions”
“Value Investing 20 Years Later: A Celebration of the Roger Murray Lecture Series”
|
We also hold annual conferences for our investment partnership clients and prospects in New York and London at which our portfolio management team discusses the investment environment, our strategies, and event-driven investment opportunities.
| · | Capitalizing on Acquisitions, Alliances and Lift-outs. We intend to selectively and opportunistically pursue acquisitions, alliances and lift-outs that will broaden our product offerings and add new sources of distribution. On October 1, 1999, we completed our alliance with Mathers and Company, Inc. and now act as investment advisor to the Mathers Fund (renamed GAMCO Mathers Fund), and in May 2000, we added Comstock Partners Funds, Inc., (renamed Comstock Funds, Inc.). The Mathers and Comstock funds are part of our Non-Market Correlated mutual fund product line. In November 2002, we completed our alliance with Woodland Partners LLC, a Minneapolis-based investment advisor focused on investing in small capitalization companies. On March 11, 2008, Gabelli Funds, LLC (“Funds Advisor”) assumed the role of investment advisor to the AXA Enterprise Mergers and Acquisitions Fund, subsequently renamed Gabelli Enterprise Mergers and Acquisitions Fund, a fund that had been sub-advised by GAMCO since the fund’s inception on February 28, 2001. On August 1, 2010, the clients of Florida-based NMF Asset Management became part of the Institutional and Private Wealth Management operation of GAMCO Asset Management Inc. (“GAMCO Asset”). |
We believe that we have the financial capacity to pursue acquisitions and lift-outs.
We believe that our growth to date is traceable to the following factors:
| · | Strong Industry Fundamentals: According to data compiled by the U.S. Federal Reserve, the investment management industry has grown faster than more traditional segments of the financial services industry, including the banking and insurance industries. Since GBL began managing assets for institutional and private wealth management clients in 1977, world equity markets have grown at a 10.5% compounded annual growth rate through December 31, 2014 to approximately $65 trillion(a). The U.S. equity market comprises about $24.4 trillion(a) or roughly 38% of world markets. We believe that demographic trends and the growing role of money managers in the placement of capital compared to the traditional role played by banks and life insurance companies will result in continued growth of the investment management industry. |
| · | Long-Term Performance: We have a superior long-term record of achieving relatively high returns for our Institutional and Private Wealth Management clients. We believe that our performance record represents a competitive advantage and a recognized component of our franchise. |
| · | Stock Market Gains: Since we began managing for institutional and private wealth management clients in 1977, our traditional value-oriented Institutional and Private Wealth Management composite has earned a compound annual return of 16.8% gross and 15.9% net of fees versus a compound annual return of 11.8% for the S&P 500 through December 31, 2014. For 2014, the GAMCO composite returned 5.9% gross and 5.3% net of fees versus 13.7% for the S&P 500. |
(a) Source: Birinyi Associates, LLC
7
| · | Widely-Recognized “Gabelli” and “GAMCO” Brand Names: For much of our history, our portfolio managers and investment products have been featured in a variety of financial print media, including both U.S. and international publications such as The Wall Street Journal, Financial Times, Money Magazine, Barron's, Fortune, Business Week, Nikkei Financial News, Forbes Magazine, Consumer Reports and Investor's Business Daily. We also underwrite publications written by our investment professionals, including Deals…Deals…and More Deals, which examines the history of merger arbitrage and Global Convertible Investing: The Gabelli Way, a comprehensive guide to effective investing in convertible securities. |
| · | Diversified Product Offerings: Since the inception of our investment management activities, we have sought to expand the breadth of our product offerings. We currently offer a wide spectrum of investment products and strategies, including product offerings in U.S. equities, U.S. fixed income, global and international equities, convertible securities and investment partnerships. |
Business Description
GBL started operations in 1977 as an institutional services firm. We entered the Institutional and Private Wealth Management business in 1977, management of investment partnerships in 1985 and the mutual fund business in 1986. Our initial product offerings centered on our tax sensitive, buy-hold, value-oriented investment philosophy. Starting in the mid-1980s, we began building on our core value-oriented equity investment products by adding new investment strategies designed for a broad array of clients seeking to invest in growth-oriented equities, convertible securities and fixed income products. Since then, we have continued to build our franchise by expanding our investment management capabilities through the addition of industry specific, international, global, non-market correlated, venture capital, leveraged buy-out and merchant banking product offerings. Throughout our 37 year history, we have marketed most of our products under the “Gabelli” and “GAMCO” brand names. Specialty brands offered to investors have included Mathers and Comstock.
Our AUM are clustered mostly in three groups: Institutional and Private Wealth Management, Funds and Investment Partnerships.
Institutional and Private Wealth Management: Since 1977, we have provided investment management services to a broad spectrum of institutional and private wealth investors. At December 31, 2014, we had $20.4 billion of AUM in approximately 1,800 Institutional and Private Wealth Management accounts, representing 42.9% of our total AUM. The majority of advisory services are provided to private wealth management clients – defined as individuals generally having minimum account balances of $1 million. They comprised approximately 78% of the total number of Institutional and Private Wealth Management accounts and approximately $5.6 billion, or 28%, of the PWM assets as of December 31, 2014. We believe that private wealth management clients are attracted to us by our returns and the tax efficient nature of the underlying investment process in these traditional products. As of December 31, 2014, Institutional client accounts, which include corporate pension and profit sharing plans, jointly-trusteed plans and public funds, represented approximately $8.7 billion, or 42%, of the PWM assets and 10% of the accounts.
Foundation and endowment fund assets represented 11% of the number of Institutional and Private Wealth Management accounts and approximately $2.4 billion, or 12%, of the Institutional and Private Wealth Management AUM. The sub-advisory portion of the Institutional and Private Wealth Management (where we act as sub-advisor to certain other third party investment funds) held approximately $3.7 billion, or 18%, of total Institutional and Private Wealth Management assets with 1% of the total number of accounts.
The ten largest Institutional and Private Wealth Management relationships comprised approximately 41% of Institutional and PWM AUM and approximately 17% of our total AUM and approximately 24% of Institutional and PWM revenues and approximately 7% of our total revenues for the year ended December 31, 2014.
In general, our Institutional and Private Wealth Management AUM are managed to meet the specific needs and objectives of each client by utilizing investment strategies that are within our areas of expertise: “all cap value”, “large cap value”, “small cap value”, “large cap growth”, “international growth” and “convertible bond”. We distinguish between taxable and tax-free assets and manage client portfolios with tax sensitivity within given investment strategies.
Sales efforts are conducted on a regional and product specialist basis. Members of the sales and marketing staff for the Institutional and Private Wealth Management have an average of more than ten years of experience and focus on developing and maintaining direct, long-term relationships with their Institutional and Private Wealth Management clients. The firm will host its 30th Annual Client Conference in May 2015. This conference will be held at the Pierre Hotel in New York and will include presentations by our portfolio managers and analysts.
8
We act as a sub-advisor on certain funds for several large and well-known fund distributors. Sub-advisory clients are subject to business combinations, much the same as corporate clients, and this may result in the curtailment of product distribution or the termination of the relationship.
Investment advisory agreements for our Institutional and Private Wealth Management clients are typically subject to termination by the client without penalty on 30 days notice or less.
Open and Closed-End Funds: We provide advisory services to twenty-one open-end funds and eleven closed-end funds. At December 31, 2014, we had $26.1 billion of AUM in open-end and closed-end funds, representing 54.9% of our total AUM. Our equity funds and closed-end funds were $24.6 billion in AUM on December 31, 2014, 2.5% above the $24.0 billion on December 31, 2013.
GAMCO is the brand for our “Growth” business, which is primarily represented by The GAMCO Growth Fund, The GAMCO Global Growth Fund, and The GAMCO International Growth Fund. GAMCO also includes other distinct investment strategies and styles including our contrarian funds and covered call writing strategies.
The six GAMCO branded open-end funds are:
|
● GAMCO Growth
|
|
● “ International Growth
|
|
● “ Global Telecommunications
|
|
● “ Global Growth
|
|
● “ Global Opportunity
|
|
● “ Mathers
|
The Gabelli brand represents our “Value” business, primarily representing our absolute return, research-driven Private Market Value (PMV) with a CatalystTM funds. The GAMCO Global Telecommunications Fund is a value portfolio but retains the GAMCO name. The Gabelli brand also includes The Gabelli Dividend Growth Fund, The Gabelli Focus Five Fund and The Gabelli Global Rising Income and Dividend Fund as well as eight of the closed-end funds.
Open-end Funds
On December 31, 2014, we had $17.7 billion of AUM in twenty open-end equity funds and $1.5 billion in our Gabelli U.S. Treasury Money Market Fund. At year-end, of the open-end funds AUM having an overall rating from Morningstar, Inc. (“Morningstar”), 91% were ranked “three stars” or better, with approximately 51% ranked “four stars” on an overall basis (i.e., derived from a weighted average of the performance figures associated with their three, five, and ten year Morningstar Rating metrics). There can be no assurance, however, that these funds will be able to maintain such ratings or that past performance is indicative of future results.
We market our open-end funds primarily through third party distribution programs, including no-transaction fee (“NTF”) programs, and have developed additional share classes for many of our funds for distribution through additional third party distribution channels. At December 31, 2014, third party distribution programs accounted for approximately 82% of all assets in open-end equity funds. At December 31, 2014, approximately 18% of our AUM in open-end, equity funds was sourced through direct sales relationships.
Closed-end Funds
We act as investment advisor to eleven closed-end funds, all of which trade on the NYSE or its affiliated exchange: Gabelli Equity Trust (GAB), GDL Fund (GDL), Gabelli Multimedia Trust (GGT), Gabelli Healthcare & Wellness Rx Trust (GRX), Gabelli Convertible and Income Securities Fund (GCV), Gabelli Utility Trust (GUT), Gabelli Dividend & Income Trust (GDV), Gabelli Global Utility & Income Trust (GLU), GAMCO Global Gold, Natural Resources & Income Trust (GGN), GAMCO Natural Resources, Gold & Income Trust (GNT) and The Gabelli Global Small and Mid Cap Value Trust (GGZ). As of December 31, 2014, the eleven closed-end funds had total assets of $6.9 billion, representing 26.6% of the total assets in our Funds business.
The Gabelli Equity Trust (“GAB”), which raised $400 million through its initial public offering in August 1986, finished its 28th year with net assets of $1.8 billion. Since inception, the Gabelli Equity Trust has distributed $2.9 billion in cash to common shareholders through its 10% distribution policy and spawned three other closed-end funds, the Gabelli Multimedia Trust, the Gabelli Utility Trust (“GUT”) and the Gabelli Healthcare & Wellness Rx Trust. In 2014, the fund raised $157 million through an oversubscribed rights offering for common shares.
9
The Gabelli Dividend & Income Trust, launched in November 2003, had net assets of $2.4 billion as of December 31, 2014. During 2014, The Gabelli Small and Mid Cap Value Trust (“GGZ”) was spun-off with approximately $100 million.
The GAMCO Global Gold, Natural Resources & Income Trust (“GGN”) was launched in March 2005. During the years ended December 31, 2014 and 2013, GGN issued 5.9 million and 5.5 million common shares, respectively, through various “at the market offerings”. The net proceeds received from these offerings were approximately $61.9 million and $62.1 million, respectively. GGN filed a $500 million shelf registration statement with the SEC that became effective on November 18, 2014, enabling GGN to offer additional common and preferred shares. In May 2013, GGN issued $100 million of 5.0% Series B Cumulative Preferred Shares. As of December 31, 2014, after taking into account the issuance of the preferred and common shares, GGN had approximately $500 million available for issuance under the shelf registration statement. GGN utilizes a covered call option writing program and had net assets of $0.9 billion as of December 31, 2014.
In January 2007, we launched The GDL Fund, a closed-end fund which seeks to achieve its investment objective by investing primarily in announced merger and acquisition transactions and, to a lesser extent, in corporate reorganizations involving stubs, spin-offs and liquidations. During 2009, The GDL Fund raised $96 million through a rights offering of Series A preferred shares. During 2011, The GDL Fund redeemed the Series A preferred shares and also raised $144 million through a rights offering of Series B preferred shares.
In January 2011, we established the GAMCO Natural Resources, Gold & Income Trust (“GNT”), a closed-end fund that seeks to achieve its investment objective by providing a high level of current income from interest, dividends and option premiums. This launch raised approximately $370 million in AUM.
In April 2011, the Gabelli Healthcare & WellnessRx Trust (“GRX”), a closed-end fund that seeks long-term growth of capital within the healthcare and wellness industries, raised $18 million through a rights offering of common shares. In July 2013, the fund raised an additional $34 million through a rights offering of common shares. During 2014, the fund raised $44.5 million through a rights offering for common shares and an additional $33.9 million through a preferred share offering.
In May 2011, the Gabelli Multimedia Trust (“GGT”), a closed-end fund that seeks long-term capital appreciation from equity investments in global telecommunications, media, publishing and entertainment industries, raised $31 million through a rights offering of common shares. During 2014, the fund raised $54.3 million through a rights offering for common shares.
In December 2012, the Gabelli Global Utility Trust (“GUT”), a closed-end fund that seeks high total return from investments primarily in securities of companies in gas, electricity and water industries, raised $54 million through a rights offering of common shares.
In June 2013, the Gabelli Global Utility & Income Trust (“GLU”), a closed-end fund that seeks a consistent level of after-tax total return for its investors with an emphasis on tax-advantaged dividend income, raised $70 million through a rights offering of common and preferred shares.
Investment Partnerships: We manage Investment Partnerships through our 94% majority-owned subsidiary, Gabelli Securities, Inc. (“GSI”). The Investment Partnerships consist primarily of limited partnerships and offshore funds. As of December 31, 2014, we had $905 million of Investment Partnership AUM.
We introduced our first investment partnership, a merger arbitrage partnership, in 1985. An offshore version of this strategy was added in 1989. Building on our strengths in global event-driven value investing, several new Investment Partnerships have been added to balance investors’ geographic, strategy and sector needs. Today we offer a broad range of absolute return products. Within our merger arbitrage strategy, we manage approximately $715 million of assets for investors who seek positive returns not correlated to fluctuations of the general market. These funds seek to drive returns mainly by investing in announced merger and acquisition transactions that are primarily dependent on deal closure and less on the overall market environment. In event-driven strategies, we manage $166 million of assets focused on the U.S. markets. We also manage a series of sector-focused absolute return funds designed to offer investors a mechanism to diversify their portfolios by global economic sector rather than by geographic region. We currently offer three sector-focused portfolios: the Gabelli International Gold Fund Ltd., GAMA Select Energy Plus, L.P. and GAMCO Medical Opportunities, L.P. Venture capital activities are carried out through ALCE Partners, L.P. and Gabelli Multimedia Partners, L.P., both of which have been closed to new investors.
10
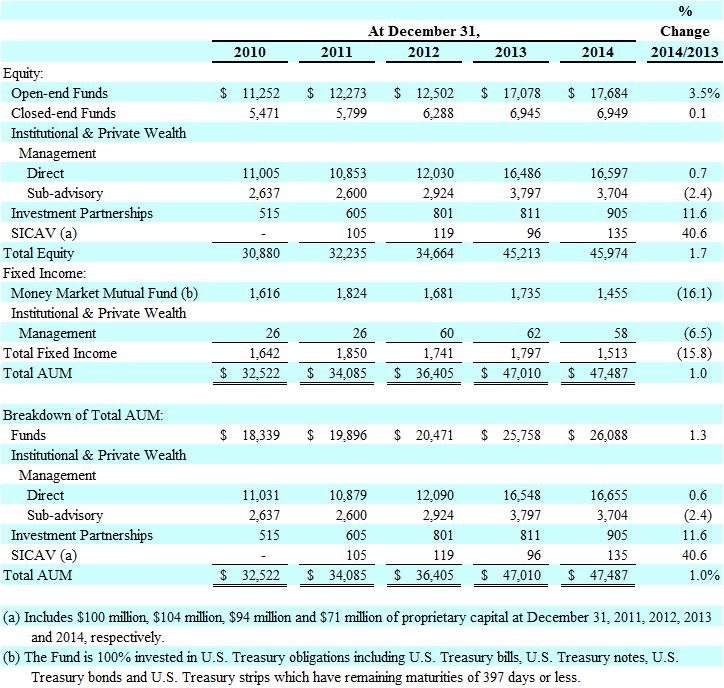
Assets Under Management
The following table sets forth total AUM by product type as of the dates shown:
Assets Under Management
By Product Type
(Dollars in millions)
11
Summary of Investment Products
We manage assets in the following wide spectrum of investment products and strategies, many of which are focused on fast-growing areas:
|
U.S. Equities:
|
Global and International Equities:
|
Investment Partnerships:
|
|
All Cap Value
|
International Growth
|
Merger Arbitrage
|
|
Large Cap Value
|
Global Growth
|
U.S. Long/Short
|
|
Large Cap Growth
|
Global Value
|
Global Long/Short
|
|
Mid Cap Value
|
Global Telecommunications
|
Sector-Focused
|
|
Small Cap Value
|
Multimedia
|
- Energy
|
|
Small Cap Growth
|
Gold
|
- Gold
|
|
Micro Cap
|
- Medical Opportunities
|
|
|
Natural Resources
|
U.S. Fixed Income:
|
Merchant Banking
|
|
Income
|
Corporate
|
|
|
Utilities
|
Government
|
|
|
Non-Market Correlated
|
Asset-backed
|
|
|
Option Income
|
Intermediate
|
|
|
Short-term
|
||
|
Convertible Securities:
|
U.S. Balanced:
|
|
|
U.S. Convertible Securities
|
Balanced Growth
|
|
|
Balanced Value
|
During 2014, we continued to develop the skills of our investment team by allocating firm capital to incubate investment strategies. Historically, this began with a capital structure arbitrage strategy (2004) and now includes a merger-arbitrage and a global trading strategy.
Additional Information on Mutual Funds
Through Funds Advisor, we act as advisor to all of the Funds, except with respect to the Gabelli Capital Asset Fund for which we act as a sub-advisor. Guardian Investment Services Corporation, an unaffiliated company, acts as manager.
Shareholders of the open-end funds are allowed to exchange shares among the same class of shares of the other open-end funds as economic and market conditions and investor needs change at no additional cost. However, as noted below, certain open-end funds impose a 2% redemption fee on shares redeemed within seven days or less after a purchase. We periodically introduce new funds designed to complement and expand our investment product offerings, respond to competitive developments in the financial marketplace and meet the changing needs of investors.
Our marketing efforts for the open-end funds are currently focused on increasing the distribution and sales of our existing funds as well as creating new products for sale through our distribution channels. We believe that our marketing efforts for the funds will continue to generate additional revenues from investment advisory fees. We have traditionally distributed most of our open-end funds by using a variety of direct response marketing techniques, including telemarketing and advertising, and as a result we maintain direct relationships with many of our no-load open-end fund customers. Beginning in late 1995, we expanded our product distribution by offering several of our open-end funds through third party distribution programs, including NTF programs. In 1998 and 1999, we further expanded these efforts to include substantially all of our open-end funds in third party distribution programs. Approximately 18% of the AUM in the open-end equity funds are still attributable to our direct response marketing efforts. Third party distribution programs have become an increasingly important source of asset growth for us. Of the $17.7 billion of AUM in the open-end equity funds as of December 31, 2014, approximately 82% were generated through third party distribution programs. We are responsible for paying the service and distribution fees charged by many of the third party distribution programs, although a portion of such service fees under certain circumstances are payable by the funds. During 2000, we completed development of additional classes of shares for many of our funds for sale on a commission basis through national brokerage and investment firms and other third party distribution channels. The multi-class shares are available in all of the Gabelli Funds, with the exception of the Gabelli Capital Asset Fund and the GAMCO Mathers Fund. We believe that the use of multi-class share products will expand the distribution of Gabelli Fund products into the advised sector of the mutual fund investment community. During 2003, we introduced Class I shares, which are no-load shares with higher minimum initial investment and without distribution fees available directly through G.distributors or brokers that have entered into selling agreements specifically with respect to Class I shares. The no-load shares are designated as Class AAA shares and are available for new and current investors. In general, distribution through third party programs has greater variable cost components and lower fixed cost components than distribution through our traditional direct sales methods.
12
We provide investment advisory and management services pursuant to an investment management agreement with each fund. The investment management agreements with the funds generally provide that we are responsible for the overall investment and administrative services, subject to the oversight of each fund's Board of Directors or Trustees and in accordance with each fund's fundamental investment objectives and policies. The investment management agreements permit us to enter into separate agreements for administrative and accounting services on behalf of the respective funds.
Our affiliated advisors provide the funds with administrative services pursuant to the management contracts. Such services include, without limitation, supervision of the calculation of net asset value, preparation of financial reports for shareholders of the funds, internal accounting, tax accounting and reporting, regulatory filings and other services. Most of these administrative services are provided through sub-contracts with independent third parties. Transfer agency and custodial services are provided directly to the funds by independent third parties.
Our funds’ investment management agreements may continue in effect from year to year only if specifically approved at least annually by (i) the fund's Board of Directors or Trustees or (ii) the fund's shareholders and, in either case, the vote of a majority of the fund's directors or trustees who are not parties to the agreement or “interested persons” of any such party, within the meaning of the Investment Company Act of 1940 as amended (the “Company Act”). Each fund may terminate its investment management agreement at any time upon 60 days' written notice by (i) a vote of the majority of the Board of Directors or Trustees cast in person at a meeting called for the purpose of voting on such termination or (ii) a vote at a meeting of shareholders of the lesser of either 67% of the voting shares represented in person or by proxy (if at least 50% of the shares are present at the meeting) or 50% of the outstanding voting shares of such Fund. Each investment management agreement automatically terminates in the event of its assignment, as defined in the Company Act. We may terminate an investment management agreement without penalty on 60 days' written notice.
Mutual Fund Distribution, Institutional Research, Brokerage and Underwriting
G.research, the wholly-owned subsidiary of our 94% majority-owned subsidiary GSI, is a broker-dealer registered under the Securities Exchange Act of 1934 and is regulated by the Financial Industry Regulatory Authority (“FINRA”). G.research’s revenues are derived primarily from institutional research services, underwriting fees and selling concessions. G.distributors, a wholly-owned subsidiary of GBL, is a broker-dealer registered under the Securities Exchange Act of 1934 and is regulated by FINRA. G.distributors' revenues are derived primarily from the distribution of our open-end funds.
Mutual Fund Distribution
G.distributors distributes our open-end funds pursuant to distribution agreements with each fund. It also distributes the TETON Westwood Funds. Under each distribution agreement with an open-end fund, G.distributors offers and sells such open-end fund's shares on a continuous basis and pays the majority of the costs of marketing and selling the shares, including printing and mailing prospectuses and sales literature, advertising and maintaining sales and customer service personnel and sales and services fulfillment systems, and payments to the sponsors of third party distribution programs, financial intermediaries and G.distributors sales personnel. G.distributors receives fees for such services pursuant to distribution plans adopted under provisions of Rule 12b-1 (“12b-1”) of the Company Act. Distribution fees from the open-end funds are computed daily based on average net assets. Distribution fees from the open-end funds amounted to $56.1 million, $47.4 million and $41.2 million for the years ended December 31, 2014, 2013 and 2012, respectively. G.distributors is the principal underwriter for funds distributed in multiple classes of shares which carry either a front-end or back-end sales charge. Underwriting fees and sales charges retained amounted to $2.7 million, $2.6 million and $2.0 million for the years ended December 31, 2014, 2013 and 2012, respectively.
Under the distribution plans, the open-end Class AAA shares of the funds (except The Gabelli U.S. Treasury Money Market Fund, Gabelli Capital Asset Fund and The Gabelli ABC Fund) and the Class A and ADV shares of various funds pay G.distributors a distribution or service fee of .25% per year (except the Class A shares of the TETON Westwood Funds and Gabelli Enterprise Mergers & Acquisition Fund which pay .50% and 0.45% per year, respectively, and the TETON Westwood Intermediate Bond Fund which pays .35%) on the average daily net assets of the fund. Class C shares have a 12b-1 distribution plan with a service and distribution fee totaling 1%. Class B shares were discontinued in 2014. G.distributors’ distribution agreements with the funds may continue in effect from year to year only if specifically approved at least annually by (i) the fund's Board of Directors or Trustees or (ii) the fund's shareholders and, in either case, the vote of a majority of the fund's directors or trustees who are not parties to the agreement or “interested persons” of any such party, within the meaning of the Company Act. Each fund may terminate its distribution agreement, or any agreement thereunder, at any time upon 60 days' written notice by (i) a vote of the majority of its directors or trustees cast in person at a meeting called for the purpose of voting on such termination or (ii) a vote at a meeting of shareholders of the lesser of either 67% of the voting shares represented in person or by proxy (if at least 50% of the shares are present at the meeting) or 50% of the outstanding voting shares of such fund. Each distribution agreement automatically terminates in the event of its assignment, as defined in the Company Act. G.distributors may terminate a distribution agreement without penalty upon 60 days' written notice.
13
G.distributors also offers our open-end fund products through our website, www.gabelli.com, where directly registered mutual fund investors can access their personal account information and buy, sell, and exchange Fund shares. Fund prospectuses, quarterly reports, fund applications, daily net asset values and performance charts are all available online.
Institutional Research Services
G.research provides institutional investors with investment ideas in numerous industries and special situations, with a particular emphasis on small-cap and mid-cap companies. Our research analysts are industry-focused, following sectors that stem from our core competencies. They research companies of all market capitalizations on a global basis. The primary function of the research team is to gather data, array the data, and then project and interpret data from which investment decisions can be made. Analysts publish their insights in the form of research reports and daily notes. In addition, G.research hosts numerous conferences each year which bring together industry leaders and institutional investors. The objective of the institutional research services is to provide superior investment ideas to investment decision makers.
Analysts are generally assigned to research platforms, coordinated by a senior analyst, in order to ensure a consistent process, enhance idea cross-fertilization and knowledge-sharing. Our platforms include Digital, which includes cable, telecommunications, broadcasting, publishing, advertising, entertainment, and technology; Green, which includes utilities, and renewable energy; Consumer, Health and Wellness, Autos, Aerospace, and Capital Goods; Natural Resources; and Financial Services.
G.research generates institutional research services revenues through brokerage activities from securities transactions executed on an agency basis on behalf of institutional and private wealth management clients as well as from retail customers and mutual funds. Institutional research services revenues totaled $9.1 million, $8.9 million, and $11.0 million for the years ended December 31, 2014, 2013 and 2012, respectively. G.research continues to pursue expansion of such activities.
Underwriting
During 2014, G.research participated as Sales Manager in the at the market offerings of The GAMCO Global Gold, Natural Resources & Income Trust and acted as Dealer Manager for The Gabelli Equity Trust Rights Offering, the Gabelli Multimedia Trust Rights Offering, the Gabelli Healthcare & Wellness Trust Rights Offering, and acted as co-manager in The Gabelli Health & Wellness Trust 5.875% Series B Cumulative Preferred Stock Offering. During 2013, G.research participated as Sales Manager in the at the market offerings of The GAMCO Global Gold, Natural Resources & Income Trust and acted as Dealer Manager for The Gabelli Global Utility and Income Trust’s Series A Preferred Share Rights Offering, and acted as co-manager in The GAMCO Global Gold, Natural Resources & Income Trust 5% Series B Cumulative Preferred Stock Offering. During 2012, G.research participated as Sales Manager in the at the market offerings of The GAMCO Global Gold, Natural Resources & Income Trust and acted as Dealer Manager for The Gabelli Equity Trust’s Series F Cumulative Preferred Rights Offering, and acted as co-underwriter for The Gabelli Equity Trust’s Series H Cumulative Preferred Stock Offering.
Competition
We compete with other investment management firms and mutual fund companies, insurance companies, banks, brokerage firms and other financial institutions that offer products that have similar features and investment objectives. Many of these investment management firms are subsidiaries of large diversified financial companies. Many others are much larger in terms of AUM and revenues and, accordingly, have much larger sales organizations and marketing budgets. Historically, we have competed primarily on the basis of the long-term investment performance of many of our investment products. However, we have taken steps to increase our distribution channels, brand name awareness and marketing efforts.
The market for providing investment management services to Institutional and Private Wealth Management clients is also highly competitive. Approximately 33% of our investment advisory fee revenue for the year ended December 31, 2014 was derived from our Institutional and Private Wealth Management. Selection of investment advisors by U.S. institutional investors is often subject to a screening process and to favorable recommendations by investment industry consultants. Many of these investors require their investment advisors to have a successful and sustained performance record, often five years or longer with focus also on one-year and three-year performance records. We have significantly increased our AUM on behalf of U.S. institutional investors since our entry into the institutional asset management business in 1977. At the current time, we believe that our investment performance record would be attractive to potential new Institutional and Private Wealth Management clients. However, no assurance can be given that our efforts to obtain new business will be successful.
14
Intellectual Property
Service marks and brand name recognition are important to our business. We have rights to the service marks under which our products are offered. We have registered certain service marks in the United States and will continue to do so as new trademarks and service marks are developed or acquired. We have rights to use the “Gabelli” name, the “GAMCO” name, and other names. Pursuant to an assignment agreement, Mr. Gabelli has assigned to us all of his rights, title and interests in and to the “Gabelli” name for use in connection with investment management services, mutual funds and securities brokerage services. However, under the agreement, Mr. Gabelli will retain any and all rights, title and interests he has or may have in the “Gabelli” name for use in connection with (i) charitable foundations controlled by Mr. Gabelli or members of his family and (ii) entities engaged in private investment activities for Mr. Gabelli or members of his family. In addition, the funds managed by Mr. Gabelli outside GBL have entered into a license agreement with us permitting them to continue limited use of the “Gabelli” name under specified circumstances. We have taken, and will continue to take, action to protect our interests in these service marks.
Regulation
Virtually all aspects of our businesses are subject to various federal, state and foreign laws and regulations. These laws and regulations are primarily intended to protect investment advisory clients and shareholders of investment funds, the markets and customers of broker-dealers. Under such laws and regulations, agencies that regulate investment advisors and broker-dealers have broad powers, including the power to limit, restrict or prohibit such an advisor or broker-dealer from carrying on its business in the event that it fails to comply with such laws and regulations. In such an event, the possible sanctions that may be imposed include civil and criminal liability, the suspension of individual employees, injunctions, limitations on engaging in certain lines of business for specified periods of time, revocation of the investment advisor and other registrations, censures, and fines.
Our business is subject to extensive regulation at the federal, state and foreign level by the SEC and other regulatory bodies. Certain of our subsidiaries are registered with the SEC under the Investment Advisers Act of 1940 (“Advisers Act”), and the funds are registered with the SEC under the Company Act. We also have subsidiaries that are registered as broker-dealers with the SEC and are subject to regulation by FINRA and various states.
The subsidiaries of GBL that are registered with the Commission under the Advisers Act (Funds Advisor, Gabelli Fixed Income LLC, GAMCO Asset and GSI) are regulated by and subject to examination by the SEC. The Advisers Act imposes numerous obligations on registered investment advisors including fiduciary duties, disclosure obligations and record keeping, operational and marketing requirements. The Commission is authorized to institute proceedings and impose sanctions for violations of the Advisers Act, ranging from censure to termination of an investment advisor's registration. The failure of an advisory subsidiary to comply with the requirements of the SEC could have a material adverse effect on us.
We derive a substantial majority of our revenues from investment advisory services through our various investment management agreements. Under the Advisers Act, our investment management agreements may not be assigned without the client's consent. Under the Company Act, advisory agreements with registered investment companies such as our Funds terminate automatically upon assignment. The term “assignment” is broadly defined and includes direct as well as assignments that may be deemed to occur, under certain circumstances, upon the transfer, directly or indirectly, of a controlling interest in GBL.
In their capacities as broker-dealers, G.research and G.distributors are required to maintain certain minimum net capital amounts. These requirements also provide that equity capital may not be withdrawn, advances to affiliates may not be made or cash dividends paid if certain minimum net capital requirements are not met. G.research’s and G.distributors’ net capital, as defined, met or exceeded all minimum requirements as of December 31, 2014. As registered broker-dealers, G.research and G.distributors are also subject to periodic examination by FINRA, the SEC and the states.
Subsidiaries of GBL are subject to the Employee Retirement Income Security Act of 1974, as amended (“ERISA”), and to regulations promulgated thereunder, insofar as they are “fiduciaries” under ERISA with respect to certain of their clients. ERISA and applicable provisions of the Internal Revenue Code of 1986, as amended (the “Code”), impose certain duties on persons who are fiduciaries under ERISA and prohibit certain transactions involving ERISA plan clients. Our failure to comply with these requirements could have a material adverse effect on us.
Investments by GBL and on behalf of our advisory clients and investment funds often represent a significant equity ownership position in an issuer's class of stock. As of December 31, 2014, we had five percent or more beneficial ownership with respect to 120 equity securities. This activity raises frequent regulatory, legal, and disclosure issues regarding our aggregate beneficial ownership level with respect to portfolio securities, including issues relating to issuers' shareholder rights plans or “poison pills,” and various federal and state regulatory limitations, including state gaming laws and regulations, federal communications laws and regulations and federal and state public utility laws and regulations, as well as federal proxy rules governing shareholder communications and federal laws and regulations regarding the reporting of beneficial ownership positions. Our failure to comply with these requirements could have a material adverse effect on us.
15
The USA Patriot Act of 2001 contains anti-money laundering and financial transparency laws and mandates the implementation of various new regulations applicable to broker-dealers, mutual funds and other financial services companies, including standards for verifying client identification at account opening, and obligations to monitor client transactions and report suspicious activities. Anti-money laundering laws outside of the U.S. contain some similar provisions. Our failure to comply with these requirements could have a material adverse effect on us.
We and certain of our affiliates are subject to the laws of non-U.S. jurisdictions and non-U.S. regulatory agencies or bodies. In connection with our office in London and our plans to market certain products in Europe, we are required to comply with the laws of the United Kingdom and other European countries regarding these activities. Our subsidiary, GAMCO Asset Management (UK) Limited, is regulated by the Financial Conduct Authority (“FCA”). In connection with our registration in the United Kingdom, we have minimum capital requirements that have been consistently met or exceeded. Several of our investment funds are organized under the laws of foreign jurisdictions and subject to regulation. We opened research offices in Shanghai and Tokyo and therefore are subject to national and local laws in those jurisdictions. We are subject to requirements in numerous jurisdictions regarding reporting of beneficial ownership positions in securities issued by companies whose securities are publicly-traded in those countries.
Regulatory matters
The investment management industry is likely to continue facing a high level of regulatory scrutiny and become subject to additional rules designed to increase disclosure, tighten controls and reduce potential conflicts of interest. In addition, the Commission has substantially increased its use of focused inquiries which request information from investment advisors and a number of fund complexes regarding particular practices or provisions of the securities laws. We participate in some of these inquiries in the normal course of our business. Changes in laws, regulations and administrative practices by regulatory authorities, and the associated compliance costs, have increased our cost structure and could in the future have a material adverse impact. Although we have installed procedures and utilize the services of experienced administrators, accountants and lawyers to assist us in adhering to regulatory guidelines and satisfying these requirements, and maintain insurance to protect ourselves in the case of client losses, there can be no assurance that the precautions and procedures that we have instituted and installed, or the insurance that we maintain to protect ourselves in case of client losses, will protect us from all potential liabilities.
See Item 3: LEGAL PROCEEDINGS below.
Personnel
On February 28, 2015, we had a full-time staff of 232 individuals, of whom 78 served in the portfolio management, research and trading areas (including 22 portfolio managers for the Funds, Institutional and Private Wealth Management and Investment Partnerships), 64 served in the marketing and shareholder servicing areas and 90 served in the administrative area.
| ITEM 1A: | RISK FACTORS |
We caution the reader that the following risks and those risks described elsewhere in this report and in our other SEC filings could have a material adverse effect on our business, prospects, financial condition, results of operations or cash flow or could cause a decline in the Company’s stock price.
Risks Related to Our Industry
We earn substantially all of our revenue based on assets under management and therefore a reduction in assets under management would reduce our revenues and profitability. Assets under management fluctuate based on many factors including: market conditions, investment performance, and terminations of investment contracts.
Substantially all of our revenues are directly related to the amount of our AUM. Under our investment advisory contracts with our clients, the investment advisory fees we receive are typically based on the market value of AUM. In addition, we receive asset-based distribution and/or service fees with respect to the open-end funds managed by Funds Advisor or Teton Advisors, Inc. (“Teton”) over time pursuant to distribution plans adopted under provisions of Rule 12b-1 under the Company Act. Rule 12b-1 fees typically are based on the average AUM and represented approximately 12.8%, 11.9% and 12.0% of our total revenues for the years ended December 31, 2014, 2013 and 2012, respectively. Accordingly, a decline in the prices of securities generally may cause our revenues and net income to decline by either causing the value of our AUM to decrease, which would result in lower investment advisory and Rule 12b-1 fees, or causing our clients to withdraw funds in favor of investments they perceive to offer greater opportunity or lower risk, which would also result in lower fees. The securities markets are highly volatile, and securities prices may increase or decrease for many reasons beyond our control, including but not limited to economic and political events, war (whether or not directly involving the U.S.), acts of terrorism, unanticipated changes in currency exchange rates, interest rates, inflation rates, the yield curve, defaults by derivative counterparties, bond default risks, the sovereign debt crisis in Europe and other factors that are difficult or impossible to predict. If a decline in securities prices caused our revenues to decline, it could have a material adverse effect on our earnings.
16
Changes in laws or regulations or in governmental policies and compliance with existing laws or regulations could limit the sources and amounts of our revenues, increase our costs of doing business, decrease our profitability and materially and adversely affect our business.
Our business is subject to extensive regulation in the United States, primarily at the federal level, including regulation by the SEC under the Company Act and the Advisers Act as well as other securities laws, by the Department of Labor under ERISA, and regulation by FINRA and state regulators. The Funds managed by Funds Advisor are registered with the SEC as investment companies under the Company Act. The Advisers Act imposes numerous obligations on investment advisors, including record-keeping, advertising and operating requirements, fiduciary and disclosure obligations, custodial requirements and prohibitions on fraudulent activities. The Company Act imposes similar obligations, as well as additional detailed operational requirements, on registered investment companies and investment advisors. In addition, our businesses are also subject to regulation by the Financial Services Authority in the United Kingdom, and we are also subject to the laws of other non-U.S. jurisdictions and non-U.S. regulatory agencies or bodies.
Our failure to comply with applicable laws or regulations could result in fines, censure, suspensions of personnel or other sanctions, including revocation of our subsidiaries’ registrations as an investment advisor or broker-dealer. Industry regulations are designed to protect our clients and investors in our funds and other third parties who deal with us and to ensure the integrity of the financial markets. Our industry is frequently altered by new laws or regulations and by revisions to, and evolving interpretations of, existing laws and regulations, both in the U.S. and in other nations. Changes in laws or regulations or in governmental policies could limit the sources and amounts of our revenues including but not limited to distribution revenue under the Company Act, increase our costs of doing business, decrease our profitability and materially and adversely affect our business.
To the extent we are forced to compete on the basis of price, we may not be able to maintain our current fee structure.
The investment management business is highly competitive and has relatively low barriers to entry. To the extent we are forced to compete on the basis of price, we may not be able to maintain our current fee structure. Although our investment management fees vary from product to product, historically we have competed primarily on the performance of our products and not on the level of our investment management fees relative to those of our competitors. In recent years, however, there has been a trend toward lower fees in the investment management industry. In order to maintain our fee structure in a competitive environment, we must be able to continue to provide clients with investment returns and service that make investors willing to pay our fees. In addition, the board of directors or trustees of each fund managed by Funds Advisor must make certain findings as to the reasonableness of its fees. We cannot be assured that we will succeed in providing investment returns and service that will allow us to maintain our current fee structure. Fee reductions on existing or new business could have an adverse effect on our profit margins and results of operations.
We derive a substantial portion of our revenues from investment advisory contracts that may be terminated on short notice or may not be renewed by clients.
A substantial majority of our revenues are derived from investment management agreements and distribution arrangements. Investment management agreements and distribution arrangements with the Funds are terminable without penalty on 60 days' notice (subject to certain additional procedural requirements in the case of termination by a Fund) and must be specifically approved at least annually, as required by law. Such annual renewal requires, among other things, approval by the disinterested members of each Fund's board of directors or trustees. Investment advisory agreements with our Institutional and Private Wealth Management clients are typically terminable by the client without penalty on 30 days' notice or less. Any failure to renew or termination of a significant number of these agreements or arrangements would have a material adverse effect on us.
17
Investors in the open-end funds can redeem their investments in these funds at any time without prior notice, which could adversely affect our earnings.
Open-end fund investors may redeem their investments in those funds at any time without prior notice. Investors may reduce the aggregate amount of AUM for any number of reasons, including investment performance, changes in prevailing interest rates and financial market performance. In a declining stock market, the pace of mutual fund redemptions could accelerate. Poor performance relative to other asset management firms tends to result in decreased purchases of mutual fund shares and increased redemptions of mutual fund shares. The redemption of investments in mutual funds managed by Funds Advisor would adversely affect our revenues, which are substantially dependent upon the AUM in our funds. If redemptions of investments in mutual funds caused our revenues to decline, it could have a material adverse effect on our earnings.
Certain changes in control of our company would automatically terminate our investment management agreements with our clients, unless our Institutional and Private Wealth Management clients consent and, in the case of Fund clients, the Funds’ boards of directors and shareholders vote to continue the agreements, and could prevent us for a two-year period from increasing the investment advisory fees we are able to charge our mutual fund clients.
Under the Company Act, an investment management agreement with a fund must provide for its automatic termination in the event of its assignment. The fund’s board and shareholders must vote to continue the agreement following its assignment, the cost of which ordinarily would be borne by us. Under the Advisers Act, a client’s investment management agreement may not be “assigned” by the investment advisor without the client’s consent. An investment management agreement is considered to be assigned to another party when a controlling block of the advisor’s securities is transferred. In our case, an assignment of our investment management agreements may occur if, among other things, we sell or issue a certain number of additional common shares in the future. We cannot be certain that our clients will consent to assignments of our investment management agreements or approve new agreements with us if an assignment occurs. Under the Company Act, if a fund’s investment advisor engages in a transaction that results in the assignment of its investment management agreement with the fund, the advisor may not impose an “unfair burden” on that fund as a result of the transaction for a two-year period after the transaction is completed. The term “unfair burden” has been interpreted to include certain increases in investment advisory fees. This restriction may discourage potential purchasers from acquiring a controlling interest in our company.
Catastrophic and unpredictable events could have a material adverse effect on our business.
A terrorist attack, political unrest, war (whether or not directly involving the U.S.), power failure, cyber-attack, technology failure, natural disaster or many other possible catastrophic or unpredictable events could adversely affect our future revenues, expenses and earnings by, among other things: causing disruptions in U.S., regional or global economic conditions; interrupting our normal business operations; inflicting employee casualties, including loss of our key executives; requiring substantial expenditures and expenses to repair, replace and restore normal business operations; and reducing investor confidence.
We have a disaster recovery plan to address certain contingencies, but it cannot be assured that this plan will be effective or sufficient in responding to, eliminating or ameliorating the effects of all disaster scenarios. If our employees or vendors we rely upon for support in a catastrophic event are unable to respond adequately or in a timely manner, we may lose clients resulting in a decrease in AUM which may have a material adverse effect on revenues and net income.
The soundness of other financial institutions could adversely affect our business.
Financial services institutions are interrelated as a result of trading, clearing, counterparty or other relationships. We and the investments we manage may have exposure to many different industries and counterparties, and we routinely execute transactions with counterparties in the financial services industry, including: brokers and dealers, commercial banks, investment banks, clearing organizations, mutual and hedge funds, and other institutions. Many of these transactions expose us, or the accounts we manage, to credit risk in the event of the counterparty’s default. There is no assurance that any such losses would not materially and adversely impact the Company’s revenues and earnings.
Risks Related to Our Business
Control by Mr. Gabelli of a majority of the combined voting power of our common stock may give rise to conflicts of interests.
Since our Offering in 1999, Mr. Gabelli, through his control and majority ownership of GGCP, has beneficially owned a majority of our outstanding Class B Stock, representing 93% of voting control. As long as Mr. Gabelli indirectly beneficially owns a majority of the combined voting power of our common stock, he will have the ability to elect all of the members of our Board of Directors and thereby control our management and affairs, including determinations with respect to acquisitions, dispositions, borrowings, issuances of common stock or other securities, and the declaration and payment of dividends on the common stock. In addition, Mr. Gabelli will be able to determine the outcome of matters submitted to a vote of our shareholders for approval and will be able to cause or prevent a change in control of our company. As a result of Mr. Gabelli's control, none of our agreements with Mr. Gabelli and other companies controlled by him can be assumed to have been arrived at through “arm's-length” negotiations, although we believe that the parties endeavor to implement market-based terms. There can be no assurance that we would not have received more favorable terms, or offered less favorable terms to, an unaffiliated party.
18
On February 6, 2008, Mr. Gabelli entered into an amended and restated employment agreement (the “2008 Employment Agreement”) with the Company, which was initially approved by the Company’s shareholders on November 30, 2007 and approved again on May 6, 2011, and which limits his activities outside of the Company. Under the 2008 Employment Agreement, the manner of computing Mr. Gabelli’s remuneration from GAMCO is unchanged.
Mr. Gabelli has agreed that while he is employed by us he will not provide investment management services outside of GAMCO, except for certain permitted accounts. These permitted accounts, excluding personal accounts, held assets at December 31, 2014 and 2013 of approximately $248.4 million and $202.1 million, respectively. Mr. Gabelli continues to be a member of the team that manages the TETON Westwood Mighty MitesSM Fund, whose advisor, Teton, was spun-off from GBL in March 2009. The assets in the TETON Westwood Mighty MitesSM Fund at December 31, 2014 were $1.3 billion. The 2008 Employment Agreement may not be amended without the approval of the Compensation Committee and Mr. Gabelli.
We depend on Mr. Gabelli and other key personnel.
We are dependent on the efforts of Mr. Gabelli, our Chairman of the Board, Chief Executive Officer and the primary portfolio manager for a significant majority of our AUM. The loss of Mr. Gabelli's services could have a material adverse effect on us.
In addition to Mr. Gabelli, our future success depends to a substantial degree on our ability to retain and attract other qualified personnel to conduct our investment management business. The market for qualified portfolio managers is extremely competitive and has grown more so in recent periods as the investment management industry has experienced growth. We anticipate that it will be necessary for us to add portfolio managers and investment analysts as we further diversify our investment products and strategies. There can be no assurance, however, that we will be successful in our efforts to recruit and retain the required personnel. In addition, our investment professionals and senior marketing personnel have direct contact with our Institutional and Private Wealth Management clients, which can lead to strong client relationships. The loss of these personnel could jeopardize our relationships with certain Institutional and Private Wealth Management clients, and result in the loss of such accounts. The loss of key management professionals or the inability to recruit and retain sufficient portfolio managers and marketing personnel could have a material adverse effect on our business.
There may be adverse effects on our business from a decline in the performance of the securities markets.
Our results of operations are affected by many economic factors, including the performance of the securities markets. During the 1990s, unusually favorable and sustained performance of the U.S. securities markets, and the U.S. equity market in particular, attracted substantial inflows of new investments in these markets and has contributed to significant market appreciation which has, in turn, led to an increase in our AUM and revenues. More recently, the securities markets in general have experienced significant volatility, and such volatility may continue or increase in the future. At December 31, 2014, approximately 97% of our AUM were invested in portfolios consisting primarily of equity securities. Any decline in the securities markets, in general, and the equity markets, in particular, could reduce our AUM and consequently reduce our revenues. In addition, any such decline in the equity markets, failure of these markets to sustain their prior levels of growth, or continued short-term volatility in these markets could result in investors withdrawing from the equity markets or decreasing their rate of investment, either of which would be likely to adversely affect us. Also, from time to time, a relatively high proportion of the assets we manage may be concentrated in particular economic or industry sectors. A general decline in the performance of securities in those industry sectors could have an adverse effect on our AUM and revenues.
Our reputation is critical to our success.
Our reputation is critical to acquiring, maintaining and developing relationships with our clients, Mutual Fund shareholders and third party intermediaries. In recent years, there have been a number of well-publicized cases involving fraud, conflicts of interest or other misconduct by individuals in the financial services industry. Misconduct by our staff, or even unsubstantiated allegations, could result not only in direct financial harm but also in harm to our reputation, causing injury to the value of our brands and our ability to retain or attract AUM. In addition, in certain circumstances, misconduct on the part of our clients or other parties could damage our reputation. Moreover, reputational harm may cause us to lose current employees and we may be unable to continue to attract new ones with similar qualification or skills. Damage to our reputation could substantially reduce our AUM and impair our ability to maintain or grow our business, which could have a material adverse effect on us.
19
There is a possibility of losses associated with proprietary investment activities.
Currently, we maintain relatively large proprietary investment positions in securities. Market fluctuations and other factors may result in substantial losses in our proprietary accounts, which could have an adverse effect on our balance sheet, reduce our ability or willingness to make new investments or impair our credit ratings.
Future investment performance could reduce revenues and other income.
Success in the investment management and mutual fund businesses is dependent on investment performance as well as distribution and client servicing. Good performance generally stimulates sales of our investment products and tends to keep withdrawals and redemptions low, which generates higher management fees (which are based on the amount of AUM). Conversely, poor performance, both in absolute terms and/or relative to peers and industry benchmarks, tends to result in decreased sales, increased withdrawals and redemptions in the case of the open-end Funds, and in the loss of Institutional and Private Wealth Management clients, with corresponding decreases in revenues to us. Many analysts of the mutual fund industry believe that investment performance is the most important factor for the growth of open and closed-end funds, such as those we offer. Failure of our investment products to perform well or failure of the Funds to maintain ratings or rankings could, therefore, have a material adverse effect on us.
In addition, when our investment products experience strong results relative to the market or other asset classes, clients' investments in our products may increase beyond their target levels, and we could, therefore, suffer withdrawals as our clients rebalance their investments to fit their asset allocation preferences.
Loss of significant Institutional and Private Wealth Management accounts could affect our revenues.
We had approximately 1,800 Institutional and Private Wealth Management accounts as of December 31, 2014, of which the ten largest accounts generated approximately 7% of our total revenues during the year ended December 31, 2014. Account turnover for any reason would have an adverse effect on our revenues. Notwithstanding performance, we have from time to time experienced account turnover of large Institutional and Private Wealth Management accounts as a result of corporate mergers and restructurings, and we could continue to lose accounts under these or other circumstances.
A decline in the market for closed-end funds could reduce our ability to raise future assets to manage.
Market conditions may preclude us from increasing the assets we manage in closed-end funds. A significant portion of our recent growth in the assets we manage has resulted from public offerings of the common and preferred shares of closed-end funds. We have raised approximately $4.6 billion in gross assets through closed-end fund offerings since January 2004. The market conditions for these offerings may not be as favorable in the future, which could adversely impact our ability to grow our AUM and our revenue.
We rely on third party distribution programs.
A significant share of sales of our open-end funds come through third party distribution programs, which are programs sponsored by third party intermediaries that offer their mutual fund customers a variety of competing products and administrative services. A substantial component of sales growth is from third party distribution programs with no transaction fees payable by the customer, which we refer to as NTF programs. Approximately $5.5 billion of our AUM in the open-end equity funds as of December 31, 2014 were obtained through NTF programs. The cost of participating in third party distribution programs is higher than our direct distribution costs, and it is anticipated that the cost of third party distribution programs will increase in the future. Any increase would be likely to have an adverse effect on our profit margins and results of operations. In addition, there can be no assurance that the third party distribution programs will continue to distribute the Funds. At December 31, 2014, approximately 93% of the NTF program net assets in the Gabelli/GAMCO families of funds are attributable to two NTF programs. The decision by these third party distribution programs to discontinue distribution of the funds, or a decision by us to withdraw one or more of the funds from the programs, could have an adverse effect on our growth of AUM.
There is a possibility of losses associated with underwriting, trading and market-making activities.
Our underwriting and trading activities are primarily conducted through our subsidiary, G.research, primarily as agent. Such activities subject our capital to significant risks of loss. The risks of loss include those resulting from ownership of securities, extension of credit, leverage, liquidity, counterparty failure to meet commitments, client fraud, employee errors, misconduct and fraud (including unauthorized transactions by traders), failures in connection with the processing of securities transactions and litigation. We have procedures and internal controls to address such risks, but there can be no assurance that these procedures and controls will prevent losses from occurring.
20
We may have liability as a general partner or otherwise with respect to our alternative investment products.
Certain of our subsidiaries act as general partner for investment partnerships, including arbitrage, event-driven long/short, sector focused and merchant banking limited partnerships. As a general partner of these partnerships, we may be held liable for the partnerships' liabilities in excess of their ability to pay such liabilities. In addition, in certain circumstances, we may be liable as a control person for the acts of our investment partnerships. As of December 31, 2014, our AUM included approximately $905 million in investment partnerships. A substantial adverse judgment or other liability with respect to our investment partnerships could have a material adverse effect on us.
Operational risks may disrupt our businesses, result in regulatory action against us or limit our growth.
We face operational risk arising from errors made in the execution, confirmation or settlement of transactions or from transactions not being properly recorded, evaluated or accounted for. Our business is highly dependent on our ability to process, on a daily basis, transactions across markets in an efficient and accurate manner. Consequently, we rely heavily on our financial, accounting and other data processing systems. Despite the reliability of these systems, and the training and skill of our employees and third parties we rely on, it remains likely that errors may occasionally occur due to the extremely large number of transactions we process. In addition, if systems we use are unable to accommodate an increasing volume of transactions our ability to expand our businesses could be constrained. If any of these systems do not operate properly or are disabled, we could suffer financial loss, a disruption of our businesses, liability to clients, regulatory intervention or reputational damage.
Failure to maintain adequate infrastructure could impede the Company’s productivity and growth. Additionally, failure to implement effective information and cyber security policies, procedures and capabilities could disrupt operations and cause financial losses that could result in a decrease in the Company’s earnings or stock price.
The Company’s infrastructure, including its information systems and technology, is vital to the competitiveness of its business. The failure to maintain an adequate infrastructure commensurate with the size and scope of our business could impede our productivity and growth, which could cause our earnings or stock price to decline. We outsource a significant portion of our information systems operations to third parties who are responsible for providing the management, maintenance and updating of such systems. Technology is subject to rapid change and we cannot guarantee that our competitors may not implement more advanced technology platforms for their products than we do for ours. In addition, there can be no assurance that the cost of maintaining such outsourcing arrangements will not increase from its current level, which could have a material adverse effect on us.
In addition, any inaccuracies, delays, system failures or security breaches in these and other systems could subject us to client dissatisfaction and losses. Breach of our technology systems could result in the loss of valuable information, liability for stolen assets or information, remediation costs to repair damage caused by the breach, additional security costs to mitigate against future incidents and litigation costs resulting from the incident. Moreover, loss of confidential customer identification information could harm our reputation and subject us to liability under laws that protect confidential personal data, resulting in increased costs or loss of revenues. Further, although we take precautions to password protect and encrypt our laptops and other mobile electronic hardware, if such hardware is stolen, misplaced or left unattended, it may become vulnerable to hacking or other unauthorized use, creating a possible security risk and resulting in potentially costly actions by us.
Our operations rely on the secure processing, storage and transmission of confidential and other information in our computer systems and networks. We may be the target of cyber-attacks, including denial-of-service attacks, and must continuously monitor and develop our systems to protect our technology infrastructure and data from misappropriation or corruption. Although we take protective measures and endeavor to modify them as circumstances warrant, our computer systems, software and networks may be vulnerable to unauthorized access, misuse, computer viruses or other malicious code and other events that could have a security impact. If one or more of such events occur, this potentially could jeopardize our or our clients’ or counterparties’ confidential and other information processed and stored in our, our clients’, our counterparties’ or third parties’ operations, which could impact their ability to transact with us or otherwise result in significant losses or reputational damage. The increased use of mobile technologies can heighten these and other operational risks. We expect to expend significant additional resources on an ongoing basis to modify our protective measures and to investigate and remediate vulnerabilities or other exposures, and we may be subject to litigation and financial losses that are either not insured against or not fully covered through any insurance maintained by us.
21
We routinely transmit and receive personal, confidential and proprietary information by email and other electronic means. We have discussed and worked with clients, vendors, service providers, counterparties and other third parties to develop secure transmission capabilities and protect against cyber-attacks, but we do not have, and may be unable to put in place, secure capabilities with all of our clients, vendors, service providers, counterparties and other third parties and we may not be able to ensure that these third parties have appropriate controls in place to protect the confidentiality of the information. An interception, misuse or mishandling of personal, confidential or proprietary information being sent to or received from a client, vendor, service provider, counterparty or other third party could result in legal liability, regulatory action and reputational harm.
The failure of one of our vendors to fulfill its obligations to us could have a material adverse effect on the Company and its products.
The Company depends on a number of key vendors for various fund administration, accounting, custody and transfer agent roles and other operational needs. The failure or inability of the Company to diversify its sources for key services or the failure of any key vendors to fulfill their obligations could lead to operational issues for the Company and in certain products, which could result in financial losses for the Company and its clients.
Our ability to meet cash needs may be adversely affected by a number of factors.
Our ability to meet anticipated cash needs is affected by factors such as the market value of our assets, our operating cash flows and our creditworthiness as perceived by lenders. Adverse developments in any of these areas could have significantly adverse effects on our business. If we are unable to obtain funds and financing in a timely manner or on acceptable terms, we may be forced to incur unanticipated costs or revise our business plans. Further, our access to the capital markets depends significantly on our credit ratings. A reduction in our credit ratings could increase our borrowing costs and limit our access to the capital markets. Volatility in the U.S., regional or global financing markets may also impact our ability to access the capital markets should we seek to do so, and we may be forced to incur unanticipated costs or experience other adverse effects on our business. We believe that a one notch downgrade in our credit rating would result in a debt rating below investment grade and increase our long-term borrowing costs, on future borrowings, by 50 basis points, while a two notch downgrade would increase our long-term borrowing costs, on future borrowings, by approximately 100-125 basis points. Our current outstanding debt issuances would not be impacted by any changes in our ratings.
We face exposure to legal actions, including litigation and arbitration claims and regulatory and governmental examinations and/or investigations. Insurance coverage for these matters may be inadequate.
The volume of litigation and arbitration claims against financial services firms and the amount of damages claimed has increased over the past several years. The types of claims that we may face are varied. For example, we may face claims against us for purchasing securities that are inconsistent with a client’s investment objectives or guidelines, in connection with the operation of the Funds or arising from an employment dispute. The risk of litigation is difficult to predict, assess or quantify, and may occur years after the activities or events at issue. In addition, from time to time we may become the subject of governmental or regulatory investigations and/or examinations. Even if we prevail in a legal or regulatory action, the costs alone of defending against the action or the harm to our reputation could have a material adverse effect on us. The insurance coverage that we maintain with respect to legal and regulatory actions may be inadequate or may not cover certain proceedings.
Compliance failures could adversely affect us.
Our investment management activities are subject to client guidelines, and our Mutual Fund business involves compliance with numerous investment, asset valuation, distribution and tax requirements. A failure to comply with these guidelines or contractual requirements could result in damage to the Company’s reputation or in its clients seeking to recover losses, withdrawing their AUM or terminating their contracts, any of which could cause the Company’s revenues and earnings to decline. There can be no assurance that the precautions and procedures that we have instituted and installed or the insurance we maintain to protect ourselves in case of client losses will protect us from potential liabilities.
We face strong competition from numerous and, in many instances, larger companies.
The asset management business is intensely competitive. We compete with numerous investment management companies, stock brokerage and investment banking firms, insurance companies, banks, savings and loan associations and other financial institutions. The periodic establishment of new investment management companies and other competitors increases the competition that we face. At the same time, consolidation in the financial services industry has created stronger competitors with greater financial resources and broader distribution channels than our own. Competition is based on various factors, including, among others, business reputation, investment performance, product mix and offerings, service quality and innovation, distribution relationships and fees charged. Our competitive success in any or all of these areas cannot be assured. Additionally, competing securities dealers whom we rely upon to distribute our mutual funds also sell their own proprietary funds and investment products, which could limit the distribution of our investment products. To the extent that existing or potential customers, including securities dealers, decide to invest in or distribute the products of our competitors, the sales of our products as well as our market share, revenues and net income could decline.
22
Fee pressures could reduce our profit margins.
There has been a trend toward lower fees in some segments of the investment management industry. In order for us to maintain our fee structure in a competitive environment, we must be able to provide clients with investment returns and service that will encourage them to be willing to pay such fees. Accordingly, there can be no assurance that we will be able to maintain our current fee structure. Fee reductions on existing or future new business could have an adverse effect on our profit margins and results of operations.
Risks Related to the Company
The disparity in the voting rights among the classes of shares may have a potential adverse effect on the price of our Class A Stock.
The holders of Class A Common Stock (“Class A Stock”) and Class B Stock have identical rights except that (i) holders of Class A Stock are entitled to one vote per share, while holders of Class B Stock are entitled to ten votes per share on all matters to be voted on by shareholders in general, and (ii) holders of Class A Stock are not eligible to vote on matters relating exclusively to Class B Stock and vice versa. Since our Offering in 1999, Mr. Gabelli, through his control and majority ownership of GGCP, has beneficially owned a majority of our outstanding Class B Stock, representing approximately 94% of voting control. As long as Mr. Gabelli indirectly beneficially owns a majority of the combined voting power of our common stock, he will have the ability to elect all of the members of our Board of Directors and thereby control our management and affairs, including among other things any determinations with respect to acquisitions, dispositions, borrowings, issuances of common stock or other securities, and the declaration and payment of dividends on the common stock. The differential in voting rights and the ability of our company to issue additional Class B Stock could adversely affect the value of the Class A Stock to the extent the investors, or any potential future purchaser of our company, view the superior voting rights of the Class B Stock to have value. On May 6, 2014, Class A Stock shareholders approved an advisory proposal for the Board of Directors to consider the conversion and reclassification of our shares of Class B Stock into Class A Stock at a ratio in the range of 1.15 to 1.25 shares of Class A Stock for each share of Class B Stock. The Board of Directors has made no decision on this matter.
Future sales of our Class A Stock in the public market or sales or distributions of our Class B Stock could lower our stock price, and any additional capital raised by us through the sale of equity or convertible securities may dilute our stockholders’ ownership in us.
We may sell additional shares of Class A Stock in subsequent public offerings. We also may issue additional shares of Class A Stock or convertible debt securities. In addition, sales by our current shareholders could be perceived negatively.
No prediction can be made as to the effect, if any, that future sales or distributions of Class B Stock owned by GGCP Holdings LLC will have on the market price of the Class A Stock from time to time. Sales or distributions of substantial amounts of Class A Stock or Class B Stock, or the perception that such sales or distributions are likely to occur, could adversely affect the prevailing market price for the Class A Stock.
Our common stock has relatively limited trading volume, and ownership of a large percentage is concentrated with a small number of shareholders, which could increase the volatility in our stock trading and dramatically affect our share price.
A large percentage of our common stock is held by a limited number of shareholders. If our larger shareholders decide to liquidate their positions, it could cause significant fluctuation in the share price of our common stock.
None.
23
Our principal offices, consisting of a single 60,000 square foot building, are located at 401 Theodore Fremd Avenue, Rye, New York, under a lease agreement which expires on December 31, 2028 from an entity controlled by members of Mr. Gabelli's immediate family. In addition we lease office space in Connecticut, Florida, Illinois, Missouri, Nevada and, internationally, in London, Shanghai and Tokyo.
ITEM 3:LEGAL PROCEEDINGS
From time to time, the Company may be named in legal actions and proceedings. These actions may seek substantial or indeterminate compensatory as well as punitive damages or injunctive relief. The Company is also subject to governmental or regulatory examinations or investigations. The examinations or investigations could result in adverse judgments, settlements, fines, injunctions, restitutions or other relief. For any such matters, the consolidated financial statements include the necessary provisions for losses that the Company believes are probable and estimable. Furthermore, the Company evaluates whether there exist losses which may be reasonably possible and, if material, makes the necessary disclosures.
Not applicable.
24
PART II
| ITEM 5: | MARKET FOR THE REGISTRANT’S COMMON EQUITY, RELATED STOCKHOLDER MATTERS AND ISSUER PURCHASES OF EQUITY SECURITIES |
Our shares of Class A Stock are traded on the NYSE under the symbol GBL.
As of February 1, 2015, there were 324 Class A Stockholders of record and 26 Class B Stockholders of record. These figures do not include stockholders with shares held under beneficial ownership in nominee name, which are estimated to be approximately 3,000.
The following table sets forth the high and low prices of our Class A Stock and historical dividends declared per share to both Class A Stock and Class B Stock for each quarter of 2014 and 2013 as reported by the NYSE.
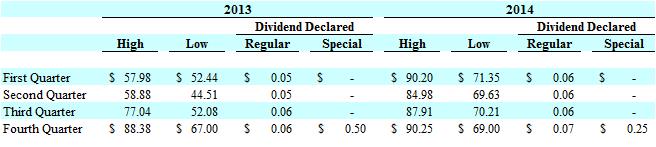
As of December 31, 2014, since the Offering, we have returned $879.6 million in total to shareholders of which $478.8 million was in the form of dividends and $400.8 million was through our stock buyback program.
The following table provides information with respect to the shares of our Class A Stock we repurchased during the three months ended December 31, 2014:
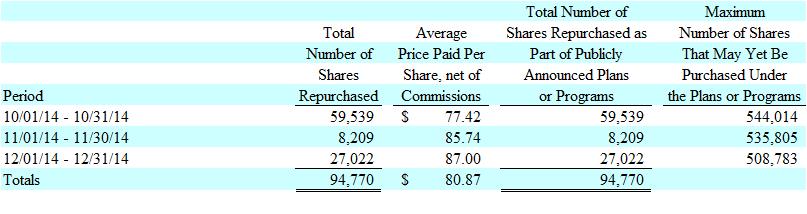
In 1999, the Board of Directors established the stock repurchase program. Our stock repurchase program is not subject to an expiration date.
25
We are required to provide a comparison of the cumulative total return on our Class A Stock as of December 31, 2014 with that of a broad equity market index and either a published industry index or a peer group index selected by us. The following chart compares the return on the Class A Stock with the return on the S&P 500 Index and an index comprised of public asset managers (“SNL Asset Manager”). The comparison assumes that $100 was invested in the Class A Stock and in each of the named indices, including the reinvestment of dividends, on December 31, 2009. This chart is not intended to forecast future performance of our common stock.
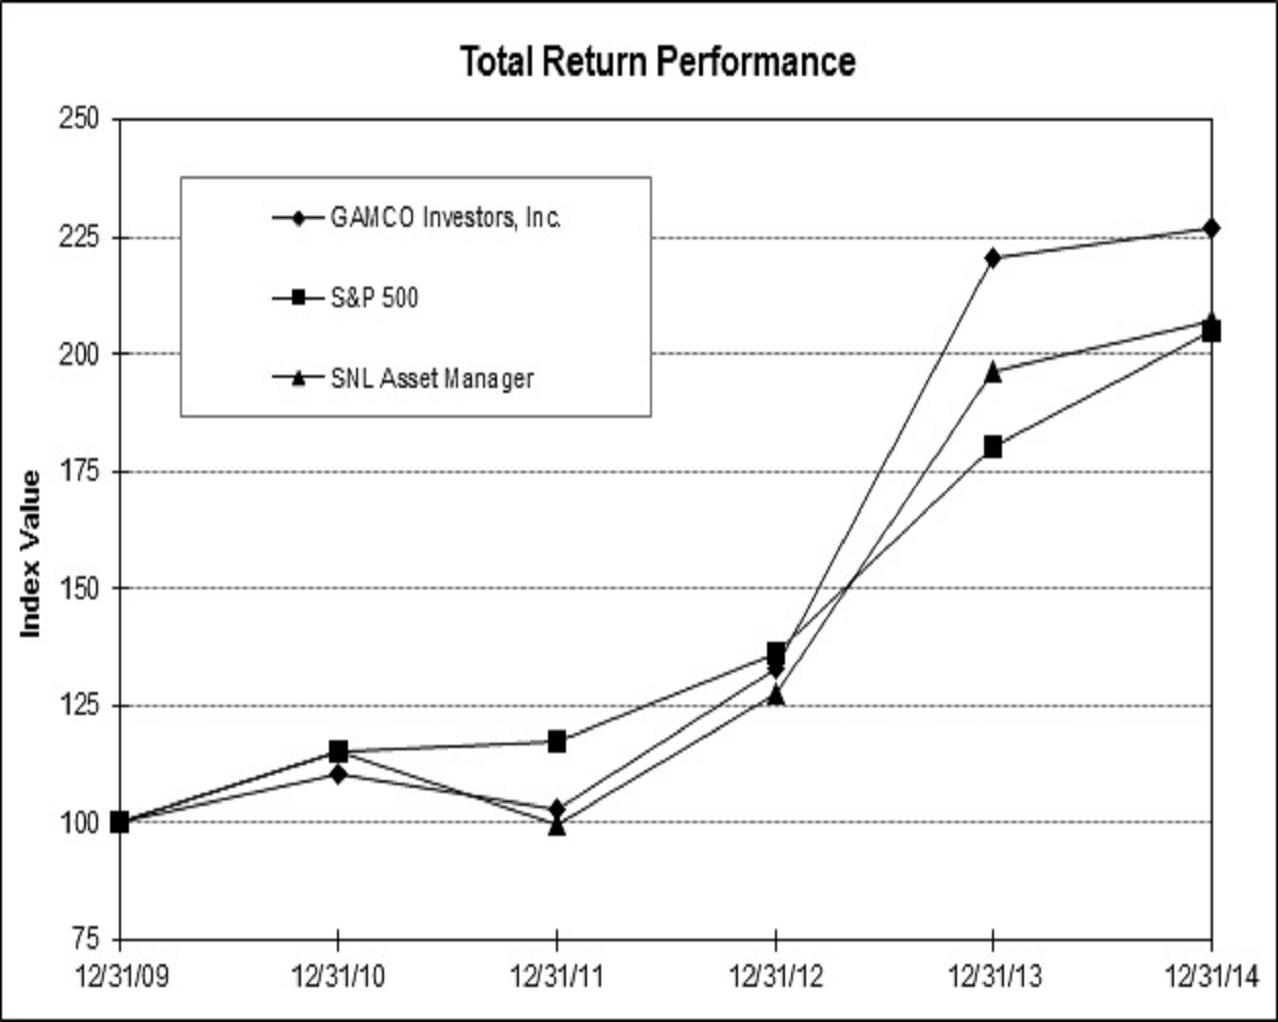
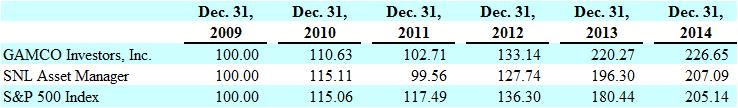
The following table shows information regarding outstanding options and shares reserved for future issuance under our equity compensation plans as of December 31, 2014.
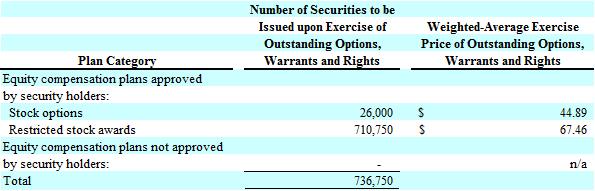
The number of securities remaining available for future issuance under equity compensation plans (excluding securities reflected in the first column above) are 1,827,925.
26
| ITEM 6: | SELECTED FINANCIAL DATA |
General
The selected historical financial data presented below has been derived in part from, and should be read in conjunction with “Management’s Discussion and Analysis of Financial Condition and Results of Operations” included in Item 7 and “Financial Statements and Supplementary Data” included in Item 8 of this report. Amounts included in the tables related to income statement data and balance sheet data are derived from audited financial statements.
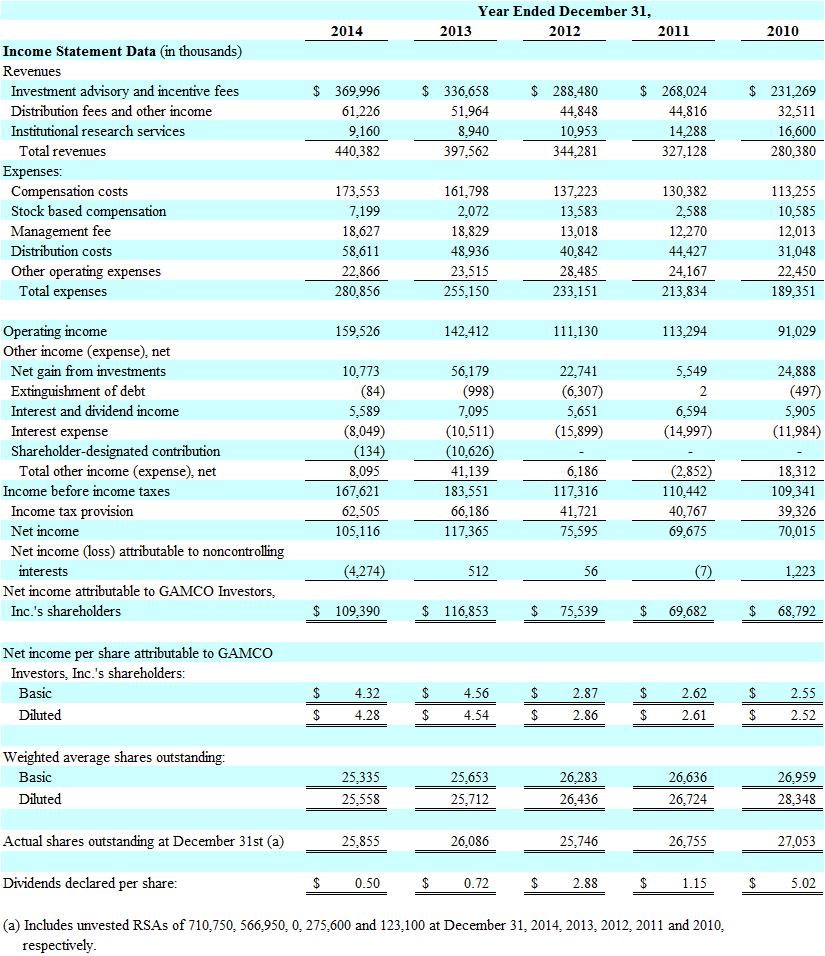
27
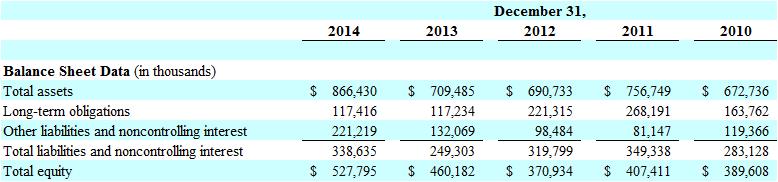
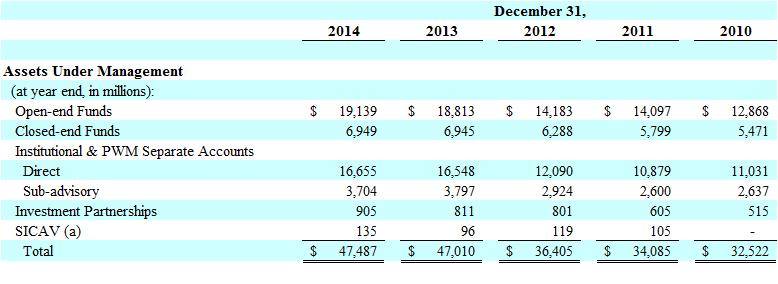
(a) Includes $71 million, $96 million, $104 million and $100 million of proprietary seed capital at December 31, 2014, 2013, 2012 and 2011, respectively.
28
| ITEM 7: | MANAGEMENT'S DISCUSSION AND ANALYSIS OF FINANCIAL CONDITION AND RESULTS OF OPERATIONS |
The following discussion should be read in conjunction with the Consolidated Financial Statements and the notes thereto included in Item 8 to this report.
Introduction
Our revenues are highly correlated to the level of AUM and fees associated with our various investment products, rather than our own corporate assets. AUM, which are directly influenced by the level and changes of the overall equity markets, can also fluctuate through acquisitions, the creation of new products, the addition of new accounts or the loss of existing accounts. Since various equity products have different fees, changes in our business mix may also affect revenues. At times, the performance of our equity products may differ markedly from popular market indices, and this can also impact our revenues. It is our belief that general stock market trends will have the greatest impact on our level of AUM and hence, revenues.
As of December 31, 2014, we had $47.5 billion of AUM. We conduct our investment advisory business principally through: GAMCO (Institutional and Private Wealth Management), Funds Advisor (Funds) and GSI (Investment Partnerships). We also act as an underwriter and provide institutional research services through G.research, a broker-dealer subsidiary, and are a distributor of our open-end mutual funds through our other broker-dealer subsidiary G.distributors.
The Board of Directors has authorized management to explore a potential restructure that will enable the Company to further increase its market focus. While this may involve a split-up of certain facets of our business, there are numerous regulatory related and other issues that may preclude pursuit of any alternative. Management does not plan to give periodic updates on the Company’s progress.
Overview
Consolidated Statements of Income
Investment advisory and incentive fees, which are based on the amount and composition of AUM in our Funds, Institutional and Private Wealth Management accounts and Investment Partnerships, represent our largest source of revenues. In addition to the general level and trends of the stock market, growth in revenues depends on good investment performance, which influences the value of existing AUM as well as contributes to higher investment and lower redemption rates and facilitates the ability to attract additional investors while maintaining current fee levels. Growth in AUM is also dependent on being able to access various distribution channels, which is usually based on several factors, including performance and service. A majority of our cash inflows to mutual fund products have come through third party distribution programs, including NTF programs. We have also been engaged to act as a sub-advisor for other much larger financial services companies with much larger sales distribution organizations. These sub-advisory clients are subject to business combinations that may result in the termination of the relationship. The loss of a sub-advisory relationship could have a significant impact on our financial results in the future.
Advisory fees from the open-end funds, closed-end funds and sub-advisory accounts are computed daily or weekly based on average net assets. Advisory fees from Institutional and Private Wealth Management clients are generally computed quarterly based on account values as of the end of the preceding quarter. Management fees from Investment Partnerships are computed either monthly or quarterly. These revenues are highly correlated to the stock market and can vary in direct proportion to movements in the stock market and the level of sales compared with redemptions, financial market conditions and the fee structure for AUM. Revenues derived from the equity-oriented portfolios generally have higher management fee rates than fixed income portfolios.
Revenues from Investment Partnerships also generally include an incentive allocation on the absolute gain in a portfolio or a fee of 20% of the economic profit, as defined in the partnership agreement. We recognize revenue only when the measurement period has been completed and when the incentive fees have been earned. We also receive incentive fees from certain Institutional and Private Wealth Management clients, which are based upon meeting or exceeding a specific benchmark index or indices. These fees are recognized at the end of the stipulated contract period, which may be quarterly or annually, for the respective account. Management fees on assets attributable to a majority of the closed-end preferred shares are earned at year-end if the total return to common shareholders of the closed-end fund for the calendar year exceeds the dividend rate of the preferred shares. These fees are recognized at the end of the measurement period.
Institutional research services revenues consist of brokerage commissions derived from securities transactions executed on an agency basis on behalf of mutual funds, Institutional and Private Wealth Management clients as well as investment banking revenue, which consists of underwriting profits, selling concessions and management fees associated with underwriting activities. Commission revenues vary directly with account trading activity and new account generation. Investment banking revenues are directly impacted by the overall market conditions, which affect the number of public offerings which may take place.
29
Distribution fees and other income primarily include distribution fee revenue earned in accordance with Rule 12b-1 of the Company Act, as amended, along with sales charges and underwriting fees associated with the sale of the mutual funds plus other revenues. Distribution fees fluctuate based on the level of AUM and the amount and type of mutual funds sold directly by G.distributors or through various distribution channels.
Compensation costs include variable and fixed compensation and related expenses paid to officers, portfolio managers, sales, trading, research and all other professional staff. Variable compensation paid to sales personnel and portfolio management generally represents 40% of revenues and is the largest component of total compensation costs. Distribution costs include marketing, product distribution and promotion costs. Management fee is incentive-based and entirely variable compensation in the amount of 10% of the aggregate pre-tax profits which is paid to Mr. Gabelli or his designee for acting as CEO pursuant to his 2008 Employment Agreement so long as he is an executive of GBL and devotes the substantial majority of his working time to the business. Other operating expenses include general and administrative operating costs and clearing charges and fees for G.research’s brokerage operation.
Other income and expenses include net gains and losses from investments (which includes both realized and unrealized gains and losses from trading securities and equity in earnings of investments in partnerships), interest and dividend income, and interest expense. Net gains and losses from investments are derived from our proprietary investment portfolio consisting of various public and private investments.
Net income (loss) attributable to noncontrolling interests represents the share of net income attributable to the minority stockholders, as reported on a separate company basis, of our consolidated majority-owned subsidiaries and net income attributable to third party limited partners of certain partnerships and offshore funds we consolidate. Please refer to Notes A and D in our consolidated financial statements included elsewhere in this report.
Consolidated Statements of Financial Condition
We ended the 2014 year with approximately $694.3 million in cash and investments, net of securities sold, not yet purchased of $10.6 million, which includes $4.1 million of cash and investments held by our consolidated investment partnerships. The $694.3 million consists of $298.2 million cash and cash equivalents, primarily invested in our 100% U.S. Treasury Money Market Fund, $185.1 million invested in common stocks, $19.0 million invested in U.S. Treasury obligations, $107.6 million invested in partnerships, available for sale (“AFS”) securities of $79.8 million and $4.6 million in other types of investments. Included in our AFS securities of $79.8 million were investments in The Gabelli Dividend & Income Trust, The GDL Fund, and various other Gabelli and GAMCO open-end funds as well as shares of Westwood Holdings Group.
Our debt consisted of $100 million of 5.875% senior notes due June 1, 2021 and $12.2 million in zero coupon subordinated debentures (current principal amount of $13.1 million) due December 31, 2015, which were originally distributed to shareholders as a dividend on December 31, 2010.
Equity, excluding noncontrolling interests, was $525.1 million or $20.30 per share on December 31, 2014 compared to $457.3 million or $17.53 per share on December 31, 2013. The increase in equity from the end of 2013 was largely comprised of comprehensive income of $104.2 million partially offset by the declaration of dividends of $12.9 million and the purchase of treasury stock of $32.7 million during 2014.
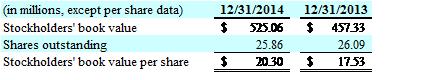
Our strong and liquid balance sheet provides us access to financial markets and the flexibility to opportunistically add operating resources to our firm and consider strategic initiatives. We filed a shelf registration with the SEC in 2012 which, among other things, provides us the flexibility to sell any combination of senior and subordinate debt securities, convertible debt securities, equity securities (including common and preferred stock), and other securities up to a total amount of $400 million. The shelf is available through May 30, 2015, at which time it may be renewed.
Our primary goal is to use our liquid resources to opportunistically and strategically grow operating income. While this goal is a priority, if opportunities are not present with what we consider a margin of safety, we will consider alternatives to return capital to our shareholders including stock repurchases and dividends.
30
Assets Under Management Highlights
We reported assets under management as follows (dollars in millions):
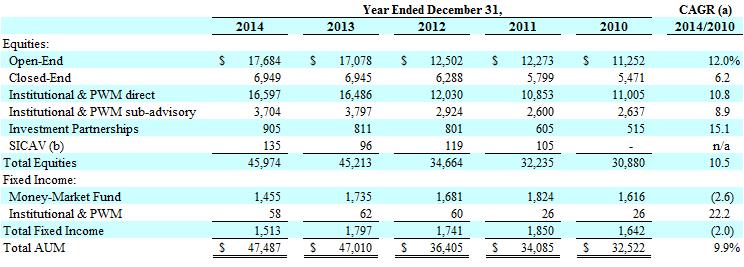
Our net cash inflows or outflows by product line were as follows (in millions):
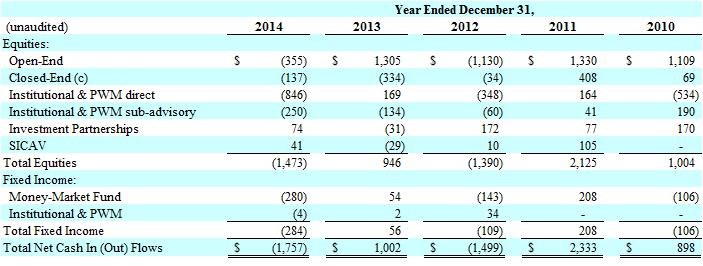
| (a) | Compound annual growth rate. |
| (b) | Includes $71 million, $96 million, $104 million and $100 million of proprietary seed capital at December 31, 2014, 2013, 2012 and 2011, respectively. |
| (c) | Our net cash inflows or outflows for Closed-End equity funds includes distributions, net of reinvestments, to fund holders of $479 million, $484 million, $454 million, $396 million and $328 million in 2014, 2013, 2012, 2011 and 2010, respectively. |
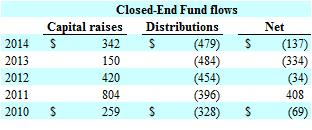
31
Our net appreciation and depreciation by product line were as follows (in millions):
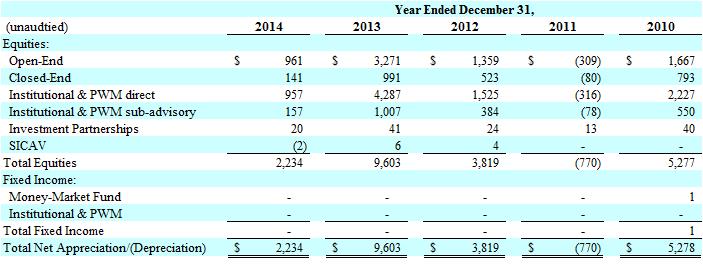
AUM at December 31, 2014 were $47.5 billion, an increase of 1.0% from AUM of $47.0 billion at December 31, 2013. Equity AUM were $46.0 billion on December 31, 2014, 1.7% above the $45.2 billion on December 31, 2013. We earn incentive fees for certain institutional client assets, assets attributable to certain preferred issues for our closed-end funds, our GDL Fund (NYSE: GDL) and investment partnership assets. As of December 31, 2014, assets with incentive based fees were $4.8 billion, 11.6% above the $4.3 billion on December 31, 2013. The majority of these assets have calendar year-end measurement periods; therefore, our incentive fees are primarily recognized in the fourth quarter when the uncertainty is removed at the end of the annual measurement period.
32
Operating Results for the Year Ended December 31, 2014 as Compared to the Year Ended December 31, 2013
Revenues
Total revenues were $440.4 million in 2014, $42.8 million or 10.8% higher than the total revenues of $397.6 million in 2013. The change in total revenues by revenue component was as follows (dollars in millions):
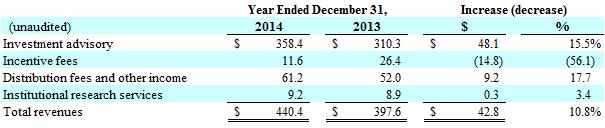
Investment Advisory and Incentive Fees: Investment advisory fees, which comprised 81.4% of total revenues in 2014, are directly influenced by the level and mix of average AUM. Average total AUM rose 14.4% to $47.7 billion in 2014 as compared to $41.7 billion in 2013. Average equity AUM rose 15.0% to $45.9 billion in 2014 from $39.9 billion in 2013. Incentive fees, which comprised 2.6% of total revenues in 2014, result from our ability to either generate an absolute return in a portfolio or meet or exceed a specific benchmark index or indices and can vary significantly from one period to another. Incentive fees were lower in 2014 as fewer portfolios exceeded their respective benchmarks.
Fund revenues increased $24.2 million or 11.3%, to $238.2 million, driven by higher average AUM. Revenue from open-end funds increased $27.1 million, or 18.8%, from the prior year as average AUM in 2014 increased $3.0 billion, or 18.3%, to $19.4 billion from the $16.4 billion in 2013. Closed-end fund revenues decreased $2.8 million, or 4.0%, to $67.3 million from the prior year and was comprised of a decline of $6.4 million in incentive fees on certain closed-end fund AUM offset slightly by an increase of $3.6 million in investment advisory fees attributable to higher average AUM. Revenue from Institutional and Private Wealth Management accounts, excluding incentive fees, which are generally billed on beginning quarter AUM, increased $16.5 million, or 15.9%, principally due to higher billable AUM levels throughout the course of 2014. Incentive fees earned on certain accounts declined by $6.8 million. In 2014, average AUM in our equity Institutional and Private Wealth Management business increased $2.5 billion, or 14.1%, for the year to $20.2 billion. Total advisory fees from Investment Partnerships decreased $0.7 million or 6.9%. Management fee revenues were $6.8 million in 2014, an increase of $0.6 million or 9.7%, from the $6.2 million in 2013 as average AUM increased $85.1 million, or 9.5%, to $982.1 million in 2014 from $897.0 million in 2013. Incentive allocations and fees from investment partnerships, which generally represent 20% of the economic profit, decreased $1.3 million or 32.5% to $2.7 million in 2014 from $4.0 million in 2013.
Institutional Research Services: Institutional research services revenues in 2014 were $9.2 million, a $0.3 million or 3.4% increase from $8.9 million in 2013 resulting from higher brokerage commissions derived from securities transactions executed on an agency basis. Commission revenues derived from transactions on behalf of our Funds and Institutional and Private Wealth Management clients totaled $4.7 million, or approximately 52% of total institutional research services revenues of $8.6 million in 2014.
Distribution Fees and Other Income: Distribution fees and other income increased $9.2 million, or 17.7%, to $61.2 million in 2014 from $52.0 million in 2013. Higher distribution fees of $56.1 million in 2014 versus $47.4 million for the prior year, principally as a result of increased average AUM in our open-end equity mutual funds of 20.2% and an increase of $0.5 million in fees from the sale of load shares of mutual funds and other income contributed to this increase.
Expenses
Compensation: Total compensation costs, which are largely variable in nature, increased $12.1 million, or 7.3%, to $173.6 million in 2014 from $161.8 million in 2013. Variable compensation costs, principally portfolio manager and relationship manager fees, increased $6.9 million to $128.8 million in 2014 from $121.9 million in 2013 and decreased as a percent of revenues to 29.2% in 2014 from 30.7% in 2013. Variable compensation is driven by revenue levels which increased in 2014 from 2013. Fixed compensation costs increased to $44.8 million in 2014 from $39.9 million in 2013.
Stock based compensation: Stock based compensation was $7.2 million in 2014, an increase of $5.1 million, as compared to $2.1 million in 2013. The increase results from the issuance of 576,950 RSAs in the second half of 2013 and 158,600 RSAs during 2014.
Management Fee: In 2014 management fee expense decreased to $18.6 million versus $18.8 million in 2013. Management fee expense is incentive-based and entirely variable in the amount of 10% of the aggregate pre-tax profits which is paid to Mr. Gabelli (or his designee) in accordance with his employment agreement. A portion of these management fees, totaling $1.4 million, was waived prior to being earned in 2013.
33
Distribution Costs: Distribution costs, which include marketing, promotion and distribution costs increased $9.7 million, or 19.8%, to $58.6 million in 2014 from $48.9 million in 2013 driven by an increase in average open-end equity mutual funds AUM of 20.2% and a higher percentage of mutual fund AUM coming through intermediary channels.
Other Operating Expenses: Our other operating expenses were $22.9 million in 2014 compared to $23.5 million in 2013, a decrease of $0.6 million or 2.6%. The year over year decrease of $0.6 million was spread among multiple categories of expense.
Operating Income and Margin
Operating income increased $17.1 million, or 12.0%, to $159.5 million for 2014 versus $142.4 million in the prior year period. This increase was primarily due to the growth in revenues which were largely attributable to the higher levels of average AUM in 2014 versus 2013. Operating margin was 36.2% for the year ended December 31, 2014, versus 35.8% in the prior year period. The improvement in operating margin was due to leveraging of fixed costs partially offset by higher management fee expense.
Operating income before management fee was $178.2 million for the year ended of 2014, versus $161.2 million in the prior year. Operating margin before management fee was 40.5% in the 2014 period versus 40.6% in the 2013 period. The reconciliation of operating income before management fee and operating margin before management fee, both of which are non-GAAP measures to their respective GAAP measures, is provided at the end of this section.
Other Income and Expense
Total other income (expense) (which primarily represents investment income from our proprietary investments), net of interest expense, was $8.1 million for the year ended December 31, 2014 compared to $41.1 million in 2013. Net gain from investments was $10.9 million in 2014 as compared to $56.2 million in 2013. Loss on extinguishment of debt declined to $0.1 million in 2014 from $1.0 million in 2013. Interest and dividend income was $5.5 million in 2014 compared to $7.1 million in 2013. The decrease of $1.6 million was due entirely to dividend income as interest income was flat year over year.
Interest expense decreased $2.5 million to $8.0 million in 2014, from $10.5 million in 2013. The decline was due to a lower total average debt outstanding. On May 15, 2013, we repaid the $99 million of 5.5% senior notes which matured on that date.
In 2013, the Board of Directors of GBL initiated a Shareholder Designated Charitable Contribution program on behalf of all registered Class A and Class B shareholders. Under the program the Board approved two $0.25 per share contributions, resulting in a charge of $10.6 million in 2013 and $0.1 million in 2014.
Income Taxes
The effective tax rate (“ETR”) was 37.3% for the year ended December 31, 2014, versus 36.1% for the year ended December 31, 2013. The ETR is impacted by the income (loss) attributable to noncontrolling interests included in pretax earnings for which no corporate tax provision or benefit is provided. Excluding this income (loss) the ETR was 36.4% in 2014 and 36.2% in 2013. The 2013 rate included a 0.6% tax rate benefit from the increase in donations of appreciated securities.
Net Income Attributable to Noncontrolling interest
Net income attributable to noncontrolling interests was a loss of $4.3 million in 2014 compared to income of $0.5 million in 2013, the result of currency fluctuations on Euro denominated share classes in the underlying investment partnerships consolidated for GAAP purposes.
Shareholder Compensation and Initiatives
During 2014, we returned $45.6 million of our earnings to shareholders through dividends and stock repurchases. We returned to shareholders a total of $0.25 per share in regular quarterly cash dividends and one special cash dividend of $0.25 per share in 2014 totaling $12.9 million. During 2013, we returned $33.5 million of our earnings to shareholders through dividends and stock repurchases. We returned to shareholders a total of $0.22 per share in regular quarterly cash dividends and one special cash dividend of $0.50 per share in 2013 totaling $18.7 million.
Through our stock buyback program, we repurchased 414,432 and 229,228 shares in 2014 and 2013, respectively, for approximately $32.7 million and $14.8 million, or $78.99 and $64.41 per share, respectively. Approximately 509,000 shares remain authorized under our stock buyback program at December 31, 2014. Since our IPO we have repurchased 9,126,025 shares for a total investment of $400.8 million, or $43.92 per share.
Weighted average shares outstanding on a diluted basis in 2014 and 2013 were 25.6 million and 25.7 million, respectively.
34
At December 31, 2014, we had 26,000 options outstanding to purchase our Class A Stock.
Operating income before management fee expense is used by management for purposes of evaluating its business operations. We believe this measure is useful in illustrating the operating results of the Company as management fee expense is based on pre-tax income before management fee expense, which includes non-operating items including investment gains and losses from the Company’s proprietary investment portfolio and interest expense. We believe that an investor would find this useful in analyzing the business operations of the Company without the impact of the non-operating items such as trading and investment portfolios or interest expense.
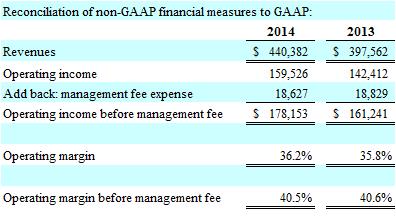
Operating Results for the Year Ended December 31, 2013 as Compared to the Year Ended December 31, 2012
Revenues
Total revenues were $397.6 million in 2013, $53.3 million or 15.5% higher than the total revenues of $344.3 million in 2012. The change in total revenues by revenue component was as follows (dollars in millions):
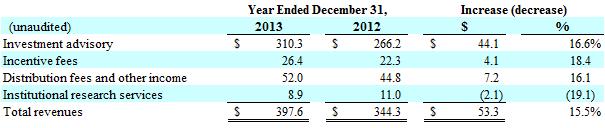
Investment Advisory and Incentive Fees: Investment advisory fees, which comprised 78.0% of total revenues in 2013, are directly influenced by the level and mix of average AUM. Average total AUM rose 15.8% to $41.7 billion in 2013 as compared to $36.0 billion in 2012. Average equity AUM rose 17.0% to $39.9 billion in 2013 from $34.1 billion in 2012. Incentive fees, which comprised 6.6% of total revenues in 2013, result from our ability to either generate an absolute return in a portfolio or meet or exceed a specific benchmark index or indices and can vary significantly from one period to another. Incentive fees were higher in 2013 as portfolios largely benefitted from the stronger prevailing U.S. and global stock market performance.
Fund revenues increased $26.9 million or 14.4%, to $213.9 million, driven by higher average AUM. Revenue from open-end funds increased $19.5 million, or 15.7%, from the prior year as average AUM in 2013 increased $1.9 billion, or 13.1%, to $16.4 billion from the $14.5 billion in 2012. Closed-end fund revenues increased $7.4 million, or 11.8%, to $70.1 million from the prior year and was comprised of $6.7 million in investment advisory fees attributable to higher average AUM and $0.7 million in incentive fees on certain closed-end fund AUM. Revenue from Institutional and Private Wealth Management accounts, excluding incentive fees, which are generally billed on beginning quarter AUM, increased $17.5 million, or 20.4%, principally due to higher billable AUM levels throughout the course of 2013 and an increase of $2.4 million in incentive fees earned on certain accounts. In 2013, average AUM in our equity Institutional and Private Wealth Management business increased $3.1 billion, or 21.2%, for the year to $17.7 billion. Total advisory fees from Investment Partnerships increased $1.3 million or 14.7%. Management fee revenues were $6.2 million in 2013, an increase of $0.4 million or 6.9%, from the $5.8 million in 2012 as average AUM increased $53 million, or 6.3%, to $897 million in 2013 from $844 million in 2012. Incentive allocations and fees from investment partnerships, which generally represent 20% of the economic profit, increased $1.0 million or 33.3% to $4.0 million in 2013 from $3.0 million in 2012.
35
Institutional Research Services: Institutional research services revenues in 2013 were $8.9 million, a $2.1 million or 19.1% decrease from $11.0 million in 2012 resulting from lower revenues from underwriting and syndicate activities. Brokerage commissions derived from securities transactions executed on an agency basis were higher, at $8.3 million in 2013 versus $7.9 million in 2012. Commission revenues derived from transactions on behalf of our Funds and Institutional and Private Wealth Management clients totaled $4.8 million, or approximately 58% of total institutional research services revenues in 2013.
Distribution Fees and Other Income: Distribution fees and other income increased $7.2 million or 16.1% to $52.0 million in 2013 from $44.8 million in 2012. Higher distribution fees of $47.4 million in 2013 versus $41.2 million for the prior year, principally as a result of increased average AUM in our open-end equity mutual funds of 16.6% and an increase of $0.9 million in fees from the sale of load shares of mutual funds and other income contributed to this increase.
Expenses
Compensation: Total compensation costs, which are largely variable in nature, increased $24.6 million, or 17.9%, to $161.8 million in 2013 from $137.2 million in 2012. Variable compensation costs increased $21.5 million to $121.9 million in 2013 from $100.4 million in 2012 and increased as a percent of revenues to 30.7% in 2013 from 29.2% in 2012. Variable compensation is driven by revenue levels which increased in 2013 from 2012. Fixed compensation costs increased to $39.9 million in 2013 from $36.9 million in 2012.
Stock based compensation: Stock based compensation was $2.1 million in 2013, a decrease of $11.5 million, as compared to $13.6 million in 2012. The decrease results from the acceleration of restricted stock awards (“RSAs”) vesting in 2012, which resulted in $10.1 million of expense recognized in 2012 that would have been recognized from 2013 to 2016.
Management Fee: In 2013 management fee expense increased to $18.8 million versus $13.0 million in 2012. Management fee expense is incentive-based and entirely variable in the amount of 10% of the aggregate pre-tax profits which is paid to Mr. Gabelli (or his designee) in accordance with his employment agreement. A portion of these management fees, totaling $1.4 million, was waived prior to being earned in 2013.
Distribution Costs: Distribution costs, which include marketing, promotion and distribution costs increased $8.1 million, or 19.9%, to $48.9 million in 2013 from $40.8 million in 2012 driven by an increase in average open-end equity mutual funds AUM of 16.6% and a higher percentage of mutual fund AUM coming through intermediary channels.
Other Operating Expenses: Our other operating expenses were $23.5 million in 2013 compared to $28.5 million in 2012, a decrease of $5.0 million or 17.5%. The year over year decrease of $5.0 million was largely comprised of a $2.5 million decrease in legal and regulatory costs, and $2.4 million in lower contributions to charitable organizations with the remaining decrease spread among multiple categories of expense.
Operating Income and Margin
Operating income increased $31.3 million, or 28.2%, to $142.4 million for 2013 versus $111.1 million in the prior year period. Included in the 2012 results was a charge of $10.1 million related to the acceleration of RSAs. Excluding this charge, operating income increased $21.2 million, or 17.5%, in 2013 from $121.2 million in 2012. This increase was primarily due to the growth in revenues which were largely attributable to the higher levels of average AUM in 2013 versus 2012. Operating margin was 35.8% for the year ended December 31, 2013, versus 32.3% in the prior year period. The improvement in operating margin was due to leveraging of fixed costs partially offset by higher management fee expense.
Operating income before management fee was $161.2 million for the year ended of 2013, versus $124.1 million in the prior year. Operating margin before management fee was 40.6% in the 2013 period versus 36.1% in the 2012 period (39.0% excluding one-time costs). The reconciliation of operating income before management fee and operating margin before management fee, both of which are non-GAAP measures to their respective GAAP measures, is provided at the end of this section.
Other Income and Expense
Total other income (expense) (which primarily represents investment income from our proprietary investments), net of interest expense, was $41.1 million for the year ended December 31, 2013 compared to $6.2 million in 2012. Net gain from investments was $56.2 million in 2013 as compared to $22.7 million in 2012. Loss on extinguishment of debt declined to $1.0 million in 2013 from $6.3 million in 2012. Interest and dividend income was $7.1 million in 2013 compared to $5.7 million in 2012. The increase of $1.4 million was due entirely to dividend income as interest income was flat year over year.
36
Interest expense decreased $5.4 million to $10.5 million in 2013, from $15.9 million in 2012. The decline was due to a lower total average debt outstanding. On May 15, 2013, we repaid the $99 million of 5.5% senior notes which matured on that date. Additionally, during the third quarter of 2012, we reduced our outstanding debt through the repurchase of $64.1 million (face value) five year zero coupon subordinated debentures due 2015.
In 2013, the Board of Directors of GBL initiated a Shareholder Designated Charitable Contribution program on behalf of all registered Class A and Class B shareholders. Under the program the Board approved two $0.25 per share contributions, resulting in a charge of $10.6 million in 2013.
Income Taxes
The effective tax rate was 36.1% for the year ended December 31, 2013, versus 35.6% for the year ended December 31, 2012. The 2012 rate included a benefit of 1.2% resulting from the difference between the tax and book basis of the zero coupon subordinated debentures repurchased during the year which was partially offset in 2013 by a 0.6% tax rate benefit from the increase in donations of appreciated securities.
Net Income Attributable to Noncontrolling interest
Net income attributable to noncontrolling interests was $0.5 million in 2013 compared to $56,000 in 2012, the result of improved performance in the underlying investment partnerships consolidated for GAAP purposes.
Shareholder Compensation and Initiatives
During 2013, we returned $33.5 million of our earnings to shareholders through dividends and stock repurchases. We returned to shareholders a total of $0.22 per share in regular quarterly cash dividends and one special cash dividend of $0.50 per share in 2013 totaling $18.7 million. During 2012, we returned $131.3 million of our earnings to shareholders through dividends and stock repurchases. We returned to shareholders a total of $0.18 per share in regular quarterly cash dividends, two special cash dividends of $0.25 per share each and one special cash dividend of $2.20 per share totaling $76.4 million during 2012.
Through our stock buyback program, we repurchased 229,228 and 1,138,313 shares in 2013 and 2012, respectively, for approximately $14.8 million and $54.9 million, or $64.41 and $48.25 per share, respectively. Approximately 923,000 shares remain authorized under our stock buyback program at December 31, 2013.
Weighted average shares outstanding on a diluted basis in 2013 were 25.7 million.
At December 31, 2013, we had 66,000 options outstanding to purchase our Class A Stock. The allocation of the options was recommended by the Company's Chairman who did not receive options.
Operating income before management fee expense is used by management for purposes of evaluating its business operations. We believe this measure is useful in illustrating the operating results of the Company as management fee expense is based on pre-tax income before management fee expense, which includes non-operating items including investment gains and losses from the Company’s proprietary investment portfolio and interest expense. We believe that an investor would find this useful in analyzing the business operations of the Company without the impact of the non-operating items such as trading and investment portfolios or interest expense.
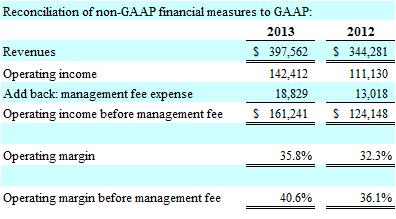
37
Liquidity and Capital Resources
Our principal assets are highly liquid in nature and consist of cash and cash equivalents, short-term investments, securities held for investment purposes, investments in mutual funds, and investment partnerships. Cash and cash equivalents are comprised primarily of 100% U.S. Treasury money market funds managed by GAMCO. Although investments in partnerships and offshore funds are subject to restrictions as to the timing of distributions, the underlying investments of such partnerships or funds are, for the most part, liquid, and the valuations of these products reflect that underlying liquidity.
Summary cash flow data derived from our audited consolidated statements of cash flows are as follows:
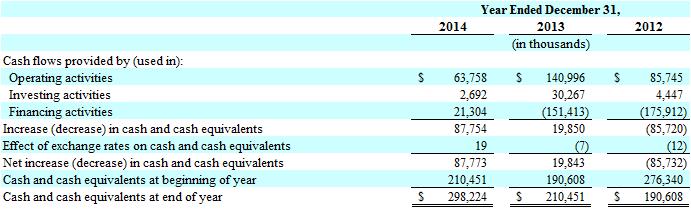
Cash and liquidity requirements have historically been met through cash generated by operating income and our borrowing capacity. We filed a shelf registration with the SEC in 2012 which, among other things, provides us opportunistic flexibility to sell any combination of senior and subordinate debt securities, convertible debt securities, equity securities (including common and preferred stock), and other securities up to a total amount of $500 million. We took down $100 million off the shelf in debt financing leaving $400 million available at this time. The shelf is available through May 30, 2015, at which time it may be renewed.
At December 31, 2014, we had cash and cash equivalents of $298.2 million, an increase of $87.8 million from the prior year-end primarily due to the Company’s operating activities described below. Cash and cash equivalents of $0.1 million and investments in securities of $59.1 million held by consolidated investment partnerships and offshore funds may not be readily available for the Company to access. Total debt outstanding at December 31, 2014 was $112.2 million, consisting of $12.2 million in five year zero coupon subordinated debentures due 2015 (“Debentures”), with a face value of $13.1 million and $100 million of 5.875% senior notes due 2021.
Cash provided by operating activities was $63.8 million in 2014 and $141.0 million in 2013. The year over year decline of $77.2 million was largely the result of cash used to purchase securities and partnership interests, and decreases in accrued expenses and other liabilities. Our largest source of cash comes from net earnings as adjusted for non-cash expenses. In 2014, this totaled $107.7 million versus $107.6 million in 2013. Other sources of cash included $6.3 million from timing differences in the settlement of trading securities. Cash uses included net purchases of securities and partnership interests in our proprietary accounts which totaled $40.4 million and other net changes in operating assets and liabilities of $10.5 million. In 2013, cash was provided by net sales and redemptions of investments in securities and partnership interests of $7.4 million and increases in compensation payable and accrued expenses and other liabilities of $28.4 million. Cash used included $2.4 million from the timing of trade settlement activities.
Net cash provided by investing activities of $2.7 million in 2014 is due to proceeds from sales of available for sale securities of $8.6 million and return of capital from available for sale securities of $0.5 million partially offset by $6.5 million in purchases of available for sale securities. Net cash provided by investing activities of $30.3 million in 2013 is due to proceeds from sales of available for sale securities of $37.9 million and return of capital from available for sale securities of $1.5 million partially offset by $9.1 million in purchases of available for sale securities.
Net cash provided by financing activities of $21.3 million in 2014 principally resulted from net contributions of $65.7 million from redeemable non-controlling interests and $1.6 million from the exercise of stock options partially offset by $12.6 million in dividends paid and $32.7 million of repurchases of our Class A Stock under the Stock Repurchase Program. Net cash used in financing activities of $151.4 million in 2013 principally resulted from the maturity and repayment of $99.0 million in 5.5% senior notes, $18.4 million in dividends paid, $7.7 million for the repurchase of zero coupon subordinated debentures, $14.8 million of repurchases of our Class A Stock under the Stock Repurchase Program, net redemptions of $11.1 million from redeemable non-controlling interests and $0.5 million from redemptions of non-controlling interests.
38
Under the terms of the lease of our Rye, New York office, we are obligated to make minimum total payments of $15.2 million through December 2028.
We continue to maintain investment grade ratings with two ratings agencies, Moody’s Investors Services and Standard and Poor’s Ratings Services. We believe that our ability to maintain our investment grade ratings will provide greater access to the capital markets, enhance liquidity and lower overall borrowing costs.
G.research and G.distributors are registered with the SEC as broker-dealers and are regulated by FINRA. As such, they are subject to the minimum net capital requirements promulgated by the SEC. Both G.research’s and G.distributors’ net capital exceeded these minimum requirements at December 31, 2014. G.research and G.distributors both compute their net capital under the alternative method permitted by the SEC, which requires minimum net capital of the greater of $250,000 or 2% of the aggregate debit items in the reserve formula for those broker-dealers subject to Rule 15c3-3 promulgated under the Securities Exchange Act of 1934. As of December 31, 2014 and 2013, G.research had net capital, as defined, of approximately $1.6 million and $3.6 million, respectively, exceeding the regulatory requirement by approximately $1.4 million and $3.4 million, respectively. At December 31, 2014 and 2013, G.distributors had net capital, as defined, of approximately $4.7 million and $3.8 million, respectively, exceeding the regulatory requirement by approximately $4.5 million and $3.5 million, respectively. Net capital requirements for our affiliated broker-dealers may increase in accordance with rules and regulations to the extent they engage in other business activities.
Our subsidiary, GAMCO Asset Management (UK) Limited is authorized and regulated by the FCA. In February 2011, GAMCO Asset Management (UK) Limited increased its permitted license with the FCA’s predecessor, the Financial Services Authority (“FSA”) and has held Total Capital of £504,000 and £495,000 ($783,000 and $816,000 at December 31, 2014 and 2013, respectively) and had a Financial Resources Requirement of £210,000 and £226,000 ($326,000 and $373,000 at December 31, 2014 and 2013, respectively). We have consistently met or exceeded these minimum requirements.
Market Risk
Our primary market risk exposure is to changes in equity prices and interest rates. Since approximately 97% of our AUM are equities, our financial results are subject to equity-market risk as revenues from our investment management services are sensitive to stock market dynamics. In addition, returns from our proprietary investment portfolio are exposed to interest rate and equity market risk.
The Company’s Chief Investment Officer oversees the proprietary investment portfolios and allocations of proprietary capital among the various strategies. The Chief Investment Officer and the Board of Directors review the proprietary investment portfolios throughout the year. Additionally, the Company monitors its proprietary investment portfolios to ensure that they are in compliance with the Company’s guidelines.
Equity Price Risk
The Company earns substantially all of its revenue as advisory and distribution fees from our affiliated open-end and closed-end funds, Institutional and Private Wealth Management, and Investment Partnership assets. Such fees represent a percentage of AUM, and the majority of these assets are in equity investments. Accordingly, since revenues are proportionate to the value of those investments, a substantial increase or decrease in equity markets overall will have a corresponding effect on the Company's revenues.
With respect to our proprietary investment activities, included in investments in securities and investments in sponsored registered investment companies of $300.0 million and $275.3 million at December 31, 2014 and 2013, respectively, were investments in United States Treasury Bills and Notes of $19.0 million and $38.0 million, respectively, mutual funds, largely invested in equity products, of $44.3 million and $69.0 million, respectively, a selection of common and preferred stocks totaling $235.0 million and $167.7 million, respectively, and other investments of approximately $1.7 million and $0.6 million, respectively. Investments in mutual funds generally have lower market risk through the diversification of financial instruments within their portfolio. In addition, we may alter our investment holdings from time to time in response to changes in market risks and other factors considered appropriate by management. Of the approximately $235.0 million and $167.7 million, invested in common and preferred stocks at December 31, 2014 and 2013, respectively, $38.9 million and $43.0 million, respectively, was related to our investment in Westwood Holdings Group Inc., and $103.9 million and $32.3 million, respectively, was invested in risk arbitrage opportunities in connection with mergers, consolidations, acquisitions, tender offers or other similar transactions. Securities sold, not yet purchased are financial instruments purchased under agreements to resell and financial instruments sold under agreement to repurchase. These financial instruments are stated at fair value and are subject to market risks resulting from changes in price and volatility. At December 31, 2014 and 2013, the fair value of securities sold, not yet purchased was $10.6 million and $6.2 million, respectively. Investments in partnerships and affiliates totaled $107.6 million and $96.0 million at December 31, 2014 and 2013, respectively, the majority of which consisted of investment partnerships and offshore funds which invest in risk arbitrage opportunities. These transactions generally involve announced deals with agreed upon terms and conditions, including pricing, which typically involve less market risk than common stocks held in a trading portfolio. The principal risk associated with risk arbitrage transactions is the inability of the companies involved to complete the transaction.
39
The following table provides a sensitivity analysis for our investments in equity securities and partnerships and affiliates which invest primarily in equity securities, excluding arbitrage products for which the principal exposure is to deal closure and not overall market conditions, as of December 31, 2014. The sensitivity analysis assumes a 10% increase or decrease in the value of these investments (in thousands):
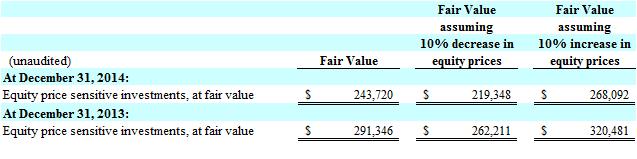
Investment advisory fees for mutual funds and sub-advisory relationships are based on average daily or weekly asset values. Advisory fees earned on Institutional and Private Wealth Management assets, for any given quarter, are generally determined based on asset values at the beginning of a quarter with any significant increases or decreases in market value of assets managed which occur during a quarter resulting in a relative increase or decrease in revenues for the following quarter.
Investment Partnership advisory fees are computed based on monthly or quarterly asset values. The incentive allocation or fee of 20% of the economic profit from Investment Partnerships is impacted by changes in the market prices of the underlying investments of these products and is not recognized until the end of the measurement period.
Interest Rate Risk
Our exposure to interest rate risk results, principally, from our investment of excess cash in a money market fund that holds U.S. Government securities. These investments are primarily short term in nature, and the carrying value of these investments generally approximates fair value. Based on December 31, 2014, cash and cash equivalent balance of $298.2 million a 1% increase in interest rates would increase our interest income by $3.0 million annually. Given that our current annualized return on these investments is close to 0%, an analysis of a 1% decrease is not meaningful.
Contractual Obligations
We are obligated to make future payments under various contracts such as debt agreements and capital and operating lease agreements. The following table sets forth our significant contractual cash obligations as of December 31, 2014 (in thousands):
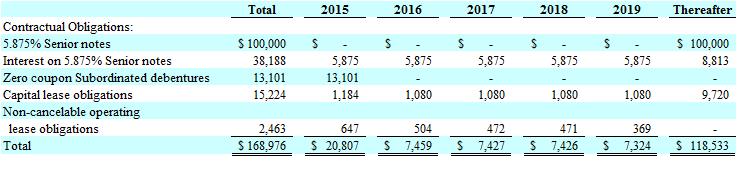
The capital lease contains an escalation clause tied to the change in the New York Metropolitan Area Consumer Price Index which may cause the future minimum payments to exceed $1,080,000 annually. Any increases to the base rental will be accounted for prospectively.
40
Off-Balance Sheet Arrangements
We are the General Partner or Co-General Partner of various limited partnerships whose underlying assets consist primarily of marketable securities.
Our income from these limited partnerships consists of our share of the management fees and a 20% incentive allocation on profits earned by the limited partners. We also receive a pro-rata return on any investment we have in the limited partnership. We earned management fees of $2.9 million, $2.8 million and $3.1 million, respectively, and incentive fees of $1.0 million, $1.5 million and $1.2 million in 2014, 2013 and 2012, respectively. Our pro-rata gain on investments in these limited partnerships totaled $1.5 million, $1.9 million and $0.9 million in 2014, 2013 and 2012, respectively.
We do not invest in any other off-balance sheet vehicles that provide financing, liquidity, market or credit risk support or engage in any leasing activities that expose us to any liability that is not reflected on the Consolidated Financial Statements.
Critical Accounting Policies
In the ordinary course of business, we make a number of estimates and assumptions relating to the reporting of results of operations and financial condition in the preparation of our financial statements in conformity with U.S. generally accepted accounting principles. We base our estimates on historical experience, when available, and on other various assumptions that are believed to be reasonable under the circumstances. Actual results could differ significantly from those estimates under different assumptions and conditions.
We believe the critical assumptions and estimates are those applied to revenue recognition, the accounting for and valuation of investments in securities, partnerships, and offshore funds, goodwill and other long-lived intangibles, income taxes, and stock based compensation accounting.
Major Revenue-Generating Services and Revenue Recognition
The Company’s revenues are derived primarily from investment advisory and incentive fees, institutional research services and distribution fees.
Investment advisory and incentive fees are directly influenced by the level and mix of AUM as fees are derived from a contractually-determined percentage of AUM for each account as well as incentive fees earned on certain accounts. Advisory fees from the open-end mutual funds, closed-end funds and sub-advisory accounts are computed daily or weekly based on average net assets and amounts receivable are included in investment advisory fees receivable on the consolidated statements of financial condition. Advisory fees from Institutional and Private Wealth Management accounts are generally computed quarterly based on account values as of the end of the preceding quarter, and amounts receivable are included in investment advisory fees receivable on the consolidated statements of financial condition. Management fees from investment partnerships and offshore funds are computed either monthly or quarterly, and amounts receivable are included in investment advisory fees receivable on the consolidated statements of financial condition. The Company derived approximately 84%, 85% and 84% of its total revenues from advisory and management fees, including incentive fees, for the periods ended December 31, 2014, 2013 and 2012, respectively. These revenues vary depending upon the level of sales compared with redemptions, financial market conditions, performance and the fee structure for AUM. Revenues derived from the equity-oriented portfolios generally have higher management fee rates than fixed income portfolios.
Revenues from investment partnerships and offshore funds also generally include an incentive allocation or fee on the absolute gain in a portfolio or a fee of 20% of the economic profit as defined in the partnership agreement. The incentive allocation or fee is recognized at the end of the measurement period, which is annually, and amounts receivable are included in investment advisory fees receivable on the consolidated statements of financial condition. There were $2.5 million and $4.3 million in incentive allocations or fees receivable as of December 31, 2014 and 2013, respectively. The Company also receives incentive fees from certain Institutional and Private Wealth Management accounts, which are based upon meeting or exceeding a specific benchmark index or indices. Incentive fees refer to fees earned when the return generated for the client exceeds the benchmark and can be earned even if the return to the client is negative as long as the return exceeds the benchmark. These fees are recognized, for each respective account, at the end of the stipulated contract period which is either quarterly or annually and varies by account. Receivables due for incentive fees earned are included in investment advisory fees receivable on the consolidated statements of financial condition. There were $0.2 million and $3.4 million in incentive fees receivable as of December 31, 2014 and 2013, respectively. Management fees on a majority of the closed-end preferred shares are received at year-end if the total return to common shareholders of the closed-end fund for the calendar year exceeds the dividend rate of the preferred shares. These fees are recognized at the end of the measurement period, which is annually. Receivables due for management fees on closed-end preferred shares are included in investment advisory fees receivable on the consolidated statements of financial condition. There were $6.3 million and $7.3 million in management fees receivable on closed-end preferred shares as of December 31, 2014 and 2013, respectively. For The GDL Fund, there is an incentive fee earned as of the end of the calendar year and varies to the extent the total return of the fund is in excess of the 90 day T-Bill Index total return. This fee is recognized at the end of the measurement period, which is annually on a calendar year basis. Receivables due on incentive fees relating to The GDL Fund are included in investment advisory fees receivable on the consolidated statements of financial condition and were $0.8 million and $6.2 million as of December 31, 2014 and 2013, respectively.
41
G.research, Inc. provides institutional research services and earns brokerage commission revenues and sales manager fees on a trade-date basis from securities transactions executed on an agency basis on behalf of institutional clients and mutual funds, private wealth management clients and retail customers of affiliated companies. It has also been involved in syndicated underwriting activities that included public equity and debt offerings managed by major investment banks. Underwriting fees include underwriting revenues and syndicate profits and are accrued as earned. Underwriting fees include gains, losses, selling concessions and fees, net of syndicate expenses, arising from securities offerings in which the Company acts as underwriter or agent. It provides institutional investors and investment partnerships with investment ideas on numerous industries and special situations, with a particular focus on small-cap and mid-cap companies. Commission revenue and related clearing charges are recorded on a trade-date basis and are included in commission revenue and other operating expenses, respectively, on the consolidated statements of income.
Distribution fees revenues are derived primarily from the distribution of Gabelli, GAMCO, Comstock and Teton open-end mutual funds (“Funds”) advised by a subsidiary of GBL, Funds Advisor and a subsidiary of GGCP, Teton. G.distributors distributes our open-end Funds pursuant to distribution agreements with each Fund. Under each distribution agreement with an open-end Fund, G.distributors offers and sells such open-end Fund shares on a continuous basis and pays all of the costs of marketing and selling the shares, including printing and mailing prospectuses and sales literature, advertising and maintaining sales and customer service personnel and sales and services fulfillment systems, and payments to the sponsors of third party distribution programs, financial intermediaries and G.distributors’ sales personnel. G.distributors receive fees for such services pursuant to distribution plans adopted under provisions of Rule 12b-1 of the Company Act. G.distributors is the principal underwriter for funds distributed in multiple classes of shares which carry front-end or back-end sales charge or no-load to certain investors.
Under the distribution plans, the open-end Class AAA shares of the Funds (except The Gabelli U.S. Treasury Money Market Fund, Gabelli Capital Asset Fund and The Gabelli ABC Fund) and the Class A shares of certain Funds pay G.distributors a distribution or service fee of .25% per year (except the Class A shares of the Westwood Funds which pay .50% per year, except for the TETON Westwood Intermediate Bond Fund which pays .35%, and the Class A shares of the Gabelli Enterprise Mergers and Acquisitions Fund which pay .45% per year) on the average daily net assets of the fund. Class B and Class C shares have a 12b-1 distribution plan with a service and distribution fee totaling 1%. Class B shares were discontinued in 2014.
Distribution fees from the open-end mutual funds are computed daily based on average net assets. The amounts receivable for distribution fees are included in receivables from affiliates on the consolidated statements of financial condition.
Finally, GBL also has investment gains or losses generated from its proprietary trading activities which are included in net gain/(loss) from investments on the consolidated statements of income.
Investments in Securities Transactions and Other Than Temporary Impairment
Investments in securities are accounted for as either “trading securities” or “available for sale” and are stated at fair value. Management determines the appropriate classification of debt and equity securities at the time of purchase and reevaluates such designations as of each balance sheet date. U.S. Treasury Bills and Notes with maturities of greater than three months at the time of purchase are considered investments in securities. Securities that are not readily marketable are stated at their estimated fair values in accordance with Generally Accepted Accounting Principles (“GAAP”). A substantial portion of investments in securities are held for resale in anticipation of short-term market movements and therefore are classified as trading securities. Trading securities are stated at fair value, with any unrealized gains or losses reported in current period earnings in net gain/(loss) from investments on the consolidated statements of income. AFS investments are stated at fair value, with any unrealized gains or losses, net of taxes, reported as a component of other comprehensive income except for losses deemed to be other than temporary which are recorded as realized losses on the consolidated statements of income. Securities transactions and any related gains and losses are recorded on a trade date basis. Realized gains and losses from securities transactions are recorded on the specific identified cost basis and are included in net gain/(loss) from investments on the consolidated statements of income.
42
AFS securities are evaluated for other than temporary impairment each reporting period and any impairment charges are recorded in net gain/(loss) from investments on the consolidated statements of income. Management reviews all available for sale securities whose cost exceeds their fair value to determine if the impairment is other than temporary. Management uses qualitative factors such as diversification of the investment, the intent to hold the investment, the amount of time that the investment has been impaired and the severity of the decline in determining whether the impairment is other than temporary.
Securities sold, but not yet purchased are recorded on the trade date, and are stated at fair value and represent obligations of GBL to purchase the securities at prevailing market prices. Therefore, the future satisfaction of such obligations may be for an amount greater or less than the amounts recorded on the consolidated statements of financial condition. The ultimate gains or losses recognized are dependent upon the prices at which these securities are purchased to settle the obligations under the sales commitments. Realized gains and losses from covers of securities sold, not yet purchased transactions are included in net gain/(loss) from investments on the consolidated statements of income. Securities sold, not yet purchased are stated at fair value, with any unrealized gains or losses reported in current period earnings in net gain/(loss) from investments on the consolidated statements of income.
Consolidation
In accordance with the consolidation assessment models set forth in ASC 810-10 and 810-20, the Company consolidates all investments in partnerships and affiliates in which the Company has a controlling interest or is deemed to be the primary beneficiary. In order to make this determination, an analysis is performed to determine if the entity is a variable interest entity (“VIE”) or a voting interest entity (“VOE”). If the entity is a VIE, further analysis, as discussed below, is performed to determine if GBL is the primary beneficiary of the entity. If the entity is not a VIE, the Company will apply the VOE model as discussed below.
Variable Interest Entities
A VIE is an entity in which either (a) the equity investment at risk is not sufficient to permit the entity to finance its own activities without additional financial support; (b) the equity investors do not have the ability to make decisions about the entities’ activities or obligation to absorb the expected losses of the entity or the right to receive the expected residual returns of the entity or (c) the voting rights are not proportional to their obligations to absorb the expected losses of the entity or their rights to receive the expected residual returns of the entity. The Company evaluates whether entities in which it has an interest are VIEs and whether the Company is the primary beneficiary of any VIEs identified in its analysis. The Company is determined to be the primary beneficiary if it absorbs a majority of the VIE’s expected losses, expected residual returns, or both. If the Company is the primary beneficiary of a VIE, it consolidates that entity. If the Company is not the primary beneficiary, it accounts for its investment under the equity method.
In June 2009 the Financial Accounting Standards Board (“FASB”) amended the guidance on VIEs when it issued Accounting Standards Update (“ASU”) 2009-17. This guidance requires that if a decision maker has a variable interest in a VIE, the decision maker is not solely acting in a fiduciary capacity and would be required to consolidate the VIE if it has both the power to direct the most significant activities of the VIE and economic exposure that could potentially be significant to the VIE. The Company is general partner or co-general partner of various sponsored partnerships and the investment manager of various sponsored offshore funds whose underlying assets consist primarily of marketable securities (the “affiliated entities”). If the Company were to apply such guidance it would be required to consolidate most of its affiliated entities. In February 2010, the FASB issued ASU 2010-10, which indefinitely deferred the effective date of the amendments to ASC 810-10 made by ASU 2009-17, for a reporting entity’s interest in certain entities. Currently, interests in entities that qualify for the deferral are evaluated by applying the VIE model in ASC 810-10 (i.e., before the amendments by ASU 2009-17), while interests in entities that do not qualify for the deferral must be evaluated under the amendments in ASU 2009-17. Because all of the entities with which the Company is involved which would have been subject to the guidance in ASU 2009-17 were determined to qualify for the FASB’s deferral of such guidance, the Company applies the guidance for VIEs that existed prior to the issuance of ASU 2009-17.
Voting Interest Entities
If the entity is not considered a VIE, it is treated as a VOE, and the Company applies the guidance in ASC 810-20 in determining whether the entity should be consolidated. Under ASC 810-20, the general partner or investment manager is deemed to control the entity and therefore must consolidate it unless the unaffiliated limited partners or shareholders (a) have the ability to remove the general partner or investment manager, without cause, (b) have the ability to dissolve the entity or (c) have substantive participating rights. If the unaffiliated limited partners or shareholders possess any of the foregoing rights, then the Company does not consolidate the entity, and either the equity or cost method of accounting is applied. If the unaffiliated limited partners or shareholders do not have any such rights, the Company consolidates the entity.
43
Equity Method Investments
Substantially all of GBL’s equity method investees are entities that record their underlying investments at fair value. Therefore, under the equity method of accounting, GBL’s share of the investee’s underlying net income predominantly represents fair value adjustments in the investments held by the equity method investees. GBL’s share of the investee’s underlying net income or loss is based upon the most currently available information and is recorded as “Net gain/(loss) from investments” on the consolidated statements of income. Capital contributions are recorded as an increase in investments when paid, while withdrawals and distributions are recorded as reductions of the investments when received. Depending on the terms of the investment, the Company may be restricted as to the timing and amounts of withdrawals.
See Note D. Investments in Partnerships, Offshore Funds and Variable Interest Entities (“VIEs”) for more detail as to the number and types of entities consolidated as well as the impact on the consolidated statements of financial condition and consolidated statements of income.
Investments in Partnerships and Affiliates
The Company is general partner or co-general partner of various affiliated entities. We also have investments in unaffiliated partnerships, offshore funds and other entities (“unaffiliated entities”). Given that we are not a general partner or investment manager in any unaffiliated entities, we do not earn any management or incentive fees and we do not have a controlling financial interest, we do not currently consolidate any unaffiliated entities.
Our balance sheet caption “Investments in partnerships” includes those investments, in both affiliated and unaffiliated entities, which the Company accounts for under the equity method of accounting and certain investments in consolidated feeder funds (“CFFs”) that the Company accounts for at fair value, as described below.
For CFFs that own 100% of their offshore master funds, the Company retains the CFF’s specialized investment company accounting (i.e., the CFFs account for their investment in master funds at fair value).
The Company records noncontrolling interests in consolidated entities for which the Company’s ownership is less than 100%. Refer to Noncontrolling Interests section within Note A for additional disclosures.
Goodwill and Identifiable Intangible Assets
Goodwill is initially measured as the excess of the cost of the acquired business over the sum of the amounts assigned to assets acquired less the liabilities assumed. At December 31, 2014 and 2013, $3.3 million of goodwill recorded on the consolidated statements of financial condition relates to our 94%-owned subsidiary, GSI, $0.2 million relates to G.distributors and the $1.9 million identifiable intangible asset is an investment advisory contract for the Gabelli Enterprise Mergers and Acquisition Fund which relates to Funds Advisor. Goodwill and identifiable intangible assets are tested for impairment at least annually on November 30th and whenever certain triggering events are met. In assessing the recoverability of goodwill and identifiable intangible assets, projections regarding estimated future cash flows and other factors are made to determine the fair value of the respective assets. In assessing the recoverability of goodwill for our annual impairment test on November 30, 2014 and 2013, we performed a qualitative assessment of whether it was more likely than not that an impairment has occurred and concluded that a quantitative analysis was not required. As part of this assessment, it was also determined that no reporting units were at risk of failing the quantitative impairment testing step that compares the reporting unit’s fair value to its carrying value.
Income Taxes
Deferred tax assets and liabilities are recorded for temporary differences between the tax basis of assets and liabilities and the reported amounts on the consolidated financial statements using the statutory tax rates in effect for the year when the reported amount of the asset or liability is recovered or settled, respectively. The effect on deferred tax assets and liabilities of a change in tax rates is recognized in the results of operations in the period that includes the enactment date. A valuation allowance is recorded to reduce the carrying values of deferred tax assets to the amount that is more likely than not to be realized. For each tax position taken or expected to be taken in a tax return, the Company determines whether it is more likely than not that the position will be sustained upon examination based on the technical merits of the position, including resolution of any related appeals or litigation. A tax position that meets the more likely than not recognition threshold is measured to determine the amount of benefit to recognize. The tax position is measured at the largest amount of benefit that is greater than 50% likely of being realized upon settlement. The Company recognizes the accrual of interest on uncertain tax positions and penalties in income tax provision on the consolidated statements of income.
44
Stock Based Compensation
The Company has granted RSAs and stock options to staff members which were recommended by the Company’s Chairman, who did not receive an RSA or option award, and approved by the Compensation Committee of the Company’s Board of Directors. We use a fair value based method of accounting for stock-based compensation provided to our employees. The estimated fair value of RSAs is determined by using the closing price of our Class A Stock on the day prior to the grant date. The total expense, which is reduced by estimated forfeitures, is recognized over the vesting period for these awards which is either (1) 30% over three years from the date of grant and 70% over five years from the date of grant or (2) 30% over three years from the date of grant and 10% each year over years four through ten from the date of grant. The forfeiture rate is determined by reviewing historical forfeiture rates for previous stock-based compensation grants and is reviewed and updated quarterly, if necessary. During the vesting period, dividends to RSA holders are held for them until the RSA vesting dates and are forfeited if the grantee is no longer employed by the Company on the vesting dates. Dividends declared on these RSAs, less estimated forfeitures, are charged to retained earnings on the declaration date. During 2012, the Board of Directors accelerated the lapsing of restrictions on all outstanding RSAs at that time.
The estimated fair value of option awards is determined using the Black Scholes option-pricing model. This sophisticated model utilizes a number of assumptions in arriving at its results, including the estimated life of the option, the risk free interest rate at the date of grant and the volatility of the underlying common stock. There may be other factors, which have not been considered, which may have an effect on the value of the options as well. The effects of changing any of the assumptions or factors employed by the Black Scholes model may result in a significantly different valuation for the options. The total expense, which is reduced by estimated forfeitures, is recognized over the vesting period for these awards which is 75% over three years from the date of grant and 25% after four years from date of grant. The forfeiture rate is determined by reviewing historical forfeiture rates for previous stock-based compensation grants and is reviewed and updated quarterly, if necessary.
Recent Accounting Developments
In May 2014, the FASB issued ASU No. 2014-09, "Revenue from Contracts with Customers," which supersedes the revenue recognition requirements in the Accounting Standards Codification ("Codification") Topic 605, Revenue Recognition, and most industry-specific guidance throughout the industry topics of the Codification. The core principle of the new ASU No. 2014-09 is for companies to recognize revenue from the transfer of goods or services to customers in amounts that reflect the consideration to which the company expects to be entitled in exchange for those goods or services. The new standard provides a five-step approach to be applied to all contracts with customers and also requires expanded disclosures about revenue recognition. The ASU is effective for annual reporting periods beginning after December 15, 2016, including interim periods and is to be retrospectively applied. Early adoption is not permitted. The Company is currently evaluating this guidance and the impact it will have on its consolidated financial statements.
In June 2014, the FASB issued an accounting update clarifying that entities should treat performance targets that could be met after the requisite service period of a share-based payment award as performance conditions that affect vesting. Therefore, an entity would not record compensation expense (measured as of the grant date) for an award where transfer to the employee is contingent upon satisfaction of the performance target until it becomes probable that the performance target will be met. The guidance is effective for the Company beginning January 1, 2016. Early adoption is permitted. This guidance is not expected to have a material impact on the Company’s consolidated financial statements.
In February 2015, the FASB issued an accounting update amending the consolidation requirements under GAAP. This guidance is effective for the Company beginning January 1, 2016. Early adoption is permitted. The Company is continuing to analyze the impact, if any, that this update may have on its financial statements.
45
Seasonality and Inflation
We do not believe our operations are subject to significant seasonal fluctuations. We do not believe inflation will significantly affect our compensation costs, as they are substantially variable in nature. However, the rate of inflation may affect our expenses such as information technology and occupancy costs. To the extent inflation results in rising interest rates and has other effects upon the securities markets, it may adversely affect our financial position and results of operations by reducing our AUM, revenues or otherwise.
Reference is made to the information contained under the heading “Management's Discussion and Analysis of Financial Condition and Results of Operations -- Market Risk.”
46
GAMCO INVESTORS, INC. AND SUBSIDIARIES
INDEX TO CONSOLIDATED FINANCIAL STATEMENTS
|
Page
|
|
|
Report of Independent Registered Public Accounting Firm
|
48
|
|
Report of Independent Registered Public Accounting Firm on Effectiveness of Internal Control over Financial Reporting
|
49
|
|
Consolidated Financial Statements:
|
|
|
Consolidated Statements of Income for the years ended December 31, 2014, 2013 and 2012
|
50
|
|
Consolidated Statements of Comprehensive Income for the years ended December 31, 2014, 2013 and 2012
|
51
|
|
Consolidated Statements of Financial Condition at December 31, 2014 and 2013
|
52
|
|
Consolidated Statements of Equity for the years ended December 31, 2014, 2013 and 2012
|
53
|
|
Consolidated Statements of Cash Flows for the years ended December 31, 2014, 2013 and 2012
|
56
|
|
Notes to Consolidated Financial Statements
|
58
|
All schedules for which provision is made in the applicable accounting regulations of the Securities and Exchange Commission that are not required under the related instructions or are inapplicable have been omitted.
47
REPORT OF INDEPENDENT REGISTERED PUBLIC ACCOUNTING FIRM
To the Board of Directors and Stockholders of
GAMCO Investors, Inc.
Rye, New York
We have audited the accompanying consolidated statements of financial condition of GAMCO Investors, Inc. and subsidiaries (the "Company") as of December 31, 2014 and 2013, and the related consolidated statements of income, comprehensive income, equity, and cash flows for each of the three years in the period ended December 31, 2014. These financial statements are the responsibility of the Company's management. Our responsibility is to express an opinion on these financial statements based on our audits.
We conducted our audits in accordance with the standards of the Public Company Accounting Oversight Board (United States). Those standards require that we plan and perform the audit to obtain reasonable assurance about whether the financial statements are free of material misstatement. An audit includes examining, on a test basis, evidence supporting the amounts and disclosures in the financial statements. An audit also includes assessing the accounting principles used and significant estimates made by management, as well as evaluating the overall financial statement presentation. We believe that our audits provide a reasonable basis for our opinion.
In our opinion, such consolidated financial statements present fairly, in all material respects, the financial position of GAMCO Investors, Inc. and subsidiaries at December 31, 2014 and 2013, and the results of their operations and their cash flows for each of the three years in the period ended December 31, 2014, in conformity with accounting principles generally accepted in the United States of America.
We have also audited, in accordance with the standards of the Public Company Accounting Oversight Board (United States), the Company's internal control over financial reporting as of December 31, 2014, based on the criteria established in Internal Control — Integrated Framework (2013) issued by the Committee of Sponsoring Organizations of the Treadway Commission and our report dated March 6, 2015 expressed an unqualified opinion on the Company's internal control over financial reporting.
DELOITTE & TOUCHE LLP
New York, New York
March 6, 2015
48
REPORT OF INDEPENDENT REGISTERED PUBLIC ACCOUNTING FIRM
To the Board of Directors and Stockholders of
GAMCO Investors, Inc.
Rye, New York
We have audited the internal control over financial reporting of GAMCO Investors, Inc. and subsidiaries (the "Company") as of December 31, 2014, based on criteria established in Internal Control — Integrated Framework (2013) issued by the Committee of Sponsoring Organizations of the Treadway Commission. The Company's management is responsible for maintaining effective internal control over financial reporting and for its assessment of the effectiveness of internal control over financial reporting, included in the accompanying Management’s Report on Internal Control Over Financial Reporting. Our responsibility is to express an opinion on the Company's internal control over financial reporting based on our audit.
We conducted our audit in accordance with the standards of the Public Company Accounting Oversight Board (United States). Those standards require that we plan and perform the audit to obtain reasonable assurance about whether effective internal control over financial reporting was maintained in all material respects. Our audit included obtaining an understanding of internal control over financial reporting, assessing the risk that a material weakness exists, testing and evaluating the design and operating effectiveness of internal control based on the assessed risk, and performing such other procedures as we considered necessary in the circumstances. We believe that our audit provides a reasonable basis for our opinion.
A company's internal control over financial reporting is a process designed by, or under the supervision of, the company's principal executive and principal financial officers, or persons performing similar functions, and effected by the company's board of directors, management, and other personnel to provide reasonable assurance regarding the reliability of financial reporting and the preparation of financial statements for external purposes in accordance with generally accepted accounting principles. A company's internal control over financial reporting includes those policies and procedures that (1) pertain to the maintenance of records that, in reasonable detail, accurately and fairly reflect the transactions and dispositions of the assets of the company; (2) provide reasonable assurance that transactions are recorded as necessary to permit preparation of financial statements in accordance with generally accepted accounting principles, and that receipts and expenditures of the company are being made only in accordance with authorizations of management and directors of the company; and (3) provide reasonable assurance regarding prevention or timely detection of unauthorized acquisition, use, or disposition of the company's assets that could have a material effect on the financial statements.
Because of the inherent limitations of internal control over financial reporting, including the possibility of collusion or improper management override of controls, material misstatements due to error or fraud may not be prevented or detected on a timely basis. Also, projections of any evaluation of the effectiveness of the internal control over financial reporting to future periods are subject to the risk that the controls may become inadequate because of changes in conditions, or that the degree of compliance with the policies or procedures may deteriorate.
In our opinion, the Company maintained, in all material respects, effective internal control over financial reporting as of December 31, 2014, based on the criteria established in Internal Control — Integrated Framework (2013) issued by the Committee of Sponsoring Organizations of the Treadway Commission.
We have also audited, in accordance with the standards of the Public Company Accounting Oversight Board (United States), the consolidated financial statements as of and for the year ended December 31, 2014 of the Company and our report dated March 6, 2015, expressed an unqualified opinion on those financial statements.
DELOITTE & TOUCHE LLP
New York, New York
March 6, 2015
49
GAMCO INVESTORS, INC. AND SUBSIDIARIES
CONSOLIDATED STATEMENTS OF INCOME
(In thousands, except per share data)
|
Year Ended December 31,
|
||||||||||||
|
2014
|
2013
|
2012
|
||||||||||
|
Revenues
|
||||||||||||
|
Investment advisory and incentive fees
|
369,996
|
$
|
336,658
|
$
|
288,480
|
|||||||
|
Distribution fees and other income
|
61,226
|
51,964
|
44,848
|
|||||||||
|
Institutional research services
|
9,160
|
8,940
|
10,953
|
|||||||||
|
Total revenues
|
440,382
|
397,562
|
344,281
|
|||||||||
|
Expenses
|
||||||||||||
|
Compensation
|
173,553
|
161,798
|
137,223
|
|||||||||
|
Stock based compensation
|
7,199
|
2,072
|
13,583
|
|||||||||
|
Management fee
|
18,627
|
18,829
|
13,018
|
|||||||||
|
Distribution costs
|
58,611
|
48,936
|
40,842
|
|||||||||
|
Other operating expenses
|
22,866
|
23,515
|
28,485
|
|||||||||
|
Total expenses
|
280,856
|
255,150
|
233,151
|
|||||||||
|
Operating income
|
159,526
|
142,412
|
111,130
|
|||||||||
|
Other income (expense)
|
||||||||||||
|
Net gain from investments
|
10,773
|
56,179
|
22,741
|
|||||||||
|
Extinguishment of debt
|
(84
|
)
|
(998
|
)
|
(6,307
|
)
|
||||||
|
Interest and dividend income
|
5,589
|
7,095
|
5,651
|
|||||||||
|
Interest expense
|
(8,049
|
)
|
(10,511
|
)
|
(15,899
|
)
|
||||||
|
Shareholder-designated contribution
|
(134
|
)
|
(10,626
|
)
|
-
|
|||||||
|
Total other income (expense), net
|
8,095
|
41,139
|
6,186
|
|||||||||
|
Income before income taxes
|
167,621
|
183,551
|
117,316
|
|||||||||
|
Income tax provision
|
62,505
|
66,186
|
41,721
|
|||||||||
|
Net income
|
105,116
|
117,365
|
75,595
|
|||||||||
|
Net income (loss) attributable to noncontrolling interests
|
(4,274
|
)
|
512
|
56
|
||||||||
|
Net income attributable to GAMCO Investors, Inc.'s shareholders
|
$
|
109,390
|
$
|
116,853
|
$
|
75,539
|
||||||
|
Net income per share attributable to GAMCO Investors, Inc.'s shareholders:
|
||||||||||||
|
Basic
|
4.32
|
$
|
4.56
|
$
|
2.87
|
|||||||
|
Diluted
|
4.28
|
$
|
4.54
|
$
|
2.86
|
|||||||
|
Weighted average shares outstanding:
|
||||||||||||
|
Basic
|
25,335
|
25,653
|
26,283
|
|||||||||
|
Diluted
|
25,558
|
25,712
|
26,436
|
|||||||||
|
Actual shares outstanding
|
25,855
|
26,086
|
25,746
|
|||||||||
See accompanying notes.
50
GAMCO INVESTORS, INC. AND SUBSIDIARIES
CONSOLIDATED STATEMENTS OF COMPREHENSIVE INCOME
(In thousands, except per share data)
|
Year Ended December 31,
|
||||||||||||
|
2014
|
2013
|
2012
|
||||||||||
|
Net income
|
$ |
105,116
|
$
|
117,365
|
$
|
75,595
|
||||||
|
Other comprehensive income/(loss), net of tax:
|
||||||||||||
|
Foreign currency translation
|
(57
|
)
|
20
|
(28
|
)
|
|||||||
|
Net unrealized gains/(losses) on securities available for sale (a)
|
(5,168
|
)
|
3,919
|
3,808
|
||||||||
|
Total other comprehensive income/(loss)
|
(5,225
|
)
|
3,939
|
3,780
|
||||||||
|
Comprehensive income
|
99,891
|
121,304
|
79,375
|
|||||||||
|
Less: Comprehensive (income)/loss attributable to noncontrolling interests
|
4,274
|
(512
|
)
|
(56
|
)
|
|||||||
|
Comprehensive income attributable to GAMCO Investors, Inc.
|
$
|
104,165
|
$
|
120,792
|
$
|
79,319
|
||||||
(a)Net of income tax expense (benefit) of $(3,036), $2,301 and $2,236 for 2014, 2013 and 2012, respectively.
See accompanying notes.
51
GAMCO INVESTORS, INC. AND SUBSIDIARIES
CONSOLIDATED STATEMENTS OF FINANCIAL CONDITION
(In thousands, except per share data)
| December 31, | December 31, | |||||||
|
2014
|
2013
|
|||||||
|
ASSETS
|
||||||||
|
Cash and cash equivalents
|
$
|
298,224
|
$
|
210,451
|
||||
|
Investments in securities
|
259,537
|
231,228
|
||||||
|
Investments in sponsored registered investment companies
|
39,537
|
44,042
|
||||||
|
Investments in partnerships
|
107,637
|
95,992
|
||||||
|
Receivable from brokers
|
76,079
|
49,461
|
||||||
|
Investment advisory fees receivable
|
41,872
|
51,506
|
||||||
|
Receivable from affiliates
|
5,772
|
6,238
|
||||||
|
Capital lease
|
2,933
|
3,142
|
||||||
|
Goodwill and identifiable intangible asset
|
5,358
|
5,358
|
||||||
|
Income tax receivable
|
2,477
|
445
|
||||||
|
Other assets
|
27,004
|
11,622
|
||||||
|
Total assets
|
$
|
866,430
|
$
|
709,485
|
||||
|
LIABILITIES AND EQUITY
|
||||||||
|
Payable to brokers
|
$
|
43,409
|
$
|
10,765
|
||||
|
Income taxes payable and deferred tax liabilities
|
27,939
|
39,846
|
||||||
|
Capital lease obligation
|
5,253
|
5,323
|
||||||
|
Compensation payable
|
39,983
|
34,663
|
||||||
|
Securities sold, not yet purchased
|
10,595
|
6,178
|
||||||
|
Mandatorily redeemable noncontrolling interests
|
1,302
|
1,355
|
||||||
|
Accrued expenses and other liabilities
|
29,657
|
32,511
|
||||||
|
Sub-total
|
158,138
|
130,641
|
||||||
|
5.875% Senior notes (due June 1, 2021)
|
100,000
|
100,000
|
||||||
| Zero coupon subordinated debentures, Face value: $13.1 million at December 31, 2014 and | ||||||||
|
$13.8 million at December 31, 2013 (due December 31, 2015)
|
12,163
|
11,911
|
||||||
|
Total liabilities
|
270,301
|
242,552
|
||||||
|
Redeemable noncontrolling interests
|
68,334
|
6,751
|
||||||
|
Commitments and contingencies (Note J)
|
||||||||
|
Equity:
|
||||||||
|
Preferred stock, $.001 par value; 10,000,000 shares authorized; none issued and outstanding
|
-
|
-
|
||||||
| Class A Common Stock, $0.001 par value; 100,000,000 shares authorized; 15,341,433 and 15,012,719 | ||||||||
|
shares issued, respectively; 6,616,212 and 6,701,930 shares outstanding, respectively
|
14
|
14
|
||||||
| Class B Common Stock, $0.001 par value; 100,000,000 shares authorized; 24,000,000 shares issued | ||||||||
|
and 19,239,260 and 19,384,174 shares outstanding, respectively
|
19
|
19
|
||||||
|
Additional paid-in capital
|
291,681
|
282,496
|
||||||
|
Retained earnings
|
602,950
|
506,441
|
||||||
|
Accumulated comprehensive income
|
25,014
|
30,239
|
||||||
|
Treasury stock, at cost (8,725,221 and 8,310,789 shares, respectively)
|
(394,617
|
)
|
(361,878
|
)
|
||||
|
Total GAMCO Investors, Inc. stockholders' equity
|
525,061
|
457,331
|
||||||
|
Noncontrolling interests
|
2,734
|
2,851
|
||||||
|
Total equity
|
527,795
|
460,182
|
||||||
|
Total liabilities and equity
|
$
|
866,430
|
$
|
709,485
|
||||
See accompanying notes.
52
GAMCO INVESTORS, INC. AND SUBSIDIARIES
CONSOLIDATED STATEMENTS OF EQUITY
(In thousands)
|
GAMCO Investors, Inc. stockholders
|
||||||||||||||||||||||||||||||||
| Additional | Accumulated | Redeemable | ||||||||||||||||||||||||||||||
| Noncontrolling | Common | Paid-in | Retained | Comprehensive | Treasury | Noncontrolling | ||||||||||||||||||||||||||
|
Interests
|
Stock
|
Capital
|
Earnings
|
Income
|
Stock
|
Total
|
Interests
|
|||||||||||||||||||||||||
|
Balance at December 31, 2011
|
$
|
3,439
|
$
|
33
|
$
|
264,409
|
$
|
409,191
|
$
|
22,520
|
$
|
(292,181
|
)
|
$
|
407,411
|
$
|
6,071
|
|||||||||||||||
| Redemptions of redeemable | ||||||||||||||||||||||||||||||||
|
noncontrolling interests
|
-
|
-
|
-
|
-
|
-
|
-
|
-
|
(13,069
|
)
|
|||||||||||||||||||||||
| Contributions from redeemable | ||||||||||||||||||||||||||||||||
|
noncontrolling interests
|
-
|
-
|
-
|
-
|
-
|
-
|
-
|
24,189
|
||||||||||||||||||||||||
|
Net income (loss)
|
(113
|
)
|
-
|
-
|
75,539
|
-
|
-
|
75,426
|
171
|
|||||||||||||||||||||||
| Net unrealized gains on | ||||||||||||||||||||||||||||||||
| securities available for sale, | ||||||||||||||||||||||||||||||||
|
net of income tax ($2,236)
|
-
|
-
|
-
|
-
|
3,808
|
-
|
3,808
|
-
|
||||||||||||||||||||||||
|
Foreign currency translation
|
-
|
-
|
-
|
-
|
(28
|
)
|
-
|
(28
|
)
|
-
|
||||||||||||||||||||||
| Dividends declared ($2.88 per | ||||||||||||||||||||||||||||||||
|
share)
|
-
|
-
|
-
|
(76,435
|
)
|
-
|
-
|
(76,435
|
)
|
-
|
||||||||||||||||||||||
| Stock based compensation | ||||||||||||||||||||||||||||||||
|
expense
|
-
|
-
|
13,583
|
-
|
-
|
-
|
13,583
|
-
|
||||||||||||||||||||||||
| Increase to paid in capital for the | ||||||||||||||||||||||||||||||||
| excess of actual tax benefit over | ||||||||||||||||||||||||||||||||
|
recorded RSA tax benefit
|
-
|
-
|
1,072
|
-
|
-
|
-
|
1,072
|
-
|
||||||||||||||||||||||||
| Exercise of stock options | ||||||||||||||||||||||||||||||||
|
including tax benefit
|
-
|
-
|
1,025
|
-
|
-
|
-
|
1,025
|
-
|
||||||||||||||||||||||||
|
Purchase of treasury stock
|
-
|
-
|
-
|
-
|
-
|
(54,928
|
)
|
(54,928
|
)
|
-
|
||||||||||||||||||||||
|
Balance at December 31, 2012
|
$
|
3,326
|
$
|
33
|
$
|
280,089
|
$
|
408,295
|
$
|
26,300
|
$
|
(347,109
|
)
|
$
|
370,934
|
$
|
17,362
|
|||||||||||||||
See accompanying notes.
53
GAMCO INVESTORS, INC. AND SUBSIDIARIES
CONSOLIDATED STATEMENTS OF EQUITY
(continued) (In thousands)
|
GAMCO Investors, Inc. shareholders
|
||||||||||||||||||||||||||||||||
| Additional | Accumulated | Redeemable | ||||||||||||||||||||||||||||||
| Noncontrolling | Common | Paid-in | Retained | Comprehensive | Treasury | Noncontrolling | ||||||||||||||||||||||||||
|
Interests
|
Stock
|
Capital
|
Earnings
|
Income
|
Stock
|
Total
|
Interests
|
|||||||||||||||||||||||||
|
Balance at December 31, 2012
|
$
|
3,326
|
$
|
33
|
$
|
280,089
|
$
|
408,295
|
$
|
26,300
|
$
|
(347,109
|
)
|
$
|
370,934
|
$
|
17,362
|
|||||||||||||||
| Redemptions of redeemable | ||||||||||||||||||||||||||||||||
|
noncontrolling interests
|
(525
|
)
|
-
|
-
|
-
|
-
|
-
|
(525
|
)
|
(16,223
|
)
|
|||||||||||||||||||||
| Contributions from redeemable | ||||||||||||||||||||||||||||||||
|
noncontrolling interests
|
-
|
-
|
-
|
-
|
-
|
-
|
-
|
5,150
|
||||||||||||||||||||||||
|
Net income (loss)
|
50
|
-
|
-
|
116,853
|
-
|
-
|
116,903
|
462
|
||||||||||||||||||||||||
| Net unrealized gains on | ||||||||||||||||||||||||||||||||
| securities available for sale, | ||||||||||||||||||||||||||||||||
|
net of income tax ($10,160)
|
-
|
-
|
-
|
-
|
17,301
|
-
|
17,301
|
-
|
||||||||||||||||||||||||
| Amounts reclassified from | ||||||||||||||||||||||||||||||||
| accumulated other | ||||||||||||||||||||||||||||||||
| comprehensive income, | ||||||||||||||||||||||||||||||||
|
net of income tax benefit ($7,859)
|
-
|
-
|
-
|
-
|
(13,382
|
)
|
-
|
(13,382
|
)
|
-
|
||||||||||||||||||||||
| Income tax effect of transaction | ||||||||||||||||||||||||||||||||
|
with shareholders
|
-
|
-
|
243
|
-
|
-
|
-
|
243
|
-
|
||||||||||||||||||||||||
|
Foreign currency translation
|
-
|
-
|
-
|
-
|
20
|
-
|
20
|
-
|
||||||||||||||||||||||||
| Dividends declared ($0.72 per | ||||||||||||||||||||||||||||||||
|
share)
|
-
|
-
|
-
|
(18,707
|
)
|
-
|
-
|
(18,707
|
)
|
-
|
||||||||||||||||||||||
| Stock based compensation | ||||||||||||||||||||||||||||||||
|
expense
|
-
|
-
|
2,072
|
-
|
-
|
-
|
2,072
|
-
|
||||||||||||||||||||||||
| Exercise of stock options | ||||||||||||||||||||||||||||||||
|
including tax benefit ($16)
|
-
|
-
|
92
|
-
|
-
|
-
|
92
|
-
|
||||||||||||||||||||||||
|
Purchase of treasury stock
|
-
|
-
|
-
|
-
|
-
|
(14,769
|
)
|
(14,769
|
)
|
-
|
||||||||||||||||||||||
|
Balance at December 31, 2013
|
$
|
2,851
|
$
|
33
|
$
|
282,496
|
$
|
506,441
|
$
|
30,239
|
$
|
(361,878
|
)
|
$
|
460,182
|
$
|
6,751
|
|||||||||||||||
See accompanying notes.
54
GAMCO INVESTORS, INC. AND SUBSIDIARIES
CONSOLIDATED STATEMENTS OF EQUITY
(continued) (In thousands)
|
GAMCO Investors, Inc. shareholders
|
||||||||||||||||||||||||||||||||
| Additional | Accumulated | Redeemable | ||||||||||||||||||||||||||||||
| Noncontrolling | Common | Paid-in | Retained | Comprehensive | Treasury | Noncontrolling | ||||||||||||||||||||||||||
|
Interests
|
Stock
|
Capital
|
Earnings
|
Income
|
Stock
|
Total
|
Interests
|
|||||||||||||||||||||||||
|
Balance at December 31, 2013
|
$
|
2,851
|
$
|
33
|
$
|
282,496
|
$
|
506,441
|
$
|
30,239
|
$
|
(361,878
|
)
|
$
|
460,182
|
$
|
6,751
|
|||||||||||||||
| Redemptions of redeemable | ||||||||||||||||||||||||||||||||
|
noncontrolling interests
|
-
|
-
|
-
|
-
|
-
|
-
|
-
|
(6,353
|
)
|
|||||||||||||||||||||||
| Contributions from redeemable | ||||||||||||||||||||||||||||||||
|
noncontrolling interests
|
-
|
-
|
-
|
-
|
-
|
-
|
-
|
72,093
|
||||||||||||||||||||||||
|
Net income (loss)
|
(117
|
)
|
-
|
-
|
109,390
|
-
|
-
|
109,273
|
(4,157
|
)
|
||||||||||||||||||||||
| Net unrealized losses on | ||||||||||||||||||||||||||||||||
| securities available for sale, | ||||||||||||||||||||||||||||||||
|
net of income tax benefit ($356)
|
-
|
-
|
-
|
-
|
(604
|
)
|
-
|
(604
|
)
|
-
|
||||||||||||||||||||||
| Amounts reclassified from | ||||||||||||||||||||||||||||||||
| accumulated other | ||||||||||||||||||||||||||||||||
| comprehensive income, | ||||||||||||||||||||||||||||||||
|
net of income tax benefit ($2,680)
|
-
|
-
|
-
|
-
|
(4,564
|
)
|
-
|
(4,564
|
)
|
-
|
||||||||||||||||||||||
|
Foreign currency translation
|
-
|
-
|
-
|
-
|
(57
|
)
|
-
|
(57
|
)
|
-
|
||||||||||||||||||||||
| Dividends declared ($0.50 per | ||||||||||||||||||||||||||||||||
|
share)
|
-
|
-
|
-
|
(12,881
|
)
|
-
|
-
|
(12,881
|
)
|
-
|
||||||||||||||||||||||
| Stock based compensation | ||||||||||||||||||||||||||||||||
|
expense
|
-
|
-
|
7,199
|
-
|
-
|
-
|
7,199
|
-
|
||||||||||||||||||||||||
| Exercise of stock options | ||||||||||||||||||||||||||||||||
|
including tax benefit ($349)
|
-
|
-
|
1,986
|
-
|
-
|
-
|
1,986
|
-
|
||||||||||||||||||||||||
|
Purchase of treasury stock
|
-
|
-
|
-
|
-
|
-
|
(32,739
|
)
|
(32,739
|
)
|
-
|
||||||||||||||||||||||
|
Balance at December 31, 2014
|
$
|
2,734
|
$
|
33
|
$
|
291,681
|
$
|
602,950
|
$
|
25,014
|
$
|
(394,617
|
)
|
$
|
527,795
|
$
|
68,334
|
|||||||||||||||
See accompanying notes.
55
GAMCO INVESTORS, INC. AND SUBSIDIARIES
CONSOLIDATED STATEMENTS OF CASH FLOWS
(In thousands)
|
Year Ended December 31,
|
||||||||||||
|
2014
|
2013
|
2012
|
||||||||||
|
Operating activities
|
||||||||||||
|
Net income
|
105,116
|
$
|
117,365
|
$
|
75,595
|
|||||||
|
Adjustments to reconcile net income to net cash provided by (used in) operating activities:
|
||||||||||||
|
Equity in net gains from partnerships
|
(1,157
|
)
|
(5,748
|
)
|
(5,948
|
)
|
||||||
|
Depreciation and amortization
|
683
|
766
|
777
|
|||||||||
|
Stock based compensation expense
|
7,199
|
2,072
|
13,583
|
|||||||||
|
Deferred income taxes
|
(8,094
|
)
|
6,557
|
8,504
|
||||||||
|
Tax benefit from exercise of stock options
|
349
|
16
|
105
|
|||||||||
|
Foreign currency translation gain/(loss)
|
(57
|
)
|
20
|
(28
|
)
|
|||||||
|
Other-than-temporary loss on available for sale securities
|
69
|
97
|
20
|
|||||||||
|
Donated securities
|
1,541
|
1,931
|
448
|
|||||||||
|
Gains on sales of available for sale securities
|
(3,565
|
)
|
(17,688
|
)
|
(1,565
|
)
|
||||||
|
Accretion of zero coupon debentures
|
885
|
1,253
|
3,155
|
|||||||||
|
(Gain) loss on extinguishment of debt
|
84
|
998
|
6,307
|
|||||||||
|
(Increase) decrease in assets:
|
||||||||||||
|
Investments in trading securities
|
(28,328
|
)
|
101
|
17,174
|
||||||||
|
Investments in partnerships:
|
||||||||||||
|
Contributions to partnerships
|
(20,998
|
)
|
(12,257
|
)
|
(27,443
|
)
|
||||||
|
Distributions from partnerships
|
10,510
|
19,562
|
36,735
|
|||||||||
|
Receivable from brokers
|
(26,618
|
)
|
1,194
|
(29,742
|
)
|
|||||||
|
Investment advisory fees receivable
|
9,634
|
(9,078
|
)
|
(10,272
|
)
|
|||||||
|
Income tax receivable and deferred tax assets
|
(2,032
|
)
|
573
|
(979
|
)
|
|||||||
|
Other assets
|
(15,415
|
)
|
641
|
338
|
||||||||
|
Increase (decrease) in liabilities:
|
||||||||||||
|
Payable to brokers
|
32,644
|
(3,581
|
)
|
3,576
|
||||||||
|
Income taxes payable and deferred tax liabilities
|
(779
|
)
|
5,590
|
432
|
||||||||
|
Compensation payable
|
5,327
|
24,128
|
(7,162
|
)
|
||||||||
|
Mandatorily redeemable noncontrolling interests
|
(53
|
)
|
13
|
(44
|
)
|
|||||||
|
Accrued expenses and other liabilities
|
(3,187
|
)
|
6,471
|
2,179
|
||||||||
|
Total adjustments
|
(41,358
|
)
|
23,631
|
10,150
|
||||||||
|
Net cash provided by (used in) operating activities
|
$
|
63,758
|
$
|
140,996
|
$
|
85,745
|
||||||
56
GAMCO INVESTORS, INC. AND SUBSIDIARIES
CONSOLIDATED STATEMENTS OF CASH FLOWS
(continued) (In thousands)
|
Year Ended December 31,
|
||||||||||||
|
2014
|
2013
|
2012
|
||||||||||
|
Investing activities
|
||||||||||||
|
Purchases of available for sale securities
|
$
|
(6,452
|
)
|
$
|
(9,080
|
)
|
$
|
(1,268
|
)
|
|||
|
Proceeds from sales of available for sale securities
|
8,625
|
37,888
|
3,184
|
|||||||||
|
Return of capital on available for sale securities
|
519
|
1,459
|
2,531
|
|||||||||
|
Net cash provided by investing activities
|
2,692
|
30,267
|
4,447
|
|||||||||
|
Financing activities
|
||||||||||||
|
Contributions from redeemable noncontrolling interests
|
72,093
|
5,150
|
24,189
|
|||||||||
|
Redemptions of redeemable noncontrolling interests
|
(6,353
|
)
|
(16,223
|
)
|
(13,069
|
)
|
||||||
|
Repayment of 5.5% senior note due May 15, 2013
|
-
|
(99,000
|
)
|
-
|
||||||||
|
Redemptions of noncontrolling interests
|
-
|
(524
|
)
|
|||||||||
|
Repurchase of Zero coupon subordinated debentures due December 31, 2015
|
(716
|
)
|
(7,705
|
)
|
(56,215
|
)
|
||||||
|
Proceeds from exercise of stock options
|
1,637
|
76
|
920
|
|||||||||
|
Dividends paid
|
(12,618
|
)
|
(18,419
|
)
|
(76,809
|
)
|
||||||
|
Purchase of treasury stock
|
(32,739
|
)
|
(14,768
|
)
|
(54,928
|
)
|
||||||
|
Net cash provided by (used in) financing activities
|
21,304
|
(151,413
|
)
|
(175,912
|
)
|
|||||||
|
Effect of exchange rates on cash and cash equivalents
|
19
|
(7
|
)
|
(12
|
)
|
|||||||
|
Net increase (decrease) in cash and cash equivalents
|
87,773
|
19,843
|
(85,732
|
)
|
||||||||
|
Cash and cash equivalents at beginning of period
|
210,451
|
190,608
|
276,340
|
|||||||||
|
Cash and cash equivalents at end of period
|
$
|
298,224
|
$
|
210,451
|
$
|
190,608
|
||||||
|
Supplemental disclosures of cash flow information:
|
||||||||||||
|
Cash paid for interest
|
$
|
7,116
|
$
|
9,797
|
$
|
10,049
|
||||||
|
Cash paid for taxes
|
$
|
70,105
|
$
|
51,964
|
$
|
32,106
|
||||||
Non-cash activity:
- For 2012, the Company recorded $1,072 as a reduction to current tax payable and an increase to additional paid-in capital for the excess of the actual tax benefit over the recorded restricted stock award tax benefit.
- For 2014, 2013 and 2012 the Company accrued restricted stock award dividends of $263, $288 and $277, respectively.
See accompanying notes.
57
A. Significant Accounting Policies
Basis of Presentation
GAMCO Investors, Inc. (“GBL” or the “Company”) was incorporated in April 1998 in the state of New York, with no significant assets or liabilities and did not engage in any substantial business activities prior to the initial public offering (“Offering”) of our shares. On February 9, 1999, we exchanged 24 million shares of our Class B Common Stock (“Class B Stock”), representing all of our then issued and outstanding common stock, with Gabelli Funds, Inc. (“GFI”) and two of its subsidiaries in consideration for substantially all of the operating assets and liabilities of GFI, relating to its institutional and retail asset management, mutual fund advisory, underwriting and brokerage business (the “Reorganization”). GFI, which was renamed Gabelli Group Capital Partners, Inc. in 1999, is the majority shareholder of GBL and was renamed GGCP, Inc. (“GGCP”) in 2005. During 2010, the shares of GBL owned by GGCP were transferred to GGCP Holdings LLC, a subsidiary of GGCP. In 2013, the Company changed its state of incorporation from New York to Delaware in a tax-free reorganization.
The accompanying consolidated financial statements include the assets, liabilities and earnings of:
|
·
|
GBL;
|
|
·
|
Our wholly-owned subsidiaries: Gabelli Funds, LLC (“Funds Advisor”), GAMCO Asset Management Inc. (“GAMCO”), G.distributors, LLC (“G.distributors”), GAMCO Asset Management (UK) Limited, Gabelli Arbitrage Holdings LLC, Gabelli Trading Holdings LLC, Gabelli Fixed Income, Inc. (“Fixed Income”) and its subsidiaries, GAMCO International Partners LLC, GAMCO Acquisition LLC;
|
|
·
|
Our majority-owned or majority-controlled subsidiaries: Gabelli Securities, Inc. (“GSI”) and its subsidiaries; and
|
|
·
|
Certain investment partnerships (“Investment Partnerships”) and offshore funds in which we have a direct or indirect controlling financial interest. Please see Note D included herein.
|
At December 31, 2014, 2013 and 2012, we owned approximately 94%, 94% and 93%, respectively, of GSI. The consolidated financial statements comprise the financial statements of GBL and its subsidiaries as of December 31 of each year. The financial statements of the subsidiaries are prepared for the same reporting year as the parent company, using consistent accounting policies. All intercompany transactions and balances have been eliminated. Subsidiaries are fully consolidated from the date of acquisition, being the date on which GBL obtains control, and continue to be consolidated until the date that such control ceases.
Use of Estimates
The preparation of the consolidated financial statements in conformity with U.S. generally accepted accounting principles requires management to make estimates and assumptions that affect the amounts reported on the consolidated financial statements and accompanying notes. Actual results could differ from those estimates.
Nature of Operations
GAMCO, Funds Advisor, Gabelli Fixed Income LLC (“Fixed Income LLC”), a wholly-owned subsidiary of Fixed Income and GSI are registered investment advisors under the Advisers Act of 1940. G.research, Inc. (“G.research”), a wholly-owned subsidiary of GSI, and G.distributors are registered broker-dealers with the Securities and Exchange Commission (“SEC”) and are regulated by the Financial Industry Regulatory Authority (“FINRA”). G.research acts as an introducing broker, and all transactions for its customers are cleared through New York Stock Exchange (“NYSE”) member firms on a fully-disclosed basis. Accordingly, open customer transactions are not reflected in the accompanying consolidated statements of financial condition. G.research is exposed to credit losses on these open positions in the event of nonperformance by its customers, pursuant to conditions of its clearing agreements with its clearing brokers. This exposure is reduced by the clearing brokers' policy of obtaining and maintaining adequate collateral and credit of the counterparties until the open transaction is completed. Refer to Major Revenue-Generating Services and Revenue Recognition section within Note A for additional discussion of GBL's business.
58
Cash and Cash Equivalents
Cash equivalents primarily consist of an affiliated money market mutual fund which is highly liquid. U.S. Treasury Bills and Notes with maturities of three months or less at the time of purchase are also considered cash equivalents.
Securities Transactions
Investments in securities are accounted for as either “trading securities” or “available for sale” and are stated at fair value. Management determines the appropriate classification of debt and equity securities at the time of purchase. U.S. Treasury Bills and Notes with maturities of greater than three months at the time of purchase are considered investments in securities. Securities that are not readily marketable are stated at their estimated fair values in accordance with Generally Accepted Accounting Principles (“GAAP”). A substantial portion of investments in securities are held for resale in anticipation of short-term market movements and therefore are classified as trading securities. Trading securities are stated at fair value, with any unrealized gains or losses reported in current period earnings in net gain/(loss) from investments on the consolidated statements of income. Available for sale (“AFS”) investments are stated at fair value, with any unrealized gains or losses, net of taxes, reported as a component of other comprehensive income except for losses deemed to be other than temporary which are recorded as realized losses on the consolidated statements of income. Securities transactions and any related gains and losses are recorded on a trade date basis. Realized gains and losses from securities transactions are recorded on the specific identified cost basis and are included in net gain/(loss) from investments on the consolidated statements of income.
Available for sale securities are evaluated for other than temporary impairments each reporting period and any impairment charges are recorded in net gain/(loss) from investments on the consolidated statements of income. Management reviews all available for sale securities whose cost exceeds their fair value to determine if the impairment is other than temporary. Management uses qualitative factors such as diversification of the investment, the intent to hold the investment, the amount of time that the investment has been impaired and the severity of the decline in determining whether the impairment is other than temporary.
Securities sold, but not yet purchased are recorded on the trade date, and are stated at fair value and represent obligations of GBL to purchase the securities at prevailing market prices. Therefore, the future satisfaction of such obligations may be for an amount greater or less than the amounts recorded on the consolidated statements of financial condition. The ultimate gains or losses recognized are dependent upon the prices at which these securities are purchased to settle the obligations under the sales commitments. Realized gains and losses from covers of securities sold, not yet purchased transactions are included in net gain/(loss) from investments on the consolidated statements of income. Securities sold, not yet purchased are stated at fair value, with any unrealized gains or losses reported in current period earnings in net gain/(loss) from investments on the consolidated statements of income.
Consolidation
In accordance with the consolidation assessment models set forth in ASC 810-10 and 810-20, the Company consolidates all investments in partnerships and affiliates in which the Company has a controlling interest or is deemed to be the primary beneficiary. In order to make this determination, an analysis is performed to determine if the entity is a variable interest entity (“VIE”) or a voting interest entity (“VOE”). If the entity is a VIE, further analysis, as discussed below, is performed to determine if GBL is the primary beneficiary of the entity. If the entity is not a VIE, the Company will apply the VOE model as discussed below.
Variable Interest Entities
A VIE is an entity in which either (a) the equity investment at risk is not sufficient to permit the entity to finance its own activities without additional financial support or (b) the equity investors do not have the ability to make decisions about the entities’ activities or obligation to absorb the expected losses of the entity or the right to receive the expected residual returns of the entity or (c) the voting rights are not proportional to their obligations to absorb the expected losses of the entity or their rights to receive the expected residual returns of the entity. The Company evaluates whether entities in which it has an interest are VIEs and whether the Company is the primary beneficiary of any VIEs identified in its analysis. The Company is determined to be the primary beneficiary if it absorbs a majority of the VIE’s expected losses, expected residual returns, or both. If the Company is the primary beneficiary of a VIE, it consolidates that entity. If the Company is not the primary beneficiary, it accounts for its investment under the equity method.
In June 2009 the Financial Accounting Standards Board (“FASB”) amended the guidance on VIEs when it issued Accounting Standards Update (“ASU”) 2009-17. This guidance requires that if a decision maker has a variable interest in a VIE, the decision maker is not solely acting in a fiduciary capacity and would be required to consolidate the VIE if it has both the power to direct the most significant activities of the VIE and economic exposure that could potentially be significant to the VIE. The Company is general partner or co-general partner of various sponsored partnerships and the investment manager of various sponsored offshore funds whose underlying assets consist primarily of marketable securities (the “affiliated entities”). If the Company were to apply such guidance it would be required to consolidate most of its affiliated entities. In February 2010, the FASB issued ASU 2010-10, which indefinitely deferred the effective date of the amendments to ASC 810-10 made by ASU 2009-17, for a reporting entity’s interest in certain entities. Currently, interests in entities that qualify for the deferral are evaluated by applying the VIE model in ASC 810-10 (i.e., before the amendments by ASU 2009-17), while interests in entities that do not qualify for the deferral must be evaluated under the amendments in ASU 2009-17. Because all of the entities with which the Company is involved which would have been subject to the guidance in ASU 2009-17 were determined to qualify for the FASB’s deferral of such guidance, the Company applies the guidance for VIEs that existed prior to the issuance of ASU 2009-17.
59
Voting Interest Entities
If the entity is not considered a VIE, it is treated as a VOE, and the Company applies the guidance in ASC 810-20 in determining whether the entity should be consolidated. Under ASC 810-20, the general partner or investment manager is deemed to control the entity and therefore must consolidate it unless the unaffiliated limited partners or shareholders (a) have the ability to remove the general partner or investment manager, without cause, (b) have the ability to dissolve the entity or (c) have substantive participating rights. If the unaffiliated limited partners or shareholders possess any of the foregoing rights, then the Company does not consolidate the entity, and either the equity or cost method of accounting is applied. If the unaffiliated limited partners or shareholders do not have any such rights, the Company consolidates the entity.
Equity Method Investments
Substantially all of GBL’s equity method investees are entities that record their underlying investments at fair value. Therefore, under the equity method of accounting, GBL’s share of the investee’s underlying net income predominantly represents fair value adjustments in the investments held by the equity method investees. GBL’s share of the investee’s underlying net income or loss is based upon the most currently available information and is recorded as “Net gain/(loss) from investments” on the consolidated statements of income. Capital contributions are recorded as an increase in investments when paid, while withdrawals and distributions are recorded as reductions of the investments when received. Depending on the terms of the investment, the Company may be restricted as to the timing and amounts of withdrawals.
See Note D. Investments in Partnerships, Offshore Funds and Variable Interest Entities for more detail as to the number and types of entities consolidated as well as the impact on the consolidated statements of financial condition and consolidated statements of income.
Investments in Partnerships and Affiliates
The Company is general partner or co-general partner of various affiliated entities. The Company also has investments in unaffiliated partnerships, offshore funds and other entities (“unaffiliated entities”). Given that the Company is not a general partner or investment manager in any unaffiliated entities, it does not earn any management or incentive fees and does not have a controlling financial interest, it does not currently consolidate any unaffiliated entities.
The balance sheet caption “Investments in partnerships” includes those investments, in both affiliated and unaffiliated entities, which the Company accounts for under the equity method of accounting and certain investments in consolidated feeder funds (“CFFs”) that the Company accounts for at fair value, as described below.
For CFFs that own 100% of their offshore master funds, the Company retains the CFF’s specialized investment company accounting (i.e., the CFFs account for their investment in master funds at fair value as opposed to consolidating the accounts of the master funds).
The Company records noncontrolling interests in consolidated entities for which the Company’s ownership is less than 100%. Refer to Noncontrolling Interests section within Note A for additional disclosures.
Receivables from and Payables to Brokers
Receivables from and payables to brokers consist of amounts arising from the purchases and sales of securities as well as cash amounts held in anticipation of investment.
60
Major Revenue-Generating Services and Revenue Recognition
The Company’s revenues are derived primarily from investment advisory and incentive fees, institutional research services and distribution fees.
Investment advisory and incentive fees are directly influenced by the level and mix of assets under management (“AUM”) as fees are derived from a contractually-determined percentage of AUM for each account as well as incentive fees earned on certain accounts. Advisory fees from the open-end mutual funds, closed-end funds and sub-advisory accounts are computed daily or weekly based on average net assets and amounts receivable are included in investment advisory fees receivable on the consolidated statements of financial condition. Advisory fees from Institutional and Private Wealth Management accounts are generally computed quarterly based on account values as of the end of the preceding quarter, and amounts receivable are included in investment advisory fees receivable on the consolidated statements of financial condition. Management fees from investment partnerships and offshore funds are computed either monthly or quarterly, and amounts receivable are included in investment advisory fees receivable on the consolidated statements of financial condition. The Company derived approximately 84%, 85% and 84% of its total revenues from advisory and management fees, including incentive fees, for the periods ended December 31, 2014, 2013 and 2012, respectively. These revenues vary depending upon the level of sales compared with redemptions, financial market conditions, performance and the fee structure for AUM. Revenues derived from the equity-oriented portfolios generally have higher management fee rates than fixed income portfolios.
Revenues from investment partnerships and offshore funds also generally include an incentive allocation on the absolute gain in a portfolio or a fee of 20% of the economic profit as defined in the partnership agreement. The incentive allocation or fee is recognized at the end of the measurement period, which is annually, and amounts receivable are included in investment advisory fees receivable on the consolidated statements of financial condition. There were $2.7 million and $4.0 million in incentive allocations or fees receivable as of December 31, 2014 and 2013, respectively. The Company also receives incentive fees from certain Institutional and Private Wealth Management accounts, which are based upon meeting or exceeding a specific benchmark index or indices. Incentive fees refer to fees earned when the return generated for the client exceeds the benchmark and can be earned even if the return to the client is negative as long as the return exceeds the benchmark. These fees are recognized, for each respective account, at the end of the stipulated contract period which is either quarterly or annually and varies by account. Receivables due for incentive fees earned are included in investment advisory fees receivable on the consolidated statements of financial condition. There were $0.2 million and $3.4 million in incentive fees receivable as of December 31, 2014 and 2013, respectively. Management fees on a majority of the closed-end preferred shares are received at year-end if the total return to common shareholders of the closed-end fund for the calendar year exceeds the dividend rate of the preferred shares. These fees are recognized at the end of the measurement period, which is annually. Receivables due for management fees on closed-end preferred shares are included in investment advisory fees receivable on the consolidated statements of financial condition. There were $6.3 million and $7.3 million in management fees receivable on closed-end preferred shares as of December 31, 2014 and 2013, respectively. For The GDL Fund, there is a performance fee earned as of the end of the calendar year if the total return of the fund is in excess of the 90 day T-Bill Index total return. This fee is recognized at the end of the measurement period, which is annually on a calendar year basis. Receivables due on incentive fees relating to The GDL Fund are included in investment advisory fees receivable on the consolidated statements of financial condition and were $0.8 million and $6.2 million as of December 31, 2014 and 2013, respectively.
G.research provides institutional research services and earns brokerage commission revenues and sales manager fees on a trade-date basis from securities transactions executed on an agency basis on behalf of institutional clients and mutual funds, private wealth management clients and retail customers of affiliated companies. It has also been involved in syndicated underwriting activities that included public equity and debt offerings managed by major investment banks. Underwriting fees include underwriting revenues and syndicate profits and are accrued as earned. Underwriting fees include gains, losses, selling concessions and fees, net of syndicate expenses, arising from securities offerings in which the Company acts as underwriter or agent. It provides institutional investors and investment partnerships with investment ideas on numerous industries and special situations, with a particular focus on small-cap and mid-cap companies. Commission revenue and related clearing charges are recorded on a trade-date basis and are included in commission revenue and other operating expenses, respectively, on the consolidated statements of income.
Distribution fees revenues are derived primarily from the distribution of Gabelli, GAMCO and Comstock open-end mutual funds (“Funds”) advised by a subsidiary of GBL, Funds Advisor and a subsidiary of GGCP, Teton. Effective August 1, 2011, G.distributors distributes our open-end Funds pursuant to distribution agreements with each Fund. Under each distribution agreement with an open-end Fund, G.distributors offers and sells such open-end Fund shares on a continuous basis and pays all of the costs of marketing and selling the shares, including printing and mailing prospectuses and sales literature, advertising and maintaining sales and customer service personnel and sales and services fulfillment systems, and payments to the sponsors of third party distribution programs, financial intermediaries and G.distributors’ sales personnel. G.distributors receive fees for such services pursuant to distribution plans adopted under provisions of Rule 12b-1 (“12b-1”) of the Investment Company Act of 1940 (“Company Act”). G.distributors is the principal underwriter for funds distributed in multiple classes of shares which carry either a front-end or back-end sales charge. Prior to August 1, 2011, G.research was the distributor of the Gabelli, GAMCO and Comstock open-end Funds.
61
Under the distribution plans, the open-end Class AAA shares of the Funds (except The Gabelli U.S. Treasury Money Market Fund, Gabelli Capital Asset Fund and The Gabelli ABC Fund) and the Class A shares of certain Funds pay G.distributors a distribution or service fee of 0.25% per year (except the Class A shares of the Westwood Funds which pay 0.50% per year and the Class A shares of the Gabelli Enterprise Mergers and Acquisitions Fund which pays 0.45% per year) on the average daily net assets of the fund. Class B and Class C shares have a 12b-1 distribution plan with a service and distribution fee totaling 1%. Class B shares were discontinued in 2014.
Distribution fees from the open-end mutual funds are computed daily based on average net assets. The amounts receivable for distribution fees are included in receivables from affiliates on the consolidated statements of financial condition.
GBL also has investment gains or losses generated from its proprietary trading activities which are included in net gain/(loss) from investments on the consolidated statements of income.
Distribution Costs
We incur certain promotion and distribution costs, which are expensed as incurred, principally related to the sale of shares of open-end mutual funds, shares sold in the initial public offerings of our closed-end funds, and after-market support services related to our closed-end funds. Additionally, Funds Advisor has agreed to reimburse expenses on certain funds, beyond certain expense caps. The reimbursed expenses are presented on a gross basis in distribution costs in the consolidated statements of income.
Dividends and Interest Income and Interest Expense
Dividends are recorded on the ex-dividend date. Interest income and interest expense are accrued as earned or incurred.
Depreciation and Amortization
Fixed assets other than leasehold improvements, with net book value of $602,000 and $682,000 at December 31, 2014 and 2013, respectively, which are included in other assets, are recorded at cost and depreciated using the straight-line method over their estimated useful lives from four to seven years. Accumulated depreciation was $2.4 million and $2.4 million at December 31, 2014 and 2013, respectively. Leasehold improvements, with net book value of $1.6 million and $1.9 million at December 31, 2014 and 2013, respectively, which are included in other assets, are recorded at cost and amortized using the straight-line method over their estimated useful lives or lease terms, whichever is shorter. The leased property under the capital lease is depreciated utilizing the straight-line method over the term of the lease, which expires on December 31, 2028. The capital lease was extended on June 11, 2013 to December 31, 2028 from December 31, 2023. For the years ended December 31, 2014, 2013 and 2012, depreciation and amortization were $683,000, $766,000 and $777,000, respectively. We estimate that depreciation and amortization will be approximately $700,000 annually over the next three years.
Derivative Financial Instruments
The Company recognizes all derivatives as either assets or liabilities measured at fair value and are included in either investments in securities or securities sold, not yet purchased on the consolidated statements of financial condition. From time to time, the Company will enter into hedging transactions to manage its exposure to foreign currencies and equity prices related to its proprietary investments. During 2014, 2013 and 2012, the Company had derivative transactions which resulted in net gains of $729,000, net gains of $775,000 and net losses of $207,000, respectively. At December 31, 2014 and 2013 we held derivative contracts on 3.8 million equity shares and 1.3 million equity shares, respectively, and the net fair value was $262,000 and $120,000, respectively, and are included as investments in securities on the consolidated statements of financial condition. These transactions are not designated as hedges for accounting purposes, and changes in fair values of these derivatives are included in net gain (loss) from investments on the consolidated statements of income and included in investments in trading securities or securities sold, not yet purchased on the consolidated statements of financial condition.
Goodwill and Identifiable Intangible Assets
Goodwill is initially measured as the excess of the cost of the acquired business over the sum of the amounts assigned to assets acquired less the liabilities assumed. At December 31, 2014 and 2013, goodwill recorded on the consolidated statements of financial condition relates to two reporting units, GSI and G.distributors, and the identifiable intangible asset is an investment advisory contact for the Gabelli Enterprise Mergers and Acquisition Fund. Goodwill and identifiable intangible assets are tested for impairment at least annually on November 30th and whenever certain triggering events are met. In assessing the recoverability of the identifiable intangible asset for 2014 and 2013, projections regarding estimated future cash flows and other factors are made to determine the fair value of the asset.
62
In assessing the recoverability of goodwill for our annual impairment test on November 30, 2014 and 2013, we performed a qualitative assessment of whether it was more likely than not that an impairment has occurred and concluded that a quantitative analysis was not required.
Income Taxes
Deferred tax assets and liabilities are recorded for temporary differences between the tax basis of assets and liabilities and the reported amounts on the consolidated financial statements using the statutory tax rates in effect for the year when the reported amount of the asset or liability is recovered or settled, respectively. The effect on deferred tax assets and liabilities of a change in tax rates is recognized in the results of operations in the period that includes the enactment date. A valuation allowance is recorded to reduce the carrying values of deferred tax assets to the amount that is more likely than not to be realized. For each tax position taken or expected to be taken in a tax return, the Company determines whether it is more likely than not that the position will be sustained upon examination based on the technical merits of the position, including resolution of any related appeals or litigation. A tax position that meets the more likely than not recognition threshold is measured to determine the amount of benefit to recognize. The tax position is measured at the largest amount of benefit that is greater than 50% likely of being realized upon settlement. The Company recognizes the accrual of interest on uncertain tax positions and penalties in income tax provision on the consolidated statements of income.
Noncontrolling Interests
Noncontrolling interests that are mandatorily redeemable upon a certain date or event occurring are classified as liabilities and relates to certain shareholders of GSI who are employed by GBL, or its affiliates, who are required to sell their shares back to GSI at book value once they cease being employed by GBL, or its affiliates. Noncontrolling interests in investment partnerships and offshore funds that are redeemable at the option of the holder are classified as redeemable noncontrolling interests in the mezzanine section between liabilities and equity. All other noncontrolling interests are classified as equity and are presented within the equity section, separately from GBL’s portion of equity.
For the years ended December 31, 2014, 2013 and 2012, net income (loss) attributable to noncontrolling interests on the consolidated statements of income represents income attributable to certain minority stockholders of GSI as well as to certain limited partners of investment partnerships and offshore funds that are also consolidated. The income/expense attributable to the noncontrolling interests classified as liabilities is included in interest expense on the consolidated statements of income.
Fair Values of Financial Instruments
All of the instruments within cash and cash equivalents, investments in securities and securities sold, not yet purchased are measured at fair value. Certain investments in partnerships are also measured at fair value.
The Company’s assets and liabilities recorded at fair value have been categorized based upon a fair value hierarchy in accordance with the FASB’s guidance on fair value measurement. The levels of the fair value hierarchy and their applicability to the Company are described below:
|
-
|
Level 1 inputs utilize quoted prices (unadjusted) in active markets for identical assets or liabilities at the reporting date. Level 1 assets include cash equivalents, government obligations, open-end mutual funds, closed-end funds and equities.
|
|
-
|
Level 2 inputs utilize inputs other than quoted prices included in Level 1 that are observable for the asset or liability, either directly or indirectly. Level 2 inputs include quoted prices for similar assets and liabilities in active markets, quoted prices for identical or similar assets or liabilities that are not active and inputs other than quoted prices that are observable for the asset or liability, such as interest rates and yield curves that are observable at commonly-quoted intervals. Assets that generally are included in this category may include certain limited partnership interests in private funds and over the counter derivatives that have inputs to the valuations that can generally be corroborated by observable market data.
|
|
-
|
Level 3 inputs are unobservable inputs for the asset or liability, and include situations where there is little, if any, market activity for the asset or liability. Assets included in this category generally include equities that trade infrequently and direct private equity investments held within consolidated partnerships.
|
In certain cases, the inputs used to measure fair value may fall into different levels of the fair value hierarchy. In such cases, the level in the fair value hierarchy within which the fair value measurement in its entirety falls has been determined based on the lowest level input that is significant to the fair value measurement in its entirety. The Company’s assessment of the significance of a particular input to the fair value measurement in its entirety requires judgment and considers factors specific to the asset or liability. Investments are transferred into or out of any level at their beginning period values.
63
The availability of observable inputs can vary from instrument to instrument and is affected by a wide variety of factors, including, for example, the type of instrument, whether the instrument is new and not yet established in the marketplace, and other characteristics particular to the transaction. To the extent that valuation is based on models or inputs that are less observable or unobservable in the market, the determination of fair value requires more judgment. Accordingly, the degree of judgment exercised by the Company in determining fair value is greatest for instruments categorized as Level 3.
The valuation process and policies reside with the financial reporting and accounting group which reports to the Chief Financial Officer. The Company uses the “market approach” valuation technique to value its investments in Level 3 investments. The Company’s valuation of the Level 3 investments has been based upon either i) the recent sale prices of the issuer’s equity securities or ii) the net assets, book value or cost basis of the issuer when there is no recent sales prices available.
In the absence of a closing price, an average of the bid and ask price is used. Bid prices reflect the highest price that the market is willing to pay for an asset. Ask prices represent the lowest price that the market is willing to accept for an asset.
Cash equivalents – Cash equivalents primarily consist of an affiliated money market mutual fund which is invested solely in U.S. Treasuries and valued based on the net asset value of the fund. U.S. Treasury Bills and Notes with maturities of three months or less at the time of purchase are also considered cash equivalents. Cash equivalents are valued using unadjusted quoted market prices.
Investments in securities, Investments in sponsored registered investment companies and Securities sold, not yet purchased – Investments in securities, investments in sponsored registered investment companies and securities sold, not yet purchased are generally valued based on quoted prices from an exchange. To the extent these securities are actively traded, valuation adjustments are not applied, and they are categorized in Level 1 of the fair value hierarchy. Securities categorized in Level 2 investments are valued using other observable inputs. Nonpublic and infrequently traded investments are included in Level 3 of the fair value hierarchy because significant inputs to measure fair value are unobservable.
Investments in Partnerships – The Company’s investments include limited partner investments in consolidated feeder funds. The Company considers the net asset value of the master funds held by the consolidated feeder fund to be the best estimate of fair value. Investments in private funds that are redeemable at the measurement date or within the near term, are categorized in Level 2 of the fair value hierarchy. We may redeem our investments in these funds monthly with 30 days’ notice.
Earnings Per Share
Basic earnings per share is based on the weighted-average number of common shares outstanding during each period less unvested restricted stock. Diluted earnings per share is based on basic shares plus the incremental shares that would be issued upon the assumed exercise of in-the-money stock options and unvested restricted stock using the treasury stock method.
Management Fee
Management fee expense is incentive-based and entirely variable compensation in the amount of 10% of the aggregate pre-tax profits before management fee which is paid to Mr. Gabelli or his designee for acting as CEO pursuant to his 2008 Employment Agreement so long as he is an executive of GBL and devotes the substantial majority of his working time to the business. In accordance with his 2008 Employment Agreement, he has allocated approximately $4.0 million, $2.3 million and $0.7 million of his management fee to certain other employees of the Company in 2014, 2013 and 2012, respectively, and waived $1.4 million in 2013.
Stock Based Compensation
The Company has granted restricted stock awards (“RSAs”) and stock options to staff members which were recommended by the Company’s Chairman, who did not receive an RSA or option award, and approved by the Compensation Committee of the Company’s Board of Directors. We use a fair value based method of accounting for stock-based compensation provided to our employees.
64
The estimated fair value of RSAs is determined by using the closing price of our Class A Stock on the day prior to the grant date. The total expense, which is reduced by estimated forfeitures, is recognized over the vesting period for these awards which is either (1) 30% over three years from the date of grant and 70% over five years from the date of grant or (2) 30% over three years from the date of grant and 10% each year over years four through ten from the date of grant. The forfeiture rate is determined by reviewing historical forfeiture rates for previous stock-based compensation grants and is reviewed and updated quarterly, if necessary. During the vesting period, dividends to RSA holders are held for them until the RSA vesting dates and are forfeited if the grantee is no longer employed by the Company on the vesting dates. Dividends declared on these RSAs, less estimated forfeitures, are charged to retained earnings on the declaration date. During 2012, the Board of Directors accelerated the lapsing of restrictions on all RSAs outstanding at that time.
The estimated fair value of option awards on the grant date is determined using the Black Scholes option-pricing model. This sophisticated model utilizes a number of assumptions in arriving at its results, including the estimated life of the option, the risk free interest rate at the date of grant and the volatility of the underlying common stock. There may be other factors, which are not considered in the Black Scholes model, which may have an effect on the value of the options as well. The effects of changing any of the assumptions or factors employed by the Black Scholes model may result in a significantly different valuation for the options. The total expense based on the grant date fair value, which is reduced by estimated forfeitures, is recognized over the vesting period for these awards which is 75% over three years from the date of grant and 25% over four years from date of grant. The forfeiture rate is determined by reviewing historical forfeiture rates for previous stock-based compensation grants and is reviewed and updated quarterly, if necessary.
Concentration of Credit Risk
Financial instruments that potentially subject the Company to concentrations of credit risk consist primarily of cash and cash equivalents and receivable from brokers. The Company maintains cash and cash equivalents primarily in the Gabelli U.S. Treasury Money Market Fund, which invests fully in instruments issued by the U.S. government, and has receivables from brokers with various brokers and financial institutions, where these balances can exceed the federally insured limit. The concentration of credit risk with respect to advisory fees receivable is generally limited due to the short payment terms extended to clients by the Company. In addition, the credit risk is further limited by virtue of the fact that no single advisory relationship provided over 10% of the total revenue of the Company during the years 2014, 2013, or 2012. All investments in securities are held at third party brokers or custodians.
Business Segment
The Company operates in one business segment, the investment advisory and asset management business. The Company conducts its investment advisory business principally through: GAMCO (Institutional and Private Wealth Management), Funds Advisor (Funds) and GSI (Investment Partnerships). The Company also provides institutional research through G.research, one of the Company’s broker-dealer subsidiaries. The distribution of our open-end funds and underwriting of those Funds was conducted through G.distributors.
Recent Accounting Developments
In May 2014, the FASB issued ASU No. 2014-09, "Revenue from Contracts with Customers," which supersedes the revenue recognition requirements in the Accounting Standards Codification ("Codification") Topic 605, Revenue Recognition, and most industry-specific guidance throughout the industry topics of the Codification. The core principle of the new ASU No. 2014-09 is for companies to recognize revenue from the transfer of goods or services to customers in amounts that reflect the consideration to which the company expects to be entitled in exchange for those goods or services. The new standard provides a five-step approach to be applied to all contracts with customers and also requires expanded disclosures about revenue recognition. The ASU is effective for annual reporting periods beginning after December 15, 2016, including interim periods and is to be retrospectively applied. Early adoption is not permitted. The Company is currently evaluating this guidance and the impact it will have on its consolidated financial statements.
In June 2014, the FASB issued an accounting update clarifying that entities should treat performance targets that could be met after the requisite service period of a share-based payment award as performance conditions that affect vesting. Therefore, an entity would not record compensation expense (measured as of the grant date) for an award where transfer to the employee is contingent upon satisfaction of the performance target until it becomes probable that the performance target will be met. The guidance is effective for the Company beginning January 1, 2016. Early adoption is permitted. This guidance is not expected to have a material impact on the Company’s consolidated financial statements.
65
In February 2015, the FASB issued an accounting update amending the consolidation requirements under GAAP. This guidance is effective for the Company beginning January 1, 2016. Early adoption is permitted. The Company is continuing to analyze the impact, if any, that this update may have on its financial statements.
B. Investments in Securities
Investments in securities at December 31, 2014 and 2013 consisted of the following:
|
2014
|
2013
|
|||||||||||||||
|
Cost
|
Fair Value
|
Cost
|
Fair Value
|
|||||||||||||
|
(In thousands)
|
||||||||||||||||
|
Trading securities:
|
||||||||||||||||
|
Government obligations
|
$ |
18,994
|
$ |
18,996
|
$
|
37,986
|
37,994
|
|||||||||
|
Common stocks
|
170,977
|
195,029
|
96,225
|
124,634
|
||||||||||||
|
Mutual funds
|
2,432
|
3,498
|
21,074
|
23,285
|
||||||||||||
|
Other investments
|
743
|
1,704
|
287
|
582
|
||||||||||||
|
Total trading securities
|
193,146
|
219,227
|
155,572
|
186,495
|
||||||||||||
|
Available for sale securities:
|
||||||||||||||||
|
Common stocks
|
13,637
|
38,942
|
13,389
|
43,046
|
||||||||||||
|
Mutual funds
|
681
|
1,368
|
843
|
1,687
|
||||||||||||
|
Total available for sale securities
|
14,318
|
40,310
|
14,232
|
44,733
|
||||||||||||
|
Total investments in securities
|
$
|
207,464
|
$
|
259,537
|
$
|
169,804
|
$
|
231,228
|
||||||||
Securities sold, not yet purchased at December 31, 2014 and 2013 consisted of the following:
|
2014
|
2013
|
|||||||||||||||
|
Cost
|
Fair Value
|
Cost
|
Fair Value
|
|||||||||||||
|
(In thousands)
|
||||||||||||||||
|
Trading securities:
|
||||||||||||||||
|
Common stocks
|
$ |
9,835
|
$ |
9,960
|
$
|
5,319
|
$
|
6,023
|
||||||||
|
Other
|
1
|
635
|
0
|
155
|
||||||||||||
|
Total securities sold, not yet purchased
|
$
|
9,836
|
$
|
10,595
|
$
|
5,319
|
$
|
6,178
|
||||||||
66
Investments in sponsored registered investment companies at December 31, 2014 and 2013 consisted of the following:
|
2014
|
2013
|
|||||||||||||||
|
Cost
|
Fair Value
|
Cost
|
Fair Value
|
|||||||||||||
|
(In thousands)
|
||||||||||||||||
|
Trading securities:
|
||||||||||||||||
|
Mutual funds
|
$
|
1
|
$
|
1
|
$
|
19
|
$
|
10
|
||||||||
|
Total trading securities
|
1
|
1
|
19
|
10
|
||||||||||||
|
Available for sale securities:
|
||||||||||||||||
|
Closed-end funds
|
21,962
|
36,323
|
23,100
|
40,624
|
||||||||||||
|
Mutual funds
|
1,898
|
3,213
|
1,951
|
3,408
|
||||||||||||
|
Total available for sale securities
|
23,860
|
39,536
|
25,051
|
44,032
|
||||||||||||
| Total investments in sponsored | ||||||||||||||||
|
registered investment companies
|
$
|
23,861
|
$
|
39,537
|
$
|
25,070
|
$
|
44,042
|
||||||||
The following table identifies all reclassifications out of accumulated other comprehensive income and into net income for the year ended December 31, 2014 and 2013 (in thousands):
|
Amount
|
Affected Line Item in
|
|
Reason for
|
||||||||
|
Reclassified
|
in the Statements
|
|
Reclassification
|
||||||||
|
from AOCI
|
Of Income
|
|
from AOCI
|
||||||||
|
Twelve months ended December 31,
|
|||||||||||
|
2014
|
2013
|
||||||||||
|
$
|
3,565
|
$ | 17,688 |
|
Net gain from investments
|
|
Realized gain / (loss) on sale of AFS securities
|
||||
|
3,748
|
3,650 |
|
Other operating expenses
|
|
Donation of AFS securities
|
||||||
|
|
(69)
|
(97) |
|
Net gain from investments
|
|
Other than temporary impairment of AFS securities
|
|||||
|
|
7,244
|
21,241 |
|
Income before income taxes
|
|
||||||
|
|
(2,680)
|
(7,859) |
|
Income tax provision
|
|
||||||
|
$
|
4,564
|
$ | 13,382 |
|
Net income
|
|
|||||
The Company is a party to enforceable master netting arrangements for swaps entered into as part of the Company’s investment strategy. The swaps are typically not used as hedging instruments. These swaps, while settled on a net basis with the counterparties, major U.S. financial institutions, are shown gross in assets and liabilities on the consolidated statements of financial condition. The swaps have a firm contract end date and are closed out and settled when each contract expires.
|
Gross Amounts Not Offset in the
|
||||||||||||||||||||||||
|
Statements of Financial Condition
|
||||||||||||||||||||||||
|
Gross
|
Gross Amounts
|
Net Amounts of
|
||||||||||||||||||||||
|
Amounts of
|
Offset in the
|
Assets Presented
|
||||||||||||||||||||||
|
Recognized
|
Statements of
|
in the Statements
|
Financial
|
Cash Collateral
|
||||||||||||||||||||
|
Assets
|
Financial Condition
|
of Financial Condition
|
Instruments
|
Received
|
Net Amount
|
|||||||||||||||||||
|
Swaps:
|
||||||||||||||||||||||||
|
December 31, 2014
|
$
|
896
|
$
|
-
|
$
|
896
|
$
|
(634
|
)
|
$
|
-
|
$
|
262
|
|||||||||||
|
December 31, 2013
|
275
|
-
|
275
|
(155
|
)
|
-
|
120
|
|||||||||||||||||
|
Gross Amounts Not Offset in the
|
||||||||||||||||||||||||
|
Statements of Financial Condition
|
||||||||||||||||||||||||
|
Gross
|
Gross Amounts
|
Net Amounts of
|
||||||||||||||||||||||
|
Amounts of
|
Offset in the
|
Liabilities Presented
|
||||||||||||||||||||||
|
Recognized
|
Statements of
|
in the Statements
|
Financial
|
Cash Collateral
|
||||||||||||||||||||
|
Liabilities
|
Financial Condition
|
of Financial Condition
|
Instruments
|
Pledged
|
Net Amount
|
|||||||||||||||||||
|
Swaps:
|
||||||||||||||||||||||||
|
December 31, 2014
|
$
|
634
|
$
|
-
|
$
|
634
|
$
|
(634
|
)
|
$
|
-
|
$
|
-
|
|||||||||||
|
December 31, 2013
|
155
|
-
|
155
|
(155
|
)
|
-
|
-
|
|||||||||||||||||
67
The following is a summary of the cost, gross unrealized gains, gross unrealized losses and fair value of available for sale investments as of December 31, 2014 and December 31, 2013:
|
December 31, 2014
|
||||||||||||||||
| Gross | Gross | |||||||||||||||
| Unrealized | Unrealized | Fair | ||||||||||||||
|
Cost
|
Gains
|
Losses
|
Value
|
|||||||||||||
|
(In thousands)
|
||||||||||||||||
|
Common stocks
|
$ |
13,637
|
$ |
25,305
|
$
|
-
|
$
|
38,942
|
||||||||
|
Closed-end Funds
|
21,962
|
14,398
|
(37
|
)
|
36,323
|
|||||||||||
|
Mutual funds
|
2,579
|
2,030
|
(28
|
)
|
4,581
|
|||||||||||
|
Total available for sale securities
|
$
|
38,178
|
$
|
41,733
|
$
|
(65
|
)
|
$
|
79,846
|
|||||||
|
December 31, 2013
|
||||||||||||||||
| Gross | Gross | |||||||||||||||
| Unrealized | Unrealized | Fair | ||||||||||||||
|
Cost
|
Gains
|
Losses
|
Value
|
|||||||||||||
|
(In thousands)
|
||||||||||||||||
|
Common stocks
|
$
|
13,389
|
$
|
29,657
|
$
|
-
|
$
|
43,046
|
||||||||
|
Closed-end Funds
|
23,100
|
17,654
|
(130
|
)
|
40,624
|
|||||||||||
|
Mutual funds
|
2,794
|
2,325
|
(24
|
)
|
5,095
|
|||||||||||
|
Total available for sale securities
|
$
|
39,283
|
$
|
49,636
|
$
|
(154
|
)
|
$
|
88,765
|
|||||||
Increases in unrealized losses, net of taxes, for AFS securities for the years ended December 31, 2014 of $0.6 million have been included in other comprehensive income at December 31, 2014. Increases in unrealized gains, net of taxes, for AFS securities for the years ended December 31, 2013 and 2012 of $17.3 million and $3.8 million have been included in other comprehensive income at December 31, 2013 and 2012, respectively. The amount reclassified from other comprehensive income for the years ended December 31, 2014 and 2013 was $4.6 million and $13.4 million, respectively. Return of capital on available for sale securities were $0.5 million, $1.5 million and $2.5 million for the years ended December 31, 2014, 2013 and 2012, respectively. Proceeds from sales of investments available for sale were approximately $8.6 million, $37.9 million and $3.2 million for the years ended December 31, 2014, 2013 and 2012, respectively. For the years ended December 31, 2014, 2013 and 2012, gross gains on the sale of investments available for sale amounted to $3.6 million, $17.7 million and $1.6 million, respectively, and were reclassed from other comprehensive income into the consolidated statements of income. Gross losses on the sale of available for sale securities was $49,000 for the year ended December 31, 2013. There were no losses on the sale of investments available for sale for the years ended December 31, 2014 and 2012. The basis on which the cost of a security sold is determined is specific identification. Accumulated other comprehensive income on the consolidated statements of equity is primarily comprised of unrealized gains/losses, net of taxes, for AFS securities.
GBL has an established accounting policy and methodology to determine other-than-temporary impairment. Under this policy, available for sale securities are evaluated for other than temporary impairments and any impairment charges are recorded in net gain/(loss) from investments on the consolidated statements of income. Management reviews all available for sale securities whose cost exceeds their market value to determine if the impairment is other than temporary. Management uses qualitative factors such as diversification of the investment, the amount of time that the investment has been impaired, the intent to sell and the severity of the decline in determining whether the impairment is other than temporary.
Investments classified as available for sale that are in an unrealized loss position for which other-than-temporary impairment has not been recognized consisted of the following:
|
December 31, 2014
|
December 31, 2013
|
|||||||||||||||||||||||
| Unrealized | Unrealized | |||||||||||||||||||||||
|
Cost
|
Losses
|
Fair Value
|
Cost
|
Losses
|
Fair Value
|
|||||||||||||||||||
|
(in thousands)
|
||||||||||||||||||||||||
|
Closed-end Funds
|
$
|
812
|
$
|
(37
|
)
|
$
|
775
|
$
|
912
|
(130
|
)
|
$
|
782
|
|||||||||||
|
Mutual Funds
|
303
|
(28
|
)
|
275
|
303
|
(24
|
)
|
279
|
||||||||||||||||
|
Total available for sale securities
|
$
|
1,115
|
$
|
(65
|
)
|
$
|
1,050
|
$
|
1,215
|
$
|
(154
|
)
|
$
|
1,061
|
||||||||||
68
At December 31, 2014, there were four holdings in loss positions which were not deemed to be other-than-temporarily impaired due to the length of time that they had been in a loss position and because they passed scrutiny in our evaluation of issuer-specific and industry-specific considerations. In these specific instances, the investments at December 31, 2014 were mutual funds and closed-end funds with diversified holdings across multiple companies and across multiple industries. One holding was impaired for one month, one for three months and two for four months at December 31, 2014. The value of these holdings at December 31, 2014 was $1.1 million. If these holdings were to continue to be impaired, we may need to record an impairment in a future period on the consolidated statement of income for the amount of unrealized loss, which at December 31, 2014 was $0.1 million.
At December 31, 2013, there were four holdings in loss positions which were not deemed to be other-than-temporarily impaired due to the length of time that they had been in a loss position and because they passed scrutiny in our evaluation of issuer-specific and industry-specific considerations. In these specific instances, the investments at December 31, 2013 were mutual funds and closed-end funds with diversified holdings across multiple companies and across multiple industries. One holding was impaired for one month, one for two months, one for four months and one for seven months at December 31, 2013. The value of these holdings at December 31, 2013 was $1.1 million.
For the years ended December 31, 2014, 2013 and 2012, there were $69,000, $97,000 and $20,000 of losses, respectively, on available for sale securities deemed to be other than temporary.
C. Fair Value
The following tables present information about the Company’s assets and liabilities by major categories measured at fair value on a recurring basis as of December 31, 2014 and 2013 and indicates the fair value hierarchy of the valuation techniques utilized by the Company to determine such fair value:
Assets and Liabilities Measured at Fair Value on a Recurring Basis as of December 31, 2014 (in thousands)
| Quoted Prices | ||||||||||||||||
| in Active | Significant | |||||||||||||||
| Markets for | Other Observable | Significant | Balance as of | |||||||||||||
| Identical Assets | Inputs | Unobservable | Decembr 31, | |||||||||||||
|
Assets
|
(Level 1)
|
(Level 2)
|
Inputs (Level 3)
|
2014
|
||||||||||||
|
Cash equivalents
|
297,971
|
$
|
-
|
$
|
-
|
$
|
297,971
|
|||||||||
|
Investments in partnerships
|
-
|
23,803
|
-
|
23,803
|
||||||||||||
|
Investments in securities:
|
||||||||||||||||
|
AFS - Common stocks
|
38,942
|
-
|
-
|
38,942
|
||||||||||||
|
AFS - Mutual funds
|
1,368
|
-
|
-
|
1,368
|
||||||||||||
|
Trading - Gov't obligations
|
18,996
|
-
|
-
|
18,996
|
||||||||||||
|
Trading - Common stocks
|
193,735
|
1
|
1,293
|
195,029
|
||||||||||||
|
Trading - Mutual funds
|
3,498
|
-
|
-
|
3,498
|
||||||||||||
|
Trading - Other
|
513
|
897
|
294
|
1,704
|
||||||||||||
|
Total investments in securities
|
257,052
|
898
|
1,587
|
259,537
|
||||||||||||
|
Investments in sponsored registered investment companies:
|
||||||||||||||||
|
AFS - Closed-end Funds
|
36,323
|
-
|
-
|
36,323
|
||||||||||||
|
AFS - Mutual Funds
|
3,213
|
-
|
-
|
3,213
|
||||||||||||
|
Trading - Mutual funds
|
1
|
-
|
-
|
1
|
||||||||||||
|
Total investments in sponsored registered investment companies
|
39,537
|
-
|
-
|
39,537
|
||||||||||||
|
Total investments
|
296,589
|
24,701
|
1,587
|
322,877
|
||||||||||||
|
Total assets at fair value Liabilities
|
$
|
594,560
|
$
|
24,701
|
$
|
1,587
|
$
|
620,848
|
||||||||
| Liabilities | ||||||||||||||||
|
Trading - Common stocks
|
$
|
9,960
|
$
|
-
|
$
|
-
|
$
|
9,960
|
||||||||
|
Trading - Other
|
-
|
635
|
-
|
635
|
||||||||||||
|
Securities sold, not yet purchased
|
$
|
9,960
|
$
|
635
|
$
|
-
|
$
|
10,595
|
||||||||
69
Assets and Liabilities Measured at Fair Value on a Recurring Basis as of December 31, 2013 (in thousands)
| Quoted Prices | ||||||||||||||||
|
in Active
|
||||||||||||||||
| Markets for | Significant | Significant | Balance as of | |||||||||||||
| Identical Assets | Other Observable | Unobservable | Decembr 31, | |||||||||||||
|
Assets
|
(Level 1)
|
Inputs (Level 2)
|
Inputs (Level 3)
|
2013
|
||||||||||||
|
Cash equivalents
|
$
|
209,913
|
$
|
-
|
$
|
-
|
$
|
209,913
|
||||||||
|
Investments in partnerships
|
-
|
25,253
|
-
|
25,253
|
||||||||||||
|
Investments in securities:
|
||||||||||||||||
|
AFS - Common stocks
|
43,046
|
-
|
-
|
43,046
|
||||||||||||
|
AFS - Mutual funds
|
1,687
|
-
|
-
|
1,687
|
||||||||||||
|
Trading - Gov't obligations
|
37,994
|
-
|
-
|
37,994
|
||||||||||||
|
Trading - Common stocks
|
123,927
|
7
|
700
|
124,634
|
||||||||||||
|
Trading - Mutual funds
|
23,285
|
-
|
-
|
23,285
|
||||||||||||
|
Trading - Other
|
23
|
275
|
284
|
582
|
||||||||||||
|
Total investments in securities
|
229,962
|
282
|
984
|
231,228
|
||||||||||||
|
Investments in sponsored registered investment companies:
|
||||||||||||||||
|
AFS - Closed-end Funds
|
40,624
|
-
|
-
|
40,624
|
||||||||||||
|
AFS - Mutual Funds
|
3,408
|
-
|
-
|
3,408
|
||||||||||||
|
Trading - Mutual funds
|
10
|
-
|
-
|
10
|
||||||||||||
|
Total investments in sponsored registered investment companies
|
44,042
|
-
|
-
|
44,042
|
||||||||||||
|
Total investments
|
274,004
|
25,535
|
984
|
300,523
|
||||||||||||
|
Total assets at fair value Liabilities
|
$
|
483,917
|
$
|
25,535
|
$
|
984
|
$
|
510,436
|
||||||||
| Liabilities | ||||||||||||||||
|
Trading - Common stocks
|
$
|
6,023
|
$
|
-
|
$
|
-
|
$
|
6,023
|
||||||||
|
Trading - Other
|
-
|
155
|
-
|
155
|
||||||||||||
|
Securities sold, not yet purchased
|
$
|
6,023
|
$
|
155
|
$
|
-
|
$
|
6,178
|
||||||||
The following tables present additional information about assets by major categories measured at fair value on a recurring basis and for which the Company has utilized Level 3 inputs to determine fair value.
Changes in Level 3 Assets Measured at Fair Value on a Recurring Basis for the year ended December 31, 2014 (in thousands)
|
|
Total | |||||||||||||||||||||||||||||||||||
| Unrealized | ||||||||||||||||||||||||||||||||||||
| Gains or | Total | |||||||||||||||||||||||||||||||||||
| Total Realized and | (Losses) | Realized | Net | |||||||||||||||||||||||||||||||||
| December | Unrealized Gains or | Included in | and | Transfers | ||||||||||||||||||||||||||||||||
| 31, 2013 |
(Losses) in Income
|
Other | Unrealized | In and/or | ||||||||||||||||||||||||||||||||
| Beginning | AFS | Comprehensive | Gains or | (Out) of | Ending | |||||||||||||||||||||||||||||||
|
Asset
|
Balance
|
Trading
|
Investments
|
Income
|
(Losses)
|
Purchases
|
Sales
|
Level 3
|
Balance
|
|||||||||||||||||||||||||||
|
Financial
|
||||||||||||||||||||||||||||||||||||
| instruments owned: | ||||||||||||||||||||||||||||||||||||
| Trading - Common | ||||||||||||||||||||||||||||||||||||
|
stocks
|
$
|
700
|
41
|
$
|
-
|
$
|
-
|
$
|
41
|
$
|
-
|
(343
|
)
|
$
|
895
|
$
|
1,293
|
|||||||||||||||||||
|
Trading - Other
|
284
|
-
|
-
|
-
|
-
|
10
|
-
|
-
|
294
|
|||||||||||||||||||||||||||
|
Total
|
$
|
984
|
$
|
41
|
$
|
-
|
$
|
-
|
$
|
41
|
$
|
10
|
$
|
(343
|
)
|
$
|
895
|
$
|
1,587
|
|||||||||||||||||
During the year ended December 31, 2014, there were no transfers between Level 1 and Level 2 holdings. During the year ended December 31, 2014, the Company reclassed approximately $895,000 of investments from Level 1 to Level 3. The reclassifications were due to decreased availability of market price quotations and were based on the values at the beginning of the period in which the reclass occurred.
70
Changes in Level 3 Assets Measured at Fair Value on a Recurring Basis for the year ended December 31, 2013 (in thousands)
| Total | ||||||||||||||||||||||||||||||||||||
| Unrealized | ||||||||||||||||||||||||||||||||||||
| Gains or | Total | |||||||||||||||||||||||||||||||||||
| Total Realized and | (Losses) | Realized | Net | |||||||||||||||||||||||||||||||||
| December | Unrealized Gains or | Included in | and | Transfers | ||||||||||||||||||||||||||||||||
| 31, 2012 |
(Losses) in Income
|
Other | Unrealized | In and/or | ||||||||||||||||||||||||||||||||
| Beginning | AFS | Comprehensive | Gains or | (Out) of | Ending | |||||||||||||||||||||||||||||||
|
Asset
|
Balance
|
Trading
|
Investments
|
Income
|
(Losses)
|
Purchases
|
Sales
|
Level 3
|
Balance
|
|||||||||||||||||||||||||||
| Financial | ||||||||||||||||||||||||||||||||||||
|
instruments owned:
|
||||||||||||||||||||||||||||||||||||
| Trading - Common | ||||||||||||||||||||||||||||||||||||
|
stocks
|
$
|
675
|
$
|
25
|
$
|
-
|
$
|
-
|
$
|
25
|
$
|
-
|
$
|
-
|
$
|
-
|
$
|
700
|
||||||||||||||||||
|
Trading - Other
|
362
|
(2
|
)
|
-
|
-
|
(2
|
)
|
3
|
(79
|
)
|
-
|
284
|
||||||||||||||||||||||||
|
Total
|
$
|
1,037
|
$
|
23
|
$
|
-
|
$
|
-
|
$
|
23
|
$
|
3
|
$
|
(79
|
)
|
$
|
-
|
$
|
984
|
|||||||||||||||||
There were no transfers between any Levels during the year ended December 31, 2013.
D. Investment in Partnerships, Offshore Funds and Variable Interest Entities
The Company is general partner or co-general partner of various affiliated entities, in which the Company has investments totaling $94.2 million and $82.0 million at December 31, 2014 and 2013, respectively, and whose underlying assets consist primarily of marketable securities (the “affiliated entities”). We also have investments in unaffiliated entities of $13.4 million and $14.0 million at December 31, 2014 and 2013, respectively (the “unaffiliated entities”). We evaluate each entity for the appropriate accounting treatment and disclosure. Certain of the affiliated entities, and none of the unaffiliated entities, are consolidated.
For those entities where consolidation is not deemed to be appropriate, we report them in our consolidated statement of financial condition under the caption “Investments in partnerships”. This caption includes those investments, in both affiliated and unaffiliated entities, which the Company accounts for under the equity method of accounting, as well as certain investments that the feeder funds hold that are carried at fair value, as described in Note C. The Company reflects the equity in earnings of these equity method investees and the change in fair value of the consolidated feeder funds (“CFFs”) under the caption “Net gain/(loss) from investments” on the consolidated statements of income.
The following table highlights the number of entities, including voting interest entities (“VOEs”), that we consolidate as well as under which accounting guidance they are consolidated, including CFFs, which retain their specialized investment company accounting, partnerships and offshore funds.
|
Entities consolidated
|
|||||||||||||||
|
CFFs
|
Partnerships
|
Offshore Funds
|
Total
|
||||||||||||
|
VIEs
|
VOEs
|
VIEs
|
VOEs
|
VIEs
|
VOEs
|
VIEs
|
VOEs
|
||||||||
|
Entities consolidated at December 31, 2011
|
1
|
2
|
-
|
1
|
-
|
1
|
1
|
4
|
|||||||
|
Additional consolidated entities
|
-
|
-
|
-
|
-
|
-
|
-
|
-
|
-
|
|||||||
|
Deconsolidated entities
|
-
|
-
|
-
|
-
|
-
|
-
|
-
|
-
|
|||||||
|
Entities consolidated at December 31, 2012
|
1
|
2
|
-
|
1
|
-
|
1
|
1
|
4
|
|||||||
|
Additional consolidated entities
|
-
|
-
|
-
|
-
|
-
|
-
|
-
|
-
|
|||||||
|
Deconsolidated entities
|
-
|
-
|
-
|
-
|
-
|
-
|
-
|
-
|
|||||||
|
Entities consolidated at December 31, 2013
|
1
|
2
|
-
|
1
|
-
|
1
|
1
|
4
|
|||||||
|
Additional consolidated entities
|
-
|
-
|
-
|
-
|
-
|
-
|
-
|
-
|
|||||||
|
Deconsolidated entities
|
-
|
-
|
-
|
-
|
-
|
-
|
-
|
-
|
|||||||
|
Entities consolidated at December 31, 2014
|
1
|
2
|
-
|
1
|
-
|
1
|
1
|
4
|
|||||||
At and for the year ended December 31, 2014, the one CFF VIE is consolidated, as the Company has been determined to be the primary beneficiary because it has an equity interest and absorbs the majority of the expected losses and/or expected gains. At and for the year ended December 31, 2014, the two CFF VOEs, the one Partnership VOE and the one Offshore Fund VOE are consolidated because the unaffiliated partners or shareholders lack substantive rights, and the Company, as either the general partner or investment manager, is deemed to have control.
71
The following table breaks down the investments in partnerships line by accounting method, either fair value or equity method, and investment type (in thousands):
| December 31, 2014 | ||||||||||||||||||||||||
|
Investment Type
|
||||||||||||||||||||||||
|
Affiliated
|
Unaffiliated
|
|||||||||||||||||||||||
| Consolidated | ||||||||||||||||||||||||
|
Accounting method
|
Feeder Funds
|
Partnerships
|
Offshore Funds
|
Partnerships
|
Offshore Funds
|
Total
|
||||||||||||||||||
|
Fair Value
|
$
|
23,803
|
$
|
-
|
$
|
-
|
$
|
-
|
$
|
-
|
$
|
23,803
|
||||||||||||
|
Equity Method
|
-
|
34,385
|
36,033
|
6,552
|
6,864
|
83,834
|
||||||||||||||||||
|
Total
|
$
|
23,803
|
$
|
34,385
|
$
|
36,033
|
$
|
6,552
|
$
|
6,864
|
$
|
107,637
|
||||||||||||
| December 31, 2013 | ||||||||||||||||||||||||
|
Investment Type
|
||||||||||||||||||||||||
|
Affiliated
|
Unaffiliated
|
|||||||||||||||||||||||
| Consolidated | ||||||||||||||||||||||||
|
Accounting method
|
Feeder Funds
|
Partnerships
|
Offshore Funds
|
Partnerships
|
Offshore Funds
|
Total
|
||||||||||||||||||
|
Fair Value
|
$
|
25,253
|
$
|
-
|
$
|
-
|
$
|
-
|
$
|
-
|
$
|
25,253
|
||||||||||||
|
Equity Method
|
-
|
21,669
|
35,030
|
6,509
|
7,531
|
70,739
|
||||||||||||||||||
|
Total
|
$
|
25,253
|
$
|
21,669
|
$
|
35,030
|
$
|
6,509
|
$
|
7,531
|
$
|
95,992
|
||||||||||||
72
The following table includes the net impact by line item on the consolidated statements of financial condition for each category of entity consolidated (in thousands):
|
December 31, 2014
|
||||||||||||||||||||
| Prior to | ||||||||||||||||||||
|
Consolidation
|
CFFs
|
Partnerships
|
Offshore Funds
|
As Reported
|
||||||||||||||||
|
Assets
|
||||||||||||||||||||
|
Cash and cash equivalents
|
$
|
298,149
|
$
|
(11
|
)
|
$ |
86
|
$
|
-
|
298,224
|
||||||||||
|
Investments in securities
|
239,980
|
-
|
7,801
|
51,293
|
299,074
|
|||||||||||||||
|
Investments in partnerships
|
111,380
|
4,438
|
(8,181
|
)
|
-
|
107,637
|
||||||||||||||
|
Receivable from brokers
|
24,301
|
-
|
623
|
51,155
|
76,079
|
|||||||||||||||
|
Investment advisory fees receivable
|
42,102
|
(6
|
)
|
(2
|
)
|
(222
|
)
|
41,872
|
||||||||||||
|
Other assets
|
43,393
|
-
|
-
|
151
|
43,544
|
|||||||||||||||
|
Total assets
|
$
|
759,305
|
$
|
4,421
|
$
|
327
|
$
|
102,377
|
$
|
866,430
|
||||||||||
|
Liabilities and equity
|
||||||||||||||||||||
|
Securities sold, not yet purchased
|
$
|
9,991
|
$
|
-
|
$
|
-
|
$
|
604
|
$
|
10,595
|
||||||||||
|
Accrued expenses and other liabilities
|
109,356
|
22
|
24
|
38,141
|
147,543
|
|||||||||||||||
|
Total debt
|
112,163
|
-
|
-
|
-
|
112,163
|
|||||||||||||||
|
Redeemable noncontrolling interests
|
-
|
4,399
|
303
|
63,632
|
68,334
|
|||||||||||||||
|
Total equity
|
527,795
|
-
|
-
|
-
|
527,795
|
|||||||||||||||
|
Total liabilities and equity
|
$
|
759,305
|
$
|
4,421
|
$
|
327
|
$
|
102,377
|
$
|
866,430
|
||||||||||
|
December 31, 2013
|
||||||||||||||||||||
| Prior to | ||||||||||||||||||||
|
Consolidation
|
CFFs
|
Partnerships
|
Offshore Funds
|
As Reported
|
||||||||||||||||
|
Assets
|
||||||||||||||||||||
|
Cash and cash equivalents
|
$
|
209,667
|
$
|
450
|
$
|
334
|
$
|
-
|
$
|
210,451
|
||||||||||
|
Investments in securities
|
276,244
|
-
|
7,473
|
(8,447
|
)
|
275,270
|
||||||||||||||
|
Investments in partnerships
|
98,494
|
6,517
|
(9,019
|
)
|
-
|
95,992
|
||||||||||||||
|
Receivable from brokers
|
35,151
|
-
|
-
|
14,310
|
49,461
|
|||||||||||||||
|
Investment advisory fees receivable
|
52,509
|
(24
|
)
|
(14
|
)
|
(965
|
)
|
51,506
|
||||||||||||
|
Other assets
|
27,433
|
(2,339
|
)
|
1,592
|
119
|
26,805
|
||||||||||||||
|
Total assets
|
$
|
699,498
|
$
|
4,604
|
$
|
366
|
$
|
5,017
|
$
|
709,485
|
||||||||||
|
Liabilities and equity
|
||||||||||||||||||||
|
Securities sold, not yet purchased
|
$
|
6,049
|
$
|
-
|
$
|
-
|
$
|
129
|
$
|
6,178
|
||||||||||
|
Accrued expenses and other liabilities
|
121,356
|
165
|
29
|
2,913
|
124,463
|
|||||||||||||||
|
Total debt
|
111,911
|
-
|
-
|
-
|
111,911
|
|||||||||||||||
|
Redeemable noncontrolling interests
|
-
|
4,439
|
337
|
1,975
|
6,751
|
|||||||||||||||
|
Total equity
|
460,182
|
-
|
-
|
-
|
460,182
|
|||||||||||||||
|
Total liabilities and equity
|
$
|
699,498
|
$
|
4,604
|
$
|
366
|
$
|
5,017
|
$
|
709,485
|
||||||||||
The CFFs, Partnerships and Offshore Funds columns above include only affiliated entities as no unaffiliated entities are consolidated.
73
The following table includes the net impact by line item on the consolidated statements of income for each category of entity consolidated (in thousands):
|
Twelve Months Ended December 31, 2014
|
||||||||||||||||||||
| Prior to | ||||||||||||||||||||
|
Consolidation
|
CFFs
|
Partnerships
|
Offshore Funds
|
As Reported
|
||||||||||||||||
|
Total revenues
|
$
|
441,380
|
$ |
(28
|
)
|
$ |
(3
|
)
|
$ |
(967
|
)
|
$ |
440,382
|
|||||||
|
Total expenses
|
279,823
|
62
|
44
|
927
|
280,856
|
|||||||||||||||
|
Operating income
|
161,557
|
(90
|
)
|
(47
|
)
|
(1,894
|
)
|
159,526
|
||||||||||||
|
Total other income, net
|
10,221
|
13
|
50
|
(2,189
|
)
|
8,095
|
||||||||||||||
|
Income before income taxes
|
171,778
|
(77
|
)
|
3
|
(4,083
|
)
|
167,621
|
|||||||||||||
|
Income tax provision
|
62,505
|
-
|
-
|
-
|
62,505
|
|||||||||||||||
|
Net income
|
109,273
|
(77
|
)
|
3
|
(4,083
|
)
|
105,116
|
|||||||||||||
|
Net income attributable to noncontrolling interests
|
(117
|
)
|
(77
|
)
|
3
|
(4,083
|
)
|
(4,274
|
)
|
|||||||||||
|
Net income attributable to GAMCO
|
$
|
109,390
|
$
|
-
|
$
|
-
|
$
|
-
|
$
|
109,390
|
||||||||||
|
Twelve Months Ended December 31, 2013
|
||||||||||||||||||||
| Prior to | ||||||||||||||||||||
|
Consolidation
|
CFFs
|
Partnerships
|
Offshore Funds
|
As Reported
|
||||||||||||||||
|
Total revenues
|
$
|
399,565
|
$
|
(53
|
)
|
$
|
(15
|
)
|
$
|
(1,935
|
)
|
$
|
397,562
|
|||||||
|
Total expenses
|
254,153
|
175
|
47
|
775
|
255,150
|
|||||||||||||||
|
Operating income
|
145,412
|
(228
|
)
|
(62
|
)
|
(2,710
|
)
|
142,412
|
||||||||||||
|
Total other income, net
|
37,676
|
475
|
111
|
2,877
|
41,139
|
|||||||||||||||
|
Income before income taxes
|
183,088
|
247
|
49
|
167
|
183,551
|
|||||||||||||||
|
Income tax provision
|
66,186
|
-
|
-
|
-
|
66,186
|
|||||||||||||||
|
Net income
|
116,902
|
247
|
49
|
167
|
117,365
|
|||||||||||||||
|
Net income (loss) attributable to noncontrolling interests
|
49
|
247
|
49
|
167
|
512
|
|||||||||||||||
|
Net income attributable to GAMCO
|
$
|
116,853
|
$
|
-
|
$
|
-
|
$
|
-
|
$
|
116,853
|
||||||||||
|
Twelve Months Ended December 31, 2012
|
||||||||||||||||||||
| Prior to | ||||||||||||||||||||
|
Consolidation
|
CFFs
|
Partnerships
|
Offshore Funds
|
As Reported
|
||||||||||||||||
|
Total revenues
|
$
|
346,195
|
$
|
2
|
$
|
(6
|
)
|
$
|
(1,910
|
)
|
$
|
344,281
|
||||||||
|
Total expenses
|
232,313
|
132
|
39
|
667
|
233,151
|
|||||||||||||||
|
Operating income
|
113,882
|
(130
|
)
|
(45
|
)
|
(2,577
|
)
|
111,130
|
||||||||||||
|
Total other income (expense), net
|
3,264
|
216
|
67
|
2,639
|
6,186
|
|||||||||||||||
|
Income before income taxes
|
117,146
|
86
|
22
|
62
|
117,316
|
|||||||||||||||
|
Income tax provision
|
41,721
|
-
|
-
|
-
|
41,721
|
|||||||||||||||
|
Net income
|
75,425
|
86
|
22
|
62
|
75,595
|
|||||||||||||||
|
Net income (loss) attributable to noncontrolling interests
|
(114
|
)
|
86
|
22
|
62
|
56
|
||||||||||||||
|
Net income attributable to GAMCO
|
$
|
75,539
|
$
|
-
|
$
|
-
|
$
|
-
|
$
|
75,539
|
||||||||||
The CFFs, Partnerships and Offshore Funds columns above include only affiliated entities as no unaffiliated entities are consolidated.
Variable Interest Entities
We sponsor a number of investment vehicles where we are the general partner or investment manager. Certain of these vehicles are VIEs, but we are not the primary beneficiary, in all but one case, because we do not absorb a majority of the entities’ expected losses or expected returns, and they are, therefore, not consolidated. We consolidate the one VIE where we are the primary beneficiary. The Company has not provided any financial or other support to these entities. The total assets of these non-consolidated VIEs at December 31, 2014 and 2013 were $71.6 million and $72.7 million, respectively. Our maximum exposure to loss as a result of our involvement with the VIEs is limited to the investment in one VIE and the deferred carried interest that we have in another. On December 31, 2014, we had an investment in two of the non-consolidated VIE offshore funds of approximately $10.6 million which was included in investments in partnerships on the consolidated statements of financial condition. On December 31, 2013, we had an investment in one of the non-consolidated VIE offshore funds of approximately $10.0 million which was included in investments in partnerships on the consolidated statements of financial condition. On December 31, 2014 and 2013, we had a deferred carried interest in one of the VIE offshore funds of approximately $43,000 and $45,000, respectively, which was included in investments in partnerships on the consolidated statements of financial condition. Additionally, as the general partner or investment manager to these VIEs the Company earns fees in relation to these roles, which given a decline in AUMs of the VIEs would result in lower fee revenues earned by the Company which would be reflected on the consolidated statements of income, consolidated statements of financial condition and consolidated statements of cash flows.
74
The assets of these VIEs may only be used to satisfy obligations of the VIEs. The following table presents the balances related to these VIEs that are consolidated and were included on the consolidated statements of financial condition as well as GAMCO’s net interest in these VIEs. Only one VIE is consolidated at both December 31, 2014 and December 31, 2013:
| December 31, | December 31, | |||||||
|
2014
|
2013
|
|||||||
|
(In thousands)
|
||||||||
|
Investments in partnerships
|
$
|
13,434
|
$
|
15,540
|
||||
|
Accrued expenses and other liabilities
|
(12
|
)
|
(2,022
|
)
|
||||
|
Redeemable noncontrolling interests
|
(794
|
)
|
(1,120
|
)
|
||||
|
GAMCO's net interests in consolidated VIEs
|
$
|
12,628
|
$
|
12,398
|
||||
E. Income Taxes
GBL and its greater than 80% owned operating subsidiaries file a consolidated federal income tax return. Accordingly, the income tax provision represents the aggregate of the amounts provided for all companies.
The provision for income taxes for the years ended December 31, 2014, 2013 and 2012 consisted of the following:
|
2014
|
2013
|
2012
|
||||||||||
|
(In thousands)
|
||||||||||||
|
Federal:
|
||||||||||||
|
Current
|
$
|
63,965
|
$
|
52,411
|
$
|
28,362
|
||||||
|
Deferred
|
(7,879
|
)
|
6,564
|
8,386
|
||||||||
|
State and local:
|
||||||||||||
|
Current
|
6,634
|
7,217
|
4,855
|
|||||||||
|
Deferred
|
(215
|
)
|
(6
|
)
|
118
|
|||||||
|
Total
|
$
|
62,505
|
$
|
66,186
|
$
|
41,721
|
||||||
A reconciliation of the Federal statutory income tax rate to the effective tax rate is set forth below:
|
2014
|
2013
|
2012 | ||||||
|
Statutory Federal income tax rate
|
35.0
|
% |
35.0
|
% | 35.0 | % | ||
|
State income tax, net of Federal benefit
|
2.5
|
2.3
|
2.3 | |||||
|
Other
|
(0.2)
|
(1.2)
|
(1.7) | |||||
|
Effective income tax rate
|
37.3
|
% |
36.1
|
% | 35.6 | % |
Significant components of our deferred tax assets and liabilities are as follows:
|
2014
|
2013
|
|||||||
|
(In thousands)
|
||||||||
|
Deferred tax assets:
|
||||||||
|
Stock compensation expense
|
$ |
3,542
|
$
|
1,063
|
||||
|
Deferred compensation
|
2,732
|
1,055
|
||||||
|
Intangible asset amortization
|
-
|
62
|
||||||
|
Capital lease obligation
|
859
|
807
|
||||||
|
Other
|
144
|
184
|
||||||
|
Total deferred tax assets
|
7,277
|
3,171
|
||||||
|
Deferred tax liabilities:
|
||||||||
|
Investments in securities available for sale
|
(10,931
|
)
|
(13,403
|
)
|
||||
|
Investments in securities and partnerships
|
(15,748
|
)
|
(19,553
|
)
|
||||
|
Contingent deferred sales commissions
|
(780
|
)
|
(962
|
)
|
||||
|
Total deferred tax liabilities
|
(27,459
|
)
|
(33,918
|
)
|
||||
|
Net deferred tax assets (liabilities)
|
$
|
(20,182
|
)
|
$
|
(30,747
|
)
|
||
75
As a result of the accelerated vesting of the RSAs and in accordance with GAAP, an increase of $108,000 was recorded in additional paid in capital for the year ended December 31, 2012 as the actual tax benefit realized by the Company was greater than the previously recorded deferred tax benefit.
As of December 31, 2014 and 2013, the total amount of gross unrecognized tax benefits related to uncertain tax positions was approximately $16.0 million and $12.9 million, respectively, of which recognition of $10.4 million and $8.4 million, respectively, would impact the Company’s effective tax rate.
As of December 31, 2014 and 2013, the net liability for unrecognized tax benefits related to uncertain tax positions was $15.0 million and $12.0 million, respectively, and is included in accrued expenses and other liabilities on the consolidated statements of financial condition.
A reconciliation of the beginning and ending amount of gross unrecognized tax benefits related to uncertain tax positions is as follows:
|
(in millions)
|
||||
|
Balance at January 1, 2012
|
$
|
9.1
|
||
|
Additions based on tax positions related to the current year
|
1.1
|
|||
|
Additions for tax positions of prior years
|
0.5
|
|||
|
Reductions for tax positions of prior years
|
-
|
|||
|
Settlements
|
(0.1
|
)
|
||
|
Balance at December 31, 2012
|
10.6
|
|||
|
Additions based on tax positions related to the current year
|
2.4
|
|||
|
Additions for tax positions of prior years
|
0.5
|
|||
|
Reductions for tax positions of prior years
|
(0.6
|
)
|
||
|
Settlements
|
-
|
|||
|
Balance at December 31, 2013
|
12.9
|
|||
|
Additions based on tax positions related to the current year
|
3.1
|
|||
|
Additions for tax positions of prior years
|
-
|
|||
|
Reductions for tax positions of prior years
|
-
|
|||
|
Settlements
|
-
|
|||
|
Balance at December 31, 2014
|
$
|
16.0
|
||
The Company records penalties and interest related to tax uncertainties in income taxes. As of December 31, 2014 and 2013, the Company had recognized gross liabilities of approximately $6.7 million and $5.2 million related to interest and penalties, respectively. For the years ended December 31, 2014, 2013 and 2012, the Company recorded income tax expenses related to an increase in its liability for interest and penalties of $1.0 million, $0.7 million and $0.6 million, respectively.
The Company is currently being audited by New York State for years 2001 through 2006 but does not expect that any potential assessments will be material to its results of operations. The Company is subject to future audits by New York State for all years after 2006. The Company’s remaining state income tax returns are subject to future audit for all years after 2008. The Company’s Federal tax returns are subject to future audit for years after 2010.
76
F. Earnings per Share
The computations of basic and diluted net income per share are as follows:
|
For the Years Ending December 31,
|
||||||||||||
|
(In thousands, except per share amounts)
|
2014
|
2013
|
2012
|
|||||||||
|
Basic:
|
||||||||||||
|
Net income attributable to GAMCO Investors, Inc.'s shareholders
|
$ |
109,390
|
$
|
116,853
|
$
|
75,539
|
||||||
|
Weighted average shares outstanding
|
25,335
|
25,653
|
26,283
|
|||||||||
|
Basic net income per share attributable to GAMCO
|
||||||||||||
|
Investors, Inc.'s shareholders
|
$ |
4.32
|
$
|
4.56
|
$
|
2.87
|
||||||
|
Diluted:
|
||||||||||||
|
Net income attributable to GAMCO Investors, Inc.'s shareholders
|
$
|
109,390
|
$
|
116,853
|
$
|
75,539
|
||||||
|
Weighted average share outstanding
|
25,335
|
25,653
|
26,283
|
|||||||||
|
Dilutive stock options and restricted stock awards
|
223
|
59
|
153
|
|||||||||
|
Total
|
25,558
|
25,712
|
26,436
|
|||||||||
|
Diluted net income per share attributable to GAMCO
|
||||||||||||
|
Investors, Inc.'s shareholders
|
$ |
4.28
|
$
|
4.54
|
$
|
2.86
|
||||||
G. Debt
Debt consists of the following:
|
December 31, 2014
|
December 31, 2013
|
|||||||||||||||
| Carrying | Fair Value | Carrying | Fair Value | |||||||||||||
|
Value
|
Level 2
|
Value
|
Level 2
|
|||||||||||||
|
(In thousands)
|
||||||||||||||||
|
5.875% Senior notes
|
$ |
100,000
|
$ |
110,123
|
$ |
100,000
|
$ |
108,500
|
||||||||
|
0% Subordinated debentures
|
12,163
|
13,000
|
11,911
|
13,819
|
||||||||||||
|
Total
|
$
|
112,163
|
$
|
123,123
|
$
|
111,911
|
$
|
122,319
|
||||||||
5.875% Senior notes
On May 31, 2011, the Company issued $100 million of senior unsecured notes at par. The net proceeds of $99.1 million are being used for working capital and general corporate purposes, which may include acquisitions and seed investments. The issuance costs of $0.9 million have been capitalized and will be amortized over the term of the debt. The notes mature on June 1, 2021 and bear interest at 5.875% per annum, payable semi-annually on June 1 and December 1 of each year and commenced on December 1, 2011. Upon the occurrence of a change of control triggering event, as defined in the indenture, the Company would be required to offer to repurchase the notes at 101% of their principal amount.
Zero coupon Subordinated debentures due December 31, 2015
On December 31, 2010, the Company issued $86.4 million in par value of five year zero coupon subordinated debentures due December 31, 2015 (“Debentures”) to its shareholders of record on December 15, 2010 through the declaration of a special dividend of $3.20 per share. The Debentures have a par value of $100 and are callable at the option of the Company, in whole or in part, at any time or from time to time, at a redemption price equal to 100% of the principal amount of the Debentures to be redeemed. During 2014, 2013 and 2012, the Company repurchased 7,178 Debentures, 78,809 Debentures and 646,008 Debentures, respectively, having a face value of $0.7 million, $7.9 million and $64.6 million, respectively. The redemptions in 2014, 2013 and 2012 were accounted for as an extinguishment of debt and resulted in a loss of $0.1 million, $1.0 million and $6.3 million, respectively, which was included in extinguishment of debt on the consolidated statements of income. The debt is being accreted to its face value using the effective rate on the date of issuance of 7.45%. At December 31, 2014 and 2013, the debt was recorded at its accreted value of $12.2 million and $11.9 million, respectively.
The fair value of the Company’s debt, which is a Level 2 valuation, is estimated based on either quoted market prices for the same or similar issues or on the current rates offered to the Company for debt of the same remaining maturities or using market standard models. Inputs into these models include credit rating, maturity and interest rate.
77
H. Equity
Voting Rights
The holders of Class A Stock and Class B Stock have identical rights except that (i) holders of Class A Stock are entitled to one vote per share, while holders of Class B Stock are entitled to ten votes per share on all matters to be voted on by shareholders in general, and (ii) holders of Class A Stock are not eligible to vote on matters relating exclusively to Class B Stock and vice versa.
Stock Award and Incentive Plan
The Company maintains two Plans approved by the shareholders, which are designed to provide incentives which will attract and retain individuals key to the success of GBL through direct or indirect ownership of our common stock. Benefits under the Plans may be granted in any one or a combination of stock options, stock appreciation rights, restricted stock, restricted stock units, stock awards, dividend equivalents and other stock or cash based awards. A maximum of 3.5 million shares of Class A Stock have been reserved for issuance under the Plans by a committee of the Board of Directors responsible for administering the Plans (“Compensation Committee”). Under the Plans, the committee may grant RSAs and either incentive or nonqualified stock options with a term not to exceed ten years from the grant date and at an exercise price that the committee may determine.
During 2014, 2013 and 2012, the Company issued 158,600, 576,950 and 105,300 RSAs, respectively, at grant date fair values of $80.23, $63.82 and $43.49 per share, respectively. As of December 31, 2014 and 2013, there were 710,750 RSA shares and 566,950 RSA shares, respectively, outstanding that were issued at an average grant price of $67.45 per share and $63.93 per share, respectively. All grants of RSAs were recommended by the Company's Chairman, who did not receive a RSA, and approved by the Compensation Committee of the Company's Board of Directors. This expense, net of estimated forfeitures, is recognized over the vesting period for these awards which is either (1) 30% over three years from the date of grant and 70% over five years from the date of grant or (2) 30% over three years from the date of grant and 10% each year over years four through ten from the date of grant. During the vesting period, dividends to RSA holders are held for them until the RSA vesting dates and are forfeited if the grantee is no longer employed by the Company on the vesting dates. Dividends declared on these RSAs, less estimated forfeitures, are charged to retained earnings on the declaration date.
During 2012, the Board of Directors accelerated the lapsing of restrictions on all outstanding RSAs resulting in recognition of $10.1 million in stock compensation expense during 2012 that would have been recorded in 2013 through 2016.
78
A summary of the stock option and RSA activity for the years ended December 31, 2014 and 2013 is as follows:
|
Options
|
RSAs
|
|||||||||||||||
| Weighted Average | ||||||||||||||||
| Weighted Average | Grant Date | |||||||||||||||
|
Shares
|
Exercise Price
|
Shares
|
Fair Value
|
|||||||||||||
|
Outstanding at December 31, 2012
|
68,623
|
$
|
41.79
|
-
|
$
|
-
|
||||||||||
|
Granted
|
-
|
-
|
576,950
|
63.82
|
||||||||||||
|
Forfeited
|
-
|
-
|
(10,000
|
)
|
57.86
|
|||||||||||
|
Exercised / Vested
|
(2,623
|
)
|
28.95
|
-
|
-
|
|||||||||||
|
Outstanding at December 31, 2013
|
66,000
|
42.49
|
566,950
|
63.93
|
||||||||||||
|
Granted
|
-
|
-
|
158,600
|
80.23
|
||||||||||||
|
Forfeited
|
-
|
-
|
(14,800
|
)
|
69.38
|
|||||||||||
|
Exercised / Vested
|
(40,000
|
)
|
40.94
|
-
|
-
|
|||||||||||
|
Outstanding at December 31, 2014
|
26,000
|
$
|
44.89
|
710,750
|
$
|
67.45
|
||||||||||
|
Shares available for future issuance at
|
||||||||||||||||
|
December 31, 2014
|
1,829,925
|
|||||||||||||||
At December 31, 2014 and 2013, there were exercisable outstanding stock options of 23,500 and 62,000, respectively. The weighted average exercise price of the exercisable outstanding stock options at December 31, 2014 and 2013 was $44.80 per share and $42.14 per share, respectively.
The table below represents for various prices, the weighted average characteristics of outstanding employee stock options at December 31, 2014.
| Exercise | Options | Weighted average remaining | Options currently | Exercise price of options | ||||||||||||||
|
price
|
outstanding
|
contractual life
|
exercisable
|
currently exercisable
|
||||||||||||||
|
$
|
39.90
|
10,000
|
2.08
|
10,000
|
$
|
39.90
|
||||||||||||
|
45.77
|
10,000
|
6.08
|
7,500
|
45.77
|
||||||||||||||
|
$
|
51.74
|
6,000
|
3.33
|
6,000
|
$
|
51.74
|
||||||||||||
The Company did not grant any options in 2014, 2013 or 2012.
The expected volatility reflects the volatility of the GBL stock price over a period of approximately four years, prior to each respective grant date, based on month-end prices. The expected life reflected an estimate of the length of time the employees are expected to hold the options, including the vesting period, and is based, in part, on actual experience with other grants. The dividend yield for the grants reflected the assumption of a $0.03 per share quarterly dividend. The weighted average remaining contractual life of the outstanding options at December 31, 2014 was 3.91 years.
The total compensation costs related to non-vested awards not yet recognized is approximately $31.8 million as of December 31, 2014. This will be recognized as expense in the following periods (in thousands):
|
2015
|
2016
|
2017
|
2018
|
2019
|
||||||||||||||
| $ |
9,106
|
$ |
8,136
|
$ |
5,552
|
$ |
4,054
|
$ |
2,272
|
|||||||||
| 2020 | 2021 | 2022 | 2023 | 2024 | ||||||||||||||
| $ |
1,160
|
$ |
778
|
$ |
472
|
$ |
201
|
$ |
33
|
|||||||||
For the years ended December 31, 2014, 2013 and 2012, the Company recorded approximately $7.2 million, $2.1 million and $13.6 million, respectively, in stock based compensation expense which resulted in the recognition of tax benefits of approximately $2.7 million, $0.8 million and $5.0 million, respectively. The $13.6 million for the year ended December 31, 2012, includes $10.1 million in stock compensation expense as a result of accelerating all outstanding RSAs. There were no comparable accelerations in the years ended December 31, 2014 or 2013.
79
For the years ended December 31, 2014, 2013 and 2012, the Company received approximately $1.6 million, $76,000 and $0.9 million, respectively, from the exercise of stock options which resulted in tax benefits of $0.3 million, $16,000 and $0.1 million, respectively.
Stock Repurchase Program
In 1999, the Board of Directors established the Stock Repurchase Program through which the Company has been authorized to purchase up to $9 million of Class A Stock. In November 2012, the Board of Directors authorized the purchase of up to 800,000 shares of Class A Stock through a modified “Dutch Auction” tender. 717,389 shares of this authorization were used when the tender concluded in December 2012. The remaining 82,611 shares under this authorization lapsed upon the conclusion of the tender. During 2013, the Board of Directors authorized additional repurchase of 500,000 shares in February and 500,000 shares in November. In 2014, 2013 and 2012, we repurchased 414,432 shares, 229,228 shares and 1,138,313 shares, respectively, at an average price of $78.99 per share, $64.41 per share and $48.25 per share, respectively. There remain 508,783 shares available under this program at December 31, 2014. Under the program, the Company has repurchased 9,126,025 shares at an average price of $43.92 per share and an aggregate cost of $400.8 million through December 31, 2014.
Dividends
During 2014, 2013 and 2012, the Company declared dividends of $0.50 per share, $0.72 per share and $2.88 per share, respectively, to class A and class B shareholders totaling $12.9 million, $18.7 million and $76.4 million, respectively. Under the terms of the RSA agreements, we accrue dividends, less estimated forfeitures, for RSA grantees from the date of grant but these dividends are held for grantees who are not entitled to receive dividends until their awards vest and only if they are still employed by the Company at those dates. As of December 31, 2014 and 2013, dividends accrued on RSAs not yet vested were approximately $0.6 million and $0.3 million, respectively.
Shelf Registration
In May 2012, the SEC declared effective the Company’s “shelf” registration statement on Form S-3 giving the Company the flexibility to sell any combination of senior and subordinate debt securities, convertible debt securities and equity securities (including common and preferred securities) up to a total amount of $400 million. The shelf is available through May 30, 2015, at which time it may be renewed.
I. Capital Lease
On December 5, 1997, prior to the Offering in 1999, the Company entered into a fifteen-year lease, expiring on April 30, 2013, of office space from an entity controlled by members of the Chairman's family. On June 11, 2013, the Company modified and extended its lease with M4E, LLC, the Company’s landlord at 401 Theodore Fremd Ave, Rye, NY. The lease term was extended to December 31, 2028, and the base rental remained at $18 per square foot, or $1.1 million, for 2013. From January 1, 2015 through December 31, 2028, the base rental will be determined by the change in the consumer price index for the New York Metropolitan Area for November of the immediate prior year with the base period as November 2008 for the New York Metropolitan Area.
The lease has been accounted for as a capital lease as it transfers substantially all the benefits and risks of ownership to GBL. The Company has recorded the leased property as an asset and a capital lease obligation for the present value of the obligation of the leased property. The leased property is amortized on a straight-line basis from the date of the most recent extension to the end of the lease. The capital lease obligation is amortized over the same term using the interest method of accounting. Capital lease improvements are amortized from the date of expenditure through the end of the lease term or the useful life, whichever is shorter, on a straight-line basis. The lease provides that all operating expenses relating to the property (such as property taxes, utilities and maintenance) are to be paid by the lessee, GBL. These are recognized as expenses in the periods in which they are incurred. Accumulated amortization on the leased property was approximately $4.2 million and $4.0 million at December 31, 2014 and 2013, respectively.
80
Future minimum lease payments for this capitalized lease at December 31, 2014 are as follows:
|
(In thousands)
|
||||
|
2015
|
$ |
1,184
|
||
|
2016
|
1,080
|
|||
|
2017
|
1,080
|
|||
|
2018
|
1,080
|
|||
|
2019
|
1,080
|
|||
|
Thereafter
|
9,720
|
|||
| Total minimum obligations | 15,224 | |||
|
Interest
|
9,964
|
|||
|
Present value of net obligations
|
$
|
5,260
|
||
Lease payments under this agreement amounted to approximately $1.2 million, $1.2 million and $1.1 million for each of the years ended December 31, 2014, 2013 and 2012, respectively. The capital lease contains an escalation clause tied to the change in the New York Metropolitan Area Consumer Price Index which may cause the future minimum payments to exceed $1,080,000 annually. Future minimum lease payments have not been reduced by related minimum future sublease rentals of approximately $1.0 million due over the next nine years, which are due from affiliated entities. Total minimum obligations exclude the operating expenses to be borne by the Company, which are estimated to be approximately $0.9 million per year.
J. Contractual Obligations
We rent office space under leases which expire at various dates through November 30, 2019. Future minimum lease commitments under these operating leases as of December 31, 2014 are as follows:
|
(In thousands)
|
||||
|
2015
|
$ |
647
|
||
|
2016
|
504
|
|||
|
2017
|
472
|
|||
|
2018
|
471
|
|||
|
2019
|
369
|
|||
|
2020
|
-
|
|||
|
Total
|
$
|
2,463
|
||
Equipment rentals and occupancy expense amounted to approximately $2.7 million, $2.7 million and $2.8 million, respectively, for the years ended December 31, 2014, 2013 and 2012.
K. Shareholder-Designated Contribution Plan
During 2013, the Company established a Shareholder Designated Charitable Contribution program. Under the program, each shareholder is eligible to designate a charity to which the Company would make a donation based upon the actual number of shares registered in the shareholder’s name. Shares held in nominee or street name were not eligible to participate. The Board of Directors approved two contributions during 2013 of $0.25 per registered share each. During 2013, the Company recorded a charge of $10.6 million, or $0.24 per diluted share, net of management fee and tax benefit, related to the contributions which was included in shareholder-designated contribution in the consolidated statements of income. Based upon the number of registered shares that participated in the program, the Company recorded an additional charge of $134,000 during 2014.
L. Related Party Transactions
The following is a summary of certain related party transactions.
GGCP Holdings LLC owns a majority of our Class B Stock, representing approximately 94% of the combined voting power and 72% of the outstanding shares of our common stock at December 31, 2014.
81
Capital Lease
We lease an approximately 60,000 square foot building located at 401 Theodore Fremd Avenue, Rye, New York as our headquarters (the “Building”) from an entity controlled by members of the Chairman’s family. See Note I.
We sub-lease approximately 3,300 square feet in the Building to LICT Corporation, a company for which Mr. Gabelli serves as Chairman and CEO, which pays rent at the rate of $28 per square foot plus $3 per square foot for electricity, subject to adjustment for increases in taxes and other operating expenses. The total amounts paid in 2014, 2013, and 2012 for rent and other expenses under this lease were $117,640, $116,527, and $114,716, respectively. Concurrent with the extension of the lease on the Building during 2008, we and LICT Corporation further agreed to extend the term of the sub-lease until December 2023 on the same terms and conditions. As of July 1, 2008, we also sub-lease approximately 1,600 square feet in the Building to Teton. Teton pays rent at the rate of $37.75 per square foot plus $3 per square foot for electricity, subject to adjustment for increases in taxes and other operating expenses. The total amount paid in 2014, 2013 and 2012 for rent and other expenses under this lease were $68,697, $68,189 and $67,361, respectively, and were recorded in other operating expenses as a credit on the consolidated statements of income.
Investment Advisory Services
GAMCO has entered into agreements to provide advisory and administrative services to MJG Associates, Inc., which is wholly-owned by Mr. Gabelli, with respect to the private investment funds managed by them. Pursuant to such agreements, MJG Associates, Inc. paid GAMCO $10,000 (excluding reimbursement of expenses) for each of the years 2014, 2013, and 2012. For 2014, 2013 and 2012, Manhattan Partners I, L.P. and Manhattan Partners II, L.P., investment partnerships for which John Gabelli Inc., an entity owned by John Gabelli, a brother of the Company's Chairman, is the general partner, paid GAMCO investment advisory fees in the amount of $14,483, $21,601 and $21,660, respectively. In addition, an entity in which Mr. John Gabelli’s wife is the sole shareholder, is the co-general partner of S.W.A.N. Partners, LP (“S.W.A.N.”). S.W.A.N. paid GAMCO investment advisory fees in the amount of $22,094, $32,740 and $35,649 for 2014, 2013 and 2012, respectively, and is included in investment advisory and incentive fees on the consolidated statements of income.
Gabelli Securities International Limited (“GS International”) was formed in 1994 to provide management and investment advisory services to offshore funds and accounts. Mr. Marc Gabelli, who is a member of the Board and a son of the Company's Chairman, owns 55% of GS International and GSI owns the remaining 45%. In 1994, Gabelli International Gold Fund Limited (“GIGFL”), an offshore investment company investing primarily in securities of issuers with gold-related activities, was formed and GS International entered into an agreement to provide management services to GIGFL. GSI in turn entered into an agreement with GS International to provide investment advisory services to GIGFL in return for receiving all investment management fees paid by GIGFL. Pursuant to such agreement, GSI received investment management fees of $11,096 and no incentive fees for 2014. Comparable amounts for 2013 were $13,478 and $0, respectively, and for 2012 they were $23,192 and $0, respectively. As of December 31, 2013, there was $50,639 payable to GIGFL included in accrued expenses and other liabilities on the consolidated statements of financial condition relating to management fees. There was no payable to GIGFL at December 31, 2014.
In April 1999, Gabelli Global Partners, Ltd. (“GGP Ltd.”), an offshore investment fund, was incorporated. GS International and Gemini Capital Management, LLC (“Gemini”), an entity owned by Mr. Marc Gabelli, were engaged by GGP Ltd. as investment advisors as of July 1, 1999. GGP Ltd. paid all of the management fees for 2014 and 2013 in the amounts of $286,360 and $148,909, respectively, to GS International. For 2014 and 2013, GGP Ltd. paid all of the incentive fees in the amount of $20,886 and $31,217, respectively, to GSI International. There were no incentive fees earned in 2012.
In April 1999, GSI formed Gabelli Global Partners, L.P., an investment limited partnership for which GSI and Gemini are the general partners. In March 2002, Gabelli Global Partners, L.P. changed its name to Gemini Global Partners, L.P. Gemini and GSI each received half of the management fee paid by the partnership to the general partners in 2014, 2013 and 2012 in the amounts of $78,288, $76,776 and $76,548, respectively. For 2014 and 2013, Gemini and GSI each received half of the incentive fee in the amount of $178 and $15,018, respectively. There were no incentive fees earned in 2012. As of December 31, 2014 and 2013, there were $97,656 and $36,418, respectively, receivable from Gemini Global Partners, L.P. included in investment advisory fees receivable on the consolidated statements of financial condition.
The Company serves as the investment advisor for the Funds and earns advisory fees based on predetermined percentages of the average net assets of the Funds. In addition, G.distributors has entered into distribution agreements with each of the Funds. As principal distributor, G.distributors incurs certain promotional and distribution costs related to the sale of Fund shares, for which it receives a distribution fee from the Funds or reimbursement from the investment advisor. G.research earns a majority of its commission revenue from transactions executed on behalf of clients of affiliated companies. Advisory and distribution fees receivable from the Funds were approximately $31.6 million and $37.2 million at December 31, 2014 and 2013, respectively. GBL earned approximately $0.6 million, $0.9 million and $1.0 million in 2014, 2013 and 2012, respectively, in advisory fee revenues and approximately $12,000, $12,000 and $13,000 in 2014, 2013 and 2012, respectively, in distribution fees from our proprietary investments in the Funds which are included in investment advisory and incentive fees and distribution fees and other income, respectively, on the consolidated statements of income.
82
Investments in Securities
At December 31, 2014 and 2013, approximately $80 million and $81 million, respectively, of our proprietary investment portfolio were managed by our analysts or portfolio managers other than Mr. Gabelli. The individuals managing these accounts receive 20% of the net profits, if any, earned on the accounts; however, some of the analysts are required to meet a hurdle rate of 5% before earning this 20% payout. In August 2006, a son of the Chairman was given responsibility for managing a proprietary investment account on which he would be paid, on an annual basis, 20% of any net profits earned on the account for the year. The account was initially funded with approximately $40 million during 2006. During 2014 and 2013, $2 million and $2 million, respectively, was transferred from this account back to the firm’s proprietary account and is no longer subject to the 20% payout. For 2014, 2013 and 2012, this account was up 1.6%, 41.9% and 14.3 %, respectively, and therefore he earned approximately $0.1 million, $1.5 million and $0.2 million, respectively, for managing this account.
We had an aggregate investment in the Funds of approximately $337.5 million and $253.9 million at December 31, 2014 and 2013, respectively, of which approximately $298.0 million and $209.8 million was invested in an affiliated money market mutual fund, included in cash and cash equivalents, at December 31, 2014 and 2013, respectively. GBL earned approximately $4,000, $19,000, and $52,000 in 2014, 2013 and 2012, respectively, in dividend income from our investment in our money market mutual fund. Distributions from investments in our equity Funds, which are included within interest and dividend income on the consolidated statements of income, were approximately $2.1 million, $2.3 million and $1.8 million, in 2014, 2013 and 2012, respectively.
Investments in Partnerships
We had an aggregate investment in affiliated partnerships and offshore funds of approximately $94.2 million and $82.0 million at December 31, 2014 and 2013, respectively.
Compensation
Immediately preceding the Offering and in conjunction with the Reorganization, GBL and our Chairman and CEO entered into an employment agreement. This agreement was amended and approved by shareholders on November 30, 2007 and most recently re-approved by shareholders on May 6, 2011.
Under the terms of this agreement and consistent with the firm’s practice since its inception in 1977, Mr. Gabelli will also continue receiving a percentage of revenues or net operating contribution, which are substantially derived from AUM, as compensation relating to or generated by the following activities: (i) managing or overseeing the management of various investment companies and partnerships, (ii) attracting mutual fund shareholders, (iii) attracting and managing Institutional and Private Wealth Management clients, and (iv) otherwise generating revenues for the Company. Such payments are made in a manner and at rates as agreed to from time to time by GAMCO, which rates have been and generally will be the same as those received by other professionals at GAMCO performing similar services. With respect to our Institutional and Private Wealth Management and mutual fund advisory business, we pay out up to 40% of the revenues or net operating contribution to the portfolio managers and marketing staff who introduce, service or generate such business, with payments involving the Institutional and Private Wealth Management accounts being typically based on revenues and payments involving the mutual funds being typically based on net operating contribution.
Mr. Gabelli has agreed that while he is employed by us he will not provide investment management services outside of GAMCO, except for certain permitted accounts as defined under the agreement. The 2008 Employment Agreement may not be amended without the approval of the Compensation Committee and Mr. Gabelli.
The Chairman and CEO receives compensation in the form of a management fee for managing the Company. Additionally, he earns compensation for acting as portfolio manager and/or attracting and providing client service to a large number of GAMCO's Institutional and Private Wealth Management clients, for creating and acting as portfolio manager of several open-end funds, for creating and acting as portfolio manager of the closed-end funds and for providing other services, including acting as portfolio and relationship manager of investment partnerships.
83
Other
On May 31, 2006, the Company entered into an Exchange and Standstill Agreement with Frederick J. Mancheski, a significant shareholder, pursuant to which, among other things, he agreed to exchange his 2,071,635 shares of Class B Stock, which he received on a pari passu basis with his investment in GGCP, for an equal number of shares of Class A Stock. The standstill expires on May 31, 2016. Under the terms of the standstill agreement, Mr. Mancheski agreed to, among other things, vote his shares in favor of the nominees and positions advocated by the Board of Directors. As stated in the latest available Form 13D filed by Mr. Mancheski on December 20, 2012, he continues to exercise voting control over 1,725,974 shares of Class A Stock.
For 2014, 2013, and 2012, we incurred variable costs (but not the fixed costs) of $458,000, $483,000, and $450,000, respectively, for actual usage relating to our use of aircraft in which GGCP owns the fractional interests.
As required by the Company's Code of Ethics, staff members are required to maintain their brokerage accounts at G.research unless they receive permission to maintain an outside account. G.research offers its entire staff the opportunity to engage in brokerage transactions at discounted commission rates. Accordingly, many of our staff members, including the executive officers or entities controlled by them, have brokerage accounts at G.research and have engaged in securities transactions at discounted rates.
G.research also participates in syndicated underwriting activities, some of which involve the issuance of preferred or common shares of Gabelli closed-end funds. During 2014, G.research participated as Sales Manager in the at the market offerings of The GAMCO Global Gold, Natural Resources & Income Trust and acted as Dealer Manager for The Gabelli Equity Trust Rights Offering, the Gabelli Multimedia Trust Rights Offering, the Gabelli Healthcare & Wellness Trust Rights Offering, and acted as co-manager in The Gabelli Health & Wellness Trust 5.875% Series B Cumulative Preferred Stock Offering. During 2013, G.research participated as agent in the at the market offerings of The GAMCO Global Gold, Natural Resources & Income Trust and acted as Dealer Manager for The Gabelli Global Utility and Income Trust’s Series A Preferred Share Rights Offering, and acted as co-manager in The GAMCO Global Gold, Natural Resources & Income Trust 5% Series B Cumulative Preferred Stock Offering. During 2012, G.research participated as agent in the secondary offerings of The GAMCO Global Gold, Natural Resources & Income Trust and acted as Dealer Manager for The Gabelli Equity Trust’s Series F Cumulative Preferred Rights Offering, and acted as co-underwriter for The Gabelli Equity Trust’s Series H Cumulative Preferred Stock Offering.
GBL and Teton entered into a transitional administrative and management service agreement in connection with the spin-off of Teton from GBL that formalized certain arrangements. Effective January 1, 2011, Teton and GBL renegotiated the terms of the sub-administration agreement from a flat 0.20% on the average net assets of the mutual funds managed by Teton to 0.20% on the first $370 million in average net assets, 0.12% on the next $630 million in average net assets and 0.10% on average net assets in excess of $1 billion, as compensation for providing mutual fund administration services and $15,000 per month for various administrative services. Effective April 1, 2014, the administrative services fee was increased to $25,000 per month. Prior to the spin-off these fees were eliminated in consolidation. During 2014, 2013 and 2012, there was $2.3 million, $1.8 million and $1.5 million, respectively, included in distribution fees and other income on the consolidated statements of income.
84
M. Financial Requirements
As registered broker-dealers, G.research and G.distributors are subject to the Uniform Net Capital Rule 15c3-1 (the “Rule”) of the SEC. G.research and G.distributors compute their net capital under the alternative method permitted by the Rule which requires minimum net capital of $250,000. The Companies met or exceeded this requirement at December 31, 2014.
Our subsidiary, GAMCO Asset Management (UK) Limited is authorized and regulated by the Financial Conduct Authority (“FCA”). In February 2011, GAMCO Asset Management (UK) Limited increased its permitted license with the FCA’s predecessor, the Financial Services Authority (“FSA”) and has held Total Capital of £504,000 and £495,000 ($783,000 and $816,000 at December 31, 2014 and 2013, respectively) and had a Financial Resources Requirement of £210,000 and £226,000 ($326,000 and $373,000 at December 31, 2014 and 2013, respectively). We have consistently met or exceeded these minimum requirements.
N. Administration Fees
We have entered into administration agreements with other companies (the “Administrators”), whereby the Administrators provide certain services on behalf of several of the Funds and Investment Partnerships. Such services do not include the investment advisory and portfolio management services provided by GBL. The fees are negotiated based on predetermined percentages of the net assets of each of the Funds.
O. Profit Sharing Plan and Incentive Savings Plan
The Company has a qualified contributory employee profit sharing plan and incentive savings plan covering substantially all employees. Company contributions to the plans are determined annually by the Board of Directors but may not exceed the amount permitted as a deductible expense under the Internal Revenue Code. The Company accrued contributions of approximately $18,000 and $52,000 to the plans for the years ended December 31, 2013 and 2012, respectively. For the year ended December 31, 2014, the Company used unvested contributions that were forfeited from prior year’s matching to satisfy the current year’s contribution.
P. Goodwill and Identifiable Intangible Asset
At December 31, 2014 and 2013, $3.5 million of goodwill is reflected on the consolidated statements of financial condition with $3.3 million related to GSI and $0.2 million related to G.distributors. The Company adopted the guidance issued by the FASB that allowed for a qualitative assessment of whether it is more likely than not that an impairment has occurred. At November 30, 2014 and November 30, 2013, management conducted its annual assessments of the recoverability of goodwill and determined that there was no impairment of goodwill on GBL’s consolidated financial statements.
As a result of becoming the advisor to the Gabelli Enterprise Mergers and Acquisitions Fund and the associated consideration paid, the Company maintains an identifiable intangible asset of $1.9 million within other assets on the consolidated statements of financial condition at both December 31, 2014 and 2013. The investment advisory agreement is subject to annual renewal by the fund's Board of Directors, which the Company expects to be renewed, and the Company does not expect to incur additional expense as a result, which is consistent with other investment advisory agreements entered into by the Company. The advisory contract is next up for renewal in February 2016. At November 30, 2014 and November 30, 2013, management conducted its annual assessments of the recoverability of the intangible asset and determined that there was no impairment of it on GBL’s consolidated financial statements.
Q. Other Matters
From time to time, the Company may be named in legal actions and proceedings. These actions may seek substantial or indeterminate compensatory as well as punitive damages or injunctive relief. The Company is also subject to governmental or regulatory examinations or investigations. The examinations or investigations could result in adverse judgments, settlements, fines, injunctions, restitutions or other relief. For any such matters, the consolidated financial statements include the necessary provisions for losses that the Company believes are probable and estimable. Furthermore, the Company evaluates whether there exist losses which may be reasonably possible and, if material, makes the necessary disclosures. Such amounts, both those that are probable and those that are reasonably possible, are not considered material to the Company’s financial condition, operations or cash flows.
The investment management industry is likely to continue facing a high level of regulatory scrutiny and become subject to additional rules designed to increase disclosure, tighten controls and reduce potential conflicts of interest. In addition, the SEC has substantially increased its use of focused inquiries which request information from a number of fund complexes regarding particular practices or provisions of the securities laws. The Company participates in some of these inquiries in the normal course of our business. Changes in laws, regulations and administrative practices by regulatory authorities, and the associated compliance costs, have increased our cost structure and could in the future have a material impact.
85
The Company indemnifies the clearing brokers of G.research for losses they may sustain from the customer accounts that trade on margin introduced by our broker-dealer subsidiary. At December 31, 2014, the total amount of customer balances subject to indemnification (i.e. unsecured margin debits) was immaterial. The Company also has entered into arrangements with a number of other third parties which provide for indemnification of the third parties against losses, costs, claims and liabilities arising from the performance of obligations under the agreements. The Company has had no claims or payments pursuant to these or prior agreements, and believes the likelihood of such a claim being made is remote. The Company’s estimate of the value of such agreements is de minimis, and therefore an accrual has not been made on the consolidated financial statements.
R. Quarterly Financial Information (Unaudited)
Quarterly financial information for the years ended December 31, 2014 and 2013 is presented below.
|
2014
|
||||||||||||||||||||
|
1st
|
2nd
|
3rd
|
4th
|
Total
|
||||||||||||||||
|
(In thousands, except per share data)
|
||||||||||||||||||||
|
Revenues
|
$
|
104,477
|
$
|
108,296
|
$
|
110,858
|
$
|
116,751
|
$
|
440,382
|
||||||||||
|
Operating income
|
36,499
|
37,537
|
43,586
|
41,904
|
159,526
|
|||||||||||||||
|
Net income attributable to GAMCO
|
||||||||||||||||||||
|
Investors, Inc.'s shareholders
|
27,954
|
28,950
|
23,665
|
28,821
|
109,390
|
|||||||||||||||
|
Net income attributable to GAMCO
|
||||||||||||||||||||
|
Investors, Inc.'s shareholders per share:
|
||||||||||||||||||||
|
Basic
|
1.10
|
1.14
|
0.94
|
1.14
|
4.32
|
|||||||||||||||
|
Diluted
|
$
|
1.09
|
$ |
1.13
|
$ |
0.93
|
$ |
1.13
|
$
|
4.28
|
||||||||||
|
2013
|
||||||||||||||||||||
|
1st
|
2nd
|
3rd
|
4th
|
Total
|
||||||||||||||||
|
Revenues
|
$
|
86,181
|
$
|
92,290
|
$
|
96,377
|
$
|
122,714
|
$
|
397,562
|
||||||||||
|
Operating income
|
30,727
|
31,784
|
32,728
|
47,173
|
142,412
|
|||||||||||||||
|
Net income attributable to GAMCO
|
||||||||||||||||||||
|
Investors, Inc.'s shareholders
|
22,545
|
27,893
|
33,098
|
33,317
|
116,853
|
|||||||||||||||
|
Net income attributable to GAMCO
|
||||||||||||||||||||
|
Investors, Inc.'s shareholders per share:
|
||||||||||||||||||||
|
Basic
|
0.88
|
1.09
|
1.29
|
1.30
|
4.56
|
|||||||||||||||
|
Diluted
|
$
|
0.88
|
$
|
1.09
|
$
|
1.29
|
$
|
1.29
|
$
|
4.54
|
||||||||||
S. Subsequent Events
On February 2, 2015, the Board of Directors declared a regular quarterly dividend of $0.07 per share to all of its shareholders, payable on March 31, 2015 to shareholders of record on March 17, 2015.
From January 1, 2015 to March 6, 2015, the Company repurchased 18,828 shares at $78.77 per share. As a result, there are 489,955 shares available to be repurchased under our existing buyback plan at March 6, 2015.
86
None.
ITEM 9A: CONTROLS AND PROCEDURES
(a) Evaluation of Disclosure Controls and Procedures
The Company maintains a system of disclosure controls and procedures that is designed to provide reasonable assurance that information, which is required to be timely disclosed, is recorded, processed, summarized, and reported to management within the time periods specified in Rules 13a-15(e) and 15d-15(e) of the Securities Exchange Act of 1934, as amended (the “Exchange Act”). The Company’s Chief Executive Officer and Chief Financial Officer, after evaluating the effectiveness of the Company’s disclosure controls and procedures (as defined in the Exchange Act) as of the end of the period covered by this report, have concluded that the Company’s disclosure controls and procedures are effective to provide reasonable assurance that information required to be disclosed by the Company in the reports that it files or submits under the Exchange Act is accumulated and communicated to the Company’s management, including its principal executive officer and principal financial officer, as appropriate, to allow timely decisions regarding required disclosure and are effective to provide reasonable assurance that such information is recorded, processed, summarized and reported within the time periods specified in the SEC’s rules and forms.
(b) Management’s Report on Internal Control Over Financial Reporting
GBL's management is responsible for establishing and maintaining adequate internal control over financial reporting, as such term is defined in Rule 13a-15(f) of the Exchange Act. Management, with the participation of the principal executive officer and under the supervision of the principal financial officer, of the Company conducted an evaluation of the effectiveness of GBL's internal control over financial reporting as of December 31, 2014, as required by Rule 13a-15(c) of the Exchange Act. There are inherent limitations to the effectiveness of any system of internal control over financial reporting, including the possibility of human error and the circumvention or overriding of the controls and procedures. Accordingly, even effective internal control over financial reporting controls can only provide reasonable assurance of achieving their control objectives. In making its assessment of the effectiveness of its internal control over financial reporting, the Company used the criteria set forth by the Committee of Sponsoring Organizations of the Treadway Commission (COSO) (2013) in Internal Control-Integrated Framework.
Based on its evaluation, management concluded that, as of December 31, 2014, the Company maintained effective internal control over financial reporting. The independent registered public accounting firm that audited the consolidated financial statements included in the annual report containing the disclosure required by this Item has issued an attestation report on the Company's internal control over financial reporting. The report on the audit of internal control over financial reporting is included in Item 8 in this Form 10-K.
(c) Changes in Internal Control Over Financial Reporting
There has been no change in our internal control over financial reporting during the quarter ended December 31, 2014 that has materially affected, or is reasonably likely to materially affect, our internal control over financial reporting.
None.
87
PART III
ITEM 10:DIRECTORS, EXECUTIVE OFFICERS AND CORPORATE GOVERNANCE
Information regarding the Directors and Executive Officers of GBL and compliance with Section 16(a) of the Securities Exchange Act of 1934 is incorporated herein by reference from the our definitive proxy statement for our 2015 Annual Meeting of Shareholders (the “Proxy Statement”).
GBL has adopted a Code of Business Conduct that applies to all of our officers, directors, full-time and part-time employees and a Code of Conduct that sets forth additional requirements for our principal executive officer, principal financial officer, principal accounting officer or controller, or persons performing similar functions (together, the “Codes of Conduct”). The Codes of Conduct are posted on our website (www.gabelli.com) and are available in print free of charge to anyone who requests a copy. Interested parties may address a written request for a printed copy of the Codes of Conduct to: Secretary, GAMCO Investors, Inc., One Corporate Center, Rye, New York 10580-1422. We intend to satisfy the disclosure requirement regarding any amendment to, or a waiver of, a provision of the Codes of Conduct by posting such information on our website.
In addition to the certifications attached as Exhibits to this Form 10-K, following its 2015 Annual Meeting, GBL also submitted to the New York Stock Exchange (“NYSE”) a certification by our Chief Executive Officer that he is not aware of any violations by GBL of the NYSE corporate governance listing standards as of the date of the certification.
Information required by Item 11 is included in our Proxy Statement for the 2015 Annual Meeting of Stockholders and is incorporated herein by reference.
ITEM 12:SECURITY OWNERSHIP OF CERTAIN BENEFICIAL OWNERS AND MANAGEMENT AND RELATED STOCKHOLDER MATTERS
Information required by Item 12 is included in our Proxy Statement for the 2015 Annual Meeting of Stockholders and is incorporated herein by reference.
Information required by Item 13 is included in our Proxy Statement for the 2015 Annual Meeting of Stockholders and is incorporated herein by reference.
The information set forth under the caption “Independent Registered Public Accounting Firm” in our Proxy Statement for the 2015 Annual Meeting of Stockholders is incorporated herein by reference.
88
PART IV
| ITEM 15: | EXHIBITS, FINANCIAL STATEMENT SCHEDULES |
(a) List of documents filed as part of this Report:
(1) Consolidated Financial Statements and Independent Registered Public Accounting Firm’s Reports included herein:
See Index on page 47.
(2) Financial Statement Schedules
Financial statement schedules are omitted as not required or not applicable or because the information is included in the Financial Statements or notes thereto.
(3) List of Exhibits:
The agreements included or incorporated by reference as exhibits to this Annual Report on Form 10-K contain representations and warranties by each of the parties to the applicable agreement. These representations and warranties were made solely for the benefit of the other parties to the applicable agreement and (i) were not intended to be treated as categorical statements of fact, but rather as a way of allocating the risk to one of the parties if those statements prove to be inaccurate; (ii) may have been qualified in such agreement by disclosures that were made to the other party in connection with the negotiation of the applicable agreement; (iii) may apply contract standards of “materiality” that are different from “materiality” under the applicable securities laws; and (iv) were made only as of the date of the applicable agreement or such other date or dates as may be specified in the agreement.
The Company acknowledges that, notwithstanding the inclusion of the foregoing cautionary statements, it is responsible for considering whether additional specific disclosures of material information regarding material contractual provisions are required to make the statements in this report not misleading.
Exhibit
Number Description of Exhibit
|
2.1
|
Agreement and Plan of Merger, dated October 14, 2013, between GAMCO Investors, Inc., a New York corporation and GAMCO Investors, Inc., a Delaware corporation. (Incorporated by reference to Exhibit 2.1 to the Company’s Form 8-K dated November 20, 2013 filed with the Securities and Exchange Commission on November 22, 2013).
|
|
|
3.1
|
Amended and Restated Certificate of Incorporation of GAMCO Investors, Inc. (the “Company”) (Incorporated by reference to Exhibit 3.1 to the Company’s Form 8-K dated November 20, 2013 filed with the Securities and Exchange Commission on November 22, 2013).
|
|
|
3.2
|
Amended Bylaws of the Company. (Incorporated by reference to Exhibit 3.2 to the Company’s Report on Form 8-K dated November 20, 2013 filed with the Securities and Exchange Commission on November 22, 2013).
|
|
|
3.3
|
Amendment No. 1 to Amended and Restated Bylaws of the Company (Incorporated by reference to Exhibit 3.3 to the Company’s Report on Form 8-K dated September 23, 2014 filed with the Securities and Exchange Commission on September 26, 2014).
|
|
|
4.1
|
Form of Common Stock Certificate. (Incorporated by reference to Exhibit 4.1 to the Company’s Report on Form 8-K dated November 20, 2013 filed with the Securities and Exchange Commission on November 22, 2013).
|
|
|
4.2
|
Indenture, dated as of December 31, 2010, between the Company and Computershare Trust Company, N.A., as Trustee (includes form of 0% Subordinated Debenture due 2015). (Incorporated by reference to Exhibit 4.1 to the Company's Report on Form 8-K dated January 6, 2011 filed with the Securities and Exchange Commission on January 6, 2011).
|
|
|
4.3
|
First Supplemental Indenture, dated as of November 22, 2013, by and between GAMCO Investors, Inc. and, Computershare Trust Company, N.A. as trustee. (Incorporated by reference to Exhibit 4.2 to the Company’s Report on Form 8-K dated November 20, 2013 filed with the Securities and Exchange Commission on November 22, 2013).
|
89
|
4.4
|
Indenture, dated as of February 6, 2002, between the Company and The Bank of New York, as Trustee. (Incorporated by reference to Exhibit 4.1 to the Company's Report on Form 8-K dated February 8, 2002 filed with the Securities and Exchange Commission on February 8, 2002).
|
|
|
4.5
|
Second Supplemental Indenture, dated May 31, 2011, between the Company and The Bank of New York Mellon, as Trustee (includes form of 5.875% Senior Notes due 2021). (Incorporated by reference to Exhibit 4.1 to the Company's Report on Form 8-K dated May 25, 2011 filed with the Securities and Exchange Commission on May 31, 2011).
|
|
|
4.6
|
Third Supplemental Indenture, dated November 22, 2013, between GAMCO Investors, Inc. and The Bank of New York Mellon, as Trustee. (Incorporated by reference to Exhibit 4.3 to the Company’s Report on Form 8-K dated November 20, 2013 filed with the Securities and Exchange Commission on November 22, 2013).
|
|
|
10.1
|
Tax Indemnification Agreement between the Company and GFI. (Incorporated by reference to Exhibit 10.2 to Amendment No. 3 to the Company's Registration Statement on Form S-1 (File No. 333-51023) filed with the Securities and Exchange Commission on January 29, 1999).
|
|
|
10.2
|
GAMCO Investors, Inc. 1999 Stock Award and Incentive Plan (Incorporated by reference to Exhibit 10.4 to Amendment No. 3 to the Company’s Registration Statement on Form S-1 (Registration No. 333-51023) filed with the Commission on January 29, 1999). *
|
|
|
10.3
|
GAMCO Investors, Inc. 1999 Annual Performance Incentive Plan (Incorporated by reference to Exhibit 10.5 to Amendment No. 3 to the Company's Registration Statement on Form S-1 (File No. 333-51023) filed with the Securities and Exchange Commission on January 29, 1999). *
|
|
|
10.4
|
GAMCO Investors, Inc. 2002 Stock Award and Incentive Plan (Incorporated by reference to Exhibit A to the Company’s definitive proxy statement on Schedule 14A filed with the Securities and Exchange Commission on April 30, 2002). *
|
|
|
10.5
|
First Amendment to the Company’s 2002 Stock Award and Incentive Plan (Incorporated by reference to Annex D to the Company’s definitive proxy statement on Schedule 14A filed with the Commission on October 30, 2013).*
|
|
|
10.6
|
Employment Agreement between the Company and Mario J. Gabelli dated February 6, 2008 (Incorporated by reference to Exhibit 10.1 to Company's Report on Form 8-K dated February 6, 2008 filed with the Securities and Exchange Commission on February 7, 2008). *
|
|
|
10.7
|
Exchange and Standstill Agreement, dated May 31, 2006, between the Company and Frederick J. Mancheski (Incorporated by reference to Exhibit 10.1 to the Company’s Form 10-Q for the quarter ended June 30, 2006 filed with the Securities and Exchange Commission on August 8, 2006).
|
|
|
10.8
|
Registration Rights Agreement, dated May 31, 2006 by and between GAMCO Investors, Inc. and Frederick J. Mancheski and David M. Perlmutter. (Incorporated by reference to Exhibit 10.2 to the Company’s Form 10-Q for the quarter ended June 30, 2006 filed with the Securities and Exchange Commission on August 8, 2006).
|
|
|
12.1
|
Computation of Ratios of Earnings to Fixed Charges.
|
|
|
21.1
|
Subsidiaries of the Company.
|
|
|
23.1
|
Consent of Independent Registered Public Accounting Firm.
|
|
|
24.1
|
Powers of Attorney (included on page 92 of this Report).
|
90
|
31.1
|
Certification of CEO pursuant to Rule 13a-14(a).
|
|
|
31.2
|
Certification of CFO pursuant to Rule 13a-14(a).
|
|
|
32.1
|
Certification of CEO pursuant to 18 U.S.C. Section 1350, as adopted pursuant to Section 906 of the Sarbanes-Oxley Act of 2002.
|
|
|
32.2
|
Certification of CFO pursuant to 18 U.S.C. Section 1350, as adopted pursuant to Section 906 of the Sarbanes- Oxley Act of 2002.
|
|
|
100.INS
|
XBRL Instance Document
|
|
|
100.SCH
|
XBRL Taxonomy Extension Schema Document
|
|
|
100.CAL
|
XBRL Taxonomy Extension Calculation Linkbase Document
|
|
|
100.DEF
|
XBRL Taxonomy Extension Definition Linkbase Document
|
|
|
100.LAB
|
XBRL Taxonomy Extension Label Linkbase Document
|
|
|
100.PRE
|
XBRL Taxonomy Extension Presentation Linkbase Document
|
* Compensatory agreements.
SIGNATURES
Pursuant to the requirements of Section 13 or 15(d) of the Securities Exchange Act of 1934, the registrant has duly caused this report to be signed on its behalf by the undersigned, thereunto duly authorized, in the City of Rye, State of New York, on March 6, 2015.
GAMCO INVESTORS, INC.
|
By: /s/ Kieran Caterina
|
By: /s/ Diane M. LaPointe
|
|
Name: Kieran Caterina
|
Name: Diane M. LaPointe
|
|
Title: Co-Chief Accounting Officer
(Co-Principal Accounting Officer)
|
Title: Co-Chief Accounting Officer
(Co-Principal Accounting Officer)
|
|
Date: March 6, 2015
|
Date: March 6, 2015
|
91
POWER OF ATTORNEY
Each person whose signature appears below hereby constitutes and appoints Kieran Caterina, Kevin Handwerker, Diane M. LaPointe and Robert S. Zuccaro and each of them, their true and lawful attorney-in-fact and agent with full power of substitution and resubstitution, for them in their name, place and stead, in any and all capacities, to sign any and all amendments to this report and to file the same, with all exhibits thereto, and other documents in connection therewith, with the Securities and Exchange Commission, and hereby grants to such attorney-in-fact and agent full power and authority to do and perform each and every act and thing requisite and necessary to be done, as fully to all intents and purposes as he might or could do in person, hereby ratifying and confirming all that said attorney-in-fact and agent or his substitute or substitutes may lawfully do or cause to be done by virtue hereof.
Pursuant to the requirements of the Securities Exchange Act of 1934, this report has been signed by the following persons in the capacities and on the dates indicated.
|
Signature
|
Title
|
Date
|
||
|
/s/ Mario J. Gabelli
|
Chairman of the Board,
|
March 6, 2015
|
||
|
Mario J. Gabelli
|
Chief Executive Officer
|
|||
|
(Principal Executive Officer)
|
||||
|
and Director
|
||||
|
/s/ Robert S. Zuccaro
|
Executive Vice-President and
|
March 6, 2015
|
||
|
Robert S. Zuccaro
|
Chief Financial Officer
|
|||
|
(Principal Financial Officer)
|
||||
|
/s/ Kieran Caterina
|
Co-Chief Accounting
|
March 6, 2015
|
||
|
Kieran Caterina
|
Officer (Co-Principal
|
|||
|
Accounting Officer)
|
||||
|
/s/ Diane M. LaPointe
|
Co-Chief Accounting
|
March 6, 2015
|
||
|
Diane M. LaPointe
|
Officer (Co-Principal
|
|||
|
Accounting Officer)
|
||||
|
/s/ Edwin L. Artzt
|
Director
|
March 6, 2015
|
||
|
Edwin L. Artzt
|
||||
|
/s/ Raymond C. Avansino, Jr.
|
Director
|
March 6, 2015
|
||
|
Raymond C. Avansino, Jr.
|
||||
|
/s/ Richard L. Bready
|
Director
|
March 6, 2015
|
||
|
Richard L. Bready
|
||||
|
/s/ Marc Gabelli
|
Director
|
March 6, 2015
|
||
|
Marc Gabelli
|
||||
|
/s/ Eugene R. McGrath
|
Director
|
March 6, 2015
|
||
|
Eugene R. McGrath
|
||||
|
/s/ Robert S. Prather, Jr.
|
Director
|
March 6, 2015
|
||
|
Robert S. Prather, Jr.
|
||||
|
/s/ Elisa M. Wilson
|
Director
|
March 6, 2015
|
||
|
Elisa M. Wilson
|
92