Attached files
| file | filename |
|---|---|
| EX-21 - EXHIBIT 21 - TECUMSEH PRODUCTS CO | a201410kexhibit21.htm |
| EX-23.1 - EXHIBIT 23.1 - TECUMSEH PRODUCTS CO | a201410kexhibit231.htm |
| EX-32.2 - EXHIBIT 32.2 - TECUMSEH PRODUCTS CO | a201410kq4exhibit322.htm |
| EX-32.1 - EXHIBIT 32.1 - TECUMSEH PRODUCTS CO | a201410kq4exhibit321.htm |
| EX-31.1 - EXHIBIT 31.1 - TECUMSEH PRODUCTS CO | a201410kq4exhibit311.htm |
| EX-31.2 - EXHIBIT 31.2 - TECUMSEH PRODUCTS CO | a201410kq4exhibit312.htm |
| EXCEL - IDEA: XBRL DOCUMENT - TECUMSEH PRODUCTS CO | Financial_Report.xls |
UNITED STATES
SECURITIES AND EXCHANGE COMMISSION
Washington, D.C. 20549
Form 10-K
(Mark One)
ý | ANNUAL REPORT PURSUANT TO SECTION 13 OR 15(d) OF THE SECURITIES EXCHANGE ACT OF 1934 |
For the Fiscal Year Ended December 31, 2014
Commission File Number 001‑36417
TECUMSEH PRODUCTS COMPANY
(Exact name of registrant as specified in its charter)
Michigan | 38-1093240 | |
(State or other jurisdiction of incorporation or organization) | (IRS Employer Identification Number) | |
5683 Hines Drive | ||
Ann Arbor, Michigan 48108 | (734) 585-9500 | |
(Address of Principal Executive Offices, including zip code) | (Registrant’s telephone number, including area code) | |
Securities Registered Pursuant to Section 12(b) of the Act:
Title of Each Class | Name of Each Exchange on Which Registered | |
Common Shares, No Par Value | The Nasdaq Stock Market LLC | |
Securities Registered Pursuant to Section 12(g) of the Act: None
Indicate by check mark if the registrant is a well-known seasoned issuer, as defined in Rule 405 of the Securities Act. Yes ¨ No ý
Indicate by check mark if the registrant is not required to file reports pursuant to Section 13 or Section 15(d) of the Act. Yes ¨ No ý
Indicate by check mark whether the registrant (1) has filed all reports required to be filed by Section 13 or 15(d) of the Securities Exchange Act of 1934 during the preceding 12 months (or for such shorter period that the registrant was required to file such reports), and (2) has been subject to such filing requirements for the past 90 days. Yes ý No ¨
Indicate by check mark whether the registrant has submitted electronically and posted on its corporate Web site, if any, every Interactive Data File required to be submitted and posted pursuant to Rule 405 of Regulation S-T during the preceding 12 months (or for such shorter period that the registrant was required to submit and post such files). Yes ý No ¨
Indicate by check mark if disclosure of delinquent filers pursuant to Item 405 of Regulation S-K is not contained herein, and will not be contained, to the best of registrant’s knowledge, in definitive proxy or information statements incorporated by reference in Part III of this Form 10-K or any amendment to this Form 10-K. ¨
Indicate by check mark whether the registrant is a large accelerated filer, an accelerated filer, a non-accelerated filer, or a smaller reporting company. See the definitions of “large accelerated filer,” “accelerated filer,” and “smaller reporting company” in Rule 12b-2 of the Exchange Act. (Check one):
Large accelerated filer | ¨ | Accelerated filer | ý | Non-accelerated filer | ¨ | Smaller reporting company | ¨ |
(Do not check if a smaller reporting company) | |||||||
Indicate by check mark whether the registrant is a shell company (as defined in Rule 12b-2 of the Exchange Act). Yes ¨ No ý
As of June 30, 2014, directors and executive officers of the Registrant and holders of more than 10% of our Common Shares held an aggregate of 3,041,743 shares. The aggregate market value as of June 30, 2014 (based on the closing price of $5.09 per Common Share, as reported on the Nasdaq Stock Market on such date) of the 15,437,941 Common Shares held by non-affiliates was $78,579,120.
Numbers of shares outstanding of each of the registrant’s classes of common stock at March 3, 2015:
Common Shares, No Par Value: | 18,479,684 | |
DOCUMENTS INCORPORATED BY REFERENCE
Certain information in the proxy statement to be used in connection with the registrant’s 2015 annual meeting of shareholders scheduled to be held on April 29, 2015 has been incorporated herein by reference in Part III hereof.
TABLE OF CONTENTS
Page | |
PART I
ITEM 1. | BUSINESS |
General
Tecumseh Products Company is a Michigan corporation organized in 1934. Unless the context states otherwise, the terms “Company”, “we”, “us” and “our” refer to Tecumseh Products Company and its consolidated subsidiaries. We are a global manufacturer of hermetically sealed compressors for residential and specialty air conditioning, household refrigerators and freezers and commercial refrigeration applications.
Our products include air conditioning and refrigeration compressors, as well as condensing units, heat pumps and complete refrigeration systems. Products range from fractional horsepower reciprocating compressors used in small refrigerators and dehumidifiers to large reciprocating, rotary and scroll compressors used in commercial air conditioning and refrigeration systems. We sell compressors for three primary applications: (i) commercial refrigeration, including walk-in coolers and freezers, ice makers, dehumidifiers, water coolers, food service equipment and refrigerated display cases and vending machines; (ii) household refrigerators and freezers; and (iii) residential and specialty air conditioning and heat pumps, including window air conditioners, packaged terminal air conditioners and recreational vehicle and mobile air conditioners. Tecumseh’s products are sold to original equipment manufacturers (“OEMs”) and authorized wholesale distributors.
Foreign Operations and Sales
We maintain manufacturing plants in the United States (“U.S.”), Brazil, France, and India, as well as assembly plants in Canada, Mexico, Malaysia and a joint venture in China. In 2014, sales to customers outside the U.S. represented more than 80% of total sales.
Our dependence on sales, assembly and manufacturing in foreign countries entails certain commercial and political risks, including currency fluctuations, unstable economic or political conditions in some areas and the possibility of U.S. government embargoes on sales to certain countries. In 2014, we did not knowingly engage in, or knowingly conduct, any activities requiring disclosure under Section 13(r)(1) of the Securities Exchange Act of 1934 regarding Iran. Our foreign manufacturing operations are subject to other risks, including governmental expropriation, governmental regulations that may be disadvantageous to businesses owned by foreign nationals and instabilities in the workforce due to changing political and social conditions. These considerations exist in all of our foreign countries, but are especially significant in the context of our Brazilian operations, given the importance of their overall size and performance in relation to our total operating results.
Compressor Product Lines
A compressor is a device that compresses a refrigerant gas. In applications that utilize compressors, when the gas is later permitted to expand, it removes heat from the room or appliance by absorbing and transferring it, producing a cooling effect. This technology forms the basis for a wide variety of refrigeration and air conditioning products. Most of the compressors we produce are hermetically sealed. Our current compressor line consists primarily of reciprocating, rotary and scroll designs.
Our lines of compressors include:
• | reciprocating piston models ranging from 145 to 1,100 BTU/hour used in household refrigerators and freezers, |
• | reciprocating piston models ranging from 250 to 81,000 BTU/hour used in commercial refrigeration applications, such as ice makers, vending machines, food service equipment, display cases and refrigerated walk-in coolers and freezers, |
• | rotary compressors ranging from approximately 5,000 to 32,000 BTU/hour used in stationary and mobile air conditioning applications, and |
• | scroll compressors ranging from 28,000 to 120,000 BTU/hour that are designed specifically for demanding commercial refrigeration applications. |
• | semi-hermetically sealed compressors ranging from 24,000 to 360,000 BTU/Hour |
We produce variable speed compressors for a wide range of mobile cooling applications that utilize DC power (such as battery and/or solar power). Mobile cooling applications include but are not limited to, military, medical, telecommunications, aircraft, truck, bus, rail and automotive applications. Our compressors use a variety of refrigerants, including hydrocarbon refrigerants, for different applications. We also produce sub-assemblies and complete refrigeration systems using our compressors as components. Such products include indoor and outdoor condensing units, multi-cell condensing units and complete
3
refrigeration systems that use both single speed and variable speed AC and/or DC powered compressors. These products are sold to both OEMs and authorized wholesale distributors.
During 2015, we plan on launching a number of new products. We expect to complete the majority of the transition from our existing compressor series to these new products during calendar years 2016 and 2017.
Manufacturing and Assembly Operations
We manufacture our products in facilities located in the U.S., Brazil, France and India. We also have assembly plants located in Canada, Mexico, Malaysia and a joint venture located in China. Our Brazilian compressor operations are the largest of our manufacturing locations. They include two sites producing our broadest product offerings, with an installed annual capacity of approximately 12.8 million compressors a year. Products that we produce in Brazil are sold throughout the world. Brazilian exports were approximately 19%, 24%, and 29% of Brazilian production in 2014, 2013, and 2012, respectively. The weakening of the EURO, Brazilian Real and the Indian Rupee have favorably impacted our competitiveness.
We produce compressor products in North America in our Mississippi manufacturing facility and assembly plants in Canada and Mexico. Installed annual capacity in Mississippi is approximately 2.9 million compressors a year. We also manufacture electric motors, a component of finished compressors, at our facility in Tennessee. In 2014, 2013 and 2012 approximately 15%, 16% and 13%, respectively, of the compressor products produced in our North American operations were exported outside of North America.
We operate three manufacturing facilities in France. The facilities in France have an aggregate annual compressor capacity of 3.2 million units. We also operate two manufacturing facilities in India with a current total annual compressor capacity of 4.5 million units.
We produce a significant portion of our component needs internally; however, we make strategic and concentrated purchases, particularly of raw materials, from a few suppliers. The principal raw materials used in our manufacturing processes are steel, copper and aluminum. In recent years, the volatility of commodity prices and related components has impacted us and the industry in general. We attempt to mitigate the volatility and impact of higher commodity prices through a combination of entering into commodity derivative contracts, customer price indexing, material surcharges and cost reduction initiatives.
Our required raw materials and components are generally available in sufficient quantities from a variety of non-affiliated suppliers. To the extent possible, we concentrate purchases with one to two suppliers and develop long-term relationships with these vendors. By developing these relationships, we leverage our material needs to help in ensuring we obtain adequate supply levels for our production needs at a competitive cost.
Sales and Marketing
We market our compressor and condensing unit products under the following brand names: “Tecumseh,” “Masterflux,” “Silensys,” “Celseon”, “Vector” and "Wintsys". We sell our products in 97 countries primarily through our own sales staff, as well as independent sales representatives and authorized wholesale distributors.
A substantial portion of our sales of compressor products for room air conditioners and for household refrigerators and freezers are to OEMs. A substantial portion of our sales of compressor products for unitary residential air conditioning systems and commercial refrigeration applications are to both OEMs and authorized wholesale distributors.
The breakdown of sales by class for 2014, 2013, and 2012 is set forth in the table below:
% of Total Sales Volume | |||||||||
2014 | 2013 | 2012 | |||||||
Commercial Refrigeration | 62 | % | 59 | % | 59 | % | |||
Household Refrigerator and Freezer | 19 | % | 19 | % | 22 | % | |||
Residential and Specialty Air Conditioning | 19 | % | 22 | % | 19 | % | |||
Total | 100 | % | 100 | % | 100 | % | |||
We have over 1,600 customers for compressors and condensing units. The majority of our customers are for commercial refrigeration products, while our customer base for household refrigeration and freezer (“R&F”) applications is much more concentrated. In 2014, our largest customers, Electrolux and Whirlpool Corporation, both of whom were primarily R&F customers, accounted for 6.3% and 5.9%, respectively of consolidated net sales. Loss of either of these customers could have a material adverse effect on our results. Generally, we do not enter into long-term contracts with our customers. However, we do
4
pursue long-term agreements with select major customers where a business relationship has existed for a substantial period of time.
Competition
All of the compressor and condensing unit markets in which we operate are highly competitive. We compete with other compressor producers, including manufacturers of end products and other manufacturers that have internal compressor manufacturing operations. Most of these competitors manufacture their products outside the U.S. in countries where customers are manufacturing products that use compressors and where manufacturing costs are lower, including Asia and Eastern Europe. Worldwide productive capacities exceed global demand, which has put pricing pressure on major manufacturers in this market.
Participants compete on the basis of efficiency, price, sound level, refrigerant, delivery, reliability, availability and service, as well as compliance with various environmental and regional safety standards and regulations. For most applications there are numerous competitors. Some of our competitors offer more products and have greater financial, technical, manufacturing, research and development and management resources than we do. Products in some markets are relatively undifferentiated and competitors continuously introduce new products. The household refrigerator and freezer market is vertically integrated with many appliance producers manufacturing a substantial portion of their compressor needs. Due to the robust nature of our compressors for specialty air conditioning applications, we are particularly well suited for specialized, niche markets located in parts of the Middle East and Asia.
In the U.S. and Europe specialty air conditioning compressor markets, we compete primarily with: Emerson/Copeland Corporation, Danfoss, Inc., LG, Panasonic and Rechi. In Brazil, domestic compressor manufacturers have some protection from outside competition, including import duties for compressors delivering up to 18,000 BTU/hour of cooling capacity. This protection only pertains to components (e.g., compressors) and final products. We believe that we and Whirlpool, S.A (selling compressors under the brand name “Embraco”) account for a majority of the compressors sold in Latin America for refrigeration and freezer applications. However, in prior years our market share in Brazil had been reduced, as the strength of the Brazilian currency made foreign imports relatively cheap despite the presence of duties. As a result, Asian manufacturers have captured market share, including small shares of the market for compressors for refrigeration and freezer applications, and importation of the end products containing compressors, particularly in the room air conditioning market. In addition, our Latin American sales are concentrated and we believe that Embraco is capturing additional market share. Since the second half of 2011, the Brazilian Real has been weakening, and we believe this has improved our competitiveness. In 2014, approximately 44.0% of the sales from our Brazilian location were made to its three largest customers, and the loss of any of these customers would have a significant impact on the results of operations of this location and on our consolidated results as a whole.
In East Asia, domestic compressor manufacturers also have some protection from outside competition, including import duties. We have manufacturing facilities in India, where our sales in this region are concentrated. Compressors used in air conditioning and household refrigerator applications are our primary markets in this region. This region has not yet fully developed a cold chain with temperature-controlled storage and distribution facilities. Our Indian sales are concentrated because there are fewer end product manufacturers in India. In 2014, approximately 53.7% of the sales from our Indian location into East Asian markets were made to its three largest customers, and the loss of any of these customers would have a significant impact on the results of operations of our Indian location and on our consolidated results as a whole.
Regulatory Requirements
Hydrochlorofluorocarbon compounds (“HCFCs”) are still used as a refrigerant in many air conditioning systems primarily in developing regions of the world. Under a 1992 international agreement, the use of virgin HCFCs in new pre-charged equipment was banned beginning January 1, 2010 in the U.S. Some Western European countries began HCFC phase-outs as early as 1998, while some of these countries have fully eliminated the use of HCFCs. During the last several years, we have approved and released a number of compressor models utilizing U.S. government approved hydrofluorocarbon (“HFC”) refrigerants. HFCs are also currently under global scrutiny and subject to possible future restrictions. We believe we are positioned to react in a timely manner to expected changes in the regulatory landscape.
In the last few years, there has been an even greater political and consumer movement toward the use of hydrocarbons (“HCs”) and carbon dioxide as alternative refrigerants, moving further away from the use of chlorine (which depletes the ozone layer of the atmosphere) and the use of fluorine (which contributes to the “green-house” effect). The most common HC refrigerants are isobutane (R600a) and propane (R290). HCs are flammable compounds and are approved by the U.S. Government with limits on the amount of refrigerant charge by application type. As part of the U.S. Environmental Protection Agency’s ("EPA") Significant New Alternatives Policy ("SNAP"), HC refrigerants have been approved in household refrigerators and freezers and self-contained commercial refrigeration equipment.
5
The EPA limits the charge size of isobutane to a maximum of 59 grams (2 ounces) for household refrigerator and freezer applications and the charge size of propane for self-contained commercial refrigeration applications to a maximum of 150 grams (5.3 ounces). We build compressors utilizing HCs for sale into European, Latin American and Indian markets. We also supply a small volume of HC compressors and condensing units in the U.S., where hydrocarbons are slowly being adopted by the market. It is not presently possible to estimate the level of expenditures that will be required to meet future industry requirements or the effect on our earnings or competitive position. Nonetheless, we expect that our product development process will address these changes in a timely manner.
The U.S. National Appliance Energy Conservation Act of 1987 (“NAECA”) requires specified energy efficiency ratings on room air conditioners and household refrigerators and freezers. Most of the world markets’ manufacturing communities have issued energy efficiency directives that specify the acceptable level of energy consumption for refrigerators and freezers. These efficiency ratings apply to the overall performance of the specific appliance, of which the compressor is one component. We have ongoing projects aimed at improving the efficiency levels of our compressor products and have products available to meet energy efficiency requirements as determined by our customers.
Geographic Location Information
The results of operations and other financial information by geographic location for the years ended December 31, 2014, 2013 and 2012, appear in Note 17 “Business Segments – Geographic Information” of the Notes to Consolidated Financial Statements which is in Part II, Item 8, of this report, “Financial Statements and Supplementary Data,” and that information is incorporated by reference into this Item 1.
Backlog and Seasonal Variations
Most of our production is against short-term purchase orders and order backlog is not significant.
Compressor products are subject to some seasonal variation among individual product lines. In particular, sales for compressor products are higher in the first and second quarters for customer needs prior to the commencement of warmer weather in the northern hemisphere, for both residential air conditioning products and commercial refrigeration applications. This seasonal effect is somewhat, though not completely, offset by sales volumes in the southern hemisphere. Depending on relative performance among the regions, and external factors such as foreign currency changes and global weather, trends can vary. In the past three years, consolidated sales in the aggregate have exhibited a slight seasonal trend, with sales in the first half of the year higher than sales in the second half of the year.
Patents, Licenses and Trademarks
We own a substantial number of patents, licenses and trademarks and deem them to be important to certain lines of our business; however, the success of our overall business is not considered primarily dependent on them. In the conduct of our business, we own and use a variety of registered trademarks, the most familiar of which is the trademark consisting of the word “Tecumseh” in combination with a blue Native American silhouette.
Research and Development
In addition to compressors, we’ve begun developing value-added systems, providing smart controls and remote communication controls where we believe that the benefits to our customers outweigh the added costs. These development projects also apply to our Masterflux line of variable speed products, for emerging mobile applications. We are also developing waste heat recovery applications and solar technologies.
The ability to successfully bring new products to market in a timely manner has become a critical factor for competing in the compressor products business. System energy efficiency standards and new eco-friendly refrigerants mandated by environmental regulations will continue to require advances in compressor designs. Variable speed technology is being applied where the cost/benefit can be justified.
We develop new product concepts at our research and development center in Ann Arbor, Michigan and in cooperation with project design teams located at our various regional manufacturing facilities. Compressor simulation software has been
6
developed in-house which, combined with extensive lab instrumentation and testing capabilities, helps us design the thermal, fluid, acoustic and mechanical design aspects of our new products.
We focus our design efforts on the reliability of our products and simplicity in manufacturing. We spent approximately $14.3 million, $14.7 million, and $15.1 million during 2014, 2013 and 2012, respectively, on research and development activities relating to the development of new products and the development of improvements to existing products.
Employees
On December 31, 2014, we employed approximately 5,200 full-time equivalent employees and an additional 1,000 temporary employees and contractors worldwide, 91.5% of whom were employed in foreign locations. While none of our U.S. employees were represented by labor unions, many of our foreign location personnel are represented by national trade unions. We believe we generally have a good relationship with our employees.
Available Information
We provide public access to our annual report on Form 10-K, quarterly reports on Form 10-Q, current reports on Form 8-K, and amendments to these reports filed with or furnished to the Securities and Exchange Commission (“SEC”) under the Securities Exchange Act of 1934. These documents may be accessed free of charge through the Investor Relations section of our website at the following address: http://www.tecumseh.com. These documents are provided as soon as reasonably practicable after filing with, or furnishing to, the SEC. These documents may also be found at the SEC website at http://www.sec.gov.
ITEM 1A. | RISK FACTORS |
Set forth below and elsewhere in this Annual Report on Form 10-K are descriptions of material risks and uncertainties that could cause our actual business results to differ materially from those described in any forward-looking statements contained in this report. These risk factors should be considered in addition to our cautionary statements concerning forward-looking statements in this report, including statements related to markets for our products and trends in our business, which involve a number of risks and uncertainties. Our separate section in Item 7 below, “Cautionary Statements Relating To Forward-Looking Statements,” should be considered in addition to the following statements.
We have a history of losses and might not maintain our current level of liquidity.
Our cash position has become increasingly important in light of constrained capital markets and the current economic environment. Our cash position has not been generated from operations but instead by non-recurring divestitures, new financing arrangements and pension plan reversions. However, we may not be able to maintain our current levels of liquidity. We have incurred losses in seven of our last eight years, including 2014, and would have incurred a loss in 2012 if we had not recognized a $45.0 million postretirement benefit curtailment gain due to the termination of certain postretirement benefits for salaried employees and retirees. We believe we will continue to incur net losses for the next several years. Challenges remain with respect to our ability to generate appropriate levels of liquidity solely from cash flows from operations, in particular due to uncertainties related to future sales levels, global economic conditions, currency exchange effects and commodity pricing. We may not be able to generate cash from operating activities unless further restructuring activities are implemented or sales or economic conditions improve. Additional restructuring activities may be necessary and might include changing our current footprint, consolidating facilities, otherwise reducing our manufacturing capacity, selling assets or reducing the number of our employees. These actions could result in significant restructuring or asset impairment charges, severance costs, losses on asset sales and use of cash. Accordingly, these restructuring activities could have a significant effect on our consolidated financial position, operating profit, cash flows and future operating results. While we believe that current cash balances, available borrowings under our existing credit facilities, proceeds from sales of assets and cash inflows related to non-income tax refunds will produce adequate liquidity to implement our business strategy over at least the next twelve months, there is a risk that the costs of any such restructuring and cash required will exceed the benefits received from such activities or that such benefits will ultimately be inadequate if sales or economic conditions deteriorate. In addition, while our business dispositions in prior years have improved our liquidity, many of the sale agreements provide for certain retained liabilities and indemnities, including liabilities that relate to environmental issues and product warranties. Future events could result in the recognition of additional liabilities that could consume available liquidity and management attention.
7
If we are unable to develop successful new products, our sales could be adversely affected and we might not be profitable.
If we are unable to develop and successfully market competitive products, our sales volumes could be adversely affected and we might not be profitable. Products in our markets are relatively undifferentiated and new products are continuously introduced to the market. Our future results and our ability to maintain or improve our competitive position will depend on our capacity to gauge the direction of our key markets and on our ability to successfully develop products that comply with new regulations and timely identify, develop, manufacture, market, and sell new or improved products in these changing markets. If we fail to do so, our financial condition and results of operations could be adversely affected.
Current and future global or regional political and economic conditions, including credit markets, could have an adverse effect on our sales volumes, liquidity and profitability.
Our sales volumes, liquidity and profitability depend significantly on worldwide economic conditions. Uncertainty about global economic conditions poses a risk as consumers postpone spending in response to tighter credit, unemployment, negative financial news and/or declines in income or asset values. The global recession precipitated by the financial crisis and subsequent weak and uncertain global economy had a detrimental effect on our sales volumes over the last several years, and a related detrimental effect on our liquidity and profitability. A number of factors, including, but not limited to, gross domestic product, availability of consumer credit, interest rates, consumer confidence, unemployment levels, debt levels, retail trends, housing starts, inventory levels, commodity costs and foreign currency exchange rates, generally affect demand for our products. In the event of financial turmoil affecting the banking system and financial markets, additional consolidation of the financial services industry, or significant financial service institution failures, there could be a new or incremental tightening in the credit markets, low liquidity and extreme volatility in fixed income, credit, currency and equity markets and a lack of credit availability for us. This could have a number of effects on our business, including the inability of end customers to obtain credit to finance purchases of products containing our products, and failure of derivative counterparties and other financial institutions. A further decline in economic activity and conditions, or continued volatility in global economic conditions in the U.S., Brazil, Europe, Asia and the other markets in which we operate could adversely affect our financial condition and results of operations, including our sales volumes, liquidity and profitability.
Regional economic conditions can also have an adverse effect on our sales volumes and our costs, with a resulting adverse impact on our liquidity and profitability. The prolonged stagnation and political disruption in the Euro zone, which has impacted other economies in the region, uncertainties surrounding the conflicts in the Ukraine and the Middle East and concerns about market fundamentals in many of the world's largest economies have contributed to a lack of growth in each of these markets. If these uncertainties continue, our financial condition and results of operations, including our sales volumes, liquidity and profitability could be adversely affected.
If we do not effectively improve productivity and restructure our operations in order to reduce costs and bring them in line with projected production levels and product mix, we might not be profitable.
If we are unable to improve productivity and restructure to reduce costs we might not be profitable. Our ability to make these improvements depends on our success in implementing lean manufacturing processes and reducing waste, addressing our excess capacity and high fixed cost base, optimizing headcount, enhancing the design of our products to increase manufacturing efficiency and using lower cost materials. Restructuring and realignment of our manufacturing operations and personnel or system implementations might cause business disruptions and might not result in the expected amount of savings or make us profitable.
The loss of, or substantial decline in sales to, any of our key customers, including Electrolux or Whirlpool, could adversely affect our sales volumes, profitability and liquidity.
In 2014, our largest customers, Electrolux and Whirlpool Corporation, both of whom were primarily R&F customers, accounted for 6.3% and 5.9%, respectively of consolidated net sales. Loss of either of these customers, or substantial declines in sales to either of them, could have an adverse effect on our sales volumes and our resulting profitability and liquidity. Generally, we do not enter into long-term contracts with our customers, making it easier for the customer to change volume among suppliers. Larger customers may also seek to use their position to improve their performance by various means, including improved efficiency, lower pricing and increased promotional programs. If we are unable to meet their requirements, our sales volume and related profitability and liquidity could be negatively affected. Additionally, the loss of market share or financial difficulties, including bankruptcy, by these large customers could have a material adverse effect on our liquidity, financial position and results of operations.
8
Increased or unexpected product warranty claims could adversely affect us.
We provide our customers a warranty on products we manufacture. Our warranty generally provides that products will be free from defects for periods ranging from 12 months to 36 months. If a product fails to comply with the warranty, we may be obligated, at our expense, to correct any defect by repairing or replacing the defective product. Although we maintain warranty reserves in an amount based primarily on the number of units shipped and on historical and anticipated warranty claims, future warranty claims might not follow historical patterns or we might not accurately anticipate the level of future warranty claims. An increase in the rate of warranty claims or the occurrence of unexpected warranty claims could materially and adversely affect our financial condition, results of operations and cash flows. For example, in 2014 and 2013, we incurred $11.4 million and $14.5 million, respectively in expenses to replace defective products shipped to customers, as we experienced two major quality issues that were originally identified in 2013.
We operate in highly competitive markets.
All of the compressor and condensing unit markets in which we operate are highly competitive. We compete on the basis of efficiency, price, sound level, refrigerant, delivery, reliability, availability and service, as well as compliance with various environmental and regional safety standards and regulations. For most applications there are numerous competitors, some of which offer more products and have greater financial, technical, manufacturing, research and development and management resources than we do. Products in some markets are relatively undifferentiated and competitors are continuously introducing new products. If our products do not meet or exceed the attributes of our competitors' offerings, we could be at a disadvantage in the affected product lines. These and other factors might have a material adverse effect on our results of operations.
In addition, we operate in environments where worldwide productive capacities exceed global demand and customers and competitors are establishing new productive capacities in low cost countries. These trends have put downward pressure on prices and in some cases have resulted in us losing market share. These trends may also result in the need for us to restructure our operations further by removing excess capacities and engaging in joint ventures with manufacturers in low cost countries. There is no guarantee that these initiatives, which could include plant closures, reductions in the number of our employees, asset sales and expanded operations in low cost countries, would improve our profitability in the future.
Our international operations subject us to risks associated with foreign currency fluctuations.
We are exposed to significant exchange rate risk because the majority of our revenues, expenses, assets and liabilities are derived from operations conducted outside the U.S. in local and other currencies and, for purposes of financial reporting, the results are translated into U.S. Dollars based on currency exchange rates prevailing during or at the end of the reporting period. During times of a strengthening U.S. Dollar, our reported net revenues and net income (loss) and assets are reduced because the local currency will translate into fewer U.S. Dollars, and during times of a weakening U.S. Dollar, our reported expenses and liabilities are increased because the local currency will translate into more U.S. Dollars. Because of the geographic diversity of our operations, weaknesses in some currencies might be offset by strengths in others over time. However, fluctuations in foreign currency exchange rates, particularly the strengthening of the U.S. Dollar against major currencies could materially affect our financial results.
We are also exposed to significant exchange rate risk when an operation has sales or expense transactions in a currency that differs from its local, functional currency or when the sales and expenses are denominated in different currencies. Since our primary risk stems from sales transacted at foreign locations which have the resulting receivable denominated in U.S. Dollars, this risk affects our business adversely when the Brazilian Real, Euro or Indian Rupee strengthens against the U.S. Dollar. In these cases, when the receivable is ultimately paid in less valuable U.S. Dollars, the foreign location realizes less net revenue in its local currency, which can adversely impact its margins. We have developed strategies to mitigate or partially offset these impacts, primarily hedging against transactional exposure where the risk of loss is greatest. While the use of currency hedging instruments may provide us with short-term protection from adverse fluctuations in currency exchange rates, by utilizing these instruments we potentially forego the benefits that might result from favorable fluctuations in currency exchange rates.
Ultimately, long term changes in currency exchange rates have lasting effects on the relative competitiveness of operations located in certain countries versus competitors located in different countries. See “Item 7 – Management’s Discussion and Analysis of Financial Condition and Results of Operations – Executive Summary – Currency Exchange” and “—Outlook” and “Item 7A – Quantitative and Qualitative Disclosures about Market Risk – Foreign Currency Exchange Risk” for a description of foreign currency volatility and a description of our hedging activity.
9
Our results of operations may be negatively impacted by litigation and environmental claims.
Our business exposes us to potential litigation and environmental claims, such as environmental clean-up obligations, resource damage claims and product liability suits that are inherent in the design, manufacture and sale of our current products and some products that we sold in the past. We are also potentially exposed to litigation related to prior sales of businesses, securities laws, antitrust laws or other types of business disputes. Results of legal proceedings and environmental claims cannot be predicted with certainty. Regardless of merit, litigation and environmental claims can be both time-consuming and disruptive to our operations and can cause significant expense and diversion of management attention. We estimate loss contingencies and establish reserves as required by generally accepted accounting principles in the United States (“U.S. GAAP”) based on our assessment of contingencies where liability is deemed probable and the amount is reasonably estimable in light of the facts and circumstances known to us at a particular point in time. Subsequent developments in legal proceedings, volatility in foreign currency exchange rates and other factors may affect our assessment and estimates of the loss contingency recorded and could result in an adverse effect on our results of operations in the period in which a liability would be recognized or cash flows for the period in which amounts would be paid. Actual results may significantly vary from our reserves.
We self-insure a portion of product liability claims; an unsuccessful defense of a product liability claim or series of successful claims against us could materially and adversely affect our product reputation and our financial condition, results of operations, and cash flows. Even if we are successful in defending against a claim relating to our products, claims of this nature could cause our customers to lose confidence in our products and our company.
Given the inherent uncertainty of litigation and environmental claims, we cannot be certain that existing litigation or environmental claims or any future adverse legal developments will not have a material adverse impact on our financial condition, liquidity or results of operations. See Item 8 – Financial Statements and Supplementary Data – Note 16, “Commitments and Contingencies – Litigation” of Notes to Consolidated Financial Statements for a description of our legal matters.
We are subject to, and could be further subject to, governmental investigations and actions by other third parties relating to antitrust laws that could have an adverse effect on our results of operations, liquidity and financial condition.
We are one of several companies involved in investigations by government regulators in various jurisdictions into possible anti-competitive practices in the compressor industry. While we have entered into conditional amnesty agreements under which we do not expect to be subject to criminal prosecution with respect to the investigations, we are not exempt from civil litigation. We have been named as a defendant in numerous related class action lawsuits in various jurisdictions; these lawsuits seek damages in connection with the pricing of compressors. Additional lawsuits could be filed in the future. The impact of these and other investigations and lawsuits could have a material adverse effect on our financial condition, liquidity and results of operations.
Our global operations subject us to risks associated with changes in government regulations.
Our international sales and operations, including our purchases of raw materials from international suppliers, are subject to risks associated with changes in local government laws, regulations and policies, including those related to tariffs and trade barriers, investments, taxation, exchange controls, governmental expropriation and governmental regulations that may be disadvantageous to businesses owned by foreign nationals, and instabilities in the workforce due to changing political and social conditions. Our international sales and operations are also sensitive to changes in foreign national priorities, including government budgets, as well as to political and economic instability. International transactions may involve increased financial and legal risks due to differing legal systems and customs in foreign countries. The ability to manage these risks can be difficult and may limit our operations, as well as cause the manufacture and sale of our products to become more difficult, which could negatively affect our business and results of operations. See “Item 7– Management’s Discussion and Analysis of Financial Condition and Results of Operations – Executive Summary – Liquidity” and “Liquidity Sources – Cash inflows related to taxes” for a description of our outstanding refundable non-income taxes in Brazil and India.
We also face risks arising from the imposition of exchange controls and currency devaluations. Exchange controls may limit our ability to convert foreign currencies into U.S. Dollars or to remit dividends and other payments by our foreign subsidiaries or businesses located in, or conducted within a country imposing controls. Currency devaluations result in a diminished value of funds denominated in the currency of the country instituting the devaluation. Actions of this nature, if they occur or continue for significant periods of time, could have an adverse effect on our results of operations and financial condition in any given period.
10
We are also subject to additional disclosure requirements, including conflict minerals disclosure requirements. Compliance with these requirements could have a material adverse impact on our results of operations, financial condition and liquidity, as well as divert management's attention away from running our business.
Our operations and products are subject to extensive environmental laws and energy regulations.
Our manufacturing operations are subject to stringent environmental laws and regulations in all of the countries in which we operate, including laws and regulations governing emissions to air, discharges to water and the generation, handling, storage, transportation, treatment and disposal of waste materials. These regulations can vary widely across the countries in which we do business. While we believe that we are in compliance in all material respects with these environmental laws and regulations, we could still be adversely impacted by costs, liabilities or claims with respect to existing, previously divested, or subsequently acquired operations, under either present laws and regulations or those that may be adopted or imposed in the future. We are also subject to laws requiring the cleanup of contaminated property. If a release of hazardous substances occurs at or from any of our current or former properties, or at a landfill or another location where we have disposed of hazardous materials, we may be held liable for the contamination and the amount of such liability could be material. See “Item 8 – Financial Statements and Supplementary Data – Note 16 “Commitments and Contingencies – Litigation – Environmental Matters” of Notes to Consolidated Financial Statements" for a description of our environmental matters.
In addition, governmental regulations control the types of refrigerants that may be utilized in our products, and this global scrutiny continues to evolve. We have continued to address these changes in regulations by approving and releasing new models that meet governmental and customer requirements. We also strive to have our products meet requirements for energy efficiency, which can vary substantially in the different geographic markets in which we sell our products. Future legislation may require substantial levels of expenditure to meet industry requirements, which could have a material adverse effect on our business, results of operations and financial condition.
Price volatility of commodities we purchase could have an adverse effect on our cash flow or results of operations.
The price of raw materials, such as steel, copper and aluminum are one of the most significant cost and cash flow impacts on our business. The prices of these commodities have been extremely volatile over the past few years and due to competitive markets, we are typically not able to quickly recover product cost increases through price increases or other cost savings. While we have been proactive in addressing volatility of these costs by using derivatives to hedge price risk associated with forecasted purchases of certain raw materials, our hedged price could result in our paying higher or lower prices for commodities as compared to the market prices for those commodities when purchased and will not protect us against longer term price increases. Our hedges may also be ineffective in offsetting changes in spot commodity prices, increasing, rather than decreasing, our exposure to commodity price changes. Decreases in spot prices below our hedged prices can put us at a competitive disadvantage compared to less hedged competitors and can also require us to post cash collateral with our hedge counterparties, which could impact our liquidity and cash flows. At December 31, 2014, we were required to post $0.6 million of cash collateral on our commodity hedges. In addition, increases in steel prices have a particularly negative impact as there is currently no well-established global market for hedging against increases in the cost of steel. Continued volatility of commodities or failure of our initiatives to generate cost savings or improve productivity may negatively impact our results of operations. Our hedging activities might not be successful to manage our costs. See “Item 7 – Management’s Discussion and Analysis of Financial Condition and Results of Operations – Executive Summary – Commodities” and “—Outlook” and “Item 7A – Quantitative and Qualitative Disclosures about Market Risk – Commodity Price Risk” for a description of raw material price volatility and a description of our hedging activity.
Significant supply interruptions could have an adverse effect on our cash flow or results of operations.
We generally concentrate purchases for a given raw material or component with a small number of suppliers. Although we believe there are alternative suppliers for all of our key raw material and component needs, if a supplier is unable or unwilling to meet our supply requirements, we could experience supply interruptions or cost increases, either of which could have an adverse effect on our results of operations.
Our management team is an important part of our business and loss of key employees could impair our success.
We benefit from the leadership and experience of our senior management team and other key employees and depend on their continued services to successfully implement our business strategy. The unexpected loss of key employees could have an adverse effect on our operations and profitability if we are unable to secure adequate replacement personnel.
11
We may be adversely impacted by work stoppages and other labor matters.
As of December 31, 2014, we employed approximately 5,200 full-time equivalent employees and an additional 1,000 temporary employees and contractors worldwide. The majority of people we employ on a full time and temporary basis are in foreign locations and approximately 4,800 are represented by national trade unions. While we do not believe that we will be impacted by work stoppages and other labor matters, future issues with our labor unions might not be resolved favorably and we might encounter future strikes, further unionization efforts or other types of conflicts with labor unions or our employees. Any of these factors may have an adverse effect on us or may limit our flexibility in dealing with our workforce. In addition, many of our customers have unionized work forces. Work stoppages or slow-downs experienced by our customers could result in slow-downs or closures at their plants where our products are installed. If one or more of our customers experience a material work stoppage, it could have a material adverse effect on our business, results of operations and financial condition.
A breach in cyber security relating to our information technology systems or failures of third-party technology service providers to perform effectively could adversely affect our reputation, competitive position, business or results of operations.
We rely on information technology systems to process, transmit and store electronic information and manage and operate our business. A breach in cyber security could expose us and our customers and suppliers to risks of misuse of confidential information, manipulation and destruction of data, production downtimes and operations disruptions, which in turn could adversely affect our reputation, competitive position, business or results of operations.
In addition, we have outsourced certain information technology support services and administrative functions, such as payroll processing and benefit plan administration, to third-party service providers and may outsource other functions in the future to achieve cost savings and efficiencies. If the service providers to which we outsource these functions do not perform effectively, we may have to incur additional costs to correct errors made by such service providers. Depending on the function involved, such errors may also lead to business disruption, processing inefficiencies or the loss of or damage to intellectual property through security breach, or harm employee morale, which, in turn could adversely affect our reputation, competitive position, business or results of operations.
Our financial statements may be impacted by future changes in accounting rules and requirements, and these changes may be costly to implement.
Future changes in accounting rules and disclosure requirements could significantly impact our reported financial results and the comparability of financial statements. We constantly monitor new accounting proposals under development by the standard setting bodies. Potential future changes in accounting rules and regulations could be time-consuming and costly to implement.
ITEM 1B. | UNRESOLVED STAFF COMMENTS |
None.
12
ITEM 2. | PROPERTIES |
Our headquarters are located in the United States of America in Ann Arbor, Michigan, approximately 40 miles west of Detroit. We have properties in the U.S., Brazil, France, India, Canada, Mexico, China and Malaysia, occupying approximately 4.8 million square feet; approximately 3.9 million square feet are devoted to manufacturing and assembly. Manufacturing and assembly facility utilization varies during the year depending on the production cycle. All owned and leased properties are adequate and suitable, well maintained and equipped for the purposes for which they are used. See Item 1. Business - "Manufacturing and Assembly Operations" for a description of the production capacity of our manufacturing and assembly facilities. Management believes our manufacturing facilities have excess capacity around the world and is considering reducing excess capacity which could result in a significant change in our manufacturing footprint.
The schedule below outlines our significant facilities by location, ownership and function as of December 31, 2014.
Location | Square Feet | Ownership | Use | ||||
United States: | |||||||
Verona, Mississippi | 530,000 | Leased | Manufacturing | ||||
Tupelo, Mississippi | 135,200 | Leased | Distribution | ||||
Tupelo, Mississippi | 100,000 | Leased | Distribution | ||||
Paris, Tennessee (a) | 190,000 | Owned | Manufacturing | ||||
Tecumseh, Michigan | 26,343 | Owned | Storage | ||||
Ann Arbor, Michigan (b) | 32,400 | Leased | Subleased | ||||
Ann Arbor, Michigan | 49,500 | Owned | Office and Technical Center | ||||
Brazil: | |||||||
Sao Carlos, Brazil Plant 1 | 431,905 | Owned | Manufacturing | ||||
Sao Carlos, Brazil Plant 2 | 1,001,249 | Owned | Manufacturing | ||||
France: | |||||||
Cessieu, France | 316,925 | Owned | Manufacturing | ||||
Barentin, France | 312,363 | Owned | Manufacturing | ||||
La Mure, France | 114,379 | Owned | Manufacturing | ||||
La Verpilliere, France | 341,415 | Owned | Technical Center | ||||
Vaulx Milieu, France | 240,078 | Leased | Office and Distribution | ||||
India: | |||||||
Hyderabad, India (c) | 466,962 | Owned | Manufacturing | ||||
Ballabgarh, India (c) | 246,128 | Owned | Manufacturing | ||||
Canada: | |||||||
Aylmer, Ontario, Canada | 77,700 | Owned | Assembly | ||||
Mexico: | |||||||
Monterrey, Mexico | 50,000 | Leased | Assembly | ||||
China: | |||||||
Song Jiang, China | 72,000 | Leased | Assembly | ||||
Malaysia: | |||||||
Port Klang, Malaysia | 58,205 | Leased | Assembly | ||||
(a) In March 2014, we subleased 102,161 square feet of this facility to a third party.
(b) In November 2012, we entered into a sublease of our original corporate office; in February 2013, we moved our corporate office function into the same building as our Technical Center.
(c) This land is classified as "lease-hold" property. We treat this land as Tecumseh property, however, prior to any sale government approval must be obtained.
See Item 8 - Financial Statements and Supplementary Data - Note 8 “Debt” of Notes to Consolidated Financial Statements for a description of security interests in real estate in the United States and Canada.
13
ITEM 3. | LEGAL PROCEEDINGS |
See “Note 16 – Commitments and Contingencies – Litigation” of the Notes to Financial Statements (Part II, Item 8 of this
Form 10-K) for information regarding legal proceedings in which we are involved, which is incorporated into this Item 3 by reference.
ITEM 4. | MINE SAFETY DISCLOSURES |
Not applicable.
14
PART II
ITEM 5. | MARKET FOR REGISTRANT’S COMMON EQUITY, RELATED STOCKHOLDER MATTERS AND ISSUER PURCHASES OF EQUITY SECURITIES |
As of May 2, 2014, our Common Shares trade on The Nasdaq Stock Market LLC under the symbol TECU. Total shareholders of record as of February 27, 2015 were approximately 114. Prior to May 2, 2014, we had two classes of stock: Class A and Class B Common Stock. Both of these classes of stock traded on The Nasdaq Stock Market LLC under the symbols TECUA and TECUB, respectively. See "Note 9, Stockholders' Equity" of the Notes to Consolidated Financial Statements (Part II, Item 8 of this Form 10K), for additional information regarding the recapitalization that occurred in May 2014.
We do not currently expect to pay dividends. See “Note 8 – Debt” of Notes to Consolidated Financial Statements (Part II, Item 8 of this Form 10-K) for a description of restrictions in our credit facility limiting our ability to pay dividends. As of the date of this report, we have 1,800,000 common shares authorized for issuance under the 2014 Omnibus Incentive Plan. We did not repurchase any of our equity securities during the fourth quarter of 2014.
Market Price and Dividend Information
Range of Common Stock Prices and Dividends for 2014
Sales Price | Cash Dividends Declared | ||||||||||||||
Common Shares | Class A | Class B | |||||||||||||
Quarter Ended | High | Low | High | Low | High | Low | |||||||||
March 31 (a) | N/A | N/A | $9.54 | $6.73 | $9.25 | $6.62 | $ | — | |||||||
June 30 (a)(b) | 7.74 (a) | 4.55 (a) | 7.74 (b) | 5.90 (b) | 6.49 (b) | 5.69 (b) | — | ||||||||
September 30 | 5.45 | 3.97 | N/A | N/A | N/A | N/A | — | ||||||||
December 31 | 4.11 | 2.39 | N/A | N/A | N/A | N/A | — | ||||||||
(a) Common Shares started trading on May 2, 2014. See "Note 9, Stockholders' Equity" of the Notes to Consolidated Financial Statements (Part II, Item 8 of this Form 10K), for additional information.
(b) Class A and Class B Common Stock ceased trading on May 1, 2014. See "Note 9, Stockholders' Equity" of the Notes to Consolidated Financial Statements (Part II, Item 8 of this Form 10K), for additional information.
Range of Common Stock Prices and Dividends for 2013
Sales Price | Cash Dividends Declared | ||||||||||||||||||
Class A | Class B | ||||||||||||||||||
Quarter Ended | High | Low | High | Low | |||||||||||||||
March 31 | $ | 9.67 | $ | 4.75 | $ | 9.61 | $ | 4.78 | $ | — | |||||||||
June 30 | 11.08 | 8.18 | 11.06 | 7.70 | — | ||||||||||||||
September 30 | 12.10 | 8.95 | 12.23 | 8.69 | — | ||||||||||||||
December 31 | 9.10 | 7.01 | 9.08 | 6.75 | — | ||||||||||||||
15
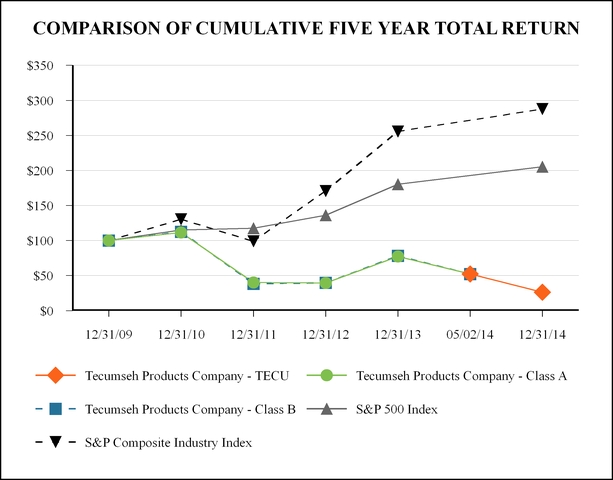
Stock Performance Graph
The following graph and table depict the cumulative total shareholder return (assuming reinvestment of dividends) on $100 invested in each class of Tecumseh common stock, the S&P 500 Index, and the S&P Composite Industry Index for the five year period from December 31, 2009 through December 31, 2014.
Base | INDEXED RETURNS | ||||||||||
Period | Years Ending | ||||||||||
Company / Index | 2009 | 2010 | 2011 | 2012 | 2013 | 2014 | |||||
Tecumseh Products Company - Common Shares (a) | 100 | N/A | N/A | N/A | N/A | 26.43 | |||||
Tecumseh Products Company - Class A (b) | 100 | 111.63 | 40.21 | 39.52 | 77.42 | N/A | |||||
Tecumseh Products Company - Class B (b) | 100 | 112.50 | 38.36 | 39.66 | 78.28 | N/A | |||||
S&P 500 Index | 100 | 115.06 | 117.49 | 136.30 | 180.44 | 205.14 | |||||
S&P Composite Industry Index (c) | 100 | 130.36 | 98.96 | 170.88 | 255.75 | 287.56 | |||||
(a) Common Shares started trading on May 2, 2014. See Note 9, “Stockholders' Equity" of the Notes to Consolidated Financial Statements in Item 8 of this report, for additional information. The return for Tecumseh Products Company represents an investment in Tecumseh Products Company Class A and Class B stock through May 1, 2014 and Tecumseh Products Company common shares subsequent to this date, since both classes were converted into an equal number of Common Shares effective May 2, 2014. Tecumseh Products Class A and Class B are no longer trading due to the amendment to our articles of incorporation that was approved on April 30, 2014. Therefore the 2014 results can only be calculated for the separate classes through May 1, 2014 and as deemed investments in an equal number of common shares after that date. Indexed Returns for Class A and Class B Stock on May 1, 2014 were $52.27 and 52.33 respectively.
(b) Class A and Class B Common Stock ceased trading after May 1, 2014. See Note 9, “Stockholders' Equity" of the Notes to Consolidated Financial Statements in Item 8 of this report, for additional information.
16
(c) S&P Composite Industry Index comprises the S&P Household Appliances Index (50%), the S&P Industrial Machinery Index (25%) and the S&P Electrical Components and Equipment Index (25%).
ITEM 6. | SELECTED FINANCIAL DATA |
The following is a summary of certain of our financial information.
Years Ended December 31, | |||||||||||||||||||
(In millions, except share and per share data) | 2014 (a) | 2013 | 2012 | 2011 (b) | 2010 (b)(c) | ||||||||||||||
Net sales | $ | 724.4 | $ | 823.6 | $ | 854.7 | $ | 864.4 | $ | 933.8 | |||||||||
Cost of sales | (653.7 | ) | (745.5 | ) | (790.0 | ) | (826.5 | ) | (849.5 | ) | |||||||||
Gross profit | 70.7 | 78.1 | 64.7 | 37.9 | 84.3 | ||||||||||||||
Selling and administrative expenses | (92.2 | ) | (104.9 | ) | (107.7 | ) | (108.1 | ) | (114.1 | ) | |||||||||
Other income (expense), net | 9.3 | 21.4 | 22.3 | 14.7 | 14.3 | ||||||||||||||
Impairments, restructuring charges, and other items | (8.8 | ) | (13.6 | ) | 40.6 | (8.5 | ) | (50.3 | ) | ||||||||||
Operating (loss) income | (21.0 | ) | (19.0 | ) | 19.9 | (64.0 | ) | (65.8 | ) | ||||||||||
Interest expense | (10.0 | ) | (9.2 | ) | (10.2 | ) | (10.5 | ) | (10.6 | ) | |||||||||
Interest income | 3.2 | 1.5 | 3.2 | 2.3 | 1.2 | ||||||||||||||
(Loss) income from continuing operations before taxes | (27.8 | ) | (26.7 | ) | 12.9 | (72.2 | ) | (75.2 | ) | ||||||||||
Tax (expense) benefit | (0.5 | ) | (7.7 | ) | 10.2 | 0.9 | 16.6 | ||||||||||||
(Loss) income from continuing operations | (28.3 | ) | (34.4 | ) | 23.1 | (71.3 | ) | (58.6 | ) | ||||||||||
(Loss) from discontinued operations, net of tax | (4.4 | ) | (3.1 | ) | (0.5 | ) | (1.9 | ) | 1.8 | ||||||||||
Net (loss) income | $ | (32.7 | ) | $ | (37.5 | ) | $ | 22.6 | $ | (73.2 | ) | $ | (56.8 | ) | |||||
Basic and diluted (loss) income per share: | |||||||||||||||||||
(Loss) income from continuing operations | $ | (1.53 | ) | $ | (1.86 | ) | $ | 1.25 | $ | (3.86 | ) | $ | (3.17 | ) | |||||
(Loss) income from discontinued operations | (0.24 | ) | (0.17 | ) | (0.03 | ) | (0.10 | ) | 0.10 | ||||||||||
Net (loss) income per share | $ | (1.77 | ) | $ | (2.03 | ) | $ | 1.22 | $ | (3.96 | ) | $ | (3.07 | ) | |||||
Weighted average shares, basic and diluted (in thousands) | 18,480 | 18,480 | 18,480 | 18,480 | 18,480 | ||||||||||||||
Cash dividends declared per share | $ | — | $ | — | $ | — | $ | — | $ | — | |||||||||
Cash and cash equivalents | $ | 42.7 | $ | 55.0 | $ | 55.3 | $ | 49.6 | $ | 65.9 | |||||||||
Working capital | $ | 76.0 | $ | 100.3 | $ | 105.0 | $ | 107.4 | $ | 185.2 | |||||||||
Property, plant and equipment, net | $ | 103.7 | $ | 122.8 | $ | 157.0 | $ | 189.4 | $ | 234.9 | |||||||||
Total assets | $ | 396.3 | $ | 487.4 | $ | 527.9 | $ | 563.7 | $ | 761.8 | |||||||||
Long-term borrowings | $ | 19.8 | $ | 17.5 | $ | 5.8 | $ | 4.8 | $ | 13.2 | |||||||||
Total stockholders’ equity | $ | 150.3 | $ | 210.3 | $ | 258.4 | $ | 285.9 | $ | 434.9 | |||||||||
Capital expenditures | $ | 13.6 | $ | 11.8 | $ | 13.8 | $ | 17.7 | $ | 9.2 | |||||||||
Depreciation and amortization | $ | 25.0 | $ | 33.5 | $ | 36.4 | $ | 40.5 | $ | 40.4 | |||||||||
(a) | In 2014, we granted restricted stock units ("RSUs") to our non-employee directors and our Chief Executive Officer and we granted non-qualified stock options to our officers in 2014. These RSUs and options are not included in diluted earnings per share, as the effect would be antidilutive. |
(b) | In 2007, we issued a warrant to a lender to purchase 1,390,944 shares of our Class A Common Stock, at $6.05 per share, which was equivalent to 7% of our then-outstanding fully diluted common stock (including both Class A and Class B shares). This warrant was not included in diluted earnings per share, as the effect would be antidilutive. This warrant expired on April 9, 2012 without the purchase or issuance of additional shares. |
(c) | Certain reclassifications have been made to prior results to conform to classifications used at December 31, 2011. These classifications have no impact on net income. |
17
ITEM 7. | MANAGEMENT’S DISCUSSION AND ANALYSIS OF FINANCIAL CONDITION AND RESULTS OF OPERATIONS |
Cautionary Statements Relating To Forward-Looking Statements
The following information should be read in connection with the information contained in the Consolidated Financial Statements and Notes to Consolidated Financial Statements in Item 8 of this report.
This report contains forward-looking statements within the meaning of the Private Securities Litigation Reform Act that are subject to the safe harbor provisions created by that Act. In addition, forward-looking statements may be made orally in the future by or on behalf of us. Forward-looking statements can be identified by the use of terms such as “expects,” “should,” “may,” “believes,” “anticipates,” “will,” and other future tense and forward-looking terminology, or by the fact that they appear under the caption “Outlook.” Our forward-looking statements generally relate to our future performance, including our anticipated operating results and liquidity sources and requirements, our business strategies and goals, and the effect of laws, rules, regulations, new accounting pronouncements and outstanding litigation, on our business, operating results, and financial condition.
Readers are cautioned that actual results may differ materially from those projected as a result of certain risks and uncertainties, including, but not limited to, i) our history of losses and our ability to maintain adequate liquidity in total and within each foreign operation; ii) our ability to develop successful new products in a timely manner; iii) current and future global or regional political and economic conditions, including housing starts, and the condition of credit markets, which may magnify other risk factors; iv) the success of our effort to effectively improve productivity and restructure our operations in order to reduce costs and bring them in line with projected production levels and product mix; v) the extent of any business disruption that may result from the restructuring and realignment of our manufacturing operations and personnel or system implementations, the ultimate cost of those initiatives and the amount of savings actually realized; vi) loss of, or substantial decline in; sales to any of our key customers; vii) increased or unexpected product warranty claims; viii) actions of competitors in markets with intense competition; ix) financial market changes, including fluctuations in foreign currency exchange rates and interest rates; x) the ultimate cost of defending and resolving legal and environmental matters, including any liabilities resulting from the regulatory antitrust investigations commenced by the United States Department of Justice Antitrust Division and the Secretariat of Economic Law of the Ministry of Justice of Brazil, both of which could preclude commercialization of products or adversely affect profitability and/or civil litigation related to such investigations; xi) local governmental, environmental, trade and energy regulations; xii) availability and volatility in the cost of materials, particularly commodities, including steel, copper and aluminum, whose cost can be subject to significant variation; xiii) significant supply interruptions or cost increases; xiv) loss of key employees; xv) the extent of any business disruption caused by work stoppages initiated by organized labor unions and other labor matters; xvi) risks relating to our information technology systems or failures of third-party technology service providers; xvii) impact of future changes in accounting rules and requirements on our financial statements; xviii) default on covenants of financing arrangements and the availability and terms of future financing arrangements; xix) reduction or elimination of credit insurance; xx) potential political and economic adversities that could adversely affect anticipated sales and production; xxi) in India, potential military conflict with neighboring countries that could adversely affect anticipated sales and production; xxii) weather conditions affecting demand for replacement products; and xxiii) the effect of terrorist activity and armed conflict. These forward-looking statements are made only as of the date of this report, and we undertake no obligation to update or revise the forward-looking statements, whether as a result of new information, future events or otherwise.
For more information regarding these and other uncertainties and factors that could cause our actual results to differ materially from what we have anticipated in our forward-looking statements or otherwise could materially adversely affect our business, financial condition, or operating results, see “Risk Factors” in Item 1A of this report.
EXECUTIVE SUMMARY
In addition to the relative competitiveness of our products, our business is significantly influenced by several specific economic factors: the strength of the overall global economy, which can have a significant impact on our sales; our product costs, especially the price of copper, steel and aluminum; and the relative value compared to the U.S. Dollar of those foreign currencies of countries where we operate.
Furthermore, we monitor changes in local governmental regulations with regards to allowable refrigerants we can use in our compressors and condensing units. These changes can also have a significant impact on our sales and our product costs.
18
Economy
Our sales depend significantly on worldwide economic conditions, which directly impact consumers' demand for the products in which our products are used. The prolonged stagnation and recent political upheaval in the Euro zone, which has impacted other economies in the region, uncertainties surrounding the conflicts in the Ukraine and the Middle East and concerns about market fundamentals in many of the world's largest economies have led to the lack of growth in each of these markets.
Our sales decreased in 2014 compared to 2013 primarily due to lower volumes and unfavorable impact of changes in currency exchange rates, partially offset by price increases. Excluding the effects of foreign currency translation, sales in 2014 were approximately 9.9% lower than in 2013.
Liquidity
Challenges remain with respect to our ability to generate appropriate levels of liquidity solely from cash flows from operations, particularly related to uncertainties of future sales levels, global economic conditions, currency exchange rates and commodity pricing as discussed below. In 2014, cash provided by operating activities was $7.2 million, which included $25.3 million provided by inventories and $9.9 million provided by receivables, partially offset by $4.9 million used for payables and accrued expenses.
In 2014, we received approximately $1.9 million and $5.4 million of outstanding refundable non-income taxes in India and Brazil, respectively, although we accrued $3.5 million more in non-refundable income taxes than we received in 2014. We have received and expect to receive refunds of outstanding Indian and Brazilian non-income taxes through the end of 2016. Due to changes in exchange rates, the actual amounts received as expressed in U.S. Dollars will vary depending on the exchange rate at the time of receipt or future reporting date. We expect to recover approximately $19.8 million of the $27.7 million outstanding refundable taxes in the next twelve months, primarily related to the short-term portion of the outstanding refundable taxes of $15.1 million in Brazil and $3.5 million in India. The tax authorities will not commit to an actual date of payment and the timing of receipt may be different than planned if the tax authorities change their pattern of payment or past practices.
We realize that we may not generate cash flow from operating activities unless further restructuring activities are implemented or, sales or economic conditions improve. As a result, we continued to adjust our workforce levels as conditions demanded in 2014 in order to reduce our aggregate salary, wages and employee benefits. Our estimated realized savings on an annual basis for these 2014 reductions is approximately $4.2 million. We incurred a charge of $4.0 million associated with the layoffs which took place in 2014. The realized savings in 2014 are consistent with our initial estimates. During 2014, we hired a Chief Restructuring Officer as well as a new Chief Executive Officer. Additional restructuring actions may be necessary during the next several quarters. These restructuring actions could result in significant restructuring or asset impairment charges, severance costs, losses on asset sales and use of cash. Accordingly, any future restructuring activities could have a significant effect on our consolidated financial position, operating profit, cash flows and future operating results. Cash required for any future restructuring activities may be provided by our cash balances, cash proceeds from the sale of assets or new financing arrangements. There is a risk that the costs of the restructuring and cash required will exceed our original estimates or the benefits received from such activities.
We have a Revolving Credit and Security Agreement with PNC Bank, National Association (“PNC”). Subject to the terms and conditions of the agreement as amended, PNC agreed to provide a senior secured term loan and a senior secured revolving credit financing up to an aggregate principal amount of $34.0 million, which includes up to $10.0 million in letters of credit, subject to a borrowing base formula, lender reserves and PNC’s reasonable discretion. PNC also provided us with a senior secured term loan. The loans under these facilities bear interest at either the London Interbank Offered Rate (LIBOR) or an alternative base rate, plus a margin that varies with borrowing availability under the revolving credit facility. These facilities mature on December 11, 2018. We were in compliance with all covenants and terms of the agreement at December 31, 2014. At December 31, 2014, our borrowings under the PNC revolving facility totaled $0.3 million and borrowings under PNC term loan totaled $8.3 million. We also had $6.4 million in outstanding letters of credit. We had $0.4 million of additional borrowing capacity under the PNC facilities as of December 31, 2014, after giving effect to our fixed charge coverage ratio covenant and our outstanding borrowings and letters of credit.
In the second quarter of 2014, our Brazilian subsidiary was approved for a special term low interest rate governmental loan intended to promote innovation and research and development spending in Brazil, in the amount of approximately 82.5 million Brazilian Reals to be used on approved research and development projects, provided that we spend approximately 35.3 million Reals of our resources on the financed projects. We received the first installment of the loan in the amount equivalent to $11.0 million during the third quarter of 2014. However, $0.5 million of this amount is not available to us because the related projects have not yet commenced. We expect to receive additional funding in two equal installments during the next two years. This loan has a grace period of 36 months, after which it will be repaid on a monthly basis between July 2017 and July 2023.
19
We have additional credit facilities in Brazil, as well as in most other jurisdictions in which we operate outside the U.S. (See Note 8 “Debt”, of the Notes to Consolidated Financial Statements in Item 8 of this report, for additional information.) Our Brazilian and European subsidiaries periodically factor their accounts receivable with financial institutions for seasonal and other working capital needs. Such receivables are factored both with limited and without recourse to us. Our Indian location also has the ability to collect receivables that are backed by letters of credit sooner than the receivables would otherwise be paid by the customer. Furthermore, some of our large customers from this location offer a non-recourse factoring program relating to their receivables only, under which we can collect these receivables at a discount sooner than they would otherwise be paid by the customer. We consider these programs similar to the factoring programs in Brazil and Europe as it relates to our liquidity.
While we believe that current cash balances and available borrowings under our credit facilities and cash inflows related to
non-income tax refunds will produce adequate liquidity to implement our business strategy over the foreseeable future, there can be no assurance that such amounts will ultimately be adequate if sales or economic conditions deteriorate. We anticipate
that we will continue to monitor non-essential uses of our cash balances until cash provided by normal operations improves.
Our business exposes us to potential litigation, such as product liability lawsuits or other lawsuits related to anti-competitive practices and securities law or other types of business disputes. These claims can be expensive to defend and an unfavorable outcome from any such litigation could adversely affect our cash flows and liquidity.
In addition, while our past business dispositions have improved our liquidity position, many of the sale agreements provide for certain retained liabilities and indemnities including liabilities that relate to environmental issues and product warranties. While we believe we have properly accounted for such contingent liabilities based on currently available information, future events could result in the recognition of additional liabilities that could consume available liquidity and management attention.
For further information related to other factors that have had, or may in the future have, a significant impact on our business, financial condition or results of operations, see “Cautionary Statements Relating To Forward-Looking Statements” above, “Results of Operations” below, and “Risk Factors” in Item 1A of this report.
Commodities
Our results of operations are very sensitive to the prices of commodities due to the high content of copper and steel and the increasing usage of aluminum in our compressor products.
The average market costs for the types of copper, steel and aluminum used in our products in 2014 as compared to 2013 fluctuated, with copper decreasing by 10.7%, steel decreasing by 8.8% and aluminum increasing by 10.0%. After consideration of our hedge positions our average cost of copper and aluminum decreased in 2014 by 8.7% and 4.6%, respectively, compared to 2013. Our average cost of copper in 2014 is lower and aluminum is higher in our results of operations when compared to 2013, primarily due to market price fluctuations. Volatility in market prices of these commodities create substantial challenges to our ability to control the cost of our products, as the final product cost can depend greatly on our ability to secure optimally priced derivative contracts.
Any increase in steel prices may have a negative impact on our product costs, as there is currently no well-established global market for hedging against increases in the price of steel.
We have been proactive in addressing the volatility of copper and aluminum costs, by executing derivative contracts. As of December 31, 2014, we had derivative contracts outstanding to cover approximately 31.9% and 22.0% of our projected 2015 copper and aluminum usage, respectively. Continued volatility of these costs could nonetheless have an adverse effect on our results of operations both in the near and long term as our anticipated needs are not 100% hedged.
We expect to continue our approach of mitigating the effect of short-term price swings of commodities through the appropriate use of hedging instruments, price increases and modified pricing structures with our customers, where available, to allow us to recover our costs in the event that the prices of commodities escalate. Due to competitive markets for our finished products, we are typically not able to quickly recover product cost increases through price increases or other cost savings. For a discussion of the risks to our business associated with commodity price risk fluctuations, refer to “Quantitative and Qualitative Disclosures about Market Risk – Commodity Price Risk” in Part II, Item 7A of this report.
Currency Exchange
The compressor industry, and our business in particular, are characterized by global and regional markets that are served by manufacturing locations positioned throughout the world. Most of our manufacturing presence is in international locations. During each of 2014 and 2013, approximately 80% of our sales activity originated outside the U.S., specifically Brazil, Europe and India. As a result of these factors, our consolidated financial results are sensitive to changes in foreign currency exchange rates, especially the Brazilian Real, the Euro and the Indian Rupee. During 2014, the Euro weakened against the U.S. Dollar by 13.6%, the Brazilian Real weakened against the U.S. Dollar by 13.4% and the Indian Rupee weakened against the U.S. Dollar by 1.9%.
We have entered into forward purchase contracts to cover a portion of our exposure to additional fluctuations in foreign currency value during 2014. Ultimately, long-term changes in currency exchange rates have lasting effects on the relative competitiveness of operations located in certain countries versus competitors located in different countries. We believe that only one major competitor faces similar exposure to the Brazilian Real. Our Brazilian and European manufacturing and sales presence is significant and changes in the Brazilian Real and the Euro have been significant to our results of operations when compared to prior periods.
For a discussion of the risks to our business associated with currency fluctuations, refer to “Quantitative and Qualitative Disclosures about Market Risk – Foreign Currency Exchange Risk” in Part II, Item 7A of this report.
20
RESULTS OF OPERATIONS
Year Ended December 31, 2014 vs. Year Ended December 31, 2013
A summary of our operating results is shown below:
Twelve Months Ended December 31, | |||||||||||||
(in millions) | 2014 | % | 2013 | % | |||||||||
Net sales | $ | 724.4 | 100.0 | % | $ | 823.6 | 100.0 | % | |||||
Cost of sales | (653.7 | ) | (90.2 | %) | (745.5 | ) | (90.5 | %) | |||||
Gross profit | 70.7 | 9.8 | % | 78.1 | 9.5 | % | |||||||
Selling and administrative expenses | (92.2 | ) | (12.7 | %) | (104.9 | ) | (12.7 | %) | |||||
Other income (expense), net | 9.3 | 1.3 | % | 21.4 | 2.6 | % | |||||||
Impairments, restructuring charges, and other items | (8.8 | ) | (1.2 | %) | (13.6 | ) | (1.7 | %) | |||||
Operating (loss) income | (21.0 | ) | (2.9 | %) | (19.0 | ) | (2.3 | %) | |||||
Interest expense | (10.0 | ) | (1.4 | %) | (9.2 | ) | (1.1 | %) | |||||
Interest income | 3.2 | 0.4 | % | 1.5 | 0.2 | % | |||||||
(Loss) income from continuing operations before taxes | (27.8 | ) | (3.8 | %) | (26.7 | ) | (3.2 | %) | |||||
Tax (expense) benefit | (0.5 | ) | (0.1 | %) | (7.7 | ) | (0.9 | %) | |||||
(Loss) income from continuing operations | $ | (28.3 | ) | (4.0 | %) | $ | (34.4 | ) | (4.1 | %) | |||
Net sales in the year ended December 31, 2014 decreased by $99.2 million, or 12.0%, compared with the same period of 2013. Excluding the decrease in sales due to the unfavorable effect of changes in foreign currency translation of $17.9 million, net sales decreased by 9.9% from 2013, primarily due to lower net volume and mix, partially offset by net price increases. The lower volumes and unfavorable mix were primarily as a result of the quality issue discovered in 2013 at our Indian location, the competitive pricing environment in Brazil and soft market conditions in North America. Sales at our North American location also declined as a result of ceasing production of a non-core product as we sold the related fixed assets in the first quarter of 2014.
Sales of compressors used in commercial refrigeration and aftermarket applications represented 62% of our total sales and decreased by 7.7% to $450.3 million in 2014, when compared to 2013. Lower volume and unfavorable changes in sales mix of $34.8 million and unfavorable changes in currency exchange rates of $3.4 million were partially offset by price increases of $0.8 million. Volume decreases are mainly attributable to our European, North American and Brazilian locations. Sales at our North American location declined partially as a result of ceasing production of a non-core product as we sold the related fixed assets in the first quarter of 2014.
Sales of compressors for air conditioning applications and all other applications represented 19% of our total sales and decreased by 23.4% to $138.6 million in 2014, when compared to 2013. This decrease is primarily due to lower volumes and unfavorable changes in sales mix of $40.4 million and unfavorable changes in currency exchange rates of $6.2 million, partially offset by price increases of $4.3 million. The lower net volumes and unfavorable changes in sales mix were primarily a result of the quality issue discovered in 2013 at our Indian location as well as competitive pricing environment in Brazil.
Sales of compressors used in household refrigeration and freezer (“R&F”) applications represented 19% of our total sales and decreased by 12.6% to $135.5 million in 2014, when compared to 2013. This decrease is primarily due to lower sales volume and unfavorable changes in sales mix of $14.1 million and unfavorable changes in currency exchange rates of $8.3 million, partially offset by price increases of $2.9 million. The lower net volumes and unfavorable changes in sales mix were primarily due to declines at our Brazilian location due to the competitive pricing environment, partially offset by increases at our Indian location due to increased contractual volumes with a major original equipment manufacturer.
Gross profit decreased by $7.4 million from $78.1 million, or 9.5% of net sales, in 2013 to $70.7 million, or 9.8% of net sales in 2014. The decrease in gross profit in 2014 was primarily attributable to unfavorable changes in other material and manufacturing costs of $15.6 million, net unfavorable changes in volume and sales mix of $5.0 million and increases in commodity costs, primarily steel, of $3.6 million, partially offset by favorable changes in currency exchange effects of $8.8 million and net price increases of $8.0 million. Warranty claims in 2014 compared to 2013 was favorable $3.4 million as we are experiencing lower claims in India and Europe related to quality concerns.
Selling and administrative (“S&A”) expenses decreased by $12.7 million from $104.9 million in 2013 to $92.2 million in 2014. As a percentage of net sales, S&A expenses were 12.7% in both 2014 and 2013. The decrease was primarily due to a decline in
21
depreciation expense of $5.7 million due to an information technology asset that became fully depreciated in late 2013, a decline of $3.0 million related to our incentive compensation awards, a decrease of $1.1 million in payroll and other employee benefits, a decrease of $0.9 million in professional fees and a net decrease of $2.0 million in other miscellaneous expenses. The decrease in payroll and other employee benefits included severance of $0.9 million for our former Chief Executive Officer, more than offset by other declines in payroll and employee benefits. Included in our professional fees are the fees for our board of directors, which decreased during 2014 as a result of restricted stock units awarded in 2014 compared to deferred stock units awarded in 2013 (see Note 10, "Share-Based Compensation Arrangements", in Part II, Item 8 of this report for additional information). We record expense related to our incentive compensation plan awards when we estimate that it is more likely than not that we will achieve the threshold level of performance as outlined in the incentive compensation awards. As of December 31, 2014, we estimated that it is more likely than not that we will not achieve our threshold level of performance. As a result, we recorded no incentive compensation expense related to our incentive compensation awards for the year 2014. The decrease related to our incentive compensation awards was also due to the re-measurement of the value of our outstanding share-based compensation awards, as our Common Share closing price at December 31, 2014 was $3.09 compared with the Class A Common Stock closing price of $9.05 at December 31, 2013.
Other income (expense), net, decreased by $12.1 million from $21.4 million in 2013 to $9.3 million in 2014. The decrease was primarily due to recording no net amortization of gains related to our postretirement benefits due to the curtailment of these benefits that was effective after December 31, 2013, as well as lower income related to various Indian government incentives and a $1.4 million gain on sale of securities in 2013 that did not recur in 2014, partially offset by a gain of $3.0 million on the sale of fixed assets at one of our U.S. locations and favorable changes in foreign currency exchange rates.
We recorded expense of $8.8 million in impairments, restructuring charges, and other items in 2014 compared to $13.6 million of expense in 2013. In 2014, this expense included $4.0 million related to severance, $1.8 million related to business process re-engineering, $1.5 million related to a legal settlement signed in the first quarter of 2014 and a $1.5 million environmental reserve with respect to a sold building. The severance expense was associated with a reduction in force at our Brazilian ($3.3 million), French ($0.6 million) and Indian ($0.1 million) locations. Refer to Note 11, “Impairments, Restructuring Charges and Other Items” of the Notes to Consolidated Financial Statements in Item 8 of this report.
Interest expense was $10.0 million in 2014 compared to $9.2 million in 2013. Our weighted average borrowings and weighted average interest rates for our borrowings increased in 2014 as compared to 2013. The average amount of accounts receivable factored decreased in 2014, with decreases at our Brazilian, European and Indian locations, while the weighted average interest rates for our discounted accounts receivable increased in 2014 as compared to 2013.
Interest income was $3.2 million in 2014 compared to $1.5 million in 2013. This increase is primarily due to interest on cash collateral placed in an interest-bearing account in Brazil, associated with our special term FINEP loan, as well as an increase in the interest rate on a judicial deposit in Brazil that is being held in an interest-bearing court appointed cash account.
For 2014, we recorded a tax expense of $0.5 million from continuing operations, which related to foreign income and withholding taxes. The $7.7 million in tax expense from continuing operations for 2013 was primarily due to tax expense reclassified out of AOCI in relation to our postretirement benefit plan that was curtailed.
Loss from continuing operations for the year ended December 31, 2014 was $28.3 million, or a loss from continuing operations per share of $1.53, as compared to loss from continuing operations of $34.4 million, or $1.86 per share for the year ended December 31, 2013. This change was primarily related to lower gross profit and lower other income, partially offset by lower impairments, restructuring charges, and other items and lower S&A expenses in 2014, as compared to the same period of 2013.
22
Year Ended December 31, 2013 vs. Year Ended December 31, 2012
A summary of our operating results is shown below:
Twelve Months Ended December 31, | |||||||||||||
(in millions) | 2013 | % | 2012 | % | |||||||||
Net sales | $ | 823.6 | 100.0 | % | $ | 854.7 | 100.0 | % | |||||
Cost of sales | (745.5 | ) | (90.5 | %) | (790.0 | ) | (92.4 | %) | |||||
Gross profit | 78.1 | 9.5 | % | 64.7 | 7.6 | % | |||||||
Selling and administrative expenses | (104.9 | ) | (12.7 | %) | (107.7 | ) | (12.6 | %) | |||||
Other income (expense), net | 21.4 | 2.6 | % | 22.3 | 2.6 | % | |||||||
Impairments, restructuring charges, and other items | (13.6 | ) | (1.7 | %) | 40.6 | 4.7 | % | ||||||
Operating (loss) income | (19.0 | ) | (2.3 | %) | 19.9 | 2.3 | % | ||||||
Interest expense | (9.2 | ) | (1.1 | %) | (10.2 | ) | (1.2 | %) | |||||
Interest income | 1.5 | 0.2 | % | 3.2 | 0.4 | % | |||||||
Income (loss) from continuing operations before taxes | (26.7 | ) | (3.2 | %) | 12.9 | 1.5 | % | ||||||
Tax (expense) benefit | (7.7 | ) | (0.9 | %) | 10.2 | 1.2 | % | ||||||
(Loss) income from continuing operations | $ | (34.4 | ) | (4.1 | %) | $ | 23.1 | 2.7 | % | ||||
Net sales in the year ended December 31, 2013 decreased by $31.1 million, or 3.6%, compared with the same period of 2012. Excluding the decrease in sales due to the effect of changes in foreign currency translation of $24.4 million, net sales decreased by 0.8% from 2012, primarily due to net decreases in volume and mix, partially offset by net price increases.
Sales of compressors used in commercial refrigeration and aftermarket applications represented 59% of our total sales and decreased by 3.2% to $487.7 million in 2013, when compared to 2012. Lower volume and unfavorable changes in sales mix of $16.1 million and unfavorable changes in currency exchange rates of $2.5 million were partially offset by price increases of $2.7 million. Volume decreases are mainly attributable to our European and North American markets due to continued soft market conditions, partially offset by volume and mix improvements attributable to our Indian and Brazilian operations.
Sales of compressors for air conditioning applications and all other applications represented 22% of our total sales and increased by 9.6% to $180.9 million in 2013, when compared to 2012. This increase is primarily due to higher volumes and favorable changes in sales mix of $25.4 million and price increases of $0.7 million, partially offset by unfavorable changes in currency exchange rates of $10.3 million. Volume increased in Brazil primarily due to a temporary shutdown of one of our major Brazilian customers in 2012 which did not recur in 2013. Volume also increased as a result of improved demand in Europe, partially offset by reduced sales in North America due to soft market conditions in the first half of 2013, specifically in the trucking industry, as well as lower volumes in India in the second half of the year related to a warranty claim that originated in the second quarter.
Sales of compressors used in household refrigeration and freezer (“R&F”) applications represented 19% of our total sales and decreased by 16.7% to $155.0 million in 2013, when compared to 2012. This decrease is primarily due to lower sales volume and unfavorable changes in sales mix of $20.4 million and unfavorable changes in currency exchange rates of $11.6 million, partially offset by price increases of $1.0 million. Volume decreases are primarily the result of lower local demand at our Brazilian location.
Gross profit increased by $13.4 million from $64.7 million, or 7.6% of net sales, in 2012 to $78.1 million, or 9.5% of net sales in 2013. The increase in gross profit in 2013 was primarily attributable to favorable changes in currency exchange effects of $14.4 million, favorable changes in commodity costs of $6.1 million and net price increases of $4.4 million, partially offset by unfavorable changes in other material and manufacturing costs of $6.4 million and net unfavorable changes in volume and sales mix of $5.1 million. The changes in material and manufacturing costs primarily relate to a warranty claim in India that originated in the second quarter of 2013, for which we recorded expense of $5.6 million, as well as a warranty claim in Europe, for which we recorded expense of $2.7 million. The unfavorable impact of these warranty claims was partially offset by other favorable changes in material and manufacturing costs of $1.9 million.
Selling and administrative (“S&A”) expenses decreased by $2.8 million from $107.7 million in 2012 to $104.9 million in 2013. As a percentage of net sales, S&A expenses were 12.7% in 2013 compared to 12.6% in 2012. The decrease was due to lower
23
professional fees of $2.2 million, primarily related to fees paid to a financial adviser in 2012 that did not recur in 2013, a decrease in depreciation of $1.5 million primarily due to an information technology asset that became fully depreciated in the fourth quarter of 2013, a decrease of $1.2 million related to our incentive compensation awards and a decrease of $0.5 million in other miscellaneous expenses. These decreases were partially offset by $1.0 million of bad debt expense recognized in the second quarter of 2013 due to a bankruptcy filing by one of our Brazilian customers and an increase of $1.6 million in employee benefits which primarily related to an increase in healthcare claims. As of December 31, 2013, we partially achieved our target levels of performance related to our compensation awards; however, these levels were lower in 2013 as compared to 2012. The decrease in the portion of the incentive compensation earned was partially offset by the re-measurement of the value of our outstanding share-based compensation awards as our Class A Common Stock closing price at December 31, 2013 was $9.05 compared with $4.62 at December 31, 2012.
Other income (expense), net, decreased by $0.9 million from $22.3 million in 2012 to $21.4 million in 2013. The decrease is mainly due to $2.9 million of income due to our sale of the right to proceeds from a future potential settlement of a lawsuit involving our Brazilian location received in the second quarter of 2012, $1.3 million due to a mutual release agreement that we signed in the second quarter of 2012 and a $1.8 million decline in income from Indian government incentives, primarily due to a one-time incentive which occurred in the first quarter of 2012. These decreases were partially offset by $1.4 million of income related to securities that had zero net book value and were sold during the second quarter of 2013, a $2.8 million increase in net amortization of gains for our postretirement benefits primarily due to curtailment of these benefits in the second quarter of 2012, (see Note 5, “Pension and Other Postretirement Benefit Plans” of the Notes to Consolidated Financial Statements in Item 8 of this report, for additional information), a $0.8 million increase in miscellaneous other income, primarily due to miscellaneous other expense recognized in 2012 that did not recur in 2013 and a $0.1 million favorable change in foreign currency exchange rates.
We recorded expense of $13.6 million in impairments, restructuring charges, and other items in 2013 compared to $40.6 million of income in 2012. In 2013, this expense included $9.9 million related to severance, $2.7 million related to business process re-engineering, $0.5 million of costs related to the relocation of our corporate office, $0.3 million for a contingent legal liability and a $0.2 million environmental reserve with respect to a sold building. The severance expense was associated with a reduction in force at our French ($7.8 million), Brazilian ($1.3 million), Indian ($0.5 million) and Corporate ($0.3 million) locations. Refer to Note 11, “Impairments, Restructuring Charges and Other Items” of the Notes to Consolidated Financial Statements in Item 8 of this report.
Interest expense was $9.2 million in 2013 compared to $10.2 million in 2012. Our weighted average borrowings and the average amount of accounts receivable factored decreased, primarily due to less factoring by our Brazilian location, as well as lower borrowing levels in Brazil and India. In addition, the weighted average interest rates for our borrowings and factored accounts receivable decreased in 2013 as compared to 2012.
Interest income was $1.5 million in 2013 compared to $3.2 million in 2012 primarily due to the interest received in the second quarter of 2012 related to an IRS refund.
For 2013, we recorded a tax expense of $7.7 million from continuing operations, which related to U.S. federal tax, primarily due to tax expense reclassified out of AOCI in relation to our postretirement benefit plan that was curtailed in 2012. The $10.2 million in tax benefit from continuing operations for 2012 was comprised of $0.7 million in foreign tax benefit, $0.1 million in state and local tax benefit and $9.4 million in U.S. federal tax benefit, primarily related to the refund received from the IRS related to a previously unrecognized tax benefit.
Net loss from continuing operations for the year ended December 31, 2013 was $34.4 million, or a net loss per share of $1.86, as compared to net income from continuing operations of $23.1 million, or $1.25 per share, for the year ended December 31, 2012. The change was primarily related to the postretirement benefit curtailment gain recorded in the second quarter of 2012, higher other impairments, restructuring charges, and other items in 2013 and an income tax benefit in 2012 compared to income tax expense in 2013, partially offset by higher gross profit in 2013, as well as due to the other factors described above.
LIQUIDITY AND CAPITAL RESOURCES
Our primary liquidity needs are to fund capital expenditures, service indebtedness, support working capital requirements, and, when needed, fund operating losses. In general, our principal sources of liquidity are cash and cash equivalents on hand, cash flows from operating activities, borrowings under available credit facilities and net cash inflows related to non-income taxes. In addition, we believe that factoring our receivables is an alternative way of freeing up working capital and providing sufficient cash to pay off debt that may mature within a year.
A substantial portion of our operating income is generated by foreign operations. As a result, we are dependent on the earnings, cash flows and the combination of dividends, distributions, inter-company loan payments and advances from our foreign
24
operations to provide the funds necessary to meet our obligations in each of our legal jurisdictions. There are no significant restrictions on the ability of our subsidiaries to pay dividends or make other distributions.
Cash Flow
2014 vs. 2013
Cash provided by operations was $7.2 million in 2014, as compared to $11.6 million in 2013. The 2014 cash flows from operations include our net loss of $32.7 million, a gain from the disposal of property and equipment of $3.1 million, non-cash employee retirement benefits of $1.2 million and non-cash share-based compensation income of $0.2 million, partially offset by depreciation and amortization of $25.0 million and a non-cash change in deferred income taxes of $0.1 million.
With respect to the changes in working capital, decreased inventory levels provided cash of $25.3 million for the year 2014, as we adjusted our inventory levels to the decline in sales. Our inventory days on hand improved by 9 days to 68 days at December 31, 2014 compared to December 31, 2013.
Accounts receivable provided cash of $9.9 million. Accounts receivable were lower due to decline in sales, as well as an improvement in our days sales outstanding by 7 days as compared to December 31, 2013 to 45 days at December 31, 2014. This decline was partially offset by lower accounts receivable factoring at our French and Brazilian locations. The improvement in days sales outstanding related to higher collections of accounts receivable in India and Brazil, as well as a favorable change in the mix of the discounted accounts receivable in Brazil.
Payables and accrued expenses resulted in a use of cash of $4.9 million, mainly as a result of a decrease in inventory purchases, as well as payments of employee-related accruals, restructuring and warranty accruals, partially offset by an increase in accruals for environmental matters and legal settlements during 2014. We saw an increase in payable days outstanding of 4 days to 63 days at December 31, 2014.
Recoverable non-income taxes used cash of $3.5 million, which is due to accruals of additional recoverable non-income taxes, which are expected to be collected in future periods, partially offset by $5.4 million cash received from the Brazilian government and $1.9 million cash received from the Indian government.
Employee retirement benefits used cash of $1.1 million primarily due to benefit payments and contributions related to our non-U.S. pension.
Cash used in investing activities was $1.7 million in 2014 as compared to $22.0 million in 2013. The 2014 cash provided by investing activities is primarily related to the net release of restricted cash of $8.0 million and proceeds received from the sale of fixed assets of $3.9 million, partially offset by capital expenditures of $13.6 million. The release of restricted cash included the reclassification of the proceeds from the PNC Term Loan in the amount of $12.7 million due to satisfying all of the closing conditions related to this loan in the first quarter of 2014, $0.6 million that became available to fund our 401(k) matching contributions and $0.3 million decrease in cash pledged on our derivatives related to our hedging activities, partially offset by a $5.6 million increase in restricted cash pledged as collateral for a special term governmental loan at our Brazilian location, the first installment of which we received during the third quarter of 2014. (See Note 8 "Debt", of the Notes to Consolidated Financial Statements in Item 8 of this report for additional information regarding this loan.)
Cash used in financing activities was $12.9 million in 2014 compared to $9.8 million provided by financing activities in 2013. The cash used during the first nine months of 2014 primarily related to a $2.1 million prepayment on the PNC Term Loan because of a sale of fixed assets that were collateral for the loan, the agreement to use $1.6 million of the released Term Loan proceeds to prepay the Term Loan, a $4.2 million payment on the PNC revolving facility due to a decline in the availability due to issuance of letters of credit and a decline in the borrowing base assets as well as $8.6 million of other net repayments of borrowings and capital leases which primarily related to net repayments of short term debt at our Brazilian location as part of our strategy to reduce the higher interest rate bearing short term borrowings at this location. These repayments were partially offset by $11.0 million of funds received under our special term governmental loan at our Brazilian location.
2013 vs. 2012
Cash provided by operations was $11.6 million in 2013, as compared to $8.8 million in 2012. The 2013 cash flows from operations include our net loss of $37.5 million which included a non-cash gain on an adjustment for employee retirement benefits of $11.6 million, partially offset by non-cash depreciation and amortization of $33.5 million, a $6.3 million release of deferred taxes from "Accumulated other comprehensive loss" in relation to the curtailment of our postretirement benefit plans (see Note 5 "Pension and Other Postretirement Benefit plans" of the Notes to Consolidated Financial Statements in Item 8 of this report for additional information), non-cash share-based compensation of $0.8 million and a non-cash loss on the disposal of property and equipment of $0.2 million.
25
With respect to the changes in working capital, increased inventory levels were primarily due to building of inventory to support higher levels of anticipated sales in North America and Asia, which resulted in a use of cash of $10.5 million. Inventory days on hand worsened by 6 days to 77 days at December 31, 2013 primarily due to lower sales for the three months ended December 31, 2013 as compared to the three months ended December 31, 2012.
Accounts receivable provided cash of $6.2 million mainly due to an improvement in our days sales outstanding by 3 days as compared to December 31, 2012 to 52 days at December 31, 2013. The improvement in days sales outstanding related to increased accounts receivables factoring in Europe and higher collections of accounts receivable that are backed by letters of credit in India.
Payables and accrued expenses provided $22.8 million of cash. We had an increase in accruals at our French location due to severance and business re-engineering accruals, as well as increases in our product warranty accrual for new claims at our French and Indian locations in 2013. We saw a decrease in payable days outstanding of 4 days to 59 days at December 31, 2013.
Recoverable non-income taxes provided cash of $8.1 million, which included $18.6 million cash received from the Brazilian government and $9.9 million cash received from the Indian government, partially offset by accruals of additional recoverable non-income taxes.
Employee retirement benefits were a use of cash of $2.1 million due to benefit payments and contributions related to our non-U.S. pension and U.S. postretirement benefit plans.
Cash used in investing activities was $22.0 million in 2013 as compared to $5.7 million in 2012. The 2013 use of cash in investing activities includes $11.8 million of capital expenditures, primarily for equipment, and $12.7 million of blocked funds related to our term loan with PNC. This use of cash was partially offset by the release of restricted cash of $2.0 million that became available to fund our 401(k) matching contributions, $0.2 million decrease in cash collateral on our letters of credit and proceeds from the sale of assets of $0.3 million.
Cash provided by financing activities was $9.8 million in 2013 compared to $3.1 million provided by financing activities in 2012. The increase in borrowings in 2013 was $16.0 million, mainly due to term loan financing with PNC of $15.0 million, partially offset by net payments on long-term debt of $4.1 million, payments on capital leases of $0.4 million, debt issuance costs of $0.2 million and net other repayments of $1.5 million.
Liquidity Sources
Credit Facilities and Cash on Hand
In addition to cash on hand, cash provided by operating activities and cash inflows related to non-operating activities, we use bank debt and other foreign credit facilities, such as accounts receivable factoring programs, when available, to fund our working capital requirements, capital expenditures, warranty claims and, when necessary, operating losses. In the U.S., we have an agreement with PNC pursuant to which, subject to the terms and conditions of our Revolving Credit and Security Agreement, as amended, PNC provides senior secured revolving credit financing up to $34.0 million, which includes up to $10.0 million in letters of credit, subject to a borrowing base formula, lender reserves and PNC's reasonable discretion as well as a secured Term Loan.
During the first quarter of 2014, $12.7 million of the funds received from the PNC Term Loan were released from a blocked account and the net proceeds, after a prepayment, were recorded in "Cash and cash equivalents" on our Consolidated Balance Sheets. Interest began accruing on the entire Term Loan balance in December 2013, and the monthly installments of $250,000 to repay the principal balance on the Term Loan began January 2, 2014. The facility matures on December 11, 2018. The agreement contains various covenants, including limitations on dividends, investments and additional indebtedness and liens, and a minimum fixed charge coverage ratio, which would apply only if average undrawn borrowing availability, as defined by the credit agreement, were to fall below a specified level for more than five business days. We were in compliance with all covenants and terms of the agreement as of December 31, 2014. As of December 31, 2014, we had $8.6 million of borrowings outstanding and $6.4 million in outstanding letters of credit under our PNC financing facilities. We had $0.4 million of additional borrowing capacity under this facility as of December 31, 2014, after giving effect to our fixed charge coverage ratio covenant and our outstanding borrowings and letters of credit under this facility. (For a more detailed description of the facilities see Note 8 “Debt", of the Notes to Consolidated Financial Statements in Item 8 of this report.)
In the U.S., we have also entered into an agreement with the Mississippi Development Authority for low interest rate financing up to $1.5 million in aggregate draws to be utilized to purchase specific capital equipment. This loan is to encourage business development in the State of Mississippi. We received the final draw in the second quarter of 2014. Payments started on the loan in first quarter of 2014 and as of December 31, 2014 we have an outstanding balance of $1.3 million.
26
We have various borrowing arrangements at our foreign subsidiaries to support working capital needs and government sponsored borrowings which provide advantageous lending rates. (See Note 8 “Debt”, of the Notes to Consolidated Financial Statements in Item 8 of this report for additional information.)
For the for the years ended December 31, 2014 and 2013 our average outstanding debt balance was $57.7 million and $55.2 million, respectively. The weighted average interest rate was 9.0% and 8.1% for the years ended December 31, 2014 and 2013, respectively.
As of December 31, 2014, our cash and cash equivalents on hand was $42.7 million. Our borrowings under current credit facilities, including capital lease obligations, totaled $49.2 million at December 31, 2014, with an uncommitted additional borrowing capacity of $24.0 million. Included in our debt balance at December 31, 2014 are capital lease obligations of $1.1 million. For a more detailed discussion of our credit facilities, refer to Note 8, “Debt”, of the Notes to Consolidated Financial Statements in Item 8 of this report.
In the U.S., only a small portion of our cash balances are insured by the Federal Deposit Insurance Corporation ("FDIC"). All cash that we hold in the U.S. is held at two major financial institutions. Any cash we hold in the U.S. that is not utilized for day-to-day working capital requirements is primarily invested in secure, institutional money market funds, which are strictly regulated by the U.S. Securities and Exchange Commission and operate under tight requirements for the liquidity, creditworthiness, and diversification of their assets.
Cash inflows related to taxes
We expect to receive refunds of outstanding refundable non-income taxes. The actual amounts received as expressed in U.S. Dollars will vary depending on the exchange rate at the time of receipt or future reporting date. Based on applicable foreign currency exchange rates at December 31, 2014, we expect to recover approximately $19.8 million of the $27.7 million outstanding refundable taxes in the next twelve months, primarily related to the short-term portion of the outstanding refundable taxes of $15.1 million in Brazil and $3.5 million in India. The tax authorities will not commit to an actual date of payment and the timing of receipt may be different than planned if the tax authorities change their pattern of payment or past practices.
Accounts Receivable Sales
Our Brazilian and European subsidiaries periodically factor their accounts receivable with financial institutions for seasonal and other working capital needs. Such receivables are factored both with limited and without recourse to us and are excluded from accounts receivable in our Consolidated Balance Sheets. The amount of factored receivables, including both with limited and without recourse amounts, was $25.1 million and $42.7 million at December 31, 2014 and 2013, respectively. The amount of factored receivables sold with limited recourse through our Brazilian location, which results in a contingent liability to us, was $3.7 million and $12.1 million as of December 31, 2014 and 2013, respectively. The amount of factored receivables sold without recourse at our Brazilian and European subsidiaries, which is recorded as a sale of the related receivables, was $21.4 million and $30.6 million as of December 31, 2014 and 2013 respectively. In addition to the credit facilities described above, our Brazilian subsidiary also has an additional $21.6 million uncommitted, discretionary factoring credit facility with respect to its local (without recourse) and foreign (with recourse) accounts receivable, subject to the availability of its accounts receivable balances eligible for sale under the facility. We use these factoring facilities, when available, for seasonal and other working capital needs.
In 2013 our European subsidiary entered into into a three-year factoring agreement with GE Factofrance, which became available in October 2013. The maximum aggregate amount of the financed eligible receivables is EUR 40.0 million, which may be increased by up to EUR 10.0 million. subject to increased sales and GE Credit Committee's prior approval and signing an amendment, as set forth in the agreement. The factoring facility is a limited recourse facility which provides non-recourse (amounts covered by insurance policy) and with-recourse financing (subject to GE's prior review and acceptance). At December 31, 2014, $5.3 million as available for sale of additional receivables under this facility. We were in compliance with all of the covenants, terms and conditions under this facility as of December 31, 2014.
Our Indian subsidiary has the ability to collect receivables that are backed by letters of credit sooner than the receivables would otherwise be paid by the customer. Furthermore, some of our large customers offer a non-recourse factoring program relating to their receivables only, under which we can collect these receivables at a discount sooner than they would otherwise be paid by the customer. We consider these programs similar to the factoring programs in Brazil and Europe as it relates to our liquidity. We collected a total of $4.0 million and $6.0 million that would otherwise have been outstanding as receivables under these programs at December 31, 2014 and December 31, 2013, respectively.
27
Adequacy of Liquidity Sources
In the near term, and in particular over the next twelve months, we expect that our liquidity sources, described above, will be sufficient to meet our liquidity requirements, including debt service, capital expenditures, working capital requirements and warranty claims, and, when needed, cash to fund operating losses and any additional restructuring activities we may implement. However, we also anticipate challenges with respect to generating positive cash flows from operations, most significantly due to challenges driven by possible volume declines, ability to generate savings from our restructuring activities, as well as currency exchange and commodity pricing volatility.
In addition, our business exposes us to potential litigation, such as product liability lawsuits or other lawsuits related to anti-competitive practices and securities law or other types of business disputes. These claims can be expensive to defend and an unfavorable outcome from any such litigation could adversely affect our cash flows and liquidity.
As of December 31, 2014, we had $42.7 million of cash and cash equivalents, and $49.2 million in debt and capital lease obligations, of which $19.8 million was long-term in nature. The short-term debt primarily consists of current maturities of long-term debt as well as committed and uncommitted revolving lines of credit, which we intend to maintain for the foreseeable future. We believe our cash on hand and availability under our borrowing facilities is sufficient to meet our debt service requirements. We do not expect any material differences between cash availability and cash outflows.
We expect capital expenditures will average $15.0 million to $20.0 million annually, although the timing of expenditures may result in higher investment in some years and lower amounts in others. For 2015, we expect our capital expenditures to be in this range as we continue to re-engineer our products and invest in our information technology infra-structure to be more efficient. These 2015 expenditures may be adjusted based on achieving expected results described in the “Outlook” section.
OFF-BALANCE SHEET ARRANGEMENTS
Other than operating leases, we do not have any off-balance sheet financing. We do not believe we have any off-balance sheet arrangements that have, or are reasonably likely to have, a material effect on us. However, a portion of accounts receivable at our Brazilian subsidiary is sold with limited recourse at a discount, which creates a contingent liability for the business. Discounted receivables sold with limited recourse were $3.7 million and $12.1 million at December 31, 2014 and 2013, respectively. We maintain a reserve for anticipated losses against these sold receivables, and losses have not historically resulted in the recording of a liability greater than the reserved amount. Under our factoring program in Europe, we may discount receivables with recourse; however, at December 31, 2014 there were no receivables sold with recourse.
CONTRACTUAL OBLIGATIONS
Our payments by period as of December 31, 2014 for our contractual obligations are as follows:
Payments due by Period
(in millions) | Total | 2015 | 2016/2017 | 2018/2019 | After 2019 | |||||||||||||||
Debt | $ | 48.1 | $ | 28.9 | $ | 8.0 | $ | 0.4 | $ | 10.8 | ||||||||||
Capital Lease Obligations | $ | 1.1 | $ | 0.5 | $ | 0.6 | $ | — | $ | — | ||||||||||
Purchase Obligations | $ | 19.2 | $ | 19.2 | $ | — | $ | — | $ | — | ||||||||||
Operating Leases (1) | $ | 10.4 | $ | 3.9 | $ | 2.8 | $ | 2.4 | $ | 1.3 | ||||||||||
Pension and Postretirement Obligations | $ | 114.1 | $ | 10.7 | $ | 21.9 | $ | 24.1 | $ | 57.4 | ||||||||||
(1) | Operating lease obligations do not include payments to landlords covering real estate taxes and common area maintenance. Rent received from a sublease contract on our previous corporate office and a lease contract on a part of our Paris, Tennessee facility, which houses a non-core business that we sold during 2014, is also not included. |
We have not included, in the table above, other long-term liabilities net of current portion in the amount of $20.9 million which include product warranty and self-insured risk, deferred tax and environmental liabilities, because they do not have a definite payout by year.
As of December 31, 2014, we had $6.4 million in outstanding domestic letters of credit and $16.2 million in outstanding foreign letters of credit issued in the normal course of business, as required by some vendor contracts.
CRITICAL ACCOUNTING ESTIMATES
In preparing our consolidated financial statements in accordance with U.S. GAAP and pursuant to the rules and regulations of the Securities and Exchange Commission ("SEC"), we make assumptions, judgments and estimates that affect the reported amounts of assets, liabilities, revenues and expenses, and related disclosures of contingent assets and liabilities. We base our assumptions, judgments and estimates on historical experience and various other factors that we believe to be reasonable under the circumstances. Actual results could differ materially from these estimates under different assumptions or conditions. On a regular basis, we evaluate our assumptions, judgments and estimates.
We believe that the assumptions, judgments and estimates involved in the accounting for Accrued and Contingent Liabilities, Employee Related Benefits, Impairment of Long-Lived Assets, Share-based Compensation and Income Taxes have the greatest potential impact on our consolidated financial statements. These areas are key components of our results of operations and are based on complex rules which require us to make judgments and estimates, so we consider these to be our critical accounting
28
policies. Historically, our assumptions, judgments and estimates relative to our critical accounting policies have not differed materially from actual results, except for warranty claims at our Indian and European locations which originated in 2013.
Accrued and Contingent Liabilities
We have established reserves for legal contingencies, self-insured product liabilities, workers compensation claims, environmental contingencies and warranty claims in accordance with U.S. GAAP. We also have liabilities with regard to certain indemnification claims and litigation related to our divested operations, which could be material. A significant amount of judgment and use of estimates is required to quantify our ultimate exposure in these matters. The valuation of reserves for contingencies is reviewed on a quarterly basis at the operating and corporate levels to assure that we are properly reserved. Reserve balances are adjusted to account for changes in circumstances for ongoing issues and the establishment of additional reserves for emerging issues. While management believes that the current level of reserves is appropriate, changes in the future could impact these determinations. Historically, reserves for accrued and contingent liabilities typically have not differed materially from actual results; however, unanticipated events such as the discovery of new facts could result in material changes to our reserves in future periods.
Employee Related Benefits
Significant employee related benefit assumptions include, but are not limited to, the expected rates of return on plan assets, determination of discount rates for re-measuring plan obligations and mortality rates. Differences among these assumptions will impact future results of operations.
We develop our demographics and utilize the expertise of actuaries to assist with the measurement of employee related obligations. The discount rate assumption is established based on Towers Watson's Rate:Link 40/90 yield curve. For the purpose of setting the discount rate, the U.S. Pension Plans (including non-qualified plans) are treated as one plan. The expected return on plan assets reflects our current asset allocation and investment strategy. The discount rates decreased for all plans, which increased liabilities.
In 2014, we adopted a new mortality base table and projection scale based on guidance published by the Society of Actuaries. Prior to 2014, for the U.S. Pension Plans, we used the PPA static mortality tables. The effect of adopting this new mortality table increased our pension benefit obligation by $4.9 million.
Historically, these assumptions, specifically our actual return on assets and financial market-based discount rates, have not differed materially from actual results; however, unanticipated events will impact future results of operations and could result in material changes to our reserves in future periods.
See Note 5, “Pension and Other Postretirement Benefit Plans” of the Notes to Consolidated Financial Statements in Item 8 of this report for more information regarding costs and assumptions for postretirement benefits.
Impairment of Long-Lived Assets
It is our policy to review our long-lived assets for possible impairment whenever events and circumstances indicate that the carrying value of an asset may not be recoverable. At December 31, 2014 and 2013, other than those assets for which impairment charges had been taken, we do not believe there was a material amount of assets that had associated undiscounted projected cash flows that were materially less than their carrying values. If there are in the future, we will disclose that fact and the carrying amount of the assets at risk of impairment. Additional restructuring actions taken will be based upon our assessment of ongoing economic activity and any such additional actions, if warranted, could result in further restructuring and/or asset impairment charges in the foreseeable future, and, accordingly, could have a significant effect on our consolidated financial position and future operating results. Such events could include a loss of a significant customer or market share, the decision to relocate production to other locations or the decision to cease production of specific models of products.
We recognize losses related to the impairment of long-lived assets when the estimated future undiscounted cash flows are less than the asset's carrying value or when the assets become permanently idle. Assumptions and estimates used in the evaluation of impairment are consistent with our business plan, including current and future economic trends, the effects of new technologies and foreign currency movements, and are subject to a high degree of judgment and complexity. All of these variables ultimately affect management's estimate of the expected future cash flows to be derived from the asset or group of assets under evaluation, as well as the estimate of their fair value. Changes in the assumptions and estimates, or our inability to achieve our business plan, may affect the carrying value of long-lived assets and could result in additional impairment charges in future periods.
Share-based Compensation
29
Share-based payment awards exchanged for employee services are recorded at fair value on the date of grant and, for cash-settled awards, re-measured quarterly over the life of the award. The awards are expensed in the Consolidated Statements of Operations over the requisite employee service period. Our plan prior to April 30, 2014 authorized two types of incentive awards for our key employees, both of which were based upon the value of our then outstanding Class A Common Stock: stock appreciation rights (“SARs”) and phantom shares. Both types of awards are settled in cash. In the first quarter of 2014, our Board of Directors adopted the 2014 Omnibus Incentive Plan, which was approved by our shareholders at our 2014 Annual Meeting of Shareholders. Under this plan, we may award share-based compensation that does not have to be settled in cash to certain key employees, directors and third-party service providers. During 2014, we have awarded non-qualified stock options as well as restricted stock units ("RSUs"). The stock options will be settled in our Common Shares, while the RSU's will be partially settled in our Common Shares and partially settled in cash.
Stock-based compensation expense is generally recognized over the vesting period on a straight-line basis. We determine the fair value of the stock options and SARs using the Black-Scholes option pricing model. The Black-Scholes option pricing model incorporates certain assumptions, such as risk-free interest rate, expected volatility, expected dividend yield and the expected life, in order to arrive at a fair value estimate. Expected volatilities are based on the historical volatility of our common shares. The risk-free interest rate is based upon quoted market yields for United States Treasury debt securities. The expected dividend yield is based upon our history of not paying dividends since the second quarter of 2005 and management's current plans regarding future dividends. We believe that the assumptions selected by management are reasonable; however, significant changes could materially impact the results of the calculation of fair value.
The fair value of the phantom shares and the portion of the RSUs settled in cash is determined based on the closing stock price on our Common Shares on the initial grant date and, for cash-settled phantom shares and RSUs, revalued based on the closing price of our Common Shares as of the last business day of each quarterly period.
For the options and RSUs settled in our Common Shares, the fair value is based on the closing price of our Common Shares on the grant date.
In addition to the awards to our employees and awards to our non-employee directors under the 2014 Omnibus Incentive Plan, under our prior plan, we granted deferred stock units ("DSUs") to our non-employee directors under our Outside Directors' Deferred Stock Unit Plan. These awards are fully vested when made. We measure the fair value of outstanding DSUs based upon the closing stock price of our Common Shares on the last day of the reporting period. We will pay cash with respect to the DSUs to a director after the earlier of a Company Change in Control, as defined in the plan, or the date when he or she ceases to be a non-employee director for any reason. Since the DSUs are settled in cash rather than by issuing equity instruments, we record an expense for DSUs, with a corresponding liability on our Consolidated Balance Sheets. See Note 10, “Share-based Compensation Arrangements,” of the Notes to the Consolidated Financial Statements in Item 8 of this report for additional information.
Income Taxes
We use the asset and liability method of accounting for income taxes. Under this method, income tax expense is recognized for the amount of taxes payable or refundable for the current year. In addition, deferred tax assets and liabilities are recognized for the expected future tax consequences of temporary differences between the financial reporting and tax bases of assets and liabilities, and for operating loss and tax credit carry forwards. Management must make assumptions, judgments and estimates to determine our current provision for income taxes, our deferred tax assets and liabilities and any valuation allowance to be recorded against a deferred tax asset.
Our assumptions, judgments and estimates relative to the current provision for income taxes take into account current tax laws, our interpretation of current tax laws and possible outcomes of current and future audits conducted by foreign and domestic tax authorities. We establish reserves for income taxes to address potential exposures involving tax positions that could be challenged by tax authorities. Although we believe our assumptions, judgments and estimates are reasonable, changes in tax laws or our interpretation of tax laws or the resolution of current or any future tax audits could significantly impact the amounts provided for income taxes in our consolidated financial statements.
Our assumptions, judgments and estimates relative to the value of a deferred tax asset take into account predictions of the amount and category of future taxable income, such as income from operations or capital gains income. Actual operating results and the underlying amount and category of income in future years could render our current assumptions, judgments and estimates of recoverable net deferred taxes inaccurate. Any of the assumptions, judgments and estimates mentioned above could cause our actual income tax obligations to differ from our estimates, thus materially impacting our financial position and results of operations. Historically, our assumptions, judgments and estimates have not differed materially from actual results; however, unanticipated events such as income from operations or capital gains income could result in material changes to our tax accounts in future periods.
RECENTLY ISSUED ACCOUNTING PRONOUNCEMENTS
Management continuously monitors accounting pronouncements, see Note 19, "New Accounting Standards", of the Notes to Consolidated Financial Statements in Item 8 of this report.
30
OUTLOOK
Information in this “Outlook” section should be read in conjunction with the cautionary statements and discussion of risk factors included elsewhere in this report.
Sales declined in 2014 primarily due to the unfavorable impact of changes in foreign currency exchange rates and net lower volumes and unfavorable changes in sales mix, partially offset by net price increases. We expect to see continued demand volatility in 2015 as a result of increased competition, quality issues, changes in the regulatory landscape and continued uncertainties with current events around the world. For 2015, we currently expect net sales to increase in the range of 1 percent to 3 percent from 2014 levels.
This current outlook for 2015 is based on our internal projections about the market and related economic conditions, expected price increases to our customers, continued economic impact from the Indian quality issue, the changing regulatory landscape, estimated foreign currency exchange rate effects, as well as our continued efforts in sales and marketing. If our key markets become weaker than we currently expect, this could have an adverse impact on our outlook for 2015.
The outlook for 2015 is subject to many of the same variables that have negatively impacted us in recent years. The condition of, and uncertainties regarding, the global economy, commodity costs, and key currency rates are all important to future performance, as is our ability to match our hedging activity with actual levels of transactions. The extent to which adverse trends in recent years continue, will ultimately determine our 2015 results. We can give no guarantees regarding what impact future exchange rates, commodity prices and other economic changes will have on our 2015 results. For a discussion of the sensitivity analysis associated with our key commodities and currency hedges see “Quantitative and Qualitative Disclosures About Market Risk” in Part II, Item 7A of this report.
The prices of some of our key commodities, specifically copper, aluminum and steel, remain volatile. The weighted average market prices of copper and steel decreased 10.7% and 8.8%, respectively, and aluminum increased 10.0%, in 2014 compared to 2013, see “Executive Summary – Commodities” above. We expect the full year change in average cost of our purchased materials in 2015, including the impact of our hedging activities, to have a slightly negative impact in 2015 when compared to 2014, depending on commodity cost levels and the level of our hedging over the course of the year. We expect to continue our approach of mitigating the effect of short-term price swings through the appropriate use of hedging instruments, price increases, and modified pricing structures.
The Euro, the Brazilian Real and the Indian Rupee have weakened against the U.S. Dollar in 2014. We have entered into forward purchase contracts to cover a portion of our exposure to additional fluctuations in value during 2014. See “Executive Summary - Currency Exchange” and “Quantitative and Qualitative Disclosures About Market Risk” in Part II, Item 7A of this report for more details regarding our hedging contracts. In the aggregate, we expect the changes in foreign currency exchange rates, after giving consideration to our hedging contracts and including the impact of realized gains and losses, to have a slightly positive impact on our net income in 2015 when compared to 2014.
After giving recognition to the factors discussed above, we expect that the full year 2015 operating (loss) income could improve compared to 2014, if we are successful at offsetting volatility in commodity costs and foreign exchange rates, and implementing initiatives for re-engineering our product lines to reduce our costs, price indexing, restructuring activities and other cost reductions. We also expect our cash flow from operating activities for 2015 to be slightly positive if we are successful at achieving the improved operating profit discussed above and the tax authorities do not significantly change their pattern of payments or past practices for the expected outstanding refundable Brazilian and Indian non-income taxes. Furthermore, we expect capital spending in 2015 to be approximately $15.0 million to $20.0 million, primarily for equipment.
Based on our assessment of ongoing economic activity, we realize that we may not generate cash flow from operating activities unless further restructuring activities are implemented or sales or economic conditions improve. We are in the process of assessing our strategic initiatives and their respective impacts on our future results. Additional restructuring actions may be necessary during the next several quarters and might include changing our current footprint, consolidation of facilities, other reductions in manufacturing capacity, reductions in our workforce, sales of assets and other restructuring activities. These restructuring actions could result in significant restructuring or asset impairment charges, severance costs, losses on asset sales and use of cash. Accordingly, any future restructuring activities could have a significant effect on our consolidated financial position, operating profit, cash flows and future operating results. Cash required for any future restructuring activities may be provided by our cash balances, cash proceeds from the sales of assets or new financing arrangements, although we have no commitments for new financing arrangements. If these restructuring actions are taken, there is a risk that the costs of the restructuring and cash required will exceed our original estimates or the benefits received from such activities.
As we look to the first quarter of 2015, we expect our sales, operating profit and operating cash flow to be slightly lower than the first quarter of 2014. Operating profit might be lower than in the first quarter of 2014 primarily due lower sales levels as well as additional restructuring actions.
31
32
ITEM 7A. | QUANTITATIVE AND QUALITATIVE DISCLOSURES ABOUT MARKET RISK |
We are exposed to market risk during the normal course of business from credit risk associated with cash investments and accounts receivable and from changes in interest rates, commodity prices and foreign currency exchange rates. The exposure to these risks is managed through a combination of normal operating and financing activities, which include the use of derivative financial instruments in the form of interest rates swaps, commodity futures contracts and foreign currency forward exchange contracts. Commodity prices and foreign currency exchange rates can be volatile, and our risk management activities do not totally eliminate these risks. Consequently, these fluctuations can have a significant effect on our results.
Credit Risk – Financial instruments which potentially subject us to concentrations of credit risk are primarily cash investments, both restricted and unrestricted and accounts receivable. In the U.S., only a small portion of our cash balances are insured by the FDIC. Any cash we hold in the U.S. that is not utilized for day-to-day working capital requirements is primarily invested in secure, institutional money market funds, which are strictly regulated by the U.S. Securities and Exchange Commission and operate under tight requirements for the liquidity, creditworthiness and diversification of their assets.
We utilize credit review procedures to approve customer credit. Customer accounts are actively monitored and collection efforts are pursued within normal industry practice. Management believes that concentrations of credit risk with respect to receivables are somewhat limited due to the large number of customers in our customer base and their dispersion across different industries and geographic areas, as well as credit insurance we obtain in certain regions.
A portion of accounts receivable at our Brazilian subsidiary is sold with limited recourse at a discount. Our European and Brazilian subsidiaries also discount certain receivables without recourse. Such receivables factored by us, both with and without limited recourse, are excluded from accounts receivable in our Consolidated Balance Sheets. Discounted receivables sold in these subsidiaries, including both with limited and without recourse amounts, were $25.1 million and $42.7 million at December 31, 2014 and 2013, respectively and the weighted average discount rate was 8.5% in 2014 and 6.1% in 2013. The amount of factored receivables sold with limited recourse, which results in a contingent liability to us, was $3.7 million and $12.1 million as of December 31, 2014 and 2013, respectively.
In India, we have the ability to collect receivables that are backed by letters of credit sooner than the receivables would otherwise be paid by the customer. Furthermore, some of our large customers offer a non-recourse factoring program relating to their receivables only, under which we can collect these receivables, at a discount, sooner than they would otherwise be paid by the customer. We consider these programs similar to the factoring programs in Brazil and Europe as it relates to our liquidity. We collected a total of $4.0 million and $6.0 million that would otherwise have been outstanding as receivables, under both of these programs at December 31, 2014 and December 31, 2013, respectively and the weighted average discount rate was 9.0% and 10.7% in 2014 and 2013, respectively.
We maintain an allowance for losses based upon the expected collectability of all accounts receivable, including receivables sold with recourse and without recourse.
Interest Rate Risk – We are subject to interest rate risk, primarily associated with our borrowings and our investments of excess cash. Our current borrowings by our foreign subsidiaries consist of variable and fixed rate loans that are based on either the London Interbank Offered Rate, European Interbank Offered Rate or the BNDES TJLP rate. Our current borrowings in the U.S. primarily bear interest at either LIBOR or an alternative base rate. We also record interest expense associated with the accounts receivable factoring facilities described above. While changes in interest rates do not affect the fair value of our variable-interest rate debt or cash investments, they do affect future earnings and cash flows. During 2014, we began using interest rate swaps to help us manage our U.S. interest rate risk. As of December 31, 2014, we held a total notional value of $8.3 million in interest rate swaps, which covers 100% of the outstanding interest rate exposure of our PNC variable rate Term Loan. Based on our debt and invested cash balances at December 31, 2014, a 1% increase in interest rates would increase interest expense for the year by approximately $0.5 million and a 1% decrease in interest rates would have an immaterial effect on investments. Based on our debt and invested cash balances at December 31, 2013, a 1% increase in interest rates would increase interest expense for the year by approximately $0.7 million and a 1% decrease in interest rates would have an immaterial effect on investments.
Commodity Price Risk – Our exposure to commodity price risk is related primarily to the price of copper, steel and aluminum, as these are major components of our product cost.
We use commodity derivatives to provide us with greater flexibility in managing the substantial volatility in commodity pricing. Our policy allows management to utilize commodity derivative contracts for a limited percentage of projected raw materials requirements up to 18 months in advance. At December 31, 2014 and 2013, we held a total notional value of $8.9 million and $12.2 million, respectively, in commodity derivative contracts. The decline in notional value of our commodity
33
contracts is primarily due to downward trends in base metal market prices and increased aluminum usage, which is lower in cost. Derivatives are designated at the inception of the contract as cash flow hedges against the future prices of copper and aluminum, and are accounted for as hedges on our Consolidated Balance Sheets unless they are subsequently de-designated. While the use of derivatives can mitigate the risks of short-term price increases associated with these commodities by “locking in” prices at a specific level, we do not realize the full benefit of a rapid decrease in commodity prices. If market pricing becomes significantly deflationary, our level of commodity hedging could result in lower operating margins and reduced profitability.
As of December 31, 2014, we have been proactive in addressing the volatility of copper and aluminum prices, including executing derivative contracts to cover approximately 31.9% and 22.0% of our anticipated copper and aluminum requirements for 2015, respectively.
Any rapid increases in steel prices has a particularly negative impact, as there is currently no well-established global market for hedging against increases in the cost of steel.
Based on our current level of activity, and before consideration of our outstanding commodity derivatives contracts, a 10% increase in the price, as of December 31, of copper, steel or aluminum used in production of our products would have adversely affected our annual operating profit on an annual basis as indicated in the table below:
10% increase in commodity prices | ||||||||
(in millions) | 2014 | 2013 | ||||||
Copper | $ | (2.2 | ) | $ | (4.4 | ) | ||
Steel | (7.2 | ) | (10.0 | ) | ||||
Aluminum | (0.5 | ) | (0.6 | ) | ||||
Total | $ | (9.9 | ) | $ | (15.0 | ) | ||
The decreases shown in the table above are primarily due to lower market prices of copper and steel at December 31, 2014, compared to December 31, 2013 and lower than expected sales.
Based on our current level of commodity derivative contracts, a 10% decrease in the price as of December 31, of copper, or aluminum (there are currently no steel contracts) used in production of our products would have resulted in losses under these contracts that would adversely impact our annual operating results for 2014 and 2013 as indicated in the table below:
10% decrease in commodity prices | ||||||||
(in millions) | 2014 | 2013 | ||||||
Copper | $ | (0.7 | ) | $ | (1.1 | ) | ||
Steel | — | — | ||||||
Aluminum | (0.1 | ) | (0.2 | ) | ||||
Total | $ | (0.8 | ) | $ | (1.3 | ) | ||
Foreign Currency Exchange Risk – We are exposed to significant exchange rate risk since the majority of all our revenue, expenses, assets and liabilities are derived from operations conducted outside the U.S. in local and other currencies. For purposes of financial reporting, the results are translated into U.S. Dollars based on currency exchange rates prevailing during or at the end of the reporting period. We are also exposed to significant exchange rate risk when an operation has sales or expense transactions in a currency that differs from its local, functional currency or when the sales and expenses are denominated in different currencies. This risk applies to all of our foreign locations since a large percentage of their receivables are transacted in a currency other than their local currency, mainly U.S. Dollars. In those cases, if the receivable is ultimately paid in less valuable U.S. Dollars, the foreign location realizes less proceeds in its local currency, which can adversely impact its margins. The periodic adjustment of these receivable balances based on the prevailing foreign exchange rates is recognized in our Consolidated Statements of Operations. As the U.S. Dollar strengthens, our reported net revenues, operating profit (loss) and assets are reduced because the local currency will translate into fewer U.S. Dollars, and during times of a weakening U.S. Dollar, our reported expenses and liabilities are increased because the local currency will translate into more U.S. Dollars. Translation of our Consolidated Statements of Operations into U.S. Dollars affects the comparability of revenue, expenses, operating income (loss), and earnings (loss) per share between years. Because of the geographic diversity of our operations, weaknesses in some currencies might be offset by strengths in others over time. However, fluctuations in foreign currency exchange rates, particularly the weakening of the U.S. Dollar against major currencies, as shown in the table below, could materially affect our financial results.
34
We have developed strategies to mitigate or partially offset these impacts, primarily hedging against transactional exposure where the risk of loss is greatest. This involves entering into short-term derivative contracts to sell or purchase U.S. Dollars at specified rates based on estimated currency cash flows. In particular, we have entered into foreign currency derivative contracts to hedge the Brazilian, European and Indian export sales, which are predominately denominated in U.S. Dollars. However, these hedging programs only reduce exposure to currency movements over the limited time frame of up to eighteen months. Ultimately, long-term changes in currency exchange rates have lasting effects on the relative competitiveness of operations located in certain countries versus competitors located in different countries. Additionally, if the currencies weaken against the U.S. Dollar, any hedge contracts that have been entered into at higher rates result in losses recognized in our Consolidated Statements of Operations when they are settled. From January 1 to December 31, 2014, the Brazilian Real weakened against the U.S. Dollar by 13.4%, the Indian Rupee weakened against the U.S. Dollar by 1.9%, and the Euro weakened against the U.S. Dollar by 13.6%. This weakening primarily occurred in the second half of 2014.
At December 31, 2014 and 2013, we held foreign currency forward contracts with a total notional value of $21.2 million and $22.3 million, respectively. The decline in the notional value of our currency contracts was primarily due to changes in our business practices to better utilize U.S. Dollars collected by our Brazilian, Indian and European locations. Based on our current level of activity, and including any mitigation as the result of hedging activities, we believe that a 10% strengthening of the Brazilian Real, the Euro, or the Indian Rupee against the U.S. Dollar would have negatively impacted our operating profit on an annual basis for 2014 and 2013 as indicated in the table below:
10% Strengthening against U.S. $ | ||||||||
(in millions) | 2014 | 2013 | ||||||
Real | $ | (3.3 | ) | $ | (2.7 | ) | ||
Euro | (2.5 | ) | (9.5 | ) | ||||
Rupee | (1.2 | ) | (0.7 | ) | ||||
Total | $ | (7.0 | ) | $ | (12.9 | ) | ||
Based on our current foreign currency forward contracts, a 10% weakening in the value of the Brazilian Real, the Euro or the Indian Rupee against the U.S. Dollar would have resulted in losses under such foreign currency forward contracts that would adversely impact our operating results in 2014 and 2013 as indicated in the table below:
10% Weakening against U.S. $ | ||||||||
(in millions) | 2014 | 2013 | ||||||
Real | $ | (0.2 | ) | $ | (0.8 | ) | ||
Euro | (0.3 | ) | — | |||||
Rupee | — | — | ||||||
Total | $ | (0.5 | ) | $ | (0.8 | ) | ||
35
ITEM 8. | FINANCIAL STATEMENTS AND SUPPLEMENTARY DATA |
INDEX TO CONSOLIDATED FINANCIAL STATEMENTS
Page | |
Financial Statements | |
All schedules are omitted because they are not applicable or the required information is shown in the financial statements or notes thereto.
36
REPORT OF INDEPENDENT REGISTERED PUBLIC ACCOUNTING FIRM
Board of Directors and Stockholders
Tecumseh Products Company
We have audited the accompanying consolidated balance sheets of Tecumseh Products Company (a Michigan corporation) and subsidiaries (the “Company”) as of December 31, 2014 and 2013, and the related consolidated statements of operations, comprehensive income (loss), stockholders’ equity, and cash flows for each of the three years in the period ended December 31, 2014. These financial statements are the responsibility of the Company’s management. Our responsibility is to express an opinion on these financial statements based on our audits.
We conducted our audits in accordance with the standards of the Public Company Accounting Oversight Board (United States). Those standards require that we plan and perform the audit to obtain reasonable assurance about whether the financial statements are free of material misstatement. An audit includes examining, on a test basis, evidence supporting the amounts and disclosures in the financial statements. An audit also includes assessing the accounting principles used and significant estimates made by management, as well as evaluating the overall financial statement presentation. We believe that our audits provide a reasonable basis for our opinion.
In our opinion, the consolidated financial statements referred to above present fairly, in all material respects, the financial position of Tecumseh Products Company and subsidiaries as of December 31, 2014 and 2013, and the results of their operations and their cash flows for each of the three years in the period ended December 31, 2014 in conformity with accounting principles generally accepted in the United States of America.
We also have audited, in accordance with the standards of the Public Company Accounting Oversight Board (United States), the Company’s internal control over financial reporting as of December 31, 2014, based on criteria established in the 2013 Internal Control-Integrated Framework issued by the Committee of Sponsoring Organizations of the Treadway Commission (COSO), and our report dated March 4, 2015 expressed an unqualified opinion.
/s/ GRANT THORNTON LLP
Southfield, Michigan
March 4, 2015
37
TECUMSEH PRODUCTS COMPANY AND SUBSIDIARIES
CONSOLIDATED BALANCE SHEETS
December 31, | ||||||||
(in millions, except share data) | 2014 | 2013 | ||||||
ASSETS | ||||||||
Current Assets: | ||||||||
Cash and cash equivalents | $ | 42.7 | $ | 55.0 | ||||
Restricted cash and cash equivalents | 6.2 | 14.2 | ||||||
Accounts receivable, trade, less allowance for doubtful accounts of $1.8 million in 2014 and $1.5 million in 2013 | 68.4 | 85.5 | ||||||
Inventories | 95.6 | 127.7 | ||||||
Deferred income taxes | 0.5 | 0.8 | ||||||
Recoverable non-income taxes | 19.8 | 16.7 | ||||||
Fair value of derivatives | 0.4 | 0.6 | ||||||
Other current assets | 17.8 | 18.1 | ||||||
Total current assets | 251.4 | 318.6 | ||||||
Property, plant, and equipment, net | 103.7 | 122.8 | ||||||
Deferred income taxes | 1.0 | 1.1 | ||||||
Recoverable non-income taxes | 7.9 | 10.6 | ||||||
Deposits | 24.2 | 25.8 | ||||||
Other assets | 8.1 | 8.5 | ||||||
Total assets | $ | 396.3 | $ | 487.4 | ||||
LIABILITIES AND STOCKHOLDERS’ EQUITY | ||||||||
Current Liabilities: | ||||||||
Accounts payable, trade | $ | 92.6 | $ | 100.4 | ||||
Short-term borrowings | 29.4 | 49.7 | ||||||
Accrued liabilities: | ||||||||
Employee compensation | 19.5 | 25.5 | ||||||
Product warranty and self-insured risks | 12.3 | 15.1 | ||||||
Payroll taxes | 11.8 | 13.4 | ||||||
Fair value of derivatives | 1.8 | 1.6 | ||||||
Other current liabilities | 8.0 | 12.6 | ||||||
Total current liabilities | 175.4 | 218.3 | ||||||
Long-term borrowings | 19.8 | 17.5 | ||||||
Product warranty and self-insured risks | 3.6 | 4.2 | ||||||
Pension liabilities | 29.9 | 20.0 | ||||||
Other liabilities | 17.3 | 17.1 | ||||||
Total liabilities | 246.0 | 277.1 | ||||||
Stockholders’ Equity | ||||||||
Common Shares, no par value; authorized 100,000,000 shares; issued and outstanding 18,479,684 shares in 2014 | 29.5 | — | ||||||
Class A common stock, $1 par value; authorized 75,000,000 shares; issued and outstanding 13,401,938 shares in 2013 | — | 13.4 | ||||||
Class B common stock, $1 par value; authorized 25,000,000 shares; issued and outstanding 5,077,746 shares in 2013 | — | 5.1 | ||||||
Paid in capital | 0.3 | 11.0 | ||||||
Retained earnings | 233.4 | 266.1 | ||||||
Accumulated other comprehensive loss | (112.9 | ) | (85.3 | ) | ||||
Total stockholders’ equity | 150.3 | 210.3 | ||||||
Total liabilities and stockholders’ equity | $ | 396.3 | $ | 487.4 | ||||
The accompanying notes are an integral part of these Consolidated Financial Statements.
38
TECUMSEH PRODUCTS COMPANY AND SUBSIDIARIES
CONSOLIDATED STATEMENTS OF OPERATIONS
For the Years Ended December 31, | ||||||||||||
(in millions, except share and per share data) | 2014 | 2013 | 2012 | |||||||||
Net sales | $ | 724.4 | $ | 823.6 | $ | 854.7 | ||||||
Cost of sales | (653.7 | ) | (745.5 | ) | (790.0 | ) | ||||||
Gross profit | 70.7 | 78.1 | 64.7 | |||||||||
Selling and administrative expenses | (92.2 | ) | (104.9 | ) | (107.7 | ) | ||||||
Other income (expense), net | 9.3 | 21.4 | 22.3 | |||||||||
Impairments, restructuring charges, and other items | (8.8 | ) | (13.6 | ) | 40.6 | |||||||
Operating (loss) income | (21.0 | ) | (19.0 | ) | 19.9 | |||||||
Interest expense | (10.0 | ) | (9.2 | ) | (10.2 | ) | ||||||
Interest income | 3.2 | 1.5 | 3.2 | |||||||||
(Loss) income from continuing operations before taxes | (27.8 | ) | (26.7 | ) | 12.9 | |||||||
Tax (expense) benefit | (0.5 | ) | (7.7 | ) | 10.2 | |||||||
(Loss) income from continuing operations | (28.3 | ) | (34.4 | ) | 23.1 | |||||||
(Loss) from discontinued operations, net of tax | (4.4 | ) | (3.1 | ) | (0.5 | ) | ||||||
Net (loss) income | $ | (32.7 | ) | $ | (37.5 | ) | $ | 22.6 | ||||
Basic and diluted (loss) income per share (a): | ||||||||||||
(Loss) income from continuing operations | $ | (1.53 | ) | $ | (1.86 | ) | $ | 1.25 | ||||
Loss from discontinued operations | (0.24 | ) | (0.17 | ) | (0.03 | ) | ||||||
Net (loss) income per share | $ | (1.77 | ) | $ | (2.03 | ) | $ | 1.22 | ||||
Weighted average shares, basic and diluted (in thousands) | 18,480 | 18,480 | 18,480 | |||||||||
Cash dividends declared per share | $ | — | $ | — | $ | — | ||||||
(a) During 2014, we have granted Restricted Stock Units ("RSUs") to our non-employee directors and our Chief Executive Officer. Also during 2014, we granted non-qualified stock options to our officers. These RSUs and options are not included in diluted earnings per share information for 2014, as the effect would be antidilutive.
The accompanying notes are an integral part of these Consolidated Financial Statements.
39
TECUMSEH PRODUCTS COMPANY AND SUBSIDIARIES
CONSOLIDATED STATEMENTS OF COMPREHENSIVE INCOME (LOSS)
(in millions) | For the Years Ended December 31, | ||||||||||
2014 | 2013 | 2012 | |||||||||
Net (loss) income | $ | (32.7 | ) | $ | (37.5 | ) | $ | 22.6 | |||
Paid in capital | 0.3 | — | — | ||||||||
Other comprehensive (loss) income, before tax: | |||||||||||
Foreign currency translation adjustments | (16.5 | ) | (22.6 | ) | (12.6 | ) | |||||
Pension and postretirement benefits: | |||||||||||
Prior service credit | (0.2 | ) | (2.4 | ) | (4.1 | ) | |||||
Net actuarial loss (gain) | (11.9 | ) | 2.2 | (5.3 | ) | ||||||
Loss (gain) on curtailments and settlements | — | 3.9 | (40.5 | ) | |||||||
Cash flow hedges: | |||||||||||
Unrealized (loss) gain on cash flow hedges | 0.1 | (0.9 | ) | 2.3 | |||||||
Reclassification adjustment for losses (gains) on cash flow hedges included in net (loss) income | (0.2 | ) | 0.4 | 13.8 | |||||||
Other comprehensive (loss), before tax | (28.7 | ) | (19.4 | ) | (46.4 | ) | |||||
Tax attributes of items in other comprehensive (loss) income: | |||||||||||
Foreign currency translation adjustments, tax impact | — | — | — | ||||||||
Pension and postretirement benefits: | |||||||||||
Prior service credit, tax impact | — | (4.7 | ) | 0.2 | |||||||
Net actuarial loss, tax impact | 0.1 | 4.3 | 0.2 | ||||||||
Loss on curtailments and settlements, tax impact | — | 7.7 | — | ||||||||
Cash flow hedges: | |||||||||||
Unrealized gain (loss) on cash flow hedges, tax impact | 1.0 | 2.7 | (0.6 | ) | |||||||
Reclassification adjustment for losses (gains) on cash flow hedges included in net (loss) income, tax impact | — | (1.2 | ) | (3.5 | ) | ||||||
Other comprehensive income (loss), tax impact | 1.1 | 8.8 | (3.7 | ) | |||||||
Total other comprehensive (loss), net of tax | (27.6 | ) | (10.6 | ) | (50.1 | ) | |||||
Total other comprehensive loss | $ | (60.0 | ) | $ | (48.1 | ) | $ | (27.5 | ) | ||
The accompanying notes are an integral part of these Consolidated Financial Statements.
40
TECUMSEH PRODUCTS COMPANY AND SUBSIDIARIES
CONSOLIDATED STATEMENTS OF CASH FLOWS
For the Years Ended December 31, | |||||||||||
(in millions) | 2014 | 2013 | 2012 | ||||||||
Cash Flows from Operating Activities: | |||||||||||
Net (loss) income | $ | (32.7 | ) | $ | (37.5 | ) | $ | 22.6 | |||
Adjustments to reconcile net (loss) income to net cash provided by operating activities: | |||||||||||
Depreciation and amortization | 25.0 | 33.5 | 36.4 | ||||||||
Non-cash employee retirement benefits | (1.2 | ) | (11.6 | ) | (8.9 | ) | |||||
Non-cash postretirement benefits curtailment and settlement gain | — | — | (45.0 | ) | |||||||
Deferred income taxes | (0.1 | ) | 6.3 | (3.5 | ) | ||||||
Share-based compensation | (0.2 | ) | 0.8 | 0.5 | |||||||
(Gain) loss on disposal of property and equipment | (3.1 | ) | 0.2 | (0.2 | ) | ||||||
Changes in operating assets and liabilities: | |||||||||||
Accounts receivable | 9.9 | 6.2 | (15.4 | ) | |||||||
Inventories | 25.3 | (10.5 | ) | 9.4 | |||||||
Payables and accrued expenses | (4.9 | ) | 22.8 | 12.4 | |||||||
Employee retirement benefits | (1.1 | ) | (2.1 | ) | (1.7 | ) | |||||
Recoverable non-income tax | (3.5 | ) | 8.1 | 1.1 | |||||||
Other | (6.2 | ) | (4.6 | ) | 1.1 | ||||||
Cash provided by operating activities | 7.2 | 11.6 | 8.8 | ||||||||
Cash Flows from Investing Activities: | |||||||||||
Capital expenditures | (13.6 | ) | (11.8 | ) | (13.8 | ) | |||||
Change in restricted cash and cash equivalents | 8.0 | (10.5 | ) | 7.1 | |||||||
Proceeds from sales of assets | 3.9 | 0.3 | 1.0 | ||||||||
Cash used in investing activities | (1.7 | ) | (22.0 | ) | (5.7 | ) | |||||
Cash Flows from Financing Activities: | |||||||||||
Proceeds from short-term debt | 42.7 | 72.8 | 130.0 | ||||||||
Payments on short-term debt | (59.2 | ) | (74.3 | ) | (126.3 | ) | |||||
Proceeds from long-term debt | 15.9 | 16.0 | 4.5 | ||||||||
Payments on long-term debt | (11.2 | ) | (4.1 | ) | (4.8 | ) | |||||
Payments on capital leases | (0.5 | ) | (0.4 | ) | (0.1 | ) | |||||
Debt issuance costs | (0.6 | ) | (0.2 | ) | — | ||||||
Other | — | — | (0.2 | ) | |||||||
Cash (used in) provided by financing activities | (12.9 | ) | 9.8 | 3.1 | |||||||
Effect of Exchange Rate Changes on Cash and Cash Equivalents | (4.9 | ) | 0.3 | (0.5 | ) | ||||||
(Decrease) Increase in cash and cash equivalents | (12.3 | ) | (0.3 | ) | 5.7 | ||||||
Cash and Cash Equivalents: | |||||||||||
Beginning of Period | 55.0 | 55.3 | 49.6 | ||||||||
End of Period | $ | 42.7 | $ | 55.0 | $ | 55.3 | |||||
Supplemental Schedule of Cash Flows and Non-cash Investing and Financing Activities: | |||||||||||
Cash paid for interest | $ | 8.7 | $ | 8.8 | $ | 9.1 | |||||
Cash paid for taxes | $ | 0.8 | $ | 1.4 | $ | 0.7 | |||||
Capital lease obligations incurred | $ | — | $ | 0.2 | $ | 2.0 | |||||
The accompanying notes are an integral part of these Consolidated Financial Statements.
41
TECUMSEH PRODUCTS COMPANY AND SUBSIDIARIES
CONSOLIDATED STATEMENTS OF STOCKHOLDERS’ EQUITY
(in millions) | Common Shares | Class A $1 Par Value | Class B $1 Par Value | Paid in Capital | Retained Earnings | Accumulated Other Comprehensive Income/(Loss) | Total Stockholders’ Equity | ||||||||||||||||||||
Balance, January 1, 2012 | $ | — | $ | 13.4 | $ | 5.1 | $ | 11.0 | $ | 281.0 | $ | (24.6 | ) | $ | 285.9 | ||||||||||||
Net income | 22.6 | 22.6 | |||||||||||||||||||||||||
Gain on derivatives, net of tax | 12.0 | 12.0 | |||||||||||||||||||||||||
Translation adjustments, net of tax | (12.6 | ) | (12.6 | ) | |||||||||||||||||||||||
Pension and postretirement benefits, net of tax | (49.5 | ) | (49.5 | ) | |||||||||||||||||||||||
Net | — | — | — | — | 22.6 | (50.1 | ) | (27.5 | ) | ||||||||||||||||||
Balance, December 31, 2012 | $ | — | $ | 13.4 | $ | 5.1 | $ | 11.0 | $ | 303.6 | $ | (74.7 | ) | $ | 258.4 | ||||||||||||
Net loss | (37.5 | ) | (37.5 | ) | |||||||||||||||||||||||
Gain on derivatives, net of tax | 1.0 | 1.0 | |||||||||||||||||||||||||
Translation adjustments, net of tax | (22.6 | ) | (22.6 | ) | |||||||||||||||||||||||
Pension and postretirement benefits, net of tax | 11.0 | 11.0 | |||||||||||||||||||||||||
Net | — | — | — | — | (37.5 | ) | (10.6 | ) | (48.1 | ) | |||||||||||||||||
Balance, December 31, 2013 | $ | — | $ | 13.4 | $ | 5.1 | $ | 11.0 | $ | 266.1 | $ | (85.3 | ) | $ | 210.3 | ||||||||||||
Impact of recapitalization | 29.5 | (13.4 | ) | (5.1 | ) | (11.0 | ) | — | |||||||||||||||||||
Stock based compensation | 0.3 | 0.3 | |||||||||||||||||||||||||
Net loss | (32.7 | ) | (32.7 | ) | |||||||||||||||||||||||
Gain on derivatives, net of tax | 0.9 | 0.9 | |||||||||||||||||||||||||
Translation adjustments, net of tax | (16.5 | ) | (16.5 | ) | |||||||||||||||||||||||
Pension and postretirement benefits, net of tax | (12.0 | ) | (12.0 | ) | |||||||||||||||||||||||
Net | 29.5 | (13.4 | ) | (5.1 | ) | (10.7 | ) | (32.7 | ) | $ | (27.6 | ) | (60.0 | ) | |||||||||||||
Balance, December 31, 2014 | $ | 29.5 | $ | — | $ | — | $ | 0.3 | $ | 233.4 | $ | (112.9 | ) | $ | 150.3 | ||||||||||||
The accompanying notes are an integral part of these Consolidated Financial Statements.
42
TECUMSEH PRODUCTS COMPANY AND SUBSIDIARIES
NOTES TO CONSOLIDATED FINANCIAL STATEMENTS
NOTE 1. Accounting Policies
Business Description – Tecumseh Products Company and Subsidiaries (the “Company”, "we", "us" or "our") is a global manufacturer primarily of hermetically sealed compressors for (i) commercial refrigeration applications, including walk-in coolers and freezers, ice makers, dehumidifiers, water coolers, food service equipment and refrigerated display cases and vending machines; (ii) household refrigerator and freezer applications; and (iii) residential and specialty air conditioning and heat pump applications, including window air conditioners, packaged terminal air conditioners and recreational vehicle and mobile air conditioners.
Principles of Consolidation – The accompanying consolidated financial statements include the accounts of the Company and our subsidiaries. All significant intercompany transactions and balances have been eliminated from the consolidated financial statements.
Foreign Currency Translation and Transaction Gains and Losses – The financial position and operating results of substantially all foreign operations are consolidated using the local currency as the functional currency. Local currency assets and liabilities are translated at the rates of exchange as of the balance sheet date, and local currency revenue and expenses are translated at average rates of exchange during the period. Resulting translation gains or losses are included as a component of accumulated other comprehensive income ("AOCI"), a separate component of stockholders’ equity. Transaction gains and losses arising from transactions denominated in a currency other than the functional currency of the entity involved are included in the Consolidated Statements of Operations.
Cash and Cash Equivalents and Restricted Cash and Cash Equivalents – Cash and cash equivalents consist of bank deposits and other highly liquid investments that are readily convertible into cash with original maturities of three months or less.
At December 31, 2014, restricted cash and cash equivalents consisted of funds utilized as cash collateral for a special term governmental loan at our Brazilian location, cash collateral for hedging activities and funds posted as collateral for our non-U.S. letters of credit. For more information on the special term governmental loan refer to Note 8, “Debt”.
Cash and cash equivalents outside of North American locations amounted to $31.3 million and $35.5 million at December 31, 2014 and 2013, respectively.
In the U.S., only a small portion of our cash balances are insured by the Federal Deposit Insurance Corporation ("FDIC"). All cash that we hold in the U.S. is held at two major financial institutions. Any cash we hold in the U.S. that is not utilized for day-to-day working capital requirements is primarily invested in secure, institutional money market funds, which are strictly regulated by the U.S. Securities and Exchange Commission and operate under tight requirements for the liquidity, creditworthiness, and diversification of their assets.
Accounts Receivable – Accounts receivable are stated at amounts due from customers, net of an allowance for doubtful accounts. We determine our allowance by considering a number of factors, including the length of time trade accounts receivable are past due and the customer’s current ability to pay its obligation.
Inventories – Inventories are valued at the lower of cost or market, on the first-in, first-out basis. Cost in inventory includes purchased parts and materials, direct labor and applied manufacturing overhead. We maintain an allowance for slow-moving inventory for items which we do not expect to sell within the next 24 months.
Property, Plant and Equipment, Net – Property, plant and equipment, including significant improvements, are recorded at cost. Repairs and maintenance and any gains or losses on disposition are included in operations. Depreciation is recorded on a straight-line basis to allocate the cost of depreciable assets and leasehold improvements over their estimated service lives, which generally fall within the following ranges:
Land improvements | 10 years |
Buildings and improvements | 10-40 years |
Machinery, equipment and tooling | 2-10 years |
Impairment of Long-Lived Assets – We review our long-lived assets for possible impairment whenever events and circumstances indicate that the carrying value of an asset may not be recoverable. Recoverability of assets to be held and used is measured by a comparison of the carrying amount of an asset to estimated future undiscounted cash flows expected to be generated by the asset. If the carrying amount of an asset exceeds its estimated future cash flows, an impairment charge is
43
recognized by the amount by which the carrying amount of the asset exceeds the fair value of the asset. Assumptions and estimates used in the evaluation of impairment are consistent with our business plan, including current and future economic trends, the effects of new technologies and foreign currency movements, all of which are subject to a high degree of judgment and complexity. All of these variables ultimately affect management’s estimate of the expected future cash flows to be derived from the asset or group of assets under evaluation, as well as the estimate of their fair value. Changes in the assumptions and estimates, or the inability to achieve our business plan, may affect the carrying value of long-lived assets and could result in additional impairment charges in future periods.
Deposits – Our deposits primarily relate to social taxes and judicial matters and release of the monies to us depends on the outcome of these matters.
Revenue Recognition – Revenue from the sale of our products are recognized once the risk and rewards of ownership have transferred to the customers, which, in most cases, coincide with shipment of the products. For other cases involving export sales, title transfers either when the products are delivered to the port of embarkation or received at the port of the country of destination.
Income Taxes – Income taxes are accounted for using the asset and liability method. Under this method, income tax expense is recognized for the amount of taxes payable or refundable for the current year. In addition, deferred tax assets and liabilities are recognized for the expected future tax consequences of temporary differences between the financial reporting and tax bases of assets and liabilities, and for operating loss and tax credit carry forwards. We record a valuation allowance to reduce our deferred tax assets to the amount that we believe is more likely than not to be realized. In addition, we establish reserves for income taxes to address potential exposures involving tax positions that could be challenged by tax authorities.
Derivative Financial Instruments – In the normal course of business, we employ established policies and procedures to manage our exposure to changes in foreign exchange rates and commodity prices using financial instruments deemed appropriate by management. As part of our risk management strategy, we may use derivative instruments, including interest rate swaps, currency forward exchange contracts and commodity futures contracts to hedge certain variable interest rate exposures, foreign exchange exposures and commodity prices. Our objective is to offset gains and losses resulting from these exposures with losses and gains on the derivative contracts used to hedge them, thereby reducing volatility of earnings. Derivative positions are used only to manage our underlying exposures. We do not use derivative financial instruments for speculative purposes. We formally designate and document all of our hedging relationships at the inception of the hedge as either fair value hedges or cash flow hedges, as applicable. In addition, we document our strategy for undertaking each hedge transaction and our method of assessing ongoing effectiveness. We record all derivative instruments at fair value.
For a derivative designated as a cash flow hedge, the gain or loss on the derivative is initially reported as a component of AOCI and subsequently reclassified into the statement of operations when the hedged transaction occurs. For a derivative designated as a fair value hedge, the gain or loss on the derivative in the period of change and the offsetting loss or gain of the hedged item attributed to the hedged risk are recognized in the statement of operations. For cash flow hedges, we assess the effectiveness of our futures and forwards contracts using the dollar offset method and de-designate the derivative if it is determined that the derivative will no longer be highly effective at offsetting the cash flows of the hedged item. At the time a derivative is de-designated, any losses recorded in AOCI are recognized in our Consolidated Statements of Operations while gains remain in AOCI on our Consolidated Balance Sheets until the original hedged transaction occurs. All subsequent gains and losses related to de-designated derivatives are recognized in our Consolidated Statements of Operations. See Note 14, “Derivative Instruments and Hedging Activities”, for a description of derivative instruments.
Product Warranty – Provision is made for the estimated cost of maintaining product warranties at the time the product is sold based upon historical claims experienced for each major product line. For most of our customers, warranty coverage on our compressors is provided for a period of twelve months to three years from the date of manufacture. In the U.S., for wholesale customers only, the warranty is provided for a period of up to twelve months from the date of their resale.
Self-Insured Risks – Provision is made for the estimated costs of known and anticipated claims under the deductible portions of our health, product liability and workers’ compensation insurance programs.
Environmental Expenditures – Expenditures for environmental remediation are expensed or capitalized, as appropriate. Liabilities relating to probable remedial activities are recorded when the costs of such activities can be reasonably estimated. Liabilities are not reduced for possible recoveries from insurance carriers.
Earnings (Loss) Per Share – Basic income (loss) per share is computed by dividing net income (loss) by the weighted average number of common shares outstanding during the period. Diluted earnings per share reflect the dilutive effect that would result from the conversion of, or exercise of a right to acquire, equity securities. Diluted earnings per share are not presented because
44
the effect in 2014 would have been anti-dilutive, and there were no outstanding rights to acquire our equity securities at December 31, 2013 or December 31, 2012.
Research, Development and Testing Expenses – Our research, development and testing expenses related to present and future products are expensed as incurred and were $14.3 million, $14.7 million, and $15.1 million in 2014, 2013 and 2012, respectively. Such expenses consist primarily of salary and material costs and are included in selling and administrative expenses.
Share-Based Compensation – We account for share-based compensation using the fair value for awards issued. See Note 10, “Share-based Compensation Arrangements” for a description of the types of awards we grant.
Estimates – Management is required to make certain estimates and assumptions in preparing the consolidated financial statements in accordance with U.S. GAAP. These estimates and assumptions impact the reported amount of assets and liabilities and disclosures of contingent assets and liabilities as of the date of the consolidated financial statements. They also impact the reported amount of net earnings or losses during any period. Actual results could differ from those estimates.
Significant estimates and assumptions used in the preparation of the accompanying consolidated financial statements include those related to: accruals for product warranty, self-insured risks, environmental matters, litigation and other contingent liabilities, pension obligations as well as the evaluation of long-lived asset impairments, determination of share-based compensation and the realizability of our deferred tax assets.
Certain reclassifications of prior years' amounts have been made to conform with the current year's presentation.
NOTE 2. Discontinued Operations
In 2007 and 2008, we completed the sale of the majority of our non-core businesses; however, we continue to incur legal fees, settlements and other expenses based on provisions in the purchase agreements.
Charges to discontinued operations are as follows:
Years Ended December 31, | ||||||||||||
(in millions) | 2014 | 2013 | 2012 | |||||||||
Environmental and legal charges and settlements | $ | (3.6 | ) | $ | (0.7 | ) | $ | (0.9 | ) | |||
Workers' compensation and product liability claims | (0.8 | ) | (2.4 | ) | (0.8 | ) | ||||||
Legal fee reimbursements | — | — | 0.8 | |||||||||
Grafton operating costs | — | — | (0.4 | ) | ||||||||
Mutual release agreement | — | — | 0.4 | |||||||||
Gain on sale of Grafton | — | — | 0.4 | |||||||||
Total loss from discontinued operations, net of tax | $ | (4.4 | ) | $ | (3.1 | ) | $ | (0.5 | ) | |||
For the year ended December 31, 2012, legal fee reimbursements were for the Platinum lawsuit received under our Directors and Officers insurance. We sold our Grafton facility in the fourth quarter of 2012 for net cash consideration of $0.9 million. See Note 12, “Income Taxes”, for a discussion of income taxes included in discontinued operations.
NOTE 3. Inventories
The components of inventories are as follows:
December 31, | ||||||||
(in millions) | 2014 | 2013 | ||||||
Raw materials, net of reserves | $ | 57.8 | $ | 81.1 | ||||
Work in progress | 0.5 | 1.2 | ||||||
Finished goods, net of reserves | 37.3 | 45.4 | ||||||
Inventories | $ | 95.6 | $ | 127.7 | ||||
Raw materials are net of a $3.0 million and $4.2 million reserve for obsolete and slow moving inventory at December 31, 2014 and December 31, 2013, respectively. The decline in the reserve for raw materials in 2014 is due to one of our U.S. locations disposing of some previously reserved inventory in the second quarter of 2014. Finished goods are net of a $2.0 million and $1.7 million reserve for obsolete and slow moving inventory and lower of cost or market at December 31, 2014 and 2013, respectively.
45
NOTE 4. Property, Plant and Equipment, net
The components of property, plant and equipment, net are as follows:
December 31, | ||||||||
(in millions) | 2014 | 2013 | ||||||
Land and land improvements | $ | 9.9 | $ | 10.5 | ||||
Buildings and building improvements | 86.9 | 93.2 | ||||||
Machinery and equipment | 639.6 | 701.1 | ||||||
Capital leases | 2.0 | 2.2 | ||||||
Assets in process | 9.9 | 5.1 | ||||||
Property, plant and equipment, gross | 748.3 | 812.1 | ||||||
Less accumulated depreciation | 644.6 | 689.3 | ||||||
Property, plant and equipment, net | $ | 103.7 | $ | 122.8 | ||||
Depreciation expense associated with property, plant and equipment was $25.0 million, $33.5 million and $36.3 million for the years ended December 31, 2014, 2013 and 2012, respectively.
NOTE 5. Pension and Other Postretirement Benefit Plans
We have a defined benefit retirement plan that covers substantially all domestic employees. This plan was frozen to new hires after January 15, 2011. We have frozen the pension benefits provided to our salaried pension plan participants as of December 31, 2013, and benefits provided to our hourly plan participants as of June 30, 2014. This means that: (i) pension plan participants will not earn any additional years of benefit service under the plan after the dates the respective plans were frozen for purposes of accruing an additional plan benefit; and (ii) no pay increases/decreases that plan participants earn after the dates the respective plans were frozen will be taken into account in determining their Plan benefit. Pension benefits covering salaried employees generally provide benefits that are based on average earnings and years of credited service. Pension benefits covering hourly employees generally provide benefits of stated amounts for each year of service.
With regard to our retiree health care benefit plan, in the second quarter of 2012 we informed employees and current retirees that (1) effective May 1, 2012 we would no longer provide life insurance benefits to eligible current and future salaried retirees of the Company, (2) effective December 31, 2013, we would no longer provide pre-age 65 retiree group health care benefits to current salaried employees and current salaried retirees of the Company who could participate or who are currently participating in the Plan and (3) effective May 1, 2012, all current employees who have not satisfied the age and Company service requirements as of May 1, 2012, for eligibility and participation in the Plan providing pre-age 65 retiree group health care benefits, will no longer be eligible. These plan amendments and settlements resulted in a total non-cash gain of $45.0 million on our Consolidated Statements of Operations. Due to the negative plan amendment, described in clause (2) in this paragraph, we recorded increased amortization of net gains until December 31, 2013.
We use December 31 as the measurement date for determining pension and other postretirement benefits. Information regarding the funded status and net periodic benefit costs was reconciled to or stated as of the year ended December 31.
Amounts recognized for both pension and other postretirement benefit plans in the Consolidated Balance Sheets and in AOCI as of December 31 consist of:
Pension Benefits | Other Benefits | ||||||||||||||
(in millions) | 2014 | 2013 | 2014 | 2013 | |||||||||||
Assets and liabilities: | |||||||||||||||
Liabilities – current | $ | (0.7 | ) | $ | (0.8 | ) | $ | — | $ | — | |||||
Liabilities – long term | $ | (29.9 | ) | $ | (20.0 | ) | $ | (0.2 | ) | $ | (0.3 | ) | |||
Accumulated other comprehensive income: | |||||||||||||||
Prior service cost (credit) | $ | 1.2 | $ | 1.1 | $ | — | $ | — | |||||||
Net actuarial loss (gain) | $ | 34.8 | $ | 22.8 | $ | — | $ | — | |||||||
The estimated net actuarial loss (gain) and prior service cost (credit) for the defined benefit pension plans that will be amortized from AOCI into net periodic benefit cost over the next twelve months are $2.1 million and ($0.1) million, respectively. Both the estimated net actuarial gain and prior service credit for the remaining other defined benefit postretirement plan that will be amortized from AOCI into net periodic benefit cost over the next twelve months are not material.
46
The following table provides a reconciliation of the changes in the pension and postretirement plan benefit obligations and fair value of plan assets for 2014 and 2013:
Pension Benefits | Other Benefits | ||||||||||||||
(in millions) | 2014 | 2013 | 2014 | 2013 | |||||||||||
Change in benefit obligation | |||||||||||||||
Benefit obligation at beginning of period | $ | 164.8 | $ | 186.5 | $ | 0.3 | $ | 0.2 | |||||||
Service cost | 0.9 | 2.2 | — | — | |||||||||||
Interest cost | 7.1 | 6.8 | — | — | |||||||||||
Plan amendments | — | — | — | — | |||||||||||
Actuarial loss (gain) | 17.5 | (15.1 | ) | — | (0.1 | ) | |||||||||
Benefit payments | (11.3 | ) | (10.2 | ) | — | (0.1 | ) | ||||||||
Special termination benefits | — | — | — | — | |||||||||||
Reclassification adjustment | — | — | — | 0.3 | |||||||||||
Settlements | (0.3 | ) | (1.6 | ) | — | — | |||||||||
Curtailments | — | (3.8 | ) | — | — | ||||||||||
Effect of changes in exchange rate | (1.9 | ) | — | — | — | ||||||||||
Benefit obligation at measurement date | $ | 176.8 | $ | 164.8 | $ | 0.3 | $ | 0.3 | |||||||
Change in plan assets | |||||||||||||||
Fair value at beginning of period | $ | 144.0 | $ | 148.5 | $ | — | $ | — | |||||||
Actual return on plan assets | 12.8 | 5.9 | — | — | |||||||||||
Employer contributions | 1.0 | 1.7 | — | 0.1 | |||||||||||
Benefit payments | (11.3 | ) | (10.2 | ) | — | (0.1 | ) | ||||||||
Settlements | (0.3 | ) | (1.6 | ) | — | — | |||||||||
Effect of changes in exchange rate | — | (0.3 | ) | — | — | ||||||||||
Fair value at measurement date | $ | 146.2 | $ | 144.0 | $ | — | $ | — | |||||||
The changes in benefit obligation due to the "Settlements" of $0.3 million in 2014 are related to some of our benefit plans in Europe and India, where the lump sum benefit payments exceeded the sum of service cost and interest cost, triggering settlement accounting.
The changes in benefit obligation due to the "Curtailments" of $3.8 million in 2013 are related to curtailment of our defined benefit retirement plan for the domestic salaried employees. The related balance was also reversed from AOCI.
The changes in benefit obligation due to "Reclassification adjustment" of $0.3 million in 2013 are related to reclassification of our postretirement benefit in Europe due to a continued review of our employee related plans. Previously the liabilities associated with this plan were recorded in other current liabilities and other long-term liabilities on our Consolidated Balance Sheets.
The accumulated benefit obligation for all defined benefit pension plans was $172.6 million and $160.9 million at December 31, 2014 and 2013, respectively.
Information for pension plans with an accumulated benefit obligation in excess of plan assets:
December 31, | |||||||
(in millions) | 2014 | 2013 | |||||
Projected benefit obligation | $ | 176.8 | $ | 162.8 | |||
Accumulated benefit obligation | $ | 172.6 | $ | 159.3 | |||
Fair value of plan assets | $ | 146.2 | $ | 142.3 | |||
47
Information for pension plans with a projected benefit obligation in excess of plan assets:
December 31, | |||||||
(in millions) | 2014 | 2013 | |||||
Projected benefit obligation | $ | 176.8 | $ | 164.8 | |||
Accumulated benefit obligation | $ | 172.6 | $ | 160.9 | |||
Fair value of plan assets | $ | 146.2 | $ | 144.0 | |||
Components of net periodic expense (benefit) during the year:
Pension Benefits | Other Benefits | |||||||||||||||||||||||
(in millions) | 2014 | 2013 | 2012 | 2014 | 2013 | 2012 | ||||||||||||||||||
Service cost | $ | 0.9 | $ | 2.2 | $ | 2.4 | $ | — | $ | 0.0 | $ | 0.0 | ||||||||||||
Interest cost | 7.1 | 6.8 | 7.2 | — | 0.0 | 0.1 | ||||||||||||||||||
Expected return on plan assets | (8.4 | ) | (8.5 | ) | (8.4 | ) | — | 0.0 | 0.0 | |||||||||||||||
Amortization of net loss (gain) | 1.0 | 2.7 | 3.0 | — | (12.9 | ) | (9.2 | ) | ||||||||||||||||
Amortization of unrecognized prior service costs | (0.2 | ) | (0.2 | ) | (0.2 | ) | — | (2.1 | ) | (3.9 | ) | |||||||||||||
Curtailment and settlement gain | — | — | — | — | — | (45.0 | ) | |||||||||||||||||
Net periodic expense (benefit) | $ | 0.4 | $ | 3.0 | $ | 4.0 | $ | — | $ | (15.0 | ) | $ | (58.0 | ) | ||||||||||
Additional Information
Assumptions
Assumptions used to determine benefit obligations as of December 31:
Pension Benefits | Other Benefits | ||||||||||
2014 | 2013 | 2014 | 2013 | ||||||||
U.S.-Based Plans: | |||||||||||
Discount rate | 3.75 | % | 4.50 | % | N/A | N/A | |||||
Rate of compensation increase | N/A | N/A | N/A | N/A | |||||||
Europe-Based Plans: | |||||||||||
Discount rate | 1.50 | % | 2.75 | % | 1.25 | % | 2.25 | % | |||
Rate of compensation increase | 3.00 | % | 3.00 | % | N/A | N/A | |||||
India-Based Plans: | |||||||||||
Discount rate | 8.25 | % | 9.00 | % | N/A | N/A | |||||
Rate of compensation increase | 6.85 | % | 6.00 | % | N/A | N/A | |||||
Assumptions used to determine net periodic benefit costs for the years ended December 31:
Pension Benefits | Other Benefits | |||||||||
2014 | 2013 | 2014 | 2013 | |||||||
U.S.-Based Plans: | ||||||||||
Discount rate | 4.50 | % | 3.75 | % | N/A | N/A | ||||
Expected long-term return on plan assets | 6.00 | % | 6.00 | % | N/A | N/A | ||||
Rate of compensation increase | N/A | 3.50 | % | N/A | N/A | |||||
Europe-Based Plans: | ||||||||||
Discount rate | 2.75 | % | 2.75 | % | 2.25 | % | N/A | |||
Expected long-term return on plan assets | N/A | N/A | N/A | N/A | ||||||
Rate of compensation increase | 3.00 | % | 3.00 | % | N/A | N/A | ||||
India-Based Plans: | ||||||||||
Discount rate | 9.00 | % | 8.25 | % | N/A | N/A | ||||
Expected long-term return on plan assets | 9.25 | % | 9.25 | % | N/A | N/A | ||||
Rate of compensation increase | 6.00 | % | 6.00 | % | N/A | N/A | ||||
48
In 2014, we adopted a new mortality base table and projection scale based on guidance published by the Society of Actuaries. Prior to 2014, for the U.S. Pension Plans, we used the PPA static mortality tables. The effect of adopting this new mortality table increased our pension benefit obligation by $4.9 million.
The expected long-term return on assets was determined for each class of assets in which the plan is invested based on consultation with the company's investment advisers. That information is combined with the target asset allocation, where applicable, to determine our best estimate of future returns.
Plan Assets
Our primary investment objectives are 1) preservation of principal, 2) minimizing the volatility of our assets and liabilities from changes in interest rates and market conditions, and 3) providing liquidity to meet benefit payments and expenses. Our portfolio primarily consists of fixed income obligations rated investment grade, (i.e., “Baa3/BBB” or better by Moody’s or Standard & Poor’s), respectively, and international and domestic equities.
The following tables provide pension plan assets based on nature and risks as of December 31, 2014 and 2013 (See Note 13, “Fair Value Measurements”, for additional information):
Plan Assets at December 31, 2014 | |||||||||||||||
(in millions) | Total Fair Value Measurement | Quoted Prices in Active Markets (Level 1) | Significant Other Observable Inputs (Level 2) | Significant Unobservable Inputs (Level 3) | |||||||||||
Assets: | |||||||||||||||
Cash and cash equivalents | $ | 4.1 | $ | 4.1 | $ | — | $ | — | |||||||
Mutual Funds: | |||||||||||||||
U.S. large cap | 19.1 | 19.1 | — | — | |||||||||||
U.S. small cap | 11.9 | 11.9 | — | — | |||||||||||
International growth | 13.7 | 13.7 | — | — | |||||||||||
Fixed Income Securities: | |||||||||||||||
Corporate bonds | 67.2 | — | 67.2 | — | |||||||||||
U.S. Treasury and Government bonds | 16.1 | 16.1 | — | — | |||||||||||
U.S. state and political subdivision bonds | 4.5 | — | 4.5 | — | |||||||||||
Other fixed income securities | 7.5 | — | 7.5 | — | |||||||||||
Other: | |||||||||||||||
India Government backed funds | 2.1 | 2.1 | — | — | |||||||||||
Total | $ | 146.2 | $ | 67.0 | $ | 79.2 | $ | — | |||||||
49
Plan Assets at December 31, 2013 | |||||||||||||||
(in millions) | Total Fair Value Measurement | Quoted Prices in Active Markets (Level 1) | Significant Other Observable Inputs (Level 2) | Significant Unobservable Inputs (Level 3) | |||||||||||
Assets: | |||||||||||||||
Cash and cash equivalents | $ | 3.1 | $ | 3.1 | $ | — | $ | — | |||||||
Mutual Funds: | |||||||||||||||
U.S. large cap | 18.2 | 18.2 | — | — | |||||||||||
U.S. small cap | 12.3 | 12.3 | — | — | |||||||||||
International growth | 15.0 | 15.0 | — | — | |||||||||||
Fixed Income Securities: | |||||||||||||||
Corporate bonds | 73.9 | — | 73.9 | — | |||||||||||
U.S. Treasury and Government bonds | 10.0 | 10.0 | — | — | |||||||||||
U.S. state and political subdivision bonds | 3.6 | — | 3.6 | — | |||||||||||
Other fixed income securities | 5.7 | — | 5.7 | — | |||||||||||
Other: | |||||||||||||||
India Government backed funds | 2.2 | 2.2 | — | — | |||||||||||
Total | $ | 144.0 | $ | 60.8 | $ | 83.2 | $ | — | |||||||
We expect to make contributions of $0.3 million to our pension plans in 2015.
The following benefit payments, which reflect expected future service, as appropriate, are expected to be paid:
(in millions) Year | Projected Benefit Payments from Pension Plans | Projected Benefit Payments From Postretirement Medical And Life Insurance Plans | |||||
2015 | $ | 10.7 | $ | — | |||
2016 | $ | 10.7 | $ | — | |||
2017 | $ | 11.2 | $ | — | |||
2018 | $ | 12.0 | $ | — | |||
2019 | $ | 12.1 | $ | — | |||
Aggregate for 2020-2024 | $ | 57.4 | $ | 0.1 | |||
Defined Contribution Plan
We have a defined contribution retirement plan that covers substantially all U.S. employees. The expense for this plan was $0.8 million, $2.2 million and $2.4 million in 2014, 2013 and 2012, respectively. Contributions have been funded from the proceeds obtained from the reversion of our former salaried pension plan, however these funds were exhausted late in the third quarter of 2014. Starting late in the third quarter of 2014, contributions are funded from our cash flow from operations.
NOTE 6. Recoverable Non-Income Taxes
We pay various value-added taxes in jurisdictions outside of the U.S. These include taxes levied on material purchases, fixed asset purchases and various social taxes. The majority of these taxes are creditable when goods are sold to customers domestically or against income taxes due. Since the taxes are recoverable upon completion of these activities, they are recorded as assets upon payment of the taxes.
Historically, in Brazil, such taxes were credited against income taxes. However, with reduced profitability, we instead sought these refunds via alternate proceedings. In India, we participate in a number of government sponsored tax incentive programs, which result in refundable non-income taxes.
Following is a summary of the recoverable non-income taxes recorded on our balance sheet at December 31, 2014 and 2013:
December 31, | ||||||||
(in millions) | 2014 | 2013 | ||||||
Brazil | $ | 21.7 | $ | 22.1 | ||||
India | 4.8 | 3.9 | ||||||
Europe | 1.0 | 1.3 | ||||||
Mexico | 0.2 | — | ||||||
Total recoverable non-income taxes | $ | 27.7 | $ | 27.3 | ||||
At December 31, 2014, a receivable of $19.8 million was included in current assets and $7.9 million was included in non-current assets and is expected to be recovered through 2016. At December 31, 2013, a receivable of $16.7 million was included in current assets and $10.6 million was included in non-current assets. The actual amounts received as expressed in U.S. dollars will vary depending on the exchange rate at the time of receipt or future reporting date.
NOTE 7. Warranties
Reserves are recorded on our Consolidated Balance Sheets to reflect our contractual liabilities relating to warranty commitments to customers. Unanticipated quality issues could result in material changes to estimates.
50
Changes in the carrying amount and accrued product warranty costs for the years ended December 31, 2014, 2013 and 2012 are summarized as follows:
(in millions) | |||
Balance at January 1, 2012 | $ | 6.5 | |
Settlements made (in cash or in kind) | (6.3 | ) | |
Current year accrual | 6.5 | ||
Effect of foreign currency translation | (0.1 | ) | |
Balance at December 31, 2012 | $ | 6.6 | |
Settlements made (in cash or in kind) | (7.9 | ) | |
Current year accrual | 14.8 | ||
Effect of foreign currency translation | (0.3 | ) | |
Balance at December 31, 2013 | $ | 13.2 | |
Settlements made(in cash or in kind) | (13.7 | ) | |
Current year accrual | 11.4 | ||
Effect of foreign currency translation | (0.2 | ) | |
Balance at December 31, 2014 | $ | 10.7 | |
Warranty expense was $11.4 million, $14.5 million and $6.4 million for the years ended December 31, 2014, 2013 and 2012, respectively. At December 31, 2014, $9.6 million was included in current liabilities and $1.1 million was included in non-current liabilities. At December 31, 2013, $11.9 million was included in current liabilities and $1.3 million was included in non-current liabilities.
The increase in this accrual balance is primarily due to additional accruals related to two warranty claims which originated in 2013 at our French and Indian locations. Furthermore in July 2014, the customer related to the claim at our French location has filed a lawsuit against the Company. See Note 16, "Commitments and Contingencies" for a description of the lawsuit.
NOTE 8. Debt
Our debt consists of the following:
December 31, | |||||||||||||
(in millions) | 2014 | 2013 | |||||||||||
Weighted Avg. Int. Rate | Weighted Avg. Int. Rate | ||||||||||||
Short-term borrowings | |||||||||||||
Lines of credit | $ | 21.3 | $ | 33.9 | |||||||||
Revolving credit facility | 0.3 | 8.0 | |||||||||||
Capital lease obligations | 0.5 | — | |||||||||||
Other debt | 0.6 | 0.4 | |||||||||||
Current maturities of long-term debt | 6.7 | 7.4 | |||||||||||
Total short-term borrowings | $ | 29.4 | 11.3 | % | $ | 49.7 | 8.7 | % | |||||
Long-term borrowings | |||||||||||||
Lines of credit | $ | 16.5 | $ | 7.1 | |||||||||
Term Loan | 8.3 | 15.0 | |||||||||||
Capital lease obligations | 0.6 | 1.8 | |||||||||||
Other debt | 1.1 | 1.0 | |||||||||||
Less: Current maturities of long-term debt | (6.7 | ) | (7.4 | ) | |||||||||
Total long-term debt borrowings | $ | 19.8 | 4.9 | % | $ | 17.5 | 4.4 | % | |||||
We have a Revolving Credit and Security Agreement with PNC Bank, National Association (“PNC”). Subject to the terms and conditions of the agreement as amended, PNC agreed to provide senior secured revolving credit financing up to an aggregate principal amount of $34.0 million, which includes up to $10.0 million in letters of credit subject to a borrowing base formula, lender reserves and PNC’s reasonable discretion. With the 2013 amendment, PNC also provided a senior secured term loan up to an aggregate principal amount of $15.0 million. The loans under the facilities bear interest at either LIBOR or an alternative
51
base rate, plus a margin that varies with borrowing availability under the revolving credit facility. The maturity of these facilities has been extended to December 11, 2018.
During the first quarter of 2014, we entered into an amendment to our Revolving Credit and Security Agreement with PNC, pursuant to which all closing conditions which existed at the end of 2013 related to the 2013 amendment were deemed met and we agreed to use a portion of those proceeds to prepay the Term Loan because of a shortfall in the margin value of the collateral. As a result, we reclassified the remaining proceeds from "Restricted cash and cash equivalents" to "Cash and cash equivalents" on our Consolidated Balance Sheets.
We paid $0.4 million in fees associated with the amendments. We had a remaining balance of $0.1 million in fees associated with the original agreement in 2011, which were capitalized and will now be amortized over the new five year term of the amended agreement. We must also pay a facility fee of 0.375% a year on the unused portion of the facility. The facility is guaranteed by Tecumseh Products Company and its U.S. and Canadian subsidiaries and is secured by substantially all of the assets of the borrowers.
The PNC agreement contains various covenants, including limitations on dividends, investments and additional indebtedness and liens, and a minimum fixed charge coverage ratio, which would apply only if average undrawn borrowing availability, as defined by the credit agreement, were to fall below a specified level for more than five business days. We had $0.4 million of additional borrowing capacity under this facility as of December 31, 2014, after giving effect to our fixed charge coverage ratio covenant and our outstanding borrowings and letters of credit under this facility. We were in compliance with all covenants and terms of the agreement at December 31, 2014.
At December 31, 2014, our borrowings under the PNC revolving facility totaled $0.3 million and borrowings under the PNC term loan were $8.3 million. In addition, we had $6.4 million in outstanding letters of credit.
In April 2013, we signed a loan agreement with the Mississippi Development Authority ("MDA") for draws up to $1.5 million at an interest rate of 2.25% and with a maturity date of February 2021. Draws under the agreement are permitted for purchases of certain equipment at our Tupelo, Mississippi location. We received the final draw in the second quarter of 2014. Fixed principal and interest payments started on the loan in the first quarter of 2014 and as of December 31, 2014 we had an outstanding balance of $1.3 million.
In the U.S., we have $0.3 million outstanding in short term borrowings related to financing some of our insurance premiums and $0.4 million outstanding in long term borrowings related to software financing.
We have various borrowing arrangements at our foreign subsidiaries to support working capital needs and government sponsored borrowings which provide advantageous lending rates.
In Brazil, as of December 31, 2014, we have uncommitted, discretionary line of credit facilities with several local private Brazilian banks (some of which are sponsored by the Brazilian government) for an aggregate maximum of $37.6 million, subject to a borrowing base formula computed on a monthly basis. These credit facilities are secured by a portion of our accounts receivable and inventory balances and expire at various times from January 16, 2015 through July 15, 2023. Since the expiration of the January 16, 2015 credit facility, Brazil has already acquired new credit facilities in 2015. Historically we have been able to enter into replacement facilities when these facilities expire, but such replacements are at the discretion of the banks. Lenders determine, at their discretion, whether to make new advances with respect to each draw on such facilities. There are no restrictive covenants on these credit facilities. In the second quarter of 2014, our Brazilian location was approved for a special term low interest rate loan from a governmental agency: FINEP. This agency provides funding to companies to further innovation and research and development spending in Brazil. Our Brazilian location was approved for a loan in the amount of up to approximately 82.5 million Brazilian Reals to be used on approved research and development projects, provided that our Brazilian location spends up to approximately 35.3 million Reals of its own resources on the financed projects. This loan has a grace period of 36 months, after which it will be repaid on a monthly basis between July 2017 and July 2023. We paid $0.1 million in fees associated with this loan. We received the first installment of the loan in the amount equivalent to $11.0 million during the third quarter of 2014; however, $0.5 million of this amount represents restricted funds for projects not yet commenced. We also placed collateral in the amount of $5.1 million for this loan in a separate bank account. Both the collateral and the restricted funds are recorded as "Restricted cash and cash equivalents" on our Consolidated Balance Sheets. Our borrowings in Brazil at December 31, 2014 totaled $28.8 million, with an additional $19.8 million available for borrowing, based on our accounts receivable, inventory levels and current FINEP financing at that date. In addition, we expect to receive the remaining amount of the FINEP loan in two equal installments during the next two years.
In India, we have an aggregate maximum availability of $12.4 million in line of credit facilities which are secured by land, buildings and equipment, inventories and receivables and are subject to a borrowing base formula computed on a monthly basis. The arrangements expire at various times from February 2015 through March 2015. The acquisition of new credit facilities to replace expired facilities is currently underway. Historically, we have been able to renew these facilities when they expire; however, such renewal is at the discretion of the banks. Our borrowings under these facilities totaled $8.5 million, and
52
based on our borrowing base as of December 31, 2014, we had $3.9 million available for borrowing under these facilities. There are no restrictive covenants on these credit facilities, except that consent must be received from the bank in order to dispose of certain assets located in India.
We also have capital lease agreements with an outstanding balance of $1.1 million which are included in our total borrowings balance at December 31, 2014.
Our consolidated borrowings totaled $49.2 million at December 31, 2014 and $67.2 million at December 31, 2013. Our weighted average interest rate for these borrowings was 9.0% for the twelve months ended December 31, 2014 and 8.1% for the twelve months ended December 31, 2013.
Scheduled maturities of debt and capital lease obligations for each of the five years subsequent to December 31, 2014 are as follows:
(in millions) | |||
2015 | $ | 29.4 | |
2016 | $ | 4.3 | |
2017 | $ | 4.2 | |
2018 | $ | 0.2 | |
2019 | $ | 0.2 | |
Thereafter | $ | 10.9 | |
Total | $ | 49.2 | |
NOTE 9. Stockholders’ Equity
On April 30, 2014, our shareholders approved an amendment to our articles of incorporation reclassifying and converting our Class A Common Stock and Class B Common Stock into a new class of Common Shares with no par value on a one-for-one basis. This recapitalization was completed by filing Amended and Restated Articles of Incorporation with the State of Michigan on April 30, 2014 with an effective date of May 2, 2014. As of May 2, 2014, our Common Shares are traded on the Nasdaq Stock Market under the symbol TECU.
We currently have no expectation to resume payment of dividends.
During 2014, we have granted Restricted Stock Units ("RSUs") as well as non-qualified stock options. See Note 10, "Share-based Compensation" for additional detail regarding the RSUs and stock options.
NOTE 10. Share-Based Compensation Arrangements
Prior to 2011, we granted Stock Appreciation Rights ("SARs") and phantom shares to certain key employees under our Long-Term Incentive Cash Award Plan. As both the SARs and the phantom shares under this plan are settled in cash rather than by issuing equity instruments, we record an expense with a corresponding liability on our Consolidated Balance Sheets. The expense is based on the fair value of the awards on the last day of the reporting period and represents an amortization of that fair value over the vesting period of the awards.
From 2011 to 2013, we awarded performance-based phantom shares to certain key employees to make our equity incentives reflect our performance during the respective calendar year. These performance phantom shares vest one-third each year over a three year period. In 2013, 2012 and 2011, 23,642, 435,866 and zero, respectively, performance-based phantom shares were issued based on our calendar year financial results.
In the first quarter of 2014, our Board of Directors adopted the 2014 Omnibus Incentive Plan, which was approved by our shareholders at our Annual Shareholders Meeting. Under this plan, we may award share-based compensation that does not have to be settled in cash to key employees, directors and third-party service providers. In 2014, we awarded restricted stock units ("RSUs") and non-qualified stock options under our 2014 Omnibus Incentive Plan.
Our liability with regard to our outstanding, cash settled, share-based awards is re-measured in each quarterly reporting period. The fair value of the phantom shares is based on the closing stock price of our Common Shares, or Class A Common Stock prior to May 2, 2014 (see Note 9, "Stockholders' Equity", for further discussion), on the last day of the period. At December 31, 2014 and December 31, 2013, the applicable closing stock price was $3.09 and $9.05, respectively.
53
A summary of activity under the plans during 2014 is as follows:
SARs: | Number of awards | Weighted average exercise price per share | ||||
Outstanding at January 1, 2014 | 52,079 | $ | 11.81 | |||
Granted | — | $ | — | |||
Exercised | — | $ | — | |||
Forfeited | (45,028) | $ | 14.45 | |||
Outstanding at December 31, 2014 | 7,051 | $ | 13.03 | |||
Phantom Shares: * | Number of awards | Weighted average grant date value per share | ||||
Outstanding at January 1, 2014 | 235,942 | $ | 5.98 | |||
Granted | — | $ | — | |||
Vested | (125,244 | ) | $ | 5.05 | ||
Forfeited | (50,990 | ) | $ | 5.30 | ||
Outstanding at December 31, 2014 | 59,708 | $ | 5.61 | |||
* Includes both non-performance and performance based shares. | ||||||
Restricted Stock Units: | Number of awards | Weighted average grant date value per share | ||||
Outstanding at January 1, 2014 | — | $ | — | |||
Granted | 111,168 | $ | 4.74 | |||
Vested | — | $ | — | |||
Forfeited | — | $ | — | |||
Outstanding at December 31, 2014 | 111,168 | $ | 4.74 | |||
Non-Qualified Stock Options: | Number of awards | Weighted average grant date value per share | ||||
Outstanding at January 1, 2014 | — | $ | — | |||
Granted | 275,513 | $ | 3.06 | |||
Exercised | — | $ | — | |||
Forfeited | — | $ | — | |||
Outstanding at December 31, 2014 | 275,513 | $ | 3.06 | |||
The initial value of the phantom shares is based on the closing price of our Class A Common Stock as of the grant date. The initial value of the SARs, which are the economic equivalent of options, is based on a Black-Scholes model as of the grant date.
We measure the fair value of each SAR based on the closing stock price of Common Shares, or Class A Common Stock prior to May 2, 2014 (see Note 9, Stockholders' Equity", for further discussion), on the last day of the period, using a Black-Scholes valuation model. The fair value of each SAR was estimated as of December 31, 2014, 2013 and 2012 using the following assumptions:
2014 | 2013 | 2012 | ||||||
Risk-free interest rate | 0.04%-0.67% | 0.16%-0.78% | 0.27%-0.52% | |||||
Dividend yield | 0.0 | % | 0.0 | % | 0.0 | % | ||
Expected life (years) | 0.2-2.0 years | 1.2-3.0 years | 2.2-4.0 years | |||||
Volatility | 53.58 | % | 62.21 | % | 63.63 | % | ||
Compensation expense (income) related to outstanding share-based compensation awards under the Long-Term Incentive Cash Award Plan for the years ended December 31, 2014, 2013 and 2012 was $(0.7) million, $2.3 million and $2.6 million,
54
respectively. The balance of the fair value that has not yet been recorded as expense is considered an unrecognized liability. The total unrecognized compensation liability with respect to awards under the Long-Term Incentive Cash Award Plan as calculated at December 31, 2014 was immaterial and for December 31, 2013 was $1.7 million. Total cash paid under this plan for the years ended December 31, 2014 and 2013 was $1.0 million and $1.6 million, respectively.
Prior to 2014, we granted deferred stock units ("DSUs") to our non-employee directors under our Outside Directors' Deferred Stock Unit Plan. These awards were fully vested when made. We measure the fair value of outstanding DSUs based upon the closing stock price of our Common Shares, or Class A Common Stock prior to May 2, 2014 (see Note 9, Stockholders' Equity", for further discussion), on the last day of the reporting period. We pay out the DSUs to a director after the earlier of a Company Change in Control, as defined in the plan, or the date when he or she ceases to be a non-employee director for any reason. Since the DSUs are settled in cash rather than by issuing equity instruments, we record an expense with a corresponding liability on our Consolidated Balance Sheets. Total expense (income) related to the DSUs for the years ended December 31, 2014, 2013 and 2012 was $(0.3) million, $0.8 million and $0.5 million, respectively. We recorded a liability of $0.2 million and $1.2 million as of December 31, 2014 and 2013, respectively. Total cash paid for DSUs in the year ended December 31, 2014 and 2013 was $0.7 million and $0.2 million, respectively.
In 2014, we granted restricted stock units ("RSUs") to our non-employee directors and our Chief Executive Officer under our 2014 Omnibus Incentive Plan. These RSUs vest immediately before our 2015 Annual Meeting of Shareholders if the non-employee director or Chief Executive Officer, as applicable, is serving on our Board on that date. The RSUs will be settled 75% in our Common Shares and 25% in cash. For the RSUs settled in our Common Shares, we record an expense and corresponding change in "Paid in Capital" on our Consolidated Balance Sheets, based on the fair value of the RSUs at grant date and recognized over the vesting period. For the year ended December 31, 2014, the expense was $0.3 million. For the RSUs settled in cash, we record an expense with a corresponding liability on our Consolidated Balance Sheets recognized over the vesting period. This liability will be remeasured in each quarterly reporting period, based on the closing price of our Common Shares on the last day of each period. No cash was paid for RSUs in the year ended December 31, 2014.
During fourth quarter 2014, we granted non-qualified stock options under our 2014 Omnibus Incentive Plan to certain executive officers and key employees. The stock options will be settled in our Common Shares and will vest in three equal annual installments beginning December 2015. For the stock options settled in our Common Shares, we record an expense and corresponding change in "Paid in Capital" on our Consolidated Balance Sheets. For the year ended December 31, 2014, the expense was immaterial. The value of each stock option is based on a Black-Scholes valuation model as of December 31, 2014 using the following assumptions:
December 31, 2014 | ||
Risk-free interest rate | 1.90 | % |
Dividend yield | 0.0 | % |
Expected life (years) | 6.0 | |
Volatility | 50.40 | % |
NOTE 11. Impairments, Restructuring Charges and Other Items
The charges (gains) recorded as impairments, restructuring charges, and other items are as follows:
For the years ended December 31, | |||||||||||
(in millions) | 2014 | 2013 | 2012 | ||||||||
Severance, restructuring costs, and special termination benefits | $ | 4.0 | $ | 9.9 | $ | 3.8 | |||||
Business process re-engineering | 1.8 | 2.7 | — | ||||||||
Environmental reserve for sold building | 1.5 | 0.2 | 0.6 | ||||||||
Curtailment and settlement gain on postretirement benefits | — | — | (45.0 | ) | |||||||
Refund of settlement notice and administrative costs | — | — | (0.1 | ) | |||||||
Moving costs | — | 0.5 | 0.1 | ||||||||
Contingent legal liability and settlements | 1.5 | 0.3 | — | ||||||||
Total impairments, restructuring charges, and other items | $ | 8.8 | $ | 13.6 | $ | (40.6 | ) | ||||
55
2014
Severance expense in 2014 was associated with a reduction in force at our Brazilian ($3.3 million), French ($0.6 million) and Indian ($0.1 million) locations. See Note 16, "Commitments and Contingencies - Litigation - Compressor industry antitrust investigation" and "Environmental matters" for a description of a litigation settlement and additional environmental remediation accruals.
2013
Severance expense in 2013 was associated with a reduction in force at our French ($7.8 million), Brazilian ($1.3 million), Indian ($0.5 million) and Corporate ($0.3 million) locations.
2012
Severance expense in 2012 was associated with a reduction in force at our Brazilian ($2.6 million), French ($0.6 million), North American ($0.3 million) and Corporate ($0.3 million) locations. For additional information regarding the "Curtailment and settlement gain" on postretirement benefits see Note 5, "Pension and Other Postretirement Benefit Plans". For additional information on "Refund of settlement notice and administrative costs" see Note 16, "Commitments and Contingencies".
The following table reconciles activities for the years ended December 31, 2014 and 2013 for accrued impairments, restructuring charges and other items:
(in millions) | Severance | Other | Total | |||||||||
Balance at January 1, 2013 | $ | 0.1 | $ | 1.5 | $ | 1.6 | ||||||
Accruals | 9.9 | 3.7 | 13.6 | |||||||||
Payments | (4.5 | ) | (3.5 | ) | (8.0 | ) | ||||||
Balance at December 31, 2013 | $ | 5.5 | $ | 1.7 | $ | 7.2 | ||||||
Accruals | 4.0 | 4.8 | 8.8 | |||||||||
Payments | (7.7 | ) | (3.7 | ) | (11.4 | ) | ||||||
Balance at December 31, 2014 | $ | 1.8 | $ | 2.8 | $ | 4.6 | ||||||
The accrued balance at December 31, 2014 for "Severance" mainly includes payments to be made related to our European reduction in force and is expected to be settled in the next 9 months. The accrued "Other" balance at December 31, 2014, includes $1.6 million for the estimated costs associated with remediation activities at our former Tecumseh, Michigan facility, which is expected to be paid over the next 6 months, $1.0 million for a legal settlement related to one of the anti-trust litigations (see Note 16, "Commitments and Contingencies - Legal", for further discussion) and $0.2 million related to the reserve for our former corporate office which will be paid through December 2015.
NOTE 12. Income Taxes
Consolidated income (loss) from continuing operations before taxes consists of the following:
(in millions) | 2014 | 2013 | 2012 | ||||||||
U.S. | $ | (9.7 | ) | $ | 0.8 | $ | 45.5 | ||||
Foreign | (18.1 | ) | (27.5 | ) | (32.6 | ) | |||||
Consolidated (loss) income from continuing operations before tax | $ | (27.8 | ) | $ | (26.7 | ) | $ | 12.9 | |||
56
Provision for (benefit from) income taxes from continuing operations consists of the following:
(in millions) | 2014 | 2013 | 2012 | ||||||||
Current: | |||||||||||
U.S. federal | $ | — | $ | — | $ | (4.6 | ) | ||||
State and local | — | — | (0.1 | ) | |||||||
Foreign income and withholding taxes | 0.6 | 0.6 | (0.6 | ) | |||||||
Total current: | 0.6 | 0.6 | (5.3 | ) | |||||||
Deferred: | |||||||||||
U.S. federal | — | 7.7 | (4.8 | ) | |||||||
State and local | — | — | — | ||||||||
Foreign | (0.1 | ) | (0.6 | ) | (0.1 | ) | |||||
Total deferred: | (0.1 | ) | 7.1 | (4.9 | ) | ||||||
Provision for (benefit from) income taxes from continuing operations | $ | 0.5 | $ | 7.7 | $ | (10.2 | ) | ||||
A reconciliation between the actual income tax expense (benefit) and the income tax expense (benefit) computed by applying the statutory federal income tax rate of 35% to income before tax is as follows:
(in millions) | 2014 | 2013 | 2012 | ||||||||
Income taxes expense (benefit) at U.S. statutory rate | $ | (9.7 | ) | $ | (9.3 | ) | $ | 4.5 | |||
State and local income taxes, net of federal benefit | — | — | (0.1 | ) | |||||||
Foreign tax rate differential | (0.1 | ) | 0.2 | 0.2 | |||||||
Valuation allowances | 11.0 | (2.1 | ) | (88.7 | ) | ||||||
Tax attribute expiration | — | 9.1 | 68.5 | ||||||||
Intra-period allocation | (0.1 | ) | 7.1 | (4.8 | ) | ||||||
Release of uncertain tax positions | — | — | (4.5 | ) | |||||||
Tax refunds | — | (0.4 | ) | (1.0 | ) | ||||||
Deemed foreign dividend | — | — | 15.7 | ||||||||
Deferred tax adjustments | (0.1 | ) | 4.0 | — | |||||||
Transfer pricing | — | 2.2 | — | ||||||||
Tax exempt income | (2.8 | ) | (5.8 | ) | — | ||||||
Non-deductible expense | 2.4 | 1.9 | — | ||||||||
Other items, net | (0.1 | ) | 0.8 | — | |||||||
Income tax expense (benefit) at effective worldwide tax rates | $ | 0.5 | $ | 7.7 | $ | (10.2 | ) | ||||
Deferred income taxes reflect the effect of temporary differences between the tax basis of an asset or liability and its reported amount in the financial statements. Provisions are also made for estimated taxes which may be incurred on the remittance of subsidiaries’ undistributed earnings, none of which are deemed to be permanently reinvested.
57
Significant components of our deferred tax assets and liabilities as of December 31, were as follows:
(in millions) | 2014 | 2013 | |||||
Deferred tax assets: | |||||||
Other postretirement liabilities | $ | 9.4 | $ | 6.3 | |||
Product warranty and self-insured risks | 0.4 | 0.3 | |||||
Tax carry forwards | 292.3 | 292.9 | |||||
Other accruals and miscellaneous | 22.1 | 22.6 | |||||
Subtotal | 324.2 | 322.1 | |||||
Valuation allowance | (313.5 | ) | (305.2 | ) | |||
Total deferred tax assets | 10.7 | 16.9 | |||||
Deferred tax liabilities: | |||||||
Property, plant & equipment | 5.9 | 7.8 | |||||
Pension | — | — | |||||
Unrealized gains on securities | 2.9 | 6.4 | |||||
Other | 1.8 | 2.6 | |||||
Total deferred tax liabilities | 10.6 | 16.8 | |||||
Net deferred tax assets | $ | 0.1 | $ | 0.1 | |||
Deferred tax details included in the Consolidated Balance Sheets at December 31, are as follows:
(in millions) | 2014 | 2013 | |||||
Deferred tax assets: | |||||||
Deferred tax assets - Short term | $ | 0.5 | $ | 0.8 | |||
Deferred tax assets - Long Term | 1.0 | 1.1 | |||||
Total deferred tax assets | 1.5 | 1.9 | |||||
Deferred tax liabilities*: | |||||||
Deferred tax liabilities - Short Term | 1.0 | 1.1 | |||||
Deferred tax liabilities - Long Term | 0.4 | 0.7 | |||||
Total deferred tax liabilities | 1.4 | 1.8 | |||||
Net deferred tax (liabilities) assets | $ | 0.1 | $ | 0.1 | |||
*Deferred tax liabilities are included in Other liabilities within the balance sheet.
At December 31, 2014, we had the following tax carry forwards:
(in millions) | Amounts | Expiration | |||
U.S. Federal Net Operating Loss | $ | 184.1 | 2027-2034 | ||
U.S. State Net Operating Loss | 17.3 | 2016-2034 | |||
Foreign Net Operating Losses | 53.5 | Unlimited | |||
U.S. Tax Credits | 37.1 | 2015-2031 | |||
U.S. Alternative Minimum Tax Credit | 0.3 | Unlimited | |||
Total operating loss and tax credit carry forwards | $ | 292.3 | |||
Income taxes are allocated between continuing operations, discontinued operations and other comprehensive income because all items, including discontinued operations, should be considered for purposes of determining the amount of tax benefit that results from a loss from continuing operations and that could be allocated to continuing operations. We apply this concept by tax jurisdiction, and in periods in which there is a pre-tax loss from continuing operations and pre-tax income in another category, such as discontinued operations or other comprehensive income, the tax benefit allocated to continuing operations is determined by taking into account the pre-tax income of other categories.
Deferred income tax assets are evaluated quarterly to determine if valuation allowances are required or should be adjusted. All available evidence, both positive and negative using a more likely than not standard, is considered to determine if valuation allowances should be established against deferred tax assets. This assessment considers, among other matters, the nature, frequency and severity of recent losses, forecasts of future profitability, the duration of statutory carry forward periods,
58
previous experience with tax attributes expiring unused and tax planning alternatives. In making such judgments, significant weight is given to evidence that can be objectively verified. A significant piece of objective negative evidence evaluated was the cumulative loss incurred over the three-year period ended December 31, 2014. This objective negative evidence limits the ability to consider other subjective evidence such as our projections for future growth.
Based on this assessment, full valuation allowances have been recorded against our net deferred tax assets for all tax jurisdictions in which we believe it is more likely than not that the deferred taxes will not be realized. Full valuation allowances were recorded for all of our tax jurisdictions except for Mexico and Malaysia. The amount of the deferred tax assets considered realizable, however, could be adjusted if estimates of future taxable income during the carry forward period are reduced or if objective negative evidence in the form of cumulative losses is no longer present and additional weight may be given to subjective evidence such as our projections for growth.
At December 31, 2014 and 2013 we did not have any unrecognized tax benefits.
We accrue interest and penalties related to unrecognized tax benefits in our provision for income taxes. At December 31, 2014 and 2013, we had no accrued interest and penalties.
We file U.S., state and foreign income tax returns in jurisdictions with varying statues of limitations. We have open tax years from 2007 to 2013 with various significant taxing jurisdictions including Canada, France and Brazil. In the U.S., our federal income tax returns through 2005 have been examined by the Internal Revenue Service and we have open tax years from 2010 to 2013.
Management is not aware of any uncertain tax positions taken or expected to be taken that would require recognition of a liability or asset for disclosure in the financial statements.
NOTE 13. Fair Value Measurements
We use fair value measurements to record fair value adjustments to certain assets and liabilities and to determine fair value disclosure. We categorize assets and liabilities at fair value in three levels, based on the markets in which the assets and liabilities are traded and the reliability of the assumptions used to determine fair value. These levels are as follows:
Level 1 Valuation is based upon quoted prices for identical instruments traded in active markets.
Level 2 | Valuation is based upon quoted prices for similar instruments in active markets, quoted prices for identical or similar instruments in markets that are not active, and model-based valuation techniques for which all significant assumptions are observable in the market. |
Level 3 | Valuation is generated from model-based techniques that use at least one significant assumption not observable in the market. These unobservable assumptions reflect estimates of assumptions that market participants would use in pricing the asset or liability. |
Except for derivative instruments, pension liabilities and pension plan assets, the Company has no financial assets and liabilities that are carried at fair value at December 31, 2014 and 2013. The carrying amounts of financial instruments comprising cash and cash equivalents, and accounts receivable approximate their fair values due to their short-term nature. The carrying value of the Company’s long-term debt approximates its fair value because interest charged on the loan balance is variable. See Note 8, “Debt”, for a description of Company’s debt and corresponding rates of interest. See Note 5, “Pension and Other Postretirement Benefit Plans”, regarding the fair value of pension liabilities and pension plan assets. See Note 14, “Derivative Instruments and Hedging Activities”, regarding the fair value of derivative instruments and hedging activities.
Certain Company assets are required to be recorded at fair value on a non-recurring basis when events and circumstances indicate that the carrying value may not be recoverable. As of December 31, 2014 and 2013, the Company did not have any assets at fair value on a non-recurring basis.
The following is a description of valuation methodologies used for our assets and liabilities recorded at fair value.
Foreign currency and commodity derivative contracts
Derivative instruments recognized on our Consolidated Balance Sheets consist of foreign currency forward exchange contracts, commodity futures contracts and interest rate swaps. These contracts are recognized at the estimated amount at which they could be settled based on market observable inputs, such as forward market exchange rates and are recorded on our
59
Consolidated Balance Sheets as part of current assets and liabilities under the heading “Fair value of derivatives.” We classify our derivative instruments as Level 2.
The following table presents the amounts recorded on our balance sheet for assets and liabilities measured at fair value on a recurring basis as of December 31, 2014.
(in millions) | Total Fair Value | Level 1 | Level 2 | Level 3 | |||||||||||
Assets: | |||||||||||||||
Foreign currency derivatives | 0.4 | — | 0.4 | — | |||||||||||
Balance as of December 31, 2014 | $ | 0.4 | $ | — | $ | 0.4 | $ | — | |||||||
Liabilities: | |||||||||||||||
Commodity futures contracts | (0.7 | ) | — | (0.7 | ) | — | |||||||||
Foreign currency derivatives | (1.1 | ) | — | (1.1 | ) | — | |||||||||
Balance as of December 31, 2014 | $ | (1.8 | ) | $ | — | $ | (1.8 | ) | $ | — | |||||
The following table presents the amounts recorded on our balance sheet for assets and liabilities measured at fair value on a recurring basis as of December 31, 2013.
(in millions) | Total Fair Value | Level 1 | Level 2 | Level 3 | |||||||||||
Assets: | |||||||||||||||
Commodity futures contracts | $ | 0.6 | $ | — | $ | 0.6 | $ | — | |||||||
Balance as of December 31, 2013 | 0.6 | — | 0.6 | — | |||||||||||
Liabilities: | |||||||||||||||
Foreign currency derivatives | (1.6 | ) | — | (1.6 | ) | — | |||||||||
Balance as of December 31, 2013 | $ | (1.6 | ) | $ | — | $ | (1.6 | ) | $ | — | |||||
NOTE 14. Derivative Instruments and Hedging Activities
We are exposed to foreign currency exchange rate risk arising from transactions in the normal course of business, such as sales to foreign customers not denominated in the seller’s functional currency, foreign operations, and purchases from foreign suppliers. We actively manage the exposure of our foreign currency exchange rate market risk, market fluctuations in commodity prices and interest rate risk associated with our U.S. variable rate borrowings by entering into various hedging instruments, authorized under our policies that place controls on these activities, with counterparties that are highly rated financial institutions. We are exposed to credit-related losses in the event of non-performance by these counterparties; however, our exposure is generally limited to the unrealized gains in our contracts should any of the counterparties fail to perform as contracted.
Our hedging activities primarily involve use of foreign currency forward exchange contracts, commodity derivatives contracts and, starting in 2014, interest rate swap contracts. These contracts are designated as cash flow hedges at the inception of the contract. We use derivative instruments only in an attempt to limit underlying exposure from foreign currency exchange rate fluctuations, commodity price fluctuations and variable interest rate fluctuations to minimize earnings and cash flow volatility associated with these risks. Decisions on whether to use such contracts are made based on the amount of exposure to the currency or commodity involved and an assessment of the near-term market value for each risk. Our policy is not to allow the use of derivatives for trading or speculative purposes. Our primary foreign currency exchange rate exposures are with the Brazilian Real, the Euro, and the Indian Rupee, against the U.S. Dollar. Our primary commodity risk is the price risk associated with forecasted purchases of materials used in our manufacturing process. Our primary variable interest rate exposure is with the PNC term loan.
We assess the effectiveness of our futures and forwards contracts using the dollar offset method and de-designate the derivative if it is determined that the derivative will no longer be highly effective at offsetting the cash flows of the hedged item. At the time a derivative is de-designated, any losses recorded in other comprehensive income are recognized in our Consolidated Statements of Operations while gains remain in AOCI on our Consolidated Balance Sheets until the original forecasted cash flows occur. All subsequent gains and losses related to the de-designated derivatives are recognized in our Consolidated Statements of Operations.
The notional amount outstanding of derivative commodity and currency contracts designated as cash flow hedges was $23.6 million and $21.9 million at December 31, 2014 and 2013, respectively. The notional amount outstanding of de-designated
60
derivative contracts was $6.5 million and $12.6 million at December 31, 2014 and December 31, 2013, respectively. The notional amount of the interest rate swaps at December 31, 2014, all of which were designated as cash flow hedges, was $8.3 million. We had no interest rate swaps outstanding at December 31, 2013.
We recognized $1.1 million and $5.5 million of losses associated with the derivative contracts that have been de-designated during the years ended December 31, 2014 and December 31, 2013, respectively. We had gains of $0.1 million in “Other comprehensive income” at both December 31, 2014 and December 31, 2013, for derivative contracts that have been de-designated. These gains will be recognized as the forecasted cash flows occur.
The following table presents the fair value of our derivatives designated as hedging instruments in our Consolidated Balance Sheets as of December 31, 2014 and 2013:
Asset (Liability) Derivatives | |||||||||||
December 31, 2014 | December 31, 2013 | ||||||||||
(in millions) | Financial Position Location | Fair Value | Financial Position Location | Fair Value | |||||||
Commodity derivatives contracts | Fair value of derivative asset | $ | — | Fair value of derivative asset | $ | 0.3 | |||||
Commodity derivatives contracts | Fair value of derivative liability | (0.5 | ) | Fair value of derivative liability | — | ||||||
Foreign currency derivatives | Fair value of derivative asset | 0.4 | Fair value of derivative asset | — | |||||||
Foreign currency derivatives | Fair value of derivative liability | (0.7 | ) | Fair value of derivative liability | (1.1 | ) | |||||
Total | $ | (0.8 | ) | $ | (0.8 | ) | |||||
The following table presents the fair value of our derivatives that have been de-designated as hedging instruments in our Consolidated Balance Sheets as of December 31, 2014 and 2013:
Asset (Liability) Derivatives | |||||||||||
December 31, 2014 | December 31, 2013 | ||||||||||
(in millions) | Financial Position Location | Fair Value | Financial Position Location | Fair Value | |||||||
Commodity derivatives contracts | Fair value of derivative asset | $ | — | Fair value of derivative asset | $ | 0.3 | |||||
Commodity derivatives contracts | Fair value of derivative liability | (0.2 | ) | Fair value of derivative liability | — | ||||||
Foreign currency derivatives | Fair value of derivative liability | (0.4 | ) | Fair value of derivative liability | (0.5 | ) | |||||
Total | $ | (0.6 | ) | $ | (0.2 | ) | |||||
The following table presents the impact of derivatives designated as hedging instruments on our Consolidated Statements of Operations and AOCI for our derivatives designated as cash flow hedging instruments for the years ended December 31, 2014, 2013 and 2012.
(in millions) | Amount of Gain (Loss) Recognized in AOCI (Effective Portion) | Location of Gain (Loss) Reclassified from AOCI into Income (Effective Portion) | Amount of Gain (Loss) Reclassified from AOCI into Income (Effective Portion) | Location of Gain (Loss) Recognized in Income (Ineffective Portion) | Amount of Gain (Loss) Recognized in Income (Ineffective Portion) | ||||||||||||||||||||||||||||||
Years Ended December 31, | Years Ended December 31, | Years Ended December 31, | |||||||||||||||||||||||||||||||||
2014 | 2013 | 2012 | 2014 | 2013 | 2012 | 2014 | 2013 | 2012 | |||||||||||||||||||||||||||
Commodity | $ | (0.4 | ) | $ | 0.3 | $ | 1.3 | Cost of Sales | $ | 0.4 | $ | 0.2 | $ | (2.2 | ) | Cost of Sales | $ | — | $ | — | $ | — | |||||||||||||
Currency | 0.3 | (1.5 | ) | 1.1 | Cost of Sales | (0.4 | ) | (1.0 | ) | (11.3 | ) | Cost of Sales | — | — | — | ||||||||||||||||||||
Total | $ | (0.1 | ) | $ | (1.2 | ) | $ | 2.4 | $ | — | $ | (0.8 | ) | $ | (13.5 | ) | $ | — | $ | — | $ | — | |||||||||||||
As of December 31, 2014, we estimate that we will reclassify into earnings during the next twelve months approximately $0.7 million of losses from the pretax amount recorded in AOCI as the anticipated cash flows occur. In addition, decreases in spot prices below our hedged prices may require us to post cash collateral with our hedge counterparties. At December 31, 2014
61
and 2013, we were required to post $0.6 million and $0.8 million, respectively, of cash collateral on our hedges, which is recorded in “Restricted cash and cash equivalents” in our Consolidated Balance Sheets.
NOTE 15. Reclassifications Out of Accumulated Other Comprehensive Income
The following table presents the amounts reclassified out of AOCI for the years ended December 31:
2014 | 2013 | 2012 | |||||||||
Pension and postretirement benefits: | |||||||||||
Amortization of prior service credit, net of tax | $ | 0.2 | $ | 7.1 | $ | 3.9 | |||||
Amortization of net actuarial gain, net of tax | 11.8 | 30.0 | 6.1 | ||||||||
Reclassification of prior service credit and net actuarial gain due to curtailment, net of tax | — | — | 44.1 | ||||||||
Total reclassification, net of tax - pension and postretirement benefits | $ | 12.0 | $ | 37.1 | $ | 54.1 | |||||
Cash flow hedges: | |||||||||||
Reclassification adjustment for gain, net of tax - commodities | $ | 0.1 | $ | 0.4 | $ | 1.9 | |||||
Reclassification adjustment for (loss) gain, net of tax - currency | (0.3 | ) | (1.2 | ) | 8.4 | ||||||
Total reclassification, net of tax - cash flow hedges | $ | (0.2 | ) | $ | (0.8 | ) | $ | 10.3 | |||
Total reclassification, net of tax | $ | 11.8 | $ | 36.3 | $ | 64.4 | |||||
Gains and losses on our currency derivatives that are reclassified out of AOCI are recognized as part of "Cost of sales" on our Consolidated Statements of Operations in their entirety.
Gains and losses on our commodity derivatives that are reclassified out of AOCI are partially recognized as part of "Cost of sales" on our Consolidated Statement of Operations and partially capitalized as part of "Inventories" on our Consolidated Balance Sheets. (See Note 14, "Derivative Instruments and Hedging Activities" for additional information.)
Gains and losses on amortization of prior service credit and net actuarial gain that are reclassified out of AOCI are recognized partially as a part of "Cost of sales" and "Other income" on our Consolidated Statements of Operations and partially capitalized as part of "Inventories" on our Consolidated Balance Sheets. (See Note 5, "Pension and Other Postretirement Benefit Plans" for additional information.)
NOTE 16. Commitments and Contingencies
Operating leases
Future minimum lease payments under non-cancelable operating leases amounted to $10.4 million at December 31, 2014 as follows:
Years ending December 31, | (in millions) | ||
2015 | $ | 3.9 | |
2016 | $ | 1.5 | |
2017 | $ | 1.3 | |
2018 | $ | 1.2 | |
2019 | $ | 1.2 | |
Thereafter | $ | 1.3 | |
Aggregate rental expense for operating leases was $4.7 million, $5.2 million, and $7.9 million for the fiscal years ended December 31, 2014, 2013, and 2012, respectively.
Purchase Commitments
As of December 31, 2014, 2013 and 2012, we had $19.2 million, $22.0 million and $24.8 million respectively of non-cancelable purchase commitments with suppliers for materials and supplies in the normal course of business.
62
Commitments to Former Chief Executive Officer
On June 27, 2014, we entered into a General Release of All Claims with our former Chief Executive Officer ("CEO") in connection with the termination of his employment. We agreed to (i) the payment of $835,000 over 20 months and (ii) continuation of his medical, dental and vision insurance until the earlier of the date he becomes a full-time employee of a third party and 18 months after the date of the General Release of All Claims. The former CEO agreed to release us from claims, rights and liabilities, including his previously vested stock appreciation rights and his previously unvested performance-based phantom shares. This expense is included in "Selling and administrative expenses" on our Consolidated Statements of Operations.
Accounts Receivable
A portion of accounts receivable at our Brazilian subsidiary are sold with limited recourse at a discount, which creates a contingent liability for the business. Discounted receivables sold with limited recourse were $3.7 million and $12.1 million at December 31, 2014 and 2013, respectively, and our weighted average interest rate for these receivables was 8.5% and 5.9% for the twelve months ended December 31, 2014 and 2013, respectively. Under our factoring program in Europe, we may discount receivables with recourse; however, at December 31, 2014 and 2013, there were no receivables sold with recourse.
Letters of credit
We issue letters of credit in the normal course of business as required by some vendor contracts and insurance policies. As of December 31, 2014 and 2013, we had $6.4 million and $3.2 million, respectively, in outstanding letters of credit in the U.S. Outside the U.S. we had $16.2 million and $7.9 million outstanding letters of credit at December 31, 2014 and 2013, respectively.
63
Litigation
General
We are party to litigation in the ordinary course of business. Litigation occasionally involves claims for punitive as well as compensatory damages arising out of use of our products. Although we are self-insured to some extent, we maintain insurance against certain product liability losses. We are also subject to administrative proceedings with respect to claims involving the discharge of hazardous substances into the environment. Some of these claims assert damages and liability for remedial investigation and clean-up costs. We are also typically involved in commercial and employee disputes in the ordinary course of business. Although their ultimate outcome cannot be predicted with certainty, and some may be disposed of unfavorably to us, management considers that appropriate reserves have been established and, except as described below, does not believe that the disposition of these matters will have a material adverse effect on our consolidated financial position, cash flows or results of operations. With the exception of the settlement of the working capital adjustment made with the purchaser of our former Engine & Power Train business segment, our reserves for contingent liabilities have not historically differed materially from estimates upon their final outcomes. However, discovery of new facts, developments in litigation, or settlement negotiations could cause estimates to differ materially from current expectations in the future. Except as disclosed below, we do not believe we have any pending loss contingencies that are probable or reasonably possible of having a material impact to our consolidated financial position, results of operations or cash flows.
Canadian Horsepower label litigation
On March 19, 2010, Robert Foster and Murray Davenport filed a lawsuit under the Class Proceedings Act in the Ontario Superior Court of Justice against us and several other defendants (including Sears Canada Inc., Sears Holdings Corporation, John Deere Limited, Platinum Equity, LLC, Briggs & Stratton Corporation, Kawasaki Motors Corp., USA, MTD Products Inc., The Toro Company, American Honda Motor Co., Electrolux Home Products, Inc., Husqvarna Consumer Outdoor Products N.A., Inc. and Kohler Co.), alleging that defendants conspired to fix prices of lawn mowers and lawn mower engines in Canada, to lessen competition in lawn mowers and lawn mower engines in Canada, and to mislabel the horsepower of lawn mower engines and lawn mowers in violation of the Canadian Competition Act, civil conspiracy prohibitions and the Consumer Packaging and Labeling Act. Plaintiffs seek to represent a class of all persons in Canada who purchased, for their own use and not for resale, a lawn mower containing a gas combustible engine of 30 horsepower or less provided that either the lawn mower or the engine contained within the lawn mower was manufactured and/or sold by a defendant or their predecessors between January 1, 1994 and the date of judgment. Plaintiffs seek undetermined money damages, punitive damages, interest, costs and equitable relief. In addition, Snowstorm Acquisition Corporation and Platinum Equity, LLC, the purchasers of Tecumseh Power Company and its subsidiaries and Motoco a.s. in November 2007, have notified us that they claim indemnification with respect to this lawsuit under our Stock Purchase Agreement with them.
A settlement involving all but three of the defendants (Kawasaki, American Honda and Tecumseh) has been negotiated and approved by the court. It is not binding on the non-settling defendants, nor is it determinative of their liability, if any.
At this time, we do not have a reasonable estimate of the amount of our ultimate liability, if any, or the amount of any potential future settlement, but the amount could be material to our financial position, consolidated results of operations and cash flows.
On May 3, 2010, a class action was commenced in the Superior Court of the Province of Quebec by Eric Liverman and Sidney Vadish against us and several other defendants (including those listed above) advancing allegations similar to those outlined immediately above. Plaintiffs seek undetermined monetary damages, punitive damages, interest, costs, and equitable relief. As stated above, Snowstorm Acquisition Corporation and Platinum Equity, LLC, the purchasers of Tecumseh Power Company and its subsidiaries and Motoco a.s. in November 2007, have notified us that they claim indemnification with respect to this lawsuit under our Stock Purchase Agreement with them.
As was the case with the Ontario litigation described above, a settlement involving all but three of the defendants (Kawasaki, American Honda and Tecumseh) has been negotiated and approved by the court. It is not binding on the non-settling defendants, nor is it determinative of their liability, if any.
At this time, we do not have a reasonable estimate of the amount of our ultimate liability, if any, or the amount of any potential future settlement, but the amount could be material to our financial position, consolidated results of operations and cash flows.
Compressor industry antitrust investigation
On February 17, 2009, we received a subpoena from the United States Department of Justice Antitrust Division (“DOJ”) and a formal request for information from the Secretariat of Economic Law of the Ministry of Justice of Brazil (“SDE”) related to investigations by these authorities into possible anti-competitive pricing arrangements among certain manufacturers in the compressor industry. The European Commission began an investigation of the industry on the same day.
We have entered into a conditional amnesty agreement with the DOJ under the Antitrust Division's Corporate Leniency Policy. Pursuant to the agreement, the DOJ has agreed to not bring any criminal prosecution or impose any monetary fines with
64
respect to the investigation against us as long as we, among other things, continue our full cooperation in the investigation. We have received similar conditional immunity from the European Commission and the SDE, and have received or requested immunity or leniency from competition authorities in other jurisdictions. On December 7, 2011, the European Commission announced it had reached a cartel settlement under which certain of our competitors received fines for the conduct investigated. As a result of our conditional immunity, we were not assessed any fine.
While we have taken steps to avoid fines, penalties and other sanctions as the result of proceedings brought by regulatory authorities, the amnesty grants do not extend to civil actions brought by private plaintiffs. The public disclosure of these investigations has resulted in class action lawsuits filed in Canada and numerous class action lawsuits filed in the United States, including by both direct and indirect purchaser groups. In Canada, the class actions are still in a preliminary stage. All of the U.S. actions have been transferred to the U.S. District Court for the Eastern District of Michigan for coordinated or consolidated pretrial proceedings under Multidistrict Litigation (“MDL”) procedures.
Persons who engage in price-fixing in violation of U.S. antitrust law generally are jointly and severally liable to private claimants for three times the actual damages caused by the joint conduct. As a conditional amnesty recipient, however, our civil liability will be limited pursuant to the Antitrust Criminal Penalty Enhancement and Reform Act of 2004, as amended
(“ACPERA”). As long as we continue to cooperate with the civil claimants and comply with the requirements of ACPERA, we will be liable only for actual, as opposed to treble, damages and will not be jointly and severally liable for claims against other participants in the alleged anticompetitive conduct being investigated.
As previously reported, Tecumseh Products Company, Tecumseh Compressor Company, Tecumseh do Brasil, Ltda, and Tecumseh do Brasil U.S.A. LLC entered into a settlement agreement with the direct purchaser plaintiffs in the U.S. actions on June 24, 2010 to resolve claims in the action in order to avoid the costs and distraction of this ongoing class action litigation.
On June 13, 2011, the Court issued an order denying without prejudice a motion for preliminary approval of our proposed settlement with the direct purchaser plaintiffs because the time frame and products covered by the proposed settlement class were inconsistent with the Court's rulings of the same date granting, in part, a motion by the other defendants to dismiss claims by the direct purchaser plaintiffs.
The direct purchaser plaintiffs subsequently filed a Second Amended Master Complaint to reflect the court's rulings on the motion to dismiss which allowed them to cover fractional compressors, or compressors of less than one horsepower, used for refrigeration purposes (but excluding those used for air conditioning) purchased from February 25, 2005 to December 31, 2008 (the "Covered Products").
On October 15, 2012, we entered into a settlement agreement with the direct purchaser plaintiffs (the "Settlement Agreement"). The Settlement Agreement was made by and between us and our subsidiaries and affiliates, and plaintiffs, both individually and on behalf of a class of persons who purchased the Covered Products in the United States, its territories and possessions, directly from a defendant. Under the terms of the Settlement Agreement, in exchange for plaintiffs' full release of all U.S. direct purchaser claims against us relating to refrigeration compressors, we agreed to pay a settlement amount of $7.0 million and, in addition, agreed to pay up to $150,000 for notice and administrative costs associated with administering the settlement. These costs were recorded as an expense in the second quarter ended June 30, 2010 (and paid in the third quarter of 2010) in the line item captioned "Impairments, restructuring charges, and other items" on our Consolidated Statements of Operations. On June 16, 2014, the court issued an order granting final approval of the Settlement Agreement between Tecumseh and the direct purchaser plaintiffs. The court also issued a Final Judgment dismissing all direct purchaser actions against Tecumseh and several other defendants.
We entered into a Settlement Agreement on March 21, 2014 with the named indirect purchaser plaintiffs pursuant to which these plaintiffs agreed to enter a Stipulated Order of Dismissal with Prejudice and Without Costs that dismisses all claims and causes of action alleged in their third consolidated amended complaint. Our share of the settlement was $250,000. The court entered this order on April 9, 2014.
On March 12, 2012, a proceeding was commenced by Electrolux do Brasil S.A., in the Civil Division of the State District Court in São Paulo, Brazil, against Tecumseh Do Brasil Ltda. and two other defendants controlled by Whirlpool, jointly and severally. The complaint alleges that Electrolux suffered damages from over pricing due to the activities of a cartel of which we and Whirlpool were members. The complaint states that the amount in controversy is Brazilian Real 1,000,000. However, Electrolux would be entitled to recover any damages it is able to prove in the proceeding, in the event that they exceed this amount. We timely filed opposition to this claim. We intend to continue to vigorously contest the claim.
On March 20, 2013, a proceeding was commenced by Electrolux Home Products Corporation N.V. in the Regional Court of Kiel, Germany against Tecumseh Europe S.A. and several other defendants, jointly and severally. The claim alleges total estimated damages of approximately €63.0 million based on 15% of Electrolux's total purchases in Europe of the relevant compressors, the vast majority of which were purchased from a competitor. We filed our initial response to the claim on
65
August 30, 2013. On August 22, 2013, the District Court of Kiel decided to stay the case until the Court of Justice of the European Union issues a decision in another case regarding jurisdictional issues that are also raised in this case. On March 20, 2014, we entered into a Settlement Agreement with AB Electrolux and its affiliates (“Electrolux”) pursuant to which Electrolux agreed to release us from all antitrust claims worldwide except those currently pending in the Brazil case described above and except for Electrolux's share of any direct purchaser settlement payments pursuant to the settlement described above. We agreed to pay Electrolux US$1.5 million over three years in connection with this settlement agreement.
On December 18, 2013, BSH Boschund Siemens Hausgerate GMBH ("Bosch") sent the company a letter in which it threatened to initiate court proceedings in Germany against Tecumseh unless Tecumseh pays Bosch damages for alleged overcharges relating to its purchases of compressors. A complaint was filed by Bosch in the Regional Court of Munich I on August 25, 2014 against us and several other defendants (including Embraco Europe S.r.l., Whirlpool S.A. and Panasonic Corporation). We intend to vigorously contest the claim. Danfoss (one of the other participants in the conduct) pre-empted Bosch’s claim in Munich by filing a declarative claim against Bosch in Denmark, to which Bosch has filed a counterclaim for damages. In connection with this proceeding in Denmark, Danfoss has filed a contribution claim in Denmark against Tecumseh as well as a claim for damages in France against Tecumseh Europe. In addition, Embraco has issued third party notices to Tecumseh for a contribution claim in connection with the Embraco claims.
Products Liability/ Warranty Claim
On July 31, 2014, Tecumseh Europe S.A. was served a writ (on the merits) before the Commercial court of La Roche-sur-Yon by the five companies of the Atlantic Industrie SAS group. The dispute alleges product failures associated with the supply by Tecumseh Europe of evaporating units mounted on Atlantic's thermodynamic water heaters pursuant to a November 2009 purchase agreement. The writ seeks the payment of 16,715,109 Euros as damages alleging our failure to satisfy our obligation of information, hidden defects, lack of conformity and breach of the purchase agreement. We have informed our insurance company about this dispute. Under our insurance policy, we are responsible for the first 60,000 Euros, with our insurance covering up to the next 3.5 million Euros. Our insurance company has assumed the defense of this claim, subject to a reservation of rights. See Note 7, "Warranties" for additional detail regarding the accrual related to this issue. We intend to vigorously contest Atlantic's claim.
Due to the uncertainty of our liability in the "Litigation" issues discussed above, or other cases that may be brought in the future, we have not recognized any impact in our financial statements, other than for the claims subject to the settlement agreements as well as our estimated contractual obligation related to the Atlantic claim described above. Our ultimate liability or the amount of any potential future settlements or resolution of these claims, if any, could be material to our financial position, consolidated results of operations and cash flows.
We anticipate that we will incur additional expenses as we continue to cooperate with the investigations and defend the lawsuits. We expense all legal costs as incurred in our Consolidated Statements of Operations. Such expenses and any restitution payments could negatively impact our reputation, compromise our ability to compete and result in financial losses in an amount which could be material to our financial position, consolidated results of operations and cash flows.
Environmental Matters
At December 31, 2014 and December 31, 2013 we had accrued $5.7 million and $2.4 million, respectively, for environmental remediation. Included in the December 31, 2014 balance is an accrual, measured on a discounted basis, of $1.6 million for the remaining estimated costs associated with remediation activities at our former Tecumseh, Michigan facility. We have met with the United States Environmental Protection Agency ("USEPA") several times and most recently in early 2014, to discuss the overall project at this site. On September 30, 2013, we submitted the Supplement to the Current Human Exposures Environmental Indicators Report to the USEPA. This Supplement confirmed that human exposures are under control in accordance with the Administrative Order on Consent. USEPA provided comments on January 31, 2014. We submitted a scope of work for additional investigation activities to USEPA on March 27, 2014 to respond to USEPA’s comments. These additional investigative activities began in the second quarter of 2014. The deadline for the final corrective measures proposal was extended to January 31, 2016, based upon feedback from the USEPA and time to address their comments. Most of the investigation is now expected to be completed in the next 6 months while remediation and monitoring activities are expected to be completed by the end of 2020. Delays in demolition activities of the current property owner could delay remediation system construction at the site. The investigation efforts expected to take place in the fourth quarter of 2014 and the first quarter of 2015 have been hampered due to winter weather. Based upon the additional investigation activities that were requested by USEPA and additional remediation activities that will be required, an additional accrual of $1.5 million was recognized during 2014 in "Impairments, restructuring charges, and other items" in our Consolidated Statement of Operations.
We were named by the USEPA as a potentially responsible party in connection with the Sheboygan River and Harbor Superfund Site ("SRHS") in Wisconsin. In 2003, with the cooperation of the USEPA, we and Pollution Risk Services, LLC (“PRS”) entered into a Liability Transfer and Assumption Agreement (the “Liability Transfer Agreement”). Under the terms of the Liability Transfer Agreement, PRS assumed all of our responsibilities, obligations and liabilities for remediation of the entire SRHS and the associated costs, except for potential future liabilities related to Natural Resource Damages (“NRD”). Also, as required by the Liability Transfer Agreement, we purchased Remediation Cost Cap insurance, with a 30 year term, in the amount of $100.0 million and Environmental Site Liability insurance in the amount of $20.0 million.
We believe that insurance coverage will provide sufficient assurance for completion of the responsibilities, obligations and liabilities assumed by PRS under the Liability Transfer Agreement. In conjunction with the Liability Transfer Agreement, we completed the transfer of title to the Sheboygan Falls, Wisconsin property to PRS. Active remediation of the SRHS was completed in 2013 and PRS is currently preparing the final work completion reports. PRS has been submitting these reports during the second and third quarters of 2014 and will continue to submit required reports during the first quarter of 2015. USEPA is expected to issue a Certificate of Completion for the Site after it has reviewed and approved the final work completion reports.
Now that the remediation and reporting on SRHS is nearing completion, the natural resource trustees (Wisconsin Department of Natural Resources, U.S. Fish and Wildlife Service, and the National Oceanic and Atmospheric Administration (collectively, the "Trustees")) will have the opportunity to assess if they will assert any NRD claims. In September 2012, we were advised that the Sheboygan River Natural Resource Trustees conducted a pre-assessment screen of natural resources damages related to the Sheboygan River and Harbor Site, including the Kohler Landfill Superfund Site and the Campmarina Alternate Superfund Site. In a letter received by us on May 23, 2013, the Trustees provided notice to us of their intent to perform a formal NRD assessment. The Trustees sent this letter to three parties in addition to us. Neither we, nor any of the other three notified parties, admit that we are, or it is, liable for any natural resource damages in connection with the SRHS. Further, no allocation of liability among the parties, whether interim or final, has been reached.
At this time, we have not received a Notice of Intent to Sue as required by the Comprehensive Environmental Response, Compensation and Liability Act as a predicate to any lawsuit for natural resources damages by the Trustees. However, we have entered into a second tolling agreement with the Trustees to stop any applicable limitations period on their asserted claims for the period from September 15, 2014 to September 15, 2015, "to facilitate settlement negotiations between the Parties".
66
Settlement discussions among us, one of the other potentially responsible parties ("PRP's") and the Trustees have been ongoing and continue. In 2014, we accrued $3.1 million for this issue, as part of "Loss from discontinued operations, net of tax".
In cooperation with the Wisconsin Department of Natural Resources (“WDNR”), we also conducted an investigation of soil and groundwater contamination at our Grafton, Wisconsin plant. In February 2013, the WDNR granted a "no further action" for the on-site groundwater component of the investigation but required the installation of three additional off-site, down-gradient monitoring wells and two years (six sampling events) of off-site monitoring. The timetable for monitoring began with the sampling event conducted in October 2012, with the objective of demonstrating that concentrations are stable and receiving full closure from the WDNR in 2014. The three additional off-site, down-gradient monitoring wells were installed and all on-site monitoring wells were formally abandoned during the second quarter of 2013. Groundwater results from the off-site monitoring indicated the possibility of vapor intrusion in nearby residences. Under an agreement with the WDNR, we initiated sampling of vapor intrusion beginning with residences nearest the off-site monitoring wells. Based on the results of fifteen properties to date, we have installed vapor mitigation systems in four residences and the vapor intrusion investigation was deemed complete by the WDNR. The WDNR subsequently required an additional off-site groundwater investigation. A work plan to investigate the extent of the contamination was approved by the WDNR in June 2014. Four new monitoring wells were installed and sampled in the third quarter of 2014. The sampling results of these wells indicated that additional investigation was needed and will be performed, as approved by the WDNR, during the first and second quarters of 2015. The additional off-site groundwater investigation has led to the additional vapor intrusion investigation of nine additional offsite properties that may be completed during the first quarter of 2015. Based upon the work related to vapor intrusion and the future additional off-site groundwater investigation, the accrual was adjusted by $0.2 million during 2014.
In addition to the above-mentioned sites, we are also currently participating with the USEPA and various state agencies at certain other sites to determine the nature and extent of any remedial action that may be necessary with regard to such other sites. As these matters continue toward final resolution, amounts in excess of those already provided may be necessary to discharge us from our obligations for these sites. Such amounts, depending on their amount and timing, could be material to reported net income in the particular quarter or period that they are recorded. In addition, the ultimate resolution of these matters, either individually or in the aggregate, could be material to the consolidated financial statements.
NOTE 17. Business Segments
Operating segments are defined as components of an enterprise for which separate financial information is available that is evaluated regularly by the chief operating decision maker(s) in deciding how to allocate resources and in assessing performance. The accounting policies of the reportable segments are the same as those described in Note 1, “Accounting Policies”.
External customer sales by geographic area are based upon the destination of products sold. In 2014 and 2013 one household refrigeration and freezer customer accounted for 6.3% and 8.3% of our consolidated sales, respectively. Long-lived assets by geographic area are based upon the physical location of the assets.
Business Segment Information
Assets, capital expenditures and depreciation and amortization from continuing operations for the years ended December 31, were as follows:
(in millions) | 2014 | 2013 | 2012 | ||||||||
Assets: | |||||||||||
Compressor products | $ | 263.5 | $ | 356.0 | $ | 392.3 | |||||
Corporate and consolidating items | 131.0 | 129.0 | 133.5 | ||||||||
Assets held for sale | 1.8 | 2.4 | 2.1 | ||||||||
Total assets | $ | 396.3 | $ | 487.4 | $ | 527.9 | |||||
Capital expenditures: | |||||||||||
Compressor products | $ | 11.4 | $ | 10.3 | $ | 11.9 | |||||
Corporate and consolidating items | 2.2 | 1.5 | 1.9 | ||||||||
Total capital expenditures | $ | 13.6 | $ | 11.8 | $ | 13.8 | |||||
Depreciation and amortization: | |||||||||||
Compressor products | $ | 24.1 | $ | 27.3 | $ | 29.0 | |||||
Corporate and consolidating items | 0.9 | 6.2 | 7.4 | ||||||||
Total depreciation and amortization | $ | 25.0 | $ | 33.5 | $ | 36.4 | |||||
67
Geographic Information
Customer sales by geographic location for the years ended December 31, were as follows:
(in millions) | 2014 | 2013 | 2012 | ||||||||
Customer sales by destination: | |||||||||||
North America | |||||||||||
United States | $ | 125.8 | $ | 135.9 | $ | 168.0 | |||||
Other North America | 15.7 | 15.7 | 18.3 | ||||||||
Total North America | $ | 141.5 | $ | 151.6 | $ | 186.3 | |||||
South America | |||||||||||
Brazil | $ | 182.8 | $ | 223.9 | $ | 193.4 | |||||
Other South America | 45.6 | 58.8 | 65.9 | ||||||||
Total South America | $ | 228.4 | $ | 282.7 | $ | 259.3 | |||||
Europe | $ | 191.3 | $ | 207.1 | $ | 203.2 | |||||
Asia | |||||||||||
China | $ | 13.0 | $ | 20.0 | $ | 26.2 | |||||
India | 105.0 | 74.5 | 66.3 | ||||||||
Other Asia | 5.9 | 21.1 | 27.2 | ||||||||
Total Asia | $ | 123.9 | $ | 115.6 | $ | 119.7 | |||||
Middle East and Africa | $ | 39.3 | $ | 66.6 | $ | 86.2 | |||||
Total sales | $ | 724.4 | $ | 823.6 | $ | 854.7 | |||||
Property, plant and equipment at December 31, were as follows:
(in millions) | 2014 | 2013 | 2012 | ||||||||
Property, plant and equipment, net: | |||||||||||
North America | $ | 28.9 | $ | 27.1 | $ | 30.2 | |||||
Brazil | 41.7 | 60.1 | 85.4 | ||||||||
India | 19.0 | 20.4 | 24.8 | ||||||||
Europe | 14.1 | 15.2 | 16.6 | ||||||||
Total property, plant and equipment, net | $ | 103.7 | $ | 122.8 | $ | 157.0 | |||||
NOTE 18. Quarterly Financial Data – Unaudited
Quarter | |||||||||||||||||||
(in millions, except per share data) | First | Second | Third | Fourth | Total | ||||||||||||||
2014 | |||||||||||||||||||
Net sales | $ | 179.3 | $ | 193.0 | $ | 188.3 | $ | 163.8 | $ | 724.4 | |||||||||
Gross profit | 17.1 | 17.1 | 21.2 | 15.3 | 70.7 | ||||||||||||||
Net loss(a) | (11.1 | ) | (8.7 | ) | (3.8 | ) | (9.1 | ) | (32.7 | ) | |||||||||
Basic and diluted (loss) per share | $ | (0.60 | ) | $ | (0.47 | ) | $ | (0.21 | ) | $ | (0.49 | ) | $ | (1.77 | ) | ||||
2013 | |||||||||||||||||||
Net sales | $ | 207.6 | $ | 227.6 | $ | 194.4 | $ | 194.0 | $ | 823.6 | |||||||||
Gross profit | 22.1 | 19.2 | 24.0 | 12.8 | 78.1 | ||||||||||||||
Net loss(b) | (8.4 | ) | (6.3 | ) | (5.7 | ) | (17.1 | ) | (37.5 | ) | |||||||||
Basic and diluted (loss) per share | $ | (0.45 | ) | $ | (0.35 | ) | $ | (0.30 | ) | $ | (0.93 | ) | $ | (2.03 | ) | ||||
(a) Includes $4.0 million in expense related to severance associated with reductions in work force, $1.8 million in business re-engineering costs, $1.5 million related to a contingent legal liability and settlement and $1.5 million related to environmental reserve for sold building.
68
(b) Includes $9.9 million in expense related to severance associated with reductions in work force, $2.7 million in business re-engineering costs, $0.3 million related to a contingent legal liability and $0.5 million in moving costs.
NOTE 19. New Accounting Standards
In August 2014, FASB issued ASU No. 2014-15, Presentation of Financial Statements - Going Concern: Disclosure of Uncertainties about an Entity's Ability to Continue as a Going Concern. The ASU provides guidance to an organization's management regarding its responsibility to evaluate whether there is a substantial doubt about the organization's ability to continue as a going concern or to provide related footnote disclosures. The amendment is effective for annual periods ending after December 15, 2016, and interim periods within annual periods beginning after December 15, 2016. Management will continuously assess the applicability of this ASU and its required disclosures.
In May 2014, the Financial Accounting Standards Board (FASB), issued Accounting Standards Update (ASU) No. 2014-09, Revenue from Contracts with Customers. The core principle of the guidance is that an entity should recognize revenue to depict the transfer of promised goods or services to customers in an amount that reflects the consideration to which an entity expects to be entitled in exchange for those goods or services. For all public entities, this ASU is effective for annual reporting periods beginning after December 15, 2016. The ASU allows for a choice of two methods for adoption: full retrospective with practical expedients or modified retrospective. Management continues to assess the impact of the adoption of this guidance on our financial statements and selecting the method of its retrospective adoption.
In April 2014, FASB issued ASU No. 2014-08, Presentation of Financial Statements and Property, Plant, and Equipment: Reporting Discontinued Operations and Disclosures of Disposals of Components of an Entity. This ASU is effective in the first quarter of 2015 for public with calendar year ends. Management believes that ASU No. 2014-08 will have no material effect on our financial statements.
NOTE 20. Subsequent Events
We perform review procedures for subsequent events, and determine any necessary disclosures that arise from such evaluation, up to the date of issuance of our annual and interim reports.
69
ITEM 9. | CHANGES IN AND DISAGREEMENTS WITH ACCOUNTANTS ON ACCOUNTING AND FINANCIAL DISCLOSURE |
Not applicable.
ITEM 9A. | CONTROLS AND PROCEDURES |
Disclosure Controls and Procedures
We maintain disclosure controls and procedures that are designed to ensure that information required to be disclosed by us in the reports that we file or submit under the Securities Exchange Act of 1934 is recorded, processed, summarized, and reported within the time periods specified in the SEC’s rules and forms, and that such information is accumulated and communicated to our management, including our President and Chief Executive Officer and our Executive Vice President and Chief Financial Officer, as appropriate, to allow timely decisions regarding required disclosure.
Our management evaluated, with the participation of our President and Chief Executive Officer and our Executive Vice President and Chief Financial Officer, the effectiveness of our disclosure controls and procedures and our internal control over financial reporting as of December 31, 2014, pursuant to Exchange Act Rule 13a-15. Based upon such evaluation, and as of December 31, 2014, our President and Chief Executive Officer along with our Executive Vice President and Chief Financial Officer concluded that our disclosure controls and procedures were effective at the reasonable assurance level as of December 31, 2014.
Limitations on the Effectiveness of Controls and Procedures
Management, including our President and Chief Executive Officer and our Executive Vice President and Chief Financial Officer, does not expect that our disclosure controls and procedures or internal control over financial reporting will detect or prevent all errors and all fraud. A control system, no matter how well designed and implemented, can provide only reasonable, not absolute, assurance that the control system’s objective will be met. Because of the inherent limitations in all control systems, no evaluation of controls can provide absolute assurance that all control issues within a company are detected.
In addition, projection of any evaluation of the effectiveness of internal control over financial reporting to future periods is subject to the risk that controls may become inadequate because of changes in condition, or that the degree of compliance with policies and procedures included in such controls may deteriorate.
Management’s Report on Internal Control Over Financial Reporting
Our management is responsible for establishing and maintaining adequate internal control over our financial reporting. Our internal control over financial reporting is a process designed by, or under the supervision of, our principal executive and principal financial officers, and effected by our board of directors, management and other personnel, to provide reasonable assurance regarding the reliability of financial reporting and the preparation of financial statements for external purposes in accordance with generally accepted accounting principles in the U.S. and includes policies and procedures that:
(1) pertain to the maintenance of records that in reasonable detail accurately and fairly reflect our transactions and dispositions of assets
(2) provide reasonable assurance that transactions are recorded as necessary to permit preparation of financial statements in accordance with generally accepted accounting principles, and that our receipts and expenditures are being made only in accordance with authorizations of our management and directors, and
(3) provide reasonable assurance regarding prevention or timely detection of unauthorized acquisition, use or disposition of our assets that could have a material effect on the financial statements.
Management has evaluated the effectiveness of our internal control over financial reporting as of December 31, 2014. In making its assessment, management used the framework described in Internal Control – Integrated Framework (2013 version) issued by the Committee of Sponsoring Organizations of the Treadway Commission (COSO). Based on this evaluation, management has concluded that the Company maintained effective internal control over financial reporting as of December 31, 2014.
The effectiveness of the Company’s internal control over financial reporting as of December 31, 2014 has been audited by Grant Thornton LLP, our independent registered public accounting firm, as stated in their report which is included in this Item 9A of this report on Form 10-K.
70
Changes in Internal Control Over Financial Reporting
There have been no changes in our internal control over financial reporting identified in connection with our evaluation that occurred during the fourth quarter ended December 31, 2014 that have materially affected, or are reasonably likely to materially affect, our internal control over financial reporting.
REPORT OF INDEPENDENT REGISTERED PUBLIC ACCOUNTING FIRM
Board of Directors and Stockholders
Tecumseh Products Company
We have audited the internal control over financial reporting of Tecumseh Products Company (a Michigan corporation) and subsidiaries (the “Company”) as of December 31, 2014, based on criteria established in the 2013 Internal Control-Integrated Framework issued by the Committee of Sponsoring Organizations of the Treadway Commission (COSO). The Company’s management is responsible for maintaining effective internal control over financial reporting and for its assessment of the effectiveness of internal control over financial reporting, included in the accompanying Management’s Report on Internal Control over Financial Reporting. Our responsibility is to express an opinion on the Company’s internal control over financial reporting based on our audit.
We conducted our audit in accordance with the standards of the Public Company Accounting Oversight Board (United States). Those standards require that we plan and perform the audit to obtain reasonable assurance about whether effective internal control over financial reporting was maintained in all material respects. Our audit included obtaining an understanding of internal control over financial reporting, assessing the risk that a material weakness exists, testing and evaluating the design and operating effectiveness of internal control based on the assessed risk, and performing such other procedures as we considered necessary in the circumstances. We believe that our audit provides a reasonable basis for our opinion.
A company’s internal control over financial reporting is a process designed to provide reasonable assurance regarding the reliability of financial reporting and the preparation of financial statements for external purposes in accordance with generally accepted accounting principles. A company’s internal control over financial reporting includes those policies and procedures that (1) pertain to the maintenance of records that, in reasonable detail, accurately and fairly reflect the transactions and dispositions of the assets of the company; (2) provide reasonable assurance that transactions are recorded as necessary to permit preparation of financial statements in accordance with generally accepted accounting principles, and that receipts and expenditures of the company are being made only in accordance with authorizations of management and directors of the company; and (3) provide reasonable assurance regarding prevention or timely detection of unauthorized acquisition, use, or disposition of the company’s assets that could have a material effect on the financial statements.
Because of its inherent limitations, internal control over financial reporting may not prevent or detect misstatements. Also, projections of any evaluation of effectiveness to future periods are subject to the risk that controls may become inadequate because of changes in conditions, or that the degree of compliance with the policies or procedures may deteriorate.
In our opinion, the Company maintained, in all material respects, effective internal control over financial reporting as of December 31, 2014, based on criteria established in the 2013 Internal Control-Integrated Framework issued by COSO.
We also have audited, in accordance with the standards of the Public Company Accounting Oversight Board (United States), the consolidated financial statements of the Company as of and for the year ended December 31, 2014, and our report dated March 4, 2015 expressed an unqualified opinion on those financial statements.
/s/ GRANT THORNTON LLP
Southfield, Michigan
March 4, 2015
71
ITEM 9B. | OTHER INFORMATION |
None.
PART III
ITEM 10. | DIRECTORS, EXECUTIVE OFFICERS AND CORPORATE GOVERNANCE |
The information pertaining to directors required by Item 401 of Regulation S-K will be set forth under the caption “Proposal No. 1- Election of Directors – Our Nominees” and “– Qualifications of Directors and Nominees” in our definitive proxy statement relating to our 2015 annual meeting of shareholders scheduled to be held April 29, 2015 and is incorporated herein by reference. The information pertaining to executive officers required by Item 401 of Regulation S-K will be set forth under the caption “Executive Officers” in our definitive proxy statement relating to our 2015 annual meeting of shareholders scheduled to be held April 29, 2015 and is incorporated herein by reference. The information required to be reported pursuant to Item 405 of Regulation S-K will be set forth under the caption “Information Concerning the Board of Directors – Section 16(a) Beneficial Ownership Reporting Compliance” in our definitive proxy statement relating to our 2015 annual meeting of shareholders scheduled to be held April 29, 2015 and is incorporated herein by reference.
The information required to be reported pursuant to Item 406 of Regulation S-K will be set forth under the caption “Information Concerning the Board of Directors – Code of Conduct” in our definitive proxy statement relating to our 2015 annual meeting of shareholders scheduled to be held April 29, 2015 and is incorporated herein by reference. The information required to be reported pursuant to paragraphs (d)(4) and (d)(5) of Item 407 of Regulation S-K will be set forth under the caption “Information Concerning the Board of Directors – Committees of the Board” and “– Audit Committee” in our definitive proxy statement relating to our 2015 annual meeting of shareholders scheduled to be held April 29, 2015 and is incorporated herein by reference. No information is required to be reported pursuant to paragraph (c)(3) of Item 407 of Regulation S-K.
ITEM 11. | EXECUTIVE COMPENSATION |
The information required to be reported pursuant to Item 402 of Regulation S-K and paragraph (e)(5) of Item 407 of Regulation S-K will be set forth under the caption “Executive Compensation,” and the information required to be reported pursuant to paragraph (e)(4) of Item 407 of Regulation S-K will be set forth under the sub-caption “Compensation Committee Interlocks and Insider Participation” under the caption “Information Concerning the Board of Directors” in our definitive proxy statement relating to our 2015 annual meeting of shareholders scheduled to be held April 29, 2015 and is incorporated herein by reference.
ITEM 12. | SECURITY OWNERSHIP OF CERTAIN BENEFICIAL OWNERS AND MANAGEMENT AND RELATED STOCKHOLDER MATTERS |
The information required to be reported pursuant to Item 403 of Regulation S-K will be set forth under the caption “Share Ownership” in our definitive proxy statement relating to our 2015 annual meeting of shareholders scheduled to be held April 29, 2015 and is incorporated herein by reference. Information is required to be reported pursuant to Item 201(d) of Regulation S-K will be set forth under the caption “Executive Compensation - Equity Compensation Plan Information” in our definitive proxy statement relating to our 2015 annual meeting of shareholders scheduled to be held April 29, 2015 and is incorporated herein by reference.
ITEM 13. | CERTAIN RELATIONSHIPS AND RELATED TRANSACTIONS, AND DIRECTOR INDEPENDENCE |
The information required to be reported pursuant to Item 404 of Regulation S-K and paragraph (a) of Item 407 of Regulation S-K will be set forth under the sub-captions “Board Independence,” “Compensation Committee Interlocks and Insider Participation” and “Transactions with Related Persons” under the caption “Information Concerning the Board of Directors” in our definitive proxy statement relating to our 2015 annual meeting of shareholders scheduled to be held April 29, 2015 and is incorporated herein by reference.
72
ITEM 14. | PRINCIPAL ACCOUNTANT FEES AND SERVICES |
The information required to be reported pursuant to Item 9(e) of Schedule 14A will be set forth under the caption “Proposal No. 3 – Ratification of Appointment of Independent Accountant - Audit and Non-Audit Fees” in our definitive proxy statement relating to our 2015 annual meeting of shareholders scheduled to be held April 29, 2015 and is incorporated herein by reference.
PART IV
ITEM 15. | EXHIBITS AND FINANCIAL STATEMENT SCHEDULES |
(a)(1) Financial Statements
See “Index to Consolidated Financial Statements” in Item 8 of this report.
(a)(2) Financial Statement Schedules
None
(a)(3) Exhibits
See Exhibit Index following the signature page of this report.
73
SIGNATURES
Pursuant to the requirements of Section 13 or 15(d) of the Securities Exchange Act of 1934, the Registrant has duly caused this report to be signed on its behalf by the undersigned thereunto duly authorized.
TECUMSEH PRODUCTS COMPANY | |||
Date: | March 4, 2015 | By | /s/ Harold M. Karp |
Harold M. Karp | |||
President and Chief Executive Officer | |||
Pursuant to the requirements of the Securities Exchange Act of 1934, this report has been signed below by the following persons on behalf of the Registrant and in the capacities and on the dates indicated.
Signature | Office | Date of Signing | ||
/s/ Harold M. Karp | President, Chief Executive Officer and Director (Principal Executive Officer) | March 4, 2015 | ||
Harold M. Karp | ||||
/s/ Janice E. Stipp | Executive Vice President, Chief Financial Officer, Treasurer and Secretary (Principal Accounting and Principal Financial Officer) | March 4, 2015 | ||
Janice E. Stipp | ||||
/s/ Stephanie H. Boyse | Director | March 4, 2015 | ||
Stephanie H. Boyse | ||||
/s/ Gary L. Cowger | Director | March 4, 2015 | ||
Gary L. Cowger | ||||
/s/ Mitchell I. Quain | Director | March 4, 2015 | ||
Mitchell I. Quain | ||||
/s/ Robert E. Rossiter | Director | March 4, 2015 | ||
Robert E. Rossiter | ||||
/s/ Terence C. Seikel | Director | March 4, 2015 | ||
Terence C. Seikel | ||||
/s/ Douglas M. Suliman Jr. | Director | March 4, 2015 | ||
Douglas M. Suliman Jr. | ||||
74
10-K EXHIBIT INDEX
Exhibit No. | Description of Exhibit | |
2.1 | Purchase Agreement dated as of October 22, 2007 by and between Snowstorm Acquisition Corporation and Tecumseh Products Company (incorporated by reference to Exhibit 10.1 to registrant’s Quarterly Report on Form 10-Q for the quarter ended September 30, 2007, File No. 0-452) [NOTE: Schedules, annexes, and exhibits are omitted. The registrant agrees to furnish supplementally a copy of any omitted schedule, annex, or exhibit to the Securities and Exchange Commission upon request.] | |
3(i) | Amended and Restated Articles of Incorporation of Tecumseh Products Company (incorporated by reference to Exhibit 4.2 to the registrant’s Registration Statement on Form S-8 filed on May 6, 2014, File No. 333-195739) | |
3(ii) | Amended and Restated Bylaws of Tecumseh Products Company as amended through June 29, 2010 (incorporated by reference to Exhibit 3(ii) to registrant’s Current Report on Form 8-K, dated June 29, 2010 and filed March 1, 2011, File No. 0-452) | |
4.1 | Revolving Credit and Security Agreement, dated as of April 21, 2011, among Tecumseh Products Company, Tecumseh Compressor Company, Tecumseh Products of Canada, Limited, Evergy, Inc. and PNC Bank, National Association (incorporated by reference to Exhibit 10.1 to registrant’s Current Report on Form 8-K dated April 21, 2011 and filed April 27, 2011, File No. 0-452) | |
4.2 | Side Letter, dated as of April 21, 2011, among Tecumseh Products Company, Tecumseh Compressor Company, Tecumseh Products of Canada, Limited, Evergy, Inc. and PNC Bank, National Association (incorporated by reference to Exhibit 10.2 to registrant’s Current Report on Form 8-K dated April 21, 2011 and filed April 27, 2011, File No. 0-452) | |
4.3 | Amendment No. 1 to Revolving Credit and Security Agreement, dated as of December 30, 2011, among Tecumseh Products Company, Tecumseh Compressor Company, Tecumseh Products of Canada, Limited, Evergy, Inc. and PNC Bank, National Association (incorporated by reference to Exhibit 4.4 to registrant's Annual Report on Form 10-K for the year ended December 31, 2011, File No. 0-452) | |
4.4 | Amendment No. 2 to Revolving Credit and Security Agreement, dated as of November 6, 2013, among Tecumseh Products Company, Tecumseh Compressor Company, Tecumseh Products of Canada, Limited, Evergy, Inc. and PNC Bank, National Association (incorporated by reference to Exhibit 4.5 to registrant's Registration Statement on Form S-4, filed January 29, 2014, File No. 333-193643) | |
4.5 | Amendment No. 3 to Revolving Credit and Security Agreement, dated as of December 11, 2013, among Tecumseh Products Company, Tecumseh Compressor Company, Tecumseh Products of Canada, Limited, Evergy, Inc. and PNC Bank, National Association (incorporated by reference to Exhibit 10.1 to registrant's Current Report on Form 8-K dated December 11, 2013 and filed December 17, 2013, File No. 0-452) | |
4.6 | Amendment No. 4 to Revolving Credit and Security Agreement, dated as of December 31, 2013, among Tecumseh Products Company, Tecumseh Compressor Company, Tecumseh Products of Canada, Limited, Evergy, Inc. and PNC Bank, National Association (incorporated by reference to Exhibit 4.7 to registrant's Registration Statement on Form S-4, filed January 29, 2014, File No. 333-193643) | |
4.7 | Amendment No. 5 to Revolving Credit and Security Agreement, dated as of January 22, 2014, among Tecumseh Products Company, Tecumseh Compressor Company, Tecumseh Products of Canada, Limited, Evergy, Inc. and PNC Bank, National Association (incorporated by reference to Exhibit 4.7 to registrant's Annual Report on Form 10-K for the year ended December 31, 2013, File No. 0-452) | |
75
4.8 | Amendment No. 6 to Revolving Credit and Security Agreement, dated as of March 20, 2014, among Tecumseh Products Company, Tecumseh Compressor Company, Tecumseh Products of Canada, Limited, Evergy, Inc. and PNC Bank, National Association (incorporated by reference to Exhibit 4.1 to registrant's Quarterly Report on Form 10-Q for the quarter ended March 31, 2014, File No. 0-452) | |
4.9 | Amendment No. 7 to Revolving Credit and Security Agreement, dated as of August 28, 2014, among Tecumseh Products Company, Tecumseh Compressor Company, Tecumseh Products of Canada, Limited, Evergy, Inc. and PNC Bank, National Association (incorporated by reference to Exhibit 4.1 to registrant's Quarterly Report on Form 10-Q for the quarter ended September 30, 2014, File No. 001-36417) | |
4.10 | Amendment No. 8 to Revolving Credit and Security Agreement, dated as of October 9, 2014, among Tecumseh Products Company, Tecumseh Compressor Company, Tecumseh Products of Canada, Limited, Evergy, Inc. and PNC Bank, National Association (incorporated by reference to Exhibit 4.3 to registrant's Quarterly Report on Form 10-Q for the quarter ended September 30, 2014, File No. 001-36417) | |
4.11 | Factoring Agreement, dated June 19, 2013, and Amendment No. 1 dated June 20, 2013 to Factoring Agreement dated June 19, 2013, between Tecumseh Europe S.A. and GE Factofrance (incorporated by reference to Exhibit 99.1 to registrant’s Current Report on Form 8‑K dated June 19, 2013 and filed June 25, 2013, File No. 0-452) | |
4.12 | Finance Contract between Financiadora de Estudios e Projectos (FINEP) and Tecumseh do Brazil LTDA dated July 7, 2014 (English translation) (incorporated by reference to Exhibit 10.1 to registrant's Current Report on Form 8-K dated August 6, 2014 and filed August 12, 2014, File No. 001-36417) | |
Note: Other instruments defining the rights of holders of long-term debt are not filed because the total amount authorized thereunder does not exceed 10% of the total assets of the registrant and its subsidiaries on a consolidated basis. The registrant hereby agrees to furnish a copy of any such agreement to the Securities and Exchange Commission upon request. | ||
10.1 | Annual Incentive Plan adopted December 17, 2007 (management contract or compensatory plan or arrangement) (incorporated by reference to Exhibit 10.15 to registrant’s Annual Report on Form 10-K For the year ended December 31, 2007, File No. 0-452) | |
10.2 | Long-Term Term Incentive Cash Award Plan adopted March 4, 2008 (management contract or compensatory plan or arrangement) (incorporated by reference to Exhibit 10.1 to registrant’s Current Report on Form 8-K filed March 10, 2008, File No. 0-452) | |
10.3 | Form of Award Agreement (Phantom Shares) under Long-Term Incentive Cash Award Plan (management contract or compensatory plan or arrangement) (incorporated by reference to Exhibit 10.2 to registrant’s Current Report on Form 8-K filed March 10, 2008, File No. 0-452) | |
10.4 | Form of Award Agreement (SARs) under Long-Term Incentive Cash Award Plan (management contract or compensatory plan or arrangement) (incorporated by reference to Exhibit 10.3 to registrant’s Current Report on Form 8-K filed March 10, 2008, File No. 0-452) | |
10.5 | Form of Award Agreement (Phantom Shares and Cash Performance Award) under Long-Term Incentive Cash Award Plan (management contract or compensatory plan or arrangement) (incorporated by reference to Exhibit 10.1 to registrant's Quarterly Report on Form 10-Q for the quarter ended June 30, 2013, File No. 0-452) | |
10.6 | Tecumseh Products Company 2014 Omnibus Incentive Plan (management contract or compensatory plan or arrangement) (incorporated by reference to Annex C to the registrant’s definitive proxy statement/prospectus, dated March 21, 2014 filed on March 21, 2014 pursuant to Rule 424(b) under the Securities Act, relating to Amendment No. 2 to its Registration Statement on Form S-4 (file no. 333-193643) filed March 14, 2014 and declared effective March 21, 2014) | |
10.7 | Form of Performance Unit Award Agreement Under the Tecumseh Products Company 2014 Omnibus Incentive Plan (management contract or compensatory plan or arrangement) (incorporated by reference to Exhibit 99.1 to the registrant’s Current Report on Form 8-K, dated March 31, 2014 and filed April 4 2014, File No. 0-452) | |
76
10.8 | Form of Restricted Stock Unit Award Agreement Under the Tecumseh Products Company 2014 Omnibus Incentive Plan (management contract or compensatory plan or arrangement) (incorporated by reference to Exhibit 99.3 to the registrant’s Current Report on Form 8-K, dated June 27, 2014 and filed June 27 2014, File No. 001-36417) | |
10.9 | Form of Outside Director Restricted Stock Unit Award Agreement Under the Tecumseh Products Company 2014 Omnibus Incentive Plan (management contract or compensatory plan or arrangement) (incorporated by reference to Exhibit 99.6 to the registrant’s Current Report on Form 8-K, dated June 27, 2014 and filed June 27 2014, File No. 001-36417) | |
10.10 | Form of Non-qualified Stock Option Award Agreement Under the Tecumseh Products Company 2014 Omnibus Incentive Plan (management contract or compensatory plan or arrangement) (incorporated by reference to Exhibit 99.1 to the registrant’s Current Report on Form 8-K, dated December 5, 2014 and filed December 9, 2014, File No. 001-36417) | |
10.11 | Description of Standard Director Compensation Arrangements (management contract or compensatory plan or arrangement) (incorporated by reference to the description under the caption "Executive Compensation - Director Compensation" in registrant's definitive proxy statement/prospectus, dated March 21, 2014 filed on March 21, 2014 pursuant to Rule 424(b) under the Securities Act, relating to Amendment No. 2 to its Registration Statement on Form S-4 (file no. 333-193643) filed March 14, 2014 and declared effective March 21, 2014) | |
10.12 | Amended and Restated Outside Directors’ Deferred Stock Unit Plan adopted December 14, 2010 (management contract or compensatory plan or arrangement) (incorporated by reference to Exhibit 10.7 to registrant’s Annual Report on Form 10-K for the year ended December 31, 2010, File No. 0-452) | |
10.13 | Janice E. Stipp Offer Letter dated October 10, 2011 (management contract or compensatory plan or arrangement) (incorporated by reference to Exhibit 99.2 to registrant's Current Report on Form 8-K dated October 17, 2011 and filed October 18, 2011, File No. 0-452) | |
10.14 | Igor Popov Offer Letter dated February 28, 2014 (management contract or compensatory plan or arrangement) (incorporated by reference to Exhibit 99.2 to registrant's Current Report on Form 8-K dated March 1, 2014 and filed March 4, 2014, File No. 0-452) | |
10.15 | General Release of All Claims dated June 27, 2014 between Tecumseh Products Company and James J. Connor (management contract or compensatory plan or arrangement) (incorporated by reference to Exhibit 99.2 to the registrant’s Current Report on Form 8-K, dated June 27, 2014 and filed June 27 2014, File No. 001-36417) | |
10.16 | Harold M. Karp Offer Letter dated June 27, 2014 (management contract or compensatory plan or arrangement) (incorporated by reference to Exhibit 99.4 to the registrant’s Current Report on Form 8‑-K, dated June 27, 2014 and filed June 27 2014, File No. 001‑-36417) | |
10.17 | Harold M. Karp Amended and Restated Offer Letter, dated September 24, 2014 (management contract or compensatory plan or arrangement) (incorporated by reference to Exhibit 99.2 to the registrant's Current Report on Form 8-K, dated September 18, 2014 and filed September 24, 2014, File No. 001-36417) | |
10.18 | Jerry L. Mosingo Offer Letter, dated January 30, 2014 (management contract or compensatory plan or arrangement) (incorporated by reference to Exhibit 99.1 to the registrant's Current Report on Form 8-K, dated August 4, 2014 and filed August 8, 2014, File No. 001-36417) | |
10.19 | Liability Transfer and Assumption Agreement for Sheboygan River and Harbor Superfund Site dated March 25, 2003, by and between Tecumseh Products Company and Pollution Risk Services, LLC (incorporated by reference to Exhibit 10.1 to registrant’s Current Report on Form 8-K filed April 9, 2003, File No. 0-452) | |
10.20 | Consent Order entered into on December 9, 2004 with Wisconsin Department of Natural Resources and TRC Companies, Inc. (incorporated by reference to Exhibit 10.26 to registrant’s Annual Report on Form 10-K for the year ended December 31, 2004, File No. 0-452) | |
77
10.21 | Exit Strategy Agreement dated December 29, 2004 with TRC Companies, Inc. (incorporated by reference to Exhibit 10.27 to registrant’s Annual Report on Form 10-K for the year ended December 31, 2004, File No. 0-452) | |
10.22 | Agreement with AP Services, LLC and AlixPartners, LLP dated December 7, 2006 (incorporated by reference to Exhibit 10.1 to registrant’s Current Report on Form 8-K filed December 14, 2006, File No. 0-452) | |
10.23 | First addendum dated January 19, 2007 to agreement with AP Services, LLC dated December 7, 2006 (incorporated by reference to Exhibit 10.1 to registrant’s Current Report on Form 8-K filed January 25, 2007, File No. 0-452) | |
21* | Subsidiaries of the Company | |
23.1* | Consent of Independent Registered Public Accounting Firm - Grant Thornton LLP | |
31.1* | Certification of the Principal Executive Officer pursuant to Rule 13a-14(a). | |
31.2* | Certification of the Principal Financial Officer pursuant to Rule 13a-14(a). | |
32.1* | Certification of Principal Executive Officer pursuant to Rule 13a-14(b) and Section 1350 of Chapter 63 of Title 18 of the United States Code. | |
32.2* | Certification of Principal Financial Officer pursuant to Rule 13a-14(b) and Section 1350 of Chapter 63 of Title 18 of the United States Code. | |
101.INS** | XBRL Instance Document | |
101.SCH** | XBRL Schema Document | |
101.CAL** | XBRL Calculation Linkbase Document | |
101.DEF** | XBRL Definition Linkbase Document | |
101.LAB** | XBRL Labels Linkbase Document | |
101.PRE** | XBRL Presentation Document | |
* | Filed herewith | |
** | Furnished herewith | |
78